Area Code 518 Map & Demographics
Area Code 518 Map
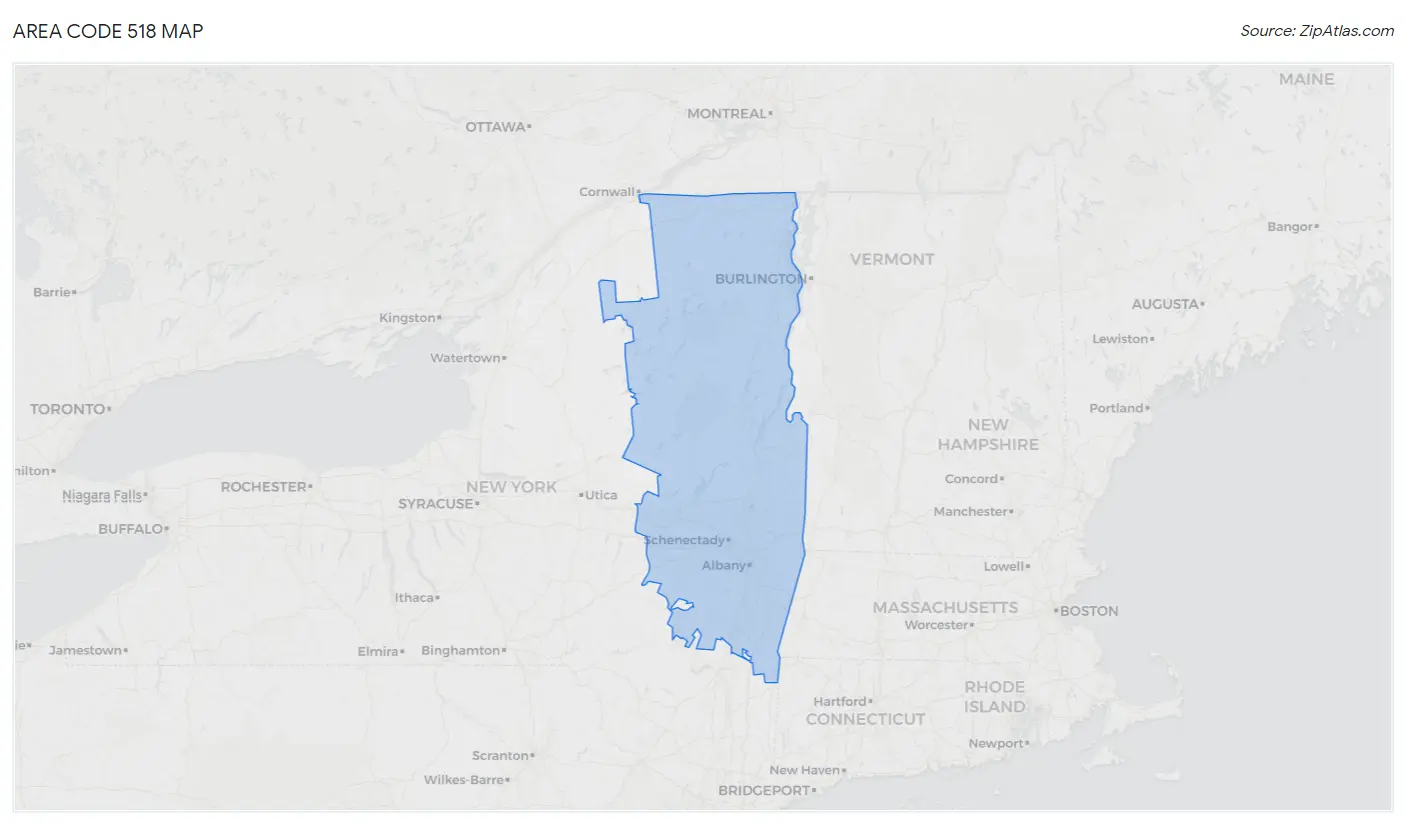
Area Code 518 Overview
$40,960
PER CAPITA INCOME
$96,883
AVG FAMILY INCOME
$78,242
AVG HOUSEHOLD INCOME
27.1%
WAGE / INCOME GAP [ % ]
72.9¢/ $1
WAGE / INCOME GAP [ $ ]
$10,908
FAMILY INCOME DEFICIT
124.30
INEQUALITY / GINI INDEX
1,374,764
TOTAL POPULATION
686,669
MALE POPULATION
688,095
FEMALE POPULATION
99.79
MALES / 100 FEMALES
100.21
FEMALES / 100 MALES
46.8
MEDIAN AGE
2.9
AVG FAMILY SIZE
2.4
AVG HOUSEHOLD SIZE
676,046
LABOR FORCE [ PEOPLE ]
58.9%
PERCENT IN LABOR FORCE
6.1%
UNEMPLOYMENT RATE
Income in Area Code 518
Income Overview in Area Code 518
Per Capita Income in Area Code 518 is $40,960, while median incomes of families and households are $96,883 and $78,242 respectively.
| Characteristic | Number | Measure |
| Per Capita Income | 1,374,764 | $40,960 |
| Median Family Income | 337,801 | $96,883 |
| Mean Family Income | 337,801 | $33,892,293 |
| Median Household Income | 565,400 | $78,242 |
| Mean Household Income | 565,400 | $29,516,610 |
| Income Deficit | 337,801 | $10,908 |
| Wage / Income Gap (%) | 1,374,764 | 27.08% |
| Wage / Income Gap ($) | 1,374,764 | 72.92¢ per $1 |
| Gini / Inequality Index | 1,374,764 | 124.30 |
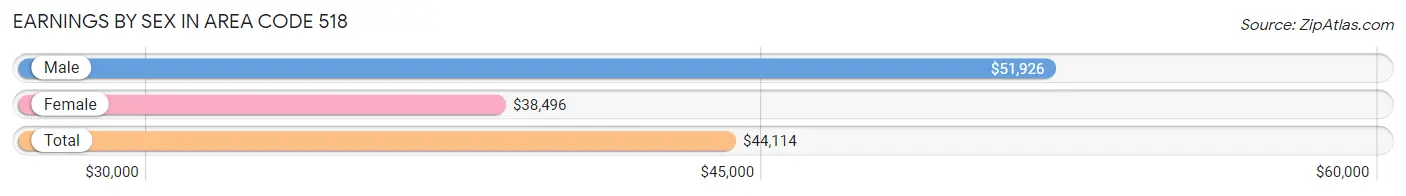
Earnings by Sex in Area Code 518
Average Earnings in Area Code 518 are $44,114, $51,926 for men and $38,496 for women, a difference of 25.9%.
| Sex | Number | Average Earnings |
| Male | 388,518 (51.8%) | $51,926 |
| Female | 361,053 (48.2%) | $38,496 |
| Total | 749,571 (100.0%) | $44,114 |
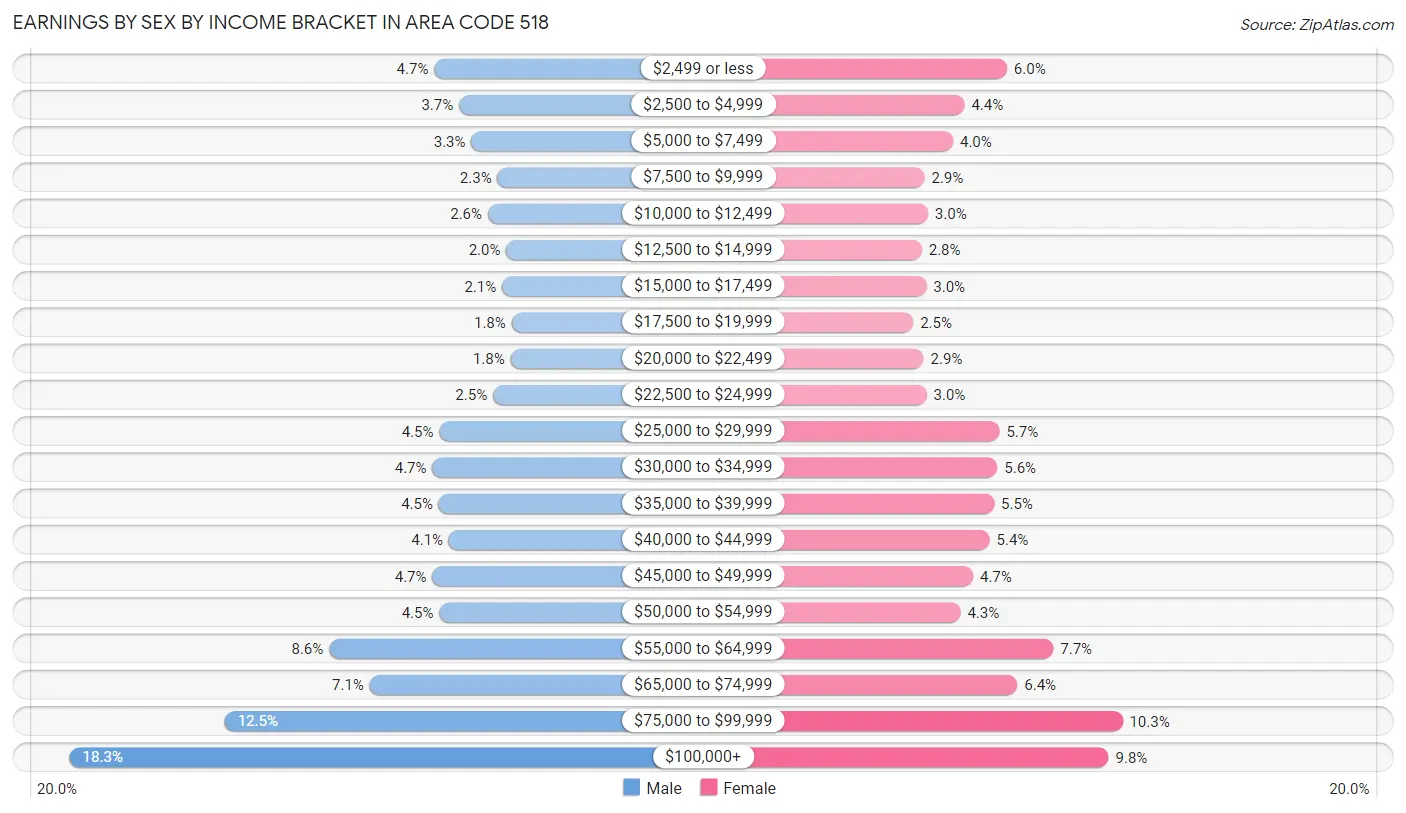
Earnings by Sex by Income Bracket in Area Code 518
The most common earnings brackets in Area Code 518 are $100,000+ for men (71,139 | 18.3%) and $75,000 to $99,999 for women (37,304 | 10.3%).
| Income | Male | Female |
| $2,499 or less | 18,055 (4.6%) | 21,674 (6.0%) |
| $2,500 to $4,999 | 14,443 (3.7%) | 15,910 (4.4%) |
| $5,000 to $7,499 | 12,649 (3.3%) | 14,386 (4.0%) |
| $7,500 to $9,999 | 8,843 (2.3%) | 10,501 (2.9%) |
| $10,000 to $12,499 | 10,249 (2.6%) | 10,988 (3.0%) |
| $12,500 to $14,999 | 7,592 (1.9%) | 10,145 (2.8%) |
| $15,000 to $17,499 | 8,188 (2.1%) | 10,768 (3.0%) |
| $17,500 to $19,999 | 6,786 (1.8%) | 9,004 (2.5%) |
| $20,000 to $22,499 | 6,969 (1.8%) | 10,389 (2.9%) |
| $22,500 to $24,999 | 9,514 (2.5%) | 10,786 (3.0%) |
| $25,000 to $29,999 | 17,316 (4.5%) | 20,664 (5.7%) |
| $30,000 to $34,999 | 18,346 (4.7%) | 20,370 (5.6%) |
| $35,000 to $39,999 | 17,417 (4.5%) | 19,943 (5.5%) |
| $40,000 to $44,999 | 15,916 (4.1%) | 19,327 (5.3%) |
| $45,000 to $49,999 | 18,355 (4.7%) | 17,070 (4.7%) |
| $50,000 to $54,999 | 17,347 (4.5%) | 15,384 (4.3%) |
| $55,000 to $64,999 | 33,371 (8.6%) | 27,948 (7.7%) |
| $65,000 to $74,999 | 27,476 (7.1%) | 23,081 (6.4%) |
| $75,000 to $99,999 | 48,547 (12.5%) | 37,304 (10.3%) |
| $100,000+ | 71,139 (18.3%) | 35,411 (9.8%) |
| Total | 388,518 (100.0%) | 361,053 (100.0%) |
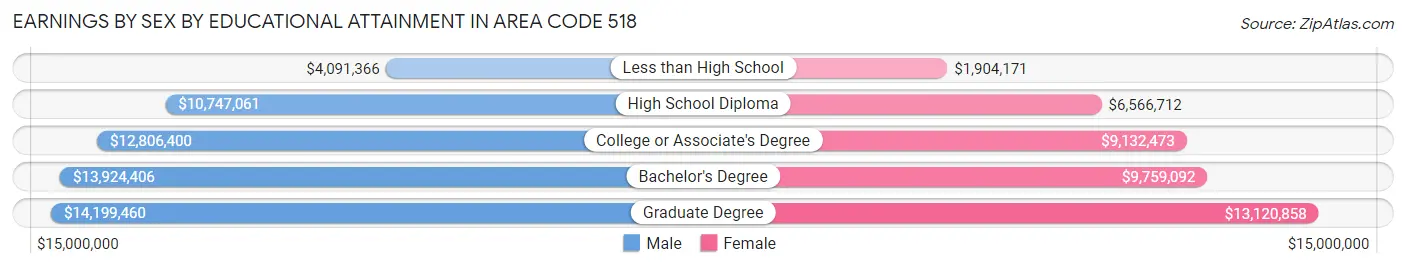
Earnings by Sex by Educational Attainment in Area Code 518
Average earnings in Area Code 518 are $15,815,706 for men and $12,073,460 for women, a difference of 23.7%. Men with an educational attainment of graduate degree enjoy the highest average annual earnings of $14,199,460, while those with less than high school education earn the least with $4,091,366. Women with an educational attainment of graduate degree earn the most with the average annual earnings of $13,120,858, while those with less than high school education have the smallest earnings of $1,904,171.
| Educational Attainment | Male Income | Female Income |
| Less than High School | $4,091,366 | $1,904,171 |
| High School Diploma | $10,747,061 | $6,566,712 |
| College or Associate's Degree | $12,806,400 | $9,132,473 |
| Bachelor's Degree | $13,924,406 | $9,759,092 |
| Graduate Degree | $14,199,460 | $13,120,858 |
| Total | $15,815,706 | $12,073,460 |
Family Income in Area Code 518
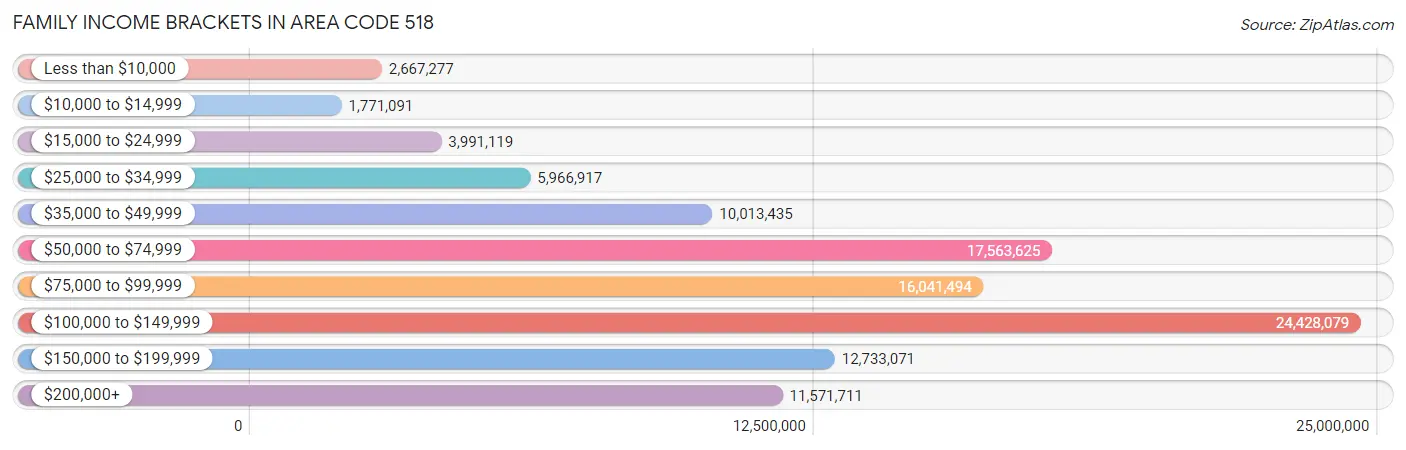
Family Income Brackets in Area Code 518
According to the Area Code 518 family income data, there are 24,428,079 families falling into the $100,000 to $149,999 income range, which is the most common income bracket and makes up 7,231.5% of all families. Conversely, the $10,000 to $14,999 income bracket is the least frequent group with only 1,771,091 families (524.3%) belonging to this category.
| Income Bracket | # Families | % Families |
| Less than $10,000 | 2,667,277 | 789.6% |
| $10,000 to $14,999 | 1,771,091 | 524.3% |
| $15,000 to $24,999 | 3,991,119 | 1,181.5% |
| $25,000 to $34,999 | 5,966,917 | 1,766.4% |
| $35,000 to $49,999 | 10,013,435 | 2,964.3% |
| $50,000 to $74,999 | 17,563,625 | 5,199.4% |
| $75,000 to $99,999 | 16,041,494 | 4,748.8% |
| $100,000 to $149,999 | 24,428,079 | 7,231.5% |
| $150,000 to $199,999 | 12,733,071 | 3,769.4% |
| $200,000+ | 11,571,711 | 3,425.6% |
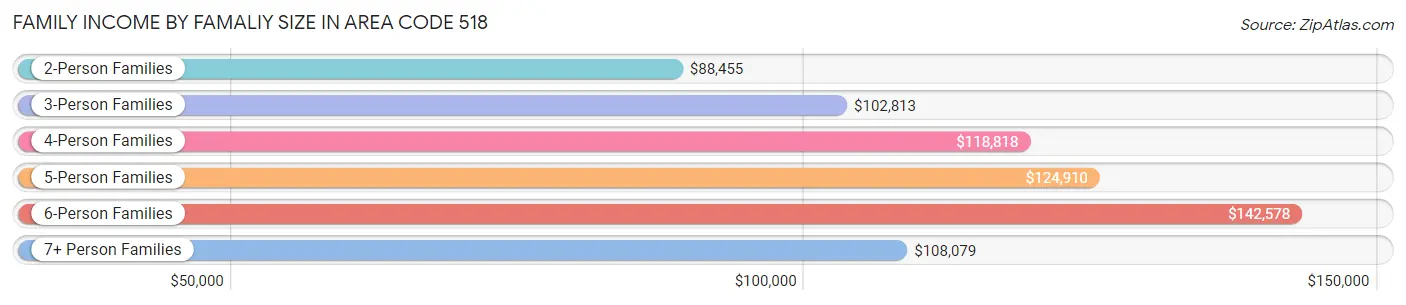
Family Income by Famaliy Size in Area Code 518
6-person families (6,153 | 1.8%) account for the highest median family income in Area Code 518 with $142,578 per family, while 2-person families (176,364 | 52.2%) have the highest median income of $44,227 per family member.
| Income Bracket | # Families | Median Income |
| 2-Person Families | 176,364 (52.2%) | $88,455 |
| 3-Person Families | 75,993 (22.5%) | $102,813 |
| 4-Person Families | 56,439 (16.7%) | $118,818 |
| 5-Person Families | 20,038 (5.9%) | $124,910 |
| 6-Person Families | 6,153 (1.8%) | $142,578 |
| 7+ Person Families | 2,814 (0.8%) | $108,079 |
| Total | 337,801 (100.0%) | $96,883 |
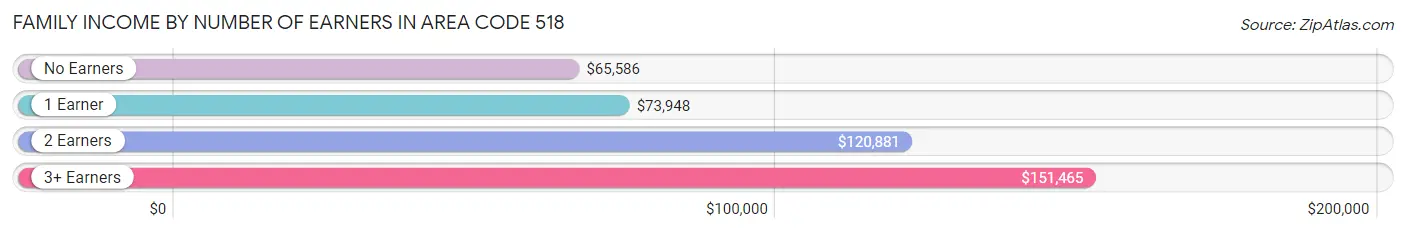
Family Income by Number of Earners in Area Code 518
The median family income in Area Code 518 is $96,883, with families comprising 3+ earners (36,848) having the highest median family income of $151,465, while families with no earners (57,167) have the lowest median family income of $65,586, accounting for 10.9% and 16.9% of families, respectively.
| Number of Earners | # Families | Median Income |
| No Earners | 57,167 (16.9%) | $65,586 |
| 1 Earner | 101,939 (30.2%) | $73,948 |
| 2 Earners | 141,847 (42.0%) | $120,881 |
| 3+ Earners | 36,848 (10.9%) | $151,465 |
| Total | 337,801 (100.0%) | $96,883 |
Household Income in Area Code 518
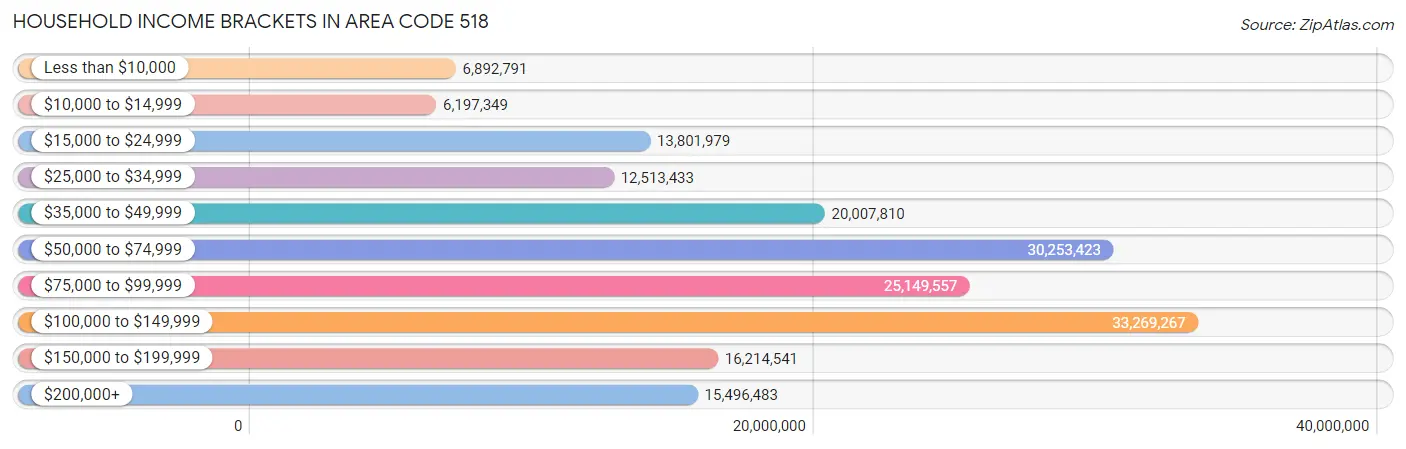
Household Income Brackets in Area Code 518
With 33,269,267 households falling in the category, the $100,000 to $149,999 income range is the most frequent in Area Code 518, accounting for 5,884.2% of all households. In contrast, only 6,197,349 households (1,096.1%) fall into the $10,000 to $14,999 income bracket, making it the least populous group.
| Income Bracket | # Households | % Households |
| Less than $10,000 | 6,892,791 | 1,219.1% |
| $10,000 to $14,999 | 6,197,349 | 1,096.1% |
| $15,000 to $24,999 | 13,801,979 | 2,441.1% |
| $25,000 to $34,999 | 12,513,433 | 2,213.2% |
| $35,000 to $49,999 | 20,007,810 | 3,538.7% |
| $50,000 to $74,999 | 30,253,423 | 5,350.8% |
| $75,000 to $99,999 | 25,149,557 | 4,448.1% |
| $100,000 to $149,999 | 33,269,267 | 5,884.2% |
| $150,000 to $199,999 | 16,214,541 | 2,867.8% |
| $200,000+ | 15,496,483 | 2,740.8% |
Household Income by Householder Age in Area Code 518
The median household income in Area Code 518 is $78,242, with the highest median household income of $94,542 found in the 45 to 64 years age bracket for the primary householder. A total of 211,986 households (37.5%) fall into this category. Meanwhile, the 15 to 24 years age bracket for the primary householder has the lowest median household income of $53,542, with 21,369 households (3.8%) in this group.
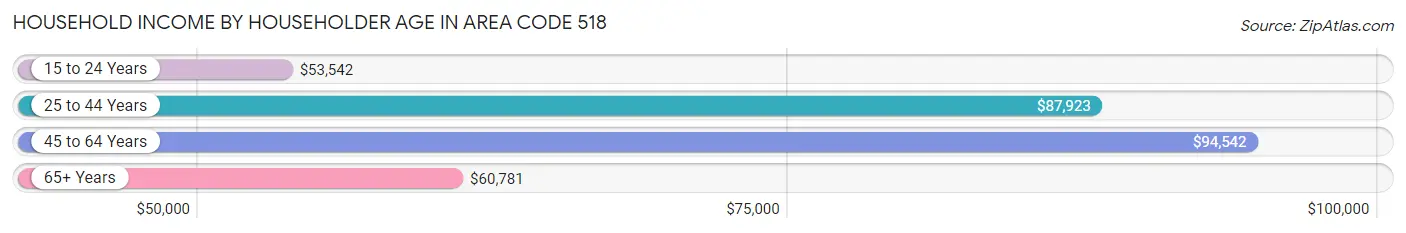
| Income Bracket | # Households | Median Income |
| 15 to 24 Years | 21,369 (3.8%) | $53,542 |
| 25 to 44 Years | 164,925 (29.2%) | $87,923 |
| 45 to 64 Years | 211,986 (37.5%) | $94,542 |
| 65+ Years | 167,120 (29.6%) | $60,781 |
| Total | 565,400 (100.0%) | $78,242 |
Poverty in Area Code 518
Income Below Poverty by Sex and Age in Area Code 518
With 10.3% poverty level for males and 12.1% for females among the residents of Area Code 518, under 5 year old males and 18 to 24 year old females are the most vulnerable to poverty, with 5,662 males (17.2%) and 11,791 females (21.0%) in their respective age groups living below the poverty level.
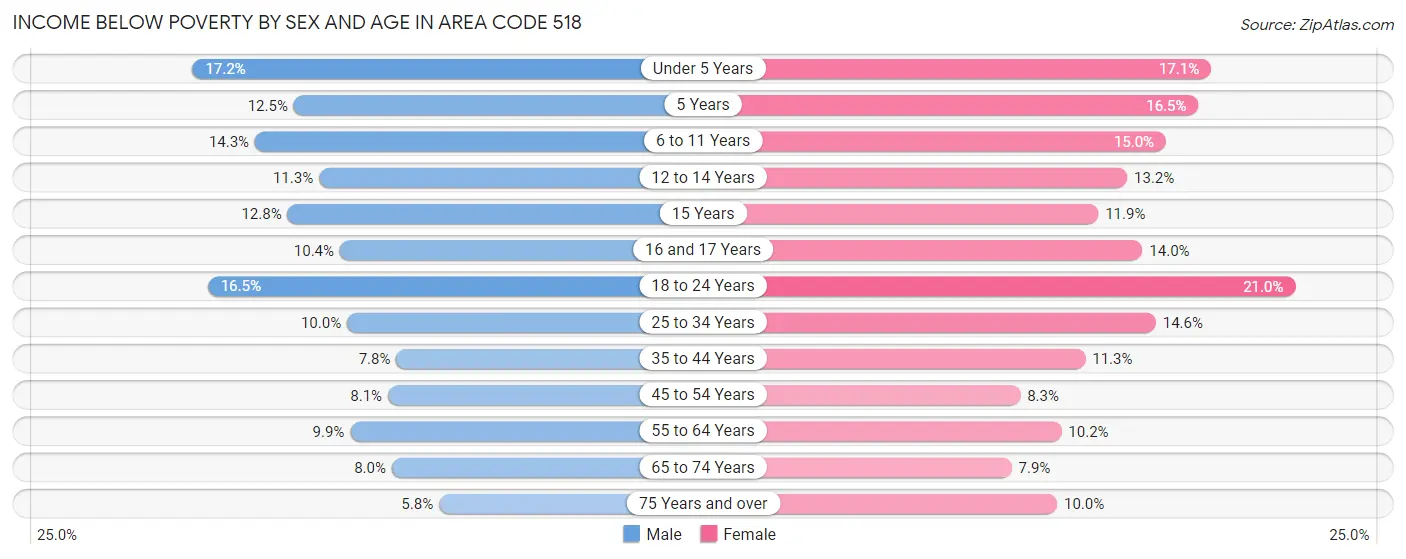
| Age Bracket | Male | Female |
| Under 5 Years | 5,662 (17.2%) | 5,549 (17.1%) |
| 5 Years | 908 (12.5%) | 961 (16.5%) |
| 6 to 11 Years | 6,165 (14.3%) | 6,239 (15.0%) |
| 12 to 14 Years | 2,658 (11.3%) | 2,814 (13.2%) |
| 15 Years | 971 (12.8%) | 888 (11.9%) |
| 16 and 17 Years | 1,687 (10.4%) | 2,076 (14.0%) |
| 18 to 24 Years | 9,839 (16.5%) | 11,791 (21.0%) |
| 25 to 34 Years | 8,556 (10.0%) | 12,102 (14.6%) |
| 35 to 44 Years | 6,278 (7.7%) | 9,125 (11.3%) |
| 45 to 54 Years | 6,943 (8.1%) | 7,013 (8.3%) |
| 55 to 64 Years | 9,578 (9.9%) | 10,207 (10.2%) |
| 65 to 74 Years | 5,916 (8.0%) | 6,289 (7.9%) |
| 75 Years and over | 2,456 (5.8%) | 5,921 (10.0%) |
| Total | 67,617 (10.3%) | 80,975 (12.1%) |
Income Above Poverty by Sex and Age in Area Code 518
According to the poverty statistics in Area Code 518, males aged 75 years and over and females aged 65 to 74 years are the age groups that are most secure financially, with 94.2% of males and 92.1% of females in these age groups living above the poverty line.
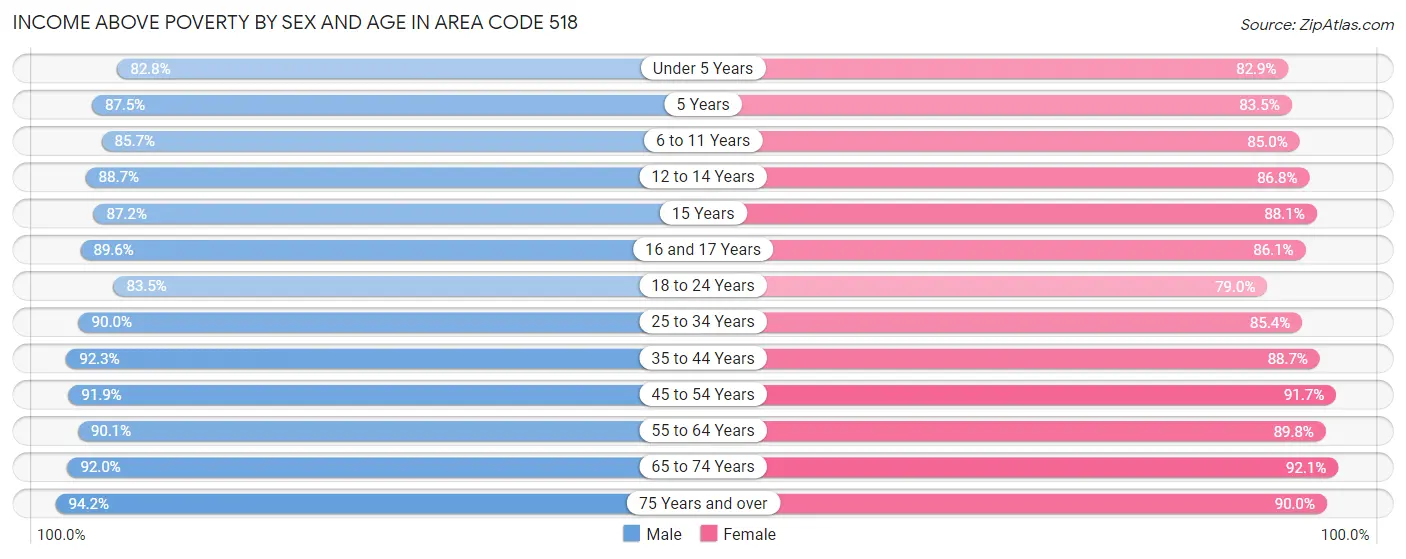
| Age Bracket | Male | Female |
| Under 5 Years | 27,240 (82.8%) | 26,839 (82.9%) |
| 5 Years | 6,352 (87.5%) | 4,850 (83.5%) |
| 6 to 11 Years | 36,916 (85.7%) | 35,255 (85.0%) |
| 12 to 14 Years | 20,789 (88.7%) | 18,447 (86.8%) |
| 15 Years | 6,615 (87.2%) | 6,575 (88.1%) |
| 16 and 17 Years | 14,583 (89.6%) | 12,806 (86.1%) |
| 18 to 24 Years | 49,786 (83.5%) | 44,245 (79.0%) |
| 25 to 34 Years | 76,669 (90.0%) | 70,941 (85.4%) |
| 35 to 44 Years | 74,772 (92.2%) | 71,619 (88.7%) |
| 45 to 54 Years | 78,315 (91.9%) | 77,723 (91.7%) |
| 55 to 64 Years | 87,309 (90.1%) | 89,950 (89.8%) |
| 65 to 74 Years | 68,390 (92.0%) | 73,497 (92.1%) |
| 75 Years and over | 40,141 (94.2%) | 53,368 (90.0%) |
| Total | 587,877 (89.7%) | 586,115 (87.9%) |
Income Below Poverty Among Married-Couple Families in Area Code 518
The poverty statistics for married-couple families in Area Code 518 show that 3.2% or 8,186 of the total 252,901 families live below the poverty line. Families with 5 or more children have the highest poverty rate of 15.9%, comprising of 170 families. On the other hand, families with no children have the lowest poverty rate of 2.8%, which includes 4,472 families.
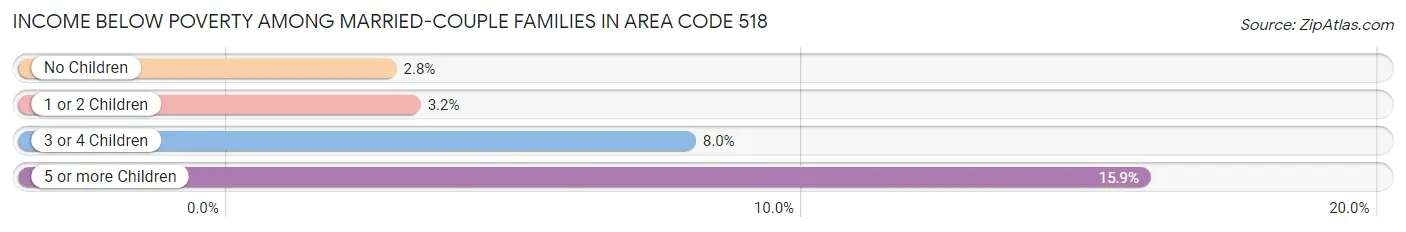
| Children | Above Poverty | Below Poverty |
| No Children | 157,648 (97.2%) | 4,472 (2.8%) |
| 1 or 2 Children | 72,963 (96.8%) | 2,400 (3.2%) |
| 3 or 4 Children | 13,204 (92.0%) | 1,144 (8.0%) |
| 5 or more Children | 900 (84.1%) | 170 (15.9%) |
| Total | 244,715 (96.8%) | 8,186 (3.2%) |
Income Below Poverty Among Single-Parent Households in Area Code 518
According to the poverty data in Area Code 518, 14.2% or 3,539 single-father households and 21.6% or 12,937 single-mother households are living below the poverty line. Among single-father households, those with 5 or more children have the highest poverty rate, with 23 households (65.7%) experiencing poverty. Likewise, among single-mother households, those with 3 or 4 children have the highest poverty rate, with 2,825 households (51.1%) falling below the poverty line.

| Children | Single Father | Single Mother |
| No Children | 705 (6.5%) | 1,832 (7.7%) |
| 1 or 2 Children | 2,260 (18.5%) | 8,161 (26.9%) |
| 3 or 4 Children | 551 (29.4%) | 2,825 (51.1%) |
| 5 or more Children | 23 (65.7%) | 119 (48.6%) |
| Total | 3,539 (14.2%) | 12,937 (21.6%) |
Income Below Poverty Among Married-Couple vs Single-Parent Households in Area Code 518
The poverty data for Area Code 518 shows that 8,186 of the married-couple family households (3.2%) and 16,476 of the single-parent households (19.4%) are living below the poverty level. Within the married-couple family households, those with 5 or more children have the highest poverty rate, with 170 households (15.9%) falling below the poverty line. Among the single-parent households, those with 5 or more children have the highest poverty rate, with 142 household (50.7%) living below poverty.
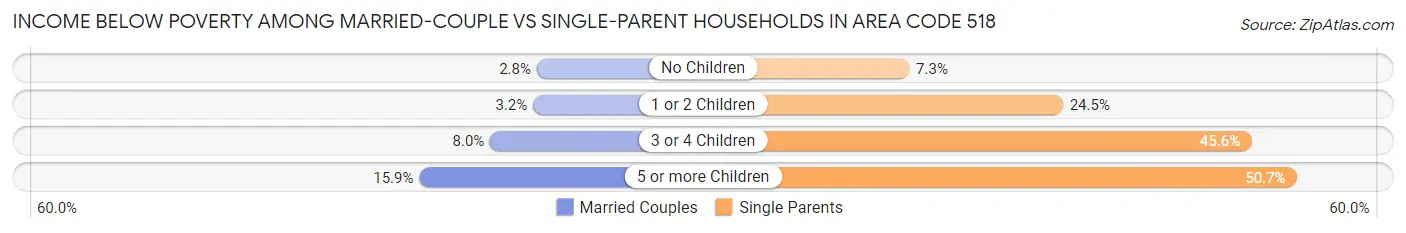
| Children | Married-Couple Families | Single-Parent Households |
| No Children | 4,472 (2.8%) | 2,537 (7.3%) |
| 1 or 2 Children | 2,400 (3.2%) | 10,421 (24.5%) |
| 3 or 4 Children | 1,144 (8.0%) | 3,376 (45.6%) |
| 5 or more Children | 170 (15.9%) | 142 (50.7%) |
| Total | 8,186 (3.2%) | 16,476 (19.4%) |
Race in Area Code 518
The most populous races in Area Code 518 are White / Caucasian (1,134,819 | 82.6%), Black / African American (85,272 | 6.2%), and Hispanic or Latino (75,269 | 5.5%).
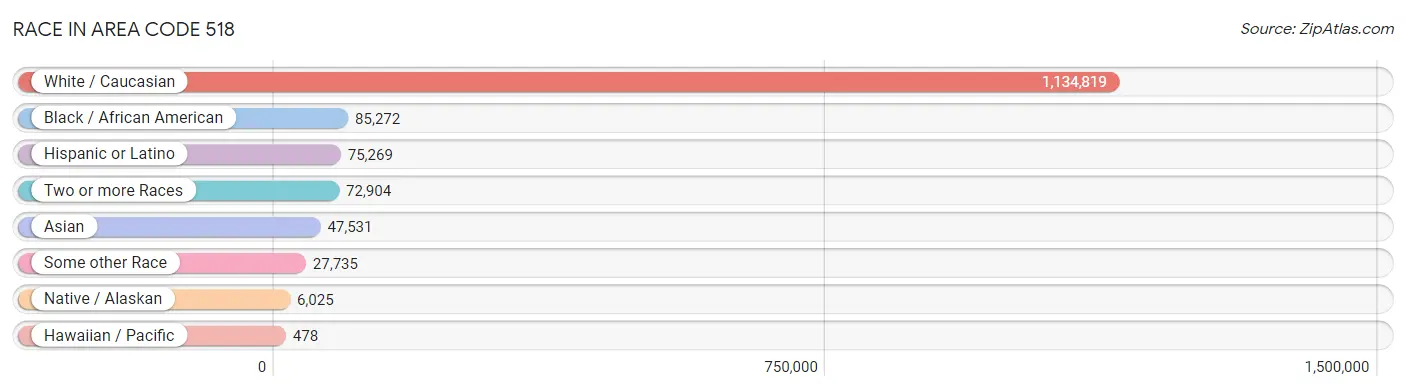
| Race | # Population | % Population |
| Asian | 47,531 | 3.5% |
| Black / African American | 85,272 | 6.2% |
| Hawaiian / Pacific | 478 | 0.0% |
| Hispanic or Latino | 75,269 | 5.5% |
| Native / Alaskan | 6,025 | 0.4% |
| White / Caucasian | 1,134,819 | 82.6% |
| Two or more Races | 72,904 | 5.3% |
| Some other Race | 27,735 | 2.0% |
| Total | 1,374,764 | 100.0% |
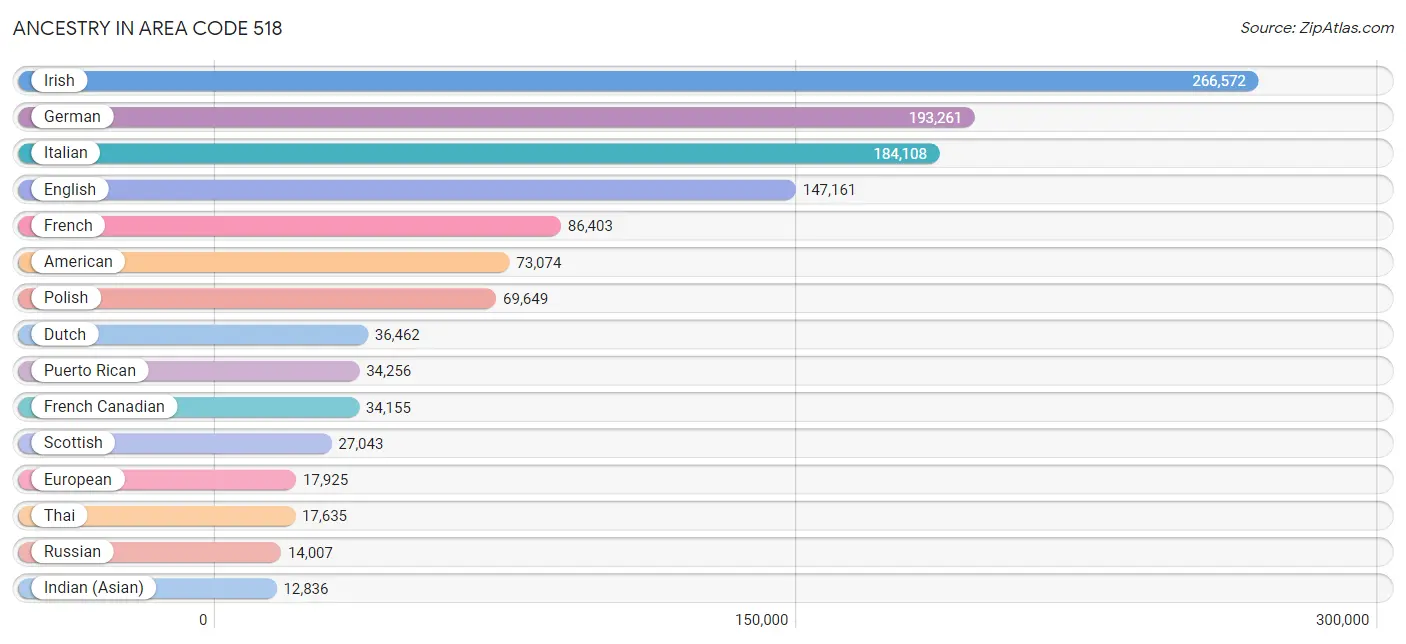
Ancestry in Area Code 518
The most populous ancestries reported in Area Code 518 are Irish (266,572 | 19.4%), German (193,261 | 14.1%), Italian (184,108 | 13.4%), English (147,161 | 10.7%), and French (86,403 | 6.3%), together accounting for 63.8% of all Area Code 518 residents.
| Ancestry | # Population | % Population |
| Afghan | 2,027 | 0.2% |
| African | 3,547 | 0.3% |
| Alaska Native | 44 | 0.0% |
| Alaskan Athabascan | 5 | 0.0% |
| Albanian | 1,535 | 0.1% |
| Alsatian | 51 | 0.0% |
| American | 73,074 | 5.3% |
| Apache | 74 | 0.0% |
| Arab | 7,961 | 0.6% |
| Argentinean | 665 | 0.1% |
| Armenian | 2,621 | 0.2% |
| Australian | 165 | 0.0% |
| Austrian | 3,651 | 0.3% |
| Bahamian | 41 | 0.0% |
| Barbadian | 485 | 0.0% |
| Basque | 91 | 0.0% |
| Belgian | 988 | 0.1% |
| Belizean | 29 | 0.0% |
| Bhutanese | 2,517 | 0.2% |
| Blackfeet | 751 | 0.1% |
| Bolivian | 175 | 0.0% |
| Brazilian | 539 | 0.0% |
| British | 6,447 | 0.5% |
| British West Indian | 583 | 0.0% |
| Bulgarian | 150 | 0.0% |
| Burmese | 4,277 | 0.3% |
| Cajun | 107 | 0.0% |
| Cambodian | 41 | 0.0% |
| Canadian | 4,408 | 0.3% |
| Cape Verdean | 35 | 0.0% |
| Carpatho Rusyn | 43 | 0.0% |
| Celtic | 355 | 0.0% |
| Central American | 6,499 | 0.5% |
| Central American Indian | 797 | 0.1% |
| Cherokee | 1,851 | 0.1% |
| Cheyenne | 22 | 0.0% |
| Chickasaw | 6 | 0.0% |
| Chilean | 573 | 0.0% |
| Chippewa | 90 | 0.0% |
| Choctaw | 37 | 0.0% |
| Colombian | 1,607 | 0.1% |
| Costa Rican | 650 | 0.1% |
| Cree | 37 | 0.0% |
| Creek | 81 | 0.0% |
| Croatian | 986 | 0.1% |
| Cuban | 2,313 | 0.2% |
| Cypriot | 45 | 0.0% |
| Czech | 3,701 | 0.3% |
| Czechoslovakian | 1,508 | 0.1% |
| Danish | 4,023 | 0.3% |
| Delaware | 28 | 0.0% |
| Dominican | 7,157 | 0.5% |
| Dutch | 36,462 | 2.6% |
| Eastern European | 5,508 | 0.4% |
| Ecuadorian | 2,258 | 0.2% |
| Egyptian | 1,185 | 0.1% |
| English | 147,161 | 10.7% |
| Estonian | 192 | 0.0% |
| Ethiopian | 314 | 0.0% |
| European | 17,925 | 1.3% |
| Filipino | 226 | 0.0% |
| Finnish | 1,302 | 0.1% |
| French | 86,403 | 6.3% |
| French American Indian | 512 | 0.0% |
| French Canadian | 34,155 | 2.5% |
| German | 193,261 | 14.1% |
| German Russian | 93 | 0.0% |
| Ghanaian | 790 | 0.1% |
| Greek | 6,466 | 0.5% |
| Guamanian / Chamorro | 49 | 0.0% |
| Guatemalan | 1,317 | 0.1% |
| Guyanese | 6,142 | 0.4% |
| Haitian | 2,107 | 0.2% |
| Honduran | 1,447 | 0.1% |
| Hungarian | 6,124 | 0.4% |
| Icelander | 105 | 0.0% |
| Indian (Asian) | 12,836 | 0.9% |
| Indonesian | 1,978 | 0.1% |
| Inupiat | 10 | 0.0% |
| Iranian | 852 | 0.1% |
| Iraqi | 288 | 0.0% |
| Irish | 266,572 | 19.4% |
| Iroquois | 3,946 | 0.3% |
| Israeli | 354 | 0.0% |
| Italian | 184,108 | 13.4% |
| Jamaican | 4,547 | 0.3% |
| Japanese | 240 | 0.0% |
| Jordanian | 192 | 0.0% |
| Kenyan | 189 | 0.0% |
| Kiowa | 93 | 0.0% |
| Korean | 5,816 | 0.4% |
| Laotian | 191 | 0.0% |
| Latvian | 979 | 0.1% |
| Lebanese | 2,529 | 0.2% |
| Liberian | 36 | 0.0% |
| Lithuanian | 4,419 | 0.3% |
| Lumbee | 1 | 0.0% |
| Luxembourger | 130 | 0.0% |
| Macedonian | 211 | 0.0% |
| Malaysian | 17 | 0.0% |
| Maltese | 47 | 0.0% |
| Marshallese | 3 | 0.0% |
| Mexican | 9,454 | 0.7% |
| Mexican American Indian | 553 | 0.0% |
| Mongolian | 293 | 0.0% |
| Moroccan | 300 | 0.0% |
| Native Hawaiian | 533 | 0.0% |
| Navajo | 82 | 0.0% |
| New Zealander | 48 | 0.0% |
| Nicaraguan | 98 | 0.0% |
| Nigerian | 1,595 | 0.1% |
| Northern European | 1,775 | 0.1% |
| Norwegian | 7,812 | 0.6% |
| Okinawan | 19 | 0.0% |
| Ottawa | 46 | 0.0% |
| Pakistani | 836 | 0.1% |
| Palestinian | 424 | 0.0% |
| Panamanian | 725 | 0.1% |
| Paraguayan | 24 | 0.0% |
| Pennsylvania German | 489 | 0.0% |
| Peruvian | 1,319 | 0.1% |
| Polish | 69,649 | 5.1% |
| Portuguese | 2,851 | 0.2% |
| Potawatomi | 3 | 0.0% |
| Pueblo | 28 | 0.0% |
| Puerto Rican | 34,256 | 2.5% |
| Romanian | 1,770 | 0.1% |
| Russian | 14,007 | 1.0% |
| Salvadoran | 2,056 | 0.2% |
| Samoan | 126 | 0.0% |
| Scandinavian | 2,994 | 0.2% |
| Scotch-Irish | 9,706 | 0.7% |
| Scottish | 27,043 | 2.0% |
| Seminole | 21 | 0.0% |
| Senegalese | 315 | 0.0% |
| Serbian | 403 | 0.0% |
| Sierra Leonean | 11 | 0.0% |
| Sioux | 557 | 0.0% |
| Slavic | 671 | 0.1% |
| Slovak | 3,474 | 0.3% |
| Slovene | 248 | 0.0% |
| Somali | 101 | 0.0% |
| South African | 452 | 0.0% |
| South American | 7,367 | 0.5% |
| South American Indian | 107 | 0.0% |
| Spaniard | 2,258 | 0.2% |
| Spanish | 1,632 | 0.1% |
| Spanish American | 168 | 0.0% |
| Sri Lankan | 2,191 | 0.2% |
| Subsaharan African | 8,614 | 0.6% |
| Sudanese | 521 | 0.0% |
| Swedish | 10,347 | 0.7% |
| Swiss | 3,417 | 0.3% |
| Syrian | 980 | 0.1% |
| Thai | 17,635 | 1.3% |
| Tongan | 20 | 0.0% |
| Trinidadian and Tobagonian | 873 | 0.1% |
| Turkish | 907 | 0.1% |
| U.S. Virgin Islander | 59 | 0.0% |
| Ugandan | 125 | 0.0% |
| Ukrainian | 8,393 | 0.6% |
| Uruguayan | 184 | 0.0% |
| Venezuelan | 404 | 0.0% |
| Vietnamese | 812 | 0.1% |
| Welsh | 9,864 | 0.7% |
| West Indian | 2,253 | 0.2% |
| Yaqui | 83 | 0.0% |
| Yugoslavian | 1,332 | 0.1% |
| Yuman | 3 | 0.0% |
| Yup'ik | 4 | 0.0% |
| Zimbabwean | 4 | 0.0% | View All 171 Rows |
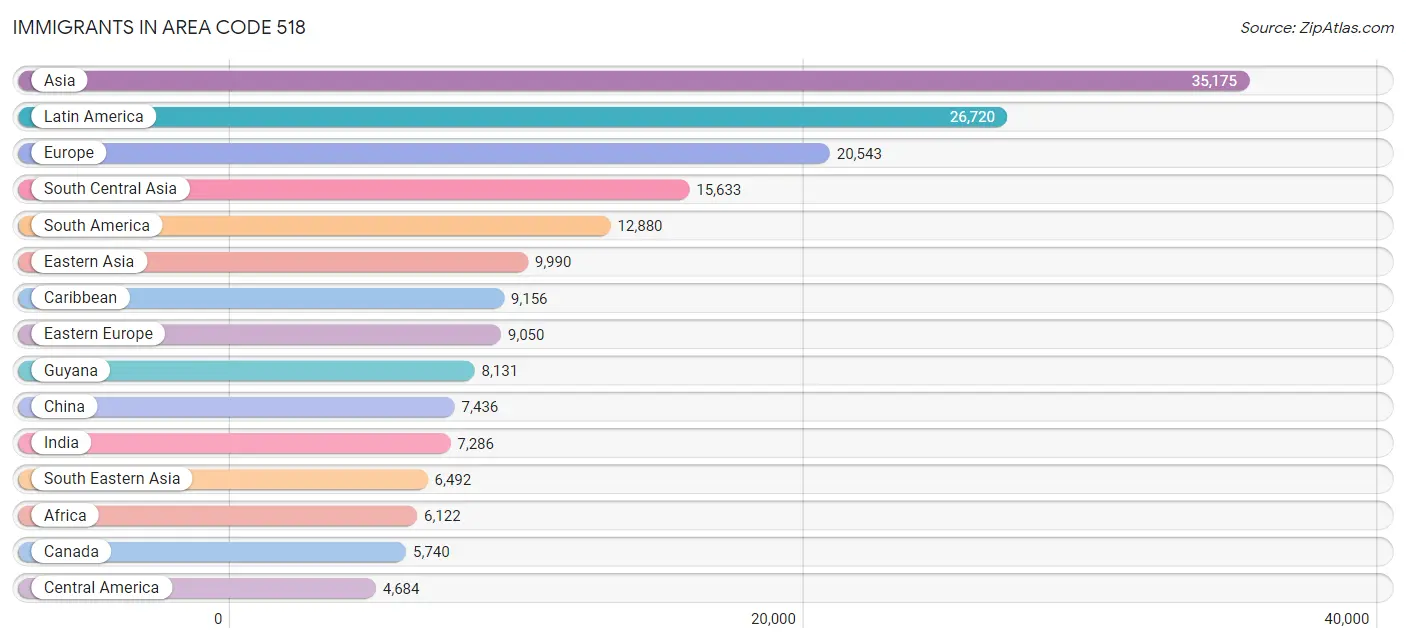
Immigrants in Area Code 518
The most numerous immigrant groups reported in Area Code 518 came from Asia (35,175 | 2.6%), Latin America (26,720 | 1.9%), Europe (20,543 | 1.5%), South Central Asia (15,633 | 1.1%), and South America (12,880 | 0.9%), together accounting for 8.1% of all Area Code 518 residents.
| Immigration Origin | # Population | % Population |
| Afghanistan | 1,913 | 0.1% |
| Africa | 6,122 | 0.4% |
| Albania | 1,050 | 0.1% |
| Argentina | 412 | 0.0% |
| Armenia | 143 | 0.0% |
| Asia | 35,175 | 2.6% |
| Australia | 181 | 0.0% |
| Austria | 215 | 0.0% |
| Bahamas | 9 | 0.0% |
| Bangladesh | 1,898 | 0.1% |
| Barbados | 155 | 0.0% |
| Belarus | 255 | 0.0% |
| Belgium | 244 | 0.0% |
| Belize | 1 | 0.0% |
| Bolivia | 60 | 0.0% |
| Bosnia and Herzegovina | 458 | 0.0% |
| Brazil | 824 | 0.1% |
| Bulgaria | 83 | 0.0% |
| Cambodia | 44 | 0.0% |
| Cameroon | 108 | 0.0% |
| Canada | 5,740 | 0.4% |
| Caribbean | 9,156 | 0.7% |
| Central America | 4,684 | 0.3% |
| Chile | 187 | 0.0% |
| China | 7,436 | 0.5% |
| Colombia | 668 | 0.1% |
| Congo | 25 | 0.0% |
| Costa Rica | 233 | 0.0% |
| Croatia | 157 | 0.0% |
| Cuba | 379 | 0.0% |
| Czechoslovakia | 302 | 0.0% |
| Denmark | 67 | 0.0% |
| Dominica | 98 | 0.0% |
| Dominican Republic | 3,106 | 0.2% |
| Eastern Africa | 1,307 | 0.1% |
| Eastern Asia | 9,990 | 0.7% |
| Eastern Europe | 9,050 | 0.7% |
| Ecuador | 1,183 | 0.1% |
| Egypt | 712 | 0.1% |
| El Salvador | 726 | 0.1% |
| England | 1,136 | 0.1% |
| Eritrea | 57 | 0.0% |
| Ethiopia | 173 | 0.0% |
| Europe | 20,543 | 1.5% |
| Fiji | 8 | 0.0% |
| France | 574 | 0.0% |
| Germany | 2,572 | 0.2% |
| Ghana | 758 | 0.1% |
| Greece | 438 | 0.0% |
| Grenada | 28 | 0.0% |
| Guatemala | 845 | 0.1% |
| Guyana | 8,131 | 0.6% |
| Haiti | 938 | 0.1% |
| Honduras | 376 | 0.0% |
| Hong Kong | 507 | 0.0% |
| Hungary | 380 | 0.0% |
| India | 7,286 | 0.5% |
| Indonesia | 127 | 0.0% |
| Iran | 466 | 0.0% |
| Iraq | 443 | 0.0% |
| Ireland | 615 | 0.0% |
| Israel | 175 | 0.0% |
| Italy | 2,417 | 0.2% |
| Jamaica | 2,856 | 0.2% |
| Japan | 702 | 0.1% |
| Jordan | 281 | 0.0% |
| Kazakhstan | 190 | 0.0% |
| Kenya | 151 | 0.0% |
| Korea | 1,830 | 0.1% |
| Kuwait | 149 | 0.0% |
| Laos | 38 | 0.0% |
| Latin America | 26,720 | 1.9% |
| Latvia | 126 | 0.0% |
| Lebanon | 368 | 0.0% |
| Liberia | 20 | 0.0% |
| Lithuania | 24 | 0.0% |
| Malaysia | 352 | 0.0% |
| Mexico | 2,202 | 0.2% |
| Micronesia | 21 | 0.0% |
| Middle Africa | 282 | 0.0% |
| Moldova | 209 | 0.0% |
| Morocco | 204 | 0.0% |
| Nepal | 597 | 0.0% |
| Netherlands | 232 | 0.0% |
| Nicaragua | 91 | 0.0% |
| Nigeria | 881 | 0.1% |
| North Macedonia | 24 | 0.0% |
| Northern Africa | 1,644 | 0.1% |
| Northern Europe | 4,108 | 0.3% |
| Norway | 156 | 0.0% |
| Oceania | 319 | 0.0% |
| Pakistan | 2,677 | 0.2% |
| Panama | 210 | 0.0% |
| Peru | 770 | 0.1% |
| Philippines | 2,960 | 0.2% |
| Poland | 1,559 | 0.1% |
| Portugal | 93 | 0.0% |
| Romania | 352 | 0.0% |
| Russia | 1,597 | 0.1% |
| Saudi Arabia | 292 | 0.0% |
| Scotland | 422 | 0.0% |
| Senegal | 114 | 0.0% |
| Serbia | 126 | 0.0% |
| Sierra Leone | 43 | 0.0% |
| Singapore | 46 | 0.0% |
| Somalia | 65 | 0.0% |
| South Africa | 560 | 0.0% |
| South America | 12,880 | 0.9% |
| South Central Asia | 15,633 | 1.1% |
| South Eastern Asia | 6,492 | 0.5% |
| Southern Europe | 3,177 | 0.2% |
| Spain | 224 | 0.0% |
| Sri Lanka | 154 | 0.0% |
| St. Vincent and the Grenadines | 191 | 0.0% |
| Sudan | 237 | 0.0% |
| Sweden | 122 | 0.0% |
| Switzerland | 356 | 0.0% |
| Syria | 169 | 0.0% |
| Taiwan | 744 | 0.1% |
| Thailand | 647 | 0.1% |
| Trinidad and Tobago | 869 | 0.1% |
| Turkey | 606 | 0.0% |
| Uganda | 99 | 0.0% |
| Ukraine | 1,462 | 0.1% |
| Uruguay | 58 | 0.0% |
| Uzbekistan | 377 | 0.0% |
| Venezuela | 411 | 0.0% |
| Vietnam | 1,170 | 0.1% |
| West Indies | 168 | 0.0% |
| Western Africa | 2,168 | 0.2% |
| Western Asia | 2,976 | 0.2% |
| Western Europe | 4,202 | 0.3% |
| Yemen | 109 | 0.0% |
| Zaire | 128 | 0.0% |
| Zimbabwe | 13 | 0.0% | View All 135 Rows |
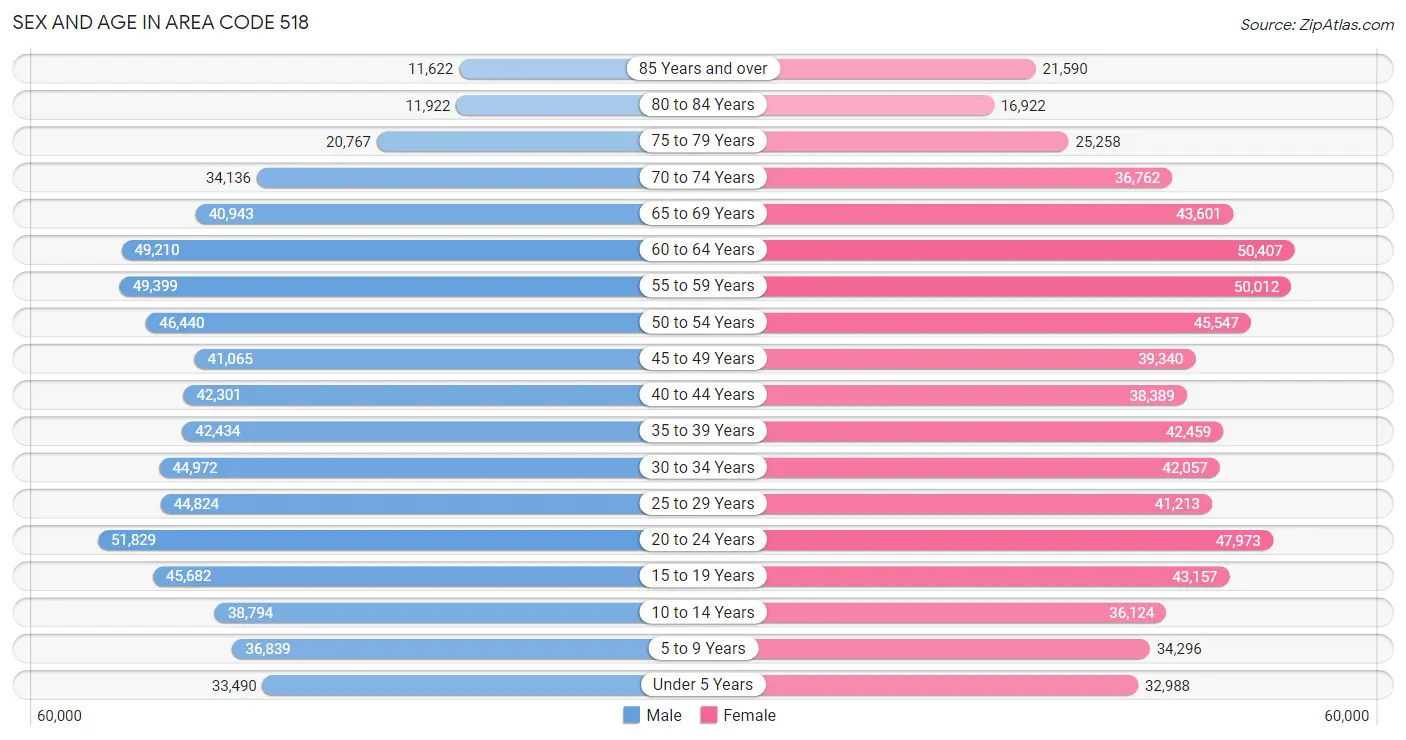
Sex and Age in Area Code 518
Sex and Age in Area Code 518
The most populous age groups in Area Code 518 are 20 to 24 Years (51,829 | 7.5%) for men and 60 to 64 Years (50,407 | 7.3%) for women.
| Age Bracket | Male | Female |
| Under 5 Years | 33,490 (4.9%) | 32,988 (4.8%) |
| 5 to 9 Years | 36,839 (5.4%) | 34,296 (5.0%) |
| 10 to 14 Years | 38,794 (5.7%) | 36,124 (5.2%) |
| 15 to 19 Years | 45,682 (6.7%) | 43,157 (6.3%) |
| 20 to 24 Years | 51,829 (7.5%) | 47,973 (7.0%) |
| 25 to 29 Years | 44,824 (6.5%) | 41,213 (6.0%) |
| 30 to 34 Years | 44,972 (6.6%) | 42,057 (6.1%) |
| 35 to 39 Years | 42,434 (6.2%) | 42,459 (6.2%) |
| 40 to 44 Years | 42,301 (6.2%) | 38,389 (5.6%) |
| 45 to 49 Years | 41,065 (6.0%) | 39,340 (5.7%) |
| 50 to 54 Years | 46,440 (6.8%) | 45,547 (6.6%) |
| 55 to 59 Years | 49,399 (7.2%) | 50,012 (7.3%) |
| 60 to 64 Years | 49,210 (7.2%) | 50,407 (7.3%) |
| 65 to 69 Years | 40,943 (6.0%) | 43,601 (6.3%) |
| 70 to 74 Years | 34,136 (5.0%) | 36,762 (5.3%) |
| 75 to 79 Years | 20,767 (3.0%) | 25,258 (3.7%) |
| 80 to 84 Years | 11,922 (1.7%) | 16,922 (2.5%) |
| 85 Years and over | 11,622 (1.7%) | 21,590 (3.1%) |
| Total | 686,669 (100.0%) | 688,095 (100.0%) |
Families and Households in Area Code 518
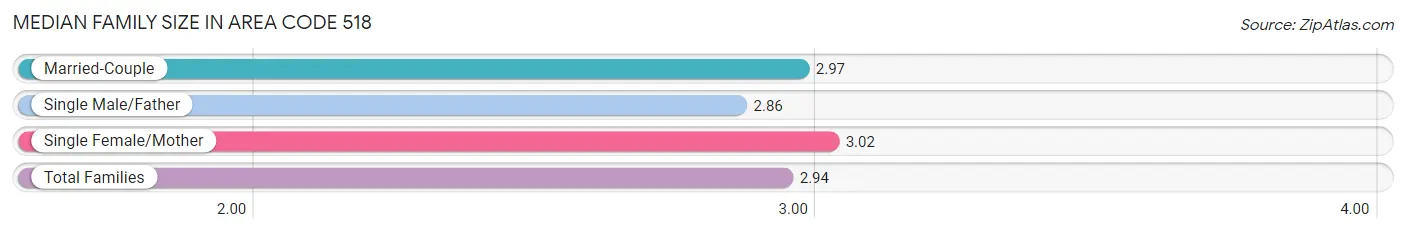
Median Family Size in Area Code 518
The median family size in Area Code 518 is 2.94 persons per family, with single female/mother families (59,911 | 17.7%) accounting for the largest median family size of 3.02243 persons per family. On the other hand, single male/father families (24,989 | 7.4%) represent the smallest median family size with 2.86 persons per family.
| Family Type | # Families | Family Size |
| Married-Couple | 252,901 (74.9%) | 2.97 |
| Single Male/Father | 24,989 (7.4%) | 2.86 |
| Single Female/Mother | 59,911 (17.7%) | 3.02 |
| Total Families | 337,801 (100.0%) | 2.94 |
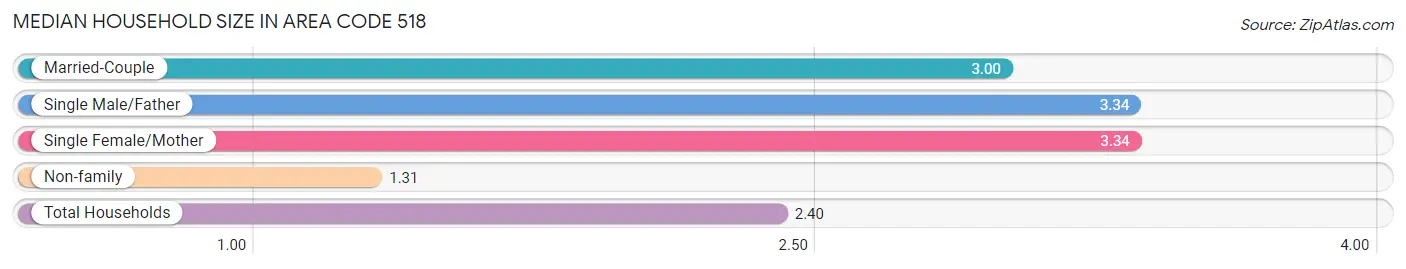
Median Household Size in Area Code 518
The median household size in Area Code 518 is 2.40 persons per household, with single female/mother households (59,911 | 10.6%) accounting for the largest median household size of 3.3438 persons per household. non-family households (227,599 | 40.3%) represent the smallest median household size with 1.31 persons per household.
| Household Type | # Households | Household Size |
| Married-Couple | 252,901 (44.7%) | 3.00 |
| Single Male/Father | 24,989 (4.4%) | 3.34 |
| Single Female/Mother | 59,911 (10.6%) | 3.34 |
| Non-family | 227,599 (40.3%) | 1.31 |
| Total Households | 565,400 (100.0%) | 2.40 |
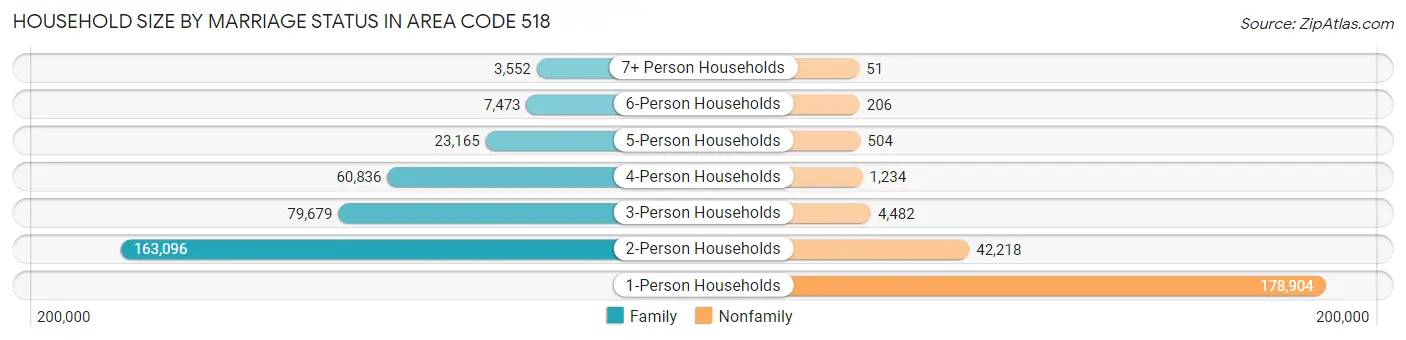
Household Size by Marriage Status in Area Code 518
Out of a total of 565,400 households in Area Code 518, 337,801 (59.8%) are family households, while 227,599 (40.3%) are nonfamily households. The most numerous type of family households are 2-person households, comprising 163,096, and the most common type of nonfamily households are 1-person households, comprising 178,904.
| Household Size | Family Households | Nonfamily Households |
| 1-Person Households | - | 178,904 (31.6%) |
| 2-Person Households | 163,096 (28.8%) | 42,218 (7.5%) |
| 3-Person Households | 79,679 (14.1%) | 4,482 (0.8%) |
| 4-Person Households | 60,836 (10.8%) | 1,234 (0.2%) |
| 5-Person Households | 23,165 (4.1%) | 504 (0.1%) |
| 6-Person Households | 7,473 (1.3%) | 206 (0.0%) |
| 7+ Person Households | 3,552 (0.6%) | 51 (0.0%) |
| Total | 337,801 (59.8%) | 227,599 (40.3%) |
Female Fertility in Area Code 518
Fertility by Age in Area Code 518
Average fertility rate in Area Code 518 is 94.8 births per 1,000 women. Women in the age bracket of 20 to 34 years have the highest fertility rate with 169.9 births per 1,000 women. Women in the age bracket of 20 to 34 years acount for 68.8% of all women with births.
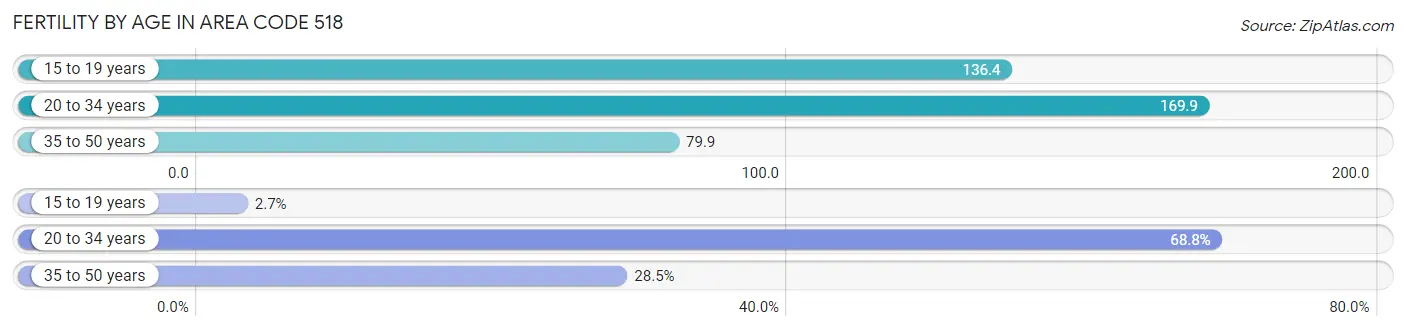
| Age Bracket | Women with Births | Births / 1,000 Women |
| 15 to 19 years | 403 (2.7%) | 136.4 |
| 20 to 34 years | 10,287 (68.8%) | 169.9 |
| 35 to 50 years | 4,253 (28.5%) | 79.9 |
| Total | 14,943 (100.0%) | 94.8 |
Fertility by Age by Marriage Status in Area Code 518
56.9% of women with births (14,943) in Area Code 518 are married. The highest percentage of unmarried women with births falls into 15 to 19 years age bracket with 100.0% of them unmarried at the time of birth, while the lowest percentage of unmarried women with births belong to 20 to 34 years age bracket with 47.8% of them unmarried.
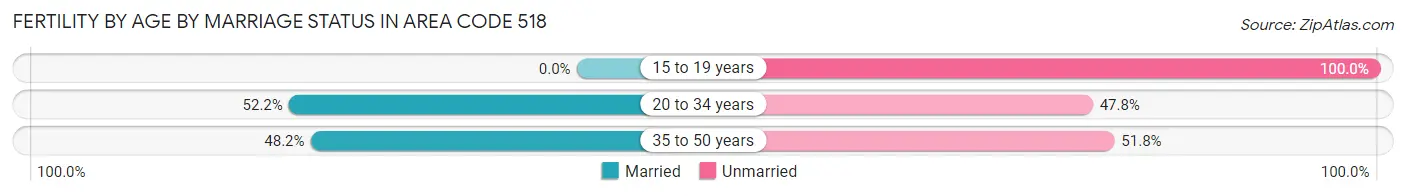
| Age Bracket | Married | Unmarried |
| 15 to 19 years | 0 (0.0%) | 403 (100.0%) |
| 20 to 34 years | 5,366 (52.2%) | 4,921 (47.8%) |
| 35 to 50 years | 2,051 (48.2%) | 2,202 (51.8%) |
| Total | 8,502 (56.9%) | 6,441 (43.1%) |
Fertility by Education in Area Code 518
Average fertility rate in Area Code 518 is 94.8 births per 1,000 women. Women with the education attainment of graduate degree have the highest fertility rate of 203.1 births per 1,000 women, while women with the education attainment of less than high school have the lowest fertility at 127.8 births per 1,000 women. Women with the education attainment of college or associate's degree represent 29.7% of all women with births.
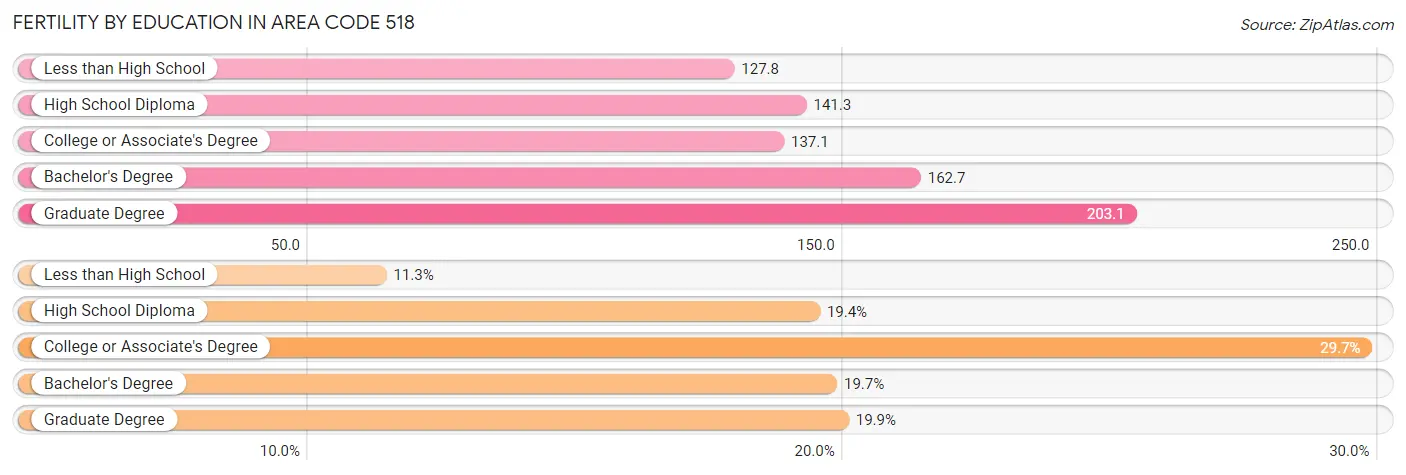
| Educational Attainment | Women with Births | Births / 1,000 Women |
| Less than High School | 1,683 (11.3%) | 127.8 |
| High School Diploma | 2,896 (19.4%) | 141.3 |
| College or Associate's Degree | 4,443 (29.7%) | 137.1 |
| Bachelor's Degree | 2,944 (19.7%) | 162.7 |
| Graduate Degree | 2,977 (19.9%) | 203.1 |
| Total | 14,943 (100.0%) | 94.8 |
Fertility by Education by Marriage Status in Area Code 518
43.1% of women with births in Area Code 518 are unmarried. Women with the educational attainment of graduate degree are most likely to be married with 49.4% of them married at childbirth, while women with the educational attainment of less than high school are least likely to be married with 87.4% of them unmarried at childbirth.
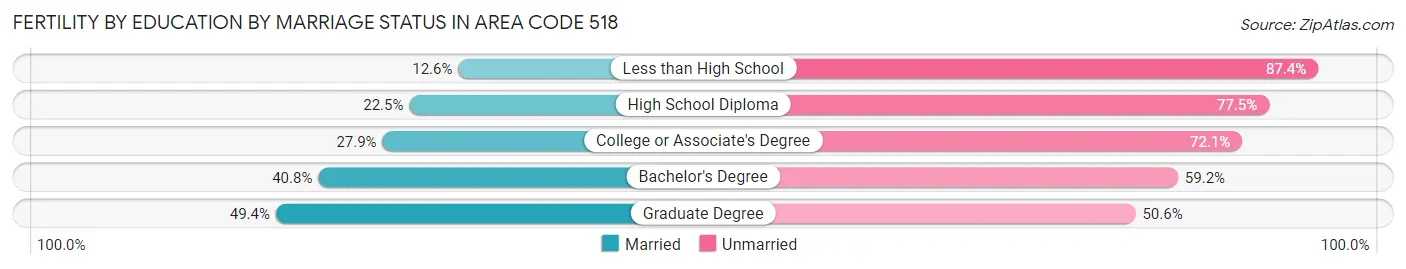
| Educational Attainment | Married | Unmarried |
| Less than High School | 212 (12.6%) | 1,471 (87.4%) |
| High School Diploma | 651 (22.5%) | 2,245 (77.5%) |
| College or Associate's Degree | 1,239 (27.9%) | 3,204 (72.1%) |
| Bachelor's Degree | 1,202 (40.8%) | 1,742 (59.2%) |
| Graduate Degree | 1,470 (49.4%) | 1,507 (50.6%) |
| Total | 8,502 (56.9%) | 6,441 (43.1%) |
Employment Characteristics in Area Code 518
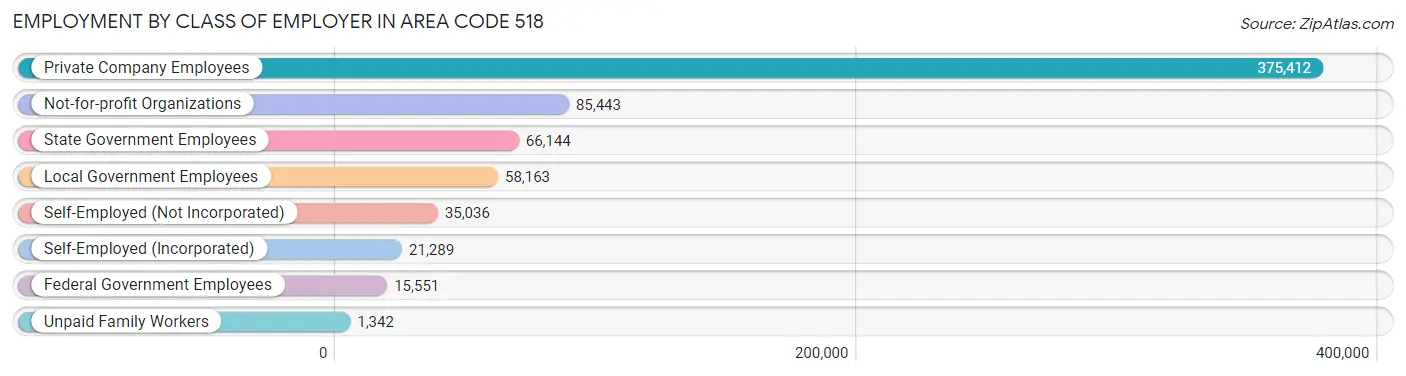
Employment by Class of Employer in Area Code 518
Among the 658,380 employed individuals in Area Code 518, private company employees (375,412 | 57.0%), not-for-profit organizations (85,443 | 13.0%), and state government employees (66,144 | 10.1%) make up the most common classes of employment.
| Employer Class | # Employees | % Employees |
| Private Company Employees | 375,412 | 57.0% |
| Self-Employed (Incorporated) | 21,289 | 3.2% |
| Self-Employed (Not Incorporated) | 35,036 | 5.3% |
| Not-for-profit Organizations | 85,443 | 13.0% |
| Local Government Employees | 58,163 | 8.8% |
| State Government Employees | 66,144 | 10.1% |
| Federal Government Employees | 15,551 | 2.4% |
| Unpaid Family Workers | 1,342 | 0.2% |
| Total | 658,380 | 100.0% |
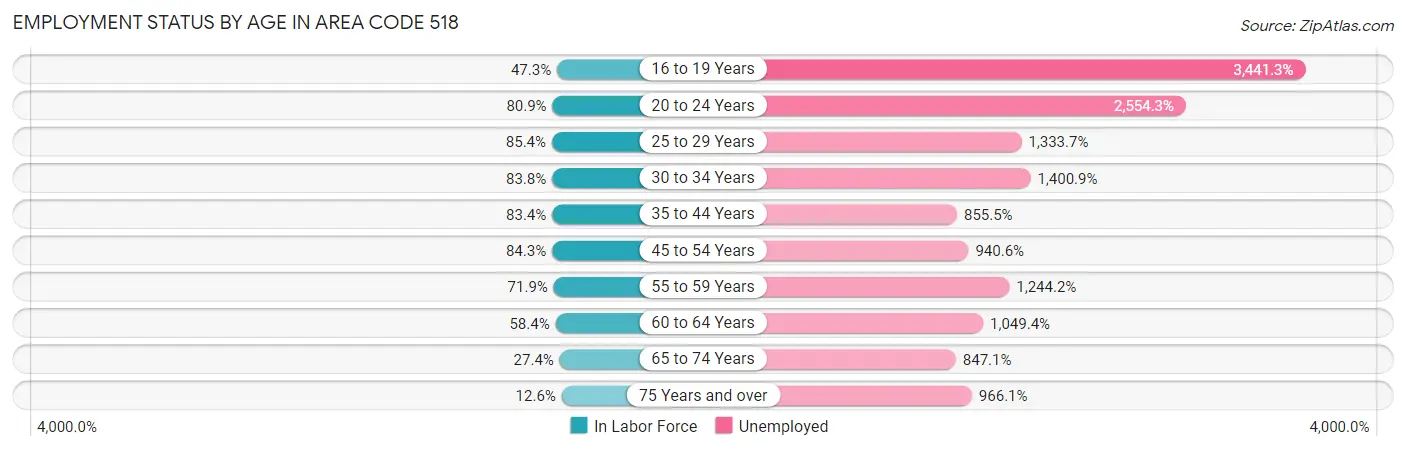
Employment Status by Age in Area Code 518
According to the labor force statistics for Area Code 518, out of the total population over 16 years of age (1,147,044), 58.9% or 676,068 individuals are in the labor force, with 6.1% or 41,173 of them unemployed. The age group with the highest labor force participation rate is 25 to 29 years, with 85.4% or 73,467 individuals in the labor force. Within the labor force, the 16 to 19 years age range has the highest percentage of unemployed individuals, with 3,441.3% or 1,199,087 of them being unemployed.
| Age Bracket | In Labor Force | Unemployed |
| 16 to 19 Years | 34,844 (47.3%) | 1,199,087 (3,441.3%) |
| 20 to 24 Years | 80,722 (80.9%) | 2,061,831 (2,554.3%) |
| 25 to 29 Years | 73,471 (85.4%) | 979,829 (1,333.7%) |
| 30 to 34 Years | 72,949 (83.8%) | 1,021,929 (1,400.9%) |
| 35 to 44 Years | 138,079 (83.4%) | 1,181,274 (855.5%) |
| 45 to 54 Years | 145,364 (84.3%) | 1,367,266 (940.6%) |
| 55 to 59 Years | 71,462 (71.9%) | 889,192 (1,244.2%) |
| 60 to 64 Years | 58,123 (58.4%) | 609,985 (1,049.4%) |
| 65 to 74 Years | 42,620 (27.4%) | 361,051 (847.1%) |
| 75 Years and over | 13,583 (12.6%) | 131,254 (966.1%) |
| Total | 676,046 (58.9%) | 41,172 (6.1%) |
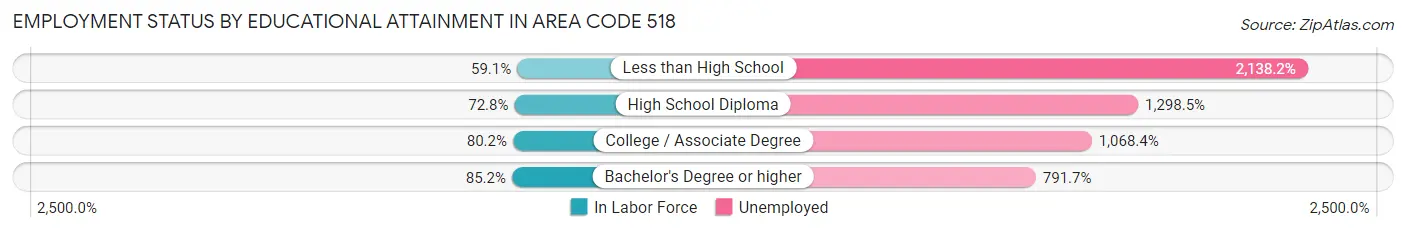
Employment Status by Educational Attainment in Area Code 518
According to labor force statistics for Area Code 518, 75.9% of individuals (539,013) out of the total population between 25 and 64 years of age (710,069) are in the labor force, with 1,213.0% or 6,538,228 of them being unemployed. The group with the highest labor force participation rate are those with the educational attainment of bachelor's degree or higher, with 85.2% or 221,339 individuals in the labor force. Within the labor force, individuals with less than high school education have the highest percentage of unemployment, with 2,138.2% or 734,001 of them being unemployed.
| Educational Attainment | In Labor Force | Unemployed |
| Less than High School | 34,328 (59.1%) | 1,241,332 (2,138.2%) |
| High School Diploma | 135,470 (72.8%) | 2,415,444 (1,298.5%) |
| College / Associate Degree | 165,520 (80.2%) | 2,204,430 (1,068.4%) |
| Bachelor's Degree or higher | 221,338 (85.2%) | 2,055,776 (791.7%) |
| Total | 538,983 (75.9%) | 8,613,137 (1,213.0%) |
Employment Occupations by Sex in Area Code 518
Management, Business, Science and Arts Occupations
The most common Management, Business, Science and Arts occupations in Area Code 518 are Community & Social Service (86,988 | 13.0%), Management (70,617 | 10.5%), Education Instruction & Library (49,257 | 7.3%), Computers, Engineering & Science (48,909 | 7.3%), and Health Diagnosing & Treating (47,161 | 7.0%).

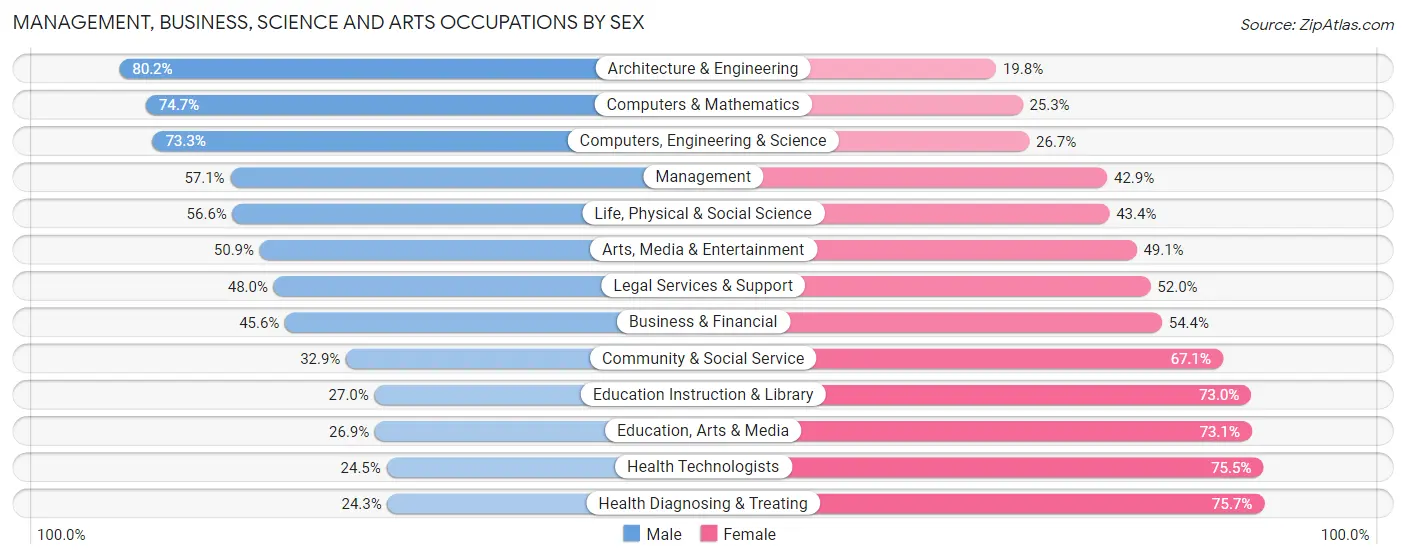
Management, Business, Science and Arts Occupations by Sex
Within the Management, Business, Science and Arts occupations in Area Code 518, the most male-oriented occupations are Architecture & Engineering (80.2%), Computers & Mathematics (74.7%), and Computers, Engineering & Science (73.3%), while the most female-oriented occupations are Health Diagnosing & Treating (75.7%), Health Technologists (75.5%), and Education, Arts & Media (73.1%).
| Occupation | Male | Female |
| Management | 40,295 (57.1%) | 30,322 (42.9%) |
| Business & Financial | 17,969 (45.6%) | 21,400 (54.4%) |
| Computers, Engineering & Science | 35,854 (73.3%) | 13,055 (26.7%) |
| Computers & Mathematics | 16,704 (74.7%) | 5,658 (25.3%) |
| Architecture & Engineering | 14,007 (80.2%) | 3,454 (19.8%) |
| Life, Physical & Social Science | 5,143 (56.6%) | 3,943 (43.4%) |
| Community & Social Service | 28,625 (32.9%) | 58,363 (67.1%) |
| Education, Arts & Media | 4,040 (26.9%) | 10,988 (73.1%) |
| Legal Services & Support | 4,466 (48.0%) | 4,837 (52.0%) |
| Education Instruction & Library | 13,296 (27.0%) | 35,961 (73.0%) |
| Arts, Media & Entertainment | 6,823 (50.9%) | 6,577 (49.1%) |
| Health Diagnosing & Treating | 11,455 (24.3%) | 35,706 (75.7%) |
| Health Technologists | 8,228 (24.5%) | 25,382 (75.5%) |
| Total (Category) | 134,198 (45.8%) | 158,846 (54.2%) |
| Total (Overall) | 347,766 (51.8%) | 323,796 (48.2%) |
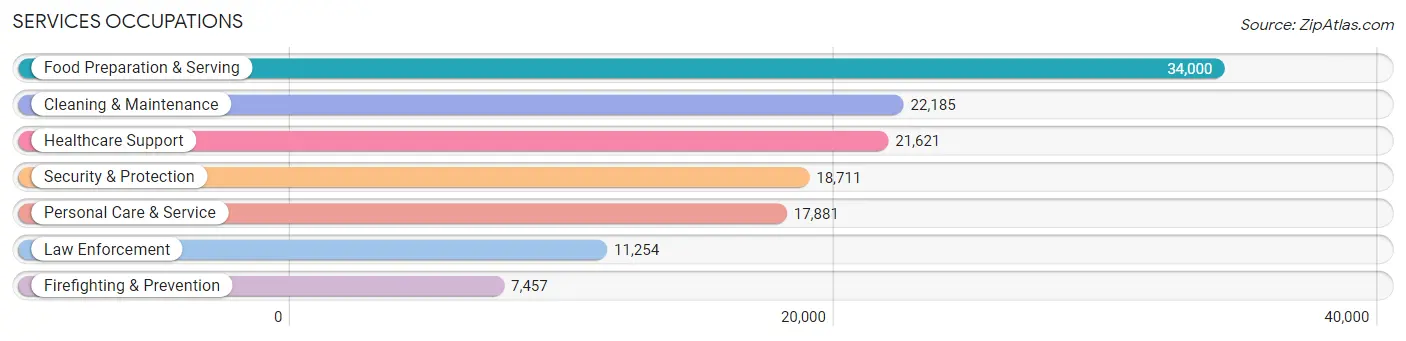
Services Occupations
The most common Services occupations in Area Code 518 are Food Preparation & Serving (34,000 | 5.1%), Cleaning & Maintenance (22,185 | 3.3%), Healthcare Support (21,621 | 3.2%), Security & Protection (18,711 | 2.8%), and Personal Care & Service (17,881 | 2.7%).
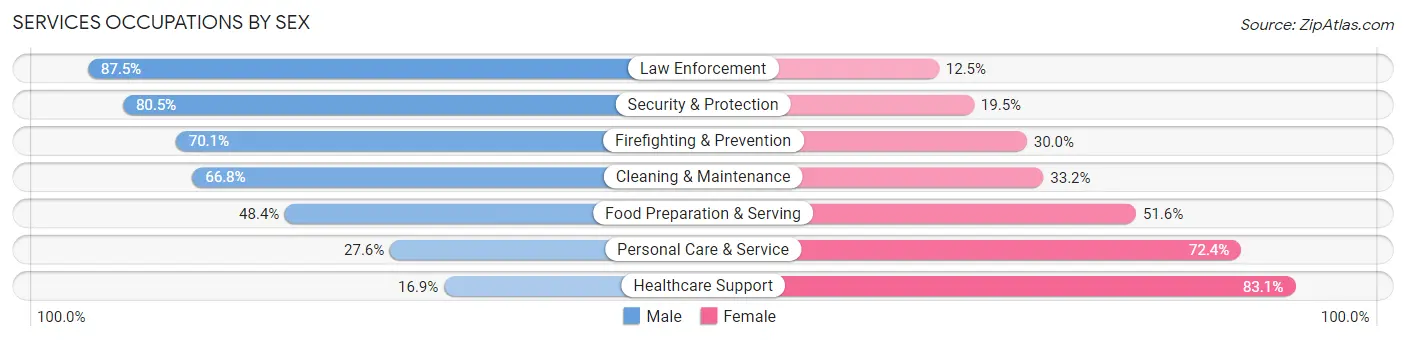
Services Occupations by Sex
Within the Services occupations in Area Code 518, the most male-oriented occupations are Law Enforcement (87.5%), Security & Protection (80.5%), and Firefighting & Prevention (70.1%), while the most female-oriented occupations are Healthcare Support (83.1%), Personal Care & Service (72.4%), and Food Preparation & Serving (51.6%).
| Occupation | Male | Female |
| Healthcare Support | 3,660 (16.9%) | 17,961 (83.1%) |
| Security & Protection | 15,067 (80.5%) | 3,644 (19.5%) |
| Firefighting & Prevention | 5,224 (70.1%) | 2,233 (29.9%) |
| Law Enforcement | 9,843 (87.5%) | 1,411 (12.5%) |
| Food Preparation & Serving | 16,458 (48.4%) | 17,542 (51.6%) |
| Cleaning & Maintenance | 14,813 (66.8%) | 7,372 (33.2%) |
| Personal Care & Service | 4,939 (27.6%) | 12,942 (72.4%) |
| Total (Category) | 54,937 (48.0%) | 59,461 (52.0%) |
| Total (Overall) | 347,766 (51.8%) | 323,796 (48.2%) |
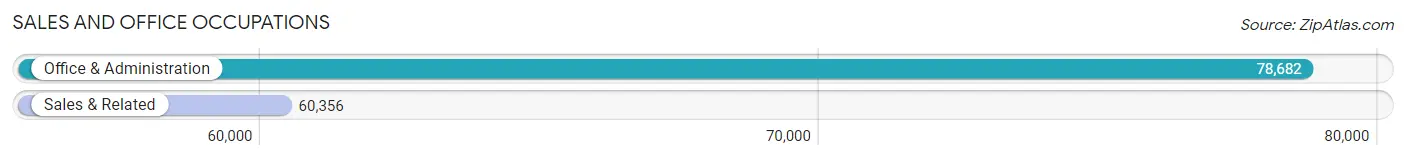
Sales and Office Occupations
The most common Sales and Office occupations in Area Code 518 are Office & Administration (78,682 | 11.7%), and Sales & Related (60,356 | 9.0%).
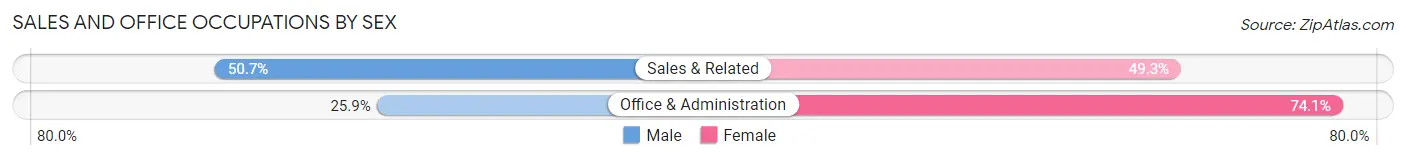
Sales and Office Occupations by Sex
| Occupation | Male | Female |
| Sales & Related | 30,614 (50.7%) | 29,742 (49.3%) |
| Office & Administration | 20,347 (25.9%) | 58,335 (74.1%) |
| Total (Category) | 50,961 (36.6%) | 88,077 (63.3%) |
| Total (Overall) | 347,766 (51.8%) | 323,796 (48.2%) |
Natural Resources, Construction and Maintenance Occupations
The most common Natural Resources, Construction and Maintenance occupations in Area Code 518 are Construction & Extraction (28,216 | 4.2%), Installation, Maintenance & Repair (18,861 | 2.8%), and Farming, Fishing & Forestry (3,490 | 0.5%).
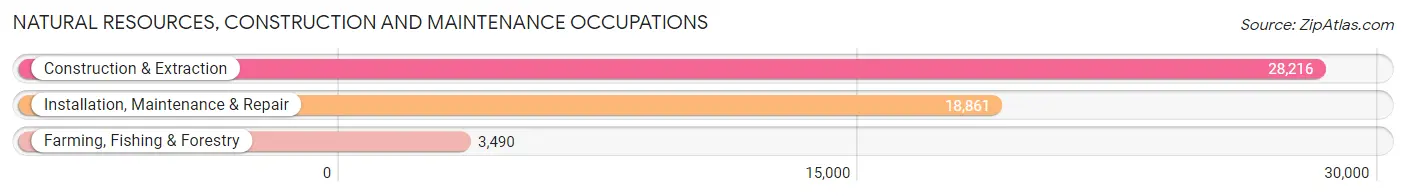
Natural Resources, Construction and Maintenance Occupations by Sex

| Occupation | Male | Female |
| Farming, Fishing & Forestry | 2,417 (69.3%) | 1,073 (30.7%) |
| Construction & Extraction | 27,451 (97.3%) | 765 (2.7%) |
| Installation, Maintenance & Repair | 18,306 (97.1%) | 555 (2.9%) |
| Total (Category) | 48,174 (95.3%) | 2,393 (4.7%) |
| Total (Overall) | 347,766 (51.8%) | 323,796 (48.2%) |
Production, Transportation and Moving Occupations
The most common Production, Transportation and Moving occupations in Area Code 518 are Production (28,715 | 4.3%), Transportation (23,567 | 3.5%), and Material Moving (22,233 | 3.3%).
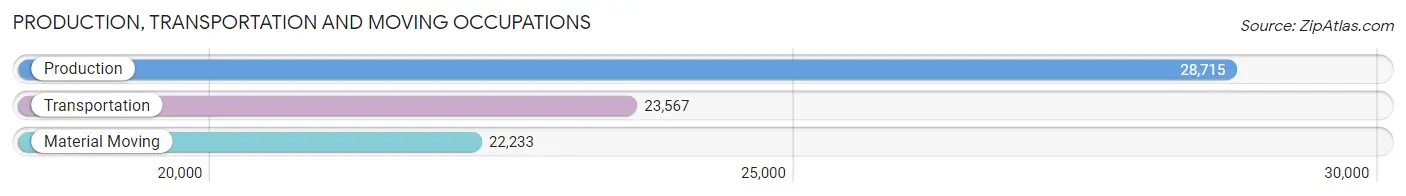
Production, Transportation and Moving Occupations by Sex
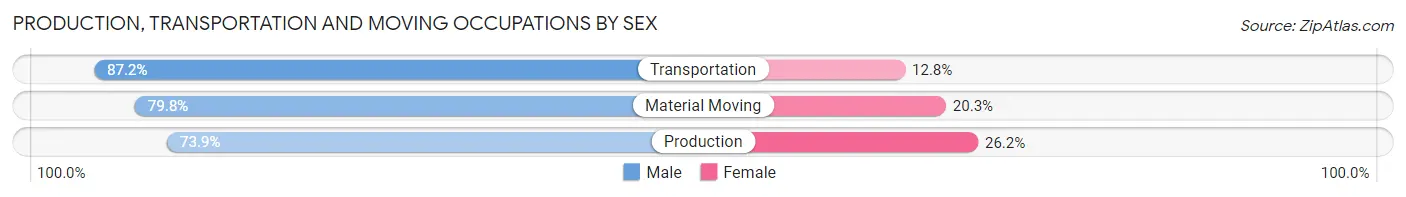
| Occupation | Male | Female |
| Production | 21,207 (73.9%) | 7,508 (26.2%) |
| Transportation | 20,559 (87.2%) | 3,008 (12.8%) |
| Material Moving | 17,730 (79.7%) | 4,503 (20.3%) |
| Total (Category) | 59,496 (79.8%) | 15,019 (20.2%) |
| Total (Overall) | 347,766 (51.8%) | 323,796 (48.2%) |
Employment Industries by Sex in Area Code 518
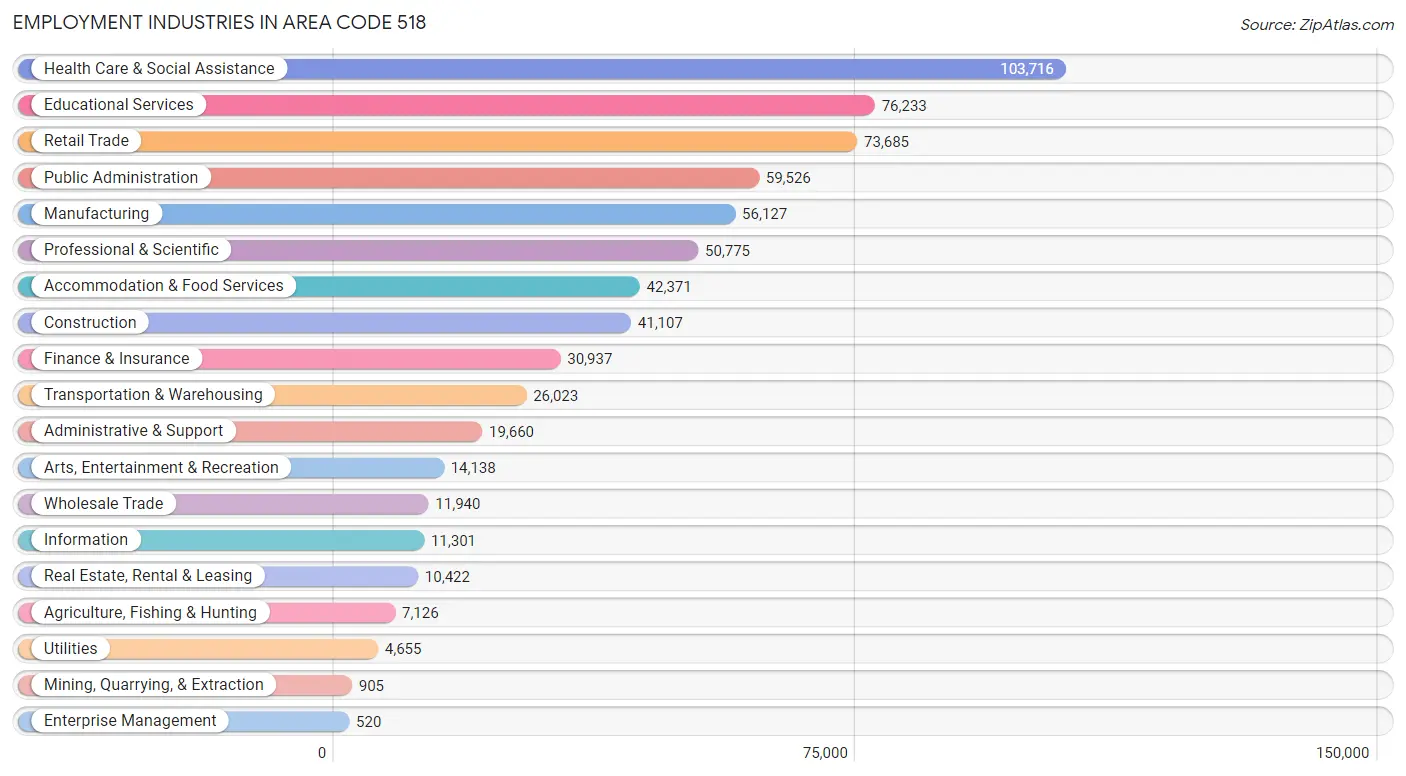
Employment Industries in Area Code 518
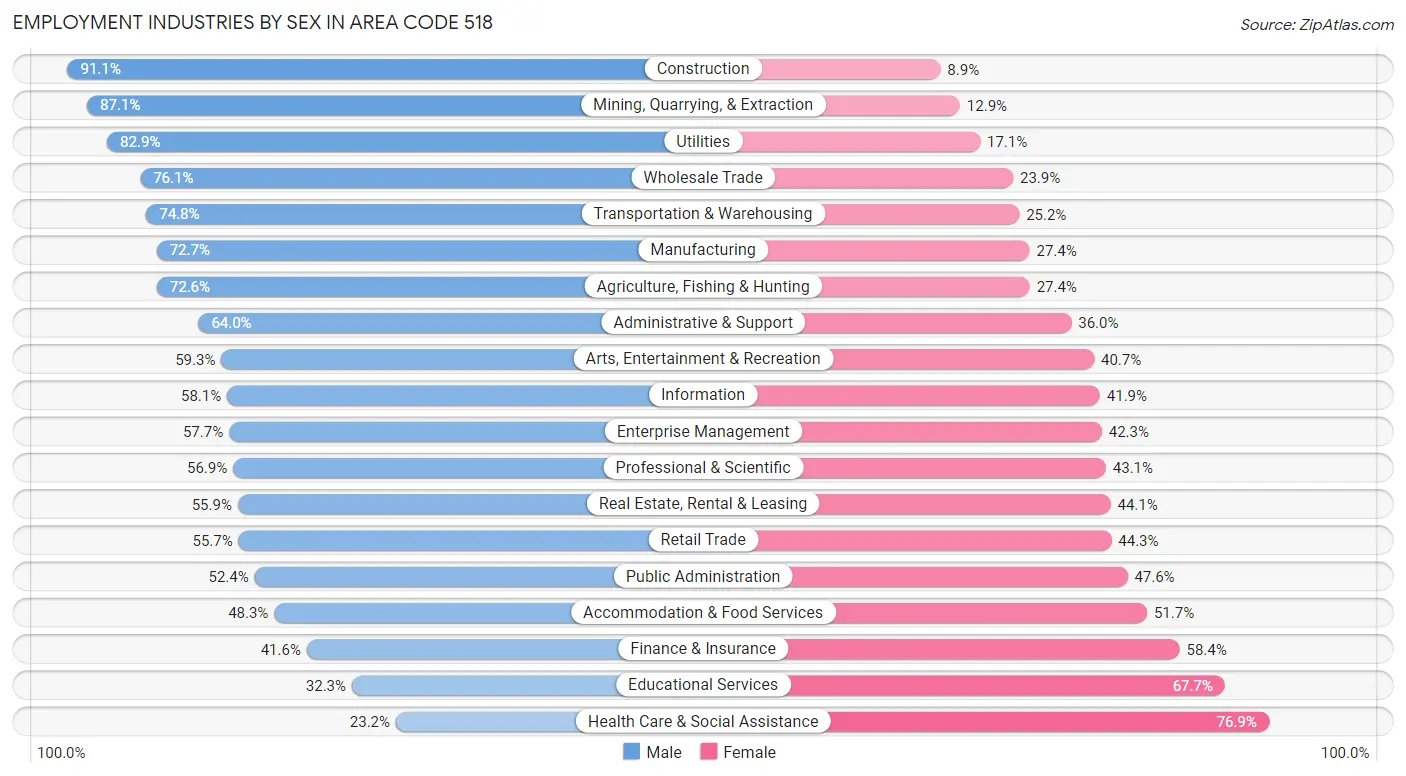
The major employment industries in Area Code 518 include Health Care & Social Assistance (103,716 | 15.4%), Educational Services (76,233 | 11.4%), Retail Trade (73,685 | 11.0%), Public Administration (59,526 | 8.9%), and Manufacturing (56,127 | 8.4%).
Employment Industries by Sex in Area Code 518
The Area Code 518 industries that see more men than women are Construction (91.1%), Mining, Quarrying, & Extraction (87.1%), and Utilities (82.9%), whereas the industries that tend to have a higher number of women are Health Care & Social Assistance (76.8%), Educational Services (67.7%), and Finance & Insurance (58.4%).
| Industry | Male | Female |
| Agriculture, Fishing & Hunting | 5,175 (72.6%) | 1,951 (27.4%) |
| Mining, Quarrying, & Extraction | 788 (87.1%) | 117 (12.9%) |
| Construction | 37,450 (91.1%) | 3,657 (8.9%) |
| Manufacturing | 40,778 (72.7%) | 15,349 (27.4%) |
| Wholesale Trade | 9,083 (76.1%) | 2,857 (23.9%) |
| Retail Trade | 41,055 (55.7%) | 32,630 (44.3%) |
| Transportation & Warehousing | 19,463 (74.8%) | 6,560 (25.2%) |
| Utilities | 3,859 (82.9%) | 796 (17.1%) |
| Information | 6,566 (58.1%) | 4,735 (41.9%) |
| Finance & Insurance | 12,871 (41.6%) | 18,066 (58.4%) |
| Real Estate, Rental & Leasing | 5,825 (55.9%) | 4,597 (44.1%) |
| Professional & Scientific | 28,871 (56.9%) | 21,904 (43.1%) |
| Enterprise Management | 300 (57.7%) | 220 (42.3%) |
| Administrative & Support | 12,584 (64.0%) | 7,076 (36.0%) |
| Educational Services | 24,594 (32.3%) | 51,639 (67.7%) |
| Health Care & Social Assistance | 24,015 (23.2%) | 79,701 (76.8%) |
| Arts, Entertainment & Recreation | 8,384 (59.3%) | 5,754 (40.7%) |
| Accommodation & Food Services | 20,482 (48.3%) | 21,889 (51.7%) |
| Public Administration | 31,185 (52.4%) | 28,341 (47.6%) |
| Total | 347,766 (51.8%) | 323,796 (48.2%) |
Education in Area Code 518
School Enrollment in Area Code 518
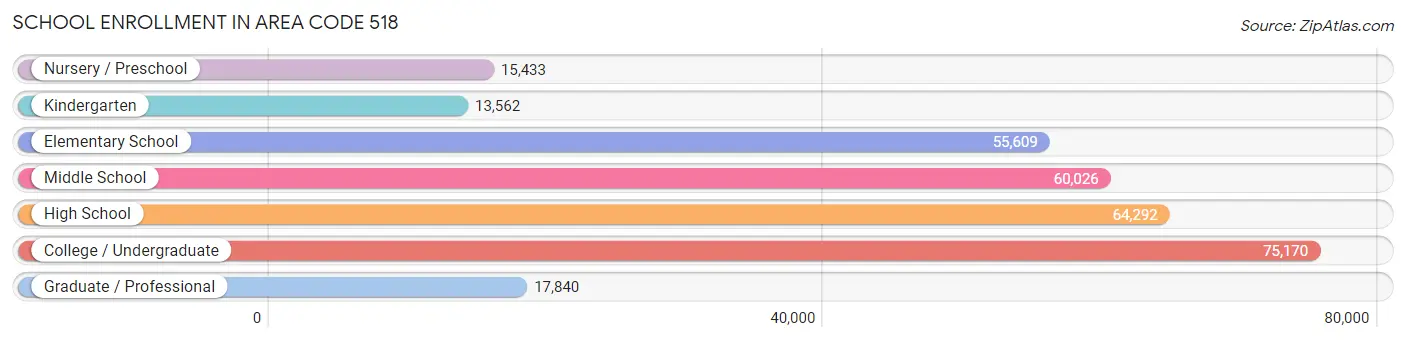
The most common levels of schooling among the 301,932 students in Area Code 518 are college / undergraduate (75,170 | 24.9%), high school (64,292 | 21.3%), and middle school (60,026 | 19.9%).
| School Level | # Students | % Students |
| Nursery / Preschool | 15,433 | 5.1% |
| Kindergarten | 13,562 | 4.5% |
| Elementary School | 55,609 | 18.4% |
| Middle School | 60,026 | 19.9% |
| High School | 64,292 | 21.3% |
| College / Undergraduate | 75,170 | 24.9% |
| Graduate / Professional | 17,840 | 5.9% |
| Total | 301,932 | 100.0% |
School Enrollment by Age by Funding Source in Area Code 518
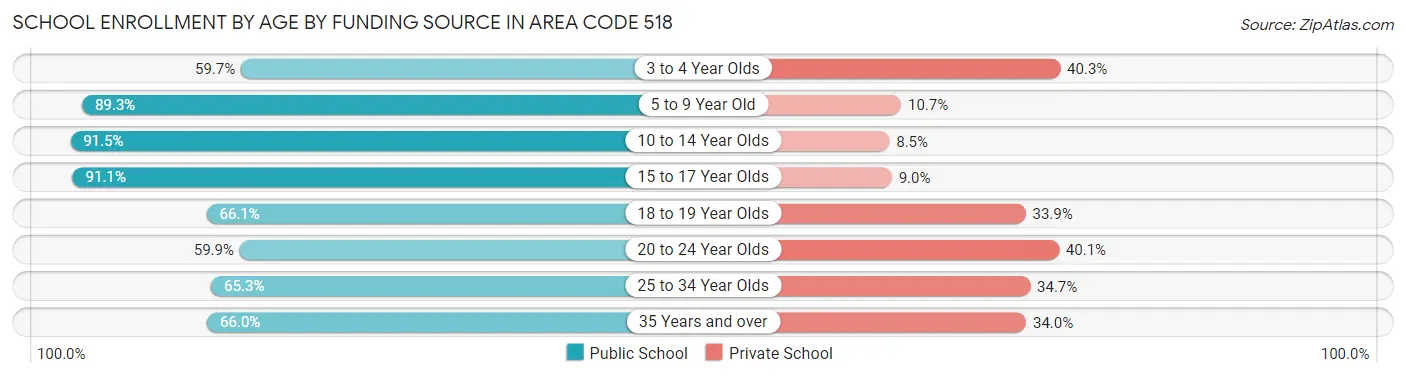
Out of a total of 301,932 students who are enrolled in schools in Area Code 518, 60,233 (20.0%) attend a private institution, while the remaining 241,699 (80.0%) are enrolled in public schools. The age group of 3 to 4 year olds has the highest likelihood of being enrolled in private schools, with 5,203 (40.3% in the age bracket) enrolled. Conversely, the age group of 10 to 14 year olds has the lowest likelihood of being enrolled in a private school, with 67,239 (91.5% in the age bracket) attending a public institution.
| Age Bracket | Public School | Private School |
| 3 to 4 Year Olds | 7,702 (59.7%) | 5,203 (40.3%) |
| 5 to 9 Year Old | 60,323 (89.3%) | 7,220 (10.7%) |
| 10 to 14 Year Olds | 67,239 (91.5%) | 6,246 (8.5%) |
| 15 to 17 Year Olds | 41,174 (91.0%) | 4,047 (8.9%) |
| 18 to 19 Year Olds | 21,934 (66.1%) | 11,240 (33.9%) |
| 20 to 24 Year Olds | 24,682 (59.9%) | 16,514 (40.1%) |
| 25 to 34 Year Olds | 9,350 (65.3%) | 4,976 (34.7%) |
| 35 Years and over | 9,298 (66.0%) | 4,784 (34.0%) |
| Total | 241,699 (80.0%) | 60,233 (20.0%) |
Educational Attainment by Field of Study in Area Code 518
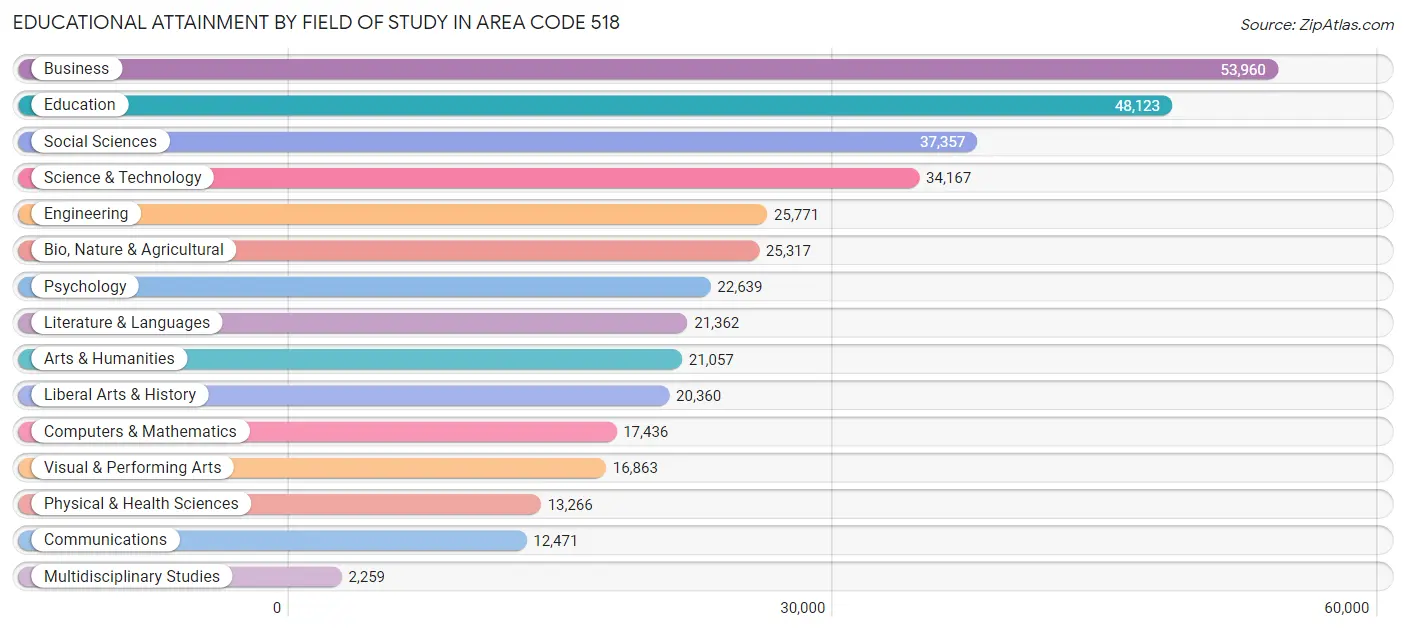
Business (53,960 | 14.5%), education (48,123 | 12.9%), social sciences (37,357 | 10.0%), science & technology (34,167 | 9.2%), and engineering (25,771 | 6.9%) are the most common fields of study among 372,408 individuals in Area Code 518 who have obtained a bachelor's degree or higher.
| Field of Study | # Graduates | % Graduates |
| Computers & Mathematics | 17,436 | 4.7% |
| Bio, Nature & Agricultural | 25,317 | 6.8% |
| Physical & Health Sciences | 13,266 | 3.6% |
| Psychology | 22,639 | 6.1% |
| Social Sciences | 37,357 | 10.0% |
| Engineering | 25,771 | 6.9% |
| Multidisciplinary Studies | 2,259 | 0.6% |
| Science & Technology | 34,167 | 9.2% |
| Business | 53,960 | 14.5% |
| Education | 48,123 | 12.9% |
| Literature & Languages | 21,362 | 5.7% |
| Liberal Arts & History | 20,360 | 5.5% |
| Visual & Performing Arts | 16,863 | 4.5% |
| Communications | 12,471 | 3.4% |
| Arts & Humanities | 21,057 | 5.7% |
| Total | 372,408 | 100.0% |
Transportation & Commute in Area Code 518
Vehicle Availability by Sex in Area Code 518
The most prevalent vehicle ownership categories in Area Code 518 are males with 2 vehicles (154,315, accounting for 45.4%) and females with 2 vehicles (135,040, making up 49.7%).
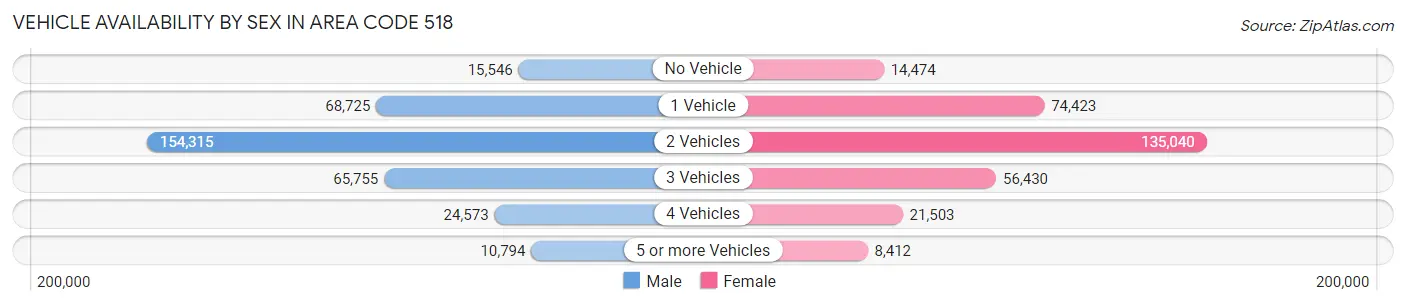
| Vehicles Available | Male | Female |
| No Vehicle | 15,546 (4.6%) | 14,474 (4.7%) |
| 1 Vehicle | 68,725 (20.2%) | 74,423 (24.0%) |
| 2 Vehicles | 154,315 (45.4%) | 135,040 (43.5%) |
| 3 Vehicles | 65,755 (19.4%) | 56,430 (18.2%) |
| 4 Vehicles | 24,573 (7.2%) | 21,503 (6.9%) |
| 5 or more Vehicles | 10,794 (3.2%) | 8,412 (2.7%) |
| Total | 339,708 (100.0%) | 310,282 (100.0%) |
Commute Time in Area Code 518
The most frequently occuring commute durations in Area Code 518 are 15 to 19 minutes (95,993 commuters, 16.3%), 10 to 14 minutes (90,418 commuters, 15.3%), and 20 to 24 minutes (87,909 commuters, 14.9%).
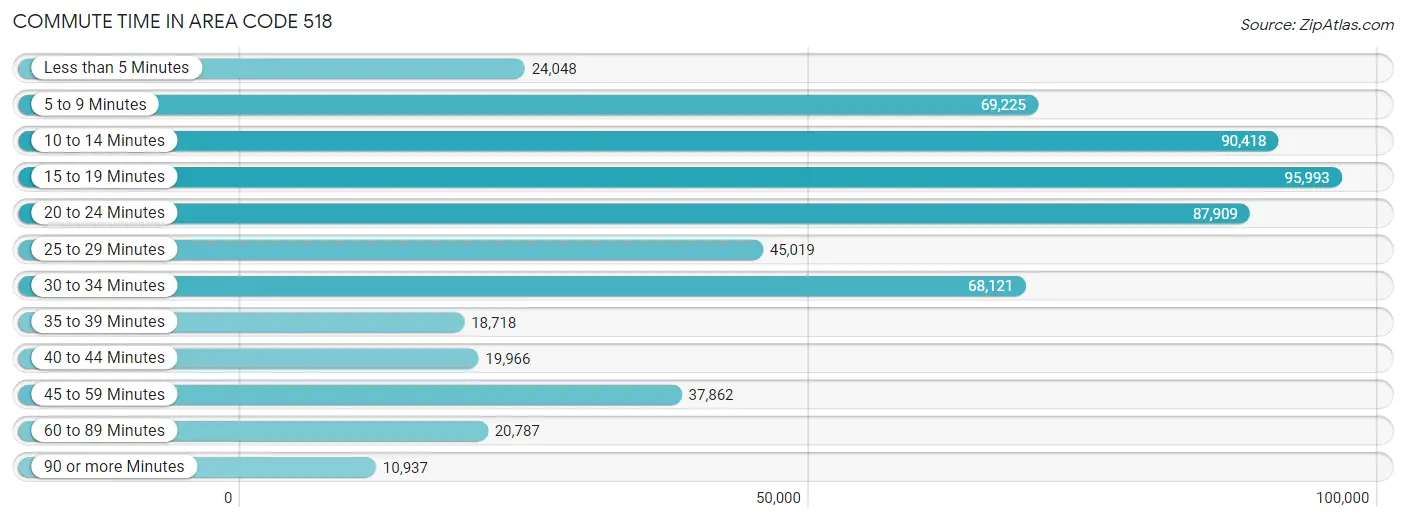
| Commute Time | # Commuters | % Commuters |
| Less than 5 Minutes | 24,048 | 4.1% |
| 5 to 9 Minutes | 69,225 | 11.7% |
| 10 to 14 Minutes | 90,418 | 15.3% |
| 15 to 19 Minutes | 95,993 | 16.3% |
| 20 to 24 Minutes | 87,909 | 14.9% |
| 25 to 29 Minutes | 45,019 | 7.6% |
| 30 to 34 Minutes | 68,121 | 11.6% |
| 35 to 39 Minutes | 18,718 | 3.2% |
| 40 to 44 Minutes | 19,966 | 3.4% |
| 45 to 59 Minutes | 37,862 | 6.4% |
| 60 to 89 Minutes | 20,787 | 3.5% |
| 90 or more Minutes | 10,937 | 1.9% |
Commute Time by Sex in Area Code 518
The most common commute times in Area Code 518 are 15 to 19 minutes (49,725 commuters, 16.0%) for males and 15 to 19 minutes (46,268 commuters, 16.6%) for females.
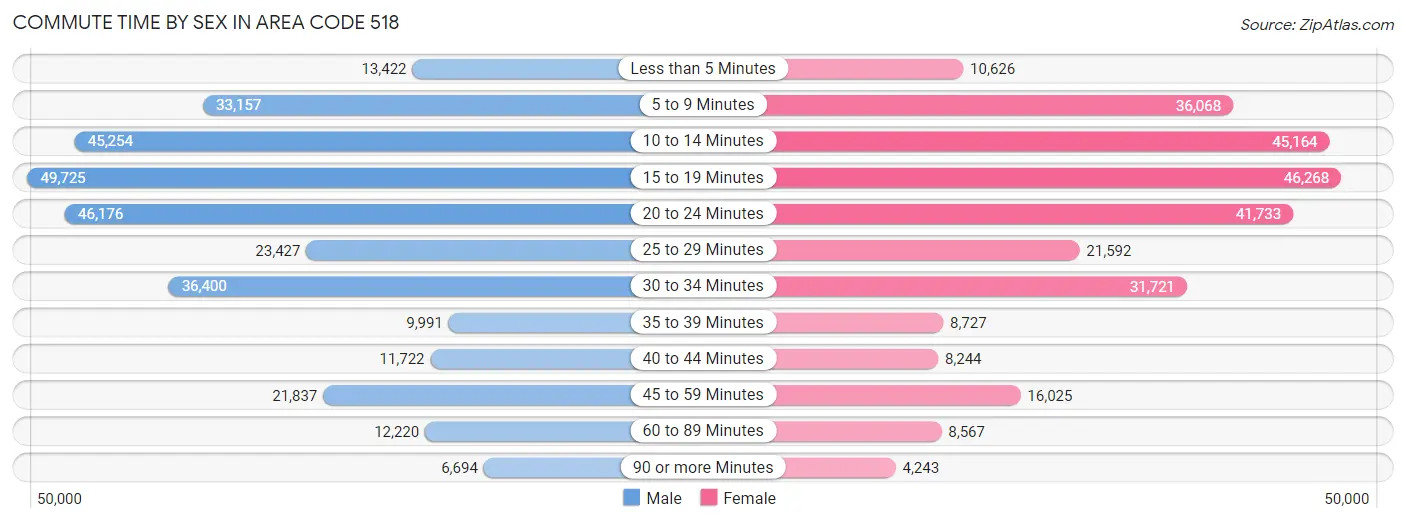
| Commute Time | Male | Female |
| Less than 5 Minutes | 13,422 (4.3%) | 10,626 (3.8%) |
| 5 to 9 Minutes | 33,157 (10.7%) | 36,068 (12.9%) |
| 10 to 14 Minutes | 45,254 (14.6%) | 45,164 (16.2%) |
| 15 to 19 Minutes | 49,725 (16.0%) | 46,268 (16.6%) |
| 20 to 24 Minutes | 46,176 (14.9%) | 41,733 (15.0%) |
| 25 to 29 Minutes | 23,427 (7.6%) | 21,592 (7.7%) |
| 30 to 34 Minutes | 36,400 (11.7%) | 31,721 (11.4%) |
| 35 to 39 Minutes | 9,991 (3.2%) | 8,727 (3.1%) |
| 40 to 44 Minutes | 11,722 (3.8%) | 8,244 (3.0%) |
| 45 to 59 Minutes | 21,837 (7.0%) | 16,025 (5.7%) |
| 60 to 89 Minutes | 12,220 (3.9%) | 8,567 (3.1%) |
| 90 or more Minutes | 6,694 (2.2%) | 4,243 (1.5%) |
Time of Departure to Work by Sex in Area Code 518
The most frequent times of departure to work in Area Code 518 are 7:00 AM to 7:29 AM (41,451, 13.4%) for males and 7:30 AM to 7:59 AM (46,698, 16.7%) for females.
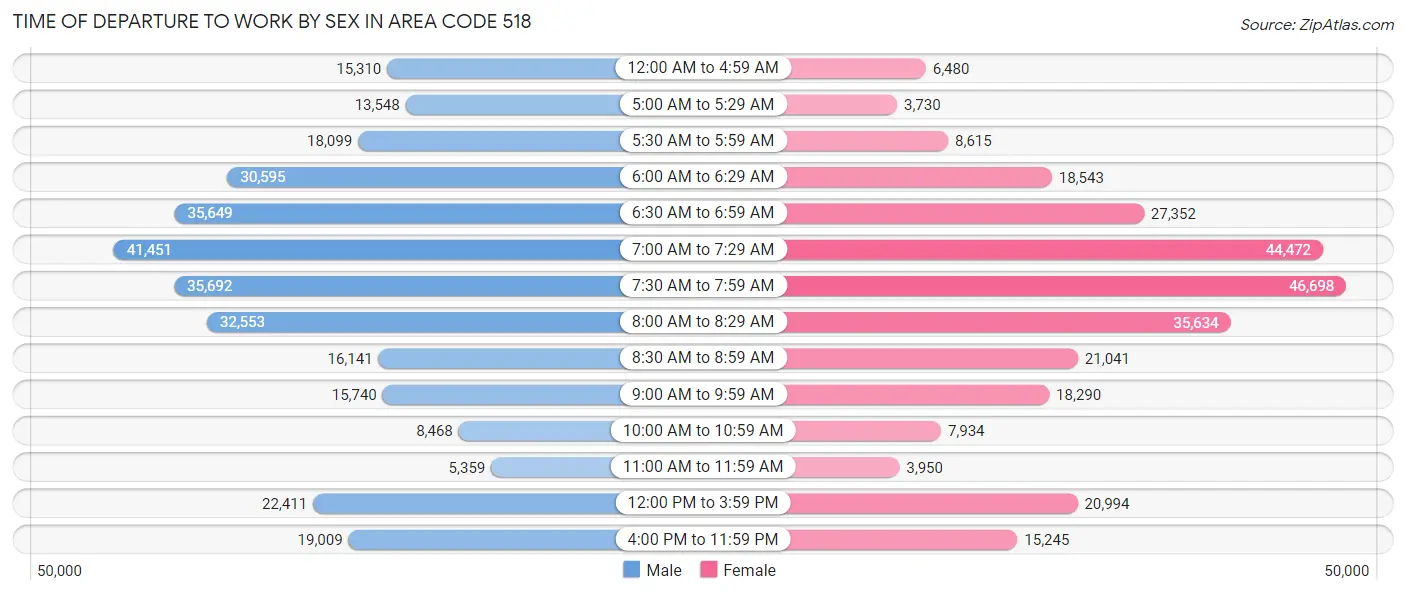
| Time of Departure | Male | Female |
| 12:00 AM to 4:59 AM | 15,310 (4.9%) | 6,480 (2.3%) |
| 5:00 AM to 5:29 AM | 13,548 (4.4%) | 3,730 (1.3%) |
| 5:30 AM to 5:59 AM | 18,099 (5.8%) | 8,615 (3.1%) |
| 6:00 AM to 6:29 AM | 30,595 (9.9%) | 18,543 (6.7%) |
| 6:30 AM to 6:59 AM | 35,649 (11.5%) | 27,352 (9.8%) |
| 7:00 AM to 7:29 AM | 41,451 (13.4%) | 44,472 (15.9%) |
| 7:30 AM to 7:59 AM | 35,692 (11.5%) | 46,698 (16.7%) |
| 8:00 AM to 8:29 AM | 32,553 (10.5%) | 35,634 (12.8%) |
| 8:30 AM to 8:59 AM | 16,141 (5.2%) | 21,041 (7.5%) |
| 9:00 AM to 9:59 AM | 15,740 (5.1%) | 18,290 (6.6%) |
| 10:00 AM to 10:59 AM | 8,468 (2.7%) | 7,934 (2.8%) |
| 11:00 AM to 11:59 AM | 5,359 (1.7%) | 3,950 (1.4%) |
| 12:00 PM to 3:59 PM | 22,411 (7.2%) | 20,994 (7.5%) |
| 4:00 PM to 11:59 PM | 19,009 (6.1%) | 15,245 (5.5%) |
| Total | 310,025 (100.0%) | 278,978 (100.0%) |
Housing Occupancy in Area Code 518
Occupancy by Ownership in Area Code 518
Of the total 565,400 dwellings in Area Code 518, owner-occupied units account for 374,251 (66.2%), while renter-occupied units make up 191,149 (33.8%).
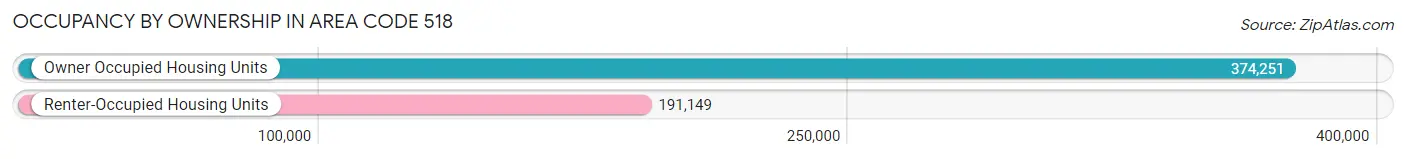
| Occupancy | # Housing Units | % Housing Units |
| Owner Occupied Housing Units | 374,251 | 66.2% |
| Renter-Occupied Housing Units | 191,149 | 33.8% |
| Total Occupied Housing Units | 565,400 | 100.0% |
Occupancy by Household Size in Area Code 518
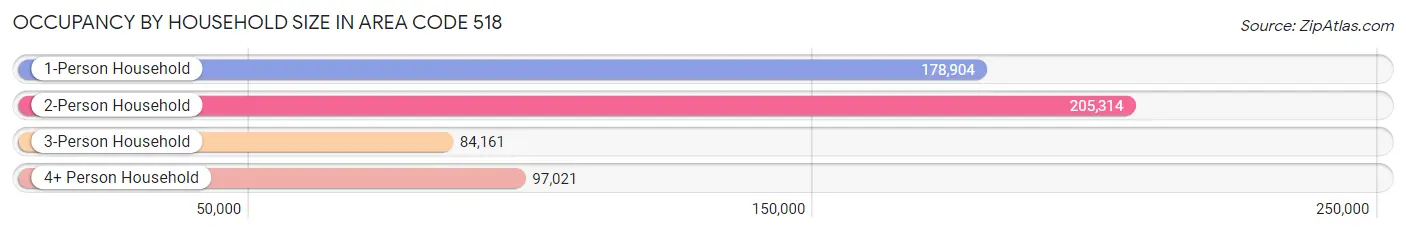
| Household Size | # Housing Units | % Housing Units |
| 1-Person Household | 178,904 | 31.6% |
| 2-Person Household | 205,314 | 36.3% |
| 3-Person Household | 84,161 | 14.9% |
| 4+ Person Household | 97,021 | 17.2% |
| Total Housing Units | 565,400 | 100.0% |
Occupancy by Ownership by Household Size in Area Code 518
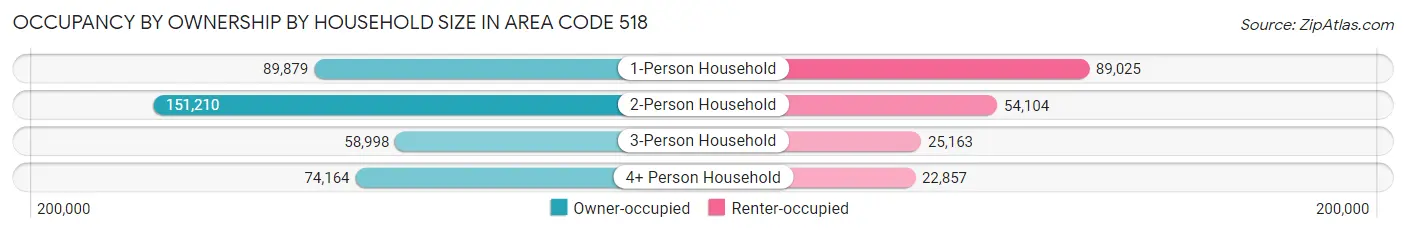
| Household Size | Owner-occupied | Renter-occupied |
| 1-Person Household | 89,879 (50.2%) | 89,025 (49.8%) |
| 2-Person Household | 151,210 (73.7%) | 54,104 (26.4%) |
| 3-Person Household | 58,998 (70.1%) | 25,163 (29.9%) |
| 4+ Person Household | 74,164 (76.4%) | 22,857 (23.6%) |
| Total Housing Units | 374,251 (66.2%) | 191,149 (33.8%) |
Occupancy by Educational Attainment in Area Code 518
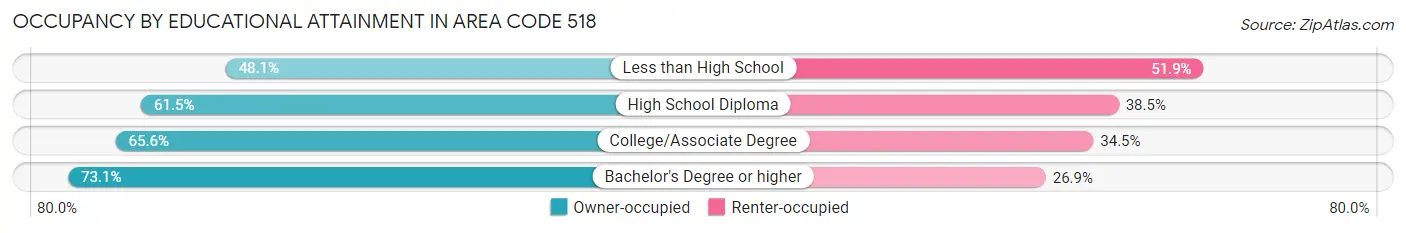
| Household Size | Owner-occupied | Renter-occupied |
| Less than High School | 18,858 (48.1%) | 20,350 (51.9%) |
| High School Diploma | 87,260 (61.5%) | 54,560 (38.5%) |
| College/Associate Degree | 111,573 (65.5%) | 58,637 (34.4%) |
| Bachelor's Degree or higher | 156,560 (73.1%) | 57,602 (26.9%) |
Occupancy by Age of Householder in Area Code 518
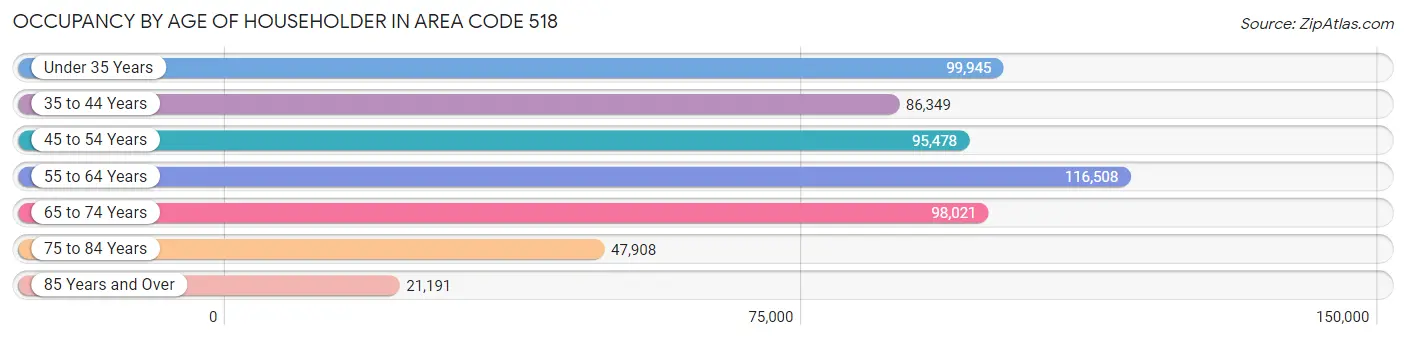
| Age Bracket | # Households | % Households |
| Under 35 Years | 99,945 | 17.7% |
| 35 to 44 Years | 86,349 | 15.3% |
| 45 to 54 Years | 95,478 | 16.9% |
| 55 to 64 Years | 116,508 | 20.6% |
| 65 to 74 Years | 98,021 | 17.3% |
| 75 to 84 Years | 47,908 | 8.5% |
| 85 Years and Over | 21,191 | 3.7% |
| Total | 565,400 | 100.0% |
Housing Finances in Area Code 518
Median Income by Occupancy in Area Code 518
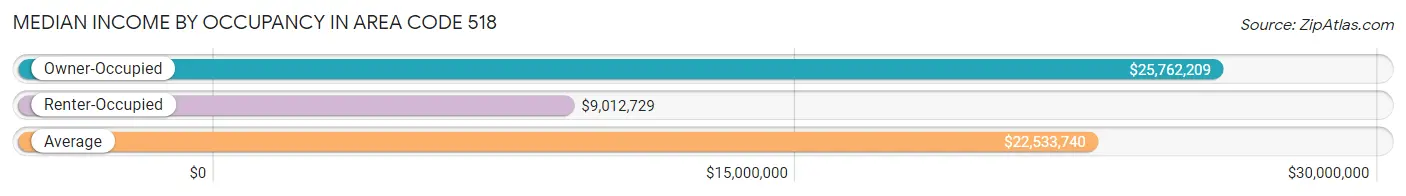
| Occupancy Type | # Households | Median Income |
| Owner-Occupied | 374,251 (66.2%) | $25,762,209 |
| Renter-Occupied | 191,149 (33.8%) | $9,012,729 |
| Average | 565,400 (100.0%) | $22,533,740 |
Occupancy by Householder Income Bracket in Area Code 518
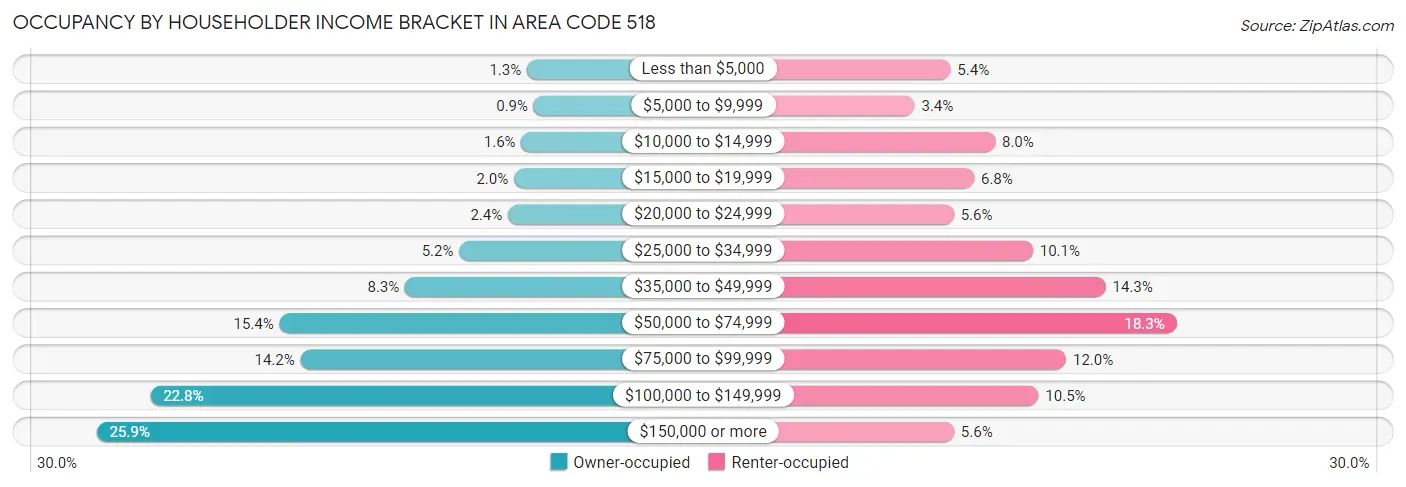
| Income Bracket | Owner-occupied | Renter-occupied |
| Less than $5,000 | 4,827 (1.3%) | 10,352 (5.4%) |
| $5,000 to $9,999 | 3,374 (0.9%) | 6,444 (3.4%) |
| $10,000 to $14,999 | 6,022 (1.6%) | 15,234 (8.0%) |
| $15,000 to $19,999 | 7,612 (2.0%) | 12,942 (6.8%) |
| $20,000 to $24,999 | 8,853 (2.4%) | 10,718 (5.6%) |
| $25,000 to $34,999 | 19,316 (5.2%) | 19,368 (10.1%) |
| $35,000 to $49,999 | 30,898 (8.3%) | 27,314 (14.3%) |
| $50,000 to $74,999 | 57,760 (15.4%) | 35,064 (18.3%) |
| $75,000 to $99,999 | 53,273 (14.2%) | 23,002 (12.0%) |
| $100,000 to $149,999 | 85,415 (22.8%) | 19,974 (10.4%) |
| $150,000 or more | 96,901 (25.9%) | 10,737 (5.6%) |
| Total | 374,251 (100.0%) | 191,149 (100.0%) |
Monthly Housing Cost Tiers in Area Code 518
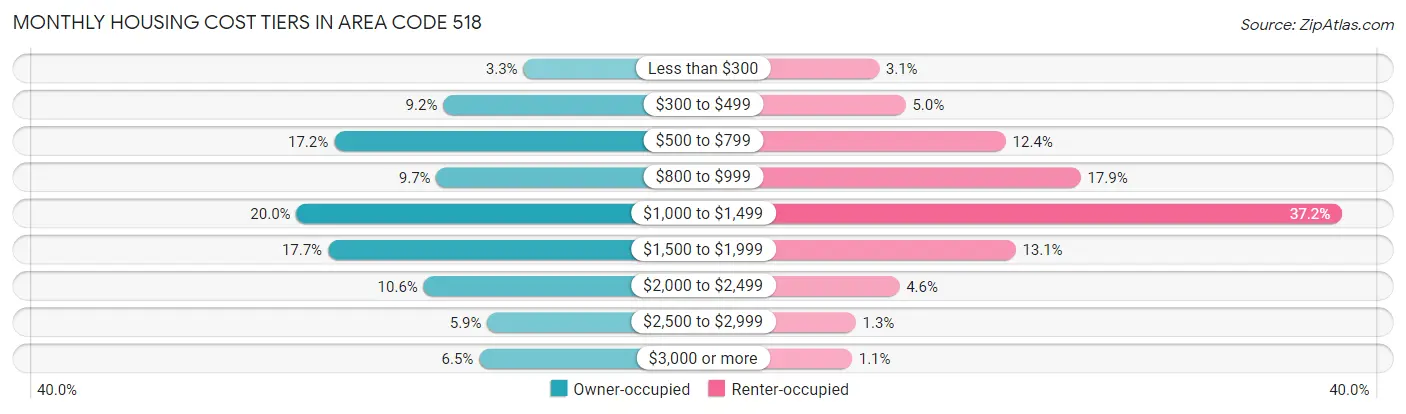
| Monthly Cost | Owner-occupied | Renter-occupied |
| Less than $300 | 12,207 (3.3%) | 5,829 (3.0%) |
| $300 to $499 | 34,321 (9.2%) | 9,572 (5.0%) |
| $500 to $799 | 64,427 (17.2%) | 23,681 (12.4%) |
| $800 to $999 | 36,182 (9.7%) | 34,214 (17.9%) |
| $1,000 to $1,499 | 74,763 (20.0%) | 71,039 (37.2%) |
| $1,500 to $1,999 | 66,076 (17.7%) | 25,060 (13.1%) |
| $2,000 to $2,499 | 39,706 (10.6%) | 8,696 (4.5%) |
| $2,500 to $2,999 | 22,165 (5.9%) | 2,566 (1.3%) |
| $3,000 or more | 24,404 (6.5%) | 2,033 (1.1%) |
| Total | 374,251 (100.0%) | 191,149 (100.0%) |
Physical Housing Characteristics in Area Code 518
Housing Structures in Area Code 518
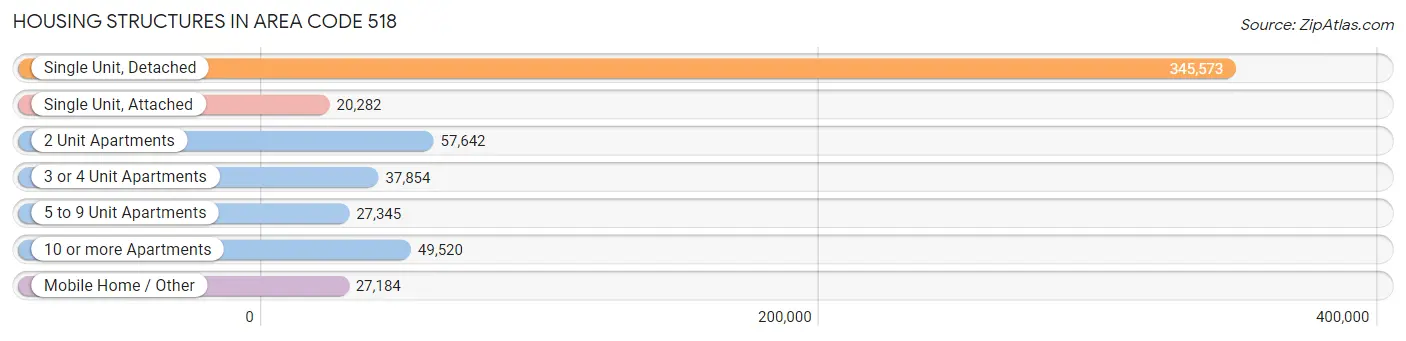
| Structure Type | # Housing Units | % Housing Units |
| Single Unit, Detached | 345,573 | 61.1% |
| Single Unit, Attached | 20,282 | 3.6% |
| 2 Unit Apartments | 57,642 | 10.2% |
| 3 or 4 Unit Apartments | 37,854 | 6.7% |
| 5 to 9 Unit Apartments | 27,345 | 4.8% |
| 10 or more Apartments | 49,520 | 8.8% |
| Mobile Home / Other | 27,184 | 4.8% |
| Total | 565,400 | 100.0% |
Housing Structures by Occupancy in Area Code 518
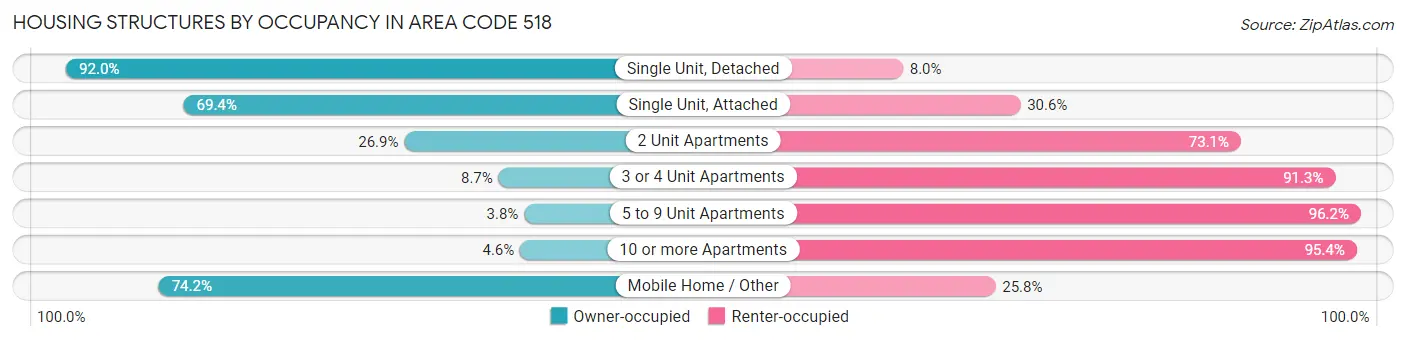
| Structure Type | Owner-occupied | Renter-occupied |
| Single Unit, Detached | 317,894 (92.0%) | 27,679 (8.0%) |
| Single Unit, Attached | 14,072 (69.4%) | 6,210 (30.6%) |
| 2 Unit Apartments | 15,503 (26.9%) | 42,139 (73.1%) |
| 3 or 4 Unit Apartments | 3,306 (8.7%) | 34,548 (91.3%) |
| 5 to 9 Unit Apartments | 1,043 (3.8%) | 26,302 (96.2%) |
| 10 or more Apartments | 2,271 (4.6%) | 47,249 (95.4%) |
| Mobile Home / Other | 20,162 (74.2%) | 7,022 (25.8%) |
| Total | 374,251 (66.2%) | 191,149 (33.8%) |
Housing Structures by Number of Rooms in Area Code 518
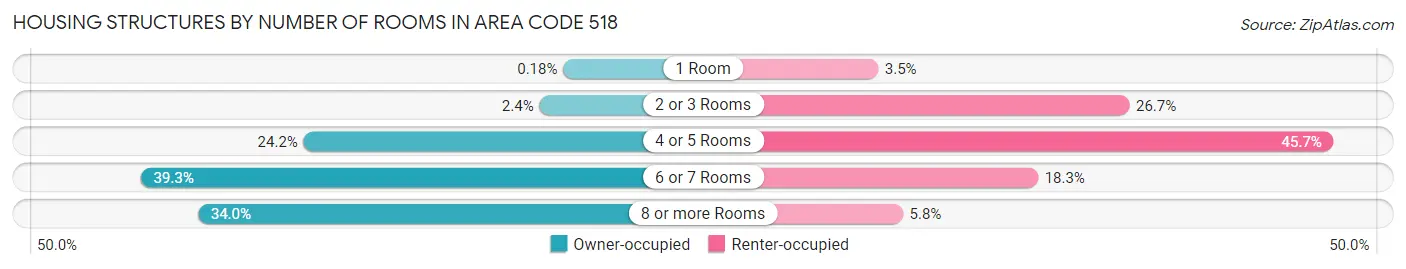
| Number of Rooms | Owner-occupied | Renter-occupied |
| 1 Room | 655 (0.2%) | 6,709 (3.5%) |
| 2 or 3 Rooms | 8,903 (2.4%) | 51,115 (26.7%) |
| 4 or 5 Rooms | 90,514 (24.2%) | 87,275 (45.7%) |
| 6 or 7 Rooms | 147,022 (39.3%) | 34,962 (18.3%) |
| 8 or more Rooms | 127,157 (34.0%) | 11,088 (5.8%) |
| Total | 374,251 (100.0%) | 191,149 (100.0%) |
Housing Structure by Heating Type in Area Code 518
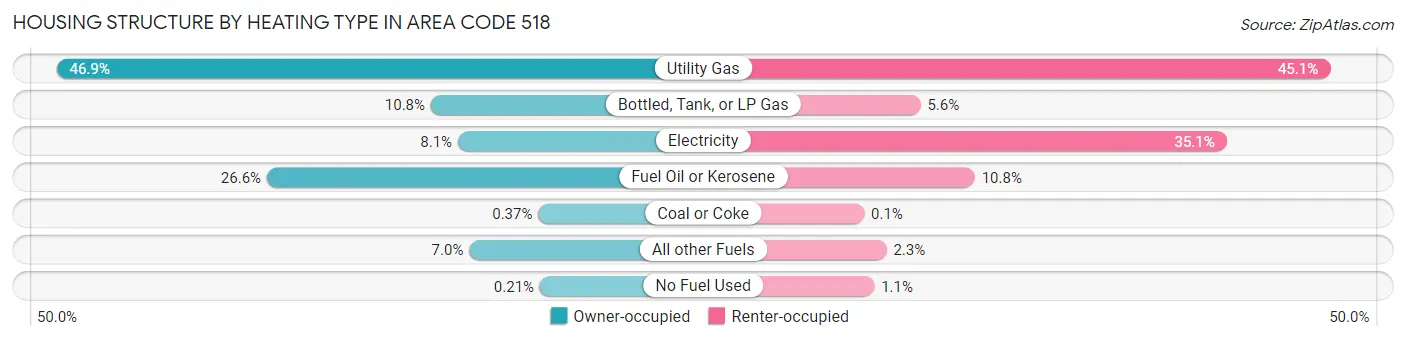
| Heating Type | Owner-occupied | Renter-occupied |
| Utility Gas | 175,560 (46.9%) | 86,225 (45.1%) |
| Bottled, Tank, or LP Gas | 40,241 (10.7%) | 10,605 (5.6%) |
| Electricity | 30,427 (8.1%) | 67,123 (35.1%) |
| Fuel Oil or Kerosene | 99,513 (26.6%) | 20,625 (10.8%) |
| Coal or Coke | 1,399 (0.4%) | 187 (0.1%) |
| All other Fuels | 26,340 (7.0%) | 4,325 (2.3%) |
| No Fuel Used | 771 (0.2%) | 2,059 (1.1%) |
| Total | 374,251 (100.0%) | 191,149 (100.0%) |
Household Vehicle Usage in Area Code 518
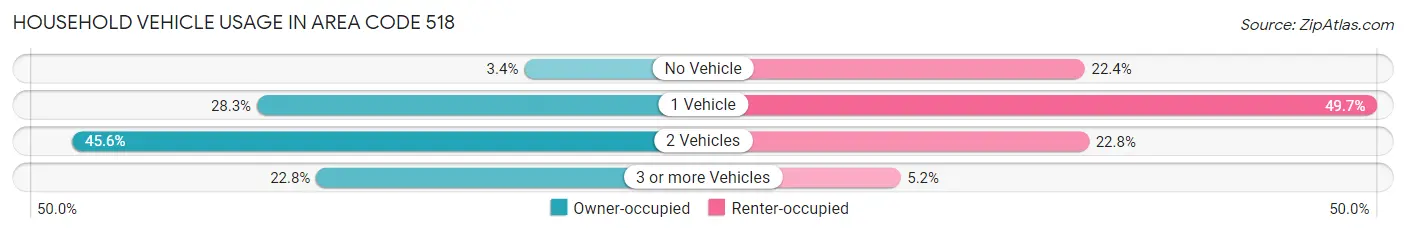
| Vehicles per Household | Owner-occupied | Renter-occupied |
| No Vehicle | 12,575 (3.4%) | 42,764 (22.4%) |
| 1 Vehicle | 105,932 (28.3%) | 94,989 (49.7%) |
| 2 Vehicles | 170,493 (45.6%) | 43,515 (22.8%) |
| 3 or more Vehicles | 85,251 (22.8%) | 9,881 (5.2%) |
| Total | 374,251 (100.0%) | 191,149 (100.0%) |
Real Estate & Mortgages in Area Code 518
Real Estate and Mortgage Overview in Area Code 518
| Characteristic | Without Mortgage | With Mortgage |
| Housing Units | 153,160 | 221,091 |
| Median Property Value | $58,817,701 | $65,856,300 |
| Median Household Income | $18,459,089 | $69,877 |
| Monthly Housing Costs | $179,026 | $23,595 |
| Real Estate Taxes | $950,455 | $6,762 |
Property Value by Mortgage Status in Area Code 518
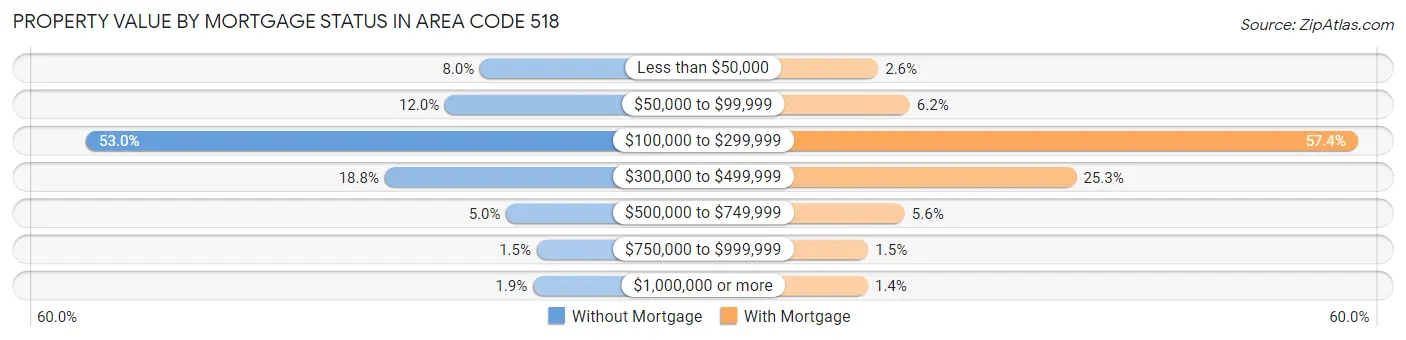
| Property Value | Without Mortgage | With Mortgage |
| Less than $50,000 | 12,174 (8.0%) | 5,755 (2.6%) |
| $50,000 to $99,999 | 18,299 (11.9%) | 13,738 (6.2%) |
| $100,000 to $299,999 | 81,114 (53.0%) | 126,883 (57.4%) |
| $300,000 to $499,999 | 28,853 (18.8%) | 55,829 (25.3%) |
| $500,000 to $749,999 | 7,583 (5.0%) | 12,475 (5.6%) |
| $750,000 to $999,999 | 2,240 (1.5%) | 3,251 (1.5%) |
| $1,000,000 or more | 2,897 (1.9%) | 3,160 (1.4%) |
| Total | 153,160 (100.0%) | 221,091 (100.0%) |
Household Income by Mortgage Status in Area Code 518
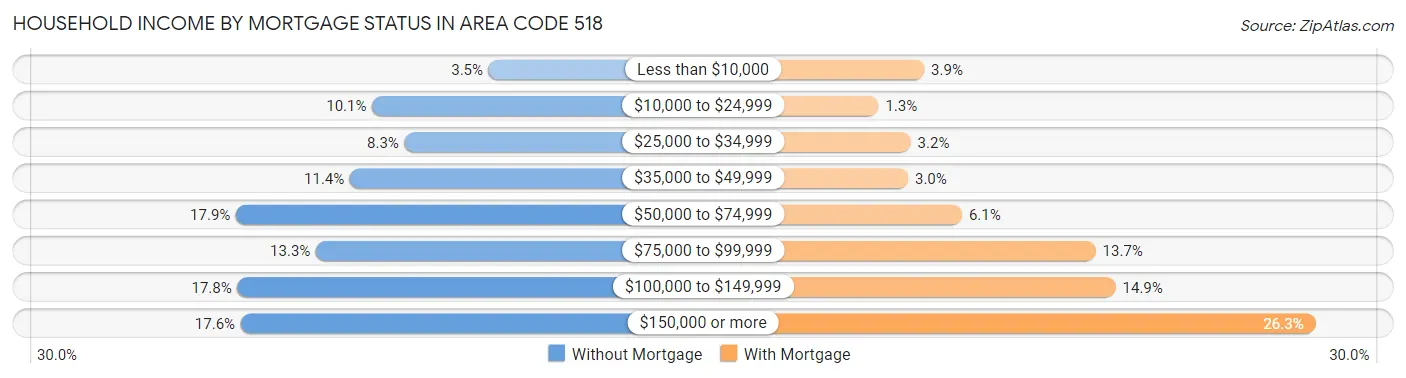
| Household Income | Without Mortgage | With Mortgage |
| Less than $10,000 | 5,309 (3.5%) | 8,665 (3.9%) |
| $10,000 to $24,999 | 15,516 (10.1%) | 2,892 (1.3%) |
| $25,000 to $34,999 | 12,682 (8.3%) | 6,971 (3.2%) |
| $35,000 to $49,999 | 17,461 (11.4%) | 6,634 (3.0%) |
| $50,000 to $74,999 | 27,430 (17.9%) | 13,437 (6.1%) |
| $75,000 to $99,999 | 20,425 (13.3%) | 30,330 (13.7%) |
| $100,000 to $149,999 | 27,313 (17.8%) | 32,848 (14.9%) |
| $150,000 or more | 27,024 (17.6%) | 58,102 (26.3%) |
| Total | 153,160 (100.0%) | 221,091 (100.0%) |
Property Value to Household Income Ratio in Area Code 518
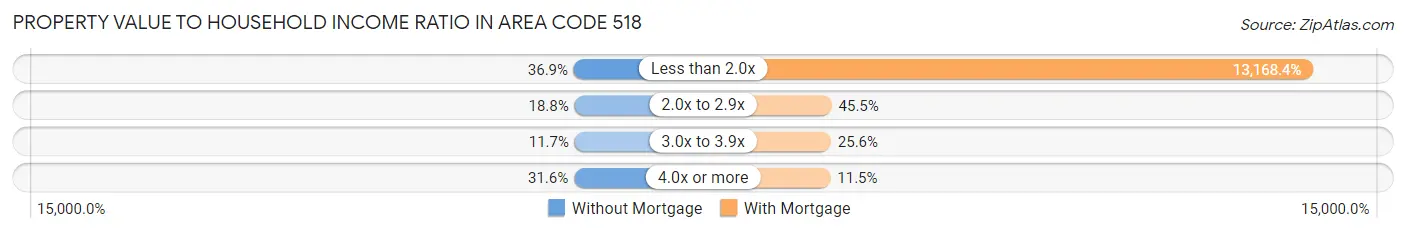
| Value-to-Income Ratio | Without Mortgage | With Mortgage |
| Less than 2.0x | 56,526 (36.9%) | 29,114,087 (13,168.4%) |
| 2.0x to 2.9x | 28,829 (18.8%) | 100,653 (45.5%) |
| 3.0x to 3.9x | 17,986 (11.7%) | 56,628 (25.6%) |
| 4.0x or more | 48,464 (31.6%) | 25,318 (11.5%) |
| Total | 153,160 (100.0%) | 221,091 (100.0%) |
Real Estate Taxes by Mortgage Status in Area Code 518
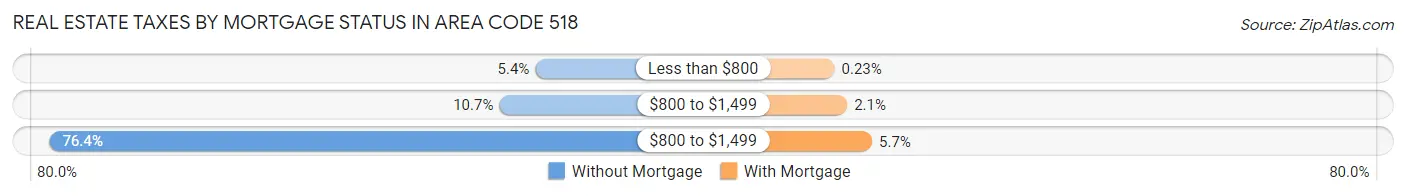
| Property Taxes | Without Mortgage | With Mortgage |
| Less than $800 | 8,248 (5.4%) | 518 (0.2%) |
| $800 to $1,499 | 16,316 (10.6%) | 4,583 (2.1%) |
| $800 to $1,499 | 116,954 (76.4%) | 12,627 (5.7%) |
| Total | 153,160 (100.0%) | 221,091 (100.0%) |
Health & Disability in Area Code 518
Health Insurance Coverage by Age in Area Code 518
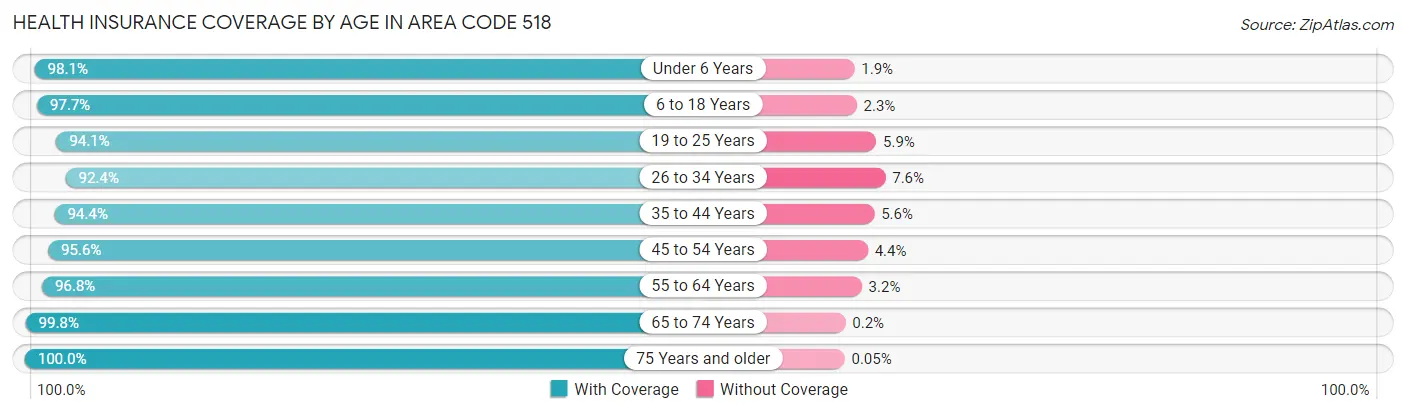
| Age Bracket | With Coverage | Without Coverage |
| Under 6 Years | 78,235 (98.1%) | 1,498 (1.9%) |
| 6 to 18 Years | 196,566 (97.7%) | 4,627 (2.3%) |
| 19 to 25 Years | 124,870 (94.1%) | 7,874 (5.9%) |
| 26 to 34 Years | 140,488 (92.4%) | 11,620 (7.6%) |
| 35 to 44 Years | 152,110 (94.4%) | 8,991 (5.6%) |
| 45 to 54 Years | 162,344 (95.6%) | 7,413 (4.4%) |
| 55 to 64 Years | 190,637 (96.8%) | 6,392 (3.2%) |
| 65 to 74 Years | 153,780 (99.8%) | 312 (0.2%) |
| 75 Years and older | 101,836 (100.0%) | 50 (0.1%) |
| Total | 1,300,866 (96.4%) | 48,777 (3.6%) |
Health Insurance Coverage by Citizenship Status in Area Code 518
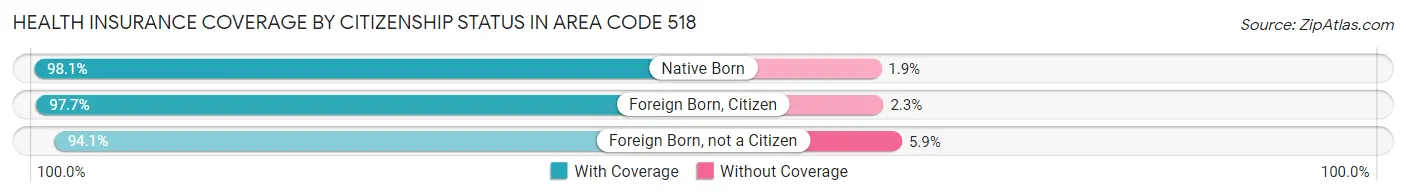
| Citizenship Status | With Coverage | Without Coverage |
| Native Born | 78,235 (98.1%) | 1,498 (1.9%) |
| Foreign Born, Citizen | 196,566 (97.7%) | 4,627 (2.3%) |
| Foreign Born, not a Citizen | 124,870 (94.1%) | 7,874 (5.9%) |
Health Insurance Coverage by Household Income in Area Code 518
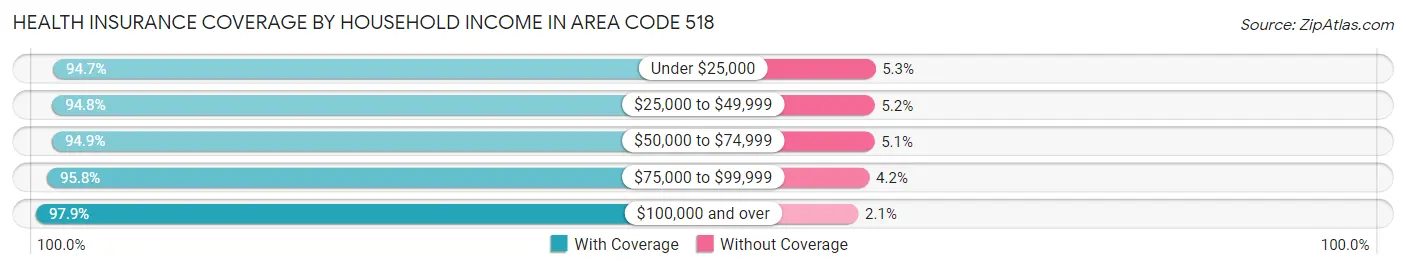
| Household Income | With Coverage | Without Coverage |
| Under $25,000 | 131,018 (94.7%) | 7,380 (5.3%) |
| $25,000 to $49,999 | 172,394 (94.8%) | 9,436 (5.2%) |
| $50,000 to $74,999 | 185,524 (94.9%) | 10,053 (5.1%) |
| $75,000 to $99,999 | 177,288 (95.8%) | 7,747 (4.2%) |
| $100,000 and over | 599,865 (97.9%) | 13,028 (2.1%) |
Public vs Private Health Insurance Coverage by Age in Area Code 518
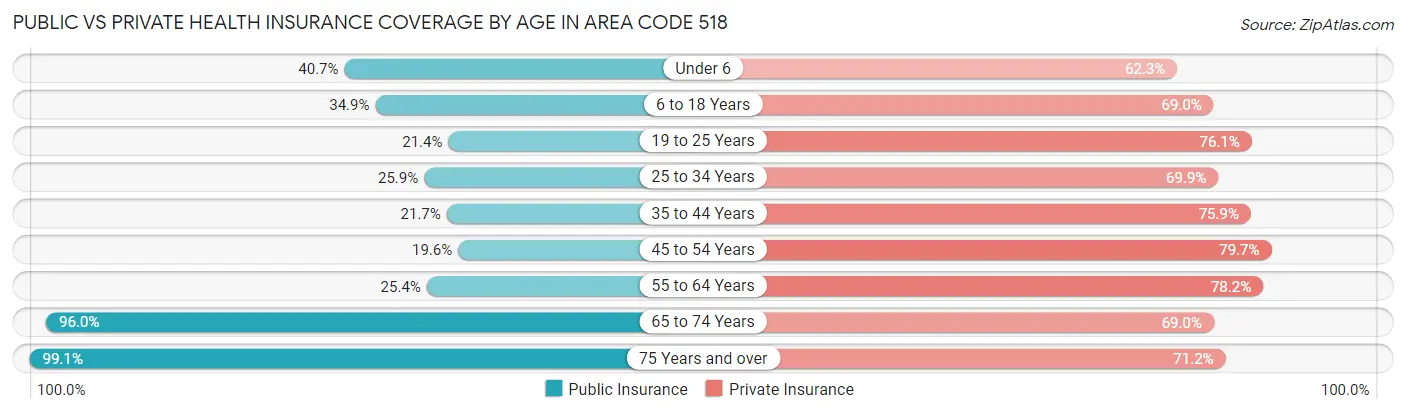
| Age Bracket | Public Insurance | Private Insurance |
| Under 6 | 32,415 (40.6%) | 49,630 (62.3%) |
| 6 to 18 Years | 70,211 (34.9%) | 138,872 (69.0%) |
| 19 to 25 Years | 28,348 (21.4%) | 100,982 (76.1%) |
| 25 to 34 Years | 39,327 (25.9%) | 106,242 (69.9%) |
| 35 to 44 Years | 34,912 (21.7%) | 122,274 (75.9%) |
| 45 to 54 Years | 33,190 (19.6%) | 135,339 (79.7%) |
| 55 to 64 Years | 49,991 (25.4%) | 154,019 (78.2%) |
| 65 to 74 Years | 147,923 (96.0%) | 106,365 (69.0%) |
| 75 Years and over | 100,947 (99.1%) | 72,540 (71.2%) |
| Total | 537,264 (39.8%) | 986,263 (73.1%) |
Disability Status by Sex by Age in Area Code 518
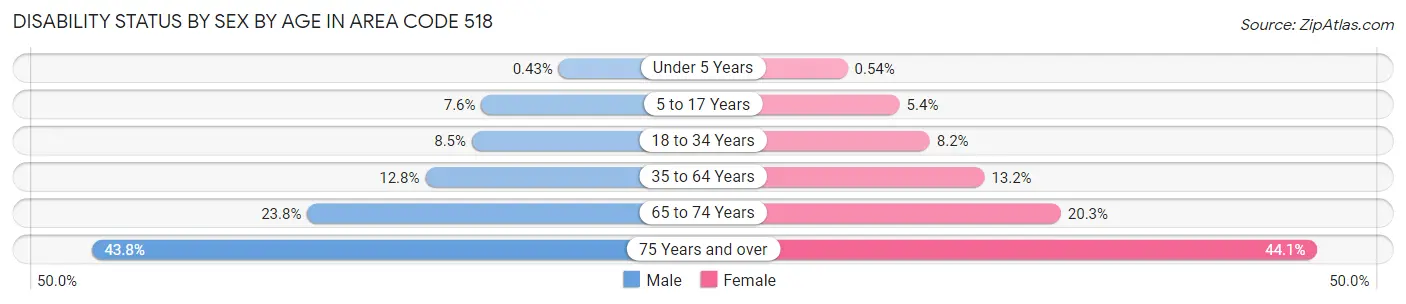
| Age Bracket | Male | Female |
| Under 5 Years | 143 (0.4%) | 177 (0.5%) |
| 5 to 17 Years | 7,571 (7.6%) | 4,994 (5.4%) |
| 18 to 34 Years | 13,202 (8.5%) | 12,363 (8.2%) |
| 35 to 64 Years | 33,599 (12.8%) | 35,160 (13.2%) |
| 65 to 74 Years | 17,659 (23.8%) | 16,221 (20.3%) |
| 75 Years and over | 18,655 (43.8%) | 26,162 (44.1%) |
Disability Class by Sex by Age in Area Code 518
Disability Class: Hearing Difficulty
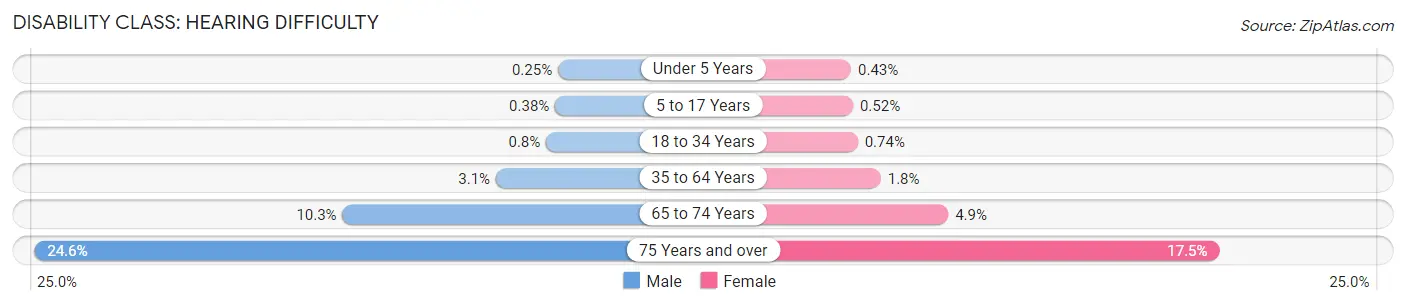
| Age Bracket | Male | Female |
| Under 5 Years | 84 (0.3%) | 141 (0.4%) |
| 5 to 17 Years | 381 (0.4%) | 486 (0.5%) |
| 18 to 34 Years | 1,246 (0.8%) | 1,117 (0.7%) |
| 35 to 64 Years | 8,207 (3.1%) | 4,810 (1.8%) |
| 65 to 74 Years | 7,614 (10.2%) | 3,938 (4.9%) |
| 75 Years and over | 10,456 (24.5%) | 10,388 (17.5%) |
Disability Class: Vision Difficulty
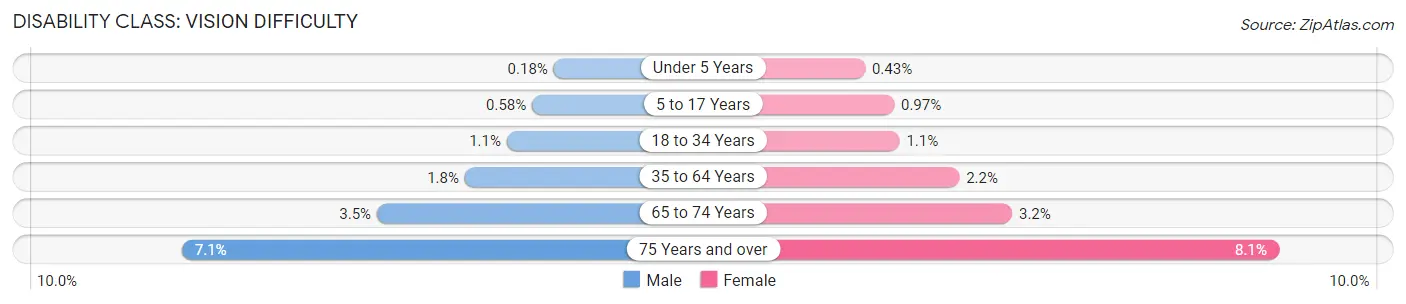
| Age Bracket | Male | Female |
| Under 5 Years | 59 (0.2%) | 143 (0.4%) |
| 5 to 17 Years | 576 (0.6%) | 901 (1.0%) |
| 18 to 34 Years | 1,637 (1.1%) | 1,616 (1.1%) |
| 35 to 64 Years | 4,787 (1.8%) | 5,785 (2.2%) |
| 65 to 74 Years | 2,568 (3.5%) | 2,522 (3.2%) |
| 75 Years and over | 3,016 (7.1%) | 4,808 (8.1%) |
Disability Class: Cognitive Difficulty
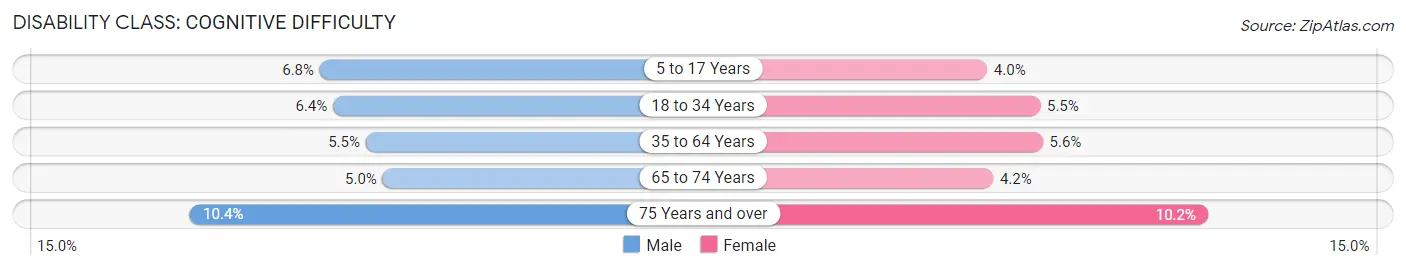
| Age Bracket | Male | Female |
| 5 to 17 Years | 6,749 (6.8%) | 3,757 (4.0%) |
| 18 to 34 Years | 9,970 (6.4%) | 8,357 (5.5%) |
| 35 to 64 Years | 14,424 (5.5%) | 14,858 (5.6%) |
| 65 to 74 Years | 3,739 (5.0%) | 3,361 (4.2%) |
| 75 Years and over | 4,424 (10.4%) | 6,043 (10.2%) |
Disability Class: Ambulatory Difficulty
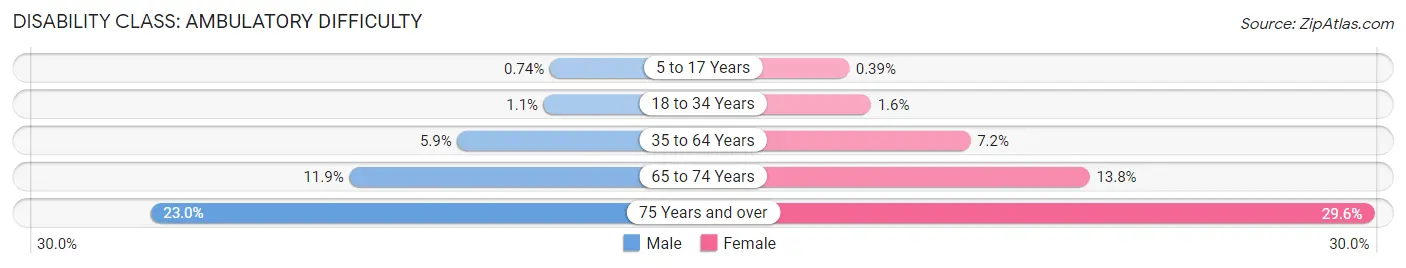
| Age Bracket | Male | Female |
| 5 to 17 Years | 733 (0.7%) | 359 (0.4%) |
| 18 to 34 Years | 1,675 (1.1%) | 2,434 (1.6%) |
| 35 to 64 Years | 15,435 (5.9%) | 18,998 (7.1%) |
| 65 to 74 Years | 8,847 (11.9%) | 11,005 (13.8%) |
| 75 Years and over | 9,797 (23.0%) | 17,576 (29.6%) |
Disability Class: Self-Care Difficulty
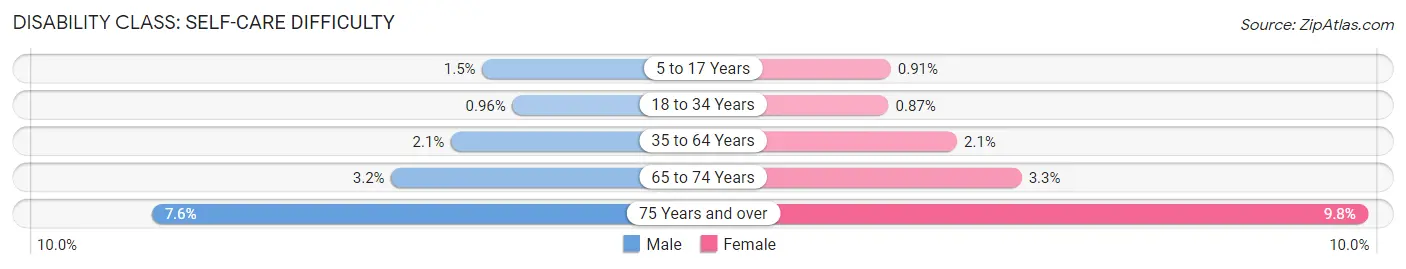
| Age Bracket | Male | Female |
| 5 to 17 Years | 1,518 (1.5%) | 845 (0.9%) |
| 18 to 34 Years | 1,497 (1.0%) | 1,315 (0.9%) |
| 35 to 64 Years | 5,514 (2.1%) | 5,690 (2.1%) |
| 65 to 74 Years | 2,387 (3.2%) | 2,666 (3.3%) |
| 75 Years and over | 3,255 (7.6%) | 5,785 (9.8%) |
Technology Access in Area Code 518
Computing Device Access in Area Code 518
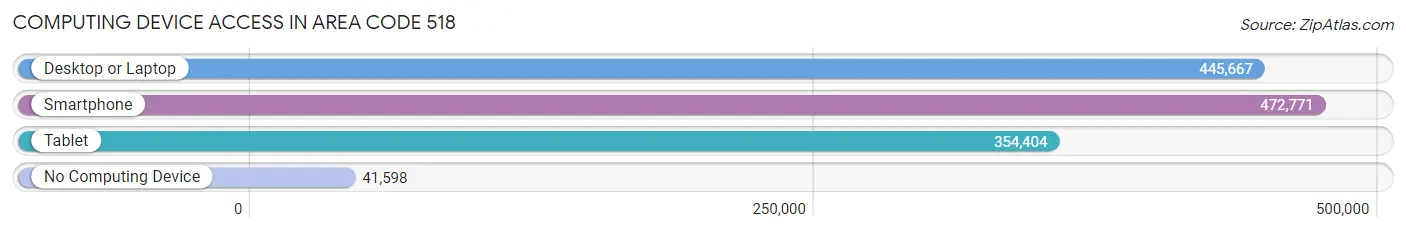
| Device Type | # Households | % Households |
| Desktop or Laptop | 445,667 | 78.8% |
| Smartphone | 472,771 | 83.6% |
| Tablet | 354,404 | 62.7% |
| No Computing Device | 41,598 | 7.4% |
| Total | 565,400 | 100.0% |
Internet Access in Area Code 518
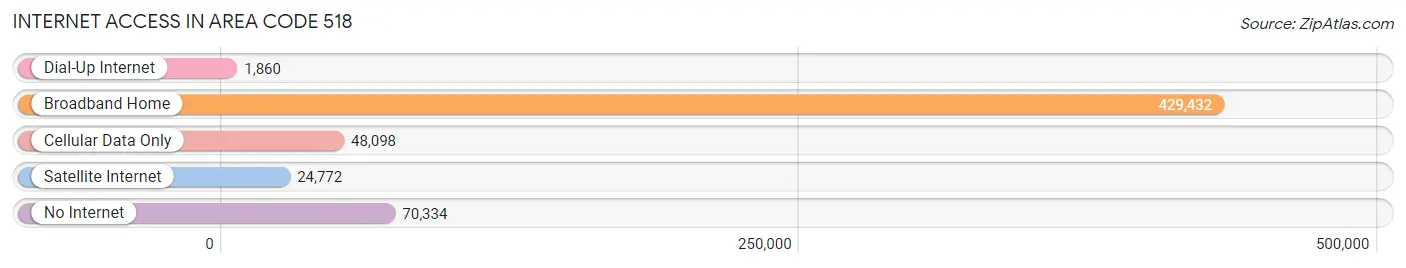
| Internet Type | # Households | % Households |
| Dial-Up Internet | 1,860 | 0.3% |
| Broadband Home | 429,432 | 75.9% |
| Cellular Data Only | 48,098 | 8.5% |
| Satellite Internet | 24,772 | 4.4% |
| No Internet | 70,334 | 12.4% |
| Total | 565,400 | 100.0% |
Area Code 518 Summary
Geography
Area code 518 is located in the northeastern part of the United States, covering the entire state of New York. It is bordered by the states of Vermont, Massachusetts, Connecticut, and Pennsylvania. The area code is also used in parts of Canada, including the provinces of Quebec and Ontario.
Social
Area code 518 is home to a diverse population of people from all walks of life. The area is known for its vibrant arts and culture scene, with many museums, galleries, and performing arts venues. The area is also home to a number of universities and colleges, making it a great place for students to pursue their studies.
Economics
Area code 518 is home to a number of major industries, including finance, technology, and healthcare. The area is also home to a number of Fortune 500 companies, including IBM, GE, and Time Warner. The area is also home to a number of small businesses, making it a great place to start a business.
Demographics
Area code 518 is home to a diverse population of people from all walks of life. The area is home to a large number of immigrants, with a significant population of people from Latin America, Asia, and Africa. The area is also home to a large number of young people, making it a great place for young professionals to start their careers.
Common Questions
What is Per Capita Income in Area Code 518?
Per Capita income in Area Code 518 is $40,960.
What is the Median Family Income in Area Code 518?
Median Family Income in Area Code 518 is $96,883.
What is the Median Household income in Area Code 518?
Median Household Income in Area Code 518 is $78,242.
What is Income or Wage Gap in Area Code 518?
Income or Wage Gap in Area Code 518 is 27.1%.
Women in Area Code 518 earn 72.9 cents for every dollar earned by a man.
What is Family Income Deficit in Area Code 518?
Family Income Deficit in Area Code 518 is $10,908.
Families that are below poverty line in Area Code 518 earn $10,908 less on average than the poverty threshold level.
What is Inequality or Gini Index in Area Code 518?
Inequality or Gini Index in Area Code 518 is 124.30.
What is the Total Population of Area Code 518?
Total Population of Area Code 518 is 1,374,764.
What is the Total Male Population of Area Code 518?
Total Male Population of Area Code 518 is 686,669.
What is the Total Female Population of Area Code 518?
Total Female Population of Area Code 518 is 688,095.
What is the Ratio of Males per 100 Females in Area Code 518?
There are 99.79 Males per 100 Females in Area Code 518.
What is the Ratio of Females per 100 Males in Area Code 518?
There are 100.21 Females per 100 Males in Area Code 518.
What is the Median Population Age in Area Code 518?
Median Population Age in Area Code 518 is 46.8 Years.
What is the Average Family Size in Area Code 518
Average Family Size in Area Code 518 is 2.9 People.
What is the Average Household Size in Area Code 518
Average Household Size in Area Code 518 is 2.4 People.
How Large is the Labor Force in Area Code 518?
There are 676,046 People in the Labor Forcein in Area Code 518.
What is the Percentage of People in the Labor Force in Area Code 518?
58.9% of People are in the Labor Force in Area Code 518.
What is the Unemployment Rate in Area Code 518?
Unemployment Rate in Area Code 518 is 6.1%.