Seneca County, NY Map & Demographics
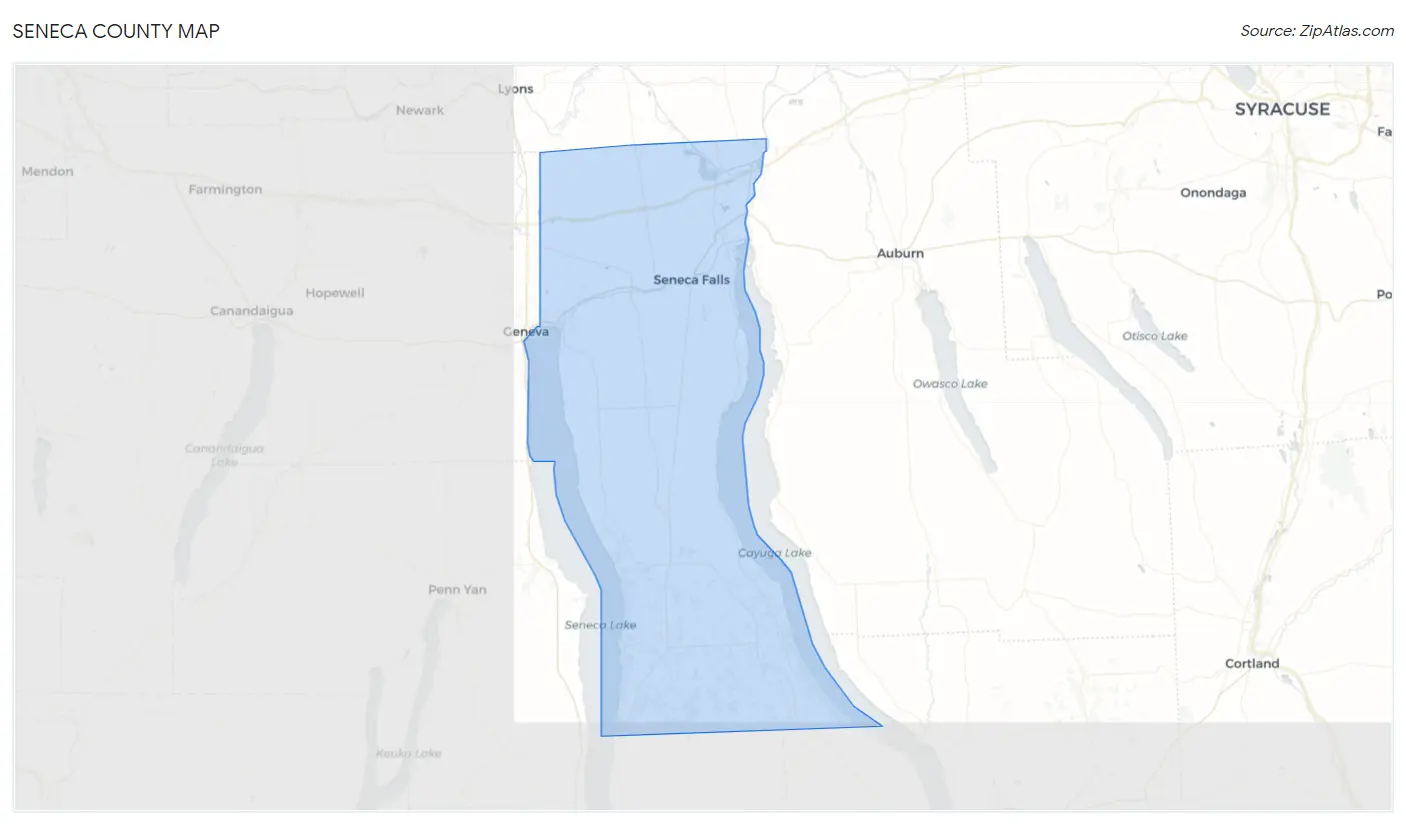
Seneca County Map
Seneca County Overview
$34,212
PER CAPITA INCOME
$81,616
AVG FAMILY INCOME
$64,050
AVG HOUSEHOLD INCOME
25.3%
WAGE / INCOME GAP [ % ]
74.7¢/ $1
WAGE / INCOME GAP [ $ ]
$10,103
FAMILY INCOME DEFICIT
0.46
INEQUALITY / GINI INDEX
33,651
TOTAL POPULATION
17,613
MALE POPULATION
16,038
FEMALE POPULATION
109.82
MALES / 100 FEMALES
91.06
FEMALES / 100 MALES
43.0
MEDIAN AGE
3.0
AVG FAMILY SIZE
2.3
AVG HOUSEHOLD SIZE
15,634
LABOR FORCE [ PEOPLE ]
56.7%
PERCENT IN LABOR FORCE
4.5%
UNEMPLOYMENT RATE
Income in Seneca County
Income Overview in Seneca County
Per Capita Income in Seneca County is $34,212, while median incomes of families and households are $81,616 and $64,050 respectively.
| Characteristic | Number | Measure |
| Per Capita Income | 33,651 | $34,212 |
| Median Family Income | 7,939 | $81,616 |
| Mean Family Income | 7,939 | $106,263 |
| Median Household Income | 13,622 | $64,050 |
| Mean Household Income | 13,622 | $83,450 |
| Income Deficit | 7,939 | $10,103 |
| Wage / Income Gap (%) | 33,651 | 25.30% |
| Wage / Income Gap ($) | 33,651 | 74.70¢ per $1 |
| Gini / Inequality Index | 33,651 | 0.46 |
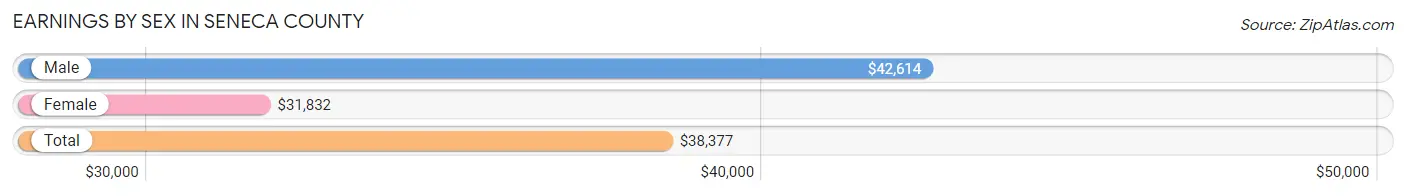
Earnings by Sex in Seneca County
Average Earnings in Seneca County are $38,377, $42,614 for men and $31,832 for women, a difference of 25.3%.
| Sex | Number | Average Earnings |
| Male | 8,728 (52.4%) | $42,614 |
| Female | 7,930 (47.6%) | $31,832 |
| Total | 16,658 (100.0%) | $38,377 |
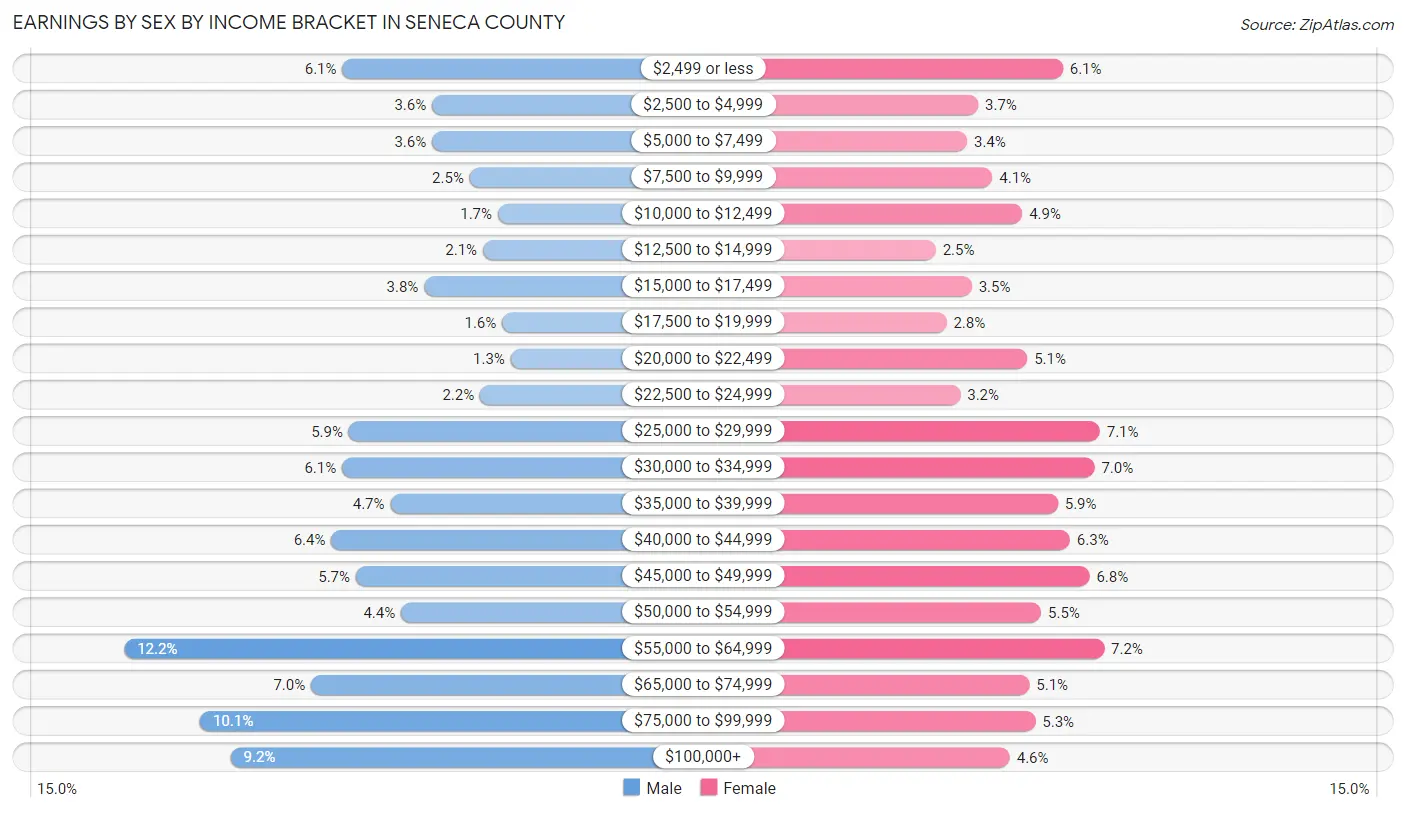
Earnings by Sex by Income Bracket in Seneca County
The most common earnings brackets in Seneca County are $55,000 to $64,999 for men (1,065 | 12.2%) and $55,000 to $64,999 for women (573 | 7.2%).
| Income | Male | Female |
| $2,499 or less | 530 (6.1%) | 481 (6.1%) |
| $2,500 to $4,999 | 310 (3.5%) | 293 (3.7%) |
| $5,000 to $7,499 | 310 (3.5%) | 268 (3.4%) |
| $7,500 to $9,999 | 217 (2.5%) | 324 (4.1%) |
| $10,000 to $12,499 | 148 (1.7%) | 391 (4.9%) |
| $12,500 to $14,999 | 185 (2.1%) | 198 (2.5%) |
| $15,000 to $17,499 | 329 (3.8%) | 278 (3.5%) |
| $17,500 to $19,999 | 138 (1.6%) | 222 (2.8%) |
| $20,000 to $22,499 | 117 (1.3%) | 402 (5.1%) |
| $22,500 to $24,999 | 192 (2.2%) | 253 (3.2%) |
| $25,000 to $29,999 | 514 (5.9%) | 564 (7.1%) |
| $30,000 to $34,999 | 531 (6.1%) | 552 (7.0%) |
| $35,000 to $39,999 | 412 (4.7%) | 470 (5.9%) |
| $40,000 to $44,999 | 557 (6.4%) | 497 (6.3%) |
| $45,000 to $49,999 | 497 (5.7%) | 541 (6.8%) |
| $50,000 to $54,999 | 386 (4.4%) | 433 (5.5%) |
| $55,000 to $64,999 | 1,065 (12.2%) | 573 (7.2%) |
| $65,000 to $74,999 | 607 (7.0%) | 407 (5.1%) |
| $75,000 to $99,999 | 879 (10.1%) | 420 (5.3%) |
| $100,000+ | 804 (9.2%) | 363 (4.6%) |
| Total | 8,728 (100.0%) | 7,930 (100.0%) |
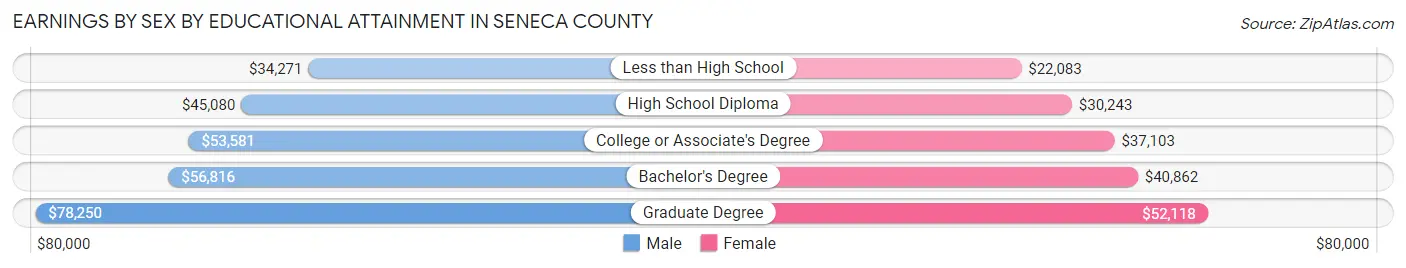
Earnings by Sex by Educational Attainment in Seneca County
Average earnings in Seneca County are $49,045 for men and $37,882 for women, a difference of 22.8%. Men with an educational attainment of graduate degree enjoy the highest average annual earnings of $78,250, while those with less than high school education earn the least with $34,271. Women with an educational attainment of graduate degree earn the most with the average annual earnings of $52,118, while those with less than high school education have the smallest earnings of $22,083.
| Educational Attainment | Male Income | Female Income |
| Less than High School | $34,271 | $22,083 |
| High School Diploma | $45,080 | $30,243 |
| College or Associate's Degree | $53,581 | $37,103 |
| Bachelor's Degree | $56,816 | $40,862 |
| Graduate Degree | $78,250 | $52,118 |
| Total | $49,045 | $37,882 |
Family Income in Seneca County
Family Income Brackets in Seneca County
According to the Seneca County family income data, there are 1,683 families falling into the $50,000 to $74,999 income range, which is the most common income bracket and makes up 21.2% of all families. Conversely, the $10,000 to $14,999 income bracket is the least frequent group with only 79 families (1.0%) belonging to this category.
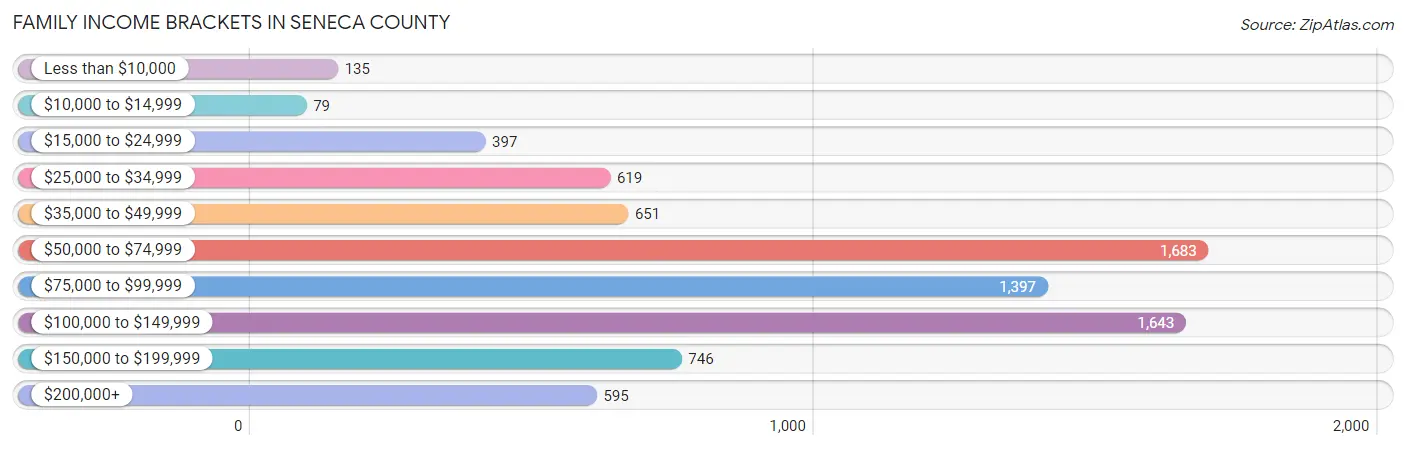
| Income Bracket | # Families | % Families |
| Less than $10,000 | 135 | 1.7% |
| $10,000 to $14,999 | 79 | 1.0% |
| $15,000 to $24,999 | 397 | 5.0% |
| $25,000 to $34,999 | 619 | 7.8% |
| $35,000 to $49,999 | 651 | 8.2% |
| $50,000 to $74,999 | 1,683 | 21.2% |
| $75,000 to $99,999 | 1,397 | 17.6% |
| $100,000 to $149,999 | 1,643 | 20.7% |
| $150,000 to $199,999 | 746 | 9.4% |
| $200,000+ | 595 | 7.5% |
Family Income by Famaliy Size in Seneca County
5-person families (608 | 7.7%) account for the highest median family income in Seneca County with $109,167 per family, while 2-person families (4,479 | 56.4%) have the highest median income of $37,296 per family member.
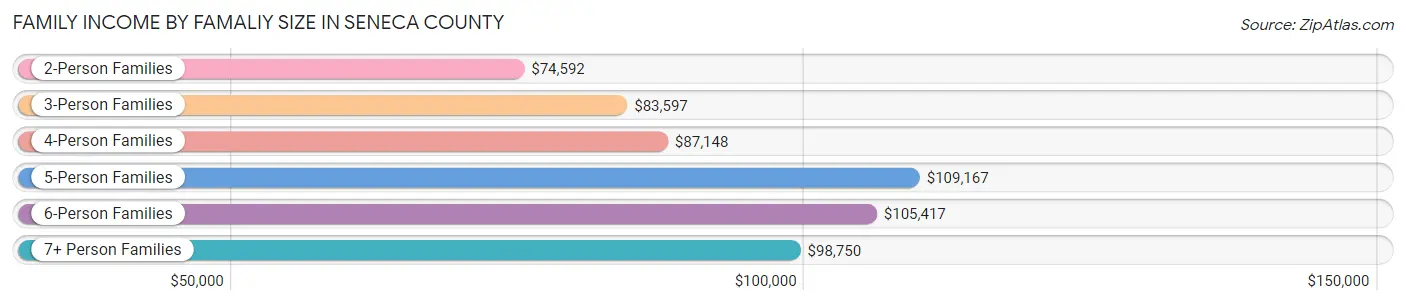
| Income Bracket | # Families | Median Income |
| 2-Person Families | 4,479 (56.4%) | $74,592 |
| 3-Person Families | 1,233 (15.5%) | $83,597 |
| 4-Person Families | 1,095 (13.8%) | $87,148 |
| 5-Person Families | 608 (7.7%) | $109,167 |
| 6-Person Families | 220 (2.8%) | $105,417 |
| 7+ Person Families | 304 (3.8%) | $98,750 |
| Total | 7,939 (100.0%) | $81,616 |
Family Income by Number of Earners in Seneca County
The median family income in Seneca County is $81,616, with families comprising 3+ earners (879) having the highest median family income of $128,346, while families with no earners (1,478) have the lowest median family income of $60,962, accounting for 11.1% and 18.6% of families, respectively.
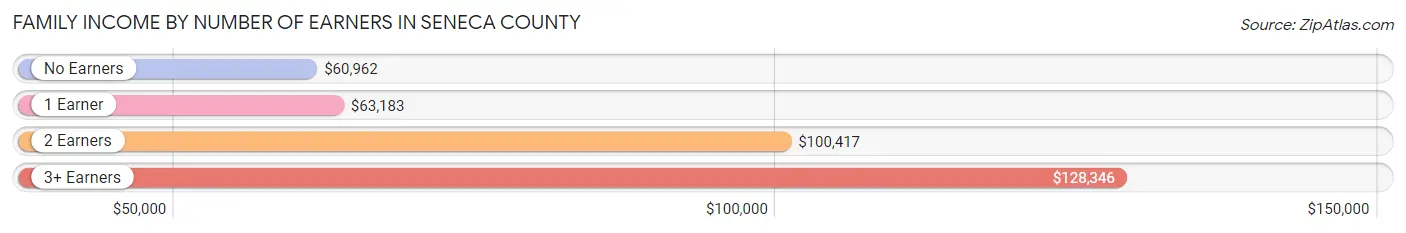
| Number of Earners | # Families | Median Income |
| No Earners | 1,478 (18.6%) | $60,962 |
| 1 Earner | 2,377 (29.9%) | $63,183 |
| 2 Earners | 3,205 (40.4%) | $100,417 |
| 3+ Earners | 879 (11.1%) | $128,346 |
| Total | 7,939 (100.0%) | $81,616 |
Household Income in Seneca County
Household Income Brackets in Seneca County
With 2,547 households falling in the category, the $50,000 to $74,999 income range is the most frequent in Seneca County, accounting for 18.7% of all households. In contrast, only 586 households (4.3%) fall into the $10,000 to $14,999 income bracket, making it the least populous group.
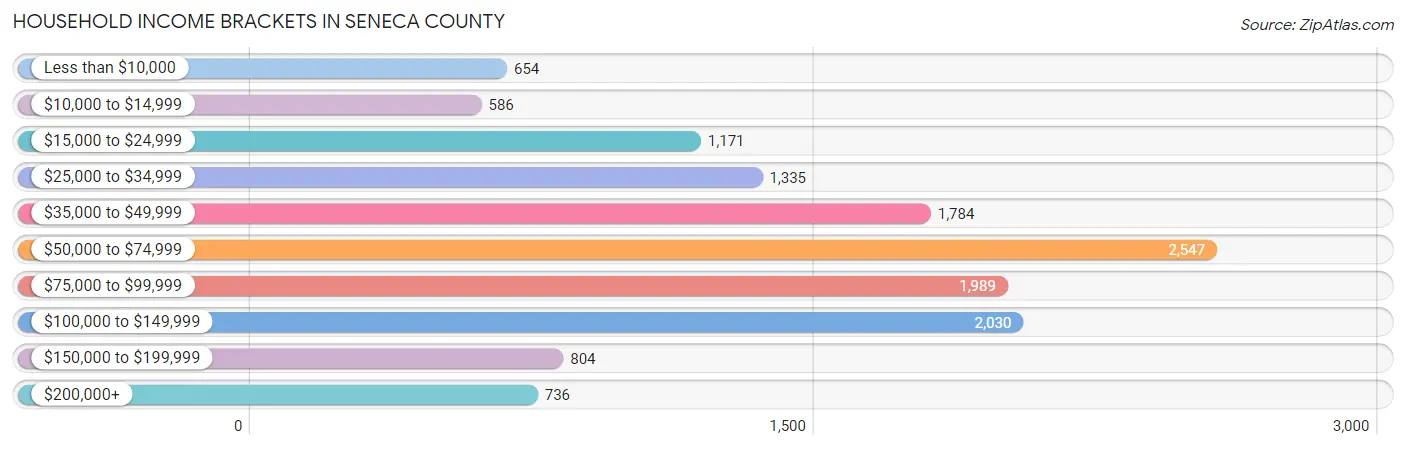
| Income Bracket | # Households | % Households |
| Less than $10,000 | 654 | 4.8% |
| $10,000 to $14,999 | 586 | 4.3% |
| $15,000 to $24,999 | 1,171 | 8.6% |
| $25,000 to $34,999 | 1,335 | 9.8% |
| $35,000 to $49,999 | 1,784 | 13.1% |
| $50,000 to $74,999 | 2,547 | 18.7% |
| $75,000 to $99,999 | 1,989 | 14.6% |
| $100,000 to $149,999 | 2,030 | 14.9% |
| $150,000 to $199,999 | 804 | 5.9% |
| $200,000+ | 736 | 5.4% |
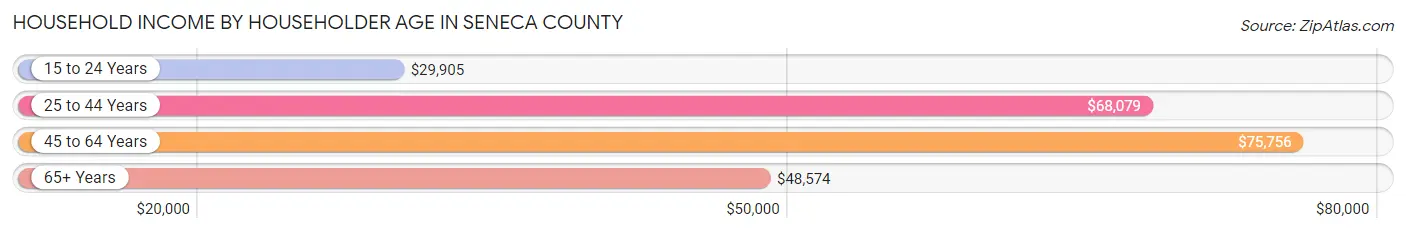
Household Income by Householder Age in Seneca County
The median household income in Seneca County is $64,050, with the highest median household income of $75,756 found in the 45 to 64 years age bracket for the primary householder. A total of 5,273 households (38.7%) fall into this category. Meanwhile, the 15 to 24 years age bracket for the primary householder has the lowest median household income of $29,905, with 537 households (3.9%) in this group.
| Income Bracket | # Households | Median Income |
| 15 to 24 Years | 537 (3.9%) | $29,905 |
| 25 to 44 Years | 3,489 (25.6%) | $68,079 |
| 45 to 64 Years | 5,273 (38.7%) | $75,756 |
| 65+ Years | 4,323 (31.7%) | $48,574 |
| Total | 13,622 (100.0%) | $64,050 |
Poverty in Seneca County
Income Below Poverty by Sex and Age in Seneca County
With 11.8% poverty level for males and 14.5% for females among the residents of Seneca County, 6 to 11 year old males and 18 to 24 year old females are the most vulnerable to poverty, with 264 males (20.4%) and 333 females (30.5%) in their respective age groups living below the poverty level.
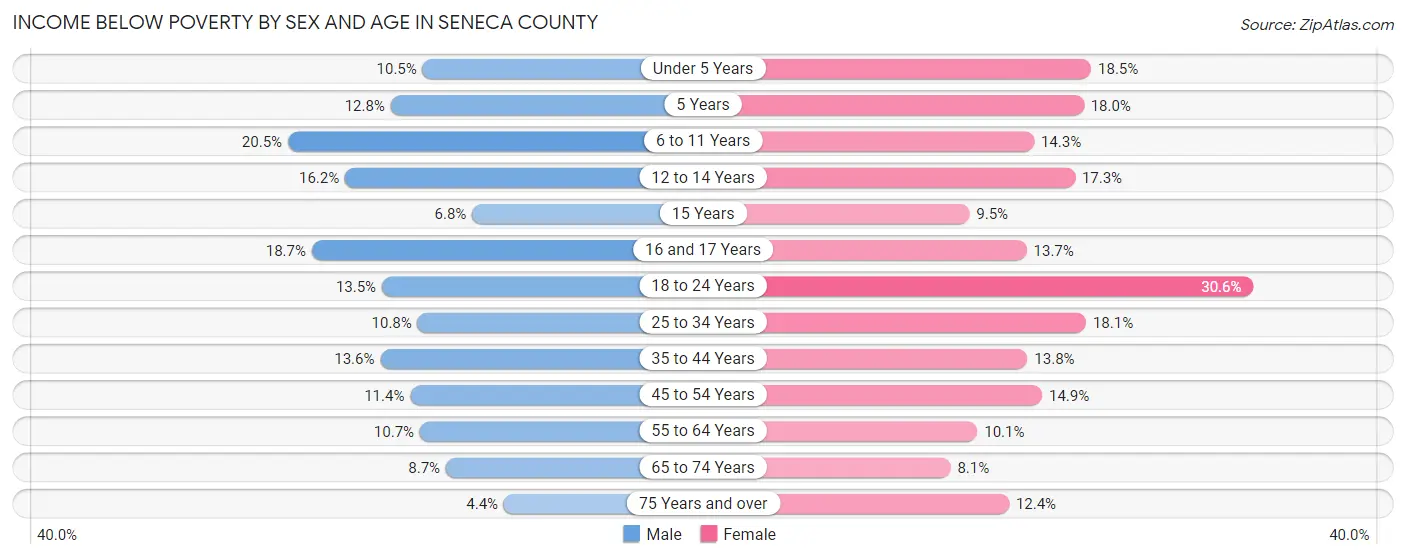
| Age Bracket | Male | Female |
| Under 5 Years | 98 (10.4%) | 156 (18.5%) |
| 5 Years | 15 (12.8%) | 30 (18.0%) |
| 6 to 11 Years | 264 (20.4%) | 153 (14.3%) |
| 12 to 14 Years | 106 (16.2%) | 72 (17.3%) |
| 15 Years | 13 (6.8%) | 23 (9.5%) |
| 16 and 17 Years | 68 (18.7%) | 38 (13.7%) |
| 18 to 24 Years | 156 (13.5%) | 333 (30.5%) |
| 25 to 34 Years | 206 (10.8%) | 358 (18.1%) |
| 35 to 44 Years | 233 (13.6%) | 230 (13.8%) |
| 45 to 54 Years | 228 (11.4%) | 289 (14.9%) |
| 55 to 64 Years | 259 (10.6%) | 252 (10.1%) |
| 65 to 74 Years | 170 (8.7%) | 165 (8.1%) |
| 75 Years and over | 49 (4.4%) | 180 (12.4%) |
| Total | 1,865 (11.8%) | 2,279 (14.5%) |
Income Above Poverty by Sex and Age in Seneca County
According to the poverty statistics in Seneca County, males aged 75 years and over and females aged 65 to 74 years are the age groups that are most secure financially, with 95.6% of males and 91.9% of females in these age groups living above the poverty line.
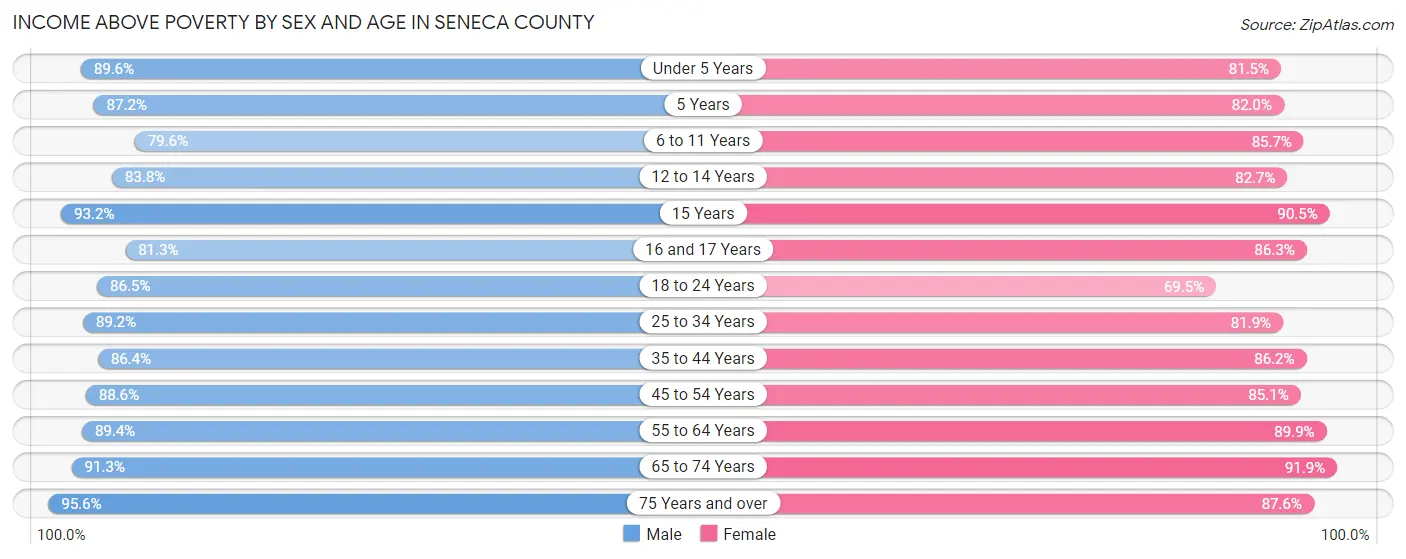
| Age Bracket | Male | Female |
| Under 5 Years | 840 (89.5%) | 687 (81.5%) |
| 5 Years | 102 (87.2%) | 137 (82.0%) |
| 6 to 11 Years | 1,027 (79.5%) | 919 (85.7%) |
| 12 to 14 Years | 548 (83.8%) | 344 (82.7%) |
| 15 Years | 179 (93.2%) | 220 (90.5%) |
| 16 and 17 Years | 296 (81.3%) | 239 (86.3%) |
| 18 to 24 Years | 1,002 (86.5%) | 757 (69.5%) |
| 25 to 34 Years | 1,698 (89.2%) | 1,617 (81.9%) |
| 35 to 44 Years | 1,481 (86.4%) | 1,439 (86.2%) |
| 45 to 54 Years | 1,778 (88.6%) | 1,655 (85.1%) |
| 55 to 64 Years | 2,174 (89.3%) | 2,253 (89.9%) |
| 65 to 74 Years | 1,779 (91.3%) | 1,879 (91.9%) |
| 75 Years and over | 1,062 (95.6%) | 1,270 (87.6%) |
| Total | 13,966 (88.2%) | 13,416 (85.5%) |
Income Below Poverty Among Married-Couple Families in Seneca County
The poverty statistics for married-couple families in Seneca County show that 4.7% or 291 of the total 6,201 families live below the poverty line. Families with 5 or more children have the highest poverty rate of 25.4%, comprising of 52 families. On the other hand, families with no children have the lowest poverty rate of 2.4%, which includes 95 families.
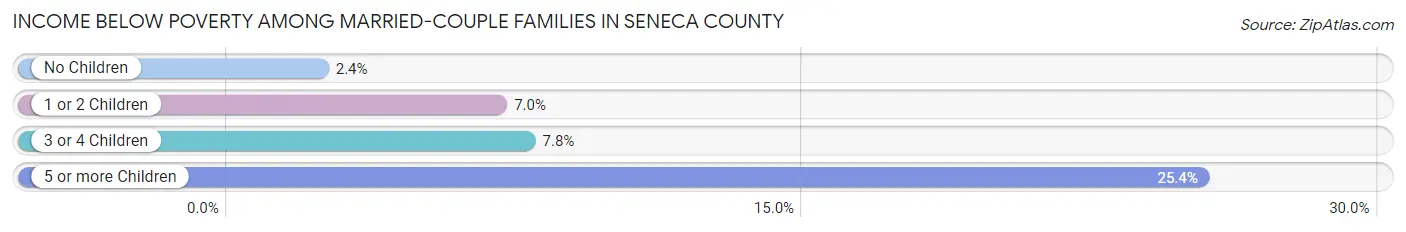
| Children | Above Poverty | Below Poverty |
| No Children | 3,913 (97.6%) | 95 (2.4%) |
| 1 or 2 Children | 1,322 (93.0%) | 100 (7.0%) |
| 3 or 4 Children | 522 (92.2%) | 44 (7.8%) |
| 5 or more Children | 153 (74.6%) | 52 (25.4%) |
| Total | 5,910 (95.3%) | 291 (4.7%) |
Income Below Poverty Among Single-Parent Households in Seneca County
According to the poverty data in Seneca County, 15.8% or 115 single-father households and 17.4% or 176 single-mother households are living below the poverty line. Among single-father households, those with 1 or 2 children have the highest poverty rate, with 95 households (25.1%) experiencing poverty. Likewise, among single-mother households, those with 5 or more children have the highest poverty rate, with 42 households (100.0%) falling below the poverty line.
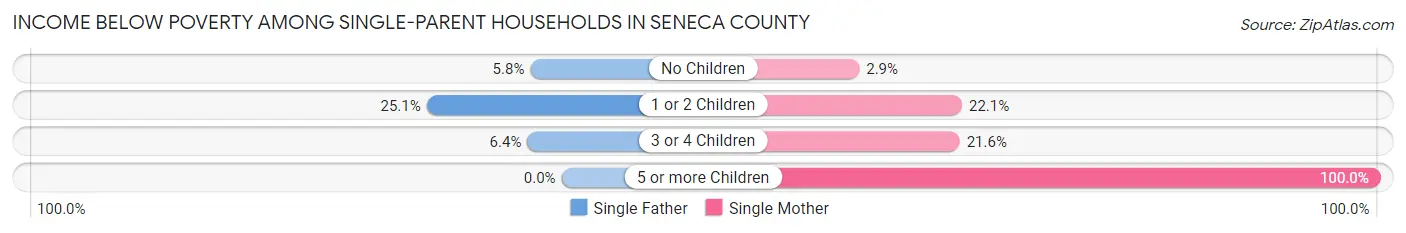
| Children | Single Father | Single Mother |
| No Children | 17 (5.8%) | 12 (2.9%) |
| 1 or 2 Children | 95 (25.1%) | 114 (22.1%) |
| 3 or 4 Children | 3 (6.4%) | 8 (21.6%) |
| 5 or more Children | 0 (0.0%) | 42 (100.0%) |
| Total | 115 (15.8%) | 176 (17.4%) |
Income Below Poverty Among Married-Couple vs Single-Parent Households in Seneca County
The poverty data for Seneca County shows that 291 of the married-couple family households (4.7%) and 291 of the single-parent households (16.7%) are living below the poverty level. Within the married-couple family households, those with 5 or more children have the highest poverty rate, with 52 households (25.4%) falling below the poverty line. Among the single-parent households, those with 5 or more children have the highest poverty rate, with 42 household (77.8%) living below poverty.
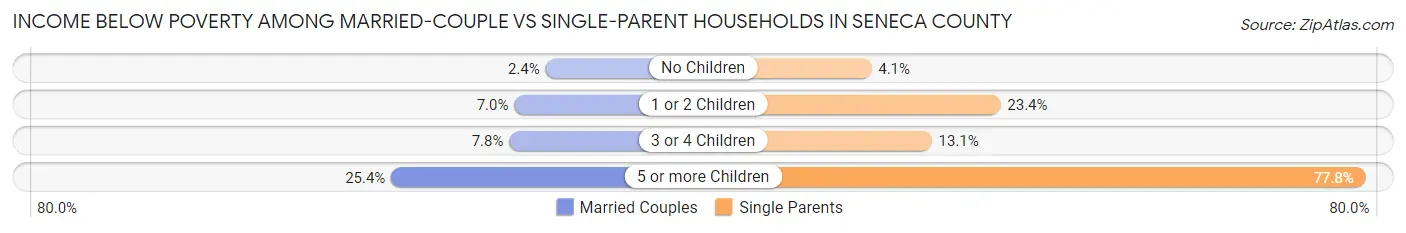
| Children | Married-Couple Families | Single-Parent Households |
| No Children | 95 (2.4%) | 29 (4.1%) |
| 1 or 2 Children | 100 (7.0%) | 209 (23.4%) |
| 3 or 4 Children | 44 (7.8%) | 11 (13.1%) |
| 5 or more Children | 52 (25.4%) | 42 (77.8%) |
| Total | 291 (4.7%) | 291 (16.7%) |
Race in Seneca County
The most populous races in Seneca County are White / Caucasian (30,133 | 89.5%), Black / African American (1,498 | 4.4%), and Two or more Races (1,288 | 3.8%).
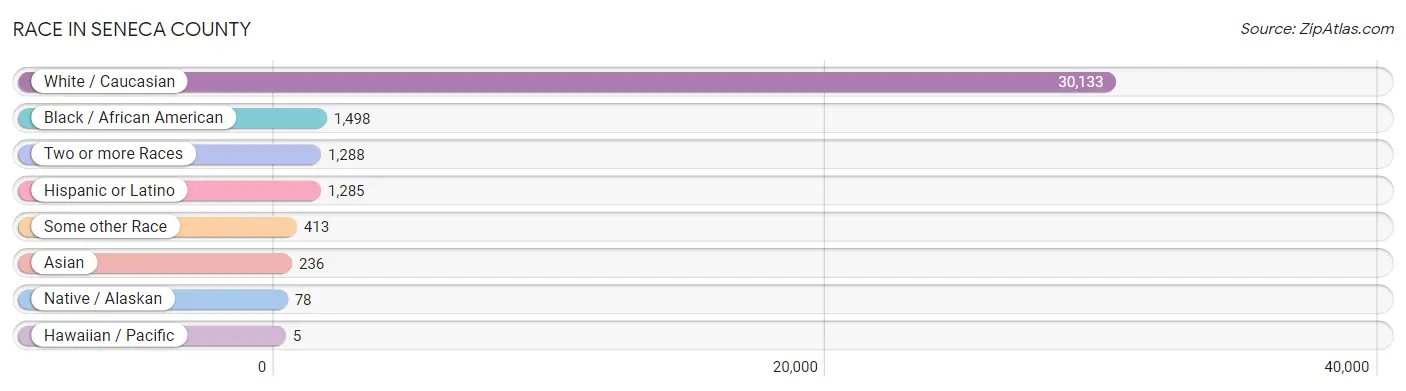
| Race | # Population | % Population |
| Asian | 236 | 0.7% |
| Black / African American | 1,498 | 4.4% |
| Hawaiian / Pacific | 5 | 0.0% |
| Hispanic or Latino | 1,285 | 3.8% |
| Native / Alaskan | 78 | 0.2% |
| White / Caucasian | 30,133 | 89.5% |
| Two or more Races | 1,288 | 3.8% |
| Some other Race | 413 | 1.2% |
| Total | 33,651 | 100.0% |
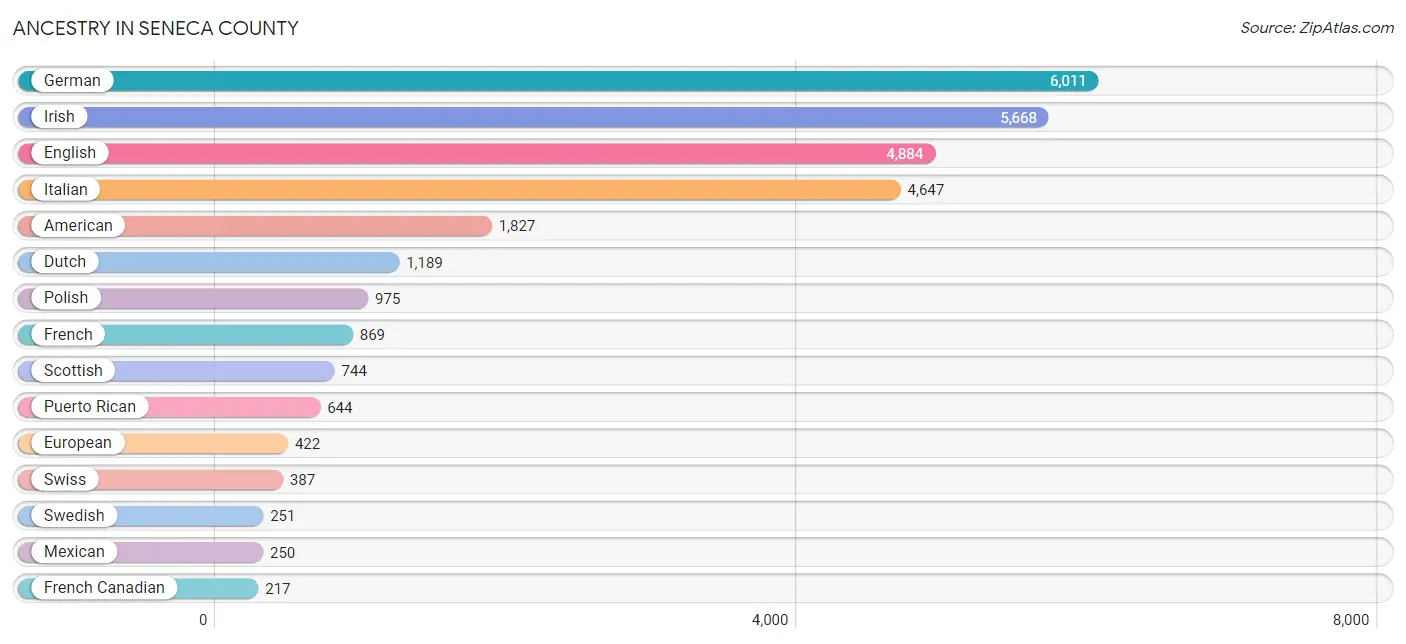
Ancestry in Seneca County
The most populous ancestries reported in Seneca County are German (6,011 | 17.9%), Irish (5,668 | 16.8%), English (4,884 | 14.5%), Italian (4,647 | 13.8%), and American (1,827 | 5.4%), together accounting for 68.4% of all Seneca County residents.
| Ancestry | # Population | % Population |
| African | 4 | 0.0% |
| Albanian | 41 | 0.1% |
| American | 1,827 | 5.4% |
| Arab | 102 | 0.3% |
| Armenian | 3 | 0.0% |
| Austrian | 45 | 0.1% |
| Belgian | 63 | 0.2% |
| Bhutanese | 21 | 0.1% |
| Blackfeet | 2 | 0.0% |
| Brazilian | 2 | 0.0% |
| British | 164 | 0.5% |
| Bulgarian | 51 | 0.2% |
| Burmese | 61 | 0.2% |
| Canadian | 98 | 0.3% |
| Celtic | 3 | 0.0% |
| Central American | 126 | 0.4% |
| Cherokee | 50 | 0.2% |
| Chippewa | 7 | 0.0% |
| Colombian | 26 | 0.1% |
| Croatian | 23 | 0.1% |
| Cuban | 34 | 0.1% |
| Czech | 64 | 0.2% |
| Czechoslovakian | 7 | 0.0% |
| Danish | 215 | 0.6% |
| Dominican | 36 | 0.1% |
| Dutch | 1,189 | 3.5% |
| Eastern European | 34 | 0.1% |
| Ecuadorian | 8 | 0.0% |
| English | 4,884 | 14.5% |
| European | 422 | 1.3% |
| Filipino | 2 | 0.0% |
| Finnish | 106 | 0.3% |
| French | 869 | 2.6% |
| French Canadian | 217 | 0.6% |
| German | 6,011 | 17.9% |
| Greek | 125 | 0.4% |
| Guamanian / Chamorro | 32 | 0.1% |
| Guyanese | 31 | 0.1% |
| Haitian | 15 | 0.0% |
| Hungarian | 89 | 0.3% |
| Indian (Asian) | 65 | 0.2% |
| Irish | 5,668 | 16.8% |
| Iroquois | 63 | 0.2% |
| Italian | 4,647 | 13.8% |
| Jamaican | 39 | 0.1% |
| Korean | 104 | 0.3% |
| Latvian | 7 | 0.0% |
| Lebanese | 52 | 0.2% |
| Lithuanian | 87 | 0.3% |
| Mexican | 250 | 0.7% |
| Mexican American Indian | 2 | 0.0% |
| Native Hawaiian | 2 | 0.0% |
| Nicaraguan | 1 | 0.0% |
| Northern European | 66 | 0.2% |
| Norwegian | 103 | 0.3% |
| Okinawan | 6 | 0.0% |
| Panamanian | 120 | 0.4% |
| Pennsylvania German | 145 | 0.4% |
| Peruvian | 12 | 0.0% |
| Polish | 975 | 2.9% |
| Portuguese | 11 | 0.0% |
| Puerto Rican | 644 | 1.9% |
| Russian | 113 | 0.3% |
| Salvadoran | 5 | 0.0% |
| Scandinavian | 28 | 0.1% |
| Scotch-Irish | 182 | 0.5% |
| Scottish | 744 | 2.2% |
| Seminole | 9 | 0.0% |
| Serbian | 2 | 0.0% |
| Sioux | 1 | 0.0% |
| Slavic | 27 | 0.1% |
| Slovak | 71 | 0.2% |
| Slovene | 2 | 0.0% |
| South African | 9 | 0.0% |
| South American | 46 | 0.1% |
| Spanish | 10 | 0.0% |
| Subsaharan African | 13 | 0.0% |
| Swedish | 251 | 0.7% |
| Swiss | 387 | 1.1% |
| Syrian | 49 | 0.2% |
| Thai | 121 | 0.4% |
| Tongan | 3 | 0.0% |
| Trinidadian and Tobagonian | 1 | 0.0% |
| Ukrainian | 143 | 0.4% |
| Ute | 4 | 0.0% |
| Welsh | 205 | 0.6% |
| West Indian | 15 | 0.0% | View All 87 Rows |
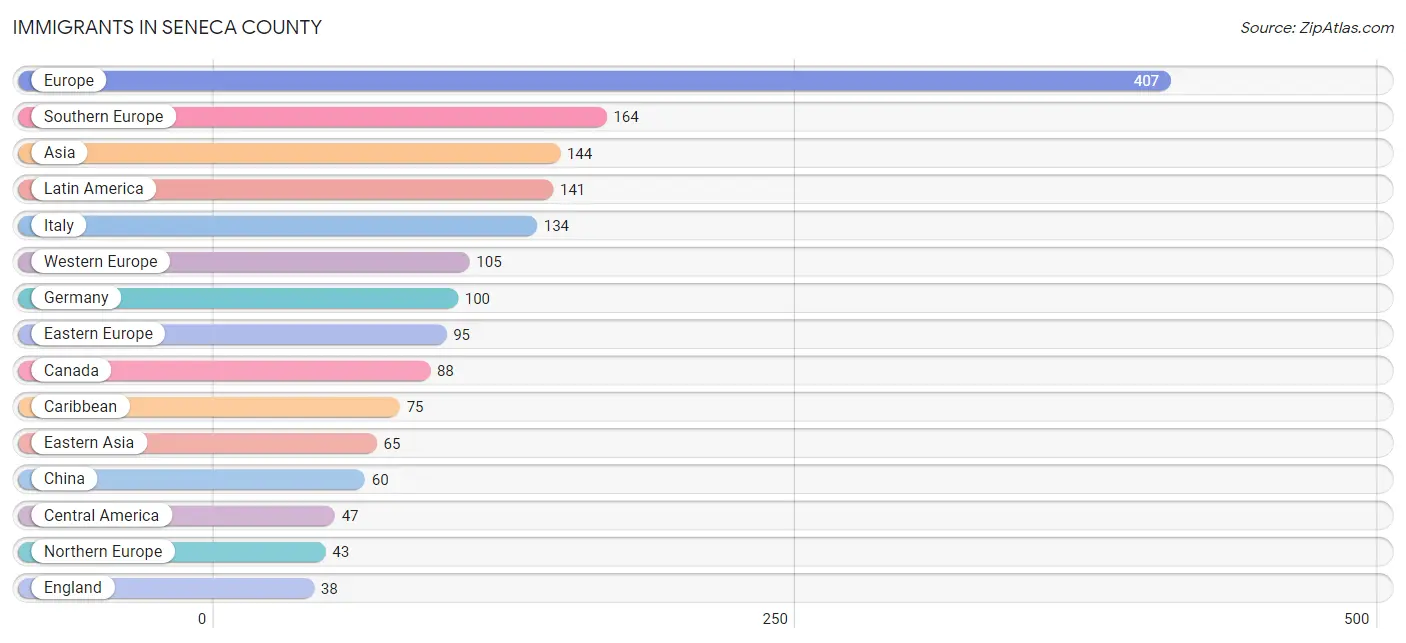
Immigrants in Seneca County
The most numerous immigrant groups reported in Seneca County came from Europe (407 | 1.2%), Southern Europe (164 | 0.5%), Asia (144 | 0.4%), Latin America (141 | 0.4%), and Italy (134 | 0.4%), together accounting for 2.9% of all Seneca County residents.
| Immigration Origin | # Population | % Population |
| Africa | 15 | 0.0% |
| Albania | 29 | 0.1% |
| Asia | 144 | 0.4% |
| Brazil | 2 | 0.0% |
| Bulgaria | 7 | 0.0% |
| Canada | 88 | 0.3% |
| Caribbean | 75 | 0.2% |
| Central America | 47 | 0.1% |
| China | 60 | 0.2% |
| Colombia | 2 | 0.0% |
| Cuba | 17 | 0.1% |
| Czechoslovakia | 5 | 0.0% |
| Dominican Republic | 17 | 0.1% |
| Eastern Africa | 13 | 0.0% |
| Eastern Asia | 65 | 0.2% |
| Eastern Europe | 95 | 0.3% |
| El Salvador | 5 | 0.0% |
| England | 38 | 0.1% |
| Europe | 407 | 1.2% |
| France | 5 | 0.0% |
| Germany | 100 | 0.3% |
| Greece | 16 | 0.1% |
| Guyana | 3 | 0.0% |
| Haiti | 14 | 0.0% |
| India | 34 | 0.1% |
| Iraq | 7 | 0.0% |
| Italy | 134 | 0.4% |
| Jamaica | 16 | 0.1% |
| Japan | 2 | 0.0% |
| Kenya | 13 | 0.0% |
| Korea | 3 | 0.0% |
| Latin America | 141 | 0.4% |
| Mexico | 29 | 0.1% |
| Northern Europe | 43 | 0.1% |
| Panama | 13 | 0.0% |
| Peru | 12 | 0.0% |
| Philippines | 25 | 0.1% |
| Poland | 6 | 0.0% |
| Russia | 38 | 0.1% |
| Serbia | 2 | 0.0% |
| South Africa | 2 | 0.0% |
| South America | 19 | 0.1% |
| South Central Asia | 34 | 0.1% |
| South Eastern Asia | 25 | 0.1% |
| Southern Europe | 164 | 0.5% |
| Spain | 14 | 0.0% |
| Taiwan | 2 | 0.0% |
| Trinidad and Tobago | 1 | 0.0% |
| Ukraine | 2 | 0.0% |
| Western Asia | 20 | 0.1% |
| Western Europe | 105 | 0.3% | View All 51 Rows |
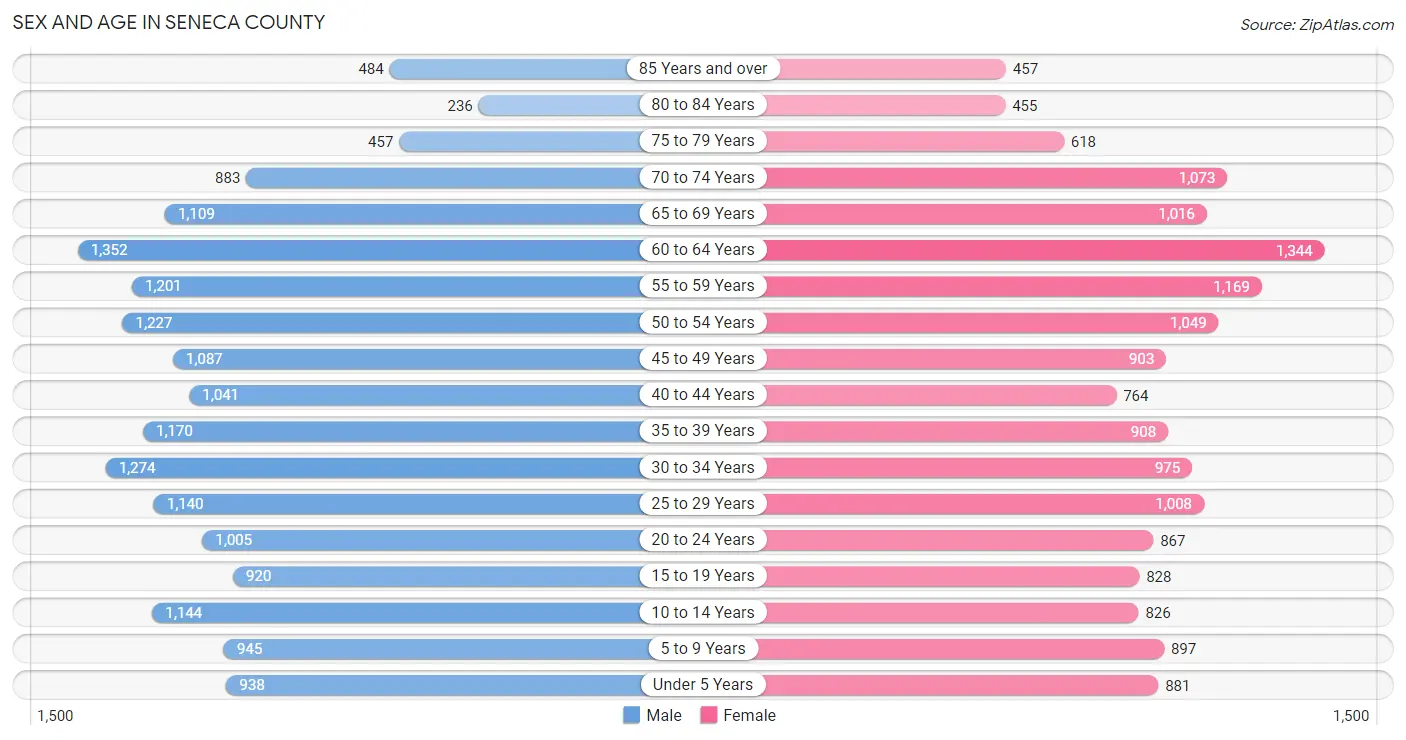
Sex and Age in Seneca County
Sex and Age in Seneca County
The most populous age groups in Seneca County are 60 to 64 Years (1,352 | 7.7%) for men and 60 to 64 Years (1,344 | 8.4%) for women.
| Age Bracket | Male | Female |
| Under 5 Years | 938 (5.3%) | 881 (5.5%) |
| 5 to 9 Years | 945 (5.4%) | 897 (5.6%) |
| 10 to 14 Years | 1,144 (6.5%) | 826 (5.1%) |
| 15 to 19 Years | 920 (5.2%) | 828 (5.2%) |
| 20 to 24 Years | 1,005 (5.7%) | 867 (5.4%) |
| 25 to 29 Years | 1,140 (6.5%) | 1,008 (6.3%) |
| 30 to 34 Years | 1,274 (7.2%) | 975 (6.1%) |
| 35 to 39 Years | 1,170 (6.6%) | 908 (5.7%) |
| 40 to 44 Years | 1,041 (5.9%) | 764 (4.8%) |
| 45 to 49 Years | 1,087 (6.2%) | 903 (5.6%) |
| 50 to 54 Years | 1,227 (7.0%) | 1,049 (6.5%) |
| 55 to 59 Years | 1,201 (6.8%) | 1,169 (7.3%) |
| 60 to 64 Years | 1,352 (7.7%) | 1,344 (8.4%) |
| 65 to 69 Years | 1,109 (6.3%) | 1,016 (6.3%) |
| 70 to 74 Years | 883 (5.0%) | 1,073 (6.7%) |
| 75 to 79 Years | 457 (2.6%) | 618 (3.8%) |
| 80 to 84 Years | 236 (1.3%) | 455 (2.8%) |
| 85 Years and over | 484 (2.8%) | 457 (2.9%) |
| Total | 17,613 (100.0%) | 16,038 (100.0%) |
Families and Households in Seneca County
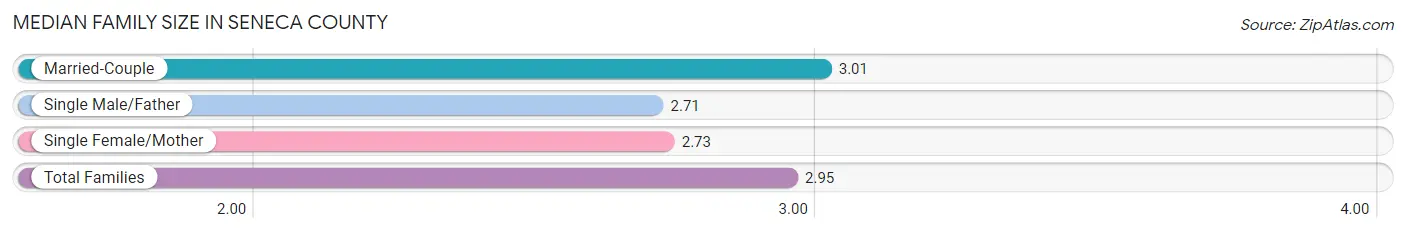
Median Family Size in Seneca County
The median family size in Seneca County is 2.95 persons per family, with married-couple families (6,201 | 78.1%) accounting for the largest median family size of 3.01 persons per family. On the other hand, single male/father families (729 | 9.2%) represent the smallest median family size with 2.71 persons per family.
| Family Type | # Families | Family Size |
| Married-Couple | 6,201 (78.1%) | 3.01 |
| Single Male/Father | 729 (9.2%) | 2.71 |
| Single Female/Mother | 1,009 (12.7%) | 2.73 |
| Total Families | 7,939 (100.0%) | 2.95 |
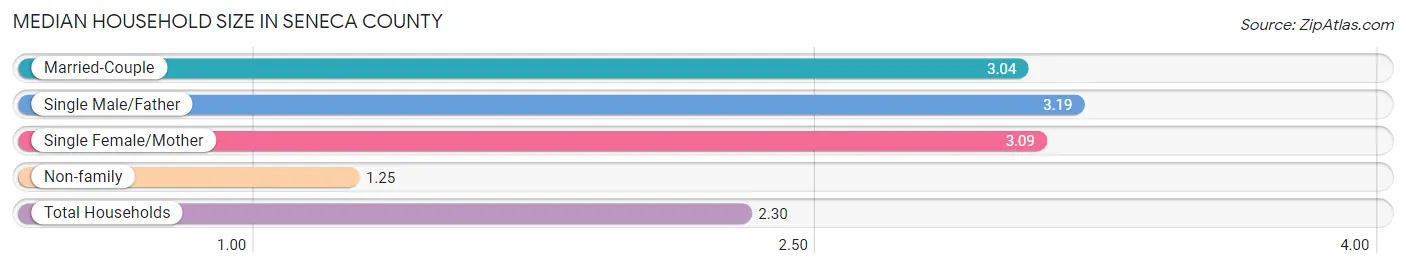
Median Household Size in Seneca County
The median household size in Seneca County is 2.30 persons per household, with single male/father households (729 | 5.3%) accounting for the largest median household size of 3.19 persons per household. non-family households (5,683 | 41.7%) represent the smallest median household size with 1.25 persons per household.
| Household Type | # Households | Household Size |
| Married-Couple | 6,201 (45.5%) | 3.04 |
| Single Male/Father | 729 (5.3%) | 3.19 |
| Single Female/Mother | 1,009 (7.4%) | 3.09 |
| Non-family | 5,683 (41.7%) | 1.25 |
| Total Households | 13,622 (100.0%) | 2.30 |
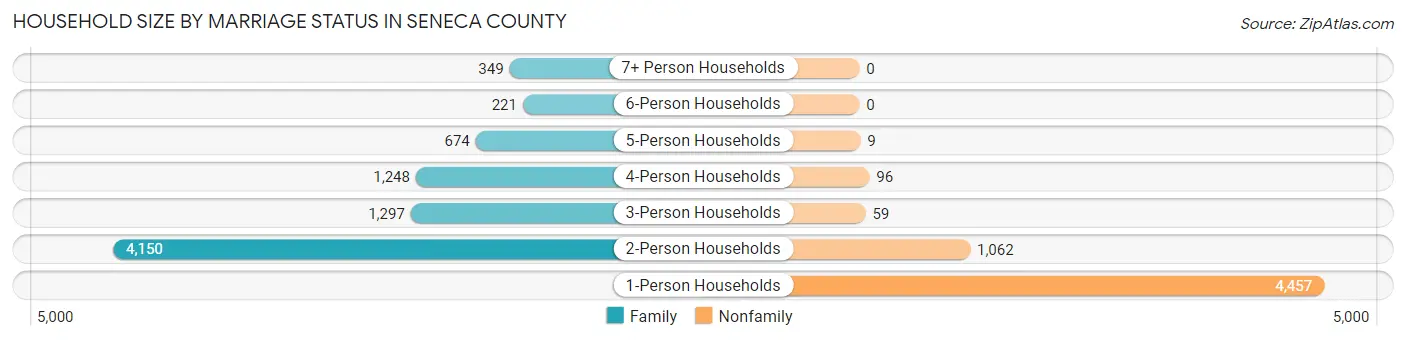
Household Size by Marriage Status in Seneca County
Out of a total of 13,622 households in Seneca County, 7,939 (58.3%) are family households, while 5,683 (41.7%) are nonfamily households. The most numerous type of family households are 2-person households, comprising 4,150, and the most common type of nonfamily households are 1-person households, comprising 4,457.
| Household Size | Family Households | Nonfamily Households |
| 1-Person Households | - | 4,457 (32.7%) |
| 2-Person Households | 4,150 (30.5%) | 1,062 (7.8%) |
| 3-Person Households | 1,297 (9.5%) | 59 (0.4%) |
| 4-Person Households | 1,248 (9.2%) | 96 (0.7%) |
| 5-Person Households | 674 (5.0%) | 9 (0.1%) |
| 6-Person Households | 221 (1.6%) | 0 (0.0%) |
| 7+ Person Households | 349 (2.6%) | 0 (0.0%) |
| Total | 7,939 (58.3%) | 5,683 (41.7%) |
Female Fertility in Seneca County
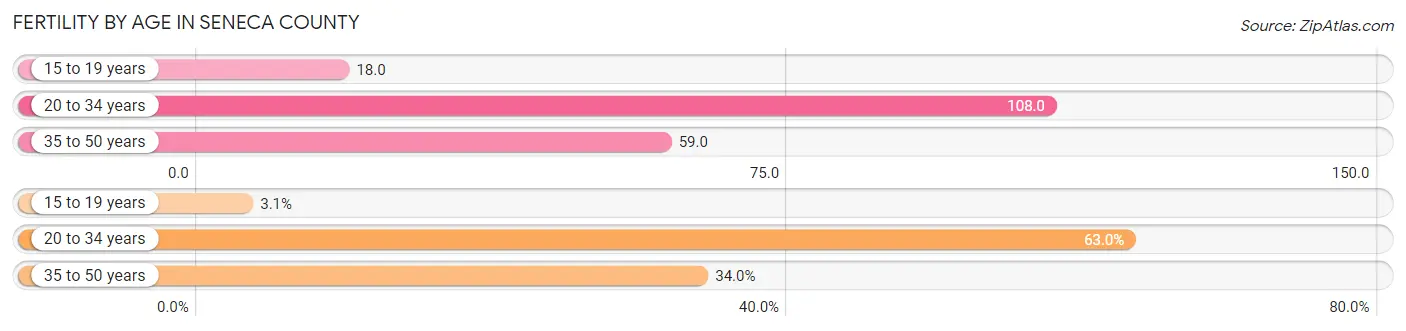
Fertility by Age in Seneca County
Average fertility rate in Seneca County is 75.0 births per 1,000 women. Women in the age bracket of 20 to 34 years have the highest fertility rate with 108.0 births per 1,000 women. Women in the age bracket of 20 to 34 years acount for 63.0% of all women with births.
| Age Bracket | Women with Births | Births / 1,000 Women |
| 15 to 19 years | 15 (3.1%) | 18.0 |
| 20 to 34 years | 308 (63.0%) | 108.0 |
| 35 to 50 years | 166 (34.0%) | 59.0 |
| Total | 489 (100.0%) | 75.0 |
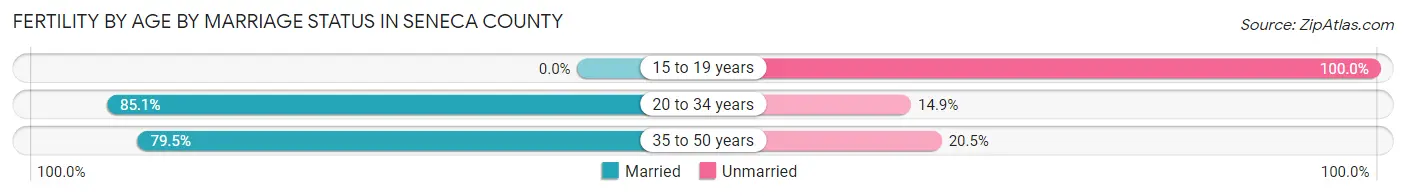
Fertility by Age by Marriage Status in Seneca County
80.6% of women with births (489) in Seneca County are married. The highest percentage of unmarried women with births falls into 15 to 19 years age bracket with 100.0% of them unmarried at the time of birth, while the lowest percentage of unmarried women with births belong to 20 to 34 years age bracket with 14.9% of them unmarried.
| Age Bracket | Married | Unmarried |
| 15 to 19 years | 0 (0.0%) | 15 (100.0%) |
| 20 to 34 years | 262 (85.1%) | 46 (14.9%) |
| 35 to 50 years | 132 (79.5%) | 34 (20.5%) |
| Total | 394 (80.6%) | 95 (19.4%) |
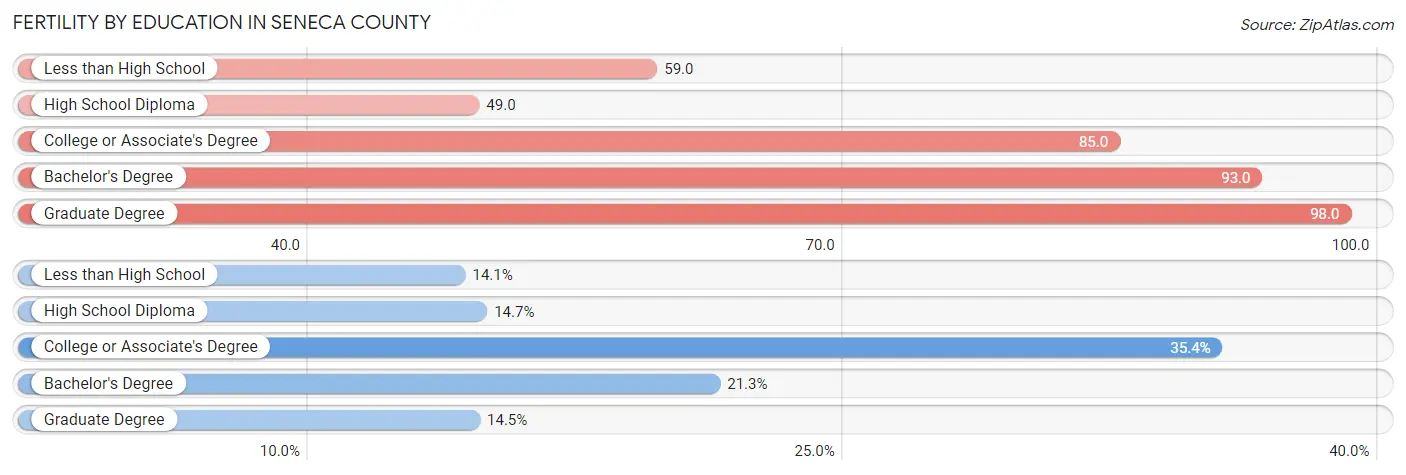
Fertility by Education in Seneca County
Average fertility rate in Seneca County is 75.0 births per 1,000 women. Women with the education attainment of graduate degree have the highest fertility rate of 98.0 births per 1,000 women, while women with the education attainment of high school diploma have the lowest fertility at 49.0 births per 1,000 women. Women with the education attainment of college or associate's degree represent 35.4% of all women with births.
| Educational Attainment | Women with Births | Births / 1,000 Women |
| Less than High School | 69 (14.1%) | 59.0 |
| High School Diploma | 72 (14.7%) | 49.0 |
| College or Associate's Degree | 173 (35.4%) | 85.0 |
| Bachelor's Degree | 104 (21.3%) | 93.0 |
| Graduate Degree | 71 (14.5%) | 98.0 |
| Total | 489 (100.0%) | 75.0 |
Fertility by Education by Marriage Status in Seneca County
19.4% of women with births in Seneca County are unmarried. Women with the educational attainment of bachelor's degree are most likely to be married with 98.1% of them married at childbirth, while women with the educational attainment of college or associate's degree are least likely to be married with 40.5% of them unmarried at childbirth.
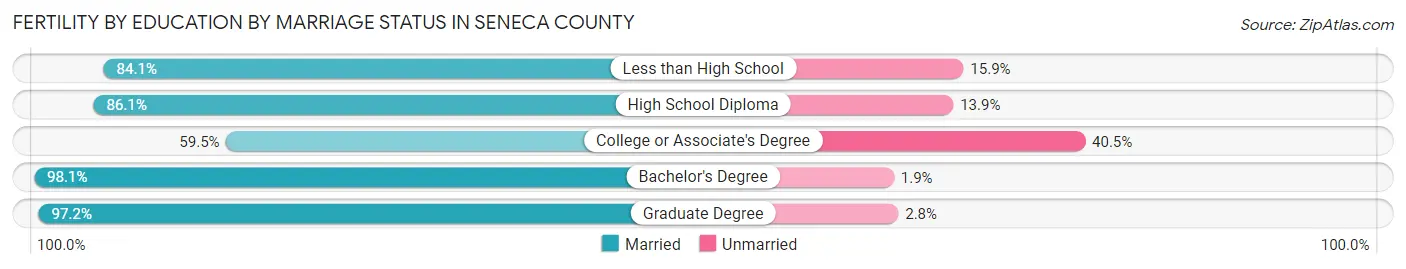
| Educational Attainment | Married | Unmarried |
| Less than High School | 58 (84.1%) | 11 (15.9%) |
| High School Diploma | 62 (86.1%) | 10 (13.9%) |
| College or Associate's Degree | 103 (59.5%) | 70 (40.5%) |
| Bachelor's Degree | 102 (98.1%) | 2 (1.9%) |
| Graduate Degree | 69 (97.2%) | 2 (2.8%) |
| Total | 394 (80.6%) | 95 (19.4%) |
Employment Characteristics in Seneca County
Employment by Class of Employer in Seneca County
Among the 14,480 employed individuals in Seneca County, private company employees (8,238 | 56.9%), not-for-profit organizations (1,907 | 13.2%), and local government employees (1,519 | 10.5%) make up the most common classes of employment.
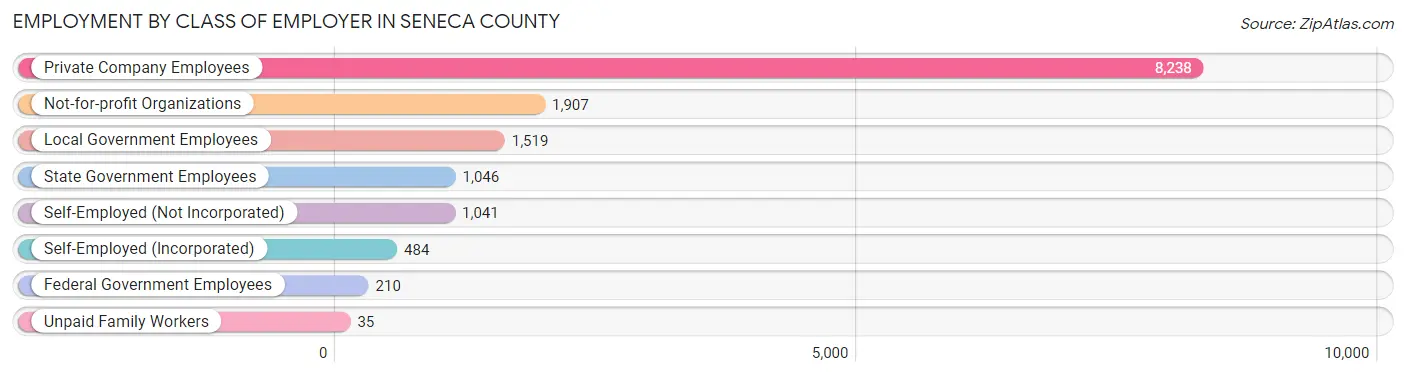
| Employer Class | # Employees | % Employees |
| Private Company Employees | 8,238 | 56.9% |
| Self-Employed (Incorporated) | 484 | 3.3% |
| Self-Employed (Not Incorporated) | 1,041 | 7.2% |
| Not-for-profit Organizations | 1,907 | 13.2% |
| Local Government Employees | 1,519 | 10.5% |
| State Government Employees | 1,046 | 7.2% |
| Federal Government Employees | 210 | 1.5% |
| Unpaid Family Workers | 35 | 0.2% |
| Total | 14,480 | 100.0% |
Employment Status by Age in Seneca County
According to the labor force statistics for Seneca County, out of the total population over 16 years of age (27,573), 56.7% or 15,634 individuals are in the labor force, with 4.5% or 704 of them unemployed. The age group with the highest labor force participation rate is 25 to 29 years, with 78.2% or 1,680 individuals in the labor force. Within the labor force, the 16 to 19 years age range has the highest percentage of unemployed individuals, with 6.7% or 47 of them being unemployed.
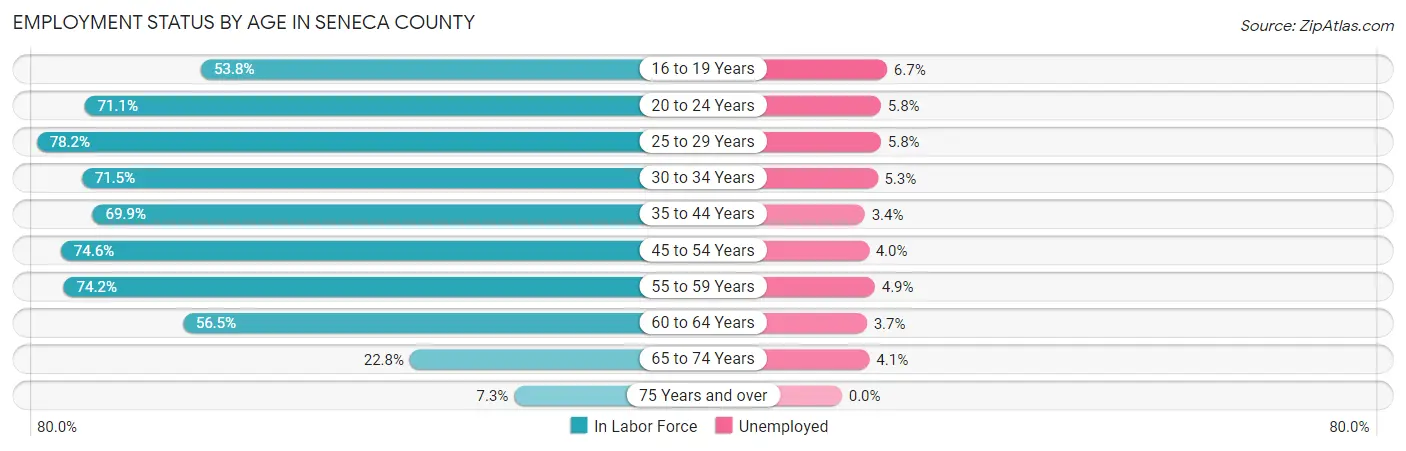
| Age Bracket | In Labor Force | Unemployed |
| 16 to 19 Years | 700 (53.8%) | 47 (6.7%) |
| 20 to 24 Years | 1,331 (71.1%) | 77 (5.8%) |
| 25 to 29 Years | 1,680 (78.2%) | 97 (5.8%) |
| 30 to 34 Years | 1,608 (71.5%) | 85 (5.3%) |
| 35 to 44 Years | 2,714 (69.9%) | 92 (3.4%) |
| 45 to 54 Years | 3,182 (74.6%) | 127 (4.0%) |
| 55 to 59 Years | 1,759 (74.2%) | 86 (4.9%) |
| 60 to 64 Years | 1,523 (56.5%) | 56 (3.7%) |
| 65 to 74 Years | 930 (22.8%) | 38 (4.1%) |
| 75 Years and over | 198 (7.3%) | 0 (0.0%) |
| Total | 15,634 (56.7%) | 704 (4.5%) |
Employment Status by Educational Attainment in Seneca County
According to labor force statistics for Seneca County, 70.8% of individuals (12,469) out of the total population between 25 and 64 years of age (17,612) are in the labor force, with 4.4% or 549 of them being unemployed. The group with the highest labor force participation rate are those with the educational attainment of bachelor's degree or higher, with 85.5% or 3,307 individuals in the labor force. Within the labor force, individuals with less than high school education have the highest percentage of unemployment, with 7.5% or 81 of them being unemployed.
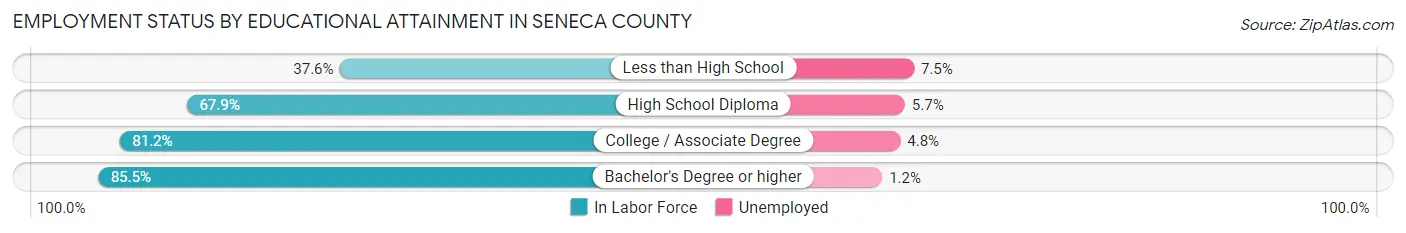
| Educational Attainment | In Labor Force | Unemployed |
| Less than High School | 1,074 (37.6%) | 214 (7.5%) |
| High School Diploma | 3,874 (67.9%) | 325 (5.7%) |
| College / Associate Degree | 4,209 (81.2%) | 249 (4.8%) |
| Bachelor's Degree or higher | 3,307 (85.5%) | 46 (1.2%) |
| Total | 12,469 (70.8%) | 775 (4.4%) |
Employment Occupations by Sex in Seneca County
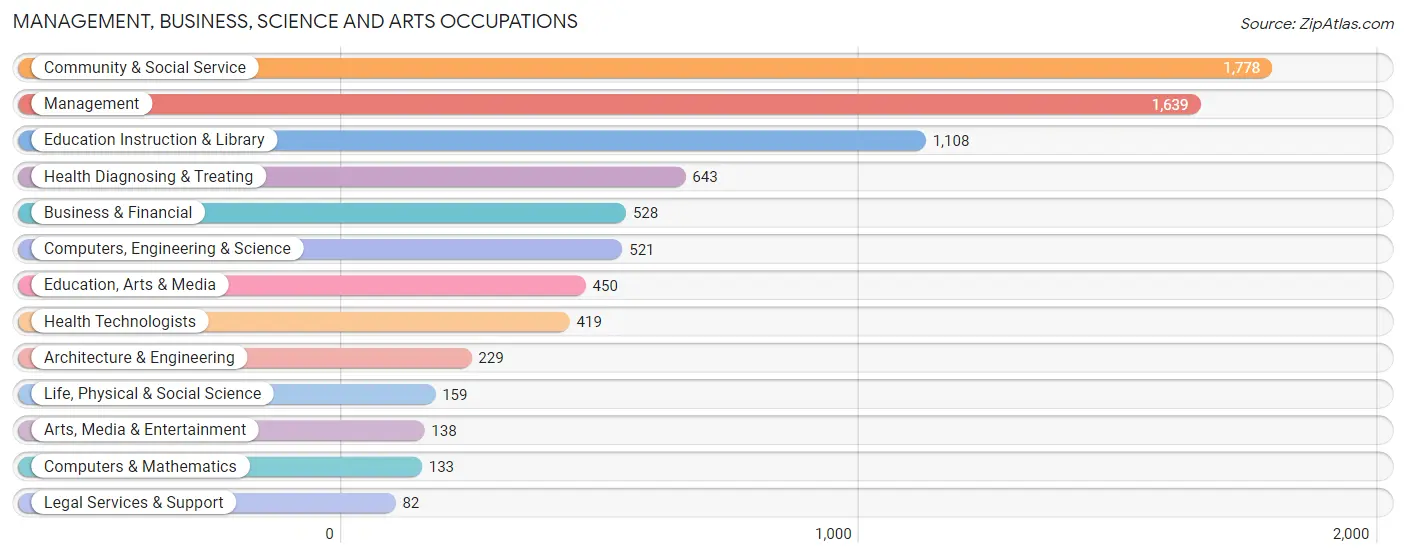
Management, Business, Science and Arts Occupations
The most common Management, Business, Science and Arts occupations in Seneca County are Community & Social Service (1,778 | 11.9%), Management (1,639 | 11.0%), Education Instruction & Library (1,108 | 7.4%), Health Diagnosing & Treating (643 | 4.3%), and Business & Financial (528 | 3.5%).
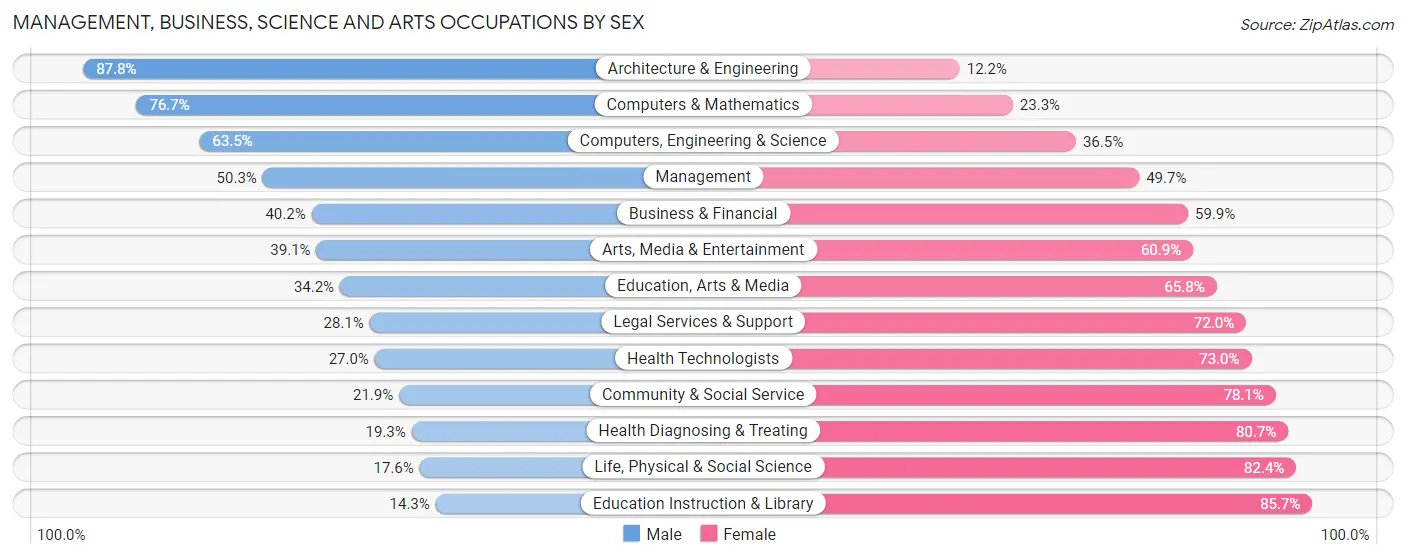
Management, Business, Science and Arts Occupations by Sex
Within the Management, Business, Science and Arts occupations in Seneca County, the most male-oriented occupations are Architecture & Engineering (87.8%), Computers & Mathematics (76.7%), and Computers, Engineering & Science (63.5%), while the most female-oriented occupations are Education Instruction & Library (85.7%), Life, Physical & Social Science (82.4%), and Health Diagnosing & Treating (80.7%).
| Occupation | Male | Female |
| Management | 825 (50.3%) | 814 (49.7%) |
| Business & Financial | 212 (40.2%) | 316 (59.9%) |
| Computers, Engineering & Science | 331 (63.5%) | 190 (36.5%) |
| Computers & Mathematics | 102 (76.7%) | 31 (23.3%) |
| Architecture & Engineering | 201 (87.8%) | 28 (12.2%) |
| Life, Physical & Social Science | 28 (17.6%) | 131 (82.4%) |
| Community & Social Service | 389 (21.9%) | 1,389 (78.1%) |
| Education, Arts & Media | 154 (34.2%) | 296 (65.8%) |
| Legal Services & Support | 23 (28.1%) | 59 (72.0%) |
| Education Instruction & Library | 158 (14.3%) | 950 (85.7%) |
| Arts, Media & Entertainment | 54 (39.1%) | 84 (60.9%) |
| Health Diagnosing & Treating | 124 (19.3%) | 519 (80.7%) |
| Health Technologists | 113 (27.0%) | 306 (73.0%) |
| Total (Category) | 1,881 (36.8%) | 3,228 (63.2%) |
| Total (Overall) | 7,656 (51.3%) | 7,264 (48.7%) |
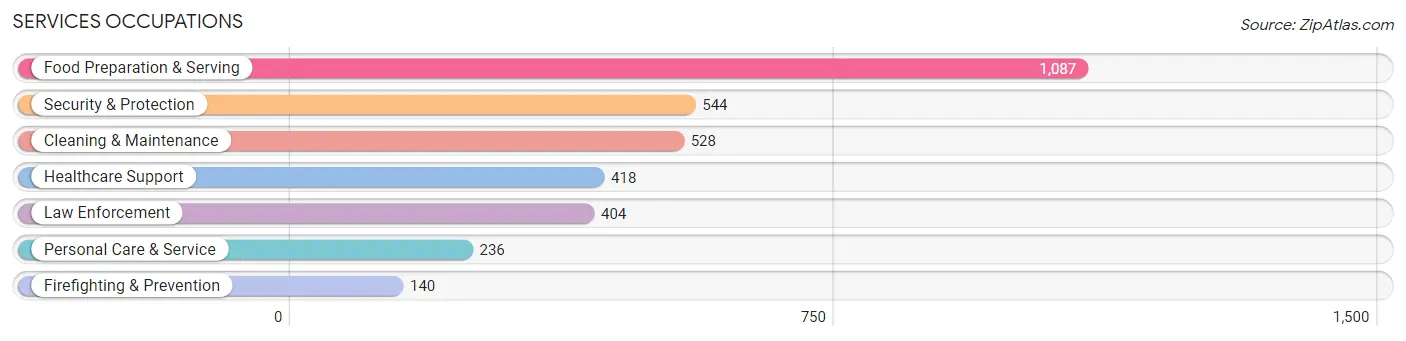
Services Occupations
The most common Services occupations in Seneca County are Food Preparation & Serving (1,087 | 7.3%), Security & Protection (544 | 3.6%), Cleaning & Maintenance (528 | 3.5%), Healthcare Support (418 | 2.8%), and Law Enforcement (404 | 2.7%).
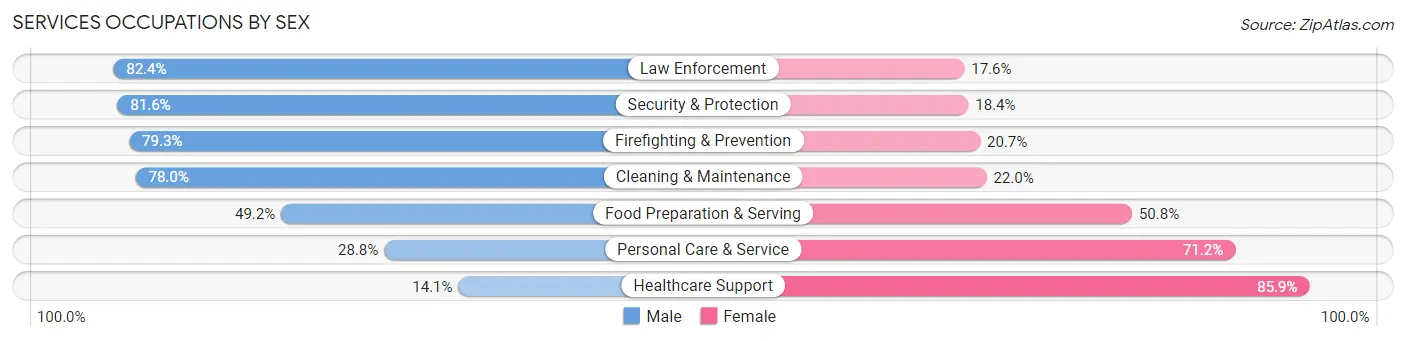
Services Occupations by Sex
Within the Services occupations in Seneca County, the most male-oriented occupations are Law Enforcement (82.4%), Security & Protection (81.6%), and Firefighting & Prevention (79.3%), while the most female-oriented occupations are Healthcare Support (85.9%), Personal Care & Service (71.2%), and Food Preparation & Serving (50.8%).
| Occupation | Male | Female |
| Healthcare Support | 59 (14.1%) | 359 (85.9%) |
| Security & Protection | 444 (81.6%) | 100 (18.4%) |
| Firefighting & Prevention | 111 (79.3%) | 29 (20.7%) |
| Law Enforcement | 333 (82.4%) | 71 (17.6%) |
| Food Preparation & Serving | 535 (49.2%) | 552 (50.8%) |
| Cleaning & Maintenance | 412 (78.0%) | 116 (22.0%) |
| Personal Care & Service | 68 (28.8%) | 168 (71.2%) |
| Total (Category) | 1,518 (54.0%) | 1,295 (46.0%) |
| Total (Overall) | 7,656 (51.3%) | 7,264 (48.7%) |
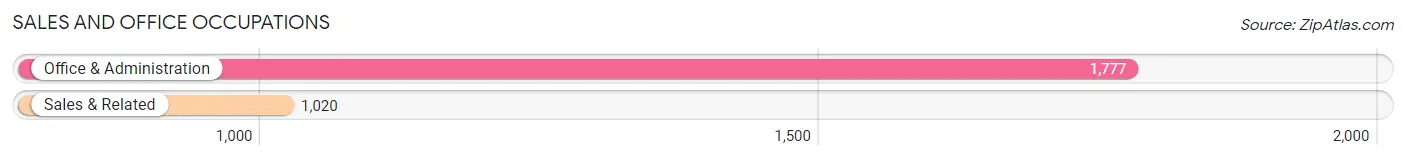
Sales and Office Occupations
The most common Sales and Office occupations in Seneca County are Office & Administration (1,777 | 11.9%), and Sales & Related (1,020 | 6.8%).
Sales and Office Occupations by Sex
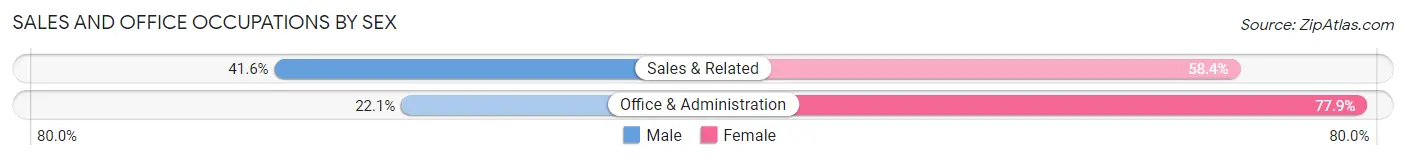
| Occupation | Male | Female |
| Sales & Related | 424 (41.6%) | 596 (58.4%) |
| Office & Administration | 392 (22.1%) | 1,385 (77.9%) |
| Total (Category) | 816 (29.2%) | 1,981 (70.8%) |
| Total (Overall) | 7,656 (51.3%) | 7,264 (48.7%) |
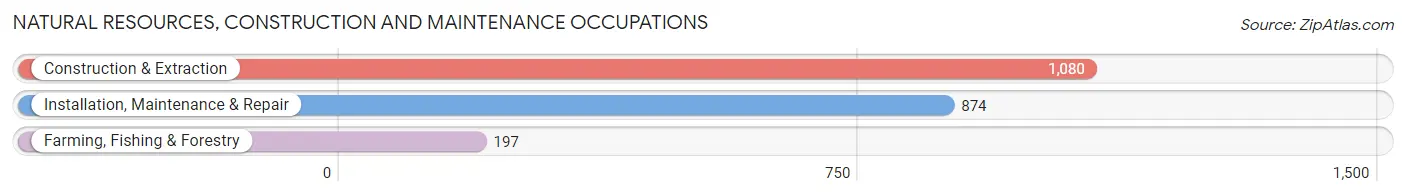
Natural Resources, Construction and Maintenance Occupations
The most common Natural Resources, Construction and Maintenance occupations in Seneca County are Construction & Extraction (1,080 | 7.2%), Installation, Maintenance & Repair (874 | 5.9%), and Farming, Fishing & Forestry (197 | 1.3%).
Natural Resources, Construction and Maintenance Occupations by Sex
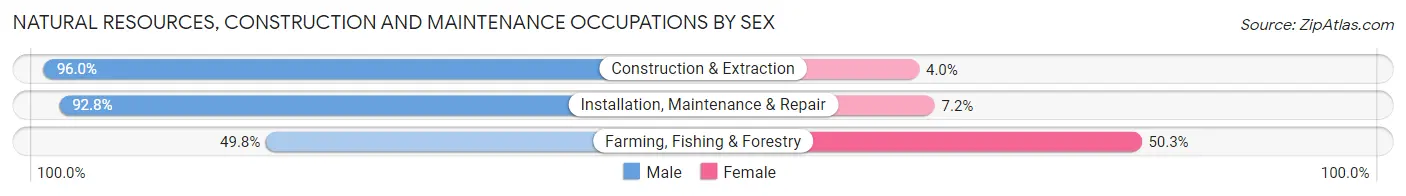
| Occupation | Male | Female |
| Farming, Fishing & Forestry | 98 (49.7%) | 99 (50.2%) |
| Construction & Extraction | 1,037 (96.0%) | 43 (4.0%) |
| Installation, Maintenance & Repair | 811 (92.8%) | 63 (7.2%) |
| Total (Category) | 1,946 (90.5%) | 205 (9.5%) |
| Total (Overall) | 7,656 (51.3%) | 7,264 (48.7%) |
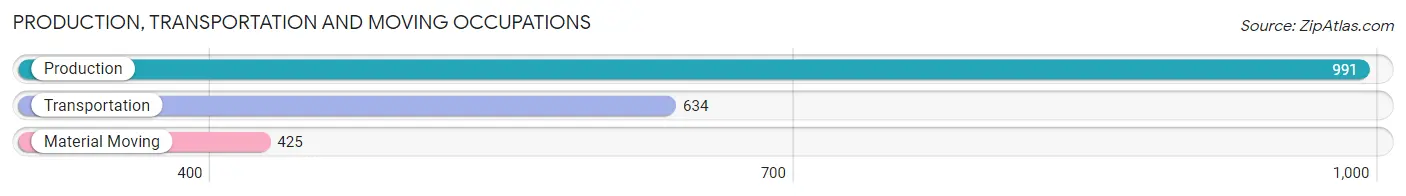
Production, Transportation and Moving Occupations
The most common Production, Transportation and Moving occupations in Seneca County are Production (991 | 6.6%), Transportation (634 | 4.3%), and Material Moving (425 | 2.9%).
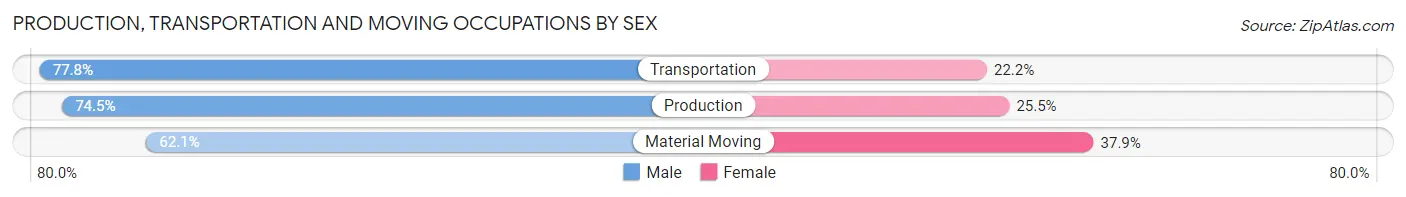
Production, Transportation and Moving Occupations by Sex
| Occupation | Male | Female |
| Production | 738 (74.5%) | 253 (25.5%) |
| Transportation | 493 (77.8%) | 141 (22.2%) |
| Material Moving | 264 (62.1%) | 161 (37.9%) |
| Total (Category) | 1,495 (72.9%) | 555 (27.1%) |
| Total (Overall) | 7,656 (51.3%) | 7,264 (48.7%) |
Employment Industries by Sex in Seneca County
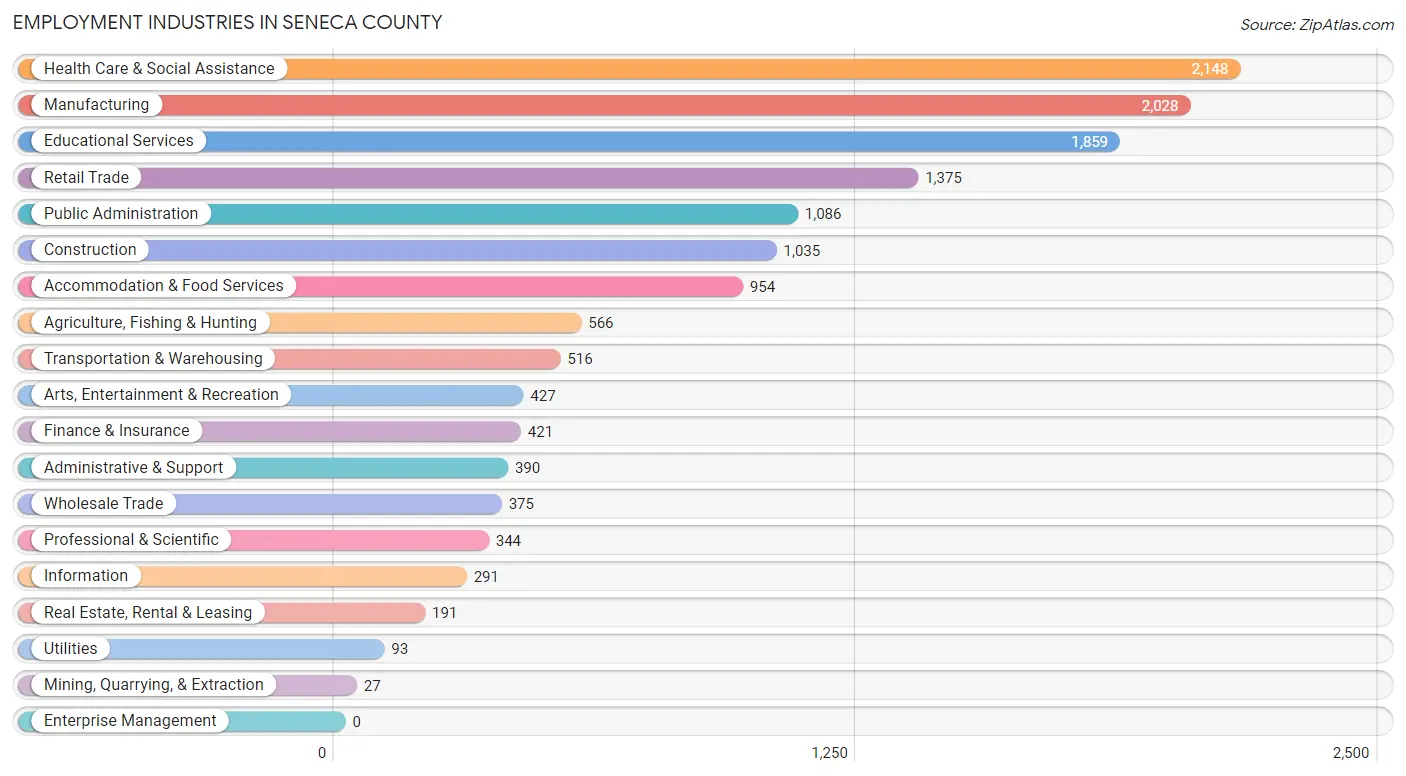
Employment Industries in Seneca County
The major employment industries in Seneca County include Health Care & Social Assistance (2,148 | 14.4%), Manufacturing (2,028 | 13.6%), Educational Services (1,859 | 12.5%), Retail Trade (1,375 | 9.2%), and Public Administration (1,086 | 7.3%).
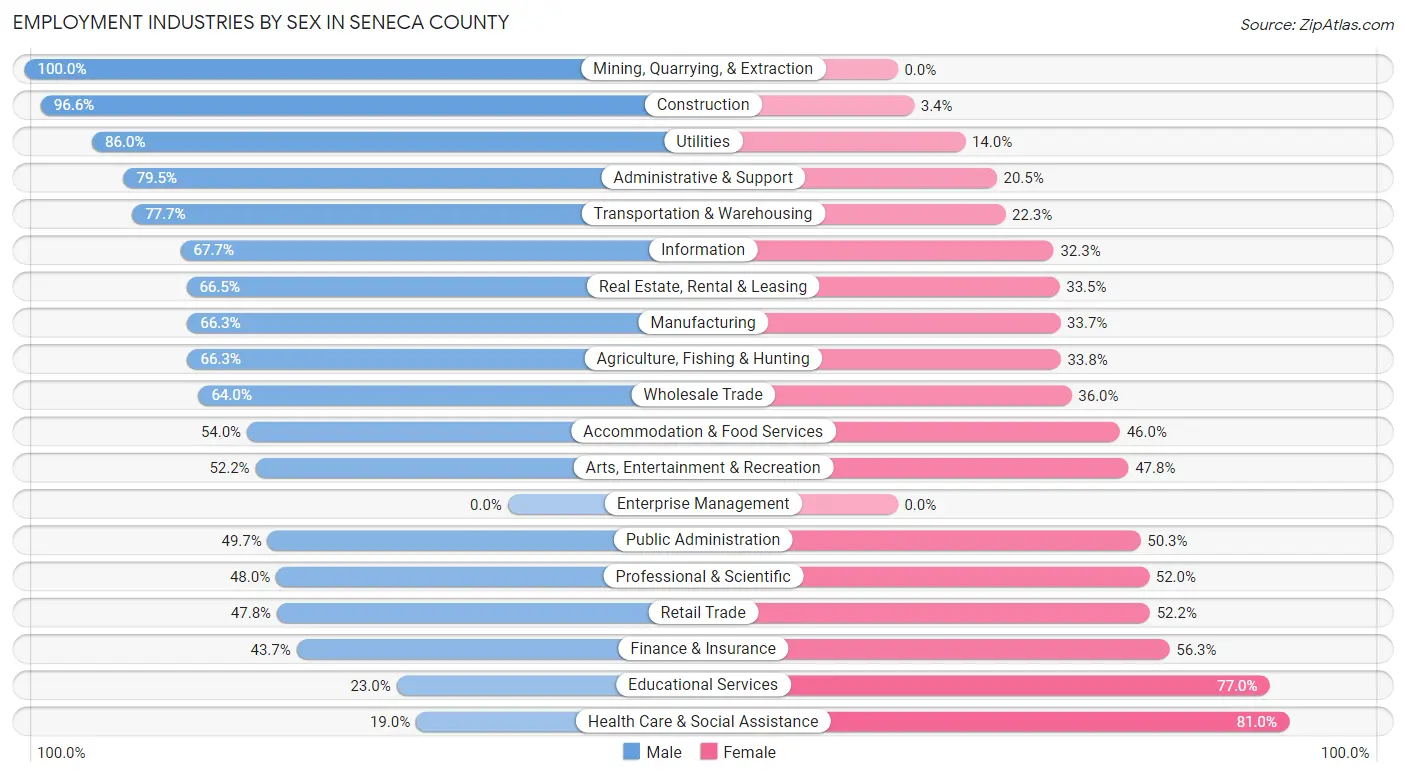
Employment Industries by Sex in Seneca County
The Seneca County industries that see more men than women are Mining, Quarrying, & Extraction (100.0%), Construction (96.6%), and Utilities (86.0%), whereas the industries that tend to have a higher number of women are Health Care & Social Assistance (81.0%), Educational Services (77.0%), and Finance & Insurance (56.3%).
| Industry | Male | Female |
| Agriculture, Fishing & Hunting | 375 (66.2%) | 191 (33.8%) |
| Mining, Quarrying, & Extraction | 27 (100.0%) | 0 (0.0%) |
| Construction | 1,000 (96.6%) | 35 (3.4%) |
| Manufacturing | 1,345 (66.3%) | 683 (33.7%) |
| Wholesale Trade | 240 (64.0%) | 135 (36.0%) |
| Retail Trade | 657 (47.8%) | 718 (52.2%) |
| Transportation & Warehousing | 401 (77.7%) | 115 (22.3%) |
| Utilities | 80 (86.0%) | 13 (14.0%) |
| Information | 197 (67.7%) | 94 (32.3%) |
| Finance & Insurance | 184 (43.7%) | 237 (56.3%) |
| Real Estate, Rental & Leasing | 127 (66.5%) | 64 (33.5%) |
| Professional & Scientific | 165 (48.0%) | 179 (52.0%) |
| Enterprise Management | 0 (0.0%) | 0 (0.0%) |
| Administrative & Support | 310 (79.5%) | 80 (20.5%) |
| Educational Services | 428 (23.0%) | 1,431 (77.0%) |
| Health Care & Social Assistance | 408 (19.0%) | 1,740 (81.0%) |
| Arts, Entertainment & Recreation | 223 (52.2%) | 204 (47.8%) |
| Accommodation & Food Services | 515 (54.0%) | 439 (46.0%) |
| Public Administration | 540 (49.7%) | 546 (50.3%) |
| Total | 7,656 (51.3%) | 7,264 (48.7%) |
Education in Seneca County
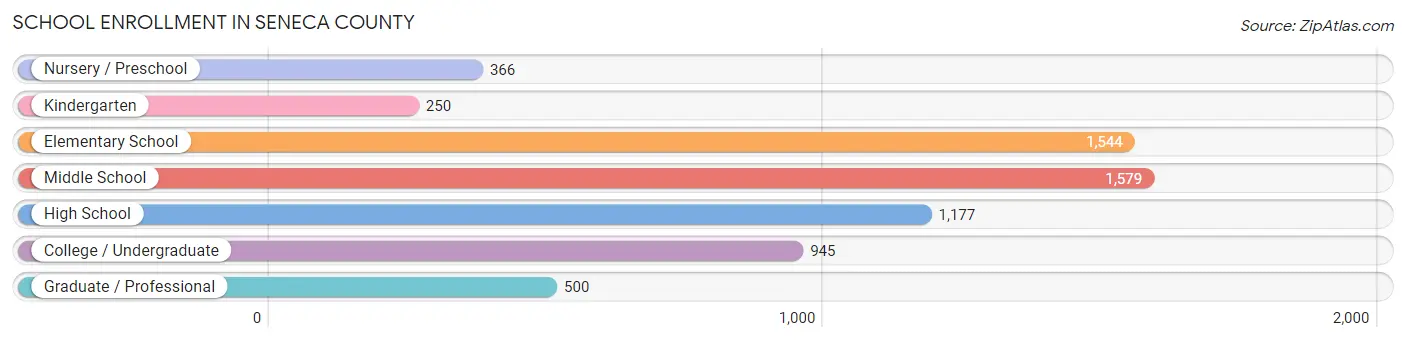
School Enrollment in Seneca County
The most common levels of schooling among the 6,361 students in Seneca County are middle school (1,579 | 24.8%), elementary school (1,544 | 24.3%), and high school (1,177 | 18.5%).
| School Level | # Students | % Students |
| Nursery / Preschool | 366 | 5.8% |
| Kindergarten | 250 | 3.9% |
| Elementary School | 1,544 | 24.3% |
| Middle School | 1,579 | 24.8% |
| High School | 1,177 | 18.5% |
| College / Undergraduate | 945 | 14.9% |
| Graduate / Professional | 500 | 7.9% |
| Total | 6,361 | 100.0% |
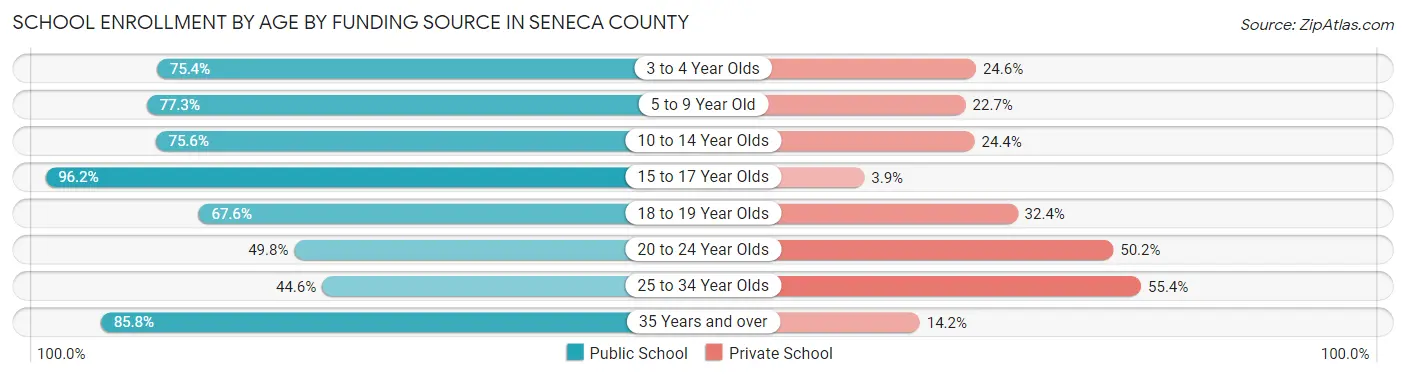
School Enrollment by Age by Funding Source in Seneca County
Out of a total of 6,361 students who are enrolled in schools in Seneca County, 1,546 (24.3%) attend a private institution, while the remaining 4,815 (75.7%) are enrolled in public schools. The age group of 25 to 34 year olds has the highest likelihood of being enrolled in private schools, with 231 (55.4% in the age bracket) enrolled. Conversely, the age group of 15 to 17 year olds has the lowest likelihood of being enrolled in a private school, with 950 (96.2% in the age bracket) attending a public institution.
| Age Bracket | Public School | Private School |
| 3 to 4 Year Olds | 211 (75.4%) | 69 (24.6%) |
| 5 to 9 Year Old | 1,350 (77.3%) | 397 (22.7%) |
| 10 to 14 Year Olds | 1,398 (75.6%) | 451 (24.4%) |
| 15 to 17 Year Olds | 950 (96.2%) | 38 (3.8%) |
| 18 to 19 Year Olds | 146 (67.6%) | 70 (32.4%) |
| 20 to 24 Year Olds | 230 (49.8%) | 232 (50.2%) |
| 25 to 34 Year Olds | 186 (44.6%) | 231 (55.4%) |
| 35 Years and over | 345 (85.8%) | 57 (14.2%) |
| Total | 4,815 (75.7%) | 1,546 (24.3%) |
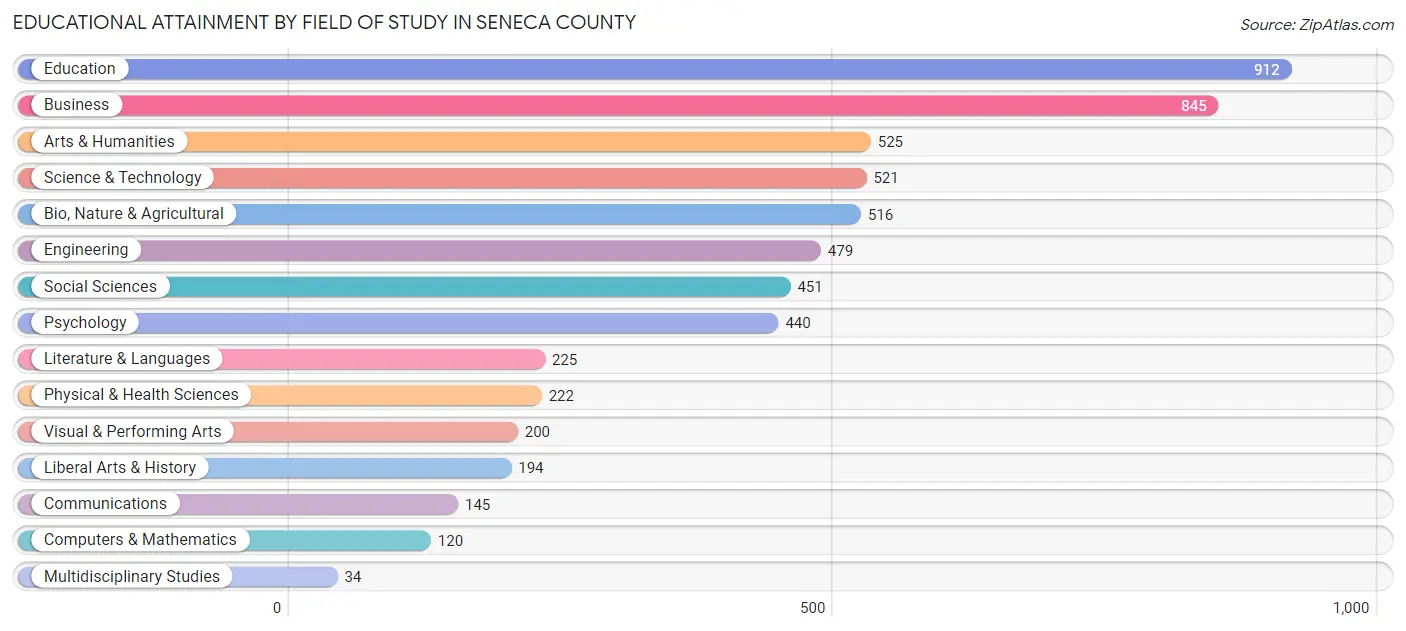
Educational Attainment by Field of Study in Seneca County
Education (912 | 15.7%), business (845 | 14.5%), arts & humanities (525 | 9.0%), science & technology (521 | 8.9%), and bio, nature & agricultural (516 | 8.8%) are the most common fields of study among 5,829 individuals in Seneca County who have obtained a bachelor's degree or higher.
| Field of Study | # Graduates | % Graduates |
| Computers & Mathematics | 120 | 2.1% |
| Bio, Nature & Agricultural | 516 | 8.8% |
| Physical & Health Sciences | 222 | 3.8% |
| Psychology | 440 | 7.5% |
| Social Sciences | 451 | 7.7% |
| Engineering | 479 | 8.2% |
| Multidisciplinary Studies | 34 | 0.6% |
| Science & Technology | 521 | 8.9% |
| Business | 845 | 14.5% |
| Education | 912 | 15.7% |
| Literature & Languages | 225 | 3.9% |
| Liberal Arts & History | 194 | 3.3% |
| Visual & Performing Arts | 200 | 3.4% |
| Communications | 145 | 2.5% |
| Arts & Humanities | 525 | 9.0% |
| Total | 5,829 | 100.0% |
Transportation & Commute in Seneca County
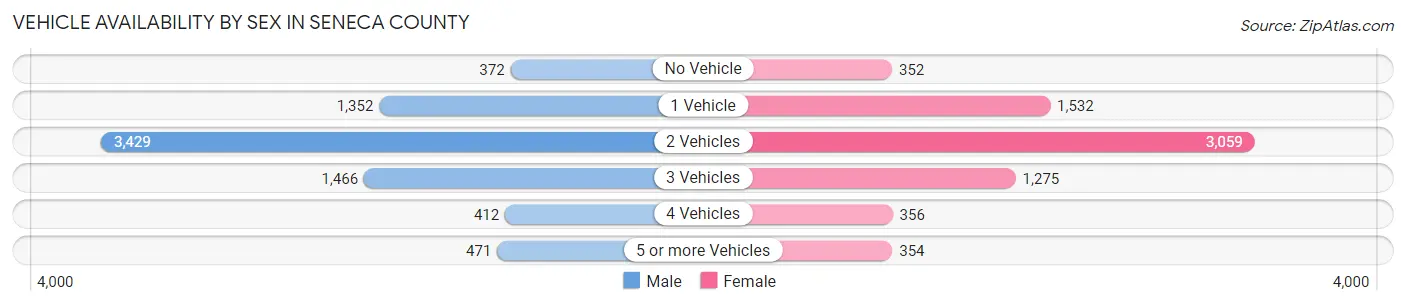
Vehicle Availability by Sex in Seneca County
The most prevalent vehicle ownership categories in Seneca County are males with 2 vehicles (3,429, accounting for 45.7%) and females with 2 vehicles (3,059, making up 49.5%).
| Vehicles Available | Male | Female |
| No Vehicle | 372 (5.0%) | 352 (5.1%) |
| 1 Vehicle | 1,352 (18.0%) | 1,532 (22.1%) |
| 2 Vehicles | 3,429 (45.7%) | 3,059 (44.2%) |
| 3 Vehicles | 1,466 (19.5%) | 1,275 (18.4%) |
| 4 Vehicles | 412 (5.5%) | 356 (5.1%) |
| 5 or more Vehicles | 471 (6.3%) | 354 (5.1%) |
| Total | 7,502 (100.0%) | 6,928 (100.0%) |
Commute Time in Seneca County
The most frequently occuring commute durations in Seneca County are 10 to 14 minutes (2,712 commuters, 20.2%), 5 to 9 minutes (2,210 commuters, 16.5%), and 20 to 24 minutes (1,860 commuters, 13.9%).
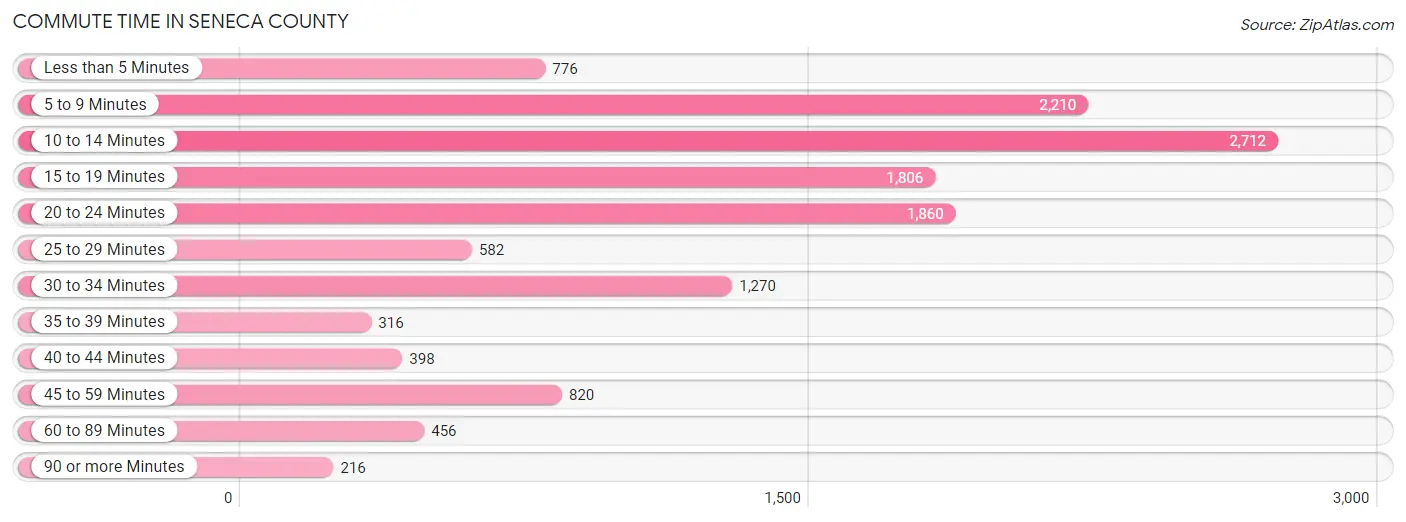
| Commute Time | # Commuters | % Commuters |
| Less than 5 Minutes | 776 | 5.8% |
| 5 to 9 Minutes | 2,210 | 16.5% |
| 10 to 14 Minutes | 2,712 | 20.2% |
| 15 to 19 Minutes | 1,806 | 13.5% |
| 20 to 24 Minutes | 1,860 | 13.9% |
| 25 to 29 Minutes | 582 | 4.3% |
| 30 to 34 Minutes | 1,270 | 9.5% |
| 35 to 39 Minutes | 316 | 2.4% |
| 40 to 44 Minutes | 398 | 3.0% |
| 45 to 59 Minutes | 820 | 6.1% |
| 60 to 89 Minutes | 456 | 3.4% |
| 90 or more Minutes | 216 | 1.6% |
Commute Time by Sex in Seneca County
The most common commute times in Seneca County are 10 to 14 minutes (1,220 commuters, 17.5%) for males and 10 to 14 minutes (1,492 commuters, 23.1%) for females.
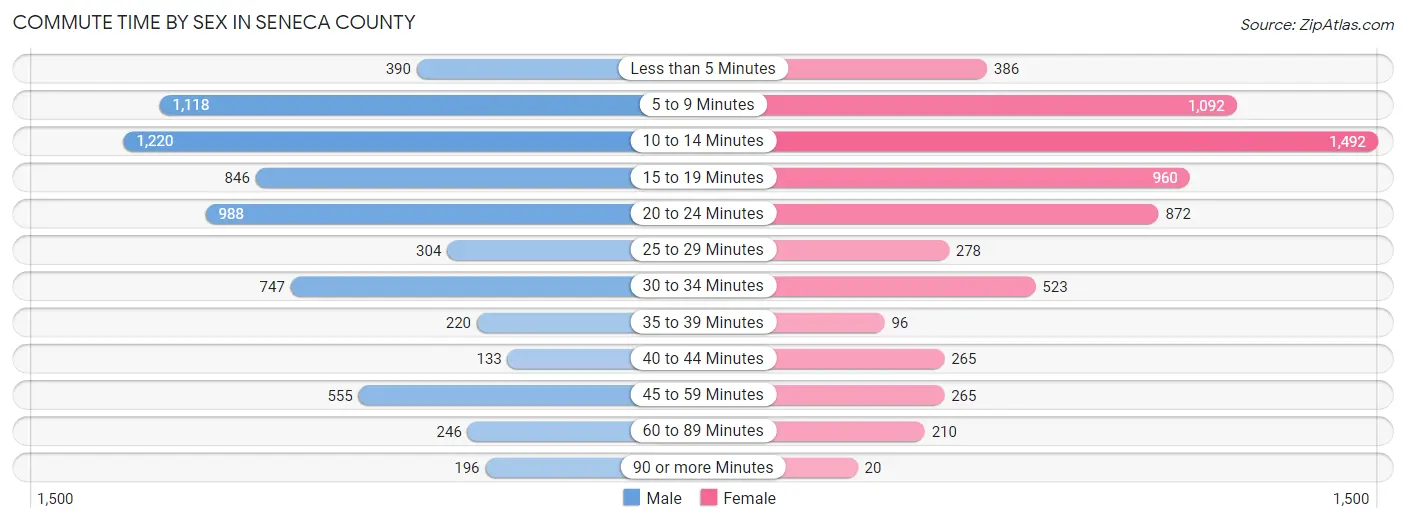
| Commute Time | Male | Female |
| Less than 5 Minutes | 390 (5.6%) | 386 (6.0%) |
| 5 to 9 Minutes | 1,118 (16.1%) | 1,092 (16.9%) |
| 10 to 14 Minutes | 1,220 (17.5%) | 1,492 (23.1%) |
| 15 to 19 Minutes | 846 (12.1%) | 960 (14.9%) |
| 20 to 24 Minutes | 988 (14.2%) | 872 (13.5%) |
| 25 to 29 Minutes | 304 (4.4%) | 278 (4.3%) |
| 30 to 34 Minutes | 747 (10.7%) | 523 (8.1%) |
| 35 to 39 Minutes | 220 (3.2%) | 96 (1.5%) |
| 40 to 44 Minutes | 133 (1.9%) | 265 (4.1%) |
| 45 to 59 Minutes | 555 (8.0%) | 265 (4.1%) |
| 60 to 89 Minutes | 246 (3.5%) | 210 (3.3%) |
| 90 or more Minutes | 196 (2.8%) | 20 (0.3%) |
Time of Departure to Work by Sex in Seneca County
The most frequent times of departure to work in Seneca County are 6:30 AM to 6:59 AM (987, 14.2%) for males and 7:30 AM to 7:59 AM (1,185, 18.3%) for females.
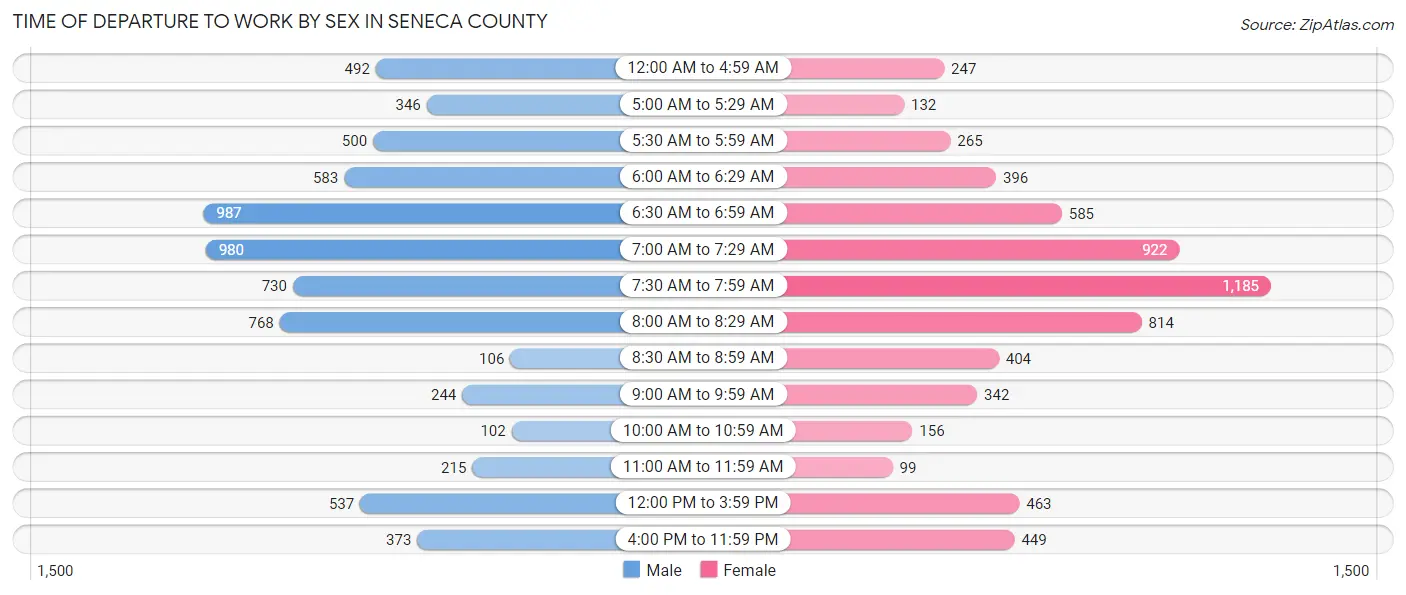
| Time of Departure | Male | Female |
| 12:00 AM to 4:59 AM | 492 (7.1%) | 247 (3.8%) |
| 5:00 AM to 5:29 AM | 346 (5.0%) | 132 (2.0%) |
| 5:30 AM to 5:59 AM | 500 (7.2%) | 265 (4.1%) |
| 6:00 AM to 6:29 AM | 583 (8.4%) | 396 (6.1%) |
| 6:30 AM to 6:59 AM | 987 (14.2%) | 585 (9.1%) |
| 7:00 AM to 7:29 AM | 980 (14.1%) | 922 (14.3%) |
| 7:30 AM to 7:59 AM | 730 (10.5%) | 1,185 (18.3%) |
| 8:00 AM to 8:29 AM | 768 (11.0%) | 814 (12.6%) |
| 8:30 AM to 8:59 AM | 106 (1.5%) | 404 (6.2%) |
| 9:00 AM to 9:59 AM | 244 (3.5%) | 342 (5.3%) |
| 10:00 AM to 10:59 AM | 102 (1.5%) | 156 (2.4%) |
| 11:00 AM to 11:59 AM | 215 (3.1%) | 99 (1.5%) |
| 12:00 PM to 3:59 PM | 537 (7.7%) | 463 (7.2%) |
| 4:00 PM to 11:59 PM | 373 (5.4%) | 449 (7.0%) |
| Total | 6,963 (100.0%) | 6,459 (100.0%) |
Housing Occupancy in Seneca County
Occupancy by Ownership in Seneca County
Of the total 13,622 dwellings in Seneca County, owner-occupied units account for 9,882 (72.5%), while renter-occupied units make up 3,740 (27.5%).
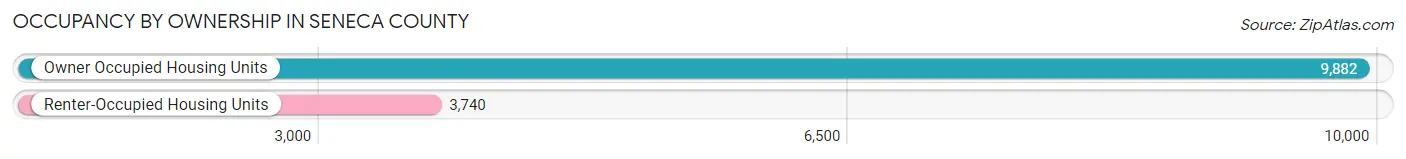
| Occupancy | # Housing Units | % Housing Units |
| Owner Occupied Housing Units | 9,882 | 72.5% |
| Renter-Occupied Housing Units | 3,740 | 27.5% |
| Total Occupied Housing Units | 13,622 | 100.0% |
Occupancy by Household Size in Seneca County
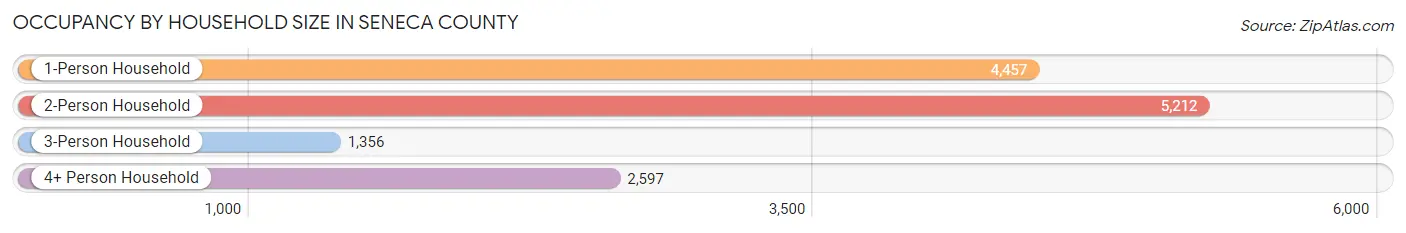
| Household Size | # Housing Units | % Housing Units |
| 1-Person Household | 4,457 | 32.7% |
| 2-Person Household | 5,212 | 38.3% |
| 3-Person Household | 1,356 | 10.0% |
| 4+ Person Household | 2,597 | 19.1% |
| Total Housing Units | 13,622 | 100.0% |
Occupancy by Ownership by Household Size in Seneca County
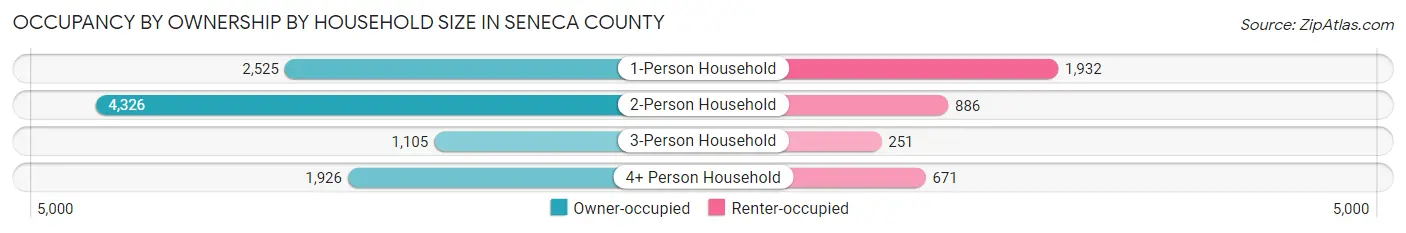
| Household Size | Owner-occupied | Renter-occupied |
| 1-Person Household | 2,525 (56.7%) | 1,932 (43.3%) |
| 2-Person Household | 4,326 (83.0%) | 886 (17.0%) |
| 3-Person Household | 1,105 (81.5%) | 251 (18.5%) |
| 4+ Person Household | 1,926 (74.2%) | 671 (25.8%) |
| Total Housing Units | 9,882 (72.5%) | 3,740 (27.5%) |
Occupancy by Educational Attainment in Seneca County
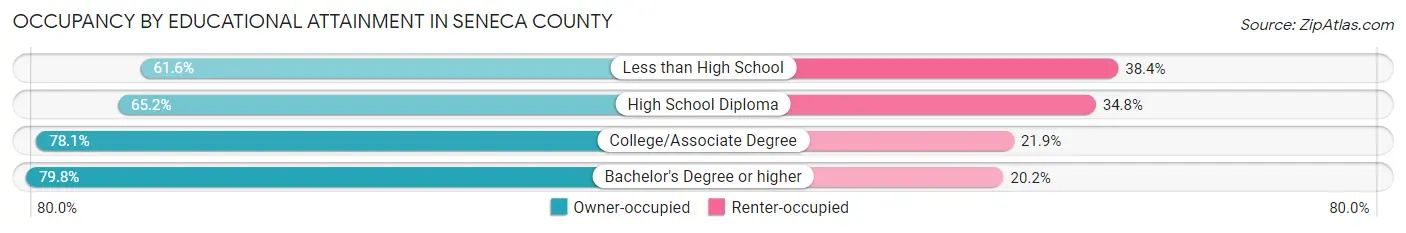
| Household Size | Owner-occupied | Renter-occupied |
| Less than High School | 874 (61.6%) | 545 (38.4%) |
| High School Diploma | 2,927 (65.2%) | 1,564 (34.8%) |
| College/Associate Degree | 3,402 (78.1%) | 952 (21.9%) |
| Bachelor's Degree or higher | 2,679 (79.8%) | 679 (20.2%) |
Occupancy by Age of Householder in Seneca County
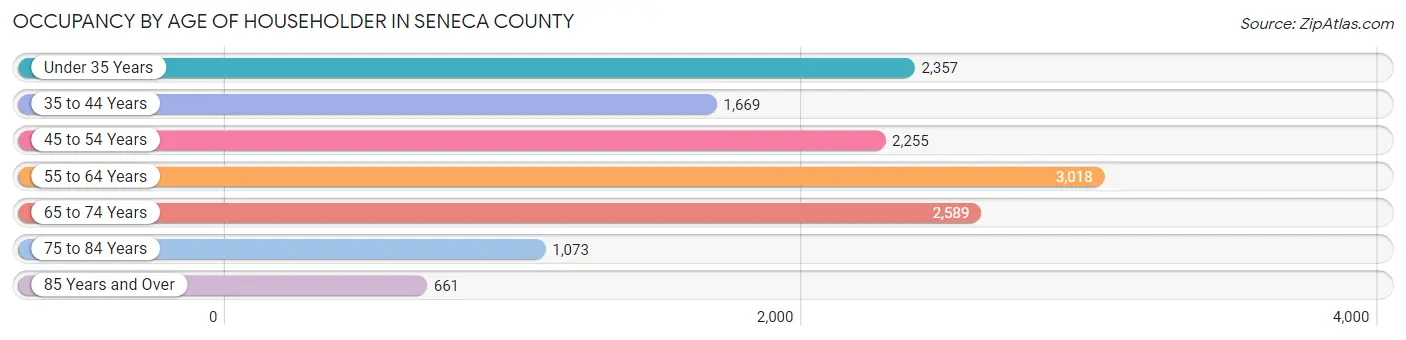
| Age Bracket | # Households | % Households |
| Under 35 Years | 2,357 | 17.3% |
| 35 to 44 Years | 1,669 | 12.2% |
| 45 to 54 Years | 2,255 | 16.6% |
| 55 to 64 Years | 3,018 | 22.2% |
| 65 to 74 Years | 2,589 | 19.0% |
| 75 to 84 Years | 1,073 | 7.9% |
| 85 Years and Over | 661 | 4.9% |
| Total | 13,622 | 100.0% |
Housing Finances in Seneca County
Median Income by Occupancy in Seneca County
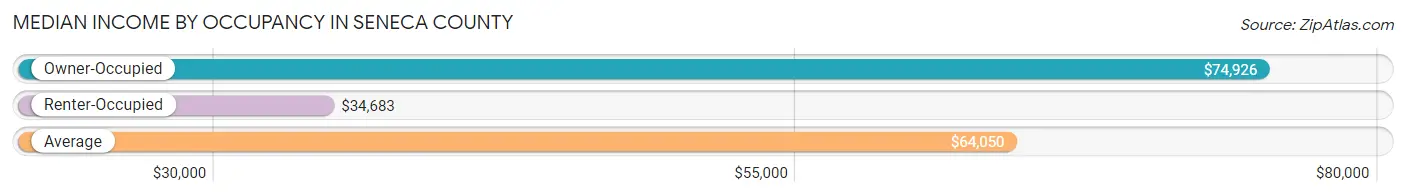
| Occupancy Type | # Households | Median Income |
| Owner-Occupied | 9,882 (72.5%) | $74,926 |
| Renter-Occupied | 3,740 (27.5%) | $34,683 |
| Average | 13,622 (100.0%) | $64,050 |
Occupancy by Householder Income Bracket in Seneca County
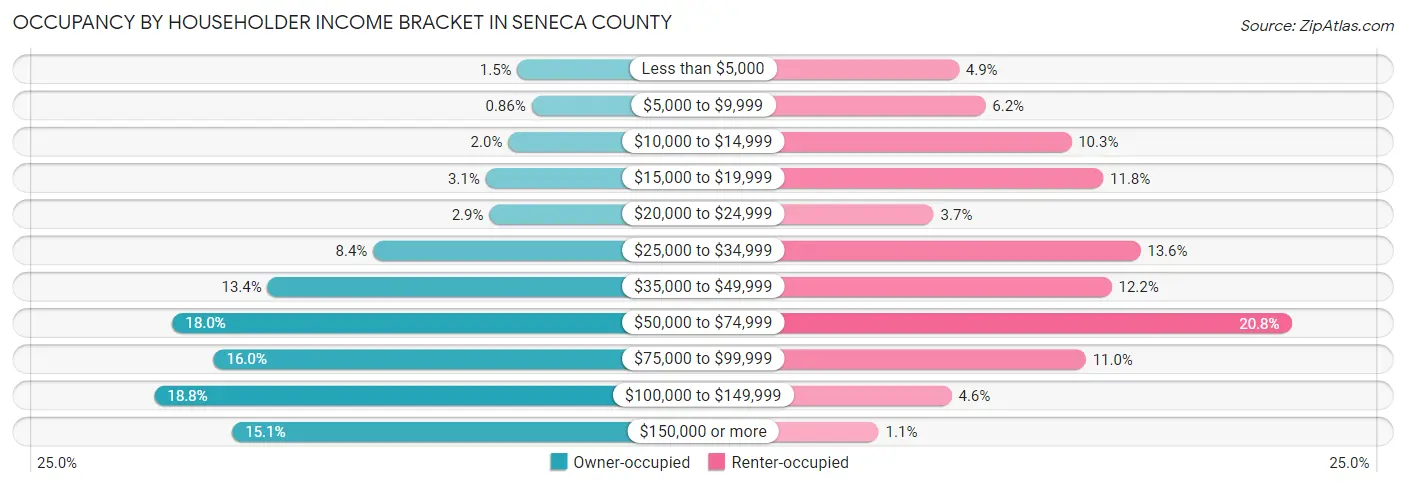
| Income Bracket | Owner-occupied | Renter-occupied |
| Less than $5,000 | 151 (1.5%) | 184 (4.9%) |
| $5,000 to $9,999 | 85 (0.9%) | 231 (6.2%) |
| $10,000 to $14,999 | 195 (2.0%) | 384 (10.3%) |
| $15,000 to $19,999 | 301 (3.0%) | 441 (11.8%) |
| $20,000 to $24,999 | 284 (2.9%) | 139 (3.7%) |
| $25,000 to $34,999 | 830 (8.4%) | 507 (13.6%) |
| $35,000 to $49,999 | 1,327 (13.4%) | 456 (12.2%) |
| $50,000 to $74,999 | 1,775 (18.0%) | 776 (20.7%) |
| $75,000 to $99,999 | 1,581 (16.0%) | 410 (11.0%) |
| $100,000 to $149,999 | 1,860 (18.8%) | 171 (4.6%) |
| $150,000 or more | 1,493 (15.1%) | 41 (1.1%) |
| Total | 9,882 (100.0%) | 3,740 (100.0%) |
Monthly Housing Cost Tiers in Seneca County
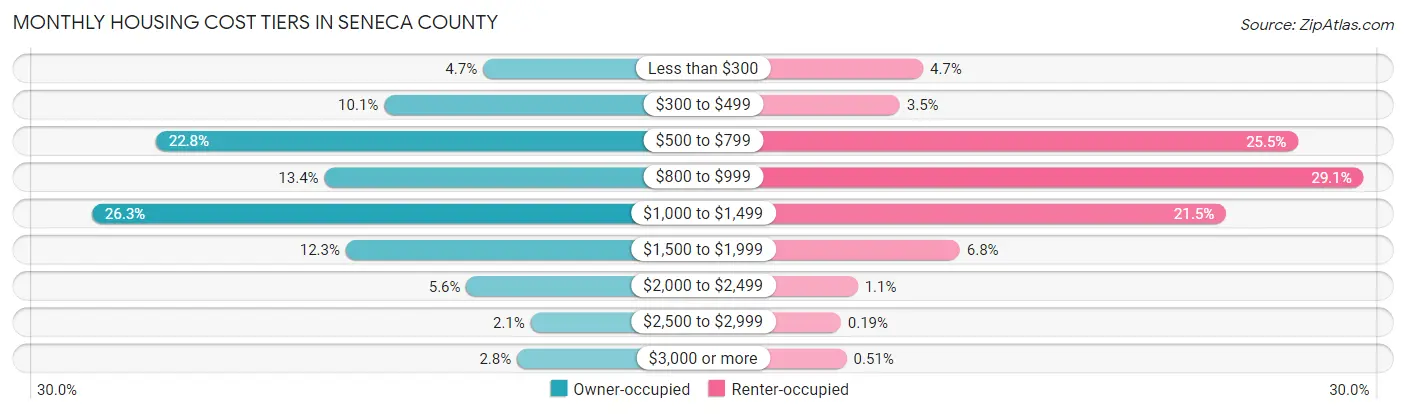
| Monthly Cost | Owner-occupied | Renter-occupied |
| Less than $300 | 462 (4.7%) | 177 (4.7%) |
| $300 to $499 | 1,002 (10.1%) | 129 (3.5%) |
| $500 to $799 | 2,248 (22.8%) | 952 (25.5%) |
| $800 to $999 | 1,328 (13.4%) | 1,087 (29.1%) |
| $1,000 to $1,499 | 2,597 (26.3%) | 803 (21.5%) |
| $1,500 to $1,999 | 1,212 (12.3%) | 253 (6.8%) |
| $2,000 to $2,499 | 553 (5.6%) | 42 (1.1%) |
| $2,500 to $2,999 | 203 (2.1%) | 7 (0.2%) |
| $3,000 or more | 277 (2.8%) | 19 (0.5%) |
| Total | 9,882 (100.0%) | 3,740 (100.0%) |
Physical Housing Characteristics in Seneca County
Housing Structures in Seneca County
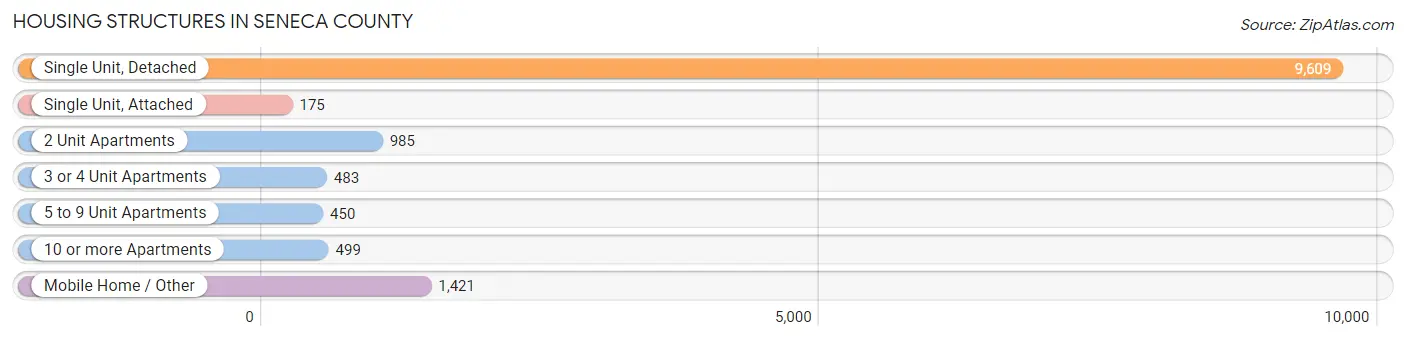
| Structure Type | # Housing Units | % Housing Units |
| Single Unit, Detached | 9,609 | 70.5% |
| Single Unit, Attached | 175 | 1.3% |
| 2 Unit Apartments | 985 | 7.2% |
| 3 or 4 Unit Apartments | 483 | 3.5% |
| 5 to 9 Unit Apartments | 450 | 3.3% |
| 10 or more Apartments | 499 | 3.7% |
| Mobile Home / Other | 1,421 | 10.4% |
| Total | 13,622 | 100.0% |
Housing Structures by Occupancy in Seneca County
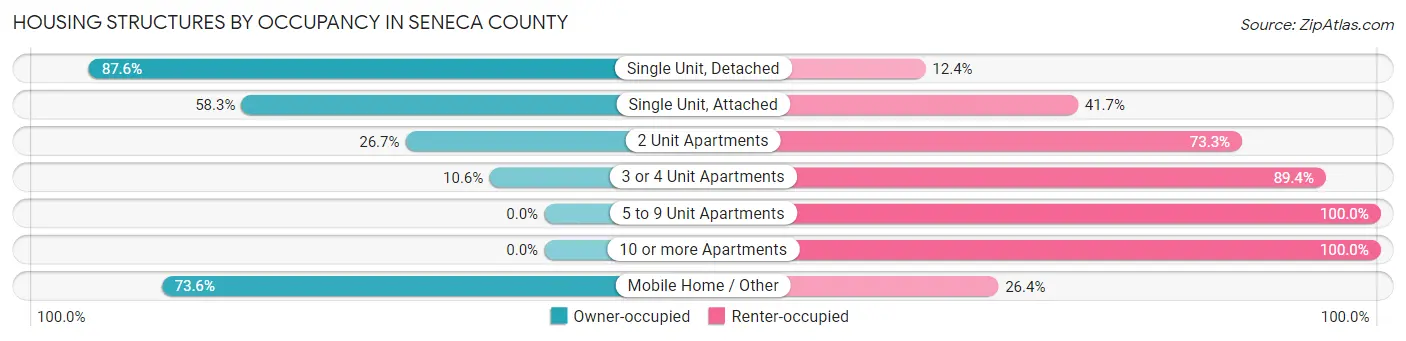
| Structure Type | Owner-occupied | Renter-occupied |
| Single Unit, Detached | 8,420 (87.6%) | 1,189 (12.4%) |
| Single Unit, Attached | 102 (58.3%) | 73 (41.7%) |
| 2 Unit Apartments | 263 (26.7%) | 722 (73.3%) |
| 3 or 4 Unit Apartments | 51 (10.6%) | 432 (89.4%) |
| 5 to 9 Unit Apartments | 0 (0.0%) | 450 (100.0%) |
| 10 or more Apartments | 0 (0.0%) | 499 (100.0%) |
| Mobile Home / Other | 1,046 (73.6%) | 375 (26.4%) |
| Total | 9,882 (72.5%) | 3,740 (27.5%) |
Housing Structures by Number of Rooms in Seneca County
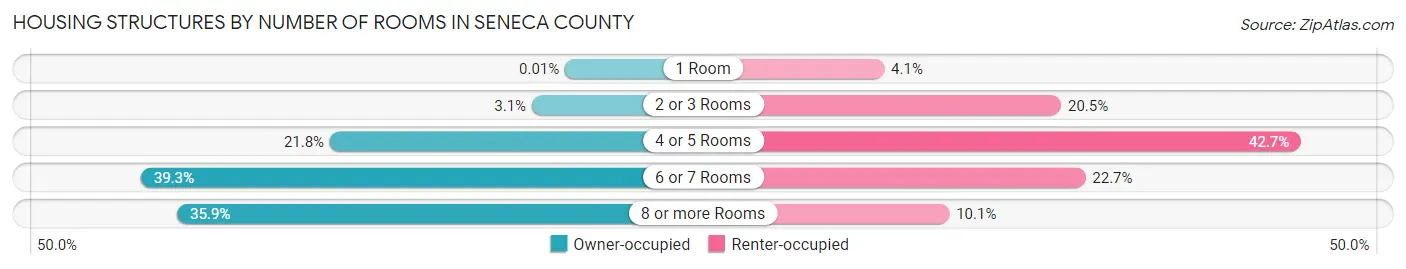
| Number of Rooms | Owner-occupied | Renter-occupied |
| 1 Room | 1 (0.0%) | 153 (4.1%) |
| 2 or 3 Rooms | 304 (3.1%) | 765 (20.4%) |
| 4 or 5 Rooms | 2,150 (21.8%) | 1,595 (42.6%) |
| 6 or 7 Rooms | 3,879 (39.3%) | 849 (22.7%) |
| 8 or more Rooms | 3,548 (35.9%) | 378 (10.1%) |
| Total | 9,882 (100.0%) | 3,740 (100.0%) |
Housing Structure by Heating Type in Seneca County
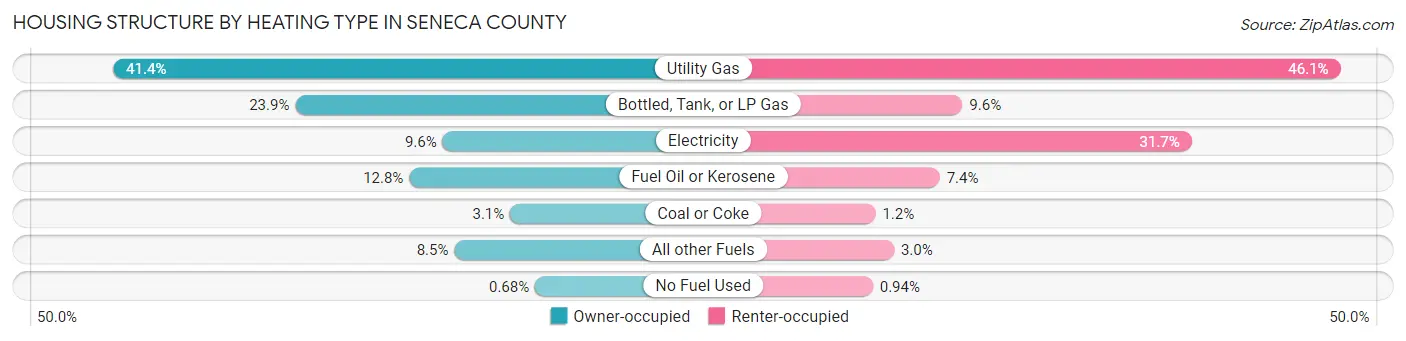
| Heating Type | Owner-occupied | Renter-occupied |
| Utility Gas | 4,095 (41.4%) | 1,725 (46.1%) |
| Bottled, Tank, or LP Gas | 2,357 (23.8%) | 359 (9.6%) |
| Electricity | 951 (9.6%) | 1,187 (31.7%) |
| Fuel Oil or Kerosene | 1,269 (12.8%) | 277 (7.4%) |
| Coal or Coke | 305 (3.1%) | 45 (1.2%) |
| All other Fuels | 838 (8.5%) | 112 (3.0%) |
| No Fuel Used | 67 (0.7%) | 35 (0.9%) |
| Total | 9,882 (100.0%) | 3,740 (100.0%) |
Household Vehicle Usage in Seneca County
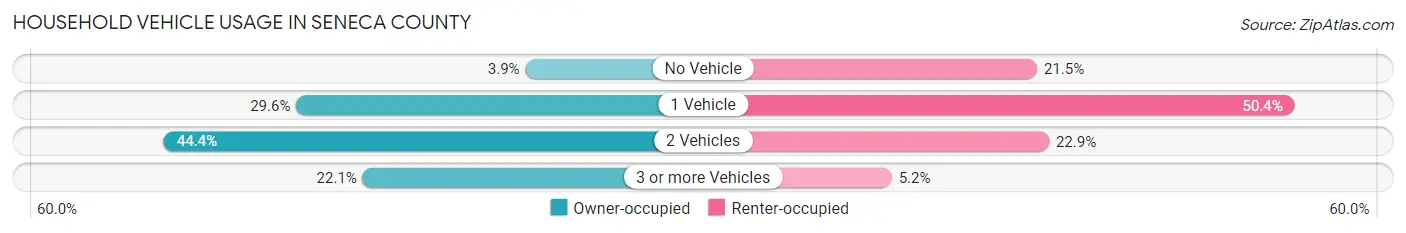
| Vehicles per Household | Owner-occupied | Renter-occupied |
| No Vehicle | 385 (3.9%) | 805 (21.5%) |
| 1 Vehicle | 2,922 (29.6%) | 1,884 (50.4%) |
| 2 Vehicles | 4,388 (44.4%) | 855 (22.9%) |
| 3 or more Vehicles | 2,187 (22.1%) | 196 (5.2%) |
| Total | 9,882 (100.0%) | 3,740 (100.0%) |
Real Estate & Mortgages in Seneca County
Real Estate and Mortgage Overview in Seneca County
| Characteristic | Without Mortgage | With Mortgage |
| Housing Units | 4,280 | 5,602 |
| Median Property Value | $125,500 | $134,500 |
| Median Household Income | $59,437 | $992 |
| Monthly Housing Costs | $625 | $239 |
| Real Estate Taxes | $2,987 | $189 |
Property Value by Mortgage Status in Seneca County
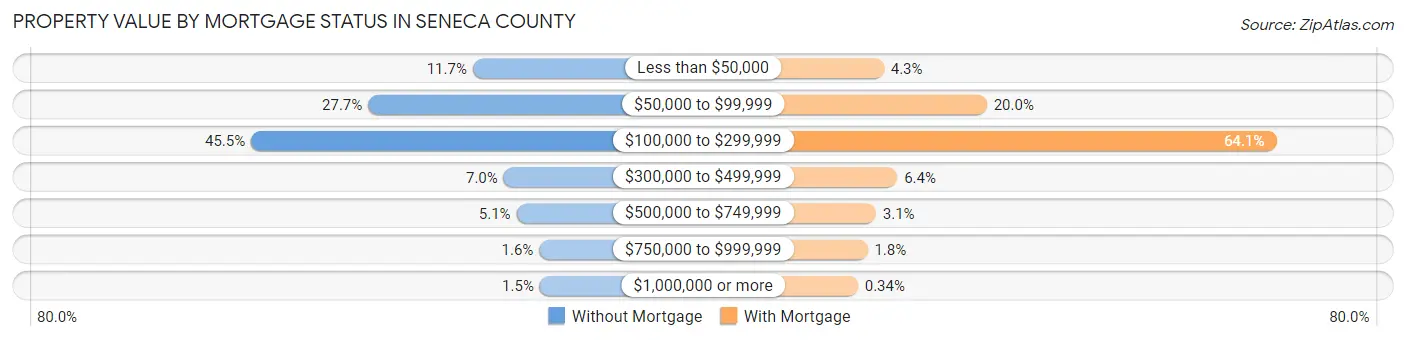
| Property Value | Without Mortgage | With Mortgage |
| Less than $50,000 | 501 (11.7%) | 241 (4.3%) |
| $50,000 to $99,999 | 1,184 (27.7%) | 1,120 (20.0%) |
| $100,000 to $299,999 | 1,947 (45.5%) | 3,591 (64.1%) |
| $300,000 to $499,999 | 300 (7.0%) | 356 (6.4%) |
| $500,000 to $749,999 | 216 (5.1%) | 173 (3.1%) |
| $750,000 to $999,999 | 68 (1.6%) | 102 (1.8%) |
| $1,000,000 or more | 64 (1.5%) | 19 (0.3%) |
| Total | 4,280 (100.0%) | 5,602 (100.0%) |
Household Income by Mortgage Status in Seneca County
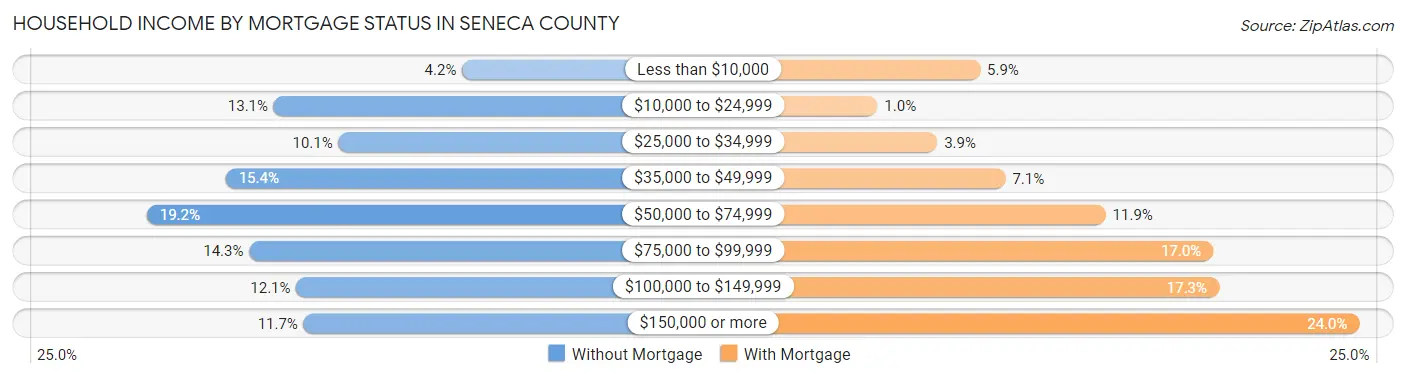
| Household Income | Without Mortgage | With Mortgage |
| Less than $10,000 | 178 (4.2%) | 332 (5.9%) |
| $10,000 to $24,999 | 562 (13.1%) | 58 (1.0%) |
| $25,000 to $34,999 | 430 (10.1%) | 218 (3.9%) |
| $35,000 to $49,999 | 660 (15.4%) | 400 (7.1%) |
| $50,000 to $74,999 | 821 (19.2%) | 667 (11.9%) |
| $75,000 to $99,999 | 612 (14.3%) | 954 (17.0%) |
| $100,000 to $149,999 | 516 (12.1%) | 969 (17.3%) |
| $150,000 or more | 501 (11.7%) | 1,344 (24.0%) |
| Total | 4,280 (100.0%) | 5,602 (100.0%) |
Property Value to Household Income Ratio in Seneca County
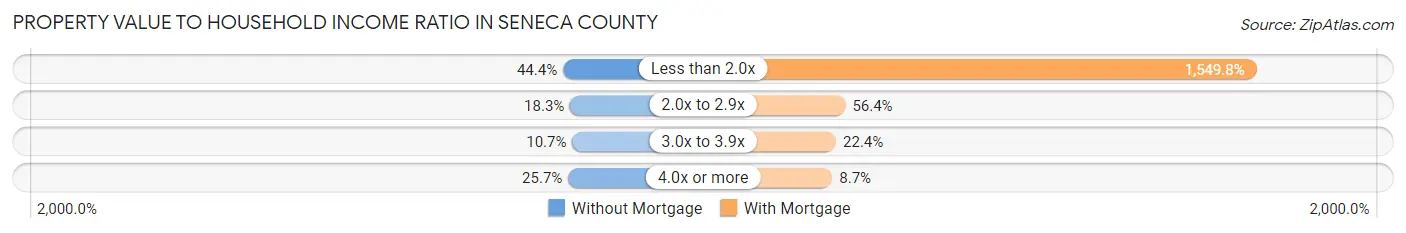
| Value-to-Income Ratio | Without Mortgage | With Mortgage |
| Less than 2.0x | 1,901 (44.4%) | 86,818 (1,549.8%) |
| 2.0x to 2.9x | 784 (18.3%) | 3,162 (56.4%) |
| 3.0x to 3.9x | 456 (10.6%) | 1,256 (22.4%) |
| 4.0x or more | 1,100 (25.7%) | 486 (8.7%) |
| Total | 4,280 (100.0%) | 5,602 (100.0%) |
Real Estate Taxes by Mortgage Status in Seneca County
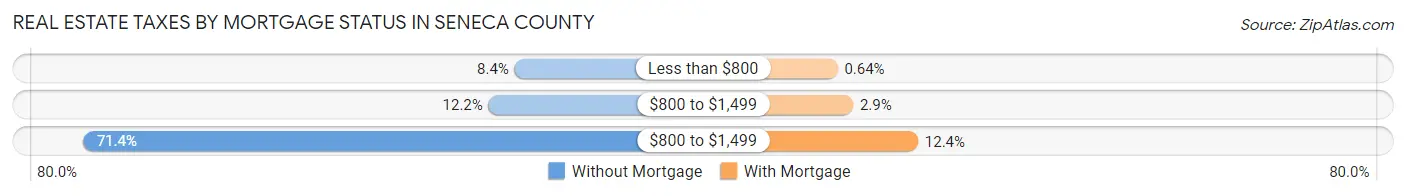
| Property Taxes | Without Mortgage | With Mortgage |
| Less than $800 | 359 (8.4%) | 36 (0.6%) |
| $800 to $1,499 | 522 (12.2%) | 163 (2.9%) |
| $800 to $1,499 | 3,054 (71.4%) | 694 (12.4%) |
| Total | 4,280 (100.0%) | 5,602 (100.0%) |
Health & Disability in Seneca County
Health Insurance Coverage by Age in Seneca County
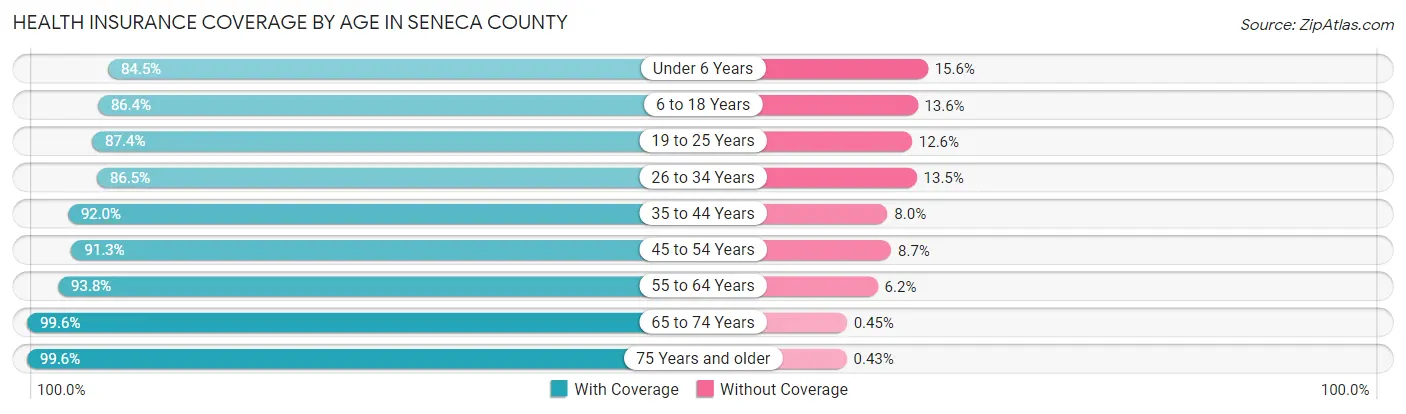
| Age Bracket | With Coverage | Without Coverage |
| Under 6 Years | 1,776 (84.5%) | 327 (15.5%) |
| 6 to 18 Years | 4,215 (86.4%) | 666 (13.6%) |
| 19 to 25 Years | 2,116 (87.4%) | 305 (12.6%) |
| 26 to 34 Years | 3,068 (86.5%) | 478 (13.5%) |
| 35 to 44 Years | 3,111 (92.0%) | 272 (8.0%) |
| 45 to 54 Years | 3,605 (91.3%) | 345 (8.7%) |
| 55 to 64 Years | 4,631 (93.8%) | 307 (6.2%) |
| 65 to 74 Years | 3,975 (99.6%) | 18 (0.4%) |
| 75 Years and older | 2,550 (99.6%) | 11 (0.4%) |
| Total | 29,047 (91.4%) | 2,729 (8.6%) |
Health Insurance Coverage by Citizenship Status in Seneca County
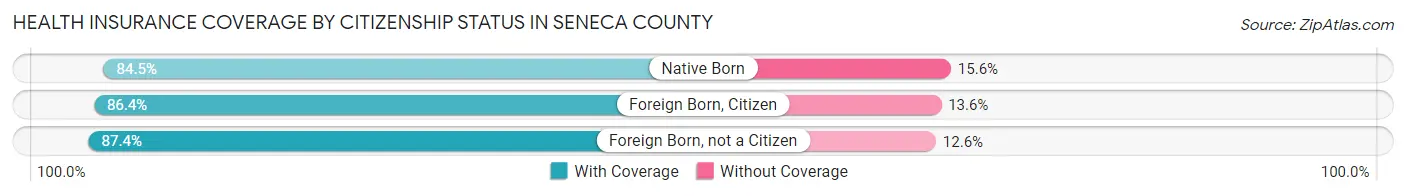
| Citizenship Status | With Coverage | Without Coverage |
| Native Born | 1,776 (84.5%) | 327 (15.5%) |
| Foreign Born, Citizen | 4,215 (86.4%) | 666 (13.6%) |
| Foreign Born, not a Citizen | 2,116 (87.4%) | 305 (12.6%) |
Health Insurance Coverage by Household Income in Seneca County
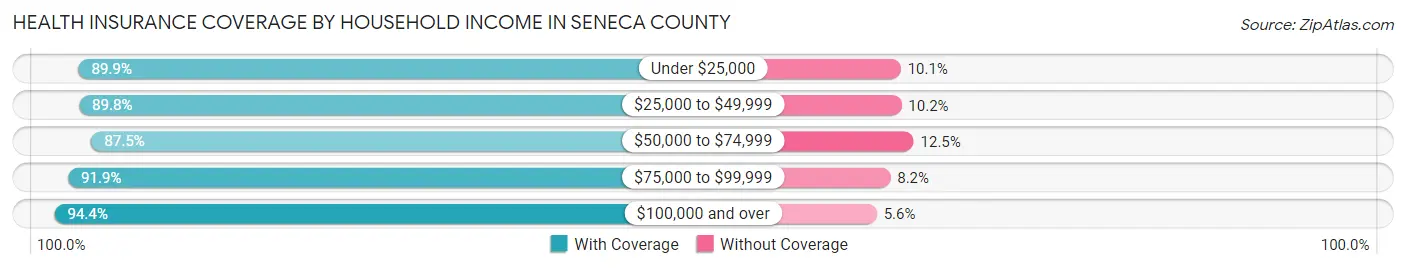
| Household Income | With Coverage | Without Coverage |
| Under $25,000 | 3,257 (89.9%) | 366 (10.1%) |
| $25,000 to $49,999 | 4,721 (89.8%) | 538 (10.2%) |
| $50,000 to $74,999 | 5,505 (87.5%) | 788 (12.5%) |
| $75,000 to $99,999 | 4,668 (91.8%) | 414 (8.2%) |
| $100,000 and over | 10,487 (94.4%) | 623 (5.6%) |
Public vs Private Health Insurance Coverage by Age in Seneca County
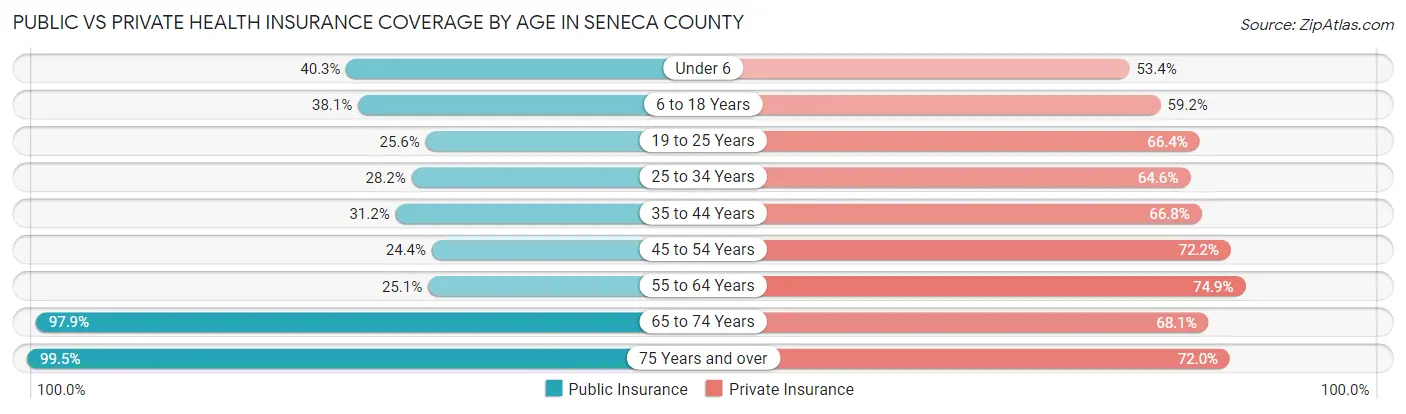
| Age Bracket | Public Insurance | Private Insurance |
| Under 6 | 847 (40.3%) | 1,123 (53.4%) |
| 6 to 18 Years | 1,860 (38.1%) | 2,889 (59.2%) |
| 19 to 25 Years | 619 (25.6%) | 1,608 (66.4%) |
| 25 to 34 Years | 999 (28.2%) | 2,292 (64.6%) |
| 35 to 44 Years | 1,054 (31.2%) | 2,259 (66.8%) |
| 45 to 54 Years | 964 (24.4%) | 2,852 (72.2%) |
| 55 to 64 Years | 1,240 (25.1%) | 3,698 (74.9%) |
| 65 to 74 Years | 3,909 (97.9%) | 2,718 (68.1%) |
| 75 Years and over | 2,549 (99.5%) | 1,845 (72.0%) |
| Total | 14,041 (44.2%) | 21,284 (67.0%) |
Disability Status by Sex by Age in Seneca County
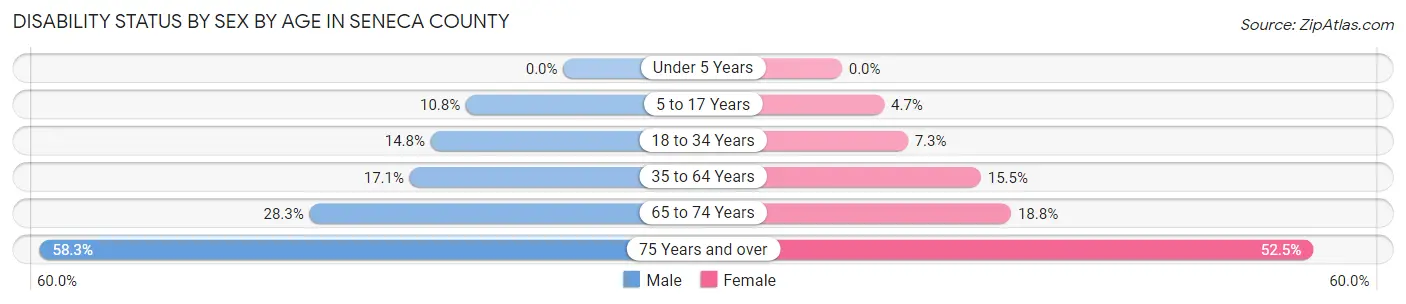
| Age Bracket | Male | Female |
| Under 5 Years | 0 (0.0%) | 0 (0.0%) |
| 5 to 17 Years | 286 (10.8%) | 106 (4.7%) |
| 18 to 34 Years | 459 (14.8%) | 230 (7.3%) |
| 35 to 64 Years | 1,052 (17.1%) | 947 (15.5%) |
| 65 to 74 Years | 551 (28.3%) | 385 (18.8%) |
| 75 Years and over | 648 (58.3%) | 761 (52.5%) |
Disability Class by Sex by Age in Seneca County
Disability Class: Hearing Difficulty
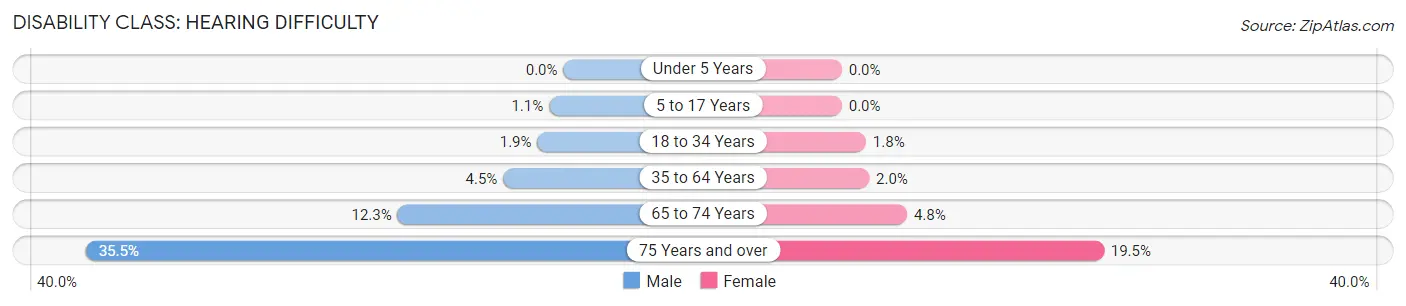
| Age Bracket | Male | Female |
| Under 5 Years | 0 (0.0%) | 0 (0.0%) |
| 5 to 17 Years | 28 (1.1%) | 0 (0.0%) |
| 18 to 34 Years | 60 (1.9%) | 56 (1.8%) |
| 35 to 64 Years | 275 (4.5%) | 124 (2.0%) |
| 65 to 74 Years | 240 (12.3%) | 99 (4.8%) |
| 75 Years and over | 394 (35.5%) | 282 (19.5%) |
Disability Class: Vision Difficulty
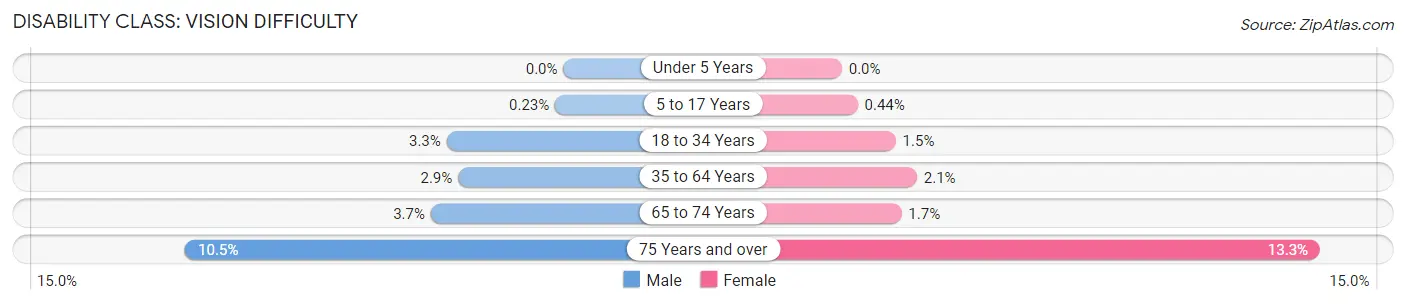
| Age Bracket | Male | Female |
| Under 5 Years | 0 (0.0%) | 0 (0.0%) |
| 5 to 17 Years | 6 (0.2%) | 10 (0.4%) |
| 18 to 34 Years | 101 (3.3%) | 47 (1.5%) |
| 35 to 64 Years | 180 (2.9%) | 128 (2.1%) |
| 65 to 74 Years | 72 (3.7%) | 34 (1.7%) |
| 75 Years and over | 117 (10.5%) | 193 (13.3%) |
Disability Class: Cognitive Difficulty
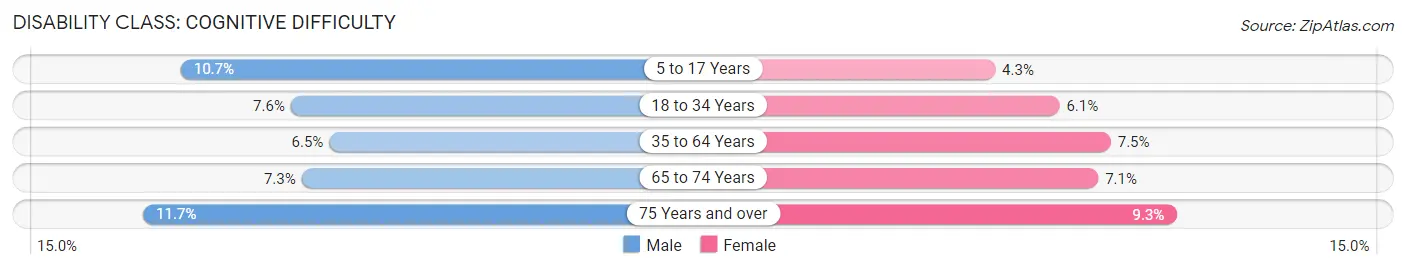
| Age Bracket | Male | Female |
| 5 to 17 Years | 281 (10.6%) | 96 (4.3%) |
| 18 to 34 Years | 236 (7.6%) | 190 (6.1%) |
| 35 to 64 Years | 401 (6.5%) | 458 (7.5%) |
| 65 to 74 Years | 142 (7.3%) | 146 (7.1%) |
| 75 Years and over | 130 (11.7%) | 135 (9.3%) |
Disability Class: Ambulatory Difficulty
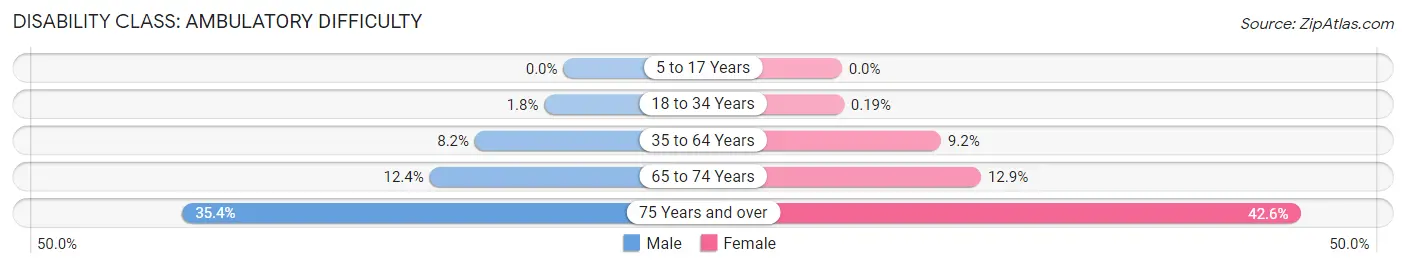
| Age Bracket | Male | Female |
| 5 to 17 Years | 0 (0.0%) | 0 (0.0%) |
| 18 to 34 Years | 55 (1.8%) | 6 (0.2%) |
| 35 to 64 Years | 505 (8.2%) | 563 (9.2%) |
| 65 to 74 Years | 242 (12.4%) | 264 (12.9%) |
| 75 Years and over | 393 (35.4%) | 617 (42.5%) |
Disability Class: Self-Care Difficulty
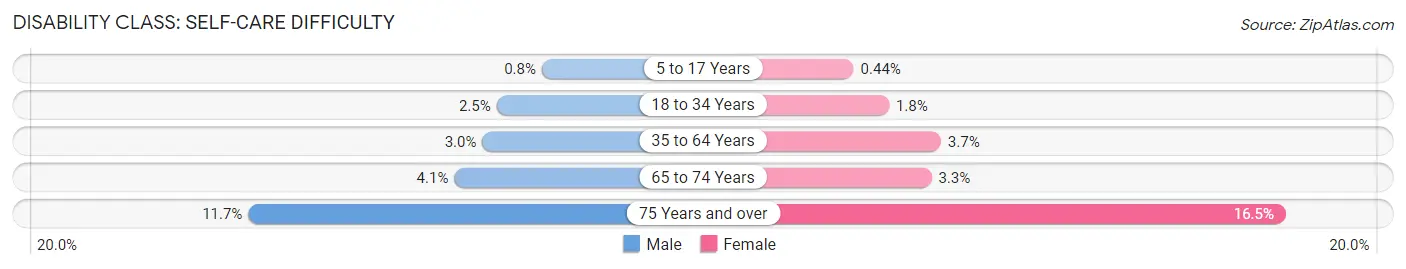
| Age Bracket | Male | Female |
| 5 to 17 Years | 21 (0.8%) | 10 (0.4%) |
| 18 to 34 Years | 77 (2.5%) | 55 (1.8%) |
| 35 to 64 Years | 185 (3.0%) | 225 (3.7%) |
| 65 to 74 Years | 79 (4.1%) | 68 (3.3%) |
| 75 Years and over | 130 (11.7%) | 239 (16.5%) |
Technology Access in Seneca County
Computing Device Access in Seneca County
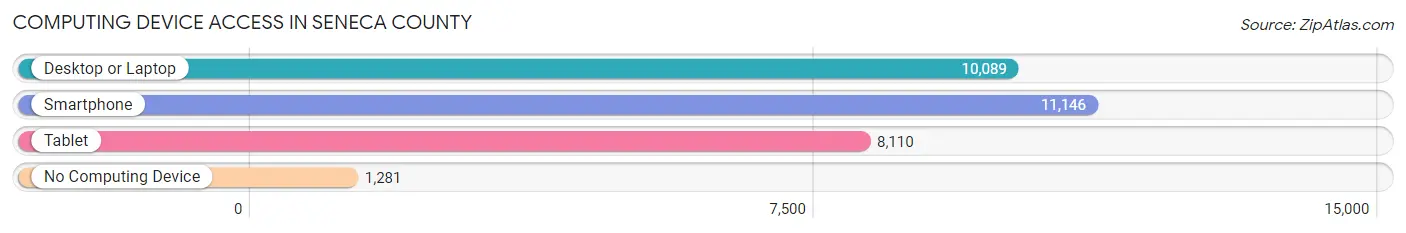
| Device Type | # Households | % Households |
| Desktop or Laptop | 10,089 | 74.1% |
| Smartphone | 11,146 | 81.8% |
| Tablet | 8,110 | 59.5% |
| No Computing Device | 1,281 | 9.4% |
| Total | 13,622 | 100.0% |
Internet Access in Seneca County
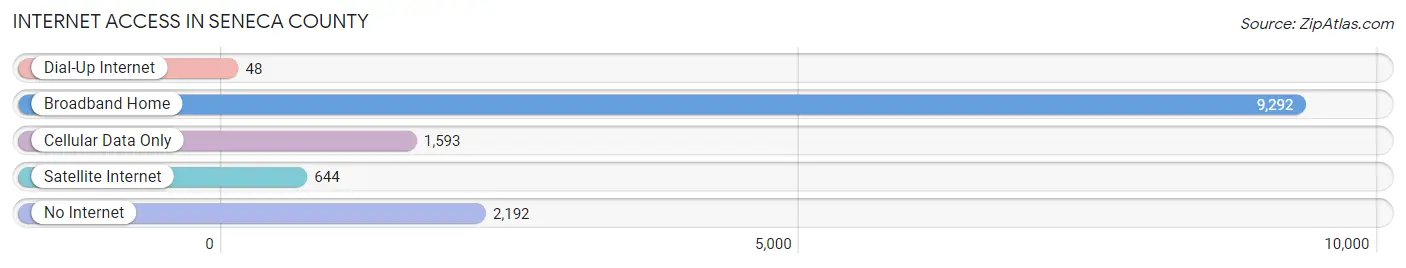
| Internet Type | # Households | % Households |
| Dial-Up Internet | 48 | 0.4% |
| Broadband Home | 9,292 | 68.2% |
| Cellular Data Only | 1,593 | 11.7% |
| Satellite Internet | 644 | 4.7% |
| No Internet | 2,192 | 16.1% |
| Total | 13,622 | 100.0% |
Seneca County Summary
Seneca County is a county located in the Finger Lakes region of New York State. It is bordered by Cayuga County to the north, Ontario County to the east, Yates County to the south, and Wayne County to the west. The county seat is Waterloo. As of the 2010 census, the population was 35,251.
Geography
Seneca County is located in the Finger Lakes region of New York State. It is bordered by Cayuga County to the north, Ontario County to the east, Yates County to the south, and Wayne County to the west. The county has a total area of 517 square miles, of which 514 square miles is land and 3.2 square miles is water. The highest point in the county is 1,945 feet above sea level on the summit of Seneca Knolls in the town of Varick.
The county is home to several lakes, including Cayuga Lake, Seneca Lake, and Canandaigua Lake. The Seneca River flows through the county, as does the Cayuga-Seneca Canal. The county is also home to several state parks, including Sampson State Park, Seneca Lake State Park, and Montezuma National Wildlife Refuge.
History
Seneca County was formed in 1804 from parts of Cayuga and Ontario counties. It was named after the Seneca Nation of Native Americans, who had inhabited the area for centuries prior to European settlement.
The first settlers in the county were Quakers from Pennsylvania, who arrived in 1790. The county was largely agricultural in its early years, with the main crops being wheat, corn, and potatoes. The county was also home to several mills, including grist mills, saw mills, and woolen mills.
In the mid-19th century, the county began to industrialize, with the opening of several factories, including a paper mill, a glass factory, and a tannery. The county also became a major producer of hops, with the opening of several hop farms.
Economy
Seneca County is largely rural, with a population of 35,251 as of the 2010 census. The county has a diverse economy, with the largest employers being the Seneca County government, the Seneca Falls School District, and the Seneca Army Depot. Other major employers include the Seneca County Sheriff's Office, the Seneca County Health Department, and the Seneca County Department of Social Services.
The county is also home to several manufacturing companies, including Seneca Foods, Seneca Glass, and Seneca Plastics. Tourism is also an important part of the county's economy, with the Finger Lakes region being a popular destination for visitors.
Demographics
As of the 2010 census, the population of Seneca County was 35,251. The racial makeup of the county was 94.3% White, 2.3% African American, 0.4% Native American, 0.7% Asian, 0.1% Pacific Islander, 0.7% from other races, and 1.5% from two or more races. Hispanic or Latino of any race were 2.3% of the population.
The median income for a household in the county was $45,945, and the median income for a family was $54,945. The per capita income for the county was $22,945. About 8.3% of families and 11.2% of the population were below the poverty line, including 15.2% of those under age 18 and 6.2% of those age 65 or over.
Seneca County is home to several colleges and universities, including Hobart and William Smith Colleges, Finger Lakes Community College, and Keuka College. The county is also home to several museums, including the Seneca Museum of Natural History and the Seneca County Historical Society.
Common Questions
What is Per Capita Income in Seneca County?
Per Capita income in Seneca County is $34,212.
What is the Median Family Income in Seneca County?
Median Family Income in Seneca County is $81,616.
What is the Median Household income in Seneca County?
Median Household Income in Seneca County is $64,050.
What is Income or Wage Gap in Seneca County?
Income or Wage Gap in Seneca County is 25.3%.
Women in Seneca County earn 74.7 cents for every dollar earned by a man.
What is Family Income Deficit in Seneca County?
Family Income Deficit in Seneca County is $10,103.
Families that are below poverty line in Seneca County earn $10,103 less on average than the poverty threshold level.
What is Inequality or Gini Index in Seneca County?
Inequality or Gini Index in Seneca County is 0.46.
What is the Total Population of Seneca County?
Total Population of Seneca County is 33,651.
What is the Total Male Population of Seneca County?
Total Male Population of Seneca County is 17,613.
What is the Total Female Population of Seneca County?
Total Female Population of Seneca County is 16,038.
What is the Ratio of Males per 100 Females in Seneca County?
There are 109.82 Males per 100 Females in Seneca County.
What is the Ratio of Females per 100 Males in Seneca County?
There are 91.06 Females per 100 Males in Seneca County.
What is the Median Population Age in Seneca County?
Median Population Age in Seneca County is 43.0 Years.
What is the Average Family Size in Seneca County
Average Family Size in Seneca County is 3.0 People.
What is the Average Household Size in Seneca County
Average Household Size in Seneca County is 2.3 People.
How Large is the Labor Force in Seneca County?
There are 15,634 People in the Labor Forcein in Seneca County.
What is the Percentage of People in the Labor Force in Seneca County?
56.7% of People are in the Labor Force in Seneca County.
What is the Unemployment Rate in Seneca County?
Unemployment Rate in Seneca County is 4.5%.