Otsego County, NY Map & Demographics
Otsego County Map
Otsego County Overview
$34,573
PER CAPITA INCOME
$82,486
AVG FAMILY INCOME
$65,778
AVG HOUSEHOLD INCOME
29.7%
WAGE / INCOME GAP [ % ]
70.3¢/ $1
WAGE / INCOME GAP [ $ ]
$9,100
FAMILY INCOME DEFICIT
0.45
INEQUALITY / GINI INDEX
59,678
TOTAL POPULATION
29,157
MALE POPULATION
30,521
FEMALE POPULATION
95.53
MALES / 100 FEMALES
104.68
FEMALES / 100 MALES
40.8
MEDIAN AGE
3.0
AVG FAMILY SIZE
2.4
AVG HOUSEHOLD SIZE
28,911
LABOR FORCE [ PEOPLE ]
56.1%
PERCENT IN LABOR FORCE
5.0%
UNEMPLOYMENT RATE
Income in Otsego County
Income Overview in Otsego County
Per Capita Income in Otsego County is $34,573, while median incomes of families and households are $82,486 and $65,778 respectively.
| Characteristic | Number | Measure |
| Per Capita Income | 59,678 | $34,573 |
| Median Family Income | 13,767 | $82,486 |
| Mean Family Income | 13,767 | $105,399 |
| Median Household Income | 22,305 | $65,778 |
| Mean Household Income | 22,305 | $86,624 |
| Income Deficit | 13,767 | $9,100 |
| Wage / Income Gap (%) | 59,678 | 29.67% |
| Wage / Income Gap ($) | 59,678 | 70.33¢ per $1 |
| Gini / Inequality Index | 59,678 | 0.45 |
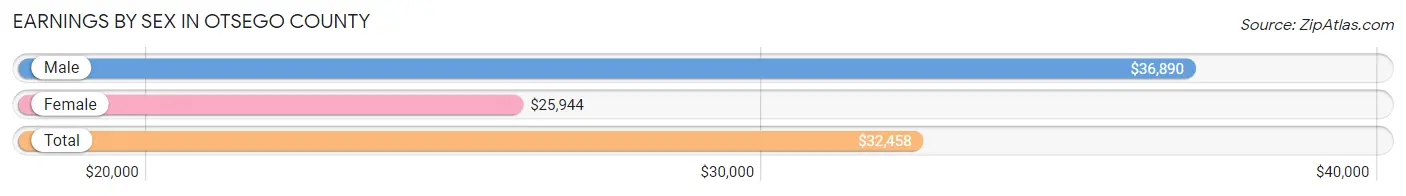
Earnings by Sex in Otsego County
Average Earnings in Otsego County are $32,458, $36,890 for men and $25,944 for women, a difference of 29.7%.
| Sex | Number | Average Earnings |
| Male | 16,496 (50.4%) | $36,890 |
| Female | 16,221 (49.6%) | $25,944 |
| Total | 32,717 (100.0%) | $32,458 |
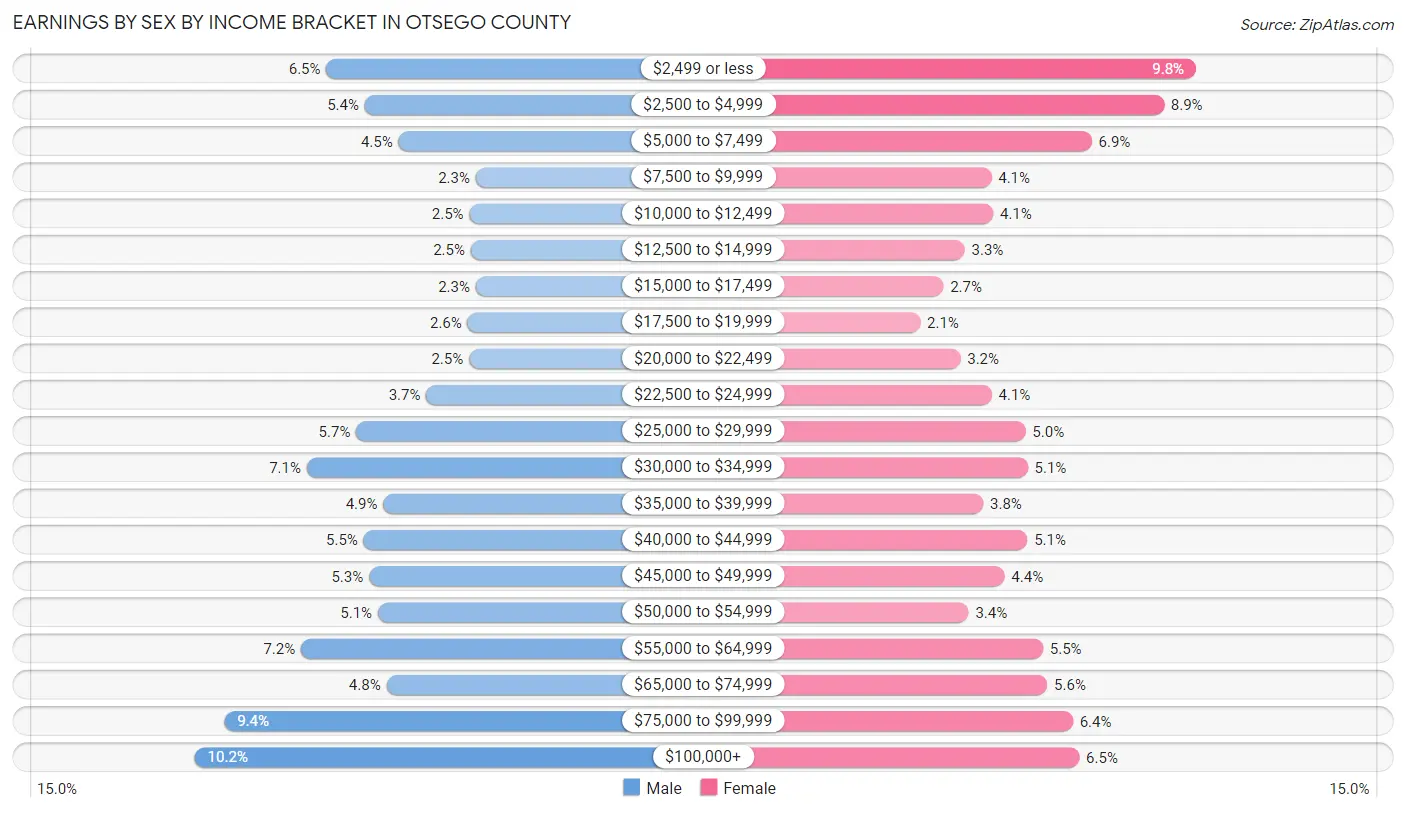
Earnings by Sex by Income Bracket in Otsego County
The most common earnings brackets in Otsego County are $100,000+ for men (1,686 | 10.2%) and $2,499 or less for women (1,592 | 9.8%).
| Income | Male | Female |
| $2,499 or less | 1,076 (6.5%) | 1,592 (9.8%) |
| $2,500 to $4,999 | 897 (5.4%) | 1,446 (8.9%) |
| $5,000 to $7,499 | 740 (4.5%) | 1,116 (6.9%) |
| $7,500 to $9,999 | 382 (2.3%) | 659 (4.1%) |
| $10,000 to $12,499 | 412 (2.5%) | 666 (4.1%) |
| $12,500 to $14,999 | 406 (2.5%) | 537 (3.3%) |
| $15,000 to $17,499 | 382 (2.3%) | 439 (2.7%) |
| $17,500 to $19,999 | 420 (2.5%) | 334 (2.1%) |
| $20,000 to $22,499 | 414 (2.5%) | 517 (3.2%) |
| $22,500 to $24,999 | 612 (3.7%) | 661 (4.1%) |
| $25,000 to $29,999 | 937 (5.7%) | 815 (5.0%) |
| $30,000 to $34,999 | 1,167 (7.1%) | 824 (5.1%) |
| $35,000 to $39,999 | 812 (4.9%) | 622 (3.8%) |
| $40,000 to $44,999 | 902 (5.5%) | 822 (5.1%) |
| $45,000 to $49,999 | 877 (5.3%) | 718 (4.4%) |
| $50,000 to $54,999 | 837 (5.1%) | 555 (3.4%) |
| $55,000 to $64,999 | 1,192 (7.2%) | 894 (5.5%) |
| $65,000 to $74,999 | 796 (4.8%) | 914 (5.6%) |
| $75,000 to $99,999 | 1,549 (9.4%) | 1,030 (6.4%) |
| $100,000+ | 1,686 (10.2%) | 1,060 (6.5%) |
| Total | 16,496 (100.0%) | 16,221 (100.0%) |
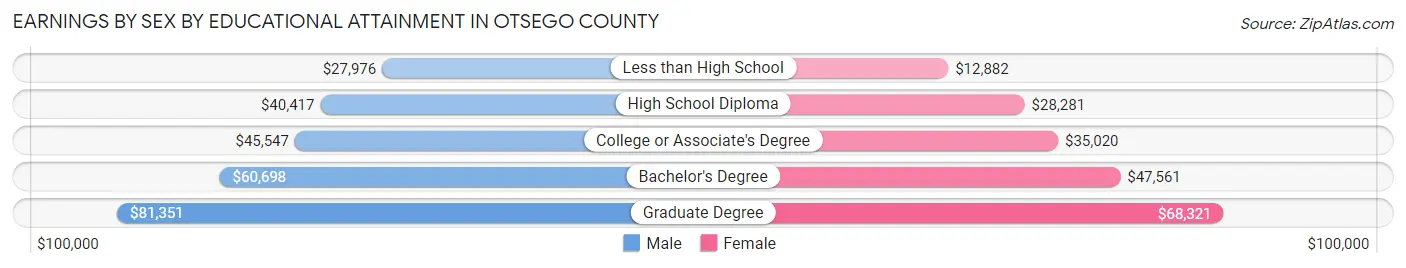
Earnings by Sex by Educational Attainment in Otsego County
Average earnings in Otsego County are $47,552 for men and $40,084 for women, a difference of 15.7%. Men with an educational attainment of graduate degree enjoy the highest average annual earnings of $81,351, while those with less than high school education earn the least with $27,976. Women with an educational attainment of graduate degree earn the most with the average annual earnings of $68,321, while those with less than high school education have the smallest earnings of $12,882.
| Educational Attainment | Male Income | Female Income |
| Less than High School | $27,976 | $12,882 |
| High School Diploma | $40,417 | $28,281 |
| College or Associate's Degree | $45,547 | $35,020 |
| Bachelor's Degree | $60,698 | $47,561 |
| Graduate Degree | $81,351 | $68,321 |
| Total | $47,552 | $40,084 |
Family Income in Otsego County
Family Income Brackets in Otsego County
According to the Otsego County family income data, there are 2,960 families falling into the $100,000 to $149,999 income range, which is the most common income bracket and makes up 21.5% of all families. Conversely, the $10,000 to $14,999 income bracket is the least frequent group with only 220 families (1.6%) belonging to this category.
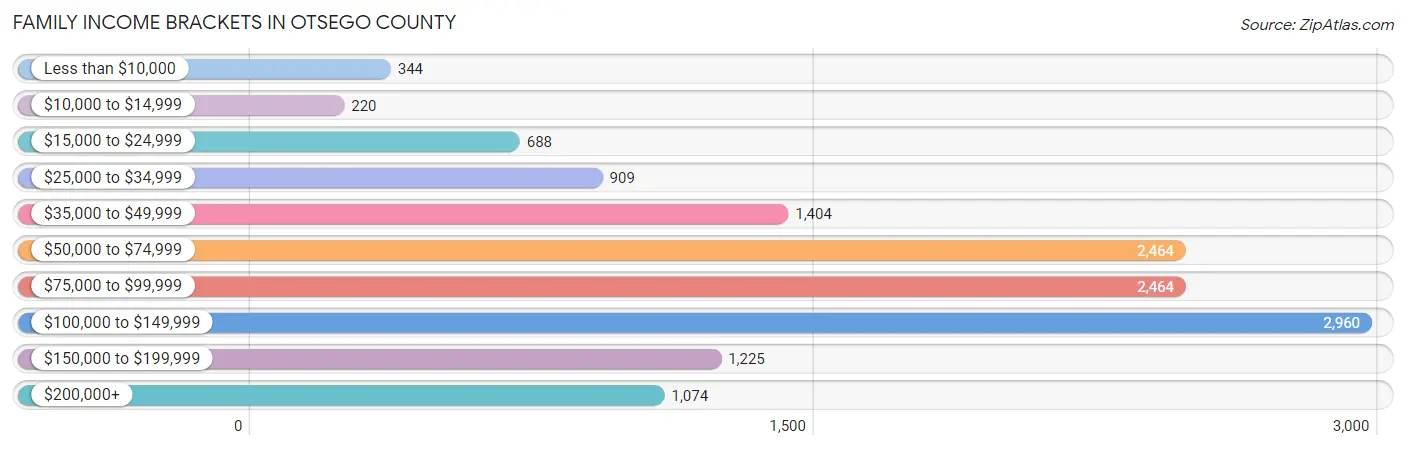
| Income Bracket | # Families | % Families |
| Less than $10,000 | 344 | 2.5% |
| $10,000 to $14,999 | 220 | 1.6% |
| $15,000 to $24,999 | 688 | 5.0% |
| $25,000 to $34,999 | 909 | 6.6% |
| $35,000 to $49,999 | 1,404 | 10.2% |
| $50,000 to $74,999 | 2,464 | 17.9% |
| $75,000 to $99,999 | 2,464 | 17.9% |
| $100,000 to $149,999 | 2,960 | 21.5% |
| $150,000 to $199,999 | 1,225 | 8.9% |
| $200,000+ | 1,074 | 7.8% |
Family Income by Famaliy Size in Otsego County
5-person families (618 | 4.5%) account for the highest median family income in Otsego County with $134,779 per family, while 2-person families (7,874 | 57.2%) have the highest median income of $37,586 per family member.
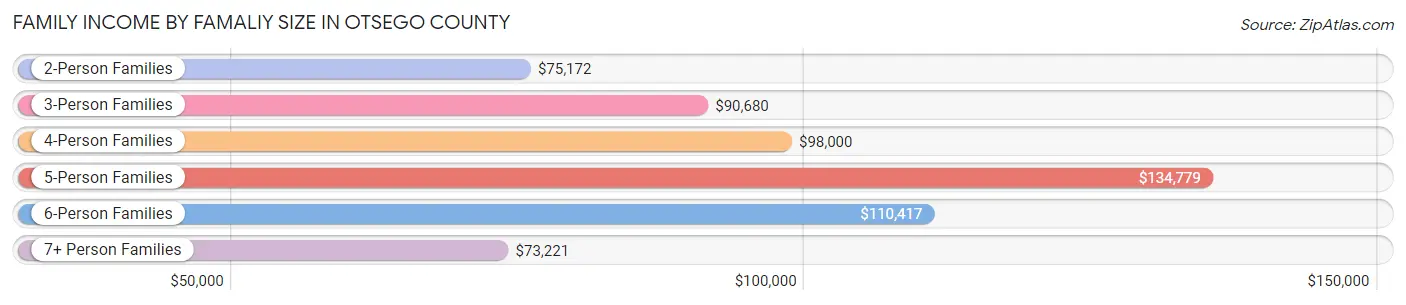
| Income Bracket | # Families | Median Income |
| 2-Person Families | 7,874 (57.2%) | $75,172 |
| 3-Person Families | 2,953 (21.4%) | $90,680 |
| 4-Person Families | 1,864 (13.5%) | $98,000 |
| 5-Person Families | 618 (4.5%) | $134,779 |
| 6-Person Families | 283 (2.1%) | $110,417 |
| 7+ Person Families | 175 (1.3%) | $73,221 |
| Total | 13,767 (100.0%) | $82,486 |
Family Income by Number of Earners in Otsego County
The median family income in Otsego County is $82,486, with families comprising 3+ earners (1,151) having the highest median family income of $143,898, while families with no earners (2,673) have the lowest median family income of $53,601, accounting for 8.4% and 19.4% of families, respectively.
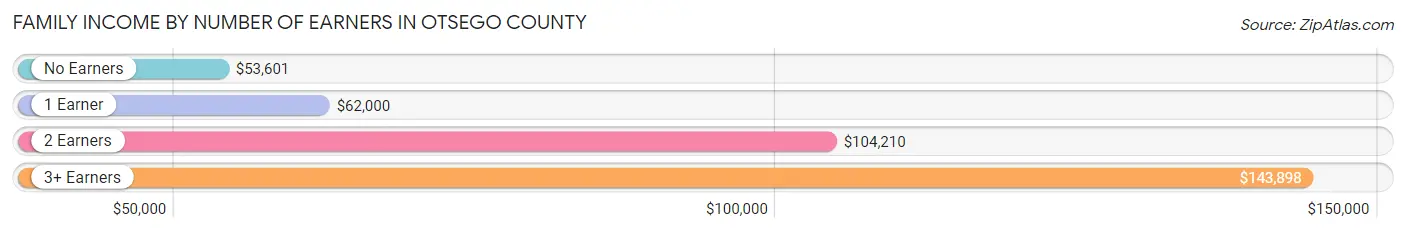
| Number of Earners | # Families | Median Income |
| No Earners | 2,673 (19.4%) | $53,601 |
| 1 Earner | 4,520 (32.8%) | $62,000 |
| 2 Earners | 5,423 (39.4%) | $104,210 |
| 3+ Earners | 1,151 (8.4%) | $143,898 |
| Total | 13,767 (100.0%) | $82,486 |
Household Income in Otsego County
Household Income Brackets in Otsego County
With 4,349 households falling in the category, the $50,000 to $74,999 income range is the most frequent in Otsego County, accounting for 19.5% of all households. In contrast, only 1,004 households (4.5%) fall into the $10,000 to $14,999 income bracket, making it the least populous group.
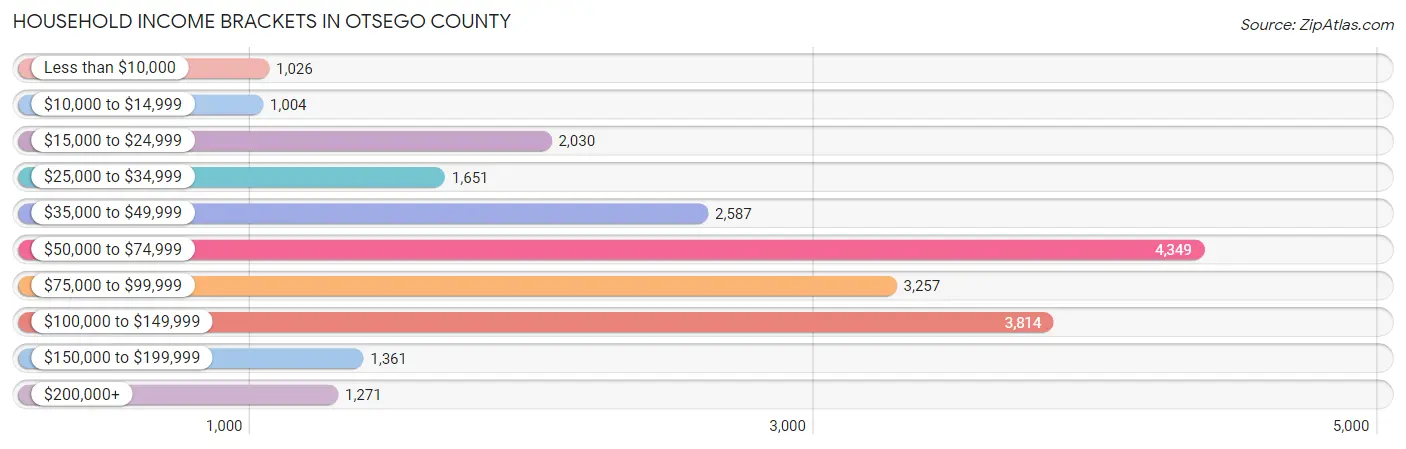
| Income Bracket | # Households | % Households |
| Less than $10,000 | 1,026 | 4.6% |
| $10,000 to $14,999 | 1,004 | 4.5% |
| $15,000 to $24,999 | 2,030 | 9.1% |
| $25,000 to $34,999 | 1,651 | 7.4% |
| $35,000 to $49,999 | 2,587 | 11.6% |
| $50,000 to $74,999 | 4,349 | 19.5% |
| $75,000 to $99,999 | 3,257 | 14.6% |
| $100,000 to $149,999 | 3,814 | 17.1% |
| $150,000 to $199,999 | 1,361 | 6.1% |
| $200,000+ | 1,271 | 5.7% |
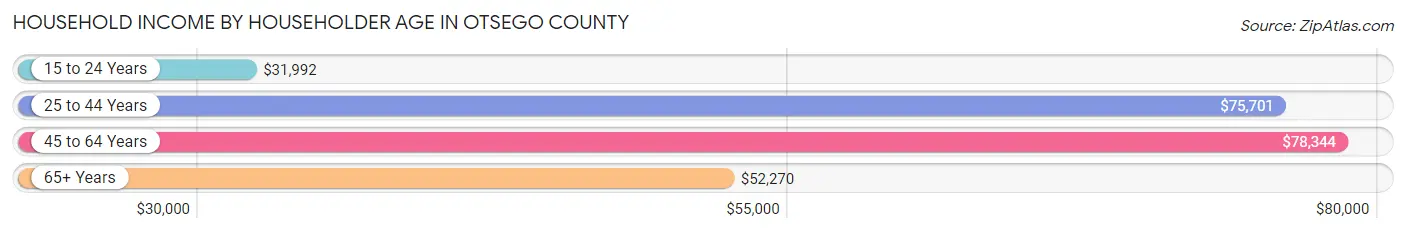
Household Income by Householder Age in Otsego County
The median household income in Otsego County is $65,778, with the highest median household income of $78,344 found in the 45 to 64 years age bracket for the primary householder. A total of 8,452 households (37.9%) fall into this category. Meanwhile, the 15 to 24 years age bracket for the primary householder has the lowest median household income of $31,992, with 933 households (4.2%) in this group.
| Income Bracket | # Households | Median Income |
| 15 to 24 Years | 933 (4.2%) | $31,992 |
| 25 to 44 Years | 5,160 (23.1%) | $75,701 |
| 45 to 64 Years | 8,452 (37.9%) | $78,344 |
| 65+ Years | 7,760 (34.8%) | $52,270 |
| Total | 22,305 (100.0%) | $65,778 |
Poverty in Otsego County
Income Below Poverty by Sex and Age in Otsego County
With 10.7% poverty level for males and 15.2% for females among the residents of Otsego County, under 5 year old males and 18 to 24 year old females are the most vulnerable to poverty, with 250 males (21.6%) and 1,331 females (38.5%) in their respective age groups living below the poverty level.
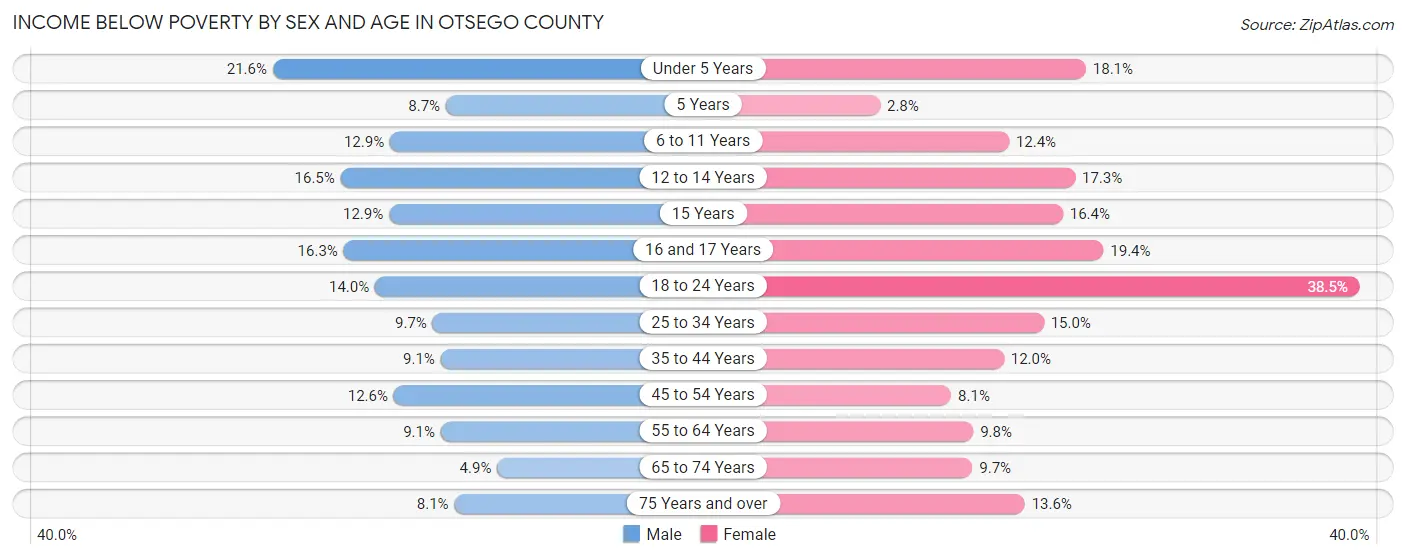
| Age Bracket | Male | Female |
| Under 5 Years | 250 (21.6%) | 199 (18.1%) |
| 5 Years | 17 (8.7%) | 5 (2.8%) |
| 6 to 11 Years | 181 (12.9%) | 189 (12.4%) |
| 12 to 14 Years | 168 (16.5%) | 136 (17.3%) |
| 15 Years | 33 (12.9%) | 54 (16.4%) |
| 16 and 17 Years | 85 (16.3%) | 87 (19.4%) |
| 18 to 24 Years | 465 (14.0%) | 1,331 (38.5%) |
| 25 to 34 Years | 299 (9.7%) | 420 (15.0%) |
| 35 to 44 Years | 264 (9.1%) | 345 (12.0%) |
| 45 to 54 Years | 411 (12.6%) | 265 (8.1%) |
| 55 to 64 Years | 376 (9.1%) | 419 (9.8%) |
| 65 to 74 Years | 180 (4.9%) | 358 (9.7%) |
| 75 Years and over | 181 (8.1%) | 372 (13.6%) |
| Total | 2,910 (10.7%) | 4,180 (15.2%) |
Income Above Poverty by Sex and Age in Otsego County
According to the poverty statistics in Otsego County, males aged 65 to 74 years and females aged 5 years are the age groups that are most secure financially, with 95.1% of males and 97.2% of females in these age groups living above the poverty line.
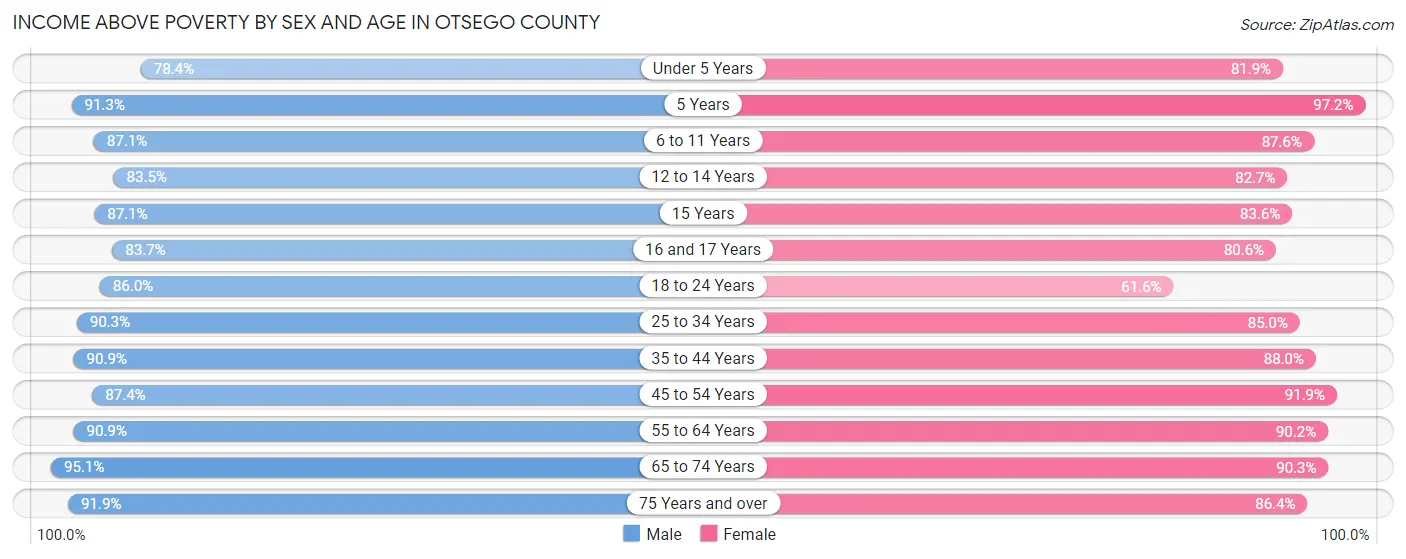
| Age Bracket | Male | Female |
| Under 5 Years | 909 (78.4%) | 899 (81.9%) |
| 5 Years | 178 (91.3%) | 171 (97.2%) |
| 6 to 11 Years | 1,225 (87.1%) | 1,334 (87.6%) |
| 12 to 14 Years | 848 (83.5%) | 649 (82.7%) |
| 15 Years | 222 (87.1%) | 275 (83.6%) |
| 16 and 17 Years | 436 (83.7%) | 361 (80.6%) |
| 18 to 24 Years | 2,862 (86.0%) | 2,131 (61.6%) |
| 25 to 34 Years | 2,782 (90.3%) | 2,382 (85.0%) |
| 35 to 44 Years | 2,635 (90.9%) | 2,524 (88.0%) |
| 45 to 54 Years | 2,853 (87.4%) | 3,000 (91.9%) |
| 55 to 64 Years | 3,754 (90.9%) | 3,876 (90.2%) |
| 65 to 74 Years | 3,483 (95.1%) | 3,335 (90.3%) |
| 75 Years and over | 2,055 (91.9%) | 2,367 (86.4%) |
| Total | 24,242 (89.3%) | 23,304 (84.8%) |
Income Below Poverty Among Married-Couple Families in Otsego County
The poverty statistics for married-couple families in Otsego County show that 3.8% or 408 of the total 10,861 families live below the poverty line. Families with 5 or more children have the highest poverty rate of 30.1%, comprising of 25 families. On the other hand, families with no children have the lowest poverty rate of 2.2%, which includes 170 families.
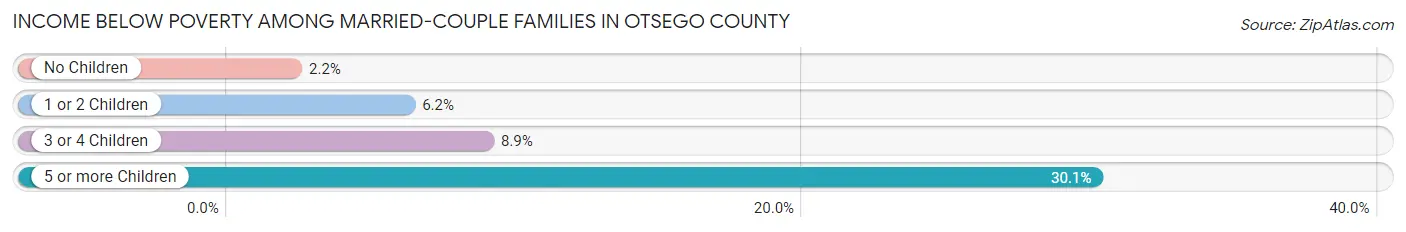
| Children | Above Poverty | Below Poverty |
| No Children | 7,439 (97.8%) | 170 (2.2%) |
| 1 or 2 Children | 2,373 (93.8%) | 156 (6.2%) |
| 3 or 4 Children | 583 (91.1%) | 57 (8.9%) |
| 5 or more Children | 58 (69.9%) | 25 (30.1%) |
| Total | 10,453 (96.2%) | 408 (3.8%) |
Income Below Poverty Among Single-Parent Households in Otsego County
According to the poverty data in Otsego County, 13.3% or 137 single-father households and 27.1% or 508 single-mother households are living below the poverty line. Among single-father households, those with 5 or more children have the highest poverty rate, with 2 households (40.0%) experiencing poverty. Likewise, among single-mother households, those with 5 or more children have the highest poverty rate, with 30 households (85.7%) falling below the poverty line.
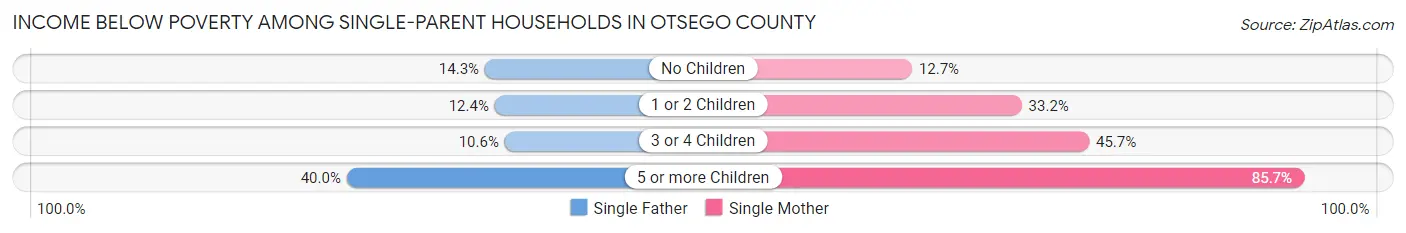
| Children | Single Father | Single Mother |
| No Children | 78 (14.3%) | 88 (12.7%) |
| 1 or 2 Children | 44 (12.4%) | 358 (33.2%) |
| 3 or 4 Children | 13 (10.6%) | 32 (45.7%) |
| 5 or more Children | 2 (40.0%) | 30 (85.7%) |
| Total | 137 (13.3%) | 508 (27.1%) |
Income Below Poverty Among Married-Couple vs Single-Parent Households in Otsego County
The poverty data for Otsego County shows that 408 of the married-couple family households (3.8%) and 645 of the single-parent households (22.2%) are living below the poverty level. Within the married-couple family households, those with 5 or more children have the highest poverty rate, with 25 households (30.1%) falling below the poverty line. Among the single-parent households, those with 5 or more children have the highest poverty rate, with 32 household (80.0%) living below poverty.
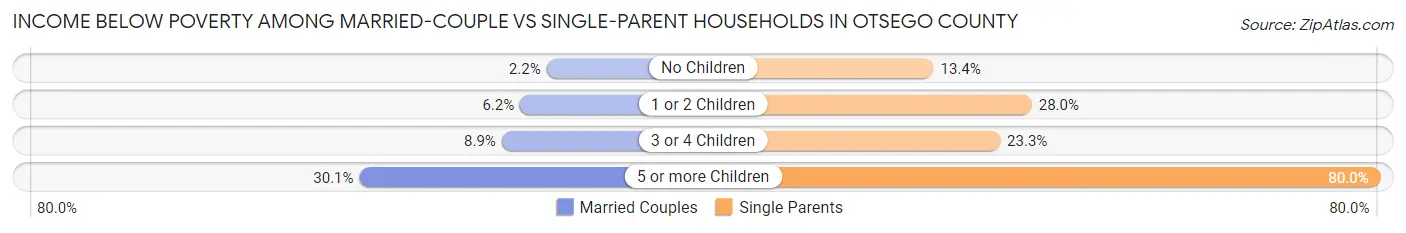
| Children | Married-Couple Families | Single-Parent Households |
| No Children | 170 (2.2%) | 166 (13.4%) |
| 1 or 2 Children | 156 (6.2%) | 402 (28.0%) |
| 3 or 4 Children | 57 (8.9%) | 45 (23.3%) |
| 5 or more Children | 25 (30.1%) | 32 (80.0%) |
| Total | 408 (3.8%) | 645 (22.2%) |
Race in Otsego County
The most populous races in Otsego County are White / Caucasian (54,377 | 91.1%), Hispanic or Latino (2,506 | 4.2%), and Two or more Races (2,300 | 3.8%).
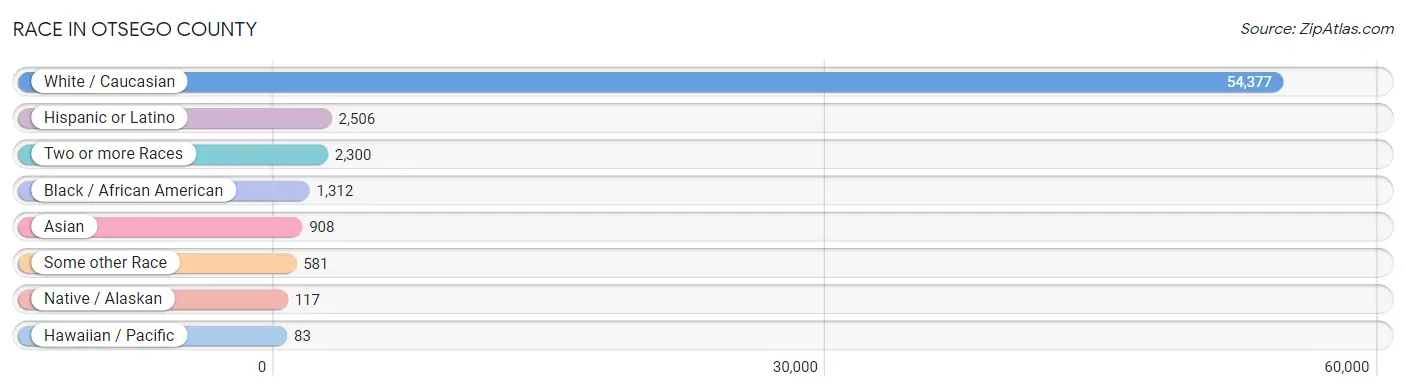
| Race | # Population | % Population |
| Asian | 908 | 1.5% |
| Black / African American | 1,312 | 2.2% |
| Hawaiian / Pacific | 83 | 0.1% |
| Hispanic or Latino | 2,506 | 4.2% |
| Native / Alaskan | 117 | 0.2% |
| White / Caucasian | 54,377 | 91.1% |
| Two or more Races | 2,300 | 3.8% |
| Some other Race | 581 | 1.0% |
| Total | 59,678 | 100.0% |
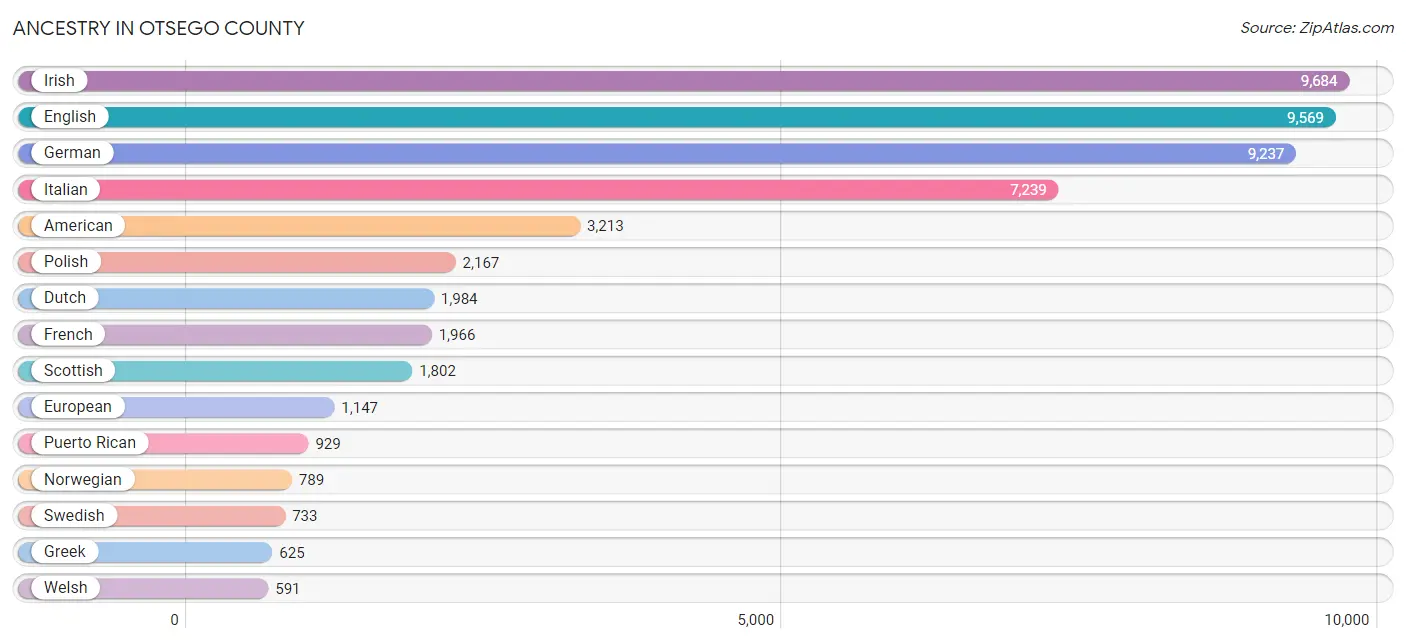
Ancestry in Otsego County
The most populous ancestries reported in Otsego County are Irish (9,684 | 16.2%), English (9,569 | 16.0%), German (9,237 | 15.5%), Italian (7,239 | 12.1%), and American (3,213 | 5.4%), together accounting for 65.2% of all Otsego County residents.
| Ancestry | # Population | % Population |
| Afghan | 3 | 0.0% |
| African | 78 | 0.1% |
| Albanian | 47 | 0.1% |
| American | 3,213 | 5.4% |
| Apache | 4 | 0.0% |
| Arab | 151 | 0.3% |
| Argentinean | 5 | 0.0% |
| Armenian | 18 | 0.0% |
| Australian | 4 | 0.0% |
| Austrian | 148 | 0.3% |
| Barbadian | 7 | 0.0% |
| Basque | 9 | 0.0% |
| Belgian | 32 | 0.1% |
| Bhutanese | 75 | 0.1% |
| Blackfeet | 3 | 0.0% |
| Brazilian | 12 | 0.0% |
| British | 383 | 0.6% |
| British West Indian | 39 | 0.1% |
| Burmese | 113 | 0.2% |
| Canadian | 168 | 0.3% |
| Central American | 181 | 0.3% |
| Central American Indian | 108 | 0.2% |
| Cherokee | 41 | 0.1% |
| Choctaw | 9 | 0.0% |
| Colombian | 74 | 0.1% |
| Croatian | 62 | 0.1% |
| Cuban | 89 | 0.2% |
| Czech | 318 | 0.5% |
| Czechoslovakian | 44 | 0.1% |
| Danish | 344 | 0.6% |
| Delaware | 6 | 0.0% |
| Dominican | 143 | 0.2% |
| Dutch | 1,984 | 3.3% |
| Eastern European | 172 | 0.3% |
| Ecuadorian | 189 | 0.3% |
| Egyptian | 4 | 0.0% |
| English | 9,569 | 16.0% |
| European | 1,147 | 1.9% |
| Filipino | 6 | 0.0% |
| Finnish | 85 | 0.1% |
| French | 1,966 | 3.3% |
| French American Indian | 5 | 0.0% |
| French Canadian | 370 | 0.6% |
| German | 9,237 | 15.5% |
| Ghanaian | 4 | 0.0% |
| Greek | 625 | 1.1% |
| Guamanian / Chamorro | 10 | 0.0% |
| Guatemalan | 88 | 0.2% |
| Guyanese | 5 | 0.0% |
| Haitian | 62 | 0.1% |
| Hungarian | 321 | 0.5% |
| Icelander | 18 | 0.0% |
| Indian (Asian) | 414 | 0.7% |
| Iranian | 24 | 0.0% |
| Irish | 9,684 | 16.2% |
| Iroquois | 98 | 0.2% |
| Italian | 7,239 | 12.1% |
| Jamaican | 22 | 0.0% |
| Kenyan | 3 | 0.0% |
| Korean | 158 | 0.3% |
| Latvian | 1 | 0.0% |
| Lebanese | 127 | 0.2% |
| Lithuanian | 155 | 0.3% |
| Maltese | 48 | 0.1% |
| Mexican | 327 | 0.5% |
| Native Hawaiian | 20 | 0.0% |
| Nigerian | 20 | 0.0% |
| Northern European | 84 | 0.1% |
| Norwegian | 789 | 1.3% |
| Pakistani | 5 | 0.0% |
| Palestinian | 14 | 0.0% |
| Panamanian | 17 | 0.0% |
| Paraguayan | 16 | 0.0% |
| Pennsylvania German | 118 | 0.2% |
| Peruvian | 46 | 0.1% |
| Polish | 2,167 | 3.6% |
| Portuguese | 52 | 0.1% |
| Puerto Rican | 929 | 1.6% |
| Romanian | 45 | 0.1% |
| Russian | 452 | 0.8% |
| Salvadoran | 76 | 0.1% |
| Scandinavian | 360 | 0.6% |
| Scotch-Irish | 473 | 0.8% |
| Scottish | 1,802 | 3.0% |
| Serbian | 48 | 0.1% |
| Sioux | 40 | 0.1% |
| Slavic | 78 | 0.1% |
| Slovak | 104 | 0.2% |
| Slovene | 49 | 0.1% |
| South African | 9 | 0.0% |
| South American | 330 | 0.5% |
| Spaniard | 160 | 0.3% |
| Spanish | 10 | 0.0% |
| Sri Lankan | 2 | 0.0% |
| Subsaharan African | 140 | 0.2% |
| Swedish | 733 | 1.2% |
| Swiss | 320 | 0.5% |
| Thai | 173 | 0.3% |
| Trinidadian and Tobagonian | 9 | 0.0% |
| Turkish | 6 | 0.0% |
| Ukrainian | 218 | 0.4% |
| Welsh | 591 | 1.0% |
| West Indian | 36 | 0.1% |
| Yugoslavian | 56 | 0.1% | View All 104 Rows |
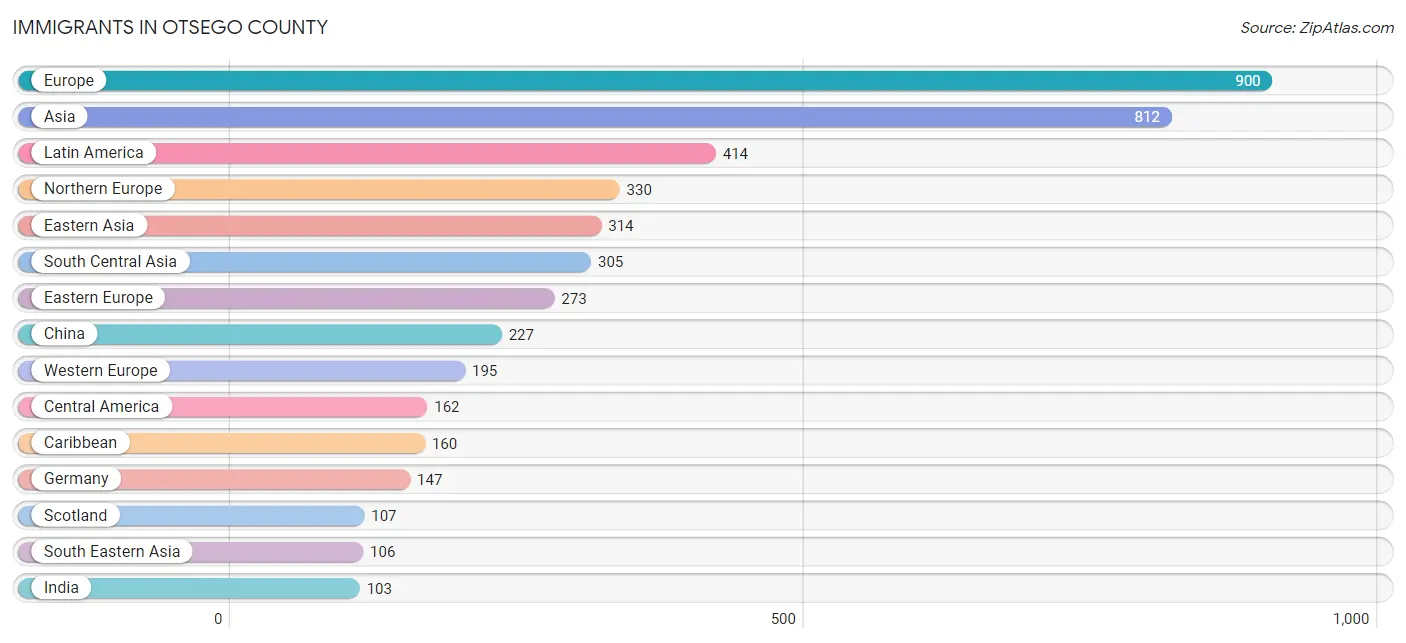
Immigrants in Otsego County
The most numerous immigrant groups reported in Otsego County came from Europe (900 | 1.5%), Asia (812 | 1.4%), Latin America (414 | 0.7%), Northern Europe (330 | 0.5%), and Eastern Asia (314 | 0.5%), together accounting for 4.6% of all Otsego County residents.
| Immigration Origin | # Population | % Population |
| Africa | 63 | 0.1% |
| Argentina | 11 | 0.0% |
| Asia | 812 | 1.4% |
| Australia | 1 | 0.0% |
| Azores | 4 | 0.0% |
| Bangladesh | 73 | 0.1% |
| Belarus | 6 | 0.0% |
| Belgium | 24 | 0.0% |
| Belize | 6 | 0.0% |
| Bosnia and Herzegovina | 15 | 0.0% |
| Brazil | 11 | 0.0% |
| Canada | 99 | 0.2% |
| Caribbean | 160 | 0.3% |
| Central America | 162 | 0.3% |
| Chile | 1 | 0.0% |
| China | 227 | 0.4% |
| Colombia | 5 | 0.0% |
| Croatia | 10 | 0.0% |
| Cuba | 80 | 0.1% |
| Czechoslovakia | 44 | 0.1% |
| Denmark | 63 | 0.1% |
| Dominica | 24 | 0.0% |
| Dominican Republic | 28 | 0.1% |
| Eastern Africa | 17 | 0.0% |
| Eastern Asia | 314 | 0.5% |
| Eastern Europe | 273 | 0.5% |
| Ecuador | 37 | 0.1% |
| Egypt | 6 | 0.0% |
| El Salvador | 9 | 0.0% |
| England | 58 | 0.1% |
| Ethiopia | 14 | 0.0% |
| Europe | 900 | 1.5% |
| France | 10 | 0.0% |
| Germany | 147 | 0.3% |
| Ghana | 4 | 0.0% |
| Greece | 65 | 0.1% |
| Grenada | 7 | 0.0% |
| Guatemala | 82 | 0.1% |
| Hong Kong | 15 | 0.0% |
| Hungary | 28 | 0.1% |
| India | 103 | 0.2% |
| Iran | 15 | 0.0% |
| Iraq | 18 | 0.0% |
| Ireland | 8 | 0.0% |
| Israel | 6 | 0.0% |
| Italy | 18 | 0.0% |
| Jamaica | 18 | 0.0% |
| Kenya | 3 | 0.0% |
| Korea | 87 | 0.2% |
| Kuwait | 23 | 0.0% |
| Latin America | 414 | 0.7% |
| Lebanon | 34 | 0.1% |
| Mexico | 50 | 0.1% |
| Nepal | 41 | 0.1% |
| Netherlands | 7 | 0.0% |
| Nicaragua | 15 | 0.0% |
| Northern Africa | 6 | 0.0% |
| Northern Europe | 330 | 0.5% |
| Norway | 36 | 0.1% |
| Oceania | 1 | 0.0% |
| Pakistan | 70 | 0.1% |
| Peru | 11 | 0.0% |
| Philippines | 81 | 0.1% |
| Poland | 46 | 0.1% |
| Portugal | 4 | 0.0% |
| Romania | 17 | 0.0% |
| Russia | 3 | 0.0% |
| Scotland | 107 | 0.2% |
| Serbia | 16 | 0.0% |
| Singapore | 20 | 0.0% |
| South Africa | 27 | 0.1% |
| South America | 92 | 0.2% |
| South Central Asia | 305 | 0.5% |
| South Eastern Asia | 106 | 0.2% |
| Southern Europe | 101 | 0.2% |
| Spain | 14 | 0.0% |
| Sri Lanka | 3 | 0.0% |
| Sweden | 9 | 0.0% |
| Switzerland | 7 | 0.0% |
| Taiwan | 6 | 0.0% |
| Thailand | 5 | 0.0% |
| Trinidad and Tobago | 3 | 0.0% |
| Ukraine | 5 | 0.0% |
| Western Africa | 4 | 0.0% |
| Western Asia | 81 | 0.1% |
| Western Europe | 195 | 0.3% | View All 86 Rows |
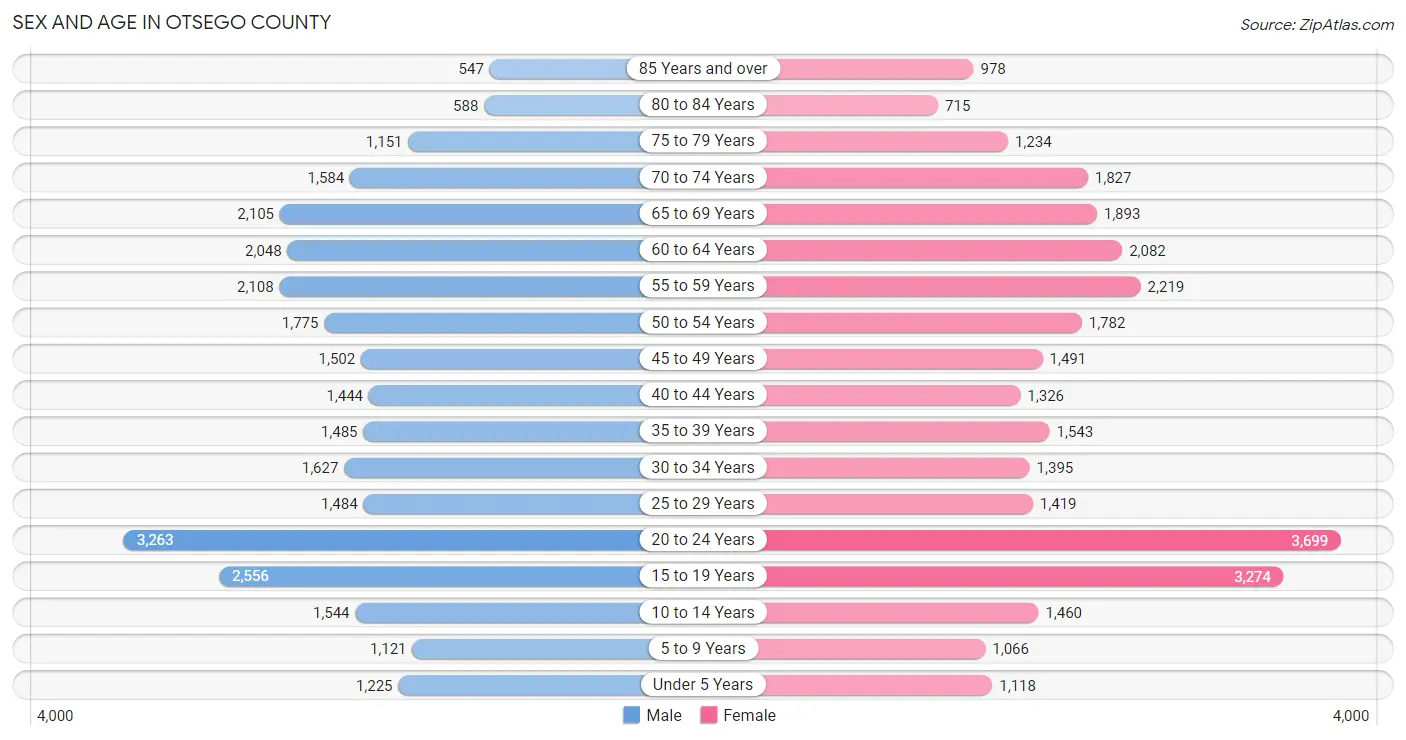
Sex and Age in Otsego County
Sex and Age in Otsego County
The most populous age groups in Otsego County are 20 to 24 Years (3,263 | 11.2%) for men and 20 to 24 Years (3,699 | 12.1%) for women.
| Age Bracket | Male | Female |
| Under 5 Years | 1,225 (4.2%) | 1,118 (3.7%) |
| 5 to 9 Years | 1,121 (3.8%) | 1,066 (3.5%) |
| 10 to 14 Years | 1,544 (5.3%) | 1,460 (4.8%) |
| 15 to 19 Years | 2,556 (8.8%) | 3,274 (10.7%) |
| 20 to 24 Years | 3,263 (11.2%) | 3,699 (12.1%) |
| 25 to 29 Years | 1,484 (5.1%) | 1,419 (4.6%) |
| 30 to 34 Years | 1,627 (5.6%) | 1,395 (4.6%) |
| 35 to 39 Years | 1,485 (5.1%) | 1,543 (5.1%) |
| 40 to 44 Years | 1,444 (5.0%) | 1,326 (4.3%) |
| 45 to 49 Years | 1,502 (5.1%) | 1,491 (4.9%) |
| 50 to 54 Years | 1,775 (6.1%) | 1,782 (5.8%) |
| 55 to 59 Years | 2,108 (7.2%) | 2,219 (7.3%) |
| 60 to 64 Years | 2,048 (7.0%) | 2,082 (6.8%) |
| 65 to 69 Years | 2,105 (7.2%) | 1,893 (6.2%) |
| 70 to 74 Years | 1,584 (5.4%) | 1,827 (6.0%) |
| 75 to 79 Years | 1,151 (4.0%) | 1,234 (4.0%) |
| 80 to 84 Years | 588 (2.0%) | 715 (2.3%) |
| 85 Years and over | 547 (1.9%) | 978 (3.2%) |
| Total | 29,157 (100.0%) | 30,521 (100.0%) |
Families and Households in Otsego County
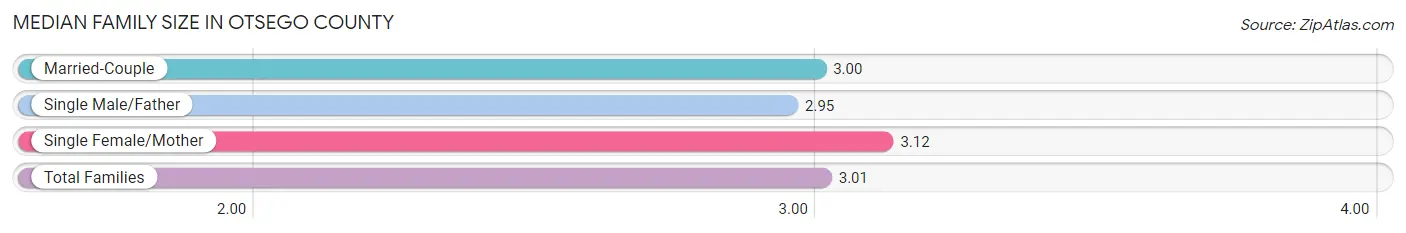
Median Family Size in Otsego County
The median family size in Otsego County is 3.01 persons per family, with single female/mother families (1,877 | 13.6%) accounting for the largest median family size of 3.12 persons per family. On the other hand, single male/father families (1,029 | 7.5%) represent the smallest median family size with 2.95 persons per family.
| Family Type | # Families | Family Size |
| Married-Couple | 10,861 (78.9%) | 3.00 |
| Single Male/Father | 1,029 (7.5%) | 2.95 |
| Single Female/Mother | 1,877 (13.6%) | 3.12 |
| Total Families | 13,767 (100.0%) | 3.01 |
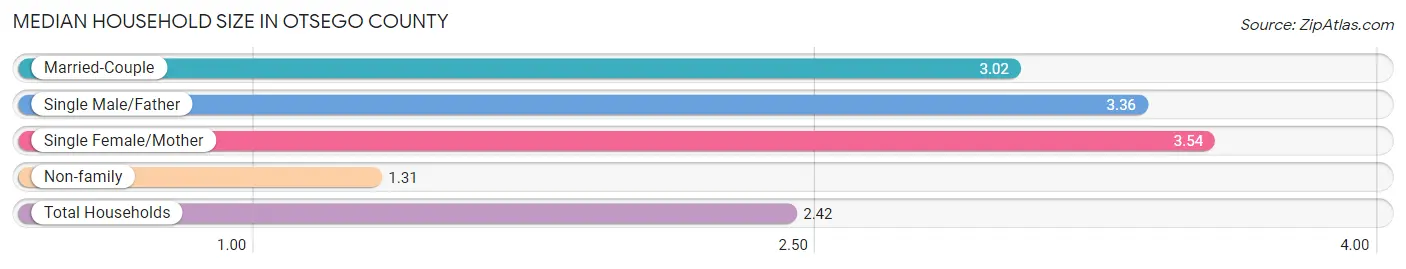
Median Household Size in Otsego County
The median household size in Otsego County is 2.42 persons per household, with single female/mother households (1,877 | 8.4%) accounting for the largest median household size of 3.54 persons per household. non-family households (8,538 | 38.3%) represent the smallest median household size with 1.31 persons per household.
| Household Type | # Households | Household Size |
| Married-Couple | 10,861 (48.7%) | 3.02 |
| Single Male/Father | 1,029 (4.6%) | 3.36 |
| Single Female/Mother | 1,877 (8.4%) | 3.54 |
| Non-family | 8,538 (38.3%) | 1.31 |
| Total Households | 22,305 (100.0%) | 2.42 |
Household Size by Marriage Status in Otsego County
Out of a total of 22,305 households in Otsego County, 13,767 (61.7%) are family households, while 8,538 (38.3%) are nonfamily households. The most numerous type of family households are 2-person households, comprising 7,296, and the most common type of nonfamily households are 1-person households, comprising 6,937.
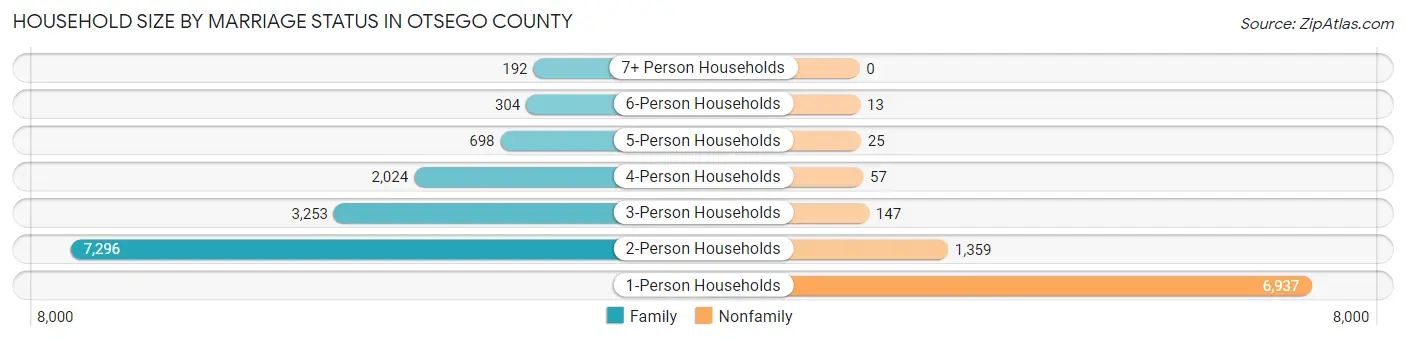
| Household Size | Family Households | Nonfamily Households |
| 1-Person Households | - | 6,937 (31.1%) |
| 2-Person Households | 7,296 (32.7%) | 1,359 (6.1%) |
| 3-Person Households | 3,253 (14.6%) | 147 (0.7%) |
| 4-Person Households | 2,024 (9.1%) | 57 (0.3%) |
| 5-Person Households | 698 (3.1%) | 25 (0.1%) |
| 6-Person Households | 304 (1.4%) | 13 (0.1%) |
| 7+ Person Households | 192 (0.9%) | 0 (0.0%) |
| Total | 13,767 (61.7%) | 8,538 (38.3%) |
Female Fertility in Otsego County
Fertility by Age in Otsego County
Average fertility rate in Otsego County is 53.0 births per 1,000 women. Women in the age bracket of 20 to 34 years have the highest fertility rate with 87.0 births per 1,000 women. Women in the age bracket of 20 to 34 years acount for 74.9% of all women with births.
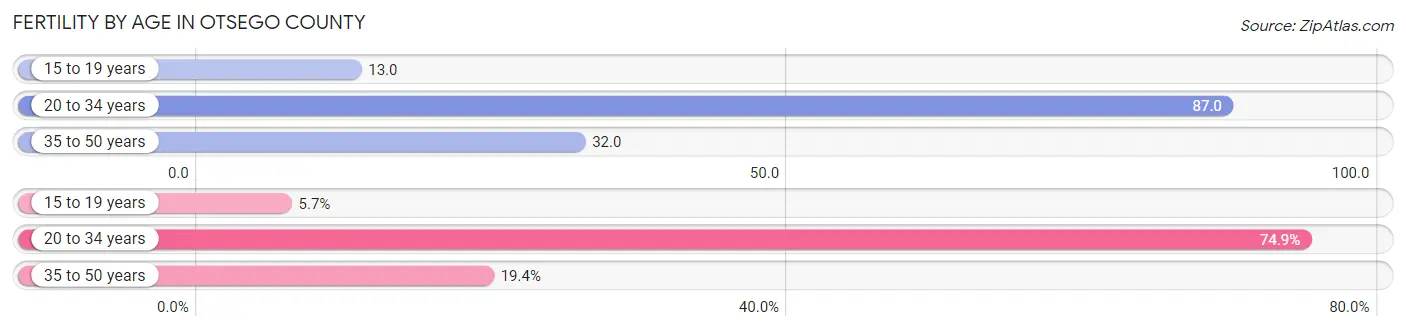
| Age Bracket | Women with Births | Births / 1,000 Women |
| 15 to 19 years | 43 (5.7%) | 13.0 |
| 20 to 34 years | 568 (74.9%) | 87.0 |
| 35 to 50 years | 147 (19.4%) | 32.0 |
| Total | 758 (100.0%) | 53.0 |
Fertility by Age by Marriage Status in Otsego County
56.1% of women with births (758) in Otsego County are married. The highest percentage of unmarried women with births falls into 15 to 19 years age bracket with 100.0% of them unmarried at the time of birth, while the lowest percentage of unmarried women with births belong to 35 to 50 years age bracket with 6.8% of them unmarried.
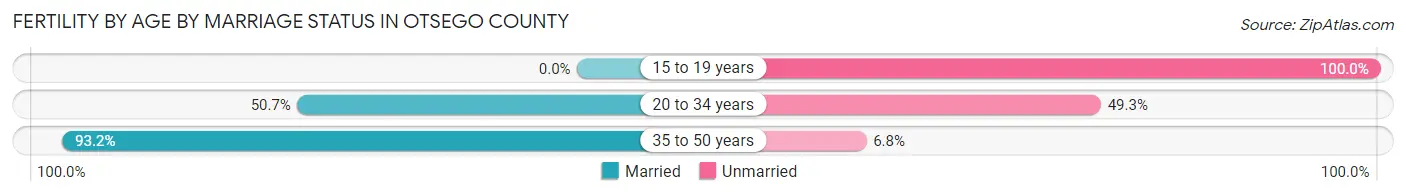
| Age Bracket | Married | Unmarried |
| 15 to 19 years | 0 (0.0%) | 43 (100.0%) |
| 20 to 34 years | 288 (50.7%) | 280 (49.3%) |
| 35 to 50 years | 137 (93.2%) | 10 (6.8%) |
| Total | 425 (56.1%) | 333 (43.9%) |
Fertility by Education in Otsego County
Average fertility rate in Otsego County is 53.0 births per 1,000 women. Women with the education attainment of less than high school have the highest fertility rate of 69.0 births per 1,000 women, while women with the education attainment of college or associate's degree have the lowest fertility at 43.0 births per 1,000 women. Women with the education attainment of college or associate's degree represent 30.2% of all women with births.
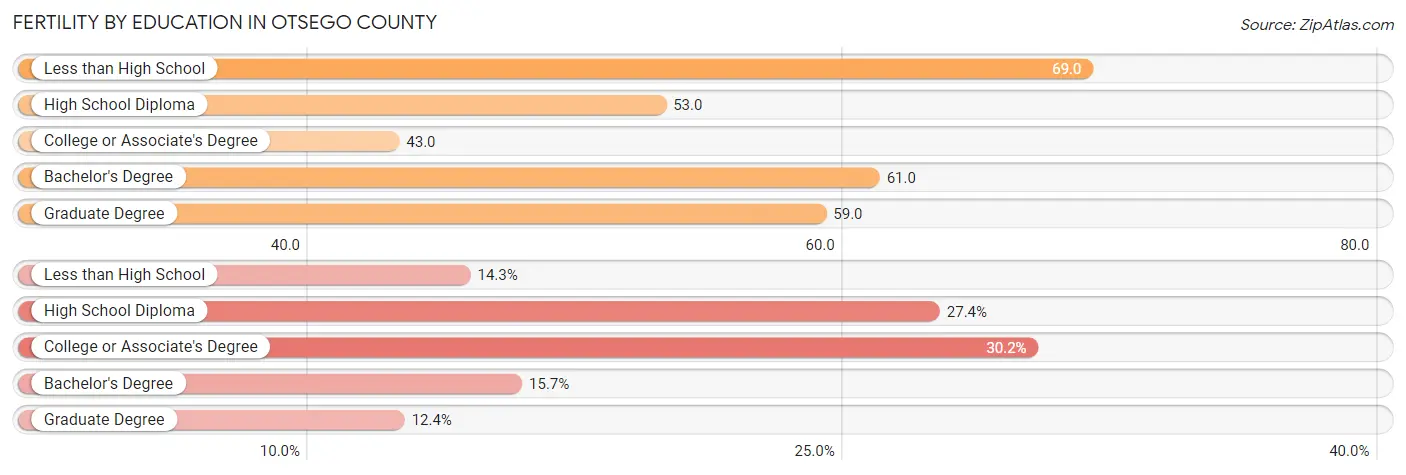
| Educational Attainment | Women with Births | Births / 1,000 Women |
| Less than High School | 108 (14.2%) | 69.0 |
| High School Diploma | 208 (27.4%) | 53.0 |
| College or Associate's Degree | 229 (30.2%) | 43.0 |
| Bachelor's Degree | 119 (15.7%) | 61.0 |
| Graduate Degree | 94 (12.4%) | 59.0 |
| Total | 758 (100.0%) | 53.0 |
Fertility by Education by Marriage Status in Otsego County
43.9% of women with births in Otsego County are unmarried. Women with the educational attainment of graduate degree are most likely to be married with 100.0% of them married at childbirth, while women with the educational attainment of less than high school are least likely to be married with 75.9% of them unmarried at childbirth.
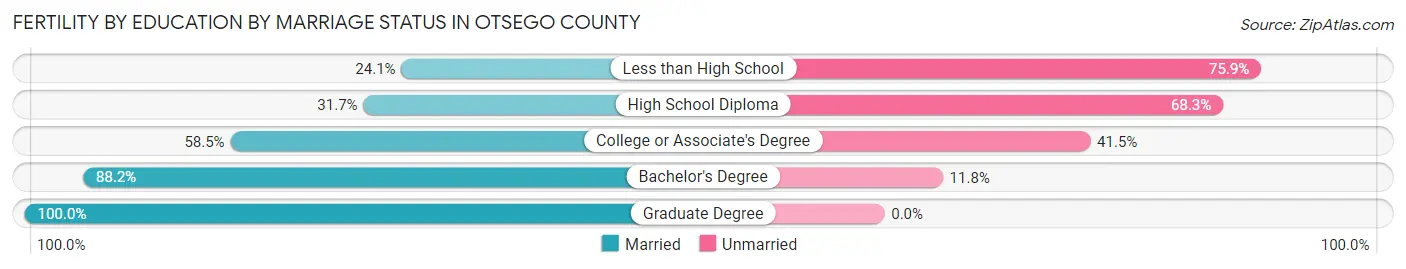
| Educational Attainment | Married | Unmarried |
| Less than High School | 26 (24.1%) | 82 (75.9%) |
| High School Diploma | 66 (31.7%) | 142 (68.3%) |
| College or Associate's Degree | 134 (58.5%) | 95 (41.5%) |
| Bachelor's Degree | 105 (88.2%) | 14 (11.8%) |
| Graduate Degree | 94 (100.0%) | 0 (0.0%) |
| Total | 425 (56.1%) | 333 (43.9%) |
Employment Characteristics in Otsego County
Employment by Class of Employer in Otsego County
Among the 26,908 employed individuals in Otsego County, private company employees (14,176 | 52.7%), not-for-profit organizations (4,640 | 17.2%), and local government employees (2,713 | 10.1%) make up the most common classes of employment.
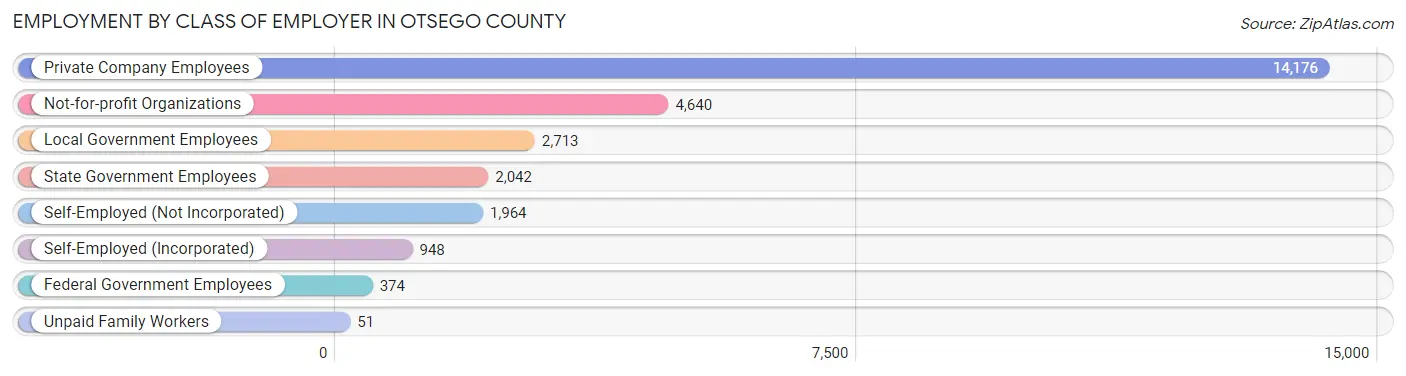
| Employer Class | # Employees | % Employees |
| Private Company Employees | 14,176 | 52.7% |
| Self-Employed (Incorporated) | 948 | 3.5% |
| Self-Employed (Not Incorporated) | 1,964 | 7.3% |
| Not-for-profit Organizations | 4,640 | 17.2% |
| Local Government Employees | 2,713 | 10.1% |
| State Government Employees | 2,042 | 7.6% |
| Federal Government Employees | 374 | 1.4% |
| Unpaid Family Workers | 51 | 0.2% |
| Total | 26,908 | 100.0% |
Employment Status by Age in Otsego County
According to the labor force statistics for Otsego County, out of the total population over 16 years of age (51,534), 56.1% or 28,911 individuals are in the labor force, with 5.0% or 1,446 of them unemployed. The age group with the highest labor force participation rate is 30 to 34 years, with 89.0% or 2,690 individuals in the labor force. Within the labor force, the 75 years and over age range has the highest percentage of unemployed individuals, with 10.9% or 45 of them being unemployed.
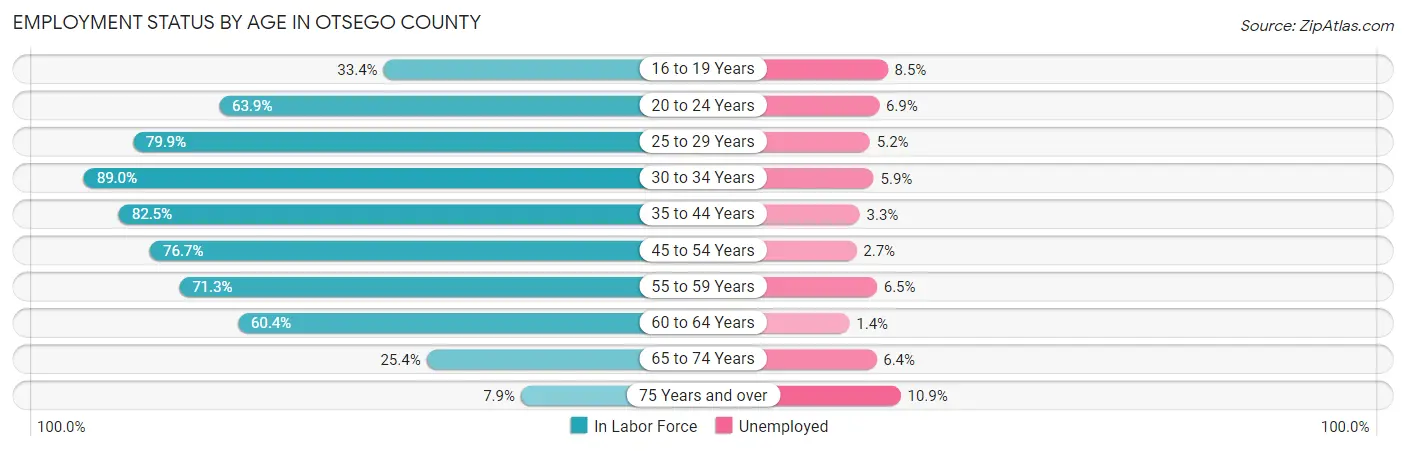
| Age Bracket | In Labor Force | Unemployed |
| 16 to 19 Years | 1,743 (33.4%) | 148 (8.5%) |
| 20 to 24 Years | 4,449 (63.9%) | 307 (6.9%) |
| 25 to 29 Years | 2,319 (79.9%) | 121 (5.2%) |
| 30 to 34 Years | 2,690 (89.0%) | 159 (5.9%) |
| 35 to 44 Years | 4,783 (82.5%) | 158 (3.3%) |
| 45 to 54 Years | 5,024 (76.7%) | 136 (2.7%) |
| 55 to 59 Years | 3,085 (71.3%) | 201 (6.5%) |
| 60 to 64 Years | 2,495 (60.4%) | 35 (1.4%) |
| 65 to 74 Years | 1,882 (25.4%) | 120 (6.4%) |
| 75 Years and over | 412 (7.9%) | 45 (10.9%) |
| Total | 28,911 (56.1%) | 1,446 (5.0%) |
Employment Status by Educational Attainment in Otsego County
According to labor force statistics for Otsego County, 76.3% of individuals (20,395) out of the total population between 25 and 64 years of age (26,730) are in the labor force, with 4.0% or 816 of them being unemployed. The group with the highest labor force participation rate are those with the educational attainment of bachelor's degree or higher, with 87.6% or 8,086 individuals in the labor force. Within the labor force, individuals with less than high school education have the highest percentage of unemployment, with 12.8% or 128 of them being unemployed.
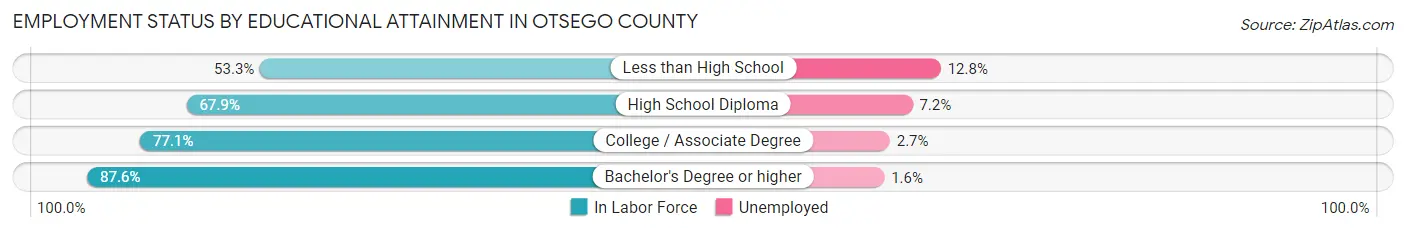
| Educational Attainment | In Labor Force | Unemployed |
| Less than High School | 997 (53.3%) | 239 (12.8%) |
| High School Diploma | 5,416 (67.9%) | 574 (7.2%) |
| College / Associate Degree | 5,899 (77.1%) | 207 (2.7%) |
| Bachelor's Degree or higher | 8,086 (87.6%) | 148 (1.6%) |
| Total | 20,395 (76.3%) | 1,069 (4.0%) |
Employment Occupations by Sex in Otsego County
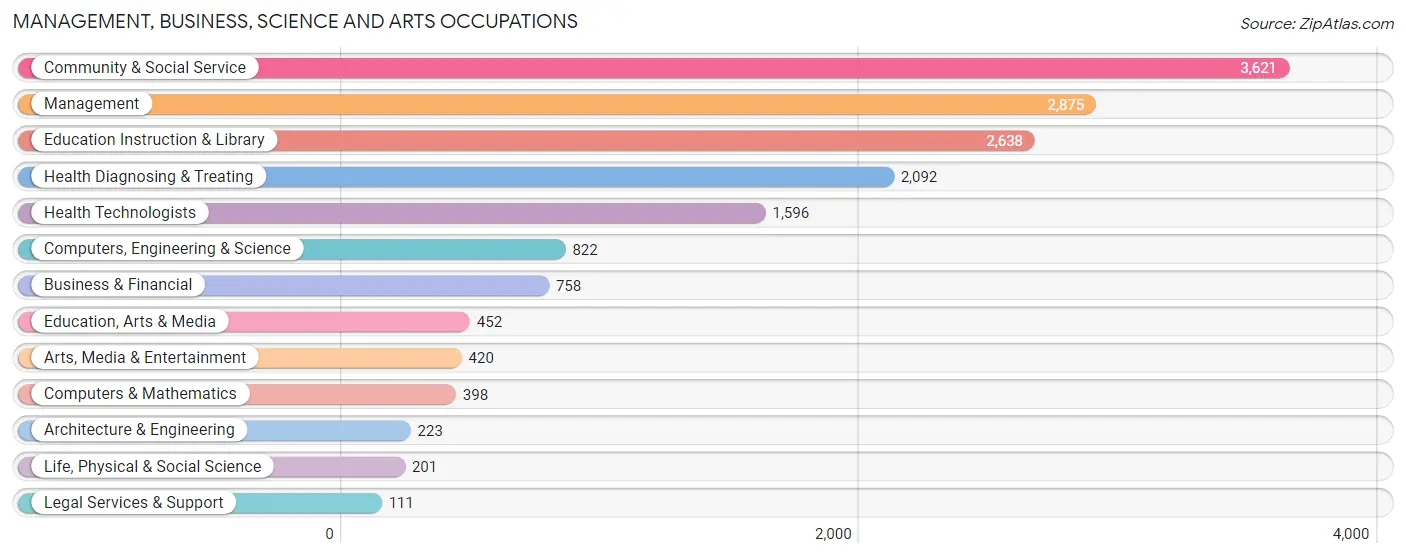
Management, Business, Science and Arts Occupations
The most common Management, Business, Science and Arts occupations in Otsego County are Community & Social Service (3,621 | 13.3%), Management (2,875 | 10.5%), Education Instruction & Library (2,638 | 9.7%), Health Diagnosing & Treating (2,092 | 7.6%), and Health Technologists (1,596 | 5.8%).
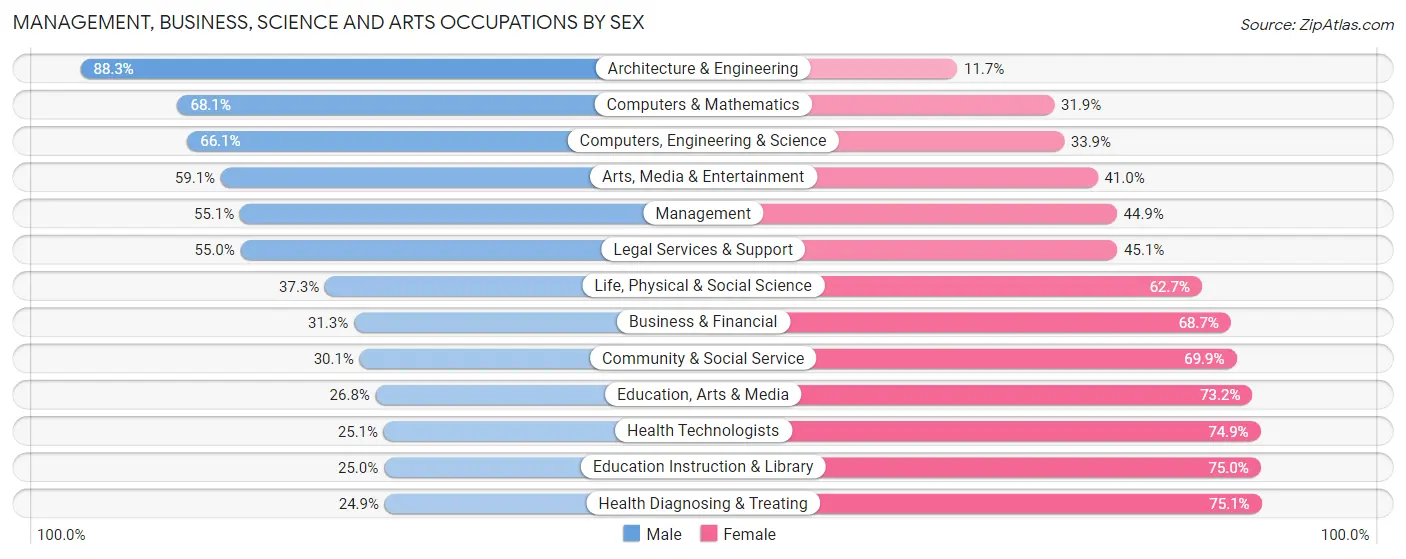
Management, Business, Science and Arts Occupations by Sex
Within the Management, Business, Science and Arts occupations in Otsego County, the most male-oriented occupations are Architecture & Engineering (88.3%), Computers & Mathematics (68.1%), and Computers, Engineering & Science (66.1%), while the most female-oriented occupations are Health Diagnosing & Treating (75.1%), Education Instruction & Library (75.0%), and Health Technologists (74.9%).
| Occupation | Male | Female |
| Management | 1,583 (55.1%) | 1,292 (44.9%) |
| Business & Financial | 237 (31.3%) | 521 (68.7%) |
| Computers, Engineering & Science | 543 (66.1%) | 279 (33.9%) |
| Computers & Mathematics | 271 (68.1%) | 127 (31.9%) |
| Architecture & Engineering | 197 (88.3%) | 26 (11.7%) |
| Life, Physical & Social Science | 75 (37.3%) | 126 (62.7%) |
| Community & Social Service | 1,090 (30.1%) | 2,531 (69.9%) |
| Education, Arts & Media | 121 (26.8%) | 331 (73.2%) |
| Legal Services & Support | 61 (54.9%) | 50 (45.1%) |
| Education Instruction & Library | 660 (25.0%) | 1,978 (75.0%) |
| Arts, Media & Entertainment | 248 (59.1%) | 172 (40.9%) |
| Health Diagnosing & Treating | 520 (24.9%) | 1,572 (75.1%) |
| Health Technologists | 400 (25.1%) | 1,196 (74.9%) |
| Total (Category) | 3,973 (39.1%) | 6,195 (60.9%) |
| Total (Overall) | 13,888 (50.8%) | 13,443 (49.2%) |
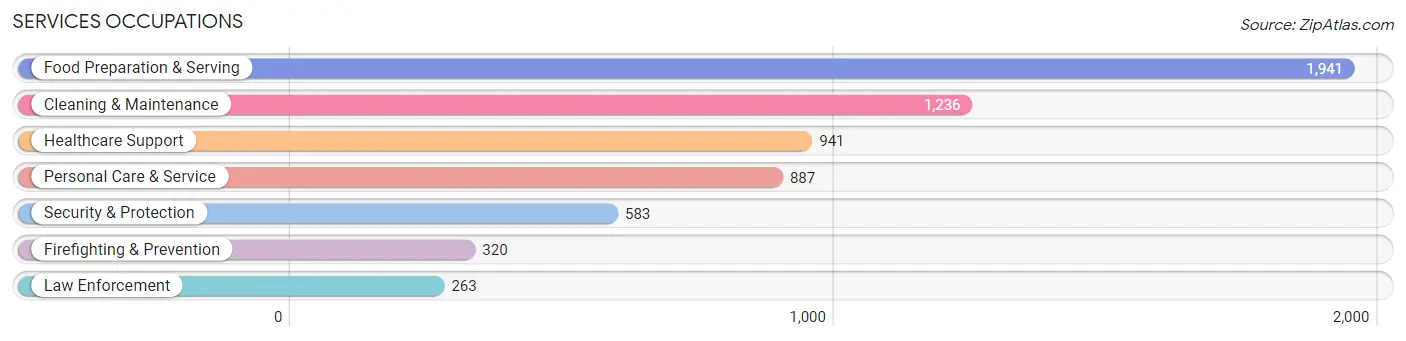
Services Occupations
The most common Services occupations in Otsego County are Food Preparation & Serving (1,941 | 7.1%), Cleaning & Maintenance (1,236 | 4.5%), Healthcare Support (941 | 3.4%), Personal Care & Service (887 | 3.3%), and Security & Protection (583 | 2.1%).
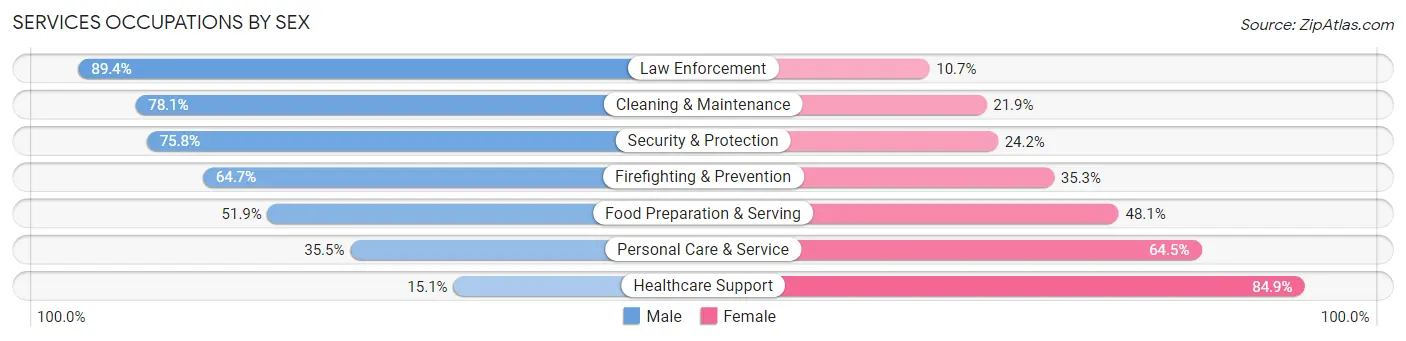
Services Occupations by Sex
Within the Services occupations in Otsego County, the most male-oriented occupations are Law Enforcement (89.3%), Cleaning & Maintenance (78.1%), and Security & Protection (75.8%), while the most female-oriented occupations are Healthcare Support (84.9%), Personal Care & Service (64.5%), and Food Preparation & Serving (48.1%).
| Occupation | Male | Female |
| Healthcare Support | 142 (15.1%) | 799 (84.9%) |
| Security & Protection | 442 (75.8%) | 141 (24.2%) |
| Firefighting & Prevention | 207 (64.7%) | 113 (35.3%) |
| Law Enforcement | 235 (89.3%) | 28 (10.6%) |
| Food Preparation & Serving | 1,007 (51.9%) | 934 (48.1%) |
| Cleaning & Maintenance | 965 (78.1%) | 271 (21.9%) |
| Personal Care & Service | 315 (35.5%) | 572 (64.5%) |
| Total (Category) | 2,871 (51.4%) | 2,717 (48.6%) |
| Total (Overall) | 13,888 (50.8%) | 13,443 (49.2%) |
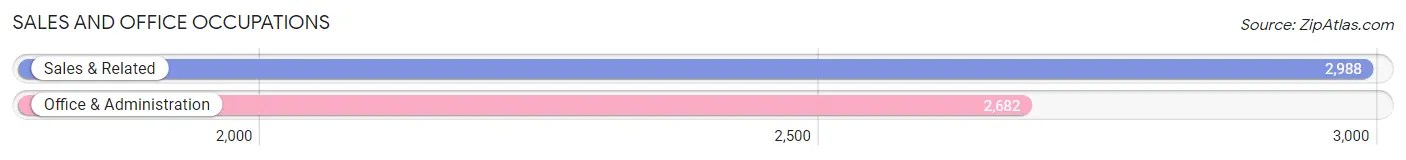
Sales and Office Occupations
The most common Sales and Office occupations in Otsego County are Sales & Related (2,988 | 10.9%), and Office & Administration (2,682 | 9.8%).
Sales and Office Occupations by Sex
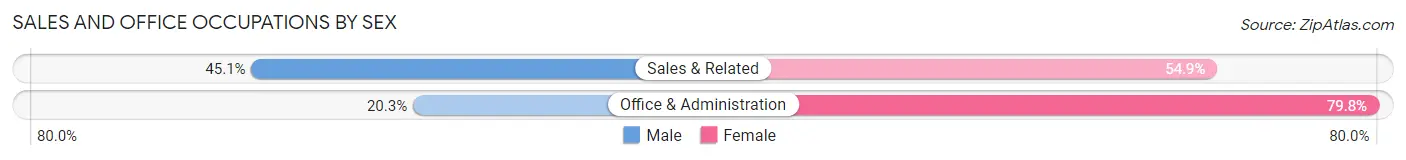
| Occupation | Male | Female |
| Sales & Related | 1,348 (45.1%) | 1,640 (54.9%) |
| Office & Administration | 543 (20.3%) | 2,139 (79.7%) |
| Total (Category) | 1,891 (33.4%) | 3,779 (66.6%) |
| Total (Overall) | 13,888 (50.8%) | 13,443 (49.2%) |
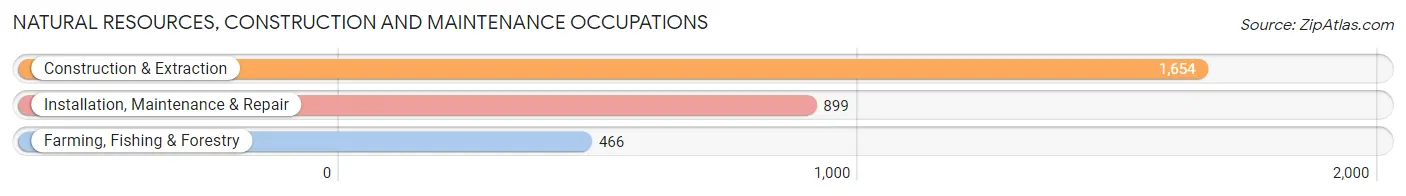
Natural Resources, Construction and Maintenance Occupations
The most common Natural Resources, Construction and Maintenance occupations in Otsego County are Construction & Extraction (1,654 | 6.0%), Installation, Maintenance & Repair (899 | 3.3%), and Farming, Fishing & Forestry (466 | 1.7%).
Natural Resources, Construction and Maintenance Occupations by Sex
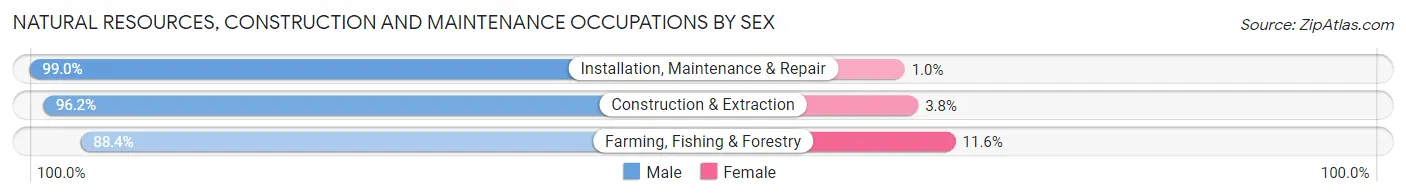
| Occupation | Male | Female |
| Farming, Fishing & Forestry | 412 (88.4%) | 54 (11.6%) |
| Construction & Extraction | 1,591 (96.2%) | 63 (3.8%) |
| Installation, Maintenance & Repair | 890 (99.0%) | 9 (1.0%) |
| Total (Category) | 2,893 (95.8%) | 126 (4.2%) |
| Total (Overall) | 13,888 (50.8%) | 13,443 (49.2%) |
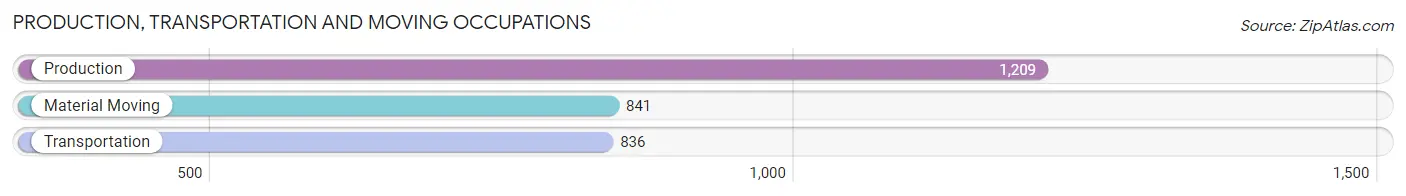
Production, Transportation and Moving Occupations
The most common Production, Transportation and Moving occupations in Otsego County are Production (1,209 | 4.4%), Material Moving (841 | 3.1%), and Transportation (836 | 3.1%).
Production, Transportation and Moving Occupations by Sex
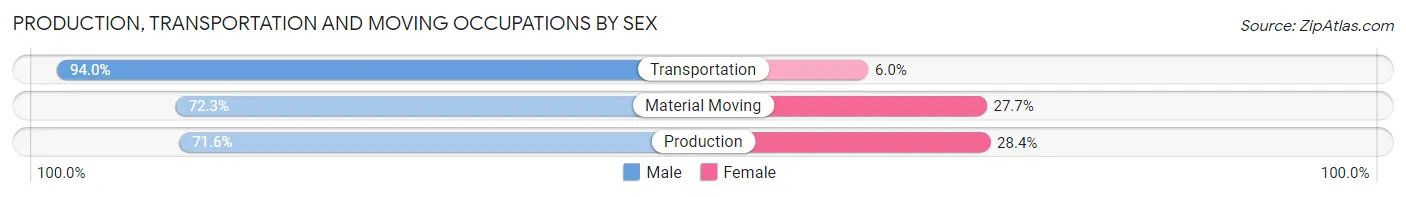
| Occupation | Male | Female |
| Production | 866 (71.6%) | 343 (28.4%) |
| Transportation | 786 (94.0%) | 50 (6.0%) |
| Material Moving | 608 (72.3%) | 233 (27.7%) |
| Total (Category) | 2,260 (78.3%) | 626 (21.7%) |
| Total (Overall) | 13,888 (50.8%) | 13,443 (49.2%) |
Employment Industries by Sex in Otsego County
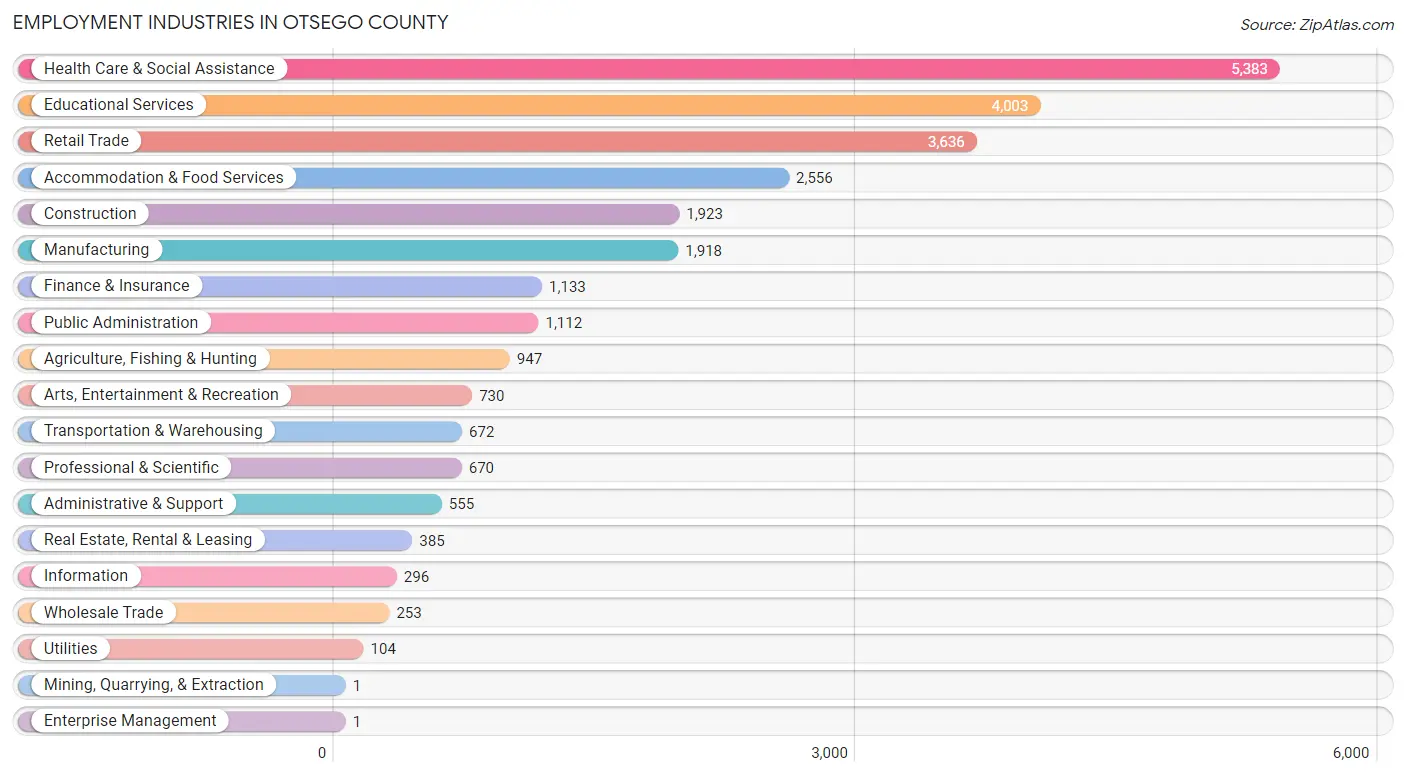
Employment Industries in Otsego County
The major employment industries in Otsego County include Health Care & Social Assistance (5,383 | 19.7%), Educational Services (4,003 | 14.6%), Retail Trade (3,636 | 13.3%), Accommodation & Food Services (2,556 | 9.3%), and Construction (1,923 | 7.0%).
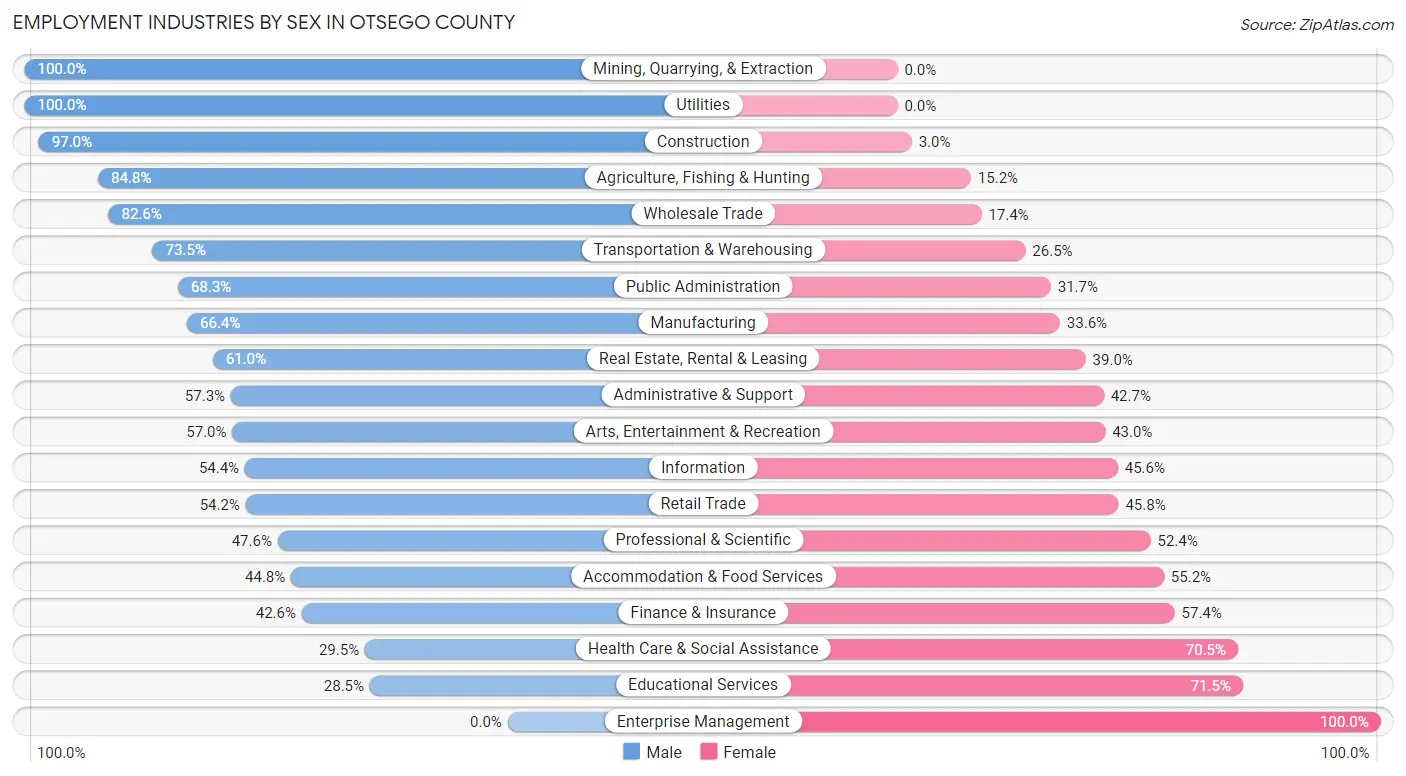
Employment Industries by Sex in Otsego County
The Otsego County industries that see more men than women are Mining, Quarrying, & Extraction (100.0%), Utilities (100.0%), and Construction (97.0%), whereas the industries that tend to have a higher number of women are Enterprise Management (100.0%), Educational Services (71.5%), and Health Care & Social Assistance (70.5%).
| Industry | Male | Female |
| Agriculture, Fishing & Hunting | 803 (84.8%) | 144 (15.2%) |
| Mining, Quarrying, & Extraction | 1 (100.0%) | 0 (0.0%) |
| Construction | 1,866 (97.0%) | 57 (3.0%) |
| Manufacturing | 1,273 (66.4%) | 645 (33.6%) |
| Wholesale Trade | 209 (82.6%) | 44 (17.4%) |
| Retail Trade | 1,972 (54.2%) | 1,664 (45.8%) |
| Transportation & Warehousing | 494 (73.5%) | 178 (26.5%) |
| Utilities | 104 (100.0%) | 0 (0.0%) |
| Information | 161 (54.4%) | 135 (45.6%) |
| Finance & Insurance | 483 (42.6%) | 650 (57.4%) |
| Real Estate, Rental & Leasing | 235 (61.0%) | 150 (39.0%) |
| Professional & Scientific | 319 (47.6%) | 351 (52.4%) |
| Enterprise Management | 0 (0.0%) | 1 (100.0%) |
| Administrative & Support | 318 (57.3%) | 237 (42.7%) |
| Educational Services | 1,142 (28.5%) | 2,861 (71.5%) |
| Health Care & Social Assistance | 1,590 (29.5%) | 3,793 (70.5%) |
| Arts, Entertainment & Recreation | 416 (57.0%) | 314 (43.0%) |
| Accommodation & Food Services | 1,146 (44.8%) | 1,410 (55.2%) |
| Public Administration | 759 (68.3%) | 353 (31.7%) |
| Total | 13,888 (50.8%) | 13,443 (49.2%) |
Education in Otsego County
School Enrollment in Otsego County
The most common levels of schooling among the 15,176 students in Otsego County are college / undergraduate (7,174 | 47.3%), high school (2,543 | 16.8%), and middle school (2,386 | 15.7%).
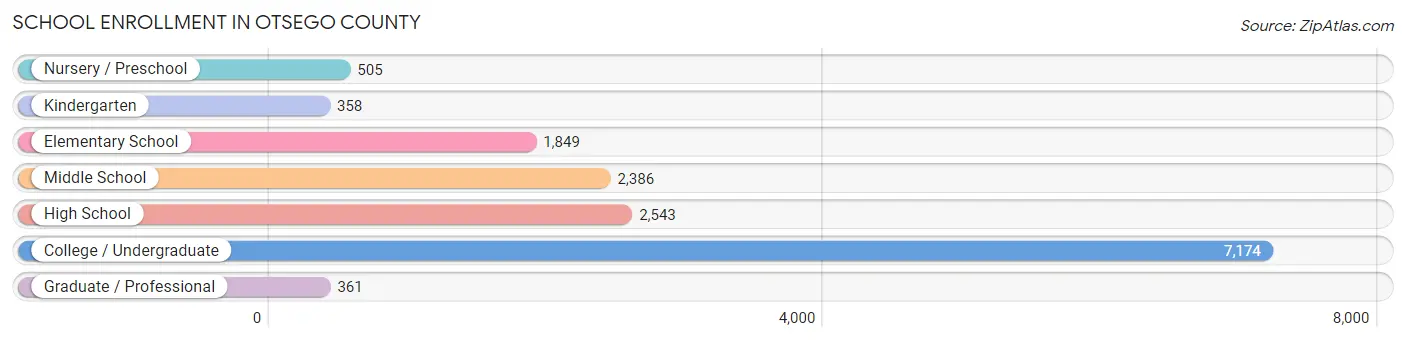
| School Level | # Students | % Students |
| Nursery / Preschool | 505 | 3.3% |
| Kindergarten | 358 | 2.4% |
| Elementary School | 1,849 | 12.2% |
| Middle School | 2,386 | 15.7% |
| High School | 2,543 | 16.8% |
| College / Undergraduate | 7,174 | 47.3% |
| Graduate / Professional | 361 | 2.4% |
| Total | 15,176 | 100.0% |
School Enrollment by Age by Funding Source in Otsego County
Out of a total of 15,176 students who are enrolled in schools in Otsego County, 2,777 (18.3%) attend a private institution, while the remaining 12,399 (81.7%) are enrolled in public schools. The age group of 25 to 34 year olds has the highest likelihood of being enrolled in private schools, with 321 (55.1% in the age bracket) enrolled. Conversely, the age group of 15 to 17 year olds has the lowest likelihood of being enrolled in a private school, with 1,450 (94.6% in the age bracket) attending a public institution.
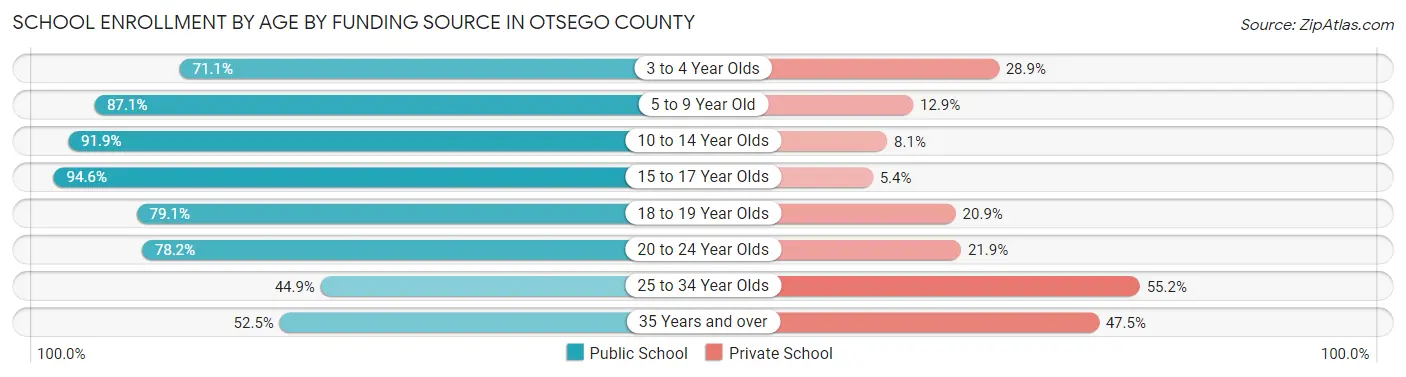
| Age Bracket | Public School | Private School |
| 3 to 4 Year Olds | 330 (71.1%) | 134 (28.9%) |
| 5 to 9 Year Old | 1,791 (87.1%) | 266 (12.9%) |
| 10 to 14 Year Olds | 2,701 (91.9%) | 238 (8.1%) |
| 15 to 17 Year Olds | 1,450 (94.6%) | 83 (5.4%) |
| 18 to 19 Year Olds | 2,894 (79.1%) | 763 (20.9%) |
| 20 to 24 Year Olds | 2,768 (78.1%) | 774 (21.8%) |
| 25 to 34 Year Olds | 261 (44.9%) | 321 (55.1%) |
| 35 Years and over | 211 (52.5%) | 191 (47.5%) |
| Total | 12,399 (81.7%) | 2,777 (18.3%) |
Educational Attainment by Field of Study in Otsego County
Education (2,476 | 17.2%), business (1,900 | 13.2%), science & technology (1,848 | 12.9%), bio, nature & agricultural (1,195 | 8.3%), and social sciences (1,100 | 7.7%) are the most common fields of study among 14,354 individuals in Otsego County who have obtained a bachelor's degree or higher.
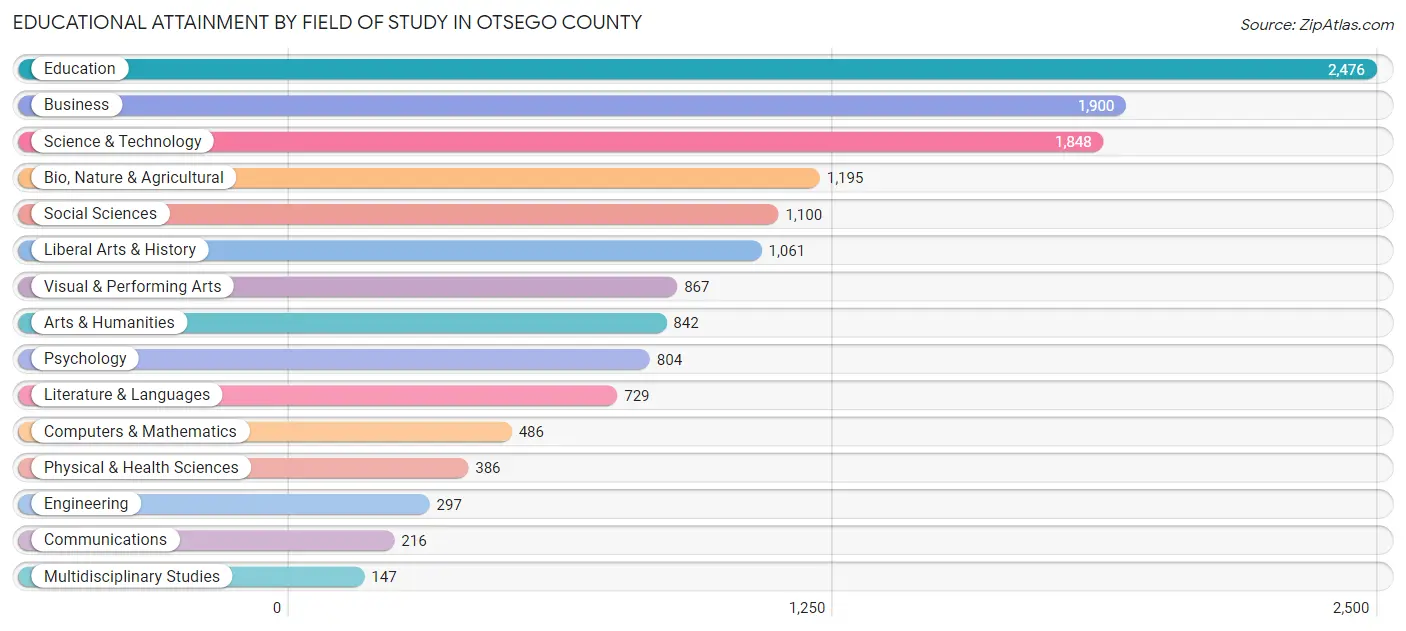
| Field of Study | # Graduates | % Graduates |
| Computers & Mathematics | 486 | 3.4% |
| Bio, Nature & Agricultural | 1,195 | 8.3% |
| Physical & Health Sciences | 386 | 2.7% |
| Psychology | 804 | 5.6% |
| Social Sciences | 1,100 | 7.7% |
| Engineering | 297 | 2.1% |
| Multidisciplinary Studies | 147 | 1.0% |
| Science & Technology | 1,848 | 12.9% |
| Business | 1,900 | 13.2% |
| Education | 2,476 | 17.2% |
| Literature & Languages | 729 | 5.1% |
| Liberal Arts & History | 1,061 | 7.4% |
| Visual & Performing Arts | 867 | 6.0% |
| Communications | 216 | 1.5% |
| Arts & Humanities | 842 | 5.9% |
| Total | 14,354 | 100.0% |
Transportation & Commute in Otsego County
Vehicle Availability by Sex in Otsego County
The most prevalent vehicle ownership categories in Otsego County are males with 2 vehicles (5,455, accounting for 40.7%) and females with 2 vehicles (5,245, making up 44.4%).
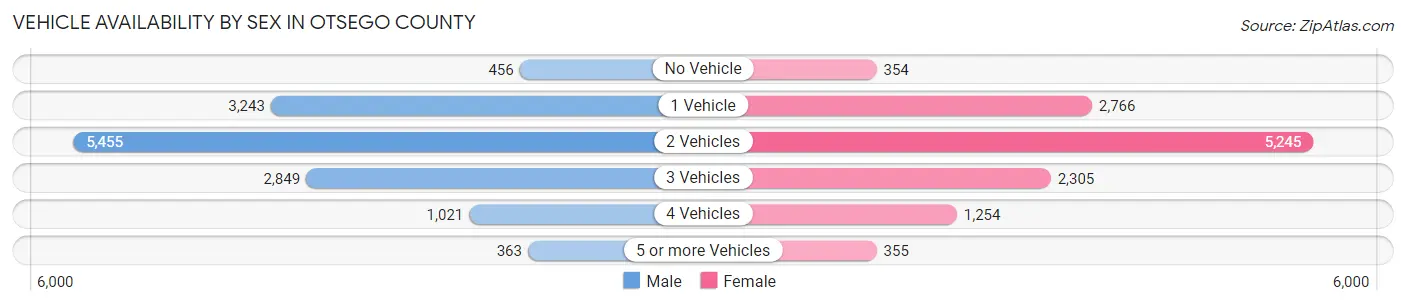
| Vehicles Available | Male | Female |
| No Vehicle | 456 (3.4%) | 354 (2.9%) |
| 1 Vehicle | 3,243 (24.2%) | 2,766 (22.5%) |
| 2 Vehicles | 5,455 (40.7%) | 5,245 (42.7%) |
| 3 Vehicles | 2,849 (21.3%) | 2,305 (18.8%) |
| 4 Vehicles | 1,021 (7.6%) | 1,254 (10.2%) |
| 5 or more Vehicles | 363 (2.7%) | 355 (2.9%) |
| Total | 13,387 (100.0%) | 12,279 (100.0%) |
Commute Time in Otsego County
The most frequently occuring commute durations in Otsego County are 5 to 9 minutes (4,193 commuters, 17.0%), 15 to 19 minutes (3,822 commuters, 15.5%), and 10 to 14 minutes (3,821 commuters, 15.5%).
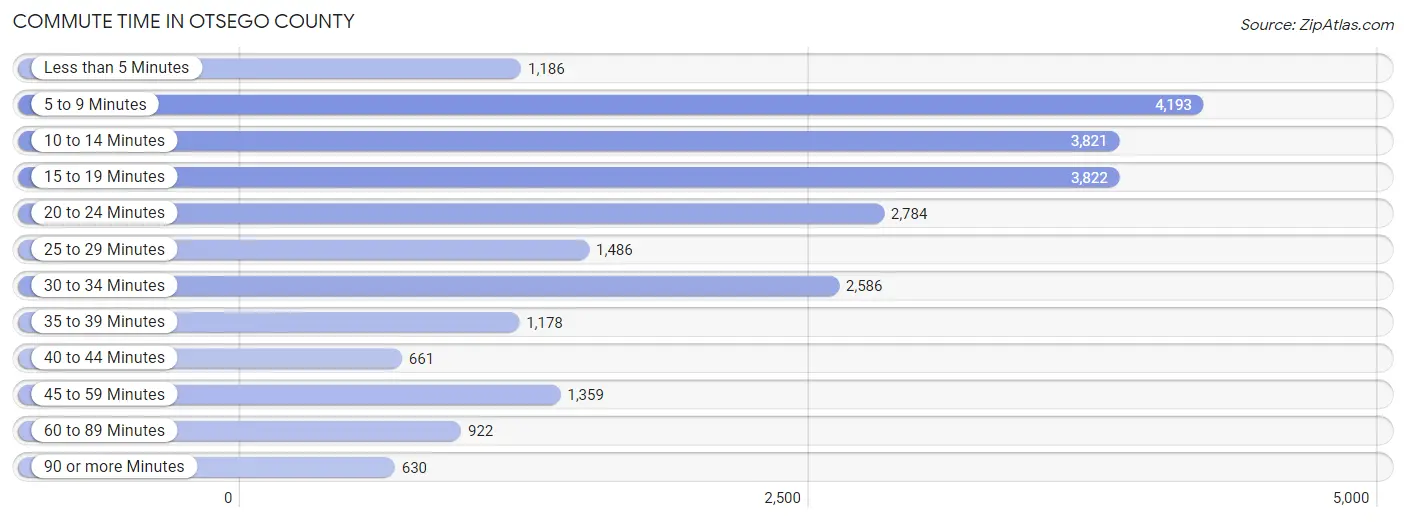
| Commute Time | # Commuters | % Commuters |
| Less than 5 Minutes | 1,186 | 4.8% |
| 5 to 9 Minutes | 4,193 | 17.0% |
| 10 to 14 Minutes | 3,821 | 15.5% |
| 15 to 19 Minutes | 3,822 | 15.5% |
| 20 to 24 Minutes | 2,784 | 11.3% |
| 25 to 29 Minutes | 1,486 | 6.0% |
| 30 to 34 Minutes | 2,586 | 10.5% |
| 35 to 39 Minutes | 1,178 | 4.8% |
| 40 to 44 Minutes | 661 | 2.7% |
| 45 to 59 Minutes | 1,359 | 5.5% |
| 60 to 89 Minutes | 922 | 3.7% |
| 90 or more Minutes | 630 | 2.6% |
Commute Time by Sex in Otsego County
The most common commute times in Otsego County are 5 to 9 minutes (2,080 commuters, 16.5%) for males and 5 to 9 minutes (2,113 commuters, 17.6%) for females.
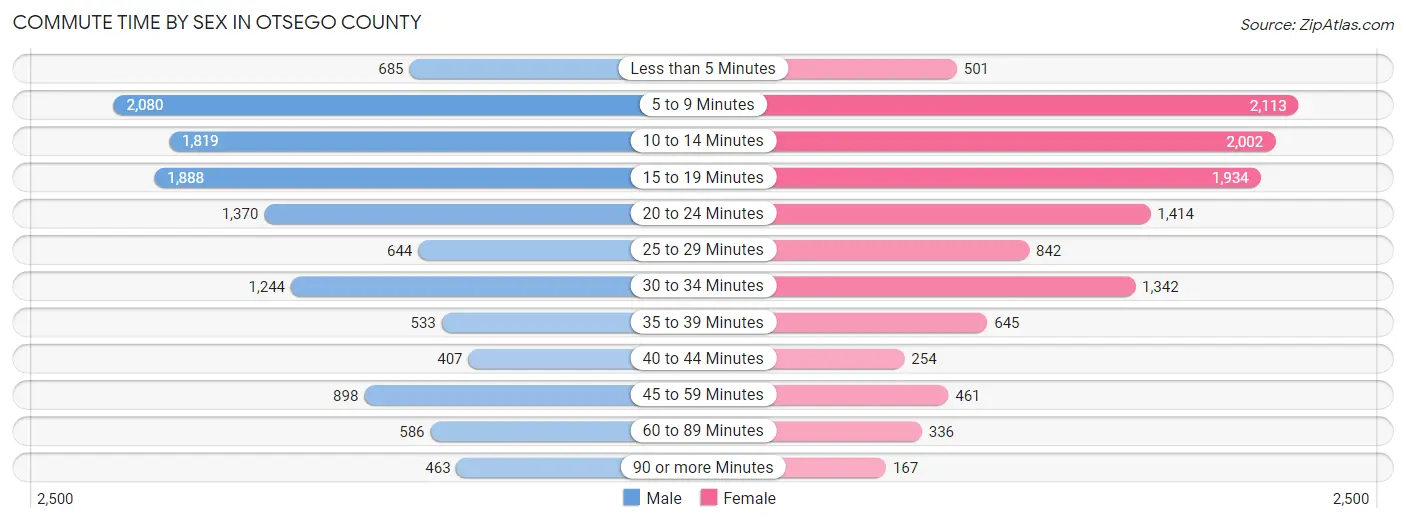
| Commute Time | Male | Female |
| Less than 5 Minutes | 685 (5.4%) | 501 (4.2%) |
| 5 to 9 Minutes | 2,080 (16.5%) | 2,113 (17.6%) |
| 10 to 14 Minutes | 1,819 (14.4%) | 2,002 (16.7%) |
| 15 to 19 Minutes | 1,888 (15.0%) | 1,934 (16.1%) |
| 20 to 24 Minutes | 1,370 (10.9%) | 1,414 (11.8%) |
| 25 to 29 Minutes | 644 (5.1%) | 842 (7.0%) |
| 30 to 34 Minutes | 1,244 (9.9%) | 1,342 (11.2%) |
| 35 to 39 Minutes | 533 (4.2%) | 645 (5.4%) |
| 40 to 44 Minutes | 407 (3.2%) | 254 (2.1%) |
| 45 to 59 Minutes | 898 (7.1%) | 461 (3.8%) |
| 60 to 89 Minutes | 586 (4.6%) | 336 (2.8%) |
| 90 or more Minutes | 463 (3.7%) | 167 (1.4%) |
Time of Departure to Work by Sex in Otsego County
The most frequent times of departure to work in Otsego County are 7:00 AM to 7:29 AM (1,899, 15.0%) for males and 7:30 AM to 7:59 AM (2,061, 17.2%) for females.
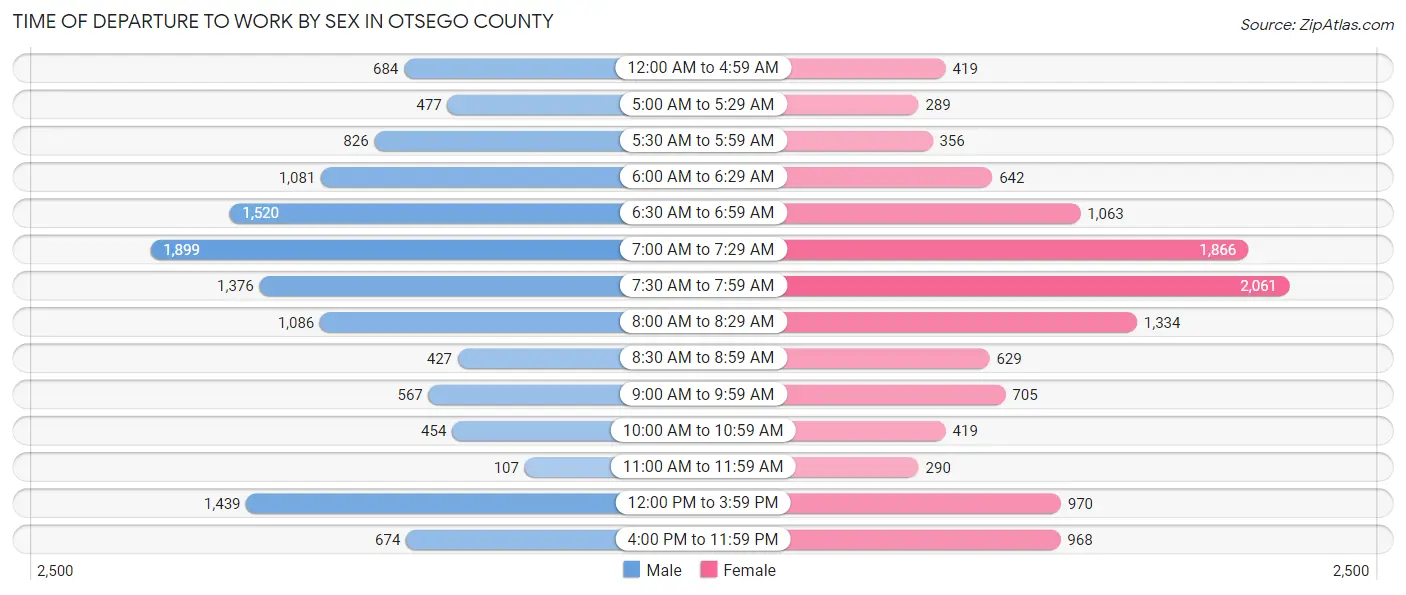
| Time of Departure | Male | Female |
| 12:00 AM to 4:59 AM | 684 (5.4%) | 419 (3.5%) |
| 5:00 AM to 5:29 AM | 477 (3.8%) | 289 (2.4%) |
| 5:30 AM to 5:59 AM | 826 (6.6%) | 356 (3.0%) |
| 6:00 AM to 6:29 AM | 1,081 (8.6%) | 642 (5.3%) |
| 6:30 AM to 6:59 AM | 1,520 (12.0%) | 1,063 (8.8%) |
| 7:00 AM to 7:29 AM | 1,899 (15.0%) | 1,866 (15.5%) |
| 7:30 AM to 7:59 AM | 1,376 (10.9%) | 2,061 (17.2%) |
| 8:00 AM to 8:29 AM | 1,086 (8.6%) | 1,334 (11.1%) |
| 8:30 AM to 8:59 AM | 427 (3.4%) | 629 (5.2%) |
| 9:00 AM to 9:59 AM | 567 (4.5%) | 705 (5.9%) |
| 10:00 AM to 10:59 AM | 454 (3.6%) | 419 (3.5%) |
| 11:00 AM to 11:59 AM | 107 (0.9%) | 290 (2.4%) |
| 12:00 PM to 3:59 PM | 1,439 (11.4%) | 970 (8.1%) |
| 4:00 PM to 11:59 PM | 674 (5.3%) | 968 (8.1%) |
| Total | 12,617 (100.0%) | 12,011 (100.0%) |
Housing Occupancy in Otsego County
Occupancy by Ownership in Otsego County
Of the total 22,305 dwellings in Otsego County, owner-occupied units account for 16,534 (74.1%), while renter-occupied units make up 5,771 (25.9%).
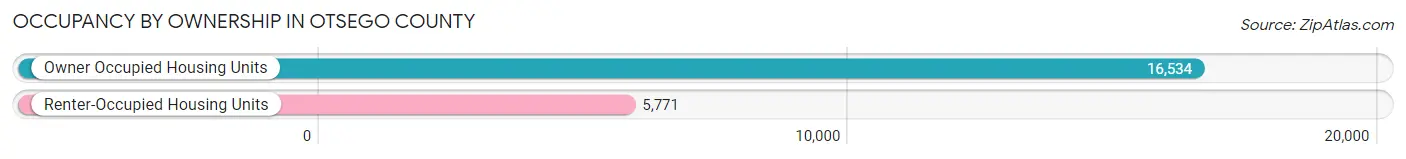
| Occupancy | # Housing Units | % Housing Units |
| Owner Occupied Housing Units | 16,534 | 74.1% |
| Renter-Occupied Housing Units | 5,771 | 25.9% |
| Total Occupied Housing Units | 22,305 | 100.0% |
Occupancy by Household Size in Otsego County
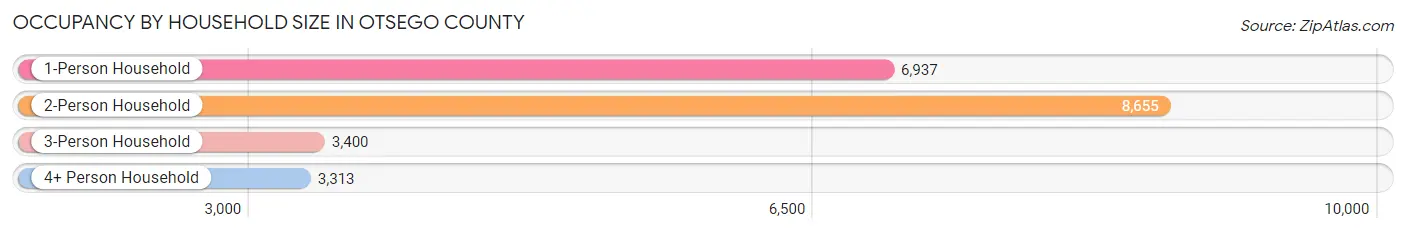
| Household Size | # Housing Units | % Housing Units |
| 1-Person Household | 6,937 | 31.1% |
| 2-Person Household | 8,655 | 38.8% |
| 3-Person Household | 3,400 | 15.2% |
| 4+ Person Household | 3,313 | 14.8% |
| Total Housing Units | 22,305 | 100.0% |
Occupancy by Ownership by Household Size in Otsego County
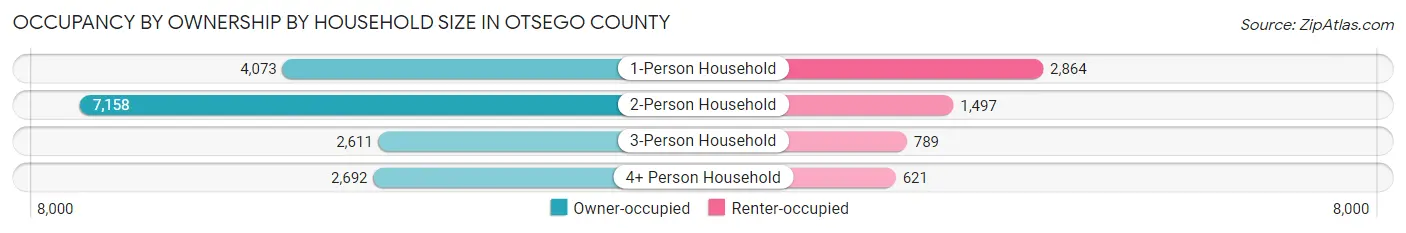
| Household Size | Owner-occupied | Renter-occupied |
| 1-Person Household | 4,073 (58.7%) | 2,864 (41.3%) |
| 2-Person Household | 7,158 (82.7%) | 1,497 (17.3%) |
| 3-Person Household | 2,611 (76.8%) | 789 (23.2%) |
| 4+ Person Household | 2,692 (81.3%) | 621 (18.7%) |
| Total Housing Units | 16,534 (74.1%) | 5,771 (25.9%) |
Occupancy by Educational Attainment in Otsego County
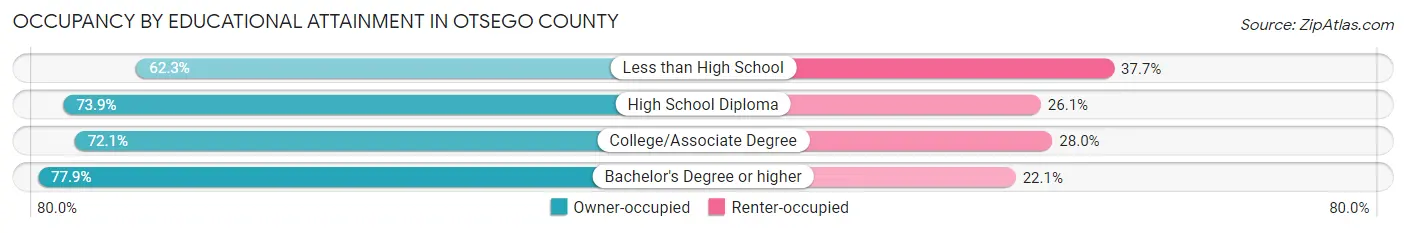
| Household Size | Owner-occupied | Renter-occupied |
| Less than High School | 800 (62.3%) | 485 (37.7%) |
| High School Diploma | 4,586 (73.9%) | 1,622 (26.1%) |
| College/Associate Degree | 4,772 (72.1%) | 1,851 (28.0%) |
| Bachelor's Degree or higher | 6,376 (77.9%) | 1,813 (22.1%) |
Occupancy by Age of Householder in Otsego County
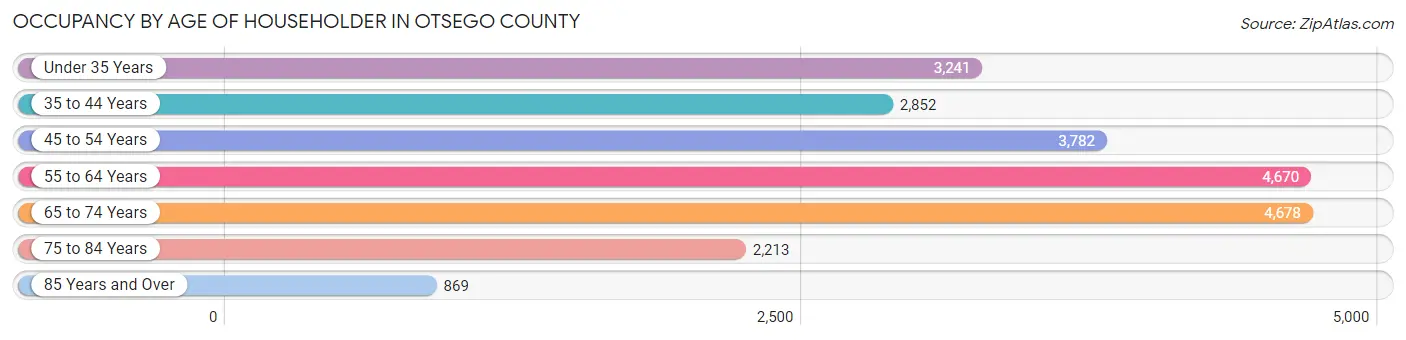
| Age Bracket | # Households | % Households |
| Under 35 Years | 3,241 | 14.5% |
| 35 to 44 Years | 2,852 | 12.8% |
| 45 to 54 Years | 3,782 | 17.0% |
| 55 to 64 Years | 4,670 | 20.9% |
| 65 to 74 Years | 4,678 | 21.0% |
| 75 to 84 Years | 2,213 | 9.9% |
| 85 Years and Over | 869 | 3.9% |
| Total | 22,305 | 100.0% |
Housing Finances in Otsego County
Median Income by Occupancy in Otsego County
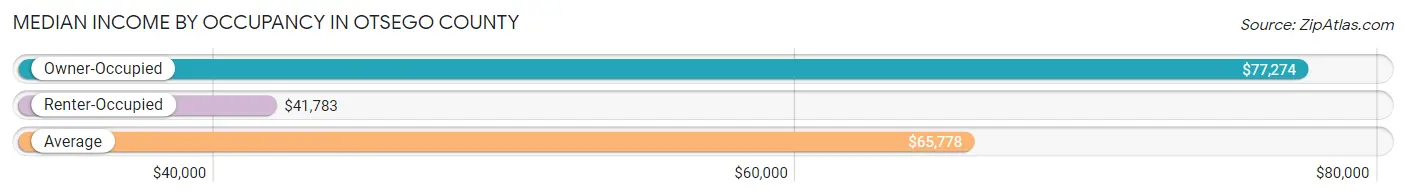
| Occupancy Type | # Households | Median Income |
| Owner-Occupied | 16,534 (74.1%) | $77,274 |
| Renter-Occupied | 5,771 (25.9%) | $41,783 |
| Average | 22,305 (100.0%) | $65,778 |
Occupancy by Householder Income Bracket in Otsego County
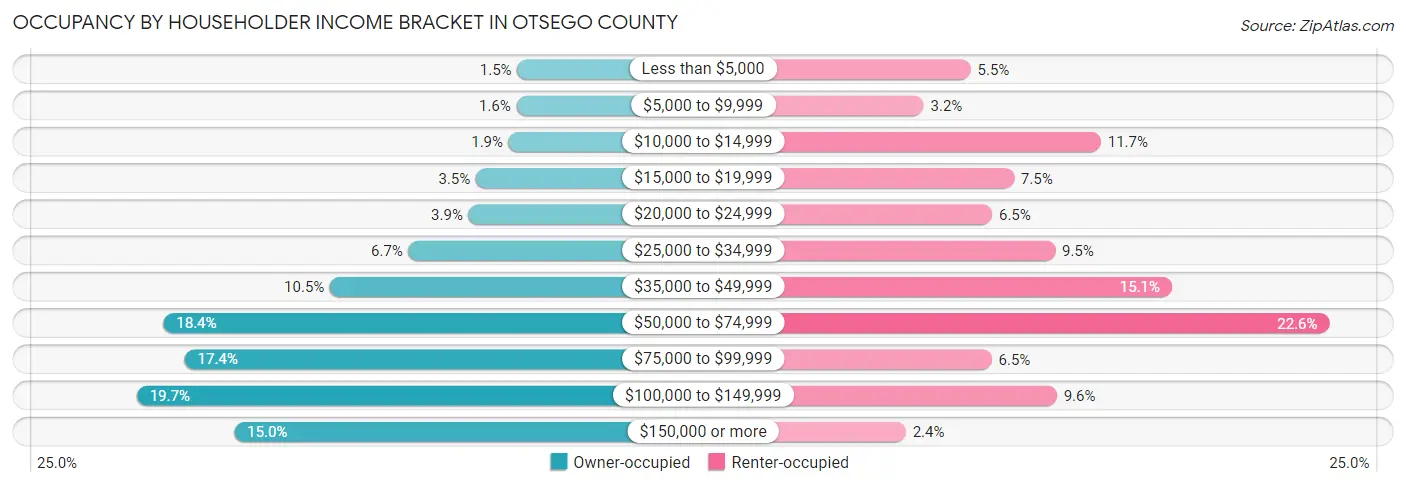
| Income Bracket | Owner-occupied | Renter-occupied |
| Less than $5,000 | 253 (1.5%) | 316 (5.5%) |
| $5,000 to $9,999 | 260 (1.6%) | 187 (3.2%) |
| $10,000 to $14,999 | 320 (1.9%) | 674 (11.7%) |
| $15,000 to $19,999 | 579 (3.5%) | 435 (7.5%) |
| $20,000 to $24,999 | 636 (3.8%) | 375 (6.5%) |
| $25,000 to $34,999 | 1,109 (6.7%) | 548 (9.5%) |
| $35,000 to $49,999 | 1,728 (10.4%) | 869 (15.1%) |
| $50,000 to $74,999 | 3,040 (18.4%) | 1,302 (22.6%) |
| $75,000 to $99,999 | 2,874 (17.4%) | 374 (6.5%) |
| $100,000 to $149,999 | 3,251 (19.7%) | 553 (9.6%) |
| $150,000 or more | 2,484 (15.0%) | 138 (2.4%) |
| Total | 16,534 (100.0%) | 5,771 (100.0%) |
Monthly Housing Cost Tiers in Otsego County
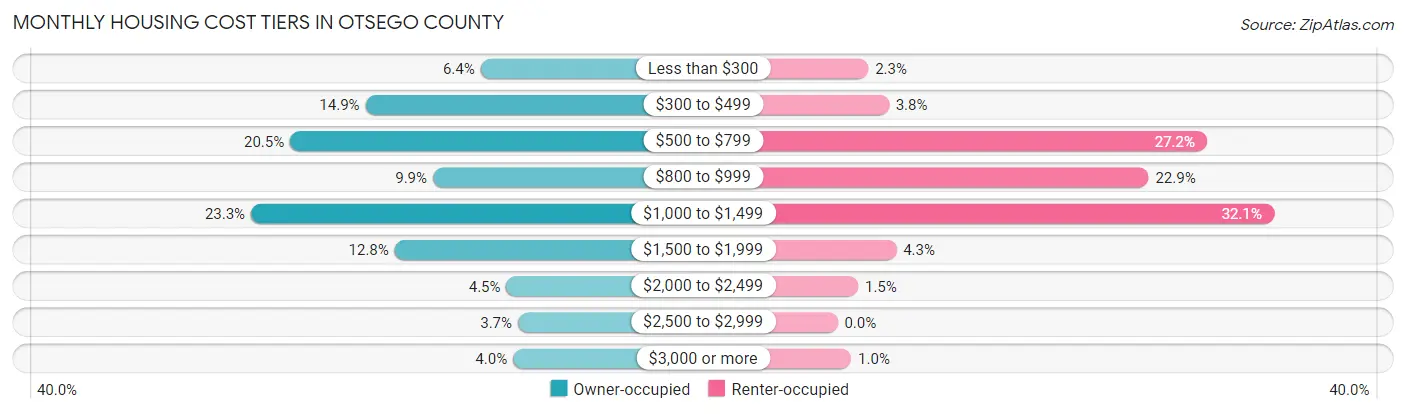
| Monthly Cost | Owner-occupied | Renter-occupied |
| Less than $300 | 1,061 (6.4%) | 131 (2.3%) |
| $300 to $499 | 2,463 (14.9%) | 218 (3.8%) |
| $500 to $799 | 3,381 (20.4%) | 1,570 (27.2%) |
| $800 to $999 | 1,642 (9.9%) | 1,322 (22.9%) |
| $1,000 to $1,499 | 3,858 (23.3%) | 1,854 (32.1%) |
| $1,500 to $1,999 | 2,108 (12.8%) | 250 (4.3%) |
| $2,000 to $2,499 | 747 (4.5%) | 88 (1.5%) |
| $2,500 to $2,999 | 607 (3.7%) | 0 (0.0%) |
| $3,000 or more | 667 (4.0%) | 58 (1.0%) |
| Total | 16,534 (100.0%) | 5,771 (100.0%) |
Physical Housing Characteristics in Otsego County
Housing Structures in Otsego County
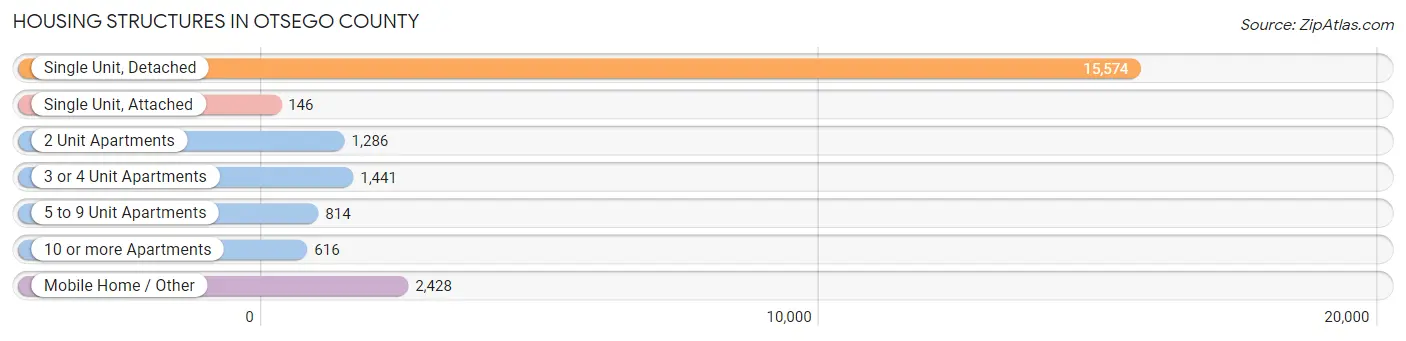
| Structure Type | # Housing Units | % Housing Units |
| Single Unit, Detached | 15,574 | 69.8% |
| Single Unit, Attached | 146 | 0.6% |
| 2 Unit Apartments | 1,286 | 5.8% |
| 3 or 4 Unit Apartments | 1,441 | 6.5% |
| 5 to 9 Unit Apartments | 814 | 3.6% |
| 10 or more Apartments | 616 | 2.8% |
| Mobile Home / Other | 2,428 | 10.9% |
| Total | 22,305 | 100.0% |
Housing Structures by Occupancy in Otsego County
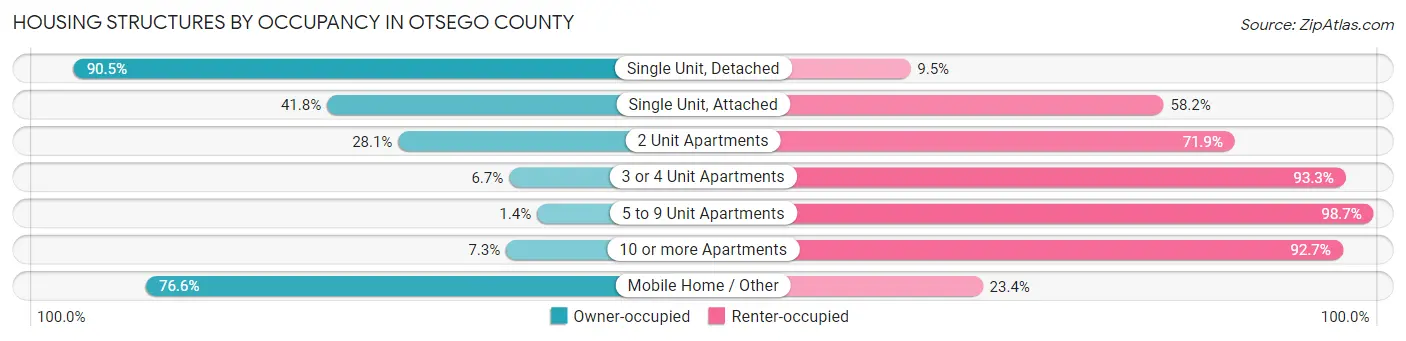
| Structure Type | Owner-occupied | Renter-occupied |
| Single Unit, Detached | 14,099 (90.5%) | 1,475 (9.5%) |
| Single Unit, Attached | 61 (41.8%) | 85 (58.2%) |
| 2 Unit Apartments | 361 (28.1%) | 925 (71.9%) |
| 3 or 4 Unit Apartments | 97 (6.7%) | 1,344 (93.3%) |
| 5 to 9 Unit Apartments | 11 (1.3%) | 803 (98.7%) |
| 10 or more Apartments | 45 (7.3%) | 571 (92.7%) |
| Mobile Home / Other | 1,860 (76.6%) | 568 (23.4%) |
| Total | 16,534 (74.1%) | 5,771 (25.9%) |
Housing Structures by Number of Rooms in Otsego County
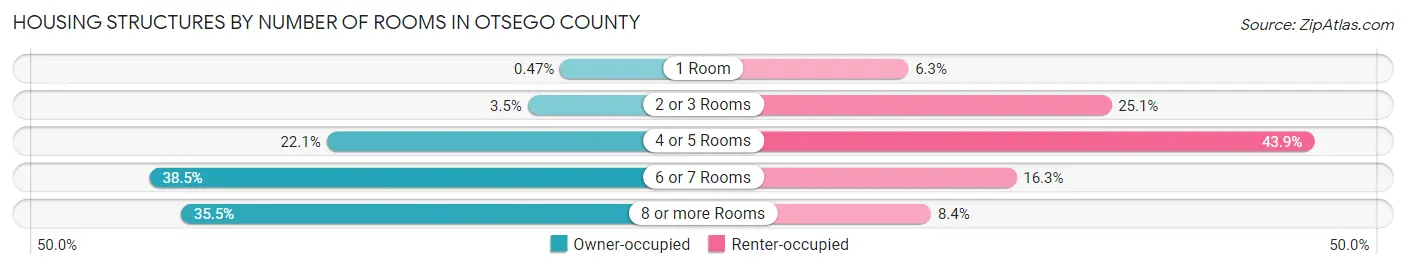
| Number of Rooms | Owner-occupied | Renter-occupied |
| 1 Room | 77 (0.5%) | 365 (6.3%) |
| 2 or 3 Rooms | 573 (3.5%) | 1,448 (25.1%) |
| 4 or 5 Rooms | 3,651 (22.1%) | 2,531 (43.9%) |
| 6 or 7 Rooms | 6,357 (38.5%) | 941 (16.3%) |
| 8 or more Rooms | 5,876 (35.5%) | 486 (8.4%) |
| Total | 16,534 (100.0%) | 5,771 (100.0%) |
Housing Structure by Heating Type in Otsego County
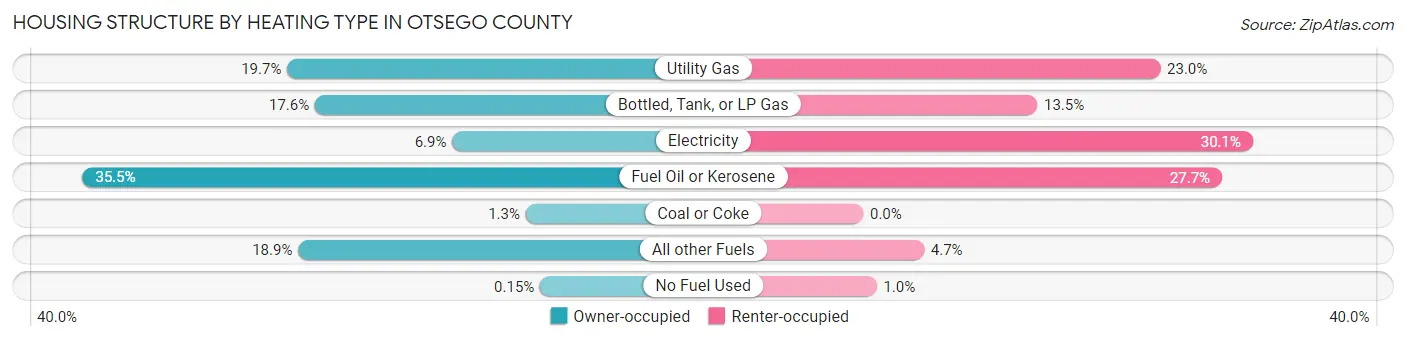
| Heating Type | Owner-occupied | Renter-occupied |
| Utility Gas | 3,258 (19.7%) | 1,325 (23.0%) |
| Bottled, Tank, or LP Gas | 2,902 (17.5%) | 776 (13.5%) |
| Electricity | 1,148 (6.9%) | 1,738 (30.1%) |
| Fuel Oil or Kerosene | 5,876 (35.5%) | 1,601 (27.7%) |
| Coal or Coke | 209 (1.3%) | 0 (0.0%) |
| All other Fuels | 3,116 (18.9%) | 271 (4.7%) |
| No Fuel Used | 25 (0.2%) | 60 (1.0%) |
| Total | 16,534 (100.0%) | 5,771 (100.0%) |
Household Vehicle Usage in Otsego County
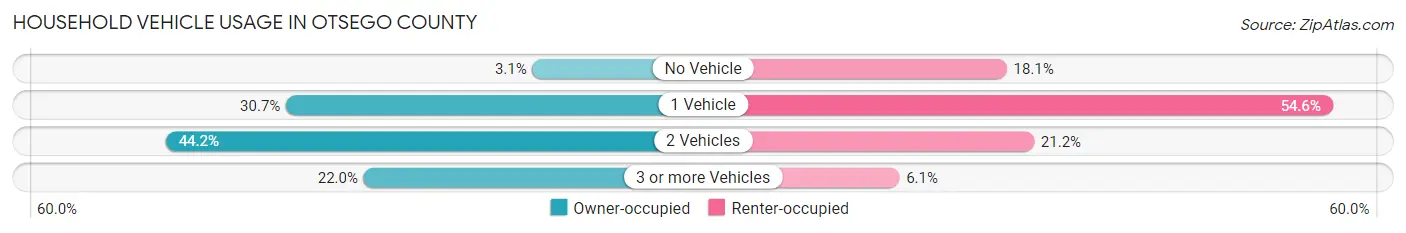
| Vehicles per Household | Owner-occupied | Renter-occupied |
| No Vehicle | 513 (3.1%) | 1,045 (18.1%) |
| 1 Vehicle | 5,076 (30.7%) | 3,153 (54.6%) |
| 2 Vehicles | 7,307 (44.2%) | 1,222 (21.2%) |
| 3 or more Vehicles | 3,638 (22.0%) | 351 (6.1%) |
| Total | 16,534 (100.0%) | 5,771 (100.0%) |
Real Estate & Mortgages in Otsego County
Real Estate and Mortgage Overview in Otsego County
| Characteristic | Without Mortgage | With Mortgage |
| Housing Units | 8,112 | 8,422 |
| Median Property Value | $153,600 | $179,600 |
| Median Household Income | $60,333 | $1,698 |
| Monthly Housing Costs | $546 | $644 |
| Real Estate Taxes | $2,535 | $197 |
Property Value by Mortgage Status in Otsego County
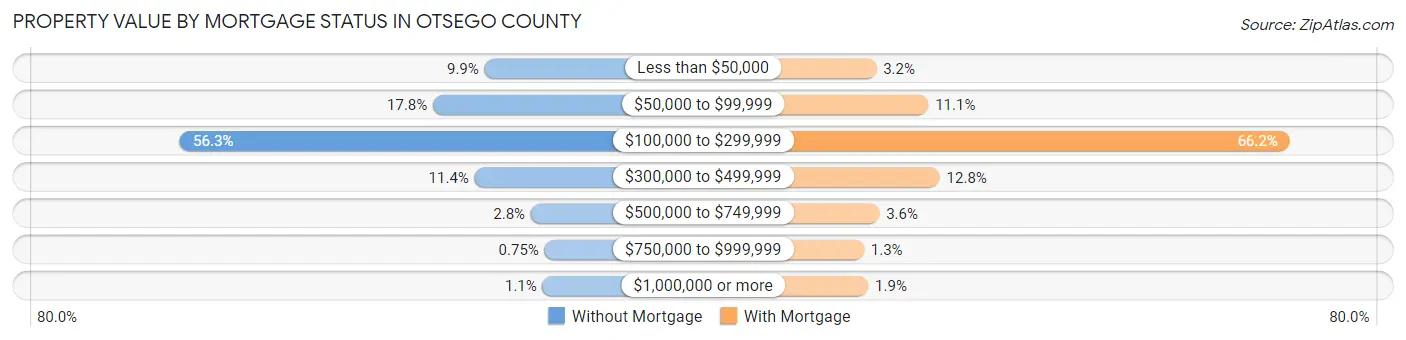
| Property Value | Without Mortgage | With Mortgage |
| Less than $50,000 | 803 (9.9%) | 265 (3.2%) |
| $50,000 to $99,999 | 1,440 (17.7%) | 933 (11.1%) |
| $100,000 to $299,999 | 4,566 (56.3%) | 5,571 (66.1%) |
| $300,000 to $499,999 | 926 (11.4%) | 1,080 (12.8%) |
| $500,000 to $749,999 | 230 (2.8%) | 304 (3.6%) |
| $750,000 to $999,999 | 61 (0.7%) | 107 (1.3%) |
| $1,000,000 or more | 86 (1.1%) | 162 (1.9%) |
| Total | 8,112 (100.0%) | 8,422 (100.0%) |
Household Income by Mortgage Status in Otsego County
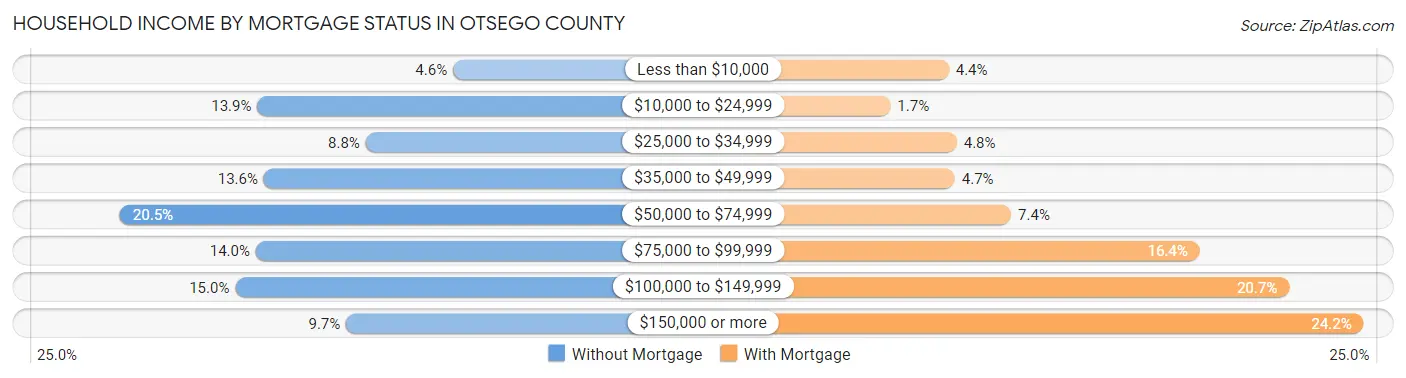
| Household Income | Without Mortgage | With Mortgage |
| Less than $10,000 | 373 (4.6%) | 374 (4.4%) |
| $10,000 to $24,999 | 1,129 (13.9%) | 140 (1.7%) |
| $25,000 to $34,999 | 711 (8.8%) | 406 (4.8%) |
| $35,000 to $49,999 | 1,104 (13.6%) | 398 (4.7%) |
| $50,000 to $74,999 | 1,660 (20.5%) | 624 (7.4%) |
| $75,000 to $99,999 | 1,135 (14.0%) | 1,380 (16.4%) |
| $100,000 to $149,999 | 1,214 (15.0%) | 1,739 (20.6%) |
| $150,000 or more | 786 (9.7%) | 2,037 (24.2%) |
| Total | 8,112 (100.0%) | 8,422 (100.0%) |
Property Value to Household Income Ratio in Otsego County
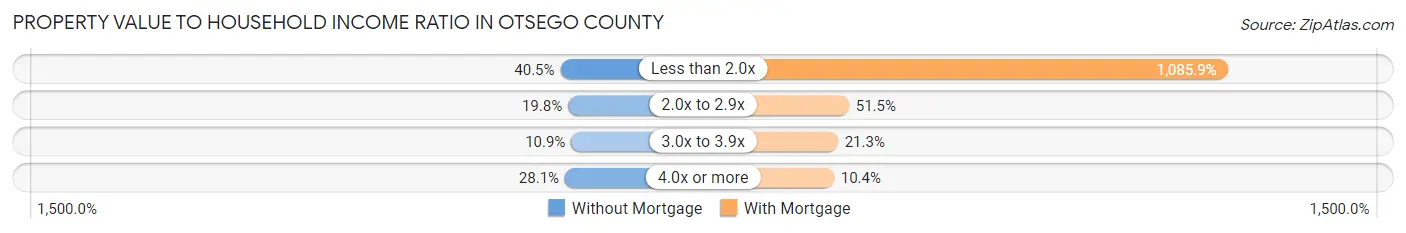
| Value-to-Income Ratio | Without Mortgage | With Mortgage |
| Less than 2.0x | 3,287 (40.5%) | 91,457 (1,085.9%) |
| 2.0x to 2.9x | 1,605 (19.8%) | 4,335 (51.5%) |
| 3.0x to 3.9x | 887 (10.9%) | 1,791 (21.3%) |
| 4.0x or more | 2,283 (28.1%) | 878 (10.4%) |
| Total | 8,112 (100.0%) | 8,422 (100.0%) |
Real Estate Taxes by Mortgage Status in Otsego County
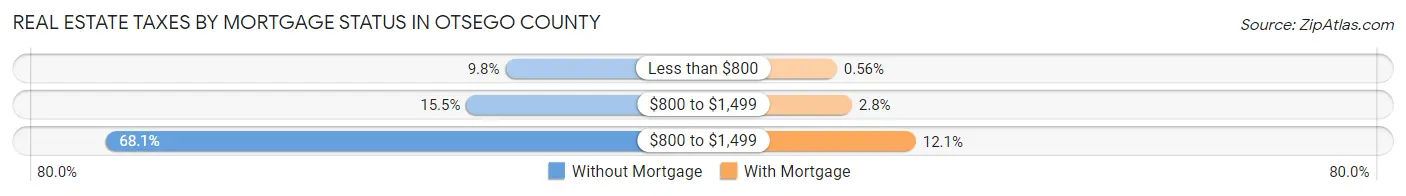
| Property Taxes | Without Mortgage | With Mortgage |
| Less than $800 | 792 (9.8%) | 47 (0.6%) |
| $800 to $1,499 | 1,254 (15.5%) | 232 (2.8%) |
| $800 to $1,499 | 5,520 (68.0%) | 1,018 (12.1%) |
| Total | 8,112 (100.0%) | 8,422 (100.0%) |
Health & Disability in Otsego County
Health Insurance Coverage by Age in Otsego County
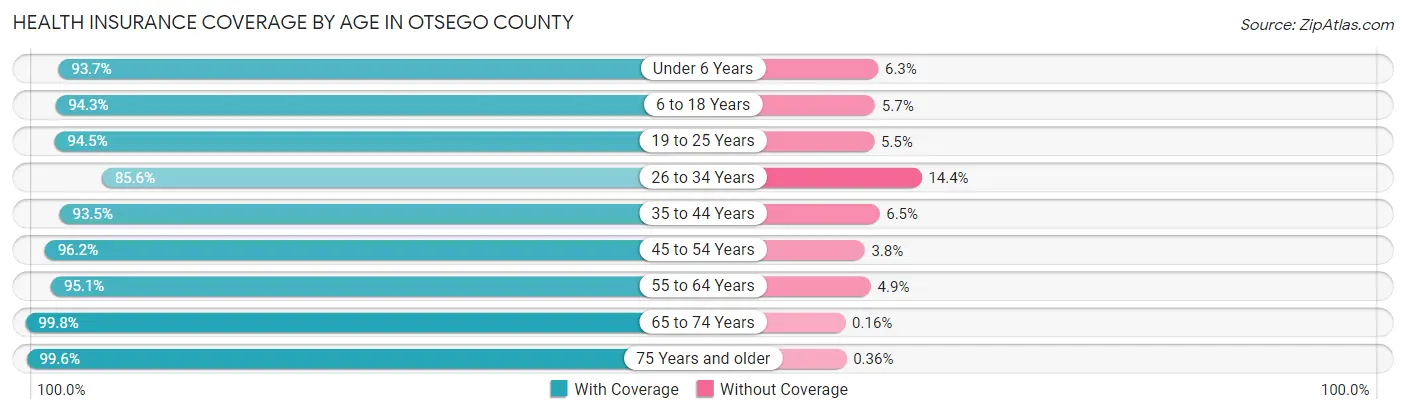
| Age Bracket | With Coverage | Without Coverage |
| Under 6 Years | 2,548 (93.7%) | 171 (6.3%) |
| 6 to 18 Years | 7,701 (94.3%) | 466 (5.7%) |
| 19 to 25 Years | 9,334 (94.5%) | 547 (5.5%) |
| 26 to 34 Years | 4,580 (85.6%) | 770 (14.4%) |
| 35 to 44 Years | 5,365 (93.5%) | 375 (6.5%) |
| 45 to 54 Years | 6,201 (96.2%) | 242 (3.8%) |
| 55 to 64 Years | 7,996 (95.1%) | 414 (4.9%) |
| 65 to 74 Years | 7,344 (99.8%) | 12 (0.2%) |
| 75 Years and older | 4,957 (99.6%) | 18 (0.4%) |
| Total | 56,026 (94.9%) | 3,015 (5.1%) |
Health Insurance Coverage by Citizenship Status in Otsego County
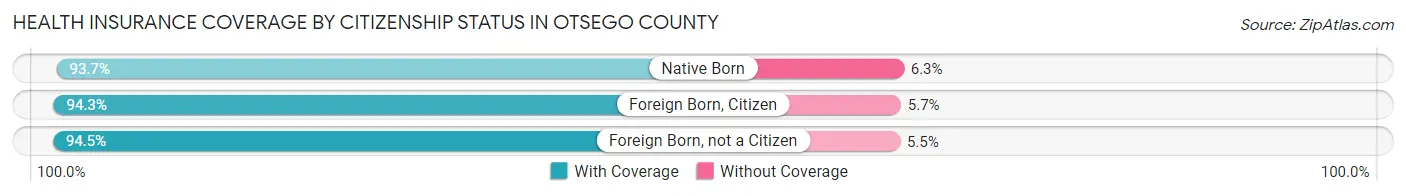
| Citizenship Status | With Coverage | Without Coverage |
| Native Born | 2,548 (93.7%) | 171 (6.3%) |
| Foreign Born, Citizen | 7,701 (94.3%) | 466 (5.7%) |
| Foreign Born, not a Citizen | 9,334 (94.5%) | 547 (5.5%) |
Health Insurance Coverage by Household Income in Otsego County
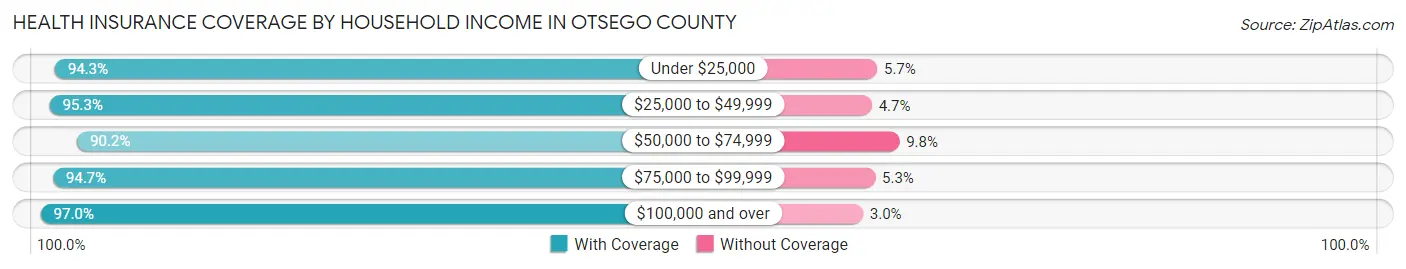
| Household Income | With Coverage | Without Coverage |
| Under $25,000 | 6,536 (94.3%) | 393 (5.7%) |
| $25,000 to $49,999 | 8,466 (95.3%) | 415 (4.7%) |
| $50,000 to $74,999 | 9,321 (90.2%) | 1,015 (9.8%) |
| $75,000 to $99,999 | 8,063 (94.7%) | 451 (5.3%) |
| $100,000 and over | 18,708 (97.0%) | 581 (3.0%) |
Public vs Private Health Insurance Coverage by Age in Otsego County
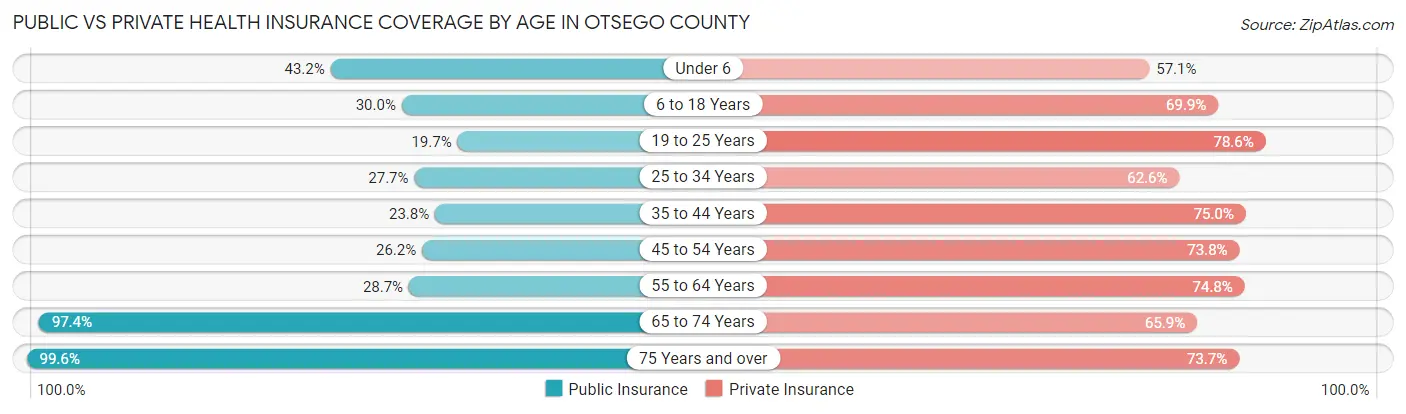
| Age Bracket | Public Insurance | Private Insurance |
| Under 6 | 1,175 (43.2%) | 1,552 (57.1%) |
| 6 to 18 Years | 2,450 (30.0%) | 5,705 (69.9%) |
| 19 to 25 Years | 1,942 (19.7%) | 7,770 (78.6%) |
| 25 to 34 Years | 1,480 (27.7%) | 3,351 (62.6%) |
| 35 to 44 Years | 1,367 (23.8%) | 4,303 (75.0%) |
| 45 to 54 Years | 1,690 (26.2%) | 4,755 (73.8%) |
| 55 to 64 Years | 2,410 (28.7%) | 6,288 (74.8%) |
| 65 to 74 Years | 7,161 (97.4%) | 4,850 (65.9%) |
| 75 Years and over | 4,957 (99.6%) | 3,668 (73.7%) |
| Total | 24,632 (41.7%) | 42,242 (71.6%) |
Disability Status by Sex by Age in Otsego County
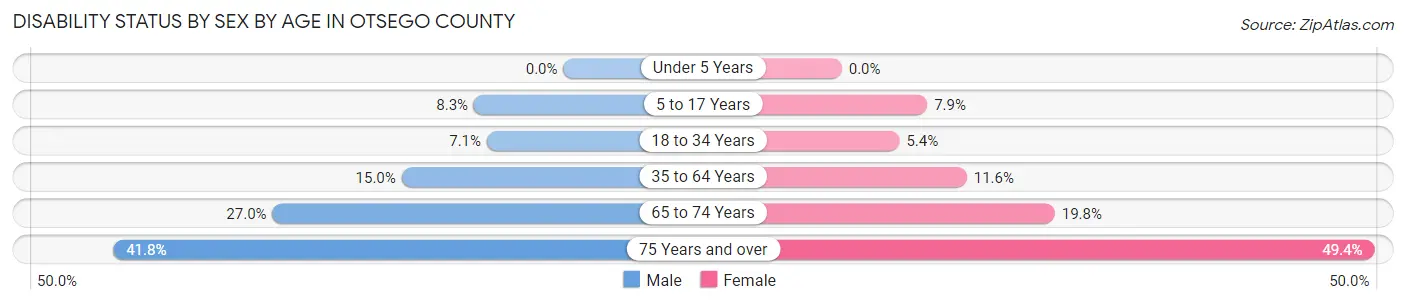
| Age Bracket | Male | Female |
| Under 5 Years | 0 (0.0%) | 0 (0.0%) |
| 5 to 17 Years | 285 (8.3%) | 264 (7.9%) |
| 18 to 34 Years | 573 (7.1%) | 478 (5.3%) |
| 35 to 64 Years | 1,527 (15.0%) | 1,209 (11.6%) |
| 65 to 74 Years | 989 (27.0%) | 730 (19.8%) |
| 75 Years and over | 934 (41.8%) | 1,354 (49.4%) |
Disability Class by Sex by Age in Otsego County
Disability Class: Hearing Difficulty
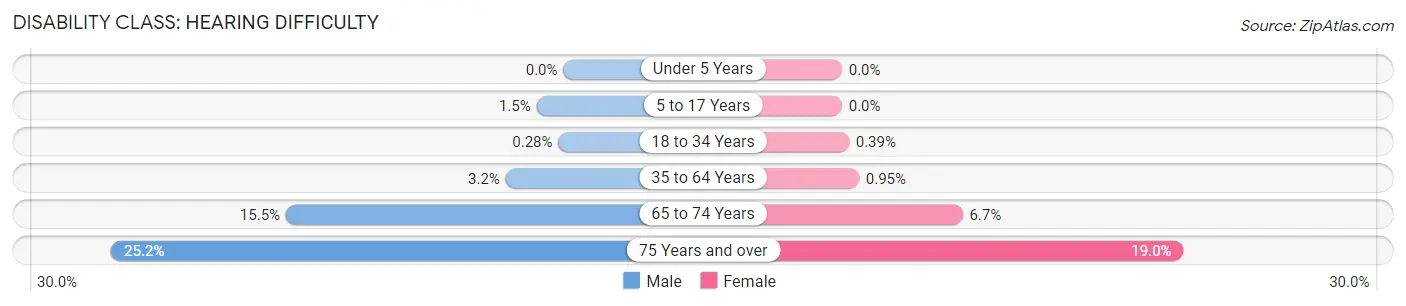
| Age Bracket | Male | Female |
| Under 5 Years | 0 (0.0%) | 0 (0.0%) |
| 5 to 17 Years | 51 (1.5%) | 0 (0.0%) |
| 18 to 34 Years | 23 (0.3%) | 35 (0.4%) |
| 35 to 64 Years | 327 (3.2%) | 99 (0.9%) |
| 65 to 74 Years | 566 (15.4%) | 248 (6.7%) |
| 75 Years and over | 563 (25.2%) | 521 (19.0%) |
Disability Class: Vision Difficulty
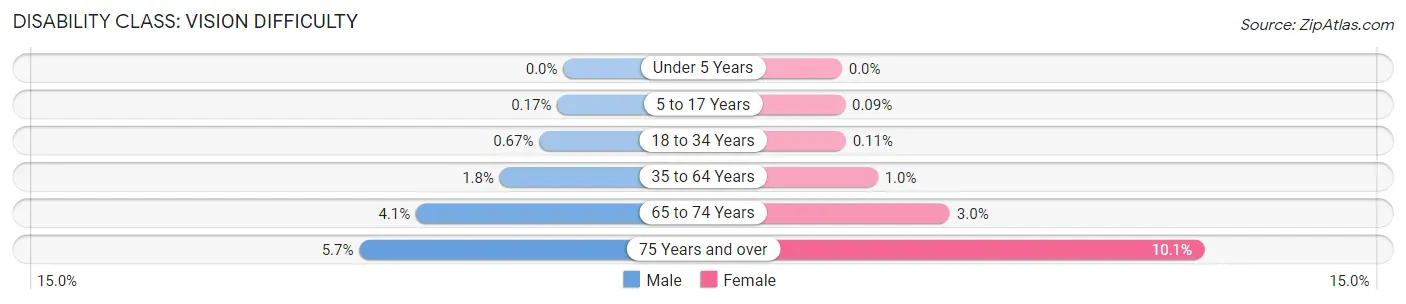
| Age Bracket | Male | Female |
| Under 5 Years | 0 (0.0%) | 0 (0.0%) |
| 5 to 17 Years | 6 (0.2%) | 3 (0.1%) |
| 18 to 34 Years | 54 (0.7%) | 10 (0.1%) |
| 35 to 64 Years | 180 (1.8%) | 104 (1.0%) |
| 65 to 74 Years | 150 (4.1%) | 111 (3.0%) |
| 75 Years and over | 127 (5.7%) | 276 (10.1%) |
Disability Class: Cognitive Difficulty
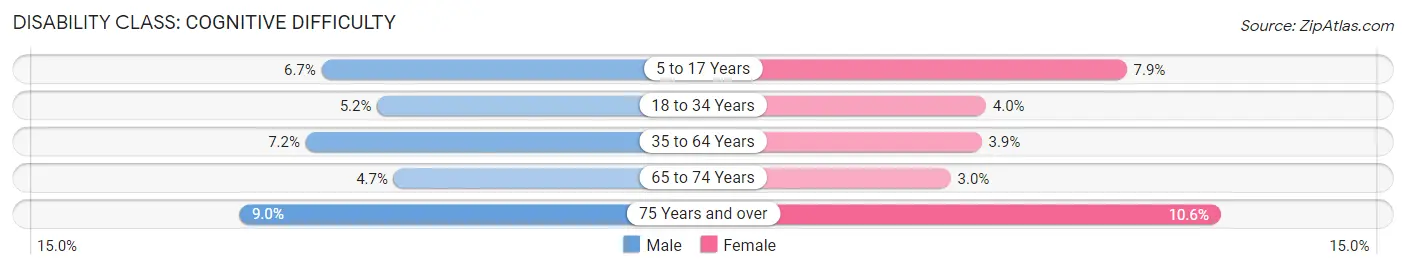
| Age Bracket | Male | Female |
| 5 to 17 Years | 231 (6.7%) | 264 (7.9%) |
| 18 to 34 Years | 418 (5.2%) | 358 (4.0%) |
| 35 to 64 Years | 729 (7.2%) | 405 (3.9%) |
| 65 to 74 Years | 173 (4.7%) | 112 (3.0%) |
| 75 Years and over | 202 (9.0%) | 289 (10.5%) |
Disability Class: Ambulatory Difficulty
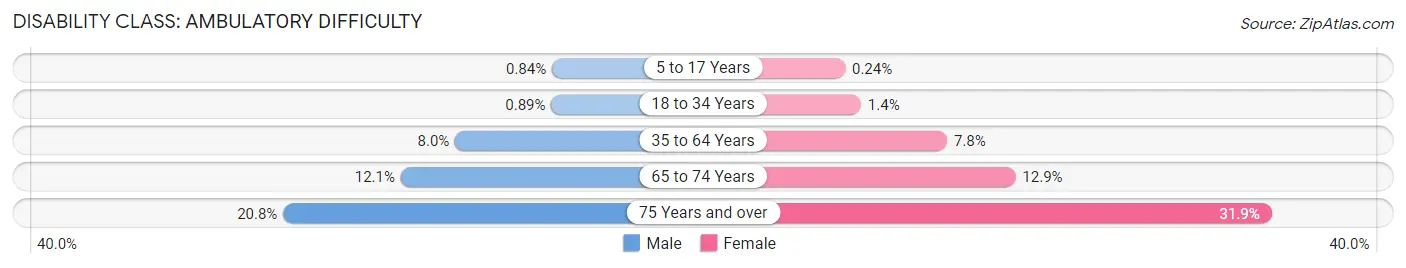
| Age Bracket | Male | Female |
| 5 to 17 Years | 29 (0.8%) | 8 (0.2%) |
| 18 to 34 Years | 72 (0.9%) | 127 (1.4%) |
| 35 to 64 Years | 817 (8.0%) | 814 (7.8%) |
| 65 to 74 Years | 442 (12.1%) | 476 (12.9%) |
| 75 Years and over | 465 (20.8%) | 874 (31.9%) |
Disability Class: Self-Care Difficulty
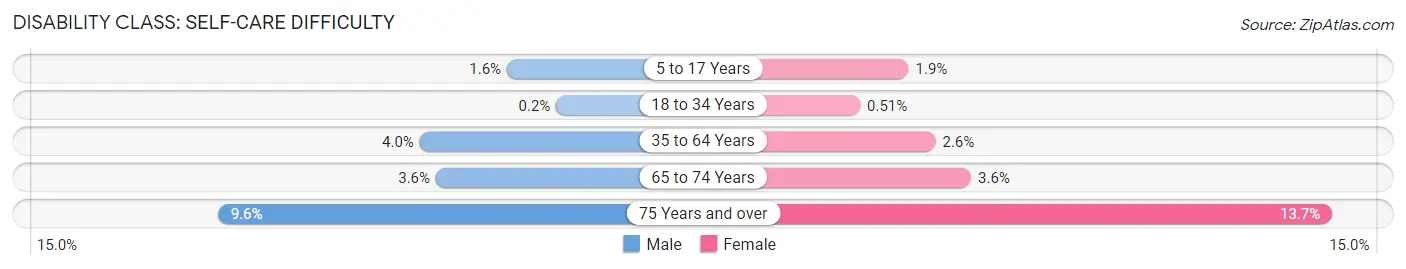
| Age Bracket | Male | Female |
| 5 to 17 Years | 54 (1.6%) | 62 (1.9%) |
| 18 to 34 Years | 16 (0.2%) | 46 (0.5%) |
| 35 to 64 Years | 407 (4.0%) | 272 (2.6%) |
| 65 to 74 Years | 130 (3.5%) | 133 (3.6%) |
| 75 Years and over | 215 (9.6%) | 374 (13.7%) |
Technology Access in Otsego County
Computing Device Access in Otsego County
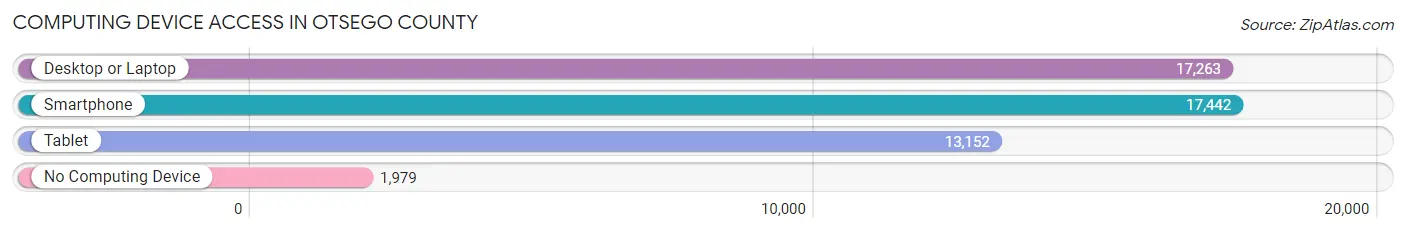
| Device Type | # Households | % Households |
| Desktop or Laptop | 17,263 | 77.4% |
| Smartphone | 17,442 | 78.2% |
| Tablet | 13,152 | 59.0% |
| No Computing Device | 1,979 | 8.9% |
| Total | 22,305 | 100.0% |
Internet Access in Otsego County
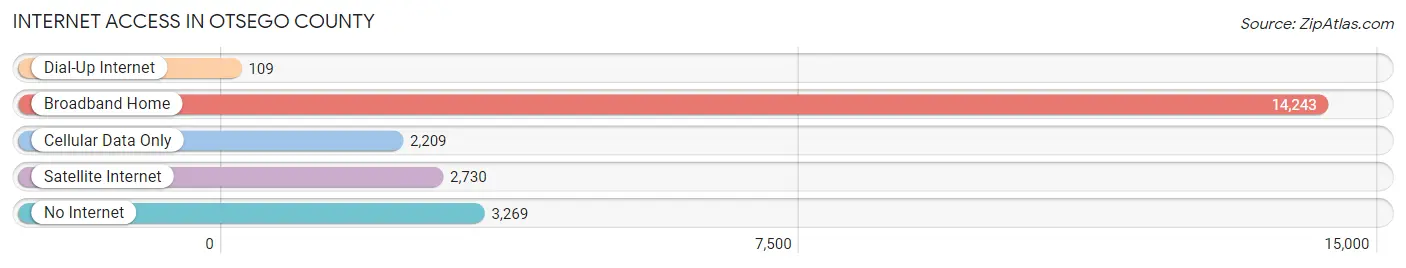
| Internet Type | # Households | % Households |
| Dial-Up Internet | 109 | 0.5% |
| Broadband Home | 14,243 | 63.9% |
| Cellular Data Only | 2,209 | 9.9% |
| Satellite Internet | 2,730 | 12.2% |
| No Internet | 3,269 | 14.7% |
| Total | 22,305 | 100.0% |
Otsego County Summary
Otsego County is located in the central part of New York State, in the foothills of the Catskill Mountains. It is bordered by Schoharie County to the north, Delaware County to the east, Chenango County to the south, and Herkimer County to the west. The county seat is Cooperstown, which is also the home of the National Baseball Hall of Fame and Museum.
History
Otsego County was formed in 1791 from parts of Albany and Montgomery counties. It was named after the Iroquois word for “meeting place”, referring to the area’s importance as a gathering place for the Iroquois Confederacy. The county was originally part of the Iroquois homeland, and the area was home to the Mohawk, Oneida, Onondaga, Cayuga, and Seneca tribes.
The first European settlers arrived in the area in the late 17th century, and the county was officially established in 1791. The county was home to many prominent figures in American history, including James Fenimore Cooper, who wrote the novel The Last of the Mohicans, and William Cooper, who founded the village of Cooperstown.
Geography
Otsego County covers an area of 1,072 square miles, making it the fourth-largest county in New York State. The county is located in the foothills of the Catskill Mountains, and is home to several rivers, including the Susquehanna, the Unadilla, and the Mohawk. The highest point in the county is Mount Utsayantha, which has an elevation of 3,140 feet.
The county is divided into two distinct regions: the northern region is mostly rural and agricultural, while the southern region is more urban and industrialized. The county is home to several state parks, including Glimmerglass State Park, which is located on the shores of Otsego Lake.
Economy
Otsego County has a diverse economy, with a mix of agriculture, manufacturing, and tourism. The county is home to several large employers, including Bassett Healthcare, which operates several hospitals and medical centers in the area. The county is also home to several large dairy farms, as well as several wineries and breweries.
Tourism is an important part of the county’s economy, with the National Baseball Hall of Fame and Museum being the most popular attraction. The county is also home to several ski resorts, including the popular Hunter Mountain Ski Resort.
Demographics
As of the 2010 census, Otsego County had a population of 62,259. The population is predominantly white (94.2%), with small percentages of African Americans (2.2%), Asians (1.2%), and Native Americans (0.5%). The median household income is $50,945, and the median age is 42.7 years.
Conclusion
Otsego County is a diverse and vibrant county located in the foothills of the Catskill Mountains in central New York State. The county has a rich history, and is home to several prominent figures in American history. The county has a diverse economy, with a mix of agriculture, manufacturing, and tourism. The population is predominantly white, with small percentages of African Americans, Asians, and Native Americans. The county is home to several state parks, ski resorts, and the National Baseball Hall of Fame and Museum.
Common Questions
What is Per Capita Income in Otsego County?
Per Capita income in Otsego County is $34,573.
What is the Median Family Income in Otsego County?
Median Family Income in Otsego County is $82,486.
What is the Median Household income in Otsego County?
Median Household Income in Otsego County is $65,778.
What is Income or Wage Gap in Otsego County?
Income or Wage Gap in Otsego County is 29.7%.
Women in Otsego County earn 70.3 cents for every dollar earned by a man.
What is Family Income Deficit in Otsego County?
Family Income Deficit in Otsego County is $9,100.
Families that are below poverty line in Otsego County earn $9,100 less on average than the poverty threshold level.
What is Inequality or Gini Index in Otsego County?
Inequality or Gini Index in Otsego County is 0.45.
What is the Total Population of Otsego County?
Total Population of Otsego County is 59,678.
What is the Total Male Population of Otsego County?
Total Male Population of Otsego County is 29,157.
What is the Total Female Population of Otsego County?
Total Female Population of Otsego County is 30,521.
What is the Ratio of Males per 100 Females in Otsego County?
There are 95.53 Males per 100 Females in Otsego County.
What is the Ratio of Females per 100 Males in Otsego County?
There are 104.68 Females per 100 Males in Otsego County.
What is the Median Population Age in Otsego County?
Median Population Age in Otsego County is 40.8 Years.
What is the Average Family Size in Otsego County
Average Family Size in Otsego County is 3.0 People.
What is the Average Household Size in Otsego County
Average Household Size in Otsego County is 2.4 People.
How Large is the Labor Force in Otsego County?
There are 28,911 People in the Labor Forcein in Otsego County.
What is the Percentage of People in the Labor Force in Otsego County?
56.1% of People are in the Labor Force in Otsego County.
What is the Unemployment Rate in Otsego County?
Unemployment Rate in Otsego County is 5.0%.