Hamilton County, NY Map & Demographics
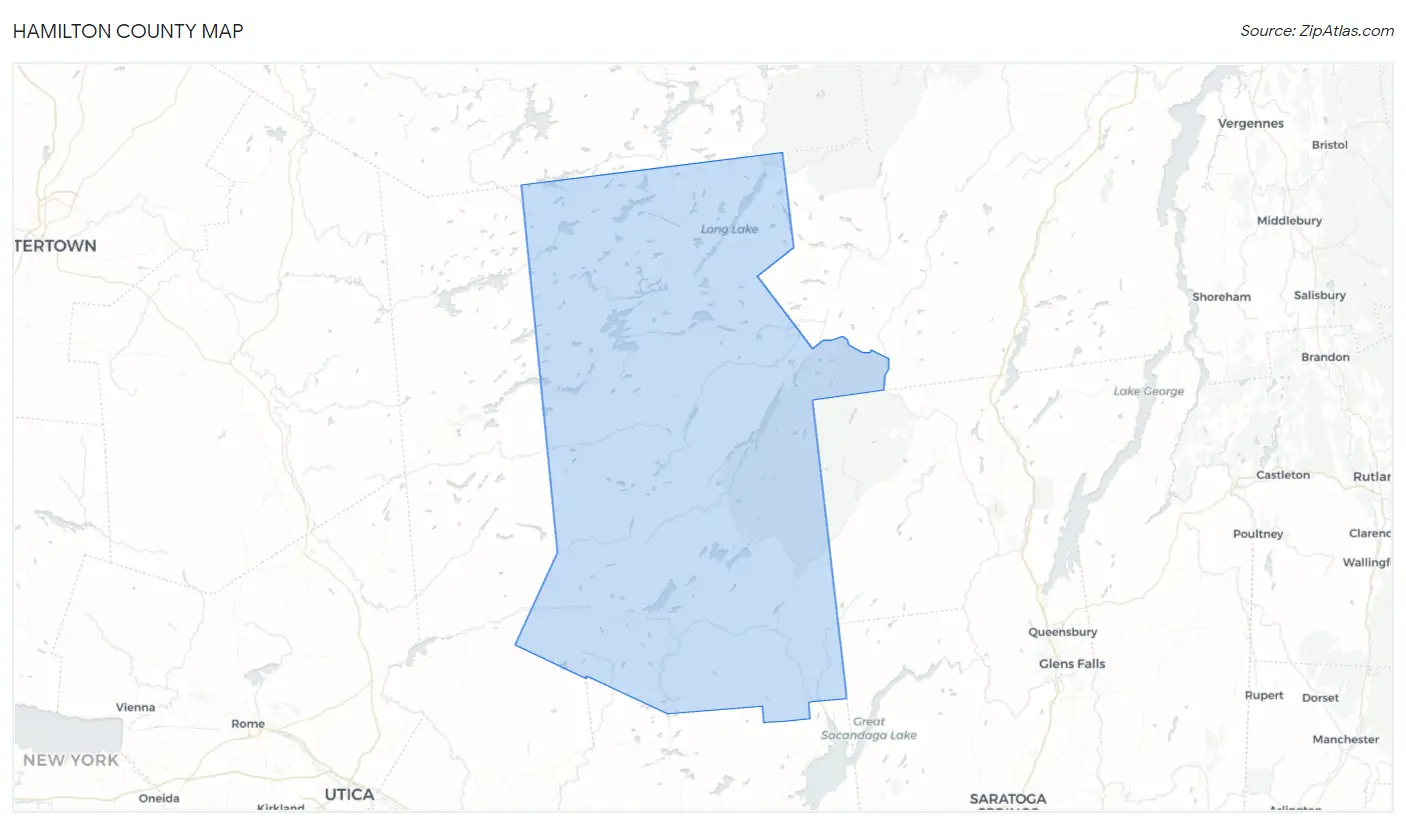
Hamilton County Map
Hamilton County Overview
$37,326
PER CAPITA INCOME
$81,389
AVG FAMILY INCOME
$66,891
AVG HOUSEHOLD INCOME
23.1%
WAGE / INCOME GAP [ % ]
76.9¢/ $1
WAGE / INCOME GAP [ $ ]
0.42
INEQUALITY / GINI INDEX
5,090
TOTAL POPULATION
2,569
MALE POPULATION
2,521
FEMALE POPULATION
101.90
MALES / 100 FEMALES
98.13
FEMALES / 100 MALES
56.4
MEDIAN AGE
3.3
AVG FAMILY SIZE
2.8
AVG HOUSEHOLD SIZE
2,347
LABOR FORCE [ PEOPLE ]
51.8%
PERCENT IN LABOR FORCE
4.9%
UNEMPLOYMENT RATE
Income in Hamilton County
Income Overview in Hamilton County
Per Capita Income in Hamilton County is $37,326, while median incomes of families and households are $81,389 and $66,891 respectively.
| Characteristic | Number | Measure |
| Per Capita Income | 5,090 | $37,326 |
| Median Family Income | 1,158 | $81,389 |
| Mean Family Income | 1,158 | $98,334 |
| Median Household Income | 1,725 | $66,891 |
| Mean Household Income | 1,725 | $86,309 |
| Income Deficit | 1,158 | $0 |
| Wage / Income Gap (%) | 5,090 | 23.15% |
| Wage / Income Gap ($) | 5,090 | 76.85¢ per $1 |
| Gini / Inequality Index | 5,090 | 0.42 |
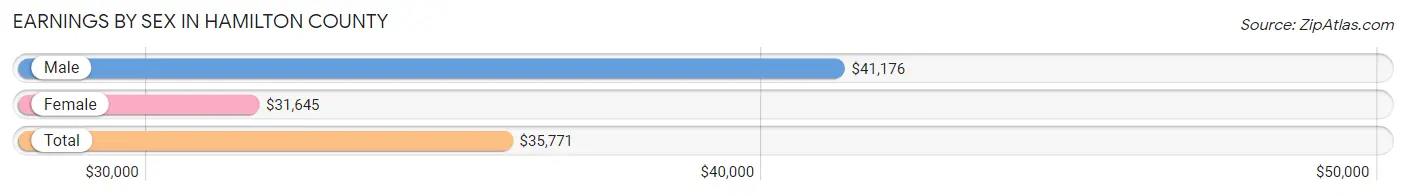
Earnings by Sex in Hamilton County
Average Earnings in Hamilton County are $35,771, $41,176 for men and $31,645 for women, a difference of 23.2%.
| Sex | Number | Average Earnings |
| Male | 1,378 (54.0%) | $41,176 |
| Female | 1,173 (46.0%) | $31,645 |
| Total | 2,551 (100.0%) | $35,771 |
Earnings by Sex by Income Bracket in Hamilton County
The most common earnings brackets in Hamilton County are $30,000 to $34,999 for men (244 | 17.7%) and $40,000 to $44,999 for women (125 | 10.7%).

| Income | Male | Female |
| $2,499 or less | 30 (2.2%) | 46 (3.9%) |
| $2,500 to $4,999 | 68 (4.9%) | 66 (5.6%) |
| $5,000 to $7,499 | 52 (3.8%) | 96 (8.2%) |
| $7,500 to $9,999 | 1 (0.1%) | 57 (4.9%) |
| $10,000 to $12,499 | 44 (3.2%) | 8 (0.7%) |
| $12,500 to $14,999 | 40 (2.9%) | 20 (1.7%) |
| $15,000 to $17,499 | 20 (1.5%) | 59 (5.0%) |
| $17,500 to $19,999 | 25 (1.8%) | 93 (7.9%) |
| $20,000 to $22,499 | 64 (4.6%) | 30 (2.6%) |
| $22,500 to $24,999 | 28 (2.0%) | 41 (3.5%) |
| $25,000 to $29,999 | 24 (1.7%) | 58 (4.9%) |
| $30,000 to $34,999 | 244 (17.7%) | 47 (4.0%) |
| $35,000 to $39,999 | 25 (1.8%) | 67 (5.7%) |
| $40,000 to $44,999 | 68 (4.9%) | 125 (10.7%) |
| $45,000 to $49,999 | 68 (4.9%) | 72 (6.1%) |
| $50,000 to $54,999 | 93 (6.8%) | 33 (2.8%) |
| $55,000 to $64,999 | 116 (8.4%) | 64 (5.5%) |
| $65,000 to $74,999 | 123 (8.9%) | 53 (4.5%) |
| $75,000 to $99,999 | 133 (9.7%) | 64 (5.5%) |
| $100,000+ | 112 (8.1%) | 74 (6.3%) |
| Total | 1,378 (100.0%) | 1,173 (100.0%) |
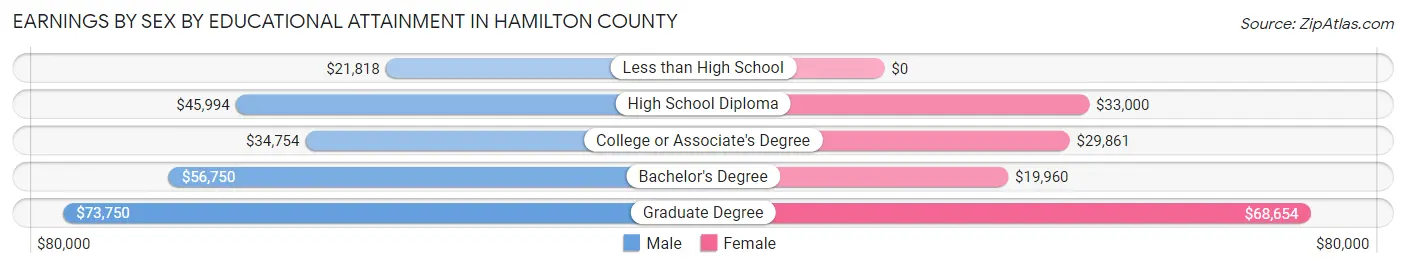
Earnings by Sex by Educational Attainment in Hamilton County
Average earnings in Hamilton County are $44,500 for men and $35,000 for women, a difference of 21.3%. Men with an educational attainment of graduate degree enjoy the highest average annual earnings of $73,750, while those with less than high school education earn the least with $21,818. Women with an educational attainment of graduate degree earn the most with the average annual earnings of $68,654, while those with bachelor's degree education have the smallest earnings of $19,960.
| Educational Attainment | Male Income | Female Income |
| Less than High School | $21,818 | $0 |
| High School Diploma | $45,994 | $33,000 |
| College or Associate's Degree | $34,754 | $29,861 |
| Bachelor's Degree | $56,750 | $19,960 |
| Graduate Degree | $73,750 | $68,654 |
| Total | $44,500 | $35,000 |
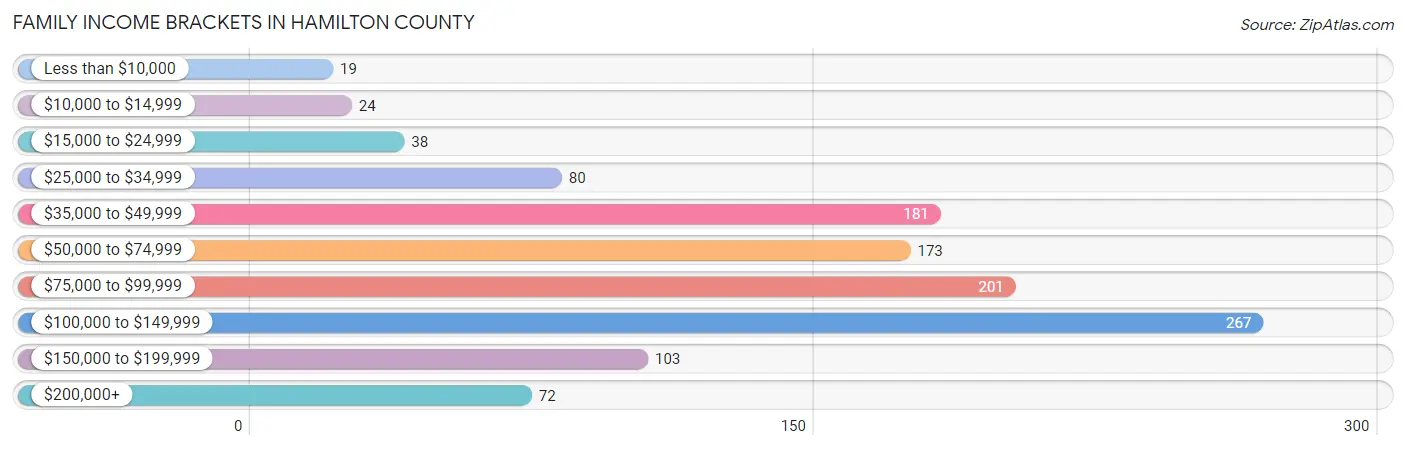
Family Income in Hamilton County
Family Income Brackets in Hamilton County
According to the Hamilton County family income data, there are 267 families falling into the $100,000 to $149,999 income range, which is the most common income bracket and makes up 23.1% of all families. Conversely, the less than $10,000 income bracket is the least frequent group with only 19 families (1.6%) belonging to this category.
| Income Bracket | # Families | % Families |
| Less than $10,000 | 19 | 1.6% |
| $10,000 to $14,999 | 24 | 2.1% |
| $15,000 to $24,999 | 38 | 3.3% |
| $25,000 to $34,999 | 80 | 6.9% |
| $35,000 to $49,999 | 181 | 15.6% |
| $50,000 to $74,999 | 173 | 14.9% |
| $75,000 to $99,999 | 201 | 17.4% |
| $100,000 to $149,999 | 267 | 23.1% |
| $150,000 to $199,999 | 103 | 8.9% |
| $200,000+ | 72 | 6.2% |
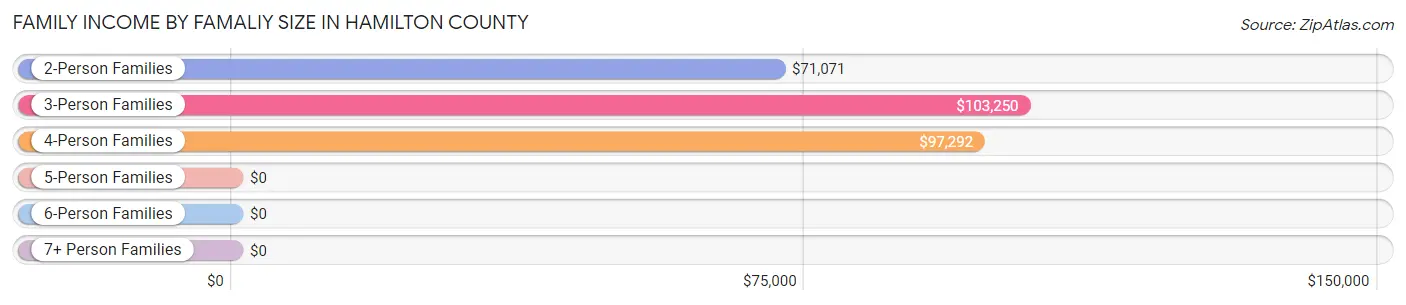
Family Income by Famaliy Size in Hamilton County
3-person families (199 | 17.2%) account for the highest median family income in Hamilton County with $103,250 per family, while 2-person families (766 | 66.1%) have the highest median income of $35,536 per family member.
| Income Bracket | # Families | Median Income |
| 2-Person Families | 766 (66.1%) | $71,071 |
| 3-Person Families | 199 (17.2%) | $103,250 |
| 4-Person Families | 107 (9.2%) | $97,292 |
| 5-Person Families | 52 (4.5%) | $0 |
| 6-Person Families | 32 (2.8%) | $0 |
| 7+ Person Families | 2 (0.2%) | $0 |
| Total | 1,158 (100.0%) | $81,389 |
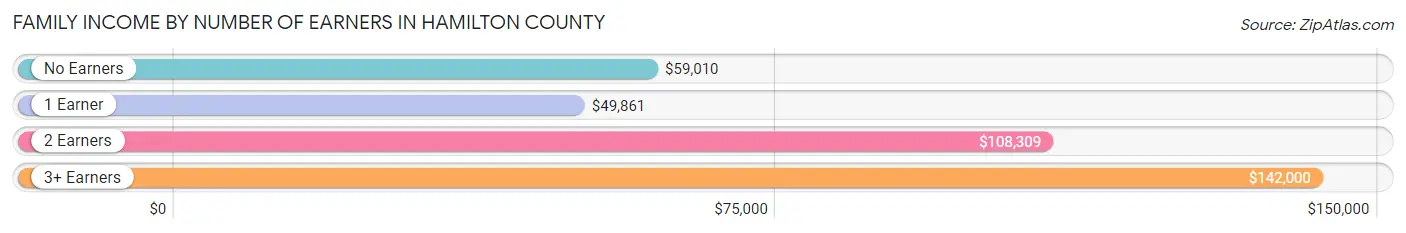
Family Income by Number of Earners in Hamilton County
The median family income in Hamilton County is $81,389, with families comprising 3+ earners (106) having the highest median family income of $142,000, while families with 1 earner (341) have the lowest median family income of $49,861, accounting for 9.1% and 29.4% of families, respectively.
| Number of Earners | # Families | Median Income |
| No Earners | 305 (26.3%) | $59,010 |
| 1 Earner | 341 (29.4%) | $49,861 |
| 2 Earners | 406 (35.1%) | $108,309 |
| 3+ Earners | 106 (9.1%) | $142,000 |
| Total | 1,158 (100.0%) | $81,389 |
Household Income in Hamilton County
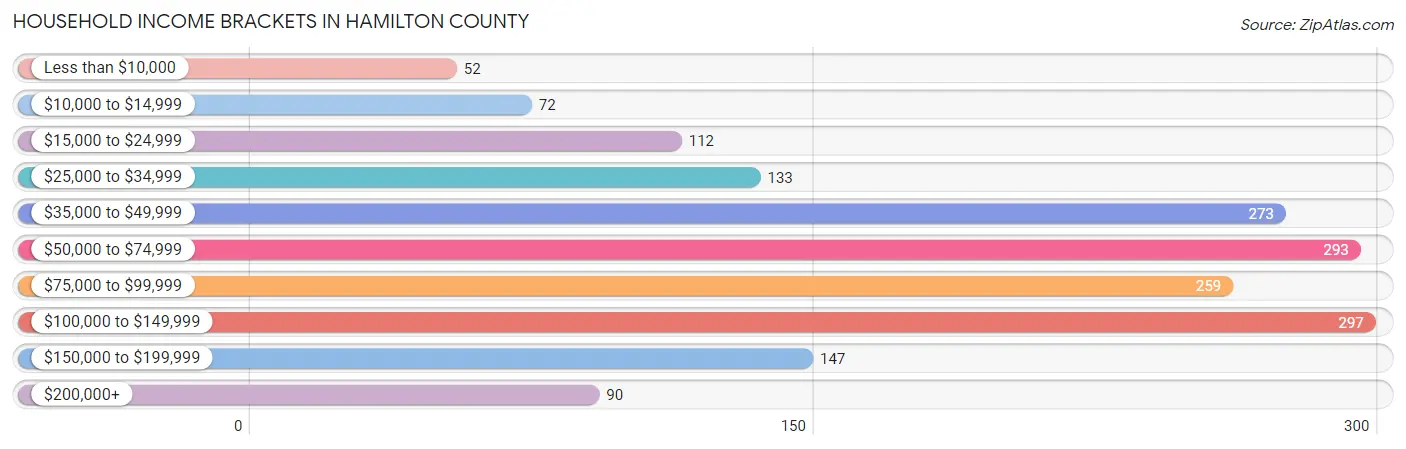
Household Income Brackets in Hamilton County
With 297 households falling in the category, the $100,000 to $149,999 income range is the most frequent in Hamilton County, accounting for 17.2% of all households. In contrast, only 52 households (3.0%) fall into the less than $10,000 income bracket, making it the least populous group.
| Income Bracket | # Households | % Households |
| Less than $10,000 | 52 | 3.0% |
| $10,000 to $14,999 | 72 | 4.2% |
| $15,000 to $24,999 | 112 | 6.5% |
| $25,000 to $34,999 | 133 | 7.7% |
| $35,000 to $49,999 | 273 | 15.8% |
| $50,000 to $74,999 | 293 | 17.0% |
| $75,000 to $99,999 | 259 | 15.0% |
| $100,000 to $149,999 | 297 | 17.2% |
| $150,000 to $199,999 | 147 | 8.5% |
| $200,000+ | 90 | 5.2% |
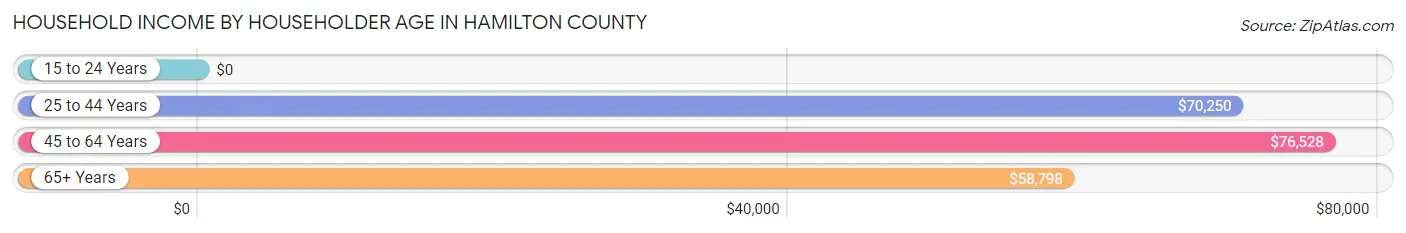
Household Income by Householder Age in Hamilton County
The median household income in Hamilton County is $66,891, with the highest median household income of $76,528 found in the 45 to 64 years age bracket for the primary householder. A total of 807 households (46.8%) fall into this category. Meanwhile, the 15 to 24 years age bracket for the primary householder has the lowest median household income of $0, with 4 households (0.2%) in this group.
| Income Bracket | # Households | Median Income |
| 15 to 24 Years | 4 (0.2%) | $0 |
| 25 to 44 Years | 255 (14.8%) | $70,250 |
| 45 to 64 Years | 807 (46.8%) | $76,528 |
| 65+ Years | 659 (38.2%) | $58,798 |
| Total | 1,725 (100.0%) | $66,891 |
Poverty in Hamilton County
Income Below Poverty by Sex and Age in Hamilton County
With 11.7% poverty level for males and 9.7% for females among the residents of Hamilton County, 6 to 11 year old males and 12 to 14 year old females are the most vulnerable to poverty, with 25 males (24.5%) and 15 females (38.5%) in their respective age groups living below the poverty level.
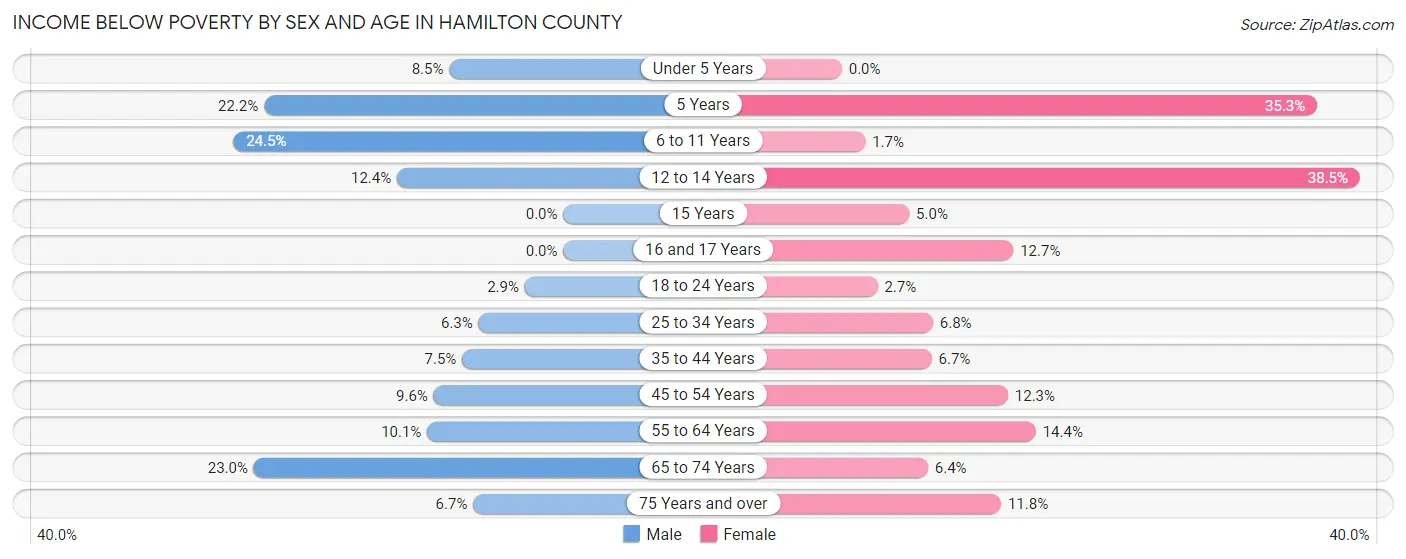
| Age Bracket | Male | Female |
| Under 5 Years | 5 (8.5%) | 0 (0.0%) |
| 5 Years | 2 (22.2%) | 6 (35.3%) |
| 6 to 11 Years | 25 (24.5%) | 2 (1.7%) |
| 12 to 14 Years | 10 (12.3%) | 15 (38.5%) |
| 15 Years | 0 (0.0%) | 1 (5.0%) |
| 16 and 17 Years | 0 (0.0%) | 7 (12.7%) |
| 18 to 24 Years | 5 (2.9%) | 3 (2.6%) |
| 25 to 34 Years | 11 (6.3%) | 14 (6.8%) |
| 35 to 44 Years | 16 (7.5%) | 15 (6.7%) |
| 45 to 54 Years | 31 (9.6%) | 37 (12.3%) |
| 55 to 64 Years | 53 (10.1%) | 73 (14.4%) |
| 65 to 74 Years | 122 (23.0%) | 32 (6.4%) |
| 75 Years and over | 19 (6.7%) | 37 (11.8%) |
| Total | 299 (11.7%) | 242 (9.7%) |
Income Above Poverty by Sex and Age in Hamilton County
According to the poverty statistics in Hamilton County, males aged 15 years and females aged under 5 years are the age groups that are most secure financially, with 100.0% of males and 100.0% of females in these age groups living above the poverty line.
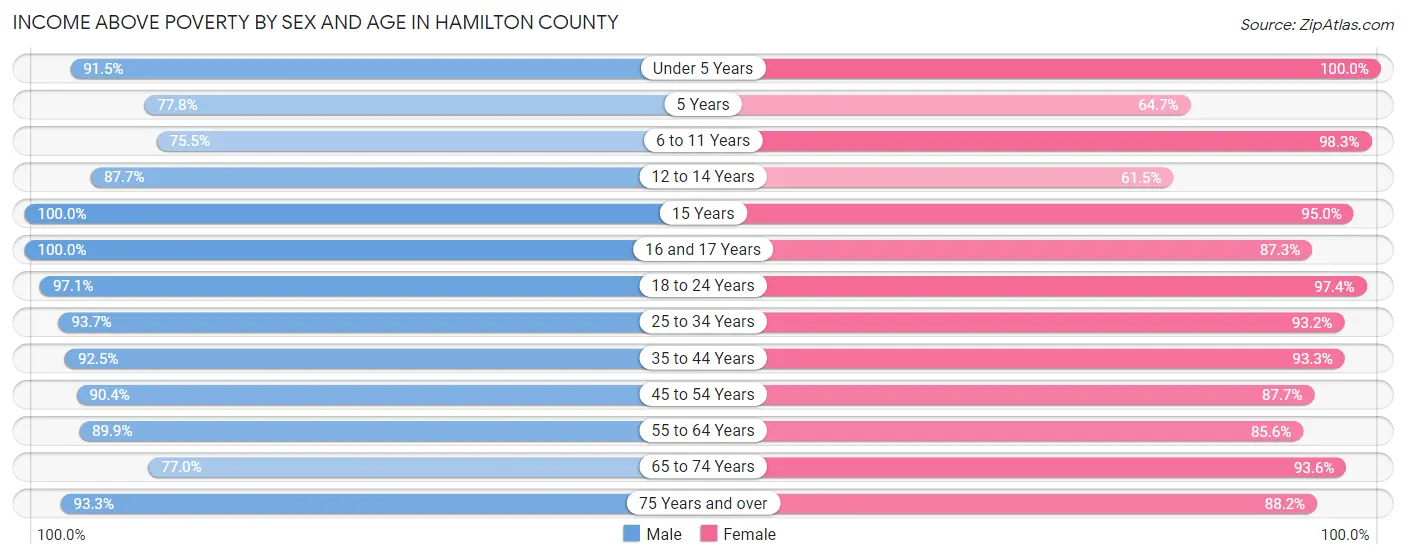
| Age Bracket | Male | Female |
| Under 5 Years | 54 (91.5%) | 87 (100.0%) |
| 5 Years | 7 (77.8%) | 11 (64.7%) |
| 6 to 11 Years | 77 (75.5%) | 113 (98.3%) |
| 12 to 14 Years | 71 (87.6%) | 24 (61.5%) |
| 15 Years | 22 (100.0%) | 19 (95.0%) |
| 16 and 17 Years | 50 (100.0%) | 48 (87.3%) |
| 18 to 24 Years | 170 (97.1%) | 110 (97.4%) |
| 25 to 34 Years | 164 (93.7%) | 193 (93.2%) |
| 35 to 44 Years | 197 (92.5%) | 210 (93.3%) |
| 45 to 54 Years | 291 (90.4%) | 263 (87.7%) |
| 55 to 64 Years | 471 (89.9%) | 434 (85.6%) |
| 65 to 74 Years | 409 (77.0%) | 469 (93.6%) |
| 75 Years and over | 265 (93.3%) | 276 (88.2%) |
| Total | 2,248 (88.3%) | 2,257 (90.3%) |
Income Below Poverty Among Married-Couple Families in Hamilton County
The poverty statistics for married-couple families in Hamilton County show that 1.8% or 18 of the total 1,008 families live below the poverty line. Families with 3 or 4 children have the highest poverty rate of 2.8%, comprising of 1 families. On the other hand, families with 1 or 2 children have the lowest poverty rate of 0.0%, which includes 0 families.
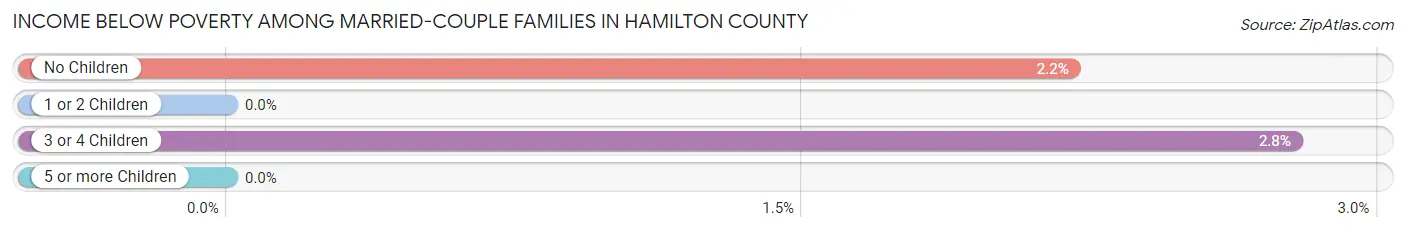
| Children | Above Poverty | Below Poverty |
| No Children | 756 (97.8%) | 17 (2.2%) |
| 1 or 2 Children | 199 (100.0%) | 0 (0.0%) |
| 3 or 4 Children | 35 (97.2%) | 1 (2.8%) |
| 5 or more Children | 0 (0.0%) | 0 (0.0%) |
| Total | 990 (98.2%) | 18 (1.8%) |
Income Below Poverty Among Single-Parent Households in Hamilton County
According to the poverty data in Hamilton County, 9.1% or 5 single-father households and 25.3% or 24 single-mother households are living below the poverty line. Among single-father households, those with 3 or 4 children have the highest poverty rate, with 5 households (100.0%) experiencing poverty. Likewise, among single-mother households, those with 1 or 2 children have the highest poverty rate, with 19 households (33.9%) falling below the poverty line.
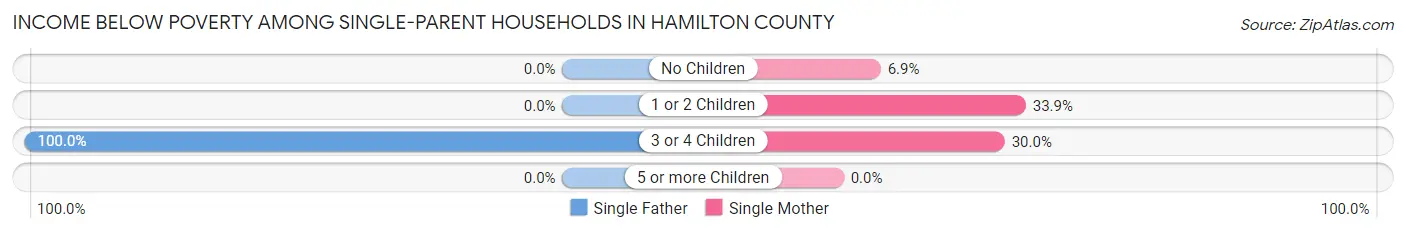
| Children | Single Father | Single Mother |
| No Children | 0 (0.0%) | 2 (6.9%) |
| 1 or 2 Children | 0 (0.0%) | 19 (33.9%) |
| 3 or 4 Children | 5 (100.0%) | 3 (30.0%) |
| 5 or more Children | 0 (0.0%) | 0 (0.0%) |
| Total | 5 (9.1%) | 24 (25.3%) |
Income Below Poverty Among Married-Couple vs Single-Parent Households in Hamilton County
The poverty data for Hamilton County shows that 18 of the married-couple family households (1.8%) and 29 of the single-parent households (19.3%) are living below the poverty level. Within the married-couple family households, those with 3 or 4 children have the highest poverty rate, with 1 households (2.8%) falling below the poverty line. Among the single-parent households, those with 3 or 4 children have the highest poverty rate, with 8 household (53.3%) living below poverty.
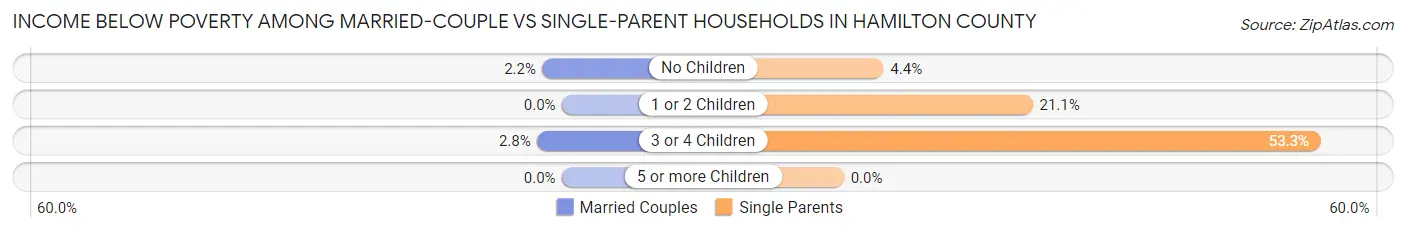
| Children | Married-Couple Families | Single-Parent Households |
| No Children | 17 (2.2%) | 2 (4.4%) |
| 1 or 2 Children | 0 (0.0%) | 19 (21.1%) |
| 3 or 4 Children | 1 (2.8%) | 8 (53.3%) |
| 5 or more Children | 0 (0.0%) | 0 (0.0%) |
| Total | 18 (1.8%) | 29 (19.3%) |
Race in Hamilton County
The most populous races in Hamilton County are White / Caucasian (4,706 | 92.5%), Two or more Races (258 | 5.1%), and Hispanic or Latino (102 | 2.0%).
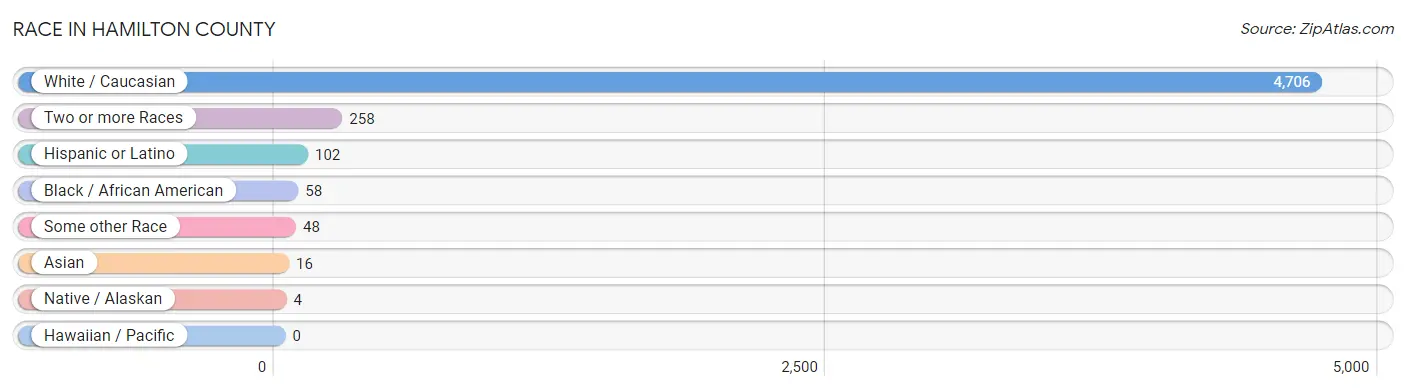
| Race | # Population | % Population |
| Asian | 16 | 0.3% |
| Black / African American | 58 | 1.1% |
| Hawaiian / Pacific | 0 | 0.0% |
| Hispanic or Latino | 102 | 2.0% |
| Native / Alaskan | 4 | 0.1% |
| White / Caucasian | 4,706 | 92.5% |
| Two or more Races | 258 | 5.1% |
| Some other Race | 48 | 0.9% |
| Total | 5,090 | 100.0% |
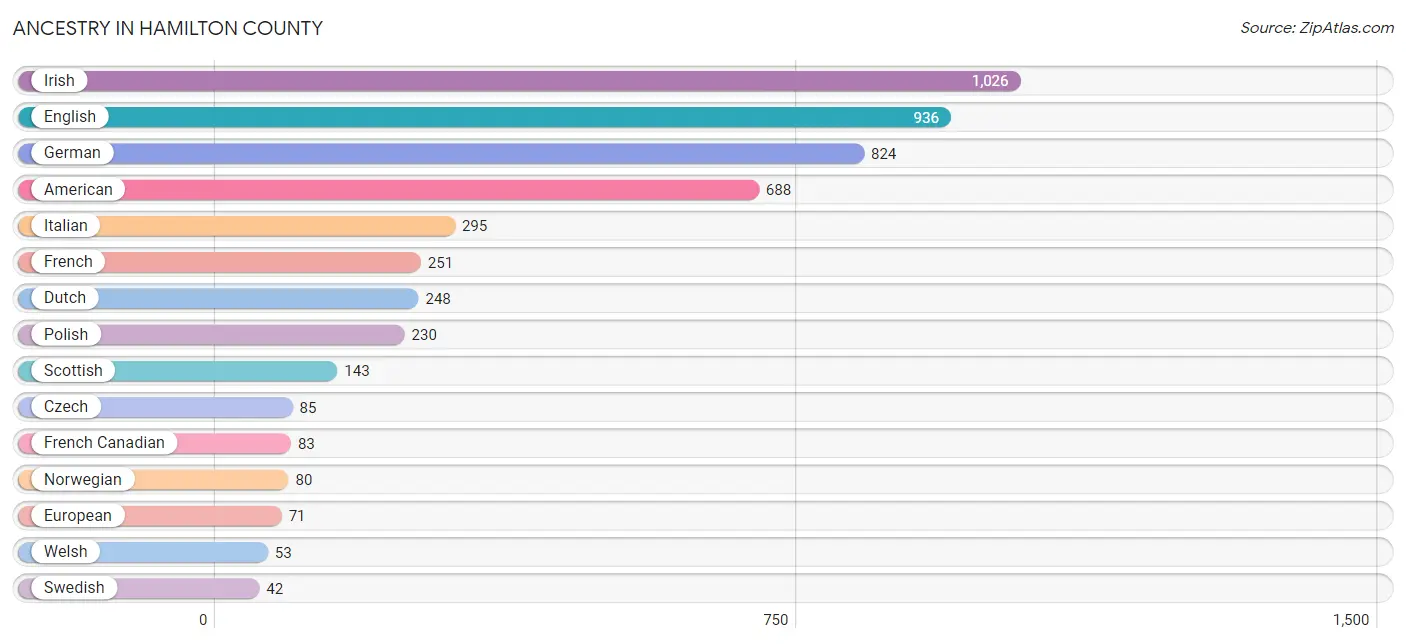
Ancestry in Hamilton County
The most populous ancestries reported in Hamilton County are Irish (1,026 | 20.2%), English (936 | 18.4%), German (824 | 16.2%), American (688 | 13.5%), and Italian (295 | 5.8%), together accounting for 74.1% of all Hamilton County residents.
| Ancestry | # Population | % Population |
| American | 688 | 13.5% |
| Arab | 11 | 0.2% |
| Austrian | 1 | 0.0% |
| British | 29 | 0.6% |
| Canadian | 9 | 0.2% |
| Central American | 20 | 0.4% |
| Cherokee | 8 | 0.2% |
| Chippewa | 1 | 0.0% |
| Cuban | 7 | 0.1% |
| Czech | 85 | 1.7% |
| Czechoslovakian | 7 | 0.1% |
| Danish | 14 | 0.3% |
| Dutch | 248 | 4.9% |
| Eastern European | 7 | 0.1% |
| Ecuadorian | 1 | 0.0% |
| English | 936 | 18.4% |
| European | 71 | 1.4% |
| Finnish | 8 | 0.2% |
| French | 251 | 4.9% |
| French American Indian | 5 | 0.1% |
| French Canadian | 83 | 1.6% |
| German | 824 | 16.2% |
| Greek | 6 | 0.1% |
| Guatemalan | 13 | 0.3% |
| Hungarian | 26 | 0.5% |
| Indian (Asian) | 16 | 0.3% |
| Irish | 1,026 | 20.2% |
| Iroquois | 12 | 0.2% |
| Italian | 295 | 5.8% |
| Lebanese | 11 | 0.2% |
| Lithuanian | 8 | 0.2% |
| Maltese | 2 | 0.0% |
| Northern European | 9 | 0.2% |
| Norwegian | 80 | 1.6% |
| Panamanian | 7 | 0.1% |
| Peruvian | 36 | 0.7% |
| Polish | 230 | 4.5% |
| Puerto Rican | 29 | 0.6% |
| Romanian | 3 | 0.1% |
| Russian | 25 | 0.5% |
| Scandinavian | 4 | 0.1% |
| Scotch-Irish | 29 | 0.6% |
| Scottish | 143 | 2.8% |
| Sioux | 1 | 0.0% |
| Slovak | 1 | 0.0% |
| South American | 37 | 0.7% |
| Spanish | 5 | 0.1% |
| Swedish | 42 | 0.8% |
| Swiss | 13 | 0.3% |
| Ukrainian | 6 | 0.1% |
| Welsh | 53 | 1.0% |
| West Indian | 2 | 0.0% |
| Yugoslavian | 6 | 0.1% | View All 53 Rows |
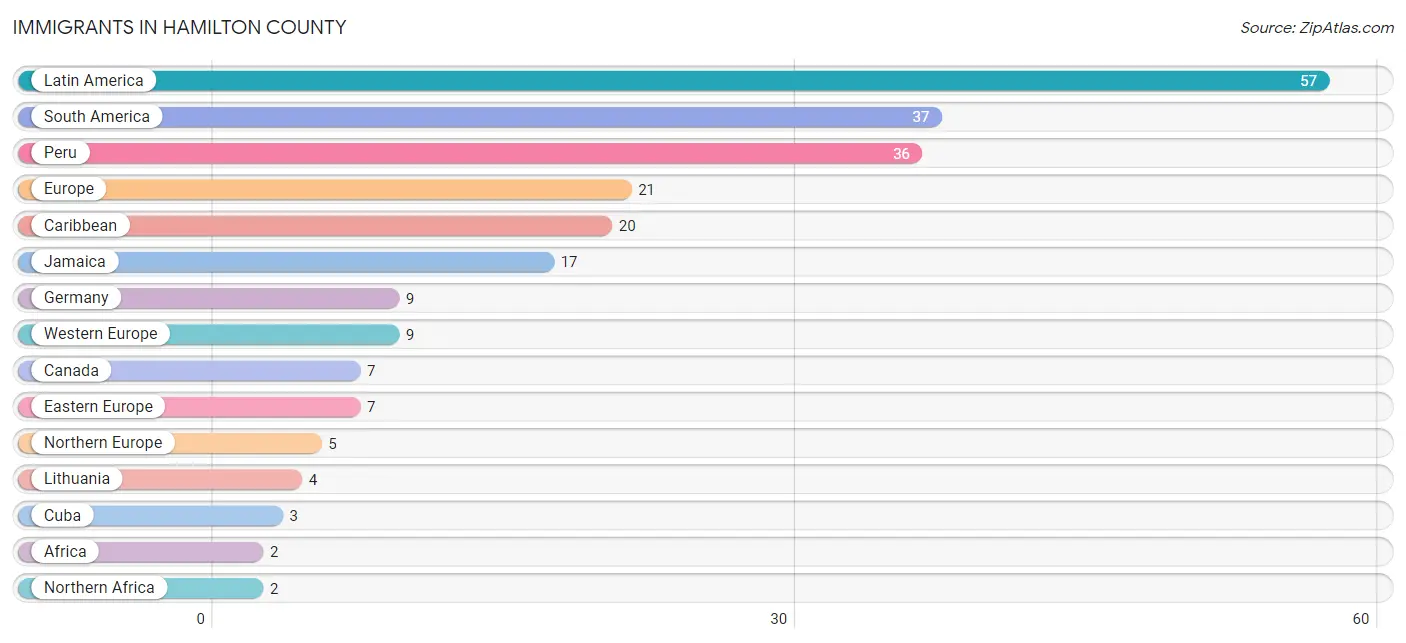
Immigrants in Hamilton County
The most numerous immigrant groups reported in Hamilton County came from Latin America (57 | 1.1%), South America (37 | 0.7%), Peru (36 | 0.7%), Europe (21 | 0.4%), and Caribbean (20 | 0.4%), together accounting for 3.4% of all Hamilton County residents.
| Immigration Origin | # Population | % Population |
| Africa | 2 | 0.0% |
| Canada | 7 | 0.1% |
| Caribbean | 20 | 0.4% |
| Cuba | 3 | 0.1% |
| Eastern Europe | 7 | 0.1% |
| Ecuador | 1 | 0.0% |
| England | 1 | 0.0% |
| Europe | 21 | 0.4% |
| Germany | 9 | 0.2% |
| Jamaica | 17 | 0.3% |
| Latin America | 57 | 1.1% |
| Lithuania | 4 | 0.1% |
| Northern Africa | 2 | 0.0% |
| Northern Europe | 5 | 0.1% |
| Peru | 36 | 0.7% |
| Romania | 1 | 0.0% |
| South America | 37 | 0.7% |
| Sudan | 2 | 0.0% |
| Ukraine | 2 | 0.0% |
| Western Europe | 9 | 0.2% | View All 20 Rows |
Sex and Age in Hamilton County
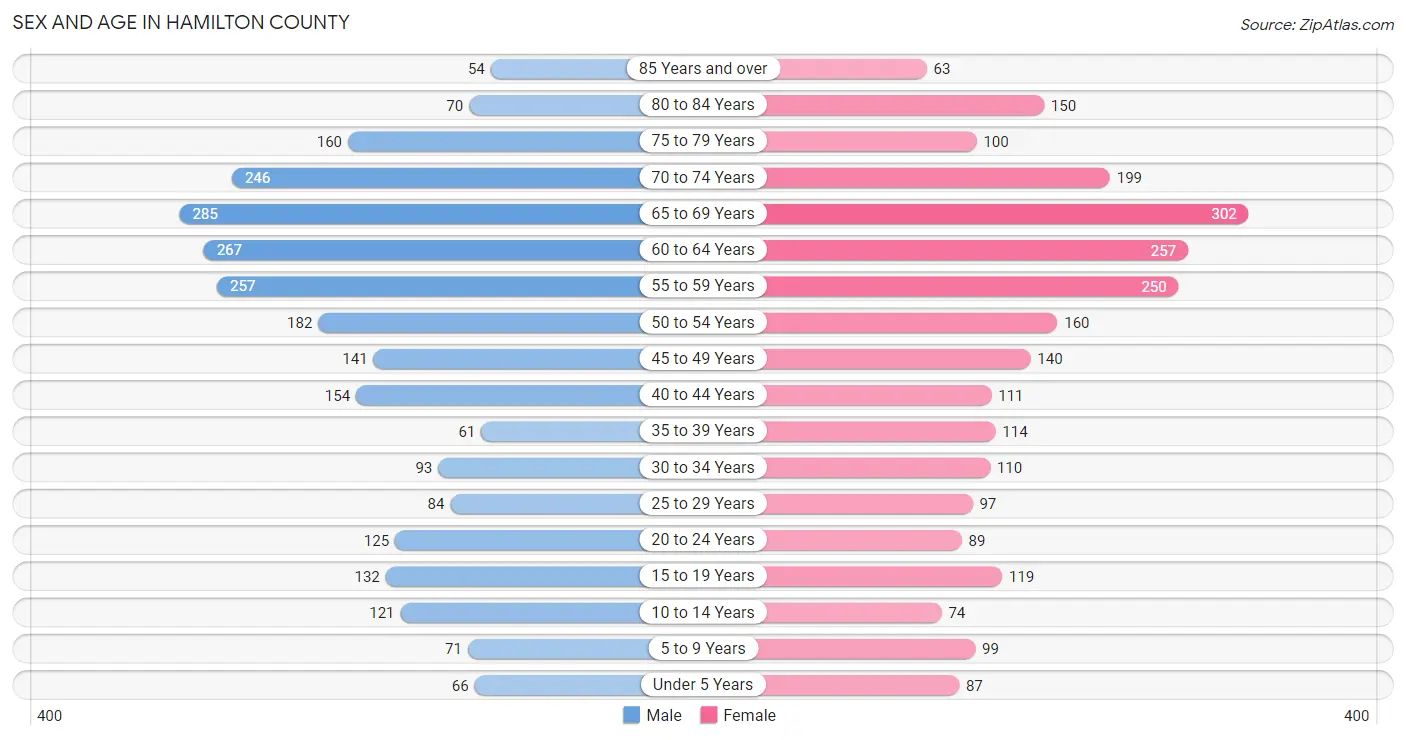
Sex and Age in Hamilton County
The most populous age groups in Hamilton County are 65 to 69 Years (285 | 11.1%) for men and 65 to 69 Years (302 | 12.0%) for women.
| Age Bracket | Male | Female |
| Under 5 Years | 66 (2.6%) | 87 (3.5%) |
| 5 to 9 Years | 71 (2.8%) | 99 (3.9%) |
| 10 to 14 Years | 121 (4.7%) | 74 (2.9%) |
| 15 to 19 Years | 132 (5.1%) | 119 (4.7%) |
| 20 to 24 Years | 125 (4.9%) | 89 (3.5%) |
| 25 to 29 Years | 84 (3.3%) | 97 (3.8%) |
| 30 to 34 Years | 93 (3.6%) | 110 (4.4%) |
| 35 to 39 Years | 61 (2.4%) | 114 (4.5%) |
| 40 to 44 Years | 154 (6.0%) | 111 (4.4%) |
| 45 to 49 Years | 141 (5.5%) | 140 (5.6%) |
| 50 to 54 Years | 182 (7.1%) | 160 (6.4%) |
| 55 to 59 Years | 257 (10.0%) | 250 (9.9%) |
| 60 to 64 Years | 267 (10.4%) | 257 (10.2%) |
| 65 to 69 Years | 285 (11.1%) | 302 (12.0%) |
| 70 to 74 Years | 246 (9.6%) | 199 (7.9%) |
| 75 to 79 Years | 160 (6.2%) | 100 (4.0%) |
| 80 to 84 Years | 70 (2.7%) | 150 (5.9%) |
| 85 Years and over | 54 (2.1%) | 63 (2.5%) |
| Total | 2,569 (100.0%) | 2,521 (100.0%) |
Families and Households in Hamilton County
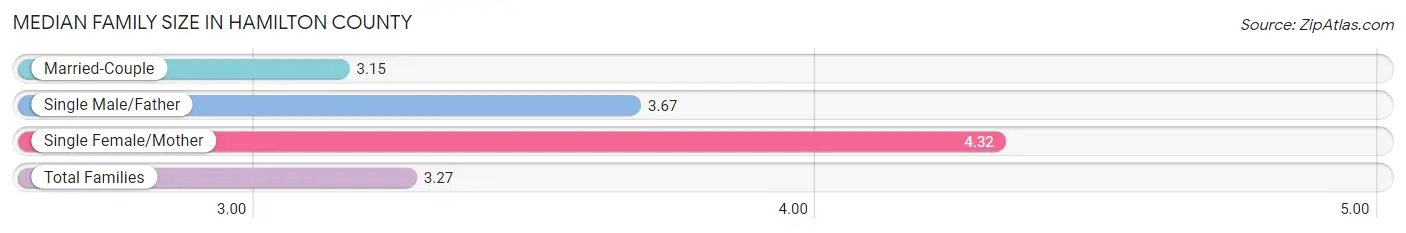
Median Family Size in Hamilton County
The median family size in Hamilton County is 3.27 persons per family, with single female/mother families (95 | 8.2%) accounting for the largest median family size of 4.32 persons per family. On the other hand, married-couple families (1,008 | 87.1%) represent the smallest median family size with 3.15 persons per family.
| Family Type | # Families | Family Size |
| Married-Couple | 1,008 (87.1%) | 3.15 |
| Single Male/Father | 55 (4.8%) | 3.67 |
| Single Female/Mother | 95 (8.2%) | 4.32 |
| Total Families | 1,158 (100.0%) | 3.27 |
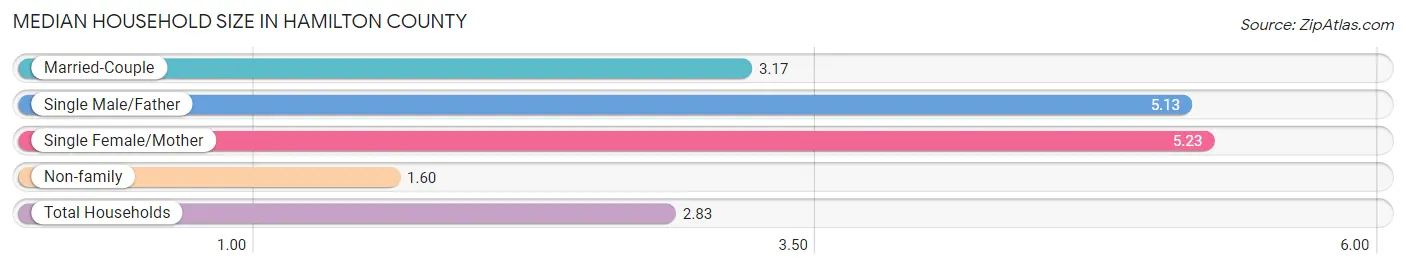
Median Household Size in Hamilton County
The median household size in Hamilton County is 2.83 persons per household, with single female/mother households (95 | 5.5%) accounting for the largest median household size of 5.23 persons per household. non-family households (567 | 32.9%) represent the smallest median household size with 1.60 persons per household.
| Household Type | # Households | Household Size |
| Married-Couple | 1,008 (58.4%) | 3.17 |
| Single Male/Father | 55 (3.2%) | 5.13 |
| Single Female/Mother | 95 (5.5%) | 5.23 |
| Non-family | 567 (32.9%) | 1.60 |
| Total Households | 1,725 (100.0%) | 2.83 |
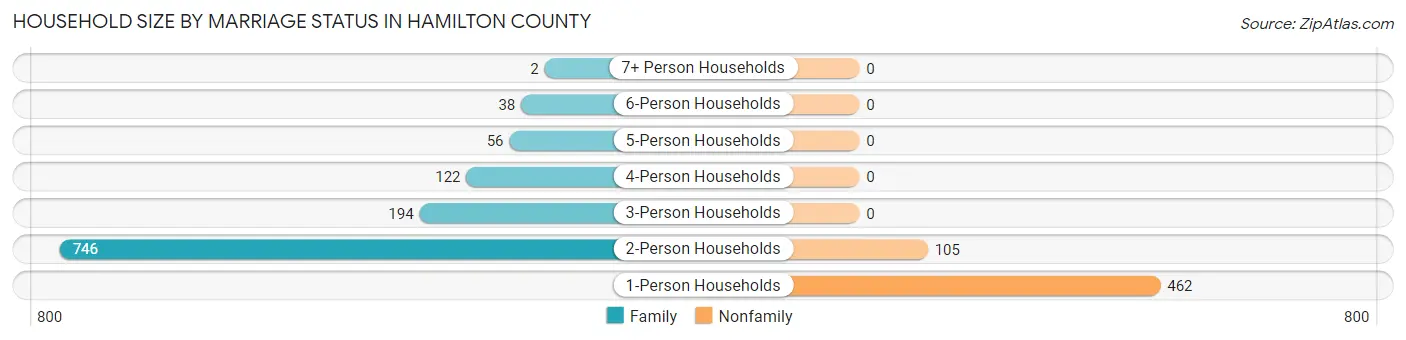
Household Size by Marriage Status in Hamilton County
Out of a total of 1,725 households in Hamilton County, 1,158 (67.1%) are family households, while 567 (32.9%) are nonfamily households. The most numerous type of family households are 2-person households, comprising 746, and the most common type of nonfamily households are 1-person households, comprising 462.
| Household Size | Family Households | Nonfamily Households |
| 1-Person Households | - | 462 (26.8%) |
| 2-Person Households | 746 (43.2%) | 105 (6.1%) |
| 3-Person Households | 194 (11.3%) | 0 (0.0%) |
| 4-Person Households | 122 (7.1%) | 0 (0.0%) |
| 5-Person Households | 56 (3.3%) | 0 (0.0%) |
| 6-Person Households | 38 (2.2%) | 0 (0.0%) |
| 7+ Person Households | 2 (0.1%) | 0 (0.0%) |
| Total | 1,158 (67.1%) | 567 (32.9%) |
Female Fertility in Hamilton County
Fertility by Age in Hamilton County
Average fertility rate in Hamilton County is 76.0 births per 1,000 women. Women in the age bracket of 35 to 50 years have the highest fertility rate with 90.0 births per 1,000 women. Women in the age bracket of 35 to 50 years acount for 57.4% of all women with births.
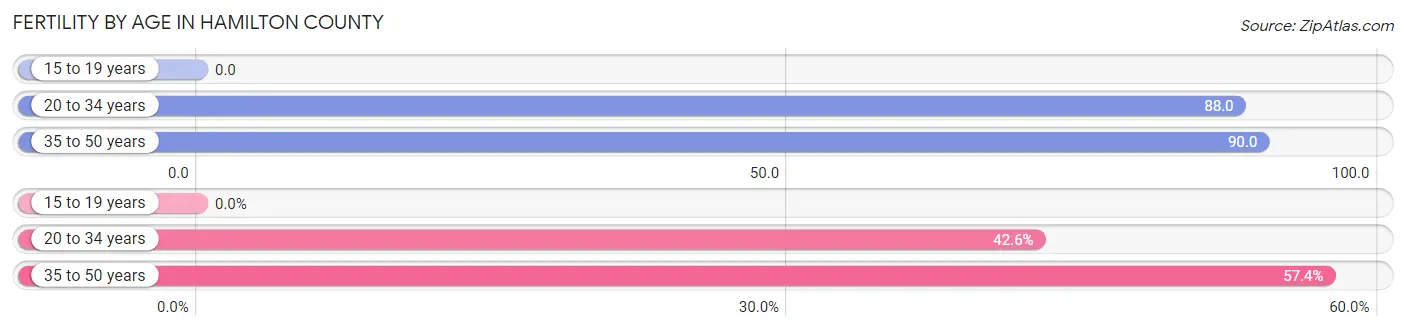
| Age Bracket | Women with Births | Births / 1,000 Women |
| 15 to 19 years | 0 (0.0%) | 0.0 |
| 20 to 34 years | 26 (42.6%) | 88.0 |
| 35 to 50 years | 35 (57.4%) | 90.0 |
| Total | 61 (100.0%) | 76.0 |
Fertility by Age by Marriage Status in Hamilton County
55.7% of women with births (61) in Hamilton County are married. The highest percentage of unmarried women with births falls into 35 to 50 years age bracket with 77.1% of them unmarried at the time of birth, while the lowest percentage of unmarried women with births belong to 20 to 34 years age bracket with 0.0% of them unmarried.
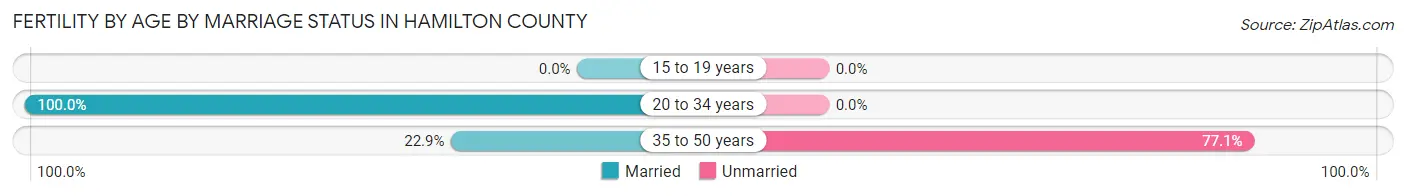
| Age Bracket | Married | Unmarried |
| 15 to 19 years | 0 (0.0%) | 0 (0.0%) |
| 20 to 34 years | 26 (100.0%) | 0 (0.0%) |
| 35 to 50 years | 8 (22.9%) | 27 (77.1%) |
| Total | 34 (55.7%) | 27 (44.3%) |
Fertility by Education in Hamilton County
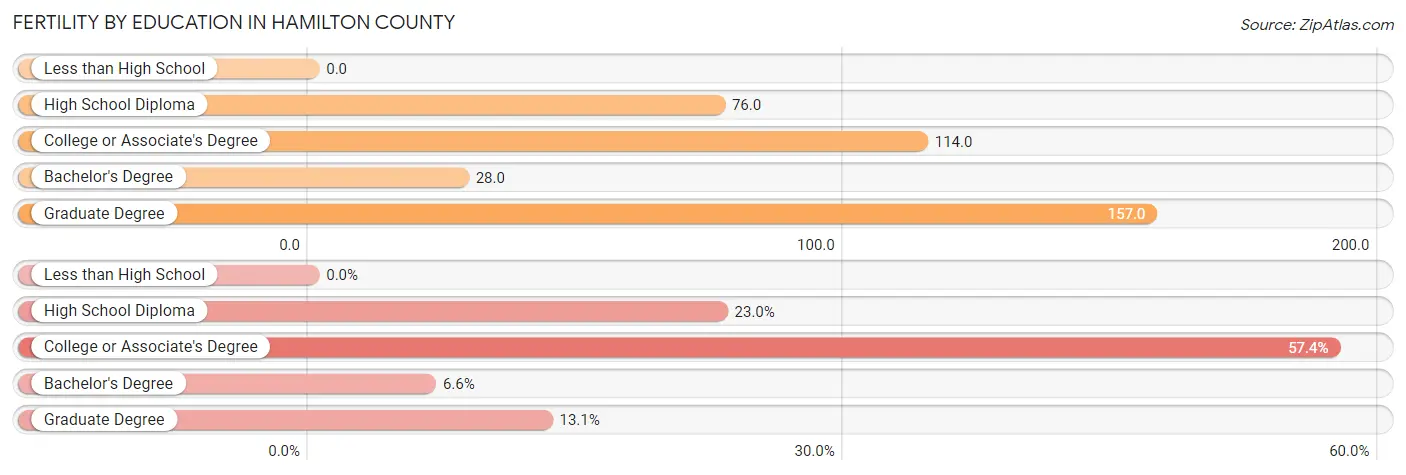
| Educational Attainment | Women with Births | Births / 1,000 Women |
| Less than High School | 0 (0.0%) | 0.0 |
| High School Diploma | 14 (23.0%) | 76.0 |
| College or Associate's Degree | 35 (57.4%) | 114.0 |
| Bachelor's Degree | 4 (6.6%) | 28.0 |
| Graduate Degree | 8 (13.1%) | 157.0 |
| Total | 61 (100.0%) | 76.0 |
Fertility by Education by Marriage Status in Hamilton County
44.3% of women with births in Hamilton County are unmarried. Women with the educational attainment of high school diploma are most likely to be married with 100.0% of them married at childbirth, while women with the educational attainment of college or associate's degree are least likely to be married with 77.1% of them unmarried at childbirth.
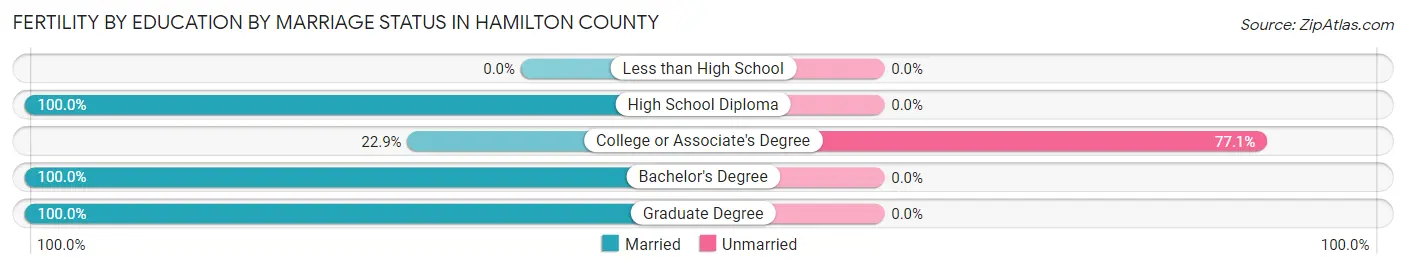
| Educational Attainment | Married | Unmarried |
| Less than High School | 0 (0.0%) | 0 (0.0%) |
| High School Diploma | 14 (100.0%) | 0 (0.0%) |
| College or Associate's Degree | 8 (22.9%) | 27 (77.1%) |
| Bachelor's Degree | 4 (100.0%) | 0 (0.0%) |
| Graduate Degree | 8 (100.0%) | 0 (0.0%) |
| Total | 34 (55.7%) | 27 (44.3%) |
Employment Characteristics in Hamilton County
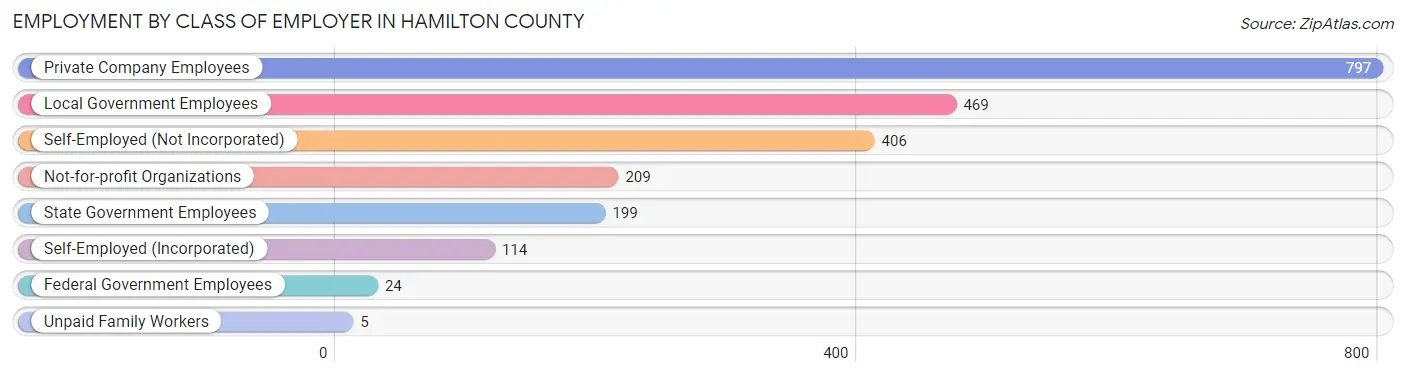
Employment by Class of Employer in Hamilton County
Among the 2,223 employed individuals in Hamilton County, private company employees (797 | 35.8%), local government employees (469 | 21.1%), and self-employed (not incorporated) (406 | 18.3%) make up the most common classes of employment.
| Employer Class | # Employees | % Employees |
| Private Company Employees | 797 | 35.8% |
| Self-Employed (Incorporated) | 114 | 5.1% |
| Self-Employed (Not Incorporated) | 406 | 18.3% |
| Not-for-profit Organizations | 209 | 9.4% |
| Local Government Employees | 469 | 21.1% |
| State Government Employees | 199 | 8.9% |
| Federal Government Employees | 24 | 1.1% |
| Unpaid Family Workers | 5 | 0.2% |
| Total | 2,223 | 100.0% |
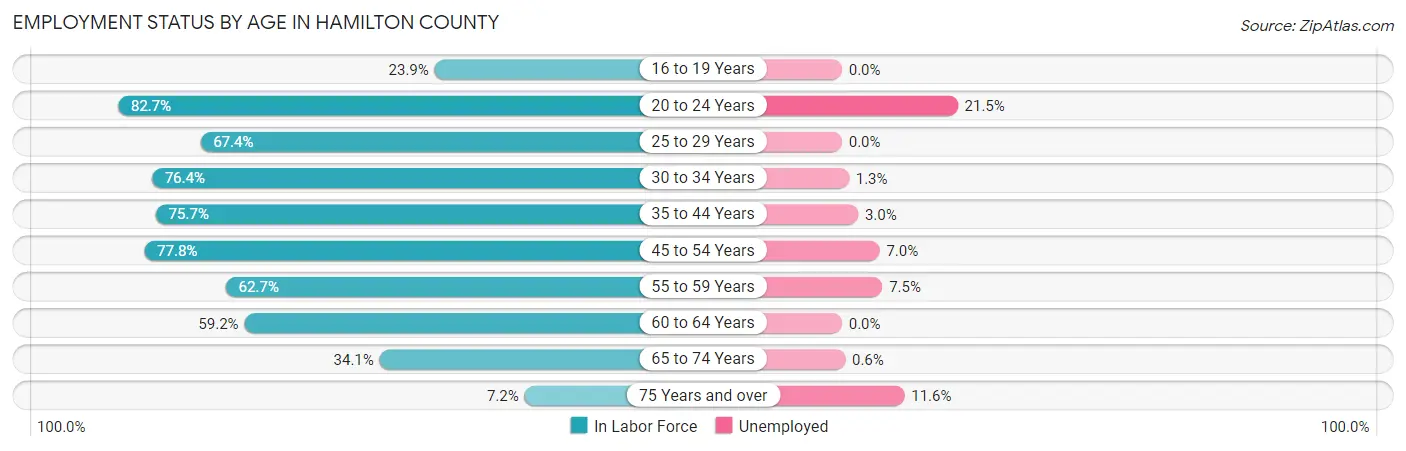
Employment Status by Age in Hamilton County
According to the labor force statistics for Hamilton County, out of the total population over 16 years of age (4,530), 51.8% or 2,347 individuals are in the labor force, with 4.9% or 115 of them unemployed. The age group with the highest labor force participation rate is 20 to 24 years, with 82.7% or 177 individuals in the labor force. Within the labor force, the 20 to 24 years age range has the highest percentage of unemployed individuals, with 21.5% or 38 of them being unemployed.
| Age Bracket | In Labor Force | Unemployed |
| 16 to 19 Years | 50 (23.9%) | 0 (0.0%) |
| 20 to 24 Years | 177 (82.7%) | 38 (21.5%) |
| 25 to 29 Years | 122 (67.4%) | 0 (0.0%) |
| 30 to 34 Years | 155 (76.4%) | 2 (1.3%) |
| 35 to 44 Years | 333 (75.7%) | 10 (3.0%) |
| 45 to 54 Years | 485 (77.8%) | 34 (7.0%) |
| 55 to 59 Years | 318 (62.7%) | 24 (7.5%) |
| 60 to 64 Years | 310 (59.2%) | 0 (0.0%) |
| 65 to 74 Years | 352 (34.1%) | 2 (0.6%) |
| 75 Years and over | 43 (7.2%) | 5 (11.6%) |
| Total | 2,347 (51.8%) | 115 (4.9%) |
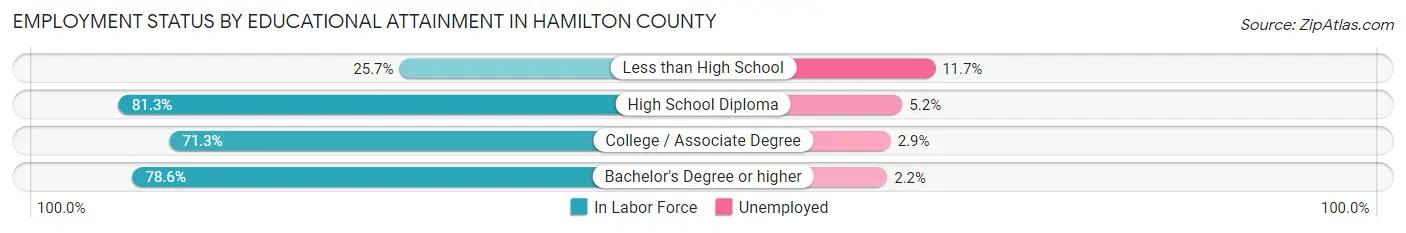
Employment Status by Educational Attainment in Hamilton County
According to labor force statistics for Hamilton County, 69.5% of individuals (1,722) out of the total population between 25 and 64 years of age (2,478) are in the labor force, with 4.1% or 71 of them being unemployed. The group with the highest labor force participation rate are those with the educational attainment of high school diploma, with 81.3% or 657 individuals in the labor force. Within the labor force, individuals with less than high school education have the highest percentage of unemployment, with 11.7% or 11 of them being unemployed.
| Educational Attainment | In Labor Force | Unemployed |
| Less than High School | 94 (25.7%) | 43 (11.7%) |
| High School Diploma | 657 (81.3%) | 42 (5.2%) |
| College / Associate Degree | 514 (71.3%) | 21 (2.9%) |
| Bachelor's Degree or higher | 458 (78.6%) | 13 (2.2%) |
| Total | 1,722 (69.5%) | 102 (4.1%) |
Employment Occupations by Sex in Hamilton County
Management, Business, Science and Arts Occupations
The most common Management, Business, Science and Arts occupations in Hamilton County are Management (432 | 19.4%), Community & Social Service (260 | 11.7%), Education Instruction & Library (161 | 7.2%), Health Diagnosing & Treating (58 | 2.6%), and Computers, Engineering & Science (44 | 2.0%).
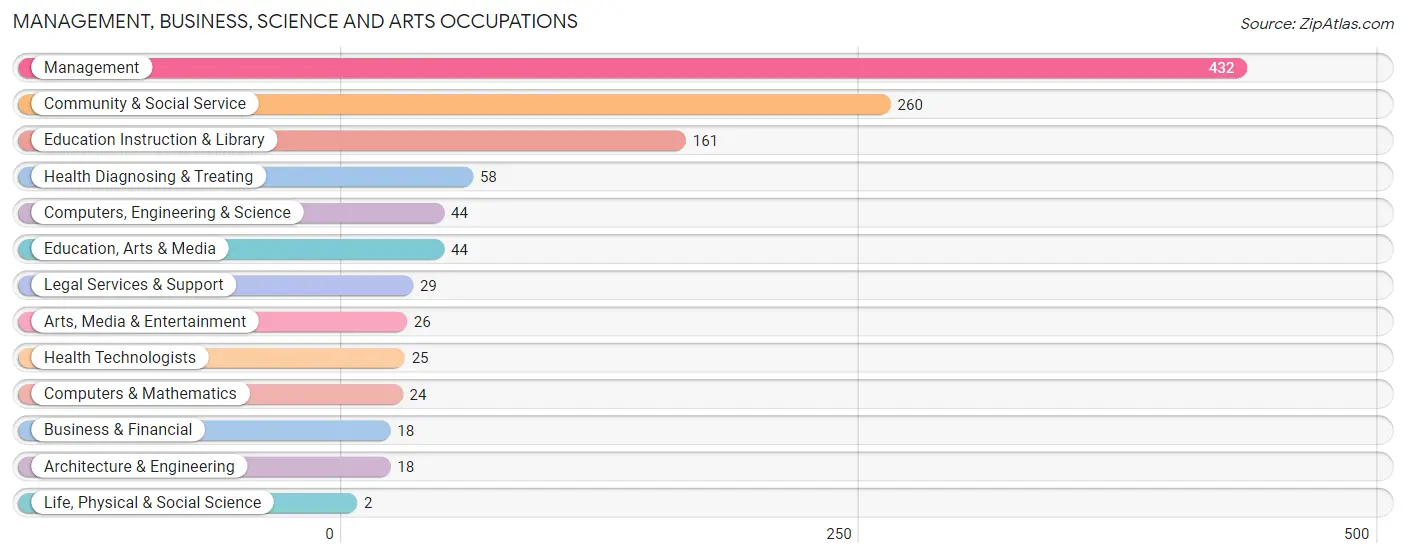
Management, Business, Science and Arts Occupations by Sex
Within the Management, Business, Science and Arts occupations in Hamilton County, the most male-oriented occupations are Architecture & Engineering (94.4%), Computers, Engineering & Science (77.3%), and Legal Services & Support (72.4%), while the most female-oriented occupations are Life, Physical & Social Science (100.0%), Health Technologists (92.0%), and Education Instruction & Library (85.7%).
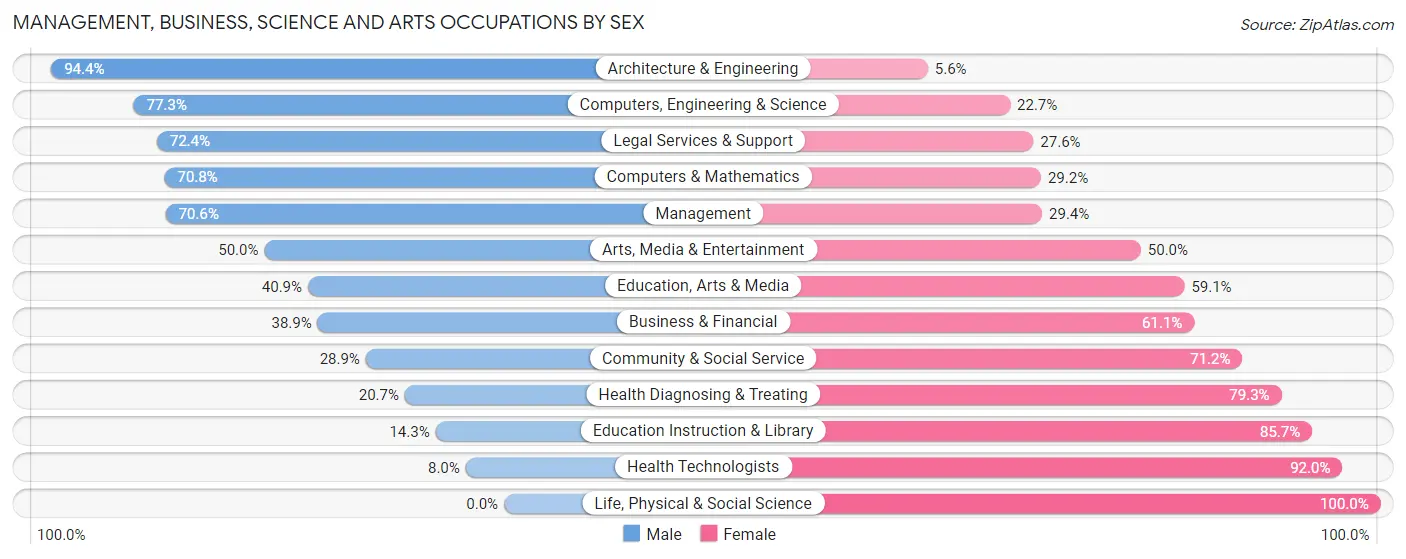
| Occupation | Male | Female |
| Management | 305 (70.6%) | 127 (29.4%) |
| Business & Financial | 7 (38.9%) | 11 (61.1%) |
| Computers, Engineering & Science | 34 (77.3%) | 10 (22.7%) |
| Computers & Mathematics | 17 (70.8%) | 7 (29.2%) |
| Architecture & Engineering | 17 (94.4%) | 1 (5.6%) |
| Life, Physical & Social Science | 0 (0.0%) | 2 (100.0%) |
| Community & Social Service | 75 (28.8%) | 185 (71.2%) |
| Education, Arts & Media | 18 (40.9%) | 26 (59.1%) |
| Legal Services & Support | 21 (72.4%) | 8 (27.6%) |
| Education Instruction & Library | 23 (14.3%) | 138 (85.7%) |
| Arts, Media & Entertainment | 13 (50.0%) | 13 (50.0%) |
| Health Diagnosing & Treating | 12 (20.7%) | 46 (79.3%) |
| Health Technologists | 2 (8.0%) | 23 (92.0%) |
| Total (Category) | 433 (53.3%) | 379 (46.7%) |
| Total (Overall) | 1,249 (56.1%) | 978 (43.9%) |
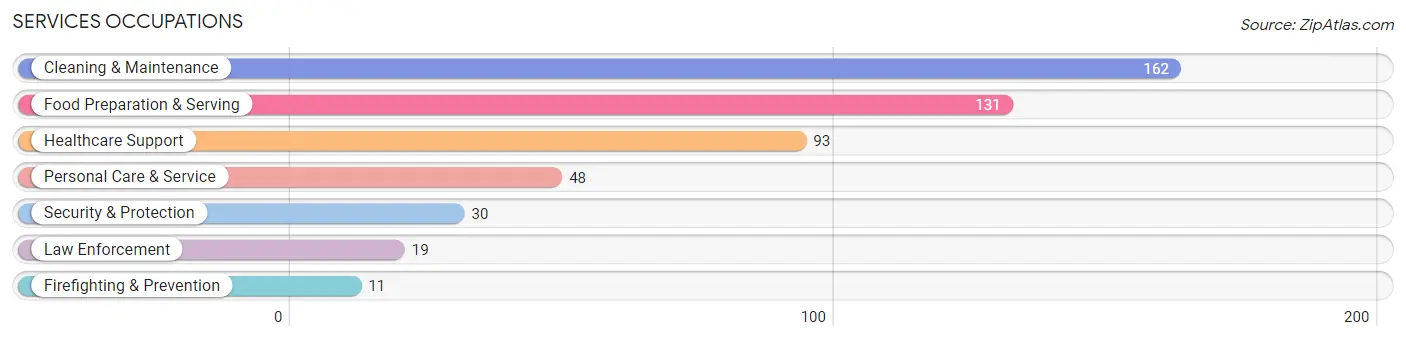
Services Occupations
The most common Services occupations in Hamilton County are Cleaning & Maintenance (162 | 7.3%), Food Preparation & Serving (131 | 5.9%), Healthcare Support (93 | 4.2%), Personal Care & Service (48 | 2.2%), and Security & Protection (30 | 1.3%).
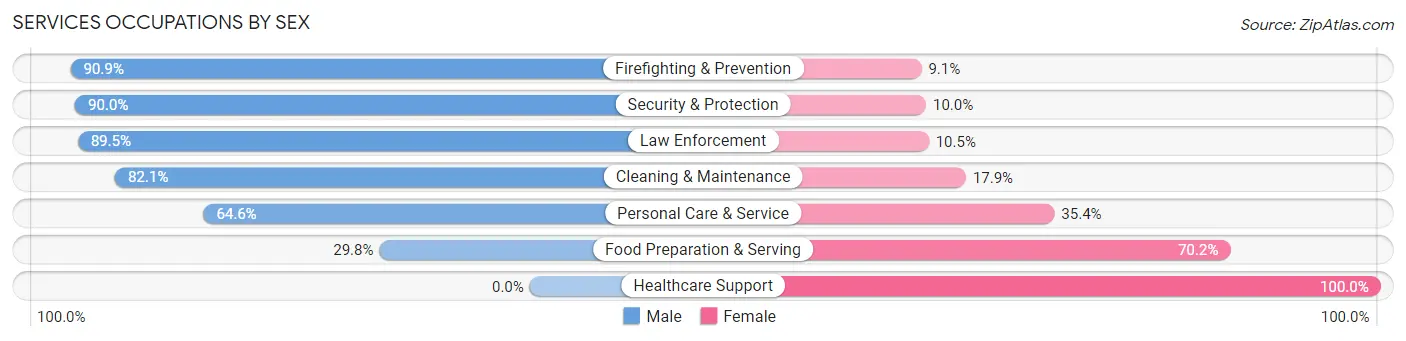
Services Occupations by Sex
Within the Services occupations in Hamilton County, the most male-oriented occupations are Firefighting & Prevention (90.9%), Security & Protection (90.0%), and Law Enforcement (89.5%), while the most female-oriented occupations are Healthcare Support (100.0%), Food Preparation & Serving (70.2%), and Personal Care & Service (35.4%).
| Occupation | Male | Female |
| Healthcare Support | 0 (0.0%) | 93 (100.0%) |
| Security & Protection | 27 (90.0%) | 3 (10.0%) |
| Firefighting & Prevention | 10 (90.9%) | 1 (9.1%) |
| Law Enforcement | 17 (89.5%) | 2 (10.5%) |
| Food Preparation & Serving | 39 (29.8%) | 92 (70.2%) |
| Cleaning & Maintenance | 133 (82.1%) | 29 (17.9%) |
| Personal Care & Service | 31 (64.6%) | 17 (35.4%) |
| Total (Category) | 230 (49.6%) | 234 (50.4%) |
| Total (Overall) | 1,249 (56.1%) | 978 (43.9%) |
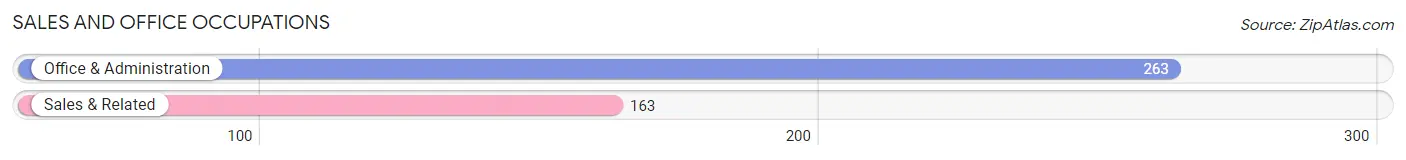
Sales and Office Occupations
The most common Sales and Office occupations in Hamilton County are Office & Administration (263 | 11.8%), and Sales & Related (163 | 7.3%).
Sales and Office Occupations by Sex
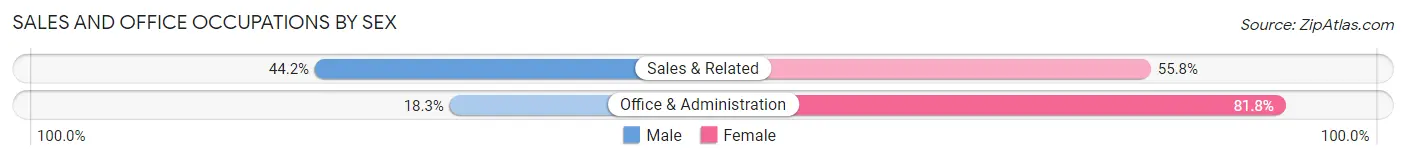
| Occupation | Male | Female |
| Sales & Related | 72 (44.2%) | 91 (55.8%) |
| Office & Administration | 48 (18.2%) | 215 (81.8%) |
| Total (Category) | 120 (28.2%) | 306 (71.8%) |
| Total (Overall) | 1,249 (56.1%) | 978 (43.9%) |
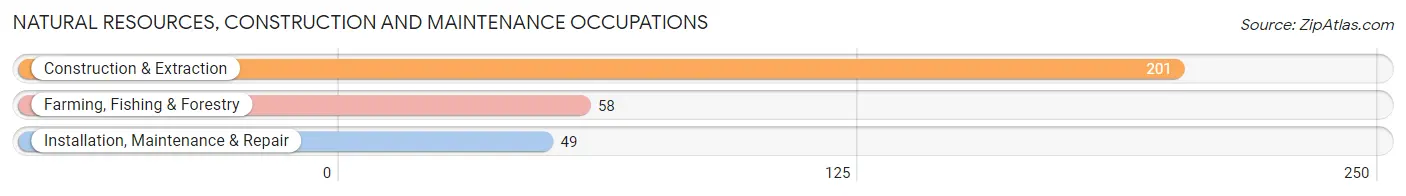
Natural Resources, Construction and Maintenance Occupations
The most common Natural Resources, Construction and Maintenance occupations in Hamilton County are Construction & Extraction (201 | 9.0%), Farming, Fishing & Forestry (58 | 2.6%), and Installation, Maintenance & Repair (49 | 2.2%).
Natural Resources, Construction and Maintenance Occupations by Sex
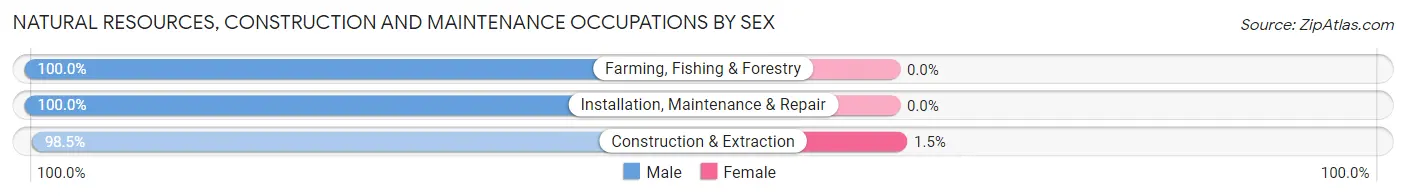
| Occupation | Male | Female |
| Farming, Fishing & Forestry | 58 (100.0%) | 0 (0.0%) |
| Construction & Extraction | 198 (98.5%) | 3 (1.5%) |
| Installation, Maintenance & Repair | 49 (100.0%) | 0 (0.0%) |
| Total (Category) | 305 (99.0%) | 3 (1.0%) |
| Total (Overall) | 1,249 (56.1%) | 978 (43.9%) |
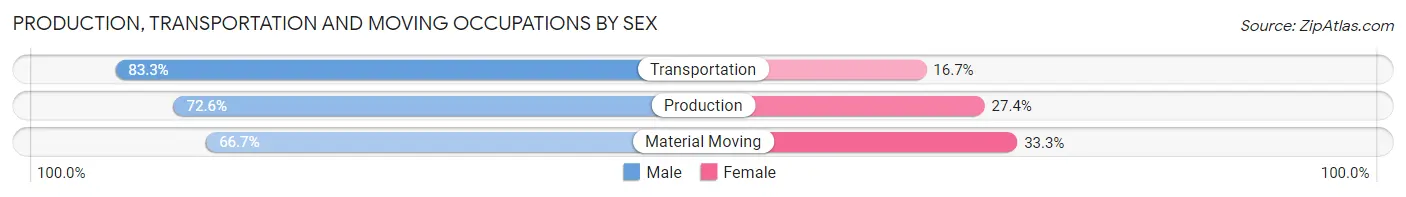
Production, Transportation and Moving Occupations
The most common Production, Transportation and Moving occupations in Hamilton County are Production (106 | 4.8%), Transportation (60 | 2.7%), and Material Moving (51 | 2.3%).
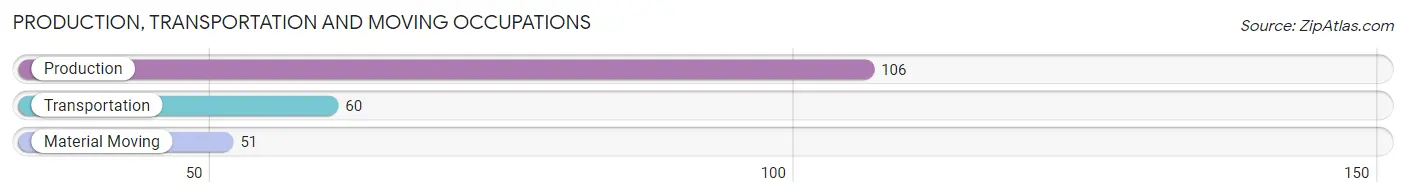
Production, Transportation and Moving Occupations by Sex
| Occupation | Male | Female |
| Production | 77 (72.6%) | 29 (27.4%) |
| Transportation | 50 (83.3%) | 10 (16.7%) |
| Material Moving | 34 (66.7%) | 17 (33.3%) |
| Total (Category) | 161 (74.2%) | 56 (25.8%) |
| Total (Overall) | 1,249 (56.1%) | 978 (43.9%) |
Employment Industries by Sex in Hamilton County
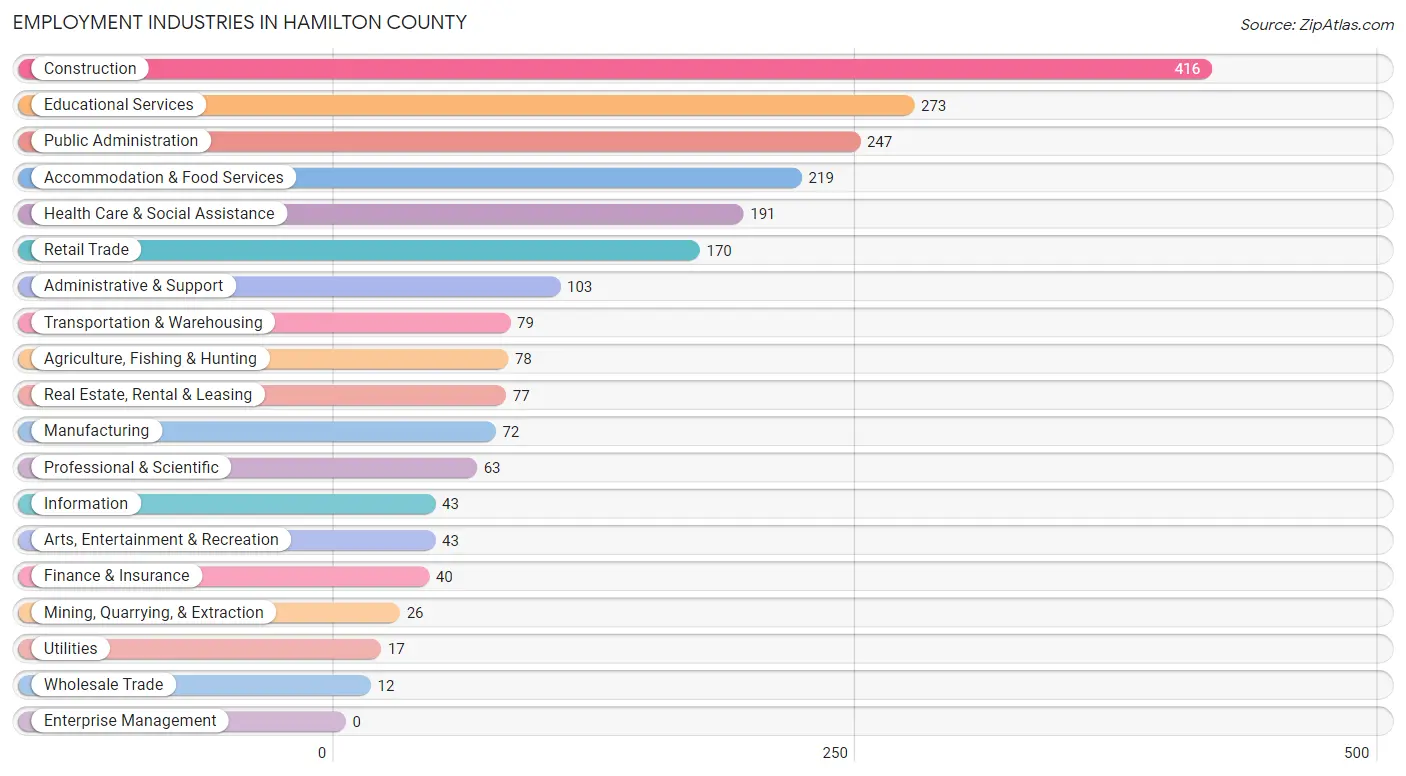
Employment Industries in Hamilton County
The major employment industries in Hamilton County include Construction (416 | 18.7%), Educational Services (273 | 12.3%), Public Administration (247 | 11.1%), Accommodation & Food Services (219 | 9.8%), and Health Care & Social Assistance (191 | 8.6%).
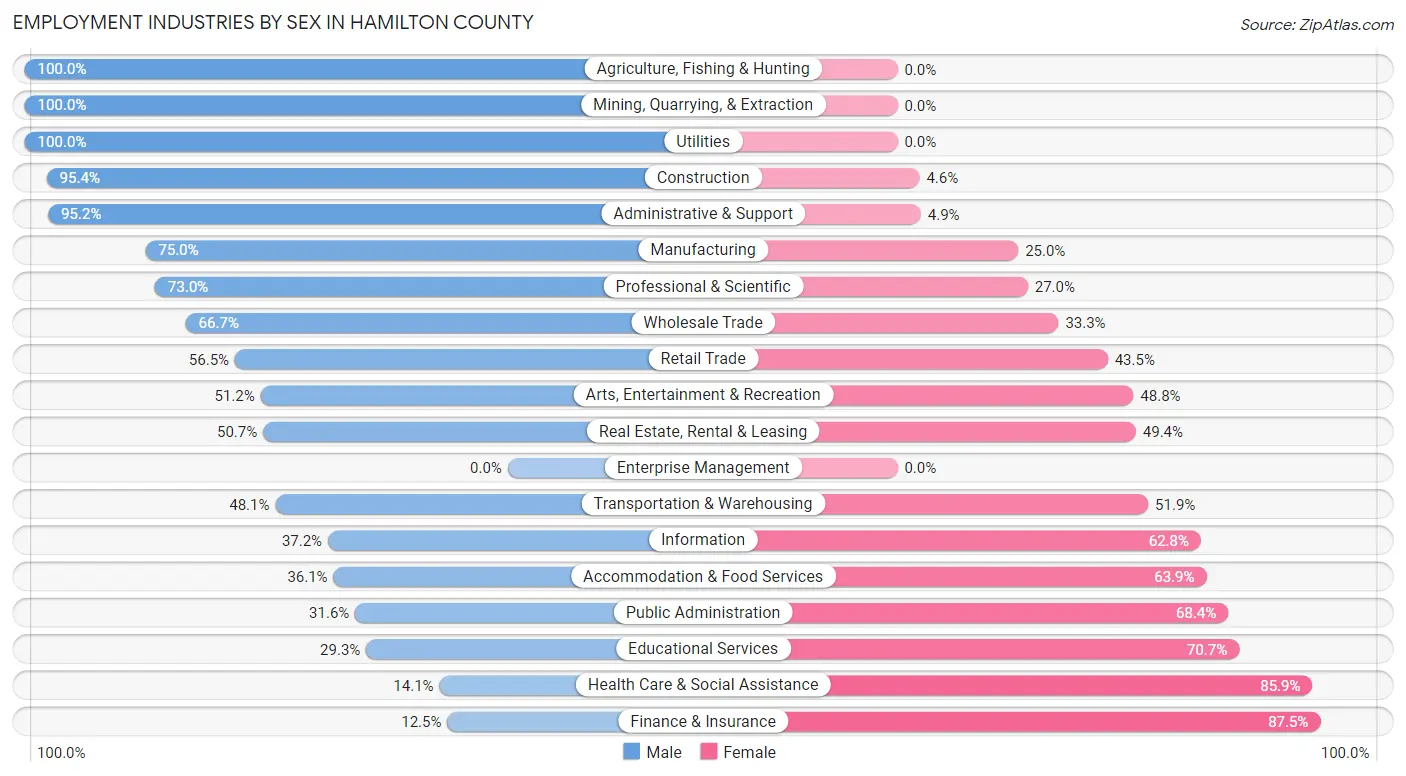
Employment Industries by Sex in Hamilton County
The Hamilton County industries that see more men than women are Agriculture, Fishing & Hunting (100.0%), Mining, Quarrying, & Extraction (100.0%), and Utilities (100.0%), whereas the industries that tend to have a higher number of women are Finance & Insurance (87.5%), Health Care & Social Assistance (85.9%), and Educational Services (70.7%).
| Industry | Male | Female |
| Agriculture, Fishing & Hunting | 78 (100.0%) | 0 (0.0%) |
| Mining, Quarrying, & Extraction | 26 (100.0%) | 0 (0.0%) |
| Construction | 397 (95.4%) | 19 (4.6%) |
| Manufacturing | 54 (75.0%) | 18 (25.0%) |
| Wholesale Trade | 8 (66.7%) | 4 (33.3%) |
| Retail Trade | 96 (56.5%) | 74 (43.5%) |
| Transportation & Warehousing | 38 (48.1%) | 41 (51.9%) |
| Utilities | 17 (100.0%) | 0 (0.0%) |
| Information | 16 (37.2%) | 27 (62.8%) |
| Finance & Insurance | 5 (12.5%) | 35 (87.5%) |
| Real Estate, Rental & Leasing | 39 (50.6%) | 38 (49.3%) |
| Professional & Scientific | 46 (73.0%) | 17 (27.0%) |
| Enterprise Management | 0 (0.0%) | 0 (0.0%) |
| Administrative & Support | 98 (95.2%) | 5 (4.9%) |
| Educational Services | 80 (29.3%) | 193 (70.7%) |
| Health Care & Social Assistance | 27 (14.1%) | 164 (85.9%) |
| Arts, Entertainment & Recreation | 22 (51.2%) | 21 (48.8%) |
| Accommodation & Food Services | 79 (36.1%) | 140 (63.9%) |
| Public Administration | 78 (31.6%) | 169 (68.4%) |
| Total | 1,249 (56.1%) | 978 (43.9%) |
Education in Hamilton County
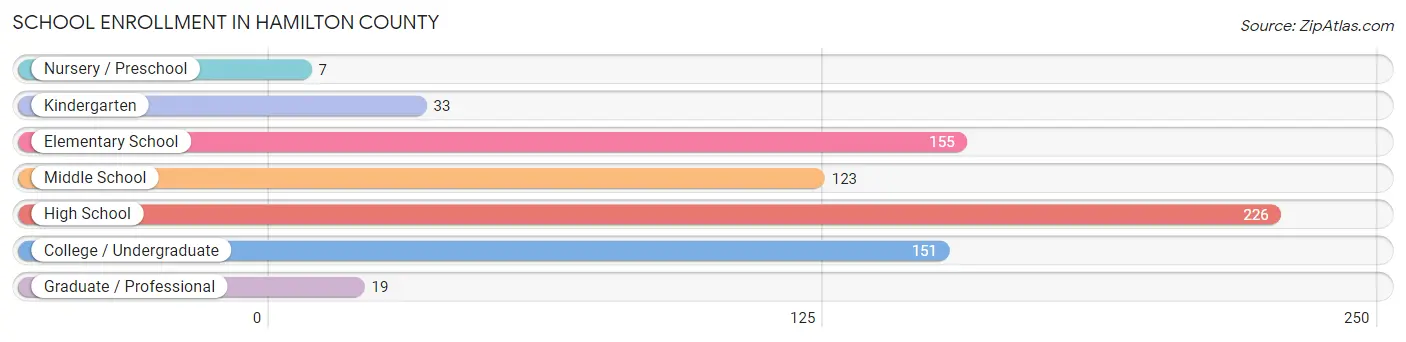
School Enrollment in Hamilton County
The most common levels of schooling among the 714 students in Hamilton County are high school (226 | 31.7%), elementary school (155 | 21.7%), and college / undergraduate (151 | 21.1%).
| School Level | # Students | % Students |
| Nursery / Preschool | 7 | 1.0% |
| Kindergarten | 33 | 4.6% |
| Elementary School | 155 | 21.7% |
| Middle School | 123 | 17.2% |
| High School | 226 | 31.7% |
| College / Undergraduate | 151 | 21.1% |
| Graduate / Professional | 19 | 2.7% |
| Total | 714 | 100.0% |
School Enrollment by Age by Funding Source in Hamilton County
Out of a total of 714 students who are enrolled in schools in Hamilton County, 112 (15.7%) attend a private institution, while the remaining 602 (84.3%) are enrolled in public schools. The age group of 35 years and over has the highest likelihood of being enrolled in private schools, with 8 (38.1% in the age bracket) enrolled. Conversely, the age group of 10 to 14 year olds has the lowest likelihood of being enrolled in a private school, with 178 (91.3% in the age bracket) attending a public institution.
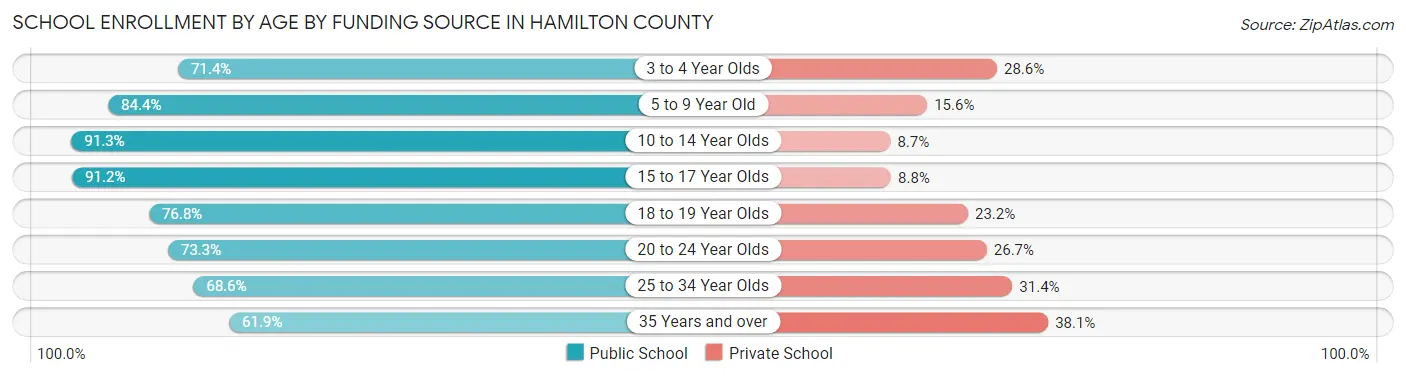
| Age Bracket | Public School | Private School |
| 3 to 4 Year Olds | 5 (71.4%) | 2 (28.6%) |
| 5 to 9 Year Old | 141 (84.4%) | 26 (15.6%) |
| 10 to 14 Year Olds | 178 (91.3%) | 17 (8.7%) |
| 15 to 17 Year Olds | 134 (91.2%) | 13 (8.8%) |
| 18 to 19 Year Olds | 63 (76.8%) | 19 (23.2%) |
| 20 to 24 Year Olds | 44 (73.3%) | 16 (26.7%) |
| 25 to 34 Year Olds | 24 (68.6%) | 11 (31.4%) |
| 35 Years and over | 13 (61.9%) | 8 (38.1%) |
| Total | 602 (84.3%) | 112 (15.7%) |
Educational Attainment by Field of Study in Hamilton County
Education (253 | 24.4%), science & technology (159 | 15.3%), business (115 | 11.1%), arts & humanities (93 | 9.0%), and literature & languages (73 | 7.0%) are the most common fields of study among 1,036 individuals in Hamilton County who have obtained a bachelor's degree or higher.
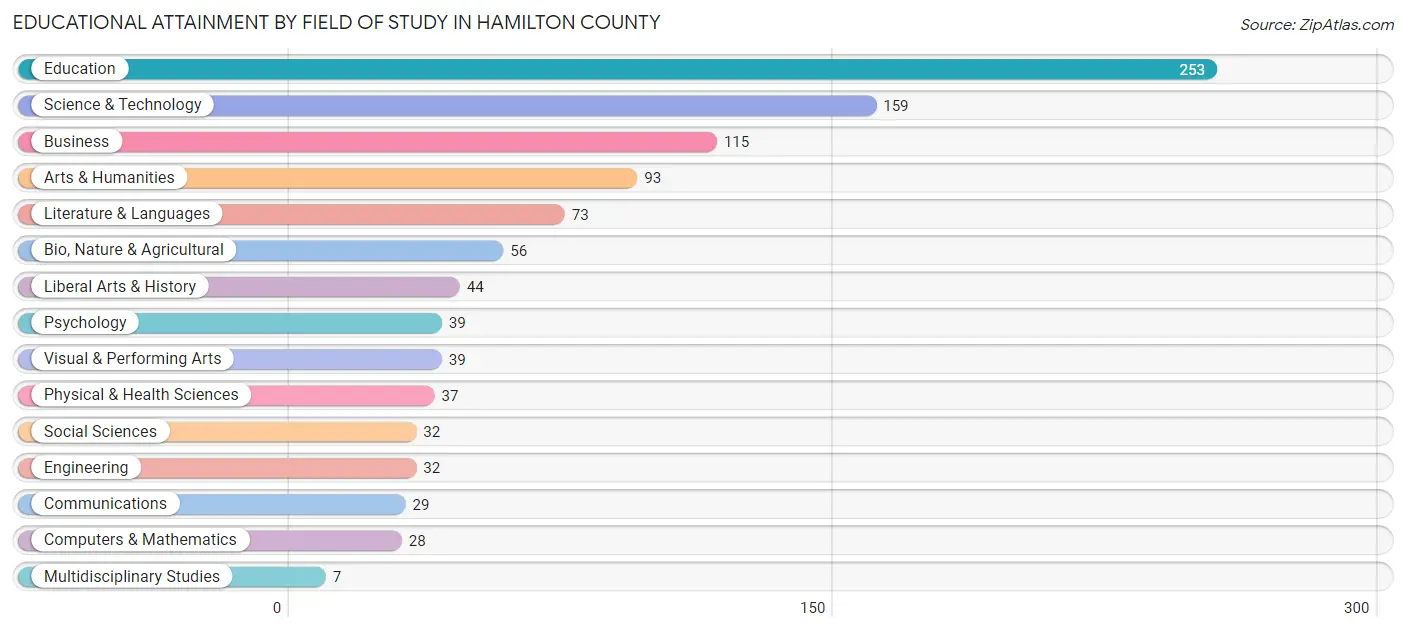
| Field of Study | # Graduates | % Graduates |
| Computers & Mathematics | 28 | 2.7% |
| Bio, Nature & Agricultural | 56 | 5.4% |
| Physical & Health Sciences | 37 | 3.6% |
| Psychology | 39 | 3.8% |
| Social Sciences | 32 | 3.1% |
| Engineering | 32 | 3.1% |
| Multidisciplinary Studies | 7 | 0.7% |
| Science & Technology | 159 | 15.3% |
| Business | 115 | 11.1% |
| Education | 253 | 24.4% |
| Literature & Languages | 73 | 7.0% |
| Liberal Arts & History | 44 | 4.3% |
| Visual & Performing Arts | 39 | 3.8% |
| Communications | 29 | 2.8% |
| Arts & Humanities | 93 | 9.0% |
| Total | 1,036 | 100.0% |
Transportation & Commute in Hamilton County
Vehicle Availability by Sex in Hamilton County
The most prevalent vehicle ownership categories in Hamilton County are males with 2 vehicles (647, accounting for 52.2%) and females with 2 vehicles (553, making up 67.0%).
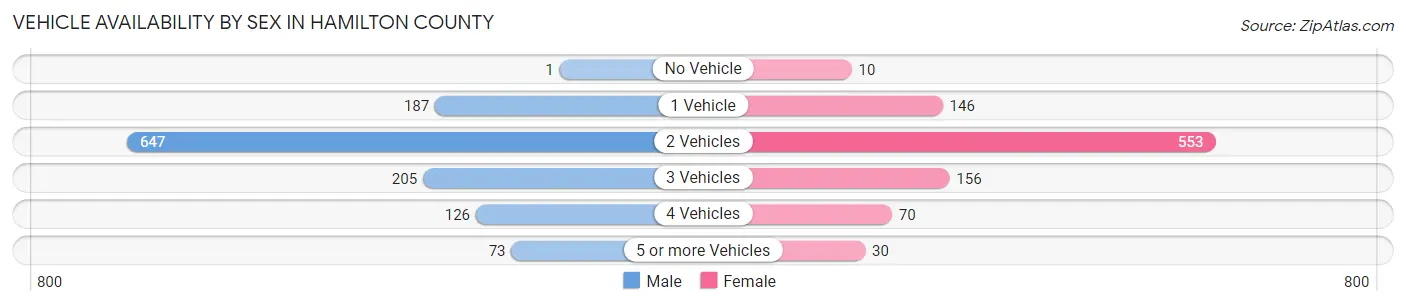
| Vehicles Available | Male | Female |
| No Vehicle | 1 (0.1%) | 10 (1.0%) |
| 1 Vehicle | 187 (15.1%) | 146 (15.1%) |
| 2 Vehicles | 647 (52.2%) | 553 (57.3%) |
| 3 Vehicles | 205 (16.6%) | 156 (16.2%) |
| 4 Vehicles | 126 (10.2%) | 70 (7.2%) |
| 5 or more Vehicles | 73 (5.9%) | 30 (3.1%) |
| Total | 1,239 (100.0%) | 965 (100.0%) |
Commute Time in Hamilton County
The most frequently occuring commute durations in Hamilton County are 5 to 9 minutes (431 commuters, 23.0%), less than 5 minutes (259 commuters, 13.8%), and 45 to 59 minutes (218 commuters, 11.7%).
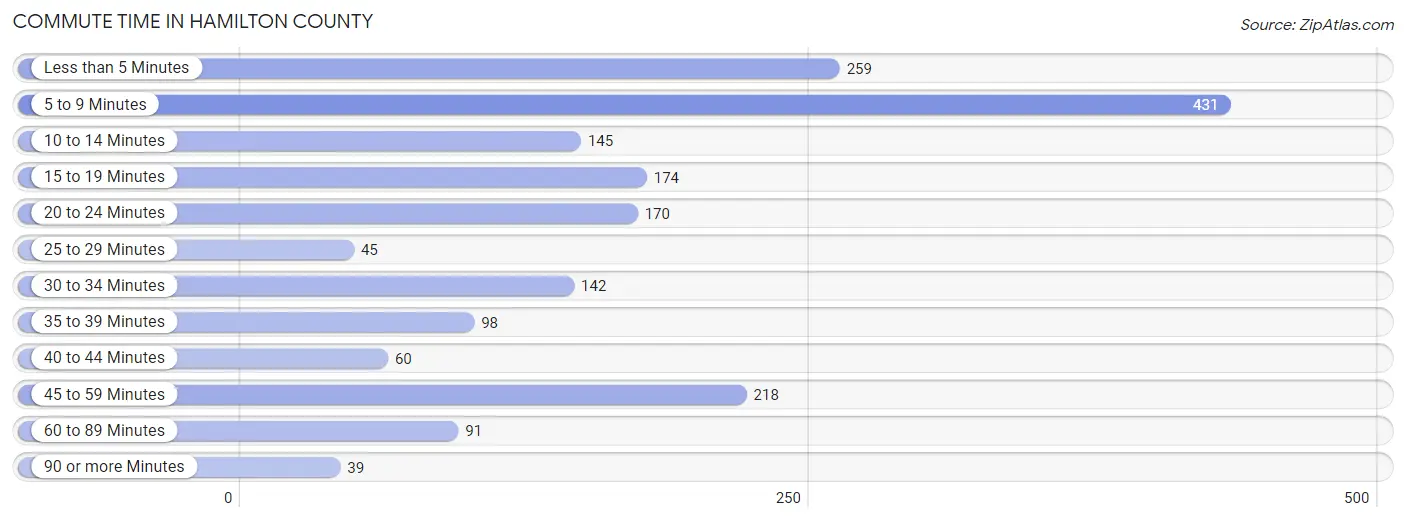
| Commute Time | # Commuters | % Commuters |
| Less than 5 Minutes | 259 | 13.8% |
| 5 to 9 Minutes | 431 | 23.0% |
| 10 to 14 Minutes | 145 | 7.7% |
| 15 to 19 Minutes | 174 | 9.3% |
| 20 to 24 Minutes | 170 | 9.1% |
| 25 to 29 Minutes | 45 | 2.4% |
| 30 to 34 Minutes | 142 | 7.6% |
| 35 to 39 Minutes | 98 | 5.2% |
| 40 to 44 Minutes | 60 | 3.2% |
| 45 to 59 Minutes | 218 | 11.7% |
| 60 to 89 Minutes | 91 | 4.9% |
| 90 or more Minutes | 39 | 2.1% |
Commute Time by Sex in Hamilton County
The most common commute times in Hamilton County are 5 to 9 minutes (191 commuters, 19.2%) for males and 5 to 9 minutes (240 commuters, 27.4%) for females.
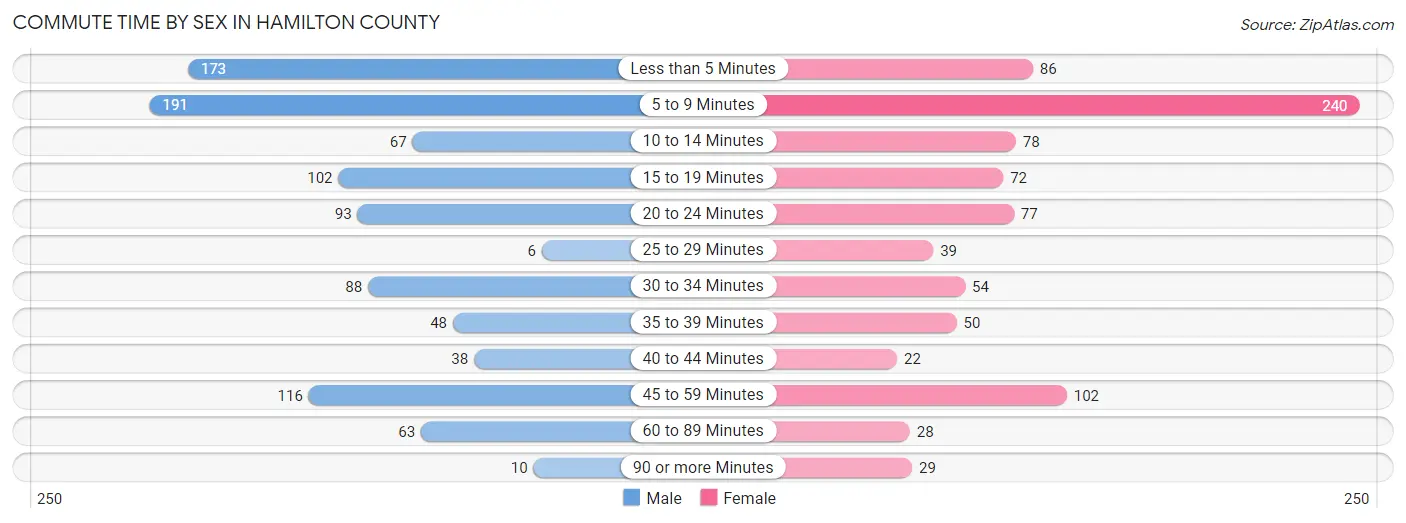
| Commute Time | Male | Female |
| Less than 5 Minutes | 173 (17.4%) | 86 (9.8%) |
| 5 to 9 Minutes | 191 (19.2%) | 240 (27.4%) |
| 10 to 14 Minutes | 67 (6.7%) | 78 (8.9%) |
| 15 to 19 Minutes | 102 (10.2%) | 72 (8.2%) |
| 20 to 24 Minutes | 93 (9.3%) | 77 (8.8%) |
| 25 to 29 Minutes | 6 (0.6%) | 39 (4.4%) |
| 30 to 34 Minutes | 88 (8.8%) | 54 (6.2%) |
| 35 to 39 Minutes | 48 (4.8%) | 50 (5.7%) |
| 40 to 44 Minutes | 38 (3.8%) | 22 (2.5%) |
| 45 to 59 Minutes | 116 (11.7%) | 102 (11.6%) |
| 60 to 89 Minutes | 63 (6.3%) | 28 (3.2%) |
| 90 or more Minutes | 10 (1.0%) | 29 (3.3%) |
Time of Departure to Work by Sex in Hamilton County
The most frequent times of departure to work in Hamilton County are 7:00 AM to 7:29 AM (209, 21.0%) for males and 7:00 AM to 7:29 AM (147, 16.8%) for females.
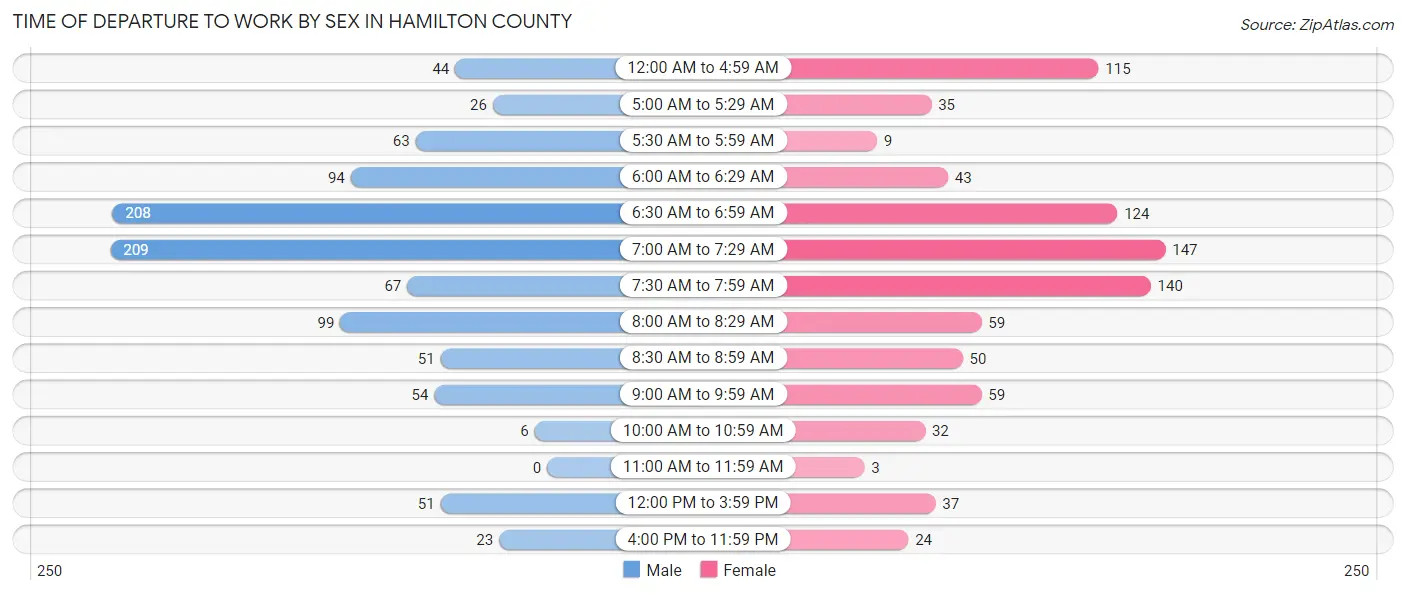
| Time of Departure | Male | Female |
| 12:00 AM to 4:59 AM | 44 (4.4%) | 115 (13.1%) |
| 5:00 AM to 5:29 AM | 26 (2.6%) | 35 (4.0%) |
| 5:30 AM to 5:59 AM | 63 (6.3%) | 9 (1.0%) |
| 6:00 AM to 6:29 AM | 94 (9.5%) | 43 (4.9%) |
| 6:30 AM to 6:59 AM | 208 (20.9%) | 124 (14.1%) |
| 7:00 AM to 7:29 AM | 209 (21.0%) | 147 (16.8%) |
| 7:30 AM to 7:59 AM | 67 (6.7%) | 140 (16.0%) |
| 8:00 AM to 8:29 AM | 99 (10.0%) | 59 (6.7%) |
| 8:30 AM to 8:59 AM | 51 (5.1%) | 50 (5.7%) |
| 9:00 AM to 9:59 AM | 54 (5.4%) | 59 (6.7%) |
| 10:00 AM to 10:59 AM | 6 (0.6%) | 32 (3.6%) |
| 11:00 AM to 11:59 AM | 0 (0.0%) | 3 (0.3%) |
| 12:00 PM to 3:59 PM | 51 (5.1%) | 37 (4.2%) |
| 4:00 PM to 11:59 PM | 23 (2.3%) | 24 (2.7%) |
| Total | 995 (100.0%) | 877 (100.0%) |
Housing Occupancy in Hamilton County
Occupancy by Ownership in Hamilton County
Of the total 1,725 dwellings in Hamilton County, owner-occupied units account for 1,465 (84.9%), while renter-occupied units make up 260 (15.1%).
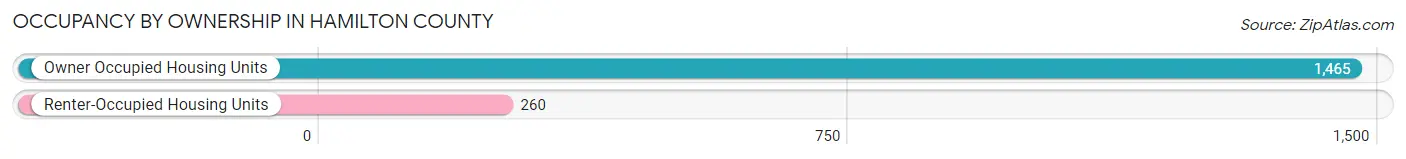
| Occupancy | # Housing Units | % Housing Units |
| Owner Occupied Housing Units | 1,465 | 84.9% |
| Renter-Occupied Housing Units | 260 | 15.1% |
| Total Occupied Housing Units | 1,725 | 100.0% |
Occupancy by Household Size in Hamilton County
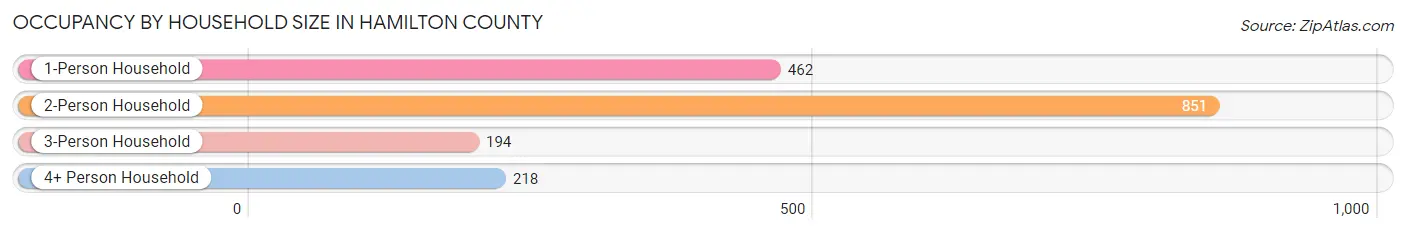
| Household Size | # Housing Units | % Housing Units |
| 1-Person Household | 462 | 26.8% |
| 2-Person Household | 851 | 49.3% |
| 3-Person Household | 194 | 11.3% |
| 4+ Person Household | 218 | 12.6% |
| Total Housing Units | 1,725 | 100.0% |
Occupancy by Ownership by Household Size in Hamilton County
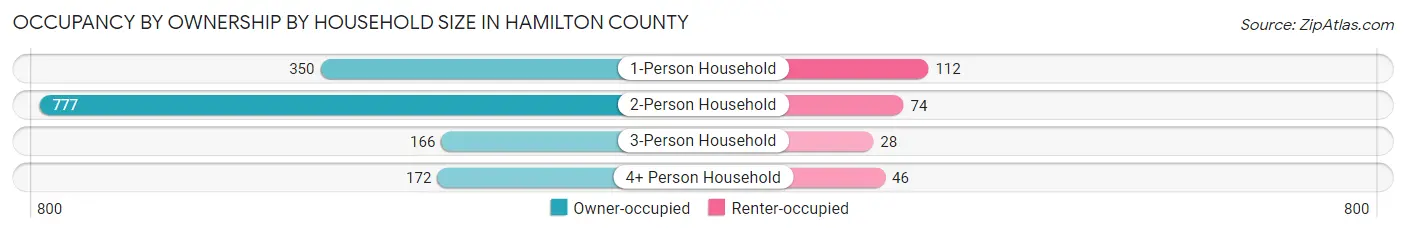
| Household Size | Owner-occupied | Renter-occupied |
| 1-Person Household | 350 (75.8%) | 112 (24.2%) |
| 2-Person Household | 777 (91.3%) | 74 (8.7%) |
| 3-Person Household | 166 (85.6%) | 28 (14.4%) |
| 4+ Person Household | 172 (78.9%) | 46 (21.1%) |
| Total Housing Units | 1,465 (84.9%) | 260 (15.1%) |
Occupancy by Educational Attainment in Hamilton County
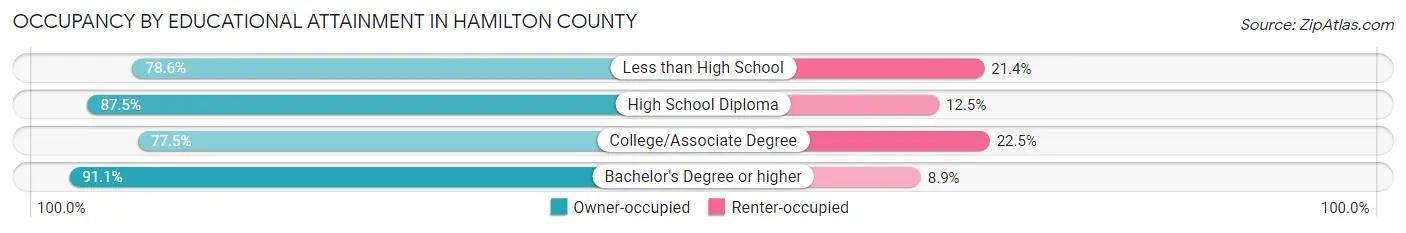
| Household Size | Owner-occupied | Renter-occupied |
| Less than High School | 77 (78.6%) | 21 (21.4%) |
| High School Diploma | 505 (87.5%) | 72 (12.5%) |
| College/Associate Degree | 420 (77.5%) | 122 (22.5%) |
| Bachelor's Degree or higher | 463 (91.1%) | 45 (8.9%) |
Occupancy by Age of Householder in Hamilton County
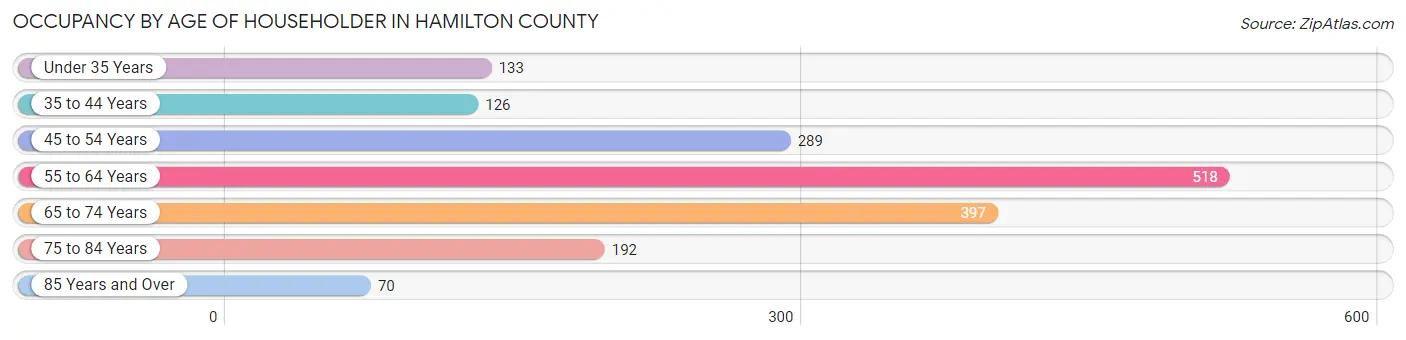
| Age Bracket | # Households | % Households |
| Under 35 Years | 133 | 7.7% |
| 35 to 44 Years | 126 | 7.3% |
| 45 to 54 Years | 289 | 16.8% |
| 55 to 64 Years | 518 | 30.0% |
| 65 to 74 Years | 397 | 23.0% |
| 75 to 84 Years | 192 | 11.1% |
| 85 Years and Over | 70 | 4.1% |
| Total | 1,725 | 100.0% |
Housing Finances in Hamilton County
Median Income by Occupancy in Hamilton County
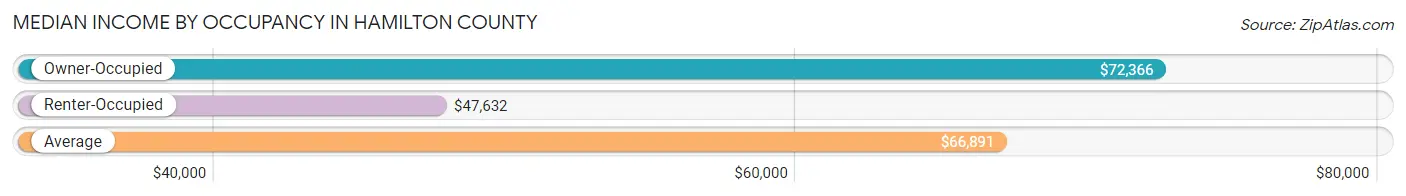
| Occupancy Type | # Households | Median Income |
| Owner-Occupied | 1,465 (84.9%) | $72,366 |
| Renter-Occupied | 260 (15.1%) | $47,632 |
| Average | 1,725 (100.0%) | $66,891 |
Occupancy by Householder Income Bracket in Hamilton County
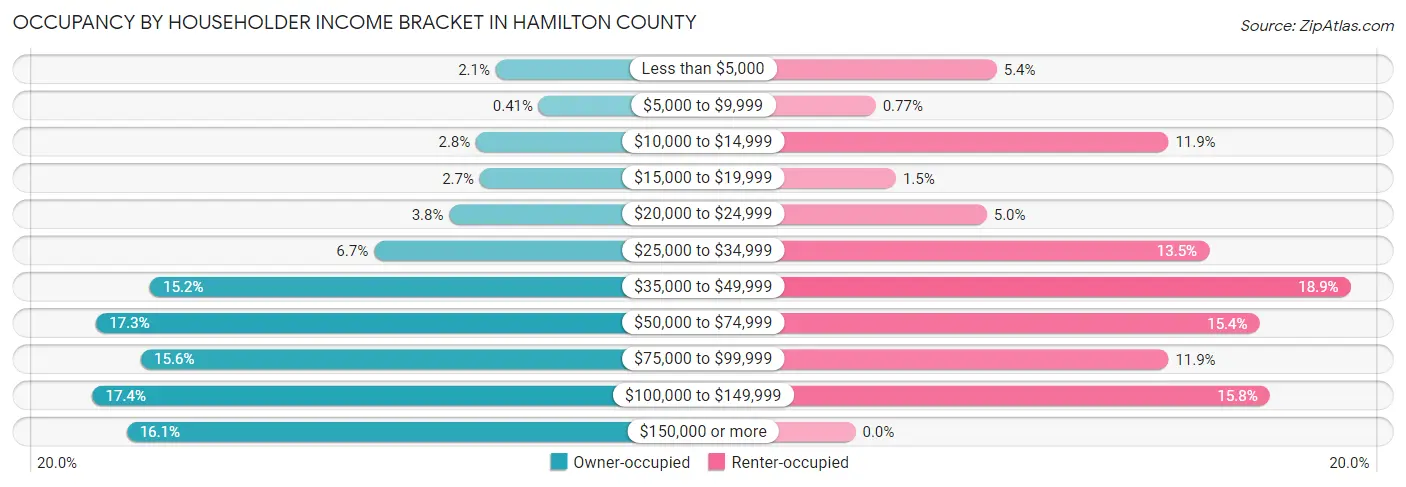
| Income Bracket | Owner-occupied | Renter-occupied |
| Less than $5,000 | 30 (2.1%) | 14 (5.4%) |
| $5,000 to $9,999 | 6 (0.4%) | 2 (0.8%) |
| $10,000 to $14,999 | 41 (2.8%) | 31 (11.9%) |
| $15,000 to $19,999 | 39 (2.7%) | 4 (1.5%) |
| $20,000 to $24,999 | 56 (3.8%) | 13 (5.0%) |
| $25,000 to $34,999 | 98 (6.7%) | 35 (13.5%) |
| $35,000 to $49,999 | 223 (15.2%) | 49 (18.9%) |
| $50,000 to $74,999 | 253 (17.3%) | 40 (15.4%) |
| $75,000 to $99,999 | 228 (15.6%) | 31 (11.9%) |
| $100,000 to $149,999 | 255 (17.4%) | 41 (15.8%) |
| $150,000 or more | 236 (16.1%) | 0 (0.0%) |
| Total | 1,465 (100.0%) | 260 (100.0%) |
Monthly Housing Cost Tiers in Hamilton County
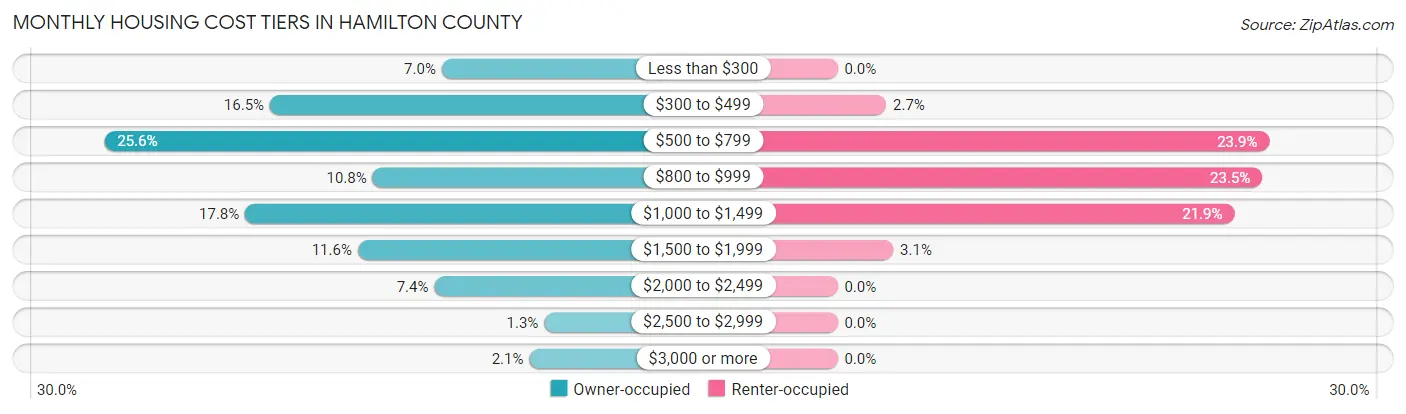
| Monthly Cost | Owner-occupied | Renter-occupied |
| Less than $300 | 102 (7.0%) | 0 (0.0%) |
| $300 to $499 | 241 (16.5%) | 7 (2.7%) |
| $500 to $799 | 375 (25.6%) | 62 (23.8%) |
| $800 to $999 | 158 (10.8%) | 61 (23.5%) |
| $1,000 to $1,499 | 261 (17.8%) | 57 (21.9%) |
| $1,500 to $1,999 | 170 (11.6%) | 8 (3.1%) |
| $2,000 to $2,499 | 108 (7.4%) | 0 (0.0%) |
| $2,500 to $2,999 | 19 (1.3%) | 0 (0.0%) |
| $3,000 or more | 31 (2.1%) | 0 (0.0%) |
| Total | 1,465 (100.0%) | 260 (100.0%) |
Physical Housing Characteristics in Hamilton County
Housing Structures in Hamilton County
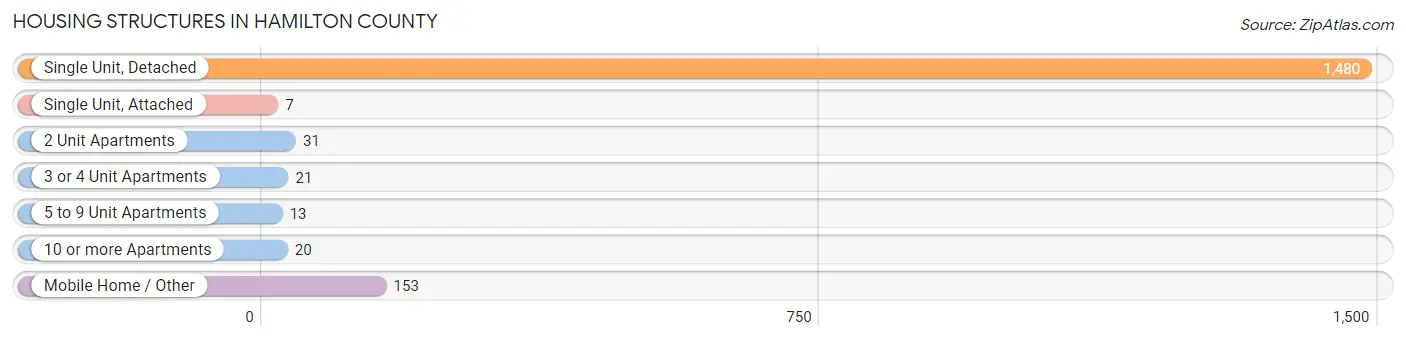
| Structure Type | # Housing Units | % Housing Units |
| Single Unit, Detached | 1,480 | 85.8% |
| Single Unit, Attached | 7 | 0.4% |
| 2 Unit Apartments | 31 | 1.8% |
| 3 or 4 Unit Apartments | 21 | 1.2% |
| 5 to 9 Unit Apartments | 13 | 0.7% |
| 10 or more Apartments | 20 | 1.2% |
| Mobile Home / Other | 153 | 8.9% |
| Total | 1,725 | 100.0% |
Housing Structures by Occupancy in Hamilton County
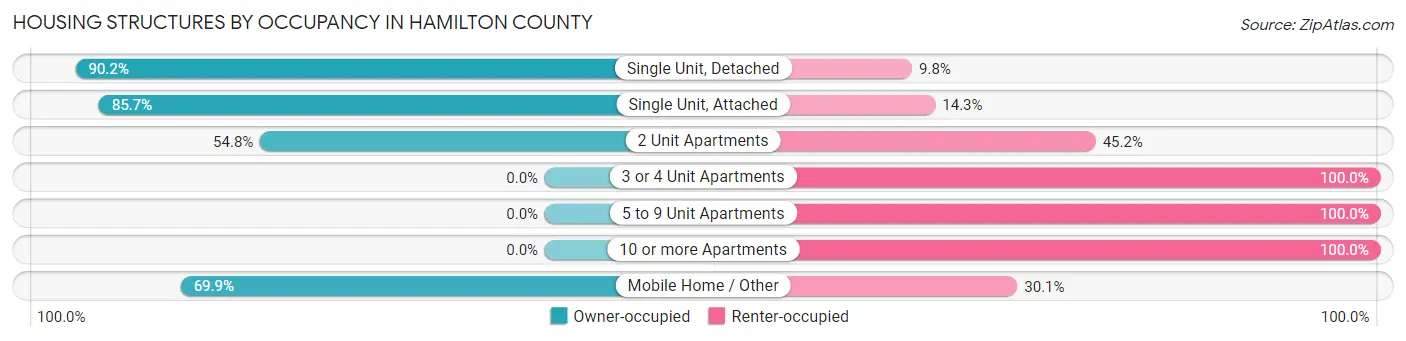
| Structure Type | Owner-occupied | Renter-occupied |
| Single Unit, Detached | 1,335 (90.2%) | 145 (9.8%) |
| Single Unit, Attached | 6 (85.7%) | 1 (14.3%) |
| 2 Unit Apartments | 17 (54.8%) | 14 (45.2%) |
| 3 or 4 Unit Apartments | 0 (0.0%) | 21 (100.0%) |
| 5 to 9 Unit Apartments | 0 (0.0%) | 13 (100.0%) |
| 10 or more Apartments | 0 (0.0%) | 20 (100.0%) |
| Mobile Home / Other | 107 (69.9%) | 46 (30.1%) |
| Total | 1,465 (84.9%) | 260 (15.1%) |
Housing Structures by Number of Rooms in Hamilton County
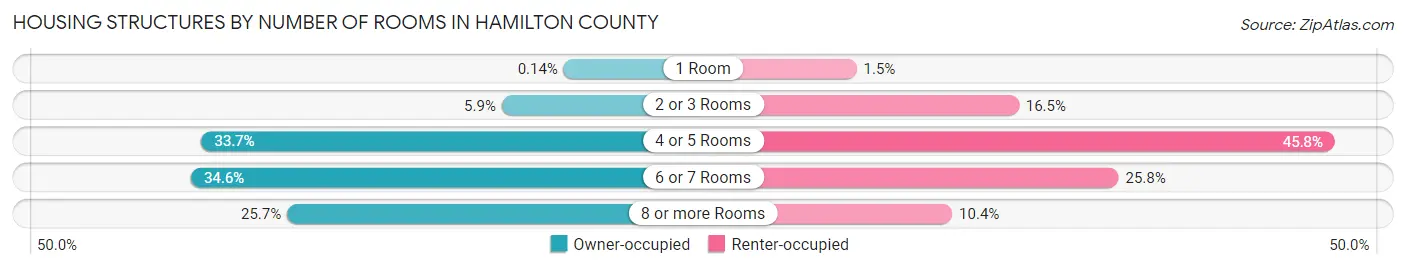
| Number of Rooms | Owner-occupied | Renter-occupied |
| 1 Room | 2 (0.1%) | 4 (1.5%) |
| 2 or 3 Rooms | 86 (5.9%) | 43 (16.5%) |
| 4 or 5 Rooms | 493 (33.7%) | 119 (45.8%) |
| 6 or 7 Rooms | 507 (34.6%) | 67 (25.8%) |
| 8 or more Rooms | 377 (25.7%) | 27 (10.4%) |
| Total | 1,465 (100.0%) | 260 (100.0%) |
Housing Structure by Heating Type in Hamilton County
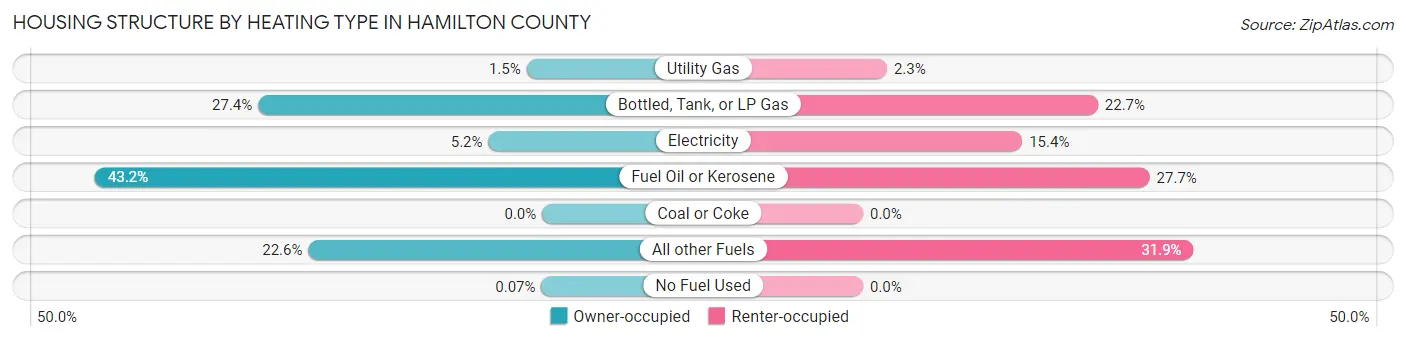
| Heating Type | Owner-occupied | Renter-occupied |
| Utility Gas | 22 (1.5%) | 6 (2.3%) |
| Bottled, Tank, or LP Gas | 402 (27.4%) | 59 (22.7%) |
| Electricity | 76 (5.2%) | 40 (15.4%) |
| Fuel Oil or Kerosene | 633 (43.2%) | 72 (27.7%) |
| Coal or Coke | 0 (0.0%) | 0 (0.0%) |
| All other Fuels | 331 (22.6%) | 83 (31.9%) |
| No Fuel Used | 1 (0.1%) | 0 (0.0%) |
| Total | 1,465 (100.0%) | 260 (100.0%) |
Household Vehicle Usage in Hamilton County
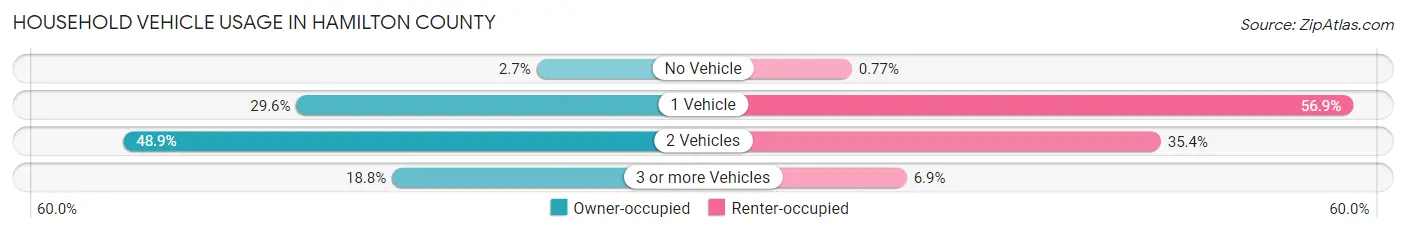
| Vehicles per Household | Owner-occupied | Renter-occupied |
| No Vehicle | 39 (2.7%) | 2 (0.8%) |
| 1 Vehicle | 433 (29.6%) | 148 (56.9%) |
| 2 Vehicles | 717 (48.9%) | 92 (35.4%) |
| 3 or more Vehicles | 276 (18.8%) | 18 (6.9%) |
| Total | 1,465 (100.0%) | 260 (100.0%) |
Real Estate & Mortgages in Hamilton County
Real Estate and Mortgage Overview in Hamilton County
| Characteristic | Without Mortgage | With Mortgage |
| Housing Units | 775 | 690 |
| Median Property Value | $235,300 | $186,600 |
| Median Household Income | $58,221 | $155 |
| Monthly Housing Costs | $545 | $17 |
| Real Estate Taxes | $2,197 | $0 |
Property Value by Mortgage Status in Hamilton County
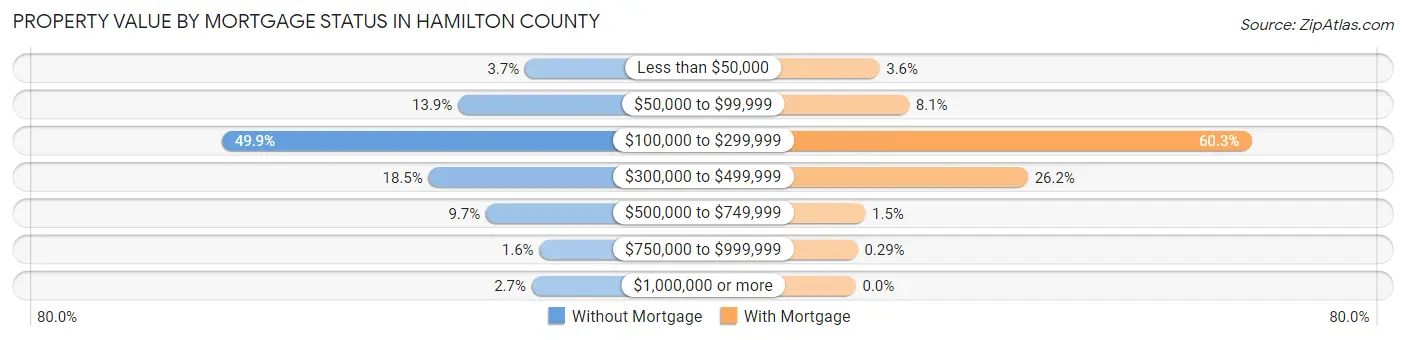
| Property Value | Without Mortgage | With Mortgage |
| Less than $50,000 | 29 (3.7%) | 25 (3.6%) |
| $50,000 to $99,999 | 108 (13.9%) | 56 (8.1%) |
| $100,000 to $299,999 | 387 (49.9%) | 416 (60.3%) |
| $300,000 to $499,999 | 143 (18.4%) | 181 (26.2%) |
| $500,000 to $749,999 | 75 (9.7%) | 10 (1.5%) |
| $750,000 to $999,999 | 12 (1.5%) | 2 (0.3%) |
| $1,000,000 or more | 21 (2.7%) | 0 (0.0%) |
| Total | 775 (100.0%) | 690 (100.0%) |
Household Income by Mortgage Status in Hamilton County
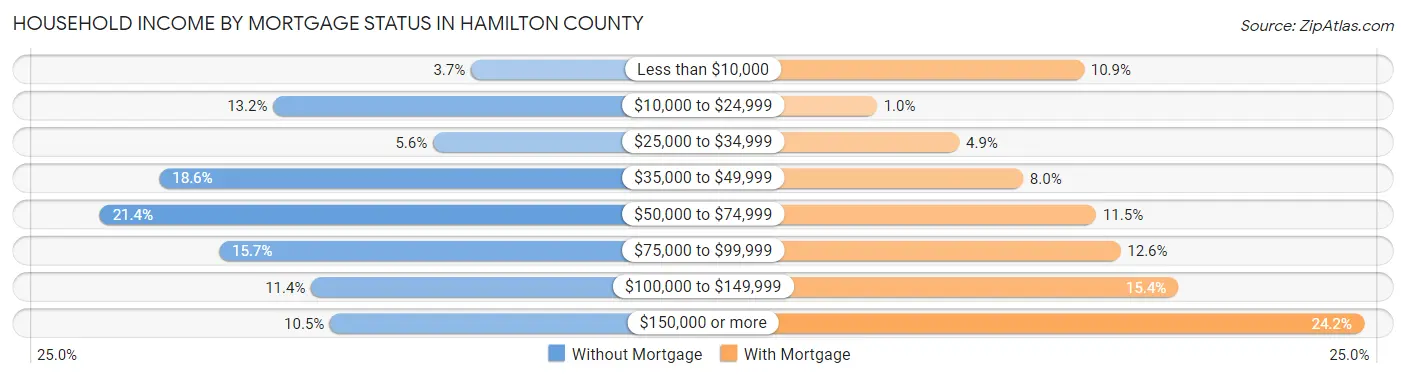
| Household Income | Without Mortgage | With Mortgage |
| Less than $10,000 | 29 (3.7%) | 75 (10.9%) |
| $10,000 to $24,999 | 102 (13.2%) | 7 (1.0%) |
| $25,000 to $34,999 | 43 (5.6%) | 34 (4.9%) |
| $35,000 to $49,999 | 144 (18.6%) | 55 (8.0%) |
| $50,000 to $74,999 | 166 (21.4%) | 79 (11.5%) |
| $75,000 to $99,999 | 122 (15.7%) | 87 (12.6%) |
| $100,000 to $149,999 | 88 (11.4%) | 106 (15.4%) |
| $150,000 or more | 81 (10.4%) | 167 (24.2%) |
| Total | 775 (100.0%) | 690 (100.0%) |
Property Value to Household Income Ratio in Hamilton County
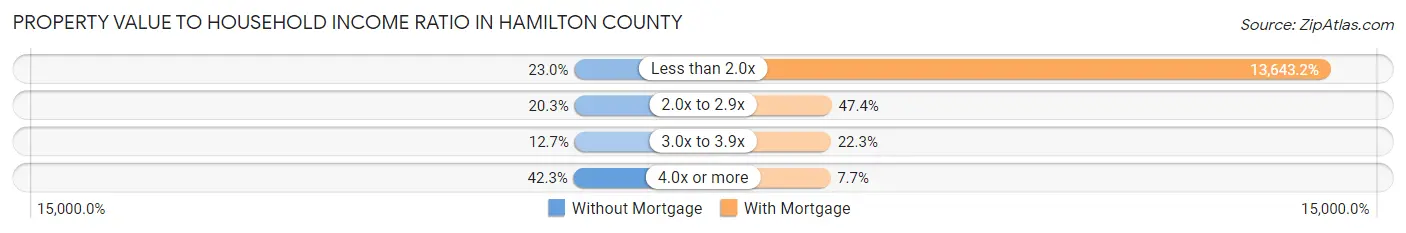
| Value-to-Income Ratio | Without Mortgage | With Mortgage |
| Less than 2.0x | 178 (23.0%) | 94,138 (13,643.2%) |
| 2.0x to 2.9x | 157 (20.3%) | 327 (47.4%) |
| 3.0x to 3.9x | 98 (12.7%) | 154 (22.3%) |
| 4.0x or more | 328 (42.3%) | 53 (7.7%) |
| Total | 775 (100.0%) | 690 (100.0%) |
Real Estate Taxes by Mortgage Status in Hamilton County
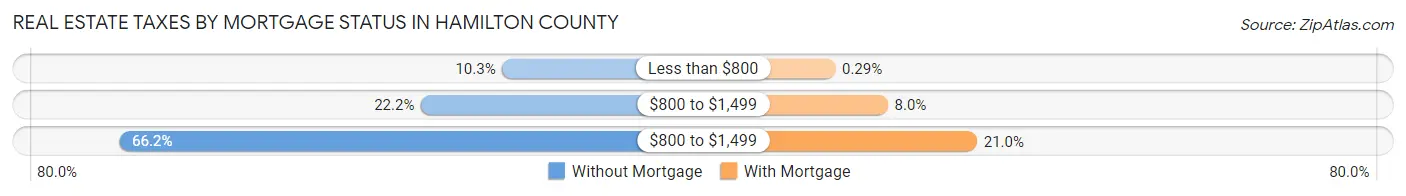
| Property Taxes | Without Mortgage | With Mortgage |
| Less than $800 | 80 (10.3%) | 2 (0.3%) |
| $800 to $1,499 | 172 (22.2%) | 55 (8.0%) |
| $800 to $1,499 | 513 (66.2%) | 145 (21.0%) |
| Total | 775 (100.0%) | 690 (100.0%) |
Health & Disability in Hamilton County
Health Insurance Coverage by Age in Hamilton County
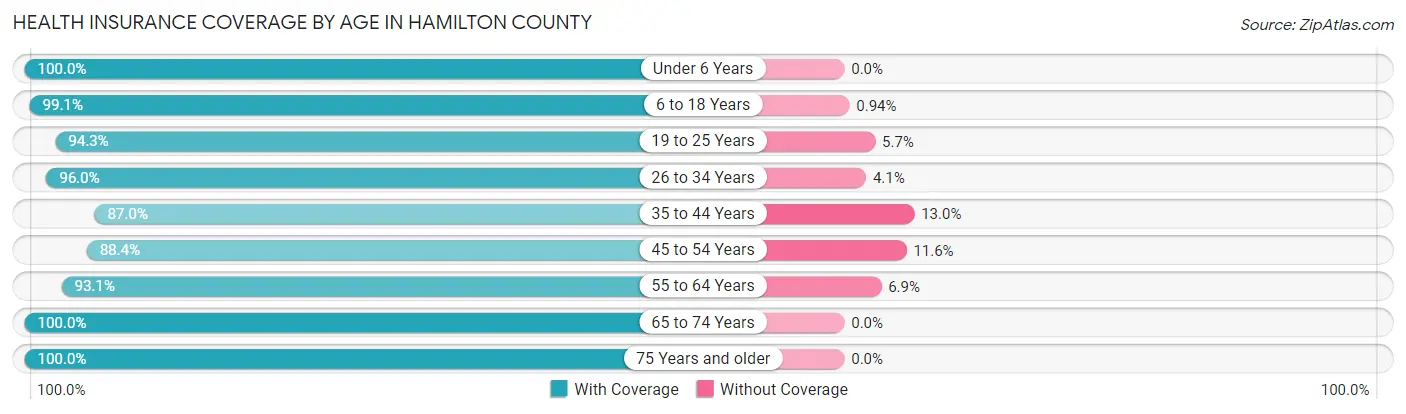
| Age Bracket | With Coverage | Without Coverage |
| Under 6 Years | 180 (100.0%) | 0 (0.0%) |
| 6 to 18 Years | 525 (99.1%) | 5 (0.9%) |
| 19 to 25 Years | 312 (94.3%) | 19 (5.7%) |
| 26 to 34 Years | 308 (96.0%) | 13 (4.1%) |
| 35 to 44 Years | 380 (87.0%) | 57 (13.0%) |
| 45 to 54 Years | 549 (88.4%) | 72 (11.6%) |
| 55 to 64 Years | 960 (93.1%) | 71 (6.9%) |
| 65 to 74 Years | 1,032 (100.0%) | 0 (0.0%) |
| 75 Years and older | 597 (100.0%) | 0 (0.0%) |
| Total | 4,843 (95.3%) | 237 (4.7%) |
Health Insurance Coverage by Citizenship Status in Hamilton County
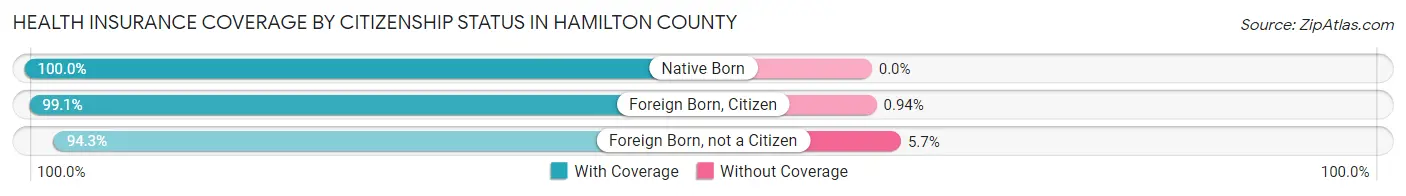
| Citizenship Status | With Coverage | Without Coverage |
| Native Born | 180 (100.0%) | 0 (0.0%) |
| Foreign Born, Citizen | 525 (99.1%) | 5 (0.9%) |
| Foreign Born, not a Citizen | 312 (94.3%) | 19 (5.7%) |
Health Insurance Coverage by Household Income in Hamilton County
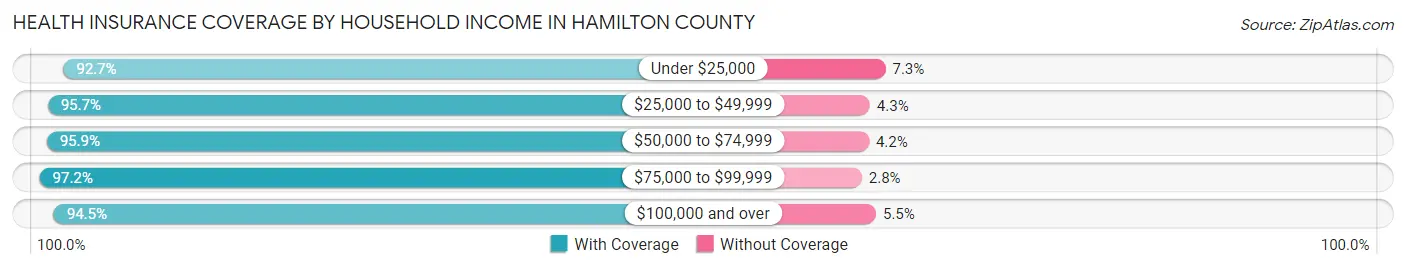
| Household Income | With Coverage | Without Coverage |
| Under $25,000 | 332 (92.7%) | 26 (7.3%) |
| $25,000 to $49,999 | 905 (95.7%) | 41 (4.3%) |
| $50,000 to $74,999 | 647 (95.9%) | 28 (4.2%) |
| $75,000 to $99,999 | 723 (97.2%) | 21 (2.8%) |
| $100,000 and over | 2,034 (94.5%) | 118 (5.5%) |
Public vs Private Health Insurance Coverage by Age in Hamilton County
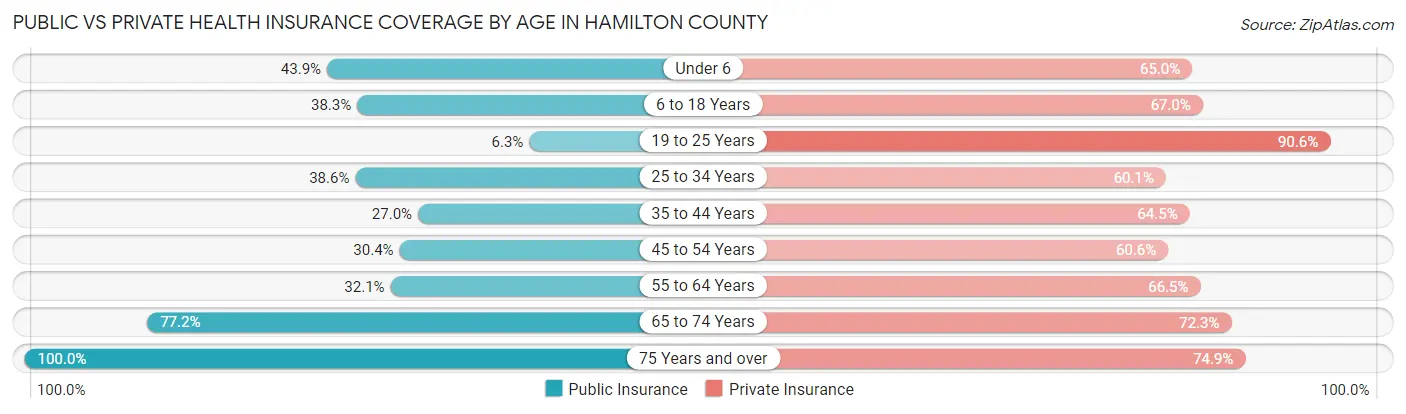
| Age Bracket | Public Insurance | Private Insurance |
| Under 6 | 79 (43.9%) | 117 (65.0%) |
| 6 to 18 Years | 203 (38.3%) | 355 (67.0%) |
| 19 to 25 Years | 21 (6.3%) | 300 (90.6%) |
| 25 to 34 Years | 124 (38.6%) | 193 (60.1%) |
| 35 to 44 Years | 118 (27.0%) | 282 (64.5%) |
| 45 to 54 Years | 189 (30.4%) | 376 (60.6%) |
| 55 to 64 Years | 331 (32.1%) | 686 (66.5%) |
| 65 to 74 Years | 797 (77.2%) | 746 (72.3%) |
| 75 Years and over | 597 (100.0%) | 447 (74.9%) |
| Total | 2,459 (48.4%) | 3,502 (68.9%) |
Disability Status by Sex by Age in Hamilton County
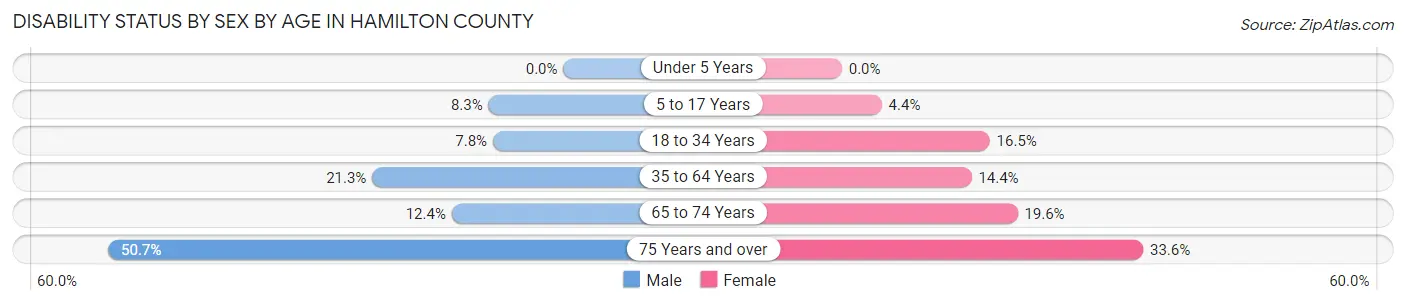
| Age Bracket | Male | Female |
| Under 5 Years | 0 (0.0%) | 0 (0.0%) |
| 5 to 17 Years | 22 (8.3%) | 11 (4.4%) |
| 18 to 34 Years | 28 (7.8%) | 56 (16.5%) |
| 35 to 64 Years | 225 (21.3%) | 149 (14.4%) |
| 65 to 74 Years | 66 (12.4%) | 98 (19.6%) |
| 75 Years and over | 144 (50.7%) | 105 (33.6%) |
Disability Class by Sex by Age in Hamilton County
Disability Class: Hearing Difficulty
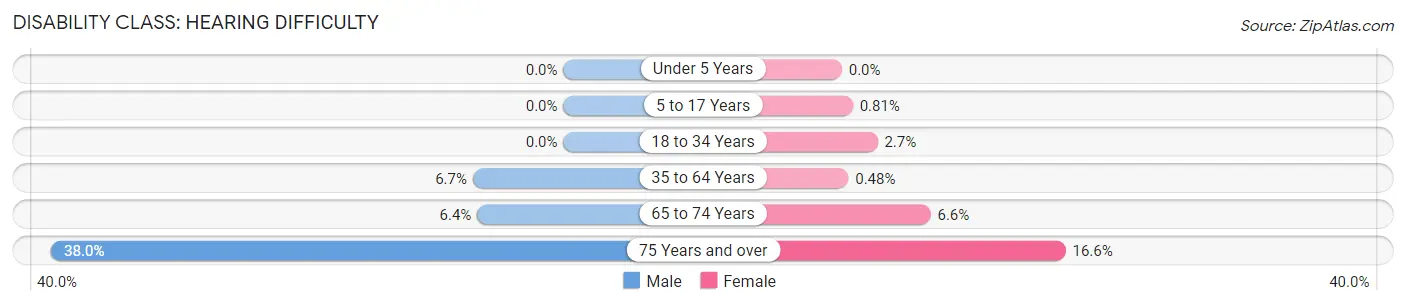
| Age Bracket | Male | Female |
| Under 5 Years | 0 (0.0%) | 0 (0.0%) |
| 5 to 17 Years | 0 (0.0%) | 2 (0.8%) |
| 18 to 34 Years | 0 (0.0%) | 9 (2.6%) |
| 35 to 64 Years | 71 (6.7%) | 5 (0.5%) |
| 65 to 74 Years | 34 (6.4%) | 33 (6.6%) |
| 75 Years and over | 108 (38.0%) | 52 (16.6%) |
Disability Class: Vision Difficulty
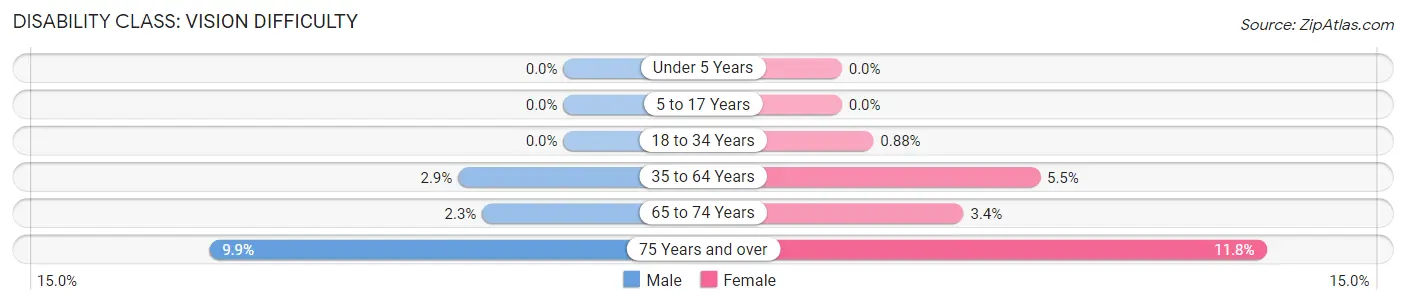
| Age Bracket | Male | Female |
| Under 5 Years | 0 (0.0%) | 0 (0.0%) |
| 5 to 17 Years | 0 (0.0%) | 0 (0.0%) |
| 18 to 34 Years | 0 (0.0%) | 3 (0.9%) |
| 35 to 64 Years | 31 (2.9%) | 57 (5.5%) |
| 65 to 74 Years | 12 (2.3%) | 17 (3.4%) |
| 75 Years and over | 28 (9.9%) | 37 (11.8%) |
Disability Class: Cognitive Difficulty
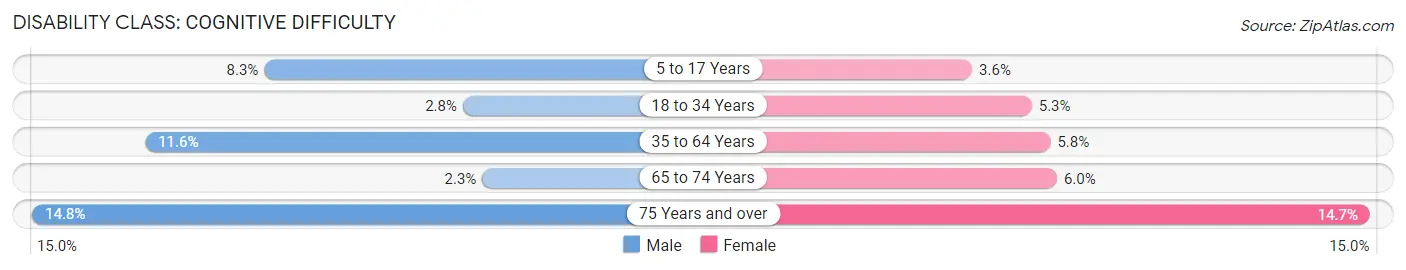
| Age Bracket | Male | Female |
| 5 to 17 Years | 22 (8.3%) | 9 (3.6%) |
| 18 to 34 Years | 10 (2.8%) | 18 (5.3%) |
| 35 to 64 Years | 123 (11.6%) | 60 (5.8%) |
| 65 to 74 Years | 12 (2.3%) | 30 (6.0%) |
| 75 Years and over | 42 (14.8%) | 46 (14.7%) |
Disability Class: Ambulatory Difficulty
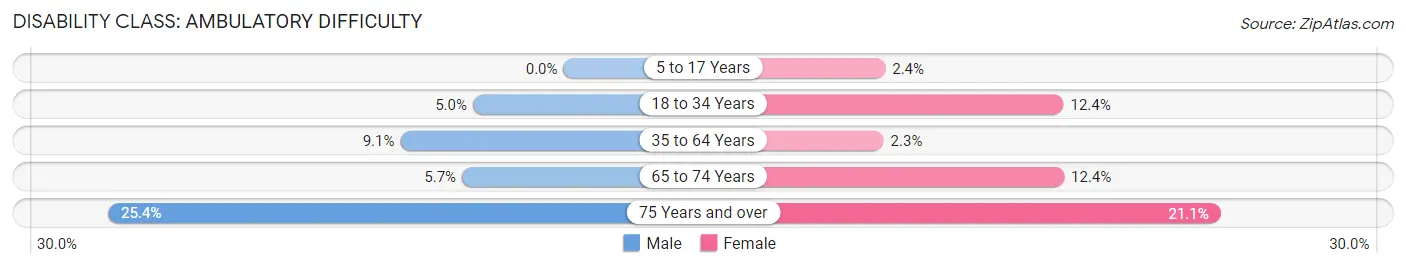
| Age Bracket | Male | Female |
| 5 to 17 Years | 0 (0.0%) | 6 (2.4%) |
| 18 to 34 Years | 18 (5.0%) | 42 (12.3%) |
| 35 to 64 Years | 96 (9.1%) | 24 (2.3%) |
| 65 to 74 Years | 30 (5.7%) | 62 (12.4%) |
| 75 Years and over | 72 (25.4%) | 66 (21.1%) |
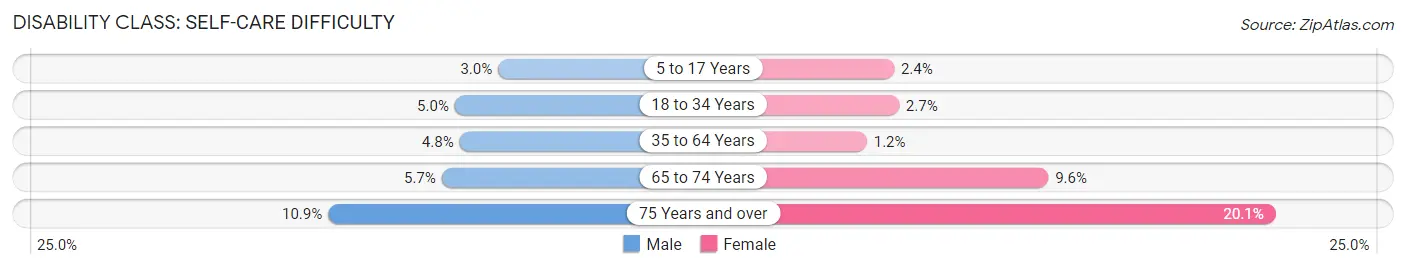
Disability Class: Self-Care Difficulty
| Age Bracket | Male | Female |
| 5 to 17 Years | 8 (3.0%) | 6 (2.4%) |
| 18 to 34 Years | 18 (5.0%) | 9 (2.6%) |
| 35 to 64 Years | 51 (4.8%) | 12 (1.2%) |
| 65 to 74 Years | 30 (5.7%) | 48 (9.6%) |
| 75 Years and over | 31 (10.9%) | 63 (20.1%) |
Technology Access in Hamilton County
Computing Device Access in Hamilton County
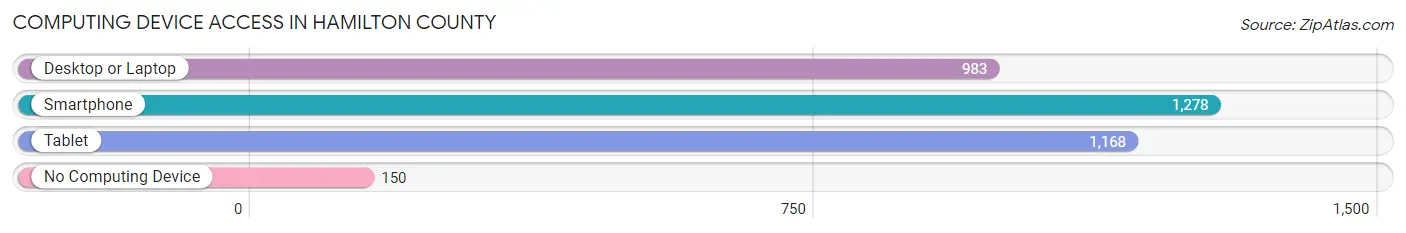
| Device Type | # Households | % Households |
| Desktop or Laptop | 983 | 57.0% |
| Smartphone | 1,278 | 74.1% |
| Tablet | 1,168 | 67.7% |
| No Computing Device | 150 | 8.7% |
| Total | 1,725 | 100.0% |
Internet Access in Hamilton County
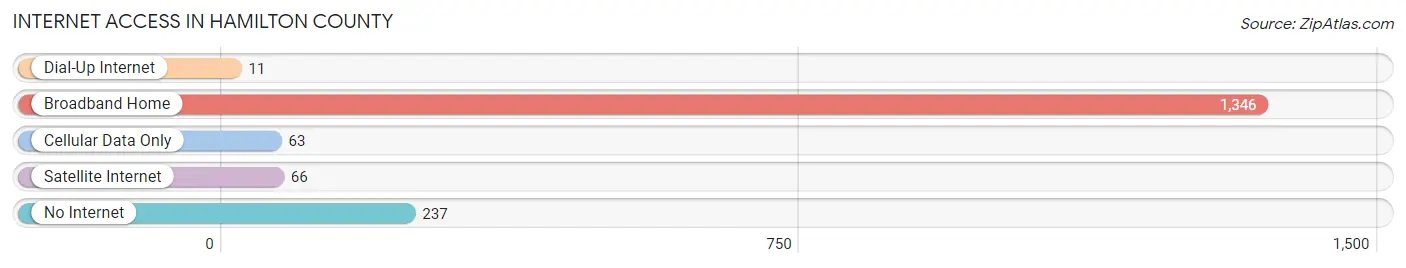
| Internet Type | # Households | % Households |
| Dial-Up Internet | 11 | 0.6% |
| Broadband Home | 1,346 | 78.0% |
| Cellular Data Only | 63 | 3.6% |
| Satellite Internet | 66 | 3.8% |
| No Internet | 237 | 13.7% |
| Total | 1,725 | 100.0% |
Hamilton County Summary
Hamilton County is located in the north-central region of New York State. It is bordered by Herkimer County to the north, Fulton County to the east, Saratoga County to the south, and Warren County to the west. The county seat is Lake Pleasant. Hamilton County is part of the Adirondack Park, a 6 million acre park that is the largest publicly protected area in the contiguous United States.
History
The area that is now Hamilton County was originally inhabited by the Mohawk and Iroquois Native American tribes. The first European settlers arrived in the area in the late 1700s. The county was established in 1816 and was named after Alexander Hamilton, the first Secretary of the Treasury.
In the early 1800s, the county was largely agricultural, with small villages and hamlets scattered throughout the area. The county was also home to several iron ore mines, which provided employment for many of the residents.
In the late 1800s, the area began to experience a period of growth and development. The Adirondack Park was established in 1892, and the area became a popular tourist destination. The county also experienced a boom in the lumber industry, with several sawmills and logging camps being established.
Geography
Hamilton County covers an area of 1,818 square miles and is located in the Adirondack Mountains. The highest point in the county is Mount Marcy, which has an elevation of 5,344 feet. The county is home to several large lakes, including Lake Pleasant, Indian Lake, and Long Lake.
The county is largely rural, with small villages and hamlets scattered throughout the area. The largest town in the county is Lake Pleasant, which is also the county seat. Other towns in the county include Indian Lake, Long Lake, and Wells.
Economy
The economy of Hamilton County is largely based on tourism and recreation. The county is home to several ski resorts, including Whiteface Mountain and Gore Mountain. The county is also home to several state parks, including the Adirondack Park, which is the largest publicly protected area in the contiguous United States.
The county is also home to several small businesses, including restaurants, retail stores, and lodging establishments. The county is also home to several farms, which produce a variety of crops, including apples, potatoes, and hay.
Demographics
As of the 2010 census, the population of Hamilton County was 4,836. The population is largely white (96.2%), with small percentages of African American (1.2%), Native American (0.5%), and Asian (0.3%) residents. The median household income in the county is $41,945, and the median age is 44.7 years.
Conclusion
Hamilton County is a rural county located in the north-central region of New York State. It is home to several ski resorts, state parks, and small businesses. The county is largely white, with a median household income of $41,945 and a median age of 44.7 years. The county is largely dependent on tourism and recreation for its economy, and is a popular destination for outdoor enthusiasts.
Common Questions
What is Per Capita Income in Hamilton County?
Per Capita income in Hamilton County is $37,326.
What is the Median Family Income in Hamilton County?
Median Family Income in Hamilton County is $81,389.
What is the Median Household income in Hamilton County?
Median Household Income in Hamilton County is $66,891.
What is Income or Wage Gap in Hamilton County?
Income or Wage Gap in Hamilton County is 23.1%.
Women in Hamilton County earn 76.9 cents for every dollar earned by a man.
What is Inequality or Gini Index in Hamilton County?
Inequality or Gini Index in Hamilton County is 0.42.
What is the Total Population of Hamilton County?
Total Population of Hamilton County is 5,090.
What is the Total Male Population of Hamilton County?
Total Male Population of Hamilton County is 2,569.
What is the Total Female Population of Hamilton County?
Total Female Population of Hamilton County is 2,521.
What is the Ratio of Males per 100 Females in Hamilton County?
There are 101.90 Males per 100 Females in Hamilton County.
What is the Ratio of Females per 100 Males in Hamilton County?
There are 98.13 Females per 100 Males in Hamilton County.
What is the Median Population Age in Hamilton County?
Median Population Age in Hamilton County is 56.4 Years.
What is the Average Family Size in Hamilton County
Average Family Size in Hamilton County is 3.3 People.
What is the Average Household Size in Hamilton County
Average Household Size in Hamilton County is 2.8 People.
How Large is the Labor Force in Hamilton County?
There are 2,347 People in the Labor Forcein in Hamilton County.
What is the Percentage of People in the Labor Force in Hamilton County?
51.8% of People are in the Labor Force in Hamilton County.
What is the Unemployment Rate in Hamilton County?
Unemployment Rate in Hamilton County is 4.9%.