Delaware County, NY Map & Demographics
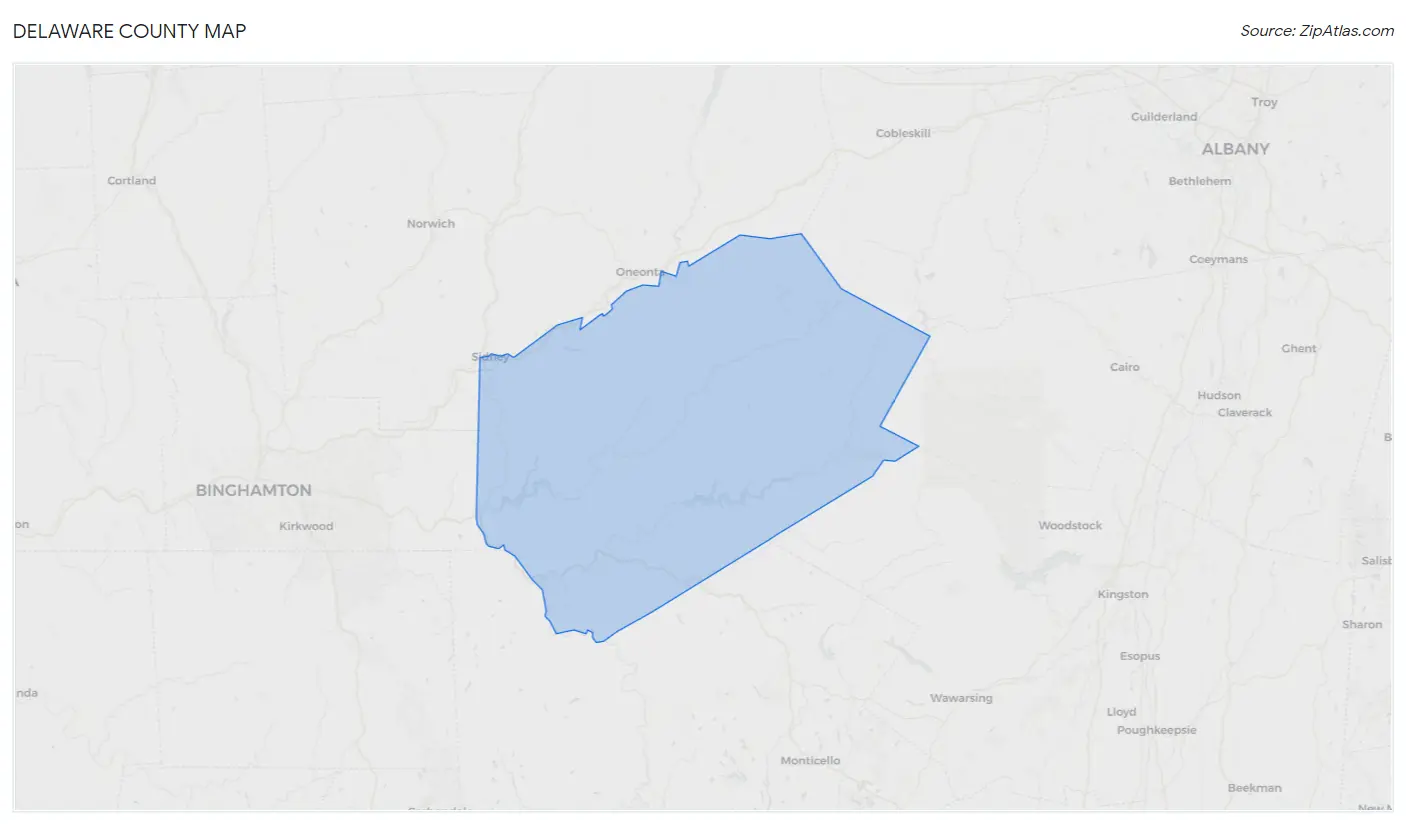
Delaware County Map
Delaware County Overview
$33,332
PER CAPITA INCOME
$75,000
AVG FAMILY INCOME
$58,338
AVG HOUSEHOLD INCOME
25.6%
WAGE / INCOME GAP [ % ]
74.4¢/ $1
WAGE / INCOME GAP [ $ ]
$10,229
FAMILY INCOME DEFICIT
0.44
INEQUALITY / GINI INDEX
44,637
TOTAL POPULATION
22,763
MALE POPULATION
21,874
FEMALE POPULATION
104.06
MALES / 100 FEMALES
96.09
FEMALES / 100 MALES
48.9
MEDIAN AGE
2.8
AVG FAMILY SIZE
2.3
AVG HOUSEHOLD SIZE
20,509
LABOR FORCE [ PEOPLE ]
53.5%
PERCENT IN LABOR FORCE
6.1%
UNEMPLOYMENT RATE
Income in Delaware County
Income Overview in Delaware County
Per Capita Income in Delaware County is $33,332, while median incomes of families and households are $75,000 and $58,338 respectively.
| Characteristic | Number | Measure |
| Per Capita Income | 44,637 | $33,332 |
| Median Family Income | 11,226 | $75,000 |
| Mean Family Income | 11,226 | $90,882 |
| Median Household Income | 18,780 | $58,338 |
| Mean Household Income | 18,780 | $76,400 |
| Income Deficit | 11,226 | $10,229 |
| Wage / Income Gap (%) | 44,637 | 25.63% |
| Wage / Income Gap ($) | 44,637 | 74.37¢ per $1 |
| Gini / Inequality Index | 44,637 | 0.44 |
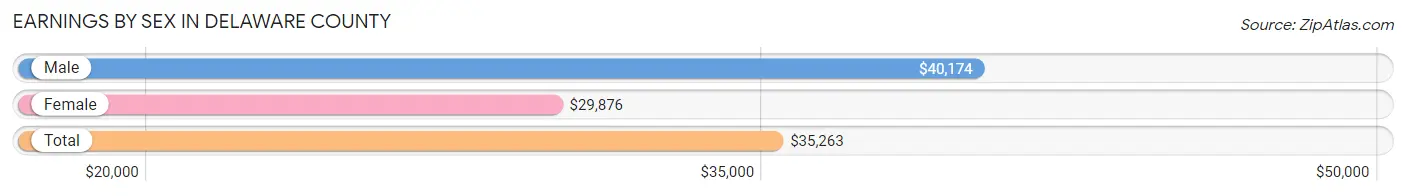
Earnings by Sex in Delaware County
Average Earnings in Delaware County are $35,263, $40,174 for men and $29,876 for women, a difference of 25.6%.
| Sex | Number | Average Earnings |
| Male | 12,040 (53.8%) | $40,174 |
| Female | 10,333 (46.2%) | $29,876 |
| Total | 22,373 (100.0%) | $35,263 |
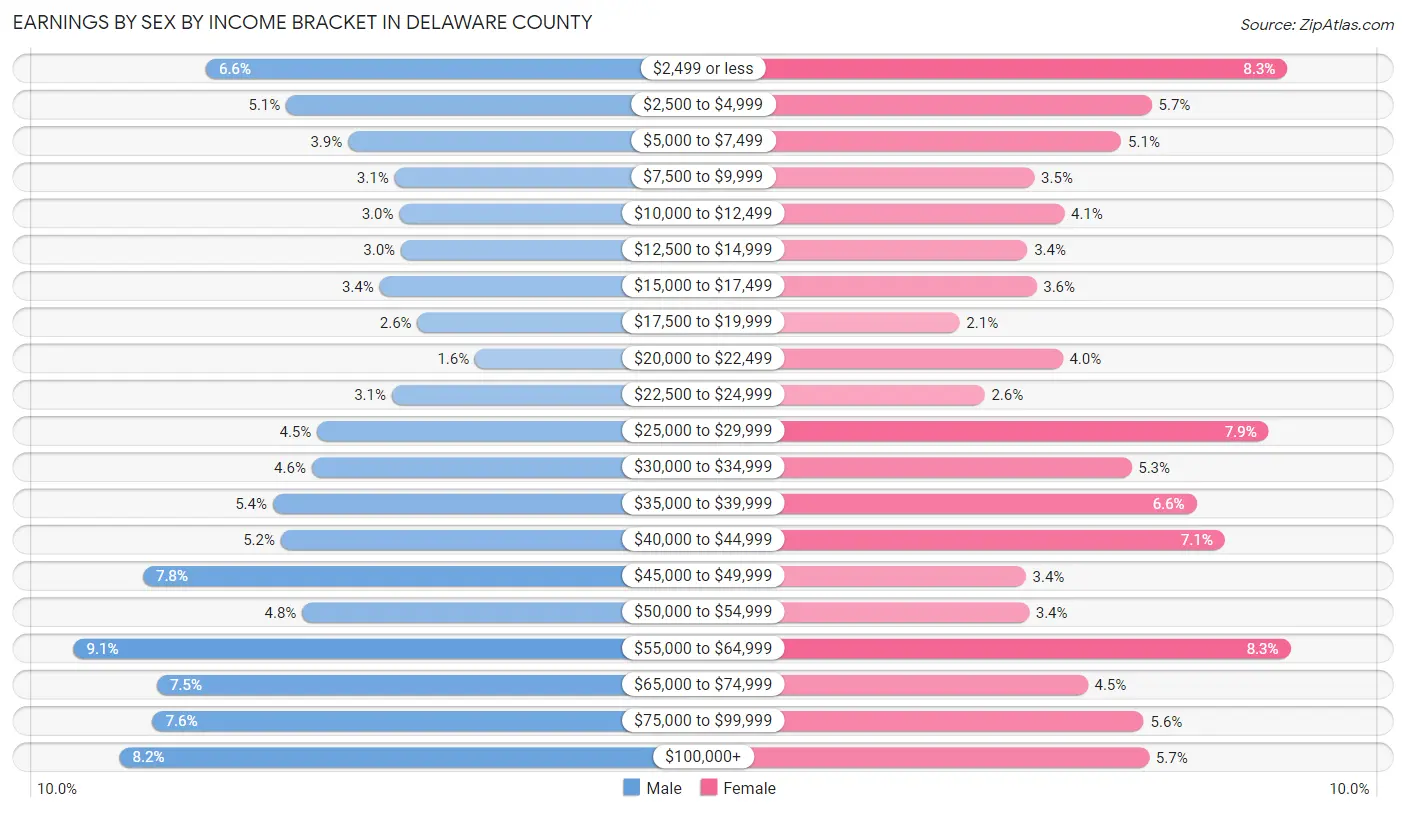
Earnings by Sex by Income Bracket in Delaware County
The most common earnings brackets in Delaware County are $55,000 to $64,999 for men (1,093 | 9.1%) and $55,000 to $64,999 for women (859 | 8.3%).
| Income | Male | Female |
| $2,499 or less | 795 (6.6%) | 852 (8.3%) |
| $2,500 to $4,999 | 614 (5.1%) | 590 (5.7%) |
| $5,000 to $7,499 | 474 (3.9%) | 531 (5.1%) |
| $7,500 to $9,999 | 370 (3.1%) | 363 (3.5%) |
| $10,000 to $12,499 | 359 (3.0%) | 421 (4.1%) |
| $12,500 to $14,999 | 355 (2.9%) | 349 (3.4%) |
| $15,000 to $17,499 | 403 (3.4%) | 367 (3.5%) |
| $17,500 to $19,999 | 318 (2.6%) | 218 (2.1%) |
| $20,000 to $22,499 | 188 (1.6%) | 417 (4.0%) |
| $22,500 to $24,999 | 376 (3.1%) | 267 (2.6%) |
| $25,000 to $29,999 | 544 (4.5%) | 816 (7.9%) |
| $30,000 to $34,999 | 556 (4.6%) | 551 (5.3%) |
| $35,000 to $39,999 | 644 (5.3%) | 677 (6.6%) |
| $40,000 to $44,999 | 626 (5.2%) | 732 (7.1%) |
| $45,000 to $49,999 | 937 (7.8%) | 346 (3.4%) |
| $50,000 to $54,999 | 578 (4.8%) | 352 (3.4%) |
| $55,000 to $64,999 | 1,093 (9.1%) | 859 (8.3%) |
| $65,000 to $74,999 | 905 (7.5%) | 466 (4.5%) |
| $75,000 to $99,999 | 915 (7.6%) | 574 (5.6%) |
| $100,000+ | 990 (8.2%) | 585 (5.7%) |
| Total | 12,040 (100.0%) | 10,333 (100.0%) |
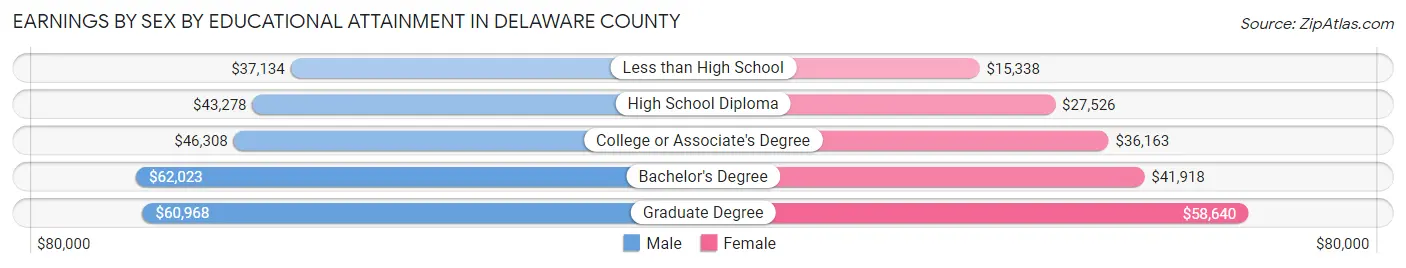
Earnings by Sex by Educational Attainment in Delaware County
Average earnings in Delaware County are $46,046 for men and $36,360 for women, a difference of 21.0%. Men with an educational attainment of bachelor's degree enjoy the highest average annual earnings of $62,023, while those with less than high school education earn the least with $37,134. Women with an educational attainment of graduate degree earn the most with the average annual earnings of $58,640, while those with less than high school education have the smallest earnings of $15,338.
| Educational Attainment | Male Income | Female Income |
| Less than High School | $37,134 | $15,338 |
| High School Diploma | $43,278 | $27,526 |
| College or Associate's Degree | $46,308 | $36,163 |
| Bachelor's Degree | $62,023 | $41,918 |
| Graduate Degree | $60,968 | $58,640 |
| Total | $46,046 | $36,360 |
Family Income in Delaware County
Family Income Brackets in Delaware County
According to the Delaware County family income data, there are 2,088 families falling into the $100,000 to $149,999 income range, which is the most common income bracket and makes up 18.6% of all families. Conversely, the less than $10,000 income bracket is the least frequent group with only 393 families (3.5%) belonging to this category.
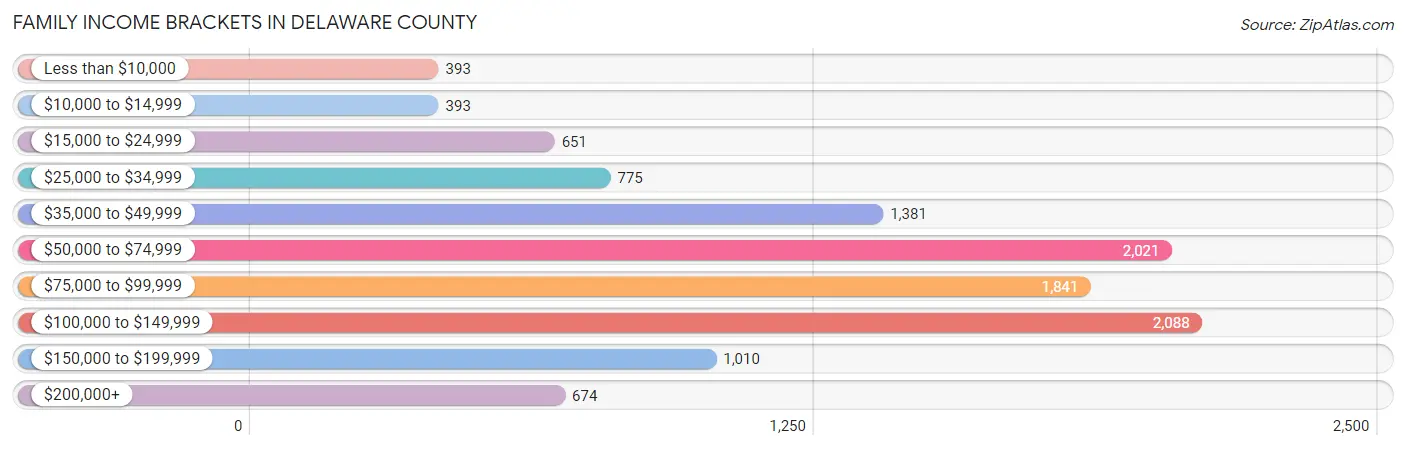
| Income Bracket | # Families | % Families |
| Less than $10,000 | 393 | 3.5% |
| $10,000 to $14,999 | 393 | 3.5% |
| $15,000 to $24,999 | 651 | 5.8% |
| $25,000 to $34,999 | 775 | 6.9% |
| $35,000 to $49,999 | 1,381 | 12.3% |
| $50,000 to $74,999 | 2,021 | 18.0% |
| $75,000 to $99,999 | 1,841 | 16.4% |
| $100,000 to $149,999 | 2,088 | 18.6% |
| $150,000 to $199,999 | 1,010 | 9.0% |
| $200,000+ | 674 | 6.0% |
Family Income by Famaliy Size in Delaware County
3-person families (2,253 | 20.1%) account for the highest median family income in Delaware County with $90,237 per family, while 2-person families (6,606 | 58.9%) have the highest median income of $33,144 per family member.
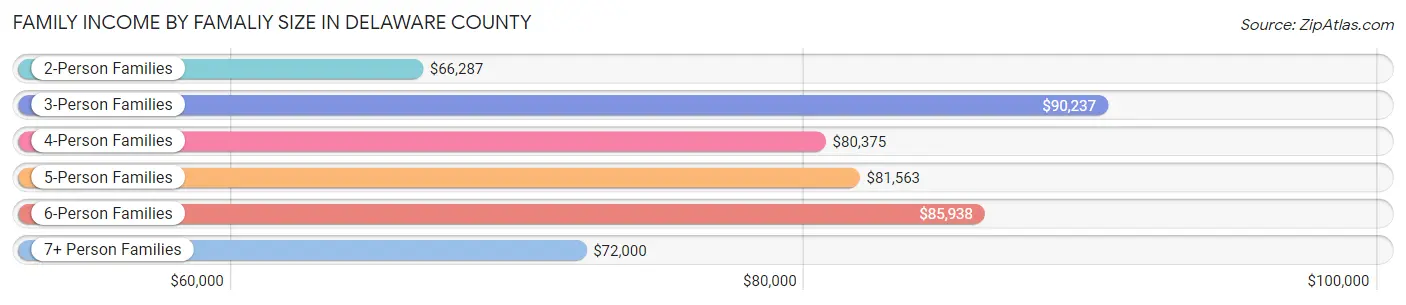
| Income Bracket | # Families | Median Income |
| 2-Person Families | 6,606 (58.9%) | $66,287 |
| 3-Person Families | 2,253 (20.1%) | $90,237 |
| 4-Person Families | 1,295 (11.5%) | $80,375 |
| 5-Person Families | 668 (5.9%) | $81,563 |
| 6-Person Families | 242 (2.2%) | $85,938 |
| 7+ Person Families | 162 (1.4%) | $72,000 |
| Total | 11,226 (100.0%) | $75,000 |
Family Income by Number of Earners in Delaware County
The median family income in Delaware County is $75,000, with families comprising 3+ earners (1,130) having the highest median family income of $132,939, while families with no earners (2,577) have the lowest median family income of $48,064, accounting for 10.1% and 23.0% of families, respectively.
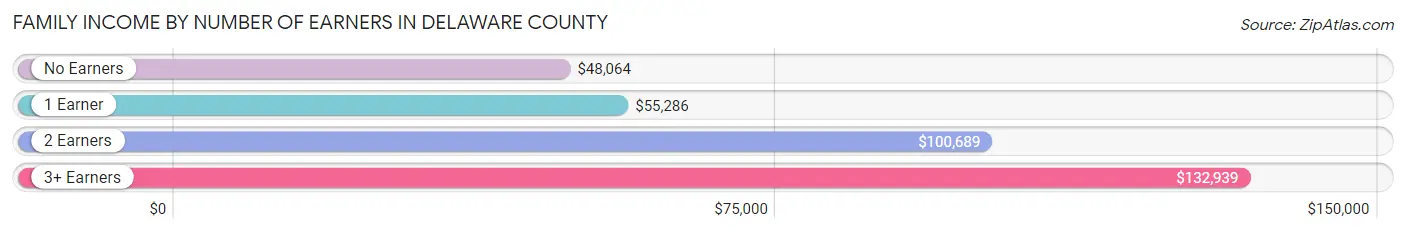
| Number of Earners | # Families | Median Income |
| No Earners | 2,577 (23.0%) | $48,064 |
| 1 Earner | 3,681 (32.8%) | $55,286 |
| 2 Earners | 3,838 (34.2%) | $100,689 |
| 3+ Earners | 1,130 (10.1%) | $132,939 |
| Total | 11,226 (100.0%) | $75,000 |
Household Income in Delaware County
Household Income Brackets in Delaware County
With 3,474 households falling in the category, the $50,000 to $74,999 income range is the most frequent in Delaware County, accounting for 18.5% of all households. In contrast, only 920 households (4.9%) fall into the $200,000+ income bracket, making it the least populous group.
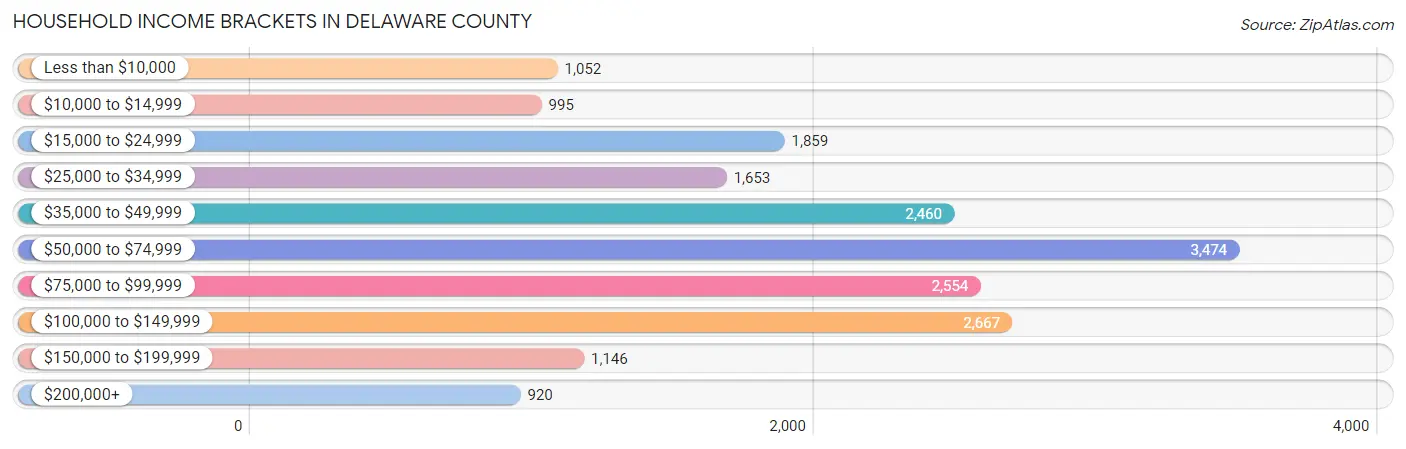
| Income Bracket | # Households | % Households |
| Less than $10,000 | 1,052 | 5.6% |
| $10,000 to $14,999 | 995 | 5.3% |
| $15,000 to $24,999 | 1,859 | 9.9% |
| $25,000 to $34,999 | 1,653 | 8.8% |
| $35,000 to $49,999 | 2,460 | 13.1% |
| $50,000 to $74,999 | 3,474 | 18.5% |
| $75,000 to $99,999 | 2,554 | 13.6% |
| $100,000 to $149,999 | 2,667 | 14.2% |
| $150,000 to $199,999 | 1,146 | 6.1% |
| $200,000+ | 920 | 4.9% |
Household Income by Householder Age in Delaware County
The median household income in Delaware County is $58,338, with the highest median household income of $73,539 found in the 25 to 44 years age bracket for the primary householder. A total of 3,823 households (20.4%) fall into this category. Meanwhile, the 15 to 24 years age bracket for the primary householder has the lowest median household income of $21,875, with 345 households (1.8%) in this group.
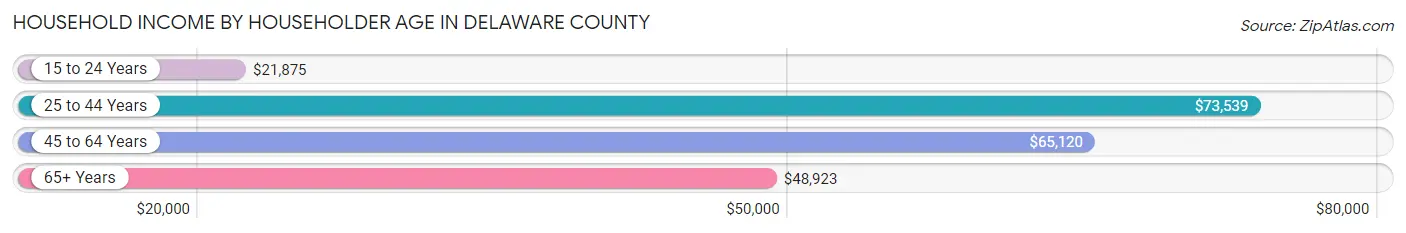
| Income Bracket | # Households | Median Income |
| 15 to 24 Years | 345 (1.8%) | $21,875 |
| 25 to 44 Years | 3,823 (20.4%) | $73,539 |
| 45 to 64 Years | 7,449 (39.7%) | $65,120 |
| 65+ Years | 7,163 (38.1%) | $48,923 |
| Total | 18,780 (100.0%) | $58,338 |
Poverty in Delaware County
Income Below Poverty by Sex and Age in Delaware County
With 14.5% poverty level for males and 15.1% for females among the residents of Delaware County, 18 to 24 year old males and 5 year old females are the most vulnerable to poverty, with 429 males (29.0%) and 26 females (28.9%) in their respective age groups living below the poverty level.
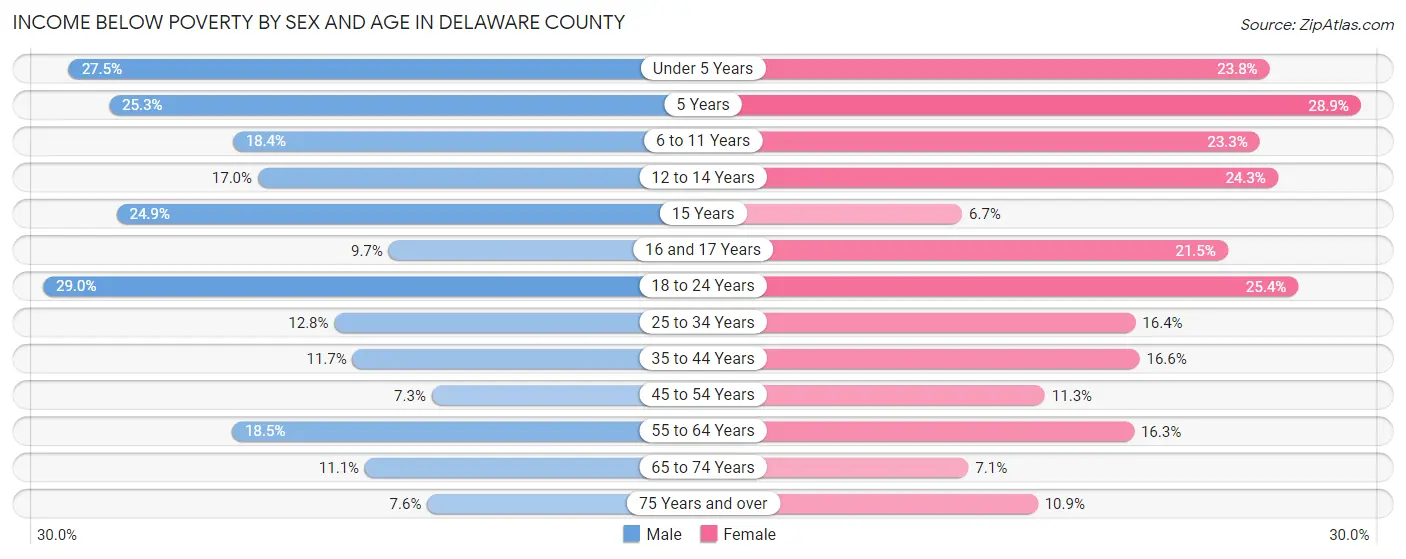
| Age Bracket | Male | Female |
| Under 5 Years | 233 (27.5%) | 190 (23.8%) |
| 5 Years | 22 (25.3%) | 26 (28.9%) |
| 6 to 11 Years | 229 (18.4%) | 294 (23.3%) |
| 12 to 14 Years | 131 (17.0%) | 141 (24.3%) |
| 15 Years | 53 (24.9%) | 14 (6.7%) |
| 16 and 17 Years | 47 (9.7%) | 84 (21.5%) |
| 18 to 24 Years | 429 (29.0%) | 313 (25.4%) |
| 25 to 34 Years | 302 (12.8%) | 334 (16.4%) |
| 35 to 44 Years | 264 (11.7%) | 362 (16.6%) |
| 45 to 54 Years | 200 (7.3%) | 313 (11.3%) |
| 55 to 64 Years | 704 (18.4%) | 590 (16.3%) |
| 65 to 74 Years | 362 (11.1%) | 222 (7.0%) |
| 75 Years and over | 161 (7.6%) | 275 (10.9%) |
| Total | 3,137 (14.5%) | 3,158 (15.1%) |
Income Above Poverty by Sex and Age in Delaware County
According to the poverty statistics in Delaware County, males aged 45 to 54 years and females aged 15 years are the age groups that are most secure financially, with 92.7% of males and 93.3% of females in these age groups living above the poverty line.
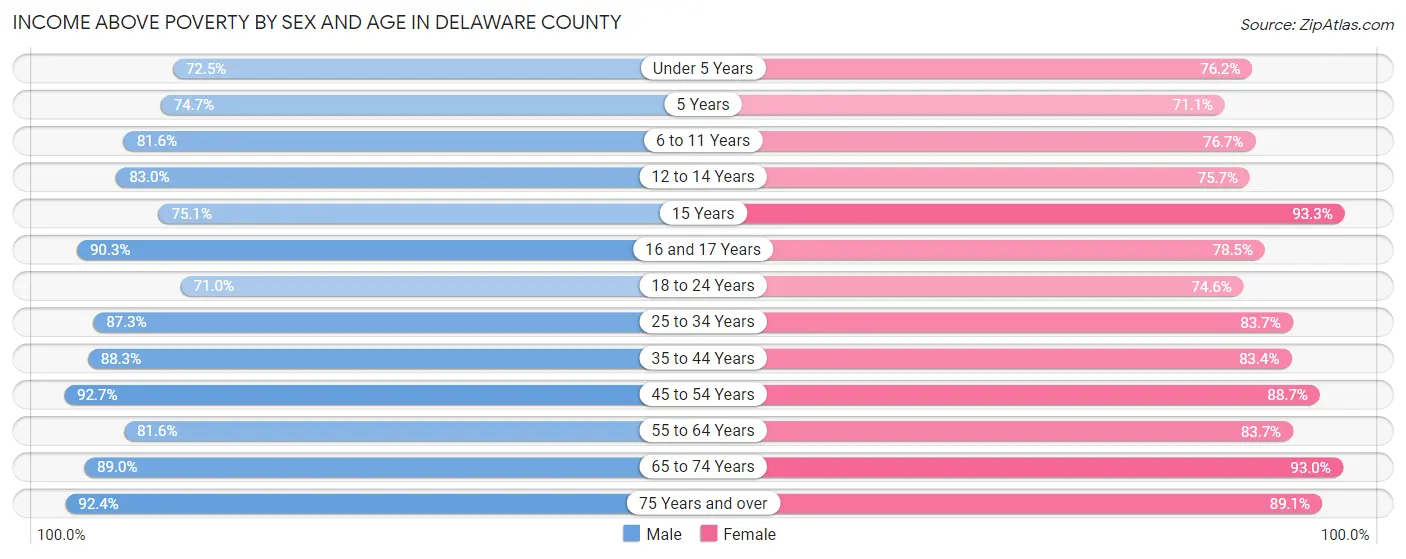
| Age Bracket | Male | Female |
| Under 5 Years | 613 (72.5%) | 608 (76.2%) |
| 5 Years | 65 (74.7%) | 64 (71.1%) |
| 6 to 11 Years | 1,015 (81.6%) | 970 (76.7%) |
| 12 to 14 Years | 639 (83.0%) | 440 (75.7%) |
| 15 Years | 160 (75.1%) | 195 (93.3%) |
| 16 and 17 Years | 436 (90.3%) | 307 (78.5%) |
| 18 to 24 Years | 1,052 (71.0%) | 919 (74.6%) |
| 25 to 34 Years | 2,067 (87.3%) | 1,709 (83.7%) |
| 35 to 44 Years | 1,984 (88.3%) | 1,821 (83.4%) |
| 45 to 54 Years | 2,527 (92.7%) | 2,454 (88.7%) |
| 55 to 64 Years | 3,112 (81.6%) | 3,036 (83.7%) |
| 65 to 74 Years | 2,913 (88.9%) | 2,925 (92.9%) |
| 75 Years and over | 1,962 (92.4%) | 2,246 (89.1%) |
| Total | 18,545 (85.5%) | 17,694 (84.9%) |
Income Below Poverty Among Married-Couple Families in Delaware County
The poverty statistics for married-couple families in Delaware County show that 7.3% or 626 of the total 8,596 families live below the poverty line. Families with 3 or 4 children have the highest poverty rate of 15.9%, comprising of 66 families. On the other hand, families with 5 or more children have the lowest poverty rate of 0.0%, which includes 0 families.
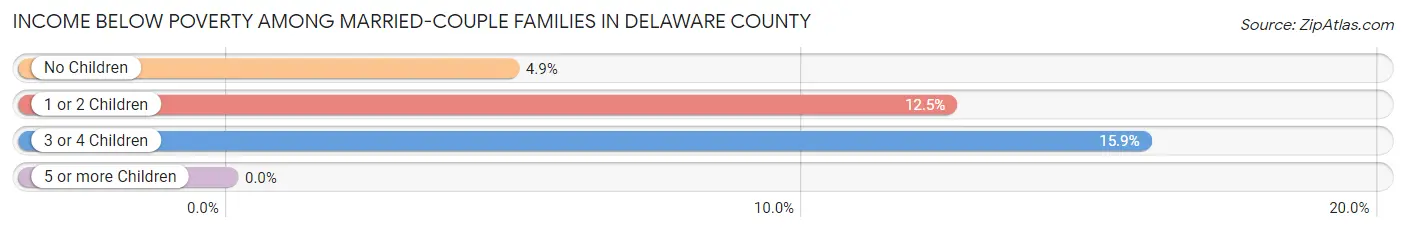
| Children | Above Poverty | Below Poverty |
| No Children | 5,624 (95.1%) | 289 (4.9%) |
| 1 or 2 Children | 1,893 (87.5%) | 271 (12.5%) |
| 3 or 4 Children | 349 (84.1%) | 66 (15.9%) |
| 5 or more Children | 104 (100.0%) | 0 (0.0%) |
| Total | 7,970 (92.7%) | 626 (7.3%) |
Income Below Poverty Among Single-Parent Households in Delaware County
According to the poverty data in Delaware County, 19.7% or 193 single-father households and 27.9% or 460 single-mother households are living below the poverty line. Among single-father households, those with 3 or 4 children have the highest poverty rate, with 32 households (46.4%) experiencing poverty. Likewise, among single-mother households, those with 3 or 4 children have the highest poverty rate, with 48 households (42.1%) falling below the poverty line.
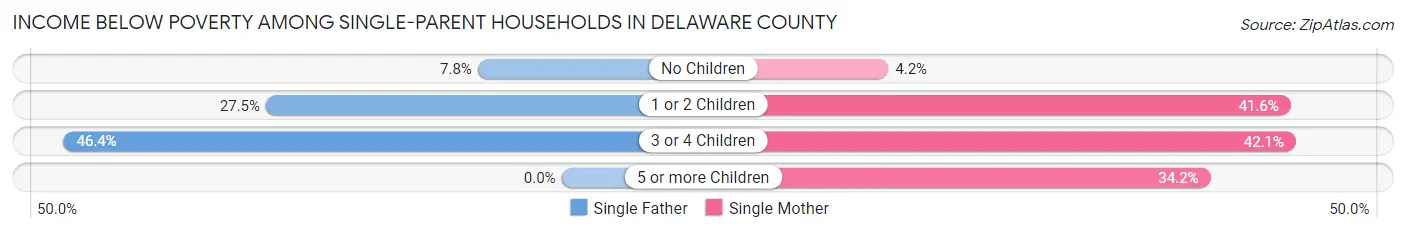
| Children | Single Father | Single Mother |
| No Children | 33 (7.8%) | 25 (4.2%) |
| 1 or 2 Children | 128 (27.5%) | 373 (41.6%) |
| 3 or 4 Children | 32 (46.4%) | 48 (42.1%) |
| 5 or more Children | 0 (0.0%) | 14 (34.2%) |
| Total | 193 (19.7%) | 460 (27.9%) |
Income Below Poverty Among Married-Couple vs Single-Parent Households in Delaware County
The poverty data for Delaware County shows that 626 of the married-couple family households (7.3%) and 653 of the single-parent households (24.8%) are living below the poverty level. Within the married-couple family households, those with 3 or 4 children have the highest poverty rate, with 66 households (15.9%) falling below the poverty line. Among the single-parent households, those with 3 or 4 children have the highest poverty rate, with 80 household (43.7%) living below poverty.
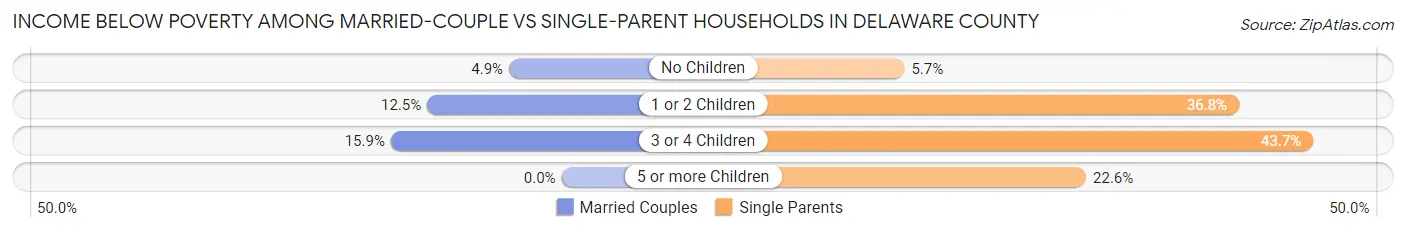
| Children | Married-Couple Families | Single-Parent Households |
| No Children | 289 (4.9%) | 58 (5.7%) |
| 1 or 2 Children | 271 (12.5%) | 501 (36.8%) |
| 3 or 4 Children | 66 (15.9%) | 80 (43.7%) |
| 5 or more Children | 0 (0.0%) | 14 (22.6%) |
| Total | 626 (7.3%) | 653 (24.8%) |
Race in Delaware County
The most populous races in Delaware County are White / Caucasian (41,231 | 92.4%), Hispanic or Latino (1,928 | 4.3%), and Two or more Races (1,844 | 4.1%).
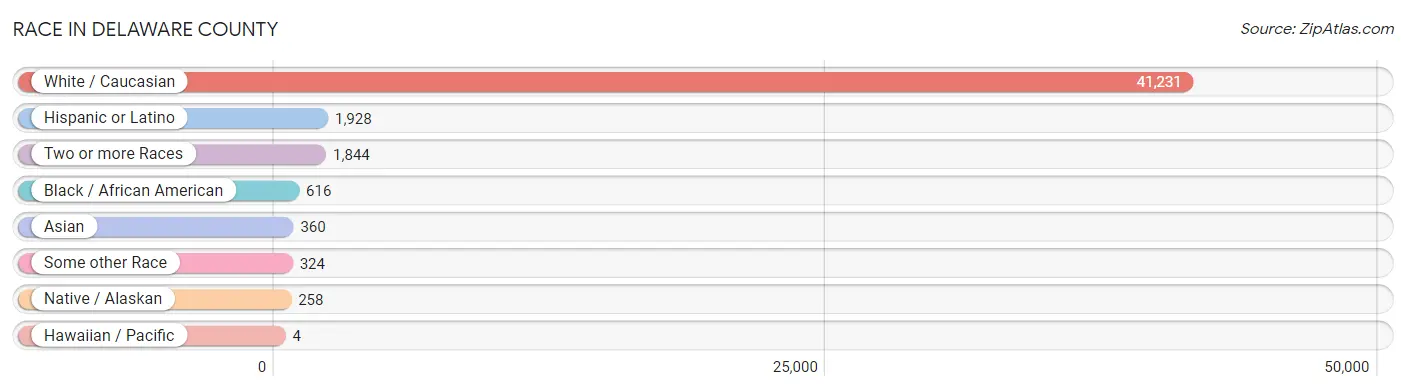
| Race | # Population | % Population |
| Asian | 360 | 0.8% |
| Black / African American | 616 | 1.4% |
| Hawaiian / Pacific | 4 | 0.0% |
| Hispanic or Latino | 1,928 | 4.3% |
| Native / Alaskan | 258 | 0.6% |
| White / Caucasian | 41,231 | 92.4% |
| Two or more Races | 1,844 | 4.1% |
| Some other Race | 324 | 0.7% |
| Total | 44,637 | 100.0% |
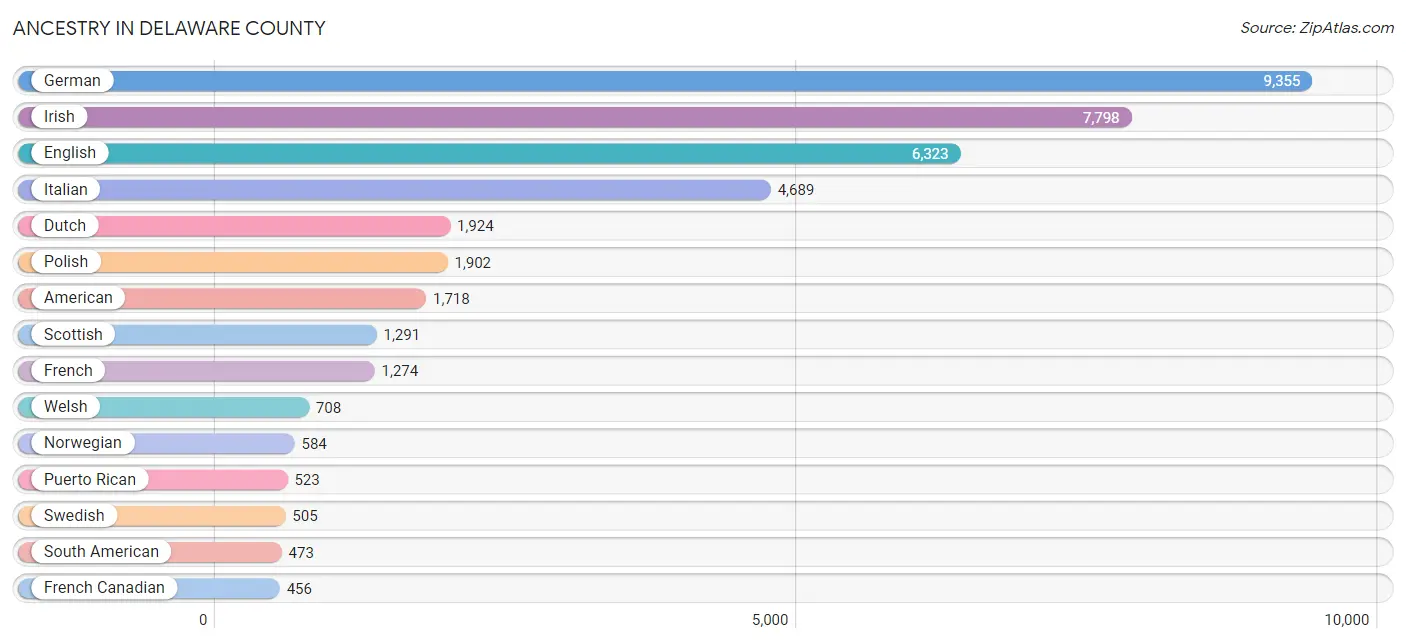
Ancestry in Delaware County
The most populous ancestries reported in Delaware County are German (9,355 | 21.0%), Irish (7,798 | 17.5%), English (6,323 | 14.2%), Italian (4,689 | 10.5%), and Dutch (1,924 | 4.3%), together accounting for 67.4% of all Delaware County residents.
| Ancestry | # Population | % Population |
| African | 8 | 0.0% |
| American | 1,718 | 3.8% |
| Apache | 3 | 0.0% |
| Arab | 99 | 0.2% |
| Argentinean | 58 | 0.1% |
| Armenian | 46 | 0.1% |
| Australian | 5 | 0.0% |
| Austrian | 183 | 0.4% |
| Barbadian | 15 | 0.0% |
| Belgian | 132 | 0.3% |
| Bhutanese | 102 | 0.2% |
| Blackfeet | 9 | 0.0% |
| Brazilian | 2 | 0.0% |
| British | 257 | 0.6% |
| British West Indian | 1 | 0.0% |
| Bulgarian | 3 | 0.0% |
| Burmese | 55 | 0.1% |
| Cambodian | 30 | 0.1% |
| Canadian | 98 | 0.2% |
| Celtic | 4 | 0.0% |
| Central American | 104 | 0.2% |
| Central American Indian | 48 | 0.1% |
| Cherokee | 44 | 0.1% |
| Cheyenne | 8 | 0.0% |
| Chilean | 10 | 0.0% |
| Chippewa | 1 | 0.0% |
| Choctaw | 3 | 0.0% |
| Colombian | 93 | 0.2% |
| Costa Rican | 6 | 0.0% |
| Croatian | 52 | 0.1% |
| Cuban | 46 | 0.1% |
| Czech | 198 | 0.4% |
| Czechoslovakian | 37 | 0.1% |
| Danish | 192 | 0.4% |
| Dominican | 74 | 0.2% |
| Dutch | 1,924 | 4.3% |
| Eastern European | 146 | 0.3% |
| Ecuadorian | 56 | 0.1% |
| Egyptian | 3 | 0.0% |
| English | 6,323 | 14.2% |
| Estonian | 9 | 0.0% |
| Ethiopian | 4 | 0.0% |
| European | 439 | 1.0% |
| Filipino | 54 | 0.1% |
| Finnish | 60 | 0.1% |
| French | 1,274 | 2.9% |
| French American Indian | 1 | 0.0% |
| French Canadian | 456 | 1.0% |
| German | 9,355 | 21.0% |
| Greek | 234 | 0.5% |
| Guatemalan | 65 | 0.2% |
| Guyanese | 43 | 0.1% |
| Haitian | 21 | 0.1% |
| Honduran | 5 | 0.0% |
| Hungarian | 454 | 1.0% |
| Indian (Asian) | 205 | 0.5% |
| Indonesian | 25 | 0.1% |
| Iranian | 12 | 0.0% |
| Irish | 7,798 | 17.5% |
| Iroquois | 18 | 0.0% |
| Israeli | 21 | 0.1% |
| Italian | 4,689 | 10.5% |
| Jamaican | 97 | 0.2% |
| Korean | 81 | 0.2% |
| Laotian | 6 | 0.0% |
| Latvian | 33 | 0.1% |
| Lebanese | 19 | 0.0% |
| Lithuanian | 180 | 0.4% |
| Luxembourger | 1 | 0.0% |
| Macedonian | 6 | 0.0% |
| Maltese | 10 | 0.0% |
| Mexican | 404 | 0.9% |
| Mexican American Indian | 213 | 0.5% |
| Mongolian | 11 | 0.0% |
| Moroccan | 5 | 0.0% |
| Navajo | 11 | 0.0% |
| Nicaraguan | 28 | 0.1% |
| Nigerian | 15 | 0.0% |
| Northern European | 77 | 0.2% |
| Norwegian | 584 | 1.3% |
| Palestinian | 6 | 0.0% |
| Pennsylvania German | 16 | 0.0% |
| Peruvian | 17 | 0.0% |
| Polish | 1,902 | 4.3% |
| Portuguese | 32 | 0.1% |
| Puerto Rican | 523 | 1.2% |
| Romanian | 44 | 0.1% |
| Russian | 365 | 0.8% |
| Samoan | 4 | 0.0% |
| Scandinavian | 115 | 0.3% |
| Scotch-Irish | 381 | 0.9% |
| Scottish | 1,291 | 2.9% |
| Slavic | 24 | 0.1% |
| Slovak | 112 | 0.3% |
| South African | 7 | 0.0% |
| South American | 473 | 1.1% |
| Spaniard | 183 | 0.4% |
| Spanish | 41 | 0.1% |
| Sri Lankan | 45 | 0.1% |
| Subsaharan African | 34 | 0.1% |
| Swedish | 505 | 1.1% |
| Swiss | 165 | 0.4% |
| Syrian | 8 | 0.0% |
| Thai | 93 | 0.2% |
| Trinidadian and Tobagonian | 9 | 0.0% |
| Turkish | 86 | 0.2% |
| Ukrainian | 119 | 0.3% |
| Uruguayan | 4 | 0.0% |
| Venezuelan | 235 | 0.5% |
| Vietnamese | 8 | 0.0% |
| Welsh | 708 | 1.6% |
| West Indian | 6 | 0.0% |
| Yugoslavian | 12 | 0.0% | View All 113 Rows |
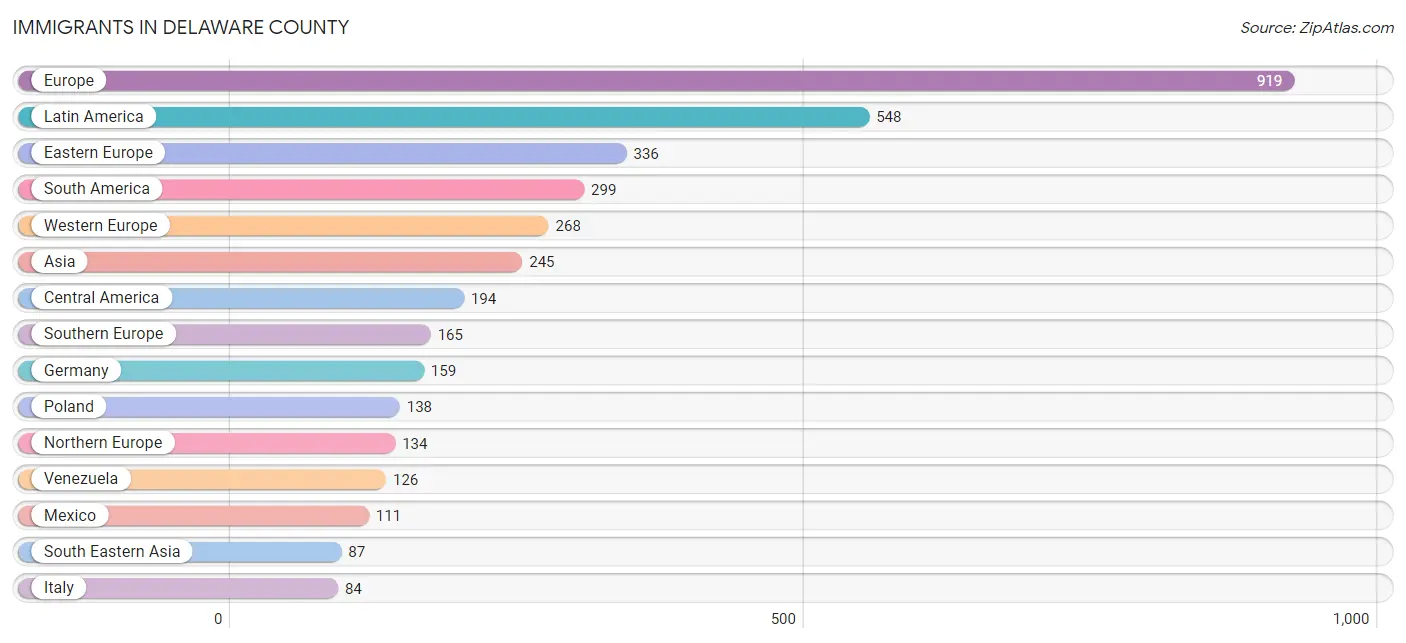
Immigrants in Delaware County
The most numerous immigrant groups reported in Delaware County came from Europe (919 | 2.1%), Latin America (548 | 1.2%), Eastern Europe (336 | 0.7%), South America (299 | 0.7%), and Western Europe (268 | 0.6%), together accounting for 5.3% of all Delaware County residents.
| Immigration Origin | # Population | % Population |
| Africa | 34 | 0.1% |
| Argentina | 11 | 0.0% |
| Asia | 245 | 0.5% |
| Australia | 5 | 0.0% |
| Austria | 14 | 0.0% |
| Bangladesh | 7 | 0.0% |
| Belarus | 45 | 0.1% |
| Belgium | 7 | 0.0% |
| Brazil | 6 | 0.0% |
| Bulgaria | 20 | 0.0% |
| Cambodia | 6 | 0.0% |
| Canada | 80 | 0.2% |
| Caribbean | 55 | 0.1% |
| Central America | 194 | 0.4% |
| China | 64 | 0.1% |
| Colombia | 59 | 0.1% |
| Czechoslovakia | 26 | 0.1% |
| Dominican Republic | 19 | 0.0% |
| Eastern Asia | 79 | 0.2% |
| Eastern Europe | 336 | 0.7% |
| Ecuador | 58 | 0.1% |
| England | 19 | 0.0% |
| Europe | 919 | 2.1% |
| France | 41 | 0.1% |
| Germany | 159 | 0.4% |
| Greece | 81 | 0.2% |
| Grenada | 1 | 0.0% |
| Guatemala | 50 | 0.1% |
| Guyana | 34 | 0.1% |
| Haiti | 21 | 0.1% |
| Honduras | 5 | 0.0% |
| Hungary | 14 | 0.0% |
| India | 53 | 0.1% |
| Indonesia | 6 | 0.0% |
| Iran | 9 | 0.0% |
| Ireland | 32 | 0.1% |
| Israel | 4 | 0.0% |
| Italy | 84 | 0.2% |
| Jamaica | 1 | 0.0% |
| Korea | 15 | 0.0% |
| Latin America | 548 | 1.2% |
| Lithuania | 4 | 0.0% |
| Mexico | 111 | 0.3% |
| Morocco | 5 | 0.0% |
| Netherlands | 18 | 0.0% |
| Nicaragua | 28 | 0.1% |
| Northern Africa | 5 | 0.0% |
| Northern Europe | 134 | 0.3% |
| Oceania | 21 | 0.1% |
| Peru | 5 | 0.0% |
| Philippines | 58 | 0.1% |
| Poland | 138 | 0.3% |
| Romania | 18 | 0.0% |
| Russia | 60 | 0.1% |
| Scotland | 20 | 0.0% |
| South Africa | 29 | 0.1% |
| South America | 299 | 0.7% |
| South Central Asia | 69 | 0.2% |
| South Eastern Asia | 87 | 0.2% |
| Southern Europe | 165 | 0.4% |
| Switzerland | 29 | 0.1% |
| Taiwan | 22 | 0.1% |
| Trinidad and Tobago | 13 | 0.0% |
| Ukraine | 2 | 0.0% |
| Venezuela | 126 | 0.3% |
| Vietnam | 4 | 0.0% |
| Western Asia | 10 | 0.0% |
| Western Europe | 268 | 0.6% | View All 68 Rows |
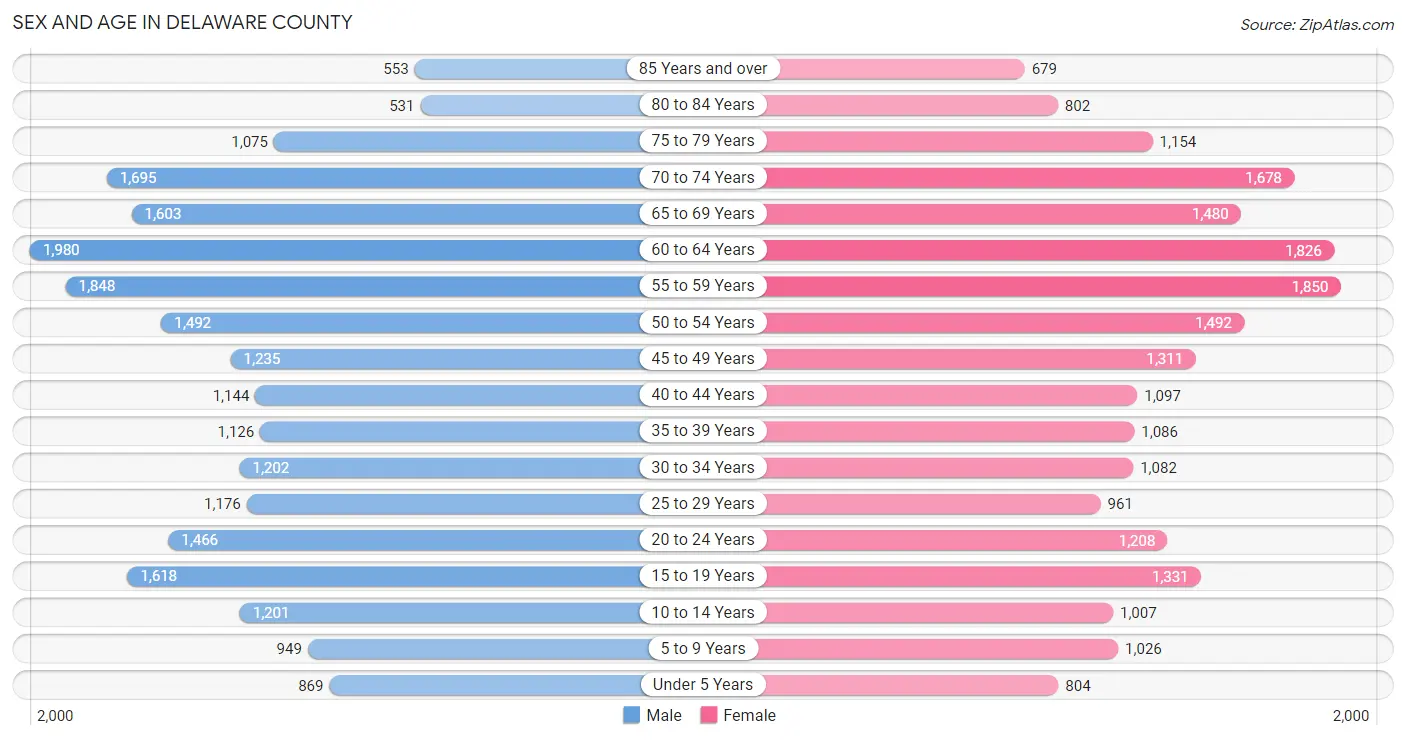
Sex and Age in Delaware County
Sex and Age in Delaware County
The most populous age groups in Delaware County are 60 to 64 Years (1,980 | 8.7%) for men and 55 to 59 Years (1,850 | 8.5%) for women.
| Age Bracket | Male | Female |
| Under 5 Years | 869 (3.8%) | 804 (3.7%) |
| 5 to 9 Years | 949 (4.2%) | 1,026 (4.7%) |
| 10 to 14 Years | 1,201 (5.3%) | 1,007 (4.6%) |
| 15 to 19 Years | 1,618 (7.1%) | 1,331 (6.1%) |
| 20 to 24 Years | 1,466 (6.4%) | 1,208 (5.5%) |
| 25 to 29 Years | 1,176 (5.2%) | 961 (4.4%) |
| 30 to 34 Years | 1,202 (5.3%) | 1,082 (5.0%) |
| 35 to 39 Years | 1,126 (5.0%) | 1,086 (5.0%) |
| 40 to 44 Years | 1,144 (5.0%) | 1,097 (5.0%) |
| 45 to 49 Years | 1,235 (5.4%) | 1,311 (6.0%) |
| 50 to 54 Years | 1,492 (6.6%) | 1,492 (6.8%) |
| 55 to 59 Years | 1,848 (8.1%) | 1,850 (8.5%) |
| 60 to 64 Years | 1,980 (8.7%) | 1,826 (8.4%) |
| 65 to 69 Years | 1,603 (7.0%) | 1,480 (6.8%) |
| 70 to 74 Years | 1,695 (7.4%) | 1,678 (7.7%) |
| 75 to 79 Years | 1,075 (4.7%) | 1,154 (5.3%) |
| 80 to 84 Years | 531 (2.3%) | 802 (3.7%) |
| 85 Years and over | 553 (2.4%) | 679 (3.1%) |
| Total | 22,763 (100.0%) | 21,874 (100.0%) |
Families and Households in Delaware County
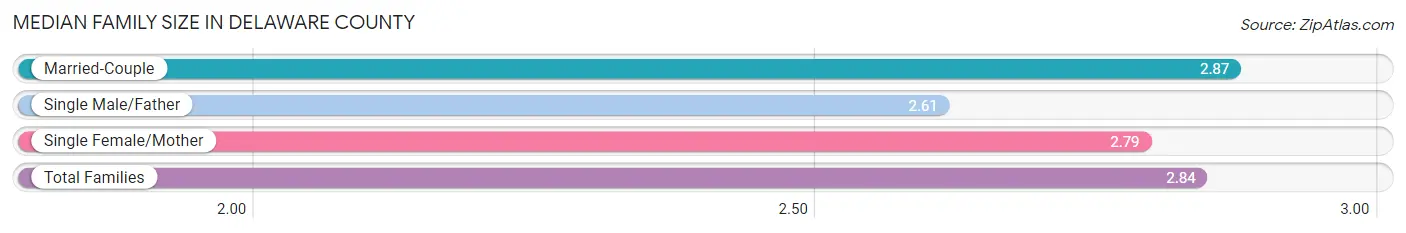
Median Family Size in Delaware County
The median family size in Delaware County is 2.84 persons per family, with married-couple families (8,596 | 76.6%) accounting for the largest median family size of 2.87 persons per family. On the other hand, single male/father families (978 | 8.7%) represent the smallest median family size with 2.61 persons per family.
| Family Type | # Families | Family Size |
| Married-Couple | 8,596 (76.6%) | 2.87 |
| Single Male/Father | 978 (8.7%) | 2.61 |
| Single Female/Mother | 1,652 (14.7%) | 2.79 |
| Total Families | 11,226 (100.0%) | 2.84 |
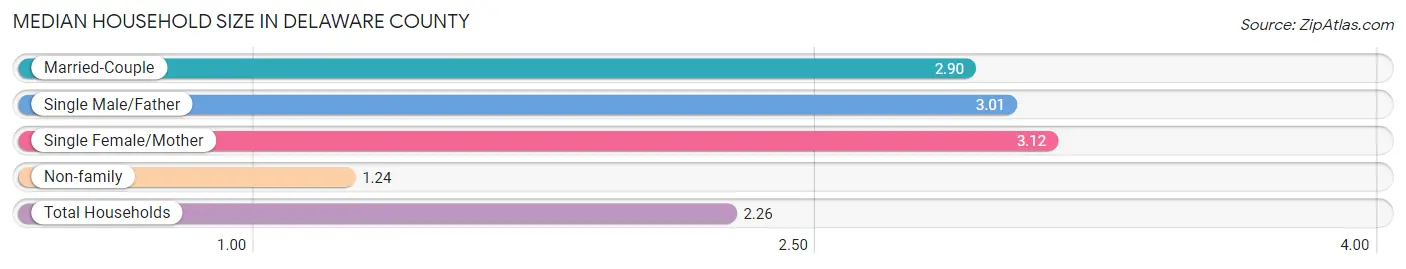
Median Household Size in Delaware County
The median household size in Delaware County is 2.26 persons per household, with single female/mother households (1,652 | 8.8%) accounting for the largest median household size of 3.12 persons per household. non-family households (7,554 | 40.2%) represent the smallest median household size with 1.24 persons per household.
| Household Type | # Households | Household Size |
| Married-Couple | 8,596 (45.8%) | 2.90 |
| Single Male/Father | 978 (5.2%) | 3.01 |
| Single Female/Mother | 1,652 (8.8%) | 3.12 |
| Non-family | 7,554 (40.2%) | 1.24 |
| Total Households | 18,780 (100.0%) | 2.26 |
Household Size by Marriage Status in Delaware County
Out of a total of 18,780 households in Delaware County, 11,226 (59.8%) are family households, while 7,554 (40.2%) are nonfamily households. The most numerous type of family households are 2-person households, comprising 6,076, and the most common type of nonfamily households are 1-person households, comprising 6,266.
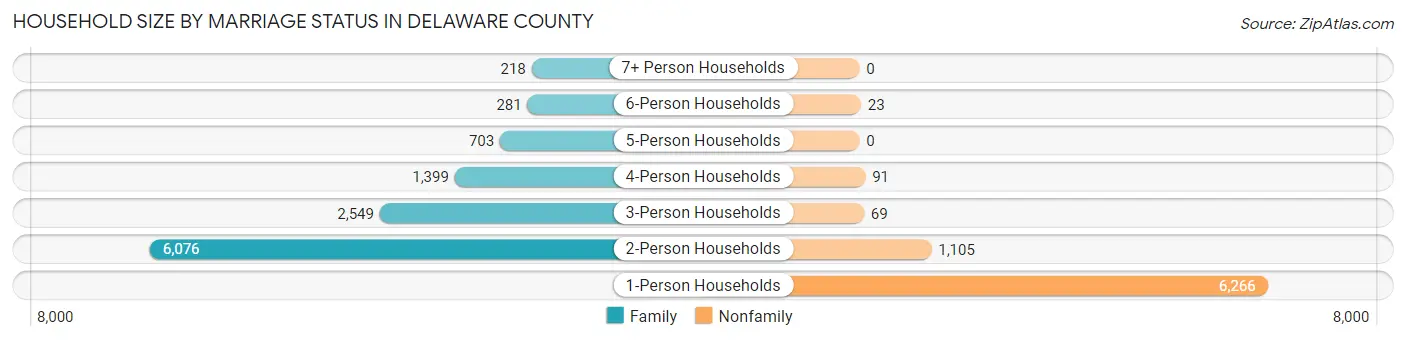
| Household Size | Family Households | Nonfamily Households |
| 1-Person Households | - | 6,266 (33.4%) |
| 2-Person Households | 6,076 (32.4%) | 1,105 (5.9%) |
| 3-Person Households | 2,549 (13.6%) | 69 (0.4%) |
| 4-Person Households | 1,399 (7.4%) | 91 (0.5%) |
| 5-Person Households | 703 (3.7%) | 0 (0.0%) |
| 6-Person Households | 281 (1.5%) | 23 (0.1%) |
| 7+ Person Households | 218 (1.2%) | 0 (0.0%) |
| Total | 11,226 (59.8%) | 7,554 (40.2%) |
Female Fertility in Delaware County
Fertility by Age in Delaware County
Average fertility rate in Delaware County is 69.0 births per 1,000 women. Women in the age bracket of 20 to 34 years have the highest fertility rate with 140.0 births per 1,000 women. Women in the age bracket of 20 to 34 years acount for 77.7% of all women with births.
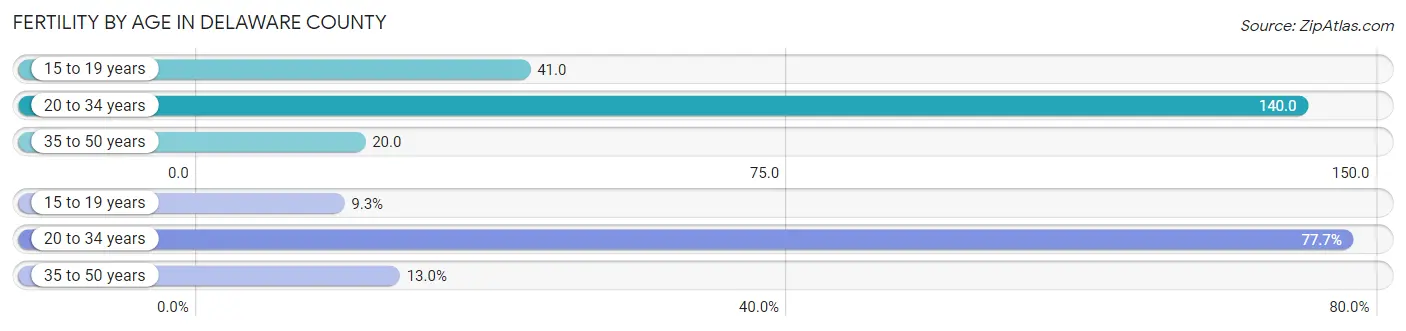
| Age Bracket | Women with Births | Births / 1,000 Women |
| 15 to 19 years | 54 (9.2%) | 41.0 |
| 20 to 34 years | 454 (77.7%) | 140.0 |
| 35 to 50 years | 76 (13.0%) | 20.0 |
| Total | 584 (100.0%) | 69.0 |
Fertility by Age by Marriage Status in Delaware County
68.2% of women with births (584) in Delaware County are married. The highest percentage of unmarried women with births falls into 15 to 19 years age bracket with 100.0% of them unmarried at the time of birth, while the lowest percentage of unmarried women with births belong to 20 to 34 years age bracket with 23.4% of them unmarried.
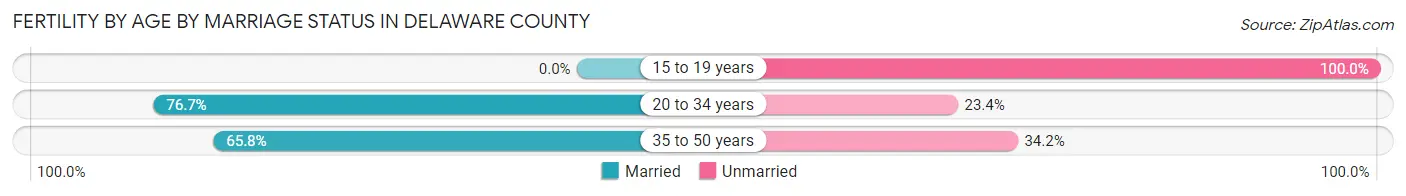
| Age Bracket | Married | Unmarried |
| 15 to 19 years | 0 (0.0%) | 54 (100.0%) |
| 20 to 34 years | 348 (76.6%) | 106 (23.4%) |
| 35 to 50 years | 50 (65.8%) | 26 (34.2%) |
| Total | 398 (68.1%) | 186 (31.9%) |
Fertility by Education in Delaware County
Average fertility rate in Delaware County is 69.0 births per 1,000 women. Women with the education attainment of high school diploma have the highest fertility rate of 118.0 births per 1,000 women, while women with the education attainment of bachelor's degree have the lowest fertility at 25.0 births per 1,000 women. Women with the education attainment of high school diploma represent 56.3% of all women with births.
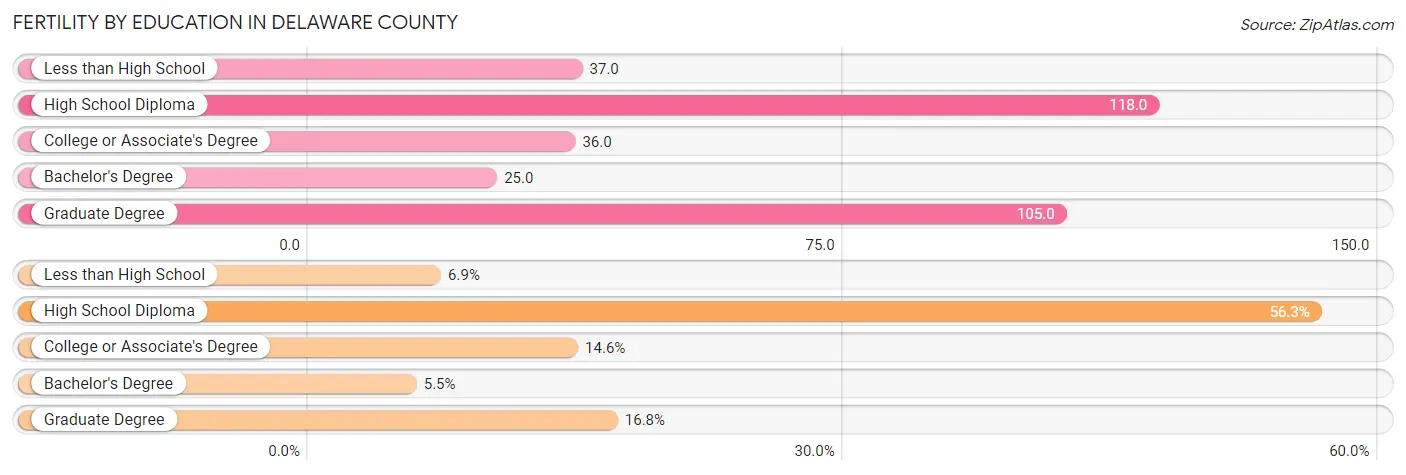
| Educational Attainment | Women with Births | Births / 1,000 Women |
| Less than High School | 40 (6.9%) | 37.0 |
| High School Diploma | 329 (56.3%) | 118.0 |
| College or Associate's Degree | 85 (14.5%) | 36.0 |
| Bachelor's Degree | 32 (5.5%) | 25.0 |
| Graduate Degree | 98 (16.8%) | 105.0 |
| Total | 584 (100.0%) | 69.0 |
Fertility by Education by Marriage Status in Delaware County
31.9% of women with births in Delaware County are unmarried. Women with the educational attainment of bachelor's degree are most likely to be married with 100.0% of them married at childbirth, while women with the educational attainment of less than high school are least likely to be married with 92.5% of them unmarried at childbirth.
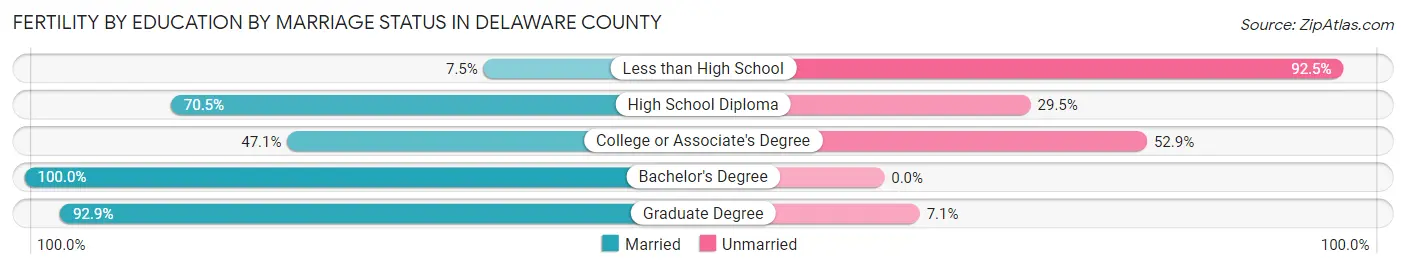
| Educational Attainment | Married | Unmarried |
| Less than High School | 3 (7.5%) | 37 (92.5%) |
| High School Diploma | 232 (70.5%) | 97 (29.5%) |
| College or Associate's Degree | 40 (47.1%) | 45 (52.9%) |
| Bachelor's Degree | 32 (100.0%) | 0 (0.0%) |
| Graduate Degree | 91 (92.9%) | 7 (7.1%) |
| Total | 398 (68.1%) | 186 (31.9%) |
Employment Characteristics in Delaware County
Employment by Class of Employer in Delaware County
Among the 18,859 employed individuals in Delaware County, private company employees (9,701 | 51.4%), local government employees (2,325 | 12.3%), and not-for-profit organizations (2,249 | 11.9%) make up the most common classes of employment.
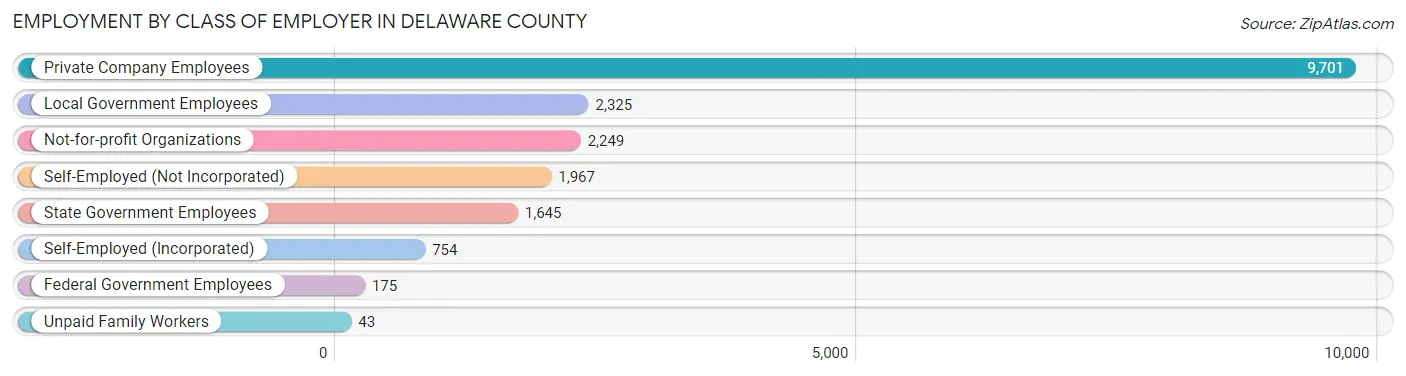
| Employer Class | # Employees | % Employees |
| Private Company Employees | 9,701 | 51.4% |
| Self-Employed (Incorporated) | 754 | 4.0% |
| Self-Employed (Not Incorporated) | 1,967 | 10.4% |
| Not-for-profit Organizations | 2,249 | 11.9% |
| Local Government Employees | 2,325 | 12.3% |
| State Government Employees | 1,645 | 8.7% |
| Federal Government Employees | 175 | 0.9% |
| Unpaid Family Workers | 43 | 0.2% |
| Total | 18,859 | 100.0% |
Employment Status by Age in Delaware County
According to the labor force statistics for Delaware County, out of the total population over 16 years of age (38,334), 53.5% or 20,509 individuals are in the labor force, with 6.1% or 1,251 of them unemployed. The age group with the highest labor force participation rate is 25 to 29 years, with 86.5% or 1,849 individuals in the labor force. Within the labor force, the 20 to 24 years age range has the highest percentage of unemployed individuals, with 12.0% or 205 of them being unemployed.
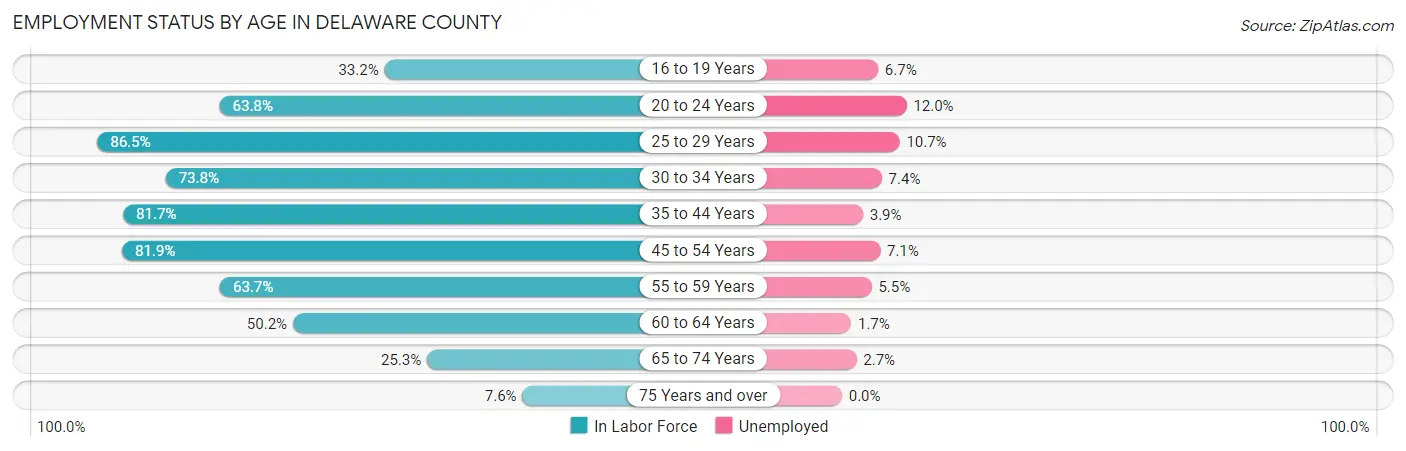
| Age Bracket | In Labor Force | Unemployed |
| 16 to 19 Years | 831 (33.2%) | 56 (6.7%) |
| 20 to 24 Years | 1,706 (63.8%) | 205 (12.0%) |
| 25 to 29 Years | 1,849 (86.5%) | 198 (10.7%) |
| 30 to 34 Years | 1,686 (73.8%) | 125 (7.4%) |
| 35 to 44 Years | 3,638 (81.7%) | 142 (3.9%) |
| 45 to 54 Years | 4,529 (81.9%) | 322 (7.1%) |
| 55 to 59 Years | 2,356 (63.7%) | 130 (5.5%) |
| 60 to 64 Years | 1,911 (50.2%) | 32 (1.7%) |
| 65 to 74 Years | 1,633 (25.3%) | 44 (2.7%) |
| 75 Years and over | 364 (7.6%) | 0 (0.0%) |
| Total | 20,509 (53.5%) | 1,251 (6.1%) |
Employment Status by Educational Attainment in Delaware County
According to labor force statistics for Delaware County, 72.9% of individuals (15,971) out of the total population between 25 and 64 years of age (21,908) are in the labor force, with 5.9% or 942 of them being unemployed. The group with the highest labor force participation rate are those with the educational attainment of bachelor's degree or higher, with 82.1% or 4,564 individuals in the labor force. Within the labor force, individuals with high school diploma education have the highest percentage of unemployment, with 8.9% or 511 of them being unemployed.
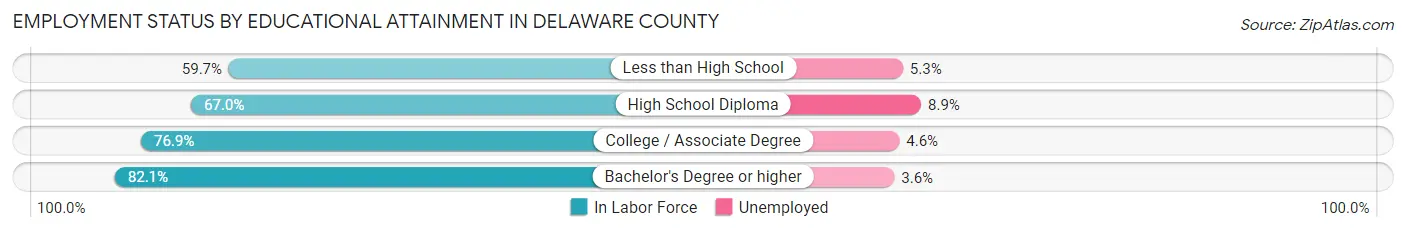
| Educational Attainment | In Labor Force | Unemployed |
| Less than High School | 1,104 (59.7%) | 98 (5.3%) |
| High School Diploma | 5,744 (67.0%) | 763 (8.9%) |
| College / Associate Degree | 4,557 (76.9%) | 273 (4.6%) |
| Bachelor's Degree or higher | 4,564 (82.1%) | 200 (3.6%) |
| Total | 15,971 (72.9%) | 1,293 (5.9%) |
Employment Occupations by Sex in Delaware County
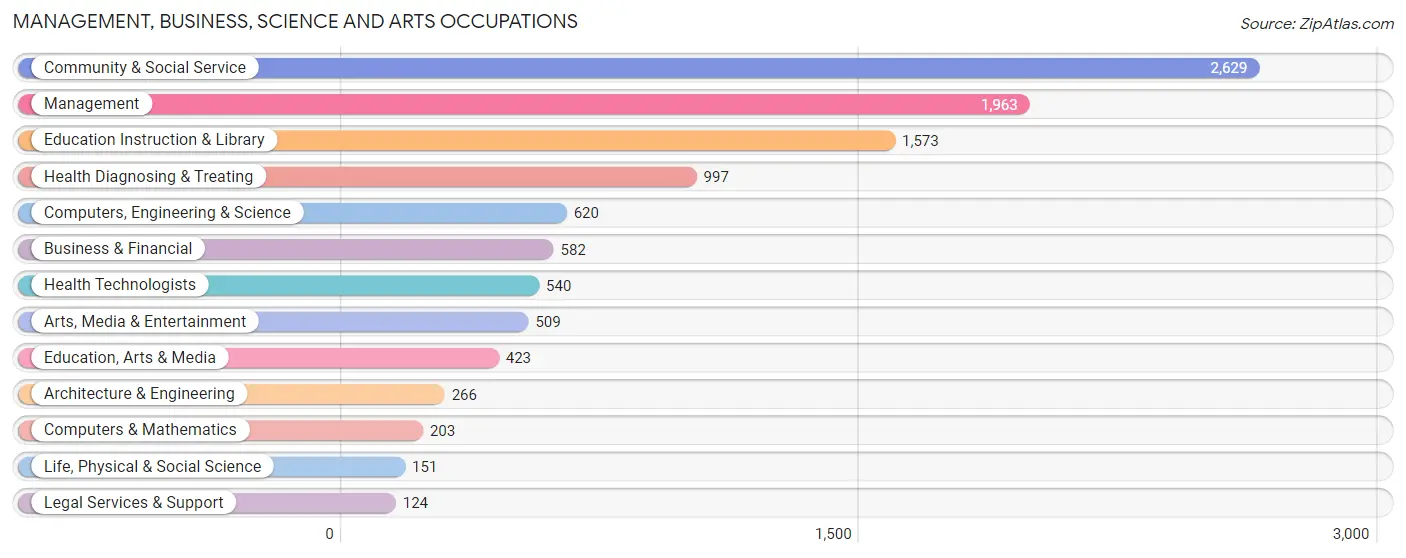
Management, Business, Science and Arts Occupations
The most common Management, Business, Science and Arts occupations in Delaware County are Community & Social Service (2,629 | 13.7%), Management (1,963 | 10.2%), Education Instruction & Library (1,573 | 8.2%), Health Diagnosing & Treating (997 | 5.2%), and Computers, Engineering & Science (620 | 3.2%).
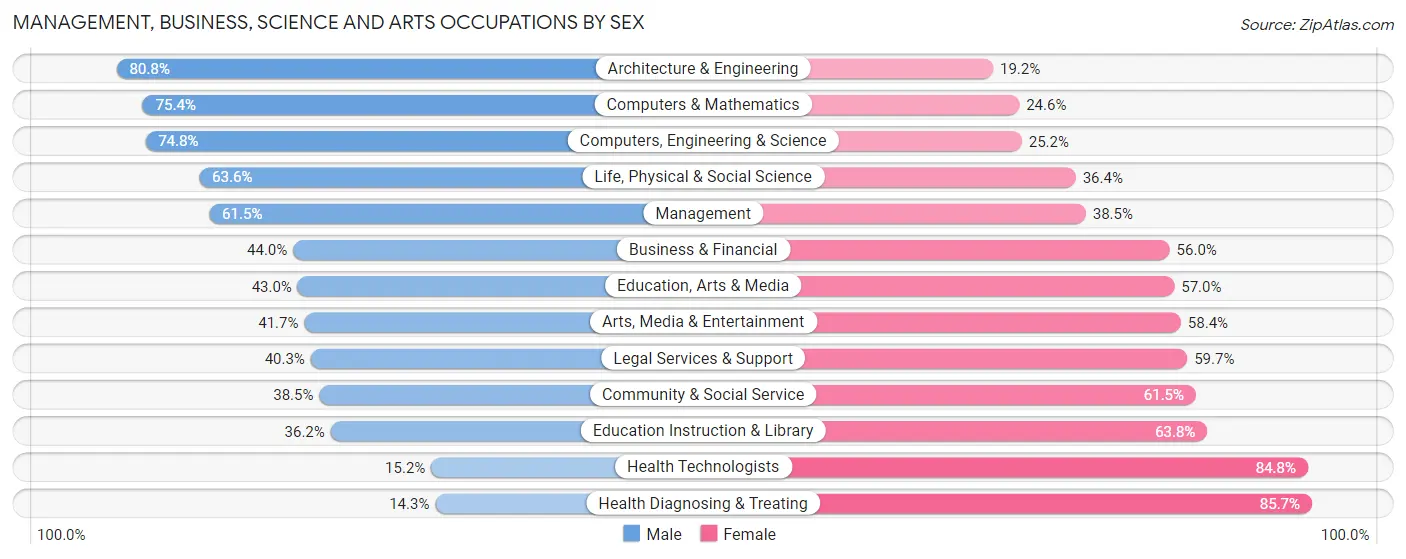
Management, Business, Science and Arts Occupations by Sex
Within the Management, Business, Science and Arts occupations in Delaware County, the most male-oriented occupations are Architecture & Engineering (80.8%), Computers & Mathematics (75.4%), and Computers, Engineering & Science (74.8%), while the most female-oriented occupations are Health Diagnosing & Treating (85.7%), Health Technologists (84.8%), and Education Instruction & Library (63.8%).
| Occupation | Male | Female |
| Management | 1,207 (61.5%) | 756 (38.5%) |
| Business & Financial | 256 (44.0%) | 326 (56.0%) |
| Computers, Engineering & Science | 464 (74.8%) | 156 (25.2%) |
| Computers & Mathematics | 153 (75.4%) | 50 (24.6%) |
| Architecture & Engineering | 215 (80.8%) | 51 (19.2%) |
| Life, Physical & Social Science | 96 (63.6%) | 55 (36.4%) |
| Community & Social Service | 1,013 (38.5%) | 1,616 (61.5%) |
| Education, Arts & Media | 182 (43.0%) | 241 (57.0%) |
| Legal Services & Support | 50 (40.3%) | 74 (59.7%) |
| Education Instruction & Library | 569 (36.2%) | 1,004 (63.8%) |
| Arts, Media & Entertainment | 212 (41.6%) | 297 (58.4%) |
| Health Diagnosing & Treating | 143 (14.3%) | 854 (85.7%) |
| Health Technologists | 82 (15.2%) | 458 (84.8%) |
| Total (Category) | 3,083 (45.4%) | 3,708 (54.6%) |
| Total (Overall) | 10,231 (53.2%) | 9,016 (46.8%) |
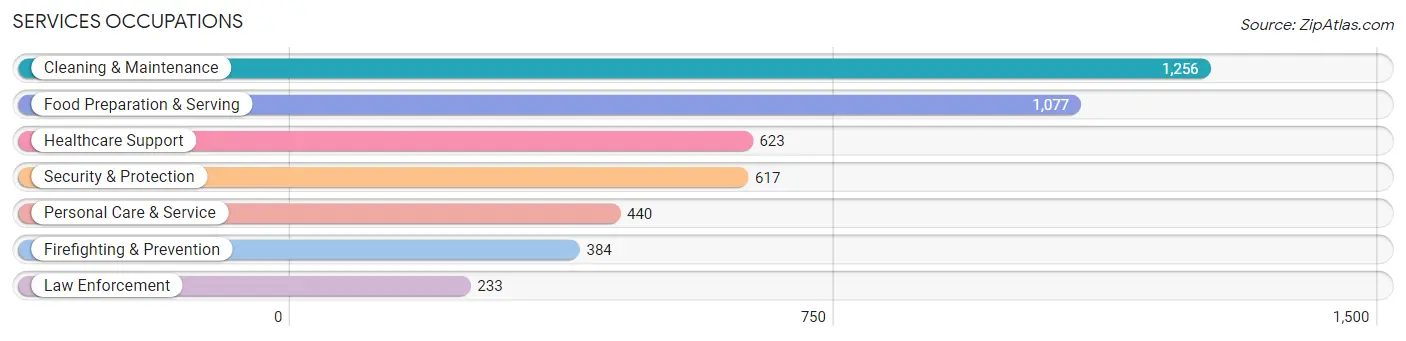
Services Occupations
The most common Services occupations in Delaware County are Cleaning & Maintenance (1,256 | 6.5%), Food Preparation & Serving (1,077 | 5.6%), Healthcare Support (623 | 3.2%), Security & Protection (617 | 3.2%), and Personal Care & Service (440 | 2.3%).
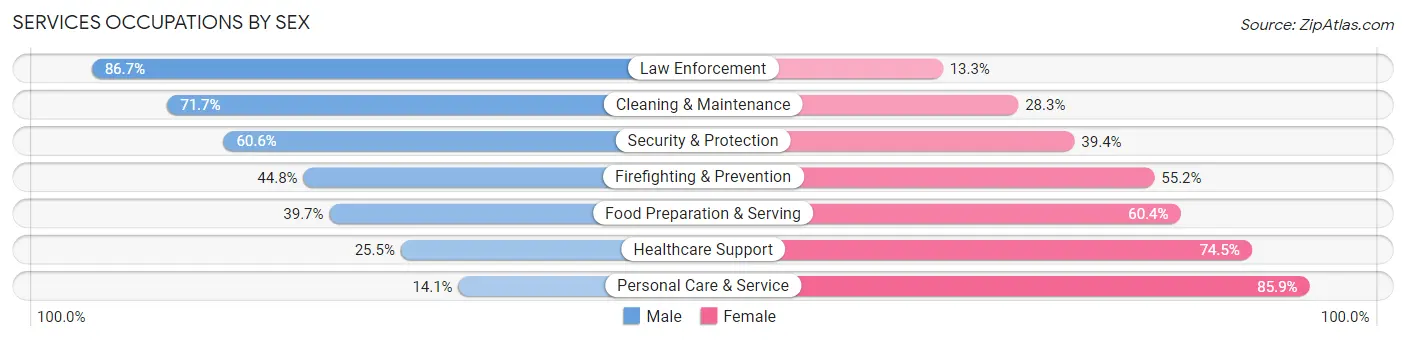
Services Occupations by Sex
Within the Services occupations in Delaware County, the most male-oriented occupations are Law Enforcement (86.7%), Cleaning & Maintenance (71.7%), and Security & Protection (60.6%), while the most female-oriented occupations are Personal Care & Service (85.9%), Healthcare Support (74.5%), and Food Preparation & Serving (60.4%).
| Occupation | Male | Female |
| Healthcare Support | 159 (25.5%) | 464 (74.5%) |
| Security & Protection | 374 (60.6%) | 243 (39.4%) |
| Firefighting & Prevention | 172 (44.8%) | 212 (55.2%) |
| Law Enforcement | 202 (86.7%) | 31 (13.3%) |
| Food Preparation & Serving | 427 (39.7%) | 650 (60.4%) |
| Cleaning & Maintenance | 901 (71.7%) | 355 (28.3%) |
| Personal Care & Service | 62 (14.1%) | 378 (85.9%) |
| Total (Category) | 1,923 (47.9%) | 2,090 (52.1%) |
| Total (Overall) | 10,231 (53.2%) | 9,016 (46.8%) |
Sales and Office Occupations
The most common Sales and Office occupations in Delaware County are Office & Administration (2,044 | 10.6%), and Sales & Related (1,549 | 8.1%).

Sales and Office Occupations by Sex
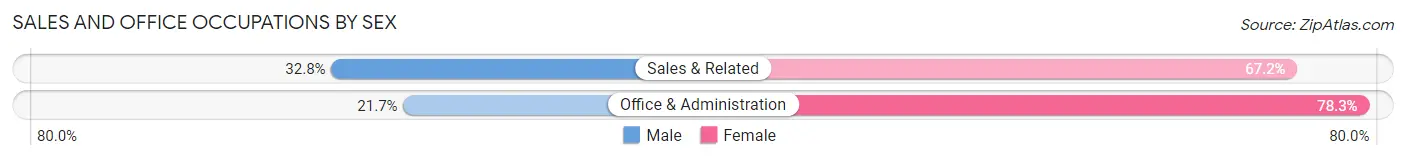
| Occupation | Male | Female |
| Sales & Related | 508 (32.8%) | 1,041 (67.2%) |
| Office & Administration | 444 (21.7%) | 1,600 (78.3%) |
| Total (Category) | 952 (26.5%) | 2,641 (73.5%) |
| Total (Overall) | 10,231 (53.2%) | 9,016 (46.8%) |
Natural Resources, Construction and Maintenance Occupations
The most common Natural Resources, Construction and Maintenance occupations in Delaware County are Construction & Extraction (1,228 | 6.4%), Installation, Maintenance & Repair (693 | 3.6%), and Farming, Fishing & Forestry (300 | 1.6%).

Natural Resources, Construction and Maintenance Occupations by Sex
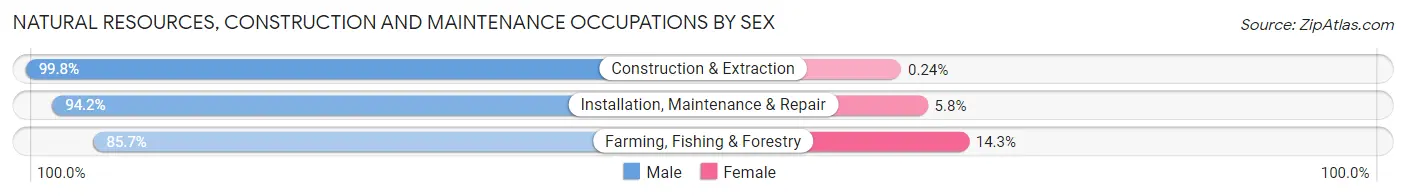
| Occupation | Male | Female |
| Farming, Fishing & Forestry | 257 (85.7%) | 43 (14.3%) |
| Construction & Extraction | 1,225 (99.8%) | 3 (0.2%) |
| Installation, Maintenance & Repair | 653 (94.2%) | 40 (5.8%) |
| Total (Category) | 2,135 (96.1%) | 86 (3.9%) |
| Total (Overall) | 10,231 (53.2%) | 9,016 (46.8%) |
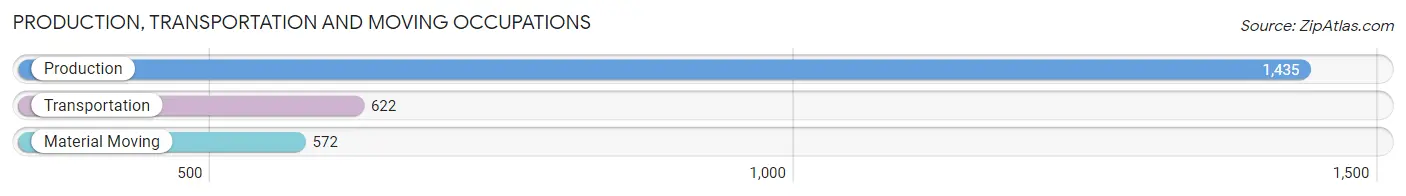
Production, Transportation and Moving Occupations
The most common Production, Transportation and Moving occupations in Delaware County are Production (1,435 | 7.5%), Transportation (622 | 3.2%), and Material Moving (572 | 3.0%).
Production, Transportation and Moving Occupations by Sex
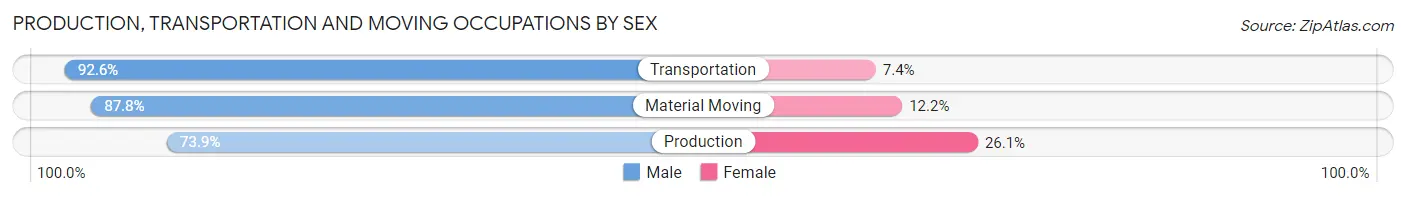
| Occupation | Male | Female |
| Production | 1,060 (73.9%) | 375 (26.1%) |
| Transportation | 576 (92.6%) | 46 (7.4%) |
| Material Moving | 502 (87.8%) | 70 (12.2%) |
| Total (Category) | 2,138 (81.3%) | 491 (18.7%) |
| Total (Overall) | 10,231 (53.2%) | 9,016 (46.8%) |
Employment Industries by Sex in Delaware County
Employment Industries in Delaware County
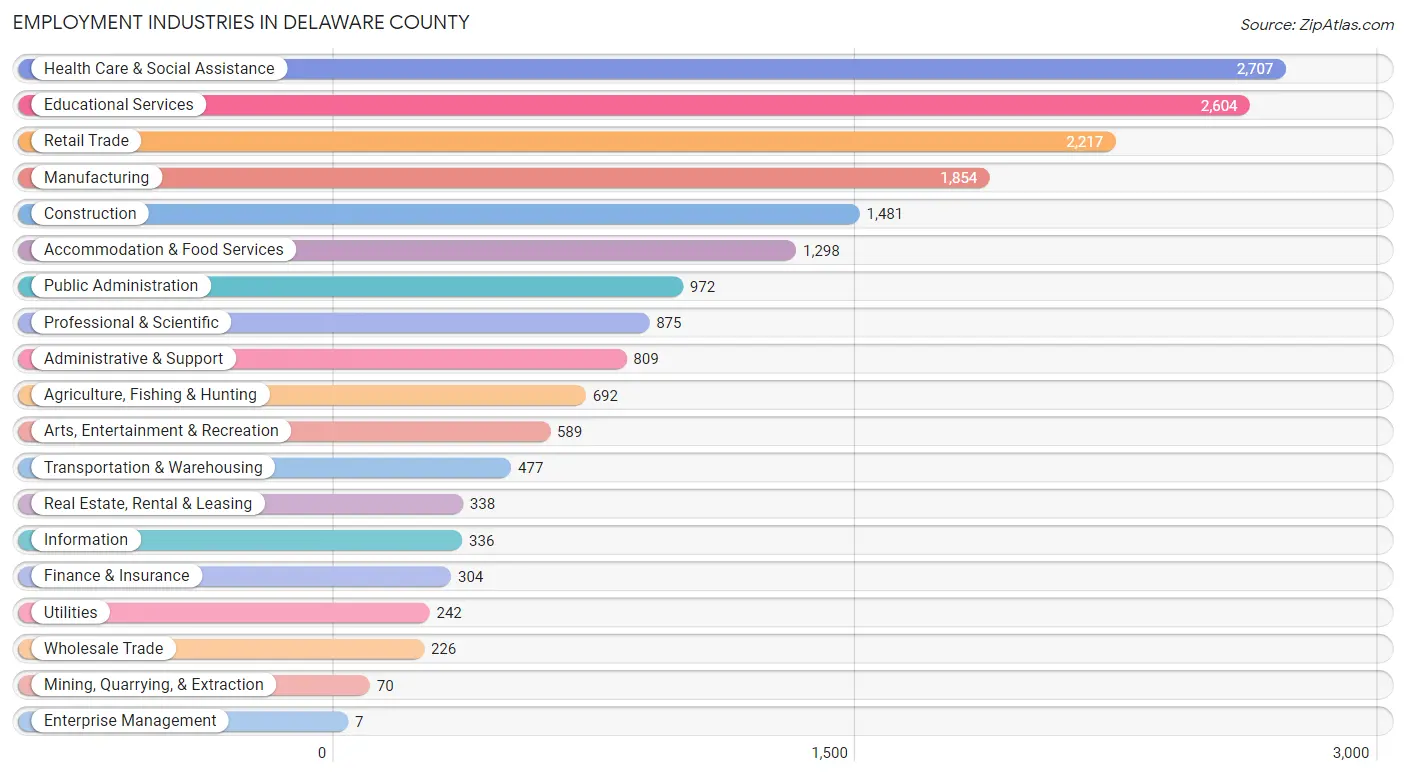
The major employment industries in Delaware County include Health Care & Social Assistance (2,707 | 14.1%), Educational Services (2,604 | 13.5%), Retail Trade (2,217 | 11.5%), Manufacturing (1,854 | 9.6%), and Construction (1,481 | 7.7%).
Employment Industries by Sex in Delaware County
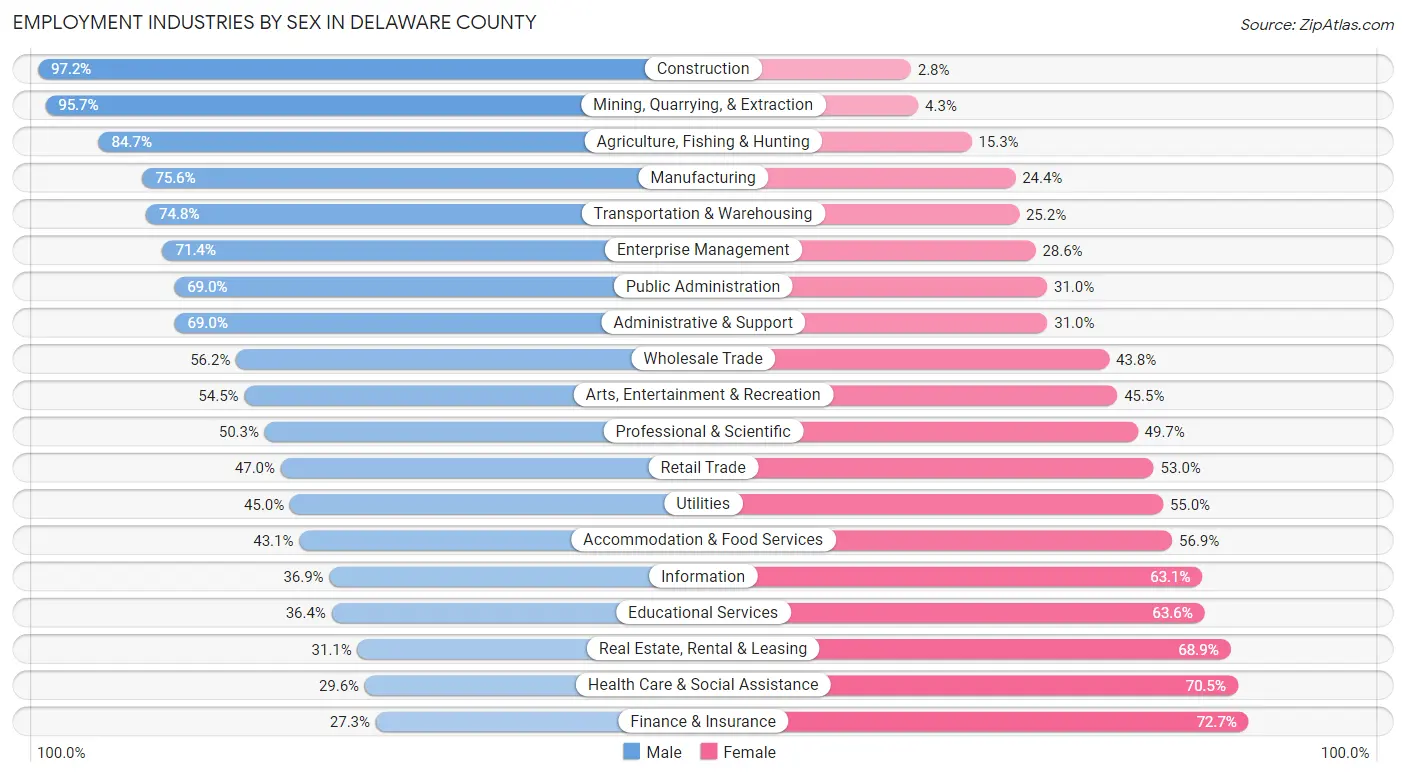
The Delaware County industries that see more men than women are Construction (97.2%), Mining, Quarrying, & Extraction (95.7%), and Agriculture, Fishing & Hunting (84.7%), whereas the industries that tend to have a higher number of women are Finance & Insurance (72.7%), Health Care & Social Assistance (70.5%), and Real Estate, Rental & Leasing (68.9%).
| Industry | Male | Female |
| Agriculture, Fishing & Hunting | 586 (84.7%) | 106 (15.3%) |
| Mining, Quarrying, & Extraction | 67 (95.7%) | 3 (4.3%) |
| Construction | 1,440 (97.2%) | 41 (2.8%) |
| Manufacturing | 1,402 (75.6%) | 452 (24.4%) |
| Wholesale Trade | 127 (56.2%) | 99 (43.8%) |
| Retail Trade | 1,041 (47.0%) | 1,176 (53.0%) |
| Transportation & Warehousing | 357 (74.8%) | 120 (25.2%) |
| Utilities | 109 (45.0%) | 133 (55.0%) |
| Information | 124 (36.9%) | 212 (63.1%) |
| Finance & Insurance | 83 (27.3%) | 221 (72.7%) |
| Real Estate, Rental & Leasing | 105 (31.1%) | 233 (68.9%) |
| Professional & Scientific | 440 (50.3%) | 435 (49.7%) |
| Enterprise Management | 5 (71.4%) | 2 (28.6%) |
| Administrative & Support | 558 (69.0%) | 251 (31.0%) |
| Educational Services | 949 (36.4%) | 1,655 (63.6%) |
| Health Care & Social Assistance | 800 (29.5%) | 1,907 (70.5%) |
| Arts, Entertainment & Recreation | 321 (54.5%) | 268 (45.5%) |
| Accommodation & Food Services | 560 (43.1%) | 738 (56.9%) |
| Public Administration | 671 (69.0%) | 301 (31.0%) |
| Total | 10,231 (53.2%) | 9,016 (46.8%) |
Education in Delaware County
School Enrollment in Delaware County
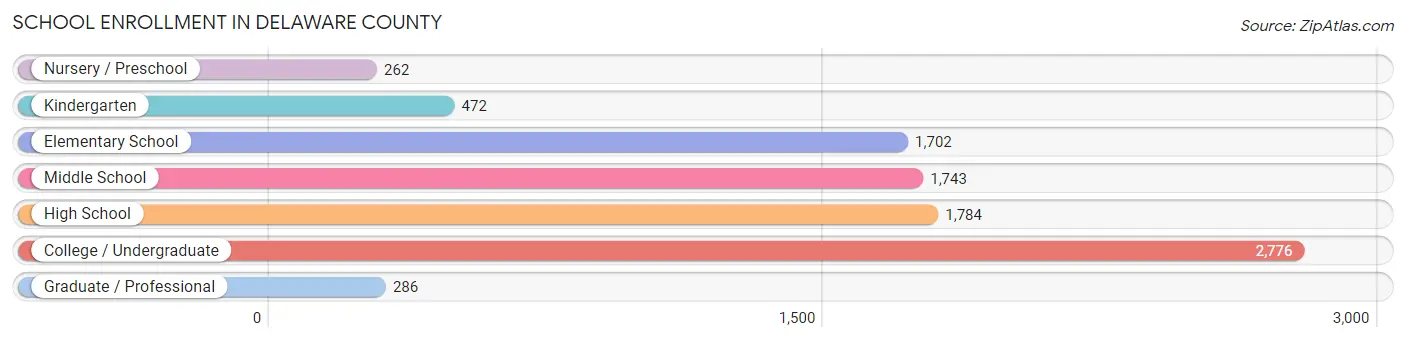
The most common levels of schooling among the 9,025 students in Delaware County are college / undergraduate (2,776 | 30.8%), high school (1,784 | 19.8%), and middle school (1,743 | 19.3%).
| School Level | # Students | % Students |
| Nursery / Preschool | 262 | 2.9% |
| Kindergarten | 472 | 5.2% |
| Elementary School | 1,702 | 18.9% |
| Middle School | 1,743 | 19.3% |
| High School | 1,784 | 19.8% |
| College / Undergraduate | 2,776 | 30.8% |
| Graduate / Professional | 286 | 3.2% |
| Total | 9,025 | 100.0% |
School Enrollment by Age by Funding Source in Delaware County
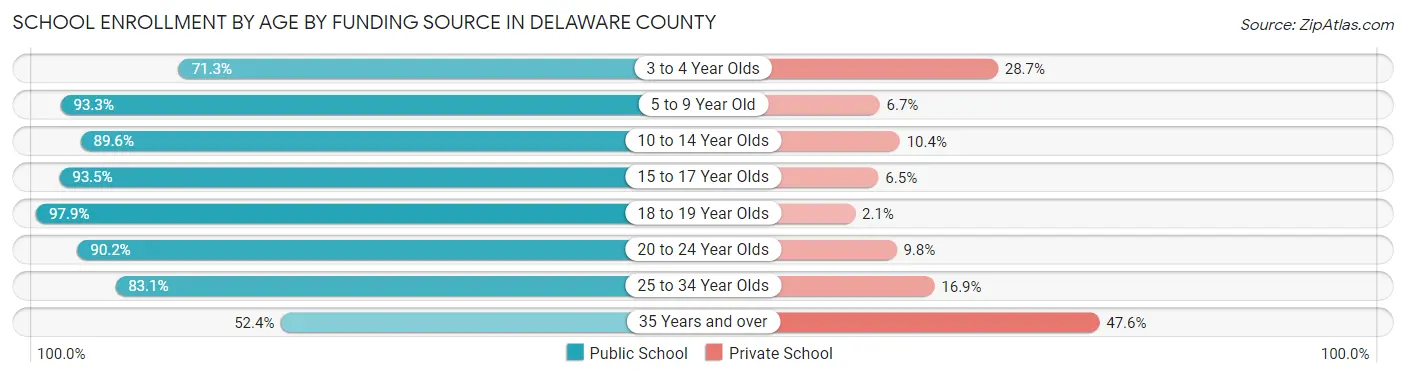
Out of a total of 9,025 students who are enrolled in schools in Delaware County, 912 (10.1%) attend a private institution, while the remaining 8,113 (89.9%) are enrolled in public schools. The age group of 35 years and over has the highest likelihood of being enrolled in private schools, with 179 (47.6% in the age bracket) enrolled. Conversely, the age group of 18 to 19 year olds has the lowest likelihood of being enrolled in a private school, with 1,284 (97.9% in the age bracket) attending a public institution.
| Age Bracket | Public School | Private School |
| 3 to 4 Year Olds | 221 (71.3%) | 89 (28.7%) |
| 5 to 9 Year Old | 1,814 (93.3%) | 130 (6.7%) |
| 10 to 14 Year Olds | 1,964 (89.6%) | 229 (10.4%) |
| 15 to 17 Year Olds | 1,244 (93.5%) | 86 (6.5%) |
| 18 to 19 Year Olds | 1,284 (97.9%) | 28 (2.1%) |
| 20 to 24 Year Olds | 1,209 (90.2%) | 132 (9.8%) |
| 25 to 34 Year Olds | 182 (83.1%) | 37 (16.9%) |
| 35 Years and over | 197 (52.4%) | 179 (47.6%) |
| Total | 8,113 (89.9%) | 912 (10.1%) |
Educational Attainment by Field of Study in Delaware County
Education (1,572 | 17.6%), business (961 | 10.7%), visual & performing arts (888 | 9.9%), science & technology (865 | 9.7%), and social sciences (802 | 9.0%) are the most common fields of study among 8,940 individuals in Delaware County who have obtained a bachelor's degree or higher.
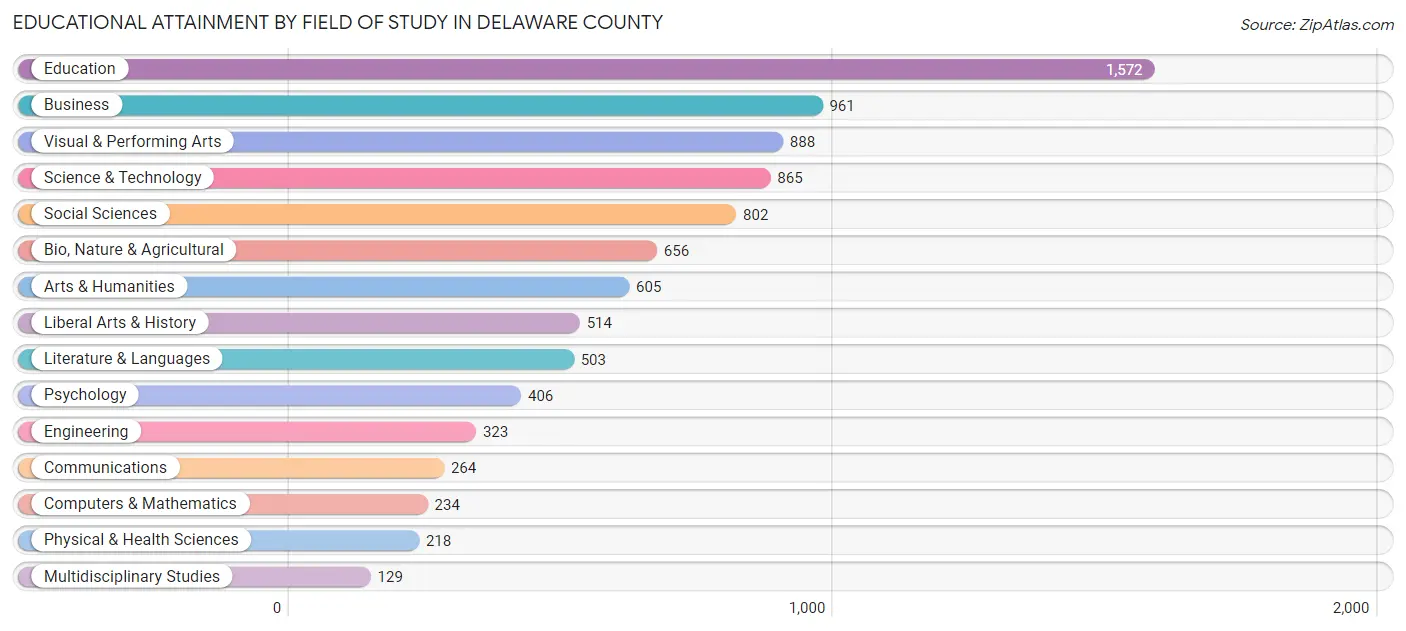
| Field of Study | # Graduates | % Graduates |
| Computers & Mathematics | 234 | 2.6% |
| Bio, Nature & Agricultural | 656 | 7.3% |
| Physical & Health Sciences | 218 | 2.4% |
| Psychology | 406 | 4.5% |
| Social Sciences | 802 | 9.0% |
| Engineering | 323 | 3.6% |
| Multidisciplinary Studies | 129 | 1.4% |
| Science & Technology | 865 | 9.7% |
| Business | 961 | 10.7% |
| Education | 1,572 | 17.6% |
| Literature & Languages | 503 | 5.6% |
| Liberal Arts & History | 514 | 5.8% |
| Visual & Performing Arts | 888 | 9.9% |
| Communications | 264 | 2.9% |
| Arts & Humanities | 605 | 6.8% |
| Total | 8,940 | 100.0% |
Transportation & Commute in Delaware County
Vehicle Availability by Sex in Delaware County
The most prevalent vehicle ownership categories in Delaware County are males with 2 vehicles (3,857, accounting for 39.3%) and females with 2 vehicles (3,560, making up 45.4%).
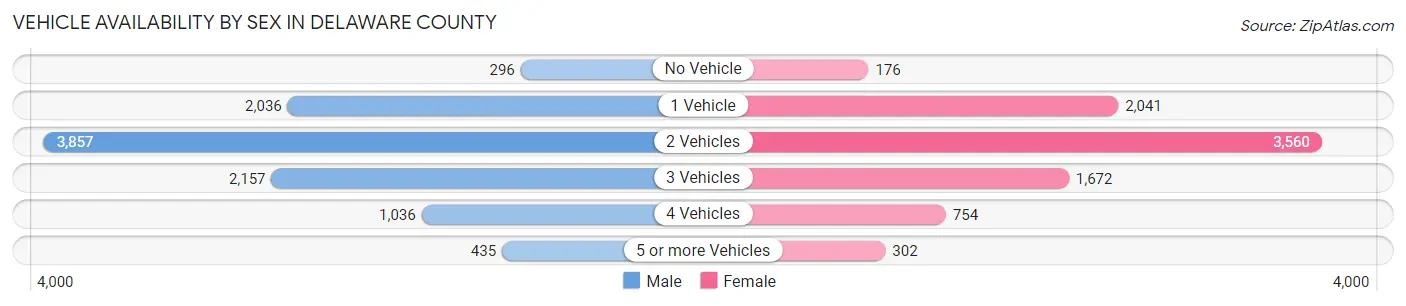
| Vehicles Available | Male | Female |
| No Vehicle | 296 (3.0%) | 176 (2.1%) |
| 1 Vehicle | 2,036 (20.7%) | 2,041 (24.0%) |
| 2 Vehicles | 3,857 (39.3%) | 3,560 (41.9%) |
| 3 Vehicles | 2,157 (22.0%) | 1,672 (19.7%) |
| 4 Vehicles | 1,036 (10.5%) | 754 (8.9%) |
| 5 or more Vehicles | 435 (4.4%) | 302 (3.5%) |
| Total | 9,817 (100.0%) | 8,505 (100.0%) |
Commute Time in Delaware County
The most frequently occuring commute durations in Delaware County are 5 to 9 minutes (2,665 commuters, 15.7%), 10 to 14 minutes (2,592 commuters, 15.3%), and 15 to 19 minutes (2,010 commuters, 11.9%).
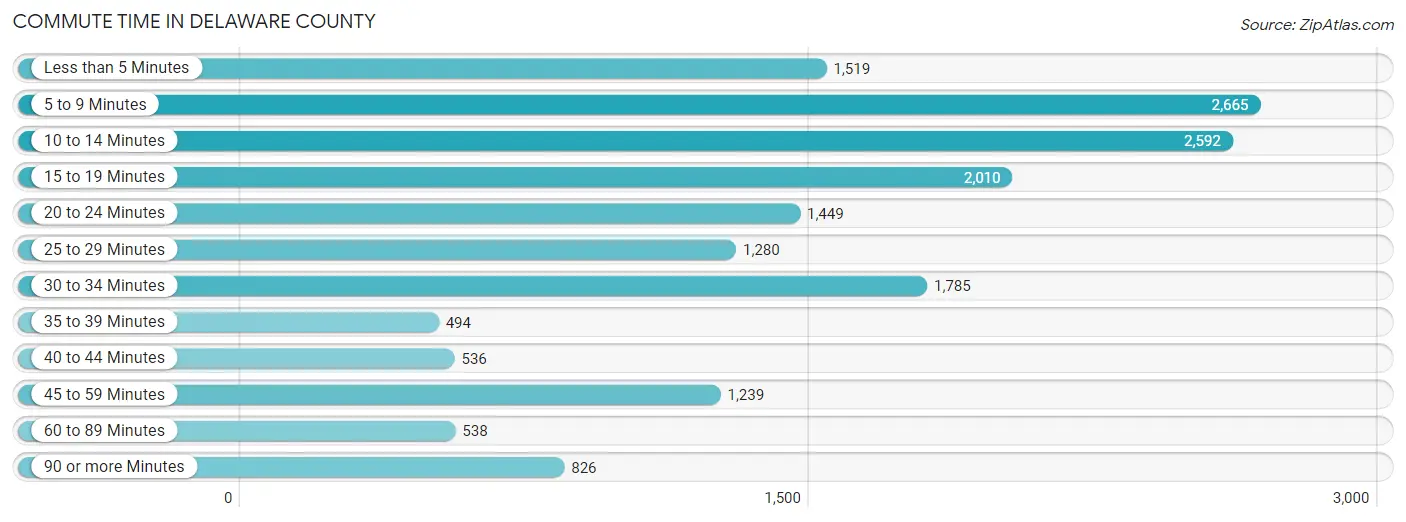
| Commute Time | # Commuters | % Commuters |
| Less than 5 Minutes | 1,519 | 9.0% |
| 5 to 9 Minutes | 2,665 | 15.7% |
| 10 to 14 Minutes | 2,592 | 15.3% |
| 15 to 19 Minutes | 2,010 | 11.9% |
| 20 to 24 Minutes | 1,449 | 8.6% |
| 25 to 29 Minutes | 1,280 | 7.6% |
| 30 to 34 Minutes | 1,785 | 10.5% |
| 35 to 39 Minutes | 494 | 2.9% |
| 40 to 44 Minutes | 536 | 3.2% |
| 45 to 59 Minutes | 1,239 | 7.3% |
| 60 to 89 Minutes | 538 | 3.2% |
| 90 or more Minutes | 826 | 4.9% |
Commute Time by Sex in Delaware County
The most common commute times in Delaware County are 5 to 9 minutes (1,406 commuters, 15.5%) for males and 10 to 14 minutes (1,269 commuters, 16.1%) for females.
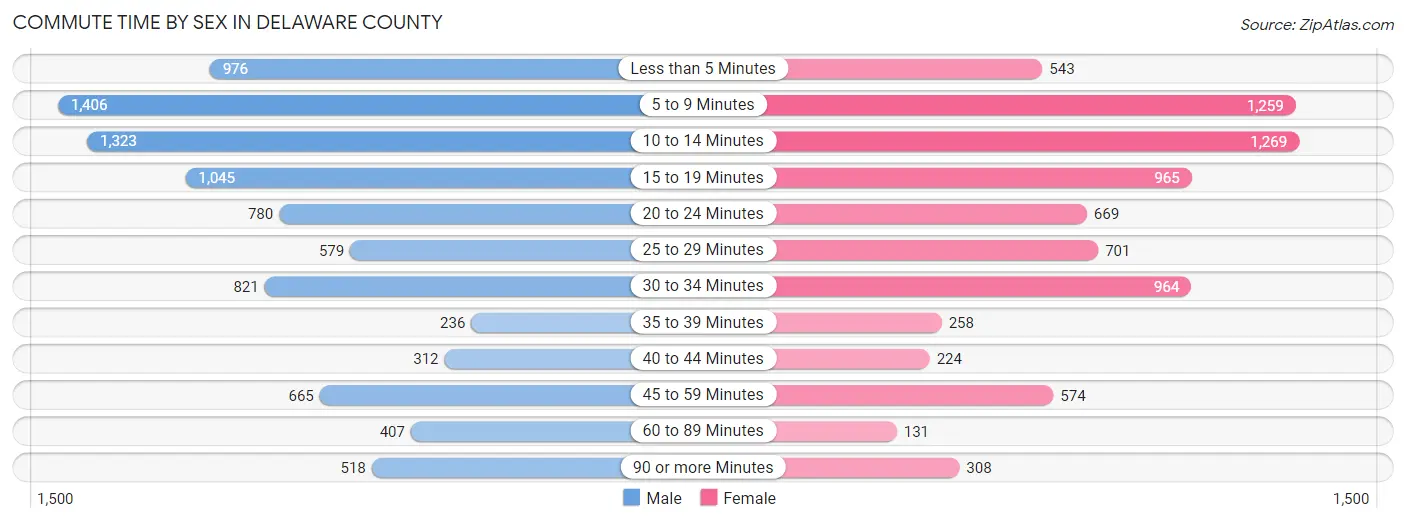
| Commute Time | Male | Female |
| Less than 5 Minutes | 976 (10.8%) | 543 (6.9%) |
| 5 to 9 Minutes | 1,406 (15.5%) | 1,259 (16.0%) |
| 10 to 14 Minutes | 1,323 (14.6%) | 1,269 (16.1%) |
| 15 to 19 Minutes | 1,045 (11.5%) | 965 (12.3%) |
| 20 to 24 Minutes | 780 (8.6%) | 669 (8.5%) |
| 25 to 29 Minutes | 579 (6.4%) | 701 (8.9%) |
| 30 to 34 Minutes | 821 (9.0%) | 964 (12.3%) |
| 35 to 39 Minutes | 236 (2.6%) | 258 (3.3%) |
| 40 to 44 Minutes | 312 (3.4%) | 224 (2.9%) |
| 45 to 59 Minutes | 665 (7.3%) | 574 (7.3%) |
| 60 to 89 Minutes | 407 (4.5%) | 131 (1.7%) |
| 90 or more Minutes | 518 (5.7%) | 308 (3.9%) |
Time of Departure to Work by Sex in Delaware County
The most frequent times of departure to work in Delaware County are 7:30 AM to 7:59 AM (1,117, 12.3%) for males and 7:30 AM to 7:59 AM (1,314, 16.7%) for females.
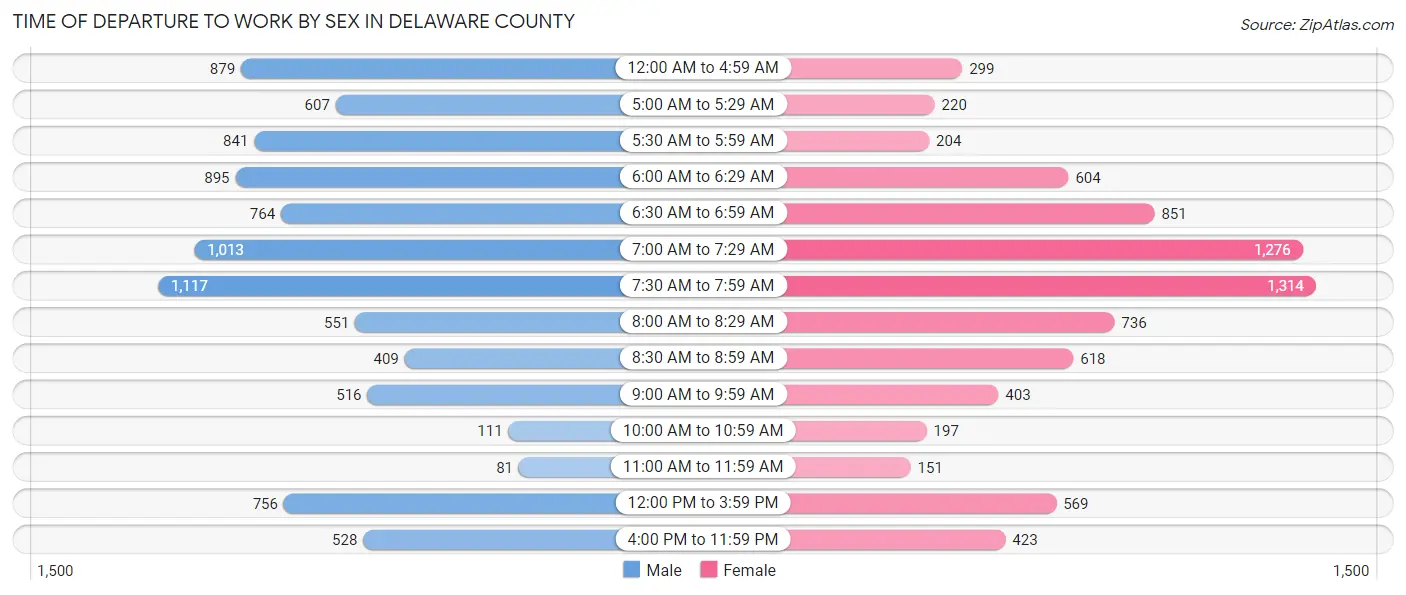
| Time of Departure | Male | Female |
| 12:00 AM to 4:59 AM | 879 (9.7%) | 299 (3.8%) |
| 5:00 AM to 5:29 AM | 607 (6.7%) | 220 (2.8%) |
| 5:30 AM to 5:59 AM | 841 (9.3%) | 204 (2.6%) |
| 6:00 AM to 6:29 AM | 895 (9.9%) | 604 (7.7%) |
| 6:30 AM to 6:59 AM | 764 (8.4%) | 851 (10.8%) |
| 7:00 AM to 7:29 AM | 1,013 (11.2%) | 1,276 (16.2%) |
| 7:30 AM to 7:59 AM | 1,117 (12.3%) | 1,314 (16.7%) |
| 8:00 AM to 8:29 AM | 551 (6.1%) | 736 (9.4%) |
| 8:30 AM to 8:59 AM | 409 (4.5%) | 618 (7.9%) |
| 9:00 AM to 9:59 AM | 516 (5.7%) | 403 (5.1%) |
| 10:00 AM to 10:59 AM | 111 (1.2%) | 197 (2.5%) |
| 11:00 AM to 11:59 AM | 81 (0.9%) | 151 (1.9%) |
| 12:00 PM to 3:59 PM | 756 (8.3%) | 569 (7.2%) |
| 4:00 PM to 11:59 PM | 528 (5.8%) | 423 (5.4%) |
| Total | 9,068 (100.0%) | 7,865 (100.0%) |
Housing Occupancy in Delaware County
Occupancy by Ownership in Delaware County
Of the total 18,780 dwellings in Delaware County, owner-occupied units account for 14,490 (77.2%), while renter-occupied units make up 4,290 (22.8%).
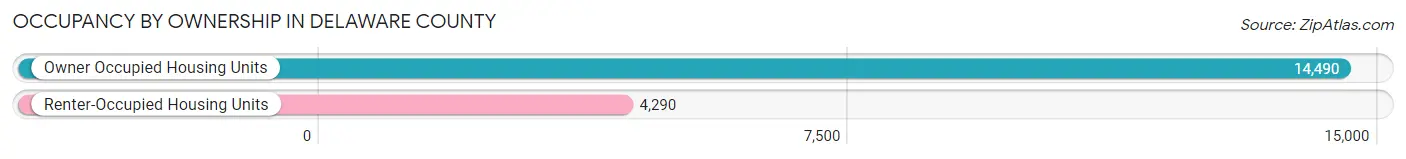
| Occupancy | # Housing Units | % Housing Units |
| Owner Occupied Housing Units | 14,490 | 77.2% |
| Renter-Occupied Housing Units | 4,290 | 22.8% |
| Total Occupied Housing Units | 18,780 | 100.0% |
Occupancy by Household Size in Delaware County
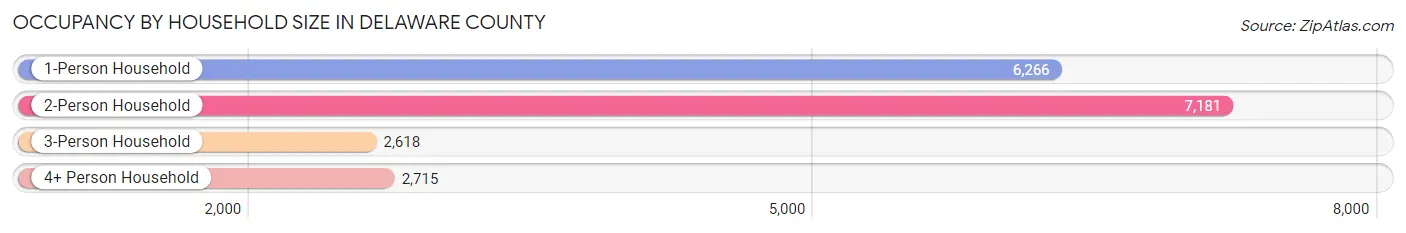
| Household Size | # Housing Units | % Housing Units |
| 1-Person Household | 6,266 | 33.4% |
| 2-Person Household | 7,181 | 38.2% |
| 3-Person Household | 2,618 | 13.9% |
| 4+ Person Household | 2,715 | 14.5% |
| Total Housing Units | 18,780 | 100.0% |
Occupancy by Ownership by Household Size in Delaware County
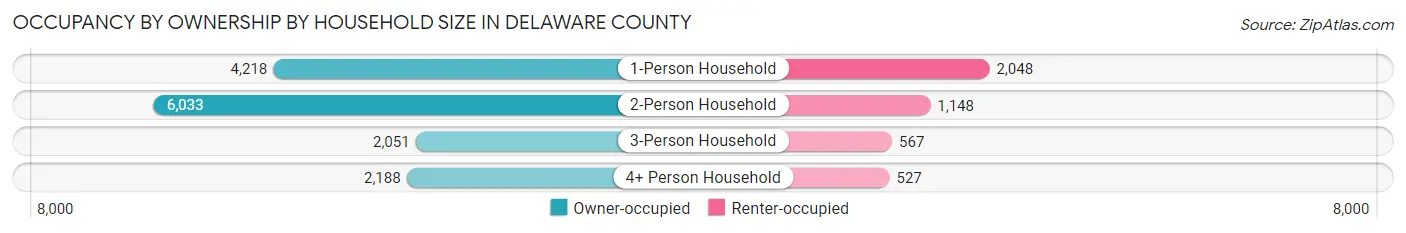
| Household Size | Owner-occupied | Renter-occupied |
| 1-Person Household | 4,218 (67.3%) | 2,048 (32.7%) |
| 2-Person Household | 6,033 (84.0%) | 1,148 (16.0%) |
| 3-Person Household | 2,051 (78.3%) | 567 (21.7%) |
| 4+ Person Household | 2,188 (80.6%) | 527 (19.4%) |
| Total Housing Units | 14,490 (77.2%) | 4,290 (22.8%) |
Occupancy by Educational Attainment in Delaware County
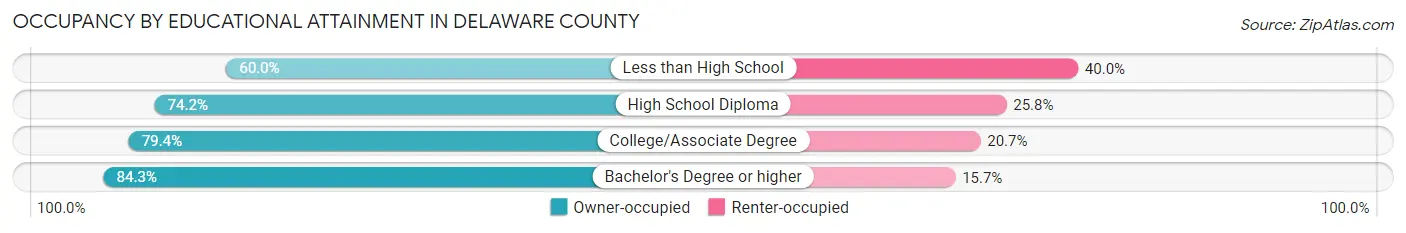
| Household Size | Owner-occupied | Renter-occupied |
| Less than High School | 978 (60.0%) | 652 (40.0%) |
| High School Diploma | 4,929 (74.2%) | 1,713 (25.8%) |
| College/Associate Degree | 4,438 (79.3%) | 1,155 (20.6%) |
| Bachelor's Degree or higher | 4,145 (84.3%) | 770 (15.7%) |
Occupancy by Age of Householder in Delaware County
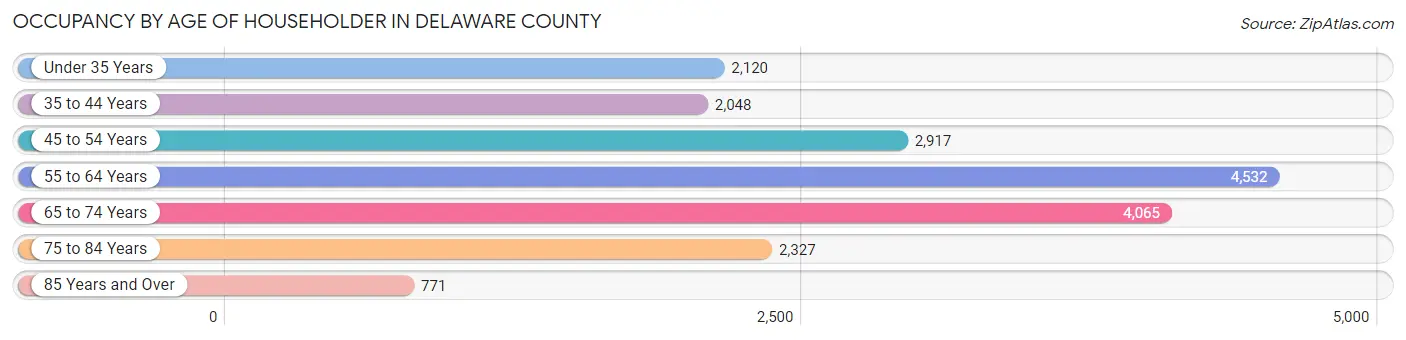
| Age Bracket | # Households | % Households |
| Under 35 Years | 2,120 | 11.3% |
| 35 to 44 Years | 2,048 | 10.9% |
| 45 to 54 Years | 2,917 | 15.5% |
| 55 to 64 Years | 4,532 | 24.1% |
| 65 to 74 Years | 4,065 | 21.6% |
| 75 to 84 Years | 2,327 | 12.4% |
| 85 Years and Over | 771 | 4.1% |
| Total | 18,780 | 100.0% |
Housing Finances in Delaware County
Median Income by Occupancy in Delaware County
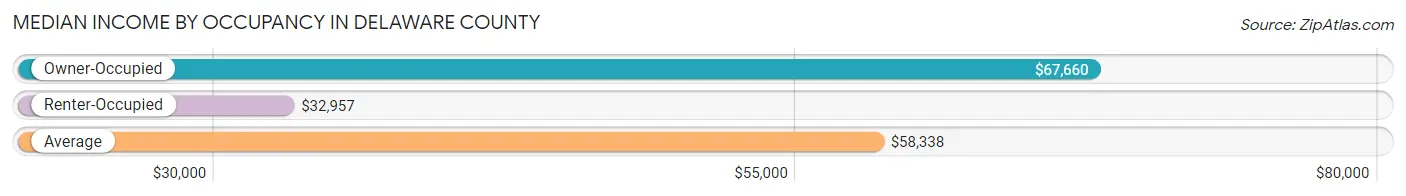
| Occupancy Type | # Households | Median Income |
| Owner-Occupied | 14,490 (77.2%) | $67,660 |
| Renter-Occupied | 4,290 (22.8%) | $32,957 |
| Average | 18,780 (100.0%) | $58,338 |
Occupancy by Householder Income Bracket in Delaware County
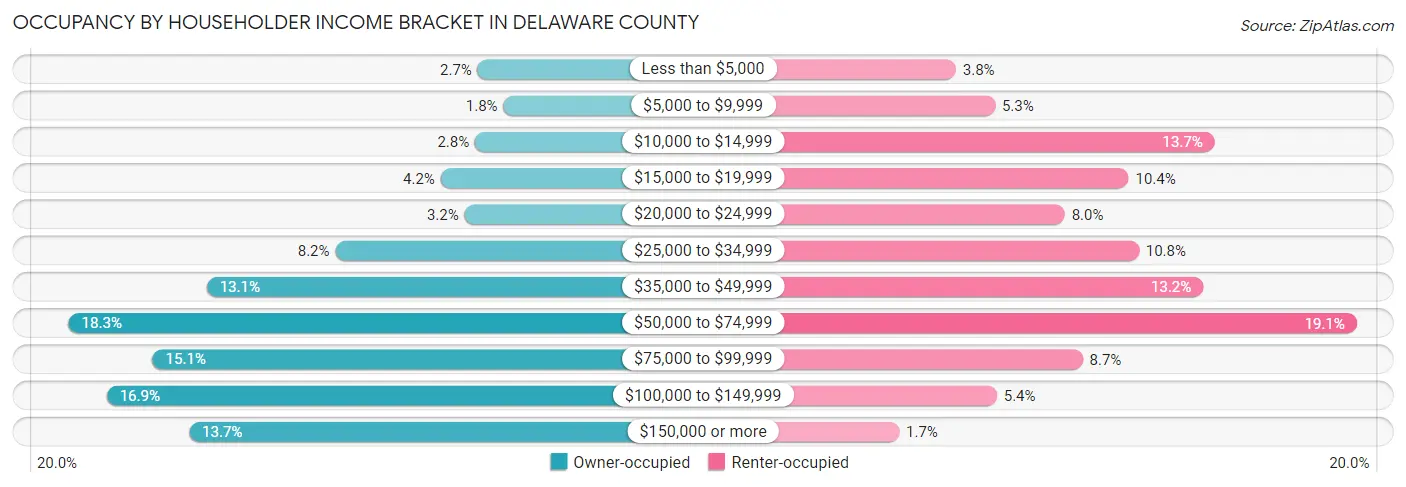
| Income Bracket | Owner-occupied | Renter-occupied |
| Less than $5,000 | 397 (2.7%) | 164 (3.8%) |
| $5,000 to $9,999 | 255 (1.8%) | 228 (5.3%) |
| $10,000 to $14,999 | 412 (2.8%) | 587 (13.7%) |
| $15,000 to $19,999 | 601 (4.2%) | 446 (10.4%) |
| $20,000 to $24,999 | 470 (3.2%) | 342 (8.0%) |
| $25,000 to $34,999 | 1,182 (8.2%) | 463 (10.8%) |
| $35,000 to $49,999 | 1,893 (13.1%) | 568 (13.2%) |
| $50,000 to $74,999 | 2,655 (18.3%) | 819 (19.1%) |
| $75,000 to $99,999 | 2,191 (15.1%) | 371 (8.6%) |
| $100,000 to $149,999 | 2,445 (16.9%) | 231 (5.4%) |
| $150,000 or more | 1,989 (13.7%) | 71 (1.7%) |
| Total | 14,490 (100.0%) | 4,290 (100.0%) |
Monthly Housing Cost Tiers in Delaware County
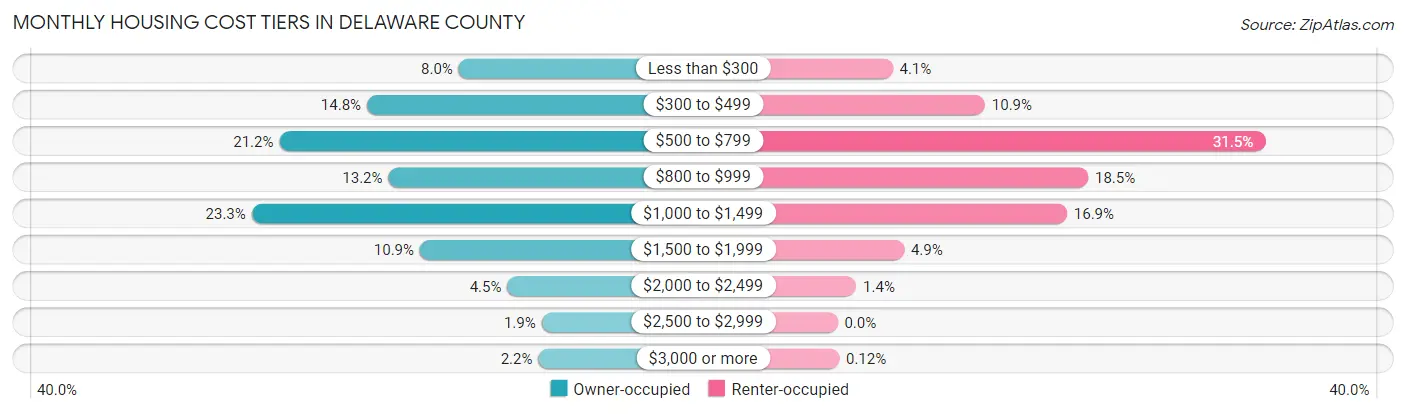
| Monthly Cost | Owner-occupied | Renter-occupied |
| Less than $300 | 1,164 (8.0%) | 174 (4.1%) |
| $300 to $499 | 2,143 (14.8%) | 466 (10.9%) |
| $500 to $799 | 3,078 (21.2%) | 1,351 (31.5%) |
| $800 to $999 | 1,914 (13.2%) | 792 (18.5%) |
| $1,000 to $1,499 | 3,373 (23.3%) | 725 (16.9%) |
| $1,500 to $1,999 | 1,578 (10.9%) | 210 (4.9%) |
| $2,000 to $2,499 | 645 (4.4%) | 59 (1.4%) |
| $2,500 to $2,999 | 280 (1.9%) | 0 (0.0%) |
| $3,000 or more | 315 (2.2%) | 5 (0.1%) |
| Total | 14,490 (100.0%) | 4,290 (100.0%) |
Physical Housing Characteristics in Delaware County
Housing Structures in Delaware County
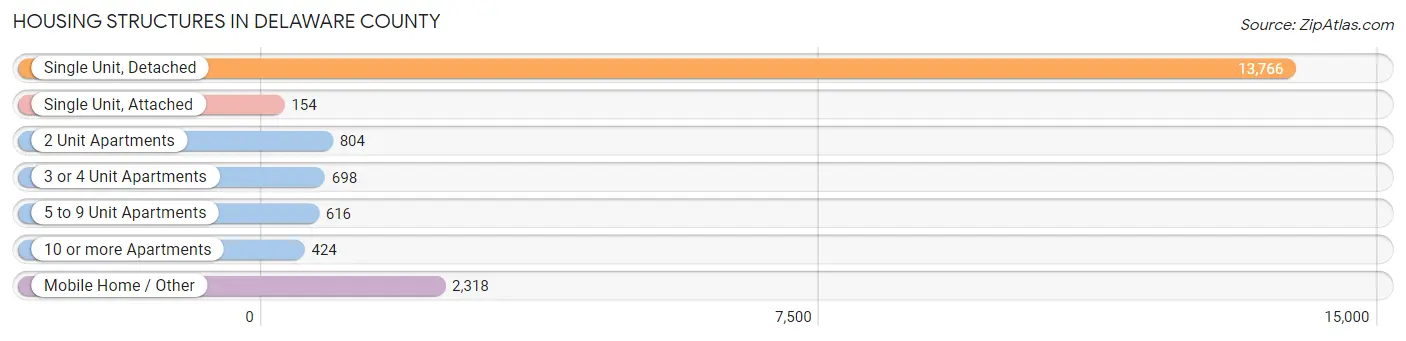
| Structure Type | # Housing Units | % Housing Units |
| Single Unit, Detached | 13,766 | 73.3% |
| Single Unit, Attached | 154 | 0.8% |
| 2 Unit Apartments | 804 | 4.3% |
| 3 or 4 Unit Apartments | 698 | 3.7% |
| 5 to 9 Unit Apartments | 616 | 3.3% |
| 10 or more Apartments | 424 | 2.3% |
| Mobile Home / Other | 2,318 | 12.3% |
| Total | 18,780 | 100.0% |
Housing Structures by Occupancy in Delaware County
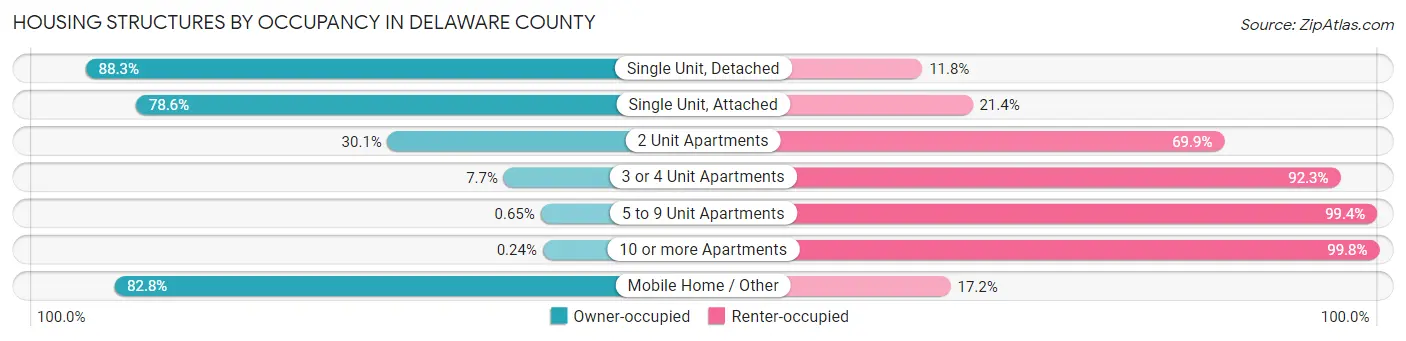
| Structure Type | Owner-occupied | Renter-occupied |
| Single Unit, Detached | 12,149 (88.2%) | 1,617 (11.7%) |
| Single Unit, Attached | 121 (78.6%) | 33 (21.4%) |
| 2 Unit Apartments | 242 (30.1%) | 562 (69.9%) |
| 3 or 4 Unit Apartments | 54 (7.7%) | 644 (92.3%) |
| 5 to 9 Unit Apartments | 4 (0.6%) | 612 (99.4%) |
| 10 or more Apartments | 1 (0.2%) | 423 (99.8%) |
| Mobile Home / Other | 1,919 (82.8%) | 399 (17.2%) |
| Total | 14,490 (77.2%) | 4,290 (22.8%) |
Housing Structures by Number of Rooms in Delaware County
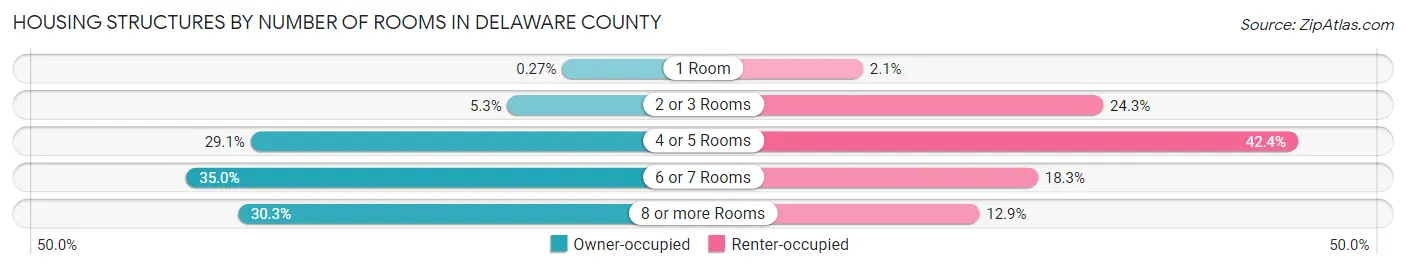
| Number of Rooms | Owner-occupied | Renter-occupied |
| 1 Room | 39 (0.3%) | 91 (2.1%) |
| 2 or 3 Rooms | 772 (5.3%) | 1,044 (24.3%) |
| 4 or 5 Rooms | 4,215 (29.1%) | 1,817 (42.3%) |
| 6 or 7 Rooms | 5,077 (35.0%) | 785 (18.3%) |
| 8 or more Rooms | 4,387 (30.3%) | 553 (12.9%) |
| Total | 14,490 (100.0%) | 4,290 (100.0%) |
Housing Structure by Heating Type in Delaware County
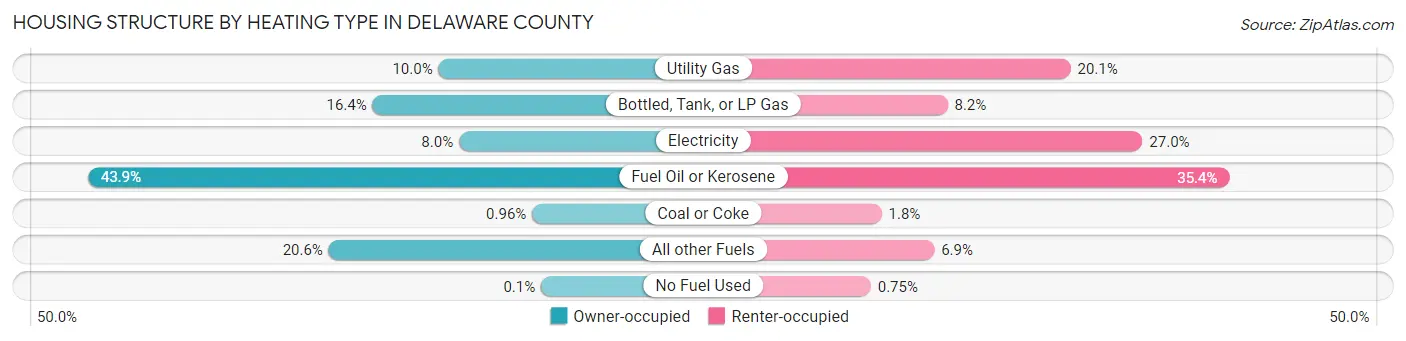
| Heating Type | Owner-occupied | Renter-occupied |
| Utility Gas | 1,451 (10.0%) | 860 (20.1%) |
| Bottled, Tank, or LP Gas | 2,374 (16.4%) | 350 (8.2%) |
| Electricity | 1,163 (8.0%) | 1,158 (27.0%) |
| Fuel Oil or Kerosene | 6,360 (43.9%) | 1,518 (35.4%) |
| Coal or Coke | 139 (1.0%) | 77 (1.8%) |
| All other Fuels | 2,988 (20.6%) | 295 (6.9%) |
| No Fuel Used | 15 (0.1%) | 32 (0.7%) |
| Total | 14,490 (100.0%) | 4,290 (100.0%) |
Household Vehicle Usage in Delaware County
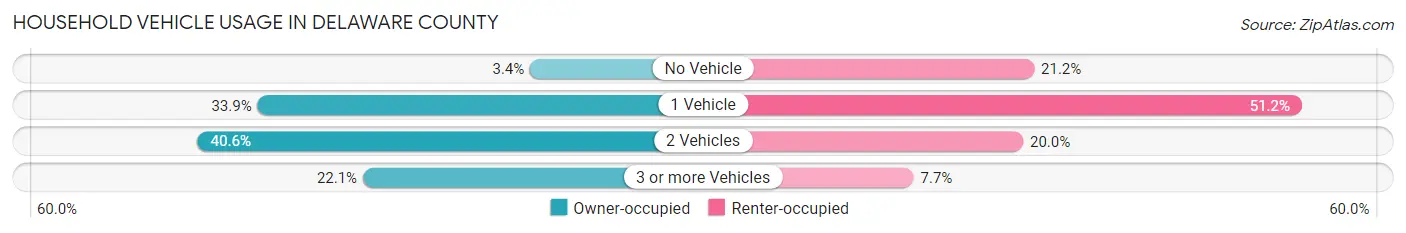
| Vehicles per Household | Owner-occupied | Renter-occupied |
| No Vehicle | 488 (3.4%) | 909 (21.2%) |
| 1 Vehicle | 4,914 (33.9%) | 2,195 (51.2%) |
| 2 Vehicles | 5,885 (40.6%) | 856 (20.0%) |
| 3 or more Vehicles | 3,203 (22.1%) | 330 (7.7%) |
| Total | 14,490 (100.0%) | 4,290 (100.0%) |
Real Estate & Mortgages in Delaware County
Real Estate and Mortgage Overview in Delaware County
| Characteristic | Without Mortgage | With Mortgage |
| Housing Units | 8,057 | 6,433 |
| Median Property Value | $153,300 | $169,800 |
| Median Household Income | $57,130 | $1,297 |
| Monthly Housing Costs | $569 | $310 |
| Real Estate Taxes | $2,816 | $120 |
Property Value by Mortgage Status in Delaware County
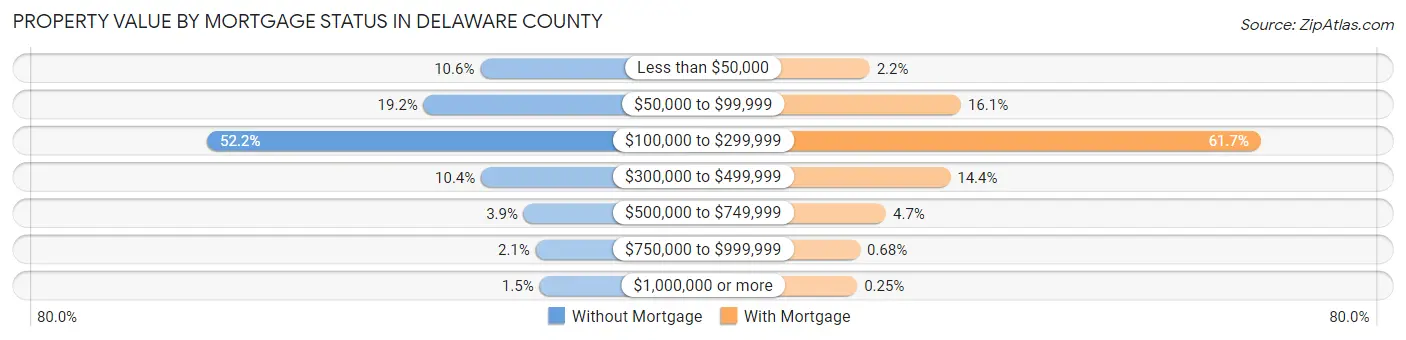
| Property Value | Without Mortgage | With Mortgage |
| Less than $50,000 | 852 (10.6%) | 139 (2.2%) |
| $50,000 to $99,999 | 1,546 (19.2%) | 1,034 (16.1%) |
| $100,000 to $299,999 | 4,205 (52.2%) | 3,972 (61.7%) |
| $300,000 to $499,999 | 841 (10.4%) | 929 (14.4%) |
| $500,000 to $749,999 | 317 (3.9%) | 299 (4.6%) |
| $750,000 to $999,999 | 172 (2.1%) | 44 (0.7%) |
| $1,000,000 or more | 124 (1.5%) | 16 (0.3%) |
| Total | 8,057 (100.0%) | 6,433 (100.0%) |
Household Income by Mortgage Status in Delaware County
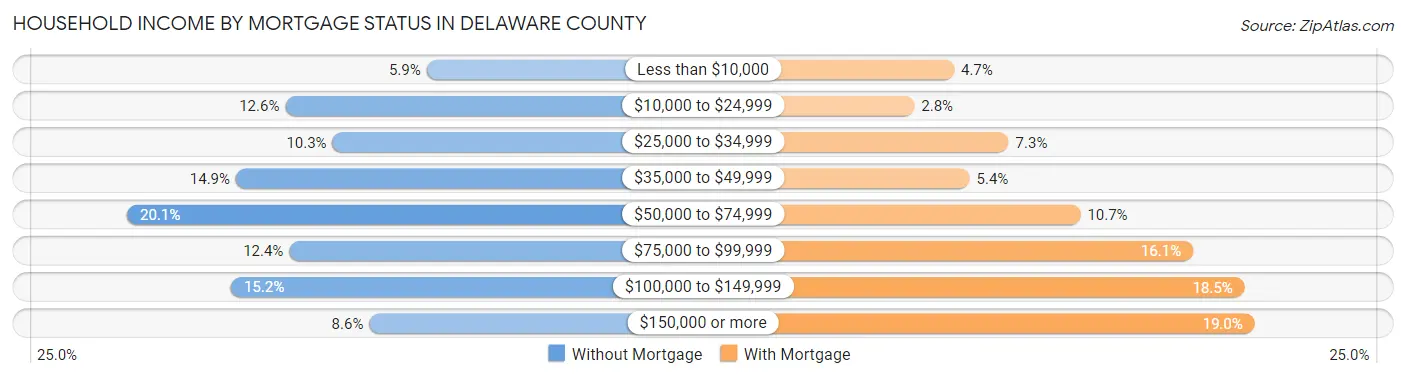
| Household Income | Without Mortgage | With Mortgage |
| Less than $10,000 | 472 (5.9%) | 302 (4.7%) |
| $10,000 to $24,999 | 1,014 (12.6%) | 180 (2.8%) |
| $25,000 to $34,999 | 833 (10.3%) | 469 (7.3%) |
| $35,000 to $49,999 | 1,204 (14.9%) | 349 (5.4%) |
| $50,000 to $74,999 | 1,621 (20.1%) | 689 (10.7%) |
| $75,000 to $99,999 | 999 (12.4%) | 1,034 (16.1%) |
| $100,000 to $149,999 | 1,222 (15.2%) | 1,192 (18.5%) |
| $150,000 or more | 692 (8.6%) | 1,223 (19.0%) |
| Total | 8,057 (100.0%) | 6,433 (100.0%) |
Property Value to Household Income Ratio in Delaware County
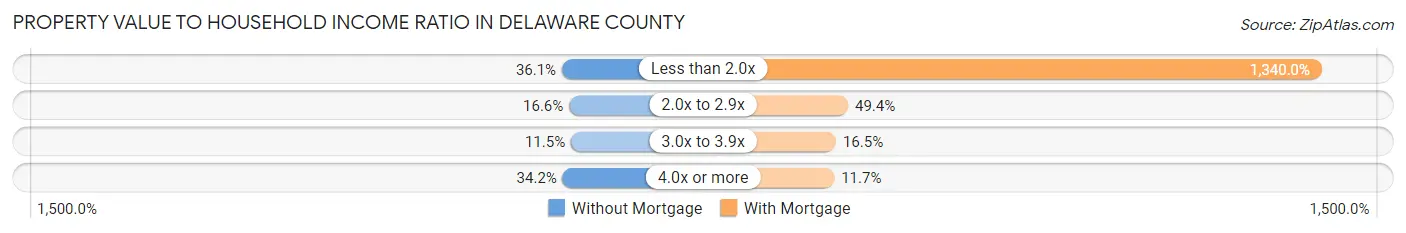
| Value-to-Income Ratio | Without Mortgage | With Mortgage |
| Less than 2.0x | 2,912 (36.1%) | 86,203 (1,340.0%) |
| 2.0x to 2.9x | 1,340 (16.6%) | 3,175 (49.3%) |
| 3.0x to 3.9x | 927 (11.5%) | 1,064 (16.5%) |
| 4.0x or more | 2,755 (34.2%) | 754 (11.7%) |
| Total | 8,057 (100.0%) | 6,433 (100.0%) |
Real Estate Taxes by Mortgage Status in Delaware County

| Property Taxes | Without Mortgage | With Mortgage |
| Less than $800 | 435 (5.4%) | 54 (0.8%) |
| $800 to $1,499 | 1,368 (17.0%) | 206 (3.2%) |
| $800 to $1,499 | 5,563 (69.1%) | 722 (11.2%) |
| Total | 8,057 (100.0%) | 6,433 (100.0%) |
Health & Disability in Delaware County
Health Insurance Coverage by Age in Delaware County
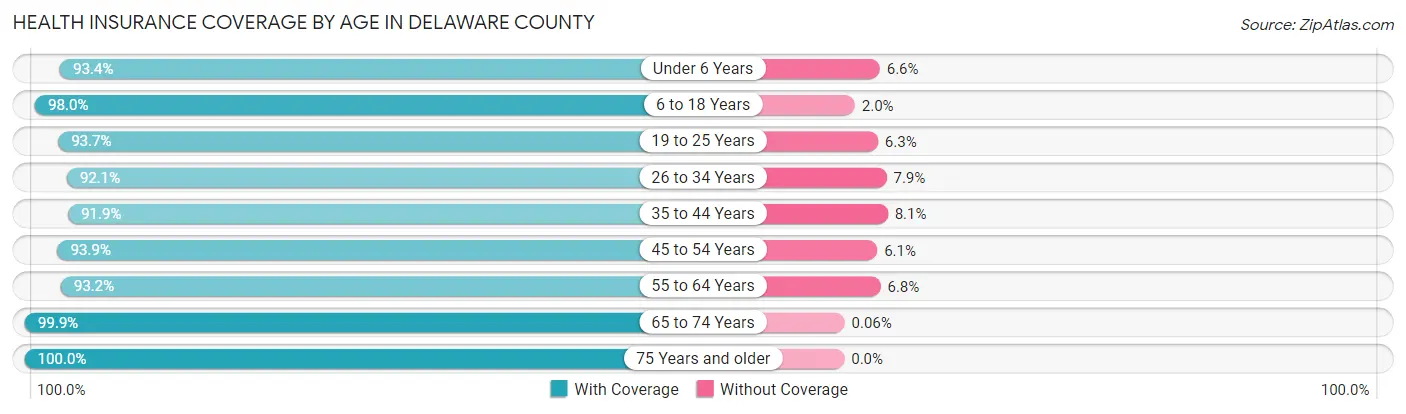
| Age Bracket | With Coverage | Without Coverage |
| Under 6 Years | 1,750 (93.4%) | 124 (6.6%) |
| 6 to 18 Years | 6,011 (98.0%) | 120 (2.0%) |
| 19 to 25 Years | 3,530 (93.7%) | 236 (6.3%) |
| 26 to 34 Years | 3,739 (92.1%) | 320 (7.9%) |
| 35 to 44 Years | 4,072 (91.9%) | 359 (8.1%) |
| 45 to 54 Years | 5,154 (93.9%) | 337 (6.1%) |
| 55 to 64 Years | 6,939 (93.2%) | 503 (6.8%) |
| 65 to 74 Years | 6,418 (99.9%) | 4 (0.1%) |
| 75 Years and older | 4,644 (100.0%) | 0 (0.0%) |
| Total | 42,257 (95.5%) | 2,003 (4.5%) |
Health Insurance Coverage by Citizenship Status in Delaware County
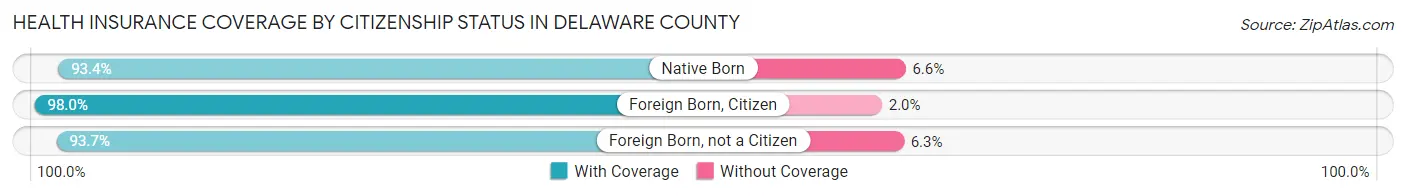
| Citizenship Status | With Coverage | Without Coverage |
| Native Born | 1,750 (93.4%) | 124 (6.6%) |
| Foreign Born, Citizen | 6,011 (98.0%) | 120 (2.0%) |
| Foreign Born, not a Citizen | 3,530 (93.7%) | 236 (6.3%) |
Health Insurance Coverage by Household Income in Delaware County
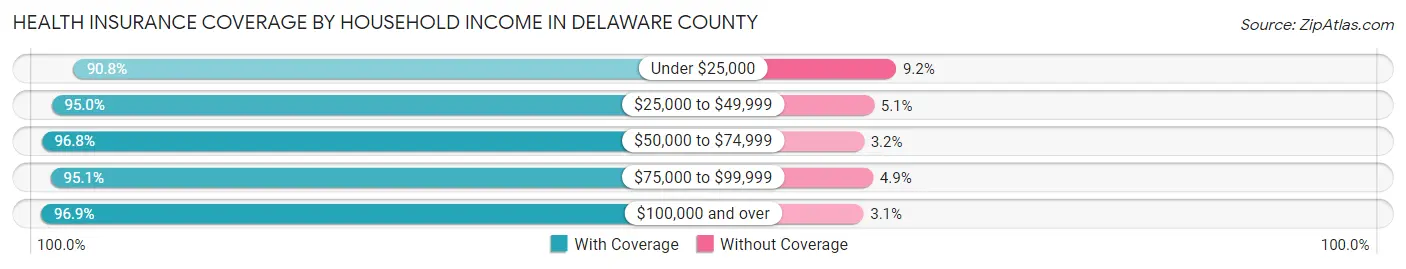
| Household Income | With Coverage | Without Coverage |
| Under $25,000 | 5,697 (90.8%) | 578 (9.2%) |
| $25,000 to $49,999 | 7,576 (95.0%) | 403 (5.1%) |
| $50,000 to $74,999 | 7,700 (96.8%) | 252 (3.2%) |
| $75,000 to $99,999 | 6,386 (95.1%) | 328 (4.9%) |
| $100,000 and over | 13,092 (96.9%) | 417 (3.1%) |
Public vs Private Health Insurance Coverage by Age in Delaware County
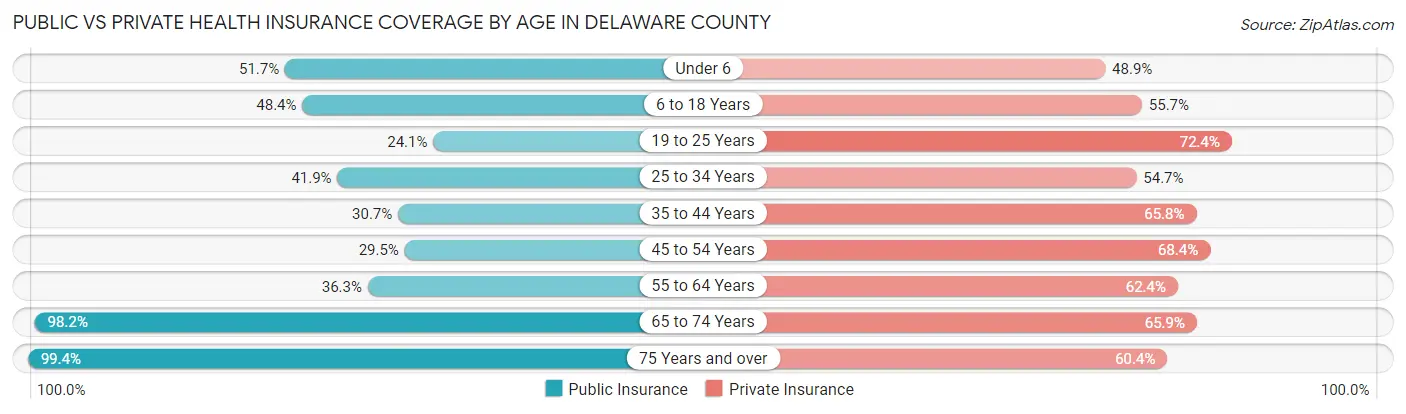
| Age Bracket | Public Insurance | Private Insurance |
| Under 6 | 968 (51.6%) | 916 (48.9%) |
| 6 to 18 Years | 2,970 (48.4%) | 3,415 (55.7%) |
| 19 to 25 Years | 909 (24.1%) | 2,726 (72.4%) |
| 25 to 34 Years | 1,702 (41.9%) | 2,219 (54.7%) |
| 35 to 44 Years | 1,359 (30.7%) | 2,915 (65.8%) |
| 45 to 54 Years | 1,617 (29.4%) | 3,753 (68.3%) |
| 55 to 64 Years | 2,701 (36.3%) | 4,641 (62.4%) |
| 65 to 74 Years | 6,304 (98.2%) | 4,231 (65.9%) |
| 75 Years and over | 4,617 (99.4%) | 2,805 (60.4%) |
| Total | 23,147 (52.3%) | 27,621 (62.4%) |
Disability Status by Sex by Age in Delaware County
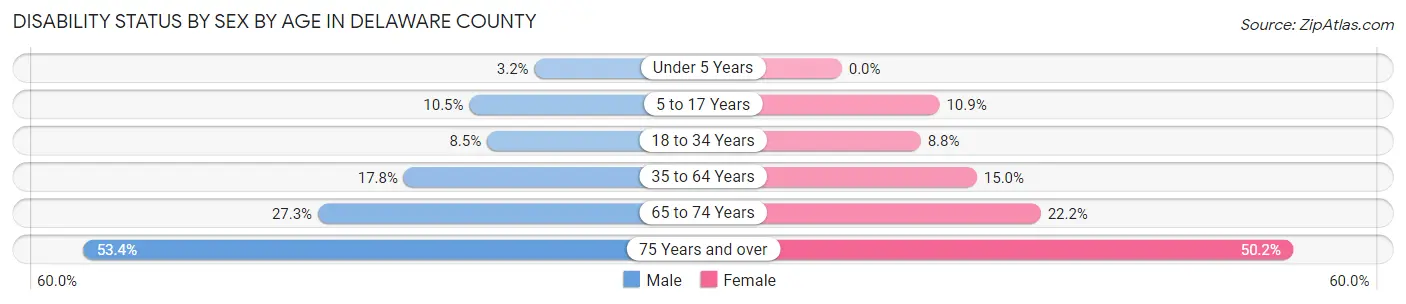
| Age Bracket | Male | Female |
| Under 5 Years | 28 (3.2%) | 0 (0.0%) |
| 5 to 17 Years | 299 (10.5%) | 290 (10.9%) |
| 18 to 34 Years | 398 (8.5%) | 347 (8.8%) |
| 35 to 64 Years | 1,562 (17.8%) | 1,290 (15.0%) |
| 65 to 74 Years | 895 (27.3%) | 697 (22.2%) |
| 75 Years and over | 1,134 (53.4%) | 1,266 (50.2%) |
Disability Class by Sex by Age in Delaware County
Disability Class: Hearing Difficulty
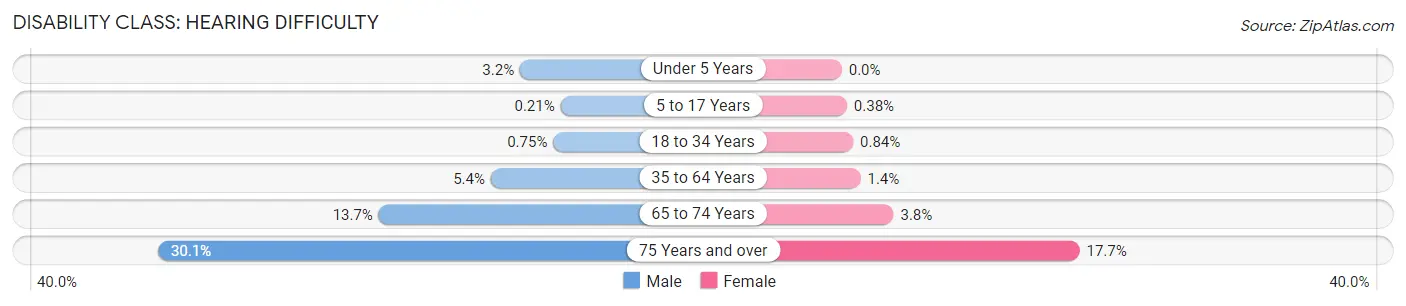
| Age Bracket | Male | Female |
| Under 5 Years | 28 (3.2%) | 0 (0.0%) |
| 5 to 17 Years | 6 (0.2%) | 10 (0.4%) |
| 18 to 34 Years | 35 (0.7%) | 33 (0.8%) |
| 35 to 64 Years | 474 (5.4%) | 119 (1.4%) |
| 65 to 74 Years | 449 (13.7%) | 121 (3.8%) |
| 75 Years and over | 639 (30.1%) | 445 (17.6%) |
Disability Class: Vision Difficulty
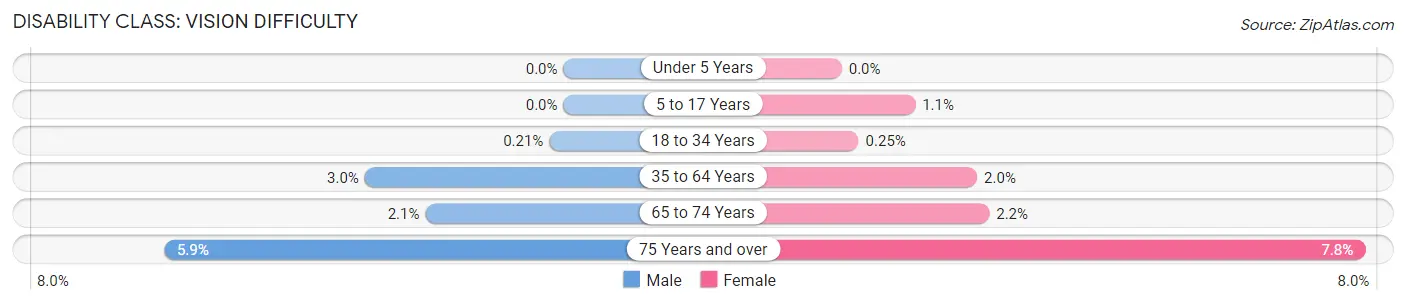
| Age Bracket | Male | Female |
| Under 5 Years | 0 (0.0%) | 0 (0.0%) |
| 5 to 17 Years | 0 (0.0%) | 29 (1.1%) |
| 18 to 34 Years | 10 (0.2%) | 10 (0.3%) |
| 35 to 64 Years | 259 (2.9%) | 172 (2.0%) |
| 65 to 74 Years | 67 (2.1%) | 69 (2.2%) |
| 75 Years and over | 126 (5.9%) | 196 (7.8%) |
Disability Class: Cognitive Difficulty
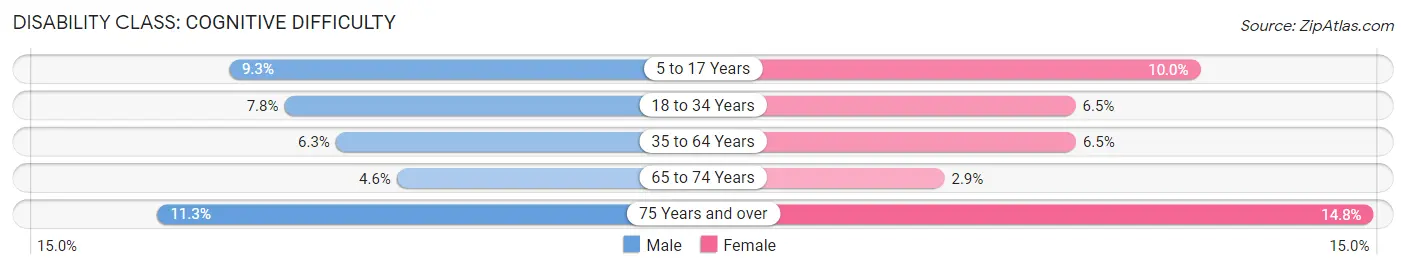
| Age Bracket | Male | Female |
| 5 to 17 Years | 266 (9.3%) | 266 (10.0%) |
| 18 to 34 Years | 364 (7.8%) | 257 (6.5%) |
| 35 to 64 Years | 557 (6.3%) | 559 (6.5%) |
| 65 to 74 Years | 152 (4.6%) | 90 (2.9%) |
| 75 Years and over | 240 (11.3%) | 373 (14.8%) |
Disability Class: Ambulatory Difficulty
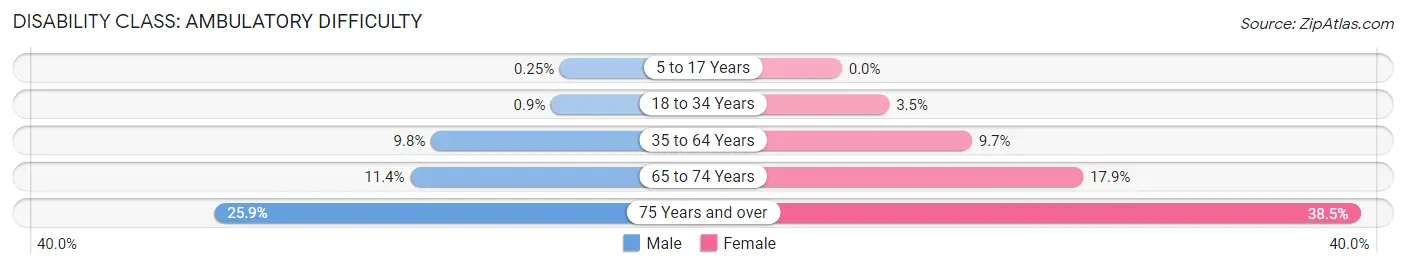
| Age Bracket | Male | Female |
| 5 to 17 Years | 7 (0.3%) | 0 (0.0%) |
| 18 to 34 Years | 42 (0.9%) | 139 (3.5%) |
| 35 to 64 Years | 862 (9.8%) | 828 (9.7%) |
| 65 to 74 Years | 372 (11.4%) | 564 (17.9%) |
| 75 Years and over | 550 (25.9%) | 970 (38.5%) |
Disability Class: Self-Care Difficulty
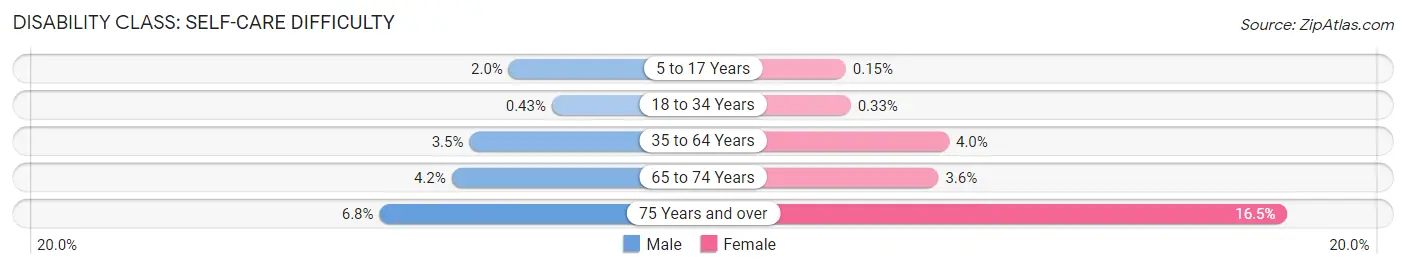
| Age Bracket | Male | Female |
| 5 to 17 Years | 58 (2.0%) | 4 (0.2%) |
| 18 to 34 Years | 20 (0.4%) | 13 (0.3%) |
| 35 to 64 Years | 307 (3.5%) | 341 (4.0%) |
| 65 to 74 Years | 136 (4.2%) | 113 (3.6%) |
| 75 Years and over | 145 (6.8%) | 417 (16.5%) |
Technology Access in Delaware County
Computing Device Access in Delaware County
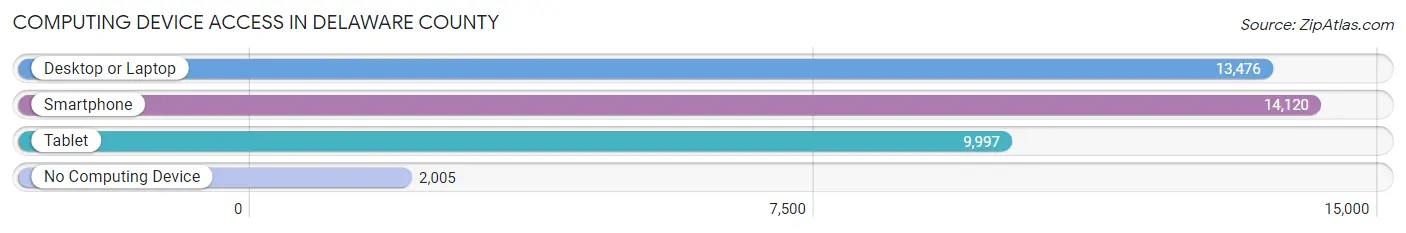
| Device Type | # Households | % Households |
| Desktop or Laptop | 13,476 | 71.8% |
| Smartphone | 14,120 | 75.2% |
| Tablet | 9,997 | 53.2% |
| No Computing Device | 2,005 | 10.7% |
| Total | 18,780 | 100.0% |
Internet Access in Delaware County
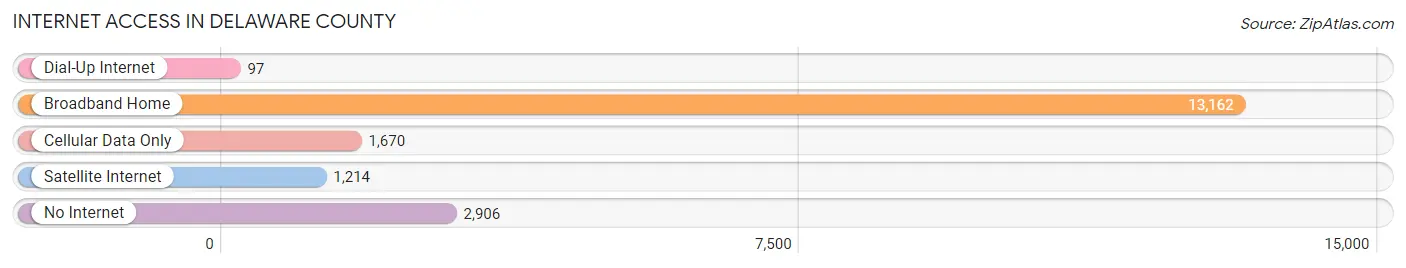
| Internet Type | # Households | % Households |
| Dial-Up Internet | 97 | 0.5% |
| Broadband Home | 13,162 | 70.1% |
| Cellular Data Only | 1,670 | 8.9% |
| Satellite Internet | 1,214 | 6.5% |
| No Internet | 2,906 | 15.5% |
| Total | 18,780 | 100.0% |
Delaware County Summary
Delaware County, New York is located in the Catskill Mountains of the state and is part of the Southern Tier region. It is bordered by Otsego County to the north, Schoharie County to the east, Sullivan County to the south, and Broome County to the west. The county seat is Delhi, and the largest city is Sidney.
Geography
Delaware County covers an area of 1,467 square miles, making it the fourth-largest county in New York. It is located in the Catskill Mountains and is part of the Southern Tier region. The terrain is mostly hilly and forested, with some flat areas in the valleys. The highest point in the county is Slide Mountain, at 4,180 feet. The county is drained by the Delaware River, which forms its western border, and its tributaries, including the East Branch, West Branch, and Beaver Kill.
The county is home to several state parks, including Catskill Park, which is the largest park in the state. Other parks include the Pepacton Reservoir, the Cannonsville Reservoir, and the Neversink Gorge.
Demographics
As of the 2010 census, Delaware County had a population of 47,980. The population density was 33.2 people per square mile. The racial makeup of the county was 94.3% White, 2.2% African American, 0.3% Native American, 0.5% Asian, 0.1% Pacific Islander, 1.2% from other races, and 1.4% from two or more races. Hispanic or Latino of any race were 3.3% of the population.
The median income for a household in the county was $41,945, and the median income for a family was $50,945. The per capita income for the county was $20,945. About 11.3% of families and 15.2% of the population were below the poverty line, including 21.2% of those under age 18 and 8.2% of those age 65 or over.
Economy
Delaware County is largely rural and agricultural. The main industries are dairy farming, forestry, and tourism. The county is home to several ski resorts, including Belleayre Mountain and Plattekill Mountain.
The county is also home to several manufacturing companies, including the Delaware County Electric Cooperative, which produces electrical equipment, and the Delaware County Industrial Development Agency, which provides economic development services.
The county is served by the Delaware County Airport, which offers commercial flights to New York City and other destinations.
Conclusion
Delaware County, New York is a rural county located in the Catskill Mountains of the state. It is part of the Southern Tier region and is bordered by Otsego County to the north, Schoharie County to the east, Sullivan County to the south, and Broome County to the west. The county has a population of 47,980 and is largely rural and agricultural, with the main industries being dairy farming, forestry, and tourism. The county is served by the Delaware County Airport and is home to several ski resorts and manufacturing companies.
Common Questions
What is Per Capita Income in Delaware County?
Per Capita income in Delaware County is $33,332.
What is the Median Family Income in Delaware County?
Median Family Income in Delaware County is $75,000.
What is the Median Household income in Delaware County?
Median Household Income in Delaware County is $58,338.
What is Income or Wage Gap in Delaware County?
Income or Wage Gap in Delaware County is 25.6%.
Women in Delaware County earn 74.4 cents for every dollar earned by a man.
What is Family Income Deficit in Delaware County?
Family Income Deficit in Delaware County is $10,229.
Families that are below poverty line in Delaware County earn $10,229 less on average than the poverty threshold level.
What is Inequality or Gini Index in Delaware County?
Inequality or Gini Index in Delaware County is 0.44.
What is the Total Population of Delaware County?
Total Population of Delaware County is 44,637.
What is the Total Male Population of Delaware County?
Total Male Population of Delaware County is 22,763.
What is the Total Female Population of Delaware County?
Total Female Population of Delaware County is 21,874.
What is the Ratio of Males per 100 Females in Delaware County?
There are 104.06 Males per 100 Females in Delaware County.
What is the Ratio of Females per 100 Males in Delaware County?
There are 96.09 Females per 100 Males in Delaware County.
What is the Median Population Age in Delaware County?
Median Population Age in Delaware County is 48.9 Years.
What is the Average Family Size in Delaware County
Average Family Size in Delaware County is 2.8 People.
What is the Average Household Size in Delaware County
Average Household Size in Delaware County is 2.3 People.
How Large is the Labor Force in Delaware County?
There are 20,509 People in the Labor Forcein in Delaware County.
What is the Percentage of People in the Labor Force in Delaware County?
53.5% of People are in the Labor Force in Delaware County.
What is the Unemployment Rate in Delaware County?
Unemployment Rate in Delaware County is 6.1%.