Chenango County, NY Map & Demographics
Chenango County Map
Chenango County Overview
$32,708
PER CAPITA INCOME
$75,027
AVG FAMILY INCOME
$61,741
AVG HOUSEHOLD INCOME
31.4%
WAGE / INCOME GAP [ % ]
68.6¢/ $1
WAGE / INCOME GAP [ $ ]
$10,872
FAMILY INCOME DEFICIT
0.42
INEQUALITY / GINI INDEX
47,096
TOTAL POPULATION
23,663
MALE POPULATION
23,433
FEMALE POPULATION
100.98
MALES / 100 FEMALES
99.03
FEMALES / 100 MALES
44.9
MEDIAN AGE
2.8
AVG FAMILY SIZE
2.3
AVG HOUSEHOLD SIZE
22,874
LABOR FORCE [ PEOPLE ]
59.3%
PERCENT IN LABOR FORCE
7.1%
UNEMPLOYMENT RATE
Income in Chenango County
Income Overview in Chenango County
Per Capita Income in Chenango County is $32,708, while median incomes of families and households are $75,027 and $61,741 respectively.
| Characteristic | Number | Measure |
| Per Capita Income | 47,096 | $32,708 |
| Median Family Income | 12,637 | $75,027 |
| Mean Family Income | 12,637 | $89,791 |
| Median Household Income | 19,886 | $61,741 |
| Mean Household Income | 19,886 | $77,091 |
| Income Deficit | 12,637 | $10,872 |
| Wage / Income Gap (%) | 47,096 | 31.39% |
| Wage / Income Gap ($) | 47,096 | 68.61¢ per $1 |
| Gini / Inequality Index | 47,096 | 0.42 |
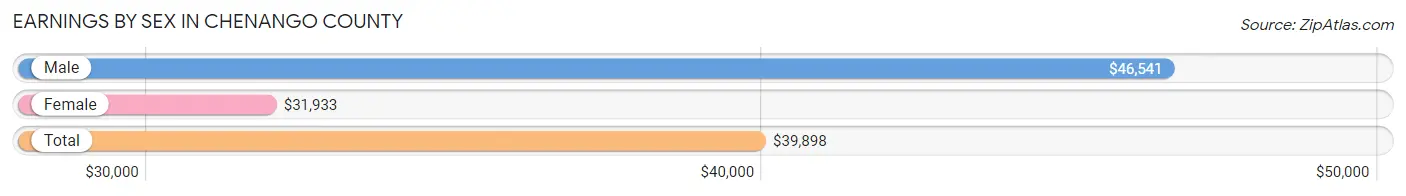
Earnings by Sex in Chenango County
Average Earnings in Chenango County are $39,898, $46,541 for men and $31,933 for women, a difference of 31.4%.
| Sex | Number | Average Earnings |
| Male | 12,513 (52.7%) | $46,541 |
| Female | 11,208 (47.2%) | $31,933 |
| Total | 23,721 (100.0%) | $39,898 |
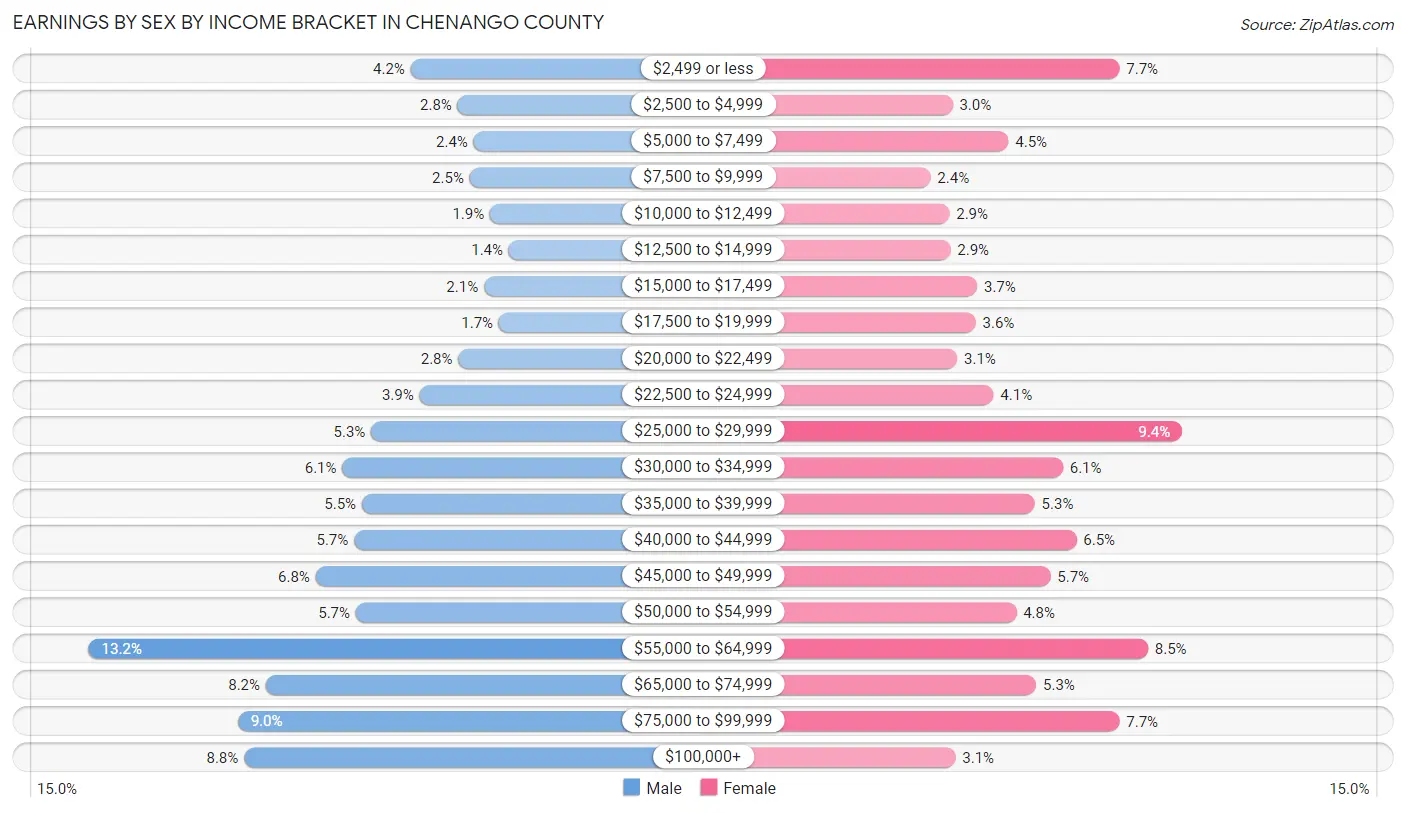
Earnings by Sex by Income Bracket in Chenango County
The most common earnings brackets in Chenango County are $55,000 to $64,999 for men (1,652 | 13.2%) and $25,000 to $29,999 for women (1,056 | 9.4%).
| Income | Male | Female |
| $2,499 or less | 519 (4.2%) | 858 (7.7%) |
| $2,500 to $4,999 | 354 (2.8%) | 333 (3.0%) |
| $5,000 to $7,499 | 298 (2.4%) | 509 (4.5%) |
| $7,500 to $9,999 | 311 (2.5%) | 263 (2.4%) |
| $10,000 to $12,499 | 240 (1.9%) | 323 (2.9%) |
| $12,500 to $14,999 | 174 (1.4%) | 326 (2.9%) |
| $15,000 to $17,499 | 262 (2.1%) | 410 (3.7%) |
| $17,500 to $19,999 | 209 (1.7%) | 406 (3.6%) |
| $20,000 to $22,499 | 352 (2.8%) | 348 (3.1%) |
| $22,500 to $24,999 | 488 (3.9%) | 462 (4.1%) |
| $25,000 to $29,999 | 658 (5.3%) | 1,056 (9.4%) |
| $30,000 to $34,999 | 760 (6.1%) | 680 (6.1%) |
| $35,000 to $39,999 | 691 (5.5%) | 592 (5.3%) |
| $40,000 to $44,999 | 718 (5.7%) | 723 (6.5%) |
| $45,000 to $49,999 | 854 (6.8%) | 641 (5.7%) |
| $50,000 to $54,999 | 712 (5.7%) | 534 (4.8%) |
| $55,000 to $64,999 | 1,652 (13.2%) | 948 (8.5%) |
| $65,000 to $74,999 | 1,028 (8.2%) | 596 (5.3%) |
| $75,000 to $99,999 | 1,128 (9.0%) | 858 (7.7%) |
| $100,000+ | 1,105 (8.8%) | 342 (3.0%) |
| Total | 12,513 (100.0%) | 11,208 (100.0%) |
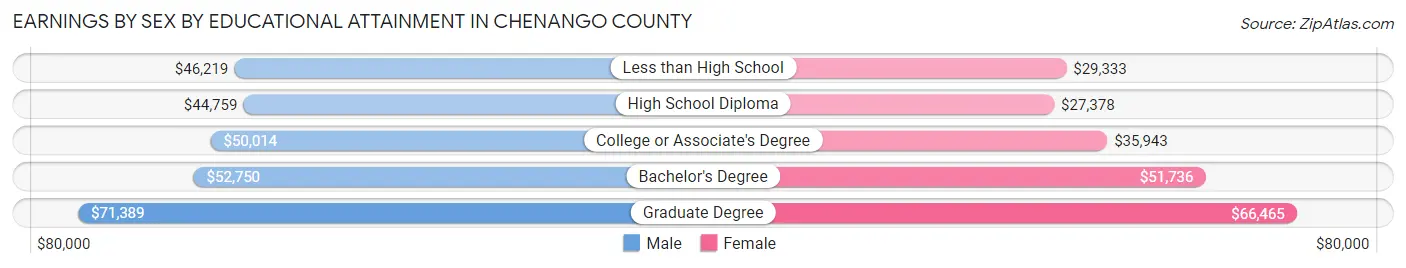
Earnings by Sex by Educational Attainment in Chenango County
Average earnings in Chenango County are $49,558 for men and $37,049 for women, a difference of 25.2%. Men with an educational attainment of graduate degree enjoy the highest average annual earnings of $71,389, while those with high school diploma education earn the least with $44,759. Women with an educational attainment of graduate degree earn the most with the average annual earnings of $66,465, while those with high school diploma education have the smallest earnings of $27,378.
| Educational Attainment | Male Income | Female Income |
| Less than High School | $46,219 | $29,333 |
| High School Diploma | $44,759 | $27,378 |
| College or Associate's Degree | $50,014 | $35,943 |
| Bachelor's Degree | $52,750 | $51,736 |
| Graduate Degree | $71,389 | $66,465 |
| Total | $49,558 | $37,049 |
Family Income in Chenango County
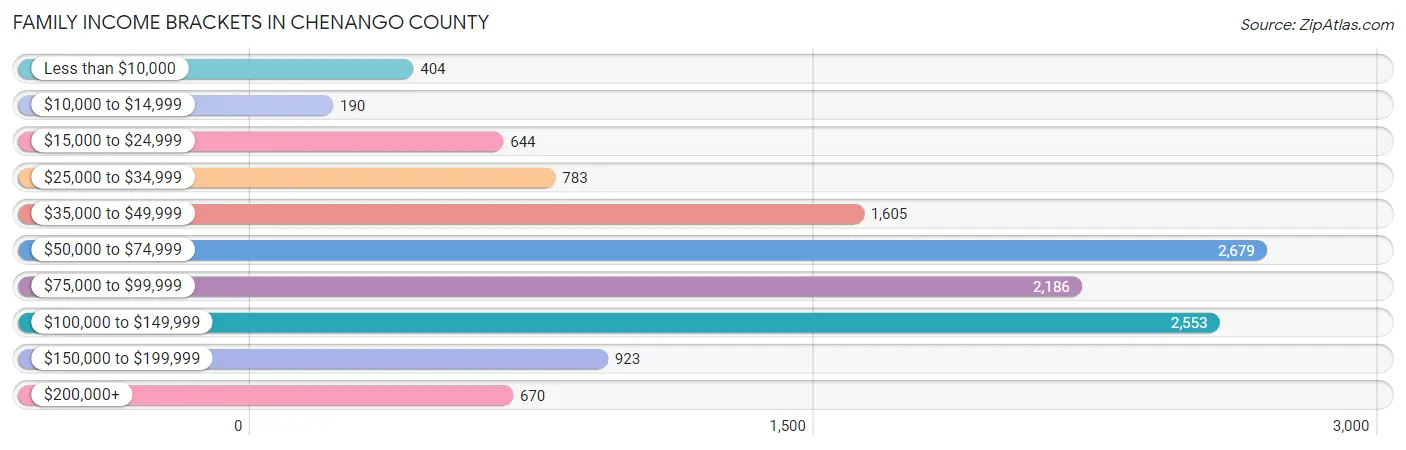
Family Income Brackets in Chenango County
According to the Chenango County family income data, there are 2,679 families falling into the $50,000 to $74,999 income range, which is the most common income bracket and makes up 21.2% of all families. Conversely, the $10,000 to $14,999 income bracket is the least frequent group with only 190 families (1.5%) belonging to this category.
| Income Bracket | # Families | % Families |
| Less than $10,000 | 404 | 3.2% |
| $10,000 to $14,999 | 190 | 1.5% |
| $15,000 to $24,999 | 644 | 5.1% |
| $25,000 to $34,999 | 783 | 6.2% |
| $35,000 to $49,999 | 1,605 | 12.7% |
| $50,000 to $74,999 | 2,679 | 21.2% |
| $75,000 to $99,999 | 2,186 | 17.3% |
| $100,000 to $149,999 | 2,553 | 20.2% |
| $150,000 to $199,999 | 923 | 7.3% |
| $200,000+ | 670 | 5.3% |
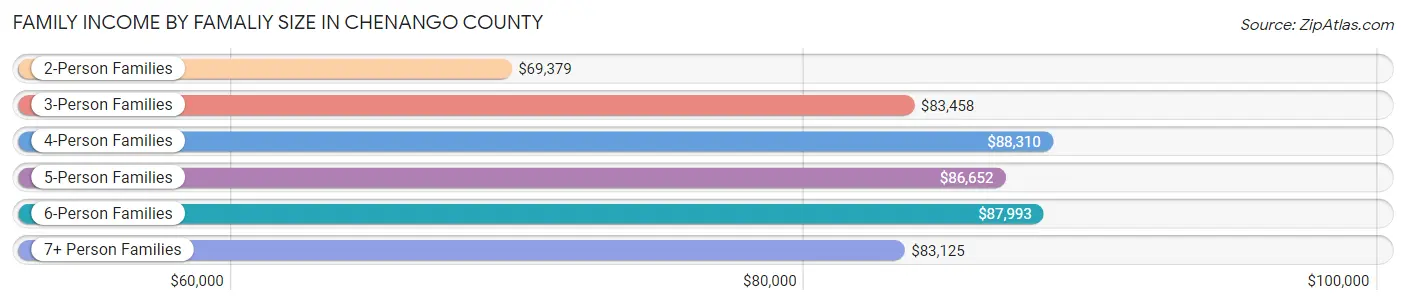
Family Income by Famaliy Size in Chenango County
4-person families (1,908 | 15.1%) account for the highest median family income in Chenango County with $88,310 per family, while 2-person families (6,879 | 54.4%) have the highest median income of $34,690 per family member.
| Income Bracket | # Families | Median Income |
| 2-Person Families | 6,879 (54.4%) | $69,379 |
| 3-Person Families | 2,683 (21.2%) | $83,458 |
| 4-Person Families | 1,908 (15.1%) | $88,310 |
| 5-Person Families | 653 (5.2%) | $86,652 |
| 6-Person Families | 351 (2.8%) | $87,993 |
| 7+ Person Families | 163 (1.3%) | $83,125 |
| Total | 12,637 (100.0%) | $75,027 |
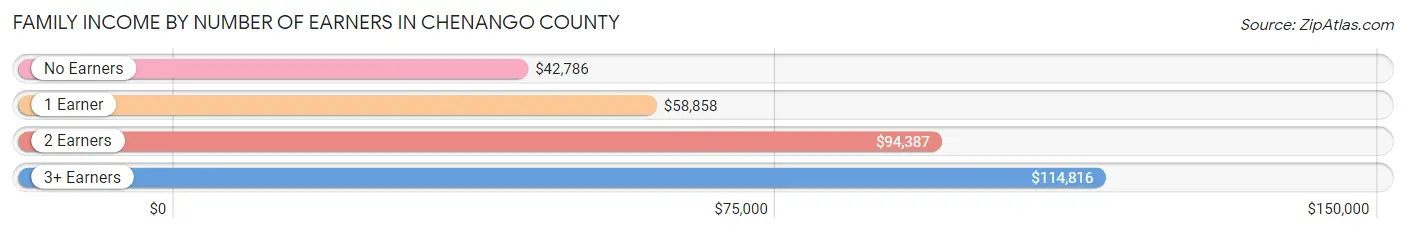
Family Income by Number of Earners in Chenango County
The median family income in Chenango County is $75,027, with families comprising 3+ earners (1,115) having the highest median family income of $114,816, while families with no earners (2,396) have the lowest median family income of $42,786, accounting for 8.8% and 19.0% of families, respectively.
| Number of Earners | # Families | Median Income |
| No Earners | 2,396 (19.0%) | $42,786 |
| 1 Earner | 4,190 (33.2%) | $58,858 |
| 2 Earners | 4,936 (39.1%) | $94,387 |
| 3+ Earners | 1,115 (8.8%) | $114,816 |
| Total | 12,637 (100.0%) | $75,027 |
Household Income in Chenango County
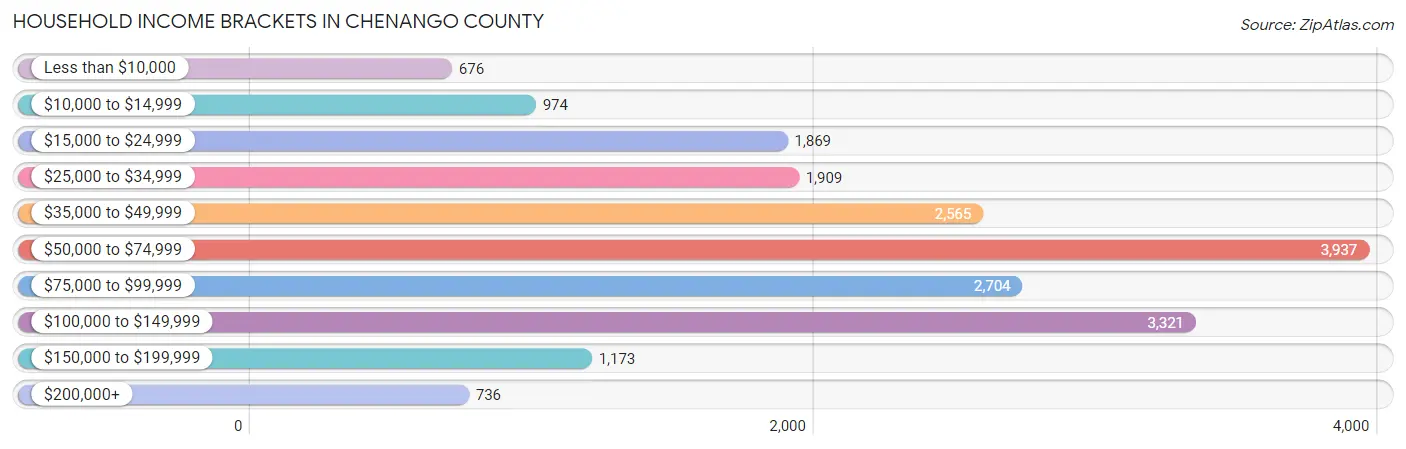
Household Income Brackets in Chenango County
With 3,937 households falling in the category, the $50,000 to $74,999 income range is the most frequent in Chenango County, accounting for 19.8% of all households. In contrast, only 676 households (3.4%) fall into the less than $10,000 income bracket, making it the least populous group.
| Income Bracket | # Households | % Households |
| Less than $10,000 | 676 | 3.4% |
| $10,000 to $14,999 | 974 | 4.9% |
| $15,000 to $24,999 | 1,869 | 9.4% |
| $25,000 to $34,999 | 1,909 | 9.6% |
| $35,000 to $49,999 | 2,565 | 12.9% |
| $50,000 to $74,999 | 3,937 | 19.8% |
| $75,000 to $99,999 | 2,704 | 13.6% |
| $100,000 to $149,999 | 3,321 | 16.7% |
| $150,000 to $199,999 | 1,173 | 5.9% |
| $200,000+ | 736 | 3.7% |
Household Income by Householder Age in Chenango County
The median household income in Chenango County is $61,741, with the highest median household income of $71,606 found in the 45 to 64 years age bracket for the primary householder. A total of 7,889 households (39.7%) fall into this category. Meanwhile, the 65+ years age bracket for the primary householder has the lowest median household income of $43,294, with 6,532 households (32.9%) in this group.
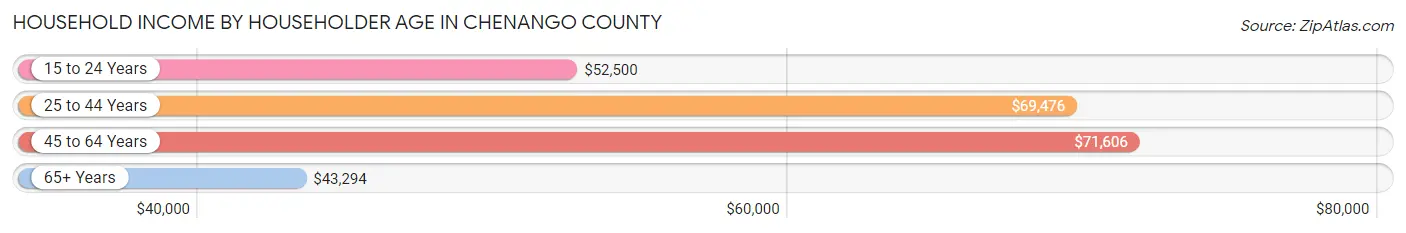
| Income Bracket | # Households | Median Income |
| 15 to 24 Years | 758 (3.8%) | $52,500 |
| 25 to 44 Years | 4,707 (23.7%) | $69,476 |
| 45 to 64 Years | 7,889 (39.7%) | $71,606 |
| 65+ Years | 6,532 (32.9%) | $43,294 |
| Total | 19,886 (100.0%) | $61,741 |
Poverty in Chenango County
Income Below Poverty by Sex and Age in Chenango County
With 11.1% poverty level for males and 13.8% for females among the residents of Chenango County, under 5 year old males and 5 year old females are the most vulnerable to poverty, with 244 males (20.8%) and 83 females (29.5%) in their respective age groups living below the poverty level.
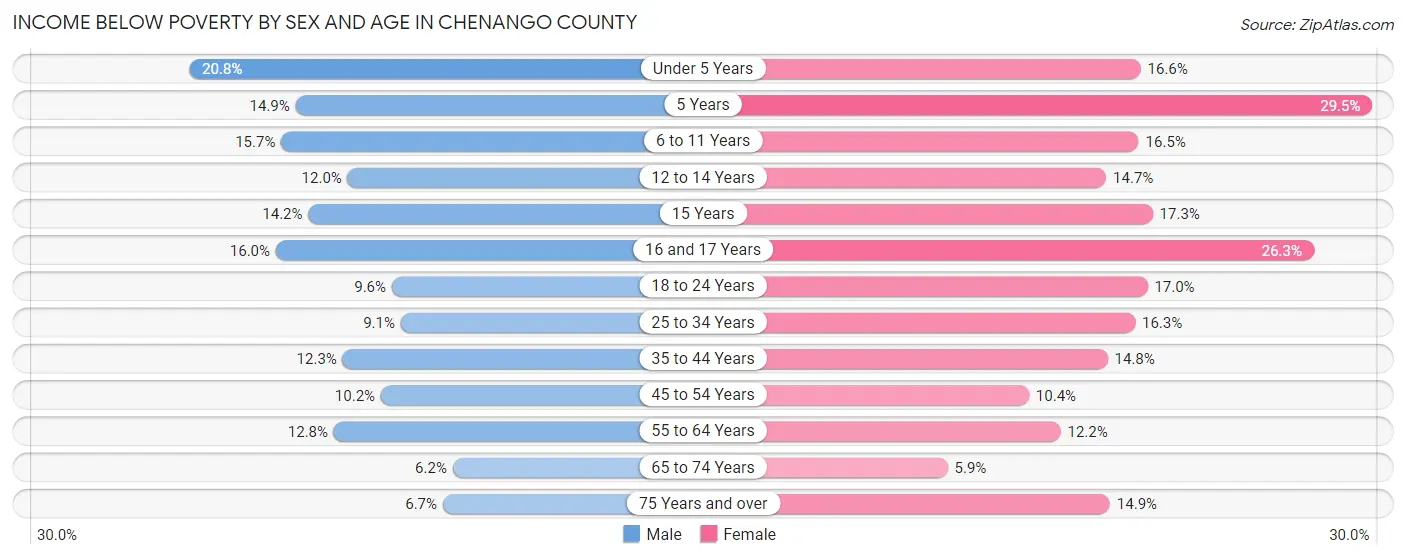
| Age Bracket | Male | Female |
| Under 5 Years | 244 (20.8%) | 194 (16.6%) |
| 5 Years | 41 (14.9%) | 83 (29.5%) |
| 6 to 11 Years | 240 (15.7%) | 237 (16.5%) |
| 12 to 14 Years | 110 (12.0%) | 117 (14.7%) |
| 15 Years | 48 (14.2%) | 45 (17.3%) |
| 16 and 17 Years | 90 (16.0%) | 154 (26.3%) |
| 18 to 24 Years | 165 (9.6%) | 288 (17.0%) |
| 25 to 34 Years | 238 (9.0%) | 418 (16.3%) |
| 35 to 44 Years | 329 (12.3%) | 375 (14.8%) |
| 45 to 54 Years | 309 (10.2%) | 305 (10.4%) |
| 55 to 64 Years | 480 (12.8%) | 448 (12.2%) |
| 65 to 74 Years | 181 (6.2%) | 168 (5.9%) |
| 75 Years and over | 120 (6.7%) | 320 (14.9%) |
| Total | 2,595 (11.1%) | 3,152 (13.8%) |
Income Above Poverty by Sex and Age in Chenango County
According to the poverty statistics in Chenango County, males aged 65 to 74 years and females aged 65 to 74 years are the age groups that are most secure financially, with 93.8% of males and 94.1% of females in these age groups living above the poverty line.
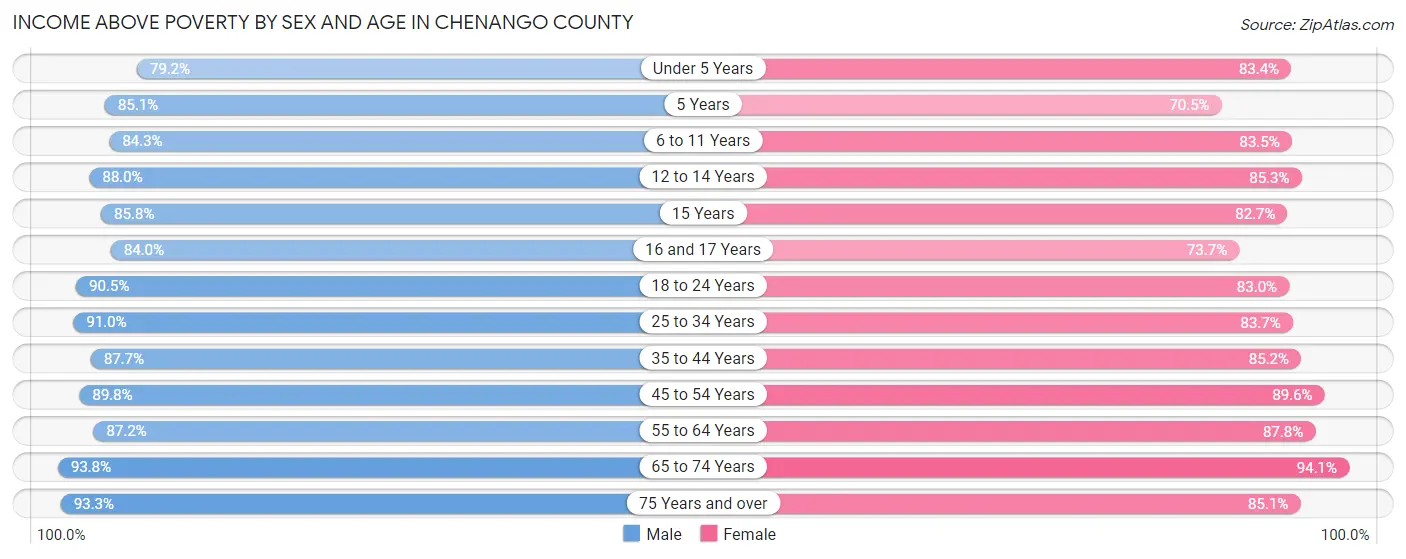
| Age Bracket | Male | Female |
| Under 5 Years | 927 (79.2%) | 972 (83.4%) |
| 5 Years | 234 (85.1%) | 198 (70.5%) |
| 6 to 11 Years | 1,288 (84.3%) | 1,197 (83.5%) |
| 12 to 14 Years | 806 (88.0%) | 678 (85.3%) |
| 15 Years | 290 (85.8%) | 215 (82.7%) |
| 16 and 17 Years | 472 (84.0%) | 432 (73.7%) |
| 18 to 24 Years | 1,563 (90.4%) | 1,404 (83.0%) |
| 25 to 34 Years | 2,391 (90.9%) | 2,141 (83.7%) |
| 35 to 44 Years | 2,349 (87.7%) | 2,158 (85.2%) |
| 45 to 54 Years | 2,731 (89.8%) | 2,621 (89.6%) |
| 55 to 64 Years | 3,275 (87.2%) | 3,231 (87.8%) |
| 65 to 74 Years | 2,756 (93.8%) | 2,686 (94.1%) |
| 75 Years and over | 1,669 (93.3%) | 1,823 (85.1%) |
| Total | 20,751 (88.9%) | 19,756 (86.2%) |
Income Below Poverty Among Married-Couple Families in Chenango County
The poverty statistics for married-couple families in Chenango County show that 3.6% or 329 of the total 9,224 families live below the poverty line. Families with 5 or more children have the highest poverty rate of 24.4%, comprising of 19 families. On the other hand, families with no children have the lowest poverty rate of 2.6%, which includes 159 families.
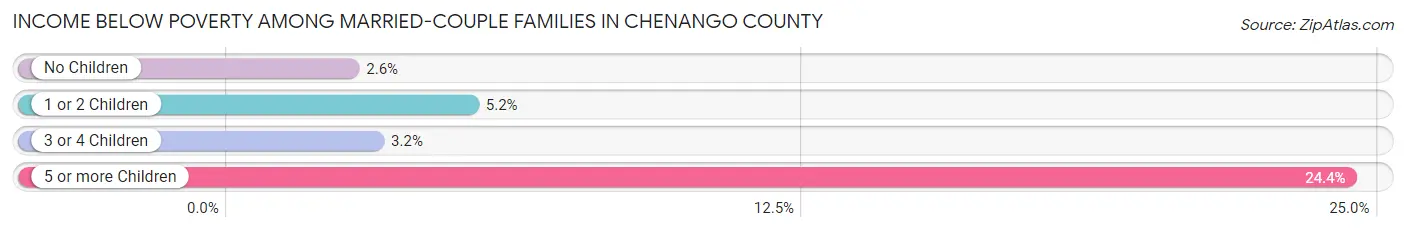
| Children | Above Poverty | Below Poverty |
| No Children | 5,869 (97.4%) | 159 (2.6%) |
| 1 or 2 Children | 2,388 (94.8%) | 132 (5.2%) |
| 3 or 4 Children | 579 (96.8%) | 19 (3.2%) |
| 5 or more Children | 59 (75.6%) | 19 (24.4%) |
| Total | 8,895 (96.4%) | 329 (3.6%) |
Income Below Poverty Among Single-Parent Households in Chenango County
According to the poverty data in Chenango County, 13.6% or 185 single-father households and 25.0% or 514 single-mother households are living below the poverty line. Among single-father households, those with 3 or 4 children have the highest poverty rate, with 42 households (29.8%) experiencing poverty. Likewise, among single-mother households, those with 3 or 4 children have the highest poverty rate, with 70 households (77.8%) falling below the poverty line.
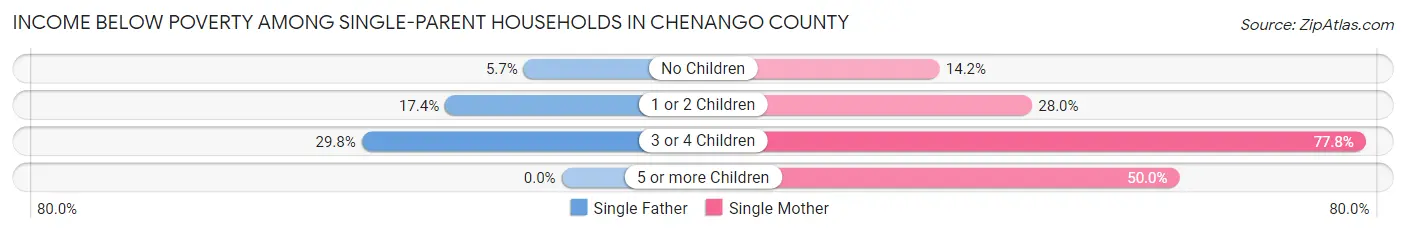
| Children | Single Father | Single Mother |
| No Children | 33 (5.7%) | 116 (14.2%) |
| 1 or 2 Children | 110 (17.3%) | 311 (28.0%) |
| 3 or 4 Children | 42 (29.8%) | 70 (77.8%) |
| 5 or more Children | 0 (0.0%) | 17 (50.0%) |
| Total | 185 (13.6%) | 514 (25.0%) |
Income Below Poverty Among Married-Couple vs Single-Parent Households in Chenango County
The poverty data for Chenango County shows that 329 of the married-couple family households (3.6%) and 699 of the single-parent households (20.5%) are living below the poverty level. Within the married-couple family households, those with 5 or more children have the highest poverty rate, with 19 households (24.4%) falling below the poverty line. Among the single-parent households, those with 5 or more children have the highest poverty rate, with 17 household (50.0%) living below poverty.
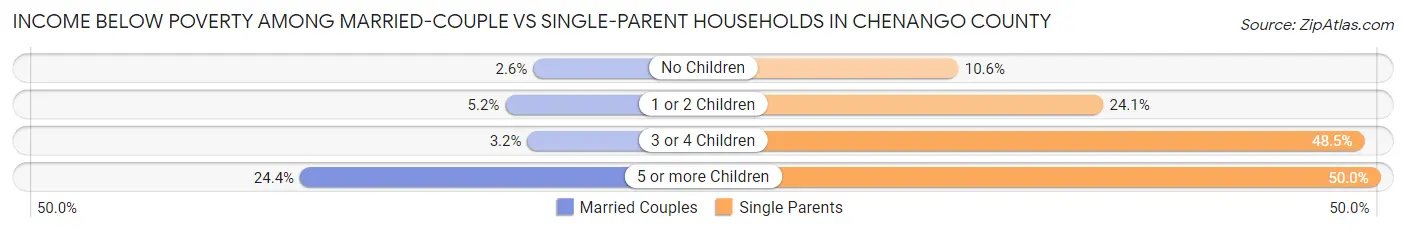
| Children | Married-Couple Families | Single-Parent Households |
| No Children | 159 (2.6%) | 149 (10.6%) |
| 1 or 2 Children | 132 (5.2%) | 421 (24.1%) |
| 3 or 4 Children | 19 (3.2%) | 112 (48.5%) |
| 5 or more Children | 19 (24.4%) | 17 (50.0%) |
| Total | 329 (3.6%) | 699 (20.5%) |
Race in Chenango County
The most populous races in Chenango County are White / Caucasian (44,432 | 94.3%), Two or more Races (1,338 | 2.8%), and Hispanic or Latino (1,125 | 2.4%).
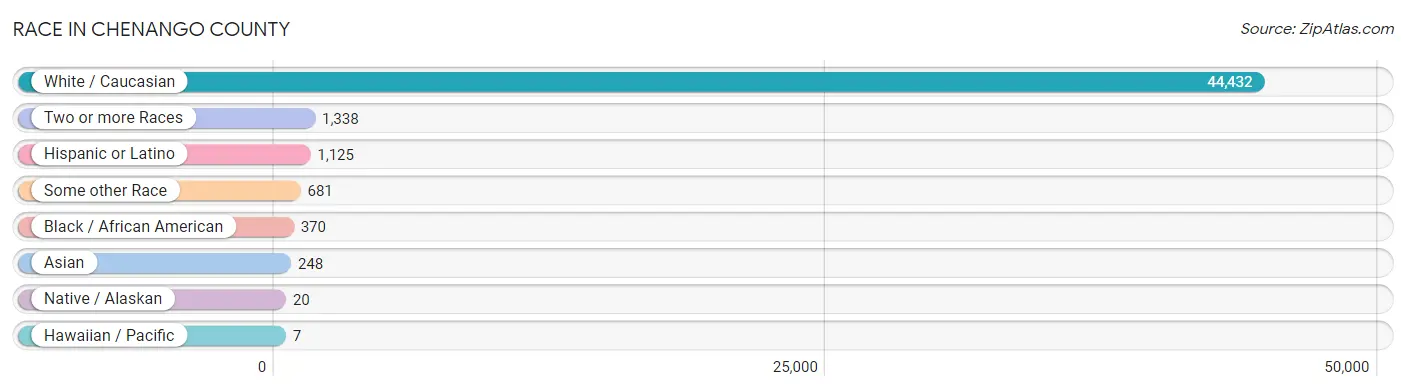
| Race | # Population | % Population |
| Asian | 248 | 0.5% |
| Black / African American | 370 | 0.8% |
| Hawaiian / Pacific | 7 | 0.0% |
| Hispanic or Latino | 1,125 | 2.4% |
| Native / Alaskan | 20 | 0.0% |
| White / Caucasian | 44,432 | 94.3% |
| Two or more Races | 1,338 | 2.8% |
| Some other Race | 681 | 1.5% |
| Total | 47,096 | 100.0% |
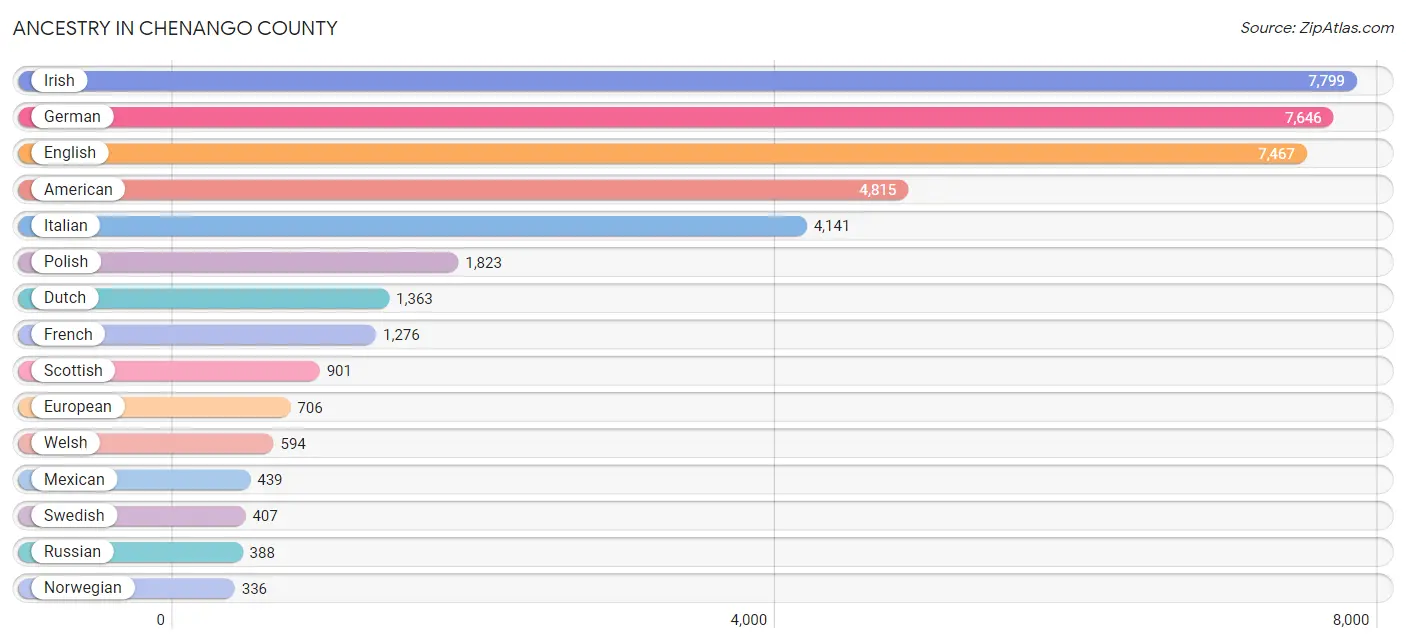
Ancestry in Chenango County
The most populous ancestries reported in Chenango County are Irish (7,799 | 16.6%), German (7,646 | 16.2%), English (7,467 | 15.9%), American (4,815 | 10.2%), and Italian (4,141 | 8.8%), together accounting for 67.6% of all Chenango County residents.
| Ancestry | # Population | % Population |
| African | 6 | 0.0% |
| Albanian | 12 | 0.0% |
| American | 4,815 | 10.2% |
| Apache | 3 | 0.0% |
| Arab | 64 | 0.1% |
| Argentinean | 1 | 0.0% |
| Armenian | 95 | 0.2% |
| Australian | 10 | 0.0% |
| Austrian | 34 | 0.1% |
| Belgian | 25 | 0.1% |
| Bhutanese | 9 | 0.0% |
| Blackfeet | 23 | 0.1% |
| Brazilian | 3 | 0.0% |
| British | 247 | 0.5% |
| British West Indian | 44 | 0.1% |
| Burmese | 33 | 0.1% |
| Canadian | 35 | 0.1% |
| Central American | 56 | 0.1% |
| Central American Indian | 7 | 0.0% |
| Cherokee | 31 | 0.1% |
| Chippewa | 1 | 0.0% |
| Colombian | 69 | 0.2% |
| Costa Rican | 30 | 0.1% |
| Croatian | 55 | 0.1% |
| Cuban | 28 | 0.1% |
| Czech | 211 | 0.4% |
| Czechoslovakian | 83 | 0.2% |
| Danish | 222 | 0.5% |
| Dominican | 67 | 0.1% |
| Dutch | 1,363 | 2.9% |
| Eastern European | 93 | 0.2% |
| Ecuadorian | 30 | 0.1% |
| Egyptian | 6 | 0.0% |
| English | 7,467 | 15.9% |
| Estonian | 8 | 0.0% |
| Ethiopian | 6 | 0.0% |
| European | 706 | 1.5% |
| Filipino | 3 | 0.0% |
| Finnish | 63 | 0.1% |
| French | 1,276 | 2.7% |
| French American Indian | 4 | 0.0% |
| French Canadian | 229 | 0.5% |
| German | 7,646 | 16.2% |
| Greek | 87 | 0.2% |
| Guamanian / Chamorro | 2 | 0.0% |
| Guatemalan | 10 | 0.0% |
| Guyanese | 31 | 0.1% |
| Haitian | 30 | 0.1% |
| Hungarian | 142 | 0.3% |
| Indian (Asian) | 115 | 0.2% |
| Iranian | 2 | 0.0% |
| Irish | 7,799 | 16.6% |
| Iroquois | 13 | 0.0% |
| Israeli | 5 | 0.0% |
| Italian | 4,141 | 8.8% |
| Jamaican | 18 | 0.0% |
| Korean | 145 | 0.3% |
| Lebanese | 28 | 0.1% |
| Lithuanian | 309 | 0.7% |
| Maltese | 3 | 0.0% |
| Mexican | 439 | 0.9% |
| Native Hawaiian | 43 | 0.1% |
| Nicaraguan | 16 | 0.0% |
| Northern European | 35 | 0.1% |
| Norwegian | 336 | 0.7% |
| Pennsylvania German | 17 | 0.0% |
| Peruvian | 11 | 0.0% |
| Polish | 1,823 | 3.9% |
| Portuguese | 30 | 0.1% |
| Puerto Rican | 293 | 0.6% |
| Romanian | 18 | 0.0% |
| Russian | 388 | 0.8% |
| Samoan | 10 | 0.0% |
| Scandinavian | 79 | 0.2% |
| Scotch-Irish | 288 | 0.6% |
| Scottish | 901 | 1.9% |
| Sioux | 1 | 0.0% |
| Slavic | 79 | 0.2% |
| Slovak | 101 | 0.2% |
| South American | 111 | 0.2% |
| Spaniard | 70 | 0.2% |
| Spanish | 22 | 0.1% |
| Subsaharan African | 12 | 0.0% |
| Swedish | 407 | 0.9% |
| Swiss | 134 | 0.3% |
| Syrian | 30 | 0.1% |
| Thai | 16 | 0.0% |
| Turkish | 109 | 0.2% |
| Ukrainian | 109 | 0.2% |
| Vietnamese | 32 | 0.1% |
| Welsh | 594 | 1.3% |
| West Indian | 3 | 0.0% | View All 92 Rows |
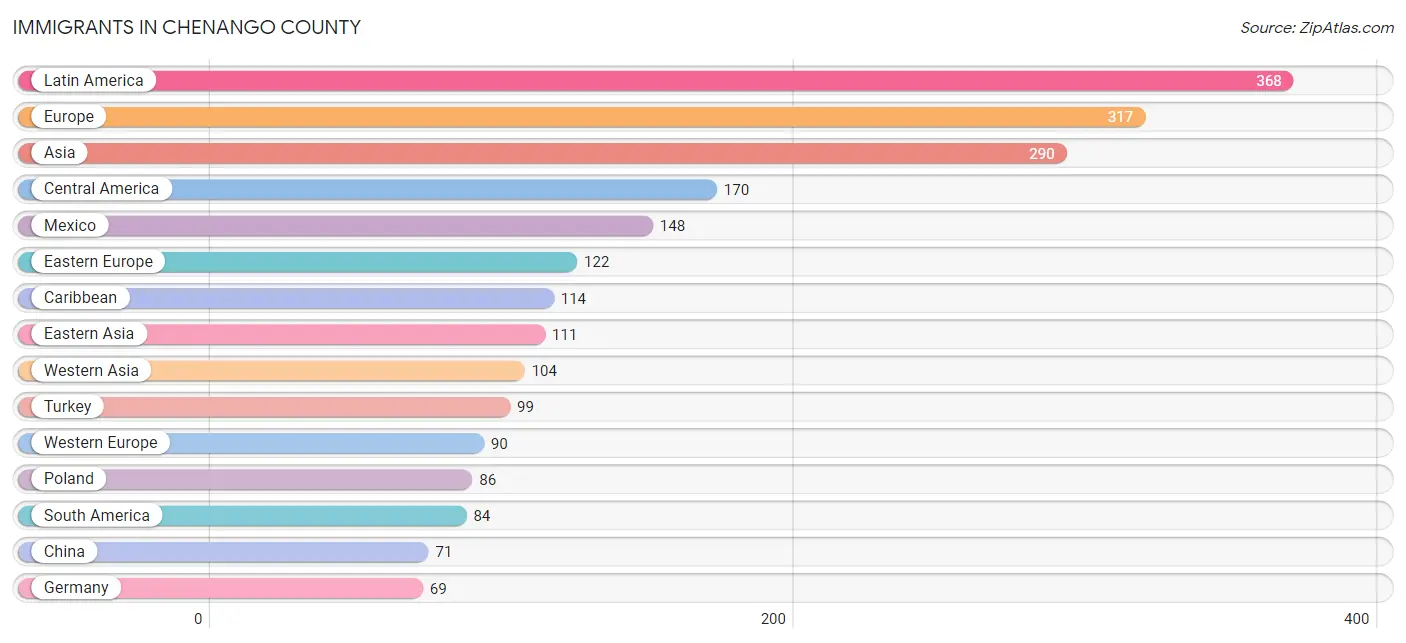
Immigrants in Chenango County
The most numerous immigrant groups reported in Chenango County came from Latin America (368 | 0.8%), Europe (317 | 0.7%), Asia (290 | 0.6%), Central America (170 | 0.4%), and Mexico (148 | 0.3%), together accounting for 2.7% of all Chenango County residents.
| Immigration Origin | # Population | % Population |
| Africa | 9 | 0.0% |
| Argentina | 7 | 0.0% |
| Asia | 290 | 0.6% |
| Australia | 7 | 0.0% |
| Austria | 8 | 0.0% |
| Brazil | 3 | 0.0% |
| Canada | 57 | 0.1% |
| Caribbean | 114 | 0.2% |
| Central America | 170 | 0.4% |
| China | 71 | 0.2% |
| Colombia | 35 | 0.1% |
| Costa Rica | 22 | 0.1% |
| Croatia | 17 | 0.0% |
| Cuba | 19 | 0.0% |
| Dominican Republic | 36 | 0.1% |
| Eastern Africa | 6 | 0.0% |
| Eastern Asia | 111 | 0.2% |
| Eastern Europe | 122 | 0.3% |
| Ecuador | 20 | 0.0% |
| England | 21 | 0.0% |
| Ethiopia | 6 | 0.0% |
| Europe | 317 | 0.7% |
| France | 6 | 0.0% |
| Germany | 69 | 0.2% |
| Guyana | 18 | 0.0% |
| Haiti | 18 | 0.0% |
| Hungary | 7 | 0.0% |
| India | 13 | 0.0% |
| Iran | 2 | 0.0% |
| Ireland | 10 | 0.0% |
| Israel | 5 | 0.0% |
| Italy | 21 | 0.0% |
| Jamaica | 24 | 0.1% |
| Japan | 9 | 0.0% |
| Korea | 31 | 0.1% |
| Latin America | 368 | 0.8% |
| Mexico | 148 | 0.3% |
| Netherlands | 3 | 0.0% |
| Northern Europe | 63 | 0.1% |
| Norway | 13 | 0.0% |
| Oceania | 11 | 0.0% |
| Peru | 1 | 0.0% |
| Philippines | 60 | 0.1% |
| Poland | 86 | 0.2% |
| Romania | 9 | 0.0% |
| South Africa | 3 | 0.0% |
| South America | 84 | 0.2% |
| South Central Asia | 15 | 0.0% |
| South Eastern Asia | 60 | 0.1% |
| Southern Europe | 42 | 0.1% |
| Spain | 21 | 0.0% |
| St. Vincent and the Grenadines | 1 | 0.0% |
| Switzerland | 4 | 0.0% |
| Turkey | 99 | 0.2% |
| West Indies | 16 | 0.0% |
| Western Asia | 104 | 0.2% |
| Western Europe | 90 | 0.2% | View All 57 Rows |
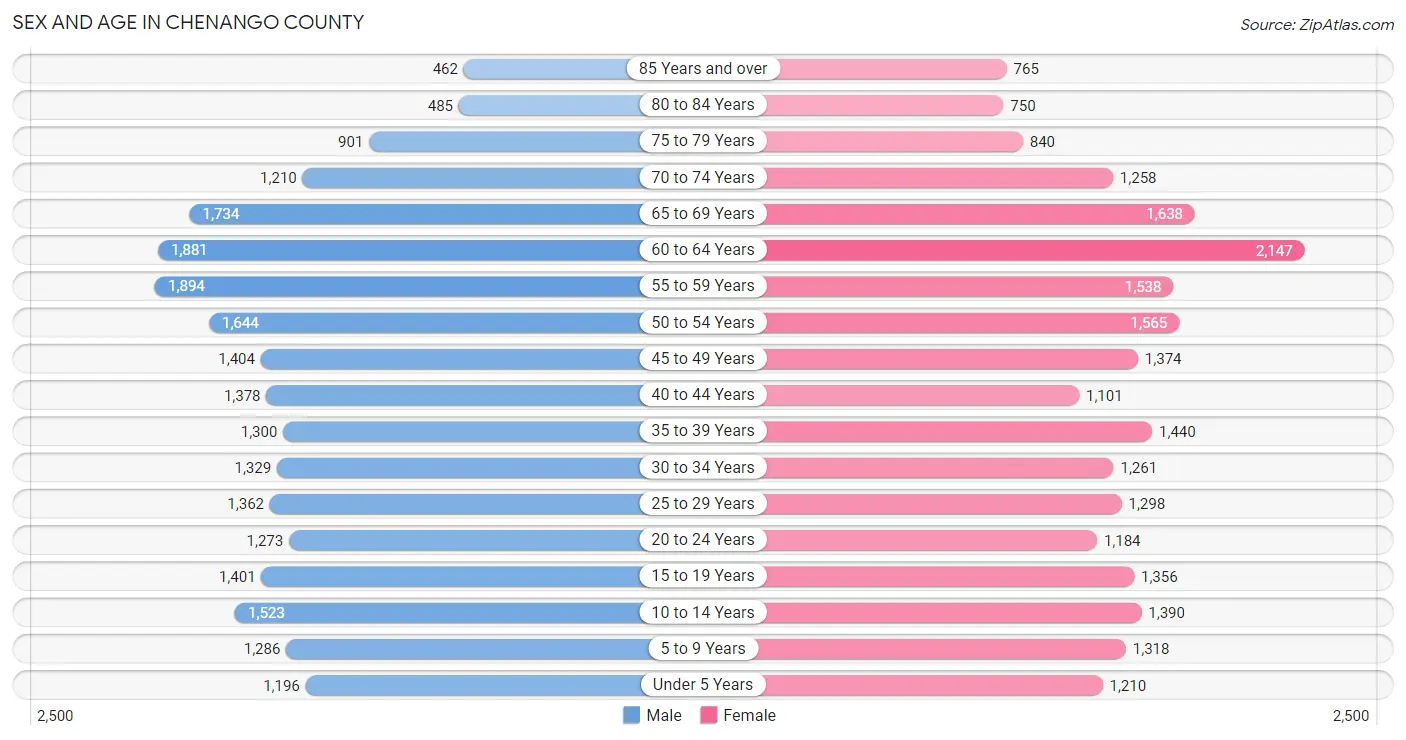
Sex and Age in Chenango County
Sex and Age in Chenango County
The most populous age groups in Chenango County are 55 to 59 Years (1,894 | 8.0%) for men and 60 to 64 Years (2,147 | 9.2%) for women.
| Age Bracket | Male | Female |
| Under 5 Years | 1,196 (5.1%) | 1,210 (5.2%) |
| 5 to 9 Years | 1,286 (5.4%) | 1,318 (5.6%) |
| 10 to 14 Years | 1,523 (6.4%) | 1,390 (5.9%) |
| 15 to 19 Years | 1,401 (5.9%) | 1,356 (5.8%) |
| 20 to 24 Years | 1,273 (5.4%) | 1,184 (5.1%) |
| 25 to 29 Years | 1,362 (5.8%) | 1,298 (5.5%) |
| 30 to 34 Years | 1,329 (5.6%) | 1,261 (5.4%) |
| 35 to 39 Years | 1,300 (5.5%) | 1,440 (6.1%) |
| 40 to 44 Years | 1,378 (5.8%) | 1,101 (4.7%) |
| 45 to 49 Years | 1,404 (5.9%) | 1,374 (5.9%) |
| 50 to 54 Years | 1,644 (7.0%) | 1,565 (6.7%) |
| 55 to 59 Years | 1,894 (8.0%) | 1,538 (6.6%) |
| 60 to 64 Years | 1,881 (8.0%) | 2,147 (9.2%) |
| 65 to 69 Years | 1,734 (7.3%) | 1,638 (7.0%) |
| 70 to 74 Years | 1,210 (5.1%) | 1,258 (5.4%) |
| 75 to 79 Years | 901 (3.8%) | 840 (3.6%) |
| 80 to 84 Years | 485 (2.1%) | 750 (3.2%) |
| 85 Years and over | 462 (1.9%) | 765 (3.3%) |
| Total | 23,663 (100.0%) | 23,433 (100.0%) |
Families and Households in Chenango County
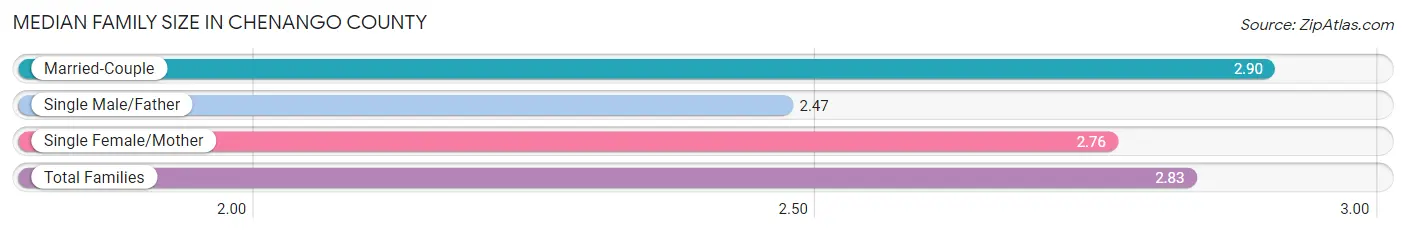
Median Family Size in Chenango County
The median family size in Chenango County is 2.83 persons per family, with married-couple families (9,224 | 73.0%) accounting for the largest median family size of 2.9 persons per family. On the other hand, single male/father families (1,359 | 10.7%) represent the smallest median family size with 2.47 persons per family.
| Family Type | # Families | Family Size |
| Married-Couple | 9,224 (73.0%) | 2.90 |
| Single Male/Father | 1,359 (10.7%) | 2.47 |
| Single Female/Mother | 2,054 (16.3%) | 2.76 |
| Total Families | 12,637 (100.0%) | 2.83 |
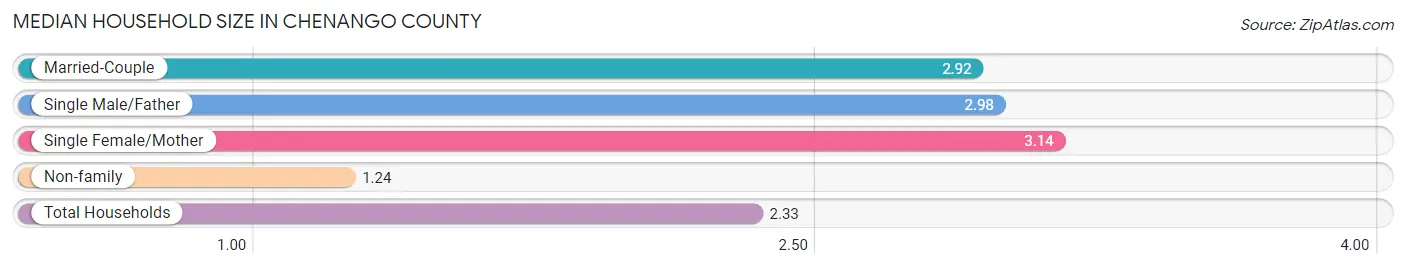
Median Household Size in Chenango County
The median household size in Chenango County is 2.33 persons per household, with single female/mother households (2,054 | 10.3%) accounting for the largest median household size of 3.14 persons per household. non-family households (7,249 | 36.4%) represent the smallest median household size with 1.24 persons per household.
| Household Type | # Households | Household Size |
| Married-Couple | 9,224 (46.4%) | 2.92 |
| Single Male/Father | 1,359 (6.8%) | 2.98 |
| Single Female/Mother | 2,054 (10.3%) | 3.14 |
| Non-family | 7,249 (36.4%) | 1.24 |
| Total Households | 19,886 (100.0%) | 2.33 |
Household Size by Marriage Status in Chenango County
Out of a total of 19,886 households in Chenango County, 12,637 (63.5%) are family households, while 7,249 (36.4%) are nonfamily households. The most numerous type of family households are 2-person households, comprising 6,215, and the most common type of nonfamily households are 1-person households, comprising 5,856.
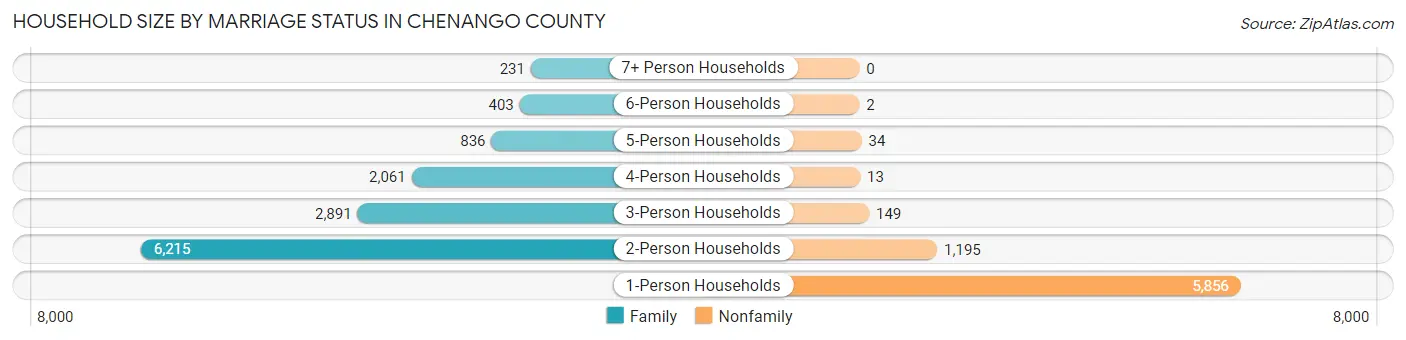
| Household Size | Family Households | Nonfamily Households |
| 1-Person Households | - | 5,856 (29.4%) |
| 2-Person Households | 6,215 (31.2%) | 1,195 (6.0%) |
| 3-Person Households | 2,891 (14.5%) | 149 (0.7%) |
| 4-Person Households | 2,061 (10.4%) | 13 (0.1%) |
| 5-Person Households | 836 (4.2%) | 34 (0.2%) |
| 6-Person Households | 403 (2.0%) | 2 (0.0%) |
| 7+ Person Households | 231 (1.2%) | 0 (0.0%) |
| Total | 12,637 (63.5%) | 7,249 (36.4%) |
Female Fertility in Chenango County
Fertility by Age in Chenango County
Average fertility rate in Chenango County is 60.0 births per 1,000 women. Women in the age bracket of 20 to 34 years have the highest fertility rate with 105.0 births per 1,000 women. Women in the age bracket of 20 to 34 years acount for 70.4% of all women with births.
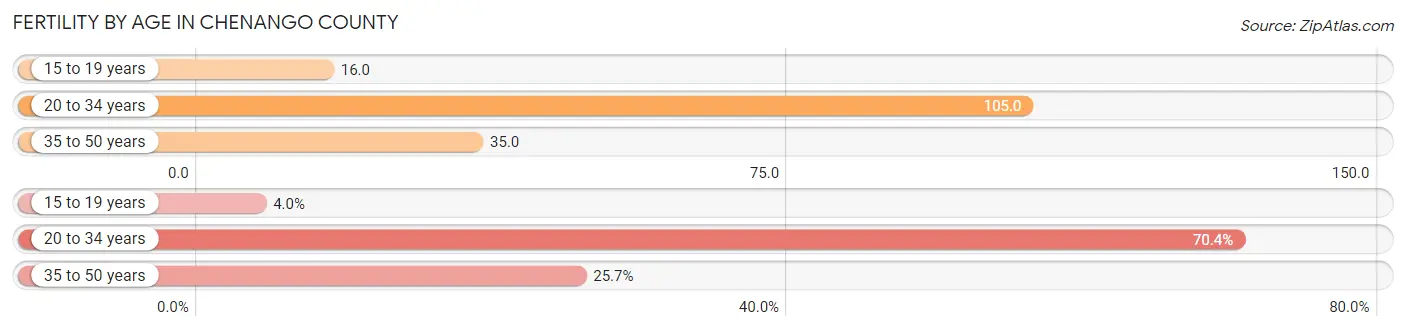
| Age Bracket | Women with Births | Births / 1,000 Women |
| 15 to 19 years | 22 (4.0%) | 16.0 |
| 20 to 34 years | 392 (70.4%) | 105.0 |
| 35 to 50 years | 143 (25.7%) | 35.0 |
| Total | 557 (100.0%) | 60.0 |
Fertility by Age by Marriage Status in Chenango County
67.7% of women with births (557) in Chenango County are married. The highest percentage of unmarried women with births falls into 15 to 19 years age bracket with 100.0% of them unmarried at the time of birth, while the lowest percentage of unmarried women with births belong to 35 to 50 years age bracket with 3.5% of them unmarried.
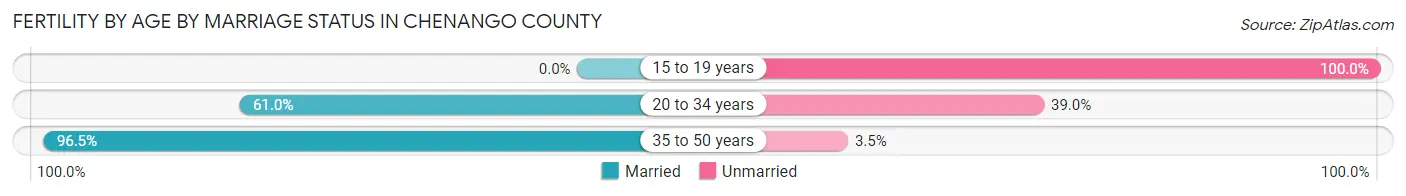
| Age Bracket | Married | Unmarried |
| 15 to 19 years | 0 (0.0%) | 22 (100.0%) |
| 20 to 34 years | 239 (61.0%) | 153 (39.0%) |
| 35 to 50 years | 138 (96.5%) | 5 (3.5%) |
| Total | 377 (67.7%) | 180 (32.3%) |
Fertility by Education in Chenango County
Average fertility rate in Chenango County is 60.0 births per 1,000 women. Women with the education attainment of graduate degree have the highest fertility rate of 120.0 births per 1,000 women, while women with the education attainment of less than high school have the lowest fertility at 14.0 births per 1,000 women. Women with the education attainment of high school diploma represent 33.6% of all women with births.
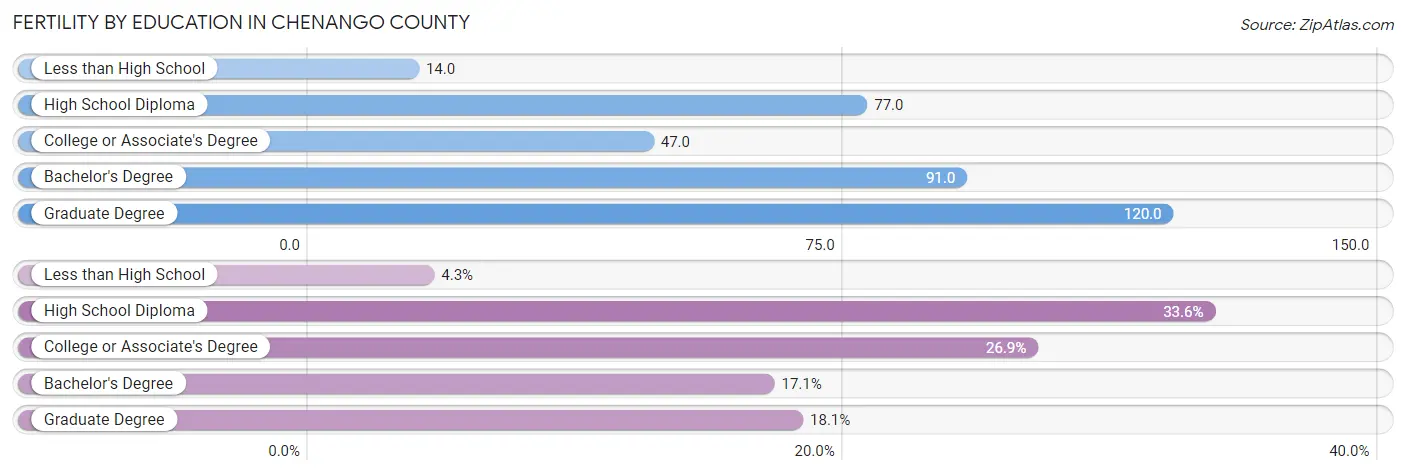
| Educational Attainment | Women with Births | Births / 1,000 Women |
| Less than High School | 24 (4.3%) | 14.0 |
| High School Diploma | 187 (33.6%) | 77.0 |
| College or Associate's Degree | 150 (26.9%) | 47.0 |
| Bachelor's Degree | 95 (17.1%) | 91.0 |
| Graduate Degree | 101 (18.1%) | 120.0 |
| Total | 557 (100.0%) | 60.0 |
Fertility by Education by Marriage Status in Chenango County
32.3% of women with births in Chenango County are unmarried. Women with the educational attainment of graduate degree are most likely to be married with 88.1% of them married at childbirth, while women with the educational attainment of less than high school are least likely to be married with 75.0% of them unmarried at childbirth.
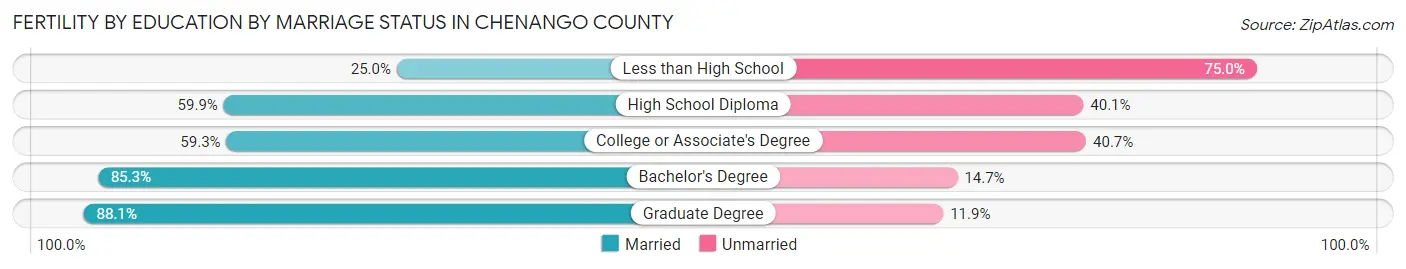
| Educational Attainment | Married | Unmarried |
| Less than High School | 6 (25.0%) | 18 (75.0%) |
| High School Diploma | 112 (59.9%) | 75 (40.1%) |
| College or Associate's Degree | 89 (59.3%) | 61 (40.7%) |
| Bachelor's Degree | 81 (85.3%) | 14 (14.7%) |
| Graduate Degree | 89 (88.1%) | 12 (11.9%) |
| Total | 377 (67.7%) | 180 (32.3%) |
Employment Characteristics in Chenango County
Employment by Class of Employer in Chenango County
Among the 20,856 employed individuals in Chenango County, private company employees (12,761 | 61.2%), not-for-profit organizations (2,377 | 11.4%), and local government employees (2,217 | 10.6%) make up the most common classes of employment.
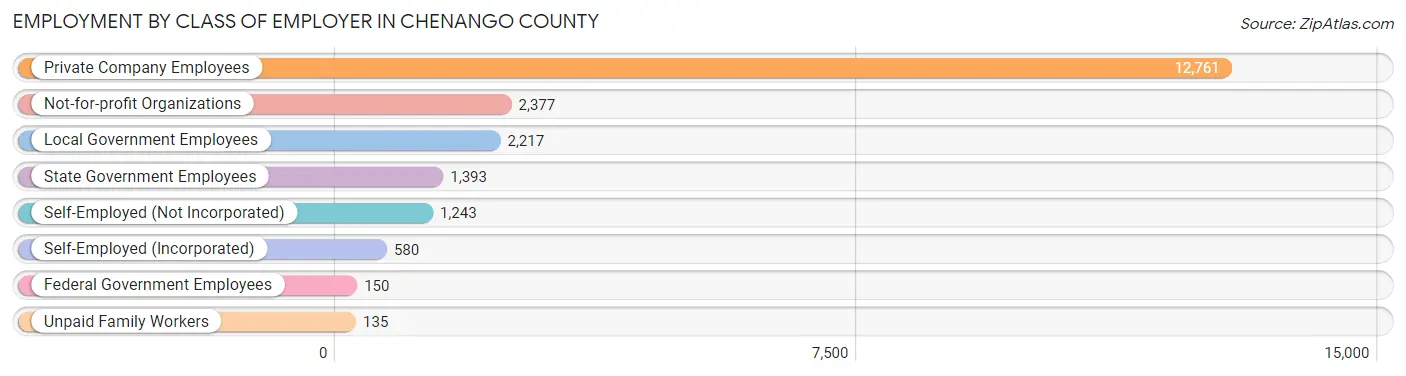
| Employer Class | # Employees | % Employees |
| Private Company Employees | 12,761 | 61.2% |
| Self-Employed (Incorporated) | 580 | 2.8% |
| Self-Employed (Not Incorporated) | 1,243 | 6.0% |
| Not-for-profit Organizations | 2,377 | 11.4% |
| Local Government Employees | 2,217 | 10.6% |
| State Government Employees | 1,393 | 6.7% |
| Federal Government Employees | 150 | 0.7% |
| Unpaid Family Workers | 135 | 0.6% |
| Total | 20,856 | 100.0% |
Employment Status by Age in Chenango County
According to the labor force statistics for Chenango County, out of the total population over 16 years of age (38,574), 59.3% or 22,874 individuals are in the labor force, with 7.1% or 1,624 of them unemployed. The age group with the highest labor force participation rate is 20 to 24 years, with 86.9% or 2,135 individuals in the labor force. Within the labor force, the 16 to 19 years age range has the highest percentage of unemployed individuals, with 22.5% or 234 of them being unemployed.
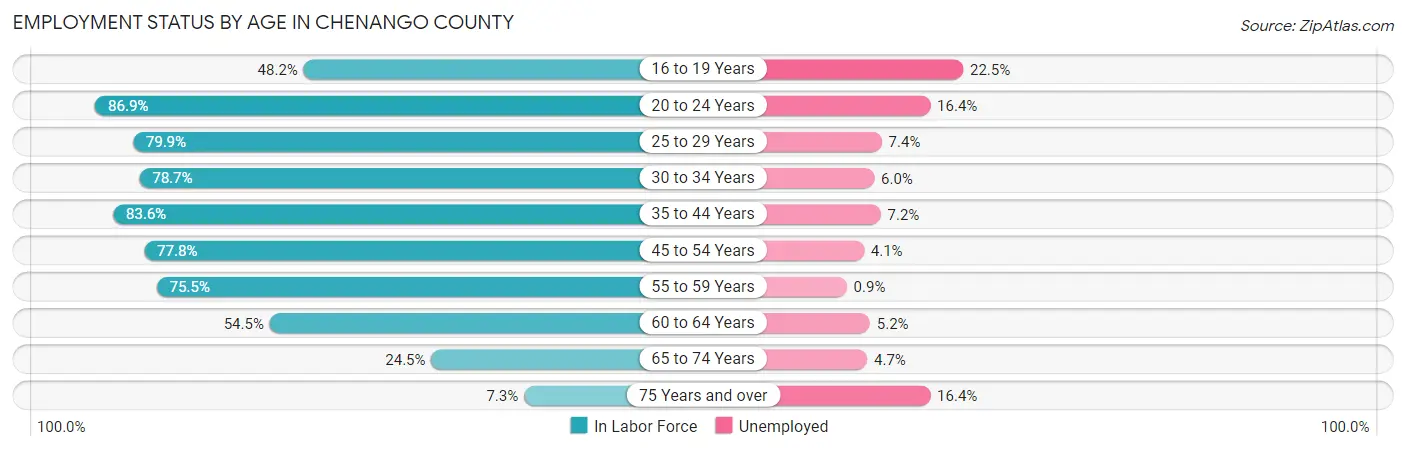
| Age Bracket | In Labor Force | Unemployed |
| 16 to 19 Years | 1,040 (48.2%) | 234 (22.5%) |
| 20 to 24 Years | 2,135 (86.9%) | 350 (16.4%) |
| 25 to 29 Years | 2,125 (79.9%) | 157 (7.4%) |
| 30 to 34 Years | 2,038 (78.7%) | 122 (6.0%) |
| 35 to 44 Years | 4,363 (83.6%) | 314 (7.2%) |
| 45 to 54 Years | 4,658 (77.8%) | 191 (4.1%) |
| 55 to 59 Years | 2,591 (75.5%) | 23 (0.9%) |
| 60 to 64 Years | 2,195 (54.5%) | 114 (5.2%) |
| 65 to 74 Years | 1,431 (24.5%) | 67 (4.7%) |
| 75 Years and over | 307 (7.3%) | 50 (16.4%) |
| Total | 22,874 (59.3%) | 1,624 (7.1%) |
Employment Status by Educational Attainment in Chenango County
According to labor force statistics for Chenango County, 75.1% of individuals (17,961) out of the total population between 25 and 64 years of age (23,916) are in the labor force, with 5.1% or 916 of them being unemployed. The group with the highest labor force participation rate are those with the educational attainment of bachelor's degree or higher, with 88.2% or 3,711 individuals in the labor force. Within the labor force, individuals with high school diploma education have the highest percentage of unemployment, with 7.2% or 489 of them being unemployed.
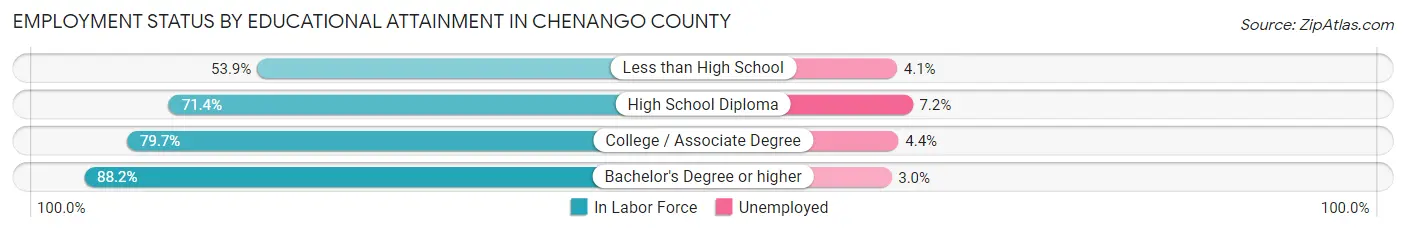
| Educational Attainment | In Labor Force | Unemployed |
| Less than High School | 1,391 (53.9%) | 106 (4.1%) |
| High School Diploma | 6,787 (71.4%) | 684 (7.2%) |
| College / Associate Degree | 6,075 (79.7%) | 335 (4.4%) |
| Bachelor's Degree or higher | 3,711 (88.2%) | 126 (3.0%) |
| Total | 17,961 (75.1%) | 1,220 (5.1%) |
Employment Occupations by Sex in Chenango County
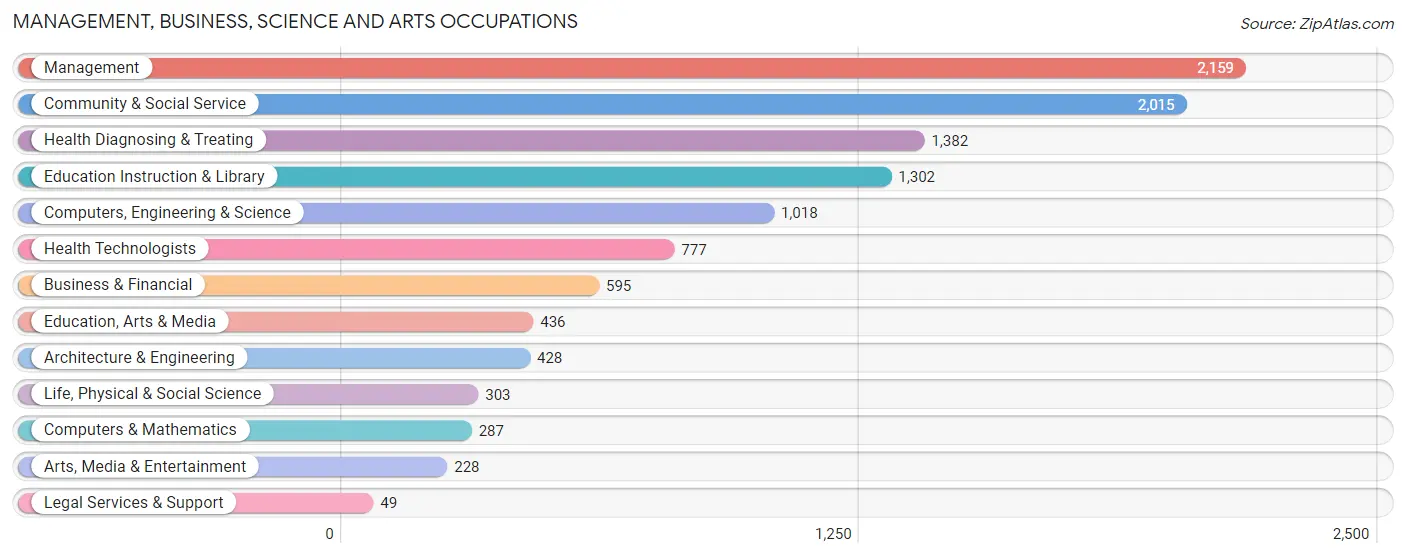
Management, Business, Science and Arts Occupations
The most common Management, Business, Science and Arts occupations in Chenango County are Management (2,159 | 10.2%), Community & Social Service (2,015 | 9.5%), Health Diagnosing & Treating (1,382 | 6.5%), Education Instruction & Library (1,302 | 6.1%), and Computers, Engineering & Science (1,018 | 4.8%).
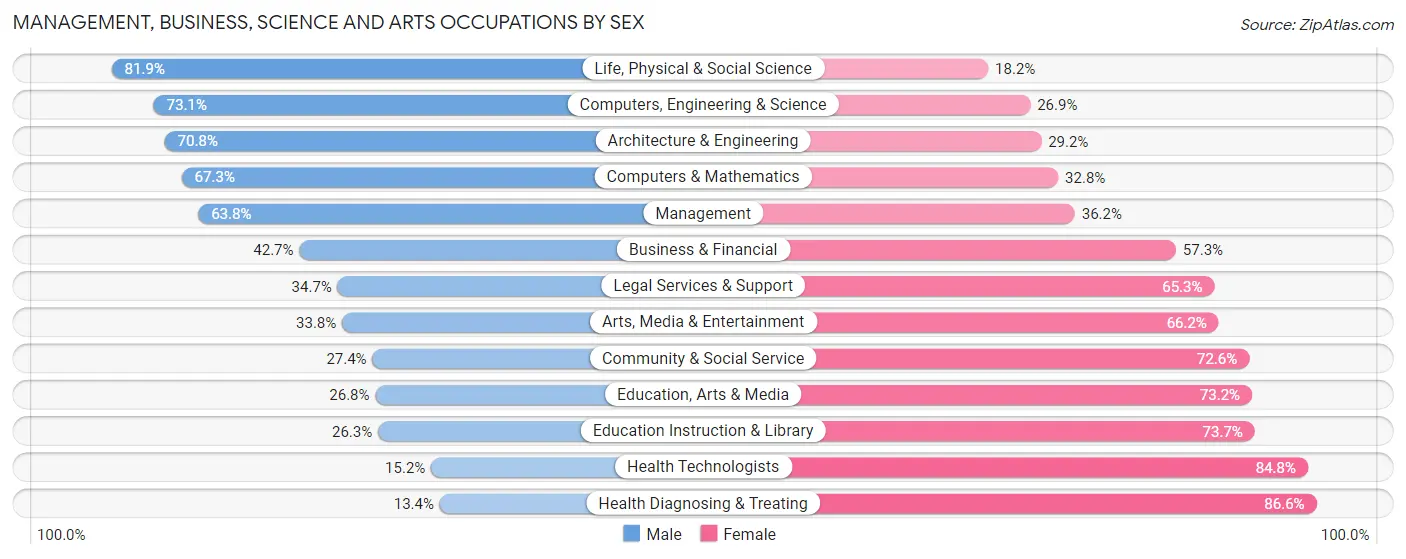
Management, Business, Science and Arts Occupations by Sex
Within the Management, Business, Science and Arts occupations in Chenango County, the most male-oriented occupations are Life, Physical & Social Science (81.9%), Computers, Engineering & Science (73.1%), and Architecture & Engineering (70.8%), while the most female-oriented occupations are Health Diagnosing & Treating (86.6%), Health Technologists (84.8%), and Education Instruction & Library (73.7%).
| Occupation | Male | Female |
| Management | 1,377 (63.8%) | 782 (36.2%) |
| Business & Financial | 254 (42.7%) | 341 (57.3%) |
| Computers, Engineering & Science | 744 (73.1%) | 274 (26.9%) |
| Computers & Mathematics | 193 (67.2%) | 94 (32.8%) |
| Architecture & Engineering | 303 (70.8%) | 125 (29.2%) |
| Life, Physical & Social Science | 248 (81.9%) | 55 (18.1%) |
| Community & Social Service | 553 (27.4%) | 1,462 (72.6%) |
| Education, Arts & Media | 117 (26.8%) | 319 (73.2%) |
| Legal Services & Support | 17 (34.7%) | 32 (65.3%) |
| Education Instruction & Library | 342 (26.3%) | 960 (73.7%) |
| Arts, Media & Entertainment | 77 (33.8%) | 151 (66.2%) |
| Health Diagnosing & Treating | 185 (13.4%) | 1,197 (86.6%) |
| Health Technologists | 118 (15.2%) | 659 (84.8%) |
| Total (Category) | 3,113 (43.4%) | 4,056 (56.6%) |
| Total (Overall) | 11,301 (53.2%) | 9,933 (46.8%) |
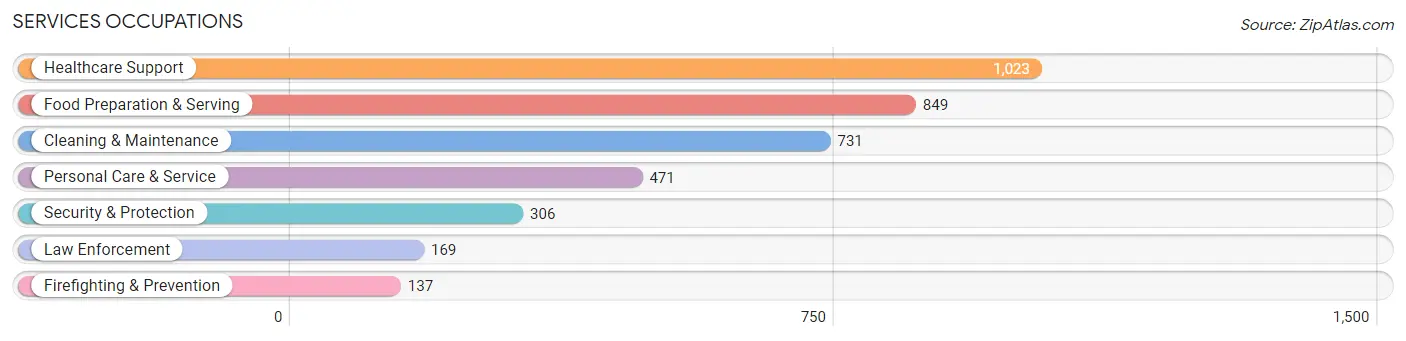
Services Occupations
The most common Services occupations in Chenango County are Healthcare Support (1,023 | 4.8%), Food Preparation & Serving (849 | 4.0%), Cleaning & Maintenance (731 | 3.4%), Personal Care & Service (471 | 2.2%), and Security & Protection (306 | 1.4%).
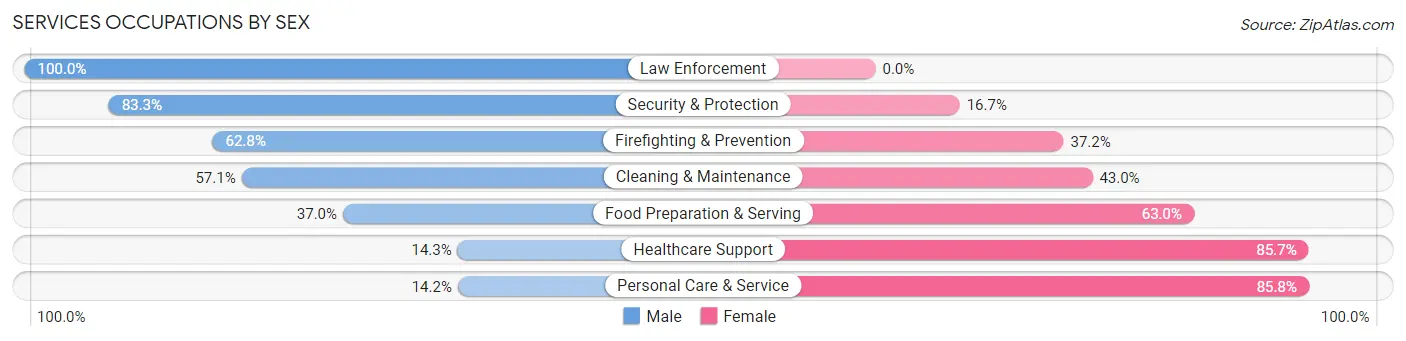
Services Occupations by Sex
Within the Services occupations in Chenango County, the most male-oriented occupations are Law Enforcement (100.0%), Security & Protection (83.3%), and Firefighting & Prevention (62.8%), while the most female-oriented occupations are Personal Care & Service (85.8%), Healthcare Support (85.7%), and Food Preparation & Serving (63.0%).
| Occupation | Male | Female |
| Healthcare Support | 146 (14.3%) | 877 (85.7%) |
| Security & Protection | 255 (83.3%) | 51 (16.7%) |
| Firefighting & Prevention | 86 (62.8%) | 51 (37.2%) |
| Law Enforcement | 169 (100.0%) | 0 (0.0%) |
| Food Preparation & Serving | 314 (37.0%) | 535 (63.0%) |
| Cleaning & Maintenance | 417 (57.1%) | 314 (42.9%) |
| Personal Care & Service | 67 (14.2%) | 404 (85.8%) |
| Total (Category) | 1,199 (35.5%) | 2,181 (64.5%) |
| Total (Overall) | 11,301 (53.2%) | 9,933 (46.8%) |
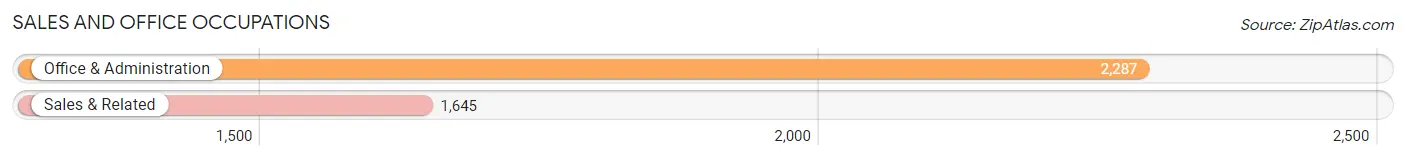
Sales and Office Occupations
The most common Sales and Office occupations in Chenango County are Office & Administration (2,287 | 10.8%), and Sales & Related (1,645 | 7.7%).
Sales and Office Occupations by Sex
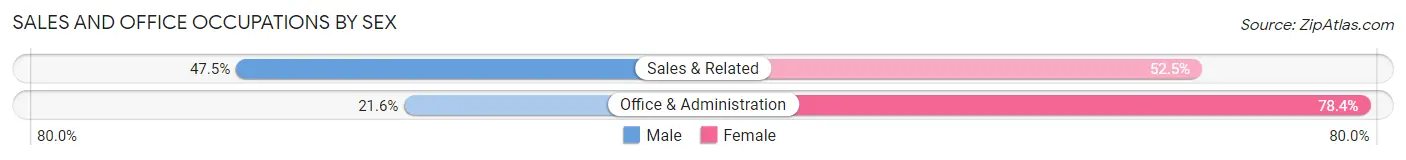
| Occupation | Male | Female |
| Sales & Related | 781 (47.5%) | 864 (52.5%) |
| Office & Administration | 494 (21.6%) | 1,793 (78.4%) |
| Total (Category) | 1,275 (32.4%) | 2,657 (67.6%) |
| Total (Overall) | 11,301 (53.2%) | 9,933 (46.8%) |
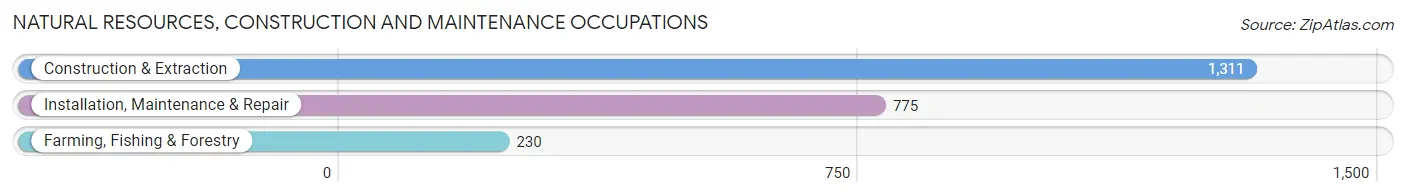
Natural Resources, Construction and Maintenance Occupations
The most common Natural Resources, Construction and Maintenance occupations in Chenango County are Construction & Extraction (1,311 | 6.2%), Installation, Maintenance & Repair (775 | 3.6%), and Farming, Fishing & Forestry (230 | 1.1%).
Natural Resources, Construction and Maintenance Occupations by Sex
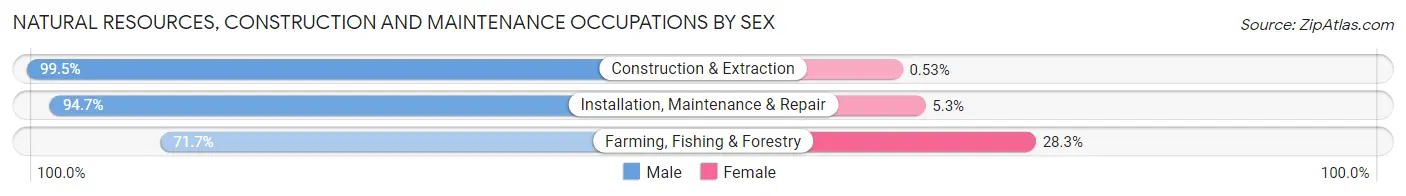
| Occupation | Male | Female |
| Farming, Fishing & Forestry | 165 (71.7%) | 65 (28.3%) |
| Construction & Extraction | 1,304 (99.5%) | 7 (0.5%) |
| Installation, Maintenance & Repair | 734 (94.7%) | 41 (5.3%) |
| Total (Category) | 2,203 (95.1%) | 113 (4.9%) |
| Total (Overall) | 11,301 (53.2%) | 9,933 (46.8%) |
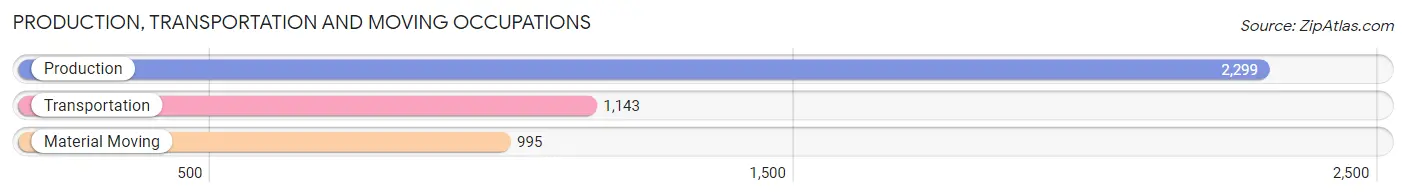
Production, Transportation and Moving Occupations
The most common Production, Transportation and Moving occupations in Chenango County are Production (2,299 | 10.8%), Transportation (1,143 | 5.4%), and Material Moving (995 | 4.7%).
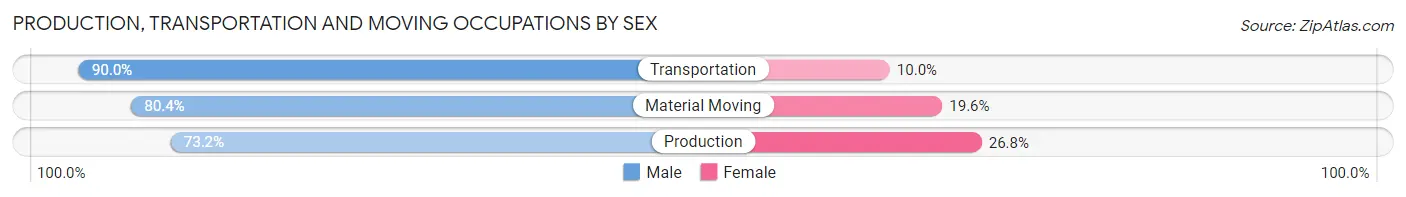
Production, Transportation and Moving Occupations by Sex
| Occupation | Male | Female |
| Production | 1,682 (73.2%) | 617 (26.8%) |
| Transportation | 1,029 (90.0%) | 114 (10.0%) |
| Material Moving | 800 (80.4%) | 195 (19.6%) |
| Total (Category) | 3,511 (79.1%) | 926 (20.9%) |
| Total (Overall) | 11,301 (53.2%) | 9,933 (46.8%) |
Employment Industries by Sex in Chenango County
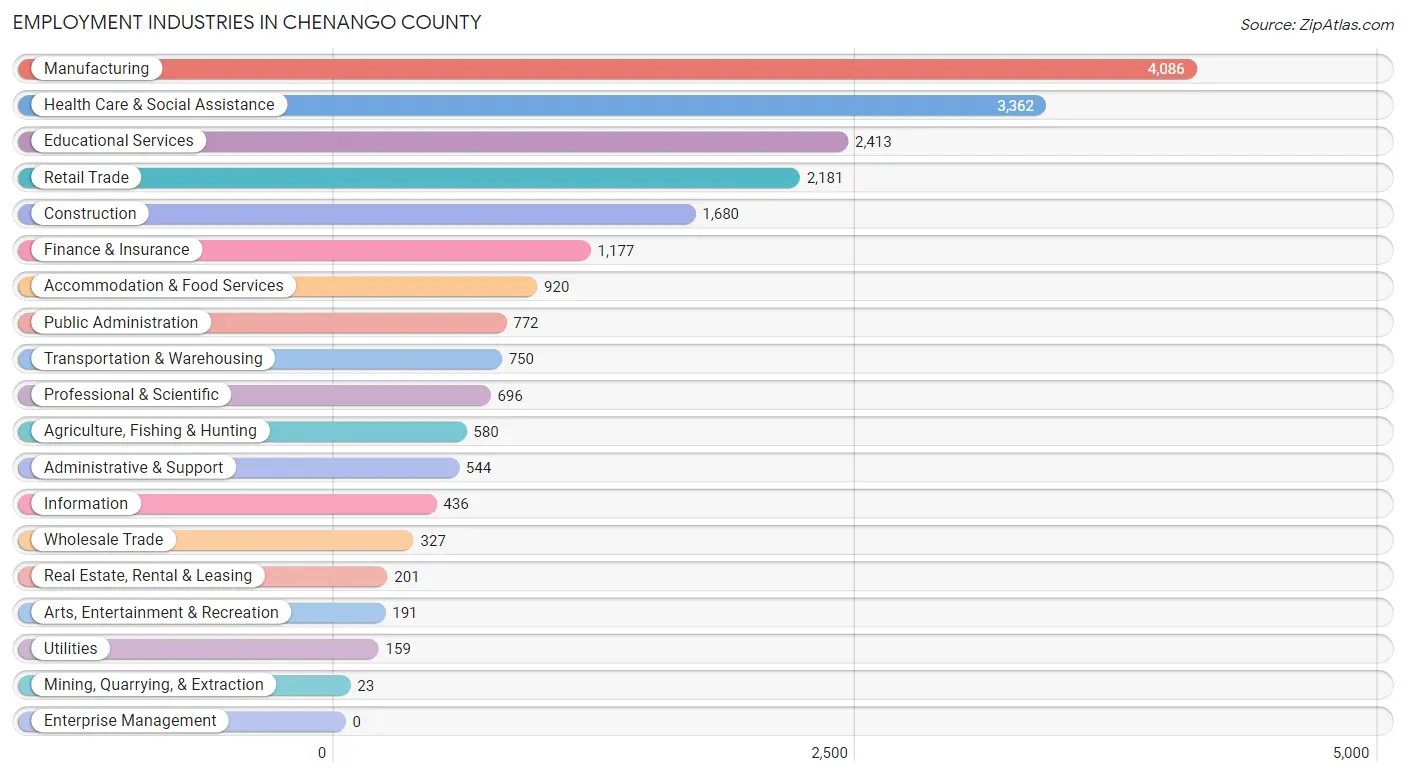
Employment Industries in Chenango County
The major employment industries in Chenango County include Manufacturing (4,086 | 19.2%), Health Care & Social Assistance (3,362 | 15.8%), Educational Services (2,413 | 11.4%), Retail Trade (2,181 | 10.3%), and Construction (1,680 | 7.9%).
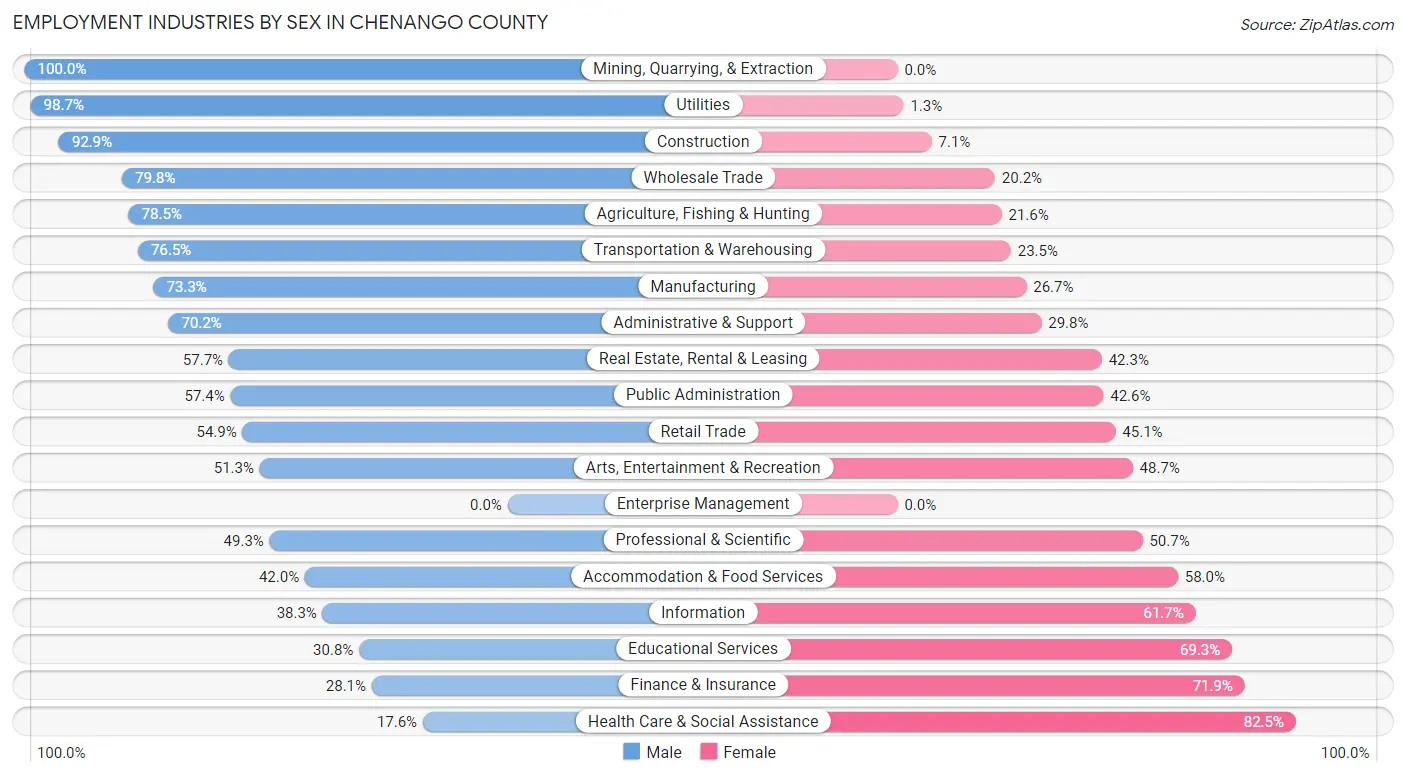
Employment Industries by Sex in Chenango County
The Chenango County industries that see more men than women are Mining, Quarrying, & Extraction (100.0%), Utilities (98.7%), and Construction (92.9%), whereas the industries that tend to have a higher number of women are Health Care & Social Assistance (82.5%), Finance & Insurance (71.9%), and Educational Services (69.3%).
| Industry | Male | Female |
| Agriculture, Fishing & Hunting | 455 (78.4%) | 125 (21.5%) |
| Mining, Quarrying, & Extraction | 23 (100.0%) | 0 (0.0%) |
| Construction | 1,561 (92.9%) | 119 (7.1%) |
| Manufacturing | 2,996 (73.3%) | 1,090 (26.7%) |
| Wholesale Trade | 261 (79.8%) | 66 (20.2%) |
| Retail Trade | 1,197 (54.9%) | 984 (45.1%) |
| Transportation & Warehousing | 574 (76.5%) | 176 (23.5%) |
| Utilities | 157 (98.7%) | 2 (1.3%) |
| Information | 167 (38.3%) | 269 (61.7%) |
| Finance & Insurance | 331 (28.1%) | 846 (71.9%) |
| Real Estate, Rental & Leasing | 116 (57.7%) | 85 (42.3%) |
| Professional & Scientific | 343 (49.3%) | 353 (50.7%) |
| Enterprise Management | 0 (0.0%) | 0 (0.0%) |
| Administrative & Support | 382 (70.2%) | 162 (29.8%) |
| Educational Services | 742 (30.7%) | 1,671 (69.3%) |
| Health Care & Social Assistance | 590 (17.5%) | 2,772 (82.5%) |
| Arts, Entertainment & Recreation | 98 (51.3%) | 93 (48.7%) |
| Accommodation & Food Services | 386 (42.0%) | 534 (58.0%) |
| Public Administration | 443 (57.4%) | 329 (42.6%) |
| Total | 11,301 (53.2%) | 9,933 (46.8%) |
Education in Chenango County
School Enrollment in Chenango County
The most common levels of schooling among the 9,065 students in Chenango County are middle school (2,327 | 25.7%), high school (2,156 | 23.8%), and elementary school (1,928 | 21.3%).
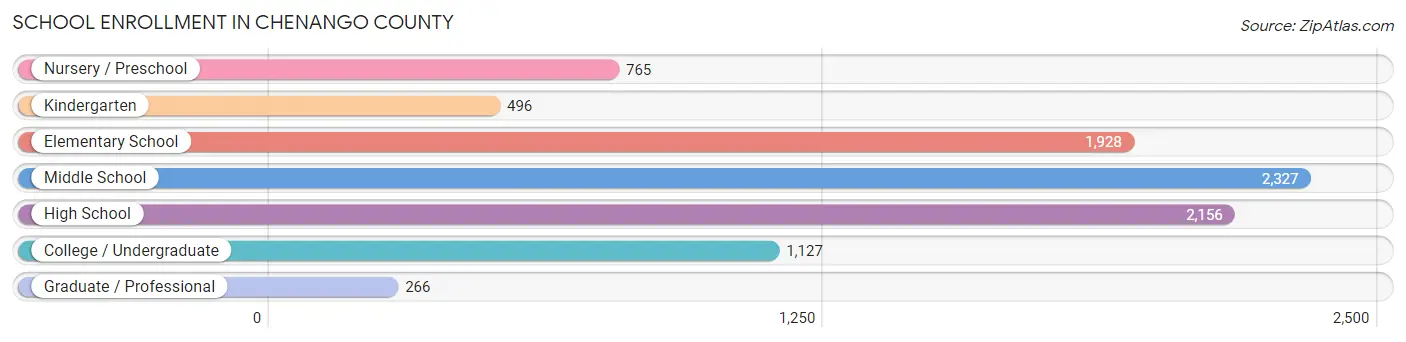
| School Level | # Students | % Students |
| Nursery / Preschool | 765 | 8.4% |
| Kindergarten | 496 | 5.5% |
| Elementary School | 1,928 | 21.3% |
| Middle School | 2,327 | 25.7% |
| High School | 2,156 | 23.8% |
| College / Undergraduate | 1,127 | 12.4% |
| Graduate / Professional | 266 | 2.9% |
| Total | 9,065 | 100.0% |
School Enrollment by Age by Funding Source in Chenango County
Out of a total of 9,065 students who are enrolled in schools in Chenango County, 861 (9.5%) attend a private institution, while the remaining 8,204 (90.5%) are enrolled in public schools. The age group of 25 to 34 year olds has the highest likelihood of being enrolled in private schools, with 67 (18.5% in the age bracket) enrolled. Conversely, the age group of 15 to 17 year olds has the lowest likelihood of being enrolled in a private school, with 1,583 (95.0% in the age bracket) attending a public institution.
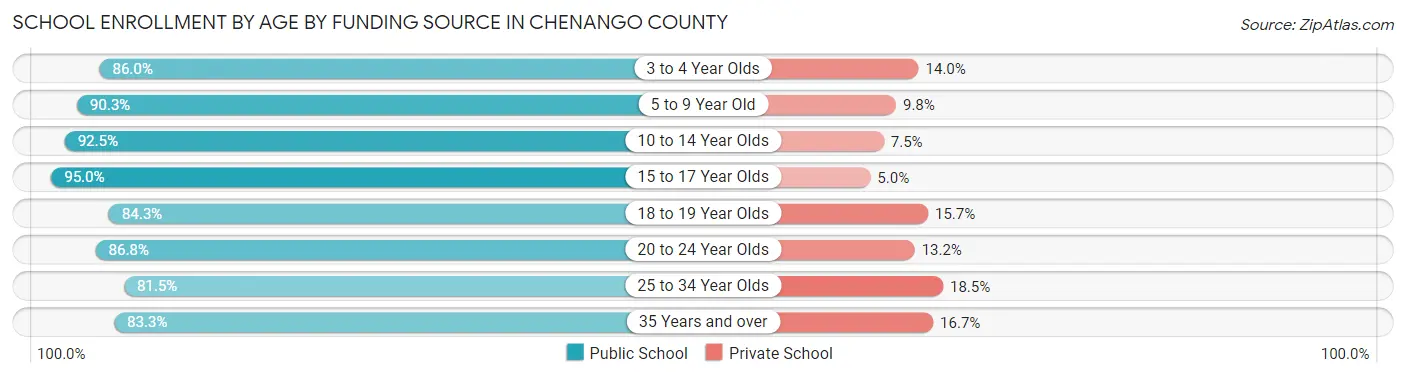
| Age Bracket | Public School | Private School |
| 3 to 4 Year Olds | 493 (86.0%) | 80 (14.0%) |
| 5 to 9 Year Old | 2,195 (90.2%) | 237 (9.8%) |
| 10 to 14 Year Olds | 2,608 (92.5%) | 211 (7.5%) |
| 15 to 17 Year Olds | 1,583 (95.0%) | 83 (5.0%) |
| 18 to 19 Year Olds | 295 (84.3%) | 55 (15.7%) |
| 20 to 24 Year Olds | 374 (86.8%) | 57 (13.2%) |
| 25 to 34 Year Olds | 295 (81.5%) | 67 (18.5%) |
| 35 Years and over | 360 (83.3%) | 72 (16.7%) |
| Total | 8,204 (90.5%) | 861 (9.5%) |
Educational Attainment by Field of Study in Chenango County
Education (1,555 | 23.1%), business (782 | 11.6%), science & technology (722 | 10.7%), liberal arts & history (534 | 7.9%), and arts & humanities (455 | 6.8%) are the most common fields of study among 6,734 individuals in Chenango County who have obtained a bachelor's degree or higher.
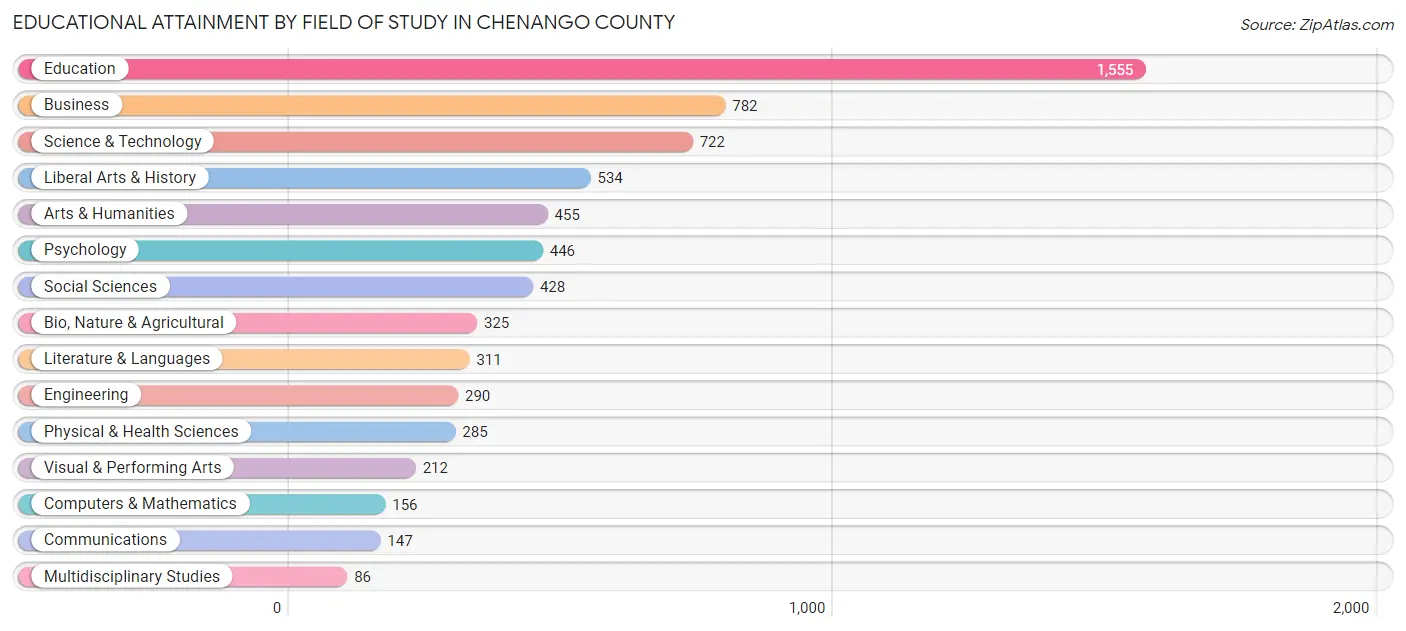
| Field of Study | # Graduates | % Graduates |
| Computers & Mathematics | 156 | 2.3% |
| Bio, Nature & Agricultural | 325 | 4.8% |
| Physical & Health Sciences | 285 | 4.2% |
| Psychology | 446 | 6.6% |
| Social Sciences | 428 | 6.4% |
| Engineering | 290 | 4.3% |
| Multidisciplinary Studies | 86 | 1.3% |
| Science & Technology | 722 | 10.7% |
| Business | 782 | 11.6% |
| Education | 1,555 | 23.1% |
| Literature & Languages | 311 | 4.6% |
| Liberal Arts & History | 534 | 7.9% |
| Visual & Performing Arts | 212 | 3.2% |
| Communications | 147 | 2.2% |
| Arts & Humanities | 455 | 6.8% |
| Total | 6,734 | 100.0% |
Transportation & Commute in Chenango County
Vehicle Availability by Sex in Chenango County
The most prevalent vehicle ownership categories in Chenango County are males with 2 vehicles (5,320, accounting for 47.8%) and females with 2 vehicles (4,439, making up 54.9%).
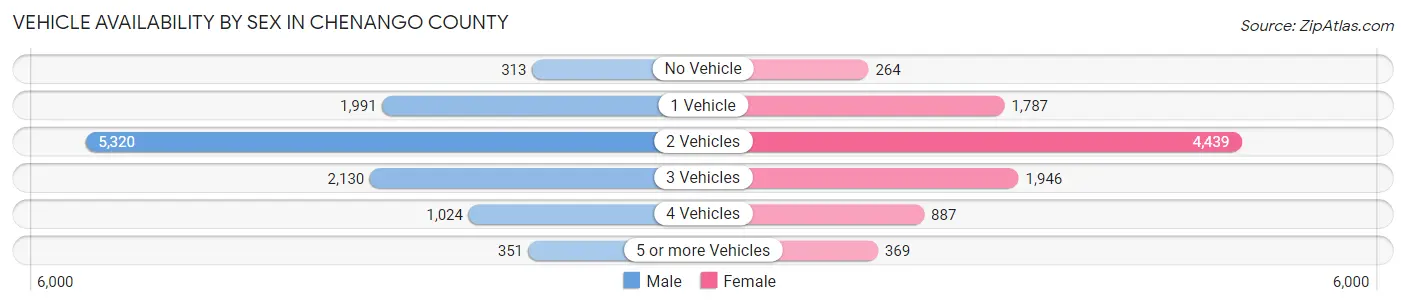
| Vehicles Available | Male | Female |
| No Vehicle | 313 (2.8%) | 264 (2.7%) |
| 1 Vehicle | 1,991 (17.9%) | 1,787 (18.4%) |
| 2 Vehicles | 5,320 (47.8%) | 4,439 (45.8%) |
| 3 Vehicles | 2,130 (19.1%) | 1,946 (20.1%) |
| 4 Vehicles | 1,024 (9.2%) | 887 (9.1%) |
| 5 or more Vehicles | 351 (3.2%) | 369 (3.8%) |
| Total | 11,129 (100.0%) | 9,692 (100.0%) |
Commute Time in Chenango County
The most frequently occuring commute durations in Chenango County are 5 to 9 minutes (3,155 commuters, 16.2%), 10 to 14 minutes (2,648 commuters, 13.6%), and 15 to 19 minutes (2,551 commuters, 13.1%).
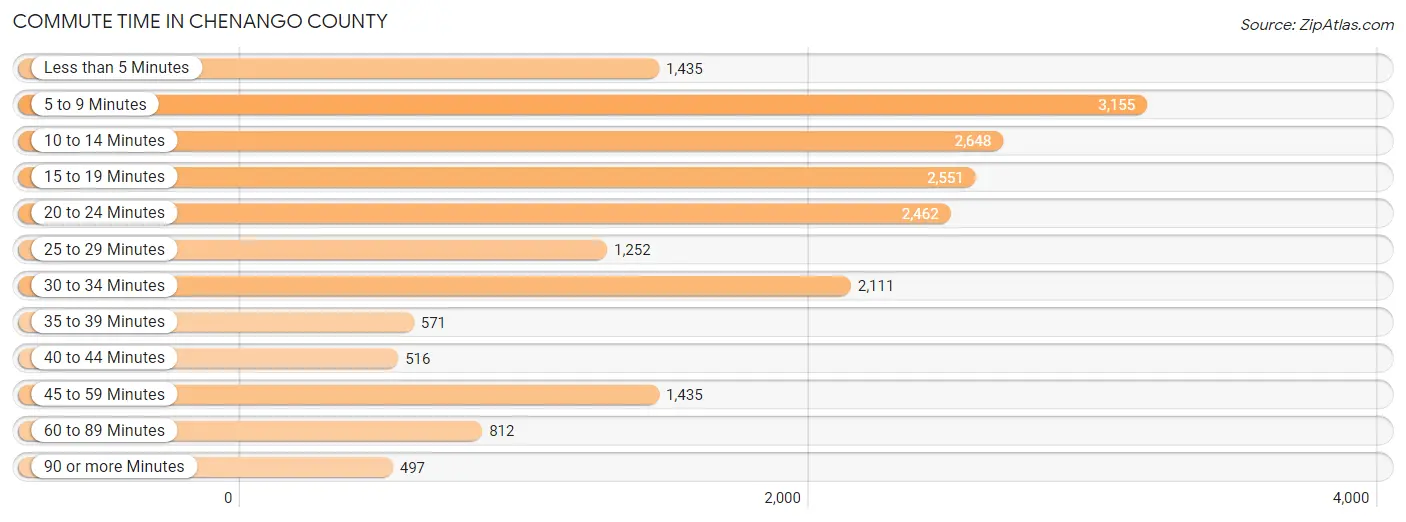
| Commute Time | # Commuters | % Commuters |
| Less than 5 Minutes | 1,435 | 7.4% |
| 5 to 9 Minutes | 3,155 | 16.2% |
| 10 to 14 Minutes | 2,648 | 13.6% |
| 15 to 19 Minutes | 2,551 | 13.1% |
| 20 to 24 Minutes | 2,462 | 12.7% |
| 25 to 29 Minutes | 1,252 | 6.4% |
| 30 to 34 Minutes | 2,111 | 10.9% |
| 35 to 39 Minutes | 571 | 2.9% |
| 40 to 44 Minutes | 516 | 2.6% |
| 45 to 59 Minutes | 1,435 | 7.4% |
| 60 to 89 Minutes | 812 | 4.2% |
| 90 or more Minutes | 497 | 2.6% |
Commute Time by Sex in Chenango County
The most common commute times in Chenango County are 5 to 9 minutes (1,560 commuters, 14.9%) for males and 5 to 9 minutes (1,595 commuters, 17.8%) for females.
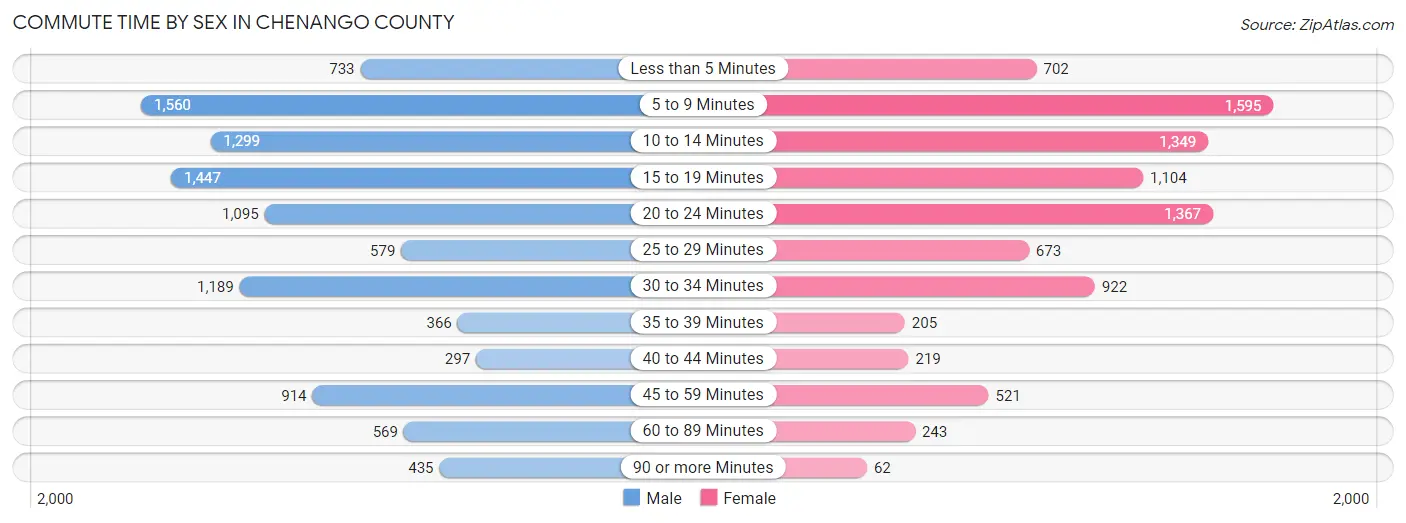
| Commute Time | Male | Female |
| Less than 5 Minutes | 733 (7.0%) | 702 (7.8%) |
| 5 to 9 Minutes | 1,560 (14.9%) | 1,595 (17.8%) |
| 10 to 14 Minutes | 1,299 (12.4%) | 1,349 (15.0%) |
| 15 to 19 Minutes | 1,447 (13.8%) | 1,104 (12.3%) |
| 20 to 24 Minutes | 1,095 (10.4%) | 1,367 (15.2%) |
| 25 to 29 Minutes | 579 (5.5%) | 673 (7.5%) |
| 30 to 34 Minutes | 1,189 (11.3%) | 922 (10.3%) |
| 35 to 39 Minutes | 366 (3.5%) | 205 (2.3%) |
| 40 to 44 Minutes | 297 (2.8%) | 219 (2.4%) |
| 45 to 59 Minutes | 914 (8.7%) | 521 (5.8%) |
| 60 to 89 Minutes | 569 (5.4%) | 243 (2.7%) |
| 90 or more Minutes | 435 (4.2%) | 62 (0.7%) |
Time of Departure to Work by Sex in Chenango County
The most frequent times of departure to work in Chenango County are 7:00 AM to 7:29 AM (1,344, 12.8%) for males and 7:00 AM to 7:29 AM (1,877, 20.9%) for females.
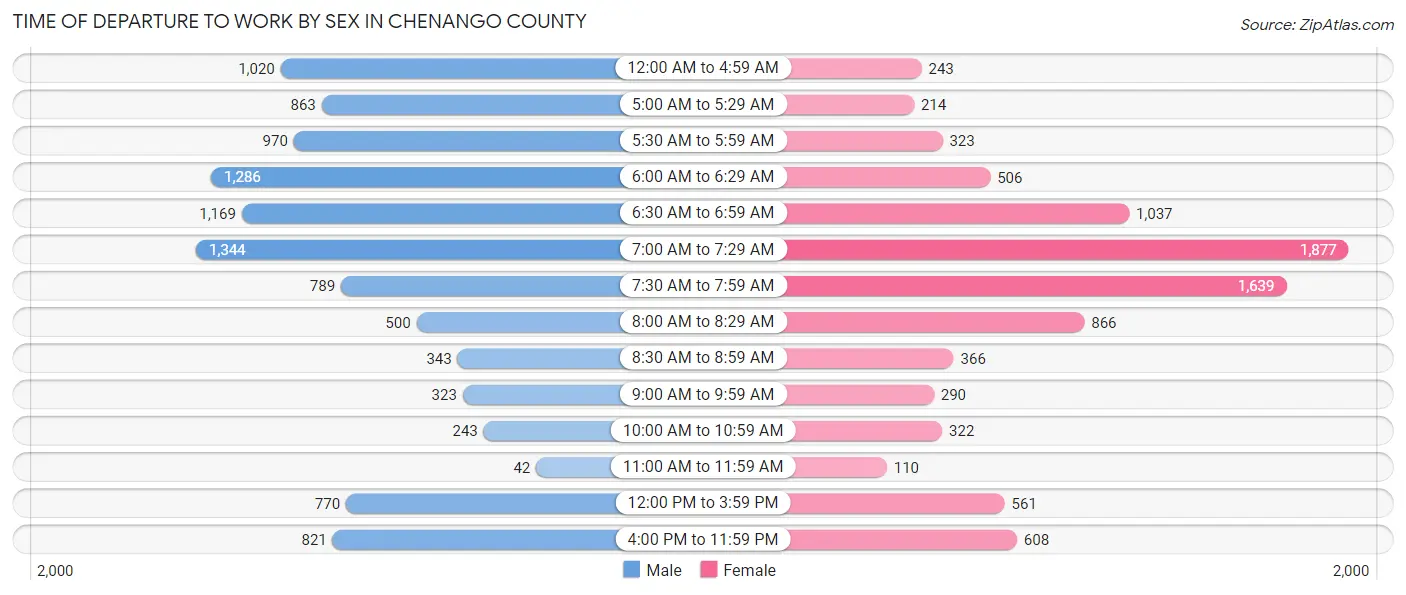
| Time of Departure | Male | Female |
| 12:00 AM to 4:59 AM | 1,020 (9.7%) | 243 (2.7%) |
| 5:00 AM to 5:29 AM | 863 (8.2%) | 214 (2.4%) |
| 5:30 AM to 5:59 AM | 970 (9.2%) | 323 (3.6%) |
| 6:00 AM to 6:29 AM | 1,286 (12.3%) | 506 (5.7%) |
| 6:30 AM to 6:59 AM | 1,169 (11.2%) | 1,037 (11.6%) |
| 7:00 AM to 7:29 AM | 1,344 (12.8%) | 1,877 (20.9%) |
| 7:30 AM to 7:59 AM | 789 (7.5%) | 1,639 (18.3%) |
| 8:00 AM to 8:29 AM | 500 (4.8%) | 866 (9.7%) |
| 8:30 AM to 8:59 AM | 343 (3.3%) | 366 (4.1%) |
| 9:00 AM to 9:59 AM | 323 (3.1%) | 290 (3.2%) |
| 10:00 AM to 10:59 AM | 243 (2.3%) | 322 (3.6%) |
| 11:00 AM to 11:59 AM | 42 (0.4%) | 110 (1.2%) |
| 12:00 PM to 3:59 PM | 770 (7.3%) | 561 (6.3%) |
| 4:00 PM to 11:59 PM | 821 (7.8%) | 608 (6.8%) |
| Total | 10,483 (100.0%) | 8,962 (100.0%) |
Housing Occupancy in Chenango County
Occupancy by Ownership in Chenango County
Of the total 19,886 dwellings in Chenango County, owner-occupied units account for 15,170 (76.3%), while renter-occupied units make up 4,716 (23.7%).
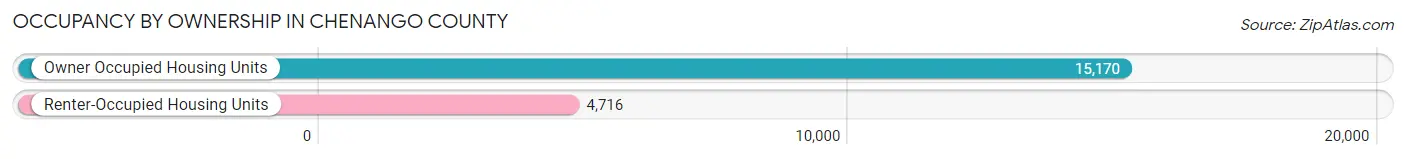
| Occupancy | # Housing Units | % Housing Units |
| Owner Occupied Housing Units | 15,170 | 76.3% |
| Renter-Occupied Housing Units | 4,716 | 23.7% |
| Total Occupied Housing Units | 19,886 | 100.0% |
Occupancy by Household Size in Chenango County
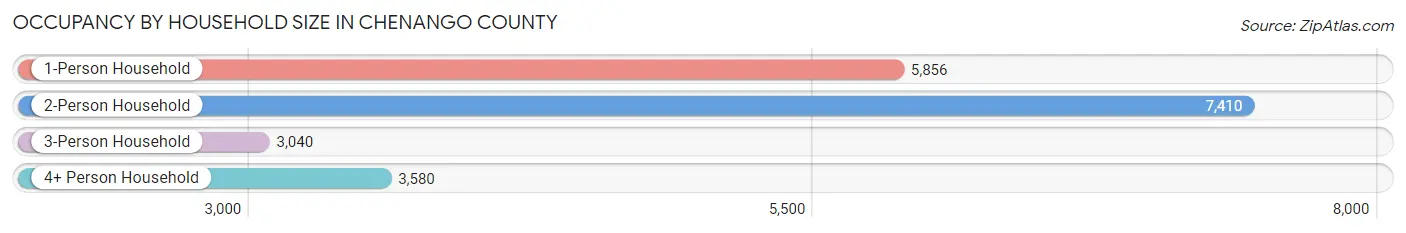
| Household Size | # Housing Units | % Housing Units |
| 1-Person Household | 5,856 | 29.4% |
| 2-Person Household | 7,410 | 37.3% |
| 3-Person Household | 3,040 | 15.3% |
| 4+ Person Household | 3,580 | 18.0% |
| Total Housing Units | 19,886 | 100.0% |
Occupancy by Ownership by Household Size in Chenango County
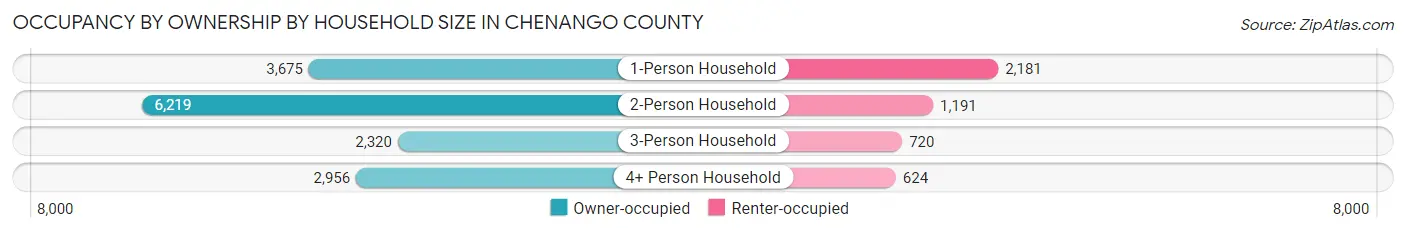
| Household Size | Owner-occupied | Renter-occupied |
| 1-Person Household | 3,675 (62.8%) | 2,181 (37.2%) |
| 2-Person Household | 6,219 (83.9%) | 1,191 (16.1%) |
| 3-Person Household | 2,320 (76.3%) | 720 (23.7%) |
| 4+ Person Household | 2,956 (82.6%) | 624 (17.4%) |
| Total Housing Units | 15,170 (76.3%) | 4,716 (23.7%) |
Occupancy by Educational Attainment in Chenango County
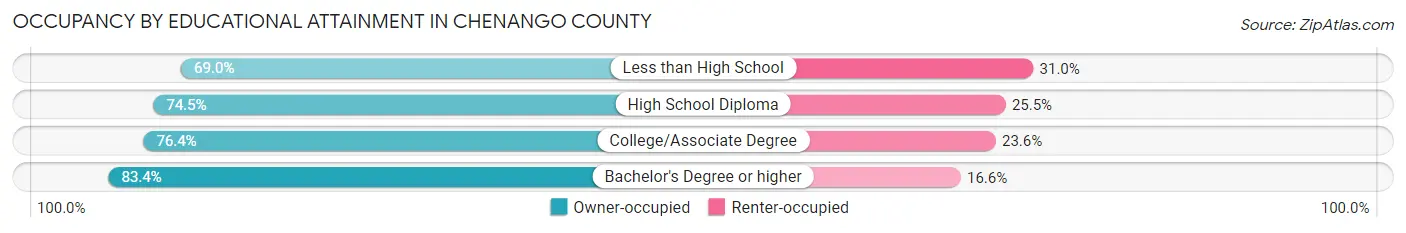
| Household Size | Owner-occupied | Renter-occupied |
| Less than High School | 1,454 (69.0%) | 654 (31.0%) |
| High School Diploma | 5,680 (74.5%) | 1,947 (25.5%) |
| College/Associate Degree | 4,702 (76.4%) | 1,450 (23.6%) |
| Bachelor's Degree or higher | 3,334 (83.4%) | 665 (16.6%) |
Occupancy by Age of Householder in Chenango County
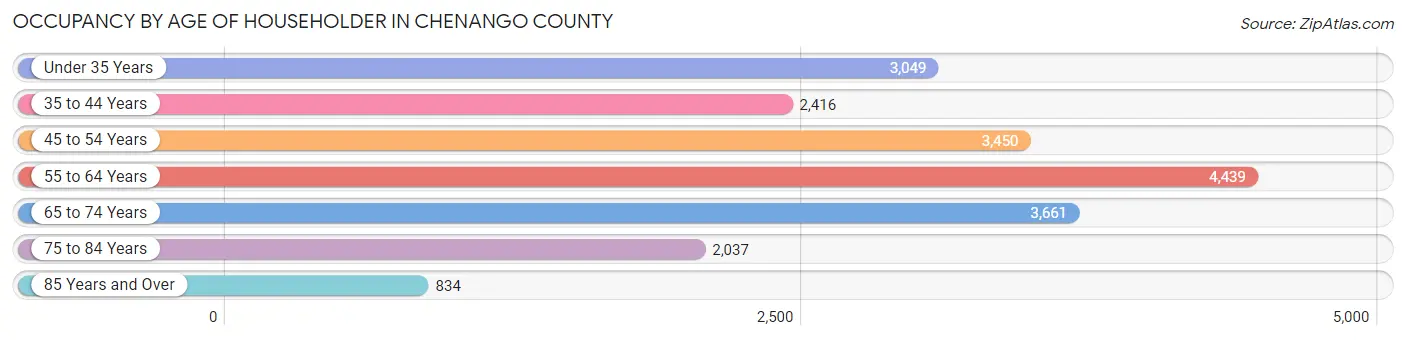
| Age Bracket | # Households | % Households |
| Under 35 Years | 3,049 | 15.3% |
| 35 to 44 Years | 2,416 | 12.1% |
| 45 to 54 Years | 3,450 | 17.3% |
| 55 to 64 Years | 4,439 | 22.3% |
| 65 to 74 Years | 3,661 | 18.4% |
| 75 to 84 Years | 2,037 | 10.2% |
| 85 Years and Over | 834 | 4.2% |
| Total | 19,886 | 100.0% |
Housing Finances in Chenango County
Median Income by Occupancy in Chenango County
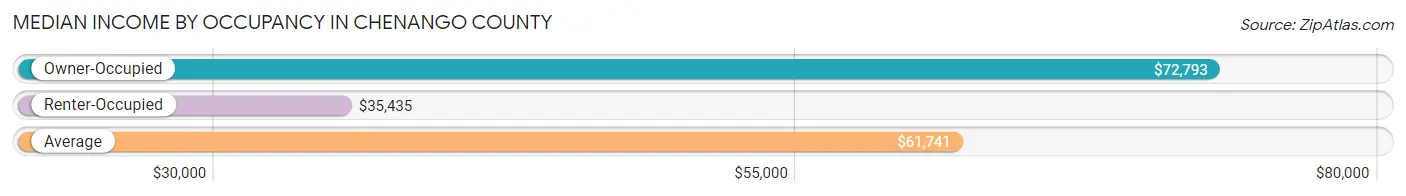
| Occupancy Type | # Households | Median Income |
| Owner-Occupied | 15,170 (76.3%) | $72,793 |
| Renter-Occupied | 4,716 (23.7%) | $35,435 |
| Average | 19,886 (100.0%) | $61,741 |
Occupancy by Householder Income Bracket in Chenango County
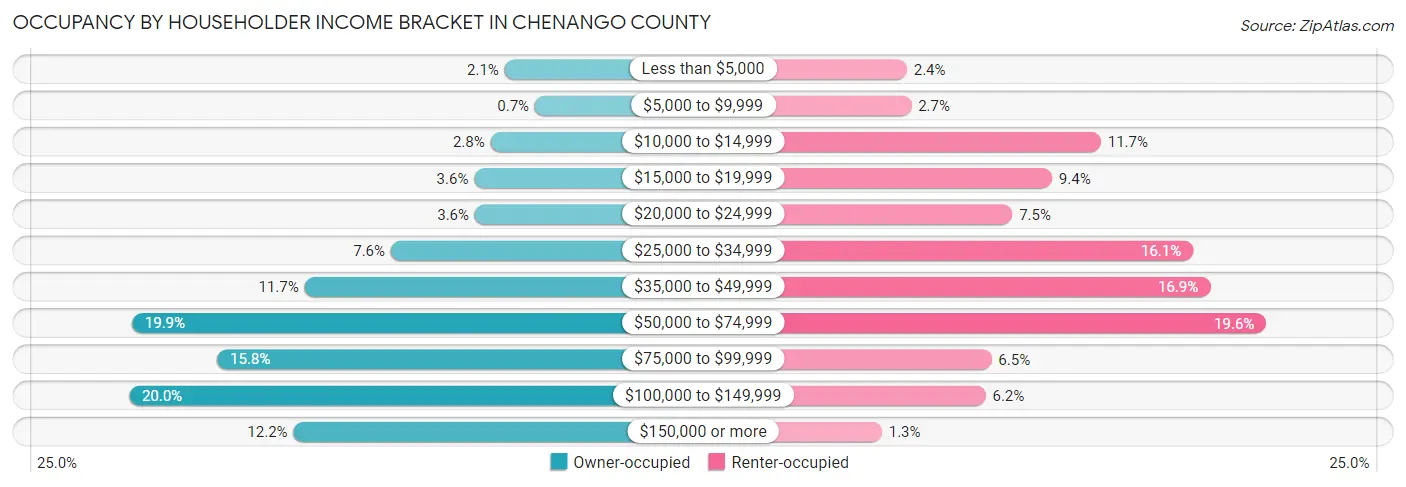
| Income Bracket | Owner-occupied | Renter-occupied |
| Less than $5,000 | 325 (2.1%) | 115 (2.4%) |
| $5,000 to $9,999 | 106 (0.7%) | 125 (2.6%) |
| $10,000 to $14,999 | 427 (2.8%) | 551 (11.7%) |
| $15,000 to $19,999 | 545 (3.6%) | 441 (9.3%) |
| $20,000 to $24,999 | 540 (3.6%) | 352 (7.5%) |
| $25,000 to $34,999 | 1,147 (7.6%) | 758 (16.1%) |
| $35,000 to $49,999 | 1,771 (11.7%) | 796 (16.9%) |
| $50,000 to $74,999 | 3,018 (19.9%) | 922 (19.6%) |
| $75,000 to $99,999 | 2,402 (15.8%) | 305 (6.5%) |
| $100,000 to $149,999 | 3,038 (20.0%) | 292 (6.2%) |
| $150,000 or more | 1,851 (12.2%) | 59 (1.3%) |
| Total | 15,170 (100.0%) | 4,716 (100.0%) |
Monthly Housing Cost Tiers in Chenango County
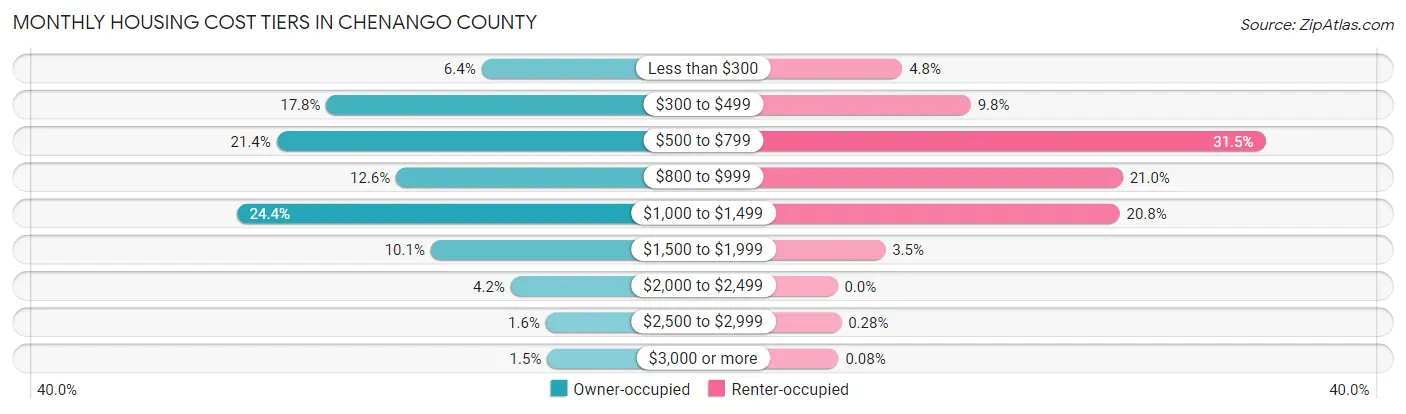
| Monthly Cost | Owner-occupied | Renter-occupied |
| Less than $300 | 964 (6.4%) | 225 (4.8%) |
| $300 to $499 | 2,697 (17.8%) | 463 (9.8%) |
| $500 to $799 | 3,252 (21.4%) | 1,486 (31.5%) |
| $800 to $999 | 1,918 (12.6%) | 991 (21.0%) |
| $1,000 to $1,499 | 3,698 (24.4%) | 980 (20.8%) |
| $1,500 to $1,999 | 1,530 (10.1%) | 166 (3.5%) |
| $2,000 to $2,499 | 637 (4.2%) | 0 (0.0%) |
| $2,500 to $2,999 | 245 (1.6%) | 13 (0.3%) |
| $3,000 or more | 229 (1.5%) | 4 (0.1%) |
| Total | 15,170 (100.0%) | 4,716 (100.0%) |
Physical Housing Characteristics in Chenango County
Housing Structures in Chenango County
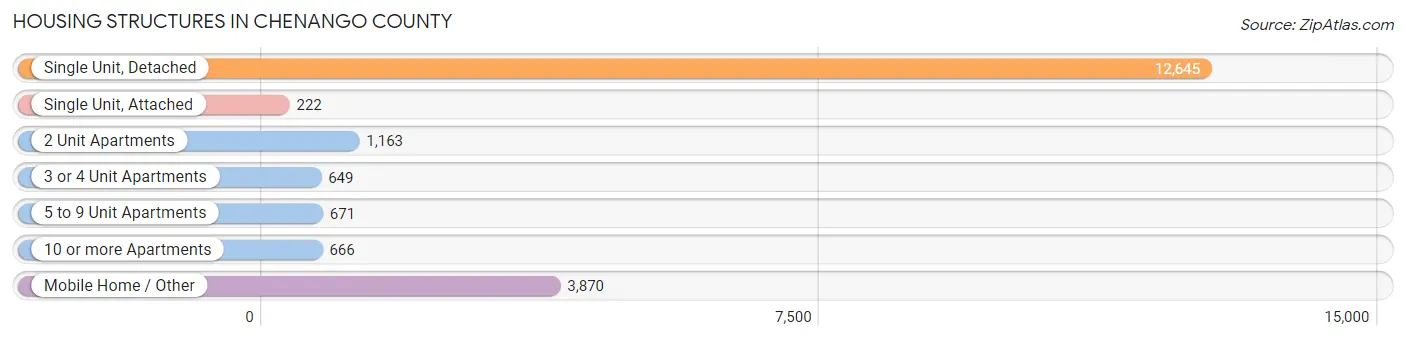
| Structure Type | # Housing Units | % Housing Units |
| Single Unit, Detached | 12,645 | 63.6% |
| Single Unit, Attached | 222 | 1.1% |
| 2 Unit Apartments | 1,163 | 5.9% |
| 3 or 4 Unit Apartments | 649 | 3.3% |
| 5 to 9 Unit Apartments | 671 | 3.4% |
| 10 or more Apartments | 666 | 3.4% |
| Mobile Home / Other | 3,870 | 19.5% |
| Total | 19,886 | 100.0% |
Housing Structures by Occupancy in Chenango County
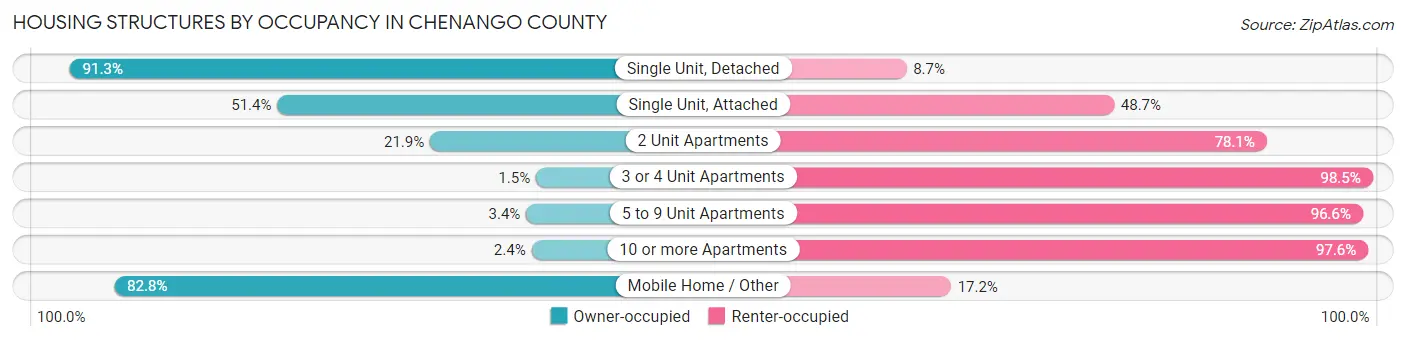
| Structure Type | Owner-occupied | Renter-occupied |
| Single Unit, Detached | 11,549 (91.3%) | 1,096 (8.7%) |
| Single Unit, Attached | 114 (51.3%) | 108 (48.6%) |
| 2 Unit Apartments | 255 (21.9%) | 908 (78.1%) |
| 3 or 4 Unit Apartments | 10 (1.5%) | 639 (98.5%) |
| 5 to 9 Unit Apartments | 23 (3.4%) | 648 (96.6%) |
| 10 or more Apartments | 16 (2.4%) | 650 (97.6%) |
| Mobile Home / Other | 3,203 (82.8%) | 667 (17.2%) |
| Total | 15,170 (76.3%) | 4,716 (23.7%) |
Housing Structures by Number of Rooms in Chenango County
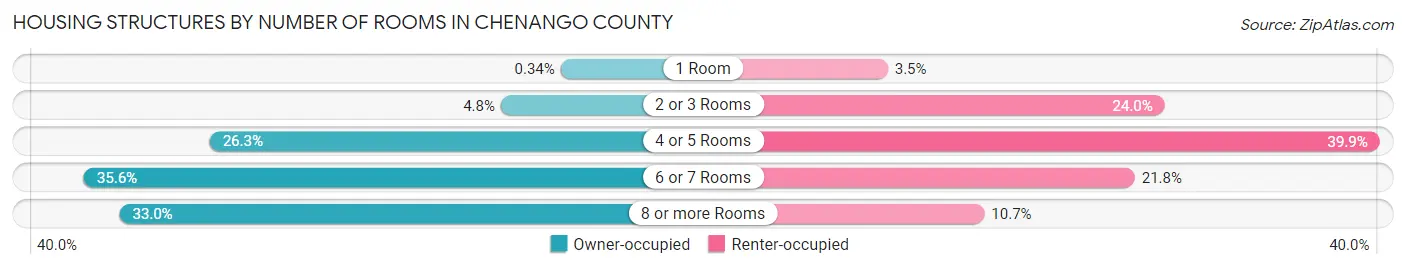
| Number of Rooms | Owner-occupied | Renter-occupied |
| 1 Room | 52 (0.3%) | 167 (3.5%) |
| 2 or 3 Rooms | 723 (4.8%) | 1,133 (24.0%) |
| 4 or 5 Rooms | 3,990 (26.3%) | 1,883 (39.9%) |
| 6 or 7 Rooms | 5,402 (35.6%) | 1,029 (21.8%) |
| 8 or more Rooms | 5,003 (33.0%) | 504 (10.7%) |
| Total | 15,170 (100.0%) | 4,716 (100.0%) |
Housing Structure by Heating Type in Chenango County
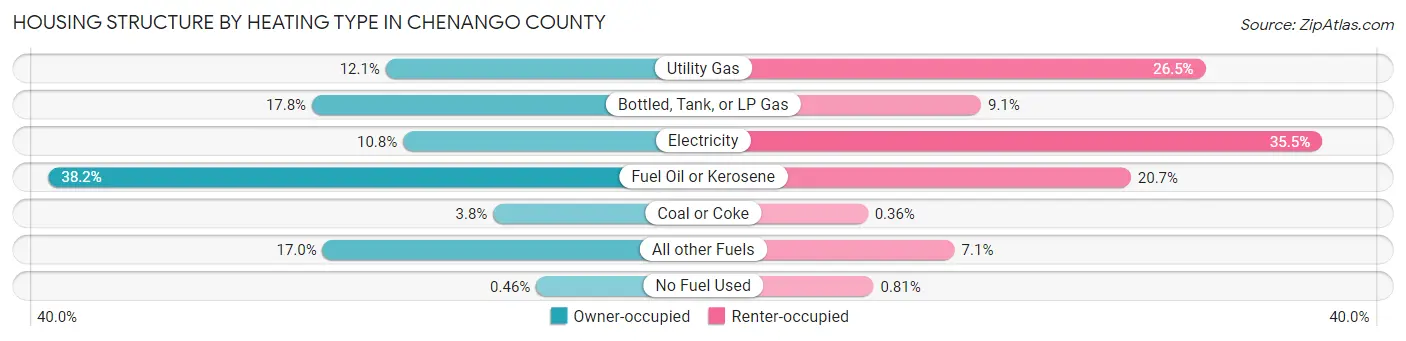
| Heating Type | Owner-occupied | Renter-occupied |
| Utility Gas | 1,834 (12.1%) | 1,248 (26.5%) |
| Bottled, Tank, or LP Gas | 2,698 (17.8%) | 430 (9.1%) |
| Electricity | 1,631 (10.7%) | 1,673 (35.5%) |
| Fuel Oil or Kerosene | 5,789 (38.2%) | 976 (20.7%) |
| Coal or Coke | 573 (3.8%) | 17 (0.4%) |
| All other Fuels | 2,575 (17.0%) | 334 (7.1%) |
| No Fuel Used | 70 (0.5%) | 38 (0.8%) |
| Total | 15,170 (100.0%) | 4,716 (100.0%) |
Household Vehicle Usage in Chenango County
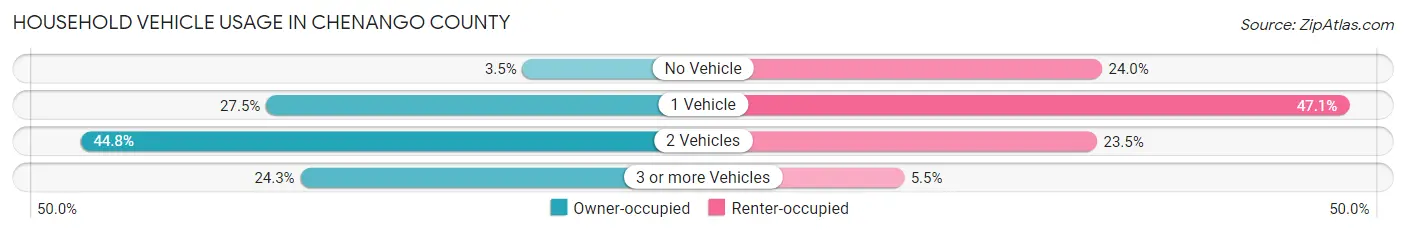
| Vehicles per Household | Owner-occupied | Renter-occupied |
| No Vehicle | 534 (3.5%) | 1,130 (24.0%) |
| 1 Vehicle | 4,164 (27.5%) | 2,219 (47.0%) |
| 2 Vehicles | 6,793 (44.8%) | 1,108 (23.5%) |
| 3 or more Vehicles | 3,679 (24.2%) | 259 (5.5%) |
| Total | 15,170 (100.0%) | 4,716 (100.0%) |
Real Estate & Mortgages in Chenango County
Real Estate and Mortgage Overview in Chenango County
| Characteristic | Without Mortgage | With Mortgage |
| Housing Units | 7,996 | 7,174 |
| Median Property Value | $101,300 | $139,700 |
| Median Household Income | $59,613 | $1,068 |
| Monthly Housing Costs | $534 | $205 |
| Real Estate Taxes | $2,539 | $313 |
Property Value by Mortgage Status in Chenango County
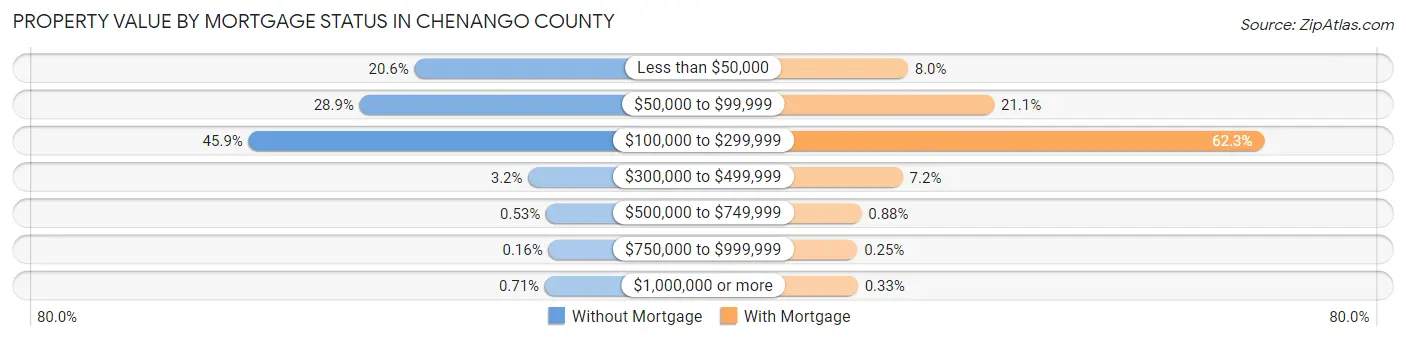
| Property Value | Without Mortgage | With Mortgage |
| Less than $50,000 | 1,645 (20.6%) | 571 (8.0%) |
| $50,000 to $99,999 | 2,313 (28.9%) | 1,514 (21.1%) |
| $100,000 to $299,999 | 3,667 (45.9%) | 4,469 (62.3%) |
| $300,000 to $499,999 | 259 (3.2%) | 515 (7.2%) |
| $500,000 to $749,999 | 42 (0.5%) | 63 (0.9%) |
| $750,000 to $999,999 | 13 (0.2%) | 18 (0.3%) |
| $1,000,000 or more | 57 (0.7%) | 24 (0.3%) |
| Total | 7,996 (100.0%) | 7,174 (100.0%) |
Household Income by Mortgage Status in Chenango County
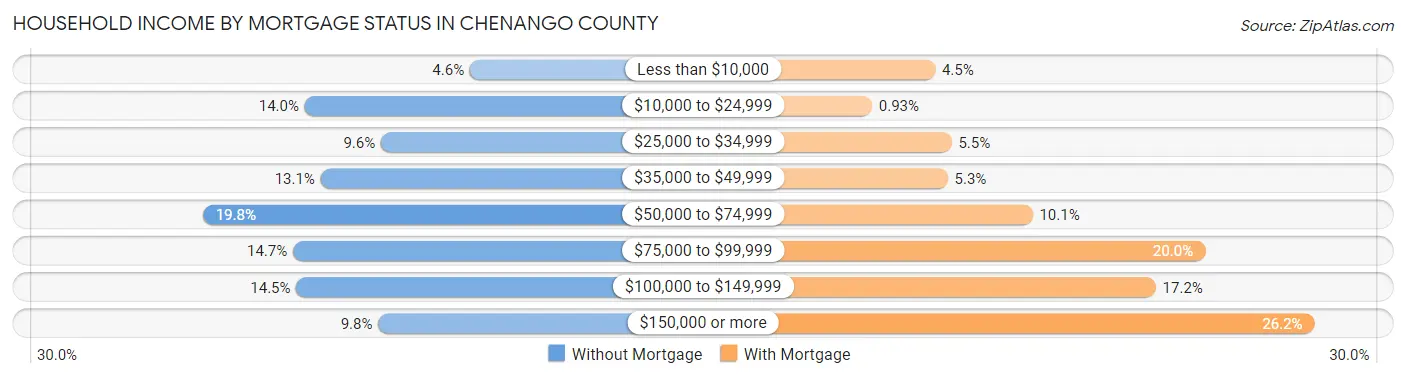
| Household Income | Without Mortgage | With Mortgage |
| Less than $10,000 | 364 (4.5%) | 326 (4.5%) |
| $10,000 to $24,999 | 1,119 (14.0%) | 67 (0.9%) |
| $25,000 to $34,999 | 770 (9.6%) | 393 (5.5%) |
| $35,000 to $49,999 | 1,046 (13.1%) | 377 (5.3%) |
| $50,000 to $74,999 | 1,585 (19.8%) | 725 (10.1%) |
| $75,000 to $99,999 | 1,172 (14.7%) | 1,433 (20.0%) |
| $100,000 to $149,999 | 1,157 (14.5%) | 1,230 (17.2%) |
| $150,000 or more | 783 (9.8%) | 1,881 (26.2%) |
| Total | 7,996 (100.0%) | 7,174 (100.0%) |
Property Value to Household Income Ratio in Chenango County
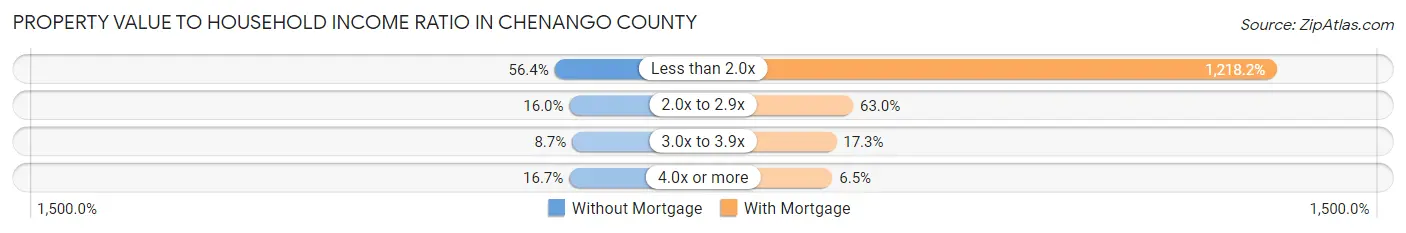
| Value-to-Income Ratio | Without Mortgage | With Mortgage |
| Less than 2.0x | 4,511 (56.4%) | 87,393 (1,218.2%) |
| 2.0x to 2.9x | 1,279 (16.0%) | 4,516 (62.9%) |
| 3.0x to 3.9x | 692 (8.6%) | 1,241 (17.3%) |
| 4.0x or more | 1,335 (16.7%) | 468 (6.5%) |
| Total | 7,996 (100.0%) | 7,174 (100.0%) |
Real Estate Taxes by Mortgage Status in Chenango County
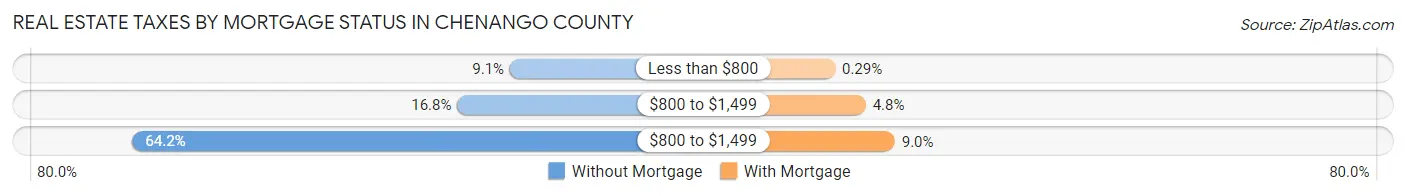
| Property Taxes | Without Mortgage | With Mortgage |
| Less than $800 | 726 (9.1%) | 21 (0.3%) |
| $800 to $1,499 | 1,341 (16.8%) | 343 (4.8%) |
| $800 to $1,499 | 5,137 (64.2%) | 647 (9.0%) |
| Total | 7,996 (100.0%) | 7,174 (100.0%) |
Health & Disability in Chenango County
Health Insurance Coverage by Age in Chenango County
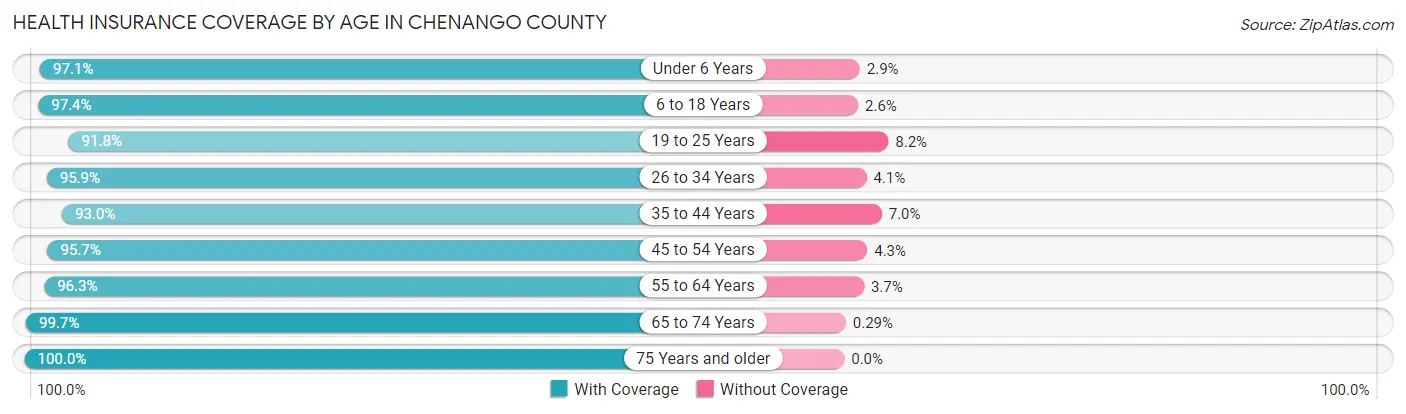
| Age Bracket | With Coverage | Without Coverage |
| Under 6 Years | 2,915 (97.1%) | 87 (2.9%) |
| 6 to 18 Years | 7,011 (97.4%) | 185 (2.6%) |
| 19 to 25 Years | 3,125 (91.8%) | 280 (8.2%) |
| 26 to 34 Years | 4,449 (95.9%) | 192 (4.1%) |
| 35 to 44 Years | 4,840 (93.0%) | 364 (7.0%) |
| 45 to 54 Years | 5,710 (95.7%) | 256 (4.3%) |
| 55 to 64 Years | 7,161 (96.3%) | 273 (3.7%) |
| 65 to 74 Years | 5,774 (99.7%) | 17 (0.3%) |
| 75 Years and older | 3,932 (100.0%) | 0 (0.0%) |
| Total | 44,917 (96.5%) | 1,654 (3.5%) |
Health Insurance Coverage by Citizenship Status in Chenango County
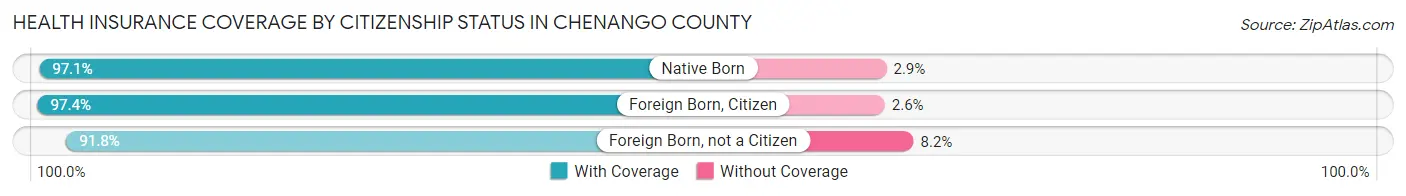
| Citizenship Status | With Coverage | Without Coverage |
| Native Born | 2,915 (97.1%) | 87 (2.9%) |
| Foreign Born, Citizen | 7,011 (97.4%) | 185 (2.6%) |
| Foreign Born, not a Citizen | 3,125 (91.8%) | 280 (8.2%) |
Health Insurance Coverage by Household Income in Chenango County
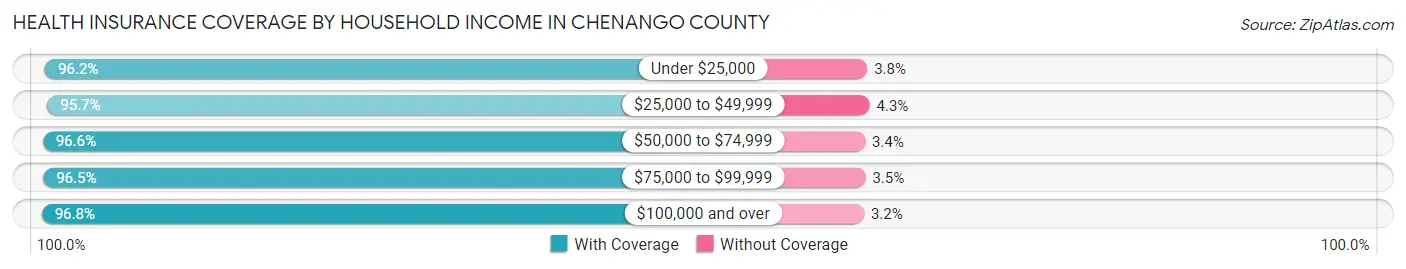
| Household Income | With Coverage | Without Coverage |
| Under $25,000 | 5,247 (96.2%) | 209 (3.8%) |
| $25,000 to $49,999 | 8,295 (95.7%) | 370 (4.3%) |
| $50,000 to $74,999 | 9,439 (96.6%) | 332 (3.4%) |
| $75,000 to $99,999 | 6,956 (96.5%) | 252 (3.5%) |
| $100,000 and over | 14,805 (96.8%) | 491 (3.2%) |
Public vs Private Health Insurance Coverage by Age in Chenango County
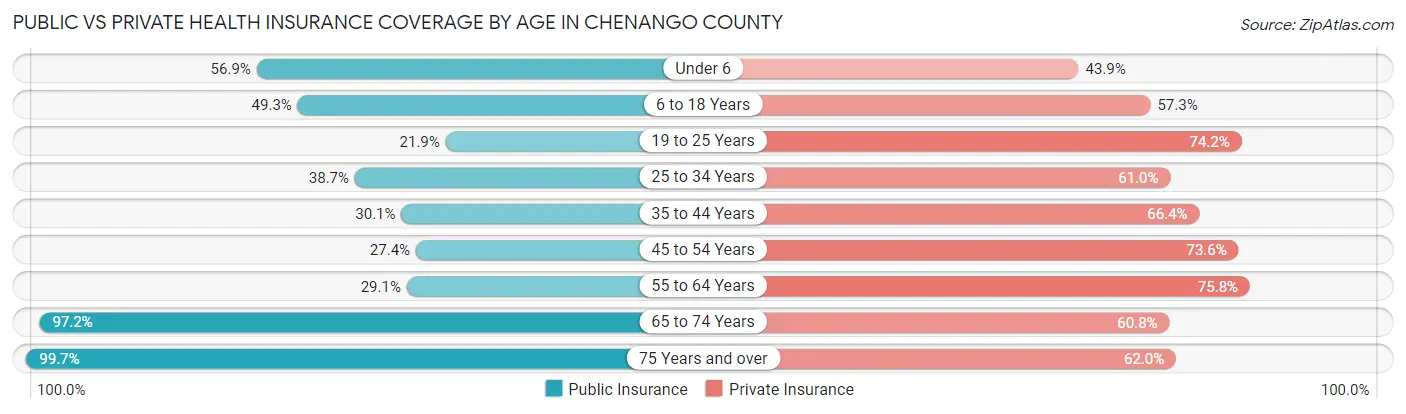
| Age Bracket | Public Insurance | Private Insurance |
| Under 6 | 1,709 (56.9%) | 1,319 (43.9%) |
| 6 to 18 Years | 3,549 (49.3%) | 4,123 (57.3%) |
| 19 to 25 Years | 744 (21.8%) | 2,527 (74.2%) |
| 25 to 34 Years | 1,796 (38.7%) | 2,829 (61.0%) |
| 35 to 44 Years | 1,565 (30.1%) | 3,454 (66.4%) |
| 45 to 54 Years | 1,633 (27.4%) | 4,393 (73.6%) |
| 55 to 64 Years | 2,161 (29.1%) | 5,631 (75.7%) |
| 65 to 74 Years | 5,631 (97.2%) | 3,521 (60.8%) |
| 75 Years and over | 3,919 (99.7%) | 2,439 (62.0%) |
| Total | 22,707 (48.8%) | 30,236 (64.9%) |
Disability Status by Sex by Age in Chenango County
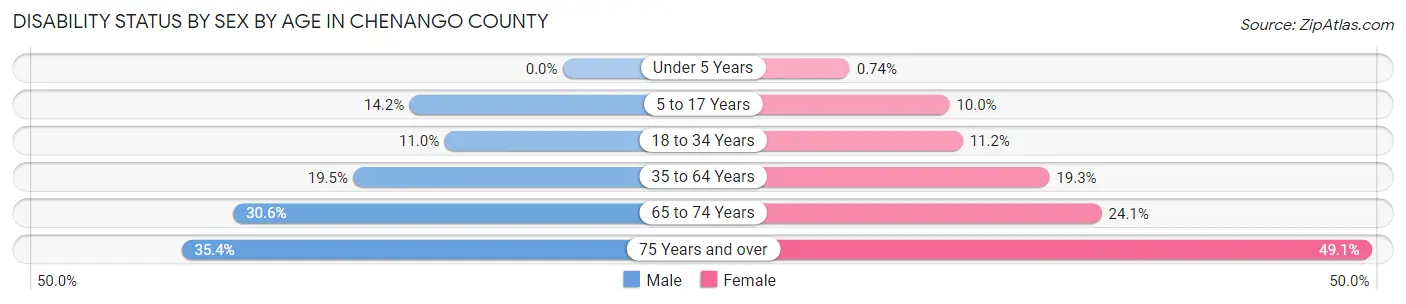
| Age Bracket | Male | Female |
| Under 5 Years | 0 (0.0%) | 9 (0.7%) |
| 5 to 17 Years | 525 (14.2%) | 355 (10.0%) |
| 18 to 34 Years | 477 (11.0%) | 477 (11.2%) |
| 35 to 64 Years | 1,841 (19.5%) | 1,761 (19.3%) |
| 65 to 74 Years | 900 (30.6%) | 688 (24.1%) |
| 75 Years and over | 634 (35.4%) | 1,053 (49.1%) |
Disability Class by Sex by Age in Chenango County
Disability Class: Hearing Difficulty
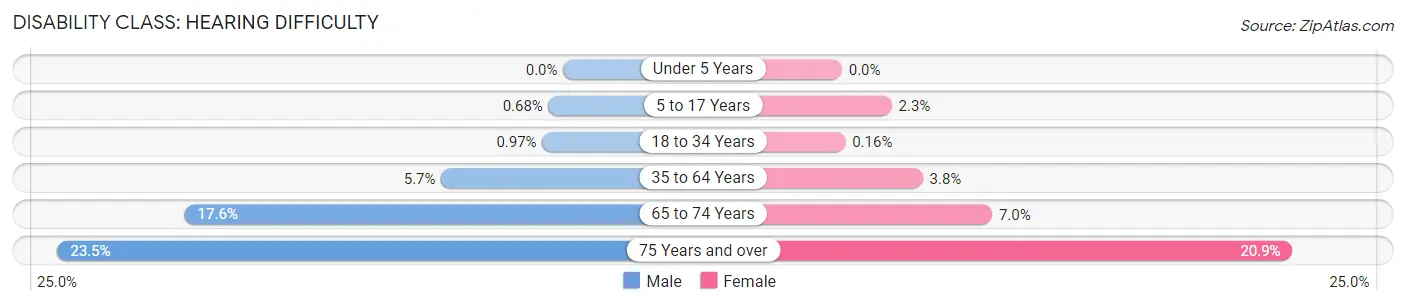
| Age Bracket | Male | Female |
| Under 5 Years | 0 (0.0%) | 0 (0.0%) |
| 5 to 17 Years | 25 (0.7%) | 82 (2.3%) |
| 18 to 34 Years | 42 (1.0%) | 7 (0.2%) |
| 35 to 64 Years | 536 (5.7%) | 343 (3.7%) |
| 65 to 74 Years | 516 (17.6%) | 199 (7.0%) |
| 75 Years and over | 420 (23.5%) | 448 (20.9%) |
Disability Class: Vision Difficulty
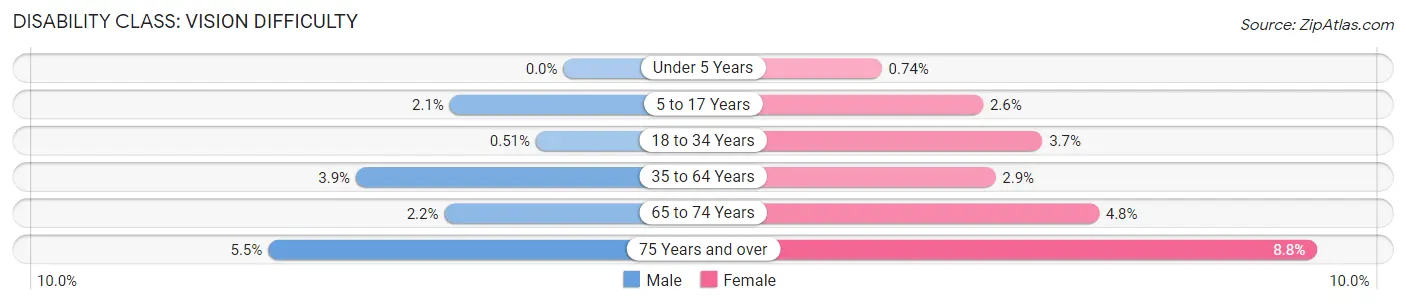
| Age Bracket | Male | Female |
| Under 5 Years | 0 (0.0%) | 9 (0.7%) |
| 5 to 17 Years | 78 (2.1%) | 93 (2.6%) |
| 18 to 34 Years | 22 (0.5%) | 158 (3.7%) |
| 35 to 64 Years | 364 (3.8%) | 260 (2.9%) |
| 65 to 74 Years | 65 (2.2%) | 136 (4.8%) |
| 75 Years and over | 98 (5.5%) | 189 (8.8%) |
Disability Class: Cognitive Difficulty
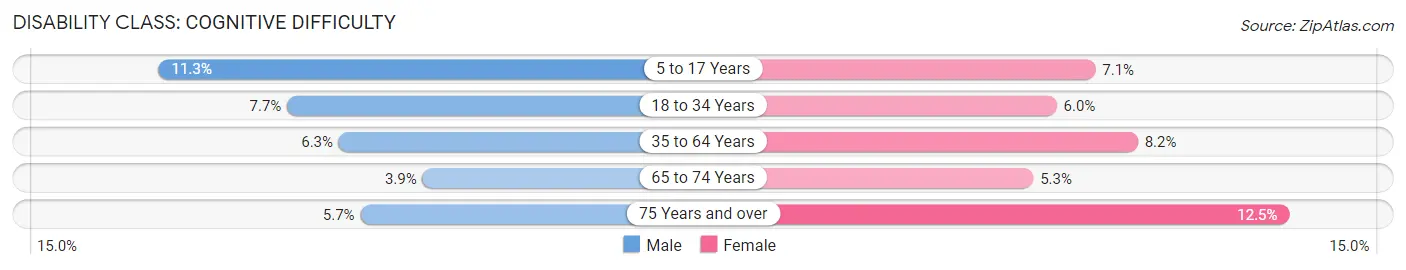
| Age Bracket | Male | Female |
| 5 to 17 Years | 416 (11.3%) | 251 (7.1%) |
| 18 to 34 Years | 334 (7.7%) | 254 (6.0%) |
| 35 to 64 Years | 592 (6.2%) | 753 (8.2%) |
| 65 to 74 Years | 115 (3.9%) | 152 (5.3%) |
| 75 Years and over | 101 (5.7%) | 267 (12.5%) |
Disability Class: Ambulatory Difficulty
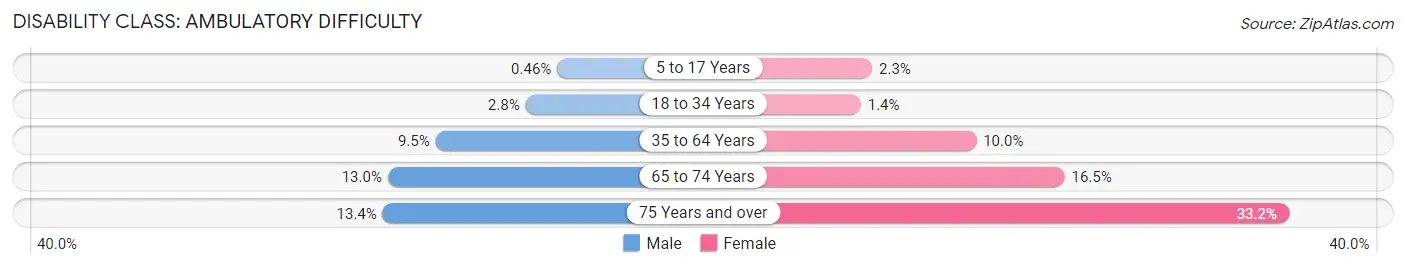
| Age Bracket | Male | Female |
| 5 to 17 Years | 17 (0.5%) | 80 (2.2%) |
| 18 to 34 Years | 122 (2.8%) | 60 (1.4%) |
| 35 to 64 Years | 898 (9.5%) | 912 (10.0%) |
| 65 to 74 Years | 383 (13.0%) | 472 (16.5%) |
| 75 Years and over | 240 (13.4%) | 711 (33.2%) |
Disability Class: Self-Care Difficulty
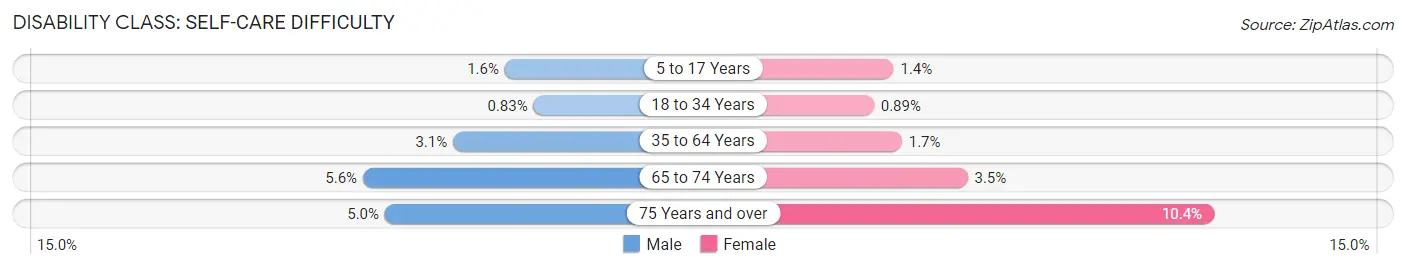
| Age Bracket | Male | Female |
| 5 to 17 Years | 60 (1.6%) | 51 (1.4%) |
| 18 to 34 Years | 36 (0.8%) | 38 (0.9%) |
| 35 to 64 Years | 291 (3.1%) | 153 (1.7%) |
| 65 to 74 Years | 164 (5.6%) | 100 (3.5%) |
| 75 Years and over | 89 (5.0%) | 222 (10.4%) |
Technology Access in Chenango County
Computing Device Access in Chenango County
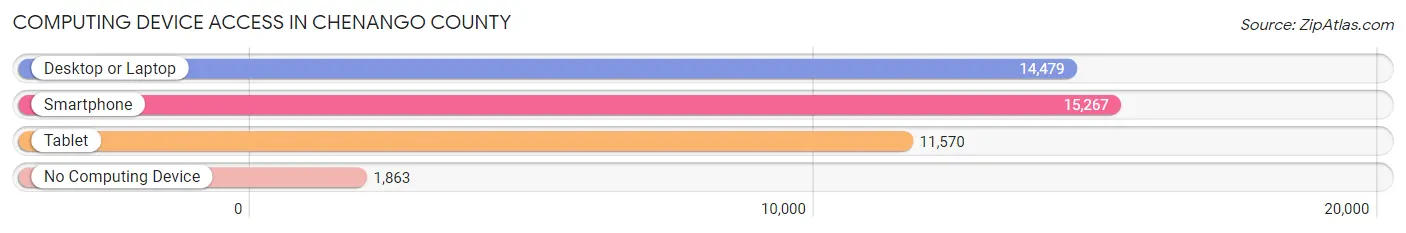
| Device Type | # Households | % Households |
| Desktop or Laptop | 14,479 | 72.8% |
| Smartphone | 15,267 | 76.8% |
| Tablet | 11,570 | 58.2% |
| No Computing Device | 1,863 | 9.4% |
| Total | 19,886 | 100.0% |
Internet Access in Chenango County
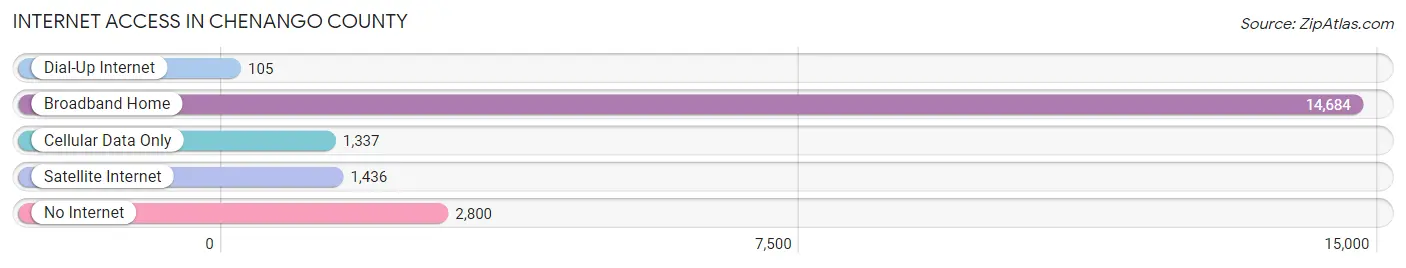
| Internet Type | # Households | % Households |
| Dial-Up Internet | 105 | 0.5% |
| Broadband Home | 14,684 | 73.8% |
| Cellular Data Only | 1,337 | 6.7% |
| Satellite Internet | 1,436 | 7.2% |
| No Internet | 2,800 | 14.1% |
| Total | 19,886 | 100.0% |
Chenango County Summary
Chenango County is located in the south-central part of New York State, and is part of the Southern Tier region. It is bordered by Madison County to the north, Otsego County to the east, Delaware County to the south, and Broome County to the west. The county seat is Norwich, and the largest city is Binghamton. The county has a total area of 864 square miles, and a population of 49,967 as of the 2010 census.
History
Chenango County was formed in 1798 from parts of Herkimer and Tioga counties. It was named after the Chenango River, which runs through the county. The first settlers in the area were mostly of English and Dutch descent, and the county was largely agricultural. The Chenango Canal, which opened in 1836, connected the Chenango River to the Erie Canal, and was a major factor in the county’s economic growth. The county was also home to several industries, including tanneries, gristmills, and sawmills.
Geography
Chenango County is located in the south-central part of New York State, and is part of the Southern Tier region. It is bordered by Madison County to the north, Otsego County to the east, Delaware County to the south, and Broome County to the west. The county has a total area of 864 square miles, and is mostly rural. The terrain is mostly rolling hills, with the highest point being the summit of Mount Utsayantha in the town of Bainbridge, at 2,365 feet above sea level. The Chenango River runs through the county, and is the main waterway.
Economy
Chenango County’s economy is largely based on agriculture and manufacturing. The county is home to several dairy farms, as well as vegetable and fruit farms. The county is also home to several manufacturing companies, including Endicott Johnson Corporation, which produces shoes, and the Norwich Pharmaceuticals plant, which produces pharmaceuticals. The county is also home to several colleges and universities, including SUNY Morrisville, SUNY Delhi, and Colgate University.
Demographics
As of the 2010 census, Chenango County had a population of 49,967. The racial makeup of the county was 94.2% White, 2.3% African American, 0.5% Native American, 0.7% Asian, 0.1% Pacific Islander, 1.2% from other races, and 1.1% from two or more races. Hispanic or Latino of any race were 3.2% of the population. The median income for a household in the county was $45,945, and the median income for a family was $54,845. The per capita income for the county was $21,945.
Chenango County is a rural county in the south-central part of New York State. It has a total area of 864 square miles, and a population of 49,967 as of the 2010 census. The county’s economy is largely based on agriculture and manufacturing, and it is home to several colleges and universities. The racial makeup of the county is mostly White, with African Americans, Native Americans, Asians, and Pacific Islanders making up the remainder of the population. The median income for a household in the county is $45,945, and the per capita income is $21,945.
Common Questions
What is Per Capita Income in Chenango County?
Per Capita income in Chenango County is $32,708.
What is the Median Family Income in Chenango County?
Median Family Income in Chenango County is $75,027.
What is the Median Household income in Chenango County?
Median Household Income in Chenango County is $61,741.
What is Income or Wage Gap in Chenango County?
Income or Wage Gap in Chenango County is 31.4%.
Women in Chenango County earn 68.6 cents for every dollar earned by a man.
What is Family Income Deficit in Chenango County?
Family Income Deficit in Chenango County is $10,872.
Families that are below poverty line in Chenango County earn $10,872 less on average than the poverty threshold level.
What is Inequality or Gini Index in Chenango County?
Inequality or Gini Index in Chenango County is 0.42.
What is the Total Population of Chenango County?
Total Population of Chenango County is 47,096.
What is the Total Male Population of Chenango County?
Total Male Population of Chenango County is 23,663.
What is the Total Female Population of Chenango County?
Total Female Population of Chenango County is 23,433.
What is the Ratio of Males per 100 Females in Chenango County?
There are 100.98 Males per 100 Females in Chenango County.
What is the Ratio of Females per 100 Males in Chenango County?
There are 99.03 Females per 100 Males in Chenango County.
What is the Median Population Age in Chenango County?
Median Population Age in Chenango County is 44.9 Years.
What is the Average Family Size in Chenango County
Average Family Size in Chenango County is 2.8 People.
What is the Average Household Size in Chenango County
Average Household Size in Chenango County is 2.3 People.
How Large is the Labor Force in Chenango County?
There are 22,874 People in the Labor Forcein in Chenango County.
What is the Percentage of People in the Labor Force in Chenango County?
59.3% of People are in the Labor Force in Chenango County.
What is the Unemployment Rate in Chenango County?
Unemployment Rate in Chenango County is 7.1%.