Grant County, NM Map & Demographics
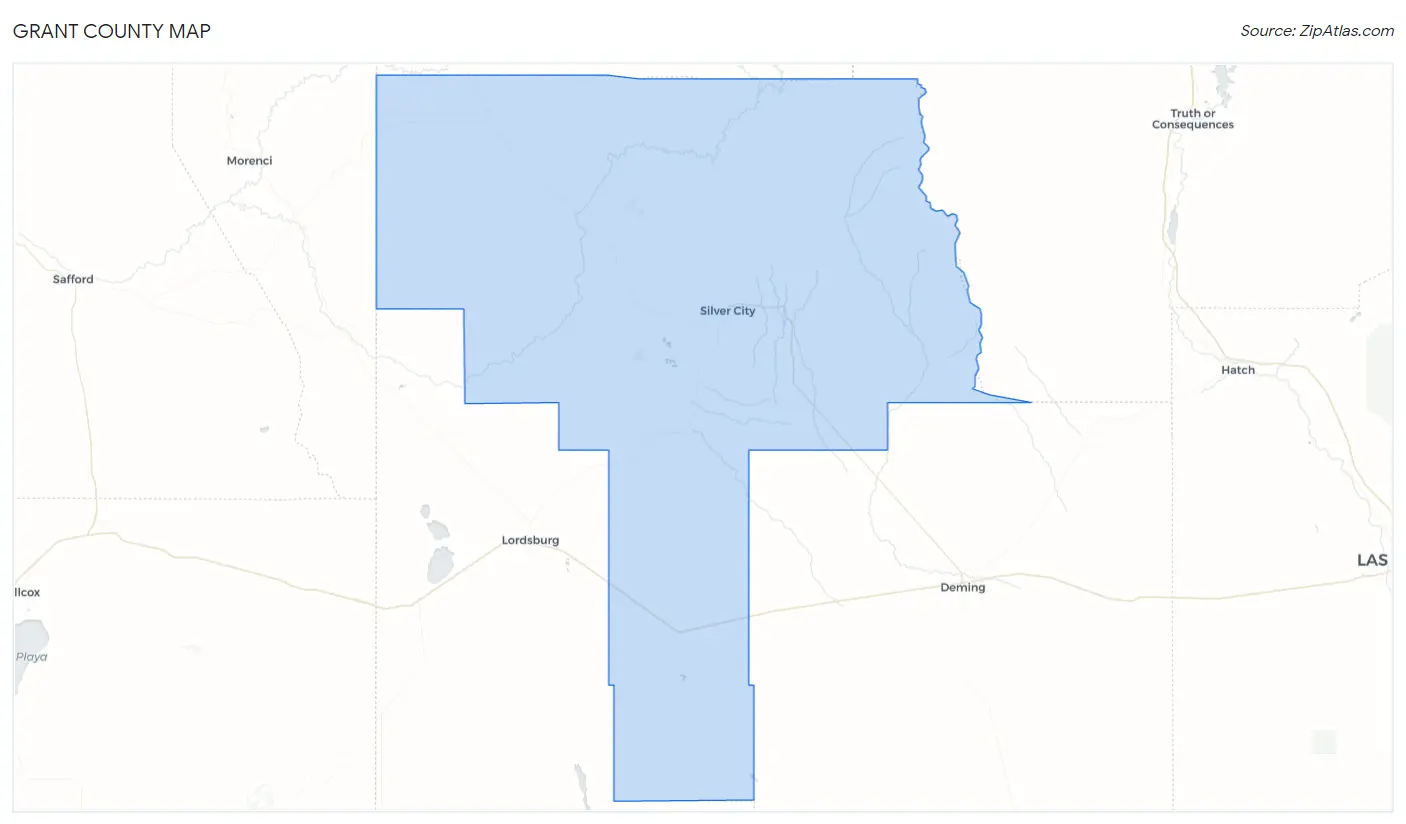
Grant County Map
Grant County Overview
$29,123
PER CAPITA INCOME
$67,686
AVG FAMILY INCOME
$44,895
AVG HOUSEHOLD INCOME
14.9%
WAGE / INCOME GAP [ % ]
85.1¢/ $1
WAGE / INCOME GAP [ $ ]
$9,408
FAMILY INCOME DEFICIT
0.49
INEQUALITY / GINI INDEX
28,006
TOTAL POPULATION
14,084
MALE POPULATION
13,922
FEMALE POPULATION
101.16
MALES / 100 FEMALES
98.85
FEMALES / 100 MALES
48.1
MEDIAN AGE
3.3
AVG FAMILY SIZE
2.4
AVG HOUSEHOLD SIZE
10,605
LABOR FORCE [ PEOPLE ]
45.4%
PERCENT IN LABOR FORCE
7.7%
UNEMPLOYMENT RATE
Income in Grant County
Income Overview in Grant County
Per Capita Income in Grant County is $29,123, while median incomes of families and households are $67,686 and $44,895 respectively.
| Characteristic | Number | Measure |
| Per Capita Income | 28,006 | $29,123 |
| Median Family Income | 6,044 | $67,686 |
| Mean Family Income | 6,044 | $89,411 |
| Median Household Income | 11,292 | $44,895 |
| Mean Household Income | 11,292 | $67,689 |
| Income Deficit | 6,044 | $9,408 |
| Wage / Income Gap (%) | 28,006 | 14.91% |
| Wage / Income Gap ($) | 28,006 | 85.09¢ per $1 |
| Gini / Inequality Index | 28,006 | 0.49 |
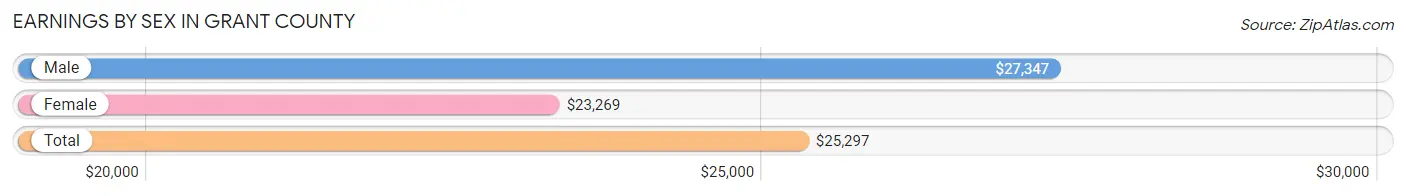
Earnings by Sex in Grant County
Average Earnings in Grant County are $25,297, $27,347 for men and $23,269 for women, a difference of 14.9%.
| Sex | Number | Average Earnings |
| Male | 5,628 (48.4%) | $27,347 |
| Female | 6,010 (51.6%) | $23,269 |
| Total | 11,638 (100.0%) | $25,297 |
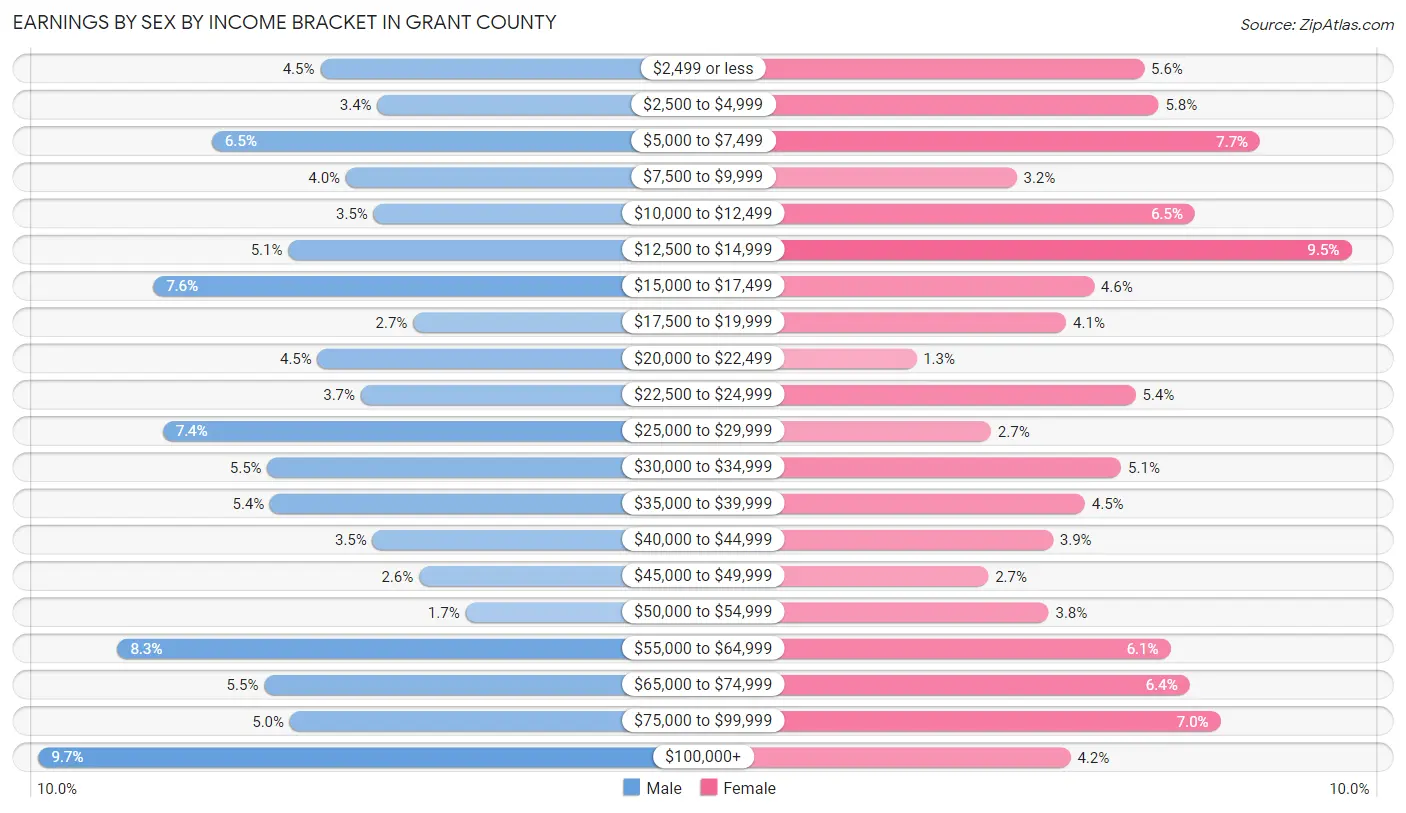
Earnings by Sex by Income Bracket in Grant County
The most common earnings brackets in Grant County are $100,000+ for men (548 | 9.7%) and $12,500 to $14,999 for women (568 | 9.5%).
| Income | Male | Female |
| $2,499 or less | 251 (4.5%) | 335 (5.6%) |
| $2,500 to $4,999 | 191 (3.4%) | 351 (5.8%) |
| $5,000 to $7,499 | 365 (6.5%) | 465 (7.7%) |
| $7,500 to $9,999 | 224 (4.0%) | 191 (3.2%) |
| $10,000 to $12,499 | 195 (3.5%) | 392 (6.5%) |
| $12,500 to $14,999 | 285 (5.1%) | 568 (9.5%) |
| $15,000 to $17,499 | 427 (7.6%) | 278 (4.6%) |
| $17,500 to $19,999 | 153 (2.7%) | 247 (4.1%) |
| $20,000 to $22,499 | 254 (4.5%) | 78 (1.3%) |
| $22,500 to $24,999 | 208 (3.7%) | 325 (5.4%) |
| $25,000 to $29,999 | 417 (7.4%) | 162 (2.7%) |
| $30,000 to $34,999 | 307 (5.4%) | 309 (5.1%) |
| $35,000 to $39,999 | 304 (5.4%) | 268 (4.5%) |
| $40,000 to $44,999 | 196 (3.5%) | 232 (3.9%) |
| $45,000 to $49,999 | 147 (2.6%) | 159 (2.6%) |
| $50,000 to $54,999 | 98 (1.7%) | 227 (3.8%) |
| $55,000 to $64,999 | 465 (8.3%) | 364 (6.1%) |
| $65,000 to $74,999 | 310 (5.5%) | 386 (6.4%) |
| $75,000 to $99,999 | 283 (5.0%) | 421 (7.0%) |
| $100,000+ | 548 (9.7%) | 252 (4.2%) |
| Total | 5,628 (100.0%) | 6,010 (100.0%) |
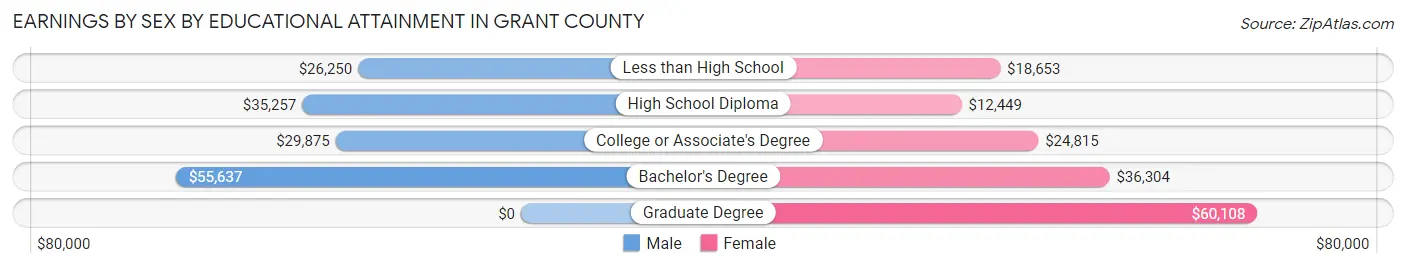
Earnings by Sex by Educational Attainment in Grant County
Average earnings in Grant County are $32,088 for men and $28,540 for women, a difference of 11.1%. Men with an educational attainment of bachelor's degree enjoy the highest average annual earnings of $55,637, while those with less than high school education earn the least with $26,250. Women with an educational attainment of graduate degree earn the most with the average annual earnings of $60,108, while those with high school diploma education have the smallest earnings of $12,449.
| Educational Attainment | Male Income | Female Income |
| Less than High School | $26,250 | $18,653 |
| High School Diploma | $35,257 | $12,449 |
| College or Associate's Degree | $29,875 | $24,815 |
| Bachelor's Degree | $55,637 | $36,304 |
| Graduate Degree | - | - |
| Total | $32,088 | $28,540 |
Family Income in Grant County
Family Income Brackets in Grant County
According to the Grant County family income data, there are 1,281 families falling into the $100,000 to $149,999 income range, which is the most common income bracket and makes up 21.2% of all families. Conversely, the $10,000 to $14,999 income bracket is the least frequent group with only 103 families (1.7%) belonging to this category.
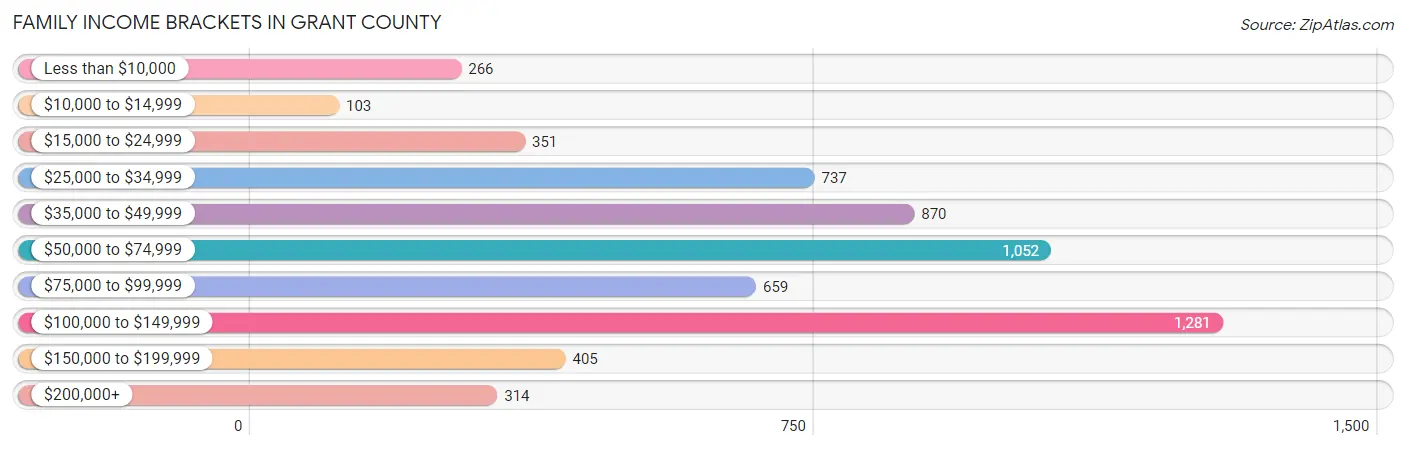
| Income Bracket | # Families | % Families |
| Less than $10,000 | 266 | 4.4% |
| $10,000 to $14,999 | 103 | 1.7% |
| $15,000 to $24,999 | 351 | 5.8% |
| $25,000 to $34,999 | 737 | 12.2% |
| $35,000 to $49,999 | 870 | 14.4% |
| $50,000 to $74,999 | 1,052 | 17.4% |
| $75,000 to $99,999 | 659 | 10.9% |
| $100,000 to $149,999 | 1,281 | 21.2% |
| $150,000 to $199,999 | 405 | 6.7% |
| $200,000+ | 314 | 5.2% |
Family Income by Famaliy Size in Grant County
6-person families (86 | 1.4%) account for the highest median family income in Grant County with $127,222 per family, while 2-person families (4,038 | 66.8%) have the highest median income of $34,474 per family member.
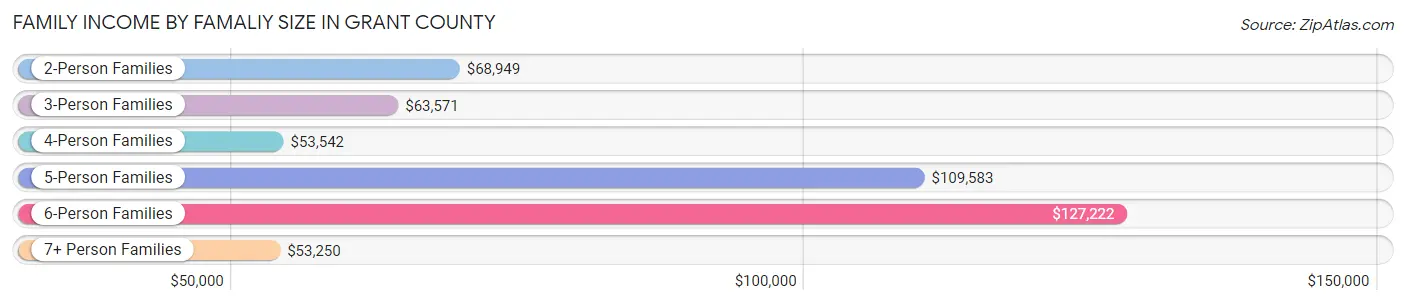
| Income Bracket | # Families | Median Income |
| 2-Person Families | 4,038 (66.8%) | $68,949 |
| 3-Person Families | 1,004 (16.6%) | $63,571 |
| 4-Person Families | 515 (8.5%) | $53,542 |
| 5-Person Families | 254 (4.2%) | $109,583 |
| 6-Person Families | 86 (1.4%) | $127,222 |
| 7+ Person Families | 147 (2.4%) | $53,250 |
| Total | 6,044 (100.0%) | $67,686 |
Family Income by Number of Earners in Grant County
The median family income in Grant County is $67,686, with families comprising 3+ earners (270) having the highest median family income of $112,727, while families with no earners (1,639) have the lowest median family income of $44,552, accounting for 4.5% and 27.1% of families, respectively.
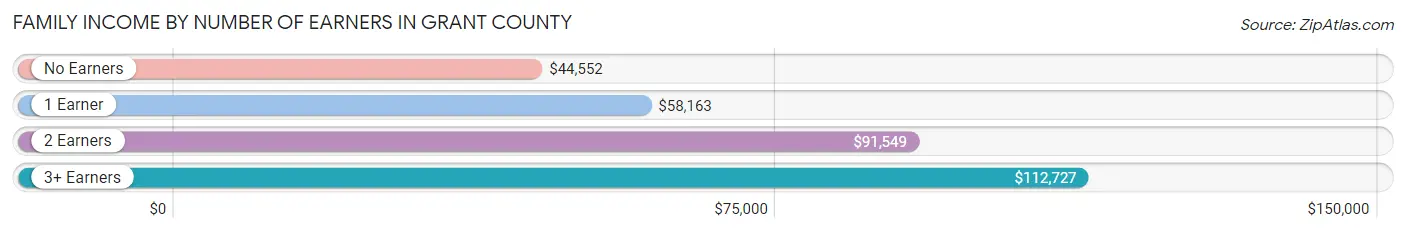
| Number of Earners | # Families | Median Income |
| No Earners | 1,639 (27.1%) | $44,552 |
| 1 Earner | 2,207 (36.5%) | $58,163 |
| 2 Earners | 1,928 (31.9%) | $91,549 |
| 3+ Earners | 270 (4.5%) | $112,727 |
| Total | 6,044 (100.0%) | $67,686 |
Household Income in Grant County
Household Income Brackets in Grant County
With 1,671 households falling in the category, the $25,000 to $34,999 income range is the most frequent in Grant County, accounting for 14.8% of all households. In contrast, only 395 households (3.5%) fall into the $150,000 to $199,999 income bracket, making it the least populous group.
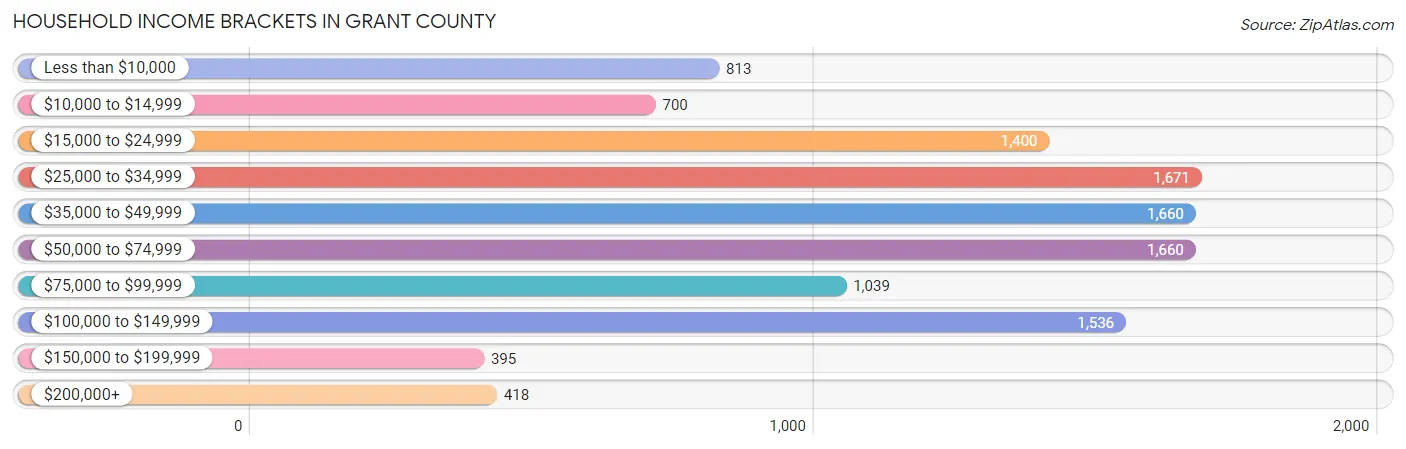
| Income Bracket | # Households | % Households |
| Less than $10,000 | 813 | 7.2% |
| $10,000 to $14,999 | 700 | 6.2% |
| $15,000 to $24,999 | 1,400 | 12.4% |
| $25,000 to $34,999 | 1,671 | 14.8% |
| $35,000 to $49,999 | 1,660 | 14.7% |
| $50,000 to $74,999 | 1,660 | 14.7% |
| $75,000 to $99,999 | 1,039 | 9.2% |
| $100,000 to $149,999 | 1,536 | 13.6% |
| $150,000 to $199,999 | 395 | 3.5% |
| $200,000+ | 418 | 3.7% |
Household Income by Householder Age in Grant County
The median household income in Grant County is $44,895, with the highest median household income of $52,557 found in the 45 to 64 years age bracket for the primary householder. A total of 3,947 households (34.9%) fall into this category. Meanwhile, the 15 to 24 years age bracket for the primary householder has the lowest median household income of $22,868, with 409 households (3.6%) in this group.
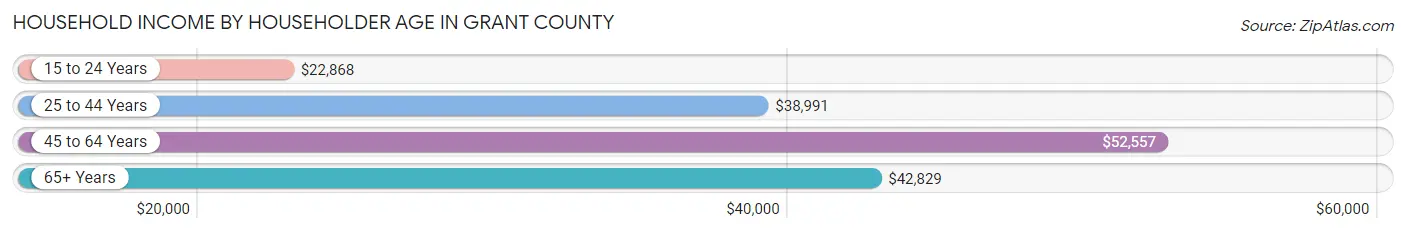
| Income Bracket | # Households | Median Income |
| 15 to 24 Years | 409 (3.6%) | $22,868 |
| 25 to 44 Years | 2,247 (19.9%) | $38,991 |
| 45 to 64 Years | 3,947 (34.9%) | $52,557 |
| 65+ Years | 4,689 (41.5%) | $42,829 |
| Total | 11,292 (100.0%) | $44,895 |
Poverty in Grant County
Income Below Poverty by Sex and Age in Grant County
With 17.8% poverty level for males and 23.1% for females among the residents of Grant County, under 5 year old males and 15 year old females are the most vulnerable to poverty, with 355 males (46.2%) and 26 females (59.1%) in their respective age groups living below the poverty level.
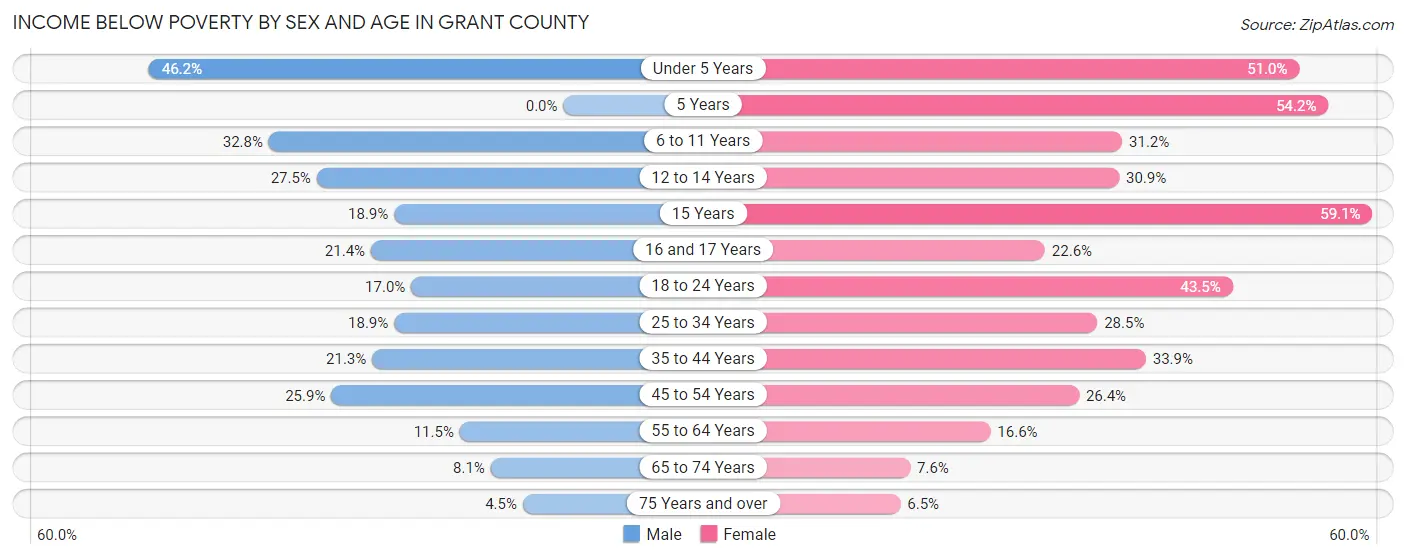
| Age Bracket | Male | Female |
| Under 5 Years | 355 (46.2%) | 242 (50.9%) |
| 5 Years | 0 (0.0%) | 52 (54.2%) |
| 6 to 11 Years | 247 (32.8%) | 261 (31.2%) |
| 12 to 14 Years | 150 (27.5%) | 168 (30.9%) |
| 15 Years | 46 (18.9%) | 26 (59.1%) |
| 16 and 17 Years | 63 (21.4%) | 76 (22.6%) |
| 18 to 24 Years | 179 (17.0%) | 440 (43.5%) |
| 25 to 34 Years | 223 (18.9%) | 326 (28.4%) |
| 35 to 44 Years | 341 (21.3%) | 511 (33.9%) |
| 45 to 54 Years | 363 (25.9%) | 383 (26.4%) |
| 55 to 64 Years | 214 (11.5%) | 344 (16.6%) |
| 65 to 74 Years | 183 (8.1%) | 169 (7.6%) |
| 75 Years and over | 65 (4.5%) | 111 (6.5%) |
| Total | 2,429 (17.8%) | 3,109 (23.1%) |
Income Above Poverty by Sex and Age in Grant County
According to the poverty statistics in Grant County, males aged 5 years and females aged 75 years and over are the age groups that are most secure financially, with 100.0% of males and 93.5% of females in these age groups living above the poverty line.
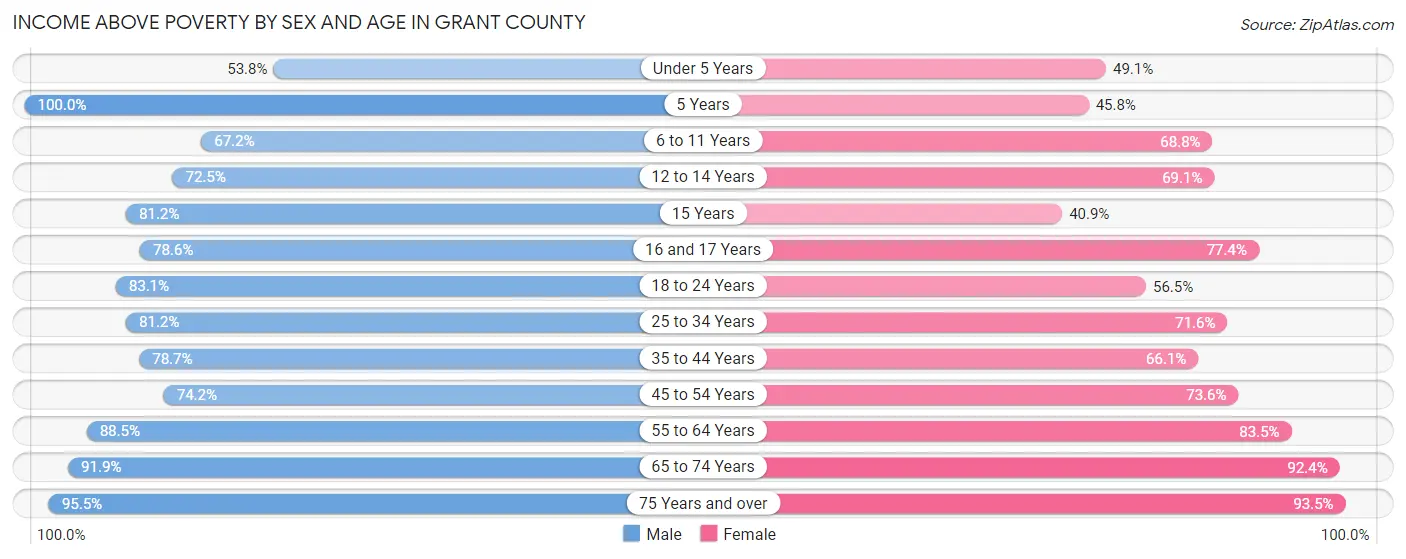
| Age Bracket | Male | Female |
| Under 5 Years | 414 (53.8%) | 233 (49.0%) |
| 5 Years | 214 (100.0%) | 44 (45.8%) |
| 6 to 11 Years | 506 (67.2%) | 575 (68.8%) |
| 12 to 14 Years | 396 (72.5%) | 376 (69.1%) |
| 15 Years | 198 (81.1%) | 18 (40.9%) |
| 16 and 17 Years | 231 (78.6%) | 260 (77.4%) |
| 18 to 24 Years | 877 (83.1%) | 571 (56.5%) |
| 25 to 34 Years | 960 (81.1%) | 820 (71.6%) |
| 35 to 44 Years | 1,260 (78.7%) | 998 (66.1%) |
| 45 to 54 Years | 1,041 (74.2%) | 1,067 (73.6%) |
| 55 to 64 Years | 1,641 (88.5%) | 1,734 (83.5%) |
| 65 to 74 Years | 2,080 (91.9%) | 2,052 (92.4%) |
| 75 Years and over | 1,373 (95.5%) | 1,591 (93.5%) |
| Total | 11,191 (82.2%) | 10,339 (76.9%) |
Income Below Poverty Among Married-Couple Families in Grant County
The poverty statistics for married-couple families in Grant County show that 5.7% or 267 of the total 4,671 families live below the poverty line. Families with 5 or more children have the highest poverty rate of 37.6%, comprising of 44 families. On the other hand, families with no children have the lowest poverty rate of 2.8%, which includes 99 families.
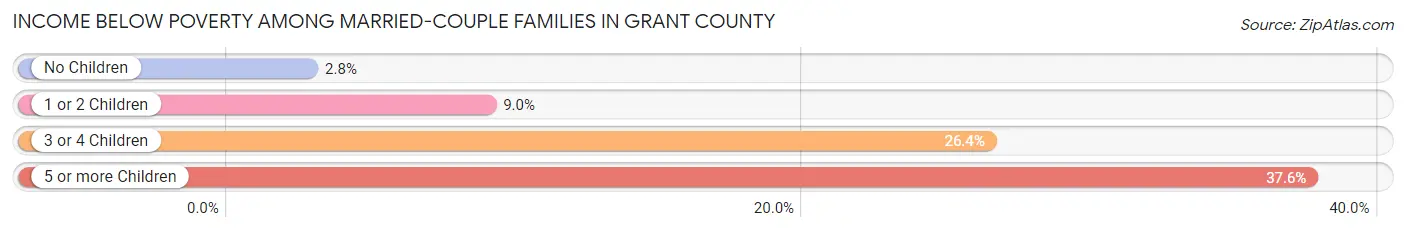
| Children | Above Poverty | Below Poverty |
| No Children | 3,450 (97.2%) | 99 (2.8%) |
| 1 or 2 Children | 739 (91.0%) | 73 (9.0%) |
| 3 or 4 Children | 142 (73.6%) | 51 (26.4%) |
| 5 or more Children | 73 (62.4%) | 44 (37.6%) |
| Total | 4,404 (94.3%) | 267 (5.7%) |
Income Below Poverty Among Single-Parent Households in Grant County
According to the poverty data in Grant County, 31.9% or 80 single-father households and 30.8% or 346 single-mother households are living below the poverty line. Among single-father households, those with 5 or more children have the highest poverty rate, with 13 households (100.0%) experiencing poverty. Likewise, among single-mother households, those with 1 or 2 children have the highest poverty rate, with 261 households (55.4%) falling below the poverty line.
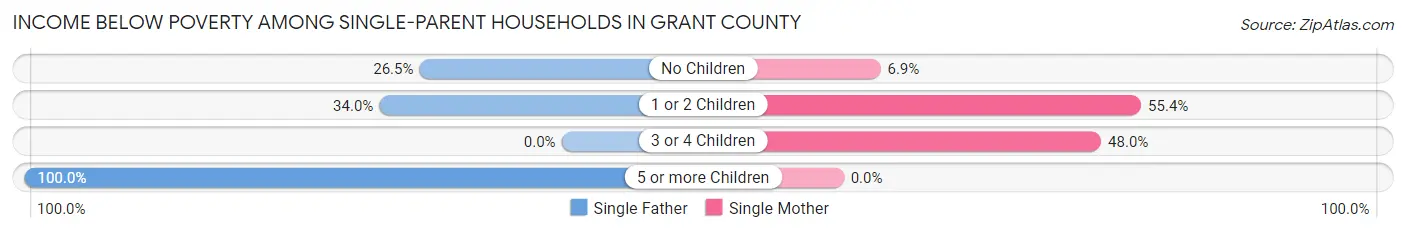
| Children | Single Father | Single Mother |
| No Children | 49 (26.5%) | 38 (6.9%) |
| 1 or 2 Children | 18 (34.0%) | 261 (55.4%) |
| 3 or 4 Children | 0 (0.0%) | 47 (48.0%) |
| 5 or more Children | 13 (100.0%) | 0 (0.0%) |
| Total | 80 (31.9%) | 346 (30.8%) |
Income Below Poverty Among Married-Couple vs Single-Parent Households in Grant County
The poverty data for Grant County shows that 267 of the married-couple family households (5.7%) and 426 of the single-parent households (31.0%) are living below the poverty level. Within the married-couple family households, those with 5 or more children have the highest poverty rate, with 44 households (37.6%) falling below the poverty line. Among the single-parent households, those with 5 or more children have the highest poverty rate, with 13 household (100.0%) living below poverty.
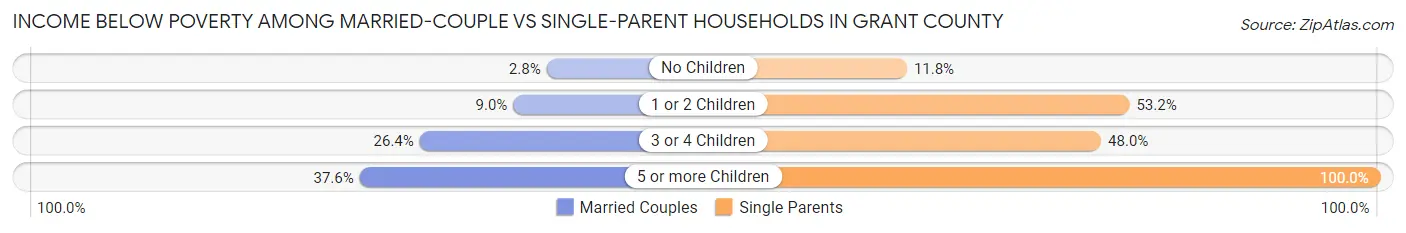
| Children | Married-Couple Families | Single-Parent Households |
| No Children | 99 (2.8%) | 87 (11.8%) |
| 1 or 2 Children | 73 (9.0%) | 279 (53.2%) |
| 3 or 4 Children | 51 (26.4%) | 47 (48.0%) |
| 5 or more Children | 44 (37.6%) | 13 (100.0%) |
| Total | 267 (5.7%) | 426 (31.0%) |
Race in Grant County
The most populous races in Grant County are White / Caucasian (20,006 | 71.4%), Hispanic or Latino (14,039 | 50.1%), and Two or more Races (5,759 | 20.6%).
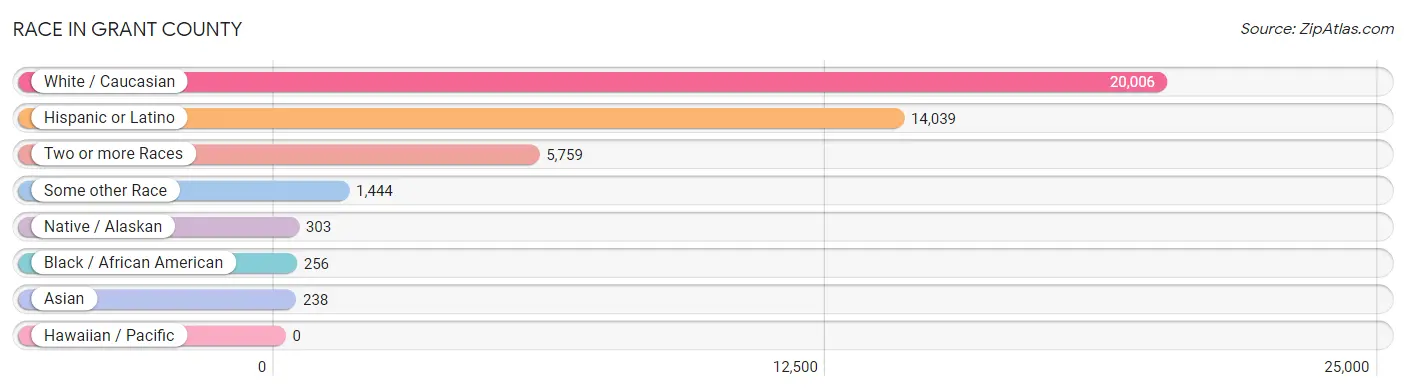
| Race | # Population | % Population |
| Asian | 238 | 0.9% |
| Black / African American | 256 | 0.9% |
| Hawaiian / Pacific | 0 | 0.0% |
| Hispanic or Latino | 14,039 | 50.1% |
| Native / Alaskan | 303 | 1.1% |
| White / Caucasian | 20,006 | 71.4% |
| Two or more Races | 5,759 | 20.6% |
| Some other Race | 1,444 | 5.2% |
| Total | 28,006 | 100.0% |
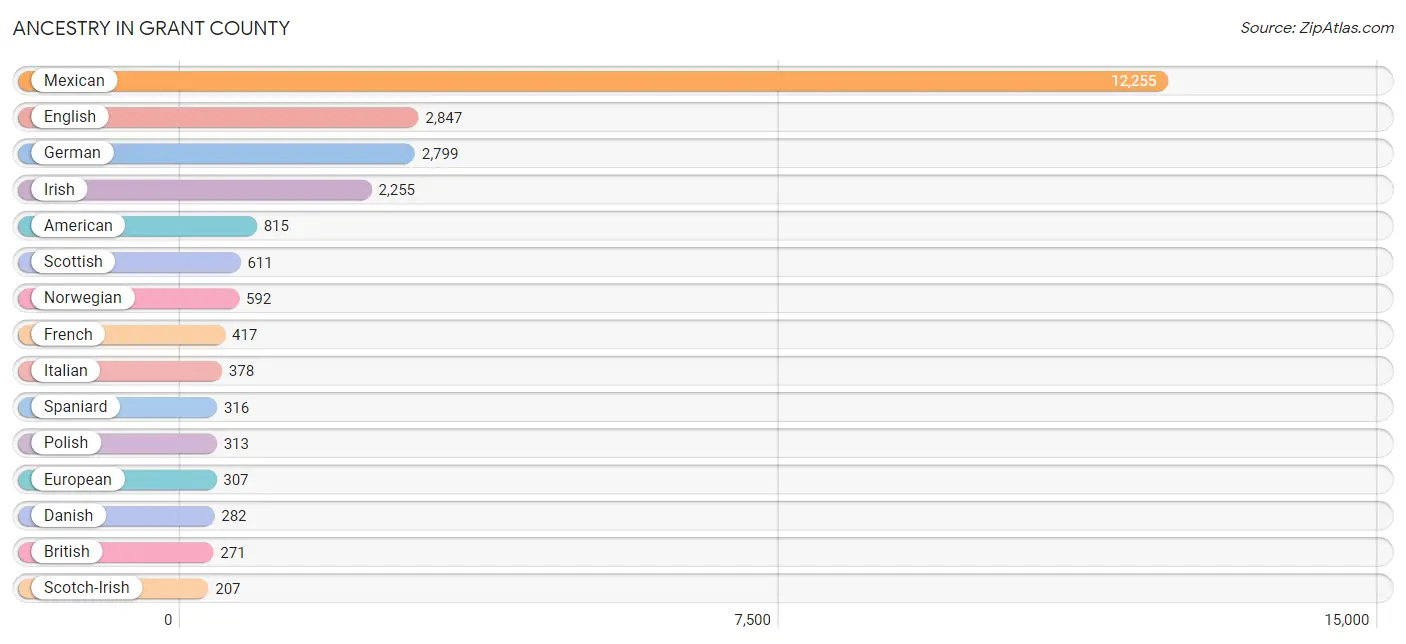
Ancestry in Grant County
The most populous ancestries reported in Grant County are Mexican (12,255 | 43.8%), English (2,847 | 10.2%), German (2,799 | 10.0%), Irish (2,255 | 8.1%), and American (815 | 2.9%), together accounting for 74.9% of all Grant County residents.
| Ancestry | # Population | % Population |
| American | 815 | 2.9% |
| Apache | 92 | 0.3% |
| Arab | 4 | 0.0% |
| Armenian | 17 | 0.1% |
| Austrian | 34 | 0.1% |
| Belgian | 11 | 0.0% |
| Bhutanese | 27 | 0.1% |
| Blackfeet | 34 | 0.1% |
| British | 271 | 1.0% |
| Burmese | 27 | 0.1% |
| Celtic | 31 | 0.1% |
| Central American | 126 | 0.4% |
| Central American Indian | 32 | 0.1% |
| Cherokee | 88 | 0.3% |
| Cheyenne | 13 | 0.1% |
| Choctaw | 34 | 0.1% |
| Colombian | 12 | 0.0% |
| Cuban | 136 | 0.5% |
| Czech | 45 | 0.2% |
| Danish | 282 | 1.0% |
| Dutch | 184 | 0.7% |
| Eastern European | 44 | 0.2% |
| Egyptian | 4 | 0.0% |
| English | 2,847 | 10.2% |
| European | 307 | 1.1% |
| Finnish | 62 | 0.2% |
| French | 417 | 1.5% |
| French Canadian | 64 | 0.2% |
| German | 2,799 | 10.0% |
| Greek | 7 | 0.0% |
| Haitian | 4 | 0.0% |
| Honduran | 67 | 0.2% |
| Hopi | 80 | 0.3% |
| Hungarian | 25 | 0.1% |
| Indian (Asian) | 16 | 0.1% |
| Irish | 2,255 | 8.1% |
| Italian | 378 | 1.3% |
| Korean | 182 | 0.6% |
| Mexican | 12,255 | 43.8% |
| Mexican American Indian | 41 | 0.2% |
| Navajo | 53 | 0.2% |
| Nicaraguan | 32 | 0.1% |
| Northern European | 49 | 0.2% |
| Norwegian | 592 | 2.1% |
| Osage | 21 | 0.1% |
| Pakistani | 1 | 0.0% |
| Peruvian | 14 | 0.1% |
| Polish | 313 | 1.1% |
| Portuguese | 48 | 0.2% |
| Pueblo | 124 | 0.4% |
| Puerto Rican | 60 | 0.2% |
| Russian | 36 | 0.1% |
| Salvadoran | 27 | 0.1% |
| Scandinavian | 12 | 0.0% |
| Scotch-Irish | 207 | 0.7% |
| Scottish | 611 | 2.2% |
| Serbian | 52 | 0.2% |
| Slavic | 13 | 0.1% |
| Slovak | 24 | 0.1% |
| South American | 26 | 0.1% |
| Spaniard | 316 | 1.1% |
| Spanish | 126 | 0.4% |
| Swedish | 161 | 0.6% |
| Swiss | 32 | 0.1% |
| Thai | 22 | 0.1% |
| Tohono O'Odham | 31 | 0.1% |
| Welsh | 199 | 0.7% | View All 67 Rows |
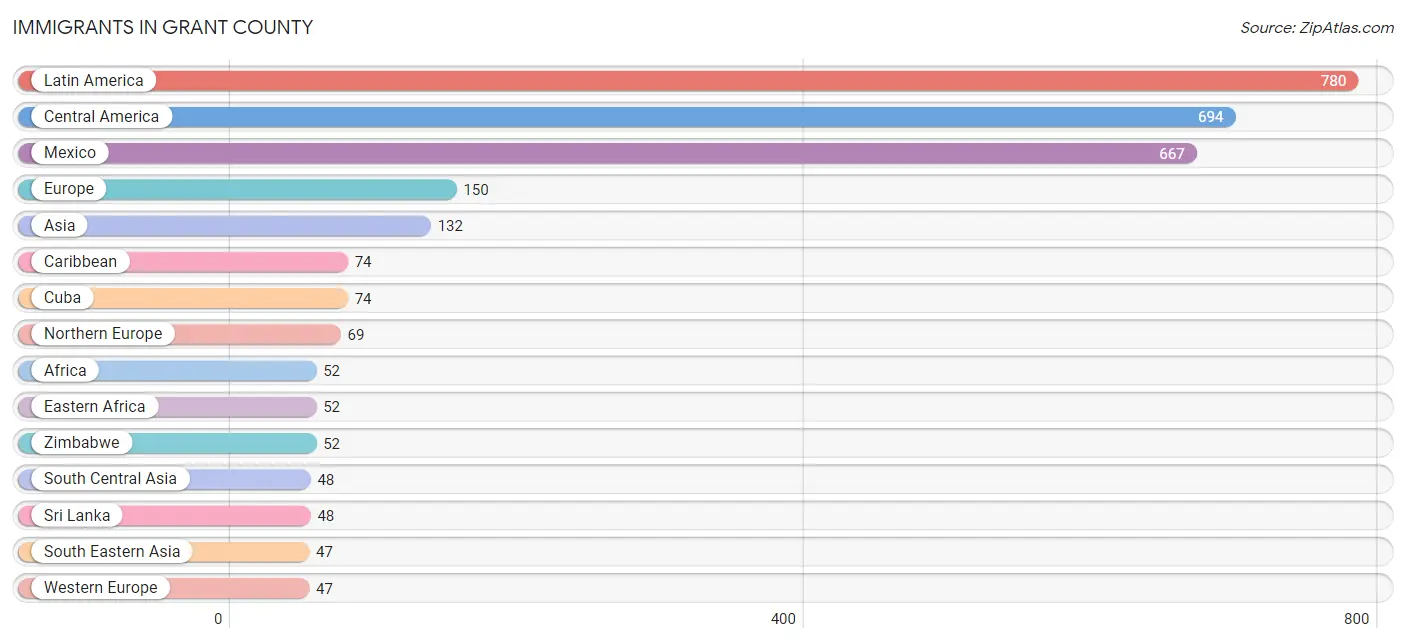
Immigrants in Grant County
The most numerous immigrant groups reported in Grant County came from Latin America (780 | 2.8%), Central America (694 | 2.5%), Mexico (667 | 2.4%), Europe (150 | 0.5%), and Asia (132 | 0.5%), together accounting for 8.7% of all Grant County residents.
| Immigration Origin | # Population | % Population |
| Africa | 52 | 0.2% |
| Asia | 132 | 0.5% |
| Brazil | 12 | 0.0% |
| Canada | 12 | 0.0% |
| Caribbean | 74 | 0.3% |
| Central America | 694 | 2.5% |
| Cuba | 74 | 0.3% |
| Denmark | 23 | 0.1% |
| Eastern Africa | 52 | 0.2% |
| Eastern Asia | 37 | 0.1% |
| Eastern Europe | 17 | 0.1% |
| El Salvador | 27 | 0.1% |
| England | 7 | 0.0% |
| Europe | 150 | 0.5% |
| France | 6 | 0.0% |
| Germany | 28 | 0.1% |
| Hungary | 4 | 0.0% |
| Italy | 11 | 0.0% |
| Japan | 27 | 0.1% |
| Korea | 10 | 0.0% |
| Latin America | 780 | 2.8% |
| Malaysia | 3 | 0.0% |
| Mexico | 667 | 2.4% |
| Netherlands | 5 | 0.0% |
| Northern Europe | 69 | 0.3% |
| Norway | 5 | 0.0% |
| Philippines | 43 | 0.2% |
| Portugal | 6 | 0.0% |
| Serbia | 13 | 0.1% |
| South America | 12 | 0.0% |
| South Central Asia | 48 | 0.2% |
| South Eastern Asia | 47 | 0.2% |
| Southern Europe | 17 | 0.1% |
| Sri Lanka | 48 | 0.2% |
| Switzerland | 8 | 0.0% |
| Thailand | 1 | 0.0% |
| Western Europe | 47 | 0.2% |
| Zimbabwe | 52 | 0.2% | View All 38 Rows |
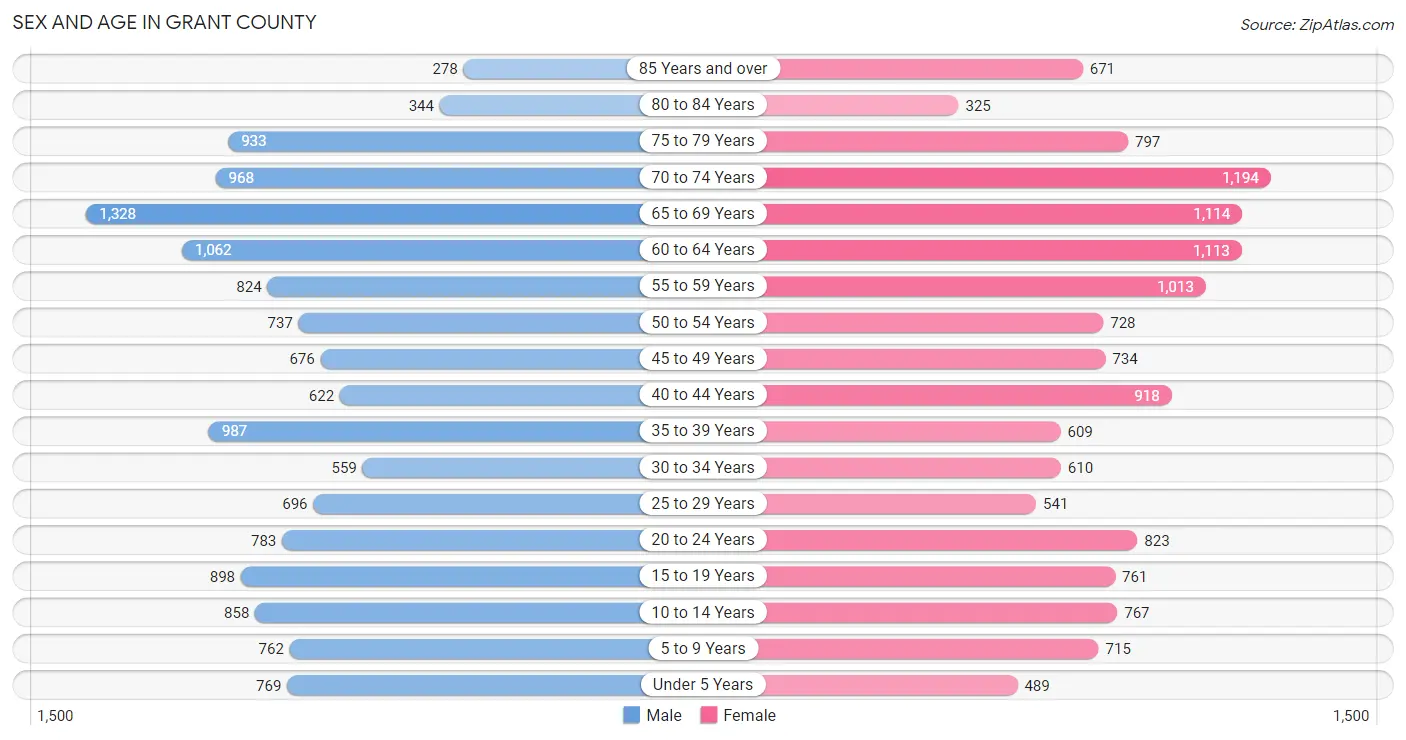
Sex and Age in Grant County
Sex and Age in Grant County
The most populous age groups in Grant County are 65 to 69 Years (1,328 | 9.4%) for men and 70 to 74 Years (1,194 | 8.6%) for women.
| Age Bracket | Male | Female |
| Under 5 Years | 769 (5.5%) | 489 (3.5%) |
| 5 to 9 Years | 762 (5.4%) | 715 (5.1%) |
| 10 to 14 Years | 858 (6.1%) | 767 (5.5%) |
| 15 to 19 Years | 898 (6.4%) | 761 (5.5%) |
| 20 to 24 Years | 783 (5.6%) | 823 (5.9%) |
| 25 to 29 Years | 696 (4.9%) | 541 (3.9%) |
| 30 to 34 Years | 559 (4.0%) | 610 (4.4%) |
| 35 to 39 Years | 987 (7.0%) | 609 (4.4%) |
| 40 to 44 Years | 622 (4.4%) | 918 (6.6%) |
| 45 to 49 Years | 676 (4.8%) | 734 (5.3%) |
| 50 to 54 Years | 737 (5.2%) | 728 (5.2%) |
| 55 to 59 Years | 824 (5.9%) | 1,013 (7.3%) |
| 60 to 64 Years | 1,062 (7.5%) | 1,113 (8.0%) |
| 65 to 69 Years | 1,328 (9.4%) | 1,114 (8.0%) |
| 70 to 74 Years | 968 (6.9%) | 1,194 (8.6%) |
| 75 to 79 Years | 933 (6.6%) | 797 (5.7%) |
| 80 to 84 Years | 344 (2.4%) | 325 (2.3%) |
| 85 Years and over | 278 (2.0%) | 671 (4.8%) |
| Total | 14,084 (100.0%) | 13,922 (100.0%) |
Families and Households in Grant County
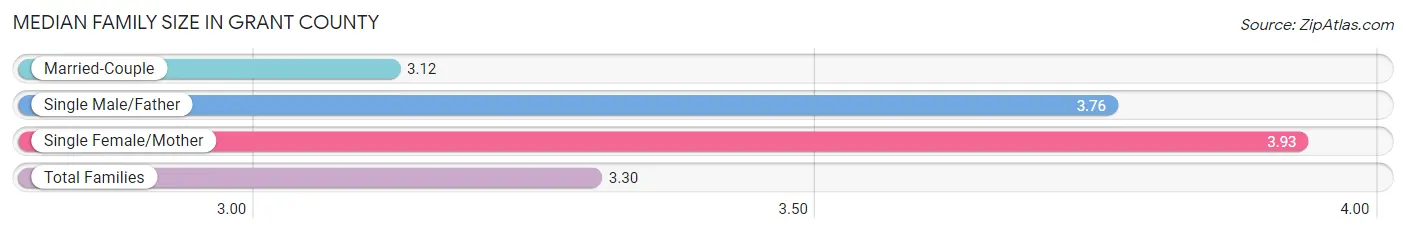
Median Family Size in Grant County
The median family size in Grant County is 3.30 persons per family, with single female/mother families (1,122 | 18.6%) accounting for the largest median family size of 3.93 persons per family. On the other hand, married-couple families (4,671 | 77.3%) represent the smallest median family size with 3.12 persons per family.
| Family Type | # Families | Family Size |
| Married-Couple | 4,671 (77.3%) | 3.12 |
| Single Male/Father | 251 (4.2%) | 3.76 |
| Single Female/Mother | 1,122 (18.6%) | 3.93 |
| Total Families | 6,044 (100.0%) | 3.30 |
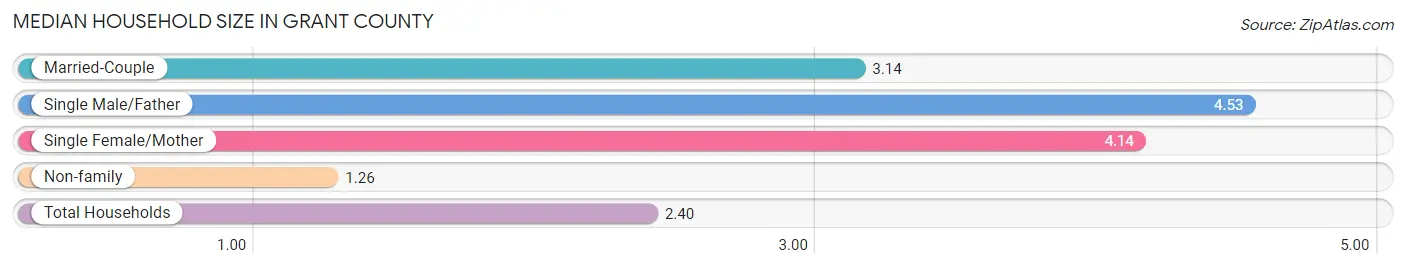
Median Household Size in Grant County
The median household size in Grant County is 2.40 persons per household, with single male/father households (251 | 2.2%) accounting for the largest median household size of 4.53 persons per household. non-family households (5,248 | 46.5%) represent the smallest median household size with 1.26 persons per household.
| Household Type | # Households | Household Size |
| Married-Couple | 4,671 (41.4%) | 3.14 |
| Single Male/Father | 251 (2.2%) | 4.53 |
| Single Female/Mother | 1,122 (9.9%) | 4.14 |
| Non-family | 5,248 (46.5%) | 1.26 |
| Total Households | 11,292 (100.0%) | 2.40 |
Household Size by Marriage Status in Grant County
Out of a total of 11,292 households in Grant County, 6,044 (53.5%) are family households, while 5,248 (46.5%) are nonfamily households. The most numerous type of family households are 2-person households, comprising 3,887, and the most common type of nonfamily households are 1-person households, comprising 4,247.
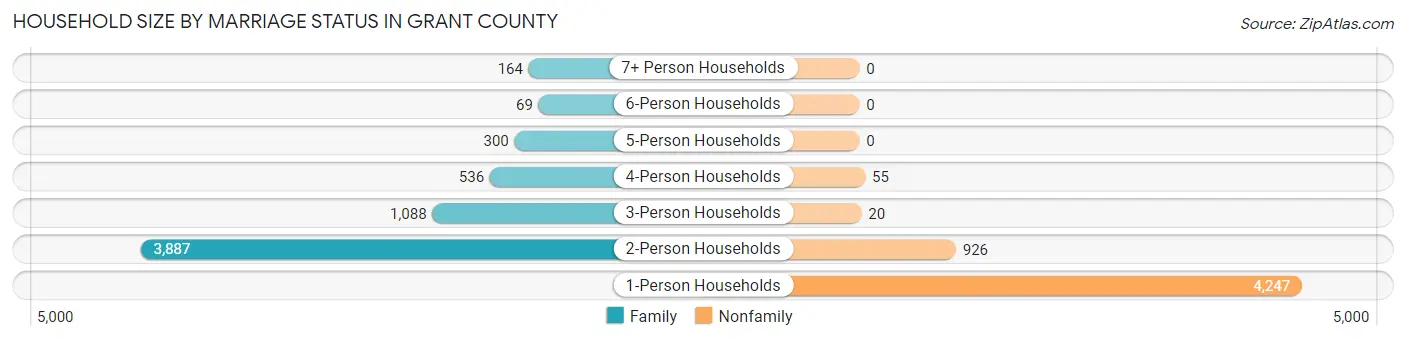
| Household Size | Family Households | Nonfamily Households |
| 1-Person Households | - | 4,247 (37.6%) |
| 2-Person Households | 3,887 (34.4%) | 926 (8.2%) |
| 3-Person Households | 1,088 (9.6%) | 20 (0.2%) |
| 4-Person Households | 536 (4.8%) | 55 (0.5%) |
| 5-Person Households | 300 (2.7%) | 0 (0.0%) |
| 6-Person Households | 69 (0.6%) | 0 (0.0%) |
| 7+ Person Households | 164 (1.5%) | 0 (0.0%) |
| Total | 6,044 (53.5%) | 5,248 (46.5%) |
Female Fertility in Grant County
Fertility by Age in Grant County
Average fertility rate in Grant County is 42.0 births per 1,000 women. Women in the age bracket of 20 to 34 years have the highest fertility rate with 65.0 births per 1,000 women. Women in the age bracket of 20 to 34 years acount for 59.5% of all women with births.
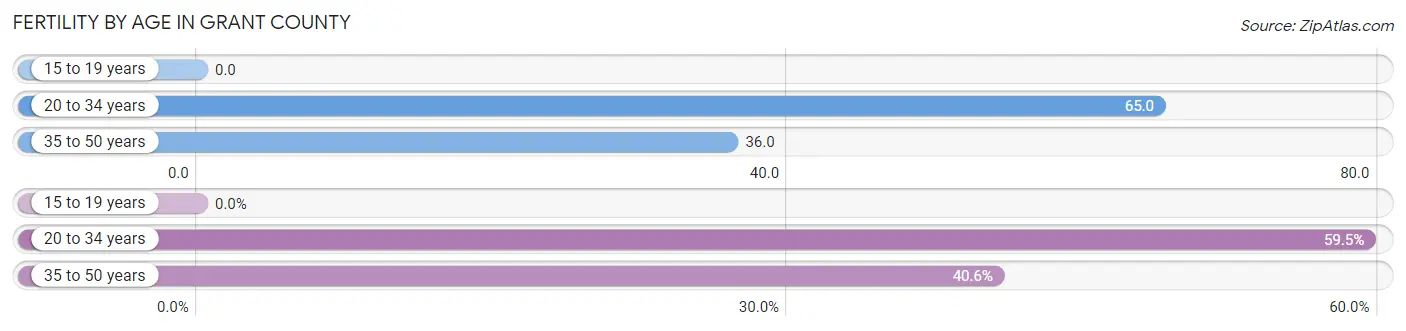
| Age Bracket | Women with Births | Births / 1,000 Women |
| 15 to 19 years | 0 (0.0%) | 0.0 |
| 20 to 34 years | 129 (59.5%) | 65.0 |
| 35 to 50 years | 88 (40.6%) | 36.0 |
| Total | 217 (100.0%) | 42.0 |
Fertility by Age by Marriage Status in Grant County
55.3% of women with births (217) in Grant County are married. The highest percentage of unmarried women with births falls into 20 to 34 years age bracket with 47.3% of them unmarried at the time of birth, while the lowest percentage of unmarried women with births belong to 35 to 50 years age bracket with 40.9% of them unmarried.
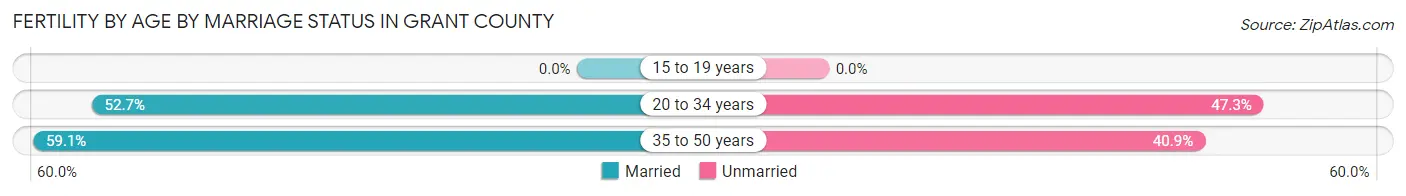
| Age Bracket | Married | Unmarried |
| 15 to 19 years | 0 (0.0%) | 0 (0.0%) |
| 20 to 34 years | 68 (52.7%) | 61 (47.3%) |
| 35 to 50 years | 52 (59.1%) | 36 (40.9%) |
| Total | 120 (55.3%) | 97 (44.7%) |
Fertility by Education in Grant County
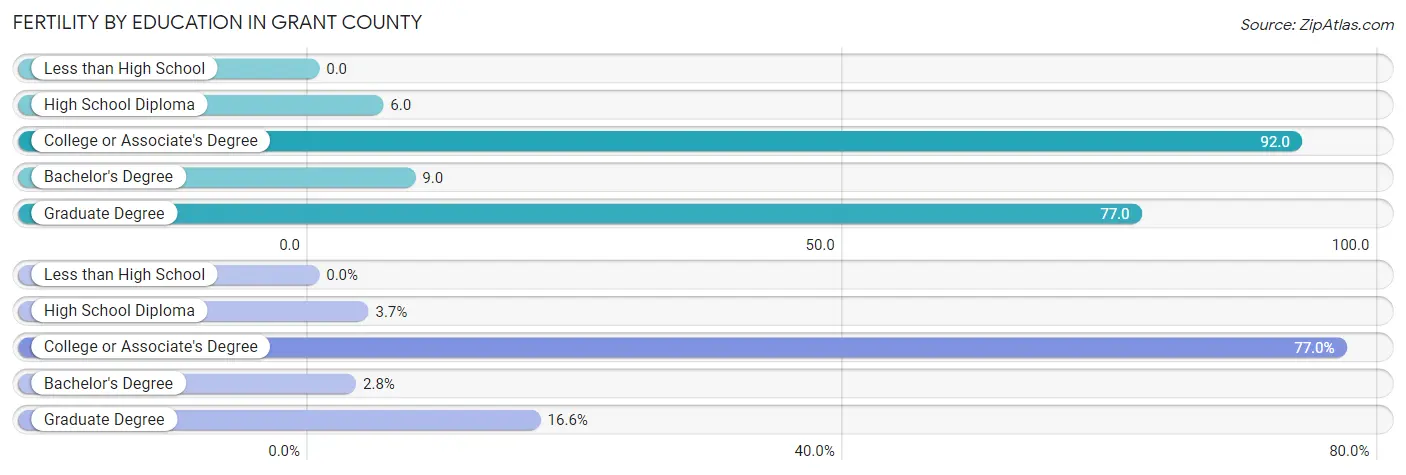
| Educational Attainment | Women with Births | Births / 1,000 Women |
| Less than High School | 0 (0.0%) | 0.0 |
| High School Diploma | 8 (3.7%) | 6.0 |
| College or Associate's Degree | 167 (77.0%) | 92.0 |
| Bachelor's Degree | 6 (2.8%) | 9.0 |
| Graduate Degree | 36 (16.6%) | 77.0 |
| Total | 217 (100.0%) | 42.0 |
Fertility by Education by Marriage Status in Grant County
44.7% of women with births in Grant County are unmarried. Women with the educational attainment of graduate degree are most likely to be married with 100.0% of them married at childbirth, while women with the educational attainment of high school diploma are least likely to be married with 100.0% of them unmarried at childbirth.
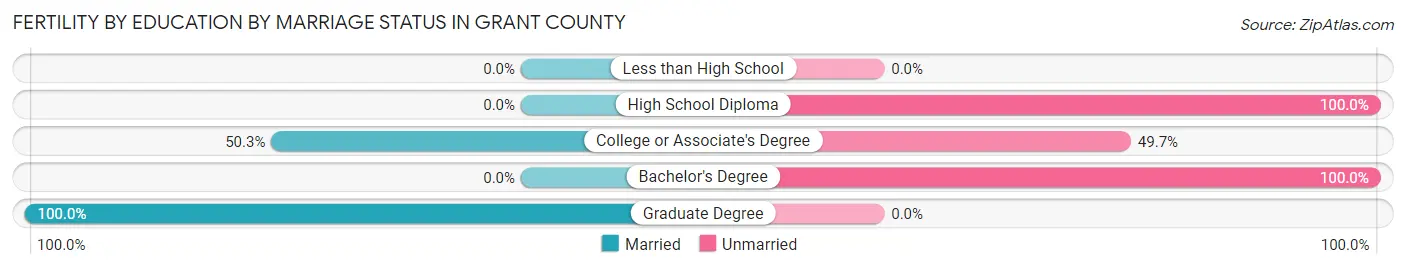
| Educational Attainment | Married | Unmarried |
| Less than High School | 0 (0.0%) | 0 (0.0%) |
| High School Diploma | 0 (0.0%) | 8 (100.0%) |
| College or Associate's Degree | 84 (50.3%) | 83 (49.7%) |
| Bachelor's Degree | 0 (0.0%) | 6 (100.0%) |
| Graduate Degree | 36 (100.0%) | 0 (0.0%) |
| Total | 120 (55.3%) | 97 (44.7%) |
Employment Characteristics in Grant County
Employment by Class of Employer in Grant County
Among the 9,731 employed individuals in Grant County, private company employees (5,533 | 56.9%), state government employees (1,367 | 14.1%), and local government employees (831 | 8.5%) make up the most common classes of employment.
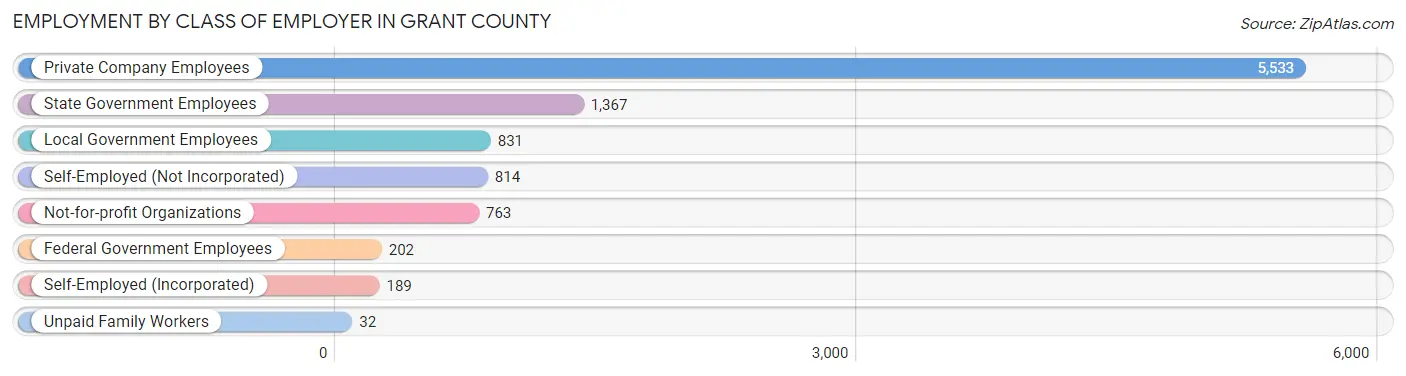
| Employer Class | # Employees | % Employees |
| Private Company Employees | 5,533 | 56.9% |
| Self-Employed (Incorporated) | 189 | 1.9% |
| Self-Employed (Not Incorporated) | 814 | 8.4% |
| Not-for-profit Organizations | 763 | 7.8% |
| Local Government Employees | 831 | 8.5% |
| State Government Employees | 1,367 | 14.1% |
| Federal Government Employees | 202 | 2.1% |
| Unpaid Family Workers | 32 | 0.3% |
| Total | 9,731 | 100.0% |
Employment Status by Age in Grant County
According to the labor force statistics for Grant County, out of the total population over 16 years of age (23,358), 45.4% or 10,605 individuals are in the labor force, with 7.7% or 817 of them unemployed. The age group with the highest labor force participation rate is 25 to 29 years, with 78.8% or 975 individuals in the labor force. Within the labor force, the 16 to 19 years age range has the highest percentage of unemployed individuals, with 29.0% or 107 of them being unemployed.
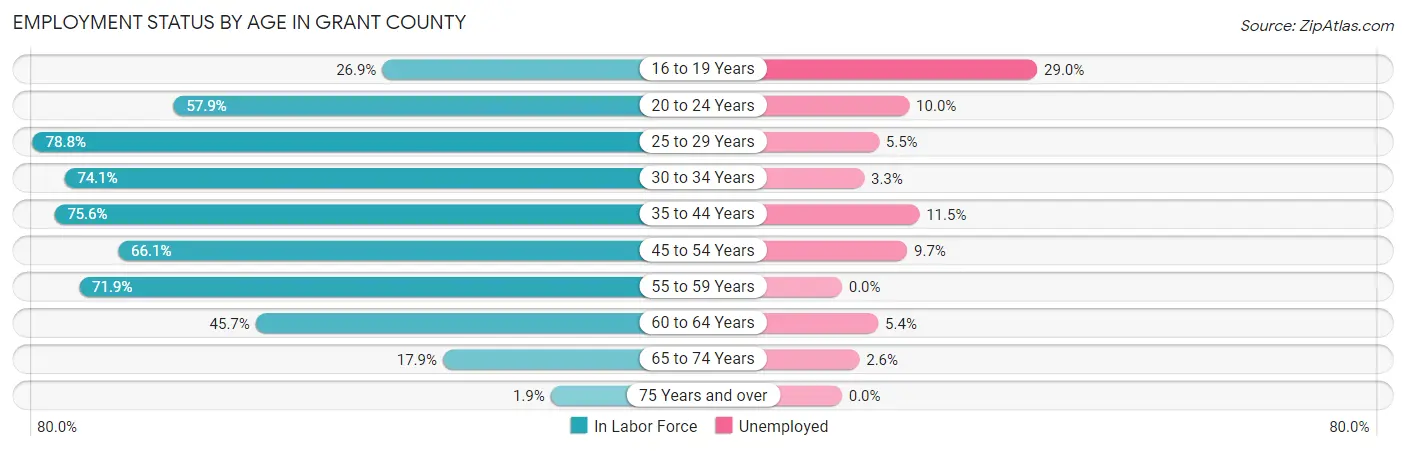
| Age Bracket | In Labor Force | Unemployed |
| 16 to 19 Years | 369 (26.9%) | 107 (29.0%) |
| 20 to 24 Years | 930 (57.9%) | 93 (10.0%) |
| 25 to 29 Years | 975 (78.8%) | 54 (5.5%) |
| 30 to 34 Years | 866 (74.1%) | 29 (3.3%) |
| 35 to 44 Years | 2,371 (75.6%) | 273 (11.5%) |
| 45 to 54 Years | 1,900 (66.1%) | 184 (9.7%) |
| 55 to 59 Years | 1,321 (71.9%) | 0 (0.0%) |
| 60 to 64 Years | 994 (45.7%) | 54 (5.4%) |
| 65 to 74 Years | 824 (17.9%) | 21 (2.6%) |
| 75 Years and over | 64 (1.9%) | 0 (0.0%) |
| Total | 10,605 (45.4%) | 817 (7.7%) |
Employment Status by Educational Attainment in Grant County
According to labor force statistics for Grant County, 67.8% of individuals (8,427) out of the total population between 25 and 64 years of age (12,429) are in the labor force, with 7.0% or 590 of them being unemployed. The group with the highest labor force participation rate are those with the educational attainment of bachelor's degree or higher, with 77.0% or 2,236 individuals in the labor force. Within the labor force, individuals with less than high school education have the highest percentage of unemployment, with 14.9% or 87 of them being unemployed.
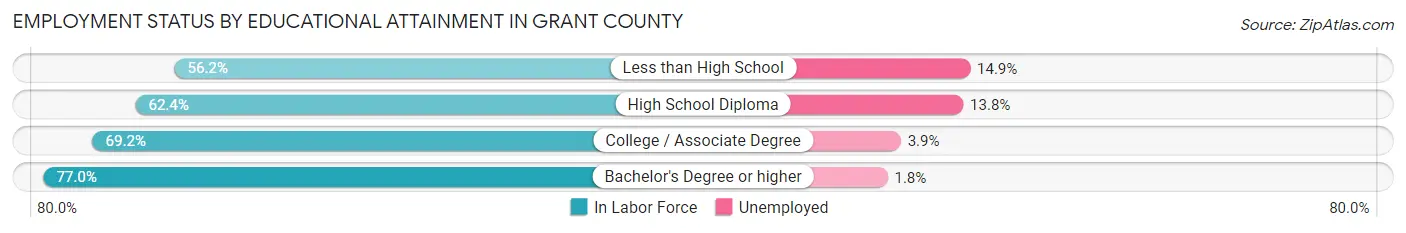
| Educational Attainment | In Labor Force | Unemployed |
| Less than High School | 584 (56.2%) | 155 (14.9%) |
| High School Diploma | 2,480 (62.4%) | 549 (13.8%) |
| College / Associate Degree | 3,121 (69.2%) | 176 (3.9%) |
| Bachelor's Degree or higher | 2,236 (77.0%) | 52 (1.8%) |
| Total | 8,427 (67.8%) | 870 (7.0%) |
Employment Occupations by Sex in Grant County
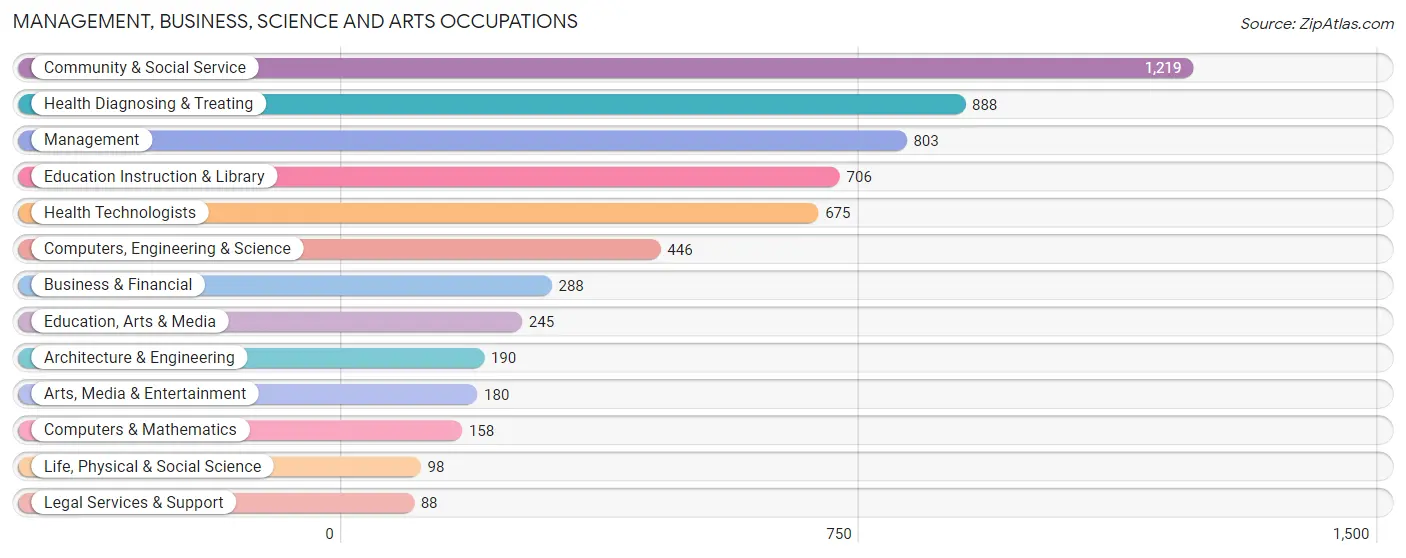
Management, Business, Science and Arts Occupations
The most common Management, Business, Science and Arts occupations in Grant County are Community & Social Service (1,219 | 12.4%), Health Diagnosing & Treating (888 | 9.1%), Management (803 | 8.2%), Education Instruction & Library (706 | 7.2%), and Health Technologists (675 | 6.9%).
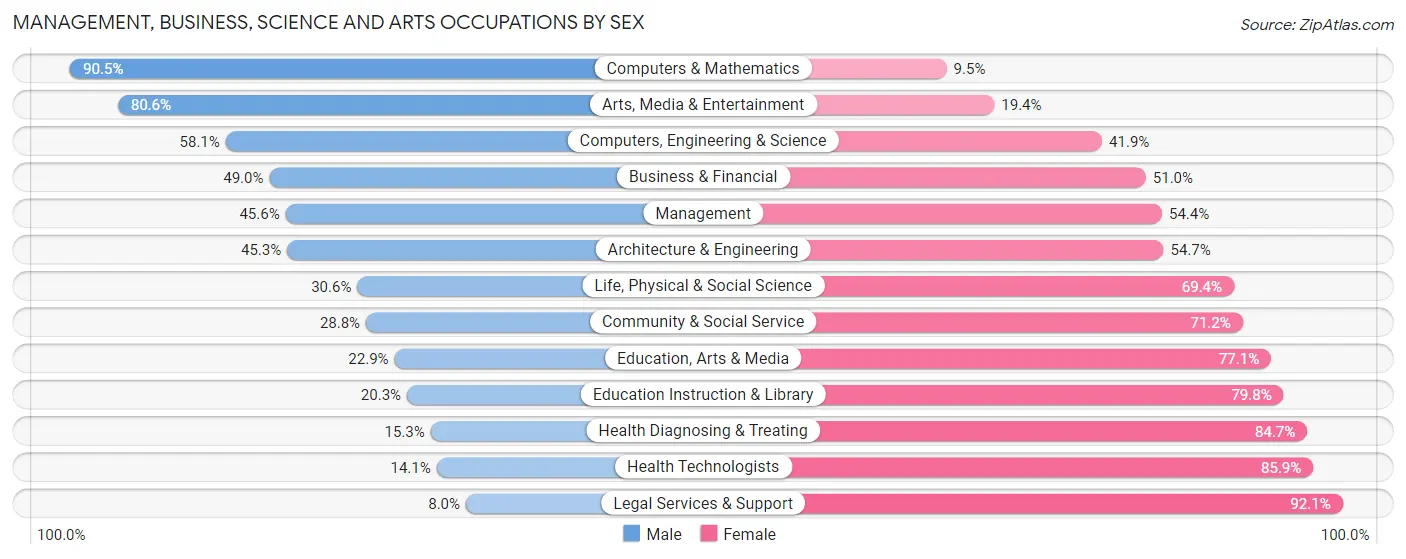
Management, Business, Science and Arts Occupations by Sex
Within the Management, Business, Science and Arts occupations in Grant County, the most male-oriented occupations are Computers & Mathematics (90.5%), Arts, Media & Entertainment (80.6%), and Computers, Engineering & Science (58.1%), while the most female-oriented occupations are Legal Services & Support (92.0%), Health Technologists (85.9%), and Health Diagnosing & Treating (84.7%).
| Occupation | Male | Female |
| Management | 366 (45.6%) | 437 (54.4%) |
| Business & Financial | 141 (49.0%) | 147 (51.0%) |
| Computers, Engineering & Science | 259 (58.1%) | 187 (41.9%) |
| Computers & Mathematics | 143 (90.5%) | 15 (9.5%) |
| Architecture & Engineering | 86 (45.3%) | 104 (54.7%) |
| Life, Physical & Social Science | 30 (30.6%) | 68 (69.4%) |
| Community & Social Service | 351 (28.8%) | 868 (71.2%) |
| Education, Arts & Media | 56 (22.9%) | 189 (77.1%) |
| Legal Services & Support | 7 (8.0%) | 81 (92.0%) |
| Education Instruction & Library | 143 (20.3%) | 563 (79.7%) |
| Arts, Media & Entertainment | 145 (80.6%) | 35 (19.4%) |
| Health Diagnosing & Treating | 136 (15.3%) | 752 (84.7%) |
| Health Technologists | 95 (14.1%) | 580 (85.9%) |
| Total (Category) | 1,253 (34.4%) | 2,391 (65.6%) |
| Total (Overall) | 5,028 (51.3%) | 4,767 (48.7%) |
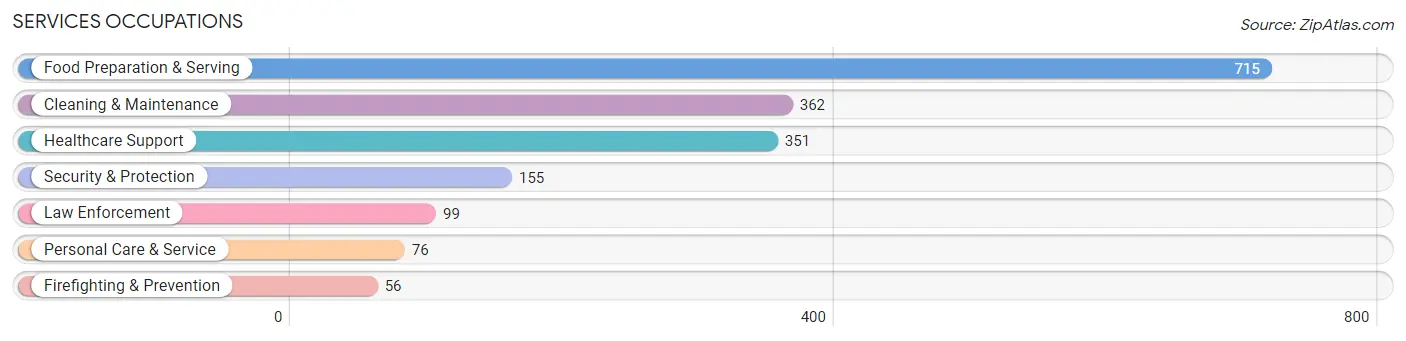
Services Occupations
The most common Services occupations in Grant County are Food Preparation & Serving (715 | 7.3%), Cleaning & Maintenance (362 | 3.7%), Healthcare Support (351 | 3.6%), Security & Protection (155 | 1.6%), and Law Enforcement (99 | 1.0%).
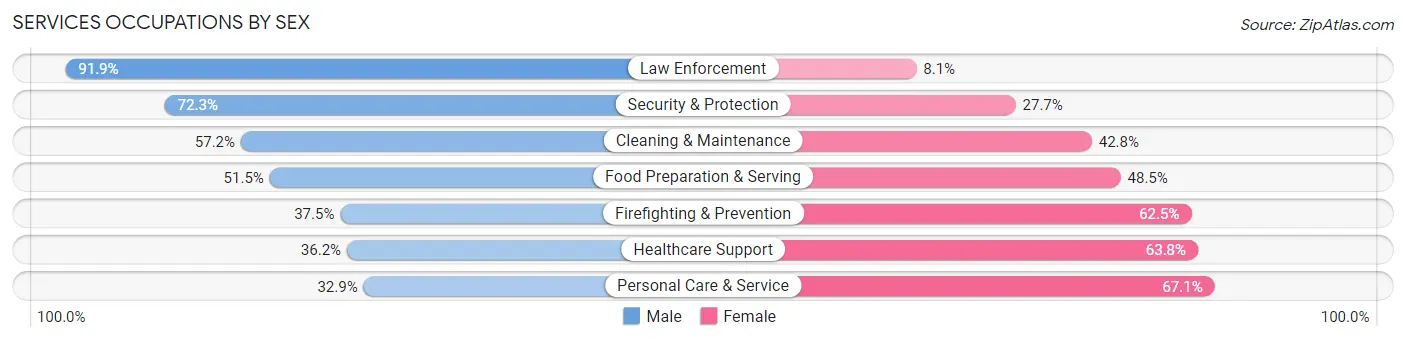
Services Occupations by Sex
Within the Services occupations in Grant County, the most male-oriented occupations are Law Enforcement (91.9%), Security & Protection (72.3%), and Cleaning & Maintenance (57.2%), while the most female-oriented occupations are Personal Care & Service (67.1%), Healthcare Support (63.8%), and Firefighting & Prevention (62.5%).
| Occupation | Male | Female |
| Healthcare Support | 127 (36.2%) | 224 (63.8%) |
| Security & Protection | 112 (72.3%) | 43 (27.7%) |
| Firefighting & Prevention | 21 (37.5%) | 35 (62.5%) |
| Law Enforcement | 91 (91.9%) | 8 (8.1%) |
| Food Preparation & Serving | 368 (51.5%) | 347 (48.5%) |
| Cleaning & Maintenance | 207 (57.2%) | 155 (42.8%) |
| Personal Care & Service | 25 (32.9%) | 51 (67.1%) |
| Total (Category) | 839 (50.6%) | 820 (49.4%) |
| Total (Overall) | 5,028 (51.3%) | 4,767 (48.7%) |
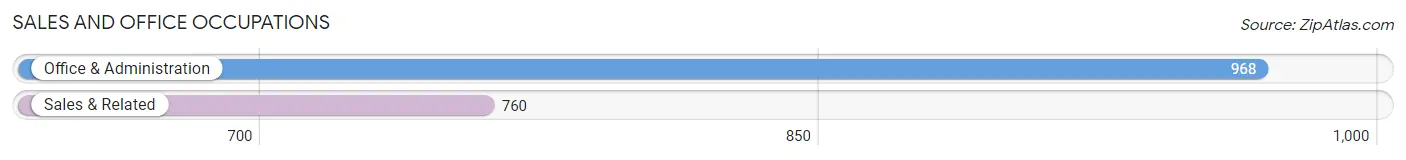
Sales and Office Occupations
The most common Sales and Office occupations in Grant County are Office & Administration (968 | 9.9%), and Sales & Related (760 | 7.8%).
Sales and Office Occupations by Sex
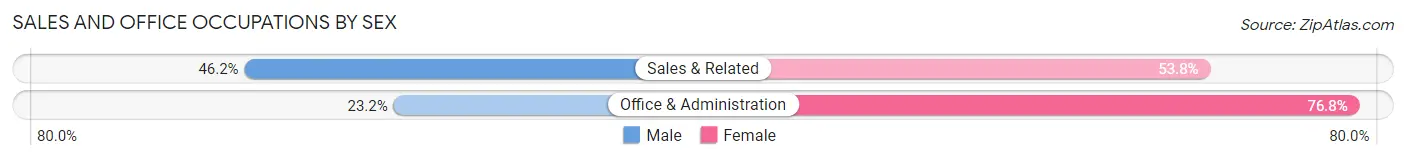
| Occupation | Male | Female |
| Sales & Related | 351 (46.2%) | 409 (53.8%) |
| Office & Administration | 225 (23.2%) | 743 (76.8%) |
| Total (Category) | 576 (33.3%) | 1,152 (66.7%) |
| Total (Overall) | 5,028 (51.3%) | 4,767 (48.7%) |
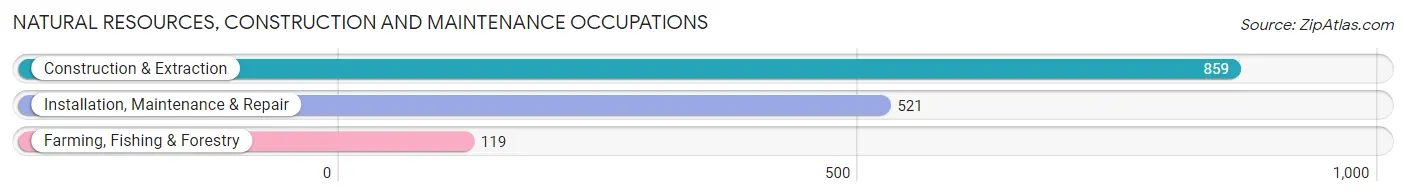
Natural Resources, Construction and Maintenance Occupations
The most common Natural Resources, Construction and Maintenance occupations in Grant County are Construction & Extraction (859 | 8.8%), Installation, Maintenance & Repair (521 | 5.3%), and Farming, Fishing & Forestry (119 | 1.2%).
Natural Resources, Construction and Maintenance Occupations by Sex
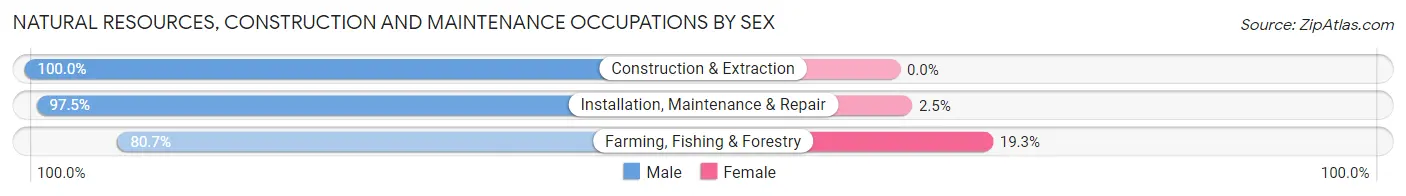
| Occupation | Male | Female |
| Farming, Fishing & Forestry | 96 (80.7%) | 23 (19.3%) |
| Construction & Extraction | 859 (100.0%) | 0 (0.0%) |
| Installation, Maintenance & Repair | 508 (97.5%) | 13 (2.5%) |
| Total (Category) | 1,463 (97.6%) | 36 (2.4%) |
| Total (Overall) | 5,028 (51.3%) | 4,767 (48.7%) |
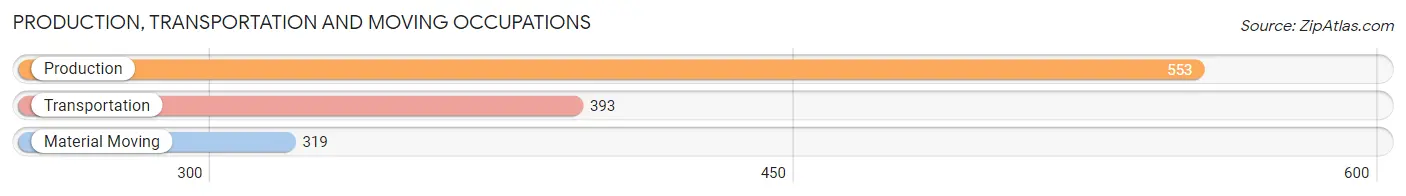
Production, Transportation and Moving Occupations
The most common Production, Transportation and Moving occupations in Grant County are Production (553 | 5.7%), Transportation (393 | 4.0%), and Material Moving (319 | 3.3%).
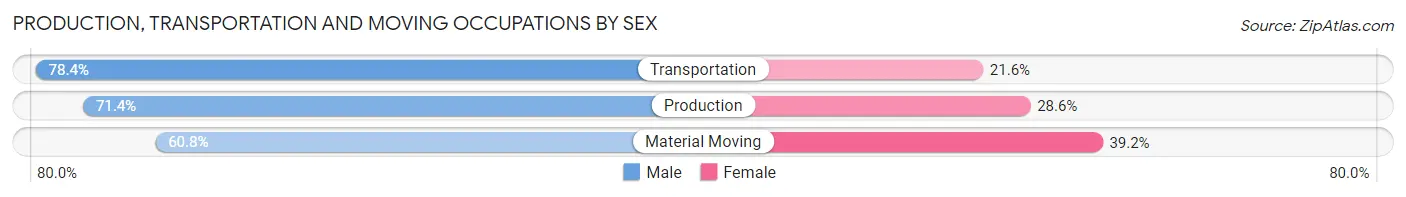
Production, Transportation and Moving Occupations by Sex
| Occupation | Male | Female |
| Production | 395 (71.4%) | 158 (28.6%) |
| Transportation | 308 (78.4%) | 85 (21.6%) |
| Material Moving | 194 (60.8%) | 125 (39.2%) |
| Total (Category) | 897 (70.9%) | 368 (29.1%) |
| Total (Overall) | 5,028 (51.3%) | 4,767 (48.7%) |
Employment Industries by Sex in Grant County
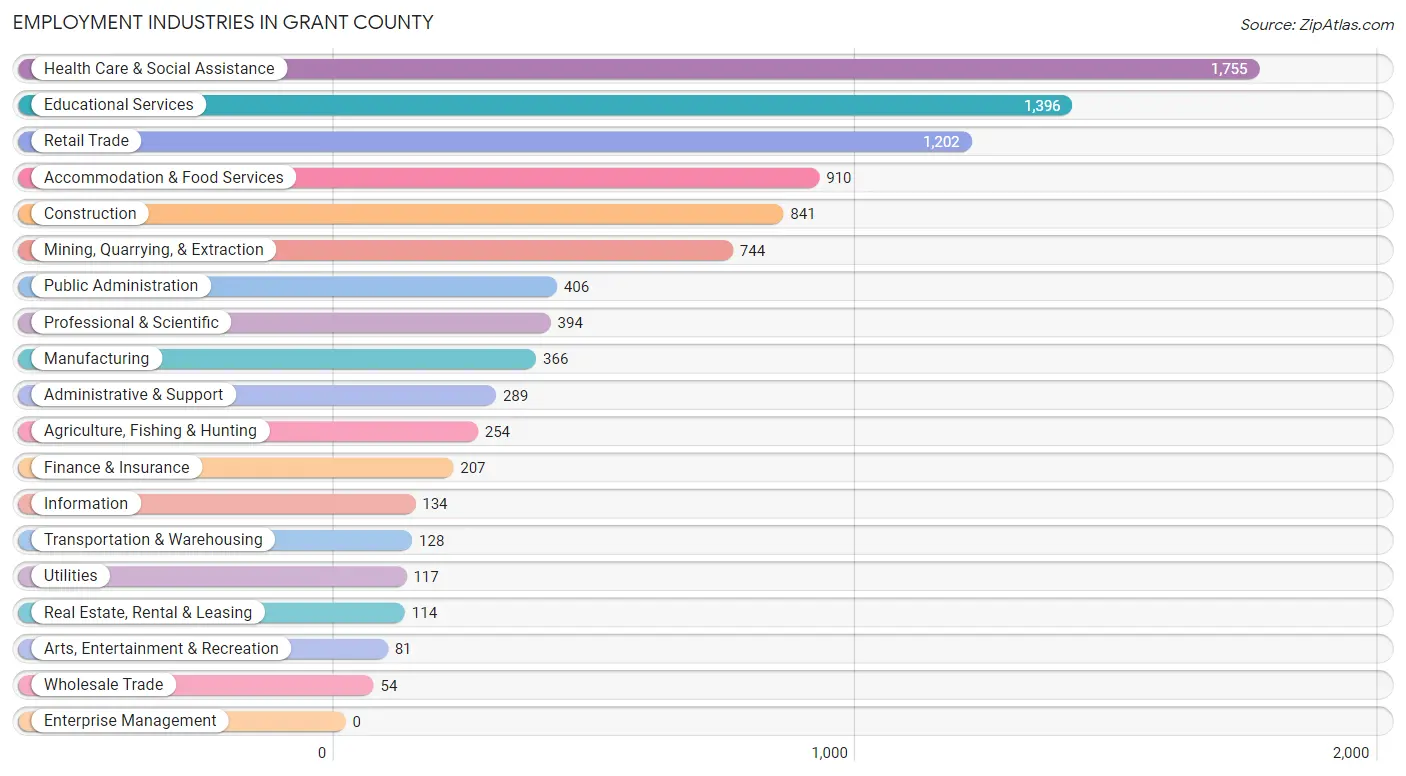
Employment Industries in Grant County
The major employment industries in Grant County include Health Care & Social Assistance (1,755 | 17.9%), Educational Services (1,396 | 14.2%), Retail Trade (1,202 | 12.3%), Accommodation & Food Services (910 | 9.3%), and Construction (841 | 8.6%).
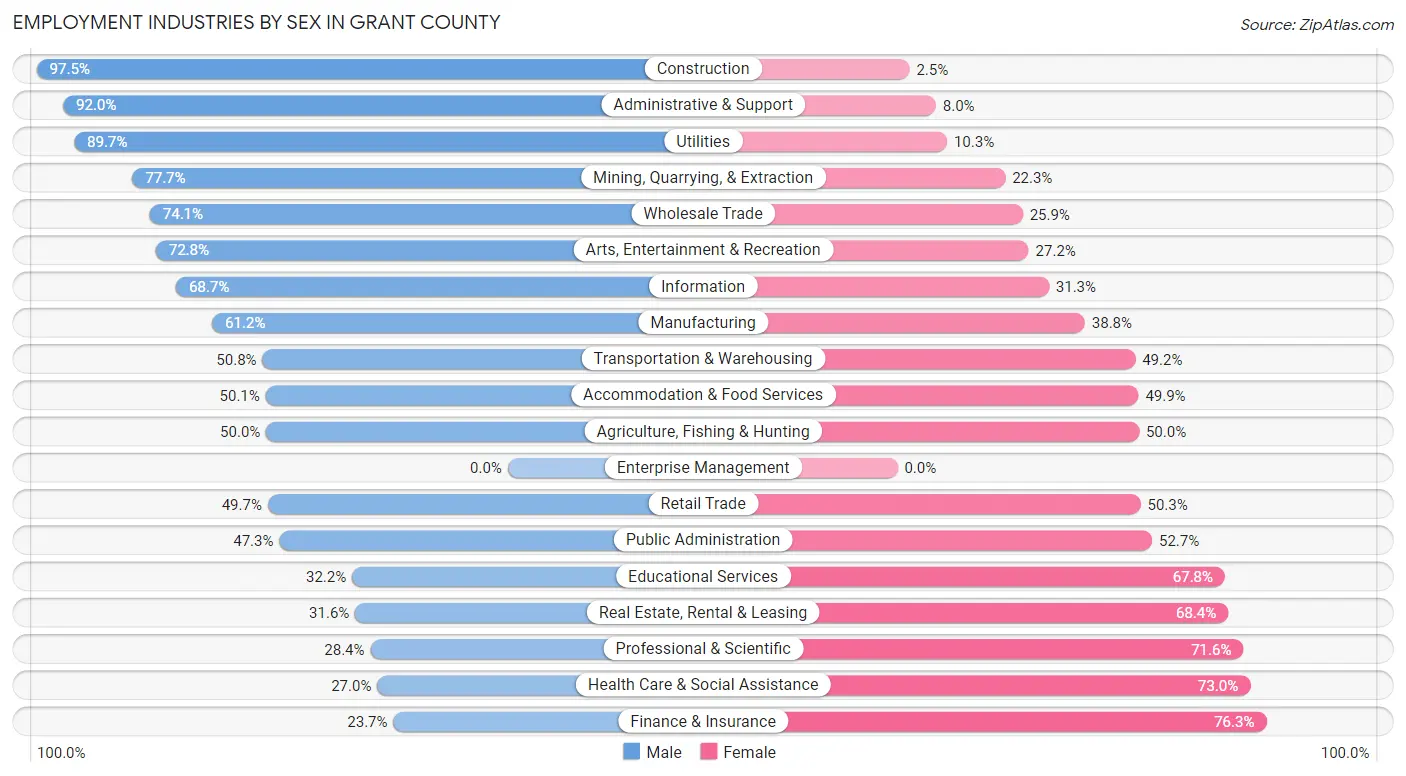
Employment Industries by Sex in Grant County
The Grant County industries that see more men than women are Construction (97.5%), Administrative & Support (92.0%), and Utilities (89.7%), whereas the industries that tend to have a higher number of women are Finance & Insurance (76.3%), Health Care & Social Assistance (73.0%), and Professional & Scientific (71.6%).
| Industry | Male | Female |
| Agriculture, Fishing & Hunting | 127 (50.0%) | 127 (50.0%) |
| Mining, Quarrying, & Extraction | 578 (77.7%) | 166 (22.3%) |
| Construction | 820 (97.5%) | 21 (2.5%) |
| Manufacturing | 224 (61.2%) | 142 (38.8%) |
| Wholesale Trade | 40 (74.1%) | 14 (25.9%) |
| Retail Trade | 597 (49.7%) | 605 (50.3%) |
| Transportation & Warehousing | 65 (50.8%) | 63 (49.2%) |
| Utilities | 105 (89.7%) | 12 (10.3%) |
| Information | 92 (68.7%) | 42 (31.3%) |
| Finance & Insurance | 49 (23.7%) | 158 (76.3%) |
| Real Estate, Rental & Leasing | 36 (31.6%) | 78 (68.4%) |
| Professional & Scientific | 112 (28.4%) | 282 (71.6%) |
| Enterprise Management | 0 (0.0%) | 0 (0.0%) |
| Administrative & Support | 266 (92.0%) | 23 (8.0%) |
| Educational Services | 450 (32.2%) | 946 (67.8%) |
| Health Care & Social Assistance | 474 (27.0%) | 1,281 (73.0%) |
| Arts, Entertainment & Recreation | 59 (72.8%) | 22 (27.2%) |
| Accommodation & Food Services | 456 (50.1%) | 454 (49.9%) |
| Public Administration | 192 (47.3%) | 214 (52.7%) |
| Total | 5,028 (51.3%) | 4,767 (48.7%) |
Education in Grant County
School Enrollment in Grant County
The most common levels of schooling among the 5,529 students in Grant County are middle school (1,290 | 23.3%), elementary school (1,171 | 21.2%), and high school (1,171 | 21.2%).
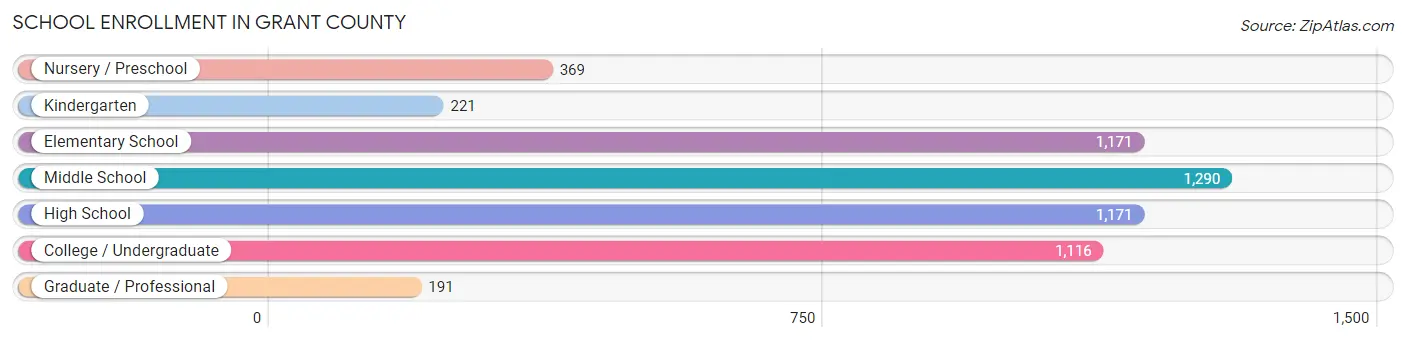
| School Level | # Students | % Students |
| Nursery / Preschool | 369 | 6.7% |
| Kindergarten | 221 | 4.0% |
| Elementary School | 1,171 | 21.2% |
| Middle School | 1,290 | 23.3% |
| High School | 1,171 | 21.2% |
| College / Undergraduate | 1,116 | 20.2% |
| Graduate / Professional | 191 | 3.5% |
| Total | 5,529 | 100.0% |
School Enrollment by Age by Funding Source in Grant County
Out of a total of 5,529 students who are enrolled in schools in Grant County, 525 (9.5%) attend a private institution, while the remaining 5,004 (90.5%) are enrolled in public schools. The age group of 25 to 34 year olds has the highest likelihood of being enrolled in private schools, with 75 (29.2% in the age bracket) enrolled. Conversely, the age group of 3 to 4 year olds has the lowest likelihood of being enrolled in a private school, with 310 (100.0% in the age bracket) attending a public institution.
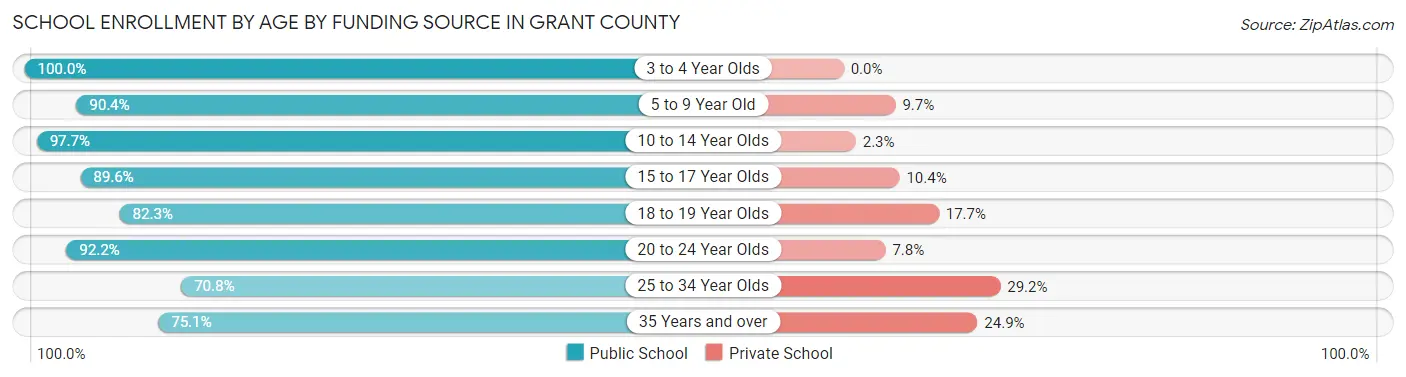
| Age Bracket | Public School | Private School |
| 3 to 4 Year Olds | 310 (100.0%) | 0 (0.0%) |
| 5 to 9 Year Old | 1,171 (90.3%) | 125 (9.7%) |
| 10 to 14 Year Olds | 1,516 (97.7%) | 35 (2.3%) |
| 15 to 17 Year Olds | 801 (89.6%) | 93 (10.4%) |
| 18 to 19 Year Olds | 432 (82.3%) | 93 (17.7%) |
| 20 to 24 Year Olds | 379 (92.2%) | 32 (7.8%) |
| 25 to 34 Year Olds | 182 (70.8%) | 75 (29.2%) |
| 35 Years and over | 214 (75.1%) | 71 (24.9%) |
| Total | 5,004 (90.5%) | 525 (9.5%) |
Educational Attainment by Field of Study in Grant County
Education (1,114 | 19.7%), science & technology (755 | 13.3%), business (726 | 12.8%), arts & humanities (432 | 7.6%), and bio, nature & agricultural (415 | 7.3%) are the most common fields of study among 5,658 individuals in Grant County who have obtained a bachelor's degree or higher.
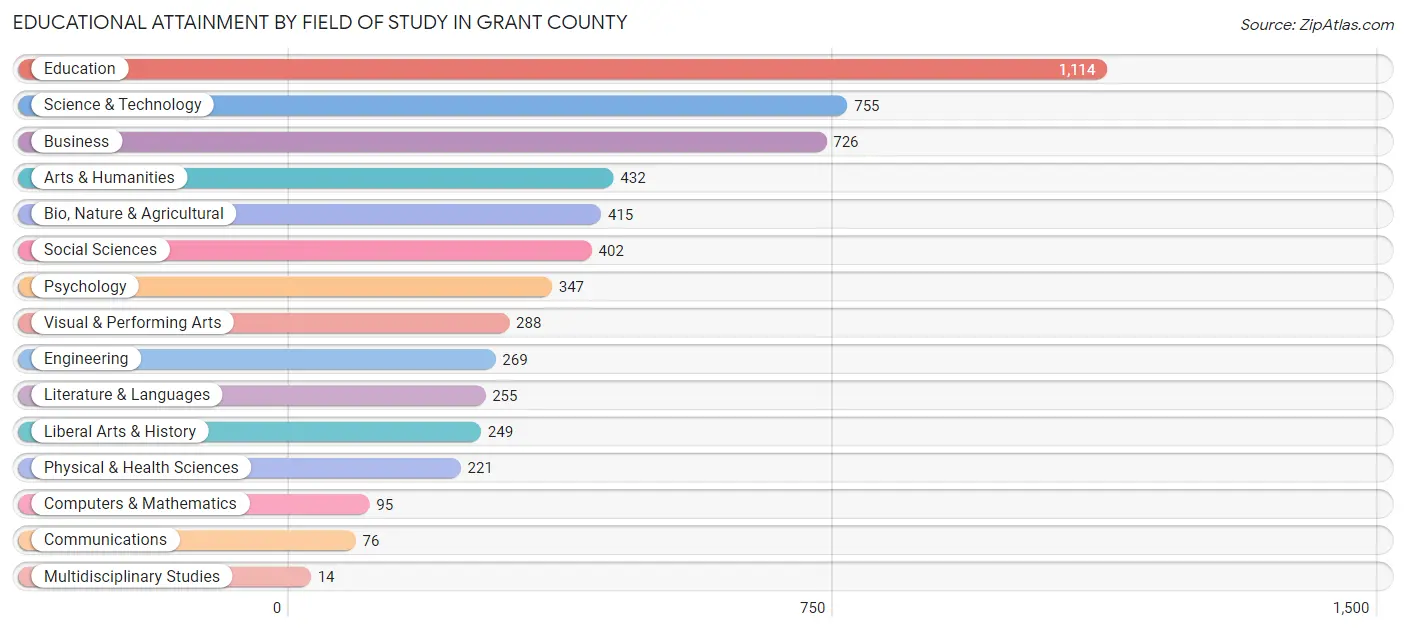
| Field of Study | # Graduates | % Graduates |
| Computers & Mathematics | 95 | 1.7% |
| Bio, Nature & Agricultural | 415 | 7.3% |
| Physical & Health Sciences | 221 | 3.9% |
| Psychology | 347 | 6.1% |
| Social Sciences | 402 | 7.1% |
| Engineering | 269 | 4.8% |
| Multidisciplinary Studies | 14 | 0.3% |
| Science & Technology | 755 | 13.3% |
| Business | 726 | 12.8% |
| Education | 1,114 | 19.7% |
| Literature & Languages | 255 | 4.5% |
| Liberal Arts & History | 249 | 4.4% |
| Visual & Performing Arts | 288 | 5.1% |
| Communications | 76 | 1.3% |
| Arts & Humanities | 432 | 7.6% |
| Total | 5,658 | 100.0% |
Transportation & Commute in Grant County
Vehicle Availability by Sex in Grant County
The most prevalent vehicle ownership categories in Grant County are males with 2 vehicles (1,922, accounting for 38.6%) and females with 2 vehicles (1,593, making up 41.6%).
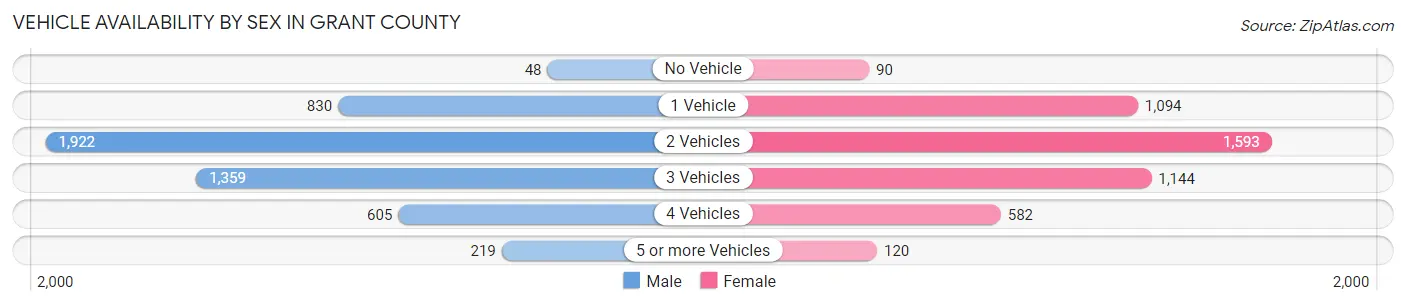
| Vehicles Available | Male | Female |
| No Vehicle | 48 (1.0%) | 90 (1.9%) |
| 1 Vehicle | 830 (16.7%) | 1,094 (23.7%) |
| 2 Vehicles | 1,922 (38.6%) | 1,593 (34.5%) |
| 3 Vehicles | 1,359 (27.3%) | 1,144 (24.7%) |
| 4 Vehicles | 605 (12.1%) | 582 (12.6%) |
| 5 or more Vehicles | 219 (4.4%) | 120 (2.6%) |
| Total | 4,983 (100.0%) | 4,623 (100.0%) |
Commute Time in Grant County
The most frequently occuring commute durations in Grant County are 10 to 14 minutes (2,066 commuters, 24.4%), 5 to 9 minutes (1,783 commuters, 21.1%), and 15 to 19 minutes (1,375 commuters, 16.2%).
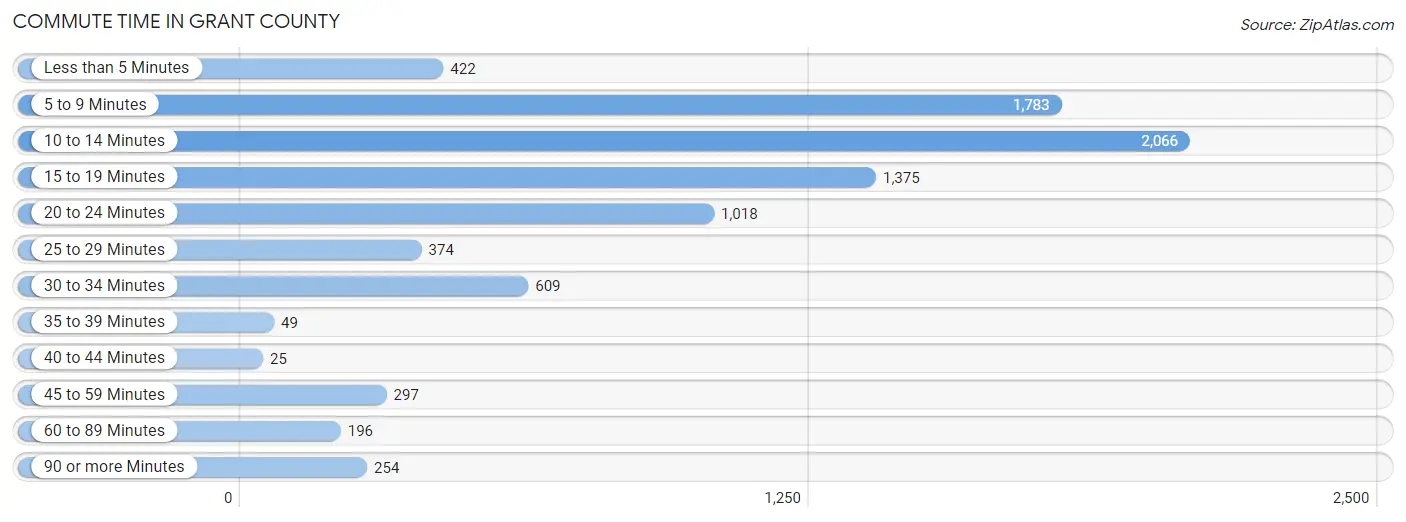
| Commute Time | # Commuters | % Commuters |
| Less than 5 Minutes | 422 | 5.0% |
| 5 to 9 Minutes | 1,783 | 21.1% |
| 10 to 14 Minutes | 2,066 | 24.4% |
| 15 to 19 Minutes | 1,375 | 16.2% |
| 20 to 24 Minutes | 1,018 | 12.0% |
| 25 to 29 Minutes | 374 | 4.4% |
| 30 to 34 Minutes | 609 | 7.2% |
| 35 to 39 Minutes | 49 | 0.6% |
| 40 to 44 Minutes | 25 | 0.3% |
| 45 to 59 Minutes | 297 | 3.5% |
| 60 to 89 Minutes | 196 | 2.3% |
| 90 or more Minutes | 254 | 3.0% |
Commute Time by Sex in Grant County
The most common commute times in Grant County are 10 to 14 minutes (803 commuters, 18.8%) for males and 10 to 14 minutes (1,263 commuters, 30.1%) for females.
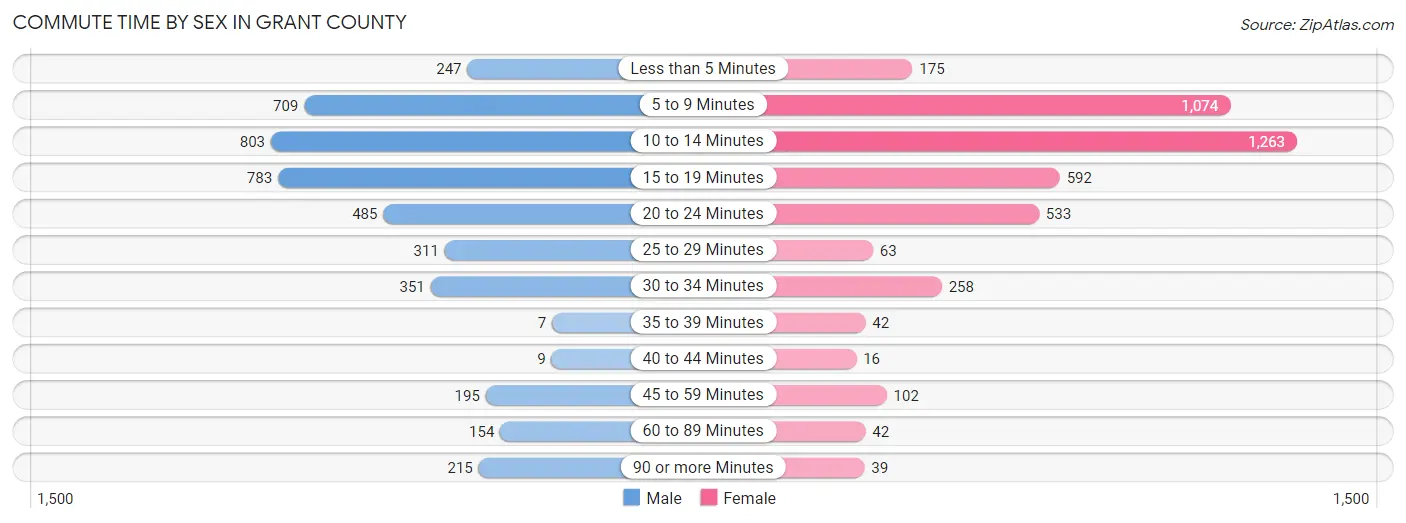
| Commute Time | Male | Female |
| Less than 5 Minutes | 247 (5.8%) | 175 (4.2%) |
| 5 to 9 Minutes | 709 (16.6%) | 1,074 (25.6%) |
| 10 to 14 Minutes | 803 (18.8%) | 1,263 (30.1%) |
| 15 to 19 Minutes | 783 (18.3%) | 592 (14.1%) |
| 20 to 24 Minutes | 485 (11.4%) | 533 (12.7%) |
| 25 to 29 Minutes | 311 (7.3%) | 63 (1.5%) |
| 30 to 34 Minutes | 351 (8.2%) | 258 (6.1%) |
| 35 to 39 Minutes | 7 (0.2%) | 42 (1.0%) |
| 40 to 44 Minutes | 9 (0.2%) | 16 (0.4%) |
| 45 to 59 Minutes | 195 (4.6%) | 102 (2.4%) |
| 60 to 89 Minutes | 154 (3.6%) | 42 (1.0%) |
| 90 or more Minutes | 215 (5.0%) | 39 (0.9%) |
Time of Departure to Work by Sex in Grant County
The most frequent times of departure to work in Grant County are 6:30 AM to 6:59 AM (575, 13.5%) for males and 8:00 AM to 8:29 AM (1,149, 27.4%) for females.
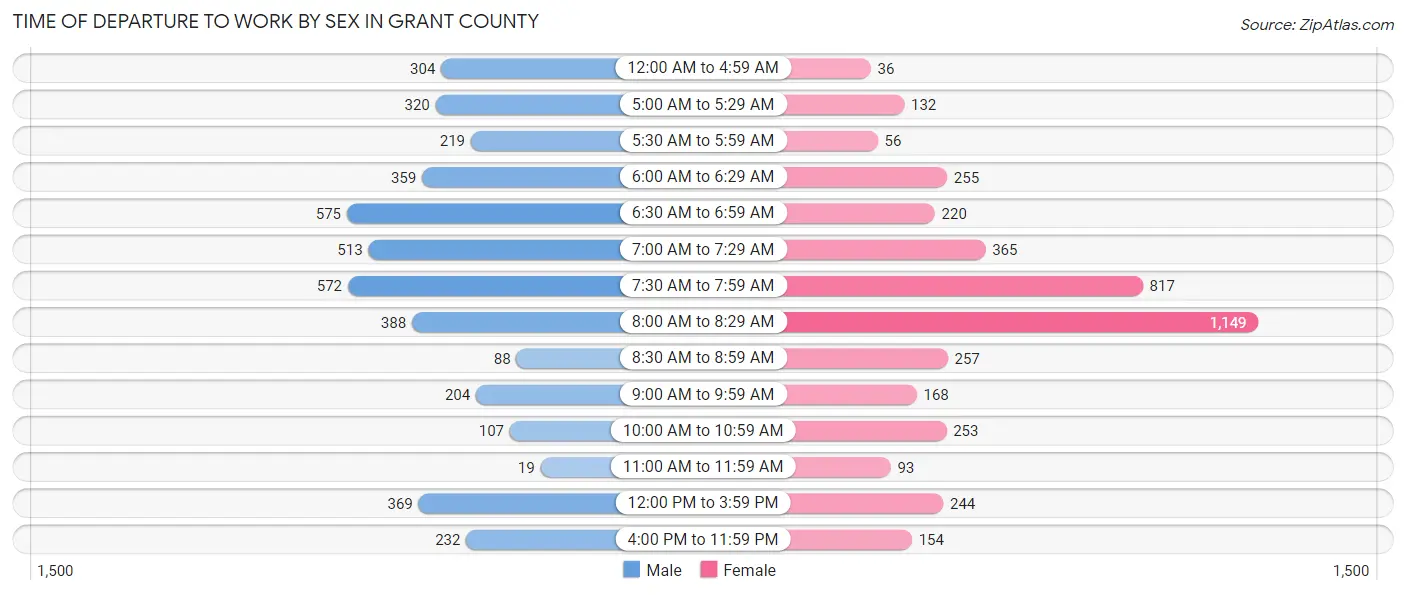
| Time of Departure | Male | Female |
| 12:00 AM to 4:59 AM | 304 (7.1%) | 36 (0.9%) |
| 5:00 AM to 5:29 AM | 320 (7.5%) | 132 (3.1%) |
| 5:30 AM to 5:59 AM | 219 (5.1%) | 56 (1.3%) |
| 6:00 AM to 6:29 AM | 359 (8.4%) | 255 (6.1%) |
| 6:30 AM to 6:59 AM | 575 (13.5%) | 220 (5.2%) |
| 7:00 AM to 7:29 AM | 513 (12.0%) | 365 (8.7%) |
| 7:30 AM to 7:59 AM | 572 (13.4%) | 817 (19.5%) |
| 8:00 AM to 8:29 AM | 388 (9.1%) | 1,149 (27.4%) |
| 8:30 AM to 8:59 AM | 88 (2.1%) | 257 (6.1%) |
| 9:00 AM to 9:59 AM | 204 (4.8%) | 168 (4.0%) |
| 10:00 AM to 10:59 AM | 107 (2.5%) | 253 (6.0%) |
| 11:00 AM to 11:59 AM | 19 (0.4%) | 93 (2.2%) |
| 12:00 PM to 3:59 PM | 369 (8.6%) | 244 (5.8%) |
| 4:00 PM to 11:59 PM | 232 (5.4%) | 154 (3.7%) |
| Total | 4,269 (100.0%) | 4,199 (100.0%) |
Housing Occupancy in Grant County
Occupancy by Ownership in Grant County
Of the total 11,292 dwellings in Grant County, owner-occupied units account for 8,072 (71.5%), while renter-occupied units make up 3,220 (28.5%).
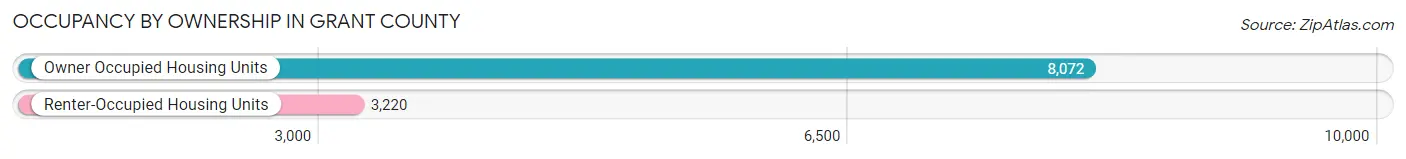
| Occupancy | # Housing Units | % Housing Units |
| Owner Occupied Housing Units | 8,072 | 71.5% |
| Renter-Occupied Housing Units | 3,220 | 28.5% |
| Total Occupied Housing Units | 11,292 | 100.0% |
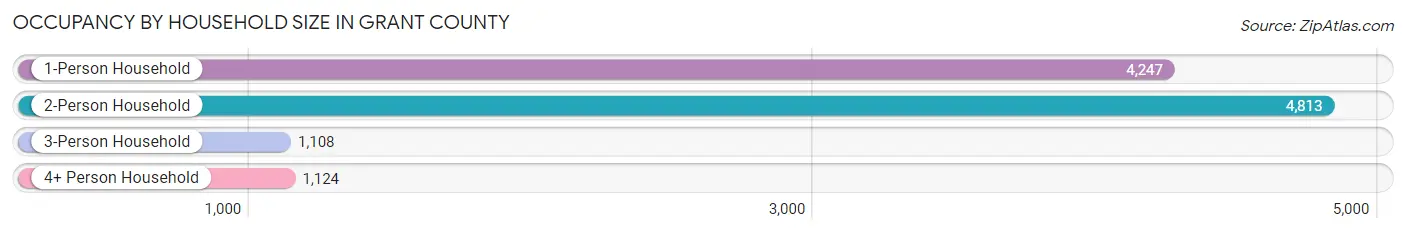
Occupancy by Household Size in Grant County
| Household Size | # Housing Units | % Housing Units |
| 1-Person Household | 4,247 | 37.6% |
| 2-Person Household | 4,813 | 42.6% |
| 3-Person Household | 1,108 | 9.8% |
| 4+ Person Household | 1,124 | 10.0% |
| Total Housing Units | 11,292 | 100.0% |
Occupancy by Ownership by Household Size in Grant County
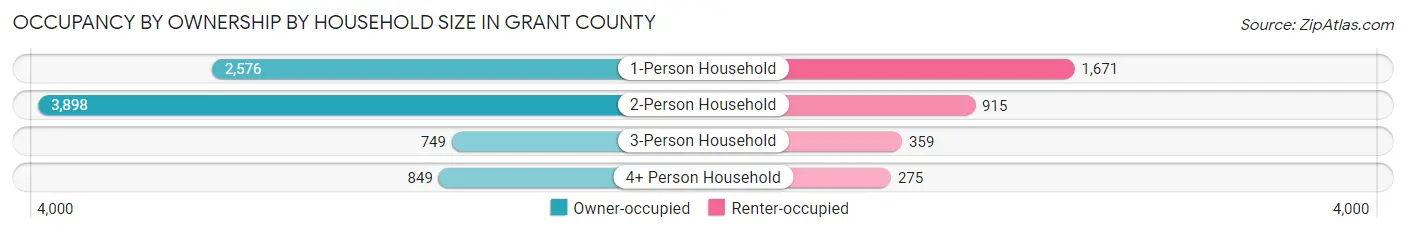
| Household Size | Owner-occupied | Renter-occupied |
| 1-Person Household | 2,576 (60.7%) | 1,671 (39.4%) |
| 2-Person Household | 3,898 (81.0%) | 915 (19.0%) |
| 3-Person Household | 749 (67.6%) | 359 (32.4%) |
| 4+ Person Household | 849 (75.5%) | 275 (24.5%) |
| Total Housing Units | 8,072 (71.5%) | 3,220 (28.5%) |
Occupancy by Educational Attainment in Grant County
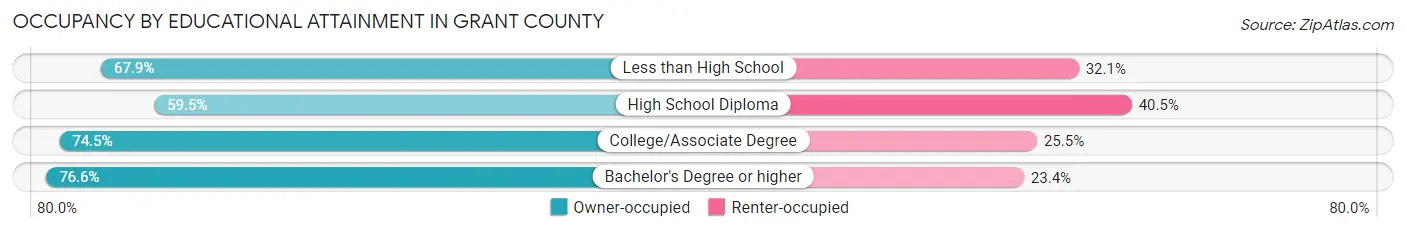
| Household Size | Owner-occupied | Renter-occupied |
| Less than High School | 712 (67.9%) | 337 (32.1%) |
| High School Diploma | 1,344 (59.5%) | 916 (40.5%) |
| College/Associate Degree | 3,463 (74.5%) | 1,186 (25.5%) |
| Bachelor's Degree or higher | 2,553 (76.6%) | 781 (23.4%) |
Occupancy by Age of Householder in Grant County
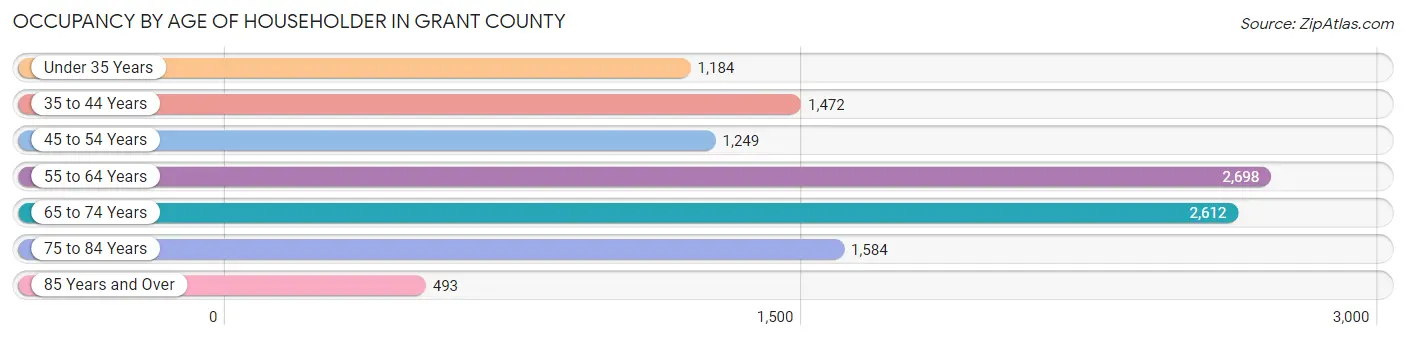
| Age Bracket | # Households | % Households |
| Under 35 Years | 1,184 | 10.5% |
| 35 to 44 Years | 1,472 | 13.0% |
| 45 to 54 Years | 1,249 | 11.1% |
| 55 to 64 Years | 2,698 | 23.9% |
| 65 to 74 Years | 2,612 | 23.1% |
| 75 to 84 Years | 1,584 | 14.0% |
| 85 Years and Over | 493 | 4.4% |
| Total | 11,292 | 100.0% |
Housing Finances in Grant County
Median Income by Occupancy in Grant County
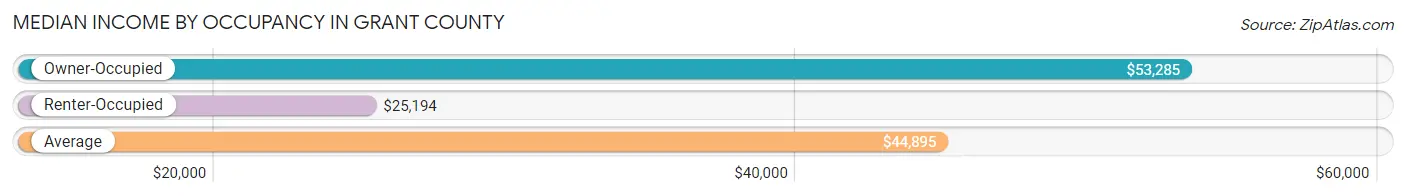
| Occupancy Type | # Households | Median Income |
| Owner-Occupied | 8,072 (71.5%) | $53,285 |
| Renter-Occupied | 3,220 (28.5%) | $25,194 |
| Average | 11,292 (100.0%) | $44,895 |
Occupancy by Householder Income Bracket in Grant County

| Income Bracket | Owner-occupied | Renter-occupied |
| Less than $5,000 | 201 (2.5%) | 294 (9.1%) |
| $5,000 to $9,999 | 129 (1.6%) | 192 (6.0%) |
| $10,000 to $14,999 | 284 (3.5%) | 419 (13.0%) |
| $15,000 to $19,999 | 283 (3.5%) | 284 (8.8%) |
| $20,000 to $24,999 | 416 (5.1%) | 412 (12.8%) |
| $25,000 to $34,999 | 1,136 (14.1%) | 540 (16.8%) |
| $35,000 to $49,999 | 1,396 (17.3%) | 264 (8.2%) |
| $50,000 to $74,999 | 1,240 (15.4%) | 417 (13.0%) |
| $75,000 to $99,999 | 824 (10.2%) | 216 (6.7%) |
| $100,000 to $149,999 | 1,469 (18.2%) | 66 (2.1%) |
| $150,000 or more | 694 (8.6%) | 116 (3.6%) |
| Total | 8,072 (100.0%) | 3,220 (100.0%) |
Monthly Housing Cost Tiers in Grant County
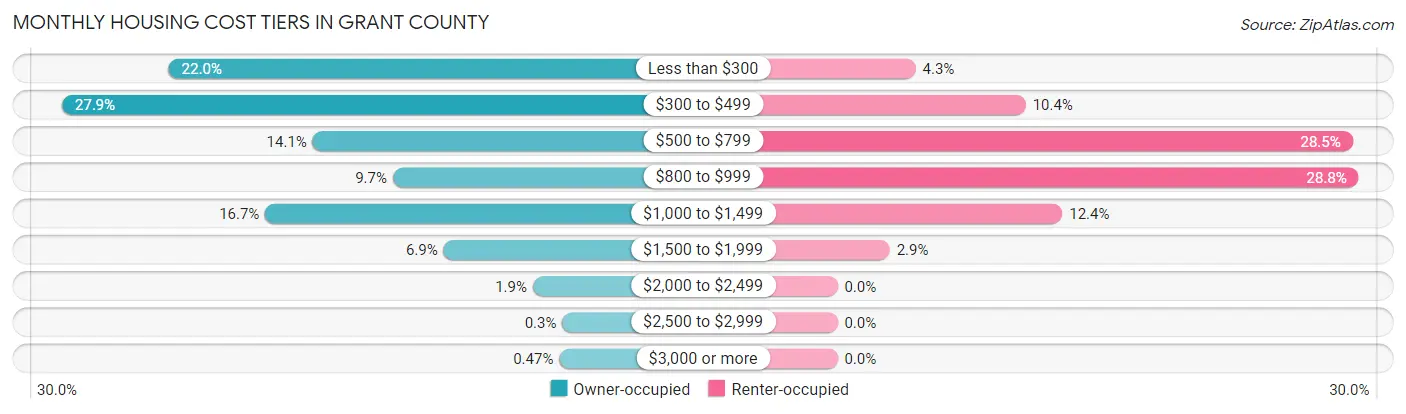
| Monthly Cost | Owner-occupied | Renter-occupied |
| Less than $300 | 1,779 (22.0%) | 139 (4.3%) |
| $300 to $499 | 2,255 (27.9%) | 335 (10.4%) |
| $500 to $799 | 1,137 (14.1%) | 916 (28.4%) |
| $800 to $999 | 780 (9.7%) | 927 (28.8%) |
| $1,000 to $1,499 | 1,349 (16.7%) | 400 (12.4%) |
| $1,500 to $1,999 | 554 (6.9%) | 93 (2.9%) |
| $2,000 to $2,499 | 156 (1.9%) | 0 (0.0%) |
| $2,500 to $2,999 | 24 (0.3%) | 0 (0.0%) |
| $3,000 or more | 38 (0.5%) | 0 (0.0%) |
| Total | 8,072 (100.0%) | 3,220 (100.0%) |
Physical Housing Characteristics in Grant County
Housing Structures in Grant County
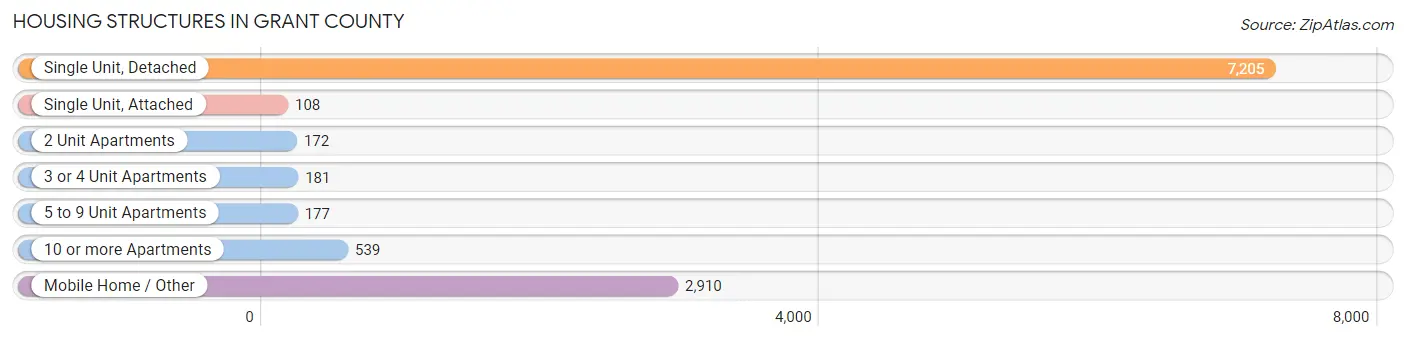
| Structure Type | # Housing Units | % Housing Units |
| Single Unit, Detached | 7,205 | 63.8% |
| Single Unit, Attached | 108 | 1.0% |
| 2 Unit Apartments | 172 | 1.5% |
| 3 or 4 Unit Apartments | 181 | 1.6% |
| 5 to 9 Unit Apartments | 177 | 1.6% |
| 10 or more Apartments | 539 | 4.8% |
| Mobile Home / Other | 2,910 | 25.8% |
| Total | 11,292 | 100.0% |
Housing Structures by Occupancy in Grant County
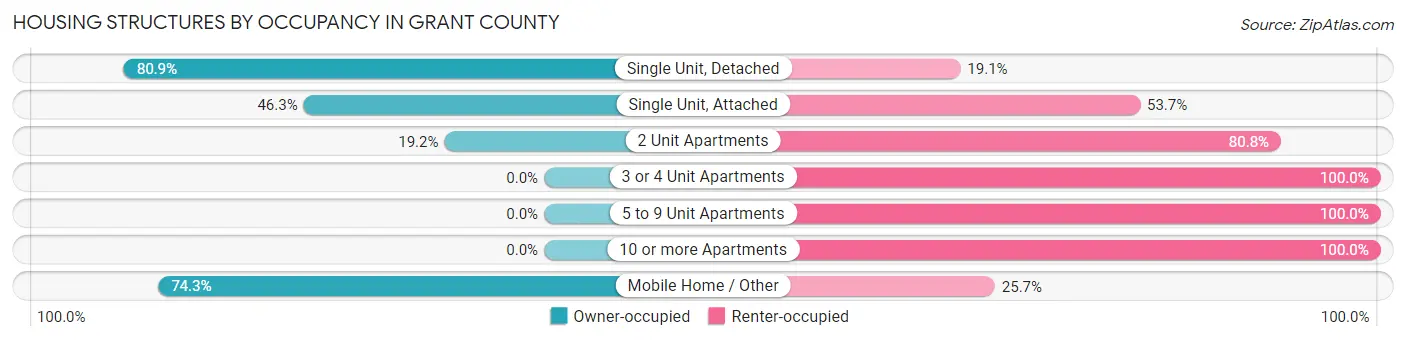
| Structure Type | Owner-occupied | Renter-occupied |
| Single Unit, Detached | 5,828 (80.9%) | 1,377 (19.1%) |
| Single Unit, Attached | 50 (46.3%) | 58 (53.7%) |
| 2 Unit Apartments | 33 (19.2%) | 139 (80.8%) |
| 3 or 4 Unit Apartments | 0 (0.0%) | 181 (100.0%) |
| 5 to 9 Unit Apartments | 0 (0.0%) | 177 (100.0%) |
| 10 or more Apartments | 0 (0.0%) | 539 (100.0%) |
| Mobile Home / Other | 2,161 (74.3%) | 749 (25.7%) |
| Total | 8,072 (71.5%) | 3,220 (28.5%) |
Housing Structures by Number of Rooms in Grant County
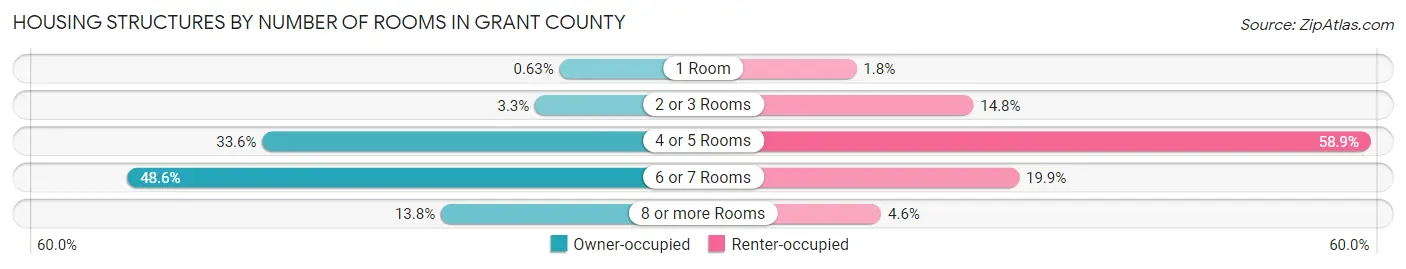
| Number of Rooms | Owner-occupied | Renter-occupied |
| 1 Room | 51 (0.6%) | 59 (1.8%) |
| 2 or 3 Rooms | 270 (3.3%) | 477 (14.8%) |
| 4 or 5 Rooms | 2,714 (33.6%) | 1,897 (58.9%) |
| 6 or 7 Rooms | 3,924 (48.6%) | 640 (19.9%) |
| 8 or more Rooms | 1,113 (13.8%) | 147 (4.6%) |
| Total | 8,072 (100.0%) | 3,220 (100.0%) |
Housing Structure by Heating Type in Grant County
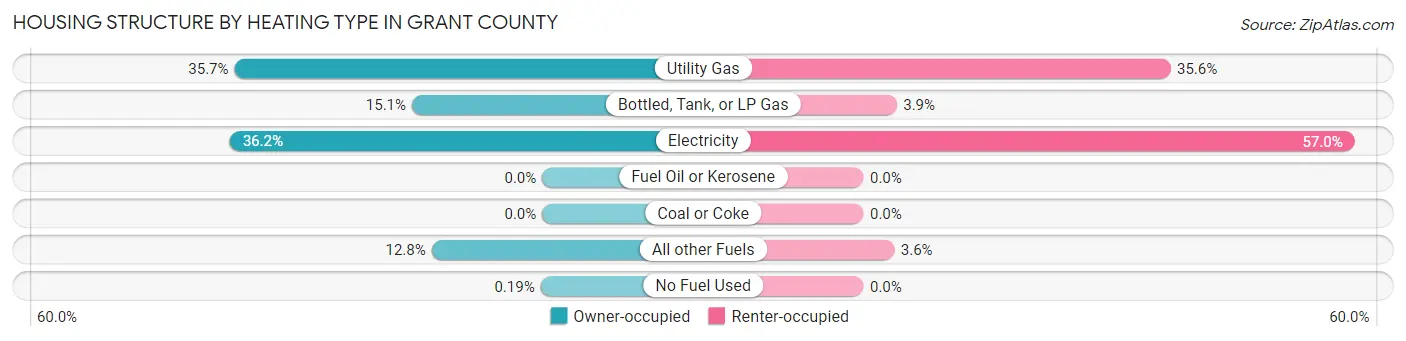
| Heating Type | Owner-occupied | Renter-occupied |
| Utility Gas | 2,880 (35.7%) | 1,146 (35.6%) |
| Bottled, Tank, or LP Gas | 1,219 (15.1%) | 124 (3.8%) |
| Electricity | 2,923 (36.2%) | 1,835 (57.0%) |
| Fuel Oil or Kerosene | 0 (0.0%) | 0 (0.0%) |
| Coal or Coke | 0 (0.0%) | 0 (0.0%) |
| All other Fuels | 1,035 (12.8%) | 115 (3.6%) |
| No Fuel Used | 15 (0.2%) | 0 (0.0%) |
| Total | 8,072 (100.0%) | 3,220 (100.0%) |
Household Vehicle Usage in Grant County
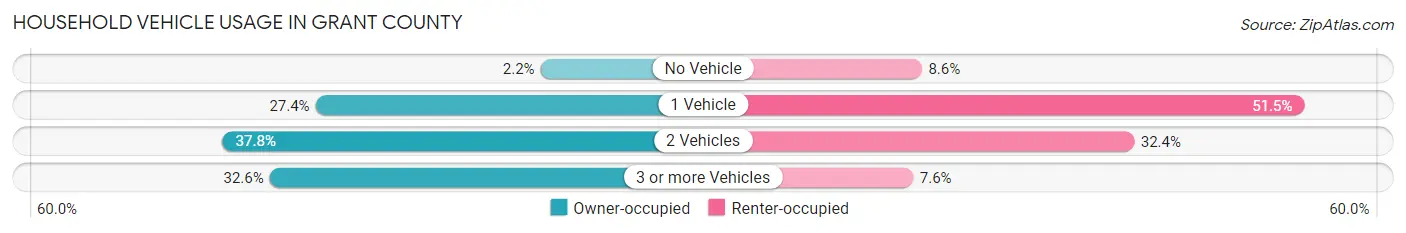
| Vehicles per Household | Owner-occupied | Renter-occupied |
| No Vehicle | 179 (2.2%) | 276 (8.6%) |
| 1 Vehicle | 2,213 (27.4%) | 1,657 (51.5%) |
| 2 Vehicles | 3,052 (37.8%) | 1,042 (32.4%) |
| 3 or more Vehicles | 2,628 (32.6%) | 245 (7.6%) |
| Total | 8,072 (100.0%) | 3,220 (100.0%) |
Real Estate & Mortgages in Grant County
Real Estate and Mortgage Overview in Grant County
| Characteristic | Without Mortgage | With Mortgage |
| Housing Units | 4,861 | 3,211 |
| Median Property Value | $156,000 | $151,400 |
| Median Household Income | $45,309 | $478 |
| Monthly Housing Costs | $349 | $38 |
| Real Estate Taxes | $685 | $154 |
Property Value by Mortgage Status in Grant County
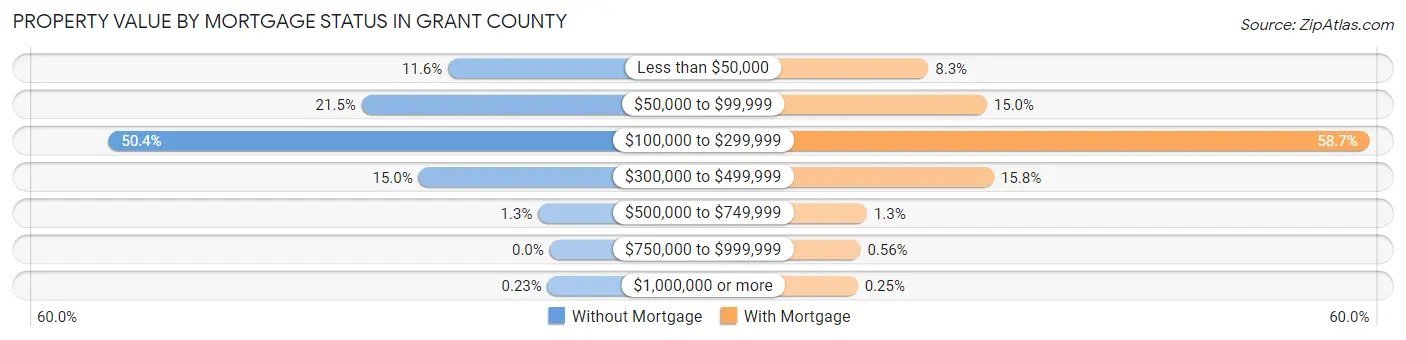
| Property Value | Without Mortgage | With Mortgage |
| Less than $50,000 | 564 (11.6%) | 267 (8.3%) |
| $50,000 to $99,999 | 1,044 (21.5%) | 482 (15.0%) |
| $100,000 to $299,999 | 2,451 (50.4%) | 1,886 (58.7%) |
| $300,000 to $499,999 | 728 (15.0%) | 508 (15.8%) |
| $500,000 to $749,999 | 63 (1.3%) | 42 (1.3%) |
| $750,000 to $999,999 | 0 (0.0%) | 18 (0.6%) |
| $1,000,000 or more | 11 (0.2%) | 8 (0.3%) |
| Total | 4,861 (100.0%) | 3,211 (100.0%) |
Household Income by Mortgage Status in Grant County
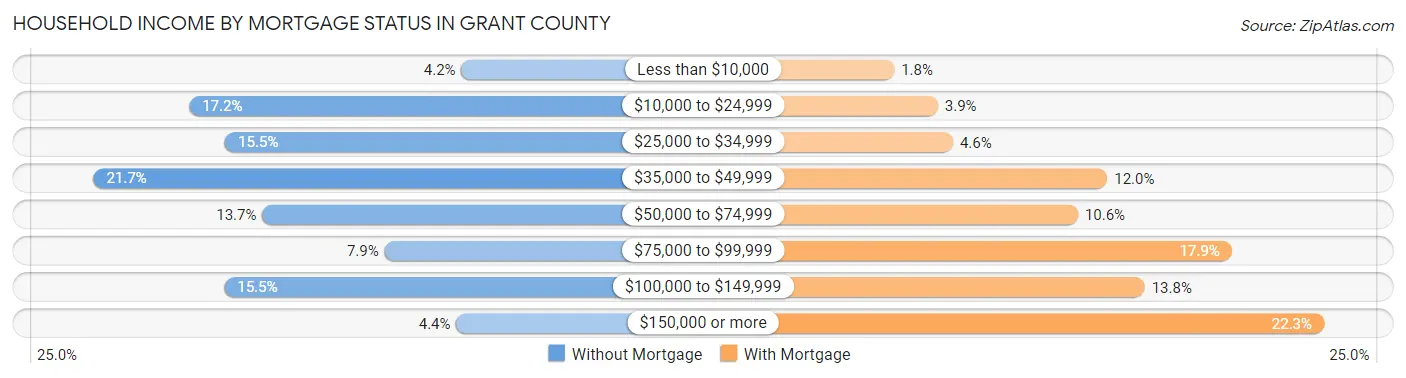
| Household Income | Without Mortgage | With Mortgage |
| Less than $10,000 | 204 (4.2%) | 59 (1.8%) |
| $10,000 to $24,999 | 834 (17.2%) | 126 (3.9%) |
| $25,000 to $34,999 | 751 (15.4%) | 149 (4.6%) |
| $35,000 to $49,999 | 1,056 (21.7%) | 385 (12.0%) |
| $50,000 to $74,999 | 665 (13.7%) | 340 (10.6%) |
| $75,000 to $99,999 | 382 (7.9%) | 575 (17.9%) |
| $100,000 to $149,999 | 753 (15.5%) | 442 (13.8%) |
| $150,000 or more | 216 (4.4%) | 716 (22.3%) |
| Total | 4,861 (100.0%) | 3,211 (100.0%) |
Property Value to Household Income Ratio in Grant County
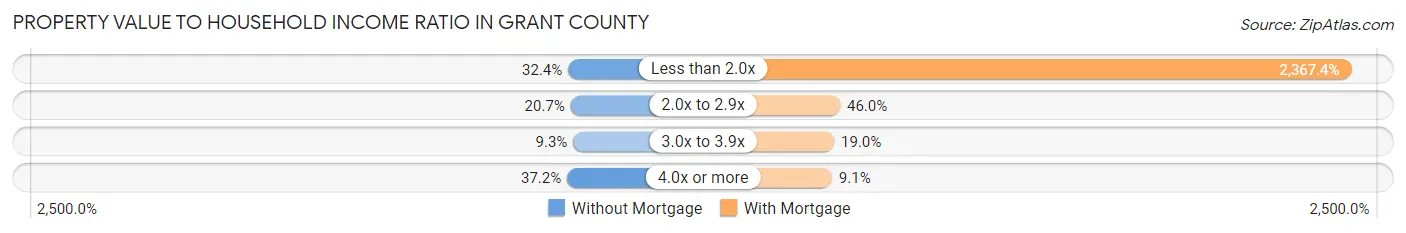
| Value-to-Income Ratio | Without Mortgage | With Mortgage |
| Less than 2.0x | 1,573 (32.4%) | 76,017 (2,367.4%) |
| 2.0x to 2.9x | 1,006 (20.7%) | 1,478 (46.0%) |
| 3.0x to 3.9x | 452 (9.3%) | 611 (19.0%) |
| 4.0x or more | 1,810 (37.2%) | 292 (9.1%) |
| Total | 4,861 (100.0%) | 3,211 (100.0%) |
Real Estate Taxes by Mortgage Status in Grant County
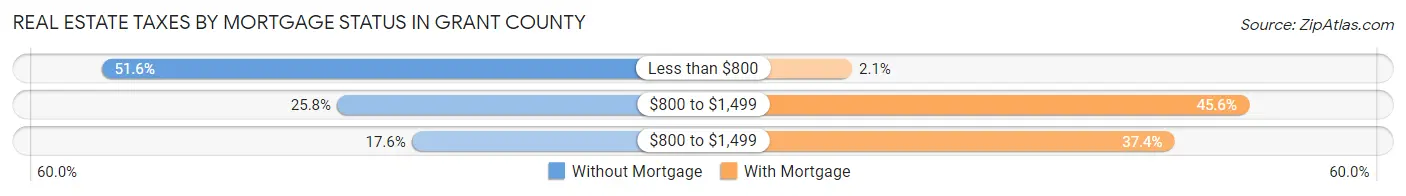
| Property Taxes | Without Mortgage | With Mortgage |
| Less than $800 | 2,507 (51.6%) | 67 (2.1%) |
| $800 to $1,499 | 1,253 (25.8%) | 1,463 (45.6%) |
| $800 to $1,499 | 855 (17.6%) | 1,201 (37.4%) |
| Total | 4,861 (100.0%) | 3,211 (100.0%) |
Health & Disability in Grant County
Health Insurance Coverage by Age in Grant County
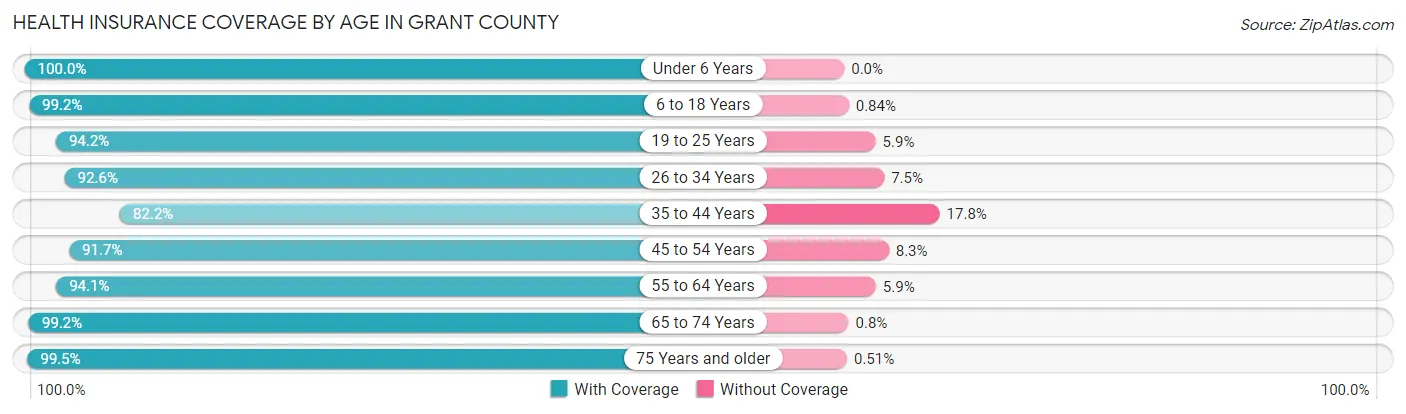
| Age Bracket | With Coverage | Without Coverage |
| Under 6 Years | 1,587 (100.0%) | 0 (0.0%) |
| 6 to 18 Years | 4,110 (99.2%) | 35 (0.8%) |
| 19 to 25 Years | 2,029 (94.2%) | 126 (5.9%) |
| 26 to 34 Years | 1,925 (92.5%) | 155 (7.4%) |
| 35 to 44 Years | 2,557 (82.2%) | 553 (17.8%) |
| 45 to 54 Years | 2,617 (91.7%) | 237 (8.3%) |
| 55 to 64 Years | 3,701 (94.1%) | 232 (5.9%) |
| 65 to 74 Years | 4,448 (99.2%) | 36 (0.8%) |
| 75 Years and older | 3,124 (99.5%) | 16 (0.5%) |
| Total | 26,098 (94.9%) | 1,390 (5.1%) |
Health Insurance Coverage by Citizenship Status in Grant County
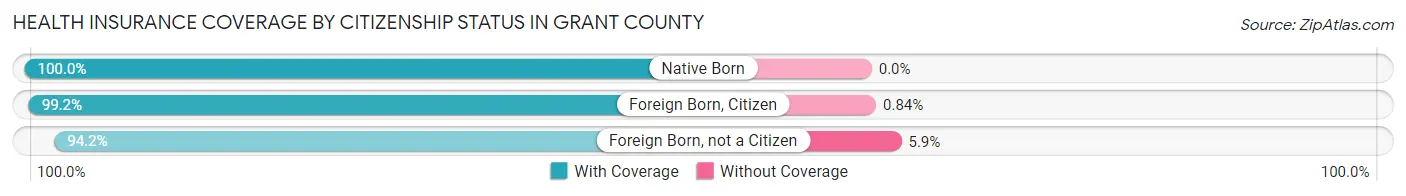
| Citizenship Status | With Coverage | Without Coverage |
| Native Born | 1,587 (100.0%) | 0 (0.0%) |
| Foreign Born, Citizen | 4,110 (99.2%) | 35 (0.8%) |
| Foreign Born, not a Citizen | 2,029 (94.2%) | 126 (5.9%) |
Health Insurance Coverage by Household Income in Grant County
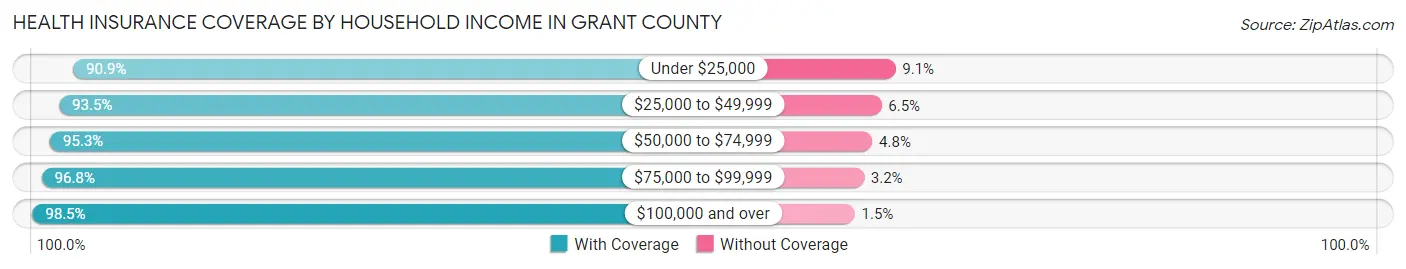
| Household Income | With Coverage | Without Coverage |
| Under $25,000 | 4,294 (90.9%) | 430 (9.1%) |
| $25,000 to $49,999 | 7,387 (93.5%) | 512 (6.5%) |
| $50,000 to $74,999 | 4,131 (95.3%) | 206 (4.8%) |
| $75,000 to $99,999 | 2,880 (96.8%) | 95 (3.2%) |
| $100,000 and over | 7,025 (98.5%) | 104 (1.5%) |
Public vs Private Health Insurance Coverage by Age in Grant County
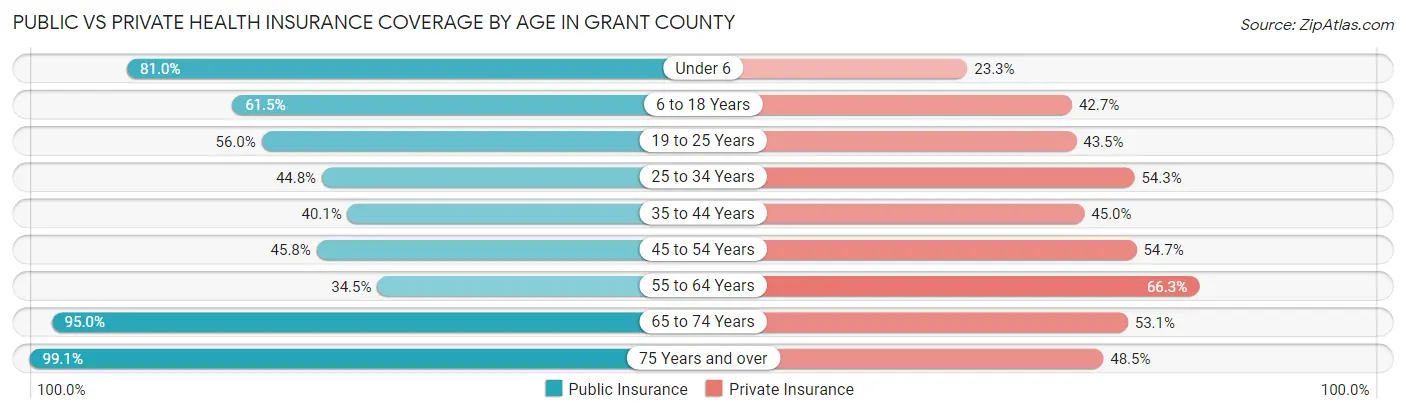
| Age Bracket | Public Insurance | Private Insurance |
| Under 6 | 1,285 (81.0%) | 370 (23.3%) |
| 6 to 18 Years | 2,547 (61.5%) | 1,771 (42.7%) |
| 19 to 25 Years | 1,207 (56.0%) | 938 (43.5%) |
| 25 to 34 Years | 932 (44.8%) | 1,130 (54.3%) |
| 35 to 44 Years | 1,246 (40.1%) | 1,400 (45.0%) |
| 45 to 54 Years | 1,307 (45.8%) | 1,561 (54.7%) |
| 55 to 64 Years | 1,358 (34.5%) | 2,607 (66.3%) |
| 65 to 74 Years | 4,259 (95.0%) | 2,380 (53.1%) |
| 75 Years and over | 3,111 (99.1%) | 1,524 (48.5%) |
| Total | 17,252 (62.8%) | 13,681 (49.8%) |
Disability Status by Sex by Age in Grant County
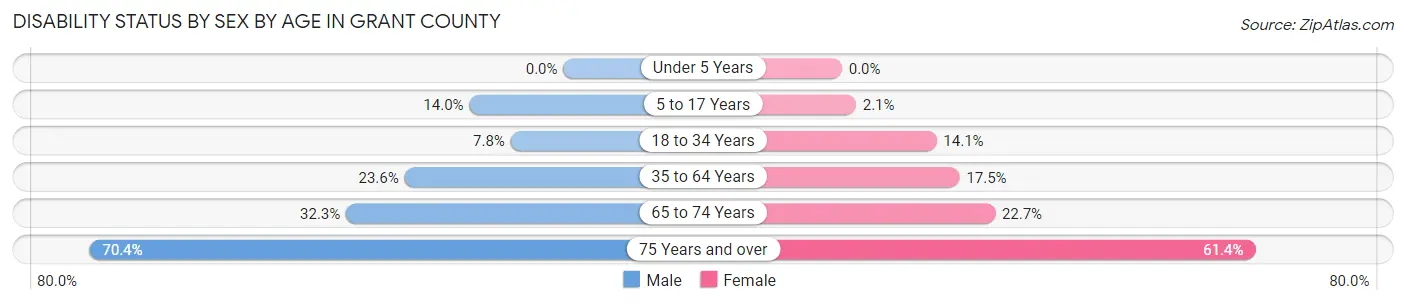
| Age Bracket | Male | Female |
| Under 5 Years | 0 (0.0%) | 0 (0.0%) |
| 5 to 17 Years | 302 (14.0%) | 39 (2.1%) |
| 18 to 34 Years | 182 (7.8%) | 329 (14.1%) |
| 35 to 64 Years | 1,146 (23.6%) | 880 (17.5%) |
| 65 to 74 Years | 730 (32.3%) | 505 (22.7%) |
| 75 Years and over | 1,012 (70.4%) | 1,045 (61.4%) |
Disability Class by Sex by Age in Grant County
Disability Class: Hearing Difficulty
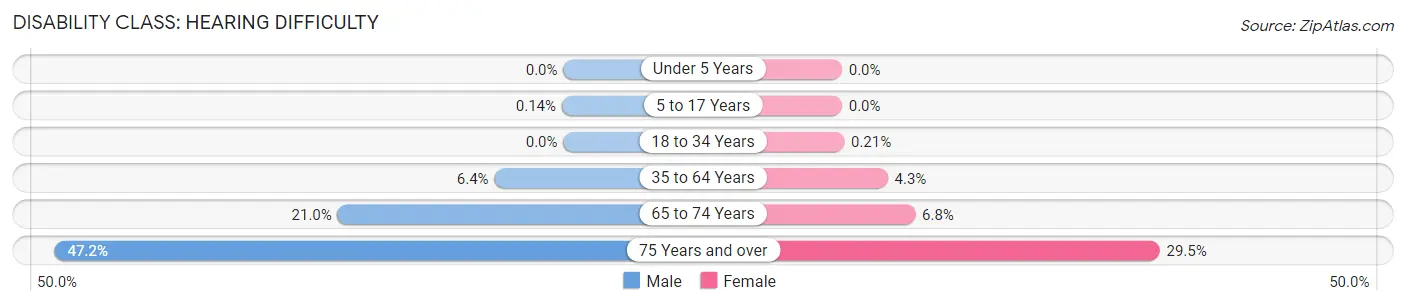
| Age Bracket | Male | Female |
| Under 5 Years | 0 (0.0%) | 0 (0.0%) |
| 5 to 17 Years | 3 (0.1%) | 0 (0.0%) |
| 18 to 34 Years | 0 (0.0%) | 5 (0.2%) |
| 35 to 64 Years | 311 (6.4%) | 214 (4.3%) |
| 65 to 74 Years | 474 (20.9%) | 151 (6.8%) |
| 75 Years and over | 679 (47.2%) | 502 (29.5%) |
Disability Class: Vision Difficulty
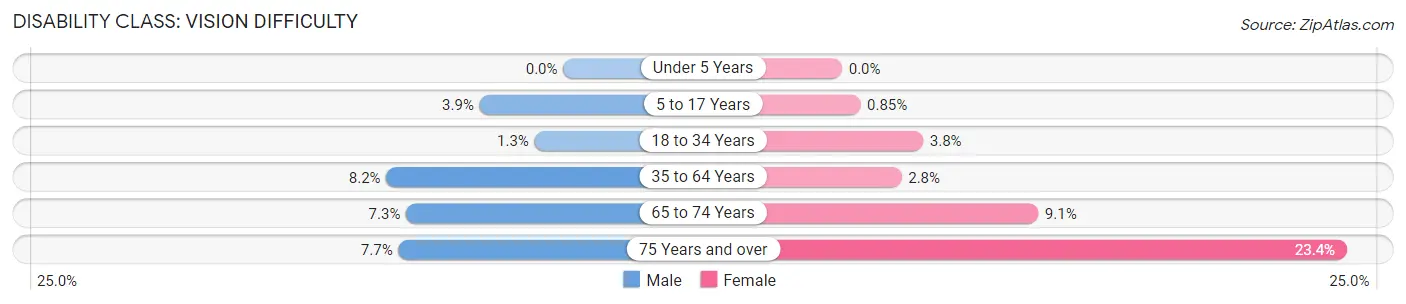
| Age Bracket | Male | Female |
| Under 5 Years | 0 (0.0%) | 0 (0.0%) |
| 5 to 17 Years | 84 (3.9%) | 16 (0.9%) |
| 18 to 34 Years | 31 (1.3%) | 88 (3.8%) |
| 35 to 64 Years | 399 (8.2%) | 139 (2.8%) |
| 65 to 74 Years | 165 (7.3%) | 202 (9.1%) |
| 75 Years and over | 110 (7.6%) | 399 (23.4%) |
Disability Class: Cognitive Difficulty
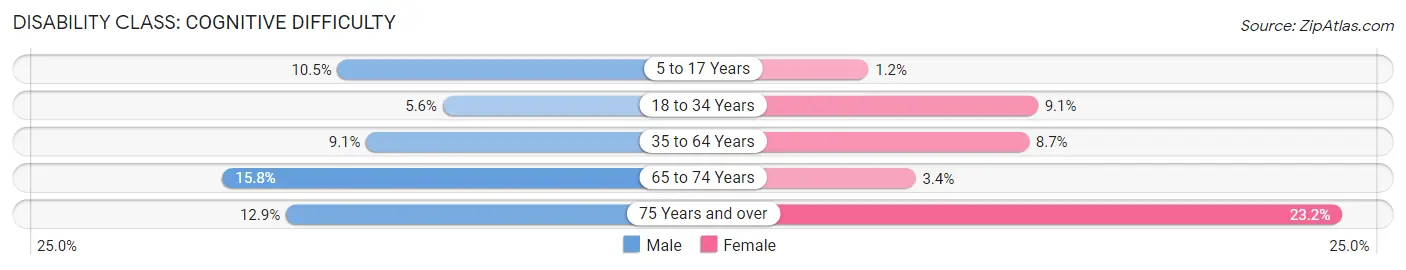
| Age Bracket | Male | Female |
| 5 to 17 Years | 227 (10.5%) | 23 (1.2%) |
| 18 to 34 Years | 130 (5.6%) | 213 (9.1%) |
| 35 to 64 Years | 444 (9.1%) | 437 (8.7%) |
| 65 to 74 Years | 358 (15.8%) | 76 (3.4%) |
| 75 Years and over | 185 (12.9%) | 395 (23.2%) |
Disability Class: Ambulatory Difficulty
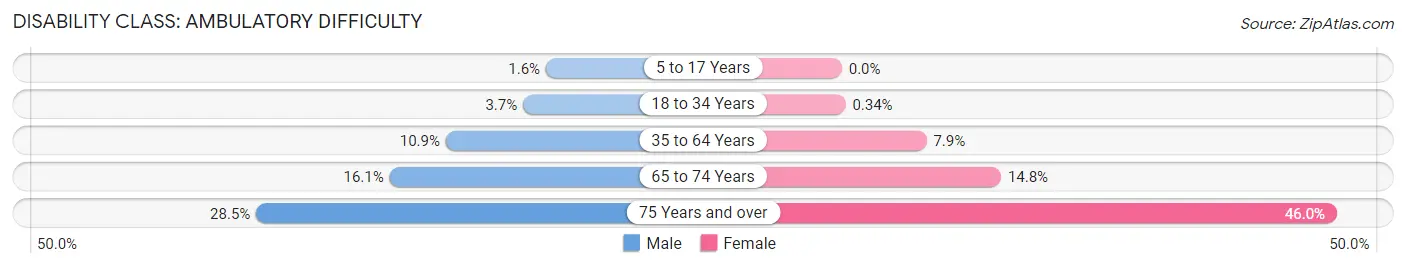
| Age Bracket | Male | Female |
| 5 to 17 Years | 35 (1.6%) | 0 (0.0%) |
| 18 to 34 Years | 87 (3.7%) | 8 (0.3%) |
| 35 to 64 Years | 530 (10.9%) | 396 (7.9%) |
| 65 to 74 Years | 365 (16.1%) | 328 (14.8%) |
| 75 Years and over | 410 (28.5%) | 782 (46.0%) |
Disability Class: Self-Care Difficulty
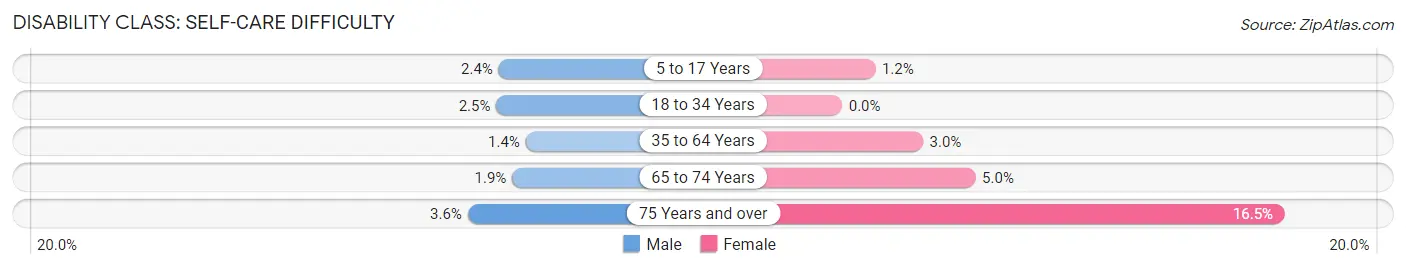
| Age Bracket | Male | Female |
| 5 to 17 Years | 52 (2.4%) | 23 (1.2%) |
| 18 to 34 Years | 58 (2.5%) | 0 (0.0%) |
| 35 to 64 Years | 68 (1.4%) | 151 (3.0%) |
| 65 to 74 Years | 43 (1.9%) | 110 (5.0%) |
| 75 Years and over | 51 (3.5%) | 280 (16.5%) |
Technology Access in Grant County
Computing Device Access in Grant County
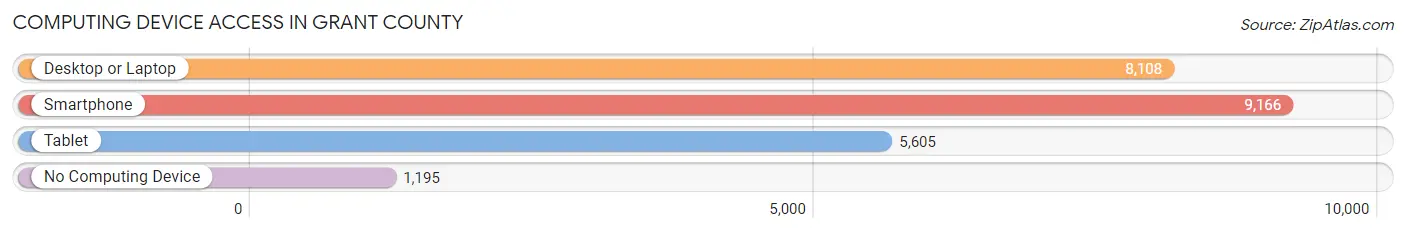
| Device Type | # Households | % Households |
| Desktop or Laptop | 8,108 | 71.8% |
| Smartphone | 9,166 | 81.2% |
| Tablet | 5,605 | 49.6% |
| No Computing Device | 1,195 | 10.6% |
| Total | 11,292 | 100.0% |
Internet Access in Grant County
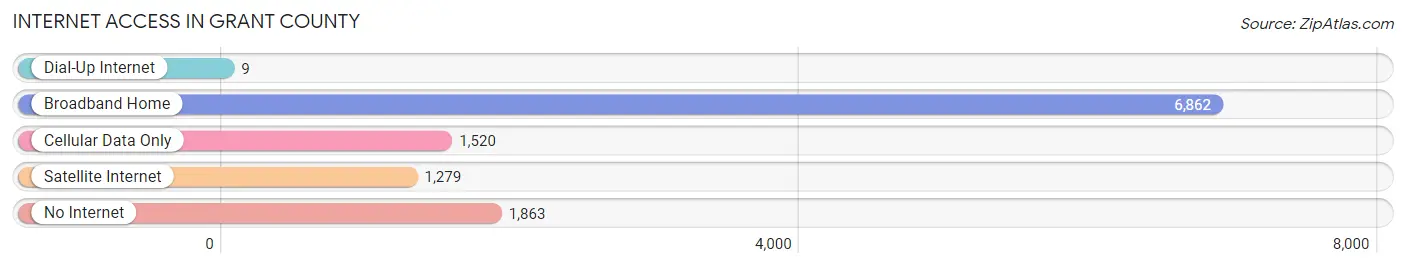
| Internet Type | # Households | % Households |
| Dial-Up Internet | 9 | 0.1% |
| Broadband Home | 6,862 | 60.8% |
| Cellular Data Only | 1,520 | 13.5% |
| Satellite Internet | 1,279 | 11.3% |
| No Internet | 1,863 | 16.5% |
| Total | 11,292 | 100.0% |
Grant County Summary
Introduction
Grant County is located in the southwestern corner of New Mexico, and is bordered by the states of Arizona and Mexico. It is the fifth largest county in the state, with an area of 5,945 square miles. The county seat is Silver City, which is also the largest city in the county. Grant County is home to a diverse population of approximately 29,000 people, and is known for its rich history, diverse geography, and vibrant economy.
History
Grant County was established in 1868, and was named after Ulysses S. Grant, the 18th President of the United States. The area was originally inhabited by the Mimbres, Chiricahua, and Apache tribes, and was later settled by Spanish colonists in the late 1700s. The area was part of the Gadsden Purchase in 1853, and was officially organized as a county in 1868.
The county was home to several mining operations in the late 1800s, including the Silver City Mining District, which was established in 1876. The area was also home to several military forts, including Fort Bayard, which was established in 1866.
Geography
Grant County is located in the southwestern corner of New Mexico, and is bordered by the states of Arizona and Mexico. It is the fifth largest county in the state, with an area of 5,945 square miles. The county is divided into two distinct regions: the Gila River Valley and the Mogollon Mountains. The Gila River Valley is a flat, arid region that is home to the county seat of Silver City. The Mogollon Mountains are a rugged, mountainous region that is home to the Gila National Forest and the Gila Wilderness.
The county is home to several rivers, including the Gila River, San Francisco River, and Mimbres River. The county is also home to several lakes, including Lake Roberts, Lake Roberts, and Lake Roberts.
Economy
Grant County is home to a diverse economy, with a variety of industries providing employment opportunities. The county is home to several mining operations, including copper, gold, and silver mines. The county is also home to several agricultural operations, including cattle ranching, dairy farming, and fruit and vegetable production.
The county is also home to several manufacturing operations, including furniture, clothing, and food processing. The county is also home to several tourism-related businesses, including hotels, restaurants, and recreational activities.
Demographics
As of the 2010 census, Grant County had a population of 29,514. The population is composed of a diverse mix of ethnicities, including White (77.3%), Hispanic or Latino (17.2%), Native American (2.2%), and African American (1.2%). The median household income in the county is $37,845, and the median age is 39.7 years.
Conclusion
Grant County is a vibrant and diverse county located in the southwestern corner of New Mexico. The county is home to a rich history, diverse geography, and vibrant economy. The county is home to a diverse population of approximately 29,000 people, and is known for its mining operations, agricultural operations, and tourism-related businesses.
Common Questions
What is Per Capita Income in Grant County?
Per Capita income in Grant County is $29,123.
What is the Median Family Income in Grant County?
Median Family Income in Grant County is $67,686.
What is the Median Household income in Grant County?
Median Household Income in Grant County is $44,895.
What is Income or Wage Gap in Grant County?
Income or Wage Gap in Grant County is 14.9%.
Women in Grant County earn 85.1 cents for every dollar earned by a man.
What is Family Income Deficit in Grant County?
Family Income Deficit in Grant County is $9,408.
Families that are below poverty line in Grant County earn $9,408 less on average than the poverty threshold level.
What is Inequality or Gini Index in Grant County?
Inequality or Gini Index in Grant County is 0.49.
What is the Total Population of Grant County?
Total Population of Grant County is 28,006.
What is the Total Male Population of Grant County?
Total Male Population of Grant County is 14,084.
What is the Total Female Population of Grant County?
Total Female Population of Grant County is 13,922.
What is the Ratio of Males per 100 Females in Grant County?
There are 101.16 Males per 100 Females in Grant County.
What is the Ratio of Females per 100 Males in Grant County?
There are 98.85 Females per 100 Males in Grant County.
What is the Median Population Age in Grant County?
Median Population Age in Grant County is 48.1 Years.
What is the Average Family Size in Grant County
Average Family Size in Grant County is 3.3 People.
What is the Average Household Size in Grant County
Average Household Size in Grant County is 2.4 People.
How Large is the Labor Force in Grant County?
There are 10,605 People in the Labor Forcein in Grant County.
What is the Percentage of People in the Labor Force in Grant County?
45.4% of People are in the Labor Force in Grant County.
What is the Unemployment Rate in Grant County?
Unemployment Rate in Grant County is 7.7%.