Shiprock, NM Map & Demographics
Shiprock Map
Shiprock Overview
$18,902
PER CAPITA INCOME
$41,382
AVG FAMILY INCOME
$38,393
AVG HOUSEHOLD INCOME
8.1%
WAGE / INCOME GAP [ % ]
91.9¢/ $1
WAGE / INCOME GAP [ $ ]
$12,078
FAMILY INCOME DEFICIT
0.48
INEQUALITY / GINI INDEX
8,275
TOTAL POPULATION
4,041
MALE POPULATION
4,234
FEMALE POPULATION
95.44
MALES / 100 FEMALES
104.78
FEMALES / 100 MALES
35.6
MEDIAN AGE
3.9
AVG FAMILY SIZE
3.5
AVG HOUSEHOLD SIZE
3,568
LABOR FORCE [ PEOPLE ]
53.0%
PERCENT IN LABOR FORCE
15.5%
UNEMPLOYMENT RATE
Shiprock Zip Codes
Shiprock Area Codes
Income in Shiprock
Income Overview in Shiprock
Per Capita Income in Shiprock is $18,902, while median incomes of families and households are $41,382 and $38,393 respectively.
| Characteristic | Number | Measure |
| Per Capita Income | 8,275 | $18,902 |
| Median Family Income | 1,928 | $41,382 |
| Mean Family Income | 1,928 | $63,249 |
| Median Household Income | 2,322 | $38,393 |
| Mean Household Income | 2,322 | $60,562 |
| Income Deficit | 1,928 | $12,078 |
| Wage / Income Gap (%) | 8,275 | 8.14% |
| Wage / Income Gap ($) | 8,275 | 91.86¢ per $1 |
| Gini / Inequality Index | 8,275 | 0.48 |
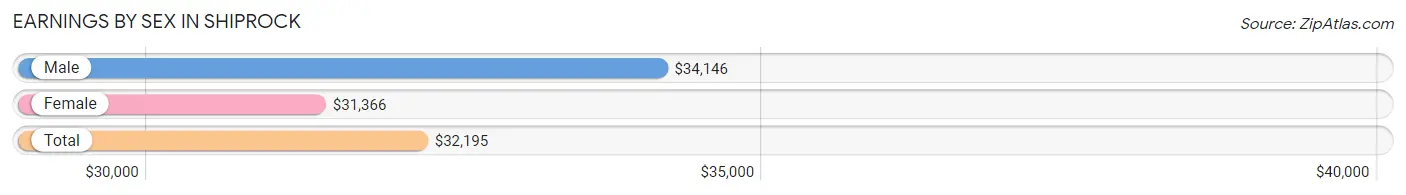
Earnings by Sex in Shiprock
Average Earnings in Shiprock are $32,195, $34,146 for men and $31,366 for women, a difference of 8.1%.
| Sex | Number | Average Earnings |
| Male | 1,457 (42.7%) | $34,146 |
| Female | 1,954 (57.3%) | $31,366 |
| Total | 3,411 (100.0%) | $32,195 |
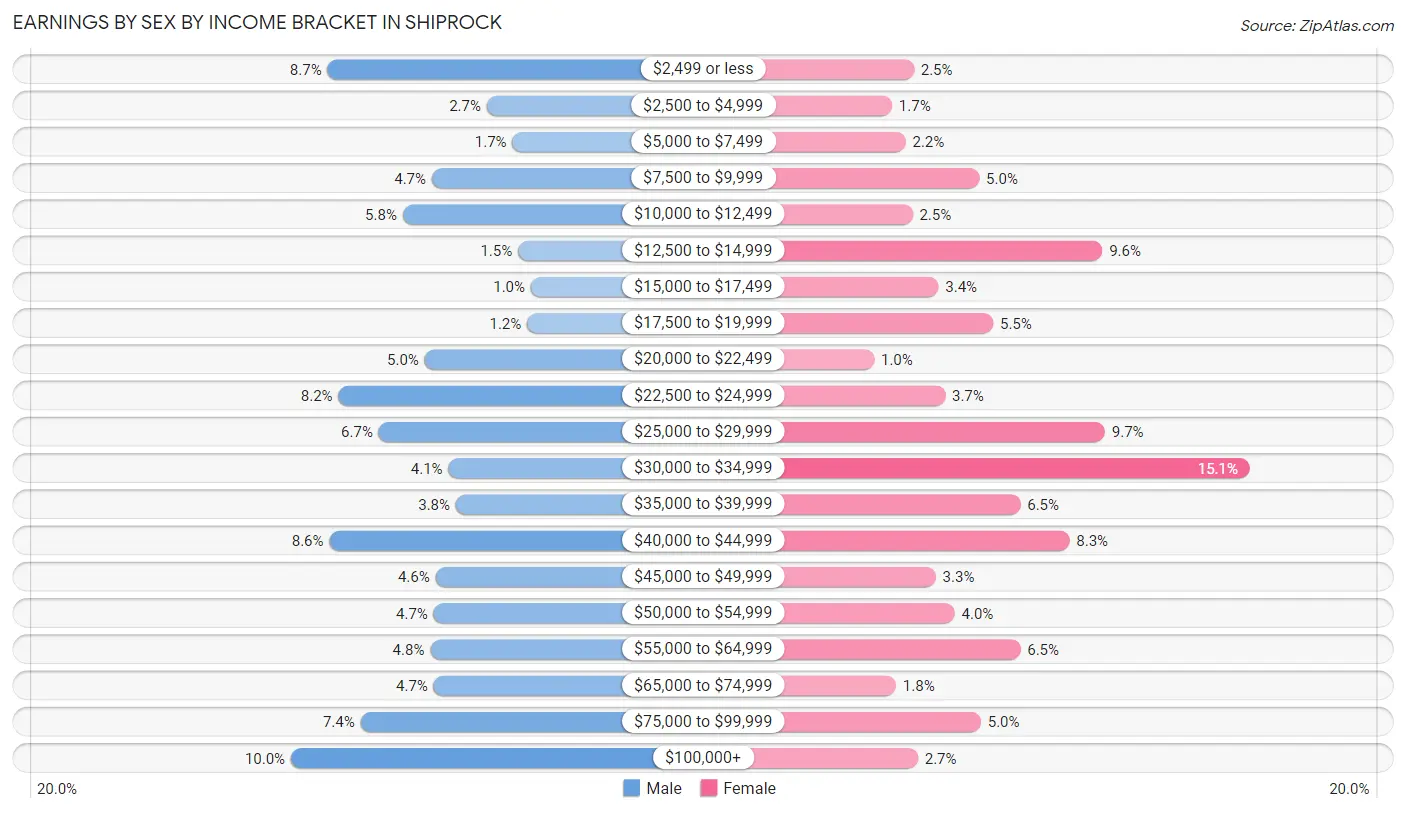
Earnings by Sex by Income Bracket in Shiprock
The most common earnings brackets in Shiprock are $100,000+ for men (146 | 10.0%) and $30,000 to $34,999 for women (295 | 15.1%).
| Income | Male | Female |
| $2,499 or less | 126 (8.6%) | 49 (2.5%) |
| $2,500 to $4,999 | 39 (2.7%) | 33 (1.7%) |
| $5,000 to $7,499 | 25 (1.7%) | 43 (2.2%) |
| $7,500 to $9,999 | 69 (4.7%) | 97 (5.0%) |
| $10,000 to $12,499 | 85 (5.8%) | 48 (2.5%) |
| $12,500 to $14,999 | 22 (1.5%) | 187 (9.6%) |
| $15,000 to $17,499 | 15 (1.0%) | 67 (3.4%) |
| $17,500 to $19,999 | 17 (1.2%) | 107 (5.5%) |
| $20,000 to $22,499 | 73 (5.0%) | 20 (1.0%) |
| $22,500 to $24,999 | 120 (8.2%) | 72 (3.7%) |
| $25,000 to $29,999 | 98 (6.7%) | 189 (9.7%) |
| $30,000 to $34,999 | 60 (4.1%) | 295 (15.1%) |
| $35,000 to $39,999 | 56 (3.8%) | 127 (6.5%) |
| $40,000 to $44,999 | 125 (8.6%) | 163 (8.3%) |
| $45,000 to $49,999 | 67 (4.6%) | 65 (3.3%) |
| $50,000 to $54,999 | 68 (4.7%) | 79 (4.0%) |
| $55,000 to $64,999 | 70 (4.8%) | 127 (6.5%) |
| $65,000 to $74,999 | 68 (4.7%) | 36 (1.8%) |
| $75,000 to $99,999 | 108 (7.4%) | 98 (5.0%) |
| $100,000+ | 146 (10.0%) | 52 (2.7%) |
| Total | 1,457 (100.0%) | 1,954 (100.0%) |
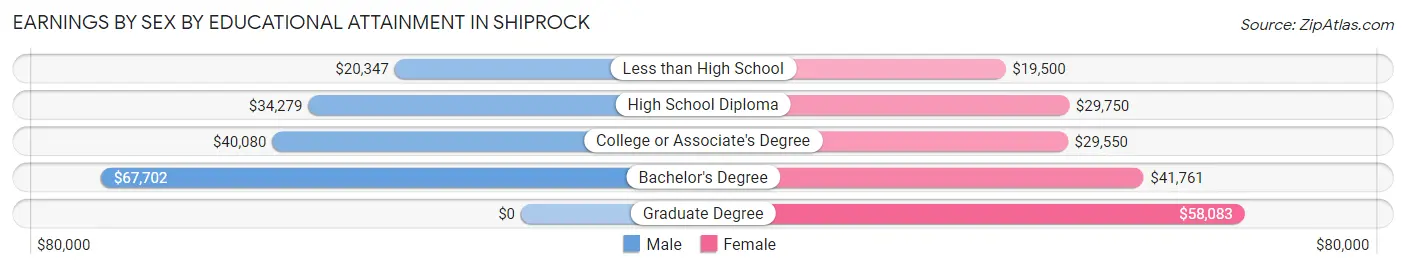
Earnings by Sex by Educational Attainment in Shiprock
Average earnings in Shiprock are $36,346 for men and $32,667 for women, a difference of 10.1%. Men with an educational attainment of bachelor's degree enjoy the highest average annual earnings of $67,702, while those with less than high school education earn the least with $20,347. Women with an educational attainment of graduate degree earn the most with the average annual earnings of $58,083, while those with less than high school education have the smallest earnings of $19,500.
| Educational Attainment | Male Income | Female Income |
| Less than High School | $20,347 | $19,500 |
| High School Diploma | $34,279 | $29,750 |
| College or Associate's Degree | $40,080 | $29,550 |
| Bachelor's Degree | $67,702 | $41,761 |
| Graduate Degree | - | - |
| Total | $36,346 | $32,667 |
Family Income in Shiprock
Family Income Brackets in Shiprock
According to the Shiprock family income data, there are 295 families falling into the $15,000 to $24,999 income range, which is the most common income bracket and makes up 15.3% of all families. Conversely, the $200,000+ income bracket is the least frequent group with only 52 families (2.7%) belonging to this category.
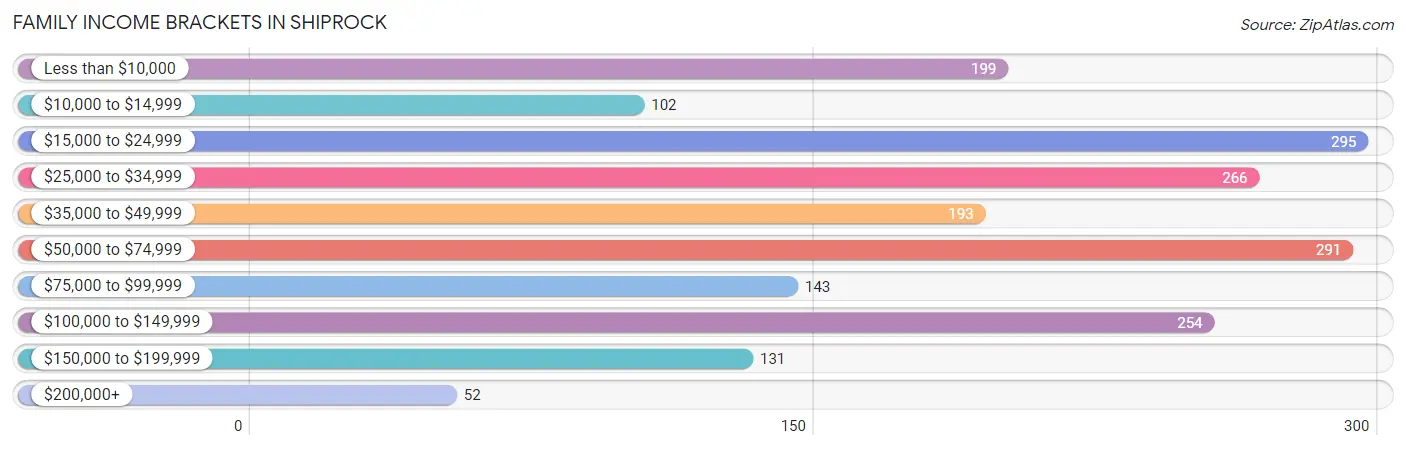
| Income Bracket | # Families | % Families |
| Less than $10,000 | 199 | 10.3% |
| $10,000 to $14,999 | 102 | 5.3% |
| $15,000 to $24,999 | 295 | 15.3% |
| $25,000 to $34,999 | 266 | 13.8% |
| $35,000 to $49,999 | 193 | 10.0% |
| $50,000 to $74,999 | 291 | 15.1% |
| $75,000 to $99,999 | 143 | 7.4% |
| $100,000 to $149,999 | 254 | 13.2% |
| $150,000 to $199,999 | 131 | 6.8% |
| $200,000+ | 52 | 2.7% |
Family Income by Famaliy Size in Shiprock
6-person families (181 | 9.4%) account for the highest median family income in Shiprock with $132,639 per family, while 5-person families (132 | 6.9%) have the highest median income of $23,286 per family member.
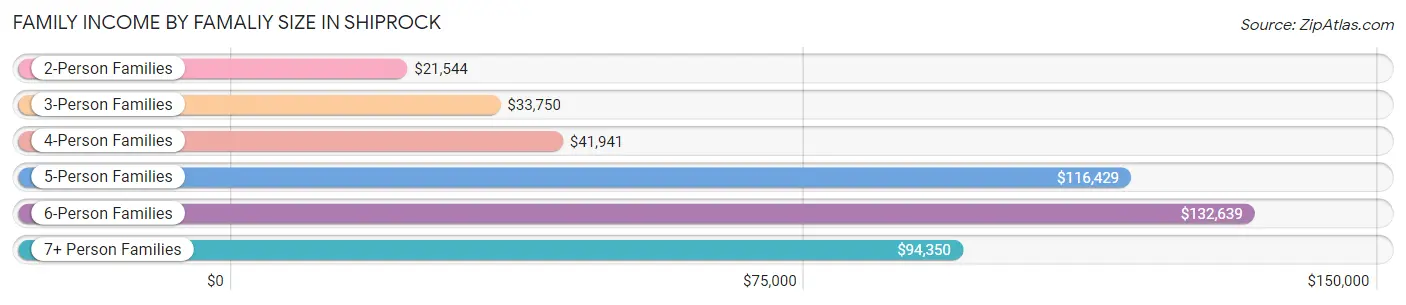
| Income Bracket | # Families | Median Income |
| 2-Person Families | 717 (37.2%) | $21,544 |
| 3-Person Families | 422 (21.9%) | $33,750 |
| 4-Person Families | 339 (17.6%) | $41,941 |
| 5-Person Families | 132 (6.9%) | $116,429 |
| 6-Person Families | 181 (9.4%) | $132,639 |
| 7+ Person Families | 137 (7.1%) | $94,350 |
| Total | 1,928 (100.0%) | $41,382 |
Family Income by Number of Earners in Shiprock
The median family income in Shiprock is $41,382, with families comprising 3+ earners (278) having the highest median family income of $138,269, while families with no earners (428) have the lowest median family income of $18,274, accounting for 14.4% and 22.2% of families, respectively.
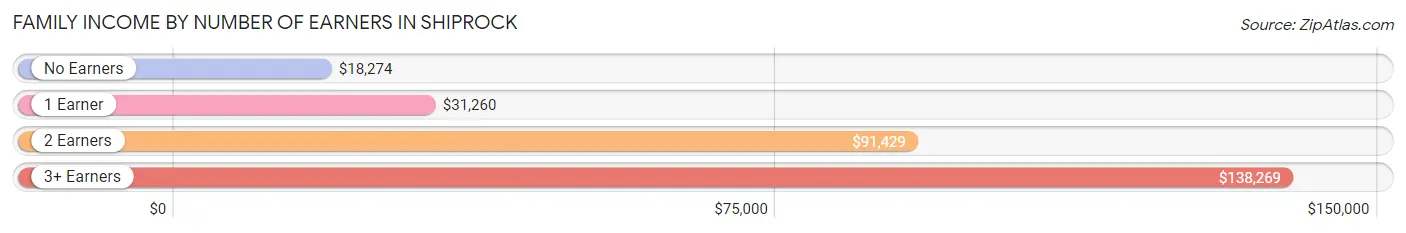
| Number of Earners | # Families | Median Income |
| No Earners | 428 (22.2%) | $18,274 |
| 1 Earner | 756 (39.2%) | $31,260 |
| 2 Earners | 466 (24.2%) | $91,429 |
| 3+ Earners | 278 (14.4%) | $138,269 |
| Total | 1,928 (100.0%) | $41,382 |
Household Income in Shiprock
Household Income Brackets in Shiprock
With 355 households falling in the category, the $25,000 to $34,999 income range is the most frequent in Shiprock, accounting for 15.3% of all households. In contrast, only 70 households (3.0%) fall into the $200,000+ income bracket, making it the least populous group.
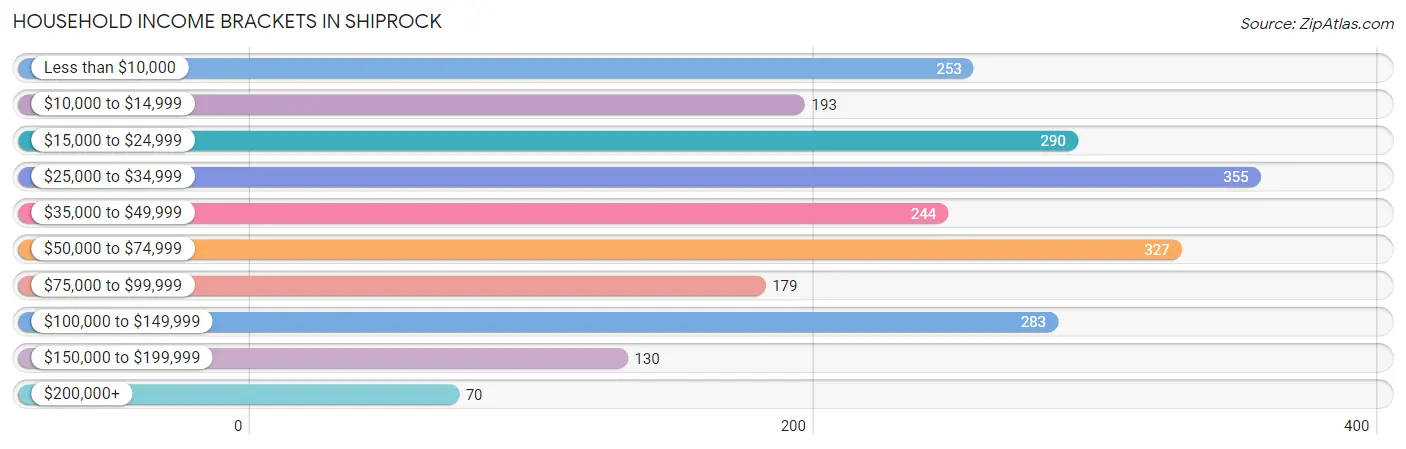
| Income Bracket | # Households | % Households |
| Less than $10,000 | 253 | 10.9% |
| $10,000 to $14,999 | 193 | 8.3% |
| $15,000 to $24,999 | 290 | 12.5% |
| $25,000 to $34,999 | 355 | 15.3% |
| $35,000 to $49,999 | 244 | 10.5% |
| $50,000 to $74,999 | 327 | 14.1% |
| $75,000 to $99,999 | 179 | 7.7% |
| $100,000 to $149,999 | 283 | 12.2% |
| $150,000 to $199,999 | 130 | 5.6% |
| $200,000+ | 70 | 3.0% |
Household Income by Householder Age in Shiprock
The median household income in Shiprock is $38,393, with the highest median household income of $57,436 found in the 45 to 64 years age bracket for the primary householder. A total of 1,048 households (45.1%) fall into this category. Meanwhile, the 15 to 24 years age bracket for the primary householder has the lowest median household income of $11,042, with 26 households (1.1%) in this group.
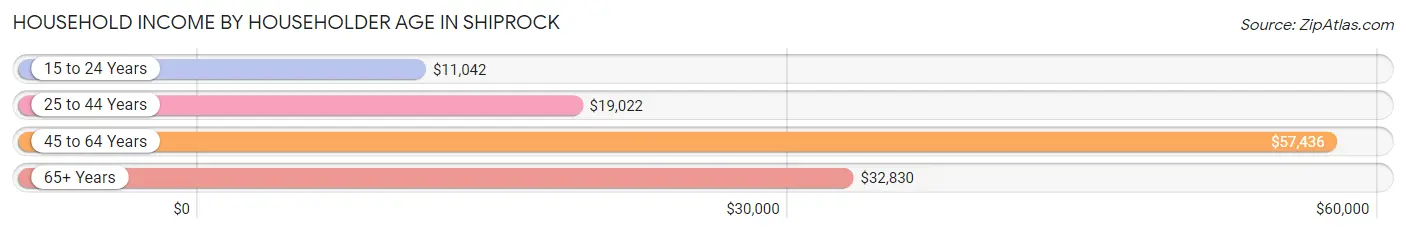
| Income Bracket | # Households | Median Income |
| 15 to 24 Years | 26 (1.1%) | $11,042 |
| 25 to 44 Years | 512 (22.1%) | $19,022 |
| 45 to 64 Years | 1,048 (45.1%) | $57,436 |
| 65+ Years | 736 (31.7%) | $32,830 |
| Total | 2,322 (100.0%) | $38,393 |
Poverty in Shiprock
Income Below Poverty by Sex and Age in Shiprock
With 29.0% poverty level for males and 27.0% for females among the residents of Shiprock, under 5 year old males and 35 to 44 year old females are the most vulnerable to poverty, with 75 males (67.0%) and 278 females (45.7%) in their respective age groups living below the poverty level.
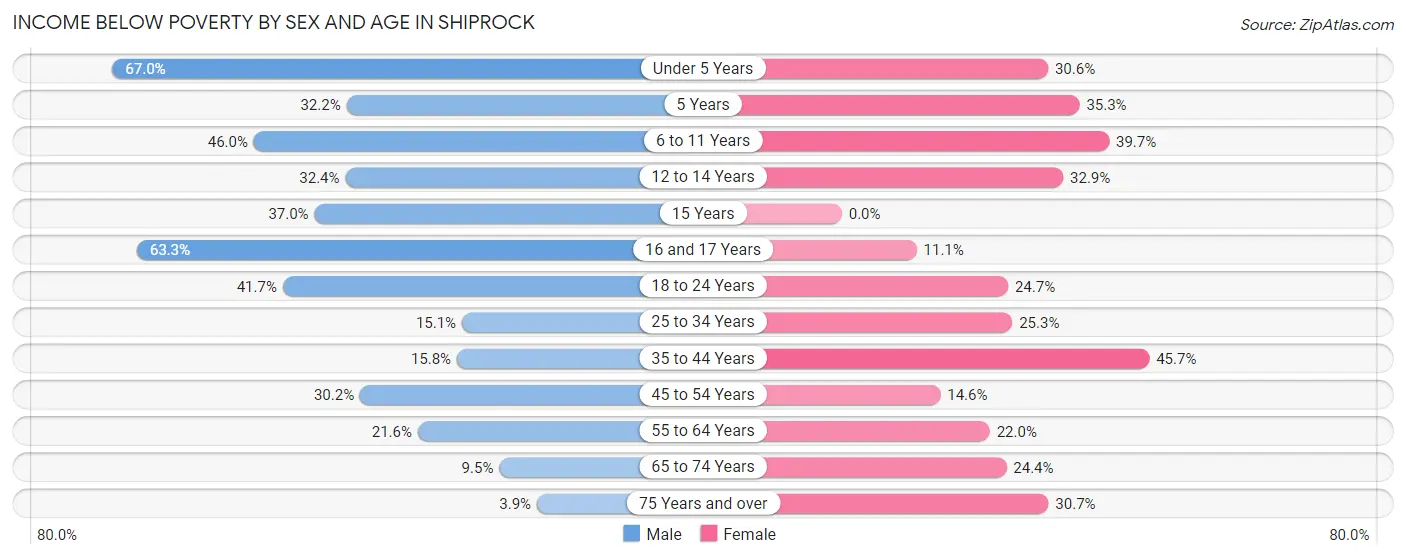
| Age Bracket | Male | Female |
| Under 5 Years | 75 (67.0%) | 64 (30.6%) |
| 5 Years | 19 (32.2%) | 6 (35.3%) |
| 6 to 11 Years | 216 (46.0%) | 98 (39.7%) |
| 12 to 14 Years | 56 (32.4%) | 23 (32.9%) |
| 15 Years | 17 (37.0%) | 0 (0.0%) |
| 16 and 17 Years | 171 (63.3%) | 9 (11.1%) |
| 18 to 24 Years | 150 (41.7%) | 115 (24.7%) |
| 25 to 34 Years | 81 (15.1%) | 201 (25.3%) |
| 35 to 44 Years | 85 (15.8%) | 278 (45.7%) |
| 45 to 54 Years | 135 (30.2%) | 66 (14.6%) |
| 55 to 64 Years | 129 (21.6%) | 125 (22.0%) |
| 65 to 74 Years | 30 (9.5%) | 76 (24.4%) |
| 75 Years and over | 4 (3.9%) | 81 (30.7%) |
| Total | 1,168 (29.0%) | 1,142 (27.0%) |
Income Above Poverty by Sex and Age in Shiprock
According to the poverty statistics in Shiprock, males aged 75 years and over and females aged 15 years are the age groups that are most secure financially, with 96.1% of males and 100.0% of females in these age groups living above the poverty line.
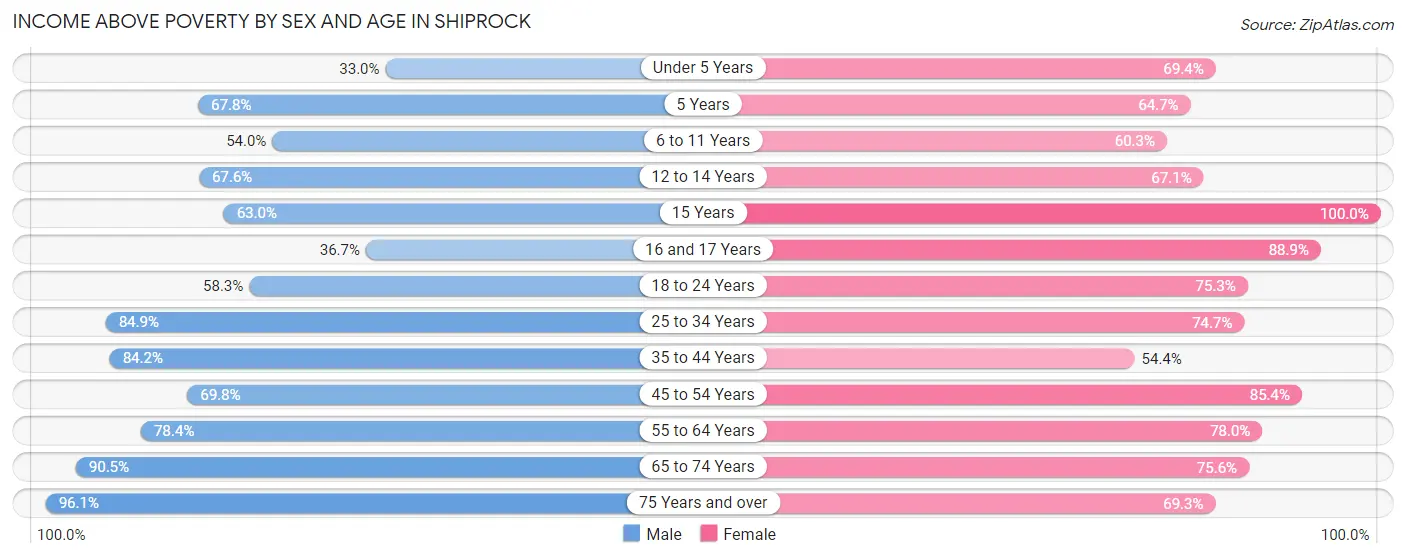
| Age Bracket | Male | Female |
| Under 5 Years | 37 (33.0%) | 145 (69.4%) |
| 5 Years | 40 (67.8%) | 11 (64.7%) |
| 6 to 11 Years | 254 (54.0%) | 149 (60.3%) |
| 12 to 14 Years | 117 (67.6%) | 47 (67.1%) |
| 15 Years | 29 (63.0%) | 139 (100.0%) |
| 16 and 17 Years | 99 (36.7%) | 72 (88.9%) |
| 18 to 24 Years | 210 (58.3%) | 351 (75.3%) |
| 25 to 34 Years | 457 (84.9%) | 593 (74.7%) |
| 35 to 44 Years | 453 (84.2%) | 331 (54.3%) |
| 45 to 54 Years | 312 (69.8%) | 385 (85.4%) |
| 55 to 64 Years | 468 (78.4%) | 444 (78.0%) |
| 65 to 74 Years | 285 (90.5%) | 235 (75.6%) |
| 75 Years and over | 98 (96.1%) | 183 (69.3%) |
| Total | 2,859 (71.0%) | 3,085 (73.0%) |
Income Below Poverty Among Married-Couple Families in Shiprock
The poverty statistics for married-couple families in Shiprock show that 13.4% or 122 of the total 909 families live below the poverty line. Families with 5 or more children have the highest poverty rate of 46.2%, comprising of 6 families. On the other hand, families with no children have the lowest poverty rate of 8.3%, which includes 42 families.
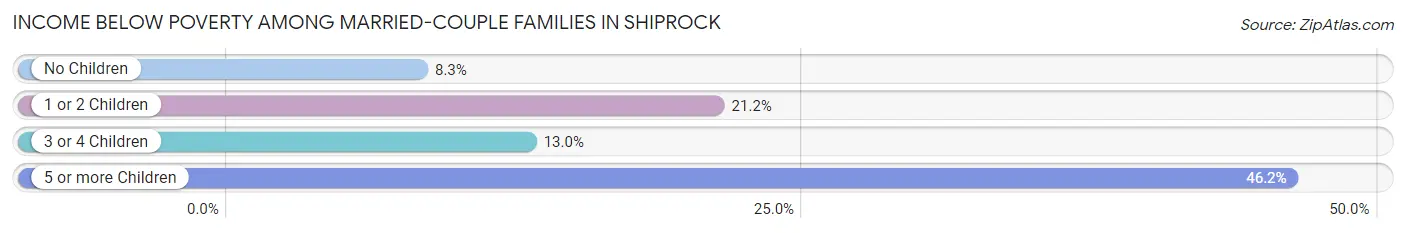
| Children | Above Poverty | Below Poverty |
| No Children | 466 (91.7%) | 42 (8.3%) |
| 1 or 2 Children | 227 (78.8%) | 61 (21.2%) |
| 3 or 4 Children | 87 (87.0%) | 13 (13.0%) |
| 5 or more Children | 7 (53.8%) | 6 (46.2%) |
| Total | 787 (86.6%) | 122 (13.4%) |
Income Below Poverty Among Single-Parent Households in Shiprock
According to the poverty data in Shiprock, 35.4% or 85 single-father households and 44.0% or 343 single-mother households are living below the poverty line. Among single-father households, those with 3 or 4 children have the highest poverty rate, with 5 households (100.0%) experiencing poverty. Likewise, among single-mother households, those with 1 or 2 children have the highest poverty rate, with 193 households (62.5%) falling below the poverty line.
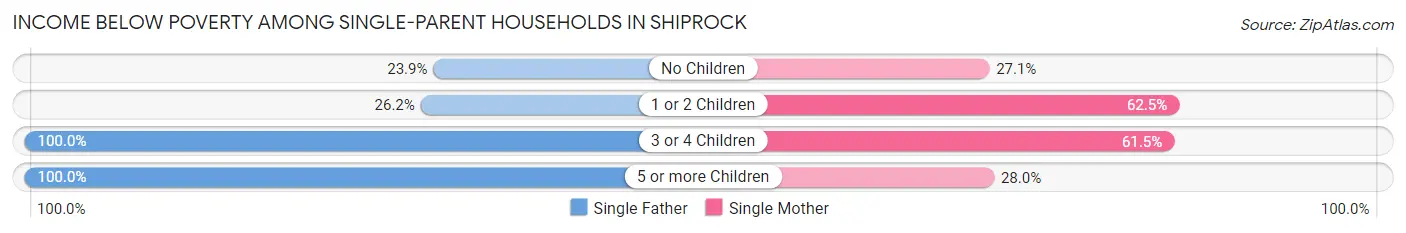
| Children | Single Father | Single Mother |
| No Children | 16 (23.9%) | 103 (27.1%) |
| 1 or 2 Children | 37 (26.2%) | 193 (62.5%) |
| 3 or 4 Children | 5 (100.0%) | 40 (61.5%) |
| 5 or more Children | 27 (100.0%) | 7 (28.0%) |
| Total | 85 (35.4%) | 343 (44.0%) |
Income Below Poverty Among Married-Couple vs Single-Parent Households in Shiprock
The poverty data for Shiprock shows that 122 of the married-couple family households (13.4%) and 428 of the single-parent households (42.0%) are living below the poverty level. Within the married-couple family households, those with 5 or more children have the highest poverty rate, with 6 households (46.2%) falling below the poverty line. Among the single-parent households, those with 5 or more children have the highest poverty rate, with 34 household (65.4%) living below poverty.
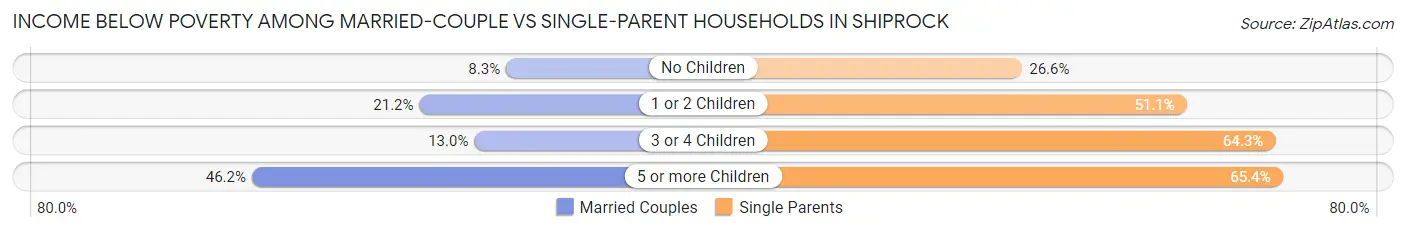
| Children | Married-Couple Families | Single-Parent Households |
| No Children | 42 (8.3%) | 119 (26.6%) |
| 1 or 2 Children | 61 (21.2%) | 230 (51.1%) |
| 3 or 4 Children | 13 (13.0%) | 45 (64.3%) |
| 5 or more Children | 6 (46.2%) | 34 (65.4%) |
| Total | 122 (13.4%) | 428 (42.0%) |
Race in Shiprock
The most populous races in Shiprock are Native / Alaskan (7,906 | 95.5%), Hispanic or Latino (220 | 2.7%), and White / Caucasian (102 | 1.2%).
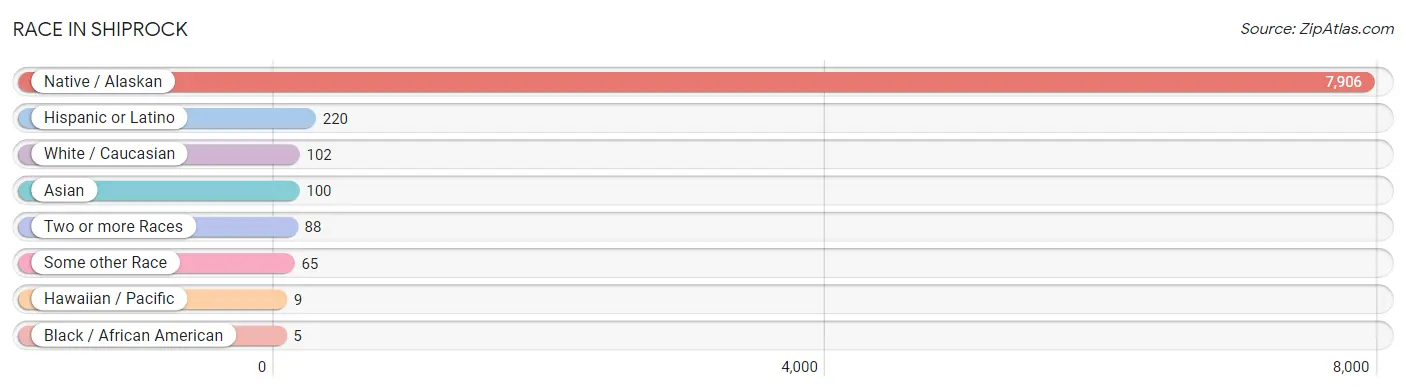
| Race | # Population | % Population |
| Asian | 100 | 1.2% |
| Black / African American | 5 | 0.1% |
| Hawaiian / Pacific | 9 | 0.1% |
| Hispanic or Latino | 220 | 2.7% |
| Native / Alaskan | 7,906 | 95.5% |
| White / Caucasian | 102 | 1.2% |
| Two or more Races | 88 | 1.1% |
| Some other Race | 65 | 0.8% |
| Total | 8,275 | 100.0% |
Ancestry in Shiprock
The most populous ancestries reported in Shiprock are Navajo (7,536 | 91.1%), Mexican (215 | 2.6%), Korean (91 | 1.1%), Paiute (62 | 0.7%), and Pueblo (56 | 0.7%), together accounting for 96.2% of all Shiprock residents.
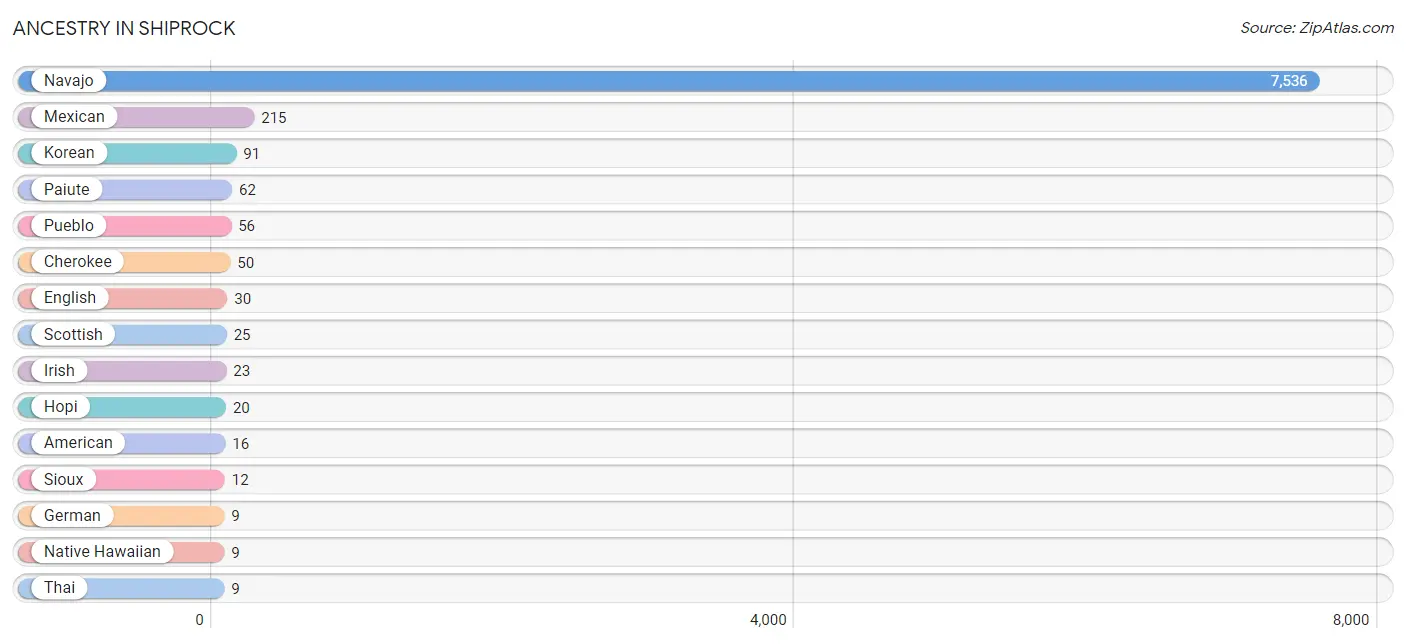
| Ancestry | # Population | % Population |
| American | 16 | 0.2% |
| Cherokee | 50 | 0.6% |
| English | 30 | 0.4% |
| German | 9 | 0.1% |
| Hopi | 20 | 0.2% |
| Irish | 23 | 0.3% |
| Israeli | 7 | 0.1% |
| Italian | 7 | 0.1% |
| Korean | 91 | 1.1% |
| Mexican | 215 | 2.6% |
| Native Hawaiian | 9 | 0.1% |
| Navajo | 7,536 | 91.1% |
| Paiute | 62 | 0.7% |
| Pueblo | 56 | 0.7% |
| Scottish | 25 | 0.3% |
| Sioux | 12 | 0.2% |
| Thai | 9 | 0.1% | View All 17 Rows |
Immigrants in Shiprock
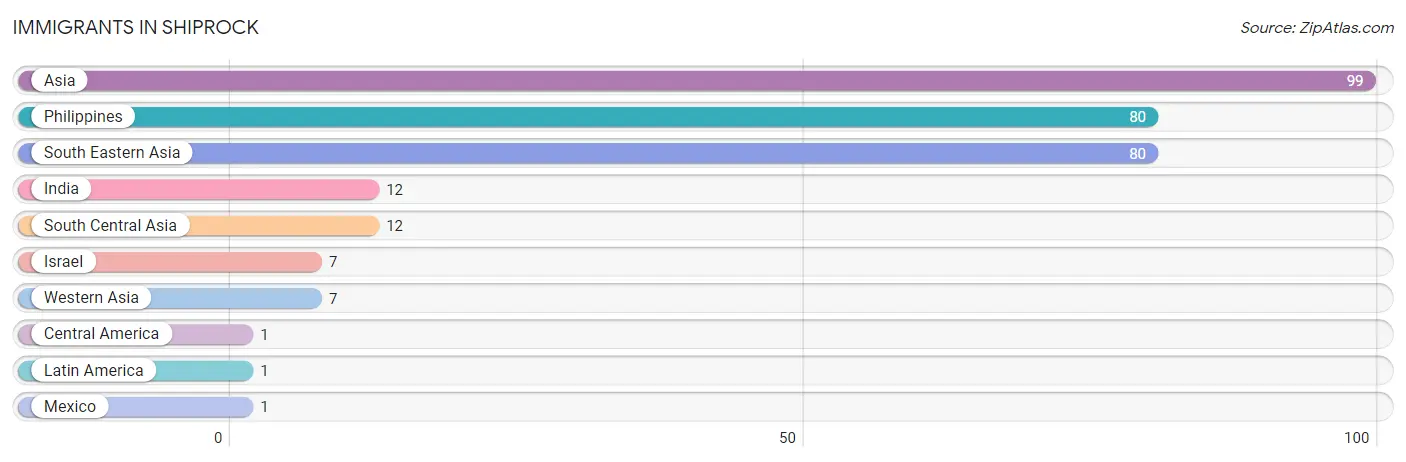
The most numerous immigrant groups reported in Shiprock came from Asia (99 | 1.2%), Philippines (80 | 1.0%), South Eastern Asia (80 | 1.0%), India (12 | 0.2%), and South Central Asia (12 | 0.2%), together accounting for 3.4% of all Shiprock residents.
| Immigration Origin | # Population | % Population |
| Asia | 99 | 1.2% |
| Central America | 1 | 0.0% |
| India | 12 | 0.2% |
| Israel | 7 | 0.1% |
| Latin America | 1 | 0.0% |
| Mexico | 1 | 0.0% |
| Philippines | 80 | 1.0% |
| South Central Asia | 12 | 0.2% |
| South Eastern Asia | 80 | 1.0% |
| Western Asia | 7 | 0.1% | View All 10 Rows |
Sex and Age in Shiprock
Sex and Age in Shiprock
The most populous age groups in Shiprock are 15 to 19 Years (534 | 13.2%) for men and 25 to 29 Years (407 | 9.6%) for women.
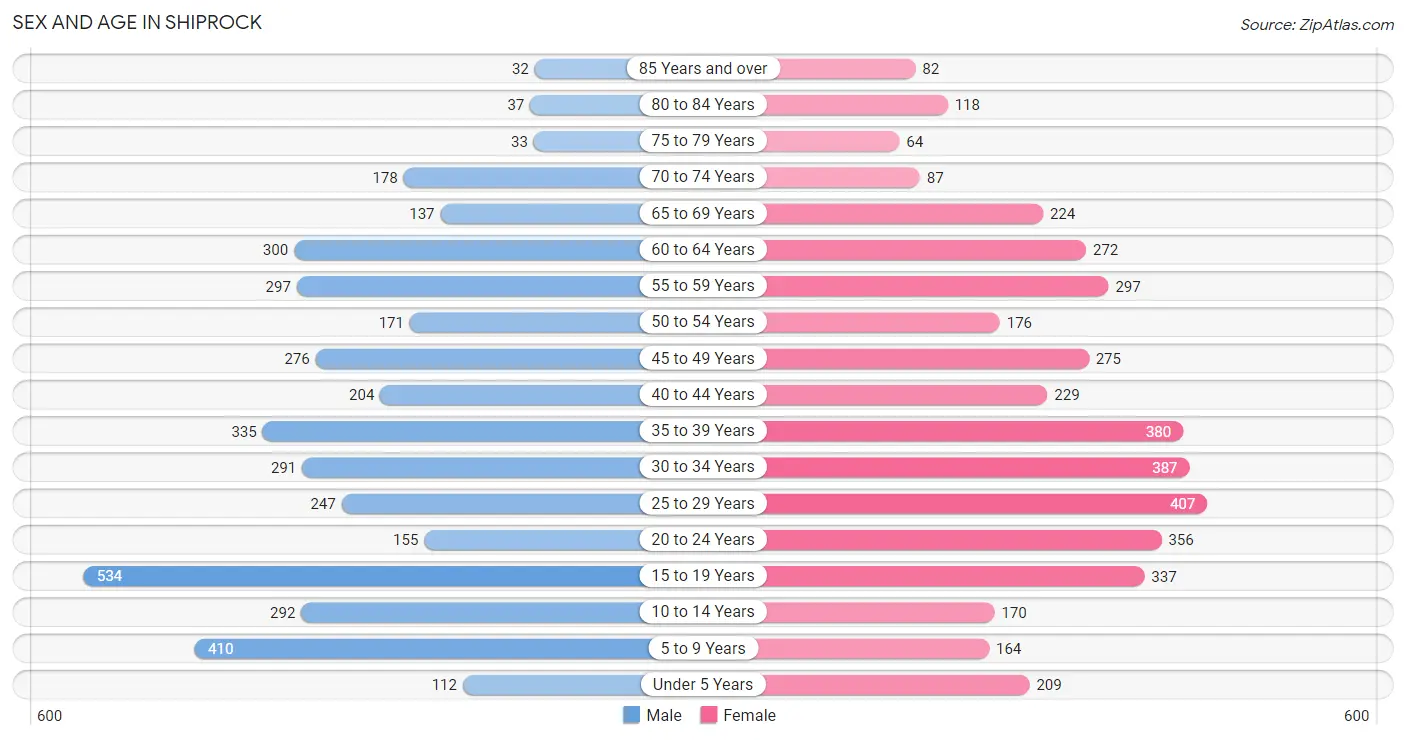
| Age Bracket | Male | Female |
| Under 5 Years | 112 (2.8%) | 209 (4.9%) |
| 5 to 9 Years | 410 (10.2%) | 164 (3.9%) |
| 10 to 14 Years | 292 (7.2%) | 170 (4.0%) |
| 15 to 19 Years | 534 (13.2%) | 337 (8.0%) |
| 20 to 24 Years | 155 (3.8%) | 356 (8.4%) |
| 25 to 29 Years | 247 (6.1%) | 407 (9.6%) |
| 30 to 34 Years | 291 (7.2%) | 387 (9.1%) |
| 35 to 39 Years | 335 (8.3%) | 380 (9.0%) |
| 40 to 44 Years | 204 (5.1%) | 229 (5.4%) |
| 45 to 49 Years | 276 (6.8%) | 275 (6.5%) |
| 50 to 54 Years | 171 (4.2%) | 176 (4.2%) |
| 55 to 59 Years | 297 (7.3%) | 297 (7.0%) |
| 60 to 64 Years | 300 (7.4%) | 272 (6.4%) |
| 65 to 69 Years | 137 (3.4%) | 224 (5.3%) |
| 70 to 74 Years | 178 (4.4%) | 87 (2.1%) |
| 75 to 79 Years | 33 (0.8%) | 64 (1.5%) |
| 80 to 84 Years | 37 (0.9%) | 118 (2.8%) |
| 85 Years and over | 32 (0.8%) | 82 (1.9%) |
| Total | 4,041 (100.0%) | 4,234 (100.0%) |
Families and Households in Shiprock
Median Family Size in Shiprock
The median family size in Shiprock is 3.94 persons per family, with single male/father families (240 | 12.4%) accounting for the largest median family size of 4.06 persons per family. On the other hand, married-couple families (909 | 47.1%) represent the smallest median family size with 3.92 persons per family.
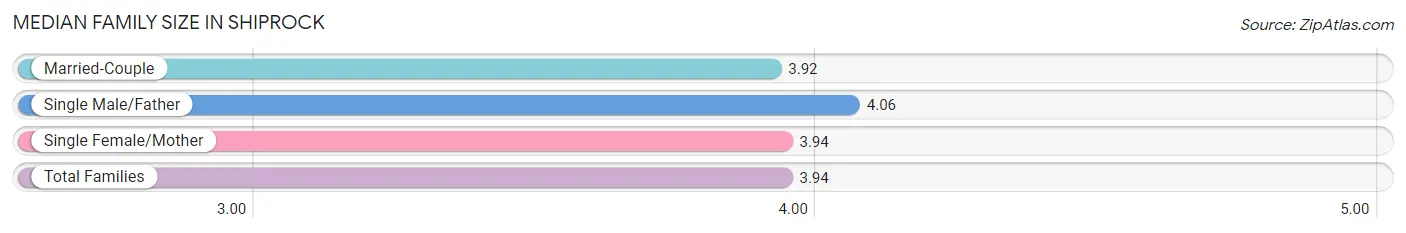
| Family Type | # Families | Family Size |
| Married-Couple | 909 (47.1%) | 3.92 |
| Single Male/Father | 240 (12.4%) | 4.06 |
| Single Female/Mother | 779 (40.4%) | 3.94 |
| Total Families | 1,928 (100.0%) | 3.94 |
Median Household Size in Shiprock
The median household size in Shiprock is 3.52 persons per household, with single male/father households (240 | 10.3%) accounting for the largest median household size of 4.28 persons per household. non-family households (394 | 17.0%) represent the smallest median household size with 1.20 persons per household.
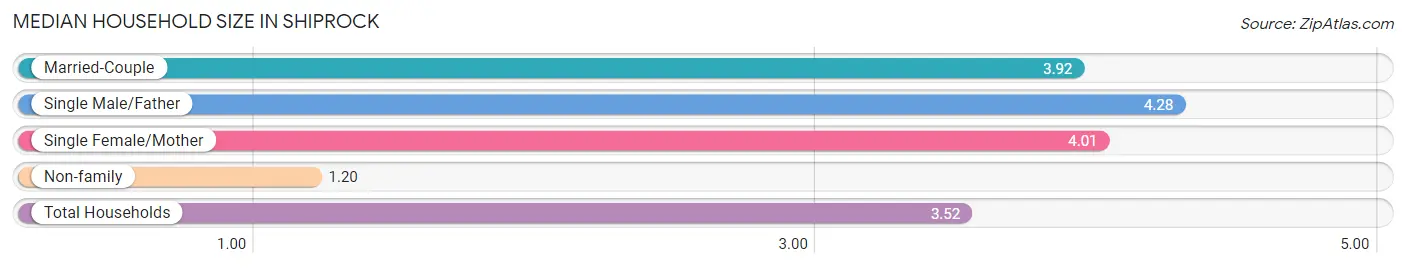
| Household Type | # Households | Household Size |
| Married-Couple | 909 (39.2%) | 3.92 |
| Single Male/Father | 240 (10.3%) | 4.28 |
| Single Female/Mother | 779 (33.6%) | 4.01 |
| Non-family | 394 (17.0%) | 1.20 |
| Total Households | 2,322 (100.0%) | 3.52 |
Household Size by Marriage Status in Shiprock
Out of a total of 2,322 households in Shiprock, 1,928 (83.0%) are family households, while 394 (17.0%) are nonfamily households. The most numerous type of family households are 2-person households, comprising 686, and the most common type of nonfamily households are 1-person households, comprising 324.
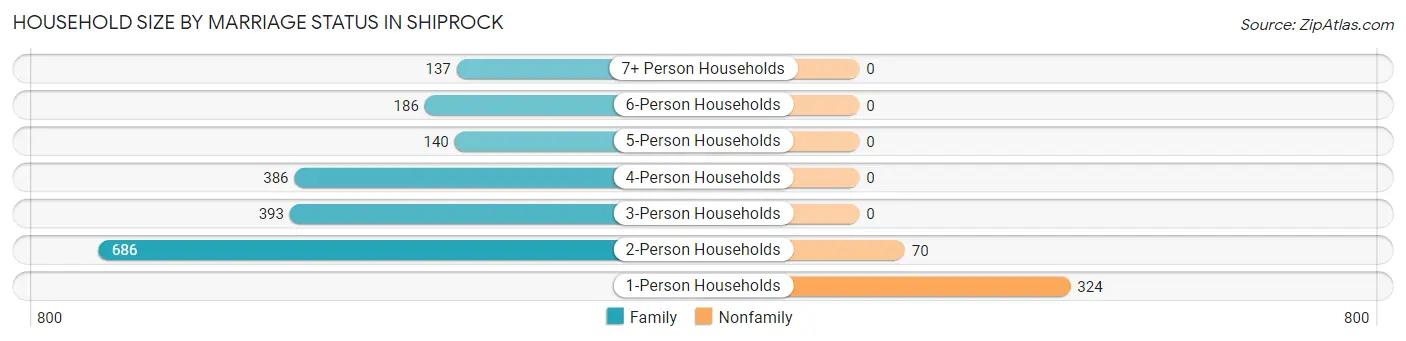
| Household Size | Family Households | Nonfamily Households |
| 1-Person Households | - | 324 (14.0%) |
| 2-Person Households | 686 (29.5%) | 70 (3.0%) |
| 3-Person Households | 393 (16.9%) | 0 (0.0%) |
| 4-Person Households | 386 (16.6%) | 0 (0.0%) |
| 5-Person Households | 140 (6.0%) | 0 (0.0%) |
| 6-Person Households | 186 (8.0%) | 0 (0.0%) |
| 7+ Person Households | 137 (5.9%) | 0 (0.0%) |
| Total | 1,928 (83.0%) | 394 (17.0%) |
Female Fertility in Shiprock
Fertility by Age in Shiprock
Average fertility rate in Shiprock is 14.0 births per 1,000 women. Women in the age bracket of 20 to 34 years have the highest fertility rate with 30.0 births per 1,000 women. Women in the age bracket of 20 to 34 years acount for 100.0% of all women with births.
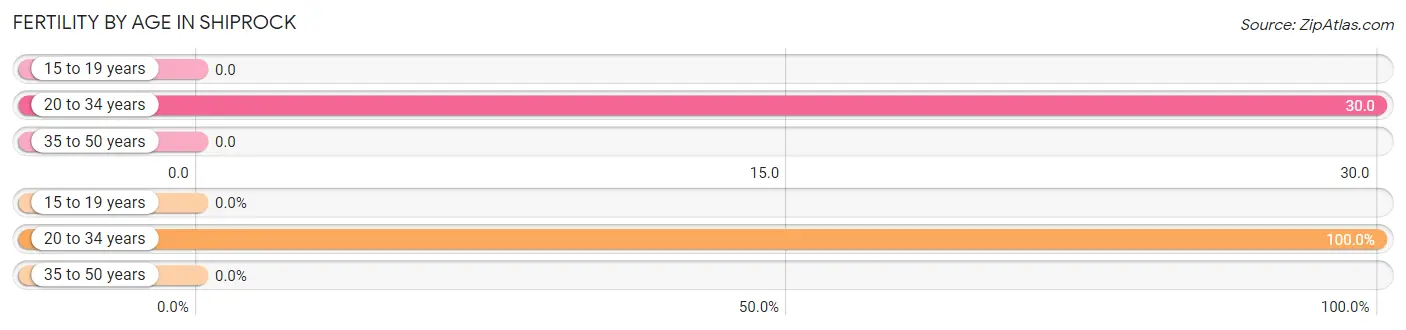
| Age Bracket | Women with Births | Births / 1,000 Women |
| 15 to 19 years | 0 (0.0%) | 0.0 |
| 20 to 34 years | 34 (100.0%) | 30.0 |
| 35 to 50 years | 0 (0.0%) | 0.0 |
| Total | 34 (100.0%) | 14.0 |
Fertility by Age by Marriage Status in Shiprock
17.6% of women with births (34) in Shiprock are married. The highest percentage of unmarried women with births falls into 20 to 34 years age bracket with 82.4% of them unmarried at the time of birth, while the lowest percentage of unmarried women with births belong to 20 to 34 years age bracket with 82.4% of them unmarried.
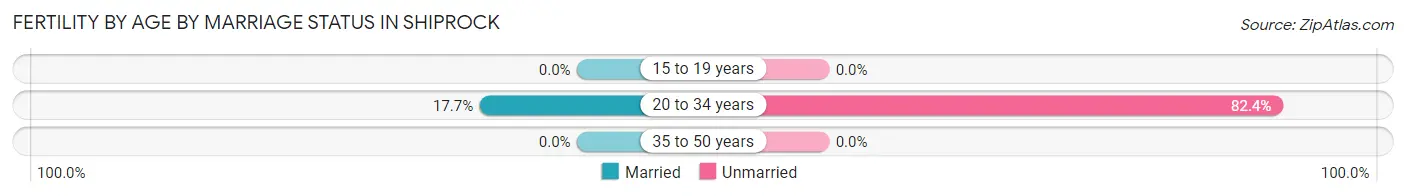
| Age Bracket | Married | Unmarried |
| 15 to 19 years | 0 (0.0%) | 0 (0.0%) |
| 20 to 34 years | 6 (17.6%) | 28 (82.4%) |
| 35 to 50 years | 0 (0.0%) | 0 (0.0%) |
| Total | 6 (17.6%) | 28 (82.4%) |
Fertility by Education in Shiprock
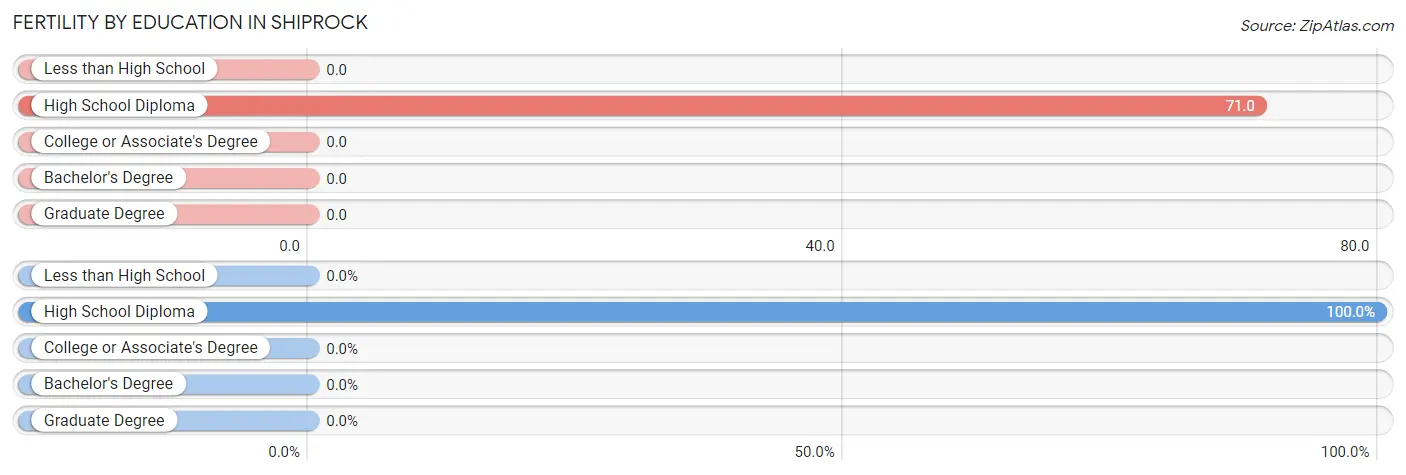
| Educational Attainment | Women with Births | Births / 1,000 Women |
| Less than High School | 0 (0.0%) | 0.0 |
| High School Diploma | 34 (100.0%) | 71.0 |
| College or Associate's Degree | 0 (0.0%) | 0.0 |
| Bachelor's Degree | 0 (0.0%) | 0.0 |
| Graduate Degree | 0 (0.0%) | 0.0 |
| Total | 34 (100.0%) | 14.0 |
Fertility by Education by Marriage Status in Shiprock
82.4% of women with births in Shiprock are unmarried. Women with the educational attainment of high school diploma are most likely to be married with 17.6% of them married at childbirth, while women with the educational attainment of high school diploma are least likely to be married with 82.4% of them unmarried at childbirth.
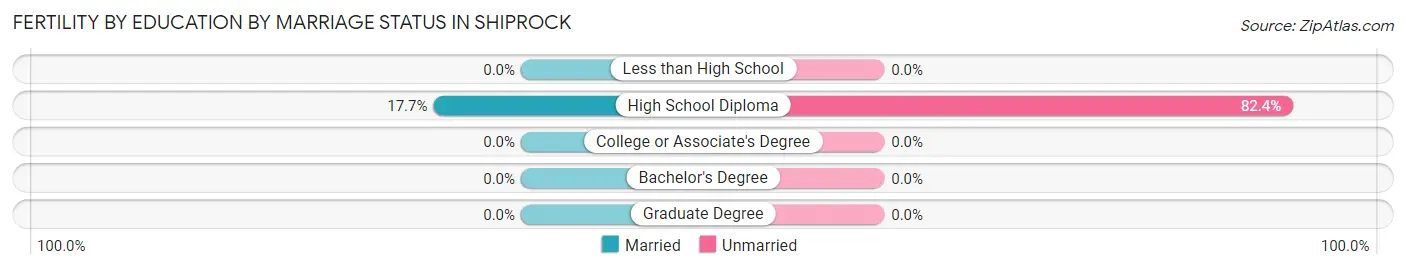
| Educational Attainment | Married | Unmarried |
| Less than High School | 0 (0.0%) | 0 (0.0%) |
| High School Diploma | 6 (17.6%) | 28 (82.4%) |
| College or Associate's Degree | 0 (0.0%) | 0 (0.0%) |
| Bachelor's Degree | 0 (0.0%) | 0 (0.0%) |
| Graduate Degree | 0 (0.0%) | 0 (0.0%) |
| Total | 6 (17.6%) | 28 (82.4%) |
Employment Characteristics in Shiprock
Employment by Class of Employer in Shiprock
Among the 2,866 employed individuals in Shiprock, private company employees (1,259 | 43.9%), local government employees (570 | 19.9%), and federal government employees (402 | 14.0%) make up the most common classes of employment.
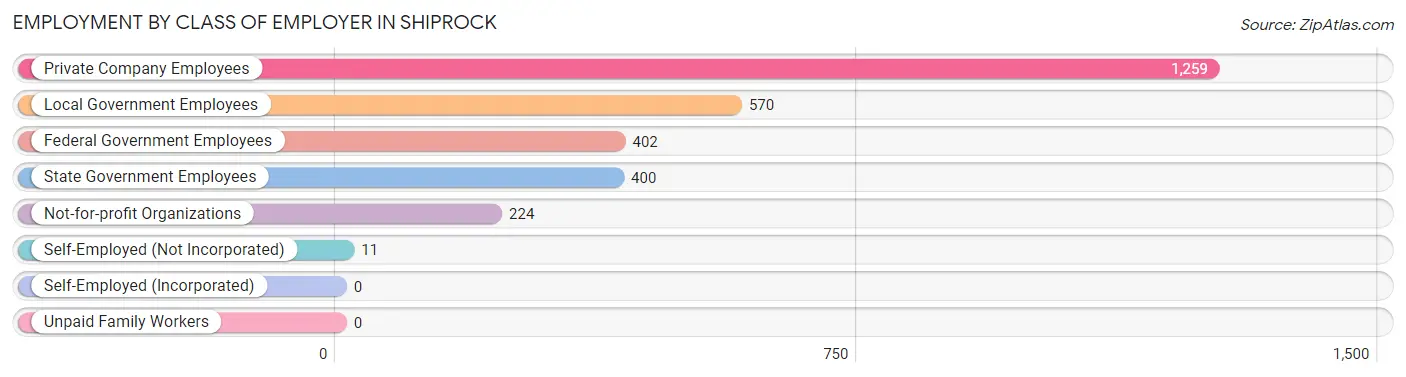
| Employer Class | # Employees | % Employees |
| Private Company Employees | 1,259 | 43.9% |
| Self-Employed (Incorporated) | 0 | 0.0% |
| Self-Employed (Not Incorporated) | 11 | 0.4% |
| Not-for-profit Organizations | 224 | 7.8% |
| Local Government Employees | 570 | 19.9% |
| State Government Employees | 400 | 14.0% |
| Federal Government Employees | 402 | 14.0% |
| Unpaid Family Workers | 0 | 0.0% |
| Total | 2,866 | 100.0% |
Employment Status by Age in Shiprock
According to the labor force statistics for Shiprock, out of the total population over 16 years of age (6,733), 53.0% or 3,568 individuals are in the labor force, with 15.5% or 553 of them unemployed. The age group with the highest labor force participation rate is 25 to 29 years, with 87.6% or 573 individuals in the labor force. Within the labor force, the 30 to 34 years age range has the highest percentage of unemployed individuals, with 25.1% or 122 of them being unemployed.
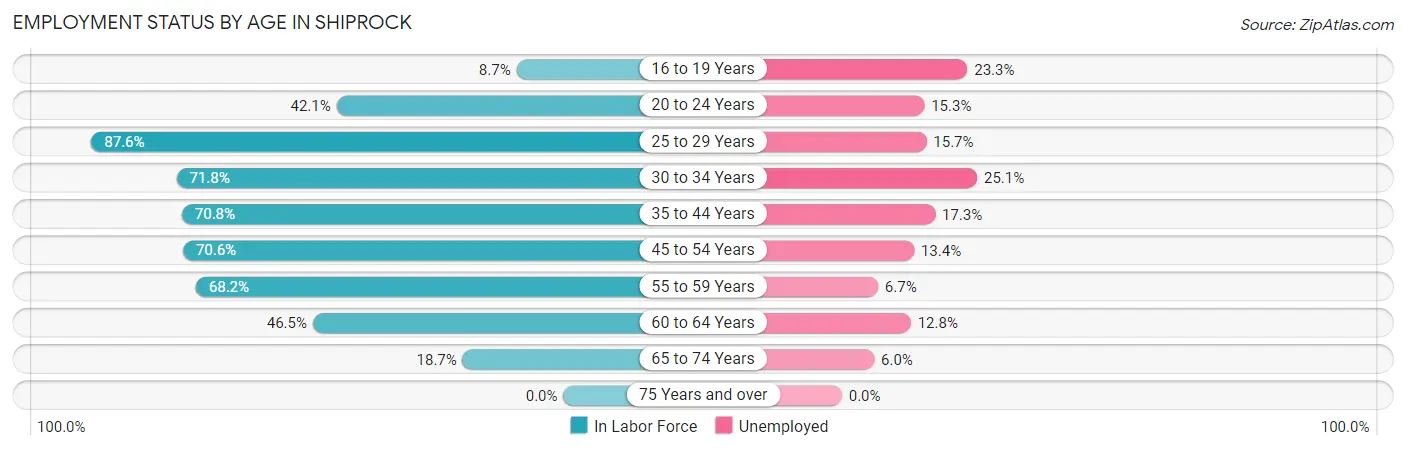
| Age Bracket | In Labor Force | Unemployed |
| 16 to 19 Years | 60 (8.7%) | 14 (23.3%) |
| 20 to 24 Years | 215 (42.1%) | 33 (15.3%) |
| 25 to 29 Years | 573 (87.6%) | 90 (15.7%) |
| 30 to 34 Years | 487 (71.8%) | 122 (25.1%) |
| 35 to 44 Years | 813 (70.8%) | 141 (17.3%) |
| 45 to 54 Years | 634 (70.6%) | 85 (13.4%) |
| 55 to 59 Years | 405 (68.2%) | 27 (6.7%) |
| 60 to 64 Years | 266 (46.5%) | 34 (12.8%) |
| 65 to 74 Years | 117 (18.7%) | 7 (6.0%) |
| 75 Years and over | 0 (0.0%) | 0 (0.0%) |
| Total | 3,568 (53.0%) | 553 (15.5%) |
Employment Status by Educational Attainment in Shiprock
According to labor force statistics for Shiprock, 69.9% of individuals (3,176) out of the total population between 25 and 64 years of age (4,544) are in the labor force, with 15.7% or 499 of them being unemployed. The group with the highest labor force participation rate are those with the educational attainment of bachelor's degree or higher, with 97.5% or 547 individuals in the labor force. Within the labor force, individuals with less than high school education have the highest percentage of unemployment, with 54.4% or 112 of them being unemployed.
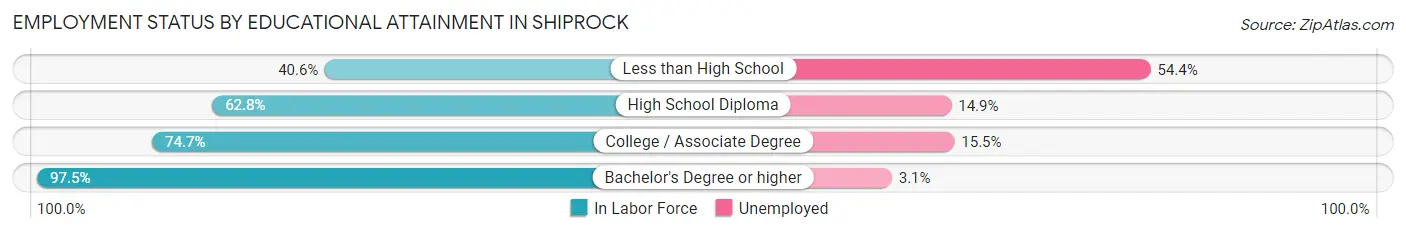
| Educational Attainment | In Labor Force | Unemployed |
| Less than High School | 206 (40.6%) | 276 (54.4%) |
| High School Diploma | 904 (62.8%) | 215 (14.9%) |
| College / Associate Degree | 1,520 (74.7%) | 315 (15.5%) |
| Bachelor's Degree or higher | 547 (97.5%) | 17 (3.1%) |
| Total | 3,176 (69.9%) | 713 (15.7%) |
Employment Occupations by Sex in Shiprock
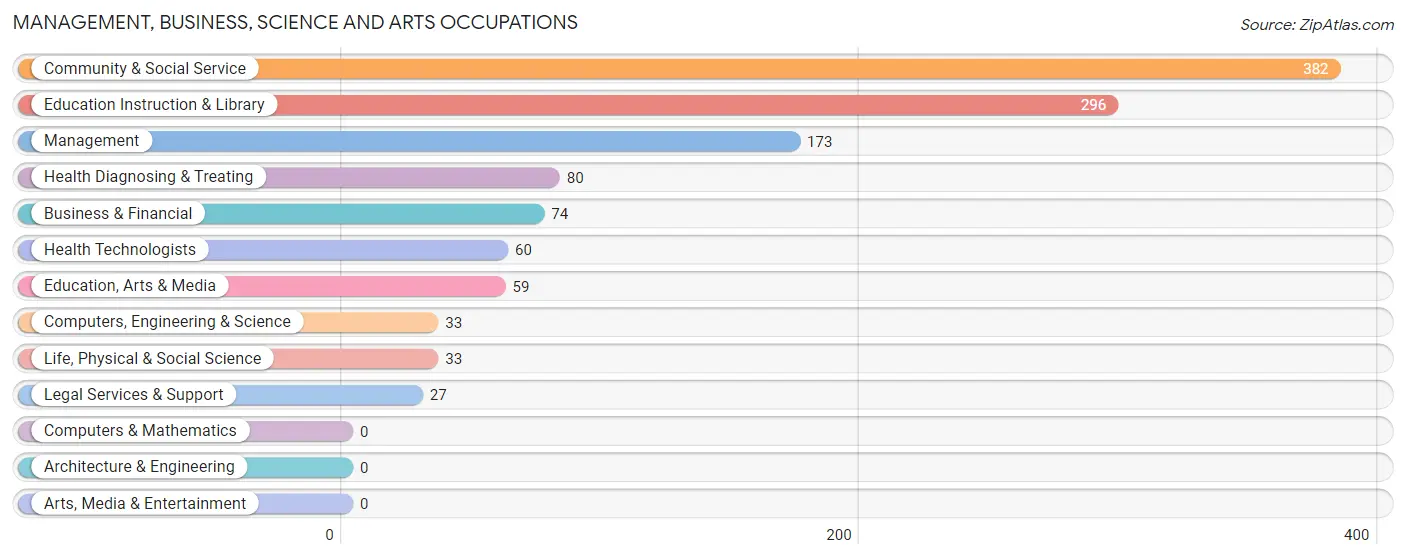
Management, Business, Science and Arts Occupations
The most common Management, Business, Science and Arts occupations in Shiprock are Community & Social Service (382 | 12.7%), Education Instruction & Library (296 | 9.8%), Management (173 | 5.7%), Health Diagnosing & Treating (80 | 2.6%), and Business & Financial (74 | 2.5%).
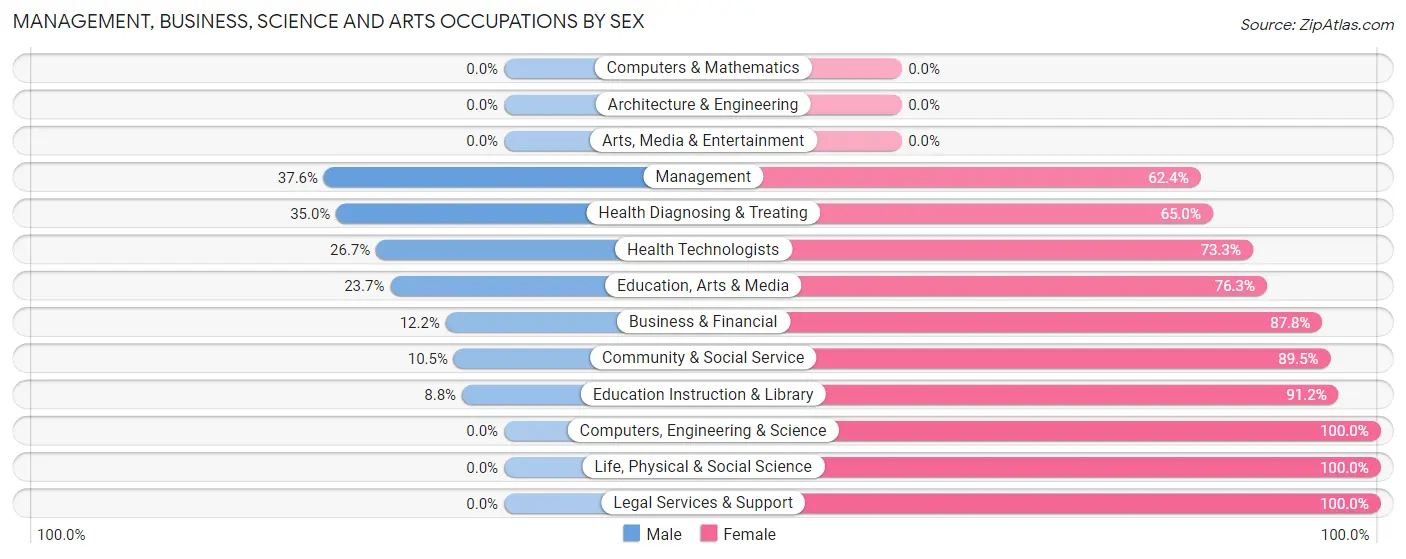
Management, Business, Science and Arts Occupations by Sex
Within the Management, Business, Science and Arts occupations in Shiprock, the most male-oriented occupations are Management (37.6%), Health Diagnosing & Treating (35.0%), and Health Technologists (26.7%), while the most female-oriented occupations are Computers, Engineering & Science (100.0%), Life, Physical & Social Science (100.0%), and Legal Services & Support (100.0%).
| Occupation | Male | Female |
| Management | 65 (37.6%) | 108 (62.4%) |
| Business & Financial | 9 (12.2%) | 65 (87.8%) |
| Computers, Engineering & Science | 0 (0.0%) | 33 (100.0%) |
| Computers & Mathematics | 0 (0.0%) | 0 (0.0%) |
| Architecture & Engineering | 0 (0.0%) | 0 (0.0%) |
| Life, Physical & Social Science | 0 (0.0%) | 33 (100.0%) |
| Community & Social Service | 40 (10.5%) | 342 (89.5%) |
| Education, Arts & Media | 14 (23.7%) | 45 (76.3%) |
| Legal Services & Support | 0 (0.0%) | 27 (100.0%) |
| Education Instruction & Library | 26 (8.8%) | 270 (91.2%) |
| Arts, Media & Entertainment | 0 (0.0%) | 0 (0.0%) |
| Health Diagnosing & Treating | 28 (35.0%) | 52 (65.0%) |
| Health Technologists | 16 (26.7%) | 44 (73.3%) |
| Total (Category) | 142 (19.1%) | 600 (80.9%) |
| Total (Overall) | 1,171 (38.8%) | 1,846 (61.2%) |
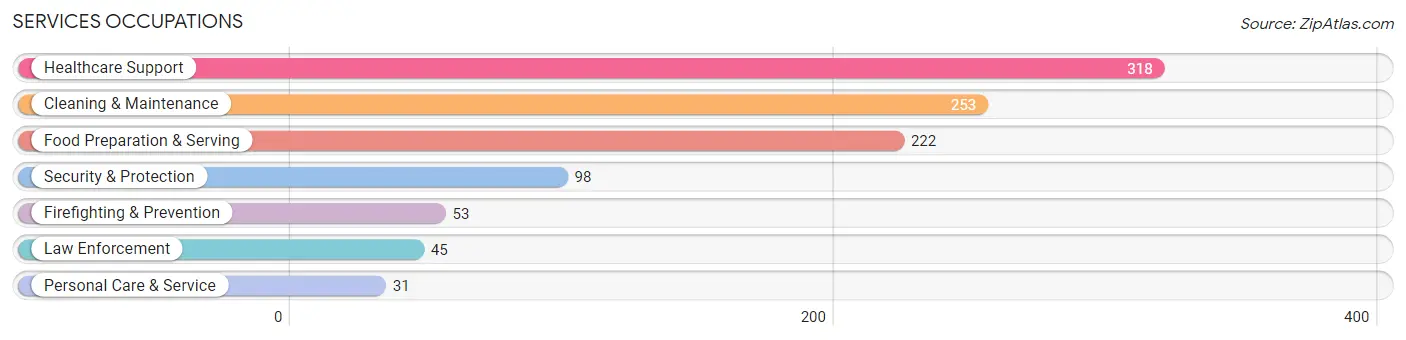
Services Occupations
The most common Services occupations in Shiprock are Healthcare Support (318 | 10.5%), Cleaning & Maintenance (253 | 8.4%), Food Preparation & Serving (222 | 7.4%), Security & Protection (98 | 3.3%), and Firefighting & Prevention (53 | 1.8%).
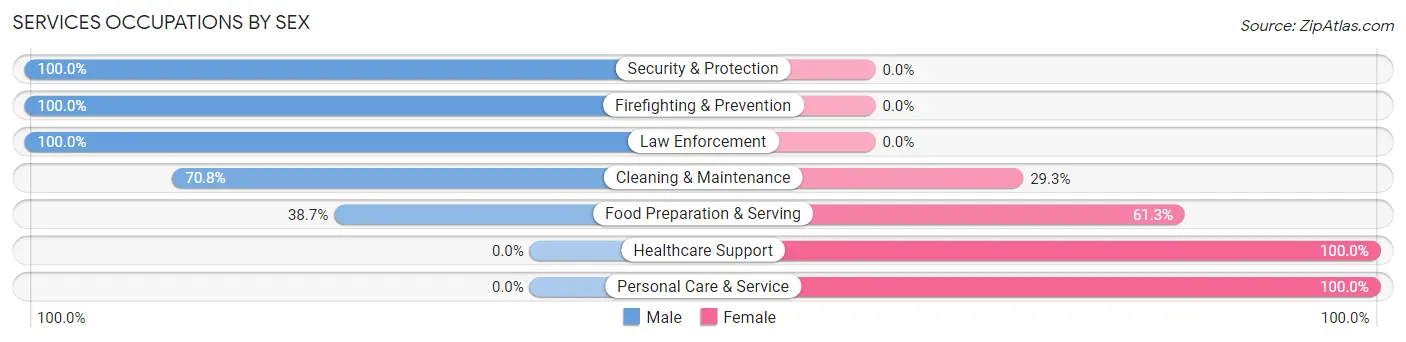
Services Occupations by Sex
Within the Services occupations in Shiprock, the most male-oriented occupations are Security & Protection (100.0%), Firefighting & Prevention (100.0%), and Law Enforcement (100.0%), while the most female-oriented occupations are Healthcare Support (100.0%), Personal Care & Service (100.0%), and Food Preparation & Serving (61.3%).
| Occupation | Male | Female |
| Healthcare Support | 0 (0.0%) | 318 (100.0%) |
| Security & Protection | 98 (100.0%) | 0 (0.0%) |
| Firefighting & Prevention | 53 (100.0%) | 0 (0.0%) |
| Law Enforcement | 45 (100.0%) | 0 (0.0%) |
| Food Preparation & Serving | 86 (38.7%) | 136 (61.3%) |
| Cleaning & Maintenance | 179 (70.8%) | 74 (29.2%) |
| Personal Care & Service | 0 (0.0%) | 31 (100.0%) |
| Total (Category) | 363 (39.4%) | 559 (60.6%) |
| Total (Overall) | 1,171 (38.8%) | 1,846 (61.2%) |
Sales and Office Occupations
The most common Sales and Office occupations in Shiprock are Office & Administration (420 | 13.9%), and Sales & Related (217 | 7.2%).
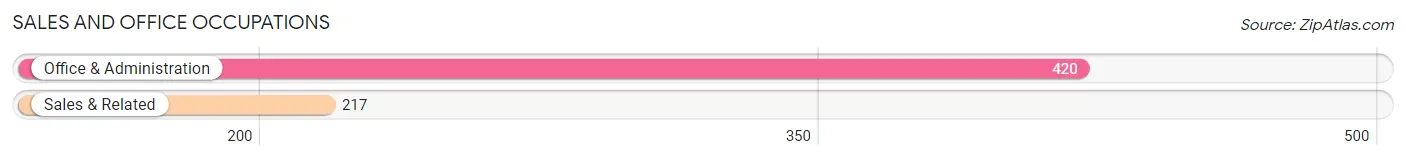
Sales and Office Occupations by Sex

| Occupation | Male | Female |
| Sales & Related | 43 (19.8%) | 174 (80.2%) |
| Office & Administration | 63 (15.0%) | 357 (85.0%) |
| Total (Category) | 106 (16.6%) | 531 (83.4%) |
| Total (Overall) | 1,171 (38.8%) | 1,846 (61.2%) |
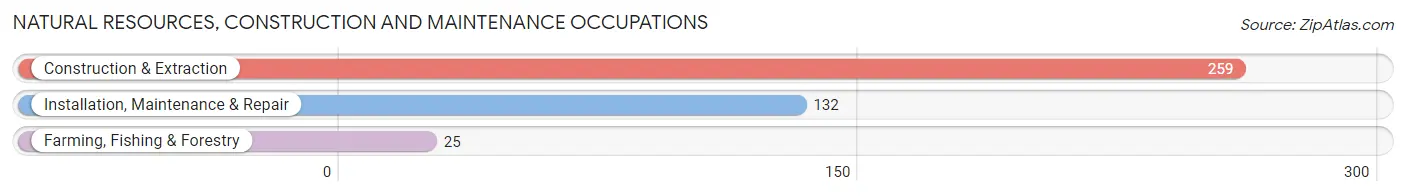
Natural Resources, Construction and Maintenance Occupations
The most common Natural Resources, Construction and Maintenance occupations in Shiprock are Construction & Extraction (259 | 8.6%), Installation, Maintenance & Repair (132 | 4.4%), and Farming, Fishing & Forestry (25 | 0.8%).
Natural Resources, Construction and Maintenance Occupations by Sex
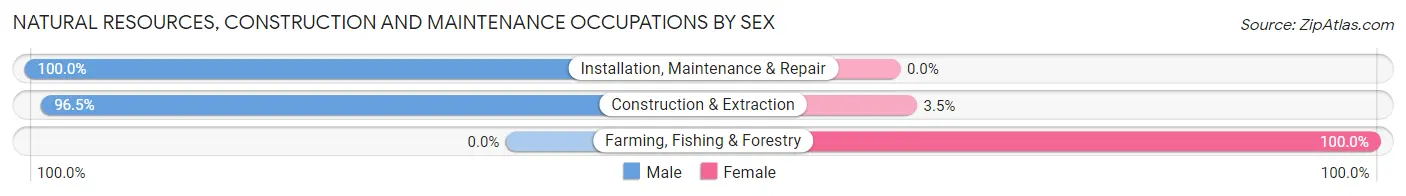
| Occupation | Male | Female |
| Farming, Fishing & Forestry | 0 (0.0%) | 25 (100.0%) |
| Construction & Extraction | 250 (96.5%) | 9 (3.5%) |
| Installation, Maintenance & Repair | 132 (100.0%) | 0 (0.0%) |
| Total (Category) | 382 (91.8%) | 34 (8.2%) |
| Total (Overall) | 1,171 (38.8%) | 1,846 (61.2%) |
Production, Transportation and Moving Occupations
The most common Production, Transportation and Moving occupations in Shiprock are Transportation (142 | 4.7%), Production (99 | 3.3%), and Material Moving (59 | 2.0%).
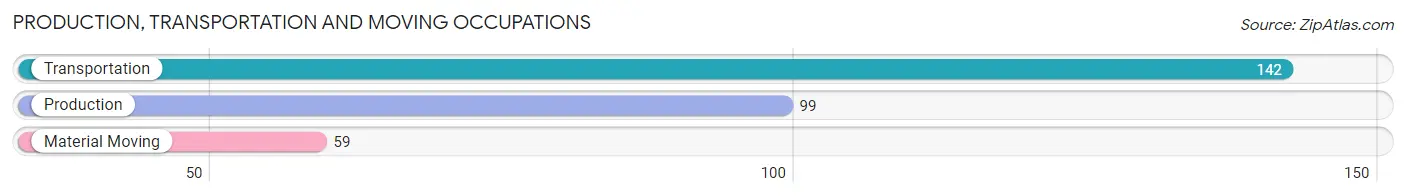
Production, Transportation and Moving Occupations by Sex
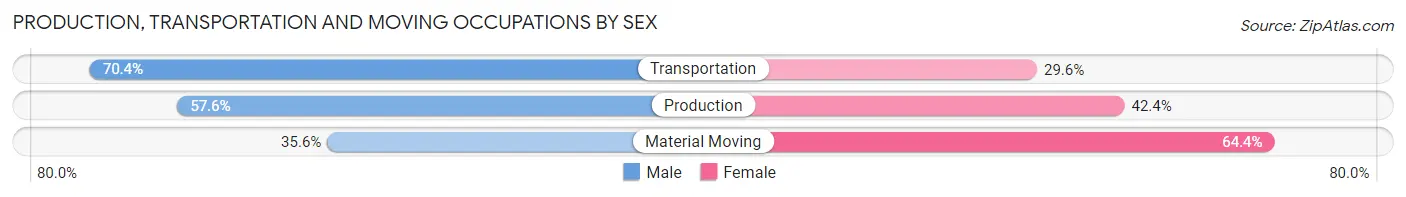
| Occupation | Male | Female |
| Production | 57 (57.6%) | 42 (42.4%) |
| Transportation | 100 (70.4%) | 42 (29.6%) |
| Material Moving | 21 (35.6%) | 38 (64.4%) |
| Total (Category) | 178 (59.3%) | 122 (40.7%) |
| Total (Overall) | 1,171 (38.8%) | 1,846 (61.2%) |
Employment Industries by Sex in Shiprock
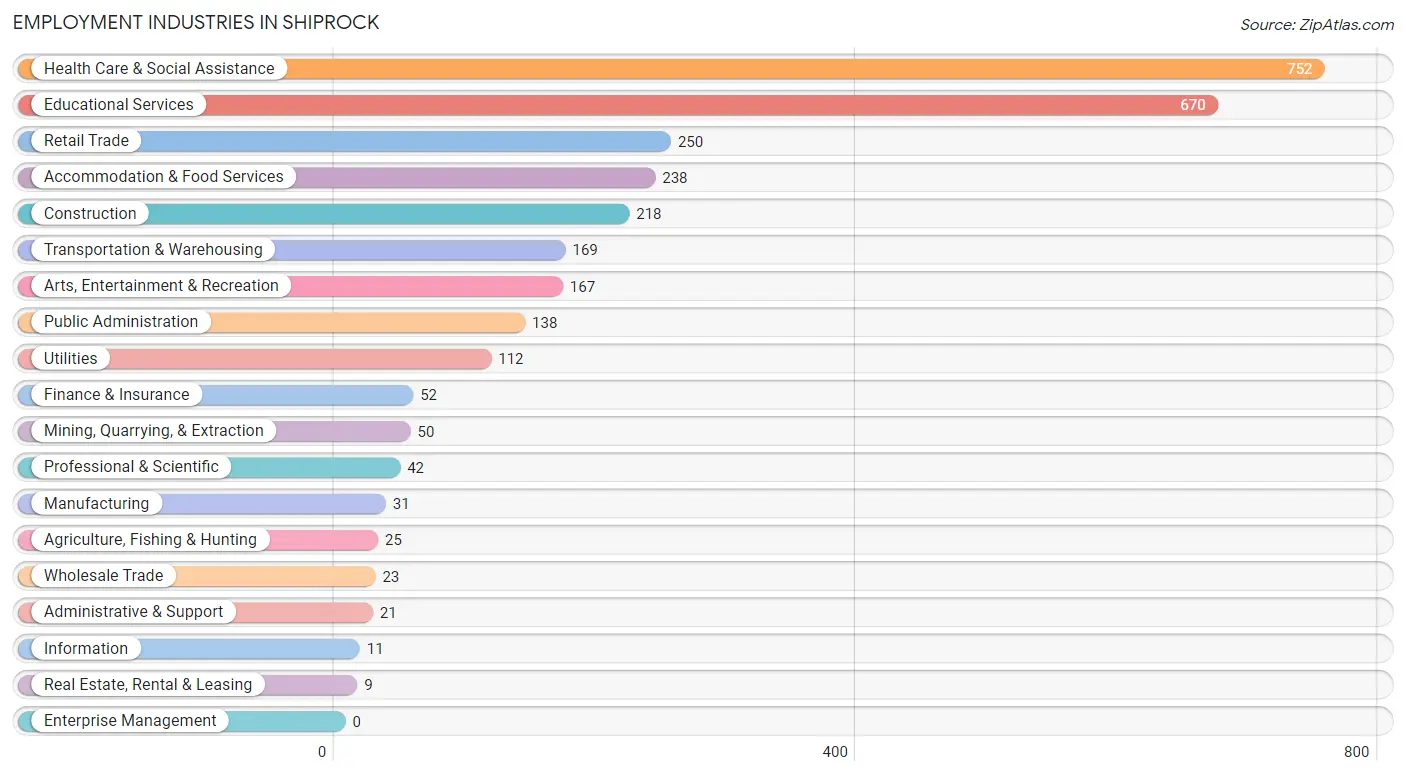
Employment Industries in Shiprock
The major employment industries in Shiprock include Health Care & Social Assistance (752 | 24.9%), Educational Services (670 | 22.2%), Retail Trade (250 | 8.3%), Accommodation & Food Services (238 | 7.9%), and Construction (218 | 7.2%).
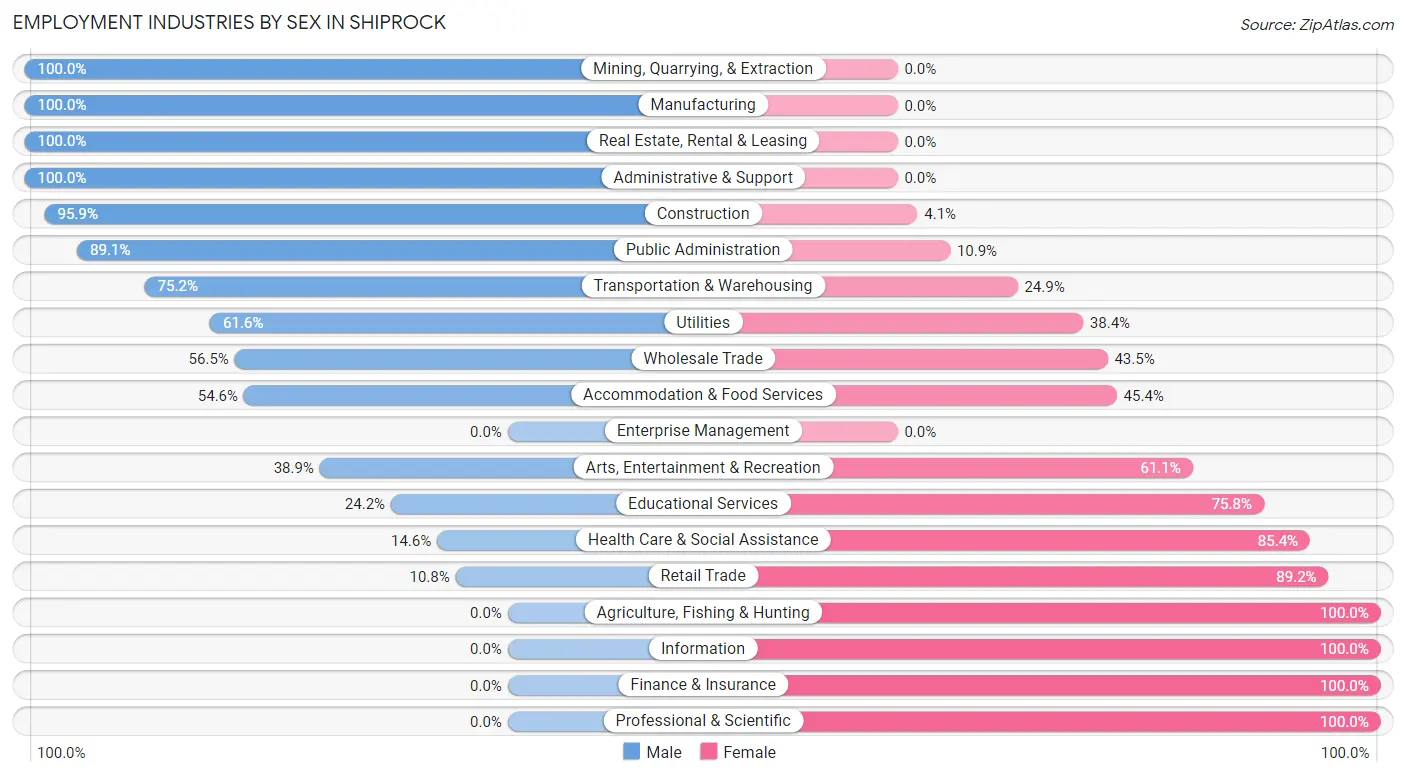
Employment Industries by Sex in Shiprock
The Shiprock industries that see more men than women are Mining, Quarrying, & Extraction (100.0%), Manufacturing (100.0%), and Real Estate, Rental & Leasing (100.0%), whereas the industries that tend to have a higher number of women are Agriculture, Fishing & Hunting (100.0%), Information (100.0%), and Finance & Insurance (100.0%).
| Industry | Male | Female |
| Agriculture, Fishing & Hunting | 0 (0.0%) | 25 (100.0%) |
| Mining, Quarrying, & Extraction | 50 (100.0%) | 0 (0.0%) |
| Construction | 209 (95.9%) | 9 (4.1%) |
| Manufacturing | 31 (100.0%) | 0 (0.0%) |
| Wholesale Trade | 13 (56.5%) | 10 (43.5%) |
| Retail Trade | 27 (10.8%) | 223 (89.2%) |
| Transportation & Warehousing | 127 (75.1%) | 42 (24.8%) |
| Utilities | 69 (61.6%) | 43 (38.4%) |
| Information | 0 (0.0%) | 11 (100.0%) |
| Finance & Insurance | 0 (0.0%) | 52 (100.0%) |
| Real Estate, Rental & Leasing | 9 (100.0%) | 0 (0.0%) |
| Professional & Scientific | 0 (0.0%) | 42 (100.0%) |
| Enterprise Management | 0 (0.0%) | 0 (0.0%) |
| Administrative & Support | 21 (100.0%) | 0 (0.0%) |
| Educational Services | 162 (24.2%) | 508 (75.8%) |
| Health Care & Social Assistance | 110 (14.6%) | 642 (85.4%) |
| Arts, Entertainment & Recreation | 65 (38.9%) | 102 (61.1%) |
| Accommodation & Food Services | 130 (54.6%) | 108 (45.4%) |
| Public Administration | 123 (89.1%) | 15 (10.9%) |
| Total | 1,171 (38.8%) | 1,846 (61.2%) |
Education in Shiprock
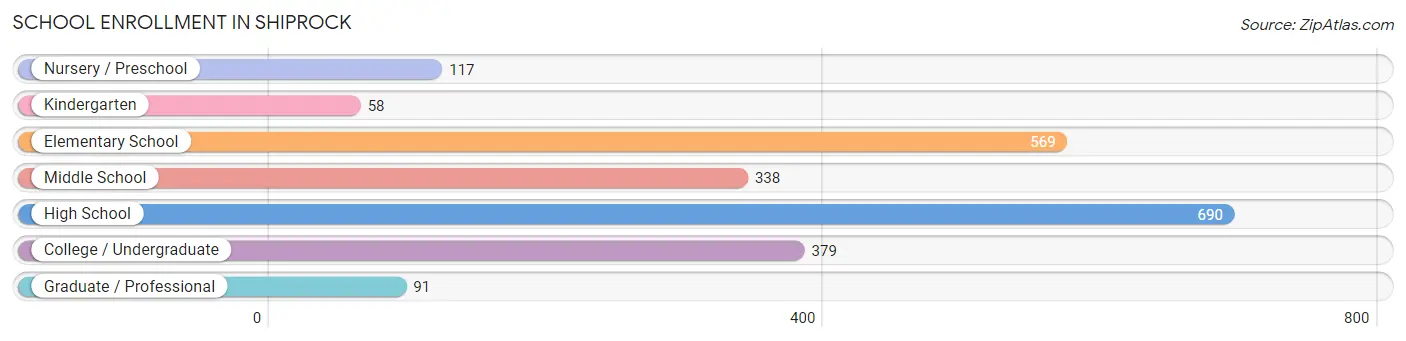
School Enrollment in Shiprock
The most common levels of schooling among the 2,242 students in Shiprock are high school (690 | 30.8%), elementary school (569 | 25.4%), and college / undergraduate (379 | 16.9%).
| School Level | # Students | % Students |
| Nursery / Preschool | 117 | 5.2% |
| Kindergarten | 58 | 2.6% |
| Elementary School | 569 | 25.4% |
| Middle School | 338 | 15.1% |
| High School | 690 | 30.8% |
| College / Undergraduate | 379 | 16.9% |
| Graduate / Professional | 91 | 4.1% |
| Total | 2,242 | 100.0% |
School Enrollment by Age by Funding Source in Shiprock
Out of a total of 2,242 students who are enrolled in schools in Shiprock, 217 (9.7%) attend a private institution, while the remaining 2,025 (90.3%) are enrolled in public schools. The age group of 10 to 14 year olds has the highest likelihood of being enrolled in private schools, with 75 (16.2% in the age bracket) enrolled. Conversely, the age group of 3 to 4 year olds has the lowest likelihood of being enrolled in a private school, with 78 (100.0% in the age bracket) attending a public institution.
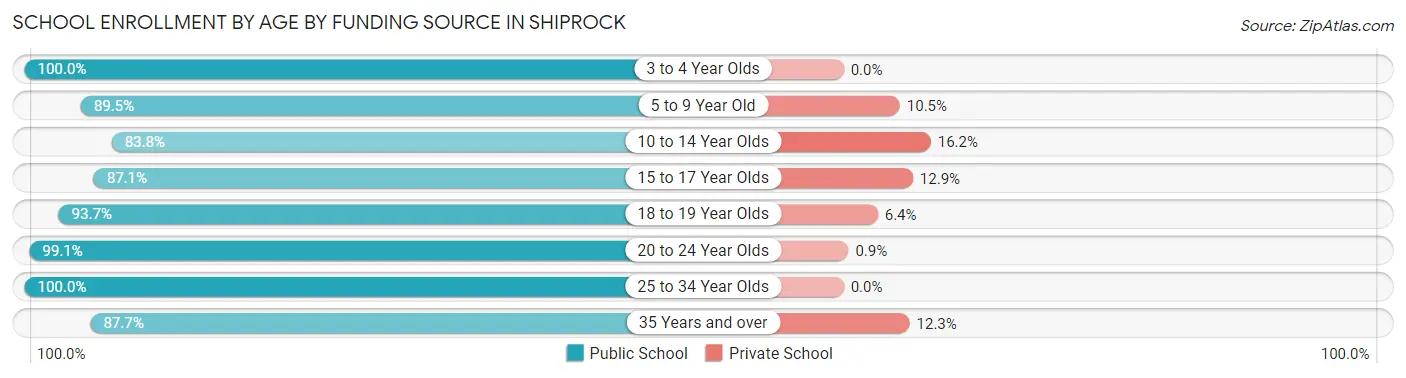
| Age Bracket | Public School | Private School |
| 3 to 4 Year Olds | 78 (100.0%) | 0 (0.0%) |
| 5 to 9 Year Old | 496 (89.5%) | 58 (10.5%) |
| 10 to 14 Year Olds | 387 (83.8%) | 75 (16.2%) |
| 15 to 17 Year Olds | 412 (87.1%) | 61 (12.9%) |
| 18 to 19 Year Olds | 236 (93.6%) | 16 (6.4%) |
| 20 to 24 Year Olds | 110 (99.1%) | 1 (0.9%) |
| 25 to 34 Year Olds | 255 (100.0%) | 0 (0.0%) |
| 35 Years and over | 50 (87.7%) | 7 (12.3%) |
| Total | 2,025 (90.3%) | 217 (9.7%) |
Educational Attainment by Field of Study in Shiprock
Psychology (140 | 21.2%), education (105 | 15.9%), social sciences (87 | 13.2%), science & technology (82 | 12.4%), and bio, nature & agricultural (74 | 11.2%) are the most common fields of study among 660 individuals in Shiprock who have obtained a bachelor's degree or higher.
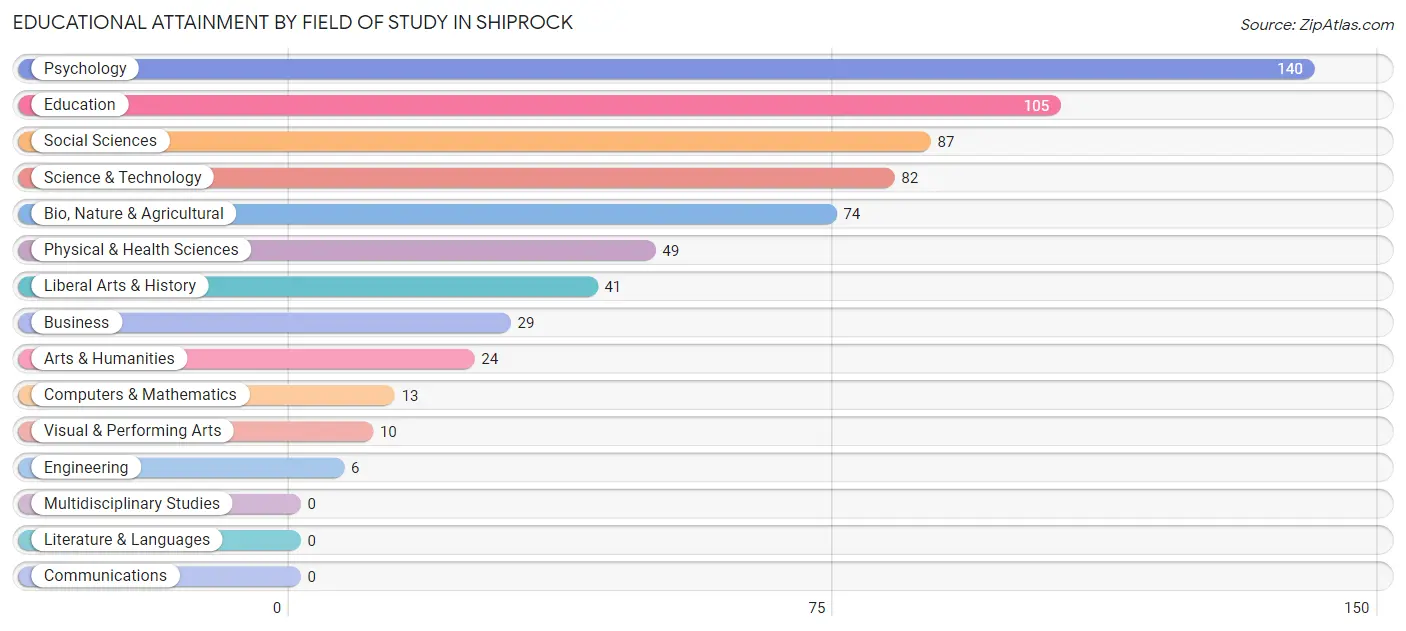
| Field of Study | # Graduates | % Graduates |
| Computers & Mathematics | 13 | 2.0% |
| Bio, Nature & Agricultural | 74 | 11.2% |
| Physical & Health Sciences | 49 | 7.4% |
| Psychology | 140 | 21.2% |
| Social Sciences | 87 | 13.2% |
| Engineering | 6 | 0.9% |
| Multidisciplinary Studies | 0 | 0.0% |
| Science & Technology | 82 | 12.4% |
| Business | 29 | 4.4% |
| Education | 105 | 15.9% |
| Literature & Languages | 0 | 0.0% |
| Liberal Arts & History | 41 | 6.2% |
| Visual & Performing Arts | 10 | 1.5% |
| Communications | 0 | 0.0% |
| Arts & Humanities | 24 | 3.6% |
| Total | 660 | 100.0% |
Transportation & Commute in Shiprock
Vehicle Availability by Sex in Shiprock
The most prevalent vehicle ownership categories in Shiprock are males with 3 vehicles (353, accounting for 32.1%) and females with 3 vehicles (393, making up 20.0%).
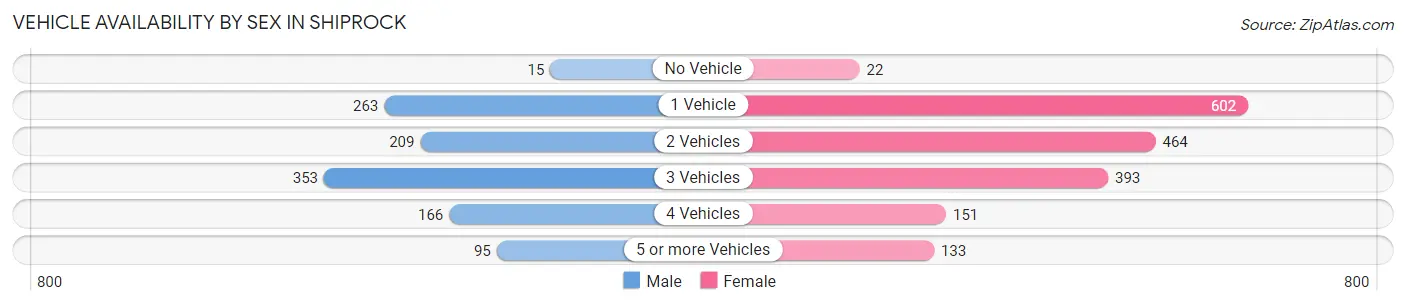
| Vehicles Available | Male | Female |
| No Vehicle | 15 (1.4%) | 22 (1.3%) |
| 1 Vehicle | 263 (23.9%) | 602 (34.1%) |
| 2 Vehicles | 209 (19.0%) | 464 (26.3%) |
| 3 Vehicles | 353 (32.1%) | 393 (22.3%) |
| 4 Vehicles | 166 (15.1%) | 151 (8.6%) |
| 5 or more Vehicles | 95 (8.6%) | 133 (7.5%) |
| Total | 1,101 (100.0%) | 1,765 (100.0%) |
Commute Time in Shiprock
The most frequently occuring commute durations in Shiprock are 5 to 9 minutes (549 commuters, 19.7%), 45 to 59 minutes (400 commuters, 14.3%), and 10 to 14 minutes (339 commuters, 12.1%).
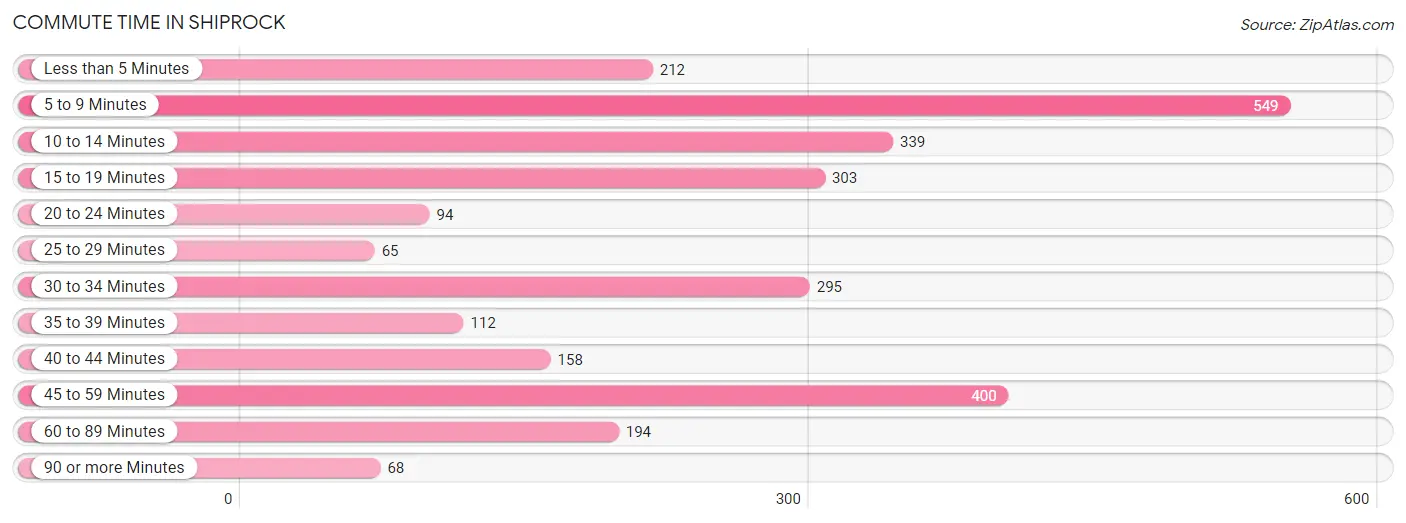
| Commute Time | # Commuters | % Commuters |
| Less than 5 Minutes | 212 | 7.6% |
| 5 to 9 Minutes | 549 | 19.7% |
| 10 to 14 Minutes | 339 | 12.1% |
| 15 to 19 Minutes | 303 | 10.9% |
| 20 to 24 Minutes | 94 | 3.4% |
| 25 to 29 Minutes | 65 | 2.3% |
| 30 to 34 Minutes | 295 | 10.6% |
| 35 to 39 Minutes | 112 | 4.0% |
| 40 to 44 Minutes | 158 | 5.7% |
| 45 to 59 Minutes | 400 | 14.3% |
| 60 to 89 Minutes | 194 | 7.0% |
| 90 or more Minutes | 68 | 2.4% |
Commute Time by Sex in Shiprock
The most common commute times in Shiprock are 5 to 9 minutes (183 commuters, 16.6%) for males and 5 to 9 minutes (366 commuters, 21.7%) for females.
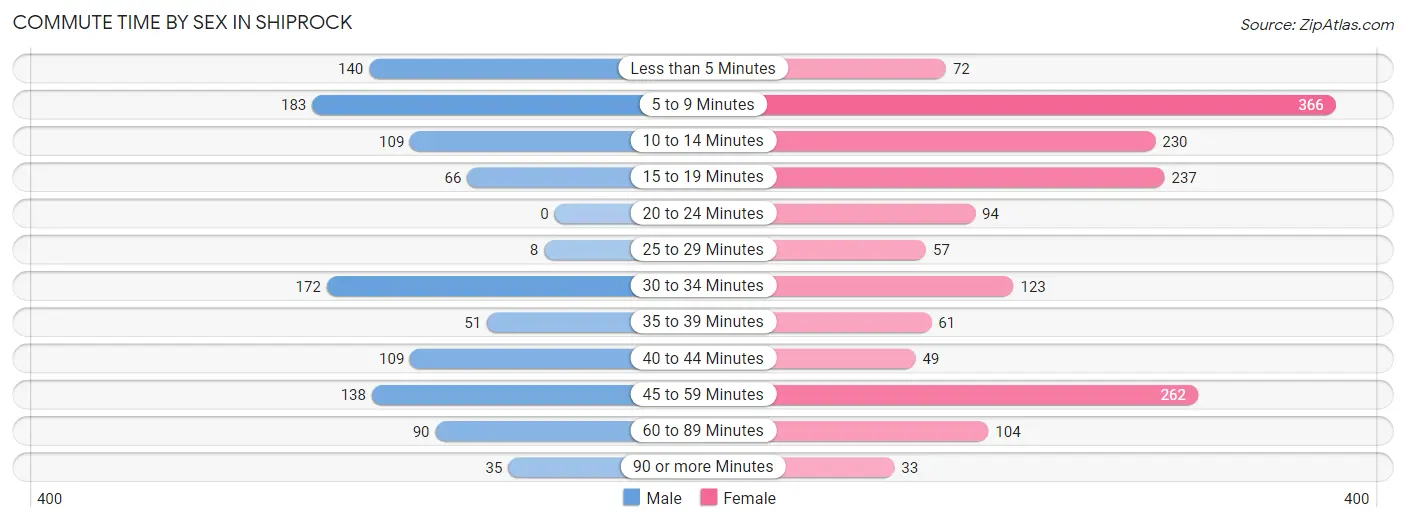
| Commute Time | Male | Female |
| Less than 5 Minutes | 140 (12.7%) | 72 (4.3%) |
| 5 to 9 Minutes | 183 (16.6%) | 366 (21.7%) |
| 10 to 14 Minutes | 109 (9.9%) | 230 (13.6%) |
| 15 to 19 Minutes | 66 (6.0%) | 237 (14.0%) |
| 20 to 24 Minutes | 0 (0.0%) | 94 (5.6%) |
| 25 to 29 Minutes | 8 (0.7%) | 57 (3.4%) |
| 30 to 34 Minutes | 172 (15.6%) | 123 (7.3%) |
| 35 to 39 Minutes | 51 (4.6%) | 61 (3.6%) |
| 40 to 44 Minutes | 109 (9.9%) | 49 (2.9%) |
| 45 to 59 Minutes | 138 (12.5%) | 262 (15.5%) |
| 60 to 89 Minutes | 90 (8.2%) | 104 (6.2%) |
| 90 or more Minutes | 35 (3.2%) | 33 (1.9%) |
Time of Departure to Work by Sex in Shiprock
The most frequent times of departure to work in Shiprock are 7:30 AM to 7:59 AM (215, 19.5%) for males and 6:30 AM to 6:59 AM (454, 26.9%) for females.
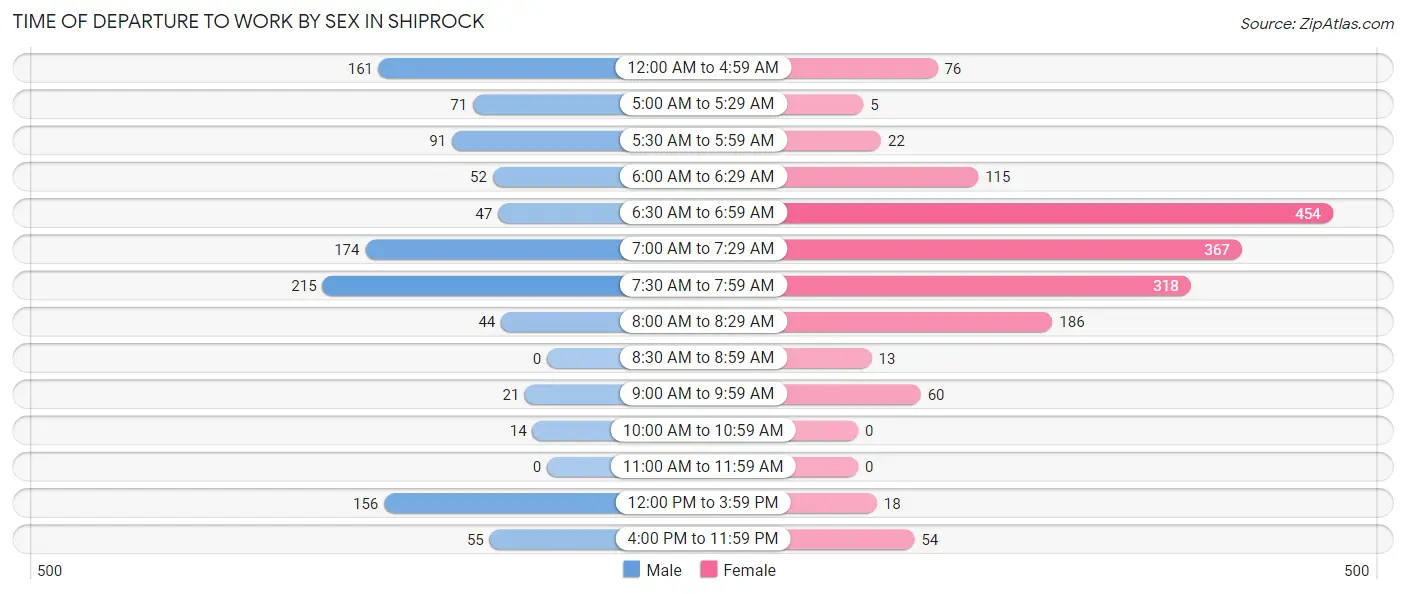
| Time of Departure | Male | Female |
| 12:00 AM to 4:59 AM | 161 (14.6%) | 76 (4.5%) |
| 5:00 AM to 5:29 AM | 71 (6.5%) | 5 (0.3%) |
| 5:30 AM to 5:59 AM | 91 (8.3%) | 22 (1.3%) |
| 6:00 AM to 6:29 AM | 52 (4.7%) | 115 (6.8%) |
| 6:30 AM to 6:59 AM | 47 (4.3%) | 454 (26.9%) |
| 7:00 AM to 7:29 AM | 174 (15.8%) | 367 (21.7%) |
| 7:30 AM to 7:59 AM | 215 (19.5%) | 318 (18.8%) |
| 8:00 AM to 8:29 AM | 44 (4.0%) | 186 (11.0%) |
| 8:30 AM to 8:59 AM | 0 (0.0%) | 13 (0.8%) |
| 9:00 AM to 9:59 AM | 21 (1.9%) | 60 (3.5%) |
| 10:00 AM to 10:59 AM | 14 (1.3%) | 0 (0.0%) |
| 11:00 AM to 11:59 AM | 0 (0.0%) | 0 (0.0%) |
| 12:00 PM to 3:59 PM | 156 (14.2%) | 18 (1.1%) |
| 4:00 PM to 11:59 PM | 55 (5.0%) | 54 (3.2%) |
| Total | 1,101 (100.0%) | 1,688 (100.0%) |
Housing Occupancy in Shiprock
Occupancy by Ownership in Shiprock
Of the total 2,322 dwellings in Shiprock, owner-occupied units account for 1,221 (52.6%), while renter-occupied units make up 1,101 (47.4%).
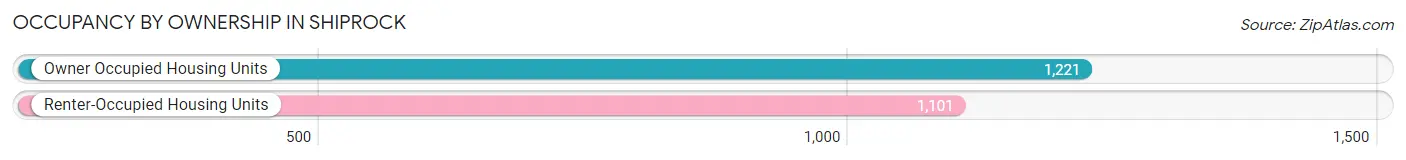
| Occupancy | # Housing Units | % Housing Units |
| Owner Occupied Housing Units | 1,221 | 52.6% |
| Renter-Occupied Housing Units | 1,101 | 47.4% |
| Total Occupied Housing Units | 2,322 | 100.0% |
Occupancy by Household Size in Shiprock
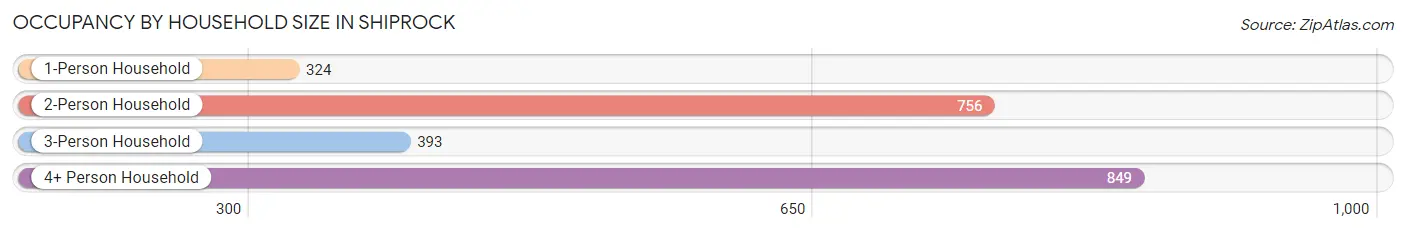
| Household Size | # Housing Units | % Housing Units |
| 1-Person Household | 324 | 14.0% |
| 2-Person Household | 756 | 32.6% |
| 3-Person Household | 393 | 16.9% |
| 4+ Person Household | 849 | 36.6% |
| Total Housing Units | 2,322 | 100.0% |
Occupancy by Ownership by Household Size in Shiprock
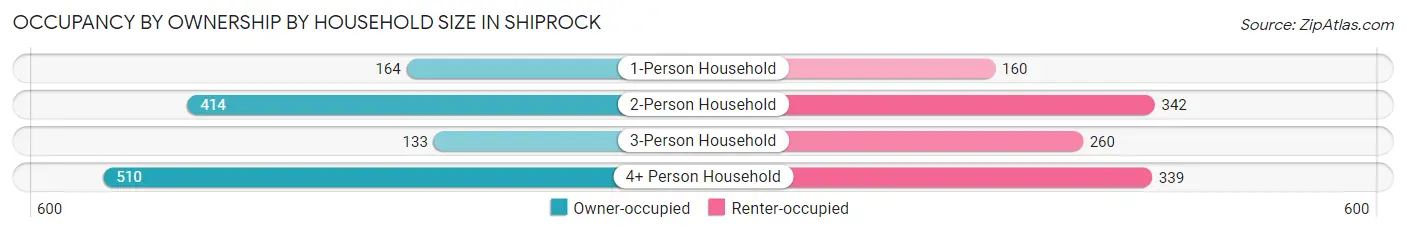
| Household Size | Owner-occupied | Renter-occupied |
| 1-Person Household | 164 (50.6%) | 160 (49.4%) |
| 2-Person Household | 414 (54.8%) | 342 (45.2%) |
| 3-Person Household | 133 (33.8%) | 260 (66.2%) |
| 4+ Person Household | 510 (60.1%) | 339 (39.9%) |
| Total Housing Units | 1,221 (52.6%) | 1,101 (47.4%) |
Occupancy by Educational Attainment in Shiprock
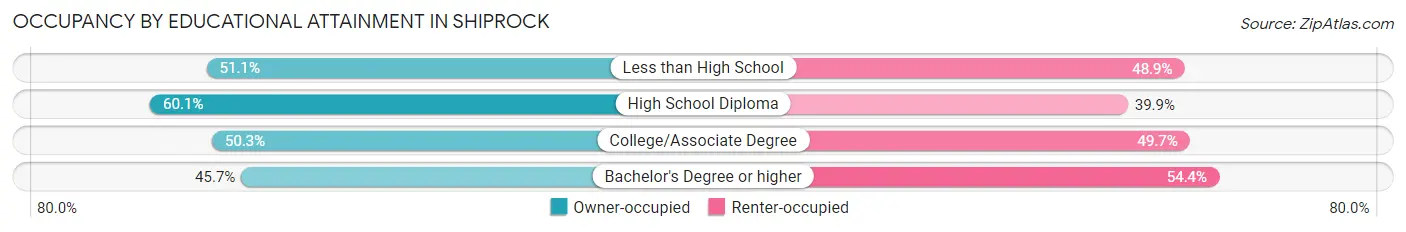
| Household Size | Owner-occupied | Renter-occupied |
| Less than High School | 179 (51.1%) | 171 (48.9%) |
| High School Diploma | 387 (60.1%) | 257 (39.9%) |
| College/Associate Degree | 529 (50.3%) | 523 (49.7%) |
| Bachelor's Degree or higher | 126 (45.7%) | 150 (54.3%) |
Occupancy by Age of Householder in Shiprock
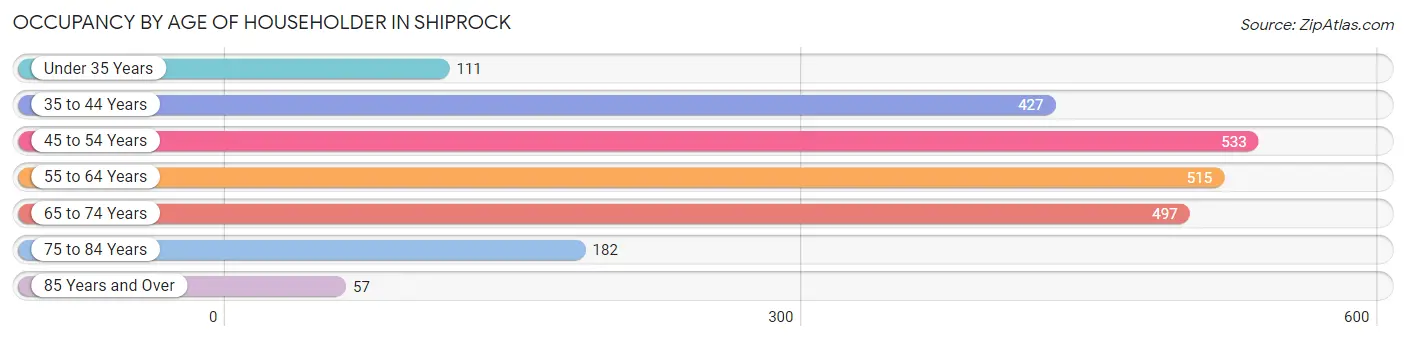
| Age Bracket | # Households | % Households |
| Under 35 Years | 111 | 4.8% |
| 35 to 44 Years | 427 | 18.4% |
| 45 to 54 Years | 533 | 23.0% |
| 55 to 64 Years | 515 | 22.2% |
| 65 to 74 Years | 497 | 21.4% |
| 75 to 84 Years | 182 | 7.8% |
| 85 Years and Over | 57 | 2.5% |
| Total | 2,322 | 100.0% |
Housing Finances in Shiprock
Median Income by Occupancy in Shiprock
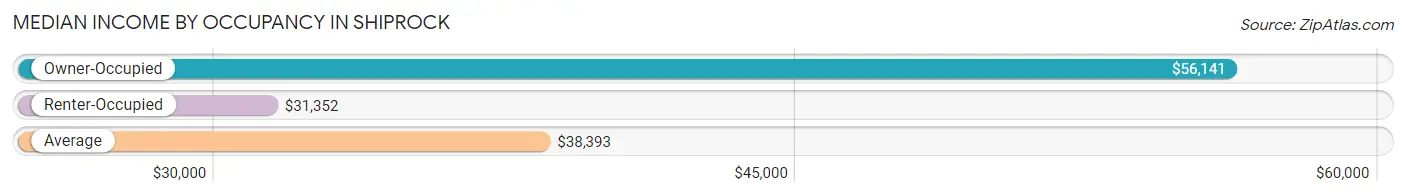
| Occupancy Type | # Households | Median Income |
| Owner-Occupied | 1,221 (52.6%) | $56,141 |
| Renter-Occupied | 1,101 (47.4%) | $31,352 |
| Average | 2,322 (100.0%) | $38,393 |
Occupancy by Householder Income Bracket in Shiprock
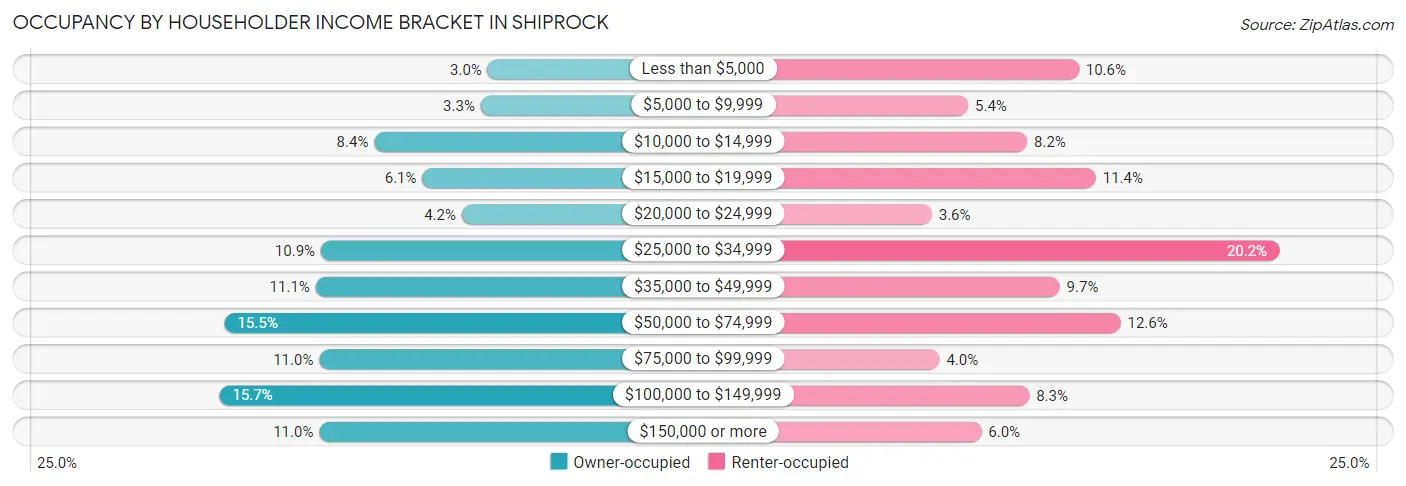
| Income Bracket | Owner-occupied | Renter-occupied |
| Less than $5,000 | 36 (2.9%) | 117 (10.6%) |
| $5,000 to $9,999 | 40 (3.3%) | 59 (5.4%) |
| $10,000 to $14,999 | 102 (8.4%) | 90 (8.2%) |
| $15,000 to $19,999 | 74 (6.1%) | 126 (11.4%) |
| $20,000 to $24,999 | 51 (4.2%) | 40 (3.6%) |
| $25,000 to $34,999 | 133 (10.9%) | 222 (20.2%) |
| $35,000 to $49,999 | 136 (11.1%) | 107 (9.7%) |
| $50,000 to $74,999 | 189 (15.5%) | 139 (12.6%) |
| $75,000 to $99,999 | 134 (11.0%) | 44 (4.0%) |
| $100,000 to $149,999 | 192 (15.7%) | 91 (8.3%) |
| $150,000 or more | 134 (11.0%) | 66 (6.0%) |
| Total | 1,221 (100.0%) | 1,101 (100.0%) |
Monthly Housing Cost Tiers in Shiprock
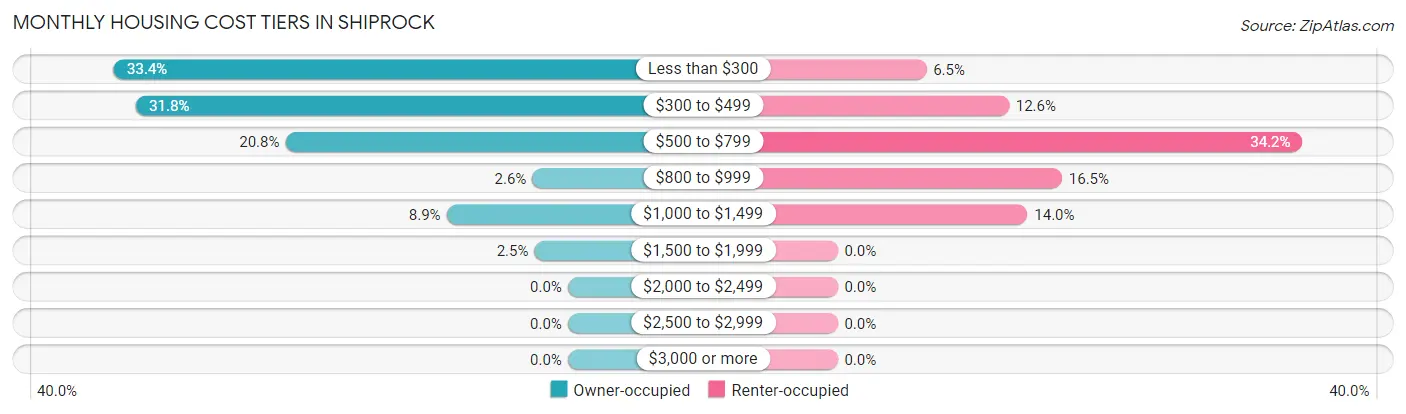
| Monthly Cost | Owner-occupied | Renter-occupied |
| Less than $300 | 408 (33.4%) | 72 (6.5%) |
| $300 to $499 | 388 (31.8%) | 139 (12.6%) |
| $500 to $799 | 254 (20.8%) | 377 (34.2%) |
| $800 to $999 | 32 (2.6%) | 182 (16.5%) |
| $1,000 to $1,499 | 109 (8.9%) | 154 (14.0%) |
| $1,500 to $1,999 | 30 (2.5%) | 0 (0.0%) |
| $2,000 to $2,499 | 0 (0.0%) | 0 (0.0%) |
| $2,500 to $2,999 | 0 (0.0%) | 0 (0.0%) |
| $3,000 or more | 0 (0.0%) | 0 (0.0%) |
| Total | 1,221 (100.0%) | 1,101 (100.0%) |
Physical Housing Characteristics in Shiprock
Housing Structures in Shiprock
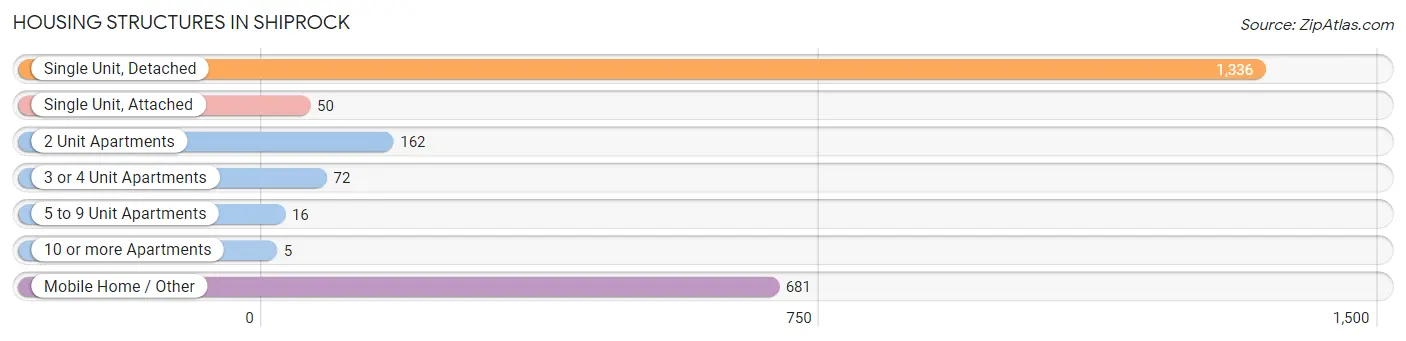
| Structure Type | # Housing Units | % Housing Units |
| Single Unit, Detached | 1,336 | 57.5% |
| Single Unit, Attached | 50 | 2.1% |
| 2 Unit Apartments | 162 | 7.0% |
| 3 or 4 Unit Apartments | 72 | 3.1% |
| 5 to 9 Unit Apartments | 16 | 0.7% |
| 10 or more Apartments | 5 | 0.2% |
| Mobile Home / Other | 681 | 29.3% |
| Total | 2,322 | 100.0% |
Housing Structures by Occupancy in Shiprock
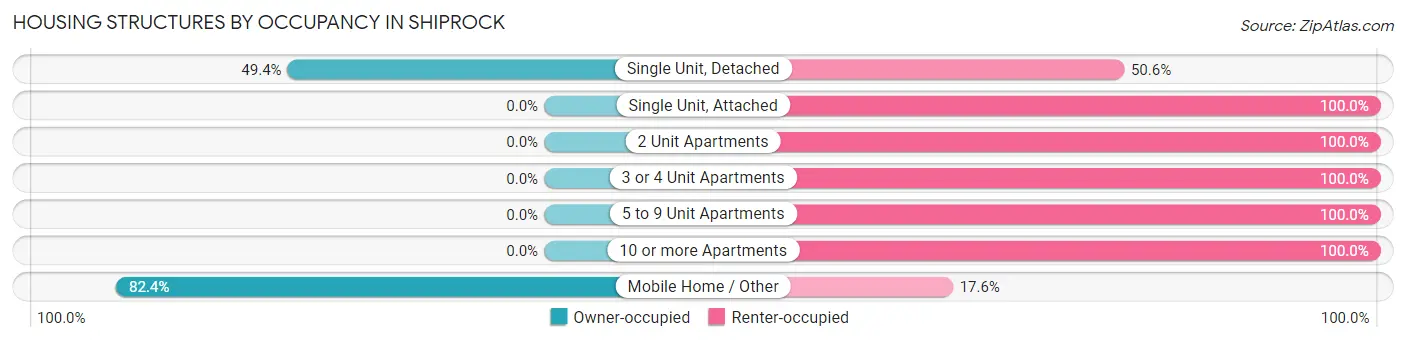
| Structure Type | Owner-occupied | Renter-occupied |
| Single Unit, Detached | 660 (49.4%) | 676 (50.6%) |
| Single Unit, Attached | 0 (0.0%) | 50 (100.0%) |
| 2 Unit Apartments | 0 (0.0%) | 162 (100.0%) |
| 3 or 4 Unit Apartments | 0 (0.0%) | 72 (100.0%) |
| 5 to 9 Unit Apartments | 0 (0.0%) | 16 (100.0%) |
| 10 or more Apartments | 0 (0.0%) | 5 (100.0%) |
| Mobile Home / Other | 561 (82.4%) | 120 (17.6%) |
| Total | 1,221 (52.6%) | 1,101 (47.4%) |
Housing Structures by Number of Rooms in Shiprock
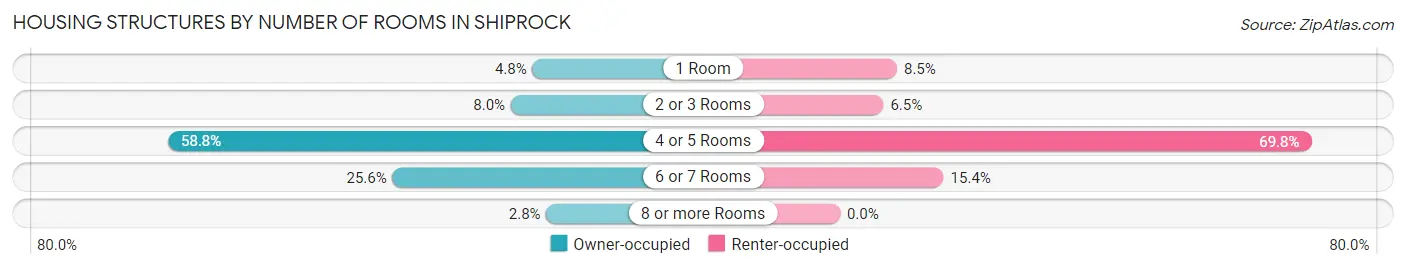
| Number of Rooms | Owner-occupied | Renter-occupied |
| 1 Room | 59 (4.8%) | 93 (8.5%) |
| 2 or 3 Rooms | 98 (8.0%) | 71 (6.5%) |
| 4 or 5 Rooms | 718 (58.8%) | 768 (69.8%) |
| 6 or 7 Rooms | 312 (25.6%) | 169 (15.3%) |
| 8 or more Rooms | 34 (2.8%) | 0 (0.0%) |
| Total | 1,221 (100.0%) | 1,101 (100.0%) |
Housing Structure by Heating Type in Shiprock
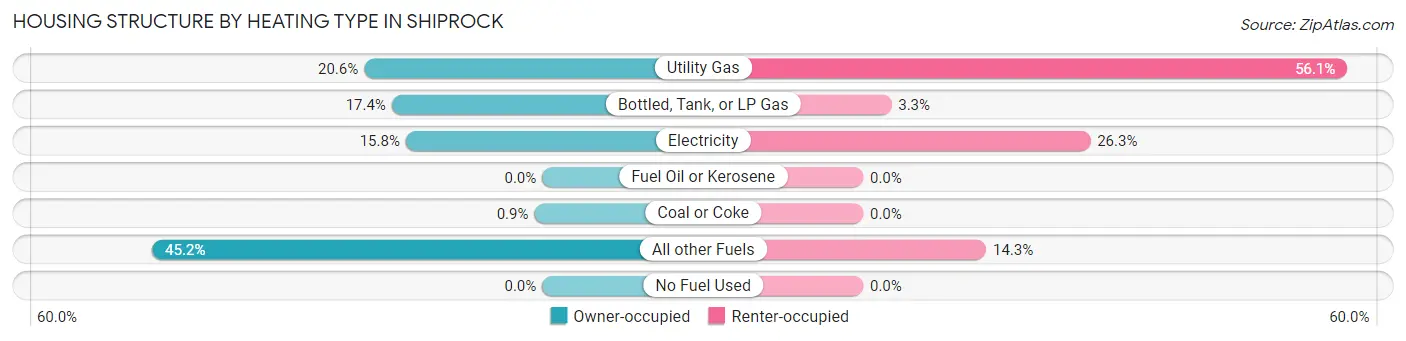
| Heating Type | Owner-occupied | Renter-occupied |
| Utility Gas | 252 (20.6%) | 618 (56.1%) |
| Bottled, Tank, or LP Gas | 213 (17.4%) | 36 (3.3%) |
| Electricity | 193 (15.8%) | 290 (26.3%) |
| Fuel Oil or Kerosene | 0 (0.0%) | 0 (0.0%) |
| Coal or Coke | 11 (0.9%) | 0 (0.0%) |
| All other Fuels | 552 (45.2%) | 157 (14.3%) |
| No Fuel Used | 0 (0.0%) | 0 (0.0%) |
| Total | 1,221 (100.0%) | 1,101 (100.0%) |
Household Vehicle Usage in Shiprock
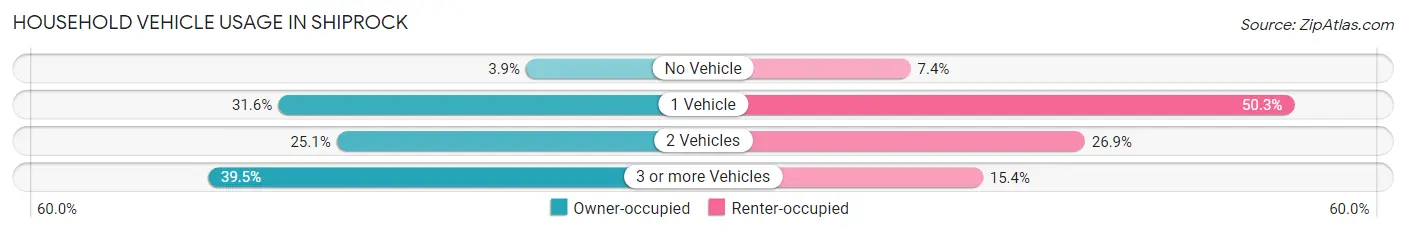
| Vehicles per Household | Owner-occupied | Renter-occupied |
| No Vehicle | 47 (3.8%) | 81 (7.4%) |
| 1 Vehicle | 386 (31.6%) | 554 (50.3%) |
| 2 Vehicles | 306 (25.1%) | 296 (26.9%) |
| 3 or more Vehicles | 482 (39.5%) | 170 (15.4%) |
| Total | 1,221 (100.0%) | 1,101 (100.0%) |
Real Estate & Mortgages in Shiprock
Real Estate and Mortgage Overview in Shiprock
| Characteristic | Without Mortgage | With Mortgage |
| Housing Units | 1,023 | 198 |
| Median Property Value | $90,800 | $0 |
| Median Household Income | $46,750 | $39 |
| Monthly Housing Costs | $365 | $0 |
| Real Estate Taxes | - | - |
Property Value by Mortgage Status in Shiprock
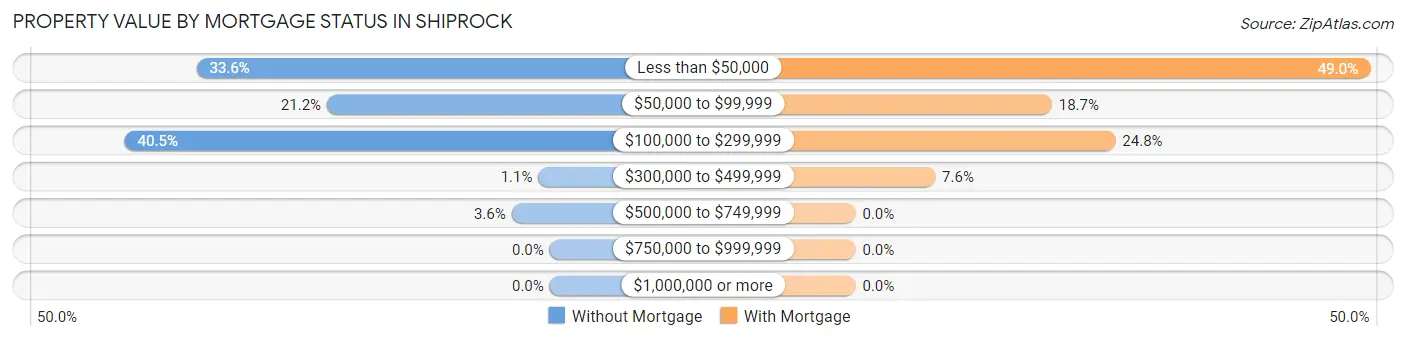
| Property Value | Without Mortgage | With Mortgage |
| Less than $50,000 | 344 (33.6%) | 97 (49.0%) |
| $50,000 to $99,999 | 217 (21.2%) | 37 (18.7%) |
| $100,000 to $299,999 | 414 (40.5%) | 49 (24.7%) |
| $300,000 to $499,999 | 11 (1.1%) | 15 (7.6%) |
| $500,000 to $749,999 | 37 (3.6%) | 0 (0.0%) |
| $750,000 to $999,999 | 0 (0.0%) | 0 (0.0%) |
| $1,000,000 or more | 0 (0.0%) | 0 (0.0%) |
| Total | 1,023 (100.0%) | 198 (100.0%) |
Household Income by Mortgage Status in Shiprock
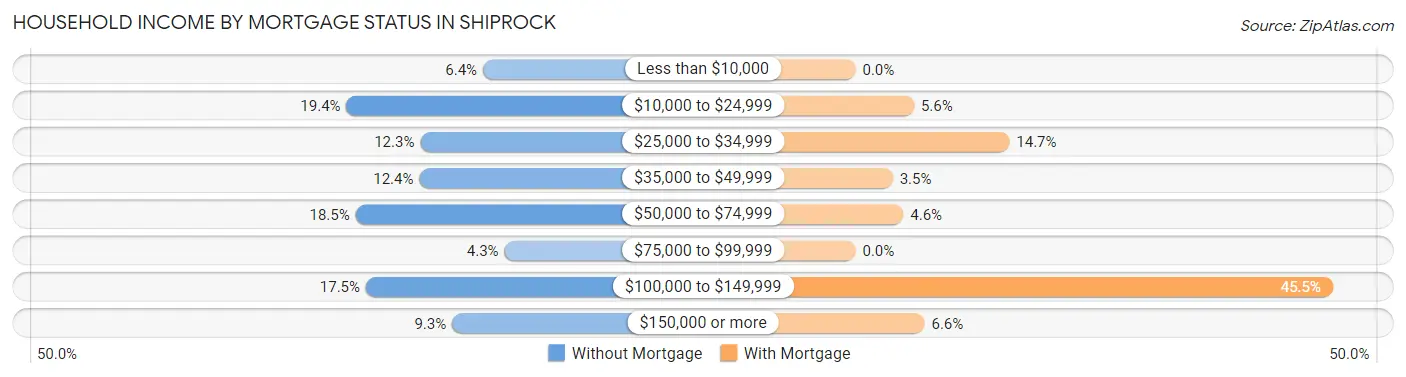
| Household Income | Without Mortgage | With Mortgage |
| Less than $10,000 | 65 (6.4%) | 0 (0.0%) |
| $10,000 to $24,999 | 198 (19.4%) | 11 (5.6%) |
| $25,000 to $34,999 | 126 (12.3%) | 29 (14.6%) |
| $35,000 to $49,999 | 127 (12.4%) | 7 (3.5%) |
| $50,000 to $74,999 | 189 (18.5%) | 9 (4.5%) |
| $75,000 to $99,999 | 44 (4.3%) | 0 (0.0%) |
| $100,000 to $149,999 | 179 (17.5%) | 90 (45.5%) |
| $150,000 or more | 95 (9.3%) | 13 (6.6%) |
| Total | 1,023 (100.0%) | 198 (100.0%) |
Property Value to Household Income Ratio in Shiprock
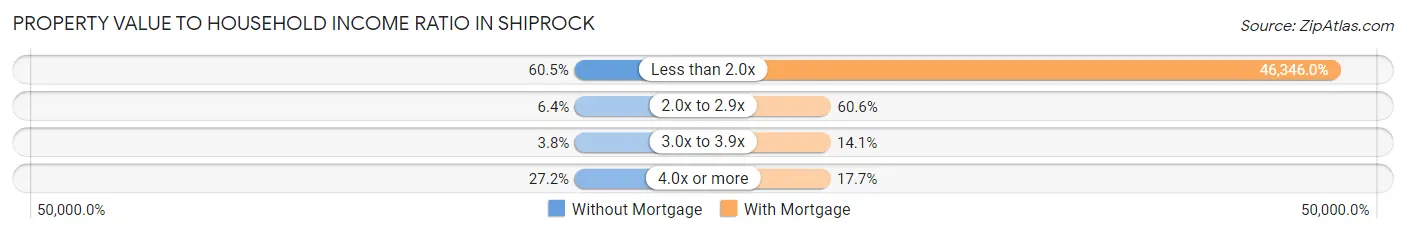
| Value-to-Income Ratio | Without Mortgage | With Mortgage |
| Less than 2.0x | 619 (60.5%) | 91,765 (46,346.0%) |
| 2.0x to 2.9x | 65 (6.4%) | 120 (60.6%) |
| 3.0x to 3.9x | 39 (3.8%) | 28 (14.1%) |
| 4.0x or more | 278 (27.2%) | 35 (17.7%) |
| Total | 1,023 (100.0%) | 198 (100.0%) |
Real Estate Taxes by Mortgage Status in Shiprock
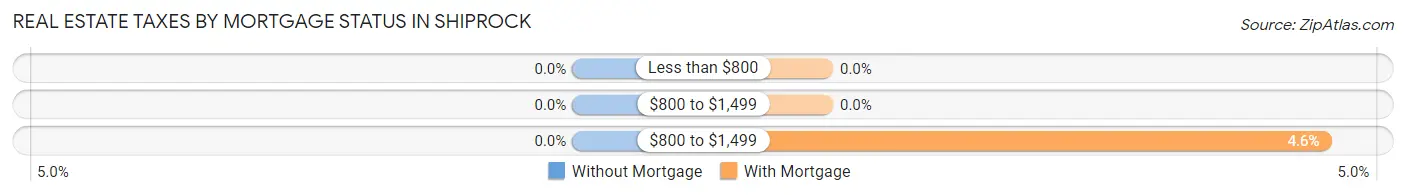
| Property Taxes | Without Mortgage | With Mortgage |
| Less than $800 | 0 (0.0%) | 0 (0.0%) |
| $800 to $1,499 | 0 (0.0%) | 0 (0.0%) |
| $800 to $1,499 | 0 (0.0%) | 9 (4.5%) |
| Total | 1,023 (100.0%) | 198 (100.0%) |
Health & Disability in Shiprock
Health Insurance Coverage by Age in Shiprock
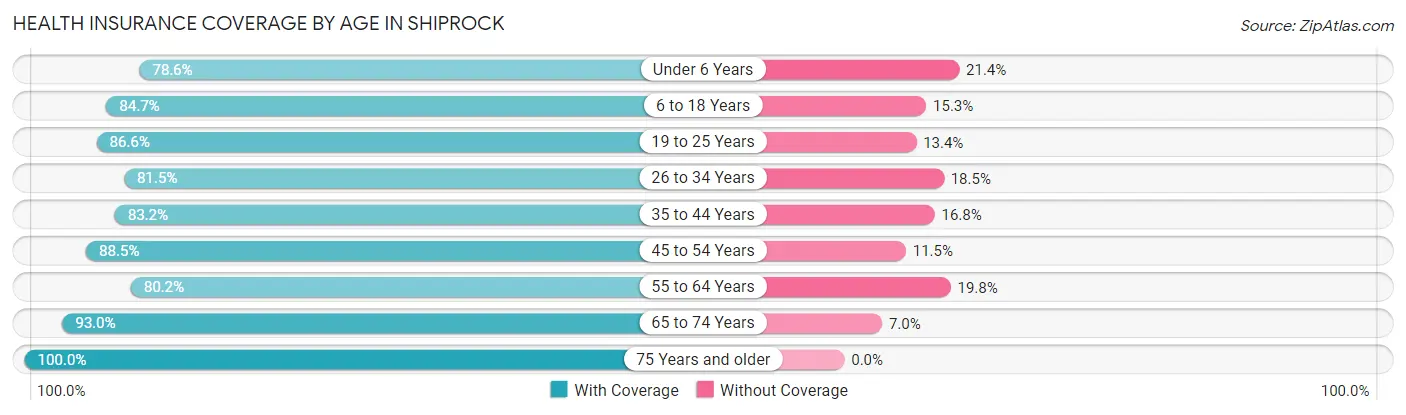
| Age Bracket | With Coverage | Without Coverage |
| Under 6 Years | 312 (78.6%) | 85 (21.4%) |
| 6 to 18 Years | 1,477 (84.7%) | 266 (15.3%) |
| 19 to 25 Years | 549 (86.6%) | 85 (13.4%) |
| 26 to 34 Years | 1,046 (81.5%) | 238 (18.5%) |
| 35 to 44 Years | 954 (83.2%) | 193 (16.8%) |
| 45 to 54 Years | 795 (88.5%) | 103 (11.5%) |
| 55 to 64 Years | 935 (80.2%) | 231 (19.8%) |
| 65 to 74 Years | 582 (93.0%) | 44 (7.0%) |
| 75 Years and older | 366 (100.0%) | 0 (0.0%) |
| Total | 7,016 (84.9%) | 1,245 (15.1%) |
Health Insurance Coverage by Citizenship Status in Shiprock
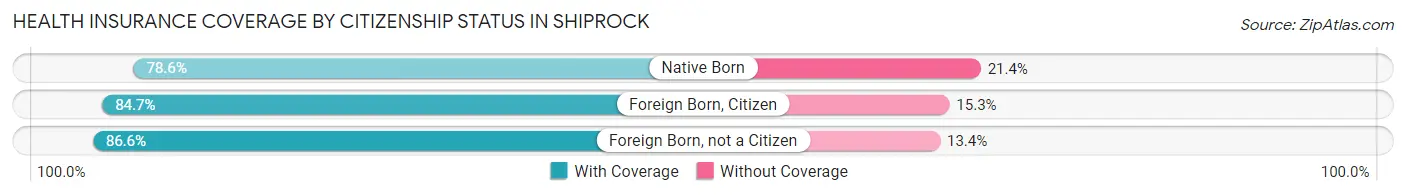
| Citizenship Status | With Coverage | Without Coverage |
| Native Born | 312 (78.6%) | 85 (21.4%) |
| Foreign Born, Citizen | 1,477 (84.7%) | 266 (15.3%) |
| Foreign Born, not a Citizen | 549 (86.6%) | 85 (13.4%) |
Health Insurance Coverage by Household Income in Shiprock
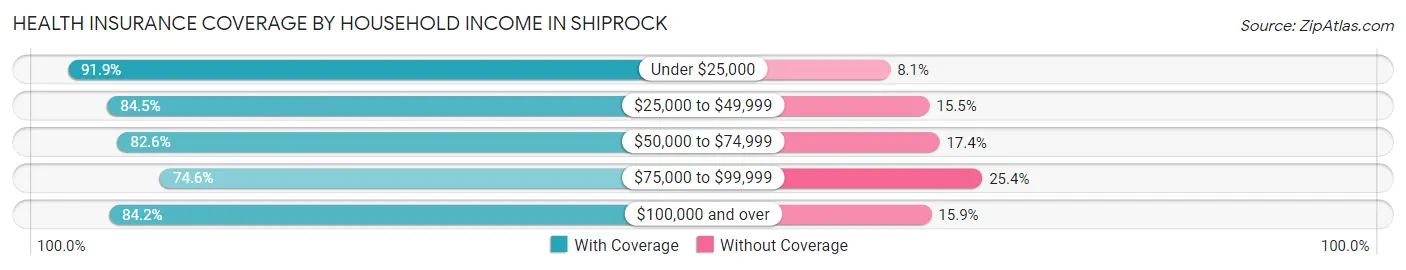
| Household Income | With Coverage | Without Coverage |
| Under $25,000 | 1,717 (91.9%) | 152 (8.1%) |
| $25,000 to $49,999 | 1,701 (84.5%) | 312 (15.5%) |
| $50,000 to $74,999 | 961 (82.6%) | 202 (17.4%) |
| $75,000 to $99,999 | 638 (74.6%) | 217 (25.4%) |
| $100,000 and over | 1,922 (84.2%) | 362 (15.9%) |
Public vs Private Health Insurance Coverage by Age in Shiprock
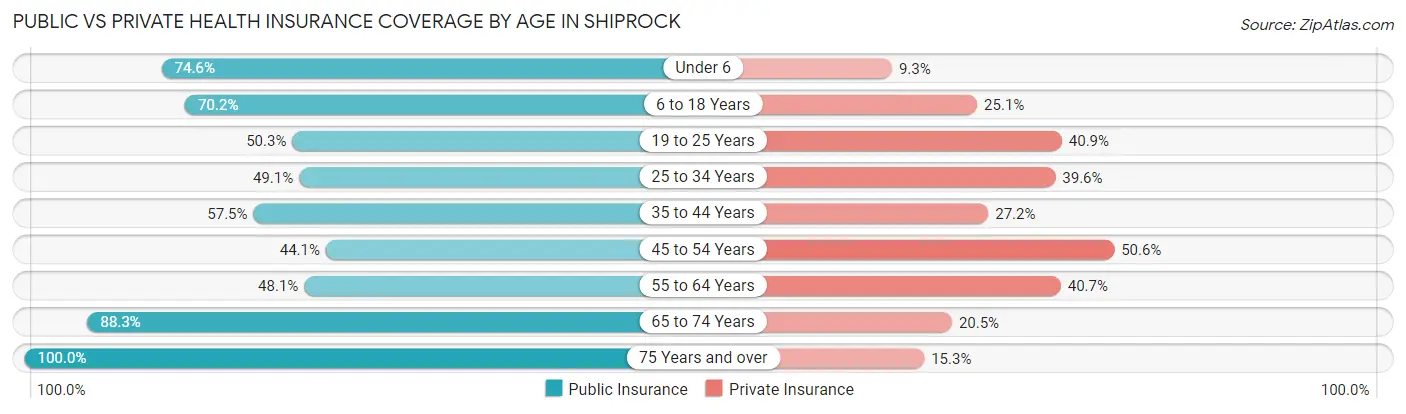
| Age Bracket | Public Insurance | Private Insurance |
| Under 6 | 296 (74.6%) | 37 (9.3%) |
| 6 to 18 Years | 1,224 (70.2%) | 438 (25.1%) |
| 19 to 25 Years | 319 (50.3%) | 259 (40.8%) |
| 25 to 34 Years | 630 (49.1%) | 509 (39.6%) |
| 35 to 44 Years | 660 (57.5%) | 312 (27.2%) |
| 45 to 54 Years | 396 (44.1%) | 454 (50.6%) |
| 55 to 64 Years | 561 (48.1%) | 474 (40.6%) |
| 65 to 74 Years | 553 (88.3%) | 128 (20.4%) |
| 75 Years and over | 366 (100.0%) | 56 (15.3%) |
| Total | 5,005 (60.6%) | 2,667 (32.3%) |
Disability Status by Sex by Age in Shiprock
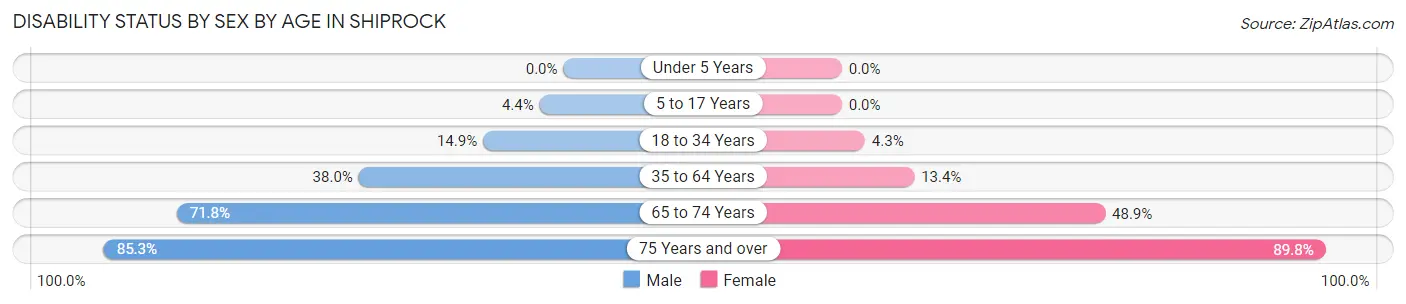
| Age Bracket | Male | Female |
| Under 5 Years | 0 (0.0%) | 0 (0.0%) |
| 5 to 17 Years | 45 (4.4%) | 0 (0.0%) |
| 18 to 34 Years | 134 (14.9%) | 54 (4.3%) |
| 35 to 64 Years | 601 (38.0%) | 219 (13.4%) |
| 65 to 74 Years | 226 (71.8%) | 152 (48.9%) |
| 75 Years and over | 87 (85.3%) | 237 (89.8%) |
Disability Class by Sex by Age in Shiprock
Disability Class: Hearing Difficulty
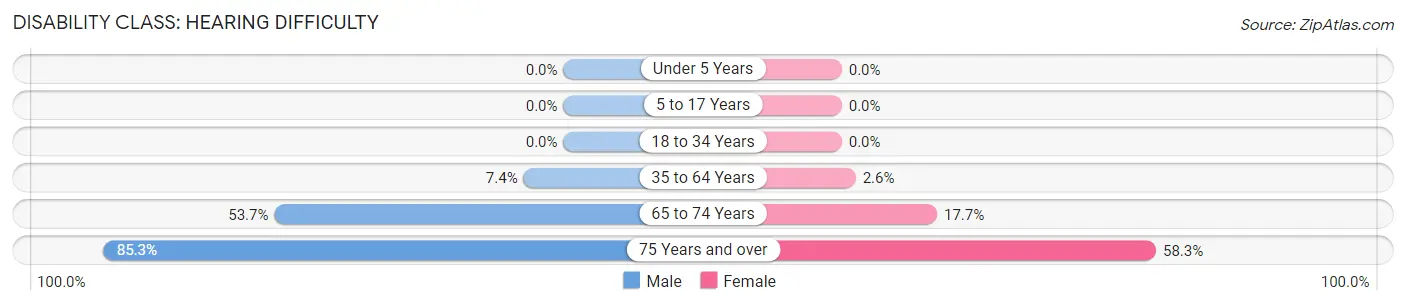
| Age Bracket | Male | Female |
| Under 5 Years | 0 (0.0%) | 0 (0.0%) |
| 5 to 17 Years | 0 (0.0%) | 0 (0.0%) |
| 18 to 34 Years | 0 (0.0%) | 0 (0.0%) |
| 35 to 64 Years | 117 (7.4%) | 42 (2.6%) |
| 65 to 74 Years | 169 (53.6%) | 55 (17.7%) |
| 75 Years and over | 87 (85.3%) | 154 (58.3%) |
Disability Class: Vision Difficulty
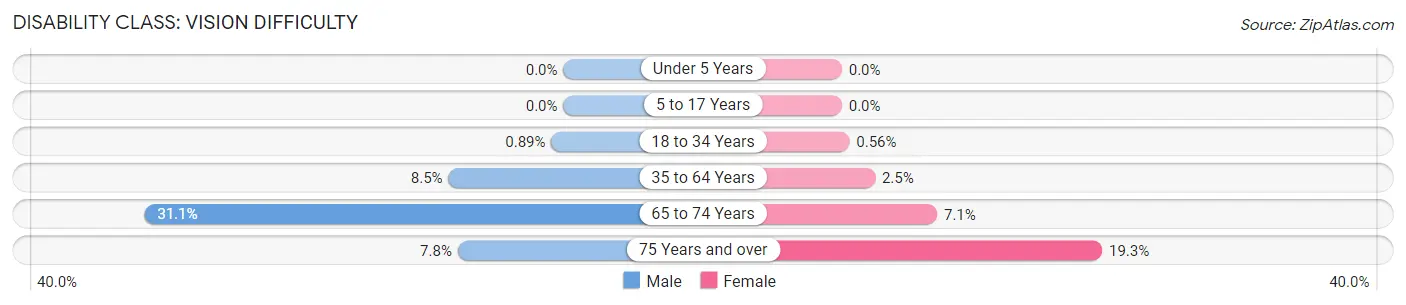
| Age Bracket | Male | Female |
| Under 5 Years | 0 (0.0%) | 0 (0.0%) |
| 5 to 17 Years | 0 (0.0%) | 0 (0.0%) |
| 18 to 34 Years | 8 (0.9%) | 7 (0.6%) |
| 35 to 64 Years | 135 (8.5%) | 40 (2.5%) |
| 65 to 74 Years | 98 (31.1%) | 22 (7.1%) |
| 75 Years and over | 8 (7.8%) | 51 (19.3%) |
Disability Class: Cognitive Difficulty
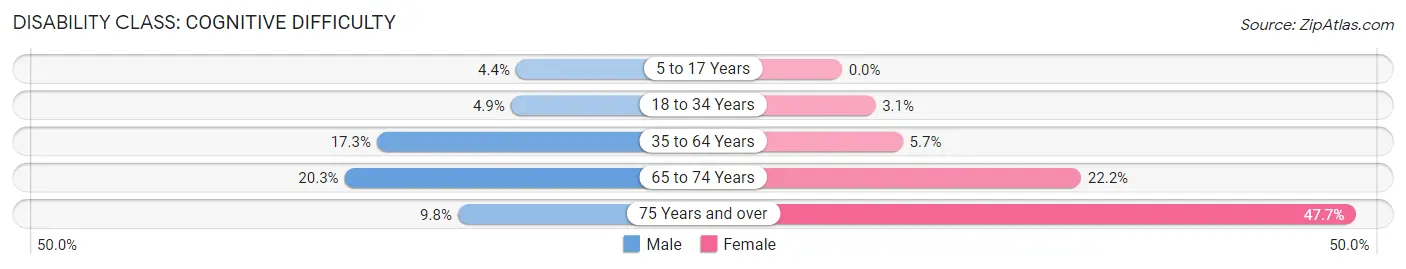
| Age Bracket | Male | Female |
| 5 to 17 Years | 45 (4.4%) | 0 (0.0%) |
| 18 to 34 Years | 44 (4.9%) | 39 (3.1%) |
| 35 to 64 Years | 274 (17.3%) | 92 (5.7%) |
| 65 to 74 Years | 64 (20.3%) | 69 (22.2%) |
| 75 Years and over | 10 (9.8%) | 126 (47.7%) |
Disability Class: Ambulatory Difficulty
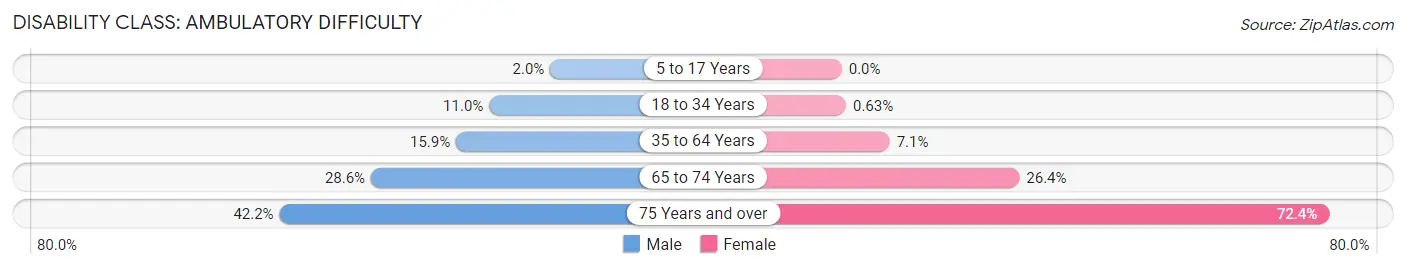
| Age Bracket | Male | Female |
| 5 to 17 Years | 20 (2.0%) | 0 (0.0%) |
| 18 to 34 Years | 99 (11.0%) | 8 (0.6%) |
| 35 to 64 Years | 252 (15.9%) | 116 (7.1%) |
| 65 to 74 Years | 90 (28.6%) | 82 (26.4%) |
| 75 Years and over | 43 (42.2%) | 191 (72.4%) |
Disability Class: Self-Care Difficulty
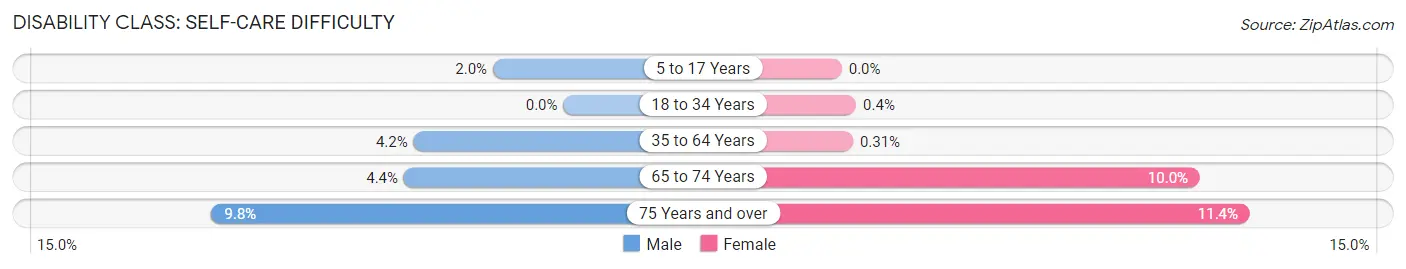
| Age Bracket | Male | Female |
| 5 to 17 Years | 20 (2.0%) | 0 (0.0%) |
| 18 to 34 Years | 0 (0.0%) | 5 (0.4%) |
| 35 to 64 Years | 66 (4.2%) | 5 (0.3%) |
| 65 to 74 Years | 14 (4.4%) | 31 (10.0%) |
| 75 Years and over | 10 (9.8%) | 30 (11.4%) |
Technology Access in Shiprock
Computing Device Access in Shiprock
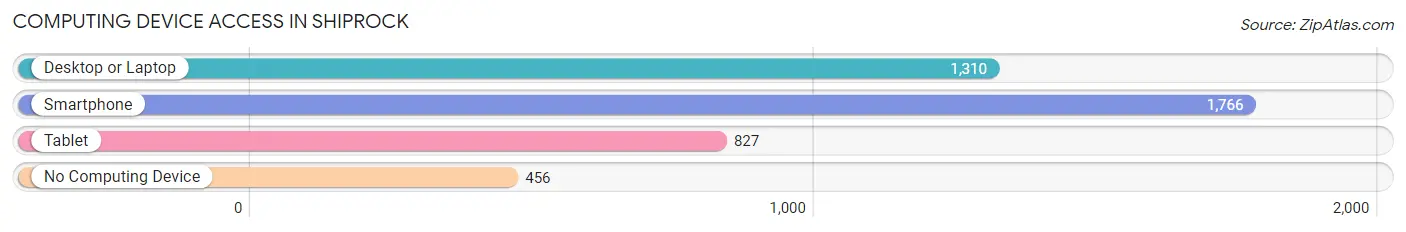
| Device Type | # Households | % Households |
| Desktop or Laptop | 1,310 | 56.4% |
| Smartphone | 1,766 | 76.1% |
| Tablet | 827 | 35.6% |
| No Computing Device | 456 | 19.6% |
| Total | 2,322 | 100.0% |
Internet Access in Shiprock
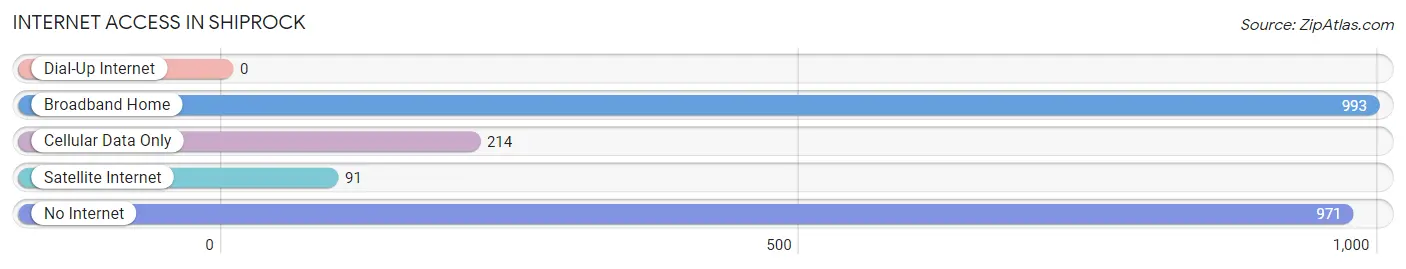
| Internet Type | # Households | % Households |
| Dial-Up Internet | 0 | 0.0% |
| Broadband Home | 993 | 42.8% |
| Cellular Data Only | 214 | 9.2% |
| Satellite Internet | 91 | 3.9% |
| No Internet | 971 | 41.8% |
| Total | 2,322 | 100.0% |
Shiprock Summary
Rock, New Mexico is a small town located in the northwest corner of the state, near the Arizona border. It is part of the Navajo Nation and is the largest town in San Juan County. The town is located on the Navajo Reservation and is home to the Shiprock Chapter of the Navajo Nation. The town is located on the banks of the San Juan River and is surrounded by the Chuska Mountains.
History
Shiprock, New Mexico was first settled by the Navajo people in the late 1800s. The town was named after the nearby Shiprock formation, a large rock formation that is sacred to the Navajo people. The town was originally a trading post and was used as a stopover for travelers. In the early 1900s, the town began to grow and develop as a trading center for the Navajo people.
In the early 1900s, the town was also used as a stopover for the Santa Fe Railroad. The railroad brought in new settlers and businesses to the area, and the town began to grow. In the 1920s, the town was incorporated and the population began to grow.
In the 1950s, the town was the site of a uranium mining boom. The uranium was used to fuel the nuclear weapons of the United States during the Cold War. The uranium mining brought in a large influx of people to the area, and the population of the town grew significantly.
In the 1970s, the town was the site of a major oil and gas boom. The oil and gas industry brought in a large influx of people to the area, and the population of the town grew significantly.
Geography
Shiprock, New Mexico is located in the northwest corner of the state, near the Arizona border. The town is located on the Navajo Reservation and is surrounded by the Chuska Mountains. The town is located on the banks of the San Juan River. The town is located at an elevation of 5,400 feet above sea level.
The climate in Shiprock is semi-arid, with hot summers and cold winters. The average annual temperature is around 60 degrees Fahrenheit. The average annual precipitation is around 8 inches.
Economy
The economy of Shiprock, New Mexico is largely based on the oil and gas industry. The town is home to several oil and gas companies, and the industry is the main source of employment in the area. The town is also home to several uranium mining companies, and the uranium mining industry is also a major source of employment in the area.
The town is also home to several retail stores, restaurants, and other businesses. The town is also home to several schools, including the Shiprock High School and the Shiprock Elementary School.
Demographics
As of the 2010 census, the population of Shiprock, New Mexico was 8,295. The population is largely Native American, with the majority of the population being Navajo. The median age of the population is 28.7 years, and the median household income is $30,938. The town has a poverty rate of 28.3%.
Common Questions
What is Per Capita Income in Shiprock?
Per Capita income in Shiprock is $18,902.
What is the Median Family Income in Shiprock?
Median Family Income in Shiprock is $41,382.
What is the Median Household income in Shiprock?
Median Household Income in Shiprock is $38,393.
What is Income or Wage Gap in Shiprock?
Income or Wage Gap in Shiprock is 8.1%.
Women in Shiprock earn 91.9 cents for every dollar earned by a man.
What is Family Income Deficit in Shiprock?
Family Income Deficit in Shiprock is $12,078.
Families that are below poverty line in Shiprock earn $12,078 less on average than the poverty threshold level.
What is Inequality or Gini Index in Shiprock?
Inequality or Gini Index in Shiprock is 0.48.
What is the Total Population of Shiprock?
Total Population of Shiprock is 8,275.
What is the Total Male Population of Shiprock?
Total Male Population of Shiprock is 4,041.
What is the Total Female Population of Shiprock?
Total Female Population of Shiprock is 4,234.
What is the Ratio of Males per 100 Females in Shiprock?
There are 95.44 Males per 100 Females in Shiprock.
What is the Ratio of Females per 100 Males in Shiprock?
There are 104.78 Females per 100 Males in Shiprock.
What is the Median Population Age in Shiprock?
Median Population Age in Shiprock is 35.6 Years.
What is the Average Family Size in Shiprock
Average Family Size in Shiprock is 3.9 People.
What is the Average Household Size in Shiprock
Average Household Size in Shiprock is 3.5 People.
How Large is the Labor Force in Shiprock?
There are 3,568 People in the Labor Forcein in Shiprock.
What is the Percentage of People in the Labor Force in Shiprock?
53.0% of People are in the Labor Force in Shiprock.
What is the Unemployment Rate in Shiprock?
Unemployment Rate in Shiprock is 15.5%.