Hidalgo County, NM Map & Demographics
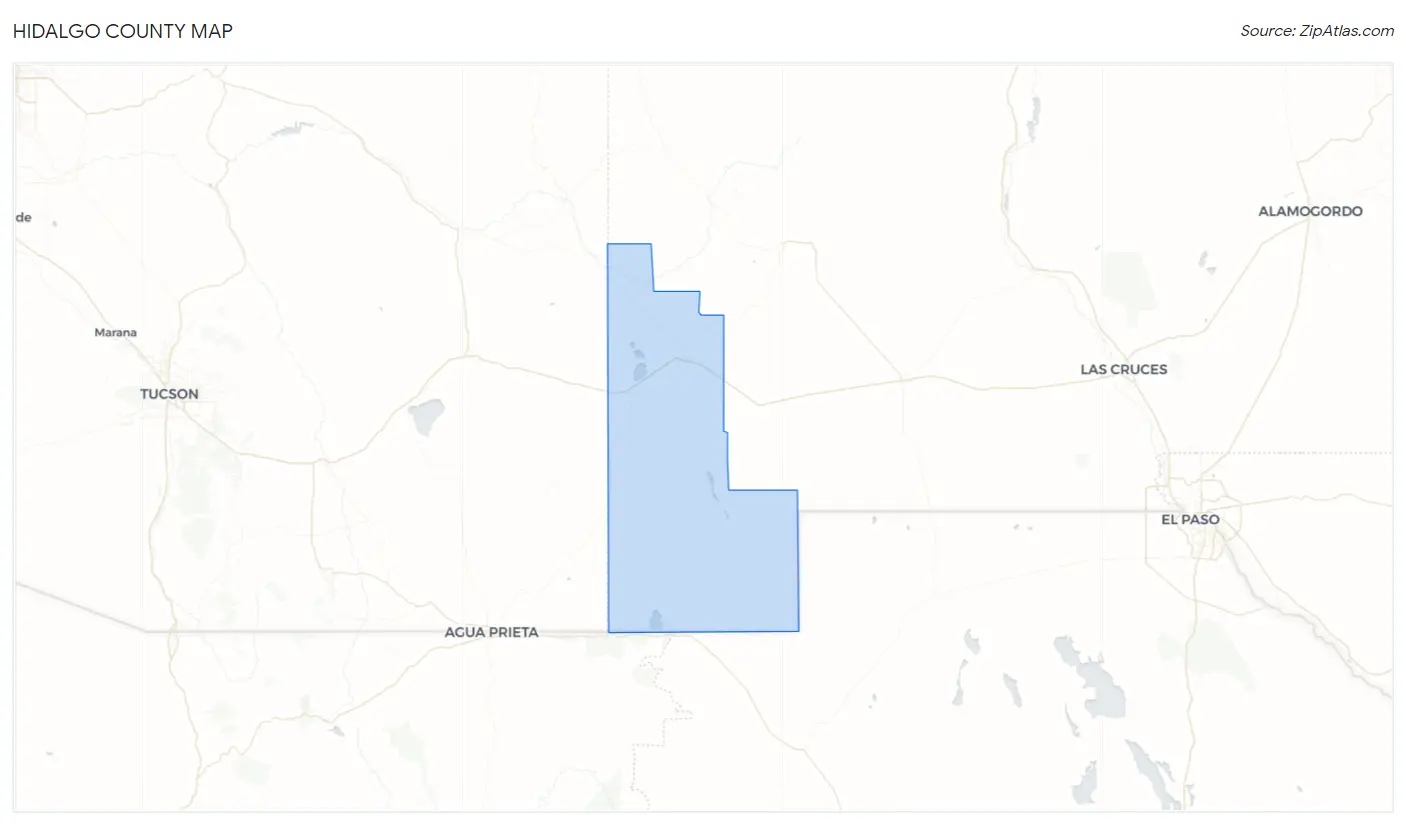
Hidalgo County Map
Hidalgo County Overview
$25,476
PER CAPITA INCOME
$63,467
AVG FAMILY INCOME
$53,651
AVG HOUSEHOLD INCOME
25.0%
WAGE / INCOME GAP [ % ]
75.0¢/ $1
WAGE / INCOME GAP [ $ ]
0.42
INEQUALITY / GINI INDEX
4,160
TOTAL POPULATION
2,066
MALE POPULATION
2,094
FEMALE POPULATION
98.66
MALES / 100 FEMALES
101.36
FEMALES / 100 MALES
42.1
MEDIAN AGE
3.3
AVG FAMILY SIZE
2.6
AVG HOUSEHOLD SIZE
1,714
LABOR FORCE [ PEOPLE ]
52.1%
PERCENT IN LABOR FORCE
4.4%
UNEMPLOYMENT RATE
Income in Hidalgo County
Income Overview in Hidalgo County
Per Capita Income in Hidalgo County is $25,476, while median incomes of families and households are $63,467 and $53,651 respectively.
| Characteristic | Number | Measure |
| Per Capita Income | 4,160 | $25,476 |
| Median Family Income | 975 | $63,467 |
| Mean Family Income | 975 | $76,060 |
| Median Household Income | 1,557 | $53,651 |
| Mean Household Income | 1,557 | $63,759 |
| Income Deficit | 975 | $0 |
| Wage / Income Gap (%) | 4,160 | 24.97% |
| Wage / Income Gap ($) | 4,160 | 75.03¢ per $1 |
| Gini / Inequality Index | 4,160 | 0.42 |
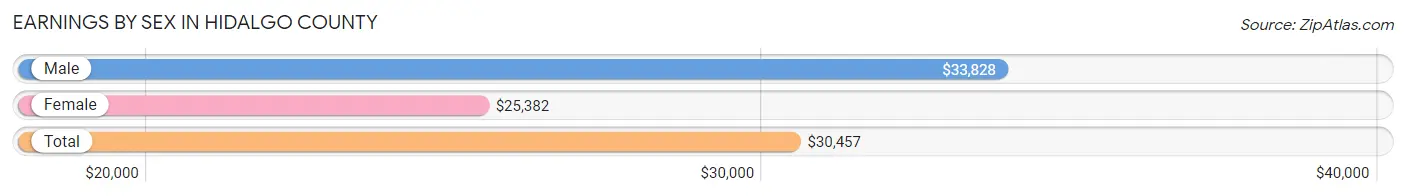
Earnings by Sex in Hidalgo County
Average Earnings in Hidalgo County are $30,457, $33,828 for men and $25,382 for women, a difference of 25.0%.
| Sex | Number | Average Earnings |
| Male | 907 (49.4%) | $33,828 |
| Female | 927 (50.5%) | $25,382 |
| Total | 1,834 (100.0%) | $30,457 |
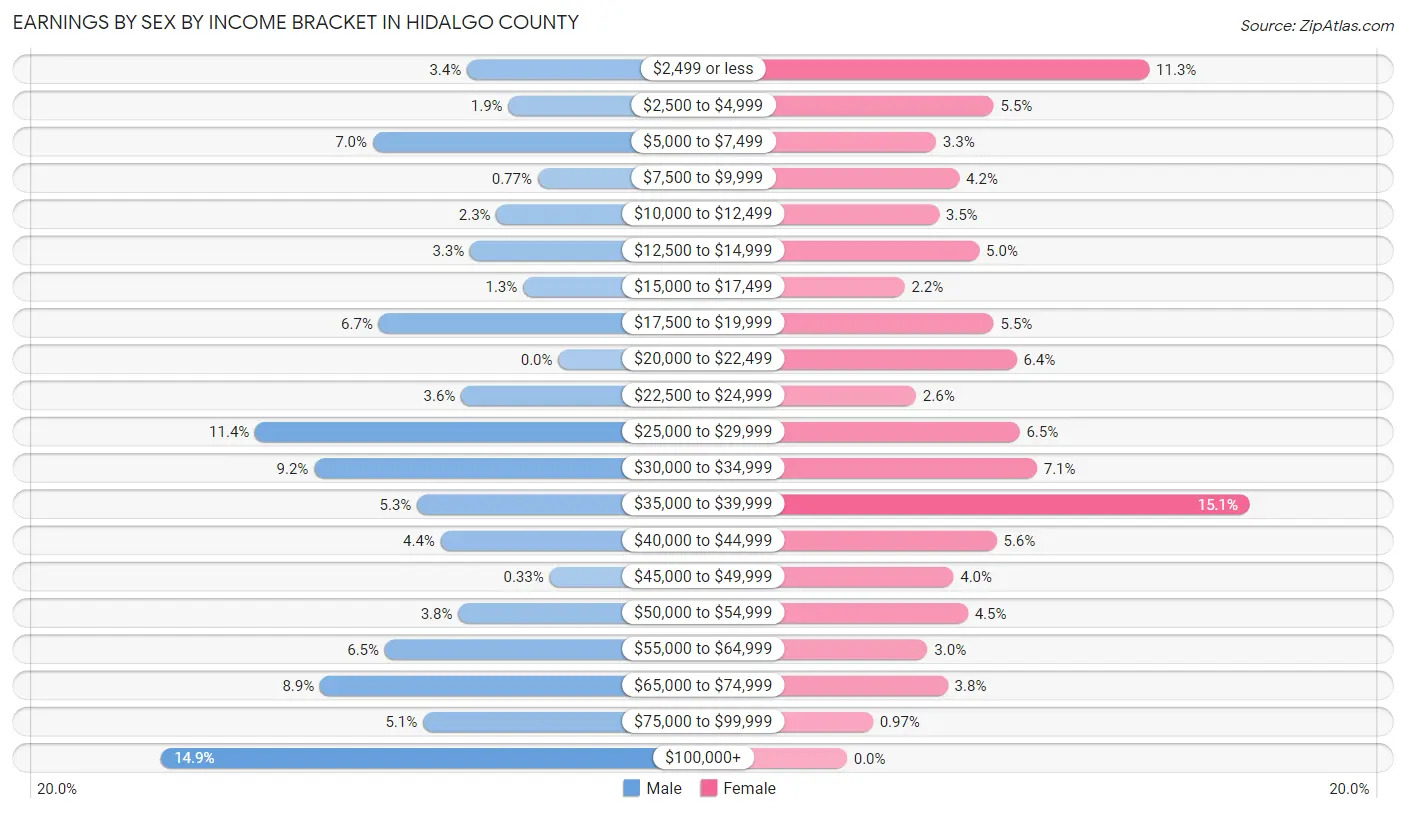
Earnings by Sex by Income Bracket in Hidalgo County
The most common earnings brackets in Hidalgo County are $100,000+ for men (135 | 14.9%) and $35,000 to $39,999 for women (140 | 15.1%).
| Income | Male | Female |
| $2,499 or less | 31 (3.4%) | 105 (11.3%) |
| $2,500 to $4,999 | 17 (1.9%) | 51 (5.5%) |
| $5,000 to $7,499 | 63 (7.0%) | 31 (3.3%) |
| $7,500 to $9,999 | 7 (0.8%) | 39 (4.2%) |
| $10,000 to $12,499 | 21 (2.3%) | 32 (3.5%) |
| $12,500 to $14,999 | 30 (3.3%) | 46 (5.0%) |
| $15,000 to $17,499 | 12 (1.3%) | 20 (2.2%) |
| $17,500 to $19,999 | 61 (6.7%) | 51 (5.5%) |
| $20,000 to $22,499 | 0 (0.0%) | 59 (6.4%) |
| $22,500 to $24,999 | 33 (3.6%) | 24 (2.6%) |
| $25,000 to $29,999 | 103 (11.4%) | 60 (6.5%) |
| $30,000 to $34,999 | 83 (9.1%) | 66 (7.1%) |
| $35,000 to $39,999 | 48 (5.3%) | 140 (15.1%) |
| $40,000 to $44,999 | 40 (4.4%) | 52 (5.6%) |
| $45,000 to $49,999 | 3 (0.3%) | 37 (4.0%) |
| $50,000 to $54,999 | 34 (3.7%) | 42 (4.5%) |
| $55,000 to $64,999 | 59 (6.5%) | 28 (3.0%) |
| $65,000 to $74,999 | 81 (8.9%) | 35 (3.8%) |
| $75,000 to $99,999 | 46 (5.1%) | 9 (1.0%) |
| $100,000+ | 135 (14.9%) | 0 (0.0%) |
| Total | 907 (100.0%) | 927 (100.0%) |
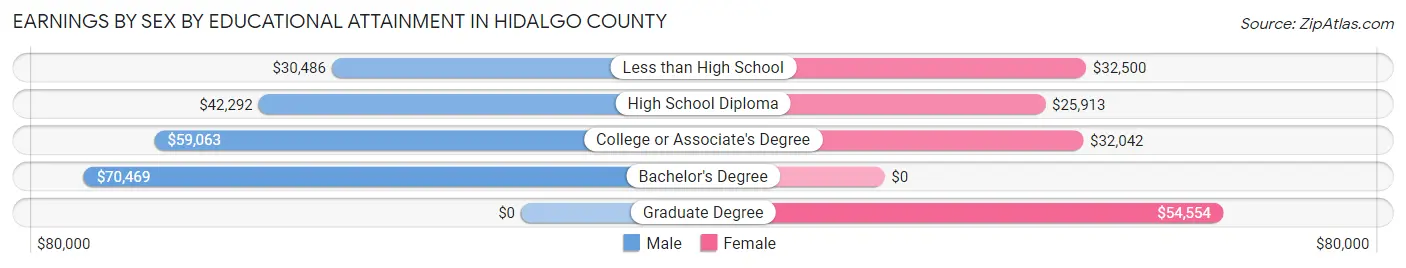
Earnings by Sex by Educational Attainment in Hidalgo County
Average earnings in Hidalgo County are $40,125 for men and $28,177 for women, a difference of 29.8%. Men with an educational attainment of bachelor's degree enjoy the highest average annual earnings of $70,469, while those with less than high school education earn the least with $30,486. Women with an educational attainment of graduate degree earn the most with the average annual earnings of $54,554, while those with high school diploma education have the smallest earnings of $25,913.
| Educational Attainment | Male Income | Female Income |
| Less than High School | $30,486 | $32,500 |
| High School Diploma | $42,292 | $25,913 |
| College or Associate's Degree | $59,063 | $32,042 |
| Bachelor's Degree | $70,469 | $0 |
| Graduate Degree | - | - |
| Total | $40,125 | $28,177 |
Family Income in Hidalgo County
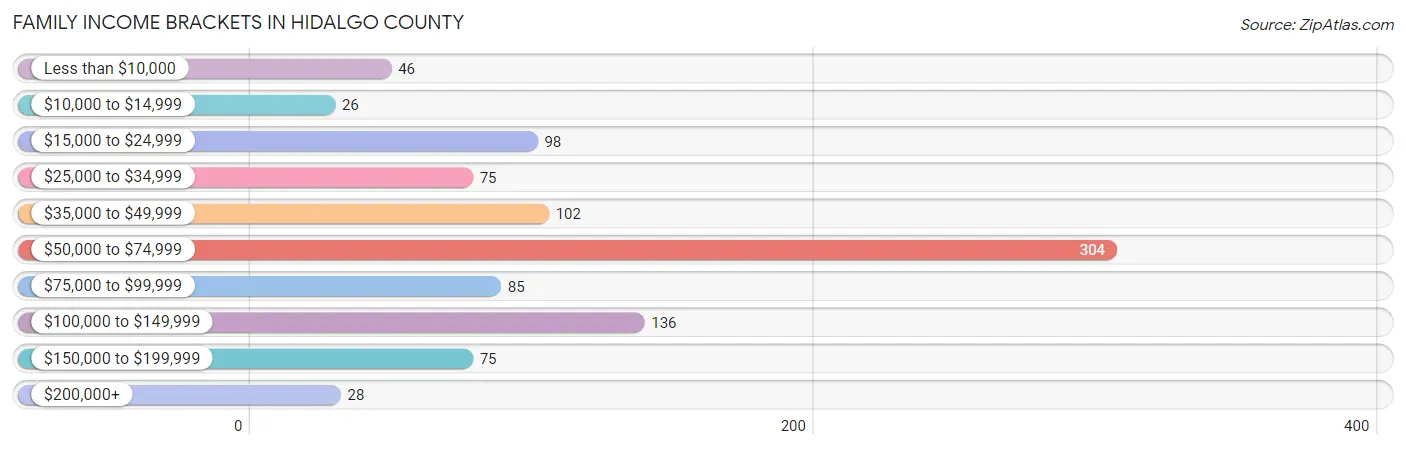
Family Income Brackets in Hidalgo County
According to the Hidalgo County family income data, there are 304 families falling into the $50,000 to $74,999 income range, which is the most common income bracket and makes up 31.2% of all families. Conversely, the $10,000 to $14,999 income bracket is the least frequent group with only 26 families (2.7%) belonging to this category.
| Income Bracket | # Families | % Families |
| Less than $10,000 | 46 | 4.7% |
| $10,000 to $14,999 | 26 | 2.7% |
| $15,000 to $24,999 | 98 | 10.1% |
| $25,000 to $34,999 | 75 | 7.7% |
| $35,000 to $49,999 | 102 | 10.5% |
| $50,000 to $74,999 | 304 | 31.2% |
| $75,000 to $99,999 | 85 | 8.7% |
| $100,000 to $149,999 | 136 | 13.9% |
| $150,000 to $199,999 | 75 | 7.7% |
| $200,000+ | 28 | 2.9% |
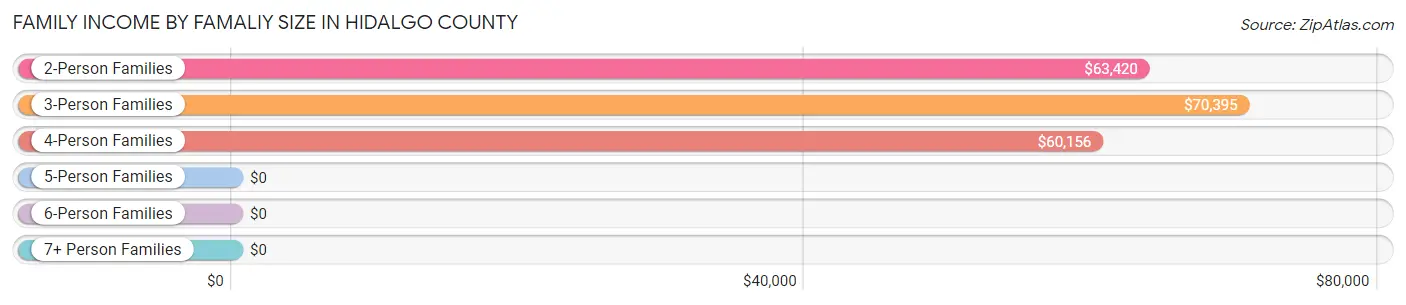
Family Income by Famaliy Size in Hidalgo County
3-person families (204 | 20.9%) account for the highest median family income in Hidalgo County with $70,395 per family, while 2-person families (507 | 52.0%) have the highest median income of $31,710 per family member.
| Income Bracket | # Families | Median Income |
| 2-Person Families | 507 (52.0%) | $63,420 |
| 3-Person Families | 204 (20.9%) | $70,395 |
| 4-Person Families | 153 (15.7%) | $60,156 |
| 5-Person Families | 58 (5.9%) | $0 |
| 6-Person Families | 35 (3.6%) | $0 |
| 7+ Person Families | 18 (1.8%) | $0 |
| Total | 975 (100.0%) | $63,467 |
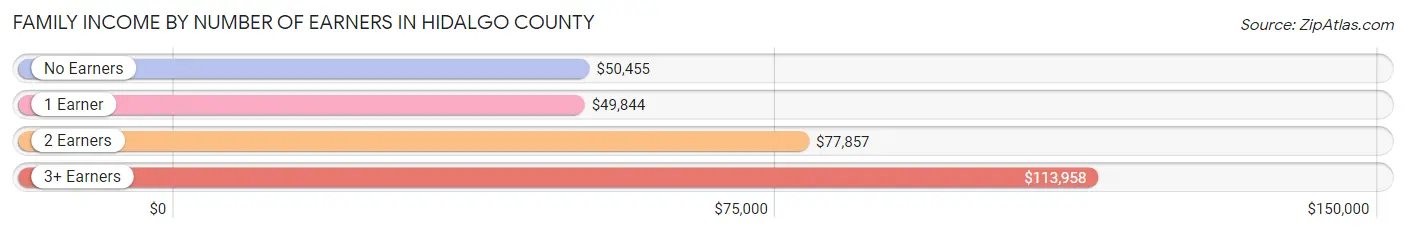
Family Income by Number of Earners in Hidalgo County
The median family income in Hidalgo County is $63,467, with families comprising 3+ earners (71) having the highest median family income of $113,958, while families with 1 earner (318) have the lowest median family income of $49,844, accounting for 7.3% and 32.6% of families, respectively.
| Number of Earners | # Families | Median Income |
| No Earners | 218 (22.4%) | $50,455 |
| 1 Earner | 318 (32.6%) | $49,844 |
| 2 Earners | 368 (37.7%) | $77,857 |
| 3+ Earners | 71 (7.3%) | $113,958 |
| Total | 975 (100.0%) | $63,467 |
Household Income in Hidalgo County
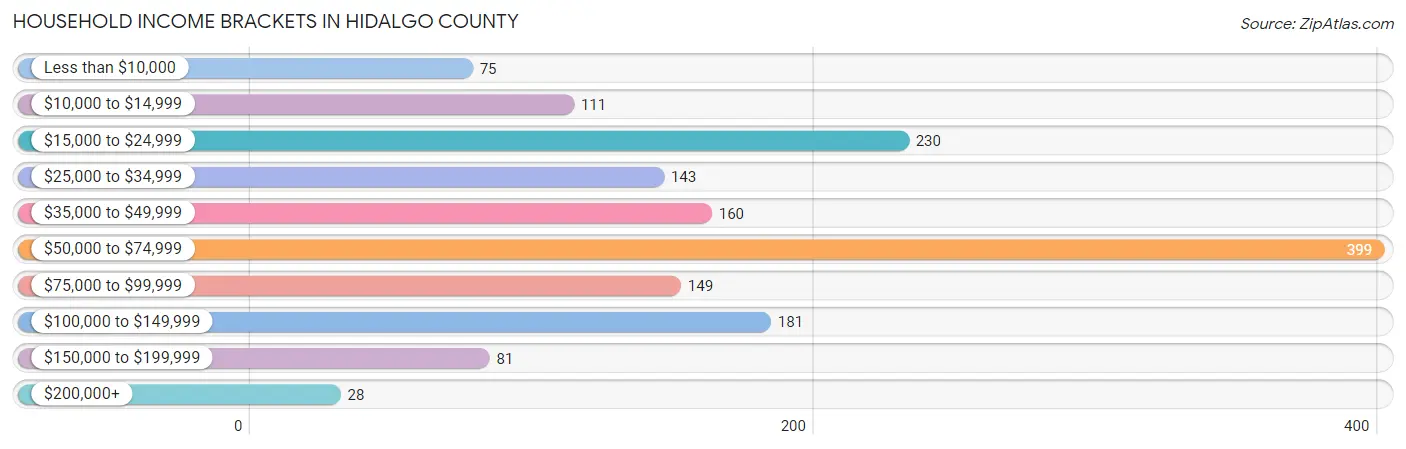
Household Income Brackets in Hidalgo County
With 399 households falling in the category, the $50,000 to $74,999 income range is the most frequent in Hidalgo County, accounting for 25.6% of all households. In contrast, only 28 households (1.8%) fall into the $200,000+ income bracket, making it the least populous group.
| Income Bracket | # Households | % Households |
| Less than $10,000 | 75 | 4.8% |
| $10,000 to $14,999 | 111 | 7.1% |
| $15,000 to $24,999 | 230 | 14.8% |
| $25,000 to $34,999 | 143 | 9.2% |
| $35,000 to $49,999 | 160 | 10.3% |
| $50,000 to $74,999 | 399 | 25.6% |
| $75,000 to $99,999 | 149 | 9.6% |
| $100,000 to $149,999 | 181 | 11.6% |
| $150,000 to $199,999 | 81 | 5.2% |
| $200,000+ | 28 | 1.8% |
Household Income by Householder Age in Hidalgo County
The median household income in Hidalgo County is $53,651, with the highest median household income of $70,385 found in the 25 to 44 years age bracket for the primary householder. A total of 374 households (24.0%) fall into this category. Meanwhile, the 15 to 24 years age bracket for the primary householder has the lowest median household income of $19,625, with 51 households (3.3%) in this group.
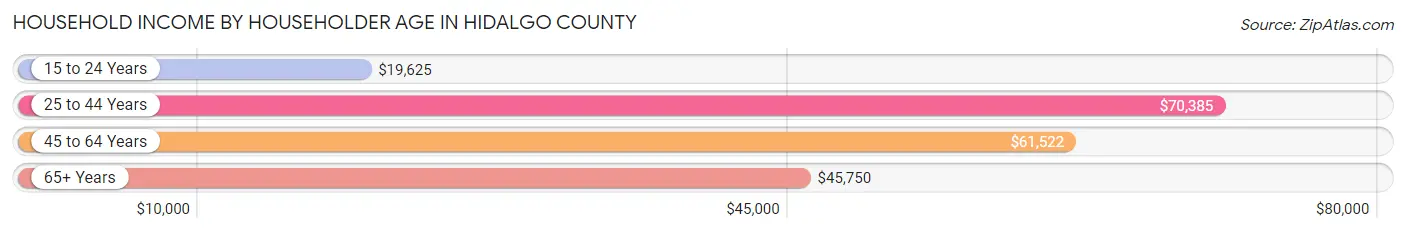
| Income Bracket | # Households | Median Income |
| 15 to 24 Years | 51 (3.3%) | $19,625 |
| 25 to 44 Years | 374 (24.0%) | $70,385 |
| 45 to 64 Years | 552 (35.4%) | $61,522 |
| 65+ Years | 580 (37.2%) | $45,750 |
| Total | 1,557 (100.0%) | $53,651 |
Poverty in Hidalgo County
Income Below Poverty by Sex and Age in Hidalgo County
With 25.0% poverty level for males and 21.5% for females among the residents of Hidalgo County, 15 year old males and 25 to 34 year old females are the most vulnerable to poverty, with 5 males (100.0%) and 103 females (43.8%) in their respective age groups living below the poverty level.
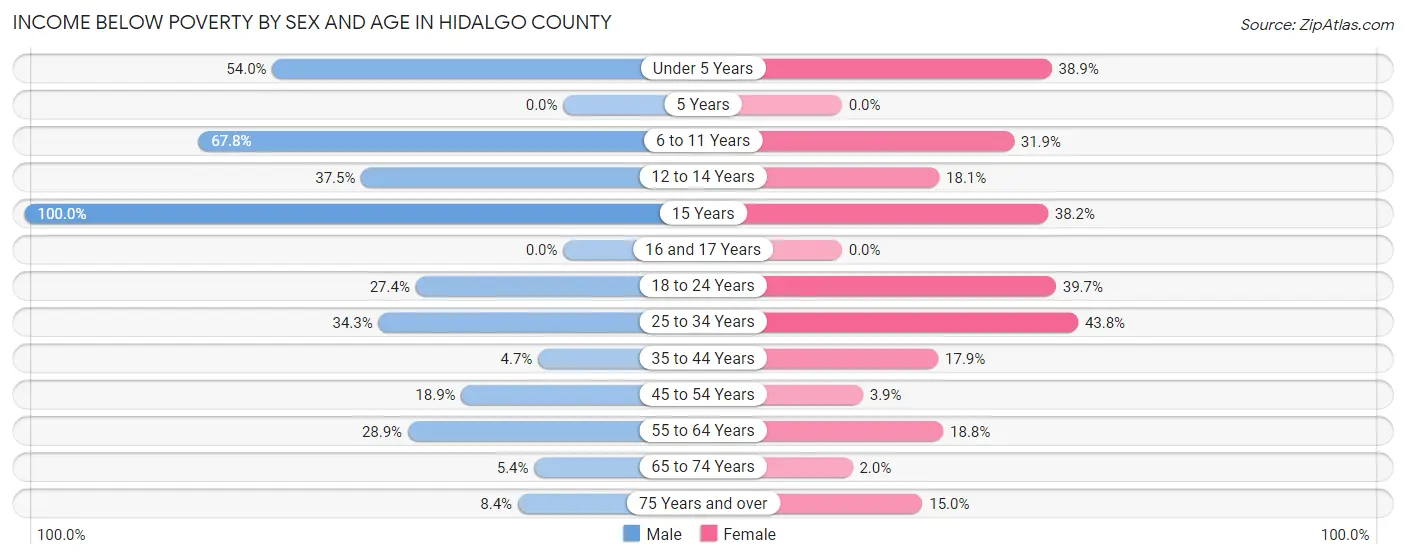
| Age Bracket | Male | Female |
| Under 5 Years | 81 (54.0%) | 44 (38.9%) |
| 5 Years | 0 (0.0%) | 0 (0.0%) |
| 6 to 11 Years | 82 (67.8%) | 83 (31.9%) |
| 12 to 14 Years | 33 (37.5%) | 13 (18.1%) |
| 15 Years | 5 (100.0%) | 13 (38.2%) |
| 16 and 17 Years | 0 (0.0%) | 0 (0.0%) |
| 18 to 24 Years | 40 (27.4%) | 56 (39.7%) |
| 25 to 34 Years | 95 (34.3%) | 103 (43.8%) |
| 35 to 44 Years | 12 (4.7%) | 32 (17.9%) |
| 45 to 54 Years | 28 (18.9%) | 10 (3.9%) |
| 55 to 64 Years | 90 (28.8%) | 57 (18.8%) |
| 65 to 74 Years | 14 (5.4%) | 5 (2.0%) |
| 75 Years and over | 14 (8.4%) | 29 (14.9%) |
| Total | 494 (25.0%) | 445 (21.5%) |
Income Above Poverty by Sex and Age in Hidalgo County
According to the poverty statistics in Hidalgo County, males aged 5 years and females aged 5 years are the age groups that are most secure financially, with 100.0% of males and 100.0% of females in these age groups living above the poverty line.
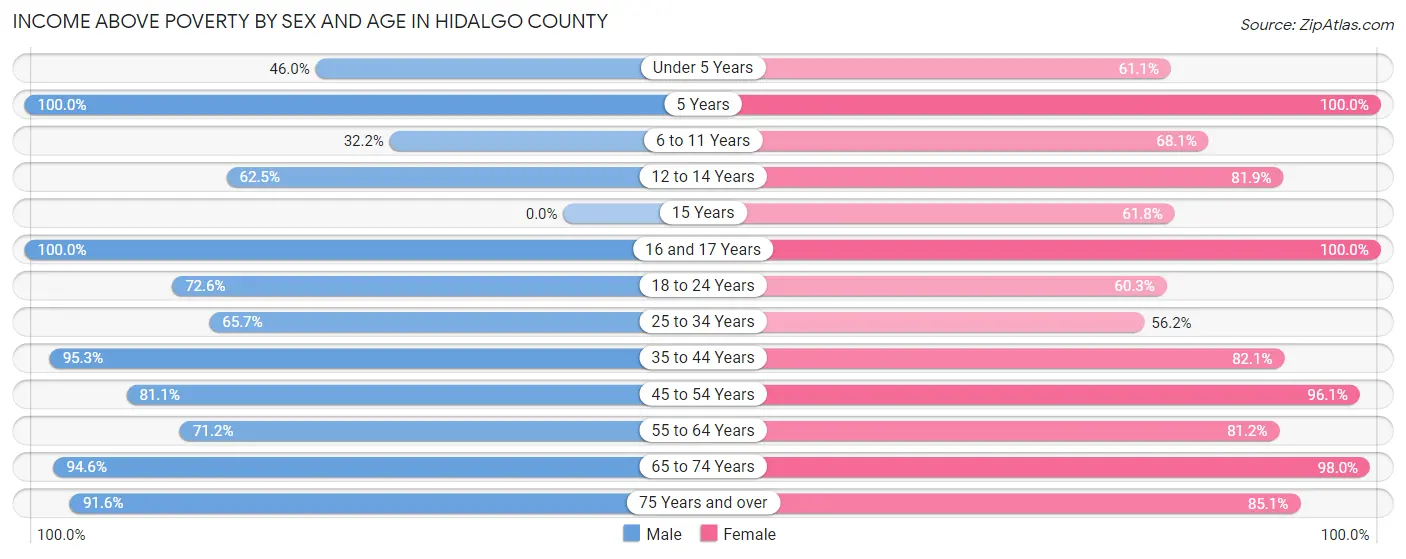
| Age Bracket | Male | Female |
| Under 5 Years | 69 (46.0%) | 69 (61.1%) |
| 5 Years | 13 (100.0%) | 15 (100.0%) |
| 6 to 11 Years | 39 (32.2%) | 177 (68.1%) |
| 12 to 14 Years | 55 (62.5%) | 59 (81.9%) |
| 15 Years | 0 (0.0%) | 21 (61.8%) |
| 16 and 17 Years | 35 (100.0%) | 11 (100.0%) |
| 18 to 24 Years | 106 (72.6%) | 85 (60.3%) |
| 25 to 34 Years | 182 (65.7%) | 132 (56.2%) |
| 35 to 44 Years | 245 (95.3%) | 147 (82.1%) |
| 45 to 54 Years | 120 (81.1%) | 247 (96.1%) |
| 55 to 64 Years | 222 (71.2%) | 246 (81.2%) |
| 65 to 74 Years | 246 (94.6%) | 248 (98.0%) |
| 75 Years and over | 152 (91.6%) | 165 (85.1%) |
| Total | 1,484 (75.0%) | 1,622 (78.5%) |
Income Below Poverty Among Married-Couple Families in Hidalgo County
The poverty statistics for married-couple families in Hidalgo County show that 12.6% or 90 of the total 712 families live below the poverty line. Families with 5 or more children have the highest poverty rate of 50.0%, comprising of 9 families. On the other hand, families with no children have the lowest poverty rate of 4.8%, which includes 22 families.
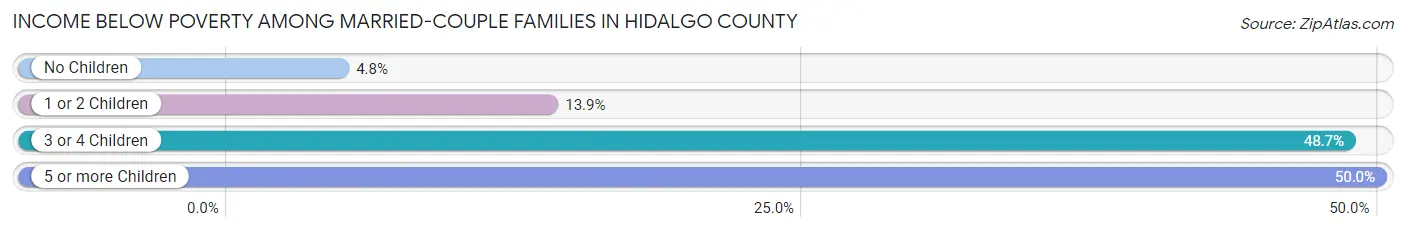
| Children | Above Poverty | Below Poverty |
| No Children | 433 (95.2%) | 22 (4.8%) |
| 1 or 2 Children | 142 (86.1%) | 23 (13.9%) |
| 3 or 4 Children | 38 (51.3%) | 36 (48.6%) |
| 5 or more Children | 9 (50.0%) | 9 (50.0%) |
| Total | 622 (87.4%) | 90 (12.6%) |
Income Below Poverty Among Single-Parent Households in Hidalgo County
According to the poverty data in Hidalgo County, 15.7% or 11 single-father households and 42.5% or 82 single-mother households are living below the poverty line. Among single-father households, those with 1 or 2 children have the highest poverty rate, with 11 households (61.1%) experiencing poverty. Likewise, among single-mother households, those with 3 or 4 children have the highest poverty rate, with 48 households (100.0%) falling below the poverty line.
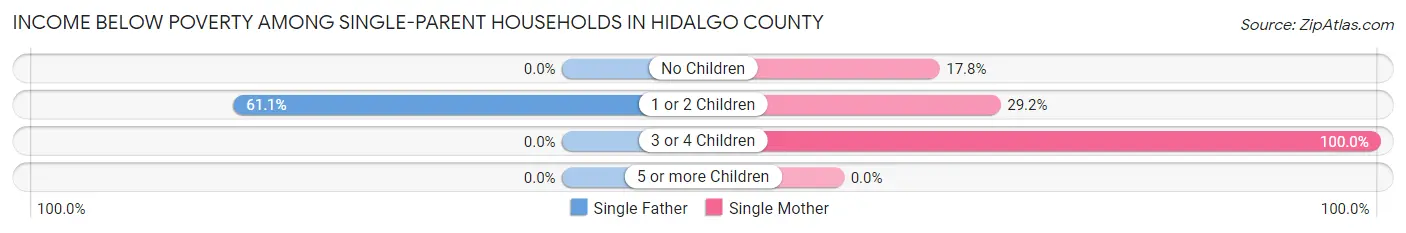
| Children | Single Father | Single Mother |
| No Children | 0 (0.0%) | 13 (17.8%) |
| 1 or 2 Children | 11 (61.1%) | 21 (29.2%) |
| 3 or 4 Children | 0 (0.0%) | 48 (100.0%) |
| 5 or more Children | 0 (0.0%) | 0 (0.0%) |
| Total | 11 (15.7%) | 82 (42.5%) |
Income Below Poverty Among Married-Couple vs Single-Parent Households in Hidalgo County
The poverty data for Hidalgo County shows that 90 of the married-couple family households (12.6%) and 93 of the single-parent households (35.4%) are living below the poverty level. Within the married-couple family households, those with 5 or more children have the highest poverty rate, with 9 households (50.0%) falling below the poverty line. Among the single-parent households, those with 3 or 4 children have the highest poverty rate, with 48 household (71.6%) living below poverty.
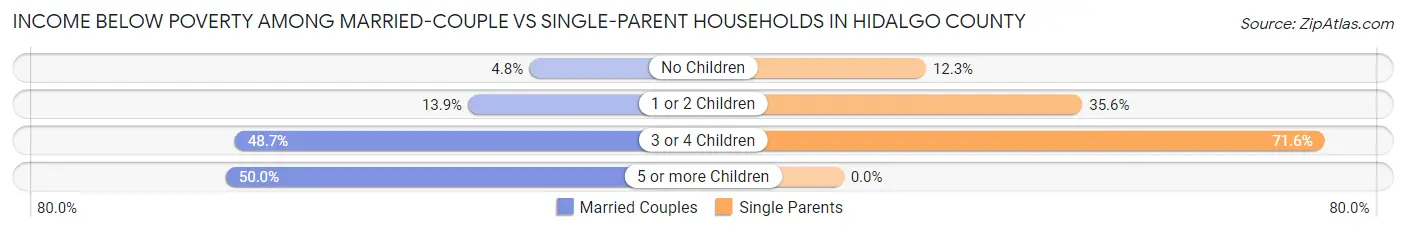
| Children | Married-Couple Families | Single-Parent Households |
| No Children | 22 (4.8%) | 13 (12.3%) |
| 1 or 2 Children | 23 (13.9%) | 32 (35.6%) |
| 3 or 4 Children | 36 (48.6%) | 48 (71.6%) |
| 5 or more Children | 9 (50.0%) | 0 (0.0%) |
| Total | 90 (12.6%) | 93 (35.4%) |
Race in Hidalgo County
The most populous races in Hidalgo County are White / Caucasian (2,887 | 69.4%), Hispanic or Latino (2,469 | 59.4%), and Two or more Races (877 | 21.1%).
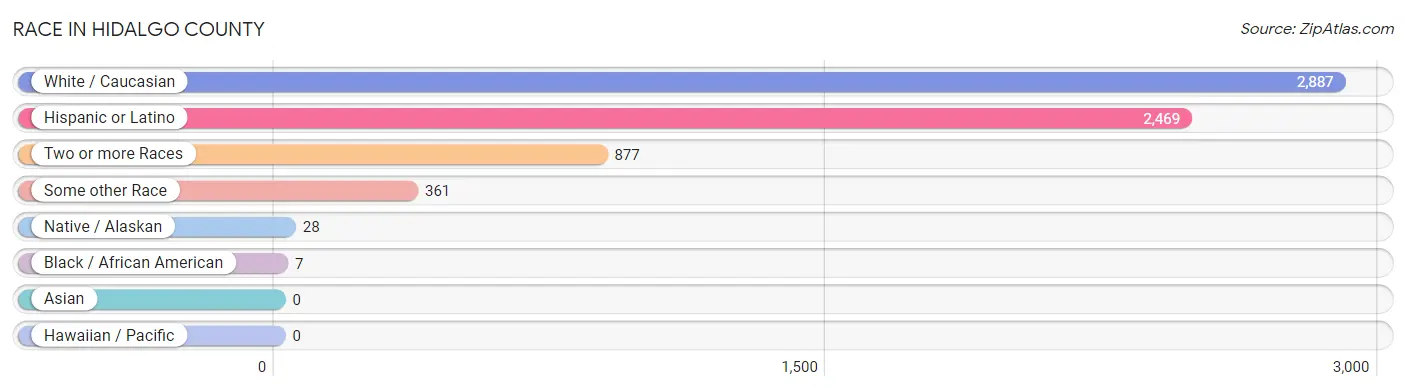
| Race | # Population | % Population |
| Asian | 0 | 0.0% |
| Black / African American | 7 | 0.2% |
| Hawaiian / Pacific | 0 | 0.0% |
| Hispanic or Latino | 2,469 | 59.4% |
| Native / Alaskan | 28 | 0.7% |
| White / Caucasian | 2,887 | 69.4% |
| Two or more Races | 877 | 21.1% |
| Some other Race | 361 | 8.7% |
| Total | 4,160 | 100.0% |
Ancestry in Hidalgo County
The most populous ancestries reported in Hidalgo County are Mexican (2,284 | 54.9%), English (346 | 8.3%), German (288 | 6.9%), Irish (264 | 6.4%), and American (185 | 4.4%), together accounting for 80.9% of all Hidalgo County residents.
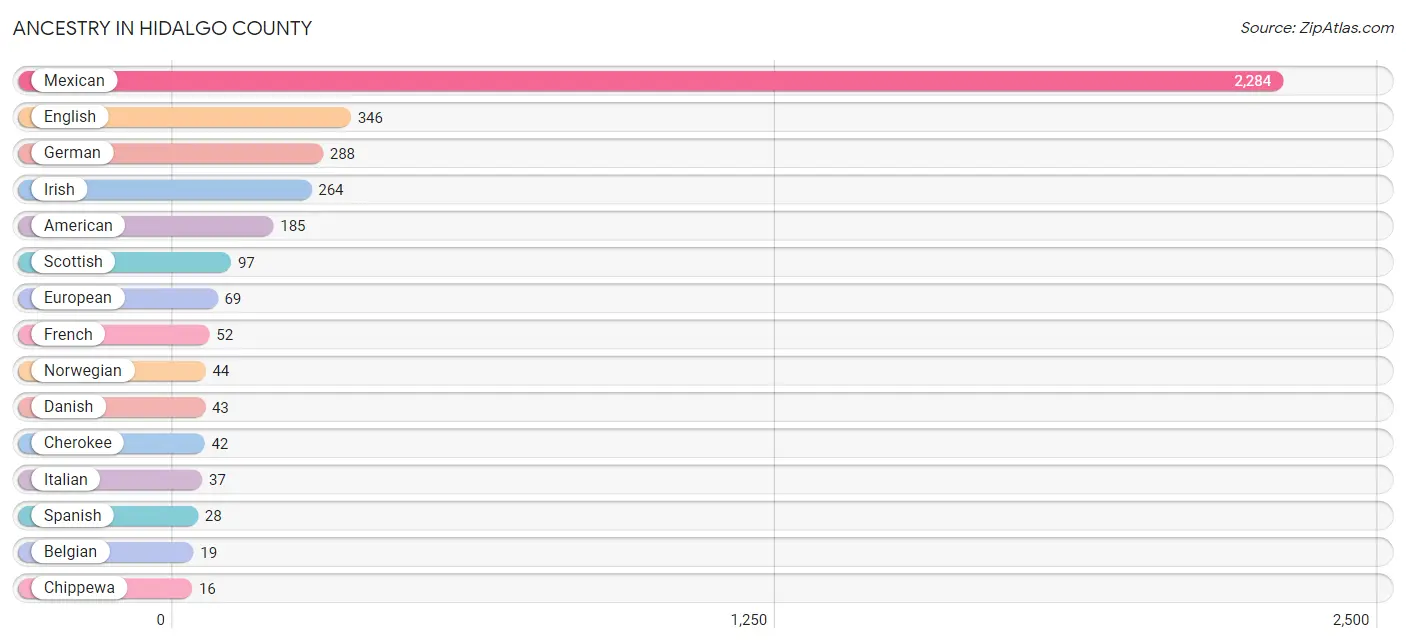
| Ancestry | # Population | % Population |
| American | 185 | 4.4% |
| Arab | 6 | 0.1% |
| Austrian | 14 | 0.3% |
| Belgian | 19 | 0.5% |
| Bhutanese | 5 | 0.1% |
| Cherokee | 42 | 1.0% |
| Chippewa | 16 | 0.4% |
| Croatian | 9 | 0.2% |
| Czech | 7 | 0.2% |
| Danish | 43 | 1.0% |
| Dutch | 9 | 0.2% |
| Eastern European | 8 | 0.2% |
| English | 346 | 8.3% |
| European | 69 | 1.7% |
| French | 52 | 1.3% |
| German | 288 | 6.9% |
| Irish | 264 | 6.4% |
| Italian | 37 | 0.9% |
| Lebanese | 6 | 0.1% |
| Mexican | 2,284 | 54.9% |
| Northern European | 4 | 0.1% |
| Norwegian | 44 | 1.1% |
| Polish | 13 | 0.3% |
| Pueblo | 14 | 0.3% |
| Puerto Rican | 11 | 0.3% |
| Scandinavian | 8 | 0.2% |
| Scotch-Irish | 6 | 0.1% |
| Scottish | 97 | 2.3% |
| Spaniard | 6 | 0.1% |
| Spanish | 28 | 0.7% |
| Swedish | 2 | 0.1% |
| Welsh | 15 | 0.4% |
| Yup'ik | 9 | 0.2% | View All 33 Rows |
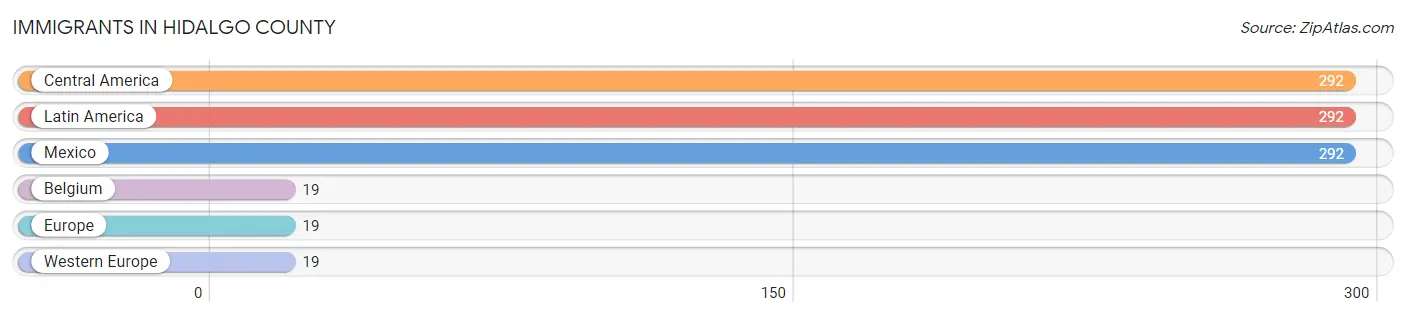
Immigrants in Hidalgo County
The most numerous immigrant groups reported in Hidalgo County came from Central America (292 | 7.0%), Latin America (292 | 7.0%), Mexico (292 | 7.0%), Belgium (19 | 0.5%), and Europe (19 | 0.5%), together accounting for 22.0% of all Hidalgo County residents.
| Immigration Origin | # Population | % Population |
| Belgium | 19 | 0.5% |
| Central America | 292 | 7.0% |
| Europe | 19 | 0.5% |
| Latin America | 292 | 7.0% |
| Mexico | 292 | 7.0% |
| Western Europe | 19 | 0.5% | View All 6 Rows |
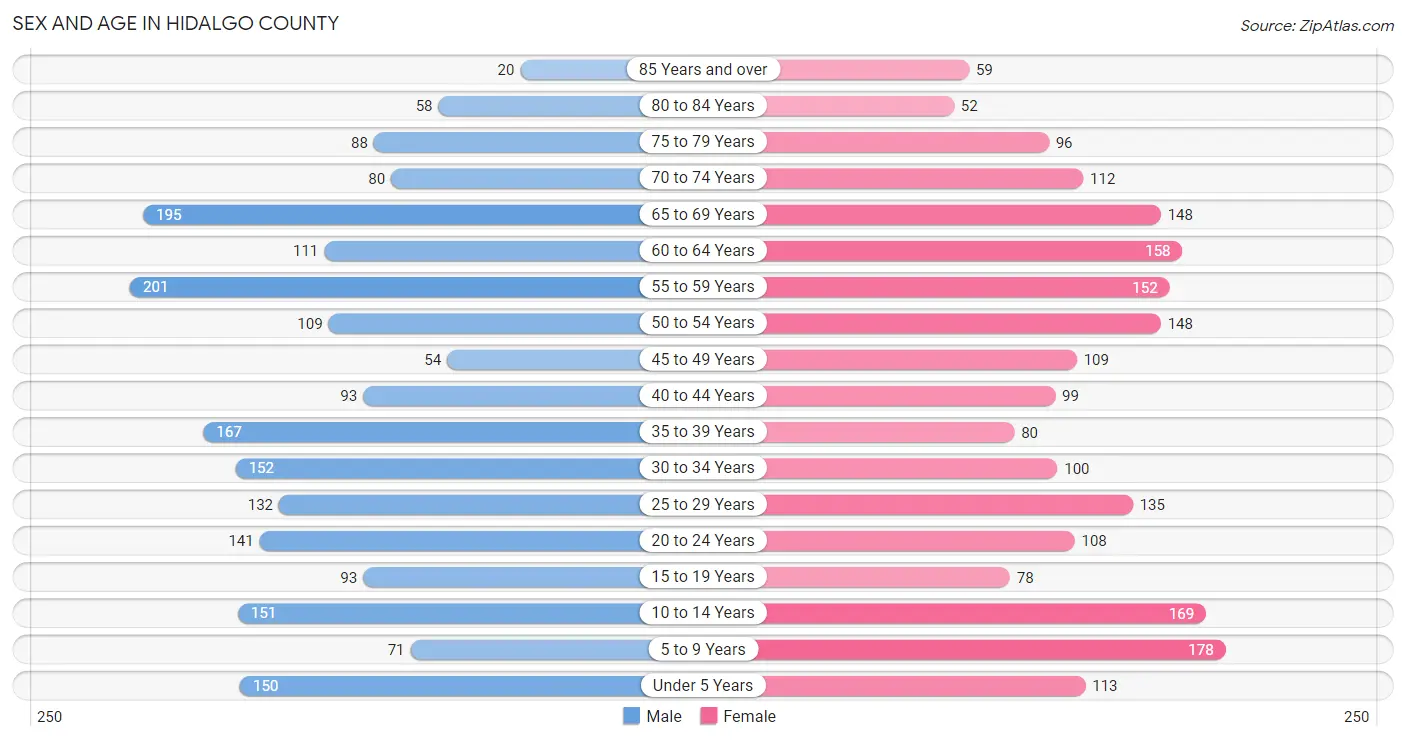
Sex and Age in Hidalgo County
Sex and Age in Hidalgo County
The most populous age groups in Hidalgo County are 55 to 59 Years (201 | 9.7%) for men and 5 to 9 Years (178 | 8.5%) for women.
| Age Bracket | Male | Female |
| Under 5 Years | 150 (7.3%) | 113 (5.4%) |
| 5 to 9 Years | 71 (3.4%) | 178 (8.5%) |
| 10 to 14 Years | 151 (7.3%) | 169 (8.1%) |
| 15 to 19 Years | 93 (4.5%) | 78 (3.7%) |
| 20 to 24 Years | 141 (6.8%) | 108 (5.2%) |
| 25 to 29 Years | 132 (6.4%) | 135 (6.5%) |
| 30 to 34 Years | 152 (7.4%) | 100 (4.8%) |
| 35 to 39 Years | 167 (8.1%) | 80 (3.8%) |
| 40 to 44 Years | 93 (4.5%) | 99 (4.7%) |
| 45 to 49 Years | 54 (2.6%) | 109 (5.2%) |
| 50 to 54 Years | 109 (5.3%) | 148 (7.1%) |
| 55 to 59 Years | 201 (9.7%) | 152 (7.3%) |
| 60 to 64 Years | 111 (5.4%) | 158 (7.5%) |
| 65 to 69 Years | 195 (9.4%) | 148 (7.1%) |
| 70 to 74 Years | 80 (3.9%) | 112 (5.3%) |
| 75 to 79 Years | 88 (4.3%) | 96 (4.6%) |
| 80 to 84 Years | 58 (2.8%) | 52 (2.5%) |
| 85 Years and over | 20 (1.0%) | 59 (2.8%) |
| Total | 2,066 (100.0%) | 2,094 (100.0%) |
Families and Households in Hidalgo County
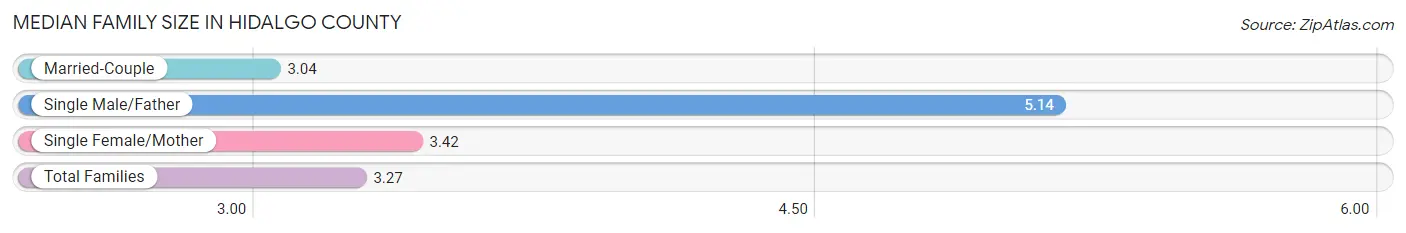
Median Family Size in Hidalgo County
The median family size in Hidalgo County is 3.27 persons per family, with single male/father families (70 | 7.2%) accounting for the largest median family size of 5.14 persons per family. On the other hand, married-couple families (712 | 73.0%) represent the smallest median family size with 3.04 persons per family.
| Family Type | # Families | Family Size |
| Married-Couple | 712 (73.0%) | 3.04 |
| Single Male/Father | 70 (7.2%) | 5.14 |
| Single Female/Mother | 193 (19.8%) | 3.42 |
| Total Families | 975 (100.0%) | 3.27 |
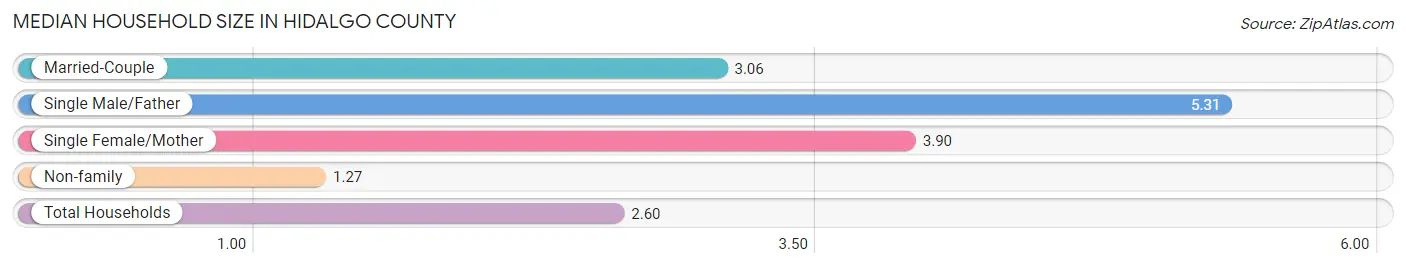
Median Household Size in Hidalgo County
The median household size in Hidalgo County is 2.60 persons per household, with single male/father households (70 | 4.5%) accounting for the largest median household size of 5.31 persons per household. non-family households (582 | 37.4%) represent the smallest median household size with 1.27 persons per household.
| Household Type | # Households | Household Size |
| Married-Couple | 712 (45.7%) | 3.06 |
| Single Male/Father | 70 (4.5%) | 5.31 |
| Single Female/Mother | 193 (12.4%) | 3.90 |
| Non-family | 582 (37.4%) | 1.27 |
| Total Households | 1,557 (100.0%) | 2.60 |
Household Size by Marriage Status in Hidalgo County
Out of a total of 1,557 households in Hidalgo County, 975 (62.6%) are family households, while 582 (37.4%) are nonfamily households. The most numerous type of family households are 2-person households, comprising 491, and the most common type of nonfamily households are 1-person households, comprising 507.
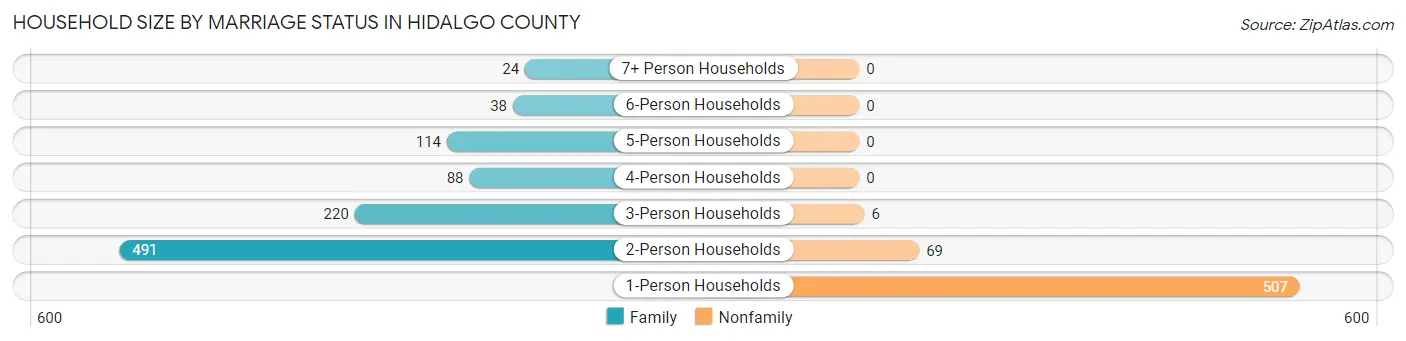
| Household Size | Family Households | Nonfamily Households |
| 1-Person Households | - | 507 (32.6%) |
| 2-Person Households | 491 (31.5%) | 69 (4.4%) |
| 3-Person Households | 220 (14.1%) | 6 (0.4%) |
| 4-Person Households | 88 (5.7%) | 0 (0.0%) |
| 5-Person Households | 114 (7.3%) | 0 (0.0%) |
| 6-Person Households | 38 (2.4%) | 0 (0.0%) |
| 7+ Person Households | 24 (1.5%) | 0 (0.0%) |
| Total | 975 (62.6%) | 582 (37.4%) |
Female Fertility in Hidalgo County
Fertility by Age in Hidalgo County
Average fertility rate in Hidalgo County is 128.0 births per 1,000 women. Women in the age bracket of 20 to 34 years have the highest fertility rate with 251.0 births per 1,000 women. Women in the age bracket of 20 to 34 years acount for 89.6% of all women with births.
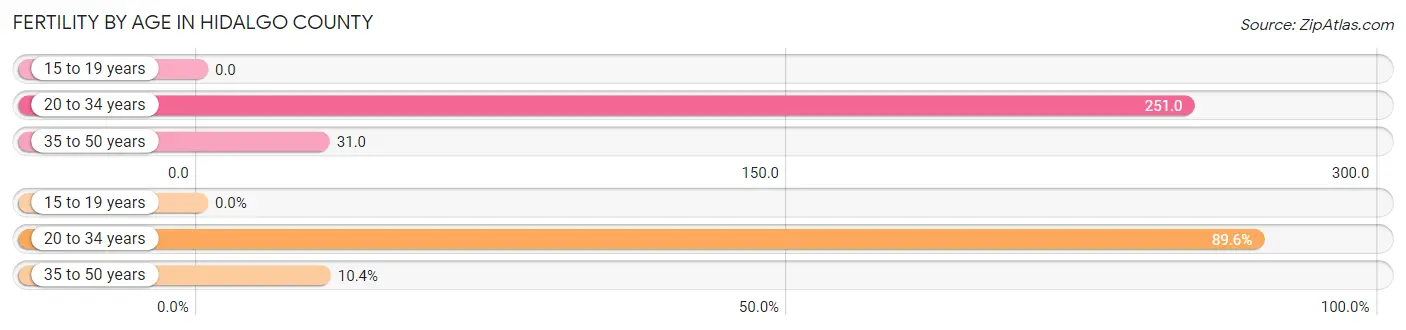
| Age Bracket | Women with Births | Births / 1,000 Women |
| 15 to 19 years | 0 (0.0%) | 0.0 |
| 20 to 34 years | 86 (89.6%) | 251.0 |
| 35 to 50 years | 10 (10.4%) | 31.0 |
| Total | 96 (100.0%) | 128.0 |
Fertility by Age by Marriage Status in Hidalgo County
86.5% of women with births (96) in Hidalgo County are married. The highest percentage of unmarried women with births falls into 20 to 34 years age bracket with 15.1% of them unmarried at the time of birth, while the lowest percentage of unmarried women with births belong to 35 to 50 years age bracket with 0.0% of them unmarried.
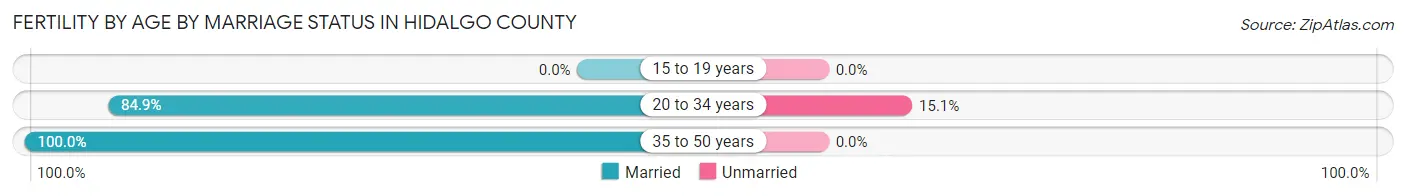
| Age Bracket | Married | Unmarried |
| 15 to 19 years | 0 (0.0%) | 0 (0.0%) |
| 20 to 34 years | 73 (84.9%) | 13 (15.1%) |
| 35 to 50 years | 10 (100.0%) | 0 (0.0%) |
| Total | 83 (86.5%) | 13 (13.5%) |
Fertility by Education in Hidalgo County
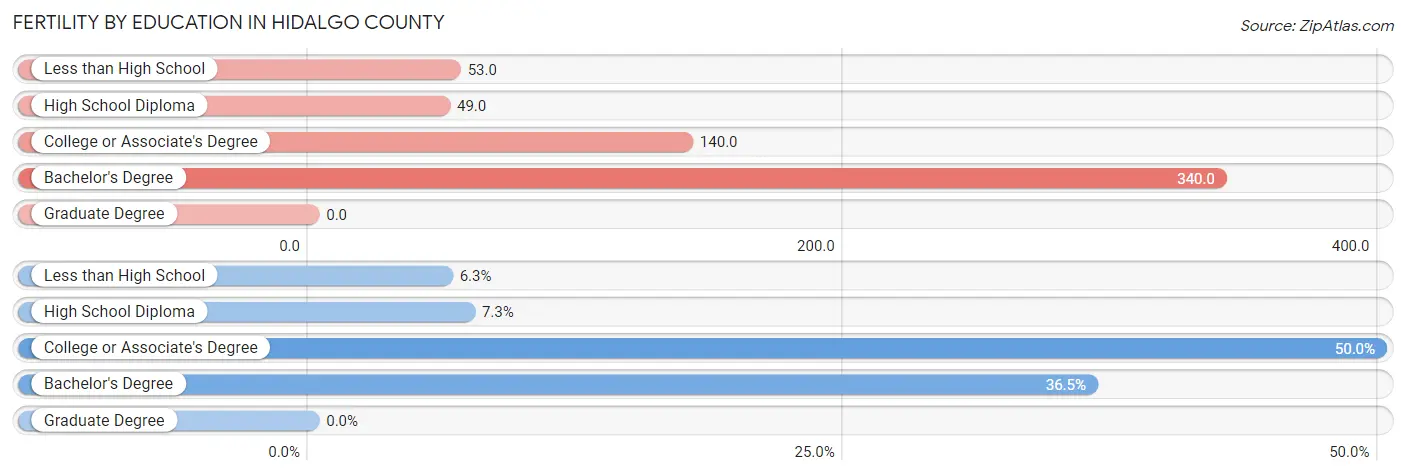
| Educational Attainment | Women with Births | Births / 1,000 Women |
| Less than High School | 6 (6.2%) | 53.0 |
| High School Diploma | 7 (7.3%) | 49.0 |
| College or Associate's Degree | 48 (50.0%) | 140.0 |
| Bachelor's Degree | 35 (36.5%) | 340.0 |
| Graduate Degree | 0 (0.0%) | 0.0 |
| Total | 96 (100.0%) | 128.0 |
Fertility by Education by Marriage Status in Hidalgo County
13.5% of women with births in Hidalgo County are unmarried. Women with the educational attainment of college or associate's degree are most likely to be married with 100.0% of them married at childbirth, while women with the educational attainment of less than high school are least likely to be married with 100.0% of them unmarried at childbirth.
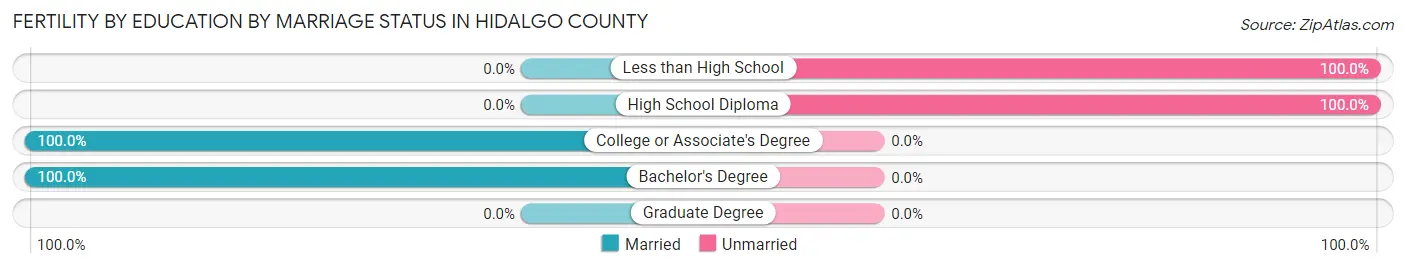
| Educational Attainment | Married | Unmarried |
| Less than High School | 0 (0.0%) | 6 (100.0%) |
| High School Diploma | 0 (0.0%) | 7 (100.0%) |
| College or Associate's Degree | 48 (100.0%) | 0 (0.0%) |
| Bachelor's Degree | 35 (100.0%) | 0 (0.0%) |
| Graduate Degree | 0 (0.0%) | 0 (0.0%) |
| Total | 83 (86.5%) | 13 (13.5%) |
Employment Characteristics in Hidalgo County
Employment by Class of Employer in Hidalgo County
Among the 1,629 employed individuals in Hidalgo County, private company employees (736 | 45.2%), state government employees (251 | 15.4%), and local government employees (239 | 14.7%) make up the most common classes of employment.
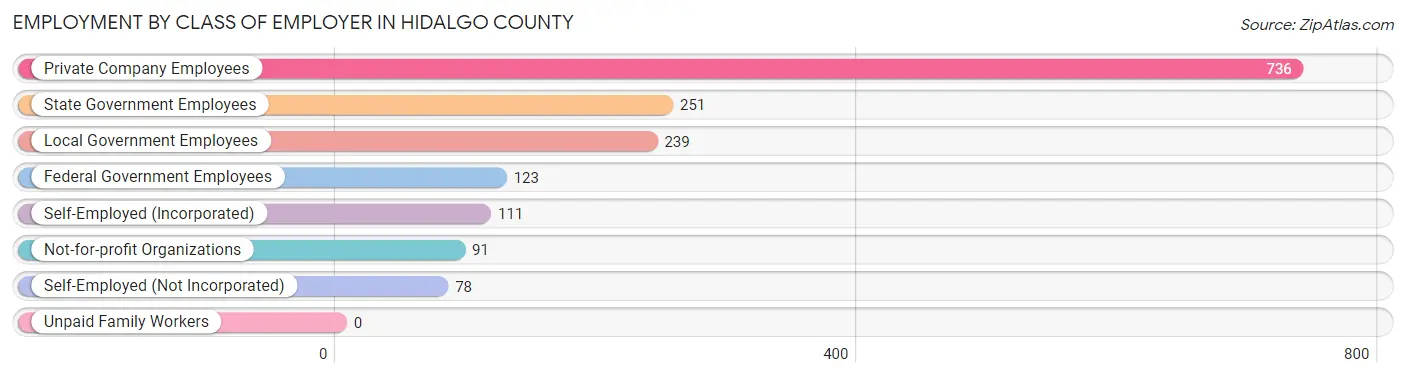
| Employer Class | # Employees | % Employees |
| Private Company Employees | 736 | 45.2% |
| Self-Employed (Incorporated) | 111 | 6.8% |
| Self-Employed (Not Incorporated) | 78 | 4.8% |
| Not-for-profit Organizations | 91 | 5.6% |
| Local Government Employees | 239 | 14.7% |
| State Government Employees | 251 | 15.4% |
| Federal Government Employees | 123 | 7.5% |
| Unpaid Family Workers | 0 | 0.0% |
| Total | 1,629 | 100.0% |
Employment Status by Age in Hidalgo County
According to the labor force statistics for Hidalgo County, out of the total population over 16 years of age (3,289), 52.1% or 1,714 individuals are in the labor force, with 4.4% or 75 of them unemployed. The age group with the highest labor force participation rate is 45 to 54 years, with 79.3% or 333 individuals in the labor force. Within the labor force, the 16 to 19 years age range has the highest percentage of unemployed individuals, with 20.0% or 13 of them being unemployed.
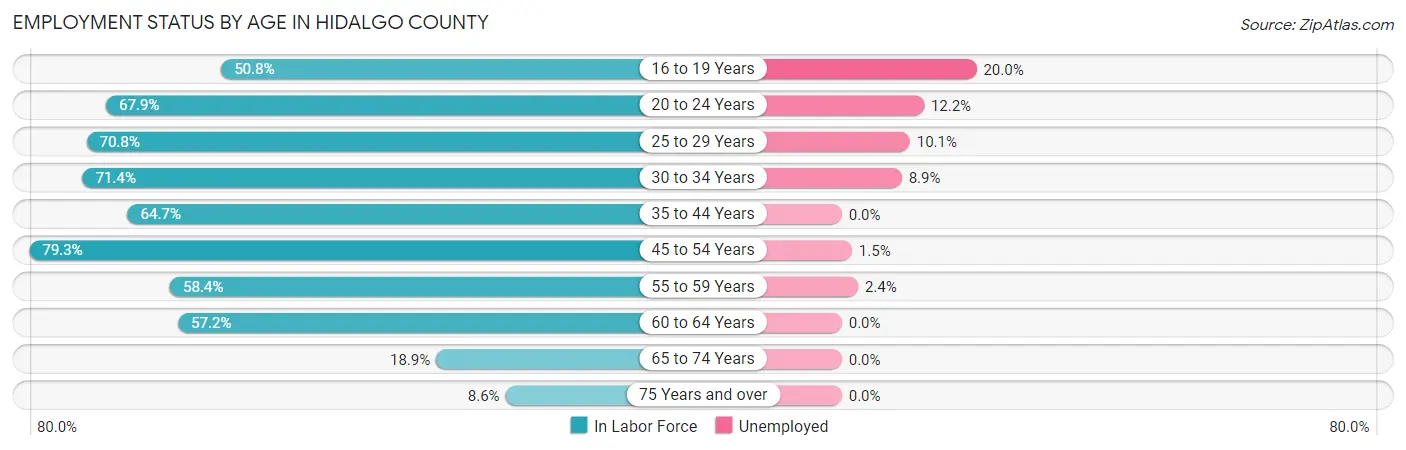
| Age Bracket | In Labor Force | Unemployed |
| 16 to 19 Years | 67 (50.8%) | 13 (20.0%) |
| 20 to 24 Years | 169 (67.9%) | 21 (12.2%) |
| 25 to 29 Years | 189 (70.8%) | 19 (10.1%) |
| 30 to 34 Years | 180 (71.4%) | 16 (8.9%) |
| 35 to 44 Years | 284 (64.7%) | 0 (0.0%) |
| 45 to 54 Years | 333 (79.3%) | 5 (1.5%) |
| 55 to 59 Years | 206 (58.4%) | 5 (2.4%) |
| 60 to 64 Years | 154 (57.2%) | 0 (0.0%) |
| 65 to 74 Years | 101 (18.9%) | 0 (0.0%) |
| 75 Years and over | 32 (8.6%) | 0 (0.0%) |
| Total | 1,714 (52.1%) | 75 (4.4%) |
Employment Status by Educational Attainment in Hidalgo County
According to labor force statistics for Hidalgo County, 67.3% of individuals (1,346) out of the total population between 25 and 64 years of age (2,000) are in the labor force, with 3.3% or 44 of them being unemployed. The group with the highest labor force participation rate are those with the educational attainment of college / associate degree, with 81.8% or 525 individuals in the labor force. Within the labor force, individuals with less than high school education have the highest percentage of unemployment, with 5.0% or 7 of them being unemployed.
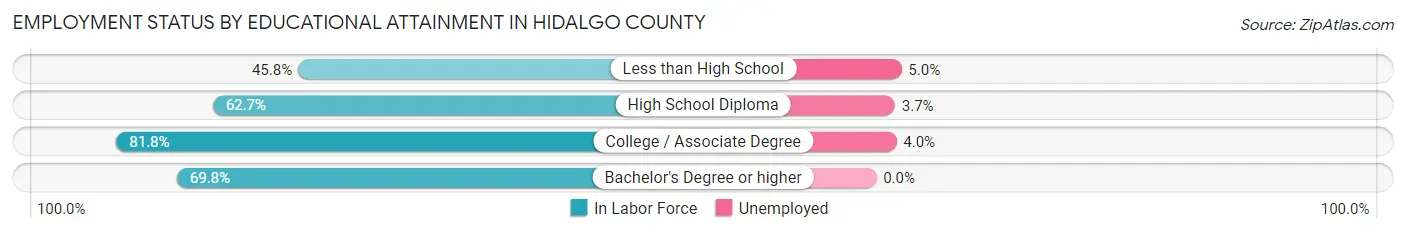
| Educational Attainment | In Labor Force | Unemployed |
| Less than High School | 141 (45.8%) | 15 (5.0%) |
| High School Diploma | 465 (62.7%) | 27 (3.7%) |
| College / Associate Degree | 525 (81.8%) | 26 (4.0%) |
| Bachelor's Degree or higher | 215 (69.8%) | 0 (0.0%) |
| Total | 1,346 (67.3%) | 66 (3.3%) |
Employment Occupations by Sex in Hidalgo County
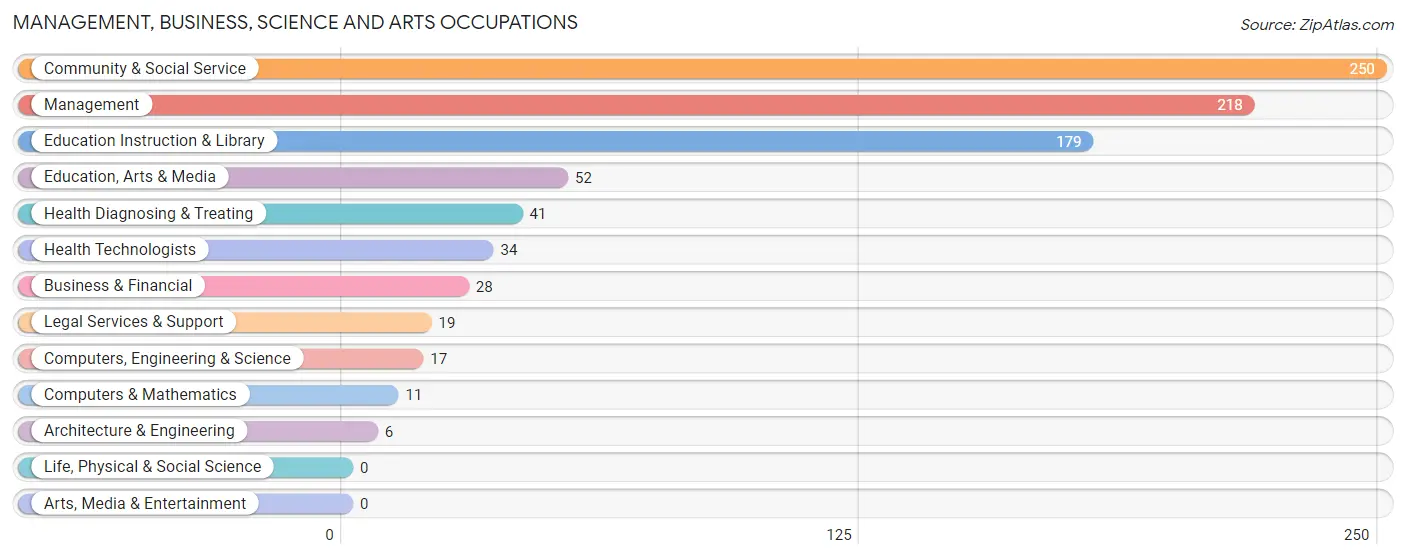
Management, Business, Science and Arts Occupations
The most common Management, Business, Science and Arts occupations in Hidalgo County are Community & Social Service (250 | 15.7%), Management (218 | 13.7%), Education Instruction & Library (179 | 11.2%), Education, Arts & Media (52 | 3.3%), and Health Diagnosing & Treating (41 | 2.6%).
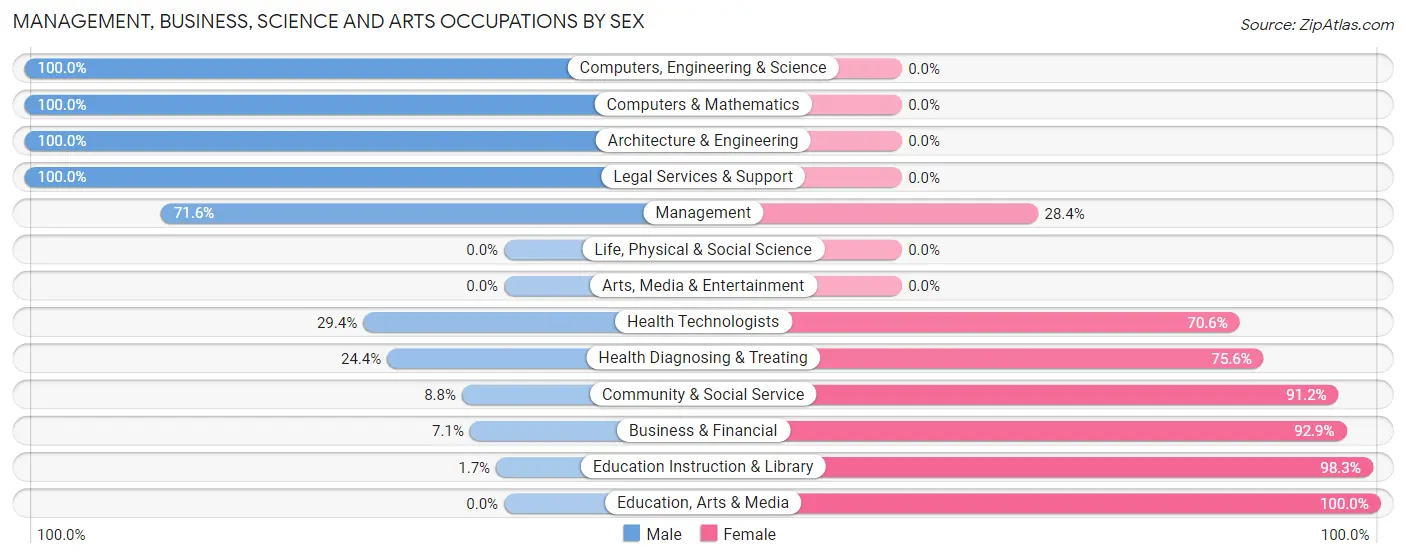
Management, Business, Science and Arts Occupations by Sex
Within the Management, Business, Science and Arts occupations in Hidalgo County, the most male-oriented occupations are Computers, Engineering & Science (100.0%), Computers & Mathematics (100.0%), and Architecture & Engineering (100.0%), while the most female-oriented occupations are Education, Arts & Media (100.0%), Education Instruction & Library (98.3%), and Business & Financial (92.9%).
| Occupation | Male | Female |
| Management | 156 (71.6%) | 62 (28.4%) |
| Business & Financial | 2 (7.1%) | 26 (92.9%) |
| Computers, Engineering & Science | 17 (100.0%) | 0 (0.0%) |
| Computers & Mathematics | 11 (100.0%) | 0 (0.0%) |
| Architecture & Engineering | 6 (100.0%) | 0 (0.0%) |
| Life, Physical & Social Science | 0 (0.0%) | 0 (0.0%) |
| Community & Social Service | 22 (8.8%) | 228 (91.2%) |
| Education, Arts & Media | 0 (0.0%) | 52 (100.0%) |
| Legal Services & Support | 19 (100.0%) | 0 (0.0%) |
| Education Instruction & Library | 3 (1.7%) | 176 (98.3%) |
| Arts, Media & Entertainment | 0 (0.0%) | 0 (0.0%) |
| Health Diagnosing & Treating | 10 (24.4%) | 31 (75.6%) |
| Health Technologists | 10 (29.4%) | 24 (70.6%) |
| Total (Category) | 207 (37.4%) | 347 (62.6%) |
| Total (Overall) | 767 (48.1%) | 827 (51.9%) |
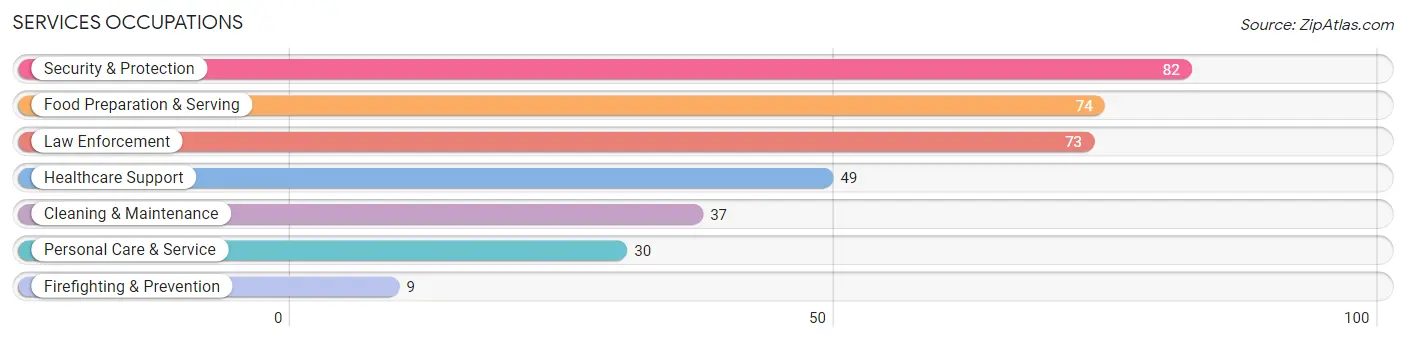
Services Occupations
The most common Services occupations in Hidalgo County are Security & Protection (82 | 5.1%), Food Preparation & Serving (74 | 4.6%), Law Enforcement (73 | 4.6%), Healthcare Support (49 | 3.1%), and Cleaning & Maintenance (37 | 2.3%).
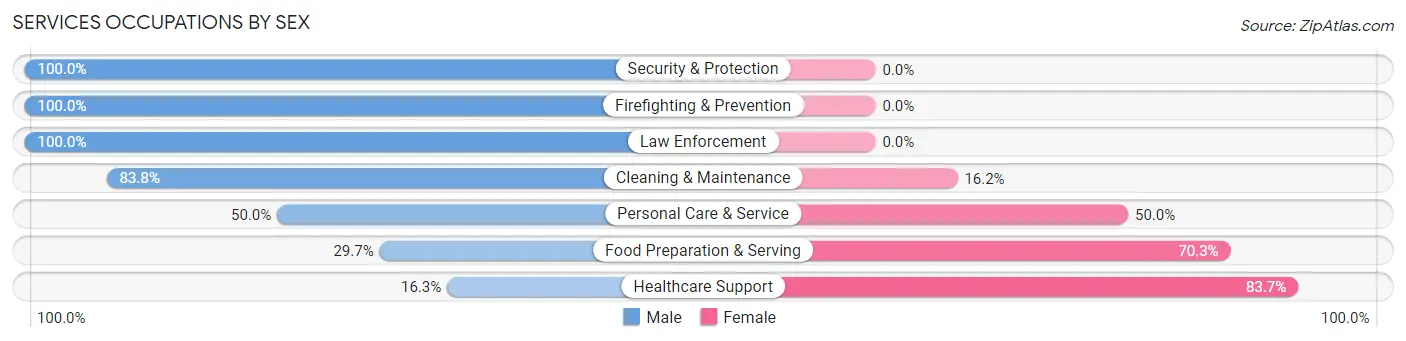
Services Occupations by Sex
Within the Services occupations in Hidalgo County, the most male-oriented occupations are Security & Protection (100.0%), Firefighting & Prevention (100.0%), and Law Enforcement (100.0%), while the most female-oriented occupations are Healthcare Support (83.7%), Food Preparation & Serving (70.3%), and Personal Care & Service (50.0%).
| Occupation | Male | Female |
| Healthcare Support | 8 (16.3%) | 41 (83.7%) |
| Security & Protection | 82 (100.0%) | 0 (0.0%) |
| Firefighting & Prevention | 9 (100.0%) | 0 (0.0%) |
| Law Enforcement | 73 (100.0%) | 0 (0.0%) |
| Food Preparation & Serving | 22 (29.7%) | 52 (70.3%) |
| Cleaning & Maintenance | 31 (83.8%) | 6 (16.2%) |
| Personal Care & Service | 15 (50.0%) | 15 (50.0%) |
| Total (Category) | 158 (58.1%) | 114 (41.9%) |
| Total (Overall) | 767 (48.1%) | 827 (51.9%) |
Sales and Office Occupations
The most common Sales and Office occupations in Hidalgo County are Office & Administration (204 | 12.8%), and Sales & Related (139 | 8.7%).
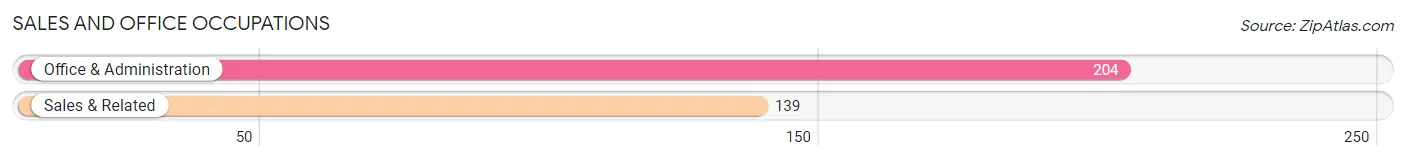
Sales and Office Occupations by Sex
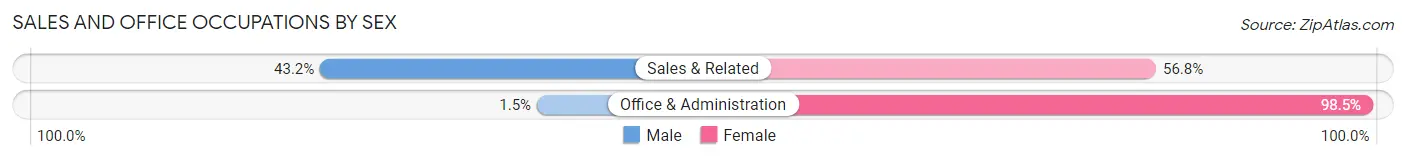
| Occupation | Male | Female |
| Sales & Related | 60 (43.2%) | 79 (56.8%) |
| Office & Administration | 3 (1.5%) | 201 (98.5%) |
| Total (Category) | 63 (18.4%) | 280 (81.6%) |
| Total (Overall) | 767 (48.1%) | 827 (51.9%) |
Natural Resources, Construction and Maintenance Occupations
The most common Natural Resources, Construction and Maintenance occupations in Hidalgo County are Construction & Extraction (180 | 11.3%), Farming, Fishing & Forestry (50 | 3.1%), and Installation, Maintenance & Repair (44 | 2.8%).
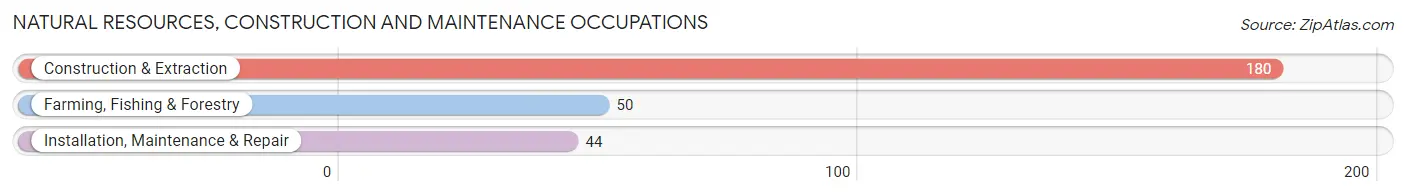
Natural Resources, Construction and Maintenance Occupations by Sex
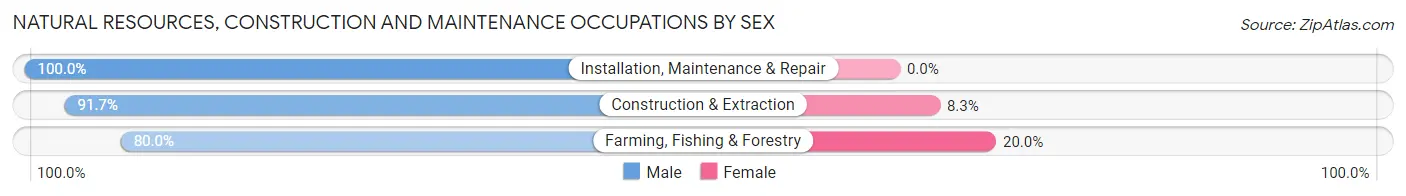
| Occupation | Male | Female |
| Farming, Fishing & Forestry | 40 (80.0%) | 10 (20.0%) |
| Construction & Extraction | 165 (91.7%) | 15 (8.3%) |
| Installation, Maintenance & Repair | 44 (100.0%) | 0 (0.0%) |
| Total (Category) | 249 (90.9%) | 25 (9.1%) |
| Total (Overall) | 767 (48.1%) | 827 (51.9%) |
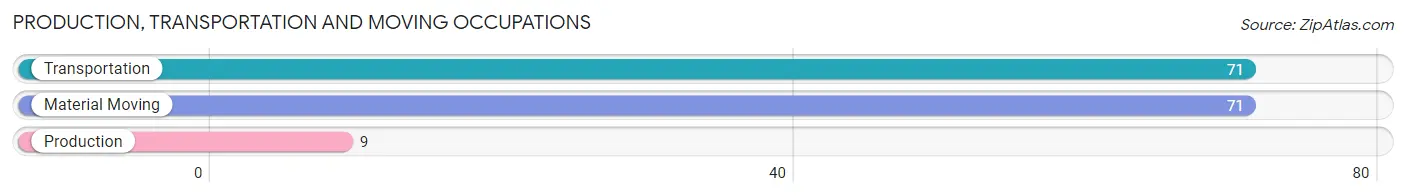
Production, Transportation and Moving Occupations
The most common Production, Transportation and Moving occupations in Hidalgo County are Transportation (71 | 4.4%), Material Moving (71 | 4.4%), and Production (9 | 0.6%).
Production, Transportation and Moving Occupations by Sex
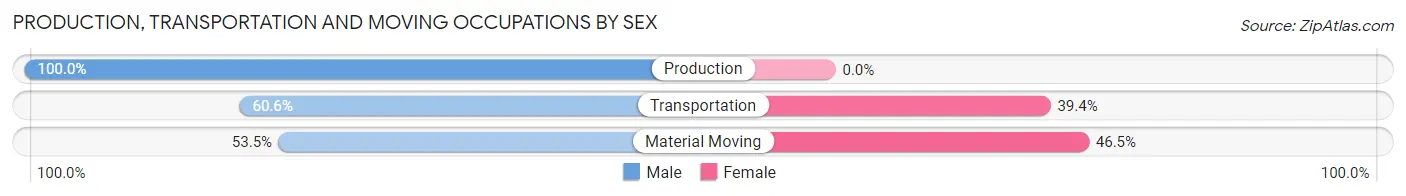
| Occupation | Male | Female |
| Production | 9 (100.0%) | 0 (0.0%) |
| Transportation | 43 (60.6%) | 28 (39.4%) |
| Material Moving | 38 (53.5%) | 33 (46.5%) |
| Total (Category) | 90 (59.6%) | 61 (40.4%) |
| Total (Overall) | 767 (48.1%) | 827 (51.9%) |
Employment Industries by Sex in Hidalgo County
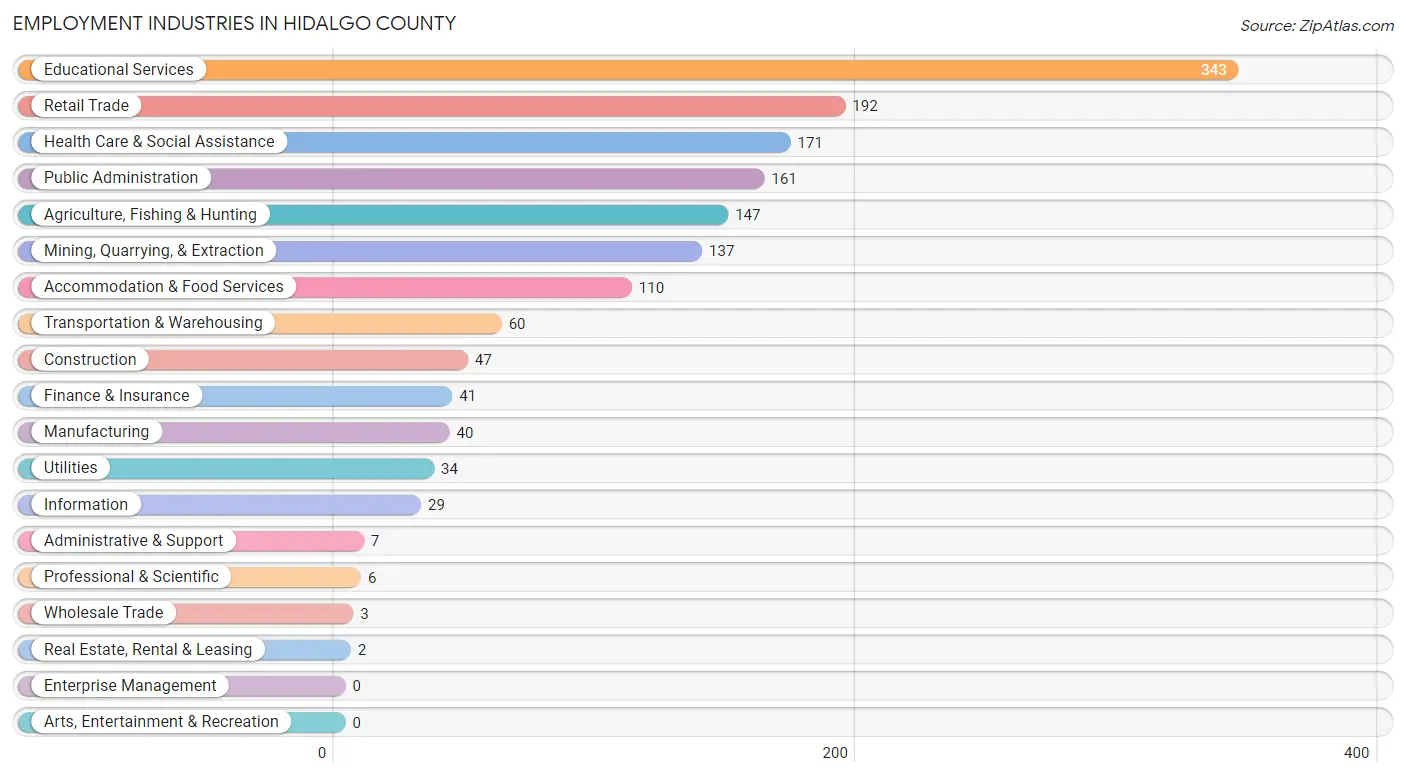
Employment Industries in Hidalgo County
The major employment industries in Hidalgo County include Educational Services (343 | 21.5%), Retail Trade (192 | 12.0%), Health Care & Social Assistance (171 | 10.7%), Public Administration (161 | 10.1%), and Agriculture, Fishing & Hunting (147 | 9.2%).
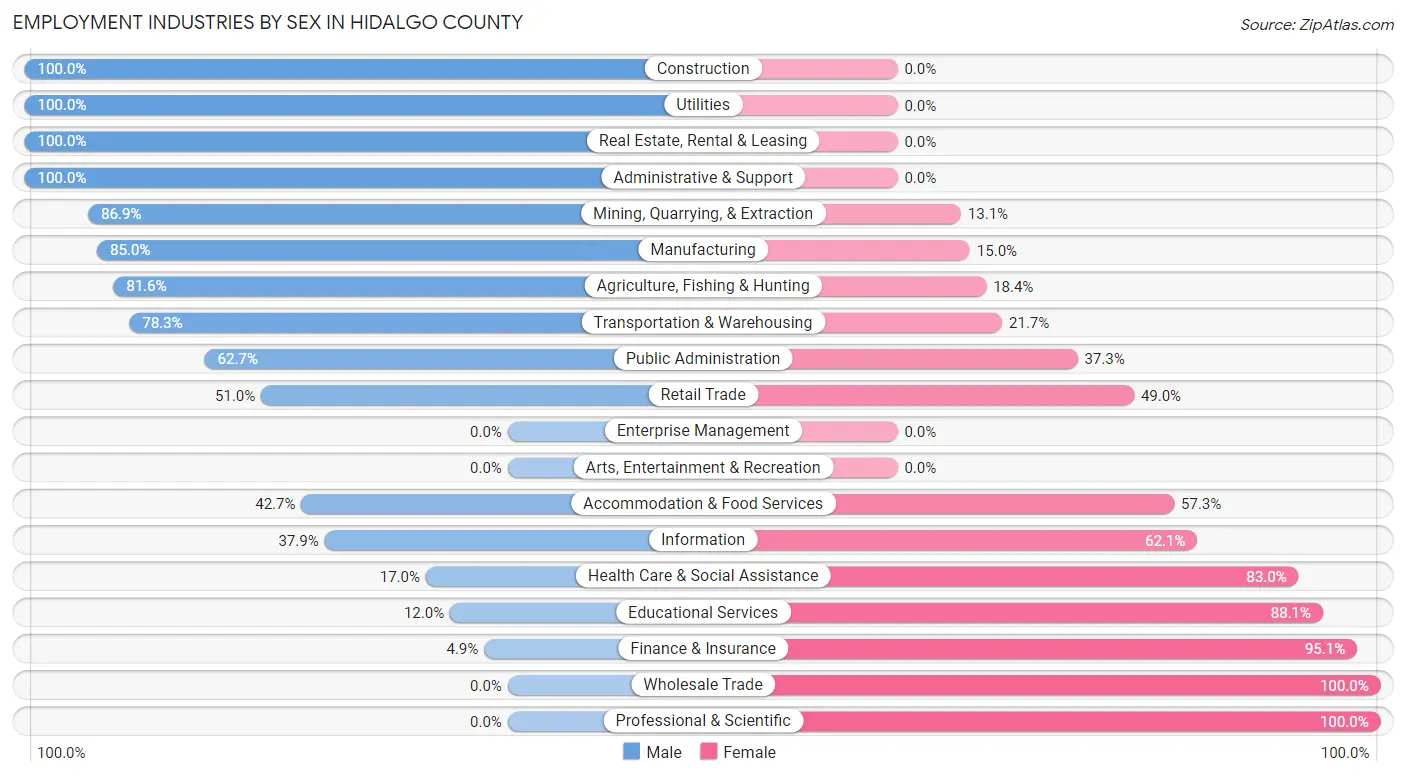
Employment Industries by Sex in Hidalgo County
The Hidalgo County industries that see more men than women are Construction (100.0%), Utilities (100.0%), and Real Estate, Rental & Leasing (100.0%), whereas the industries that tend to have a higher number of women are Wholesale Trade (100.0%), Professional & Scientific (100.0%), and Finance & Insurance (95.1%).
| Industry | Male | Female |
| Agriculture, Fishing & Hunting | 120 (81.6%) | 27 (18.4%) |
| Mining, Quarrying, & Extraction | 119 (86.9%) | 18 (13.1%) |
| Construction | 47 (100.0%) | 0 (0.0%) |
| Manufacturing | 34 (85.0%) | 6 (15.0%) |
| Wholesale Trade | 0 (0.0%) | 3 (100.0%) |
| Retail Trade | 98 (51.0%) | 94 (49.0%) |
| Transportation & Warehousing | 47 (78.3%) | 13 (21.7%) |
| Utilities | 34 (100.0%) | 0 (0.0%) |
| Information | 11 (37.9%) | 18 (62.1%) |
| Finance & Insurance | 2 (4.9%) | 39 (95.1%) |
| Real Estate, Rental & Leasing | 2 (100.0%) | 0 (0.0%) |
| Professional & Scientific | 0 (0.0%) | 6 (100.0%) |
| Enterprise Management | 0 (0.0%) | 0 (0.0%) |
| Administrative & Support | 7 (100.0%) | 0 (0.0%) |
| Educational Services | 41 (11.9%) | 302 (88.0%) |
| Health Care & Social Assistance | 29 (17.0%) | 142 (83.0%) |
| Arts, Entertainment & Recreation | 0 (0.0%) | 0 (0.0%) |
| Accommodation & Food Services | 47 (42.7%) | 63 (57.3%) |
| Public Administration | 101 (62.7%) | 60 (37.3%) |
| Total | 767 (48.1%) | 827 (51.9%) |
Education in Hidalgo County
School Enrollment in Hidalgo County
The most common levels of schooling among the 743 students in Hidalgo County are elementary school (238 | 32.0%), middle school (209 | 28.1%), and high school (171 | 23.0%).
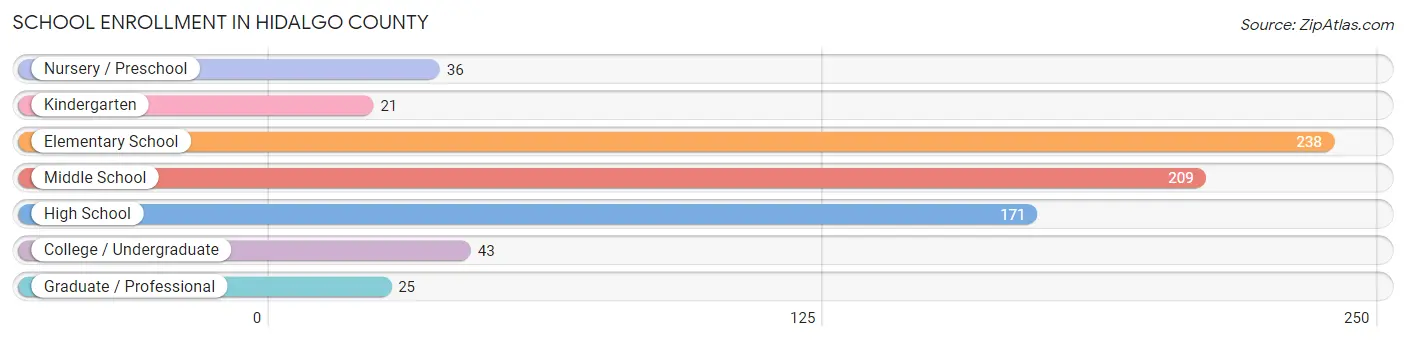
| School Level | # Students | % Students |
| Nursery / Preschool | 36 | 4.9% |
| Kindergarten | 21 | 2.8% |
| Elementary School | 238 | 32.0% |
| Middle School | 209 | 28.1% |
| High School | 171 | 23.0% |
| College / Undergraduate | 43 | 5.8% |
| Graduate / Professional | 25 | 3.4% |
| Total | 743 | 100.0% |
School Enrollment by Age by Funding Source in Hidalgo County
Out of a total of 743 students who are enrolled in schools in Hidalgo County, 19 (2.6%) attend a private institution, while the remaining 724 (97.4%) are enrolled in public schools. The age group of 18 to 19 year olds has the highest likelihood of being enrolled in private schools, with 15 (44.1% in the age bracket) enrolled. Conversely, the age group of 3 to 4 year olds has the lowest likelihood of being enrolled in a private school, with 29 (100.0% in the age bracket) attending a public institution.
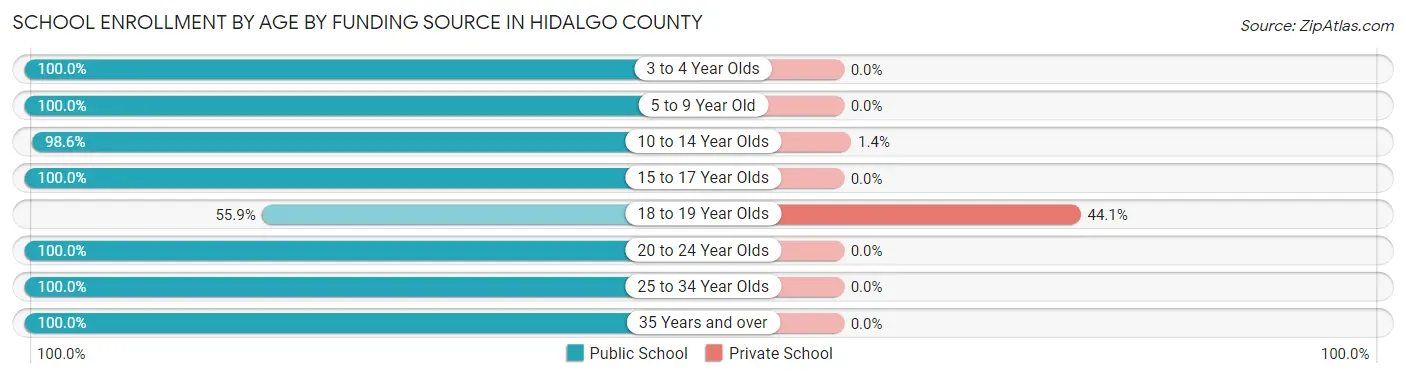
| Age Bracket | Public School | Private School |
| 3 to 4 Year Olds | 29 (100.0%) | 0 (0.0%) |
| 5 to 9 Year Old | 232 (100.0%) | 0 (0.0%) |
| 10 to 14 Year Olds | 283 (98.6%) | 4 (1.4%) |
| 15 to 17 Year Olds | 78 (100.0%) | 0 (0.0%) |
| 18 to 19 Year Olds | 19 (55.9%) | 15 (44.1%) |
| 20 to 24 Year Olds | 50 (100.0%) | 0 (0.0%) |
| 25 to 34 Year Olds | 8 (100.0%) | 0 (0.0%) |
| 35 Years and over | 25 (100.0%) | 0 (0.0%) |
| Total | 724 (97.4%) | 19 (2.6%) |
Educational Attainment by Field of Study in Hidalgo County
Education (128 | 23.3%), bio, nature & agricultural (86 | 15.6%), business (74 | 13.5%), arts & humanities (68 | 12.4%), and liberal arts & history (52 | 9.5%) are the most common fields of study among 550 individuals in Hidalgo County who have obtained a bachelor's degree or higher.
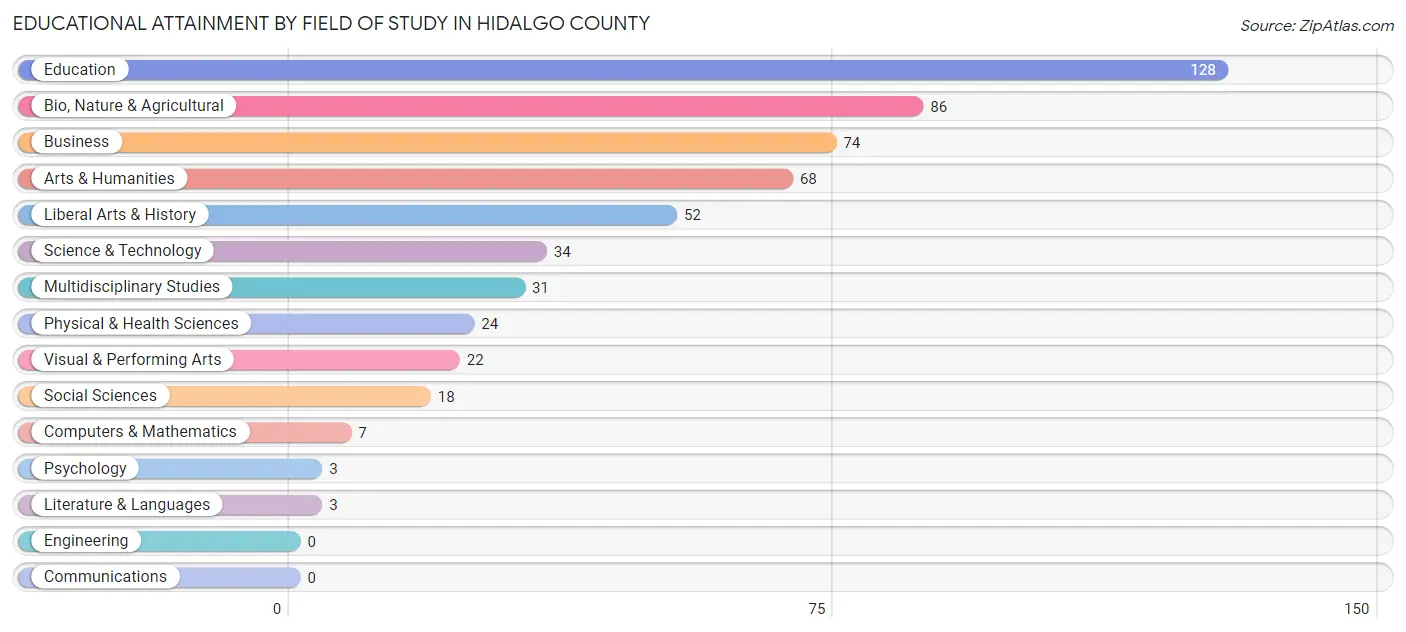
| Field of Study | # Graduates | % Graduates |
| Computers & Mathematics | 7 | 1.3% |
| Bio, Nature & Agricultural | 86 | 15.6% |
| Physical & Health Sciences | 24 | 4.4% |
| Psychology | 3 | 0.5% |
| Social Sciences | 18 | 3.3% |
| Engineering | 0 | 0.0% |
| Multidisciplinary Studies | 31 | 5.6% |
| Science & Technology | 34 | 6.2% |
| Business | 74 | 13.5% |
| Education | 128 | 23.3% |
| Literature & Languages | 3 | 0.5% |
| Liberal Arts & History | 52 | 9.5% |
| Visual & Performing Arts | 22 | 4.0% |
| Communications | 0 | 0.0% |
| Arts & Humanities | 68 | 12.4% |
| Total | 550 | 100.0% |
Transportation & Commute in Hidalgo County
Vehicle Availability by Sex in Hidalgo County
The most prevalent vehicle ownership categories in Hidalgo County are males with 2 vehicles (301, accounting for 39.8%) and females with 2 vehicles (373, making up 36.5%).
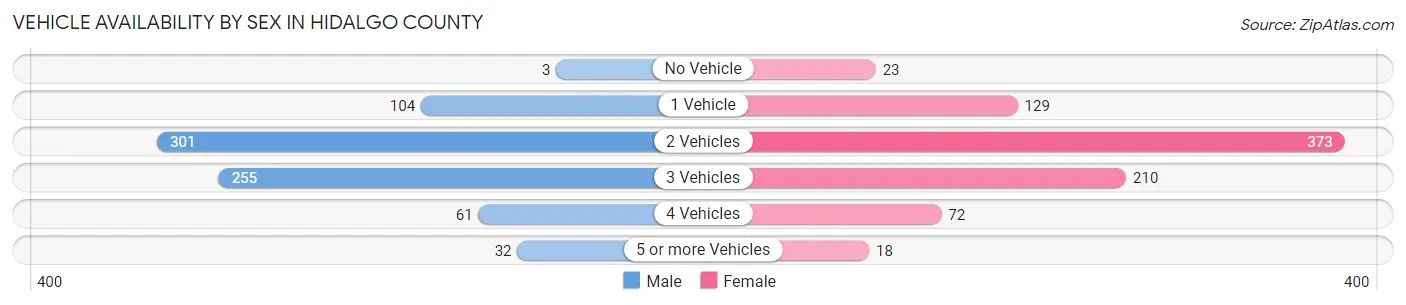
| Vehicles Available | Male | Female |
| No Vehicle | 3 (0.4%) | 23 (2.8%) |
| 1 Vehicle | 104 (13.8%) | 129 (15.6%) |
| 2 Vehicles | 301 (39.8%) | 373 (45.2%) |
| 3 Vehicles | 255 (33.7%) | 210 (25.5%) |
| 4 Vehicles | 61 (8.1%) | 72 (8.7%) |
| 5 or more Vehicles | 32 (4.2%) | 18 (2.2%) |
| Total | 756 (100.0%) | 825 (100.0%) |
Commute Time in Hidalgo County
The most frequently occuring commute durations in Hidalgo County are 5 to 9 minutes (367 commuters, 23.8%), 10 to 14 minutes (298 commuters, 19.4%), and less than 5 minutes (176 commuters, 11.4%).
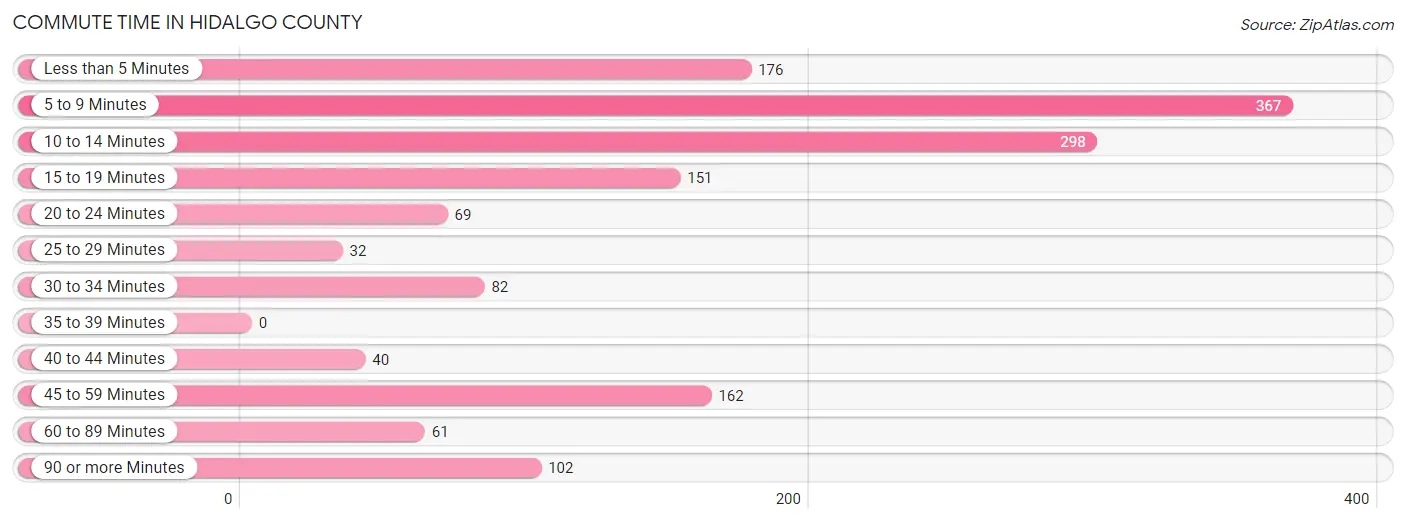
| Commute Time | # Commuters | % Commuters |
| Less than 5 Minutes | 176 | 11.4% |
| 5 to 9 Minutes | 367 | 23.8% |
| 10 to 14 Minutes | 298 | 19.4% |
| 15 to 19 Minutes | 151 | 9.8% |
| 20 to 24 Minutes | 69 | 4.5% |
| 25 to 29 Minutes | 32 | 2.1% |
| 30 to 34 Minutes | 82 | 5.3% |
| 35 to 39 Minutes | 0 | 0.0% |
| 40 to 44 Minutes | 40 | 2.6% |
| 45 to 59 Minutes | 162 | 10.5% |
| 60 to 89 Minutes | 61 | 4.0% |
| 90 or more Minutes | 102 | 6.6% |
Commute Time by Sex in Hidalgo County
The most common commute times in Hidalgo County are 5 to 9 minutes (133 commuters, 17.1%) for males and 5 to 9 minutes (234 commuters, 30.8%) for females.
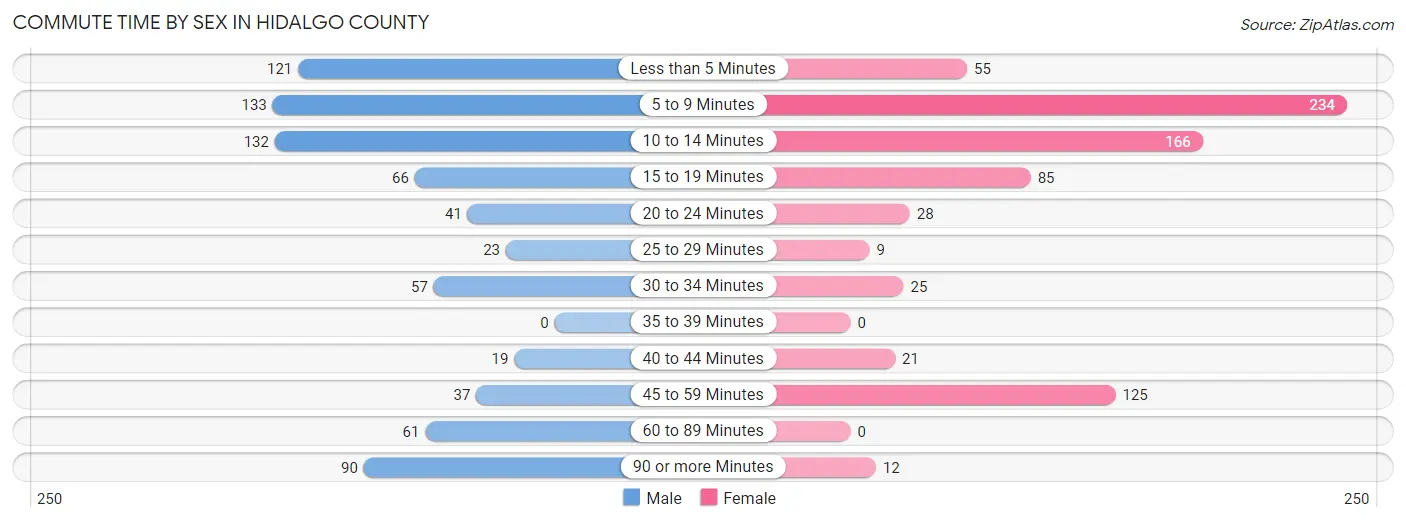
| Commute Time | Male | Female |
| Less than 5 Minutes | 121 (15.5%) | 55 (7.2%) |
| 5 to 9 Minutes | 133 (17.1%) | 234 (30.8%) |
| 10 to 14 Minutes | 132 (16.9%) | 166 (21.8%) |
| 15 to 19 Minutes | 66 (8.5%) | 85 (11.2%) |
| 20 to 24 Minutes | 41 (5.3%) | 28 (3.7%) |
| 25 to 29 Minutes | 23 (2.9%) | 9 (1.2%) |
| 30 to 34 Minutes | 57 (7.3%) | 25 (3.3%) |
| 35 to 39 Minutes | 0 (0.0%) | 0 (0.0%) |
| 40 to 44 Minutes | 19 (2.4%) | 21 (2.8%) |
| 45 to 59 Minutes | 37 (4.7%) | 125 (16.5%) |
| 60 to 89 Minutes | 61 (7.8%) | 0 (0.0%) |
| 90 or more Minutes | 90 (11.5%) | 12 (1.6%) |
Time of Departure to Work by Sex in Hidalgo County
The most frequent times of departure to work in Hidalgo County are 6:30 AM to 6:59 AM (116, 14.9%) for males and 7:30 AM to 7:59 AM (197, 25.9%) for females.

| Time of Departure | Male | Female |
| 12:00 AM to 4:59 AM | 96 (12.3%) | 11 (1.5%) |
| 5:00 AM to 5:29 AM | 88 (11.3%) | 28 (3.7%) |
| 5:30 AM to 5:59 AM | 16 (2.1%) | 27 (3.5%) |
| 6:00 AM to 6:29 AM | 101 (13.0%) | 31 (4.1%) |
| 6:30 AM to 6:59 AM | 116 (14.9%) | 16 (2.1%) |
| 7:00 AM to 7:29 AM | 83 (10.6%) | 174 (22.9%) |
| 7:30 AM to 7:59 AM | 116 (14.9%) | 197 (25.9%) |
| 8:00 AM to 8:29 AM | 51 (6.5%) | 40 (5.3%) |
| 8:30 AM to 8:59 AM | 6 (0.8%) | 36 (4.7%) |
| 9:00 AM to 9:59 AM | 10 (1.3%) | 63 (8.3%) |
| 10:00 AM to 10:59 AM | 13 (1.7%) | 8 (1.1%) |
| 11:00 AM to 11:59 AM | 0 (0.0%) | 0 (0.0%) |
| 12:00 PM to 3:59 PM | 43 (5.5%) | 26 (3.4%) |
| 4:00 PM to 11:59 PM | 41 (5.3%) | 103 (13.6%) |
| Total | 780 (100.0%) | 760 (100.0%) |
Housing Occupancy in Hidalgo County
Occupancy by Ownership in Hidalgo County
Of the total 1,557 dwellings in Hidalgo County, owner-occupied units account for 1,100 (70.7%), while renter-occupied units make up 457 (29.3%).
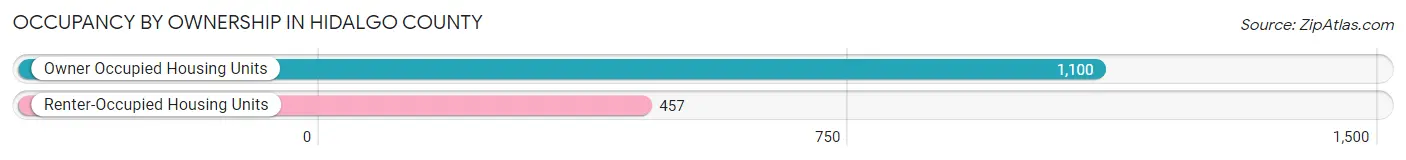
| Occupancy | # Housing Units | % Housing Units |
| Owner Occupied Housing Units | 1,100 | 70.7% |
| Renter-Occupied Housing Units | 457 | 29.3% |
| Total Occupied Housing Units | 1,557 | 100.0% |
Occupancy by Household Size in Hidalgo County
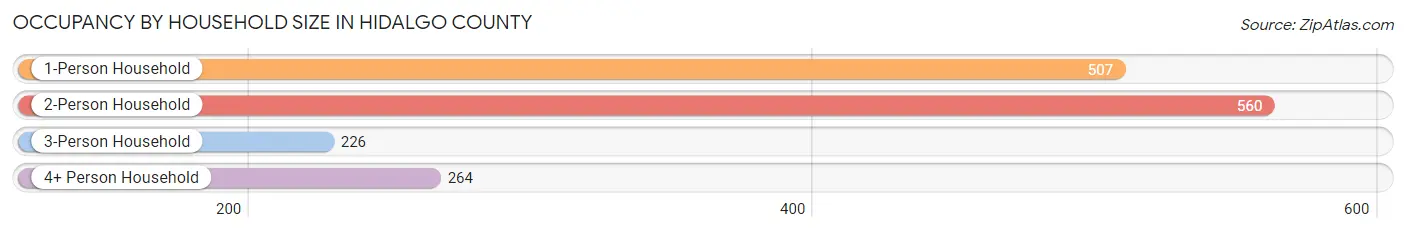
| Household Size | # Housing Units | % Housing Units |
| 1-Person Household | 507 | 32.6% |
| 2-Person Household | 560 | 36.0% |
| 3-Person Household | 226 | 14.5% |
| 4+ Person Household | 264 | 17.0% |
| Total Housing Units | 1,557 | 100.0% |
Occupancy by Ownership by Household Size in Hidalgo County
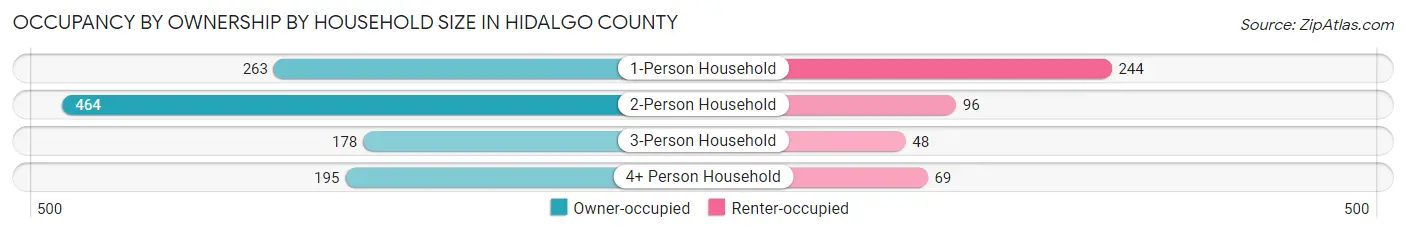
| Household Size | Owner-occupied | Renter-occupied |
| 1-Person Household | 263 (51.9%) | 244 (48.1%) |
| 2-Person Household | 464 (82.9%) | 96 (17.1%) |
| 3-Person Household | 178 (78.8%) | 48 (21.2%) |
| 4+ Person Household | 195 (73.9%) | 69 (26.1%) |
| Total Housing Units | 1,100 (70.7%) | 457 (29.3%) |
Occupancy by Educational Attainment in Hidalgo County
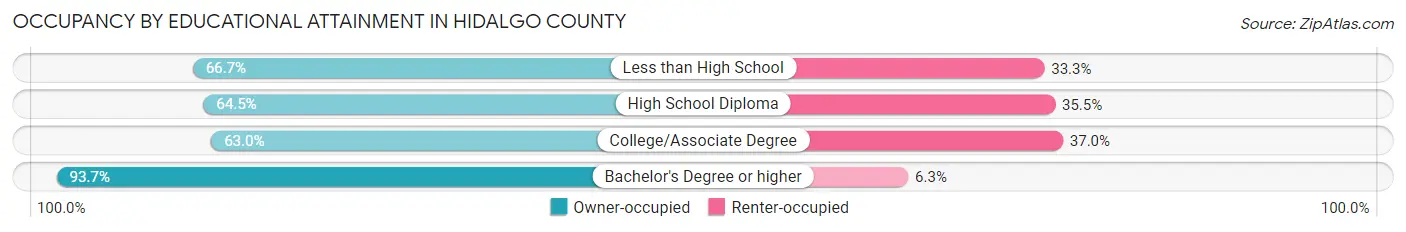
| Household Size | Owner-occupied | Renter-occupied |
| Less than High School | 194 (66.7%) | 97 (33.3%) |
| High School Diploma | 293 (64.5%) | 161 (35.5%) |
| College/Associate Degree | 303 (63.0%) | 178 (37.0%) |
| Bachelor's Degree or higher | 310 (93.7%) | 21 (6.3%) |
Occupancy by Age of Householder in Hidalgo County
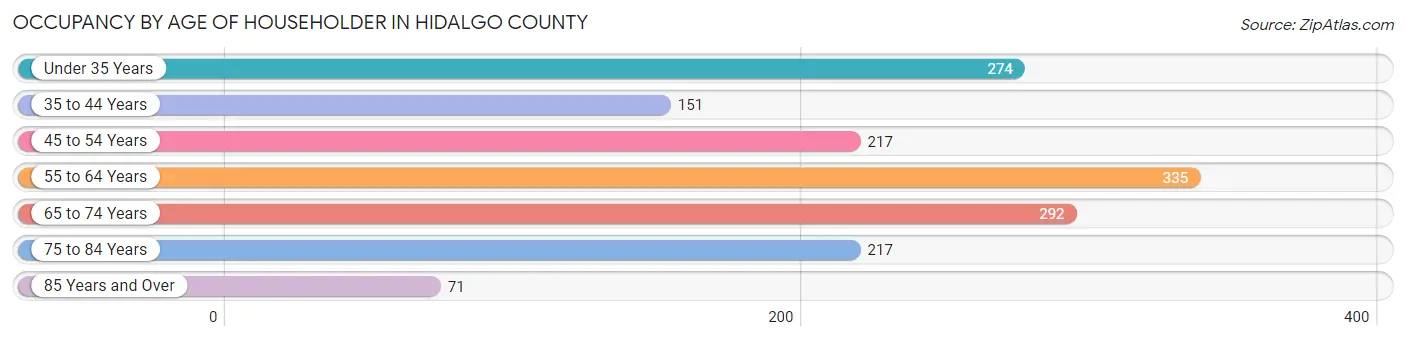
| Age Bracket | # Households | % Households |
| Under 35 Years | 274 | 17.6% |
| 35 to 44 Years | 151 | 9.7% |
| 45 to 54 Years | 217 | 13.9% |
| 55 to 64 Years | 335 | 21.5% |
| 65 to 74 Years | 292 | 18.8% |
| 75 to 84 Years | 217 | 13.9% |
| 85 Years and Over | 71 | 4.6% |
| Total | 1,557 | 100.0% |
Housing Finances in Hidalgo County
Median Income by Occupancy in Hidalgo County
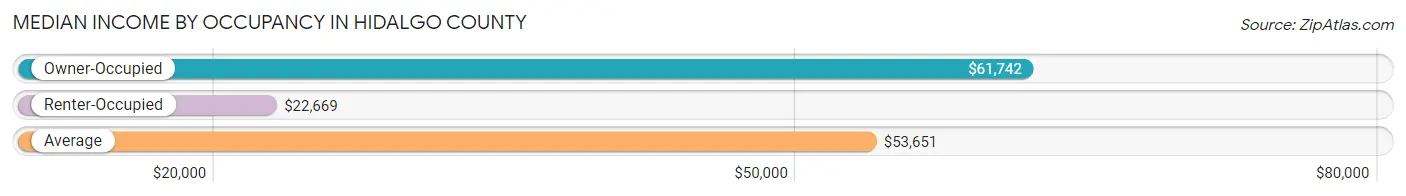
| Occupancy Type | # Households | Median Income |
| Owner-Occupied | 1,100 (70.7%) | $61,742 |
| Renter-Occupied | 457 (29.3%) | $22,669 |
| Average | 1,557 (100.0%) | $53,651 |
Occupancy by Householder Income Bracket in Hidalgo County
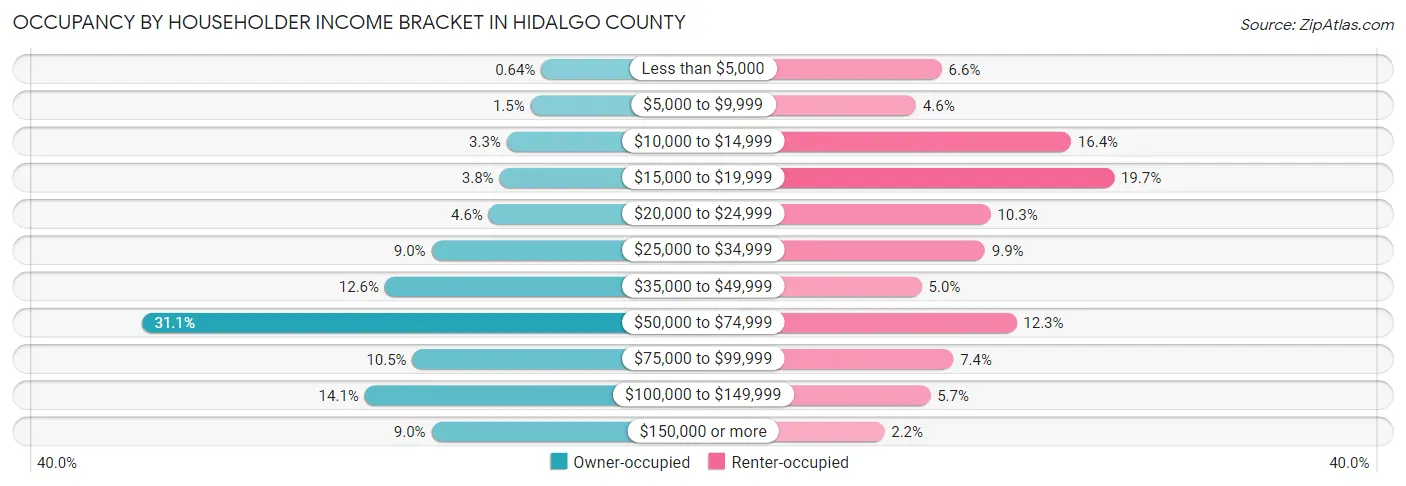
| Income Bracket | Owner-occupied | Renter-occupied |
| Less than $5,000 | 7 (0.6%) | 30 (6.6%) |
| $5,000 to $9,999 | 16 (1.5%) | 21 (4.6%) |
| $10,000 to $14,999 | 36 (3.3%) | 75 (16.4%) |
| $15,000 to $19,999 | 42 (3.8%) | 90 (19.7%) |
| $20,000 to $24,999 | 51 (4.6%) | 47 (10.3%) |
| $25,000 to $34,999 | 99 (9.0%) | 45 (9.9%) |
| $35,000 to $49,999 | 138 (12.6%) | 23 (5.0%) |
| $50,000 to $74,999 | 342 (31.1%) | 56 (12.2%) |
| $75,000 to $99,999 | 115 (10.4%) | 34 (7.4%) |
| $100,000 to $149,999 | 155 (14.1%) | 26 (5.7%) |
| $150,000 or more | 99 (9.0%) | 10 (2.2%) |
| Total | 1,100 (100.0%) | 457 (100.0%) |
Monthly Housing Cost Tiers in Hidalgo County
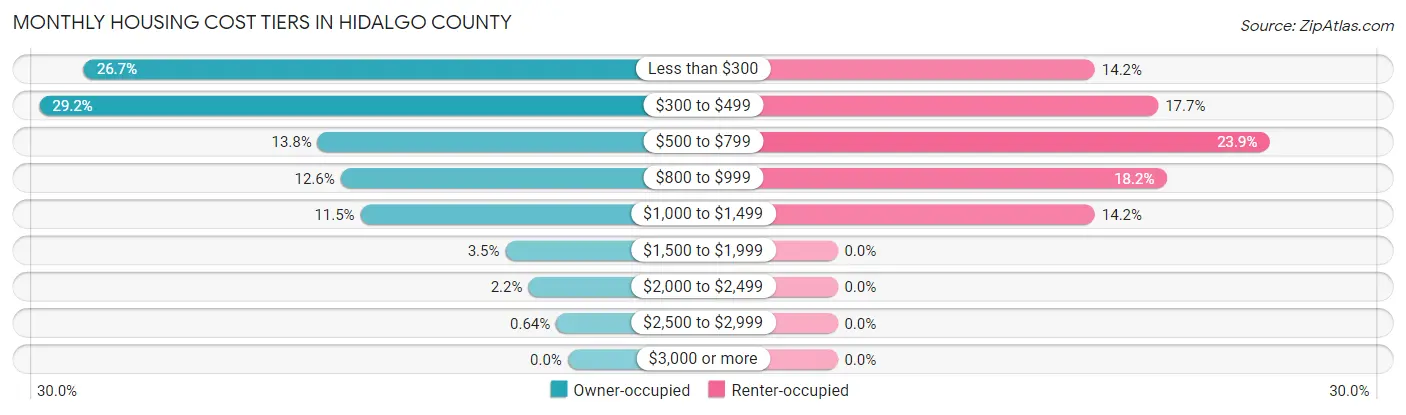
| Monthly Cost | Owner-occupied | Renter-occupied |
| Less than $300 | 294 (26.7%) | 65 (14.2%) |
| $300 to $499 | 321 (29.2%) | 81 (17.7%) |
| $500 to $799 | 152 (13.8%) | 109 (23.8%) |
| $800 to $999 | 138 (12.6%) | 83 (18.2%) |
| $1,000 to $1,499 | 126 (11.5%) | 65 (14.2%) |
| $1,500 to $1,999 | 38 (3.5%) | 0 (0.0%) |
| $2,000 to $2,499 | 24 (2.2%) | 0 (0.0%) |
| $2,500 to $2,999 | 7 (0.6%) | 0 (0.0%) |
| $3,000 or more | 0 (0.0%) | 0 (0.0%) |
| Total | 1,100 (100.0%) | 457 (100.0%) |
Physical Housing Characteristics in Hidalgo County
Housing Structures in Hidalgo County
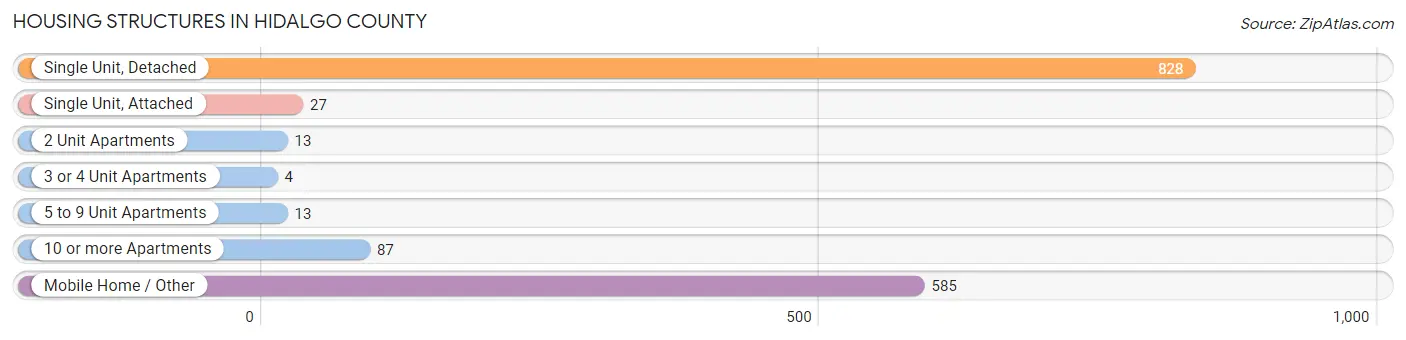
| Structure Type | # Housing Units | % Housing Units |
| Single Unit, Detached | 828 | 53.2% |
| Single Unit, Attached | 27 | 1.7% |
| 2 Unit Apartments | 13 | 0.8% |
| 3 or 4 Unit Apartments | 4 | 0.3% |
| 5 to 9 Unit Apartments | 13 | 0.8% |
| 10 or more Apartments | 87 | 5.6% |
| Mobile Home / Other | 585 | 37.6% |
| Total | 1,557 | 100.0% |
Housing Structures by Occupancy in Hidalgo County
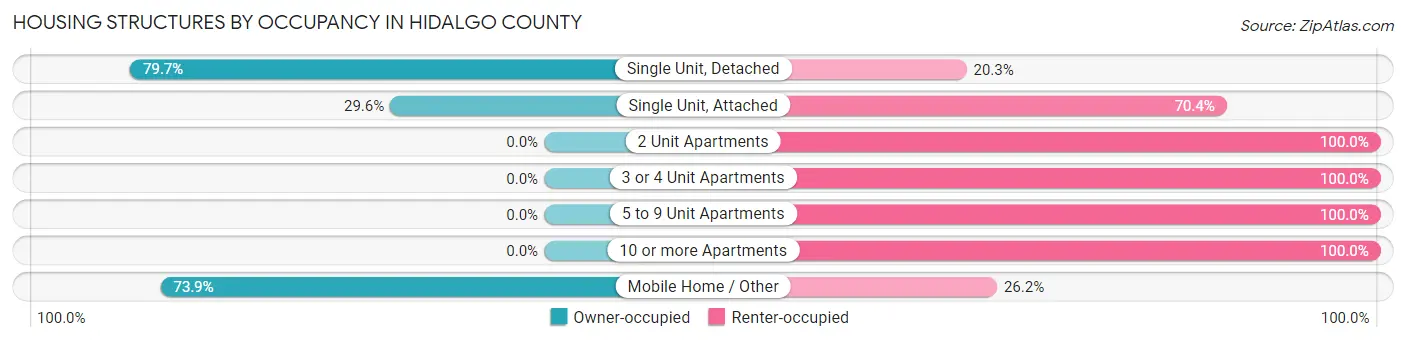
| Structure Type | Owner-occupied | Renter-occupied |
| Single Unit, Detached | 660 (79.7%) | 168 (20.3%) |
| Single Unit, Attached | 8 (29.6%) | 19 (70.4%) |
| 2 Unit Apartments | 0 (0.0%) | 13 (100.0%) |
| 3 or 4 Unit Apartments | 0 (0.0%) | 4 (100.0%) |
| 5 to 9 Unit Apartments | 0 (0.0%) | 13 (100.0%) |
| 10 or more Apartments | 0 (0.0%) | 87 (100.0%) |
| Mobile Home / Other | 432 (73.9%) | 153 (26.2%) |
| Total | 1,100 (70.7%) | 457 (29.3%) |
Housing Structures by Number of Rooms in Hidalgo County
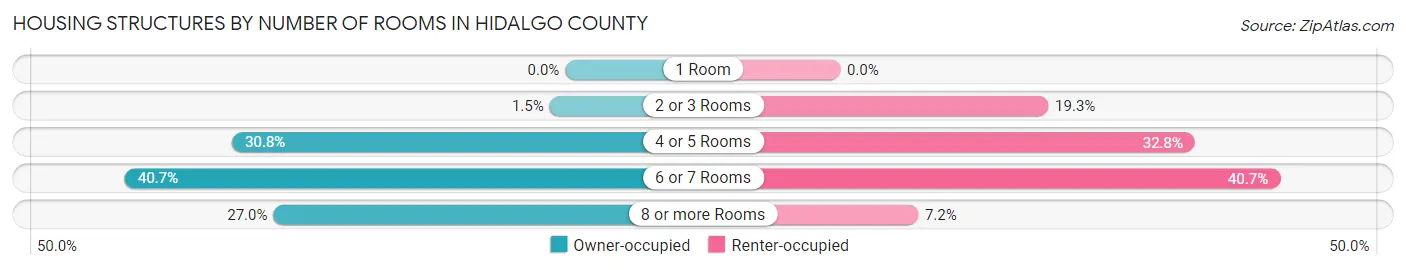
| Number of Rooms | Owner-occupied | Renter-occupied |
| 1 Room | 0 (0.0%) | 0 (0.0%) |
| 2 or 3 Rooms | 16 (1.5%) | 88 (19.3%) |
| 4 or 5 Rooms | 339 (30.8%) | 150 (32.8%) |
| 6 or 7 Rooms | 448 (40.7%) | 186 (40.7%) |
| 8 or more Rooms | 297 (27.0%) | 33 (7.2%) |
| Total | 1,100 (100.0%) | 457 (100.0%) |
Housing Structure by Heating Type in Hidalgo County
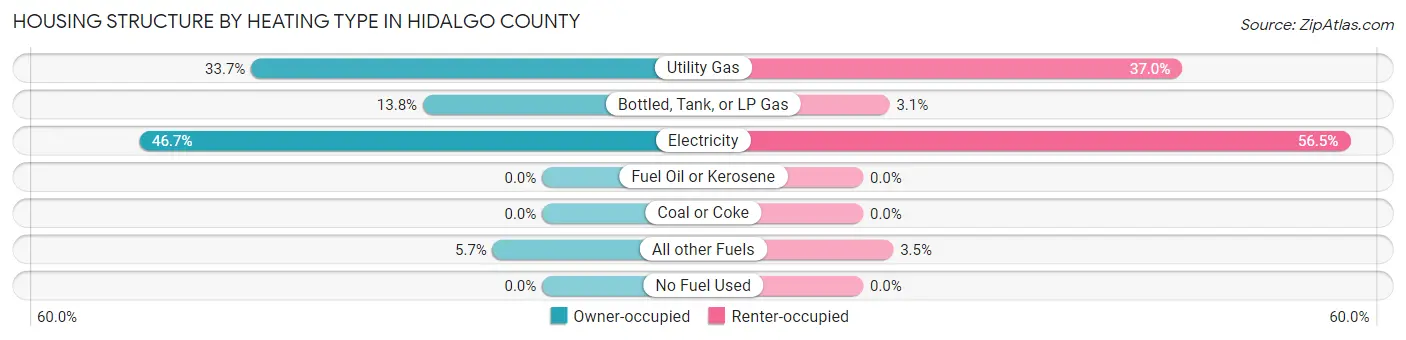
| Heating Type | Owner-occupied | Renter-occupied |
| Utility Gas | 371 (33.7%) | 169 (37.0%) |
| Bottled, Tank, or LP Gas | 152 (13.8%) | 14 (3.1%) |
| Electricity | 514 (46.7%) | 258 (56.5%) |
| Fuel Oil or Kerosene | 0 (0.0%) | 0 (0.0%) |
| Coal or Coke | 0 (0.0%) | 0 (0.0%) |
| All other Fuels | 63 (5.7%) | 16 (3.5%) |
| No Fuel Used | 0 (0.0%) | 0 (0.0%) |
| Total | 1,100 (100.0%) | 457 (100.0%) |
Household Vehicle Usage in Hidalgo County
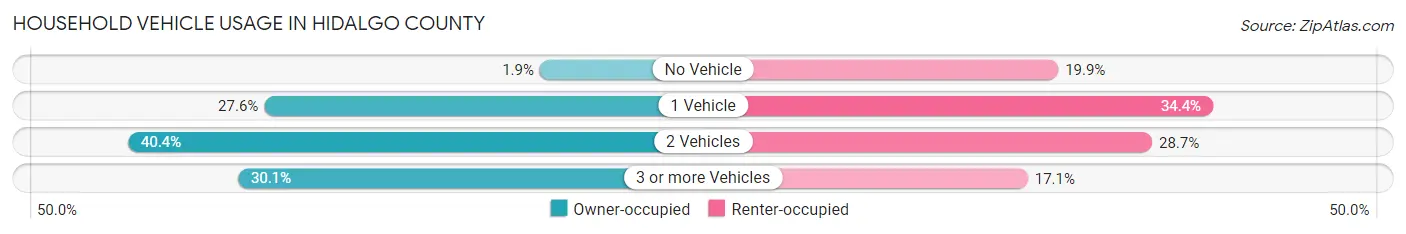
| Vehicles per Household | Owner-occupied | Renter-occupied |
| No Vehicle | 21 (1.9%) | 91 (19.9%) |
| 1 Vehicle | 304 (27.6%) | 157 (34.4%) |
| 2 Vehicles | 444 (40.4%) | 131 (28.7%) |
| 3 or more Vehicles | 331 (30.1%) | 78 (17.1%) |
| Total | 1,100 (100.0%) | 457 (100.0%) |
Real Estate & Mortgages in Hidalgo County
Real Estate and Mortgage Overview in Hidalgo County
| Characteristic | Without Mortgage | With Mortgage |
| Housing Units | 740 | 360 |
| Median Property Value | $82,800 | $129,900 |
| Median Household Income | $53,182 | $46 |
| Monthly Housing Costs | $331 | $0 |
| Real Estate Taxes | $485 | $5 |
Property Value by Mortgage Status in Hidalgo County
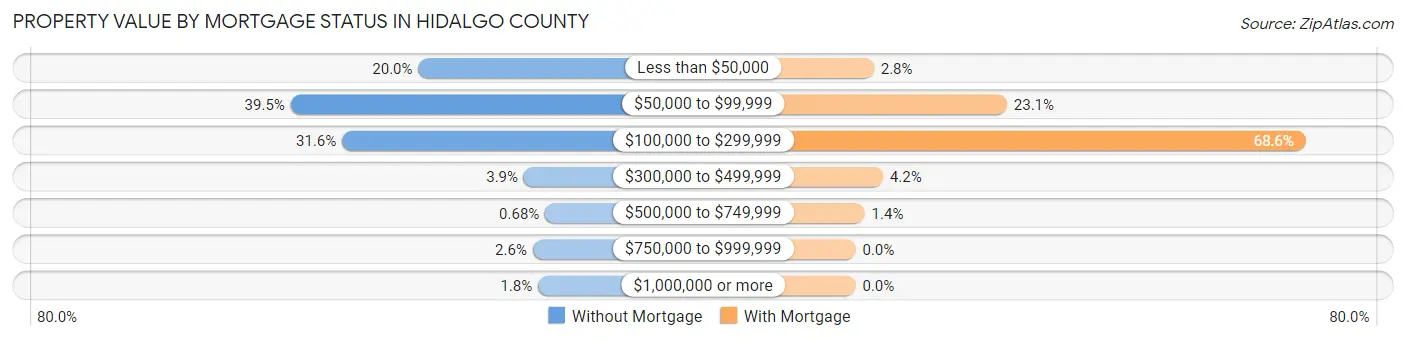
| Property Value | Without Mortgage | With Mortgage |
| Less than $50,000 | 148 (20.0%) | 10 (2.8%) |
| $50,000 to $99,999 | 292 (39.5%) | 83 (23.1%) |
| $100,000 to $299,999 | 234 (31.6%) | 247 (68.6%) |
| $300,000 to $499,999 | 29 (3.9%) | 15 (4.2%) |
| $500,000 to $749,999 | 5 (0.7%) | 5 (1.4%) |
| $750,000 to $999,999 | 19 (2.6%) | 0 (0.0%) |
| $1,000,000 or more | 13 (1.8%) | 0 (0.0%) |
| Total | 740 (100.0%) | 360 (100.0%) |
Household Income by Mortgage Status in Hidalgo County
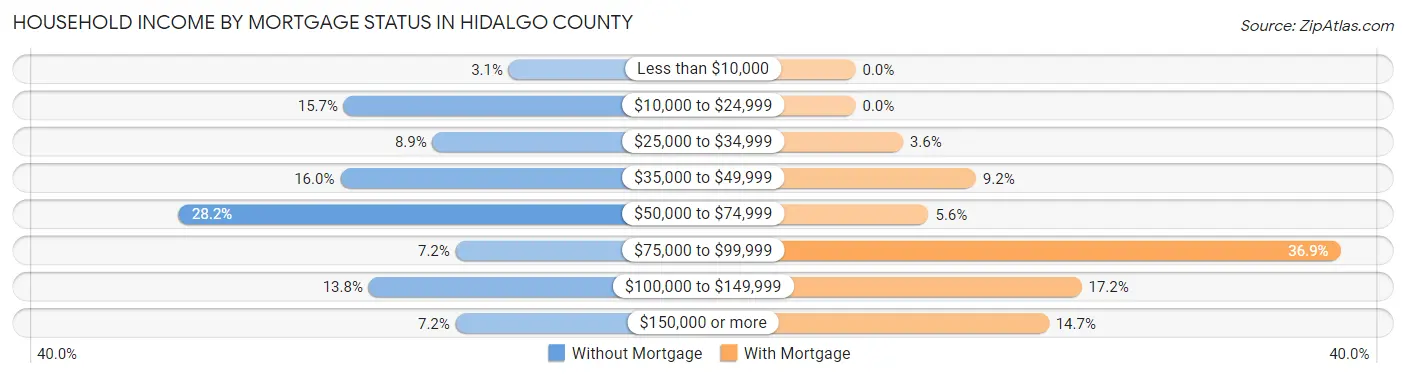
| Household Income | Without Mortgage | With Mortgage |
| Less than $10,000 | 23 (3.1%) | 0 (0.0%) |
| $10,000 to $24,999 | 116 (15.7%) | 0 (0.0%) |
| $25,000 to $34,999 | 66 (8.9%) | 13 (3.6%) |
| $35,000 to $49,999 | 118 (16.0%) | 33 (9.2%) |
| $50,000 to $74,999 | 209 (28.2%) | 20 (5.6%) |
| $75,000 to $99,999 | 53 (7.2%) | 133 (36.9%) |
| $100,000 to $149,999 | 102 (13.8%) | 62 (17.2%) |
| $150,000 or more | 53 (7.2%) | 53 (14.7%) |
| Total | 740 (100.0%) | 360 (100.0%) |
Property Value to Household Income Ratio in Hidalgo County
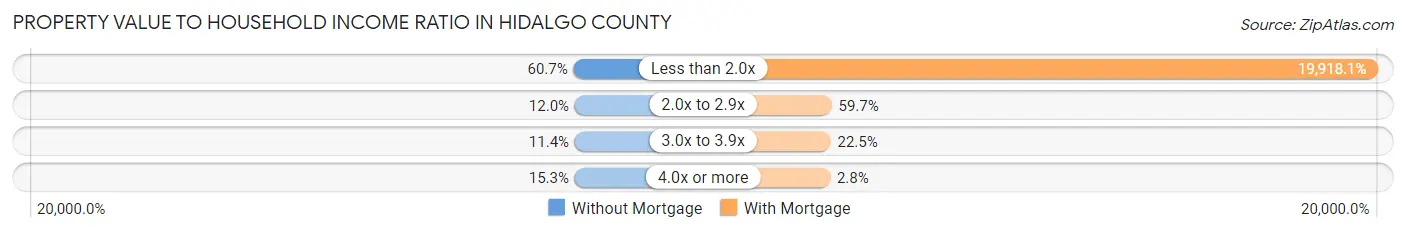
| Value-to-Income Ratio | Without Mortgage | With Mortgage |
| Less than 2.0x | 449 (60.7%) | 71,705 (19,918.1%) |
| 2.0x to 2.9x | 89 (12.0%) | 215 (59.7%) |
| 3.0x to 3.9x | 84 (11.4%) | 81 (22.5%) |
| 4.0x or more | 113 (15.3%) | 10 (2.8%) |
| Total | 740 (100.0%) | 360 (100.0%) |
Real Estate Taxes by Mortgage Status in Hidalgo County
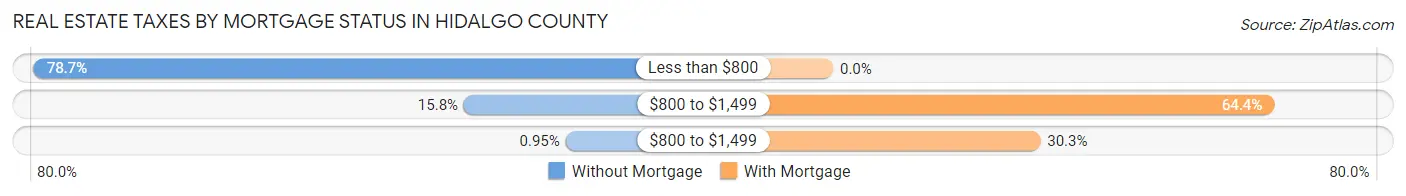
| Property Taxes | Without Mortgage | With Mortgage |
| Less than $800 | 582 (78.6%) | 0 (0.0%) |
| $800 to $1,499 | 117 (15.8%) | 232 (64.4%) |
| $800 to $1,499 | 7 (0.9%) | 109 (30.3%) |
| Total | 740 (100.0%) | 360 (100.0%) |
Health & Disability in Hidalgo County
Health Insurance Coverage by Age in Hidalgo County
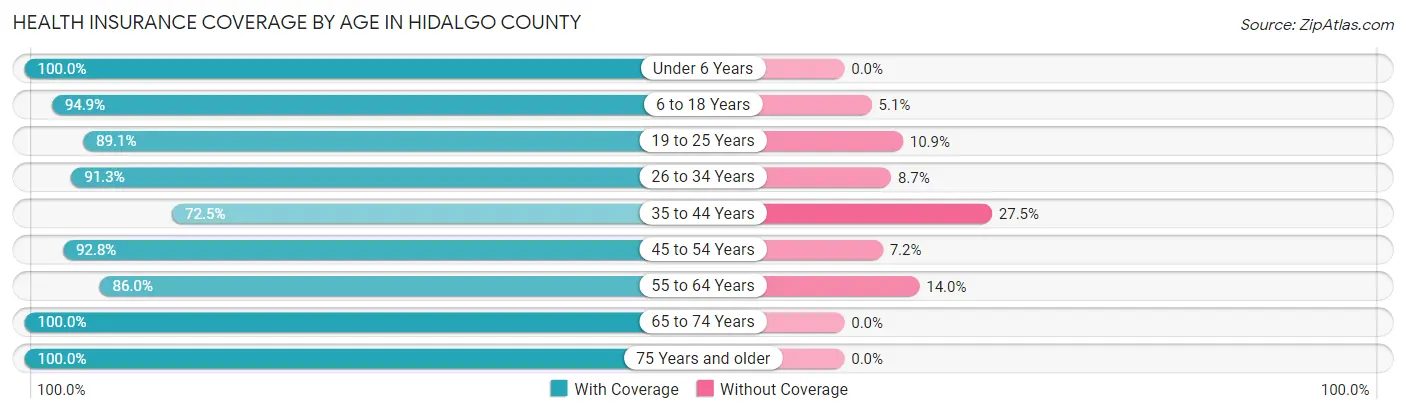
| Age Bracket | With Coverage | Without Coverage |
| Under 6 Years | 291 (100.0%) | 0 (0.0%) |
| 6 to 18 Years | 634 (94.9%) | 34 (5.1%) |
| 19 to 25 Years | 245 (89.1%) | 30 (10.9%) |
| 26 to 34 Years | 440 (91.3%) | 42 (8.7%) |
| 35 to 44 Years | 316 (72.5%) | 120 (27.5%) |
| 45 to 54 Years | 376 (92.8%) | 29 (7.2%) |
| 55 to 64 Years | 529 (86.0%) | 86 (14.0%) |
| 65 to 74 Years | 513 (100.0%) | 0 (0.0%) |
| 75 Years and older | 360 (100.0%) | 0 (0.0%) |
| Total | 3,704 (91.6%) | 341 (8.4%) |
Health Insurance Coverage by Citizenship Status in Hidalgo County
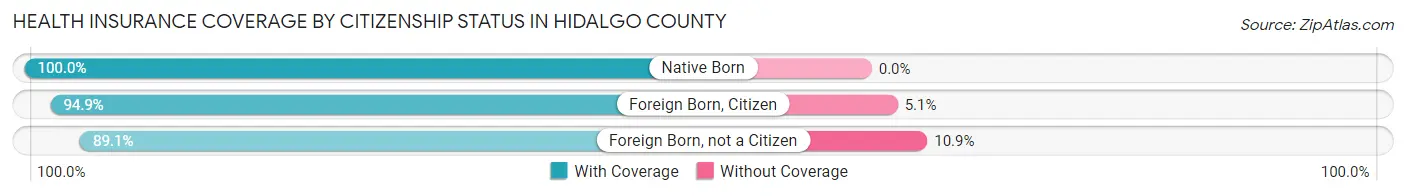
| Citizenship Status | With Coverage | Without Coverage |
| Native Born | 291 (100.0%) | 0 (0.0%) |
| Foreign Born, Citizen | 634 (94.9%) | 34 (5.1%) |
| Foreign Born, not a Citizen | 245 (89.1%) | 30 (10.9%) |
Health Insurance Coverage by Household Income in Hidalgo County

| Household Income | With Coverage | Without Coverage |
| Under $25,000 | 676 (91.5%) | 63 (8.5%) |
| $25,000 to $49,999 | 631 (81.3%) | 145 (18.7%) |
| $50,000 to $74,999 | 936 (93.7%) | 63 (6.3%) |
| $75,000 to $99,999 | 402 (88.9%) | 50 (11.1%) |
| $100,000 and over | 1,059 (98.2%) | 20 (1.8%) |
Public vs Private Health Insurance Coverage by Age in Hidalgo County
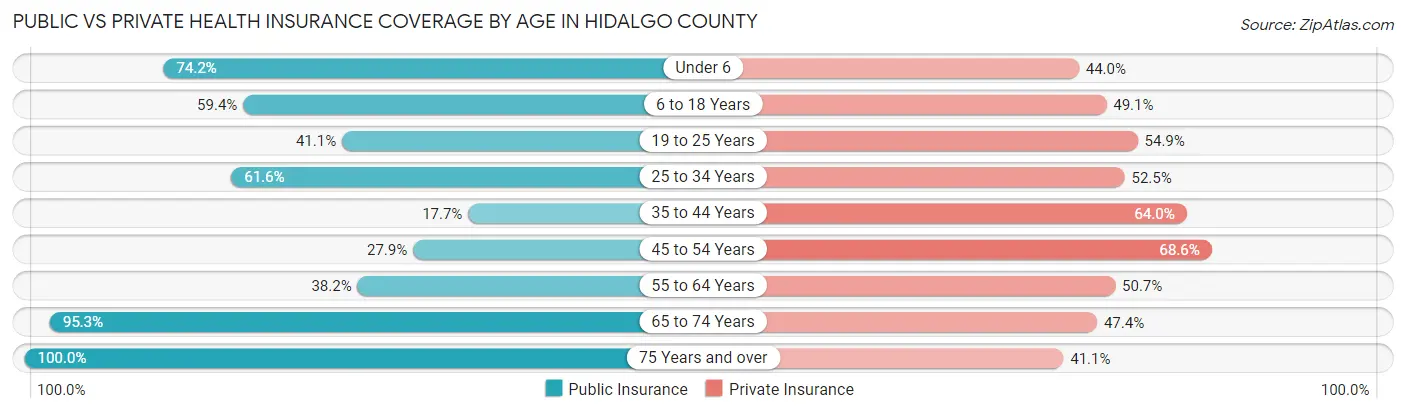
| Age Bracket | Public Insurance | Private Insurance |
| Under 6 | 216 (74.2%) | 128 (44.0%) |
| 6 to 18 Years | 397 (59.4%) | 328 (49.1%) |
| 19 to 25 Years | 113 (41.1%) | 151 (54.9%) |
| 25 to 34 Years | 297 (61.6%) | 253 (52.5%) |
| 35 to 44 Years | 77 (17.7%) | 279 (64.0%) |
| 45 to 54 Years | 113 (27.9%) | 278 (68.6%) |
| 55 to 64 Years | 235 (38.2%) | 312 (50.7%) |
| 65 to 74 Years | 489 (95.3%) | 243 (47.4%) |
| 75 Years and over | 360 (100.0%) | 148 (41.1%) |
| Total | 2,297 (56.8%) | 2,120 (52.4%) |
Disability Status by Sex by Age in Hidalgo County
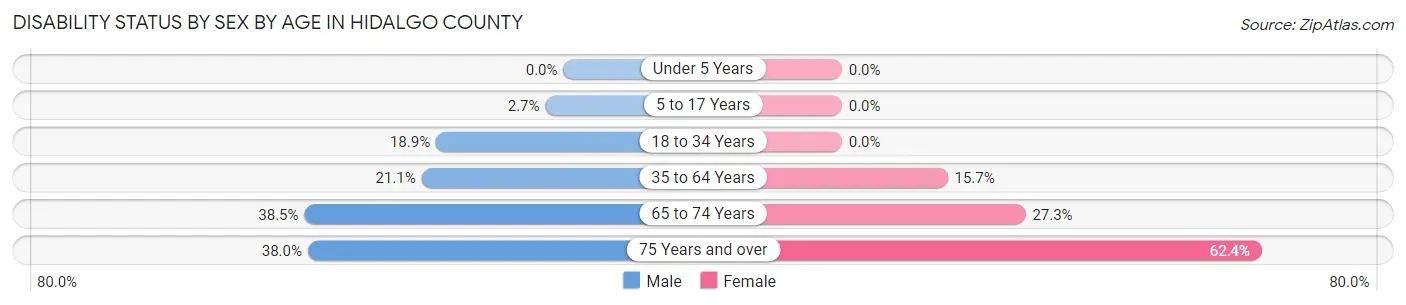
| Age Bracket | Male | Female |
| Under 5 Years | 0 (0.0%) | 0 (0.0%) |
| 5 to 17 Years | 7 (2.7%) | 0 (0.0%) |
| 18 to 34 Years | 80 (18.9%) | 0 (0.0%) |
| 35 to 64 Years | 151 (21.1%) | 116 (15.7%) |
| 65 to 74 Years | 100 (38.5%) | 69 (27.3%) |
| 75 Years and over | 63 (38.0%) | 121 (62.4%) |
Disability Class by Sex by Age in Hidalgo County
Disability Class: Hearing Difficulty
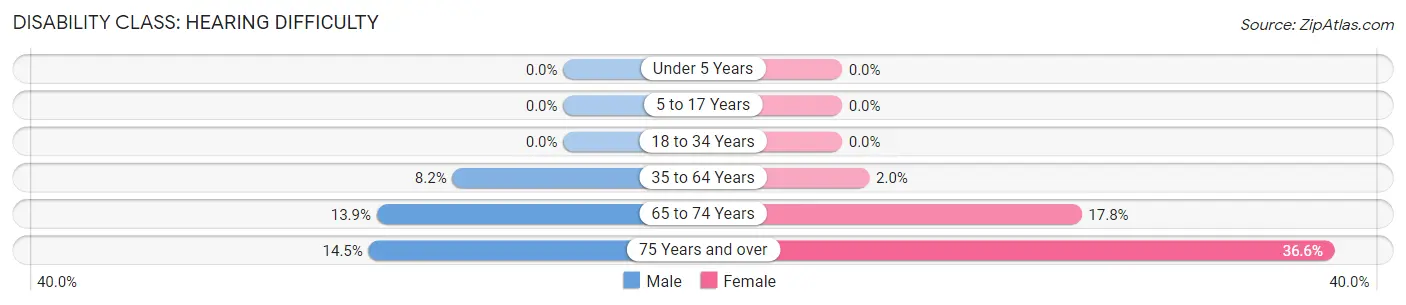
| Age Bracket | Male | Female |
| Under 5 Years | 0 (0.0%) | 0 (0.0%) |
| 5 to 17 Years | 0 (0.0%) | 0 (0.0%) |
| 18 to 34 Years | 0 (0.0%) | 0 (0.0%) |
| 35 to 64 Years | 59 (8.2%) | 15 (2.0%) |
| 65 to 74 Years | 36 (13.9%) | 45 (17.8%) |
| 75 Years and over | 24 (14.5%) | 71 (36.6%) |
Disability Class: Vision Difficulty
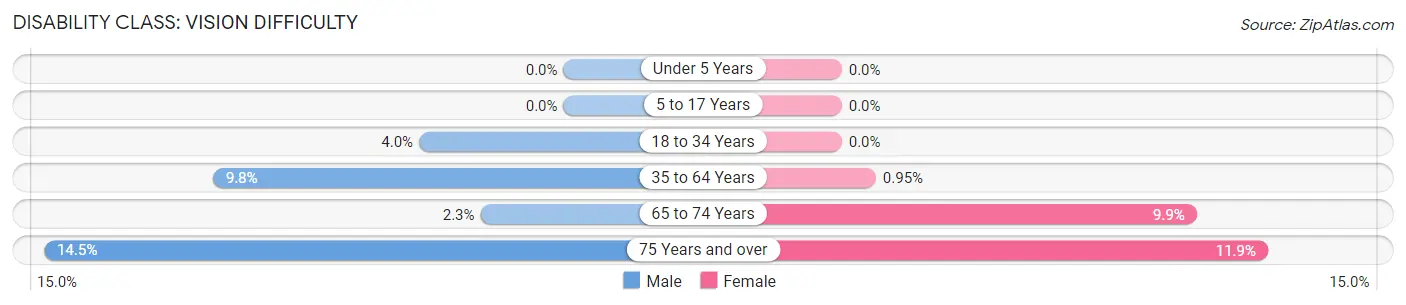
| Age Bracket | Male | Female |
| Under 5 Years | 0 (0.0%) | 0 (0.0%) |
| 5 to 17 Years | 0 (0.0%) | 0 (0.0%) |
| 18 to 34 Years | 17 (4.0%) | 0 (0.0%) |
| 35 to 64 Years | 70 (9.8%) | 7 (0.9%) |
| 65 to 74 Years | 6 (2.3%) | 25 (9.9%) |
| 75 Years and over | 24 (14.5%) | 23 (11.9%) |
Disability Class: Cognitive Difficulty
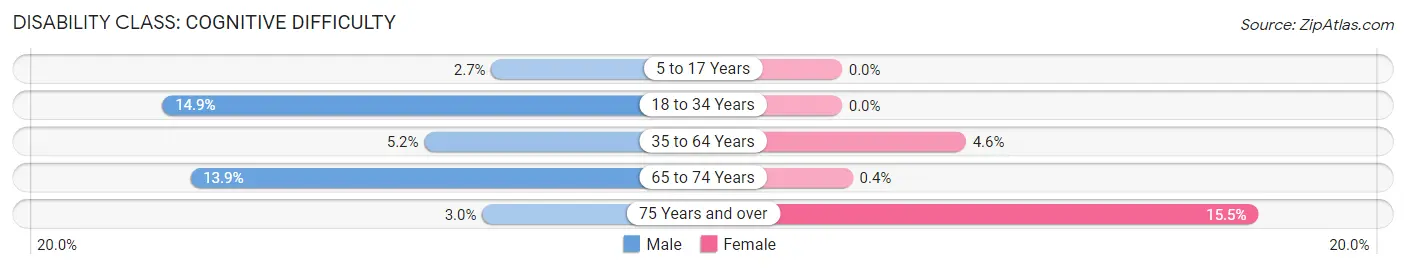
| Age Bracket | Male | Female |
| 5 to 17 Years | 7 (2.7%) | 0 (0.0%) |
| 18 to 34 Years | 63 (14.9%) | 0 (0.0%) |
| 35 to 64 Years | 37 (5.2%) | 34 (4.6%) |
| 65 to 74 Years | 36 (13.9%) | 1 (0.4%) |
| 75 Years and over | 5 (3.0%) | 30 (15.5%) |
Disability Class: Ambulatory Difficulty
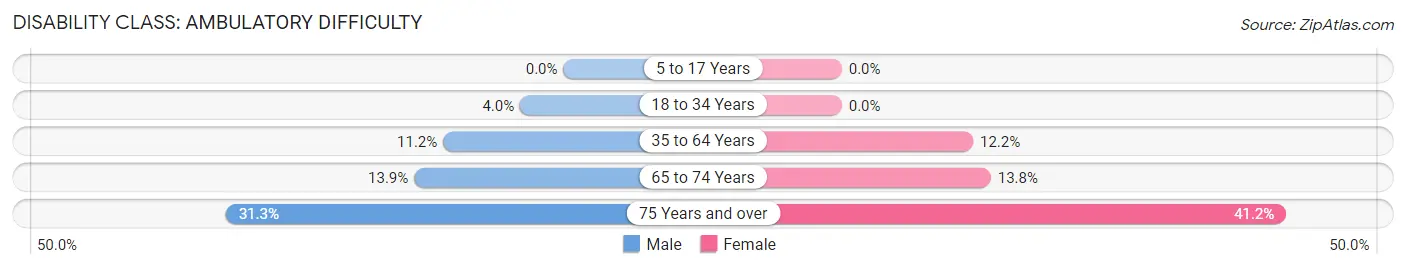
| Age Bracket | Male | Female |
| 5 to 17 Years | 0 (0.0%) | 0 (0.0%) |
| 18 to 34 Years | 17 (4.0%) | 0 (0.0%) |
| 35 to 64 Years | 80 (11.2%) | 90 (12.2%) |
| 65 to 74 Years | 36 (13.9%) | 35 (13.8%) |
| 75 Years and over | 52 (31.3%) | 80 (41.2%) |
Disability Class: Self-Care Difficulty
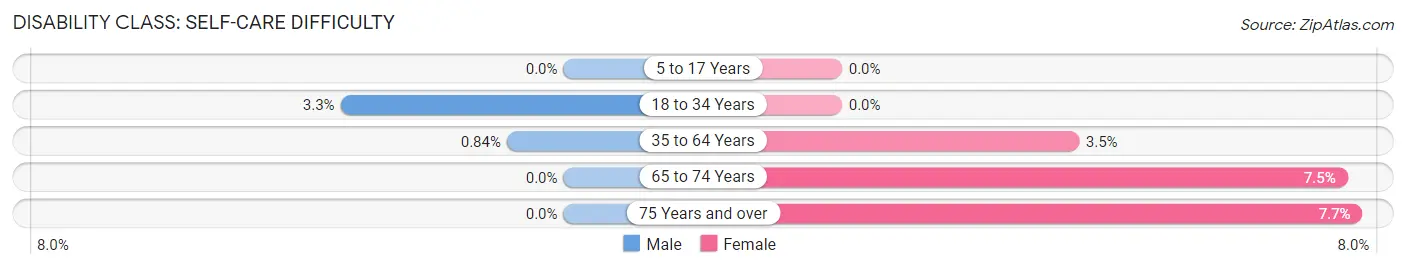
| Age Bracket | Male | Female |
| 5 to 17 Years | 0 (0.0%) | 0 (0.0%) |
| 18 to 34 Years | 14 (3.3%) | 0 (0.0%) |
| 35 to 64 Years | 6 (0.8%) | 26 (3.5%) |
| 65 to 74 Years | 0 (0.0%) | 19 (7.5%) |
| 75 Years and over | 0 (0.0%) | 15 (7.7%) |
Technology Access in Hidalgo County
Computing Device Access in Hidalgo County
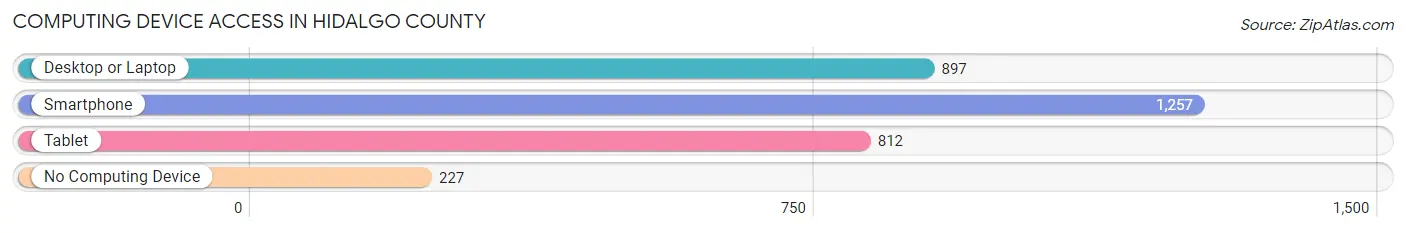
| Device Type | # Households | % Households |
| Desktop or Laptop | 897 | 57.6% |
| Smartphone | 1,257 | 80.7% |
| Tablet | 812 | 52.1% |
| No Computing Device | 227 | 14.6% |
| Total | 1,557 | 100.0% |
Internet Access in Hidalgo County
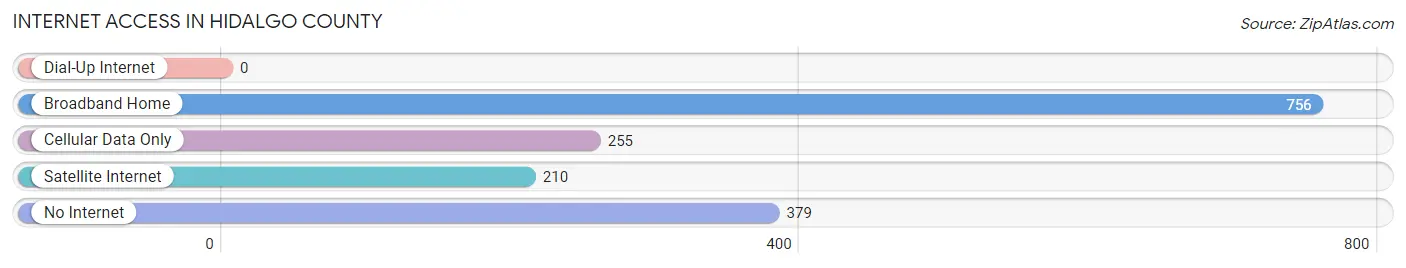
| Internet Type | # Households | % Households |
| Dial-Up Internet | 0 | 0.0% |
| Broadband Home | 756 | 48.5% |
| Cellular Data Only | 255 | 16.4% |
| Satellite Internet | 210 | 13.5% |
| No Internet | 379 | 24.3% |
| Total | 1,557 | 100.0% |
Hidalgo County Summary
Hidalgo County is located in the southwestern corner of New Mexico, and is bordered by Arizona to the west and Mexico to the south. It is the fourth-largest county in the state, with an area of 4,541 square miles. The county seat is Lordsburg, and the largest city is Animas. The county was established in 1919, and is named for Miguel Hidalgo y Costilla, a Mexican priest who is considered the father of Mexican independence.
Geography
Hidalgo County is located in the Chihuahuan Desert, and is characterized by hot, dry summers and mild winters. The county is mostly flat, with elevations ranging from 3,000 to 4,000 feet. The county is home to several mountain ranges, including the Animas Mountains, the Peloncillo Mountains, and the Little Hatchet Mountains. The county is also home to several rivers, including the San Simon, the Mimbres, and the San Bernardino.
The county is home to several protected areas, including the Coronado National Forest, the Gila National Forest, and the San Bernardino National Wildlife Refuge. The county is also home to several state parks, including the Caballo Lake State Park, the Rockhound State Park, and the City of Rocks State Park.
Economy
Hidalgo County has a diverse economy, with the largest industries being agriculture, mining, and tourism. Agriculture is the largest industry in the county, with the main crops being cotton, alfalfa, and pecans. Mining is also an important industry in the county, with copper, gold, and silver being the main minerals mined. Tourism is also an important industry in the county, with the county being home to several state parks and national forests.
Demographics
As of the 2010 census, Hidalgo County had a population of 4,894. The population was 53.2% Hispanic or Latino, 43.2% White, 1.2% Native American, 0.3% Asian, 0.1% Black or African American, and 0.1% Pacific Islander. The median household income was $30,938, and the median family income was $35,938. The per capita income was $14,945.
Conclusion
Hidalgo County is a diverse and vibrant county located in the southwestern corner of New Mexico. The county is home to several mountain ranges, rivers, and protected areas, and has a diverse economy that includes agriculture, mining, and tourism. The county has a population that is majority Hispanic or Latino, and has a median household income of $30,938. Hidalgo County is an important part of the state of New Mexico, and is a great place to live and work.
Common Questions
What is Per Capita Income in Hidalgo County?
Per Capita income in Hidalgo County is $25,476.
What is the Median Family Income in Hidalgo County?
Median Family Income in Hidalgo County is $63,467.
What is the Median Household income in Hidalgo County?
Median Household Income in Hidalgo County is $53,651.
What is Income or Wage Gap in Hidalgo County?
Income or Wage Gap in Hidalgo County is 25.0%.
Women in Hidalgo County earn 75.0 cents for every dollar earned by a man.
What is Inequality or Gini Index in Hidalgo County?
Inequality or Gini Index in Hidalgo County is 0.42.
What is the Total Population of Hidalgo County?
Total Population of Hidalgo County is 4,160.
What is the Total Male Population of Hidalgo County?
Total Male Population of Hidalgo County is 2,066.
What is the Total Female Population of Hidalgo County?
Total Female Population of Hidalgo County is 2,094.
What is the Ratio of Males per 100 Females in Hidalgo County?
There are 98.66 Males per 100 Females in Hidalgo County.
What is the Ratio of Females per 100 Males in Hidalgo County?
There are 101.36 Females per 100 Males in Hidalgo County.
What is the Median Population Age in Hidalgo County?
Median Population Age in Hidalgo County is 42.1 Years.
What is the Average Family Size in Hidalgo County
Average Family Size in Hidalgo County is 3.3 People.
What is the Average Household Size in Hidalgo County
Average Household Size in Hidalgo County is 2.6 People.
How Large is the Labor Force in Hidalgo County?
There are 1,714 People in the Labor Forcein in Hidalgo County.
What is the Percentage of People in the Labor Force in Hidalgo County?
52.1% of People are in the Labor Force in Hidalgo County.
What is the Unemployment Rate in Hidalgo County?
Unemployment Rate in Hidalgo County is 4.4%.