Rio Arriba County, NM Map & Demographics
Rio Arriba County Map
Rio Arriba County Overview
$27,878
PER CAPITA INCOME
$65,388
AVG FAMILY INCOME
$52,031
AVG HOUSEHOLD INCOME
19.3%
WAGE / INCOME GAP [ % ]
80.7¢/ $1
WAGE / INCOME GAP [ $ ]
$10,894
FAMILY INCOME DEFICIT
0.47
INEQUALITY / GINI INDEX
40,285
TOTAL POPULATION
19,854
MALE POPULATION
20,431
FEMALE POPULATION
97.18
MALES / 100 FEMALES
102.91
FEMALES / 100 MALES
41.7
MEDIAN AGE
3.6
AVG FAMILY SIZE
2.8
AVG HOUSEHOLD SIZE
16,567
LABOR FORCE [ PEOPLE ]
51.3%
PERCENT IN LABOR FORCE
6.0%
UNEMPLOYMENT RATE
Income in Rio Arriba County
Income Overview in Rio Arriba County
Per Capita Income in Rio Arriba County is $27,878, while median incomes of families and households are $65,388 and $52,031 respectively.
| Characteristic | Number | Measure |
| Per Capita Income | 40,285 | $27,878 |
| Median Family Income | 8,675 | $65,388 |
| Mean Family Income | 8,675 | $83,202 |
| Median Household Income | 14,076 | $52,031 |
| Mean Household Income | 14,076 | $69,379 |
| Income Deficit | 8,675 | $10,894 |
| Wage / Income Gap (%) | 40,285 | 19.33% |
| Wage / Income Gap ($) | 40,285 | 80.67¢ per $1 |
| Gini / Inequality Index | 40,285 | 0.47 |
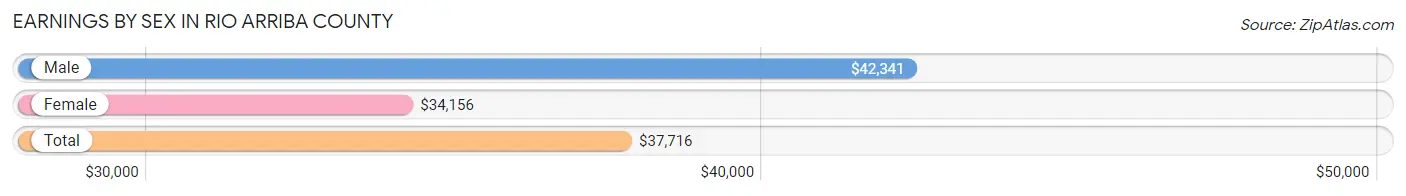
Earnings by Sex in Rio Arriba County
Average Earnings in Rio Arriba County are $37,716, $42,341 for men and $34,156 for women, a difference of 19.3%.
| Sex | Number | Average Earnings |
| Male | 8,845 (52.9%) | $42,341 |
| Female | 7,869 (47.1%) | $34,156 |
| Total | 16,714 (100.0%) | $37,716 |
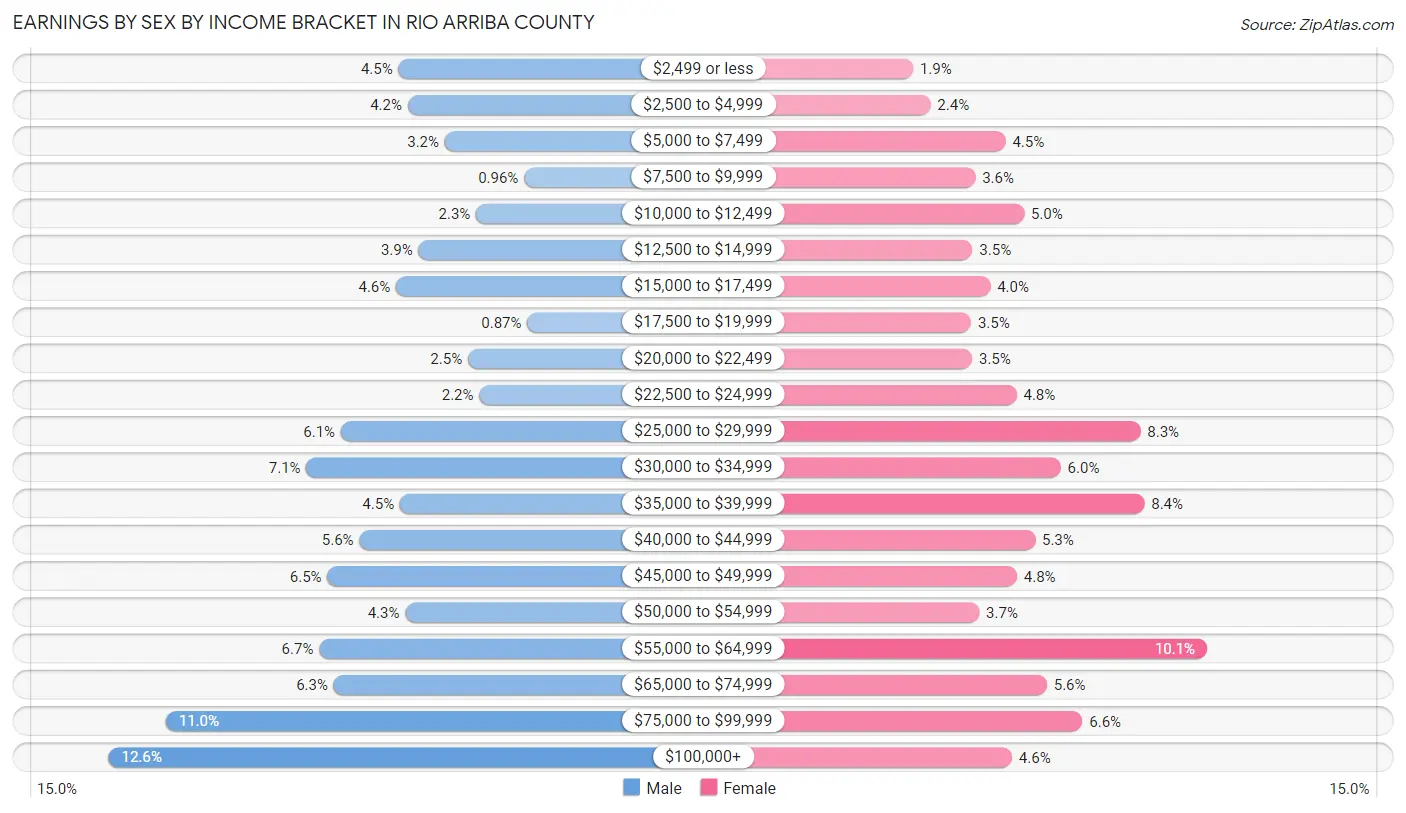
Earnings by Sex by Income Bracket in Rio Arriba County
The most common earnings brackets in Rio Arriba County are $100,000+ for men (1,118 | 12.6%) and $55,000 to $64,999 for women (796 | 10.1%).
| Income | Male | Female |
| $2,499 or less | 397 (4.5%) | 146 (1.9%) |
| $2,500 to $4,999 | 374 (4.2%) | 185 (2.4%) |
| $5,000 to $7,499 | 282 (3.2%) | 351 (4.5%) |
| $7,500 to $9,999 | 85 (1.0%) | 284 (3.6%) |
| $10,000 to $12,499 | 204 (2.3%) | 392 (5.0%) |
| $12,500 to $14,999 | 348 (3.9%) | 278 (3.5%) |
| $15,000 to $17,499 | 403 (4.6%) | 317 (4.0%) |
| $17,500 to $19,999 | 77 (0.9%) | 275 (3.5%) |
| $20,000 to $22,499 | 225 (2.5%) | 277 (3.5%) |
| $22,500 to $24,999 | 196 (2.2%) | 375 (4.8%) |
| $25,000 to $29,999 | 540 (6.1%) | 649 (8.3%) |
| $30,000 to $34,999 | 626 (7.1%) | 473 (6.0%) |
| $35,000 to $39,999 | 394 (4.4%) | 658 (8.4%) |
| $40,000 to $44,999 | 494 (5.6%) | 416 (5.3%) |
| $45,000 to $49,999 | 574 (6.5%) | 376 (4.8%) |
| $50,000 to $54,999 | 380 (4.3%) | 293 (3.7%) |
| $55,000 to $64,999 | 594 (6.7%) | 796 (10.1%) |
| $65,000 to $74,999 | 558 (6.3%) | 442 (5.6%) |
| $75,000 to $99,999 | 976 (11.0%) | 521 (6.6%) |
| $100,000+ | 1,118 (12.6%) | 365 (4.6%) |
| Total | 8,845 (100.0%) | 7,869 (100.0%) |
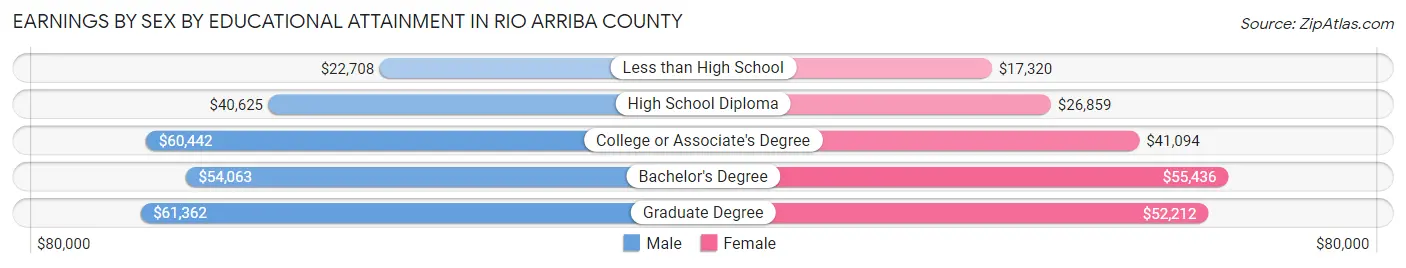
Earnings by Sex by Educational Attainment in Rio Arriba County
Average earnings in Rio Arriba County are $46,636 for men and $37,956 for women, a difference of 18.6%. Men with an educational attainment of graduate degree enjoy the highest average annual earnings of $61,362, while those with less than high school education earn the least with $22,708. Women with an educational attainment of bachelor's degree earn the most with the average annual earnings of $55,436, while those with less than high school education have the smallest earnings of $17,320.
| Educational Attainment | Male Income | Female Income |
| Less than High School | $22,708 | $17,320 |
| High School Diploma | $40,625 | $26,859 |
| College or Associate's Degree | $60,442 | $41,094 |
| Bachelor's Degree | $54,063 | $55,436 |
| Graduate Degree | $61,362 | $52,212 |
| Total | $46,636 | $37,956 |
Family Income in Rio Arriba County
Family Income Brackets in Rio Arriba County
According to the Rio Arriba County family income data, there are 1,813 families falling into the $50,000 to $74,999 income range, which is the most common income bracket and makes up 20.9% of all families. Conversely, the $10,000 to $14,999 income bracket is the least frequent group with only 269 families (3.1%) belonging to this category.
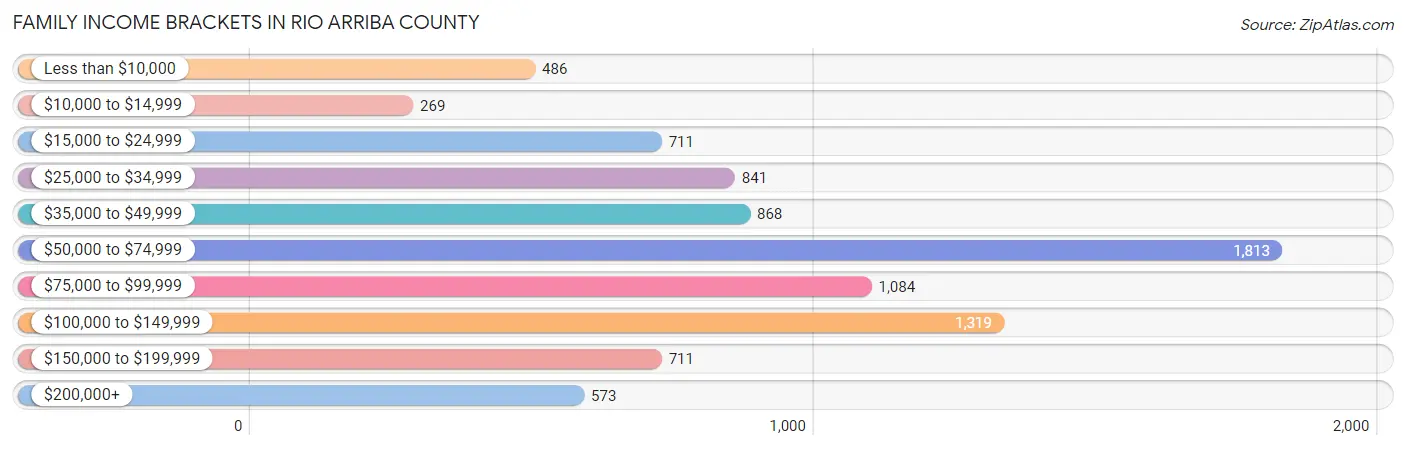
| Income Bracket | # Families | % Families |
| Less than $10,000 | 486 | 5.6% |
| $10,000 to $14,999 | 269 | 3.1% |
| $15,000 to $24,999 | 711 | 8.2% |
| $25,000 to $34,999 | 841 | 9.7% |
| $35,000 to $49,999 | 868 | 10.0% |
| $50,000 to $74,999 | 1,813 | 20.9% |
| $75,000 to $99,999 | 1,084 | 12.5% |
| $100,000 to $149,999 | 1,319 | 15.2% |
| $150,000 to $199,999 | 711 | 8.2% |
| $200,000+ | 573 | 6.6% |
Family Income by Famaliy Size in Rio Arriba County
4-person families (1,161 | 13.4%) account for the highest median family income in Rio Arriba County with $96,439 per family, while 2-person families (4,679 | 53.9%) have the highest median income of $32,214 per family member.
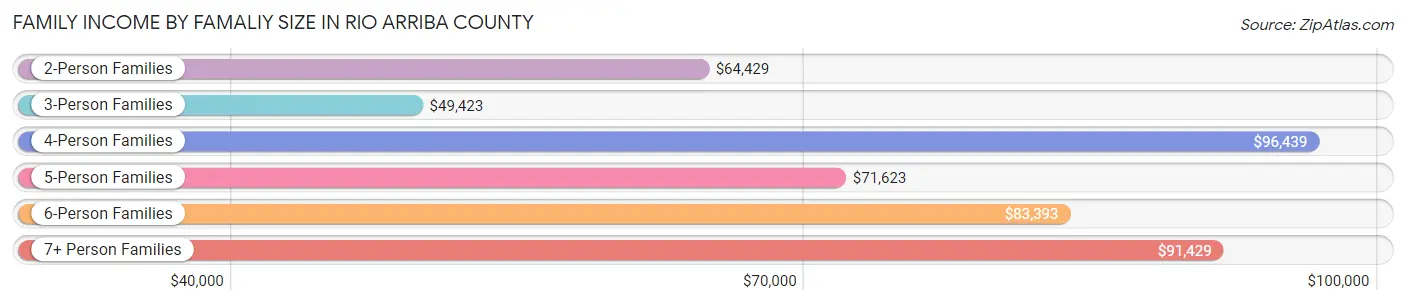
| Income Bracket | # Families | Median Income |
| 2-Person Families | 4,679 (53.9%) | $64,429 |
| 3-Person Families | 2,206 (25.4%) | $49,423 |
| 4-Person Families | 1,161 (13.4%) | $96,439 |
| 5-Person Families | 454 (5.2%) | $71,623 |
| 6-Person Families | 139 (1.6%) | $83,393 |
| 7+ Person Families | 36 (0.4%) | $91,429 |
| Total | 8,675 (100.0%) | $65,388 |
Family Income by Number of Earners in Rio Arriba County
The median family income in Rio Arriba County is $65,388, with families comprising 3+ earners (554) having the highest median family income of $124,167, while families with no earners (2,176) have the lowest median family income of $34,923, accounting for 6.4% and 25.1% of families, respectively.
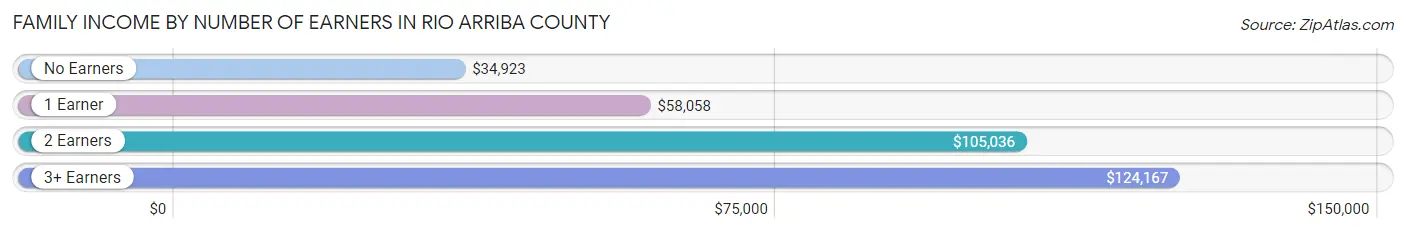
| Number of Earners | # Families | Median Income |
| No Earners | 2,176 (25.1%) | $34,923 |
| 1 Earner | 3,329 (38.4%) | $58,058 |
| 2 Earners | 2,616 (30.2%) | $105,036 |
| 3+ Earners | 554 (6.4%) | $124,167 |
| Total | 8,675 (100.0%) | $65,388 |
Household Income in Rio Arriba County
Household Income Brackets in Rio Arriba County
With 2,632 households falling in the category, the $50,000 to $74,999 income range is the most frequent in Rio Arriba County, accounting for 18.7% of all households. In contrast, only 662 households (4.7%) fall into the $200,000+ income bracket, making it the least populous group.
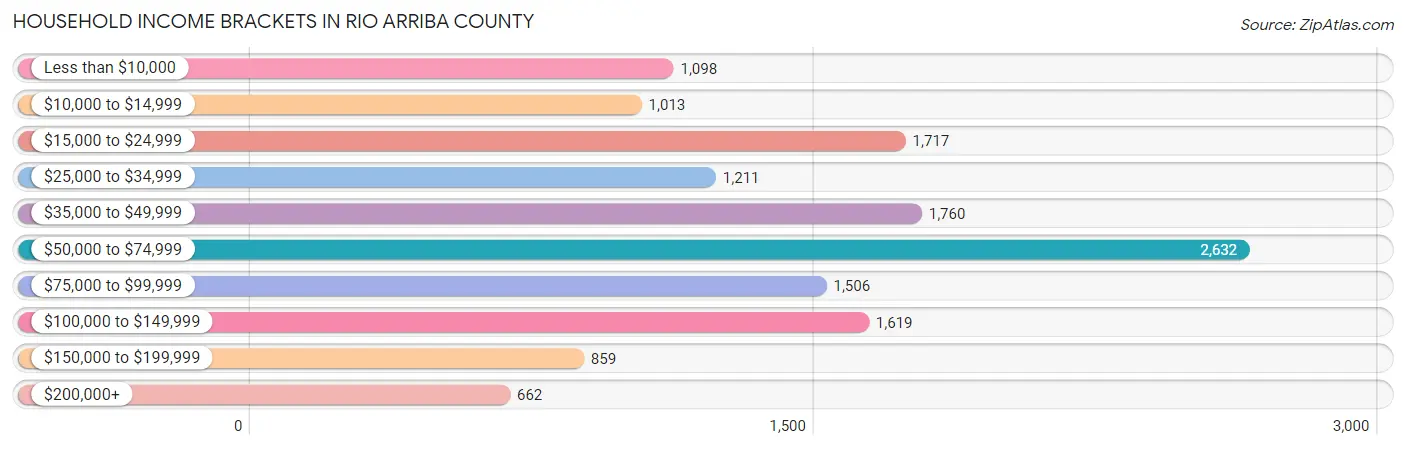
| Income Bracket | # Households | % Households |
| Less than $10,000 | 1,098 | 7.8% |
| $10,000 to $14,999 | 1,013 | 7.2% |
| $15,000 to $24,999 | 1,717 | 12.2% |
| $25,000 to $34,999 | 1,211 | 8.6% |
| $35,000 to $49,999 | 1,760 | 12.5% |
| $50,000 to $74,999 | 2,632 | 18.7% |
| $75,000 to $99,999 | 1,506 | 10.7% |
| $100,000 to $149,999 | 1,619 | 11.5% |
| $150,000 to $199,999 | 859 | 6.1% |
| $200,000+ | 662 | 4.7% |
Household Income by Householder Age in Rio Arriba County
The median household income in Rio Arriba County is $52,031, with the highest median household income of $62,729 found in the 15 to 24 years age bracket for the primary householder. A total of 175 households (1.2%) fall into this category. Meanwhile, the 65+ years age bracket for the primary householder has the lowest median household income of $43,521, with 4,816 households (34.2%) in this group.
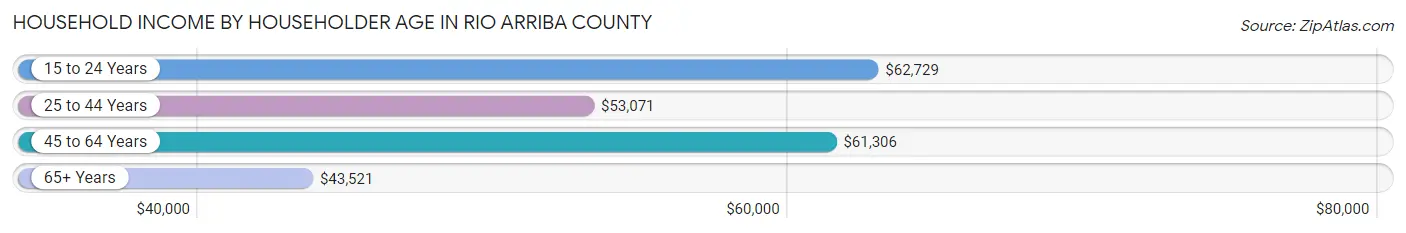
| Income Bracket | # Households | Median Income |
| 15 to 24 Years | 175 (1.2%) | $62,729 |
| 25 to 44 Years | 3,312 (23.5%) | $53,071 |
| 45 to 64 Years | 5,773 (41.0%) | $61,306 |
| 65+ Years | 4,816 (34.2%) | $43,521 |
| Total | 14,076 (100.0%) | $52,031 |
Poverty in Rio Arriba County
Income Below Poverty by Sex and Age in Rio Arriba County
With 18.9% poverty level for males and 24.6% for females among the residents of Rio Arriba County, 16 and 17 year old males and 5 year old females are the most vulnerable to poverty, with 284 males (43.8%) and 93 females (38.3%) in their respective age groups living below the poverty level.
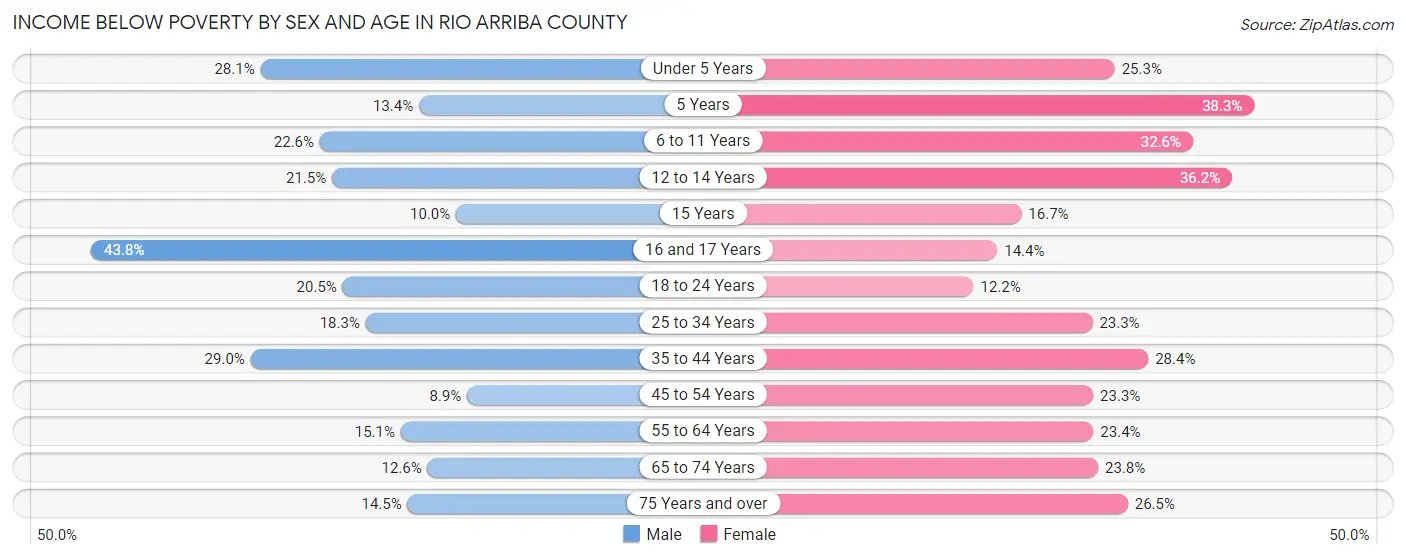
| Age Bracket | Male | Female |
| Under 5 Years | 312 (28.1%) | 250 (25.3%) |
| 5 Years | 26 (13.4%) | 93 (38.3%) |
| 6 to 11 Years | 381 (22.6%) | 492 (32.6%) |
| 12 to 14 Years | 134 (21.5%) | 373 (36.2%) |
| 15 Years | 21 (10.0%) | 26 (16.7%) |
| 16 and 17 Years | 284 (43.8%) | 84 (14.4%) |
| 18 to 24 Years | 347 (20.5%) | 206 (12.2%) |
| 25 to 34 Years | 408 (18.3%) | 505 (23.3%) |
| 35 to 44 Years | 671 (29.0%) | 626 (28.4%) |
| 45 to 54 Years | 210 (8.9%) | 568 (23.3%) |
| 55 to 64 Years | 430 (15.1%) | 687 (23.4%) |
| 65 to 74 Years | 296 (12.6%) | 595 (23.8%) |
| 75 Years and over | 203 (14.5%) | 494 (26.5%) |
| Total | 3,723 (18.9%) | 4,999 (24.6%) |
Income Above Poverty by Sex and Age in Rio Arriba County
According to the poverty statistics in Rio Arriba County, males aged 45 to 54 years and females aged 18 to 24 years are the age groups that are most secure financially, with 91.1% of males and 87.8% of females in these age groups living above the poverty line.
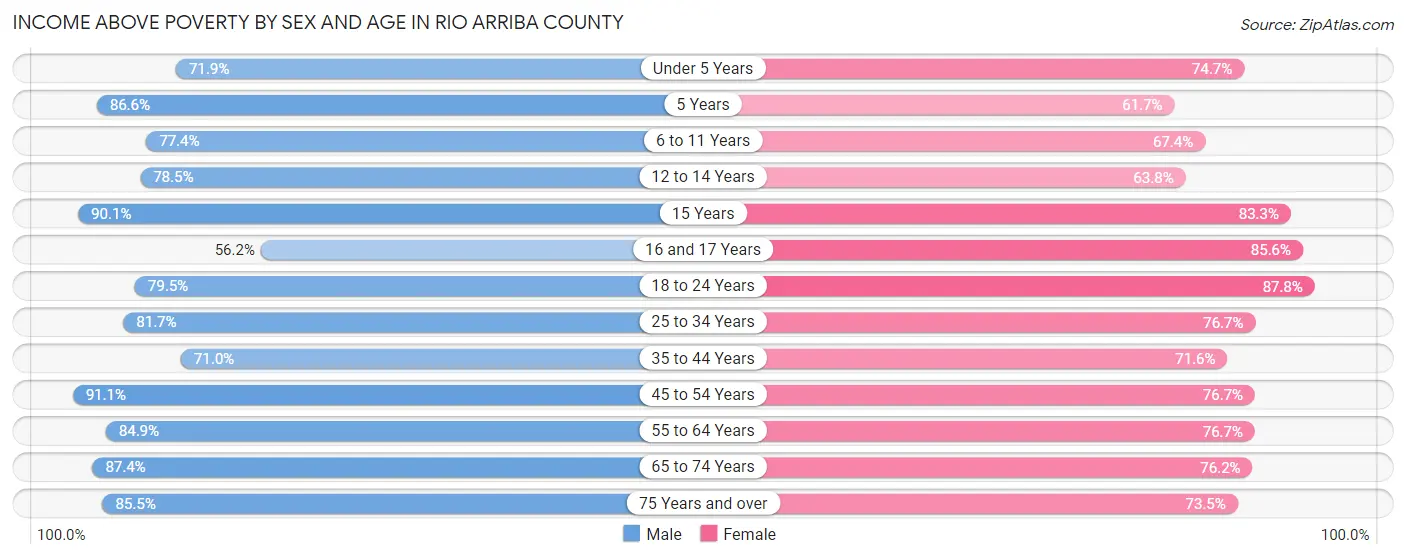
| Age Bracket | Male | Female |
| Under 5 Years | 798 (71.9%) | 737 (74.7%) |
| 5 Years | 168 (86.6%) | 150 (61.7%) |
| 6 to 11 Years | 1,305 (77.4%) | 1,018 (67.4%) |
| 12 to 14 Years | 490 (78.5%) | 657 (63.8%) |
| 15 Years | 190 (90.0%) | 130 (83.3%) |
| 16 and 17 Years | 364 (56.2%) | 498 (85.6%) |
| 18 to 24 Years | 1,347 (79.5%) | 1,479 (87.8%) |
| 25 to 34 Years | 1,817 (81.7%) | 1,666 (76.7%) |
| 35 to 44 Years | 1,641 (71.0%) | 1,575 (71.6%) |
| 45 to 54 Years | 2,141 (91.1%) | 1,867 (76.7%) |
| 55 to 64 Years | 2,419 (84.9%) | 2,255 (76.6%) |
| 65 to 74 Years | 2,053 (87.4%) | 1,906 (76.2%) |
| 75 Years and over | 1,201 (85.5%) | 1,367 (73.5%) |
| Total | 15,934 (81.1%) | 15,305 (75.4%) |
Income Below Poverty Among Married-Couple Families in Rio Arriba County
The poverty statistics for married-couple families in Rio Arriba County show that 7.2% or 397 of the total 5,508 families live below the poverty line. Families with 5 or more children have the highest poverty rate of 41.7%, comprising of 5 families. On the other hand, families with no children have the lowest poverty rate of 4.9%, which includes 186 families.
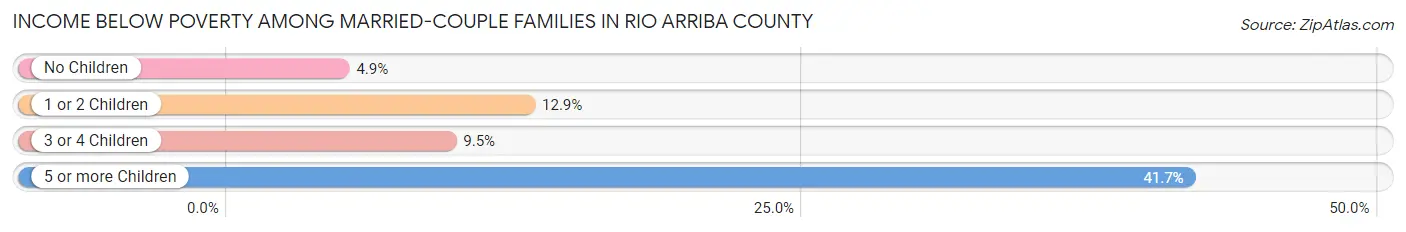
| Children | Above Poverty | Below Poverty |
| No Children | 3,653 (95.2%) | 186 (4.9%) |
| 1 or 2 Children | 1,232 (87.1%) | 183 (12.9%) |
| 3 or 4 Children | 219 (90.5%) | 23 (9.5%) |
| 5 or more Children | 7 (58.3%) | 5 (41.7%) |
| Total | 5,111 (92.8%) | 397 (7.2%) |
Income Below Poverty Among Single-Parent Households in Rio Arriba County
According to the poverty data in Rio Arriba County, 25.9% or 262 single-father households and 33.4% or 720 single-mother households are living below the poverty line. Among single-father households, those with 3 or 4 children have the highest poverty rate, with 44 households (75.9%) experiencing poverty. Likewise, among single-mother households, those with 5 or more children have the highest poverty rate, with 5 households (62.5%) falling below the poverty line.
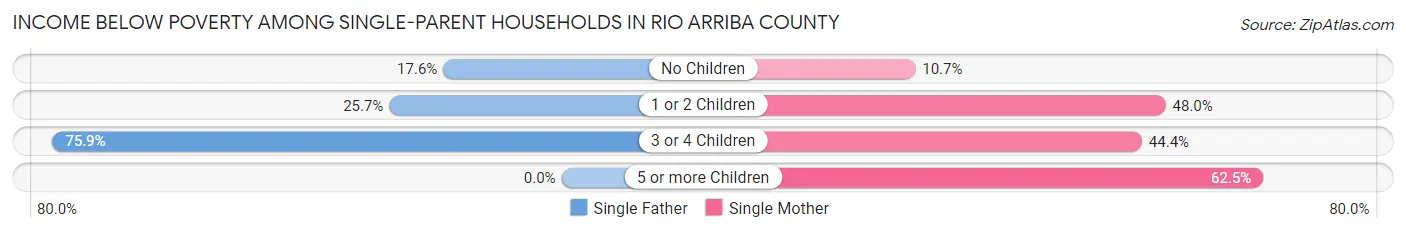
| Children | Single Father | Single Mother |
| No Children | 55 (17.6%) | 89 (10.7%) |
| 1 or 2 Children | 163 (25.7%) | 578 (48.0%) |
| 3 or 4 Children | 44 (75.9%) | 48 (44.4%) |
| 5 or more Children | 0 (0.0%) | 5 (62.5%) |
| Total | 262 (25.9%) | 720 (33.4%) |
Income Below Poverty Among Married-Couple vs Single-Parent Households in Rio Arriba County
The poverty data for Rio Arriba County shows that 397 of the married-couple family households (7.2%) and 982 of the single-parent households (31.0%) are living below the poverty level. Within the married-couple family households, those with 5 or more children have the highest poverty rate, with 5 households (41.7%) falling below the poverty line. Among the single-parent households, those with 3 or 4 children have the highest poverty rate, with 92 household (55.4%) living below poverty.
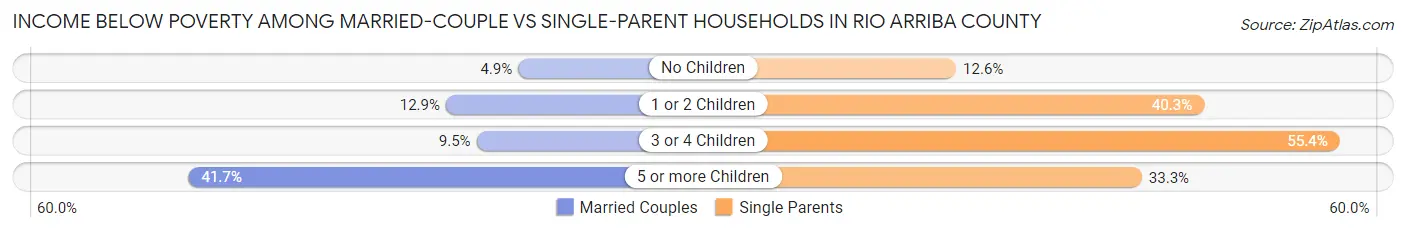
| Children | Married-Couple Families | Single-Parent Households |
| No Children | 186 (4.9%) | 144 (12.6%) |
| 1 or 2 Children | 183 (12.9%) | 741 (40.3%) |
| 3 or 4 Children | 23 (9.5%) | 92 (55.4%) |
| 5 or more Children | 5 (41.7%) | 5 (33.3%) |
| Total | 397 (7.2%) | 982 (31.0%) |
Race in Rio Arriba County
The most populous races in Rio Arriba County are Hispanic or Latino (28,711 | 71.3%), White / Caucasian (14,240 | 35.3%), and Some other Race (12,301 | 30.5%).
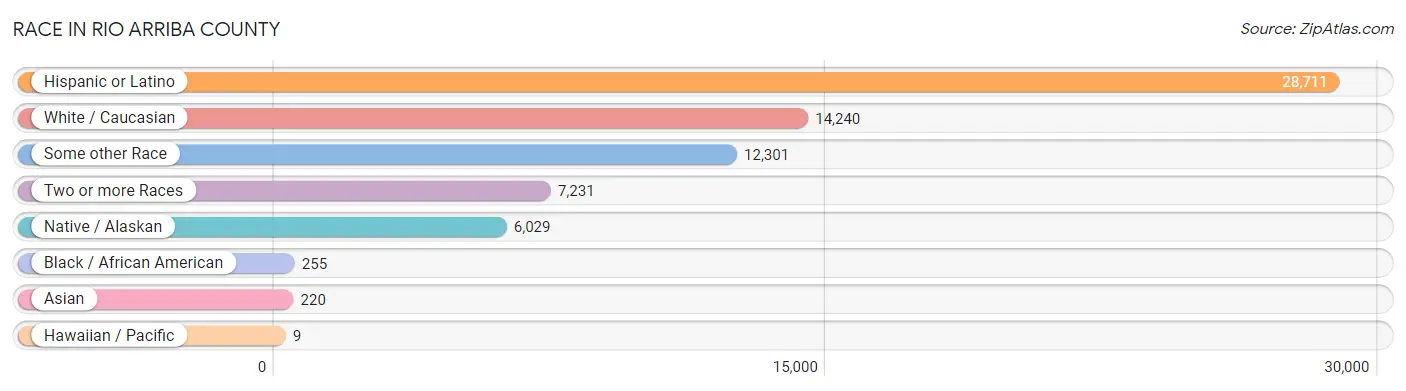
| Race | # Population | % Population |
| Asian | 220 | 0.5% |
| Black / African American | 255 | 0.6% |
| Hawaiian / Pacific | 9 | 0.0% |
| Hispanic or Latino | 28,711 | 71.3% |
| Native / Alaskan | 6,029 | 15.0% |
| White / Caucasian | 14,240 | 35.3% |
| Two or more Races | 7,231 | 17.9% |
| Some other Race | 12,301 | 30.5% |
| Total | 40,285 | 100.0% |
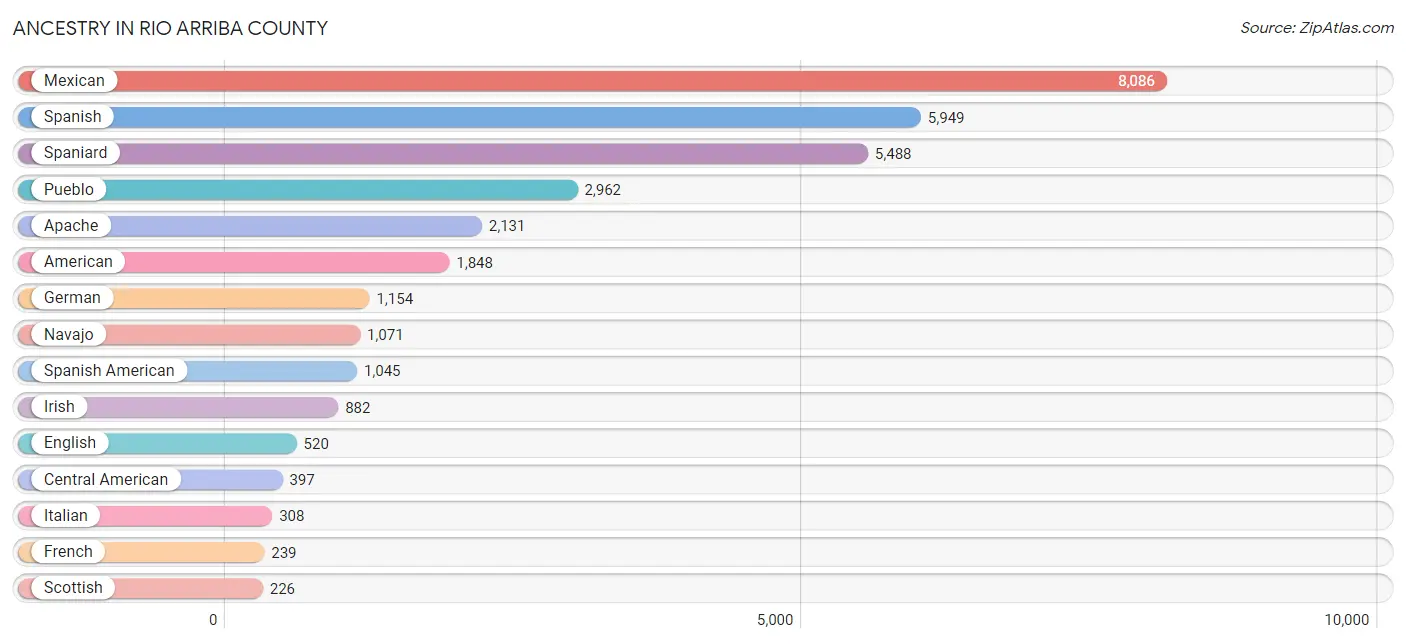
Ancestry in Rio Arriba County
The most populous ancestries reported in Rio Arriba County are Mexican (8,086 | 20.1%), Spanish (5,949 | 14.8%), Spaniard (5,488 | 13.6%), Pueblo (2,962 | 7.3%), and Apache (2,131 | 5.3%), together accounting for 61.1% of all Rio Arriba County residents.
| Ancestry | # Population | % Population |
| African | 71 | 0.2% |
| American | 1,848 | 4.6% |
| Apache | 2,131 | 5.3% |
| Arab | 5 | 0.0% |
| Austrian | 29 | 0.1% |
| Barbadian | 9 | 0.0% |
| Belgian | 16 | 0.0% |
| Blackfeet | 12 | 0.0% |
| British | 60 | 0.2% |
| Canadian | 37 | 0.1% |
| Central American | 397 | 1.0% |
| Central American Indian | 88 | 0.2% |
| Cherokee | 46 | 0.1% |
| Chickasaw | 3 | 0.0% |
| Chippewa | 13 | 0.0% |
| Choctaw | 25 | 0.1% |
| Colombian | 21 | 0.1% |
| Comanche | 50 | 0.1% |
| Costa Rican | 100 | 0.3% |
| Creek | 21 | 0.1% |
| Croatian | 37 | 0.1% |
| Cuban | 32 | 0.1% |
| Czech | 7 | 0.0% |
| Czechoslovakian | 44 | 0.1% |
| Dominican | 40 | 0.1% |
| Dutch | 160 | 0.4% |
| Ecuadorian | 162 | 0.4% |
| English | 520 | 1.3% |
| European | 70 | 0.2% |
| Finnish | 12 | 0.0% |
| French | 239 | 0.6% |
| French Canadian | 10 | 0.0% |
| German | 1,154 | 2.9% |
| Greek | 51 | 0.1% |
| Guatemalan | 117 | 0.3% |
| Hopi | 34 | 0.1% |
| Hungarian | 17 | 0.0% |
| Indian (Asian) | 42 | 0.1% |
| Irish | 882 | 2.2% |
| Italian | 308 | 0.8% |
| Jamaican | 5 | 0.0% |
| Korean | 117 | 0.3% |
| Lebanese | 5 | 0.0% |
| Liberian | 26 | 0.1% |
| Lithuanian | 15 | 0.0% |
| Mexican | 8,086 | 20.1% |
| Mexican American Indian | 16 | 0.0% |
| Native Hawaiian | 12 | 0.0% |
| Navajo | 1,071 | 2.7% |
| Northern European | 32 | 0.1% |
| Norwegian | 19 | 0.1% |
| Paiute | 3 | 0.0% |
| Panamanian | 97 | 0.2% |
| Pima | 82 | 0.2% |
| Polish | 145 | 0.4% |
| Portuguese | 3 | 0.0% |
| Potawatomi | 5 | 0.0% |
| Pueblo | 2,962 | 7.3% |
| Puerto Rican | 50 | 0.1% |
| Russian | 147 | 0.4% |
| Salvadoran | 83 | 0.2% |
| Scotch-Irish | 52 | 0.1% |
| Scottish | 226 | 0.6% |
| Serbian | 3 | 0.0% |
| Sioux | 27 | 0.1% |
| Slovak | 11 | 0.0% |
| South American | 183 | 0.4% |
| Spaniard | 5,488 | 13.6% |
| Spanish | 5,949 | 14.8% |
| Spanish American | 1,045 | 2.6% |
| Spanish American Indian | 9 | 0.0% |
| Sri Lankan | 107 | 0.3% |
| Subsaharan African | 97 | 0.2% |
| Swedish | 43 | 0.1% |
| Swiss | 38 | 0.1% |
| Tohono O'Odham | 1 | 0.0% |
| Ukrainian | 3 | 0.0% |
| Welsh | 65 | 0.2% |
| West Indian | 13 | 0.0% | View All 79 Rows |
Immigrants in Rio Arriba County
The most numerous immigrant groups reported in Rio Arriba County came from Latin America (1,935 | 4.8%), Central America (1,760 | 4.4%), Mexico (1,513 | 3.8%), Asia (194 | 0.5%), and South Eastern Asia (184 | 0.5%), together accounting for 13.9% of all Rio Arriba County residents.
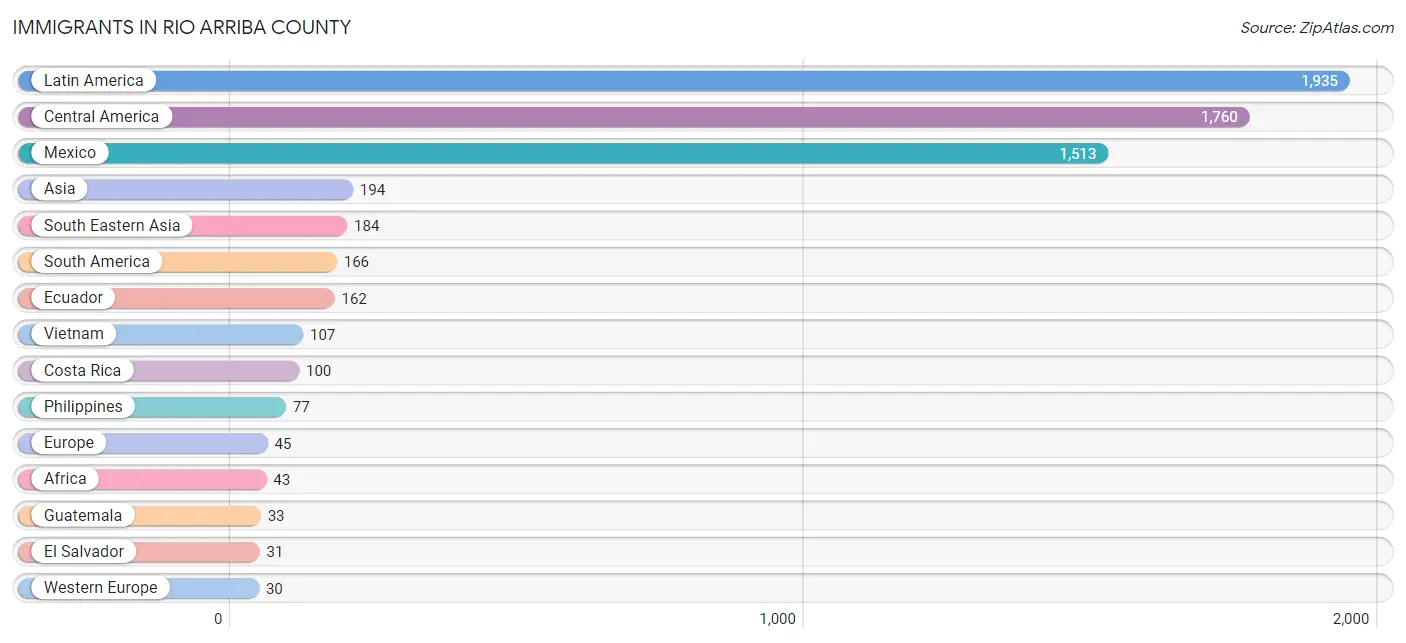
| Immigration Origin | # Population | % Population |
| Africa | 43 | 0.1% |
| Asia | 194 | 0.5% |
| Canada | 4 | 0.0% |
| Caribbean | 9 | 0.0% |
| Central America | 1,760 | 4.4% |
| China | 10 | 0.0% |
| Colombia | 4 | 0.0% |
| Costa Rica | 100 | 0.3% |
| Cuba | 4 | 0.0% |
| Eastern Africa | 2 | 0.0% |
| Eastern Asia | 10 | 0.0% |
| Eastern Europe | 3 | 0.0% |
| Ecuador | 162 | 0.4% |
| El Salvador | 31 | 0.1% |
| England | 2 | 0.0% |
| Europe | 45 | 0.1% |
| France | 19 | 0.1% |
| Germany | 6 | 0.0% |
| Guatemala | 33 | 0.1% |
| Jamaica | 5 | 0.0% |
| Kenya | 2 | 0.0% |
| Latin America | 1,935 | 4.8% |
| Mexico | 1,513 | 3.8% |
| Northern Europe | 12 | 0.0% |
| Philippines | 77 | 0.2% |
| South America | 166 | 0.4% |
| South Eastern Asia | 184 | 0.5% |
| Sweden | 10 | 0.0% |
| Switzerland | 5 | 0.0% |
| Ukraine | 3 | 0.0% |
| Vietnam | 107 | 0.3% |
| Western Europe | 30 | 0.1% | View All 32 Rows |
Sex and Age in Rio Arriba County
Sex and Age in Rio Arriba County
The most populous age groups in Rio Arriba County are 55 to 59 Years (1,633 | 8.2%) for men and 10 to 14 Years (1,655 | 8.1%) for women.
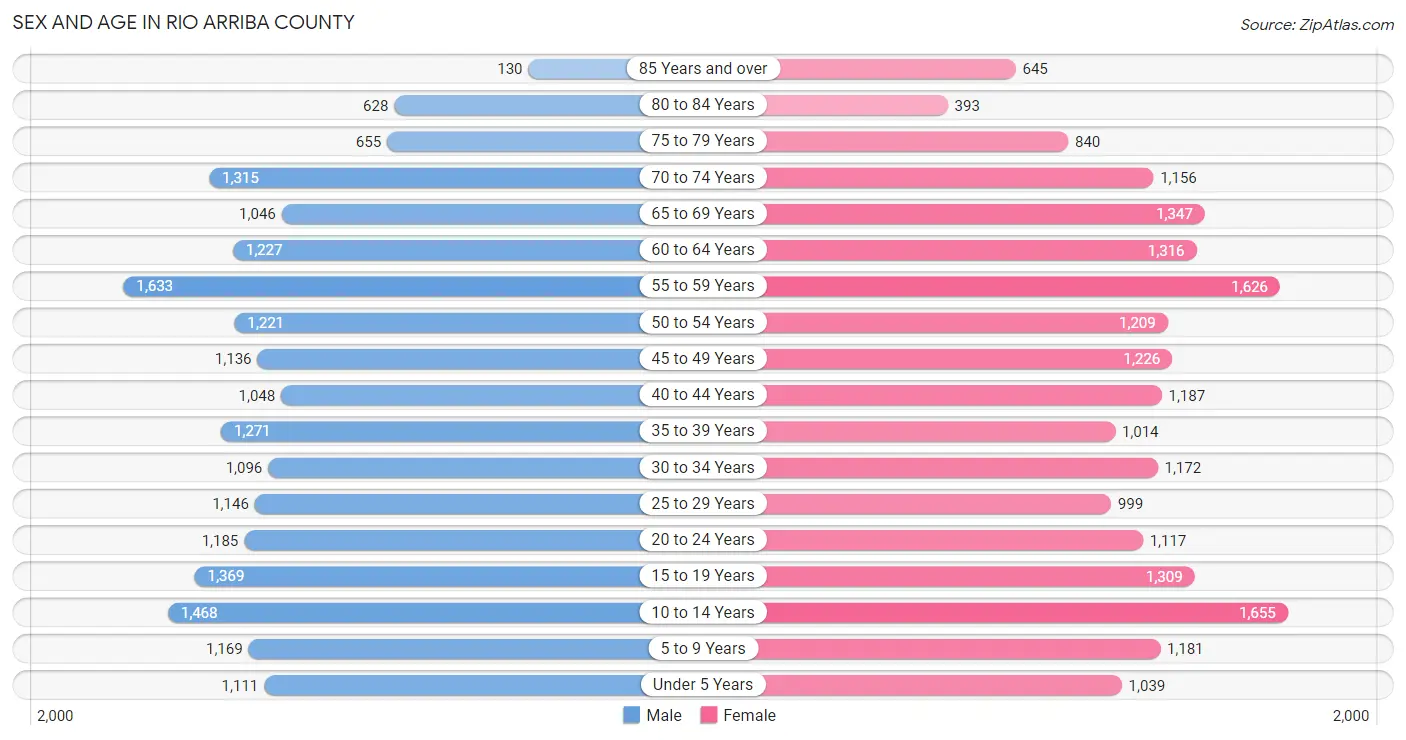
| Age Bracket | Male | Female |
| Under 5 Years | 1,111 (5.6%) | 1,039 (5.1%) |
| 5 to 9 Years | 1,169 (5.9%) | 1,181 (5.8%) |
| 10 to 14 Years | 1,468 (7.4%) | 1,655 (8.1%) |
| 15 to 19 Years | 1,369 (6.9%) | 1,309 (6.4%) |
| 20 to 24 Years | 1,185 (6.0%) | 1,117 (5.5%) |
| 25 to 29 Years | 1,146 (5.8%) | 999 (4.9%) |
| 30 to 34 Years | 1,096 (5.5%) | 1,172 (5.7%) |
| 35 to 39 Years | 1,271 (6.4%) | 1,014 (5.0%) |
| 40 to 44 Years | 1,048 (5.3%) | 1,187 (5.8%) |
| 45 to 49 Years | 1,136 (5.7%) | 1,226 (6.0%) |
| 50 to 54 Years | 1,221 (6.1%) | 1,209 (5.9%) |
| 55 to 59 Years | 1,633 (8.2%) | 1,626 (8.0%) |
| 60 to 64 Years | 1,227 (6.2%) | 1,316 (6.4%) |
| 65 to 69 Years | 1,046 (5.3%) | 1,347 (6.6%) |
| 70 to 74 Years | 1,315 (6.6%) | 1,156 (5.7%) |
| 75 to 79 Years | 655 (3.3%) | 840 (4.1%) |
| 80 to 84 Years | 628 (3.2%) | 393 (1.9%) |
| 85 Years and over | 130 (0.6%) | 645 (3.2%) |
| Total | 19,854 (100.0%) | 20,431 (100.0%) |
Families and Households in Rio Arriba County
Median Family Size in Rio Arriba County
The median family size in Rio Arriba County is 3.65 persons per family, with single female/mother families (2,155 | 24.8%) accounting for the largest median family size of 4.25 persons per family. On the other hand, married-couple families (5,508 | 63.5%) represent the smallest median family size with 3.42 persons per family.
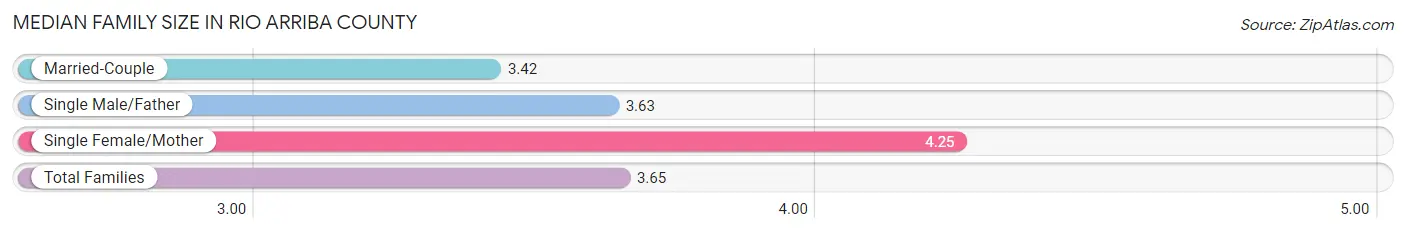
| Family Type | # Families | Family Size |
| Married-Couple | 5,508 (63.5%) | 3.42 |
| Single Male/Father | 1,012 (11.7%) | 3.63 |
| Single Female/Mother | 2,155 (24.8%) | 4.25 |
| Total Families | 8,675 (100.0%) | 3.65 |
Median Household Size in Rio Arriba County
The median household size in Rio Arriba County is 2.82 persons per household, with single female/mother households (2,155 | 15.3%) accounting for the largest median household size of 4.5 persons per household. non-family households (5,401 | 38.4%) represent the smallest median household size with 1.27 persons per household.
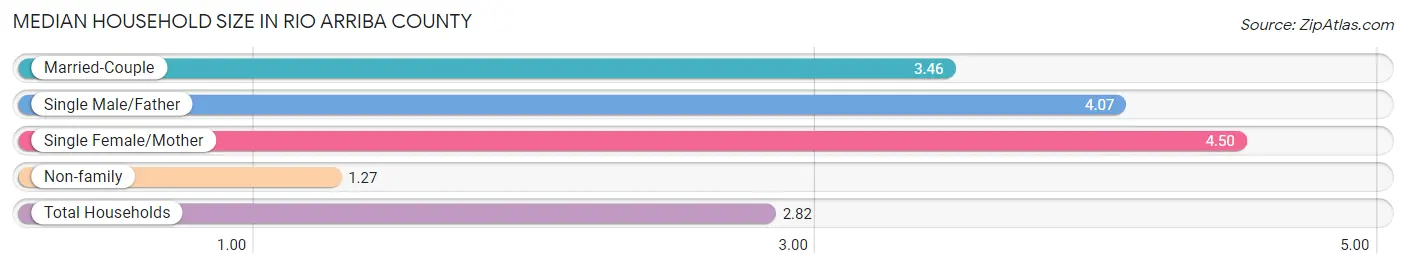
| Household Type | # Households | Household Size |
| Married-Couple | 5,508 (39.1%) | 3.46 |
| Single Male/Father | 1,012 (7.2%) | 4.07 |
| Single Female/Mother | 2,155 (15.3%) | 4.50 |
| Non-family | 5,401 (38.4%) | 1.27 |
| Total Households | 14,076 (100.0%) | 2.82 |
Household Size by Marriage Status in Rio Arriba County
Out of a total of 14,076 households in Rio Arriba County, 8,675 (61.6%) are family households, while 5,401 (38.4%) are nonfamily households. The most numerous type of family households are 2-person households, comprising 4,344, and the most common type of nonfamily households are 1-person households, comprising 4,645.
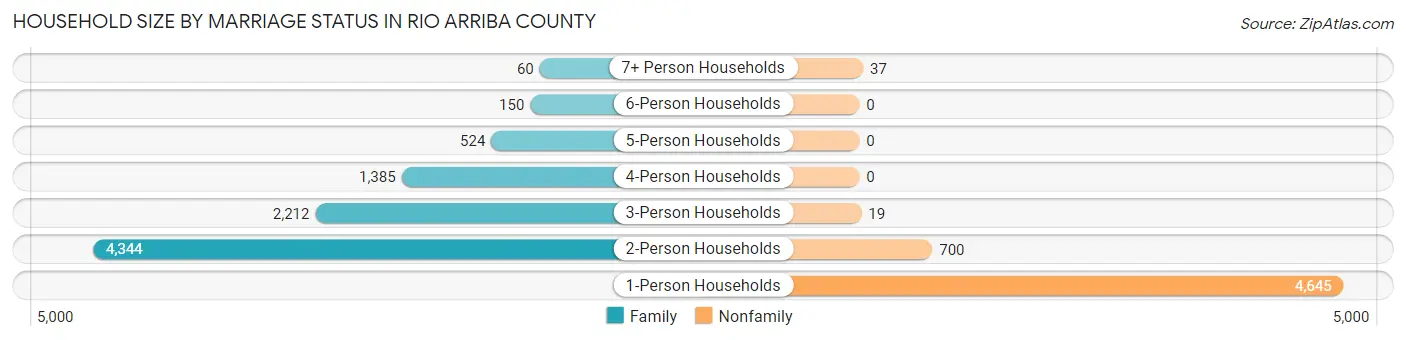
| Household Size | Family Households | Nonfamily Households |
| 1-Person Households | - | 4,645 (33.0%) |
| 2-Person Households | 4,344 (30.9%) | 700 (5.0%) |
| 3-Person Households | 2,212 (15.7%) | 19 (0.1%) |
| 4-Person Households | 1,385 (9.8%) | 0 (0.0%) |
| 5-Person Households | 524 (3.7%) | 0 (0.0%) |
| 6-Person Households | 150 (1.1%) | 0 (0.0%) |
| 7+ Person Households | 60 (0.4%) | 37 (0.3%) |
| Total | 8,675 (61.6%) | 5,401 (38.4%) |
Female Fertility in Rio Arriba County
Fertility by Age in Rio Arriba County
Average fertility rate in Rio Arriba County is 37.0 births per 1,000 women. Women in the age bracket of 20 to 34 years have the highest fertility rate with 74.0 births per 1,000 women. Women in the age bracket of 20 to 34 years acount for 79.9% of all women with births.
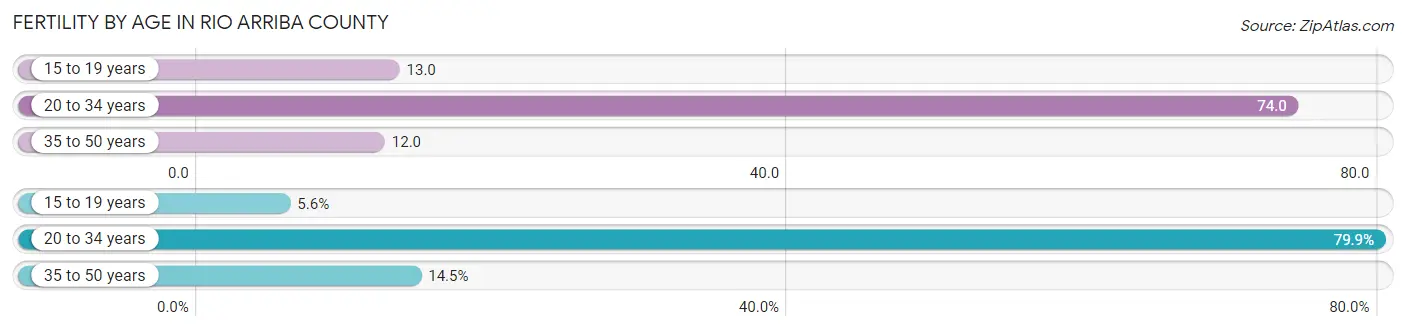
| Age Bracket | Women with Births | Births / 1,000 Women |
| 15 to 19 years | 17 (5.6%) | 13.0 |
| 20 to 34 years | 243 (79.9%) | 74.0 |
| 35 to 50 years | 44 (14.5%) | 12.0 |
| Total | 304 (100.0%) | 37.0 |
Fertility by Age by Marriage Status in Rio Arriba County
18.8% of women with births (304) in Rio Arriba County are married. The highest percentage of unmarried women with births falls into 15 to 19 years age bracket with 100.0% of them unmarried at the time of birth, while the lowest percentage of unmarried women with births belong to 35 to 50 years age bracket with 34.1% of them unmarried.
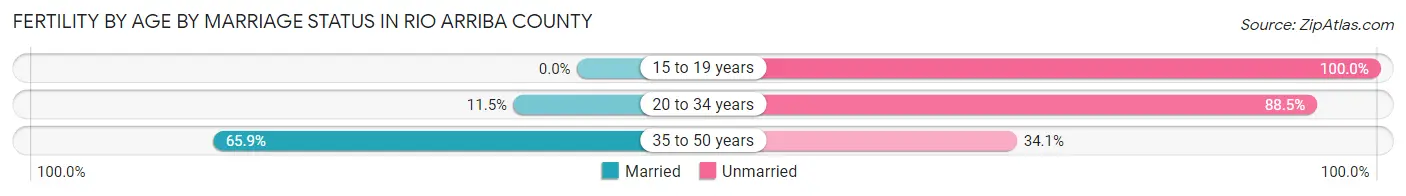
| Age Bracket | Married | Unmarried |
| 15 to 19 years | 0 (0.0%) | 17 (100.0%) |
| 20 to 34 years | 28 (11.5%) | 215 (88.5%) |
| 35 to 50 years | 29 (65.9%) | 15 (34.1%) |
| Total | 57 (18.8%) | 247 (81.2%) |
Fertility by Education in Rio Arriba County
Average fertility rate in Rio Arriba County is 37.0 births per 1,000 women. Women with the education attainment of bachelor's degree have the highest fertility rate of 97.0 births per 1,000 women, while women with the education attainment of less than high school have the lowest fertility at 2.0 births per 1,000 women. Women with the education attainment of college or associate's degree represent 45.1% of all women with births.
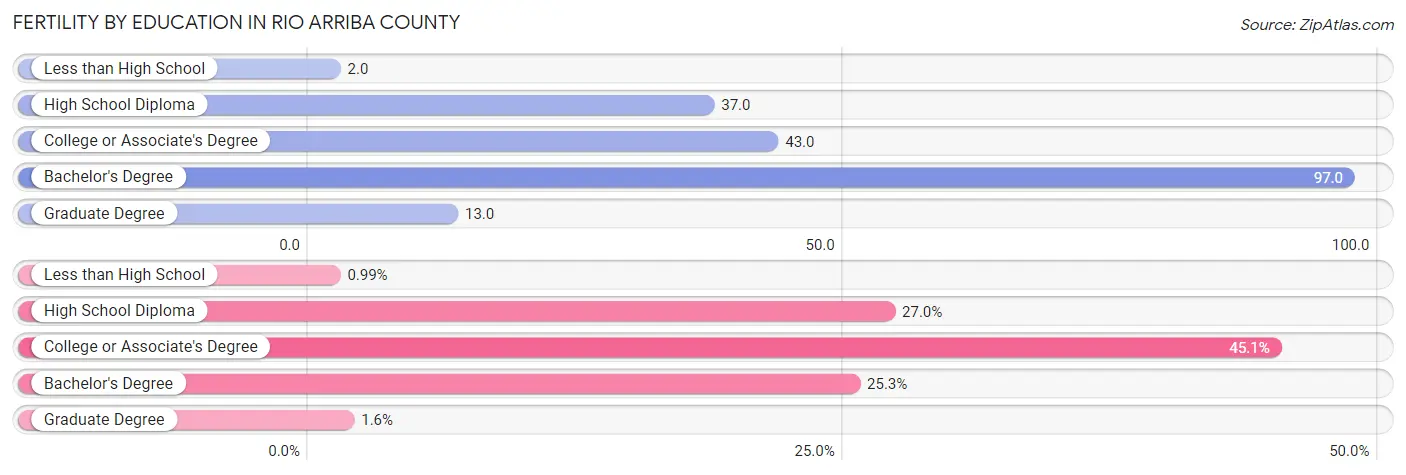
| Educational Attainment | Women with Births | Births / 1,000 Women |
| Less than High School | 3 (1.0%) | 2.0 |
| High School Diploma | 82 (27.0%) | 37.0 |
| College or Associate's Degree | 137 (45.1%) | 43.0 |
| Bachelor's Degree | 77 (25.3%) | 97.0 |
| Graduate Degree | 5 (1.6%) | 13.0 |
| Total | 304 (100.0%) | 37.0 |
Fertility by Education by Marriage Status in Rio Arriba County
81.2% of women with births in Rio Arriba County are unmarried. Women with the educational attainment of high school diploma are most likely to be married with 20.7% of them married at childbirth, while women with the educational attainment of less than high school are least likely to be married with 100.0% of them unmarried at childbirth.
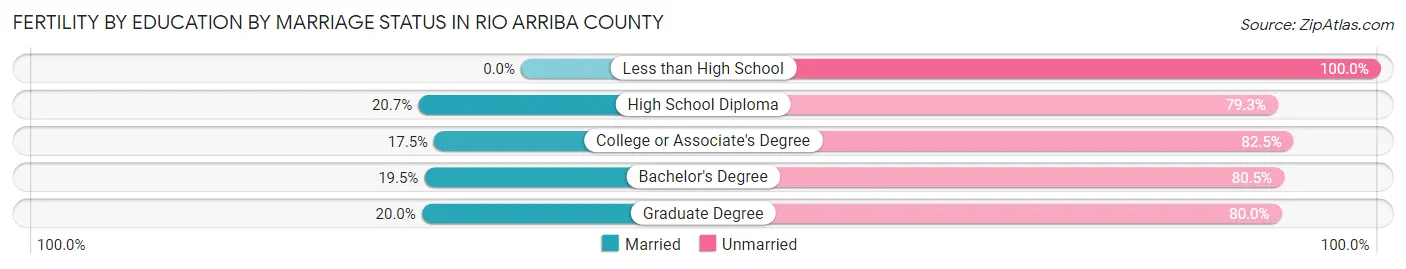
| Educational Attainment | Married | Unmarried |
| Less than High School | 0 (0.0%) | 3 (100.0%) |
| High School Diploma | 17 (20.7%) | 65 (79.3%) |
| College or Associate's Degree | 24 (17.5%) | 113 (82.5%) |
| Bachelor's Degree | 15 (19.5%) | 62 (80.5%) |
| Graduate Degree | 1 (20.0%) | 4 (80.0%) |
| Total | 57 (18.8%) | 247 (81.2%) |
Employment Characteristics in Rio Arriba County
Employment by Class of Employer in Rio Arriba County
Among the 15,331 employed individuals in Rio Arriba County, private company employees (7,216 | 47.1%), federal government employees (2,776 | 18.1%), and state government employees (1,508 | 9.8%) make up the most common classes of employment.
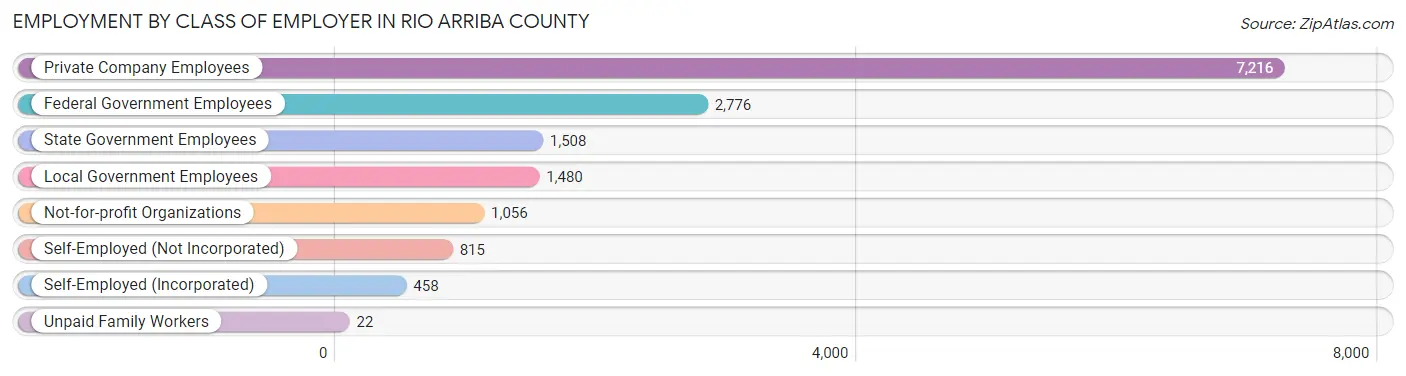
| Employer Class | # Employees | % Employees |
| Private Company Employees | 7,216 | 47.1% |
| Self-Employed (Incorporated) | 458 | 3.0% |
| Self-Employed (Not Incorporated) | 815 | 5.3% |
| Not-for-profit Organizations | 1,056 | 6.9% |
| Local Government Employees | 1,480 | 9.7% |
| State Government Employees | 1,508 | 9.8% |
| Federal Government Employees | 2,776 | 18.1% |
| Unpaid Family Workers | 22 | 0.1% |
| Total | 15,331 | 100.0% |
Employment Status by Age in Rio Arriba County
According to the labor force statistics for Rio Arriba County, out of the total population over 16 years of age (32,295), 51.3% or 16,567 individuals are in the labor force, with 6.0% or 994 of them unemployed. The age group with the highest labor force participation rate is 30 to 34 years, with 78.5% or 1,780 individuals in the labor force. Within the labor force, the 16 to 19 years age range has the highest percentage of unemployed individuals, with 21.5% or 117 of them being unemployed.
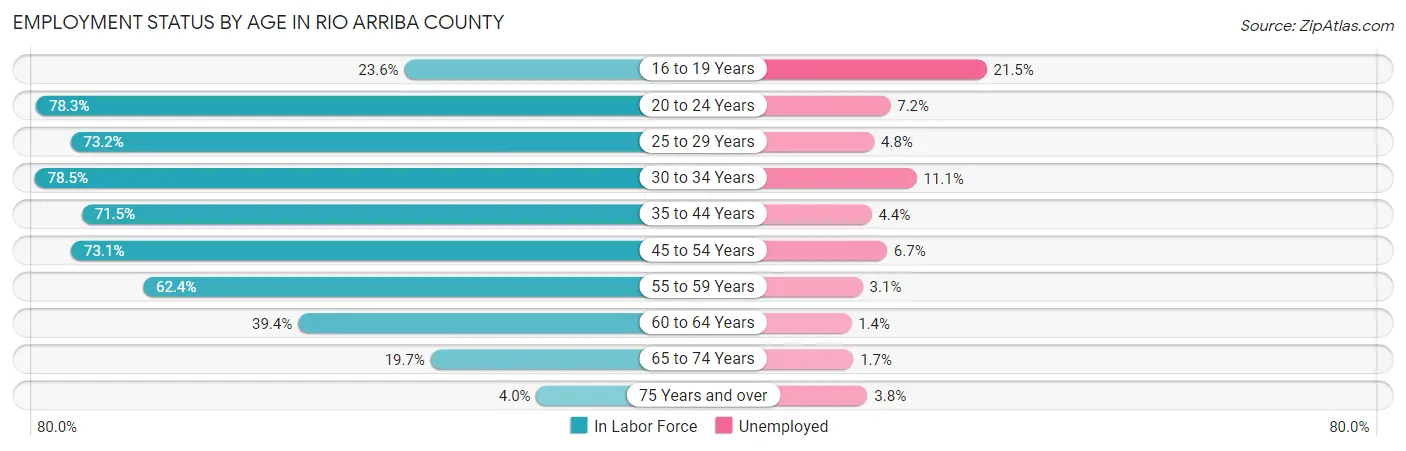
| Age Bracket | In Labor Force | Unemployed |
| 16 to 19 Years | 545 (23.6%) | 117 (21.5%) |
| 20 to 24 Years | 1,802 (78.3%) | 130 (7.2%) |
| 25 to 29 Years | 1,570 (73.2%) | 75 (4.8%) |
| 30 to 34 Years | 1,780 (78.5%) | 198 (11.1%) |
| 35 to 44 Years | 3,232 (71.5%) | 142 (4.4%) |
| 45 to 54 Years | 3,503 (73.1%) | 235 (6.7%) |
| 55 to 59 Years | 2,034 (62.4%) | 63 (3.1%) |
| 60 to 64 Years | 1,002 (39.4%) | 14 (1.4%) |
| 65 to 74 Years | 958 (19.7%) | 16 (1.7%) |
| 75 Years and over | 132 (4.0%) | 5 (3.8%) |
| Total | 16,567 (51.3%) | 994 (6.0%) |
Employment Status by Educational Attainment in Rio Arriba County
According to labor force statistics for Rio Arriba County, 67.2% of individuals (13,122) out of the total population between 25 and 64 years of age (19,527) are in the labor force, with 5.5% or 722 of them being unemployed. The group with the highest labor force participation rate are those with the educational attainment of bachelor's degree or higher, with 76.3% or 2,577 individuals in the labor force. Within the labor force, individuals with less than high school education have the highest percentage of unemployment, with 9.5% or 142 of them being unemployed.
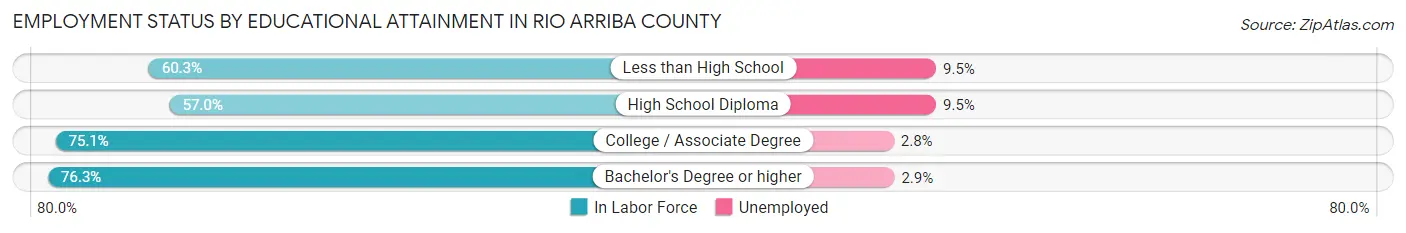
| Educational Attainment | In Labor Force | Unemployed |
| Less than High School | 1,491 (60.3%) | 235 (9.5%) |
| High School Diploma | 3,836 (57.0%) | 639 (9.5%) |
| College / Associate Degree | 5,217 (75.1%) | 195 (2.8%) |
| Bachelor's Degree or higher | 2,577 (76.3%) | 98 (2.9%) |
| Total | 13,122 (67.2%) | 1,074 (5.5%) |
Employment Occupations by Sex in Rio Arriba County
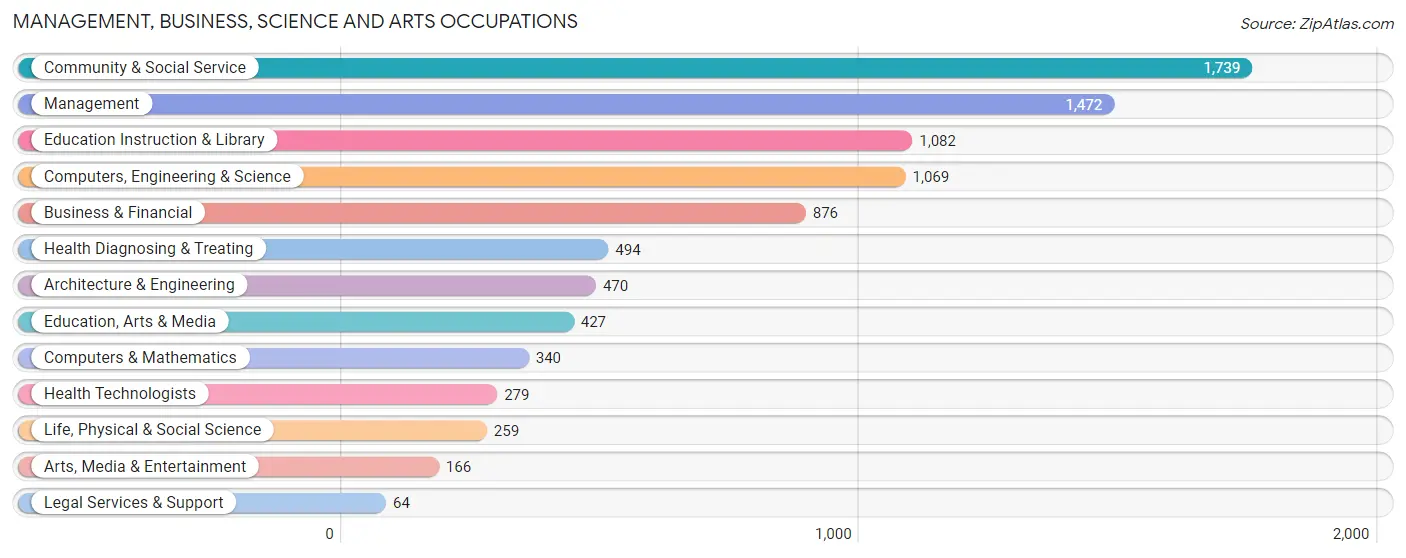
Management, Business, Science and Arts Occupations
The most common Management, Business, Science and Arts occupations in Rio Arriba County are Community & Social Service (1,739 | 11.2%), Management (1,472 | 9.5%), Education Instruction & Library (1,082 | 7.0%), Computers, Engineering & Science (1,069 | 6.9%), and Business & Financial (876 | 5.6%).
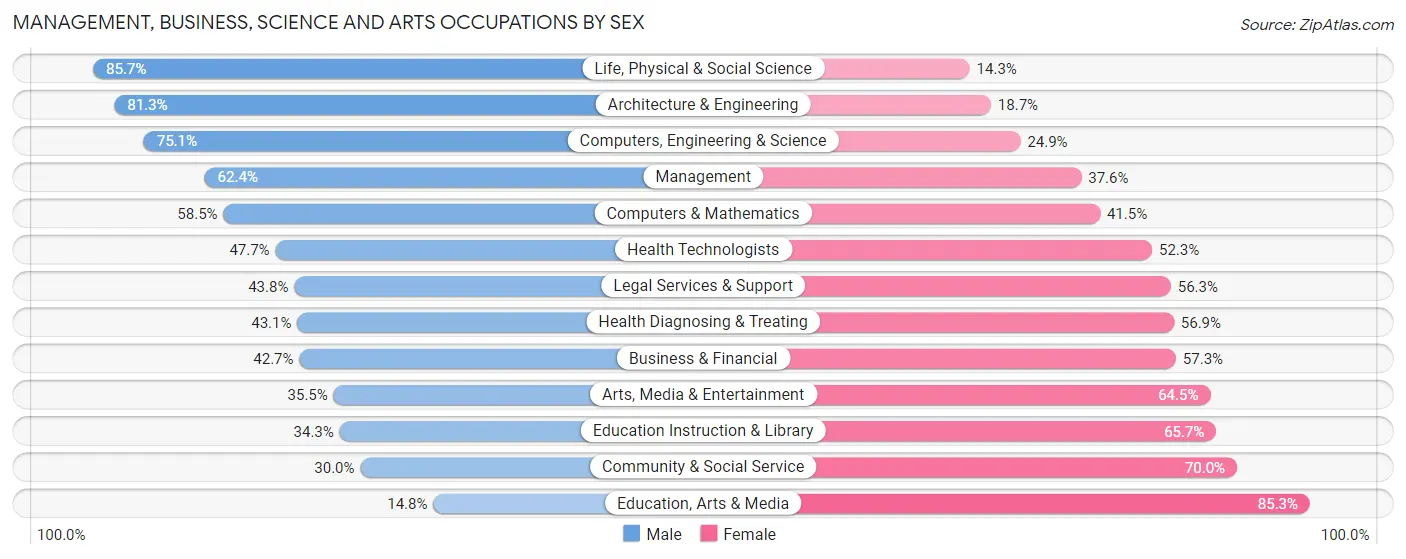
Management, Business, Science and Arts Occupations by Sex
Within the Management, Business, Science and Arts occupations in Rio Arriba County, the most male-oriented occupations are Life, Physical & Social Science (85.7%), Architecture & Engineering (81.3%), and Computers, Engineering & Science (75.1%), while the most female-oriented occupations are Education, Arts & Media (85.3%), Community & Social Service (70.0%), and Education Instruction & Library (65.7%).
| Occupation | Male | Female |
| Management | 919 (62.4%) | 553 (37.6%) |
| Business & Financial | 374 (42.7%) | 502 (57.3%) |
| Computers, Engineering & Science | 803 (75.1%) | 266 (24.9%) |
| Computers & Mathematics | 199 (58.5%) | 141 (41.5%) |
| Architecture & Engineering | 382 (81.3%) | 88 (18.7%) |
| Life, Physical & Social Science | 222 (85.7%) | 37 (14.3%) |
| Community & Social Service | 521 (30.0%) | 1,218 (70.0%) |
| Education, Arts & Media | 63 (14.7%) | 364 (85.3%) |
| Legal Services & Support | 28 (43.8%) | 36 (56.2%) |
| Education Instruction & Library | 371 (34.3%) | 711 (65.7%) |
| Arts, Media & Entertainment | 59 (35.5%) | 107 (64.5%) |
| Health Diagnosing & Treating | 213 (43.1%) | 281 (56.9%) |
| Health Technologists | 133 (47.7%) | 146 (52.3%) |
| Total (Category) | 2,830 (50.1%) | 2,820 (49.9%) |
| Total (Overall) | 8,196 (52.7%) | 7,346 (47.3%) |
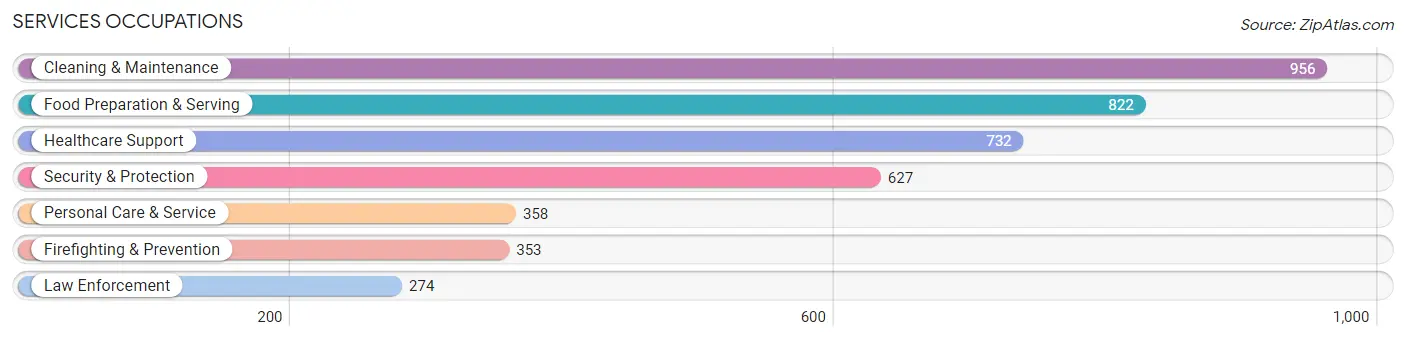
Services Occupations
The most common Services occupations in Rio Arriba County are Cleaning & Maintenance (956 | 6.1%), Food Preparation & Serving (822 | 5.3%), Healthcare Support (732 | 4.7%), Security & Protection (627 | 4.0%), and Personal Care & Service (358 | 2.3%).
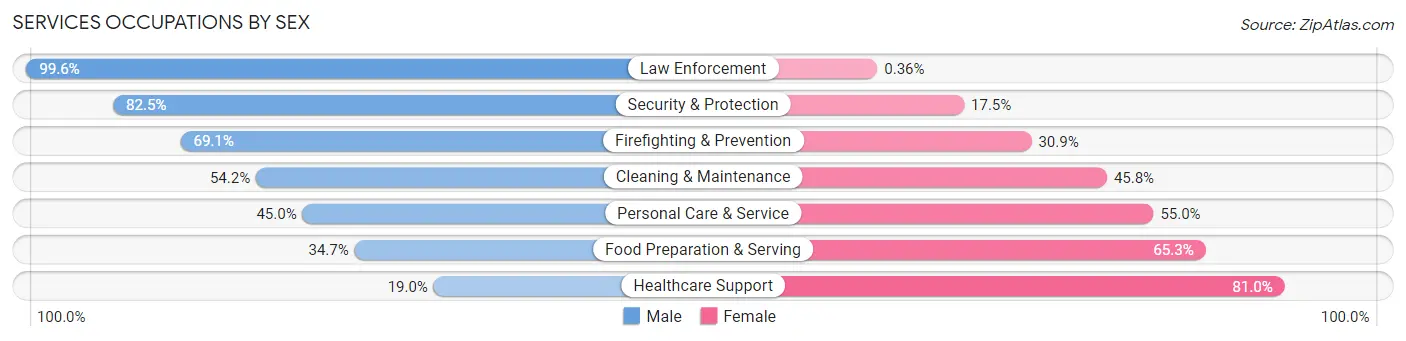
Services Occupations by Sex
Within the Services occupations in Rio Arriba County, the most male-oriented occupations are Law Enforcement (99.6%), Security & Protection (82.5%), and Firefighting & Prevention (69.1%), while the most female-oriented occupations are Healthcare Support (81.0%), Food Preparation & Serving (65.3%), and Personal Care & Service (55.0%).
| Occupation | Male | Female |
| Healthcare Support | 139 (19.0%) | 593 (81.0%) |
| Security & Protection | 517 (82.5%) | 110 (17.5%) |
| Firefighting & Prevention | 244 (69.1%) | 109 (30.9%) |
| Law Enforcement | 273 (99.6%) | 1 (0.4%) |
| Food Preparation & Serving | 285 (34.7%) | 537 (65.3%) |
| Cleaning & Maintenance | 518 (54.2%) | 438 (45.8%) |
| Personal Care & Service | 161 (45.0%) | 197 (55.0%) |
| Total (Category) | 1,620 (46.4%) | 1,875 (53.6%) |
| Total (Overall) | 8,196 (52.7%) | 7,346 (47.3%) |
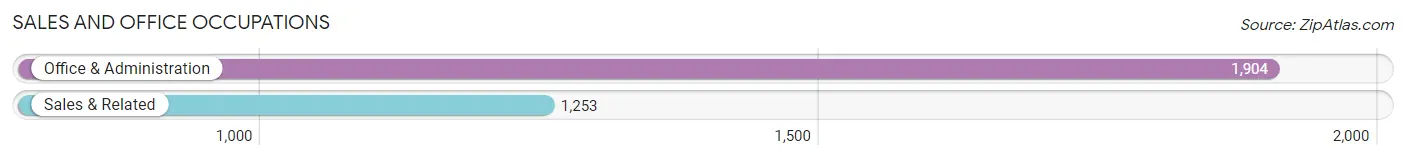
Sales and Office Occupations
The most common Sales and Office occupations in Rio Arriba County are Office & Administration (1,904 | 12.2%), and Sales & Related (1,253 | 8.1%).
Sales and Office Occupations by Sex
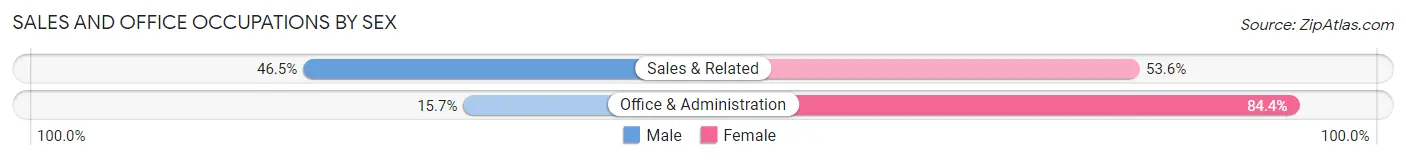
| Occupation | Male | Female |
| Sales & Related | 582 (46.5%) | 671 (53.5%) |
| Office & Administration | 298 (15.7%) | 1,606 (84.4%) |
| Total (Category) | 880 (27.9%) | 2,277 (72.1%) |
| Total (Overall) | 8,196 (52.7%) | 7,346 (47.3%) |
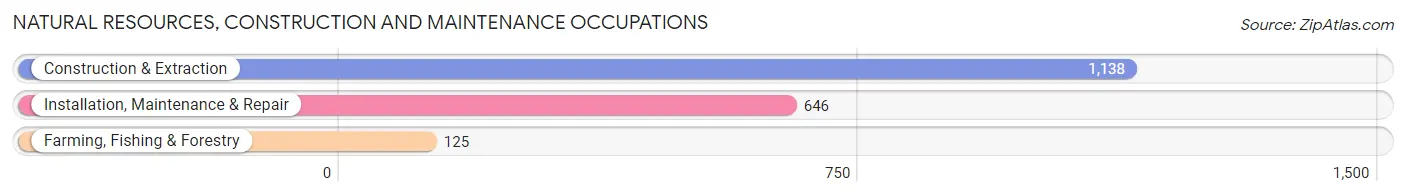
Natural Resources, Construction and Maintenance Occupations
The most common Natural Resources, Construction and Maintenance occupations in Rio Arriba County are Construction & Extraction (1,138 | 7.3%), Installation, Maintenance & Repair (646 | 4.2%), and Farming, Fishing & Forestry (125 | 0.8%).
Natural Resources, Construction and Maintenance Occupations by Sex
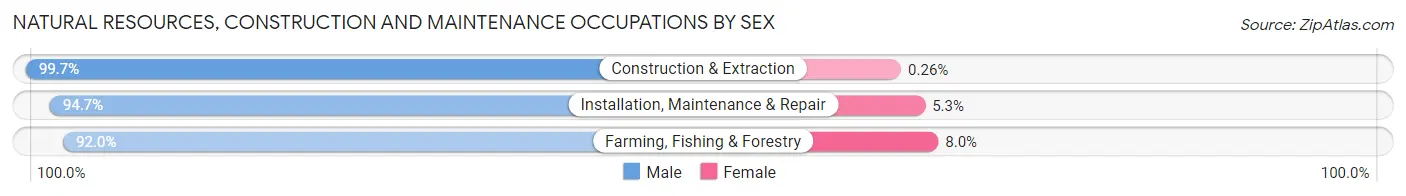
| Occupation | Male | Female |
| Farming, Fishing & Forestry | 115 (92.0%) | 10 (8.0%) |
| Construction & Extraction | 1,135 (99.7%) | 3 (0.3%) |
| Installation, Maintenance & Repair | 612 (94.7%) | 34 (5.3%) |
| Total (Category) | 1,862 (97.5%) | 47 (2.5%) |
| Total (Overall) | 8,196 (52.7%) | 7,346 (47.3%) |
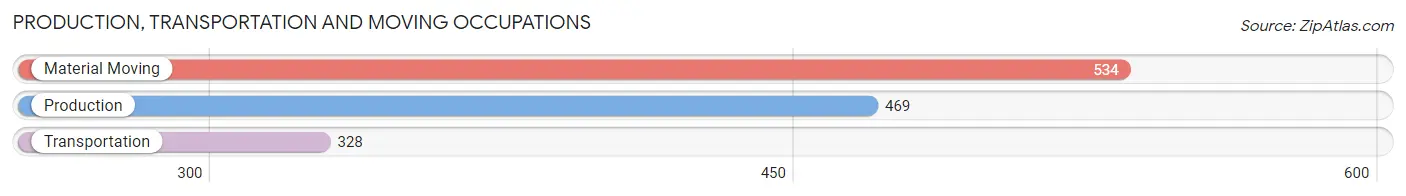
Production, Transportation and Moving Occupations
The most common Production, Transportation and Moving occupations in Rio Arriba County are Material Moving (534 | 3.4%), Production (469 | 3.0%), and Transportation (328 | 2.1%).
Production, Transportation and Moving Occupations by Sex
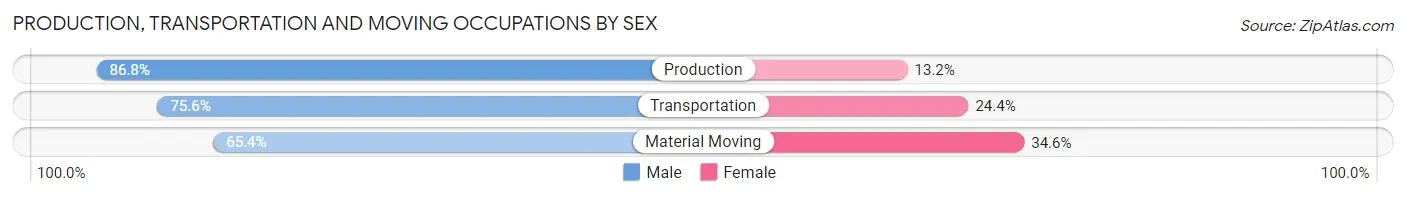
| Occupation | Male | Female |
| Production | 407 (86.8%) | 62 (13.2%) |
| Transportation | 248 (75.6%) | 80 (24.4%) |
| Material Moving | 349 (65.4%) | 185 (34.6%) |
| Total (Category) | 1,004 (75.4%) | 327 (24.6%) |
| Total (Overall) | 8,196 (52.7%) | 7,346 (47.3%) |
Employment Industries by Sex in Rio Arriba County
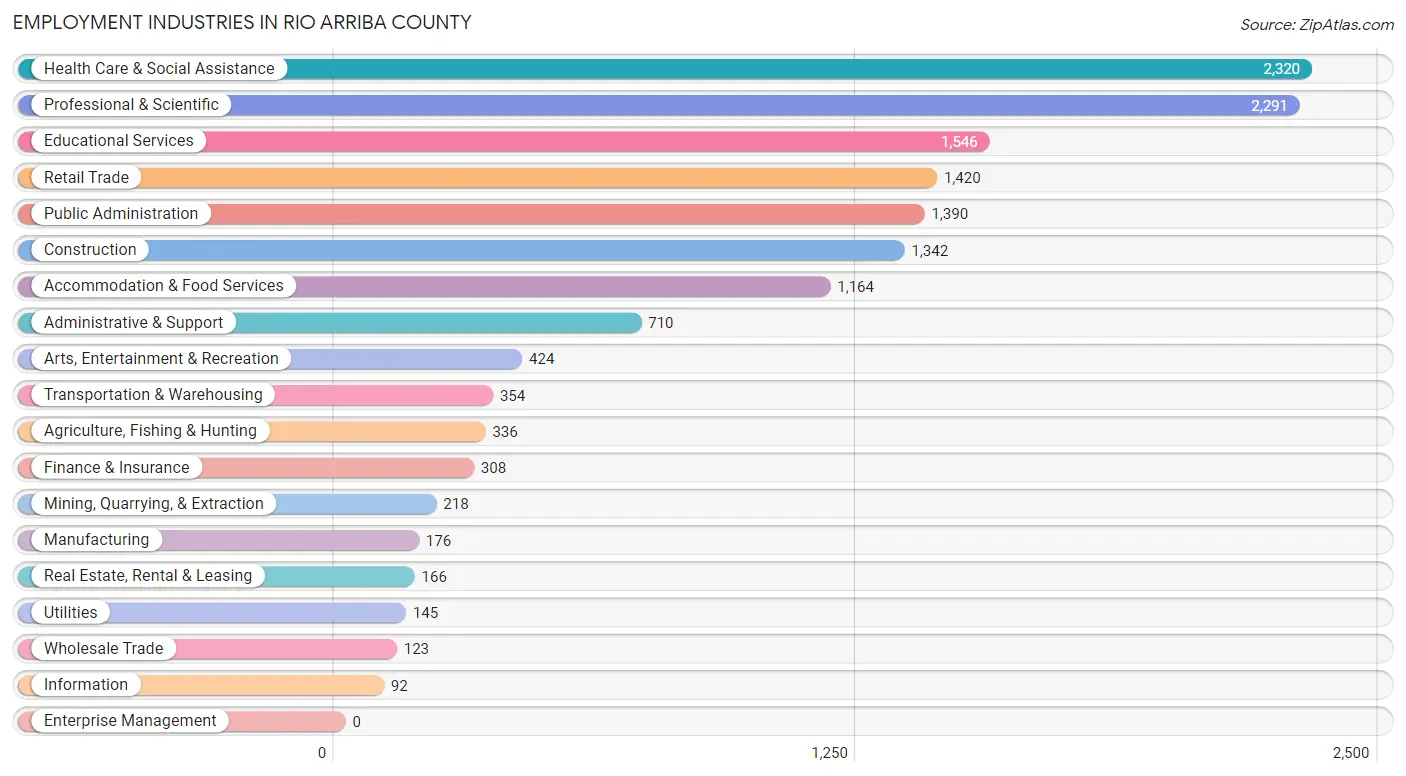
Employment Industries in Rio Arriba County
The major employment industries in Rio Arriba County include Health Care & Social Assistance (2,320 | 14.9%), Professional & Scientific (2,291 | 14.7%), Educational Services (1,546 | 10.0%), Retail Trade (1,420 | 9.1%), and Public Administration (1,390 | 8.9%).
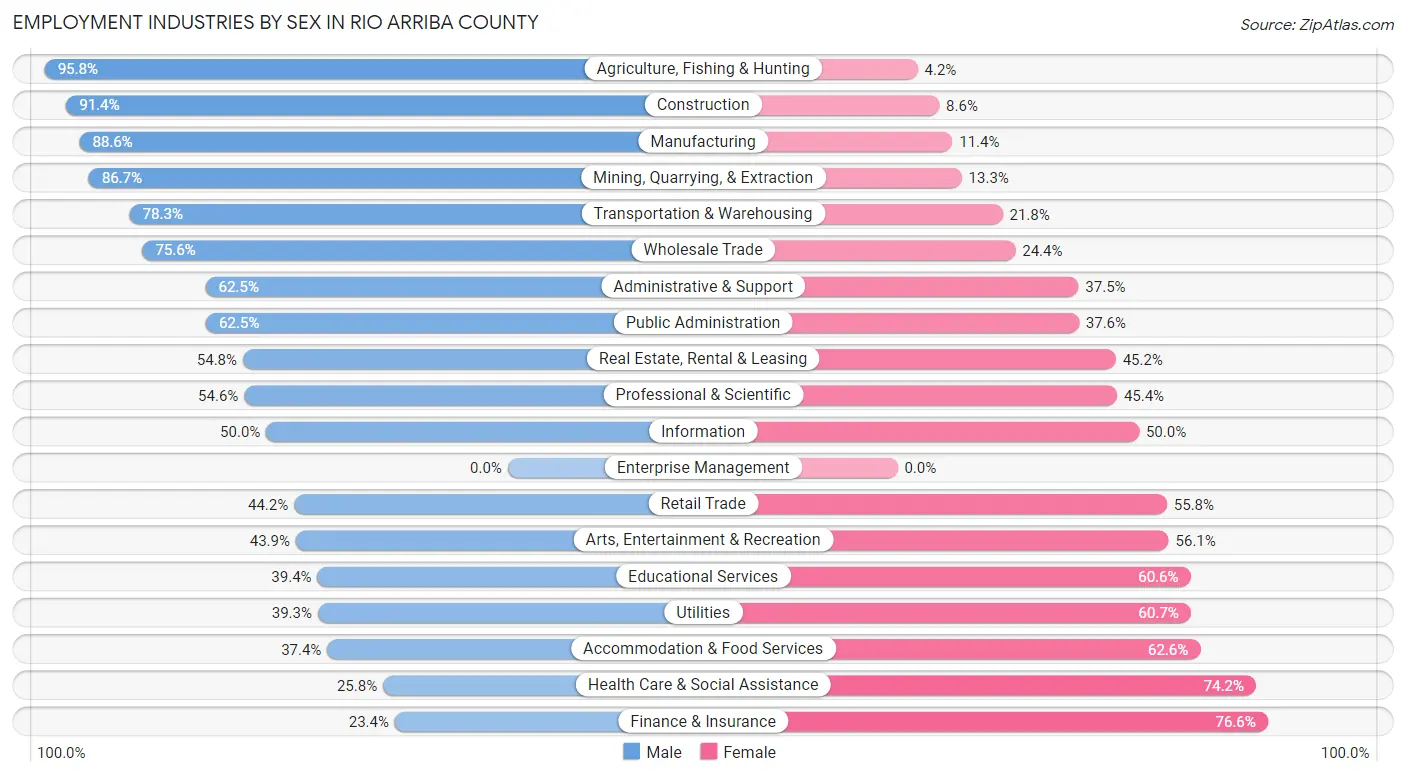
Employment Industries by Sex in Rio Arriba County
The Rio Arriba County industries that see more men than women are Agriculture, Fishing & Hunting (95.8%), Construction (91.4%), and Manufacturing (88.6%), whereas the industries that tend to have a higher number of women are Finance & Insurance (76.6%), Health Care & Social Assistance (74.2%), and Accommodation & Food Services (62.6%).
| Industry | Male | Female |
| Agriculture, Fishing & Hunting | 322 (95.8%) | 14 (4.2%) |
| Mining, Quarrying, & Extraction | 189 (86.7%) | 29 (13.3%) |
| Construction | 1,226 (91.4%) | 116 (8.6%) |
| Manufacturing | 156 (88.6%) | 20 (11.4%) |
| Wholesale Trade | 93 (75.6%) | 30 (24.4%) |
| Retail Trade | 628 (44.2%) | 792 (55.8%) |
| Transportation & Warehousing | 277 (78.2%) | 77 (21.7%) |
| Utilities | 57 (39.3%) | 88 (60.7%) |
| Information | 46 (50.0%) | 46 (50.0%) |
| Finance & Insurance | 72 (23.4%) | 236 (76.6%) |
| Real Estate, Rental & Leasing | 91 (54.8%) | 75 (45.2%) |
| Professional & Scientific | 1,250 (54.6%) | 1,041 (45.4%) |
| Enterprise Management | 0 (0.0%) | 0 (0.0%) |
| Administrative & Support | 444 (62.5%) | 266 (37.5%) |
| Educational Services | 609 (39.4%) | 937 (60.6%) |
| Health Care & Social Assistance | 599 (25.8%) | 1,721 (74.2%) |
| Arts, Entertainment & Recreation | 186 (43.9%) | 238 (56.1%) |
| Accommodation & Food Services | 435 (37.4%) | 729 (62.6%) |
| Public Administration | 868 (62.5%) | 522 (37.6%) |
| Total | 8,196 (52.7%) | 7,346 (47.3%) |
Education in Rio Arriba County
School Enrollment in Rio Arriba County
The most common levels of schooling among the 9,041 students in Rio Arriba County are middle school (2,674 | 29.6%), high school (2,108 | 23.3%), and elementary school (1,725 | 19.1%).
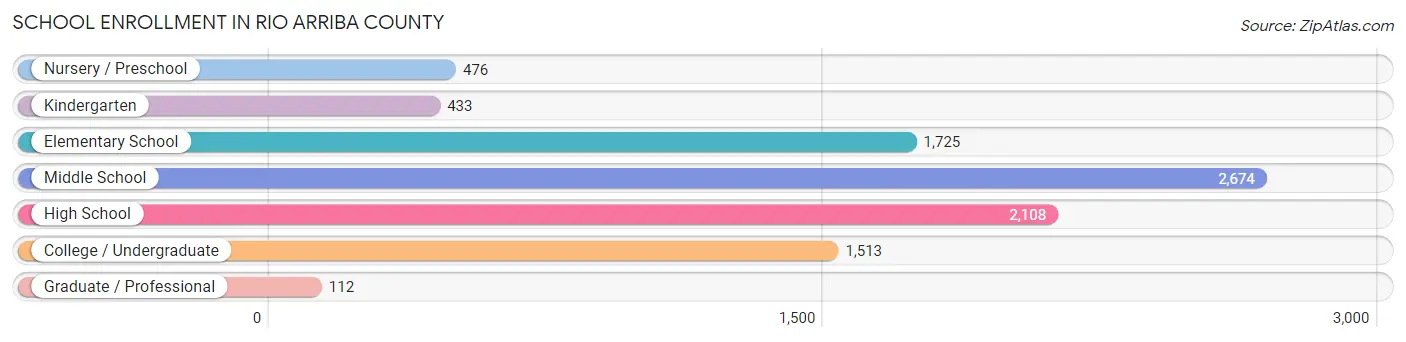
| School Level | # Students | % Students |
| Nursery / Preschool | 476 | 5.3% |
| Kindergarten | 433 | 4.8% |
| Elementary School | 1,725 | 19.1% |
| Middle School | 2,674 | 29.6% |
| High School | 2,108 | 23.3% |
| College / Undergraduate | 1,513 | 16.7% |
| Graduate / Professional | 112 | 1.2% |
| Total | 9,041 | 100.0% |
School Enrollment by Age by Funding Source in Rio Arriba County
Out of a total of 9,041 students who are enrolled in schools in Rio Arriba County, 832 (9.2%) attend a private institution, while the remaining 8,209 (90.8%) are enrolled in public schools. The age group of 35 years and over has the highest likelihood of being enrolled in private schools, with 91 (18.4% in the age bracket) enrolled. Conversely, the age group of 3 to 4 year olds has the lowest likelihood of being enrolled in a private school, with 420 (96.1% in the age bracket) attending a public institution.
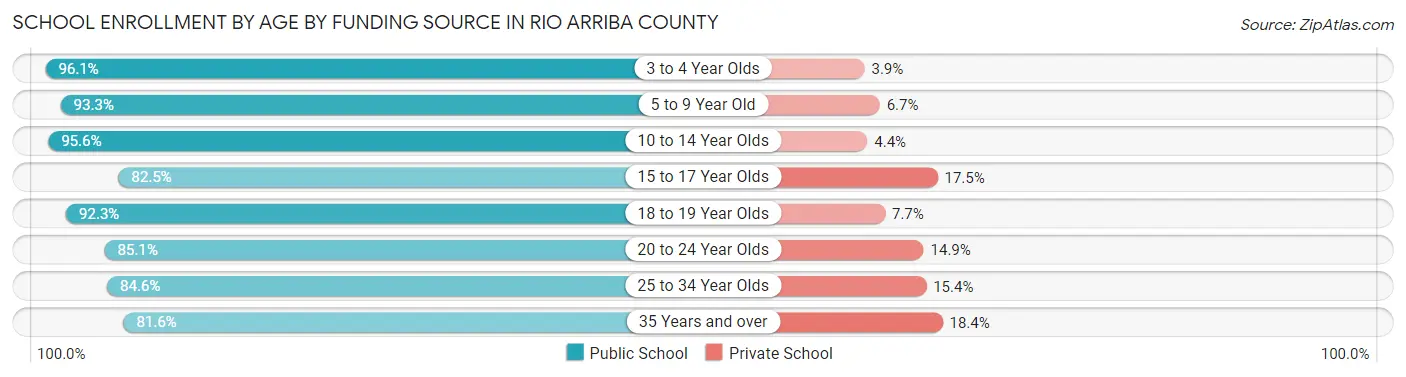
| Age Bracket | Public School | Private School |
| 3 to 4 Year Olds | 420 (96.1%) | 17 (3.9%) |
| 5 to 9 Year Old | 1,891 (93.3%) | 136 (6.7%) |
| 10 to 14 Year Olds | 2,859 (95.6%) | 132 (4.4%) |
| 15 to 17 Year Olds | 1,312 (82.5%) | 278 (17.5%) |
| 18 to 19 Year Olds | 599 (92.3%) | 50 (7.7%) |
| 20 to 24 Year Olds | 383 (85.1%) | 67 (14.9%) |
| 25 to 34 Year Olds | 341 (84.6%) | 62 (15.4%) |
| 35 Years and over | 403 (81.6%) | 91 (18.4%) |
| Total | 8,209 (90.8%) | 832 (9.2%) |
Educational Attainment by Field of Study in Rio Arriba County
Business (1,120 | 21.0%), education (939 | 17.6%), engineering (525 | 9.8%), arts & humanities (448 | 8.4%), and science & technology (344 | 6.5%) are the most common fields of study among 5,333 individuals in Rio Arriba County who have obtained a bachelor's degree or higher.
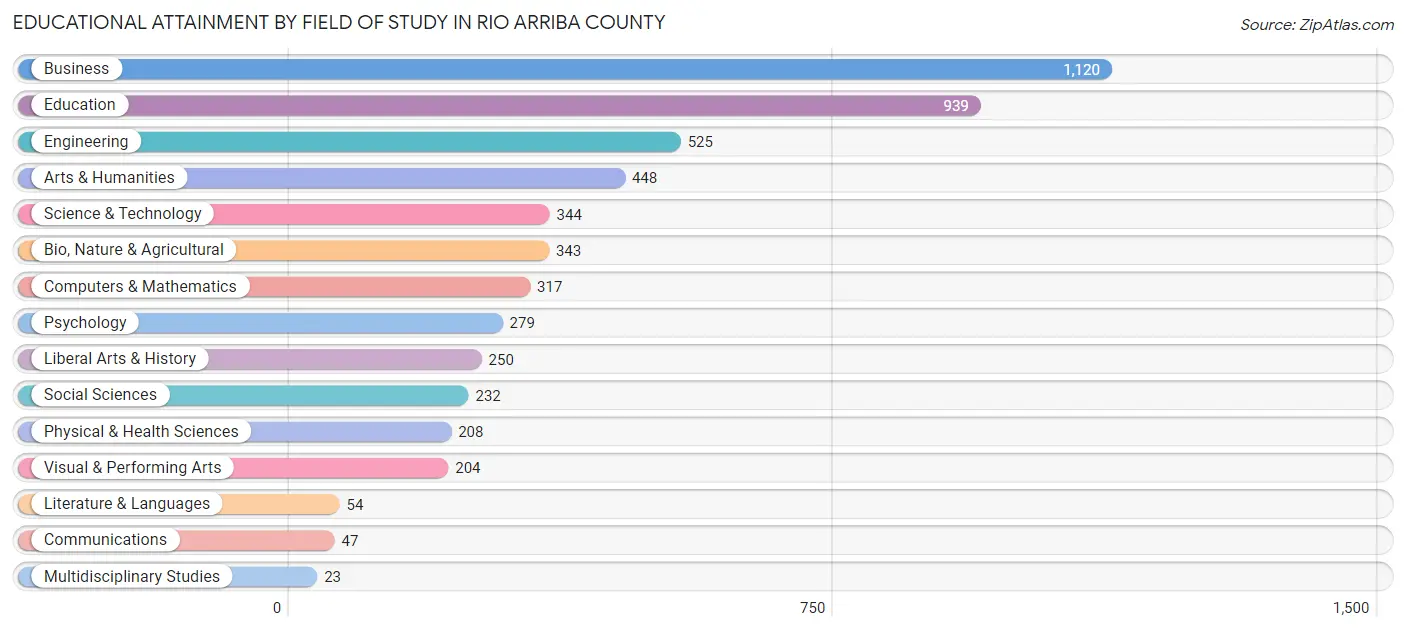
| Field of Study | # Graduates | % Graduates |
| Computers & Mathematics | 317 | 5.9% |
| Bio, Nature & Agricultural | 343 | 6.4% |
| Physical & Health Sciences | 208 | 3.9% |
| Psychology | 279 | 5.2% |
| Social Sciences | 232 | 4.3% |
| Engineering | 525 | 9.8% |
| Multidisciplinary Studies | 23 | 0.4% |
| Science & Technology | 344 | 6.5% |
| Business | 1,120 | 21.0% |
| Education | 939 | 17.6% |
| Literature & Languages | 54 | 1.0% |
| Liberal Arts & History | 250 | 4.7% |
| Visual & Performing Arts | 204 | 3.8% |
| Communications | 47 | 0.9% |
| Arts & Humanities | 448 | 8.4% |
| Total | 5,333 | 100.0% |
Transportation & Commute in Rio Arriba County
Vehicle Availability by Sex in Rio Arriba County
The most prevalent vehicle ownership categories in Rio Arriba County are males with 3 vehicles (2,349, accounting for 29.7%) and females with 3 vehicles (2,015, making up 32.5%).
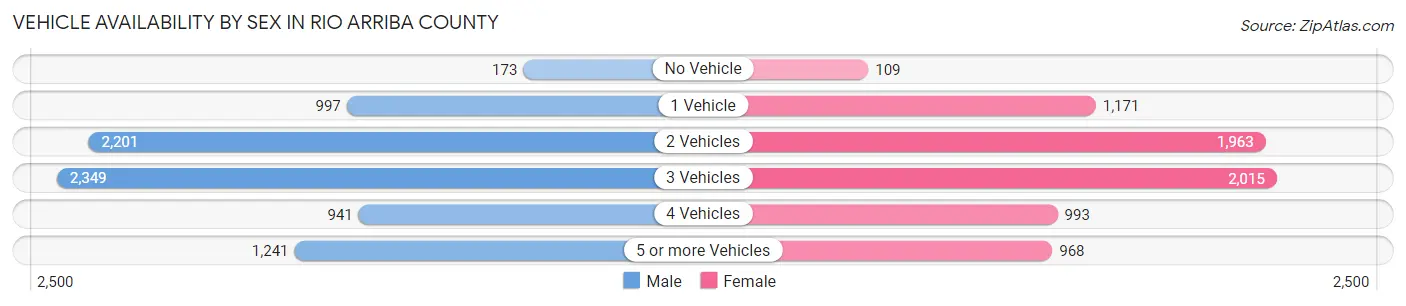
| Vehicles Available | Male | Female |
| No Vehicle | 173 (2.2%) | 109 (1.5%) |
| 1 Vehicle | 997 (12.6%) | 1,171 (16.2%) |
| 2 Vehicles | 2,201 (27.9%) | 1,963 (27.2%) |
| 3 Vehicles | 2,349 (29.7%) | 2,015 (27.9%) |
| 4 Vehicles | 941 (11.9%) | 993 (13.8%) |
| 5 or more Vehicles | 1,241 (15.7%) | 968 (13.4%) |
| Total | 7,902 (100.0%) | 7,219 (100.0%) |
Commute Time in Rio Arriba County
The most frequently occuring commute durations in Rio Arriba County are 45 to 59 minutes (2,478 commuters, 17.5%), 5 to 9 minutes (1,925 commuters, 13.6%), and 10 to 14 minutes (1,717 commuters, 12.2%).
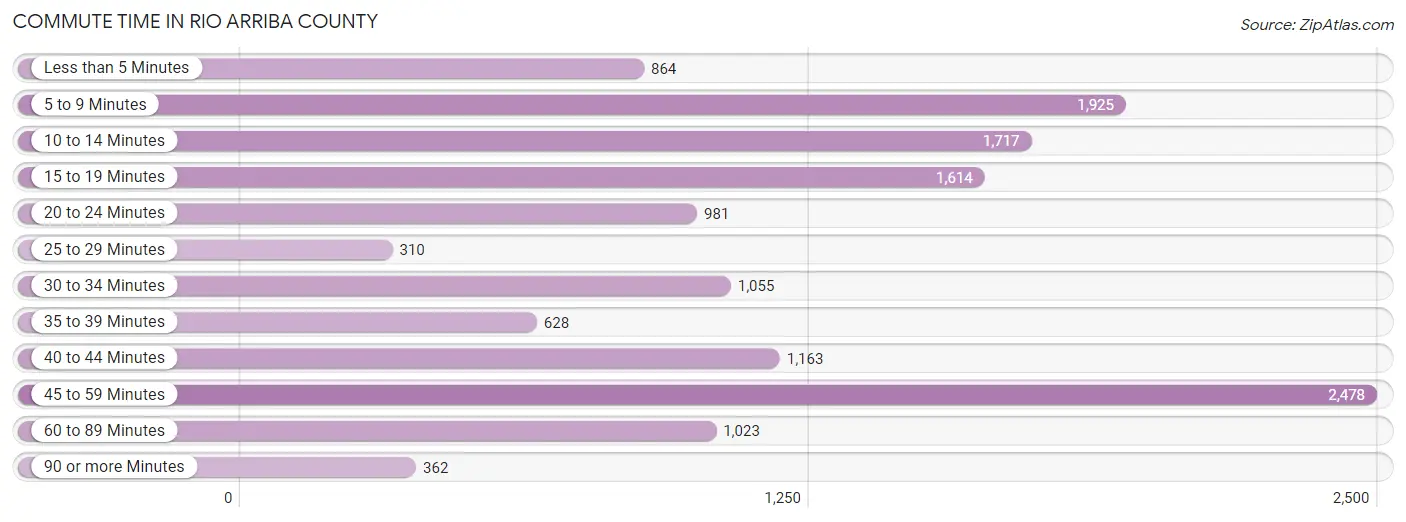
| Commute Time | # Commuters | % Commuters |
| Less than 5 Minutes | 864 | 6.1% |
| 5 to 9 Minutes | 1,925 | 13.6% |
| 10 to 14 Minutes | 1,717 | 12.2% |
| 15 to 19 Minutes | 1,614 | 11.4% |
| 20 to 24 Minutes | 981 | 7.0% |
| 25 to 29 Minutes | 310 | 2.2% |
| 30 to 34 Minutes | 1,055 | 7.5% |
| 35 to 39 Minutes | 628 | 4.4% |
| 40 to 44 Minutes | 1,163 | 8.2% |
| 45 to 59 Minutes | 2,478 | 17.5% |
| 60 to 89 Minutes | 1,023 | 7.2% |
| 90 or more Minutes | 362 | 2.6% |
Commute Time by Sex in Rio Arriba County
The most common commute times in Rio Arriba County are 45 to 59 minutes (1,423 commuters, 18.8%) for males and 45 to 59 minutes (1,055 commuters, 16.1%) for females.
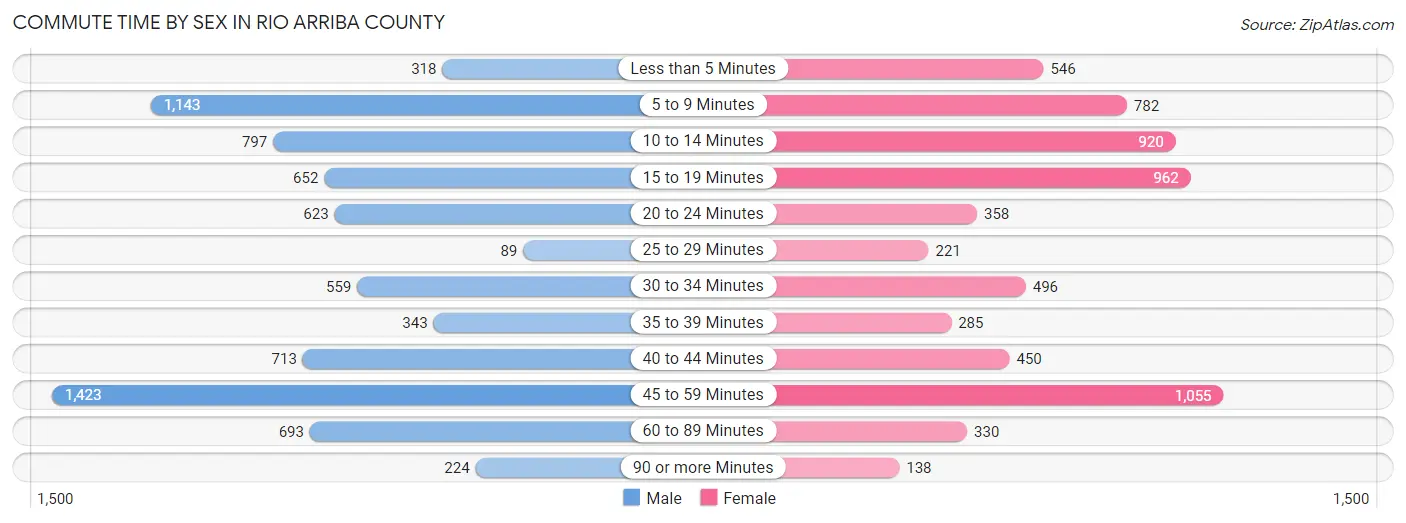
| Commute Time | Male | Female |
| Less than 5 Minutes | 318 (4.2%) | 546 (8.3%) |
| 5 to 9 Minutes | 1,143 (15.1%) | 782 (11.9%) |
| 10 to 14 Minutes | 797 (10.5%) | 920 (14.1%) |
| 15 to 19 Minutes | 652 (8.6%) | 962 (14.7%) |
| 20 to 24 Minutes | 623 (8.2%) | 358 (5.5%) |
| 25 to 29 Minutes | 89 (1.2%) | 221 (3.4%) |
| 30 to 34 Minutes | 559 (7.4%) | 496 (7.6%) |
| 35 to 39 Minutes | 343 (4.5%) | 285 (4.4%) |
| 40 to 44 Minutes | 713 (9.4%) | 450 (6.9%) |
| 45 to 59 Minutes | 1,423 (18.8%) | 1,055 (16.1%) |
| 60 to 89 Minutes | 693 (9.1%) | 330 (5.0%) |
| 90 or more Minutes | 224 (3.0%) | 138 (2.1%) |
Time of Departure to Work by Sex in Rio Arriba County
The most frequent times of departure to work in Rio Arriba County are 7:00 AM to 7:29 AM (1,625, 21.4%) for males and 7:00 AM to 7:29 AM (1,252, 19.1%) for females.
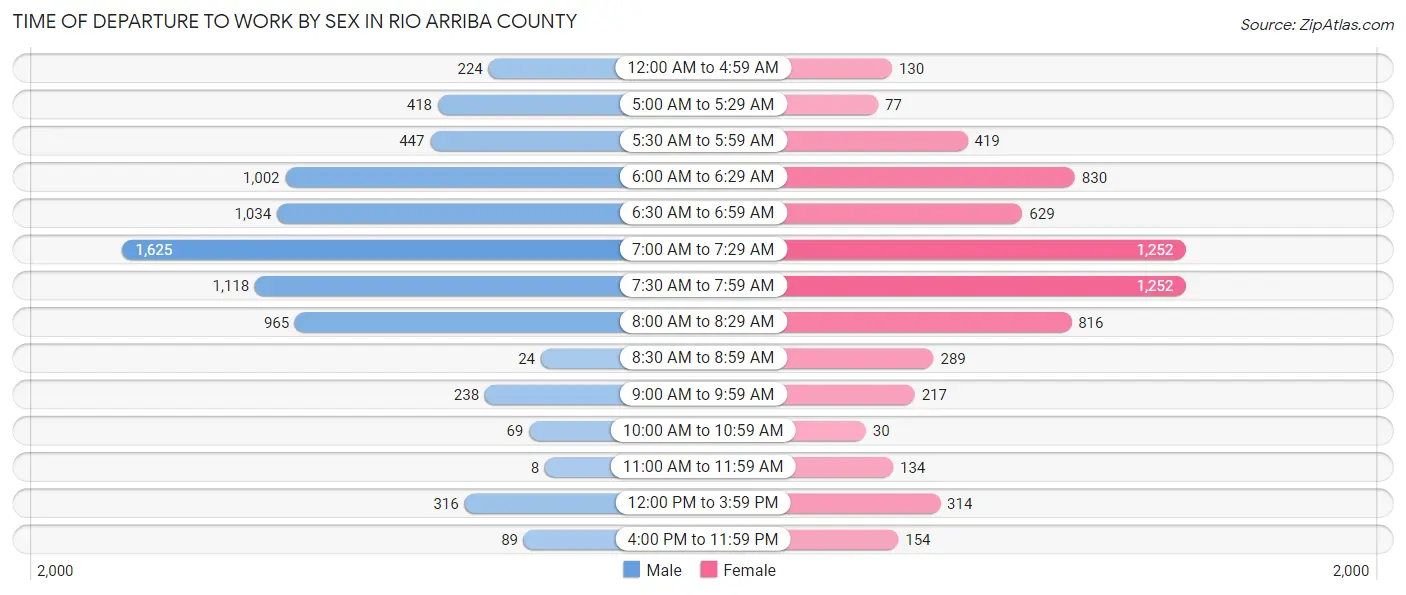
| Time of Departure | Male | Female |
| 12:00 AM to 4:59 AM | 224 (3.0%) | 130 (2.0%) |
| 5:00 AM to 5:29 AM | 418 (5.5%) | 77 (1.2%) |
| 5:30 AM to 5:59 AM | 447 (5.9%) | 419 (6.4%) |
| 6:00 AM to 6:29 AM | 1,002 (13.2%) | 830 (12.7%) |
| 6:30 AM to 6:59 AM | 1,034 (13.7%) | 629 (9.6%) |
| 7:00 AM to 7:29 AM | 1,625 (21.4%) | 1,252 (19.1%) |
| 7:30 AM to 7:59 AM | 1,118 (14.8%) | 1,252 (19.1%) |
| 8:00 AM to 8:29 AM | 965 (12.7%) | 816 (12.5%) |
| 8:30 AM to 8:59 AM | 24 (0.3%) | 289 (4.4%) |
| 9:00 AM to 9:59 AM | 238 (3.1%) | 217 (3.3%) |
| 10:00 AM to 10:59 AM | 69 (0.9%) | 30 (0.5%) |
| 11:00 AM to 11:59 AM | 8 (0.1%) | 134 (2.1%) |
| 12:00 PM to 3:59 PM | 316 (4.2%) | 314 (4.8%) |
| 4:00 PM to 11:59 PM | 89 (1.2%) | 154 (2.4%) |
| Total | 7,577 (100.0%) | 6,543 (100.0%) |
Housing Occupancy in Rio Arriba County
Occupancy by Ownership in Rio Arriba County
Of the total 14,076 dwellings in Rio Arriba County, owner-occupied units account for 11,102 (78.9%), while renter-occupied units make up 2,974 (21.1%).
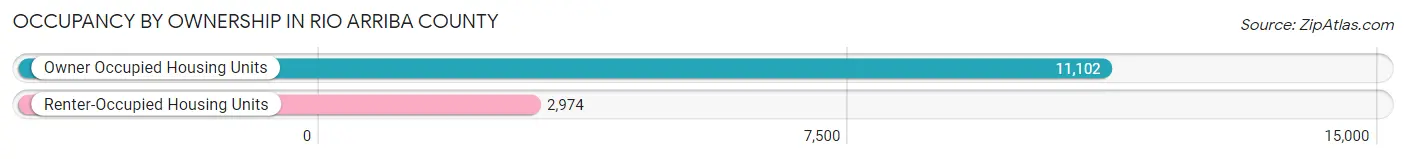
| Occupancy | # Housing Units | % Housing Units |
| Owner Occupied Housing Units | 11,102 | 78.9% |
| Renter-Occupied Housing Units | 2,974 | 21.1% |
| Total Occupied Housing Units | 14,076 | 100.0% |
Occupancy by Household Size in Rio Arriba County
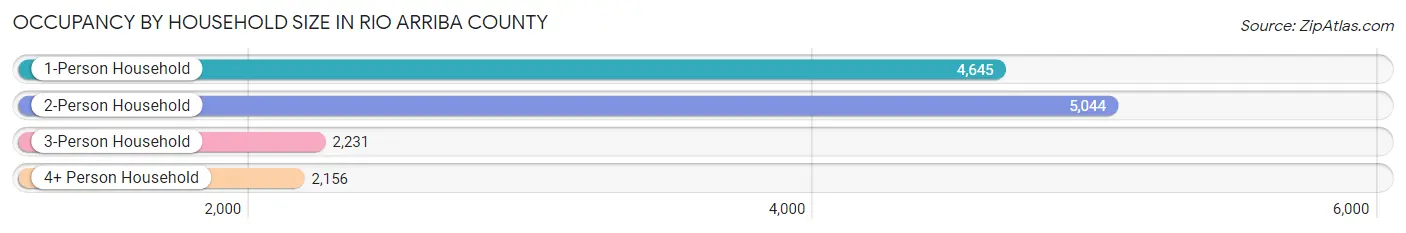
| Household Size | # Housing Units | % Housing Units |
| 1-Person Household | 4,645 | 33.0% |
| 2-Person Household | 5,044 | 35.8% |
| 3-Person Household | 2,231 | 15.9% |
| 4+ Person Household | 2,156 | 15.3% |
| Total Housing Units | 14,076 | 100.0% |
Occupancy by Ownership by Household Size in Rio Arriba County
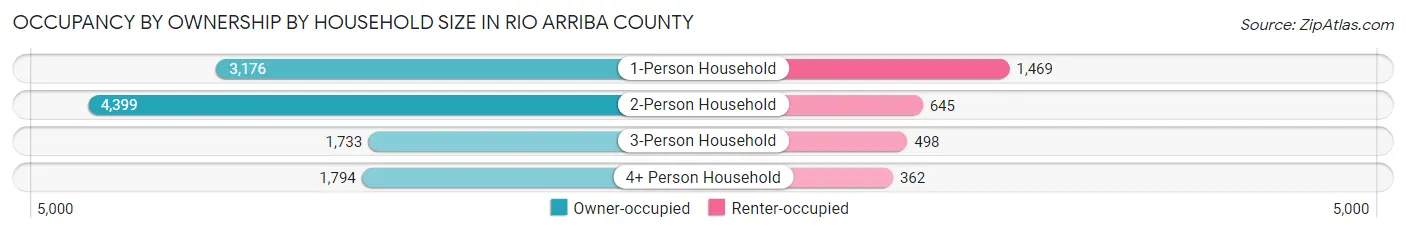
| Household Size | Owner-occupied | Renter-occupied |
| 1-Person Household | 3,176 (68.4%) | 1,469 (31.6%) |
| 2-Person Household | 4,399 (87.2%) | 645 (12.8%) |
| 3-Person Household | 1,733 (77.7%) | 498 (22.3%) |
| 4+ Person Household | 1,794 (83.2%) | 362 (16.8%) |
| Total Housing Units | 11,102 (78.9%) | 2,974 (21.1%) |
Occupancy by Educational Attainment in Rio Arriba County
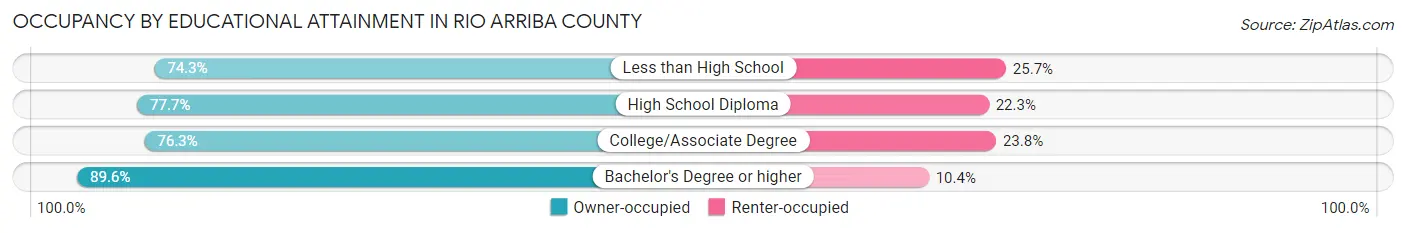
| Household Size | Owner-occupied | Renter-occupied |
| Less than High School | 1,785 (74.3%) | 618 (25.7%) |
| High School Diploma | 3,220 (77.7%) | 925 (22.3%) |
| College/Associate Degree | 3,698 (76.2%) | 1,152 (23.7%) |
| Bachelor's Degree or higher | 2,399 (89.6%) | 279 (10.4%) |
Occupancy by Age of Householder in Rio Arriba County

| Age Bracket | # Households | % Households |
| Under 35 Years | 1,381 | 9.8% |
| 35 to 44 Years | 2,106 | 15.0% |
| 45 to 54 Years | 2,638 | 18.7% |
| 55 to 64 Years | 3,135 | 22.3% |
| 65 to 74 Years | 3,033 | 21.5% |
| 75 to 84 Years | 1,438 | 10.2% |
| 85 Years and Over | 345 | 2.5% |
| Total | 14,076 | 100.0% |
Housing Finances in Rio Arriba County
Median Income by Occupancy in Rio Arriba County
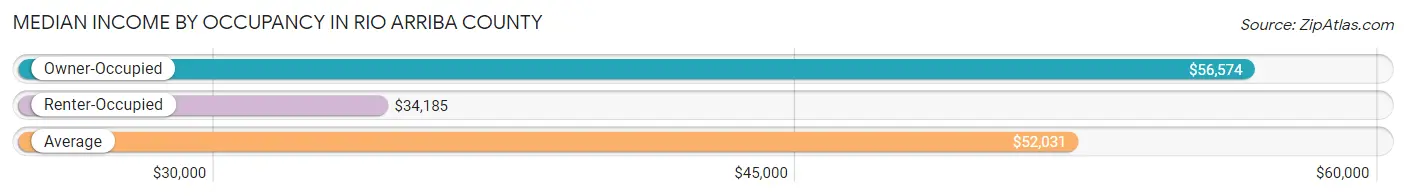
| Occupancy Type | # Households | Median Income |
| Owner-Occupied | 11,102 (78.9%) | $56,574 |
| Renter-Occupied | 2,974 (21.1%) | $34,185 |
| Average | 14,076 (100.0%) | $52,031 |
Occupancy by Householder Income Bracket in Rio Arriba County
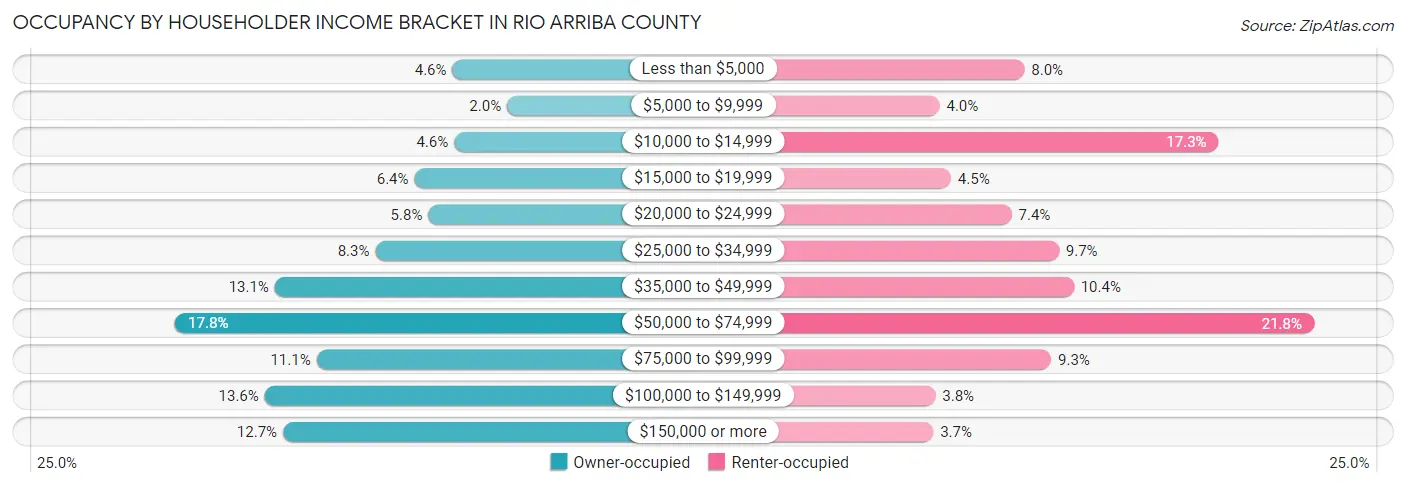
| Income Bracket | Owner-occupied | Renter-occupied |
| Less than $5,000 | 514 (4.6%) | 239 (8.0%) |
| $5,000 to $9,999 | 225 (2.0%) | 119 (4.0%) |
| $10,000 to $14,999 | 505 (4.5%) | 514 (17.3%) |
| $15,000 to $19,999 | 715 (6.4%) | 135 (4.5%) |
| $20,000 to $24,999 | 642 (5.8%) | 221 (7.4%) |
| $25,000 to $34,999 | 921 (8.3%) | 288 (9.7%) |
| $35,000 to $49,999 | 1,453 (13.1%) | 309 (10.4%) |
| $50,000 to $74,999 | 1,979 (17.8%) | 649 (21.8%) |
| $75,000 to $99,999 | 1,232 (11.1%) | 277 (9.3%) |
| $100,000 to $149,999 | 1,506 (13.6%) | 113 (3.8%) |
| $150,000 or more | 1,410 (12.7%) | 110 (3.7%) |
| Total | 11,102 (100.0%) | 2,974 (100.0%) |
Monthly Housing Cost Tiers in Rio Arriba County
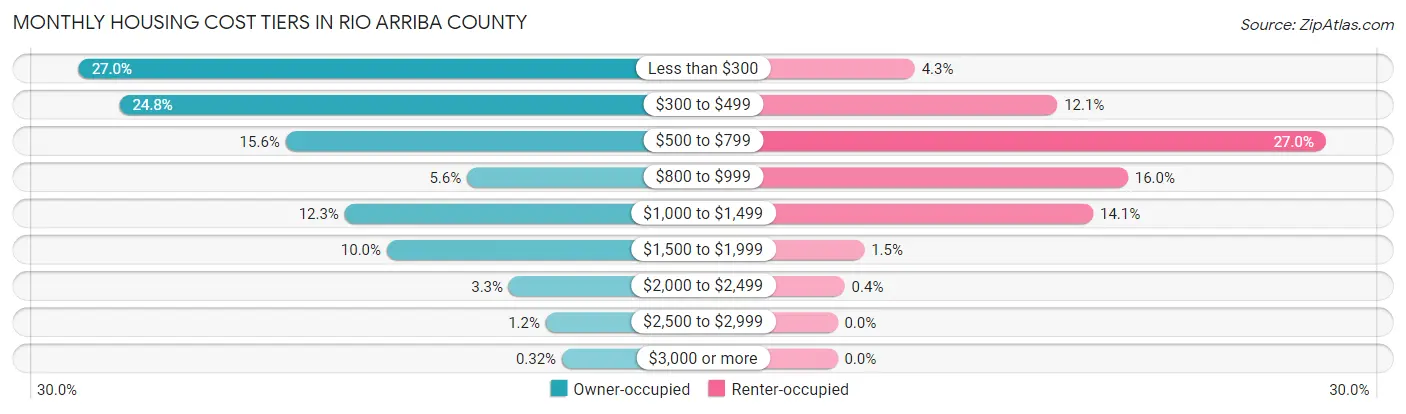
| Monthly Cost | Owner-occupied | Renter-occupied |
| Less than $300 | 2,999 (27.0%) | 127 (4.3%) |
| $300 to $499 | 2,749 (24.8%) | 361 (12.1%) |
| $500 to $799 | 1,730 (15.6%) | 802 (27.0%) |
| $800 to $999 | 617 (5.6%) | 477 (16.0%) |
| $1,000 to $1,499 | 1,368 (12.3%) | 420 (14.1%) |
| $1,500 to $1,999 | 1,109 (10.0%) | 44 (1.5%) |
| $2,000 to $2,499 | 361 (3.3%) | 12 (0.4%) |
| $2,500 to $2,999 | 134 (1.2%) | 0 (0.0%) |
| $3,000 or more | 35 (0.3%) | 0 (0.0%) |
| Total | 11,102 (100.0%) | 2,974 (100.0%) |
Physical Housing Characteristics in Rio Arriba County
Housing Structures in Rio Arriba County
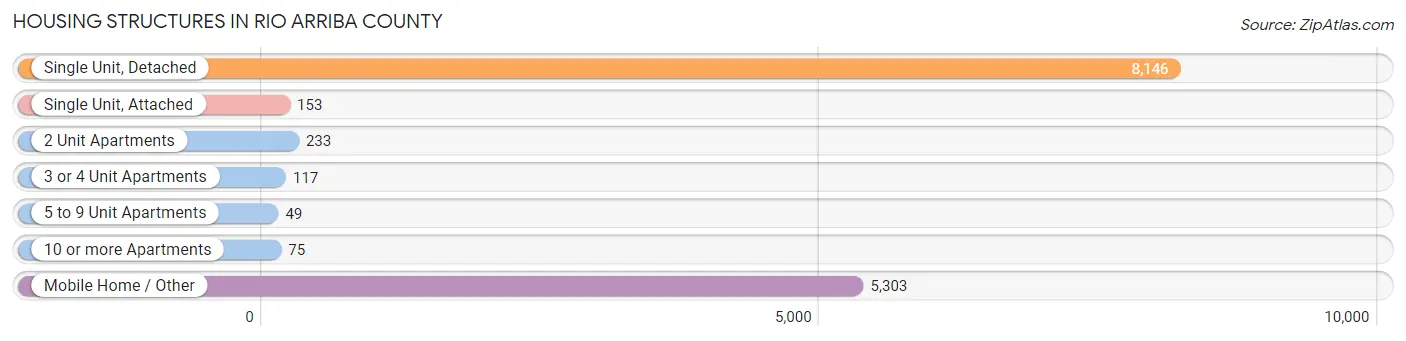
| Structure Type | # Housing Units | % Housing Units |
| Single Unit, Detached | 8,146 | 57.9% |
| Single Unit, Attached | 153 | 1.1% |
| 2 Unit Apartments | 233 | 1.7% |
| 3 or 4 Unit Apartments | 117 | 0.8% |
| 5 to 9 Unit Apartments | 49 | 0.4% |
| 10 or more Apartments | 75 | 0.5% |
| Mobile Home / Other | 5,303 | 37.7% |
| Total | 14,076 | 100.0% |
Housing Structures by Occupancy in Rio Arriba County
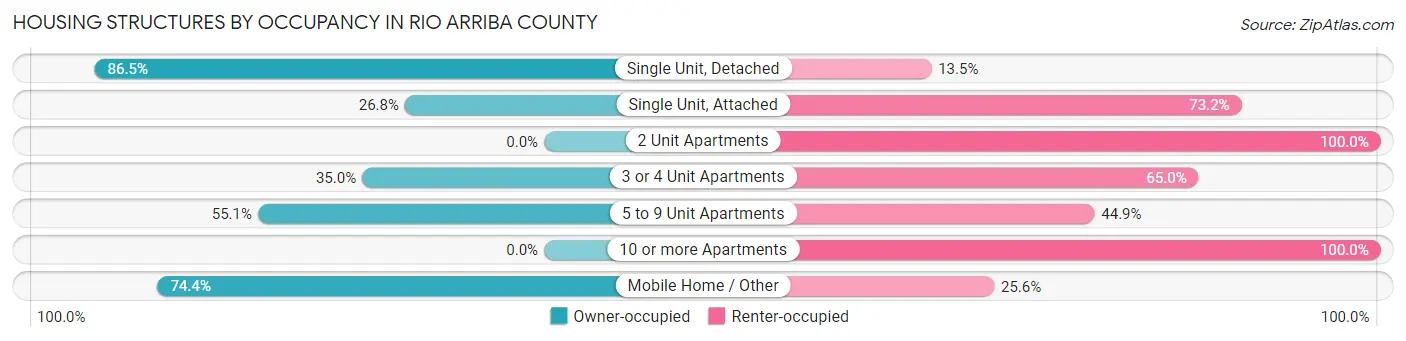
| Structure Type | Owner-occupied | Renter-occupied |
| Single Unit, Detached | 7,047 (86.5%) | 1,099 (13.5%) |
| Single Unit, Attached | 41 (26.8%) | 112 (73.2%) |
| 2 Unit Apartments | 0 (0.0%) | 233 (100.0%) |
| 3 or 4 Unit Apartments | 41 (35.0%) | 76 (65.0%) |
| 5 to 9 Unit Apartments | 27 (55.1%) | 22 (44.9%) |
| 10 or more Apartments | 0 (0.0%) | 75 (100.0%) |
| Mobile Home / Other | 3,946 (74.4%) | 1,357 (25.6%) |
| Total | 11,102 (78.9%) | 2,974 (21.1%) |
Housing Structures by Number of Rooms in Rio Arriba County
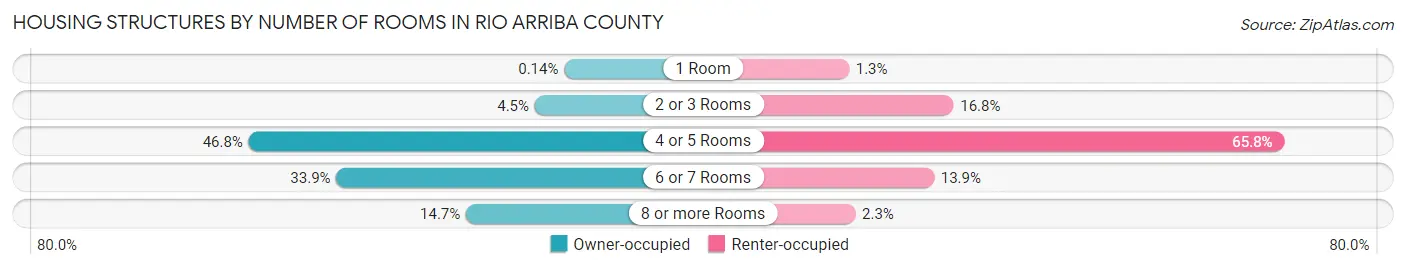
| Number of Rooms | Owner-occupied | Renter-occupied |
| 1 Room | 16 (0.1%) | 39 (1.3%) |
| 2 or 3 Rooms | 498 (4.5%) | 499 (16.8%) |
| 4 or 5 Rooms | 5,200 (46.8%) | 1,956 (65.8%) |
| 6 or 7 Rooms | 3,759 (33.9%) | 413 (13.9%) |
| 8 or more Rooms | 1,629 (14.7%) | 67 (2.2%) |
| Total | 11,102 (100.0%) | 2,974 (100.0%) |
Housing Structure by Heating Type in Rio Arriba County
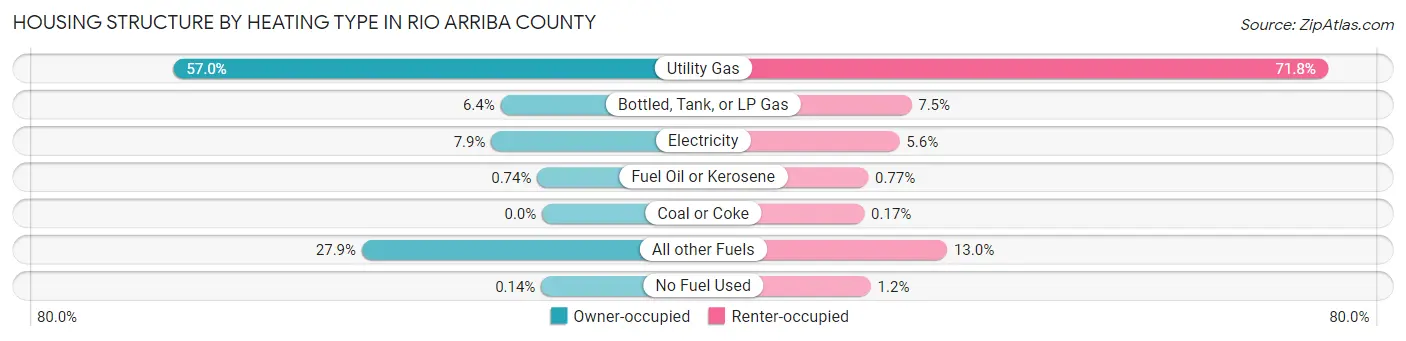
| Heating Type | Owner-occupied | Renter-occupied |
| Utility Gas | 6,327 (57.0%) | 2,136 (71.8%) |
| Bottled, Tank, or LP Gas | 713 (6.4%) | 222 (7.5%) |
| Electricity | 872 (7.9%) | 167 (5.6%) |
| Fuel Oil or Kerosene | 82 (0.7%) | 23 (0.8%) |
| Coal or Coke | 0 (0.0%) | 5 (0.2%) |
| All other Fuels | 3,093 (27.9%) | 386 (13.0%) |
| No Fuel Used | 15 (0.1%) | 35 (1.2%) |
| Total | 11,102 (100.0%) | 2,974 (100.0%) |
Household Vehicle Usage in Rio Arriba County
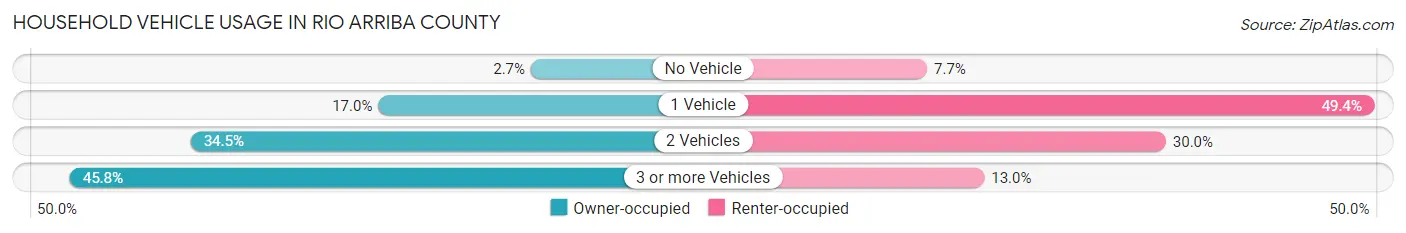
| Vehicles per Household | Owner-occupied | Renter-occupied |
| No Vehicle | 304 (2.7%) | 228 (7.7%) |
| 1 Vehicle | 1,886 (17.0%) | 1,468 (49.4%) |
| 2 Vehicles | 3,829 (34.5%) | 891 (30.0%) |
| 3 or more Vehicles | 5,083 (45.8%) | 387 (13.0%) |
| Total | 11,102 (100.0%) | 2,974 (100.0%) |
Real Estate & Mortgages in Rio Arriba County
Real Estate and Mortgage Overview in Rio Arriba County
| Characteristic | Without Mortgage | With Mortgage |
| Housing Units | 7,405 | 3,697 |
| Median Property Value | $192,100 | $235,500 |
| Median Household Income | $46,790 | $915 |
| Monthly Housing Costs | $334 | $35 |
| Real Estate Taxes | $799 | $379 |
Property Value by Mortgage Status in Rio Arriba County
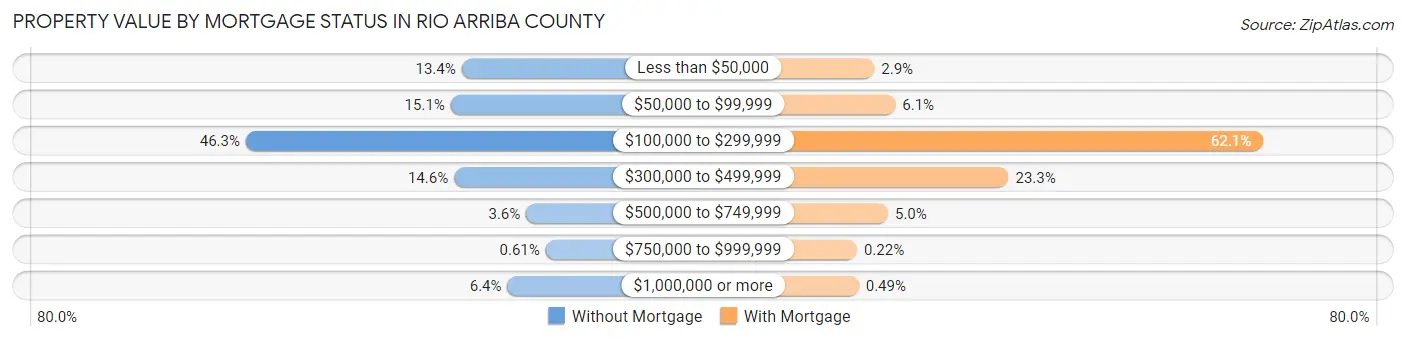
| Property Value | Without Mortgage | With Mortgage |
| Less than $50,000 | 994 (13.4%) | 106 (2.9%) |
| $50,000 to $99,999 | 1,117 (15.1%) | 224 (6.1%) |
| $100,000 to $299,999 | 3,428 (46.3%) | 2,296 (62.1%) |
| $300,000 to $499,999 | 1,079 (14.6%) | 862 (23.3%) |
| $500,000 to $749,999 | 265 (3.6%) | 183 (5.0%) |
| $750,000 to $999,999 | 45 (0.6%) | 8 (0.2%) |
| $1,000,000 or more | 477 (6.4%) | 18 (0.5%) |
| Total | 7,405 (100.0%) | 3,697 (100.0%) |
Household Income by Mortgage Status in Rio Arriba County
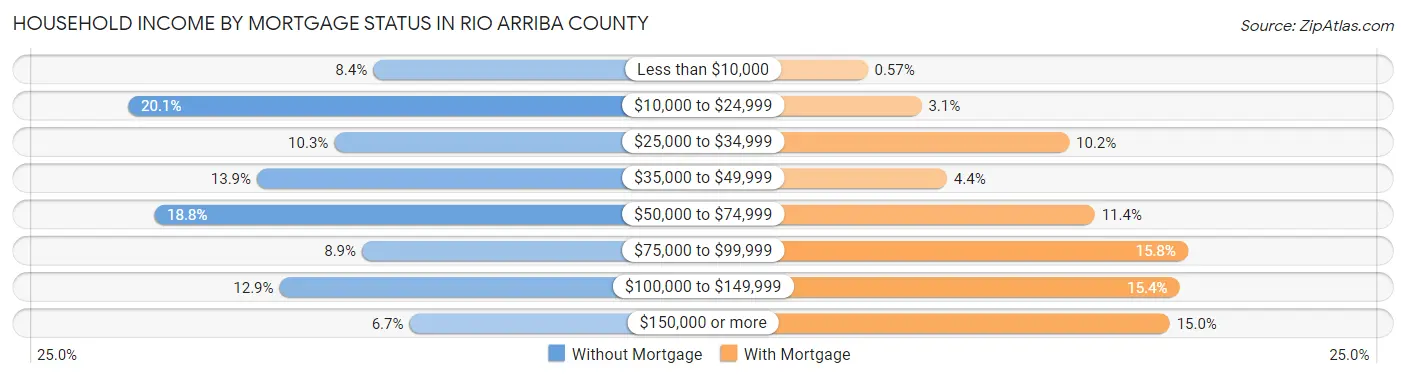
| Household Income | Without Mortgage | With Mortgage |
| Less than $10,000 | 623 (8.4%) | 21 (0.6%) |
| $10,000 to $24,999 | 1,486 (20.1%) | 116 (3.1%) |
| $25,000 to $34,999 | 760 (10.3%) | 376 (10.2%) |
| $35,000 to $49,999 | 1,032 (13.9%) | 161 (4.3%) |
| $50,000 to $74,999 | 1,394 (18.8%) | 421 (11.4%) |
| $75,000 to $99,999 | 662 (8.9%) | 585 (15.8%) |
| $100,000 to $149,999 | 953 (12.9%) | 570 (15.4%) |
| $150,000 or more | 495 (6.7%) | 553 (15.0%) |
| Total | 7,405 (100.0%) | 3,697 (100.0%) |
Property Value to Household Income Ratio in Rio Arriba County
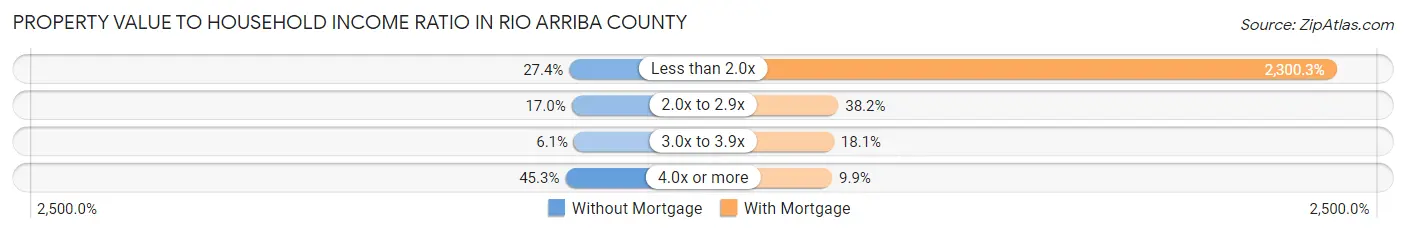
| Value-to-Income Ratio | Without Mortgage | With Mortgage |
| Less than 2.0x | 2,026 (27.4%) | 85,041 (2,300.3%) |
| 2.0x to 2.9x | 1,257 (17.0%) | 1,412 (38.2%) |
| 3.0x to 3.9x | 448 (6.0%) | 670 (18.1%) |
| 4.0x or more | 3,354 (45.3%) | 367 (9.9%) |
| Total | 7,405 (100.0%) | 3,697 (100.0%) |
Real Estate Taxes by Mortgage Status in Rio Arriba County
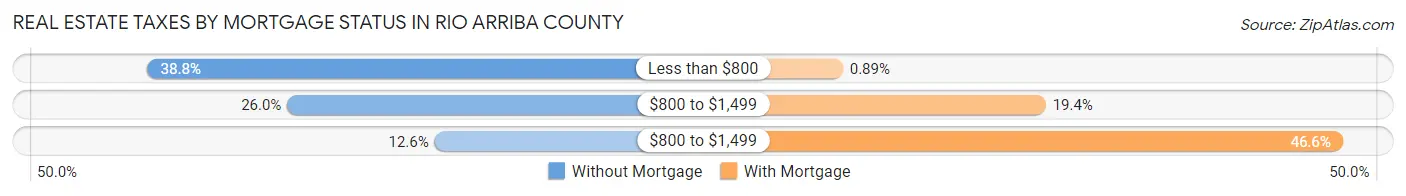
| Property Taxes | Without Mortgage | With Mortgage |
| Less than $800 | 2,870 (38.8%) | 33 (0.9%) |
| $800 to $1,499 | 1,927 (26.0%) | 718 (19.4%) |
| $800 to $1,499 | 930 (12.6%) | 1,721 (46.6%) |
| Total | 7,405 (100.0%) | 3,697 (100.0%) |
Health & Disability in Rio Arriba County
Health Insurance Coverage by Age in Rio Arriba County
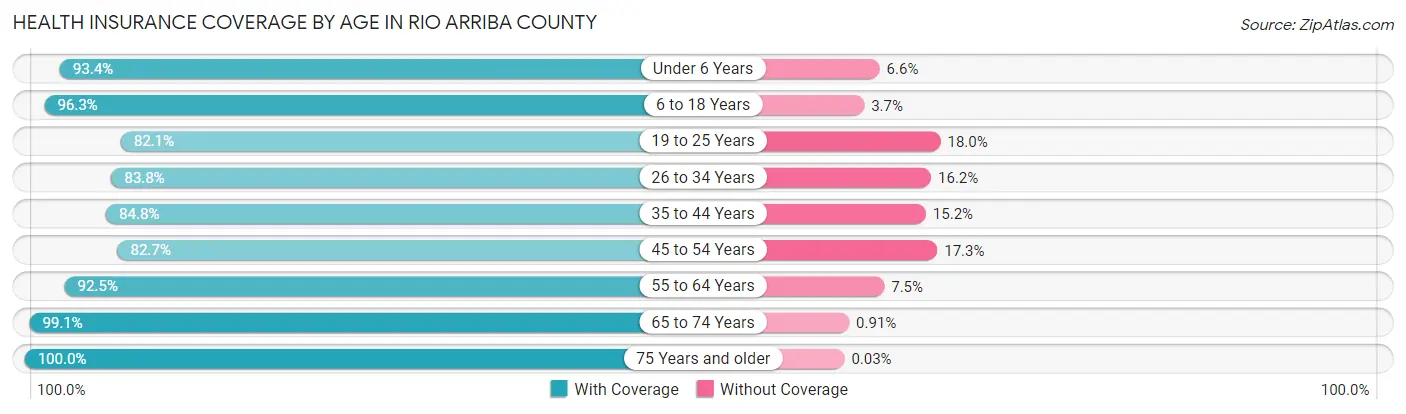
| Age Bracket | With Coverage | Without Coverage |
| Under 6 Years | 2,508 (93.4%) | 177 (6.6%) |
| 6 to 18 Years | 6,834 (96.3%) | 263 (3.7%) |
| 19 to 25 Years | 2,633 (82.1%) | 576 (17.9%) |
| 26 to 34 Years | 3,338 (83.8%) | 645 (16.2%) |
| 35 to 44 Years | 3,826 (84.8%) | 687 (15.2%) |
| 45 to 54 Years | 3,956 (82.7%) | 830 (17.3%) |
| 55 to 64 Years | 5,359 (92.5%) | 432 (7.5%) |
| 65 to 74 Years | 4,806 (99.1%) | 44 (0.9%) |
| 75 Years and older | 3,264 (100.0%) | 1 (0.0%) |
| Total | 36,524 (90.9%) | 3,655 (9.1%) |
Health Insurance Coverage by Citizenship Status in Rio Arriba County
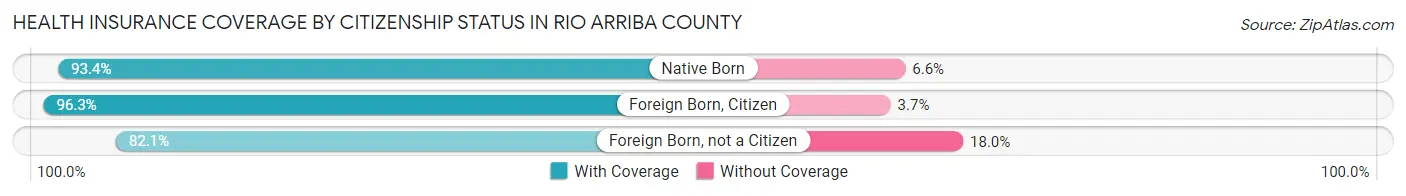
| Citizenship Status | With Coverage | Without Coverage |
| Native Born | 2,508 (93.4%) | 177 (6.6%) |
| Foreign Born, Citizen | 6,834 (96.3%) | 263 (3.7%) |
| Foreign Born, not a Citizen | 2,633 (82.1%) | 576 (17.9%) |
Health Insurance Coverage by Household Income in Rio Arriba County
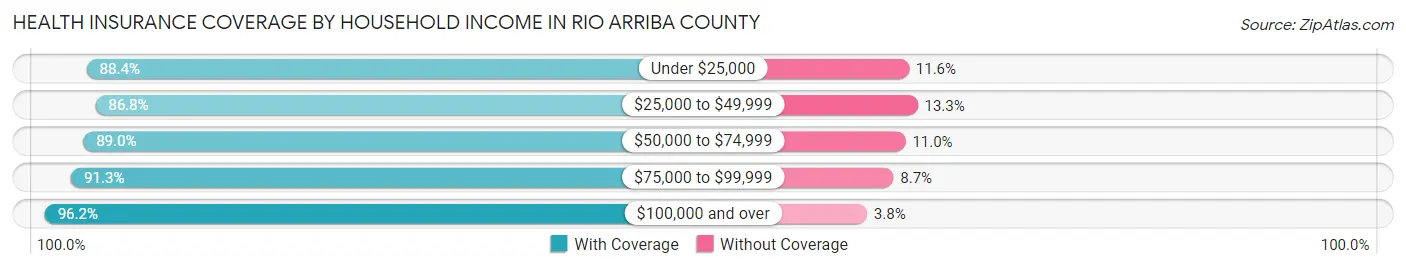
| Household Income | With Coverage | Without Coverage |
| Under $25,000 | 7,360 (88.4%) | 969 (11.6%) |
| $25,000 to $49,999 | 6,530 (86.8%) | 997 (13.3%) |
| $50,000 to $74,999 | 6,733 (89.0%) | 831 (11.0%) |
| $75,000 to $99,999 | 4,489 (91.3%) | 429 (8.7%) |
| $100,000 and over | 10,938 (96.2%) | 429 (3.8%) |
Public vs Private Health Insurance Coverage by Age in Rio Arriba County
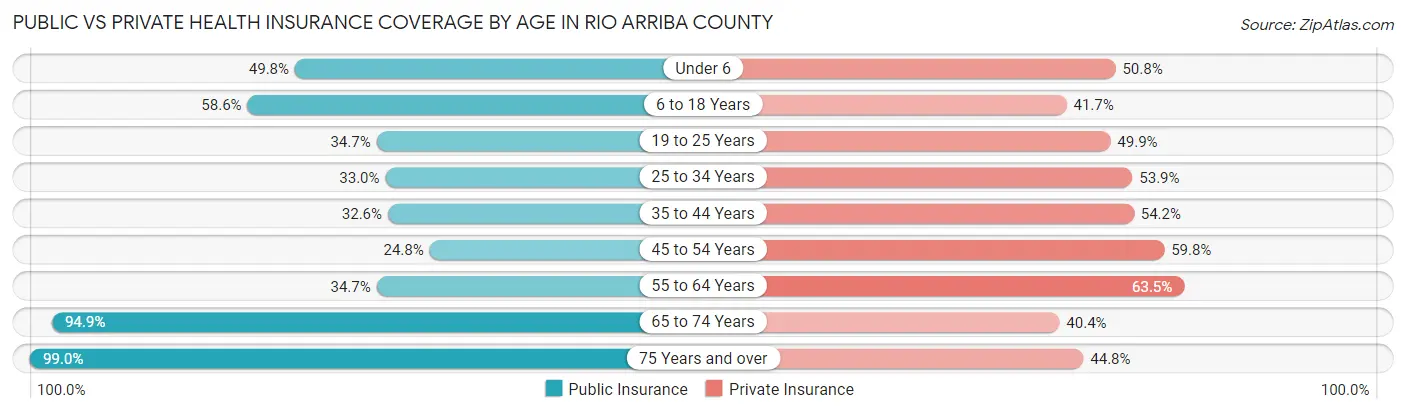
| Age Bracket | Public Insurance | Private Insurance |
| Under 6 | 1,338 (49.8%) | 1,364 (50.8%) |
| 6 to 18 Years | 4,162 (58.6%) | 2,960 (41.7%) |
| 19 to 25 Years | 1,113 (34.7%) | 1,600 (49.9%) |
| 25 to 34 Years | 1,316 (33.0%) | 2,148 (53.9%) |
| 35 to 44 Years | 1,470 (32.6%) | 2,446 (54.2%) |
| 45 to 54 Years | 1,189 (24.8%) | 2,864 (59.8%) |
| 55 to 64 Years | 2,008 (34.7%) | 3,679 (63.5%) |
| 65 to 74 Years | 4,603 (94.9%) | 1,959 (40.4%) |
| 75 Years and over | 3,232 (99.0%) | 1,464 (44.8%) |
| Total | 20,431 (50.8%) | 20,484 (51.0%) |
Disability Status by Sex by Age in Rio Arriba County
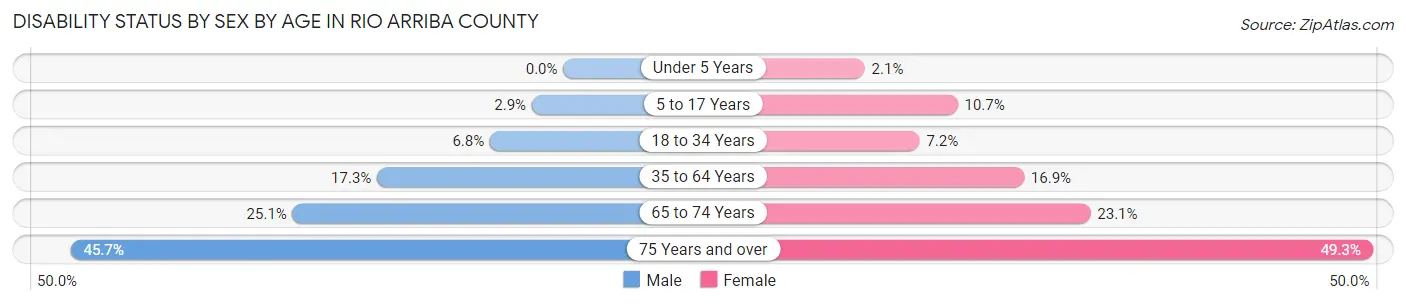
| Age Bracket | Male | Female |
| Under 5 Years | 0 (0.0%) | 22 (2.1%) |
| 5 to 17 Years | 102 (2.9%) | 384 (10.7%) |
| 18 to 34 Years | 266 (6.8%) | 277 (7.2%) |
| 35 to 64 Years | 1,298 (17.3%) | 1,281 (16.9%) |
| 65 to 74 Years | 590 (25.1%) | 577 (23.1%) |
| 75 Years and over | 642 (45.7%) | 917 (49.3%) |
Disability Class by Sex by Age in Rio Arriba County
Disability Class: Hearing Difficulty
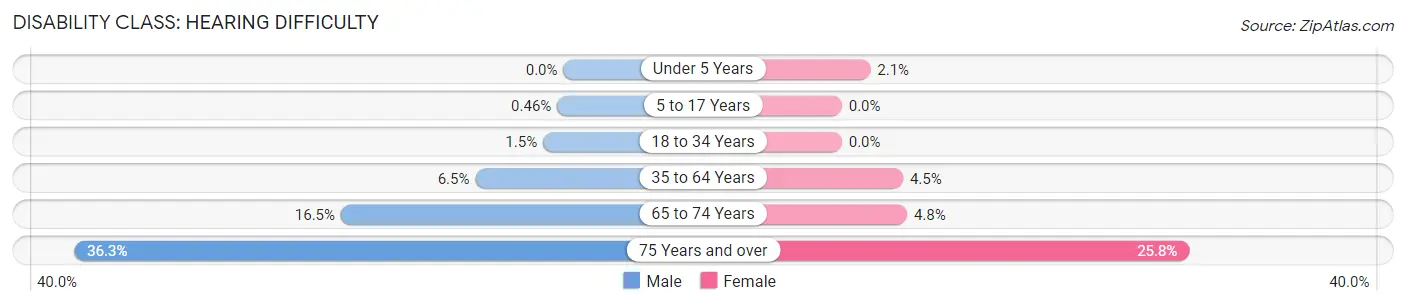
| Age Bracket | Male | Female |
| Under 5 Years | 0 (0.0%) | 22 (2.1%) |
| 5 to 17 Years | 16 (0.5%) | 0 (0.0%) |
| 18 to 34 Years | 59 (1.5%) | 0 (0.0%) |
| 35 to 64 Years | 491 (6.5%) | 344 (4.5%) |
| 65 to 74 Years | 388 (16.5%) | 121 (4.8%) |
| 75 Years and over | 510 (36.3%) | 480 (25.8%) |
Disability Class: Vision Difficulty
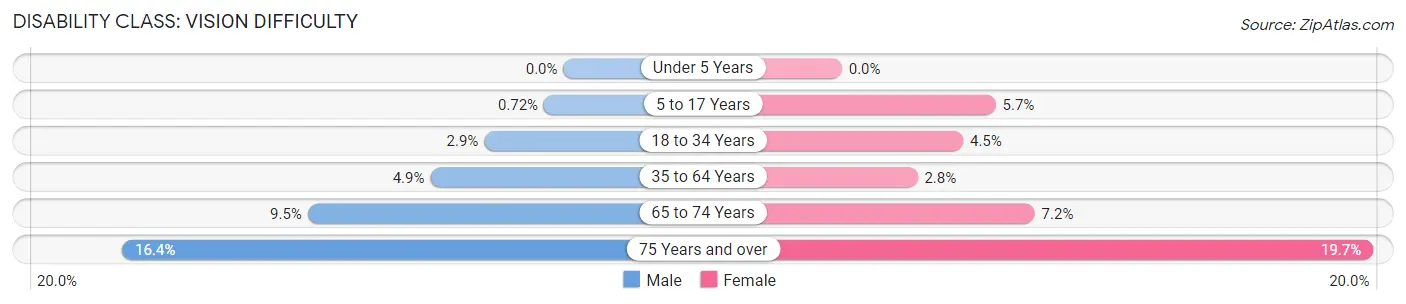
| Age Bracket | Male | Female |
| Under 5 Years | 0 (0.0%) | 0 (0.0%) |
| 5 to 17 Years | 25 (0.7%) | 204 (5.7%) |
| 18 to 34 Years | 115 (2.9%) | 173 (4.5%) |
| 35 to 64 Years | 371 (4.9%) | 213 (2.8%) |
| 65 to 74 Years | 223 (9.5%) | 179 (7.2%) |
| 75 Years and over | 230 (16.4%) | 367 (19.7%) |
Disability Class: Cognitive Difficulty
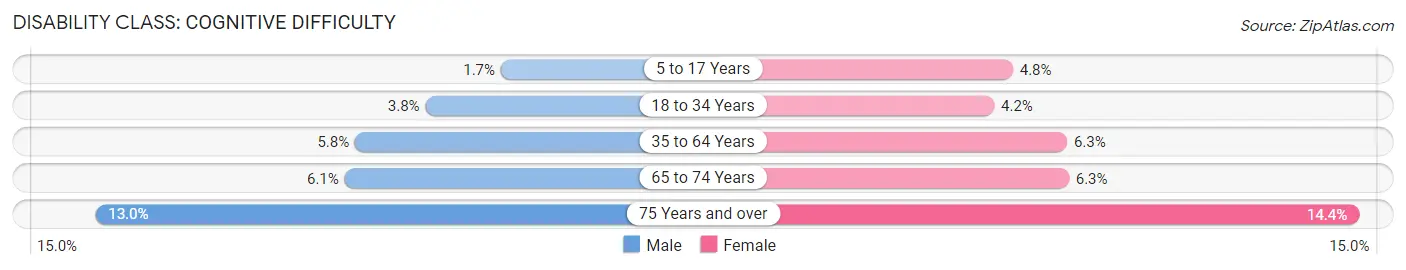
| Age Bracket | Male | Female |
| 5 to 17 Years | 61 (1.7%) | 170 (4.8%) |
| 18 to 34 Years | 150 (3.8%) | 163 (4.2%) |
| 35 to 64 Years | 436 (5.8%) | 475 (6.3%) |
| 65 to 74 Years | 143 (6.1%) | 158 (6.3%) |
| 75 Years and over | 183 (13.0%) | 268 (14.4%) |
Disability Class: Ambulatory Difficulty
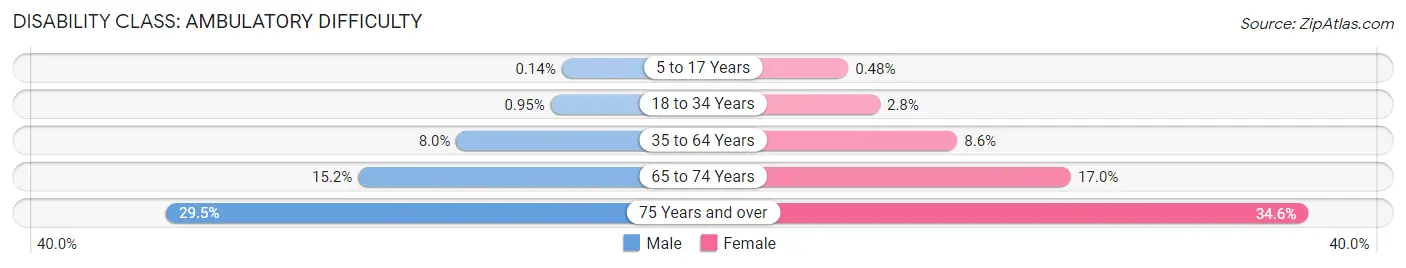
| Age Bracket | Male | Female |
| 5 to 17 Years | 5 (0.1%) | 17 (0.5%) |
| 18 to 34 Years | 37 (0.9%) | 109 (2.8%) |
| 35 to 64 Years | 597 (8.0%) | 650 (8.6%) |
| 65 to 74 Years | 358 (15.2%) | 426 (17.0%) |
| 75 Years and over | 414 (29.5%) | 644 (34.6%) |
Disability Class: Self-Care Difficulty
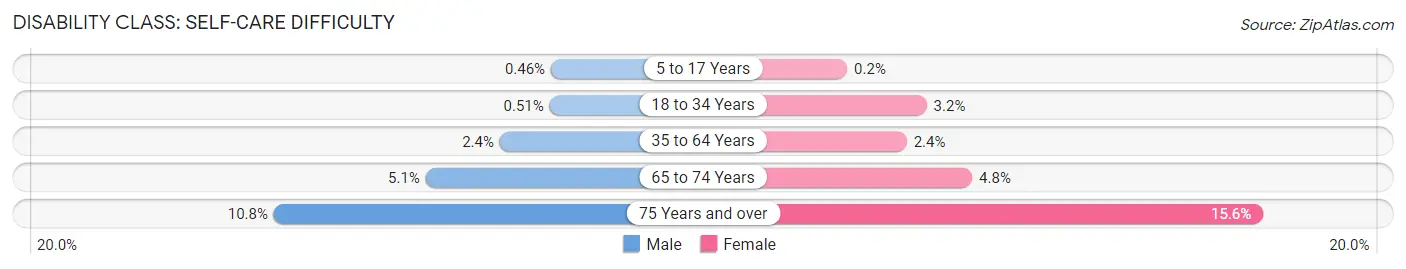
| Age Bracket | Male | Female |
| 5 to 17 Years | 16 (0.5%) | 7 (0.2%) |
| 18 to 34 Years | 20 (0.5%) | 121 (3.2%) |
| 35 to 64 Years | 177 (2.4%) | 183 (2.4%) |
| 65 to 74 Years | 120 (5.1%) | 121 (4.8%) |
| 75 Years and over | 151 (10.7%) | 291 (15.6%) |
Technology Access in Rio Arriba County
Computing Device Access in Rio Arriba County
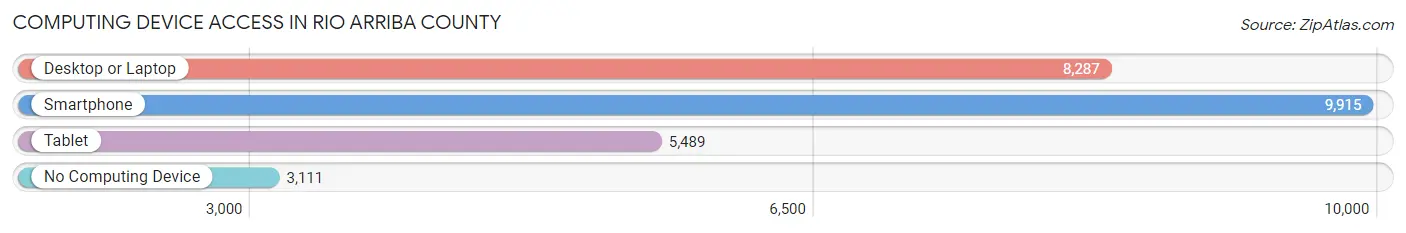
| Device Type | # Households | % Households |
| Desktop or Laptop | 8,287 | 58.9% |
| Smartphone | 9,915 | 70.4% |
| Tablet | 5,489 | 39.0% |
| No Computing Device | 3,111 | 22.1% |
| Total | 14,076 | 100.0% |
Internet Access in Rio Arriba County
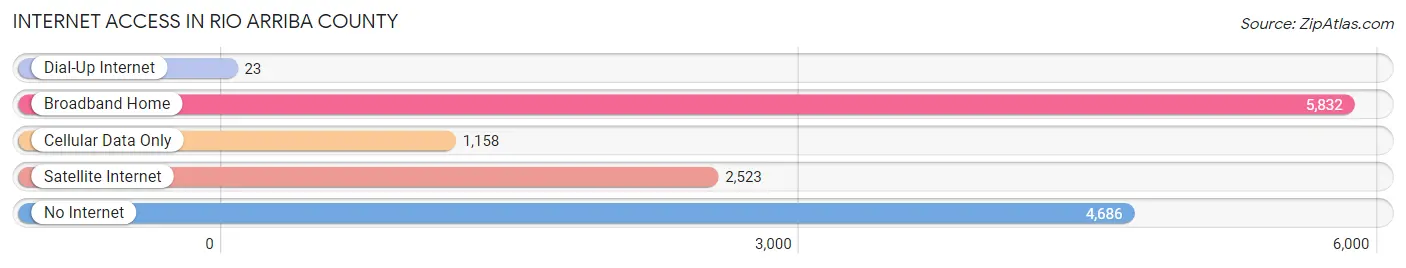
| Internet Type | # Households | % Households |
| Dial-Up Internet | 23 | 0.2% |
| Broadband Home | 5,832 | 41.4% |
| Cellular Data Only | 1,158 | 8.2% |
| Satellite Internet | 2,523 | 17.9% |
| No Internet | 4,686 | 33.3% |
| Total | 14,076 | 100.0% |
Rio Arriba County Summary
Rio Arriba County is located in the northern part of New Mexico, and is bordered by Colorado to the north, San Juan County to the east, Santa Fe County to the south, and Los Alamos County to the west. The county seat is Tierra Amarilla, and the largest city is Española. The county has a total area of 4,716 square miles, making it the largest county in New Mexico. As of the 2010 census, the population was 40,246.
History
Rio Arriba County was established in 1852, and was named for the Rio Grande, which flows through the county. The county was originally part of Santa Fe County, but was split off in 1852. The county was originally inhabited by Native American tribes, including the Apache, Navajo, and Pueblo. The first European settlers arrived in the area in the late 1700s, and the county was officially established in 1852.
The county was an important part of the Santa Fe Trail, which was used by traders and settlers to travel between Missouri and New Mexico. The county was also an important part of the Chihuahua Trail, which was used to transport goods between Mexico and the United States.
Geography
Rio Arriba County is located in the northern part of New Mexico, and is bordered by Colorado to the north, San Juan County to the east, Santa Fe County to the south, and Los Alamos County to the west. The county has a total area of 4,716 square miles, making it the largest county in New Mexico. The county is mostly mountainous, with the highest point being the summit of Truchas Peak at 13,102 feet. The county is home to several rivers, including the Rio Grande, the Chama River, and the Jemez River.
Economy
Rio Arriba County has a diverse economy, with the largest industries being agriculture, tourism, and government. The county is home to several large agricultural operations, including cattle ranches, dairy farms, and vegetable farms. Tourism is also an important part of the economy, with the county being home to several popular attractions, including the Rio Grande Gorge Bridge, the Valles Caldera National Preserve, and the Bandelier National Monument. The county is also home to several government agencies, including the Bureau of Land Management, the U.S. Forest Service, and the U.S. Fish and Wildlife Service.
Demographics
As of the 2010 census, the population of Rio Arriba County was 40,246. The population is mostly Hispanic or Latino, with the largest ethnic group being Mexican (77.3%). The median household income in the county is $37,845, and the median age is 37. The county has a poverty rate of 24.3%, and the unemployment rate is 6.2%.
Common Questions
What is Per Capita Income in Rio Arriba County?
Per Capita income in Rio Arriba County is $27,878.
What is the Median Family Income in Rio Arriba County?
Median Family Income in Rio Arriba County is $65,388.
What is the Median Household income in Rio Arriba County?
Median Household Income in Rio Arriba County is $52,031.
What is Income or Wage Gap in Rio Arriba County?
Income or Wage Gap in Rio Arriba County is 19.3%.
Women in Rio Arriba County earn 80.7 cents for every dollar earned by a man.
What is Family Income Deficit in Rio Arriba County?
Family Income Deficit in Rio Arriba County is $10,894.
Families that are below poverty line in Rio Arriba County earn $10,894 less on average than the poverty threshold level.
What is Inequality or Gini Index in Rio Arriba County?
Inequality or Gini Index in Rio Arriba County is 0.47.
What is the Total Population of Rio Arriba County?
Total Population of Rio Arriba County is 40,285.
What is the Total Male Population of Rio Arriba County?
Total Male Population of Rio Arriba County is 19,854.
What is the Total Female Population of Rio Arriba County?
Total Female Population of Rio Arriba County is 20,431.
What is the Ratio of Males per 100 Females in Rio Arriba County?
There are 97.18 Males per 100 Females in Rio Arriba County.
What is the Ratio of Females per 100 Males in Rio Arriba County?
There are 102.91 Females per 100 Males in Rio Arriba County.
What is the Median Population Age in Rio Arriba County?
Median Population Age in Rio Arriba County is 41.7 Years.
What is the Average Family Size in Rio Arriba County
Average Family Size in Rio Arriba County is 3.6 People.
What is the Average Household Size in Rio Arriba County
Average Household Size in Rio Arriba County is 2.8 People.
How Large is the Labor Force in Rio Arriba County?
There are 16,567 People in the Labor Forcein in Rio Arriba County.
What is the Percentage of People in the Labor Force in Rio Arriba County?
51.3% of People are in the Labor Force in Rio Arriba County.
What is the Unemployment Rate in Rio Arriba County?
Unemployment Rate in Rio Arriba County is 6.0%.