Otero County, NM Map & Demographics
Otero County Map
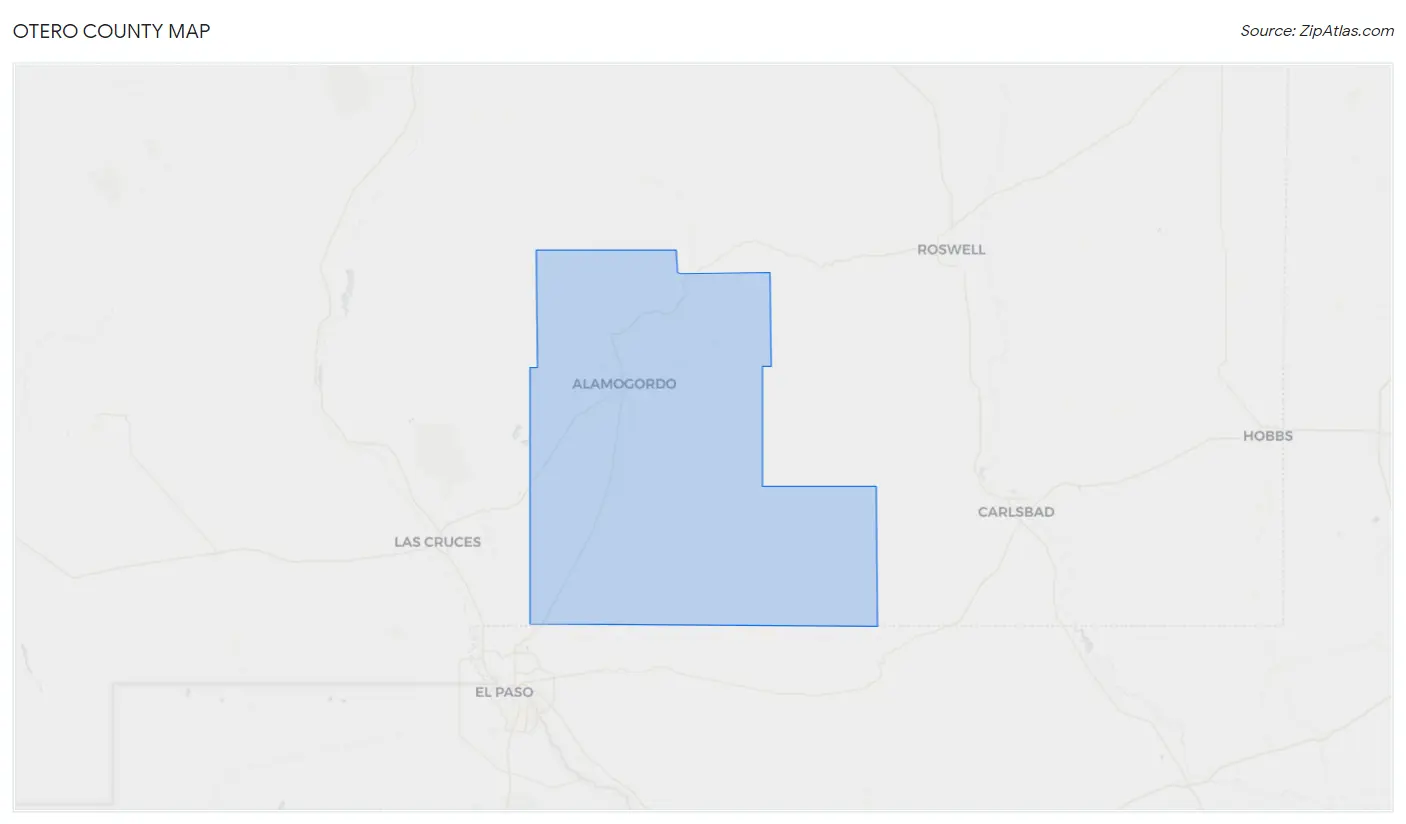
Otero County Overview
$26,319
PER CAPITA INCOME
$65,947
AVG FAMILY INCOME
$50,833
AVG HOUSEHOLD INCOME
23.9%
WAGE / INCOME GAP [ % ]
76.1¢/ $1
WAGE / INCOME GAP [ $ ]
$8,763
FAMILY INCOME DEFICIT
0.43
INEQUALITY / GINI INDEX
67,850
TOTAL POPULATION
35,846
MALE POPULATION
32,004
FEMALE POPULATION
112.00
MALES / 100 FEMALES
89.28
FEMALES / 100 MALES
35.9
MEDIAN AGE
3.5
AVG FAMILY SIZE
2.7
AVG HOUSEHOLD SIZE
29,548
LABOR FORCE [ PEOPLE ]
54.1%
PERCENT IN LABOR FORCE
9.6%
UNEMPLOYMENT RATE
Income in Otero County
Income Overview in Otero County
Per Capita Income in Otero County is $26,319, while median incomes of families and households are $65,947 and $50,833 respectively.
| Characteristic | Number | Measure |
| Per Capita Income | 67,850 | $26,319 |
| Median Family Income | 14,604 | $65,947 |
| Mean Family Income | 14,604 | $79,517 |
| Median Household Income | 23,832 | $50,833 |
| Mean Household Income | 23,832 | $67,009 |
| Income Deficit | 14,604 | $8,763 |
| Wage / Income Gap (%) | 67,850 | 23.91% |
| Wage / Income Gap ($) | 67,850 | 76.09¢ per $1 |
| Gini / Inequality Index | 67,850 | 0.43 |
Earnings by Sex in Otero County
Average Earnings in Otero County are $31,191, $34,796 for men and $26,476 for women, a difference of 23.9%.
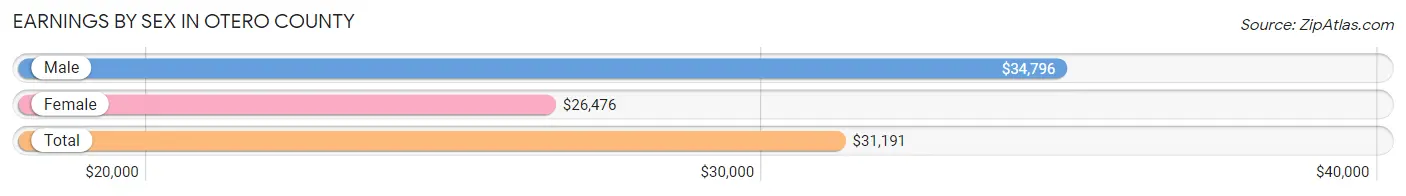
| Sex | Number | Average Earnings |
| Male | 17,865 (57.6%) | $34,796 |
| Female | 13,156 (42.4%) | $26,476 |
| Total | 31,021 (100.0%) | $31,191 |
Earnings by Sex by Income Bracket in Otero County
The most common earnings brackets in Otero County are $30,000 to $34,999 for men (1,500 | 8.4%) and $25,000 to $29,999 for women (1,257 | 9.6%).
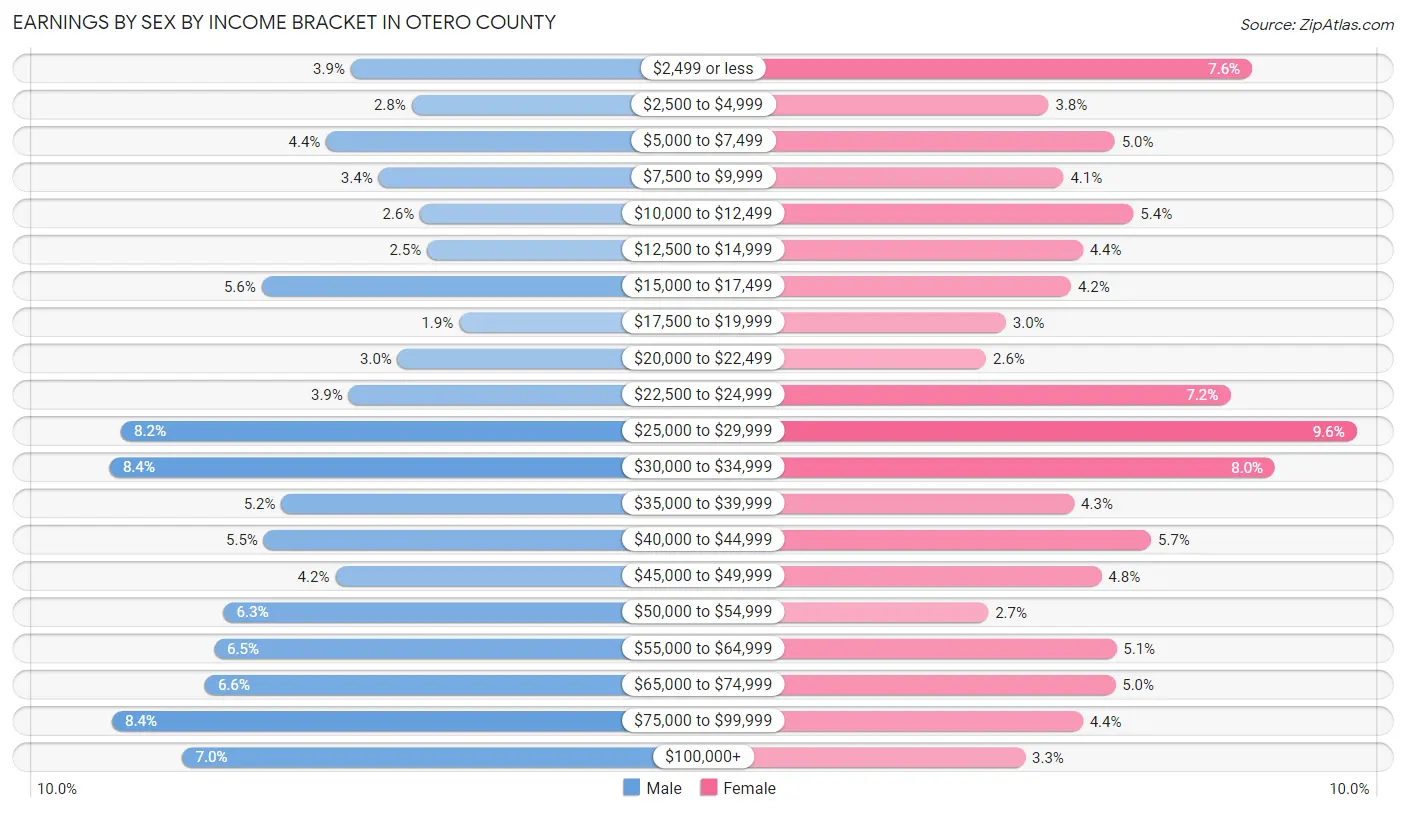
| Income | Male | Female |
| $2,499 or less | 695 (3.9%) | 999 (7.6%) |
| $2,500 to $4,999 | 491 (2.8%) | 497 (3.8%) |
| $5,000 to $7,499 | 778 (4.3%) | 660 (5.0%) |
| $7,500 to $9,999 | 602 (3.4%) | 534 (4.1%) |
| $10,000 to $12,499 | 463 (2.6%) | 706 (5.4%) |
| $12,500 to $14,999 | 439 (2.5%) | 582 (4.4%) |
| $15,000 to $17,499 | 993 (5.6%) | 552 (4.2%) |
| $17,500 to $19,999 | 333 (1.9%) | 392 (3.0%) |
| $20,000 to $22,499 | 538 (3.0%) | 343 (2.6%) |
| $22,500 to $24,999 | 702 (3.9%) | 944 (7.2%) |
| $25,000 to $29,999 | 1,464 (8.2%) | 1,257 (9.6%) |
| $30,000 to $34,999 | 1,500 (8.4%) | 1,055 (8.0%) |
| $35,000 to $39,999 | 928 (5.2%) | 561 (4.3%) |
| $40,000 to $44,999 | 986 (5.5%) | 750 (5.7%) |
| $45,000 to $49,999 | 746 (4.2%) | 627 (4.8%) |
| $50,000 to $54,999 | 1,121 (6.3%) | 349 (2.6%) |
| $55,000 to $64,999 | 1,152 (6.5%) | 665 (5.1%) |
| $65,000 to $74,999 | 1,183 (6.6%) | 662 (5.0%) |
| $75,000 to $99,999 | 1,493 (8.4%) | 582 (4.4%) |
| $100,000+ | 1,258 (7.0%) | 439 (3.3%) |
| Total | 17,865 (100.0%) | 13,156 (100.0%) |
Earnings by Sex by Educational Attainment in Otero County
Average earnings in Otero County are $43,163 for men and $29,621 for women, a difference of 31.4%. Men with an educational attainment of graduate degree enjoy the highest average annual earnings of $72,052, while those with less than high school education earn the least with $21,971. Women with an educational attainment of graduate degree earn the most with the average annual earnings of $64,318, while those with less than high school education have the smallest earnings of $18,729.
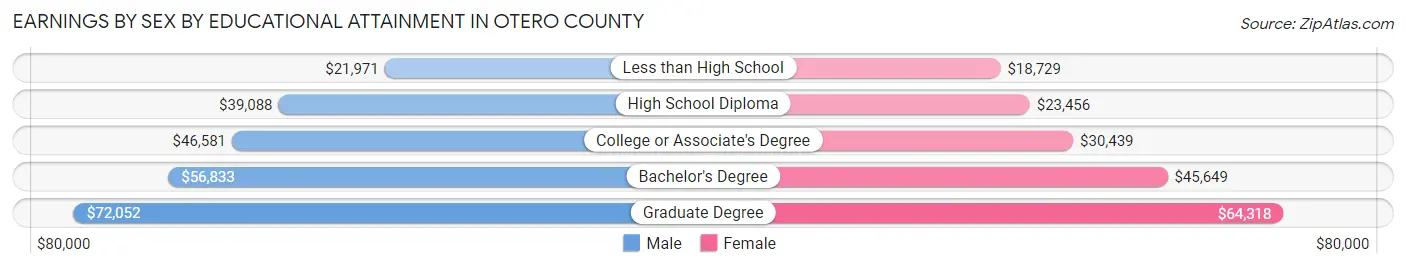
| Educational Attainment | Male Income | Female Income |
| Less than High School | $21,971 | $18,729 |
| High School Diploma | $39,088 | $23,456 |
| College or Associate's Degree | $46,581 | $30,439 |
| Bachelor's Degree | $56,833 | $45,649 |
| Graduate Degree | $72,052 | $64,318 |
| Total | $43,163 | $29,621 |
Family Income in Otero County
Family Income Brackets in Otero County
According to the Otero County family income data, there are 2,731 families falling into the $50,000 to $74,999 income range, which is the most common income bracket and makes up 18.7% of all families. Conversely, the $10,000 to $14,999 income bracket is the least frequent group with only 497 families (3.4%) belonging to this category.
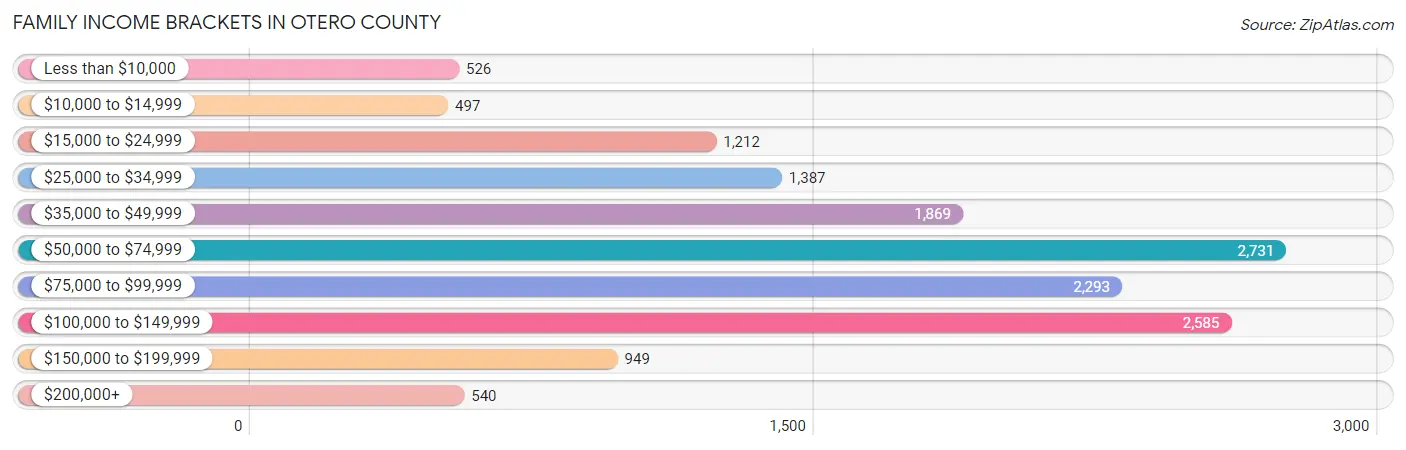
| Income Bracket | # Families | % Families |
| Less than $10,000 | 526 | 3.6% |
| $10,000 to $14,999 | 497 | 3.4% |
| $15,000 to $24,999 | 1,212 | 8.3% |
| $25,000 to $34,999 | 1,387 | 9.5% |
| $35,000 to $49,999 | 1,869 | 12.8% |
| $50,000 to $74,999 | 2,731 | 18.7% |
| $75,000 to $99,999 | 2,293 | 15.7% |
| $100,000 to $149,999 | 2,585 | 17.7% |
| $150,000 to $199,999 | 949 | 6.5% |
| $200,000+ | 540 | 3.7% |
Family Income by Famaliy Size in Otero County
5-person families (1,425 | 9.8%) account for the highest median family income in Otero County with $80,767 per family, while 2-person families (7,625 | 52.2%) have the highest median income of $31,780 per family member.
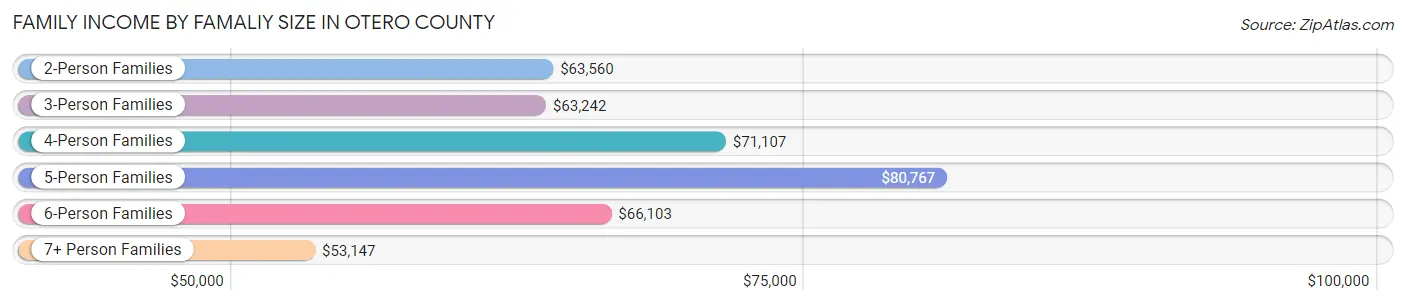
| Income Bracket | # Families | Median Income |
| 2-Person Families | 7,625 (52.2%) | $63,560 |
| 3-Person Families | 3,023 (20.7%) | $63,242 |
| 4-Person Families | 1,812 (12.4%) | $71,107 |
| 5-Person Families | 1,425 (9.8%) | $80,767 |
| 6-Person Families | 390 (2.7%) | $66,103 |
| 7+ Person Families | 329 (2.2%) | $53,147 |
| Total | 14,604 (100.0%) | $65,947 |
Family Income by Number of Earners in Otero County
The median family income in Otero County is $65,947, with families comprising 3+ earners (951) having the highest median family income of $118,353, while families with no earners (3,224) have the lowest median family income of $40,473, accounting for 6.5% and 22.1% of families, respectively.
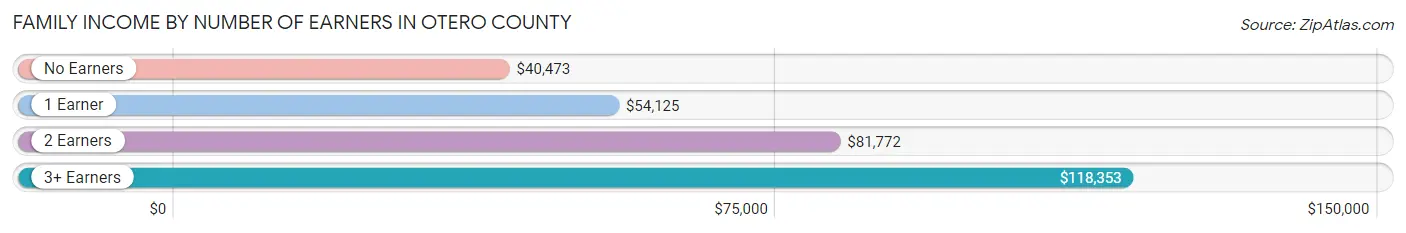
| Number of Earners | # Families | Median Income |
| No Earners | 3,224 (22.1%) | $40,473 |
| 1 Earner | 5,683 (38.9%) | $54,125 |
| 2 Earners | 4,746 (32.5%) | $81,772 |
| 3+ Earners | 951 (6.5%) | $118,353 |
| Total | 14,604 (100.0%) | $65,947 |
Household Income in Otero County
Household Income Brackets in Otero County
With 4,433 households falling in the category, the $50,000 to $74,999 income range is the most frequent in Otero County, accounting for 18.6% of all households. In contrast, only 763 households (3.2%) fall into the $200,000+ income bracket, making it the least populous group.
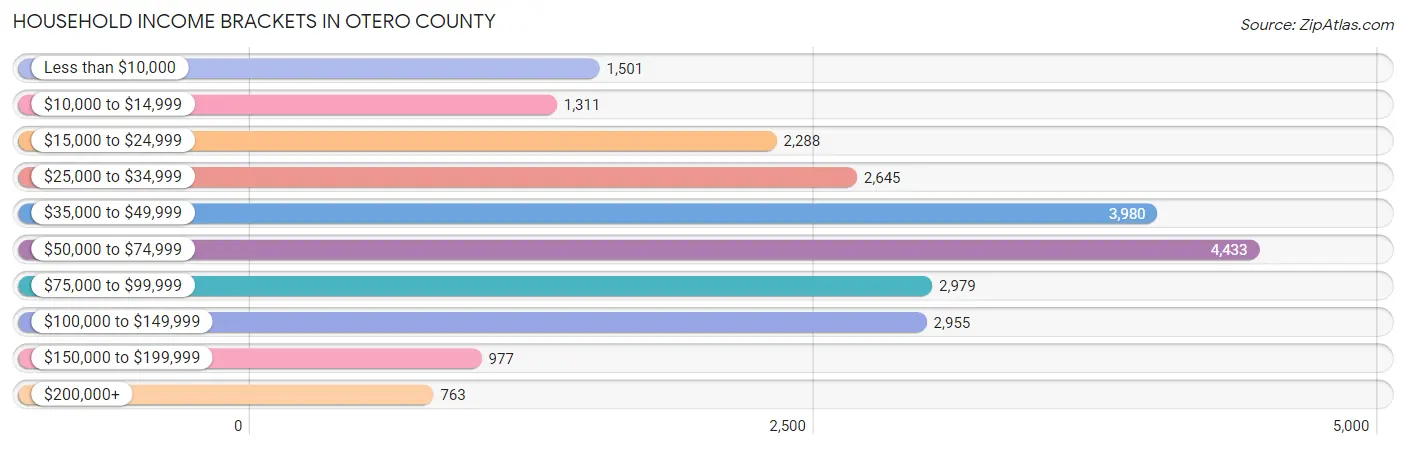
| Income Bracket | # Households | % Households |
| Less than $10,000 | 1,501 | 6.3% |
| $10,000 to $14,999 | 1,311 | 5.5% |
| $15,000 to $24,999 | 2,288 | 9.6% |
| $25,000 to $34,999 | 2,645 | 11.1% |
| $35,000 to $49,999 | 3,980 | 16.7% |
| $50,000 to $74,999 | 4,433 | 18.6% |
| $75,000 to $99,999 | 2,979 | 12.5% |
| $100,000 to $149,999 | 2,955 | 12.4% |
| $150,000 to $199,999 | 977 | 4.1% |
| $200,000+ | 763 | 3.2% |
Household Income by Householder Age in Otero County
The median household income in Otero County is $50,833, with the highest median household income of $55,272 found in the 45 to 64 years age bracket for the primary householder. A total of 7,559 households (31.7%) fall into this category. Meanwhile, the 65+ years age bracket for the primary householder has the lowest median household income of $43,396, with 6,746 households (28.3%) in this group.
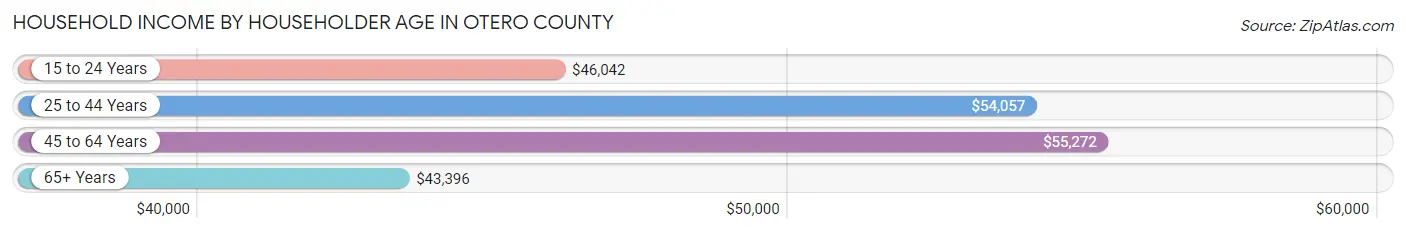
| Income Bracket | # Households | Median Income |
| 15 to 24 Years | 1,705 (7.1%) | $46,042 |
| 25 to 44 Years | 7,822 (32.8%) | $54,057 |
| 45 to 64 Years | 7,559 (31.7%) | $55,272 |
| 65+ Years | 6,746 (28.3%) | $43,396 |
| Total | 23,832 (100.0%) | $50,833 |
Poverty in Otero County
Income Below Poverty by Sex and Age in Otero County
With 17.1% poverty level for males and 21.7% for females among the residents of Otero County, 16 and 17 year old males and 6 to 11 year old females are the most vulnerable to poverty, with 405 males (40.3%) and 715 females (30.2%) in their respective age groups living below the poverty level.
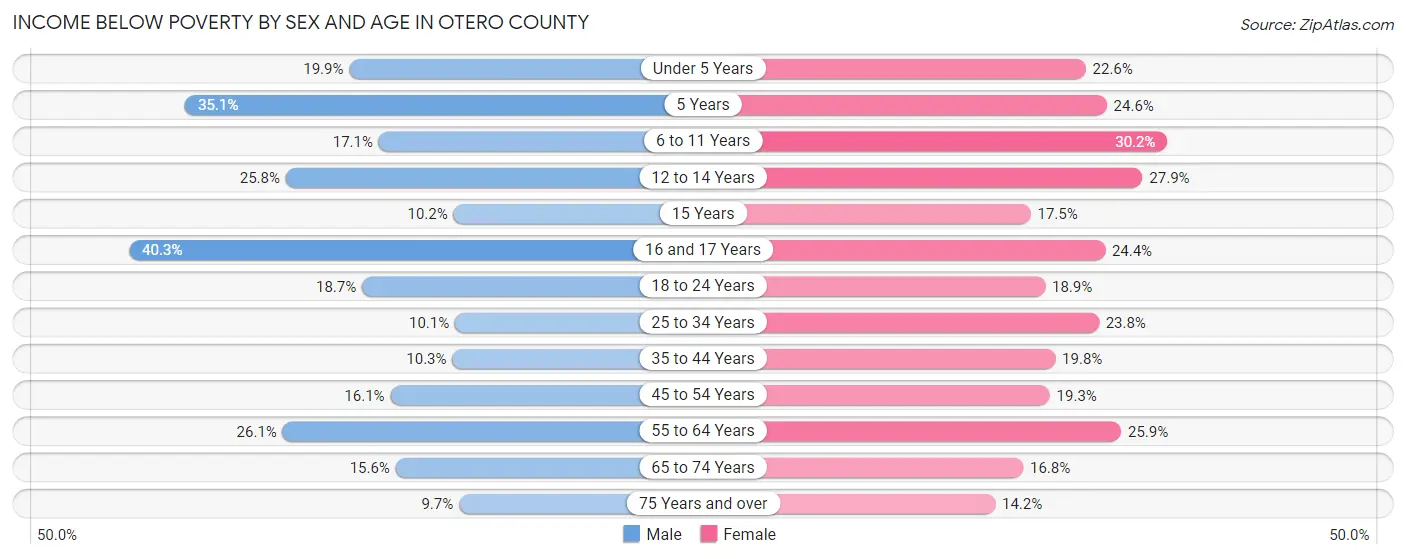
| Age Bracket | Male | Female |
| Under 5 Years | 420 (19.9%) | 452 (22.6%) |
| 5 Years | 165 (35.1%) | 117 (24.6%) |
| 6 to 11 Years | 472 (17.1%) | 715 (30.2%) |
| 12 to 14 Years | 304 (25.8%) | 330 (27.9%) |
| 15 Years | 27 (10.2%) | 58 (17.5%) |
| 16 and 17 Years | 405 (40.3%) | 211 (24.4%) |
| 18 to 24 Years | 718 (18.7%) | 536 (18.9%) |
| 25 to 34 Years | 525 (10.1%) | 1,053 (23.8%) |
| 35 to 44 Years | 373 (10.3%) | 749 (19.8%) |
| 45 to 54 Years | 501 (16.1%) | 640 (19.3%) |
| 55 to 64 Years | 963 (26.1%) | 1,082 (25.9%) |
| 65 to 74 Years | 508 (15.6%) | 571 (16.8%) |
| 75 Years and over | 204 (9.7%) | 358 (14.2%) |
| Total | 5,585 (17.1%) | 6,872 (21.7%) |
Income Above Poverty by Sex and Age in Otero County
According to the poverty statistics in Otero County, males aged 75 years and over and females aged 75 years and over are the age groups that are most secure financially, with 90.3% of males and 85.8% of females in these age groups living above the poverty line.
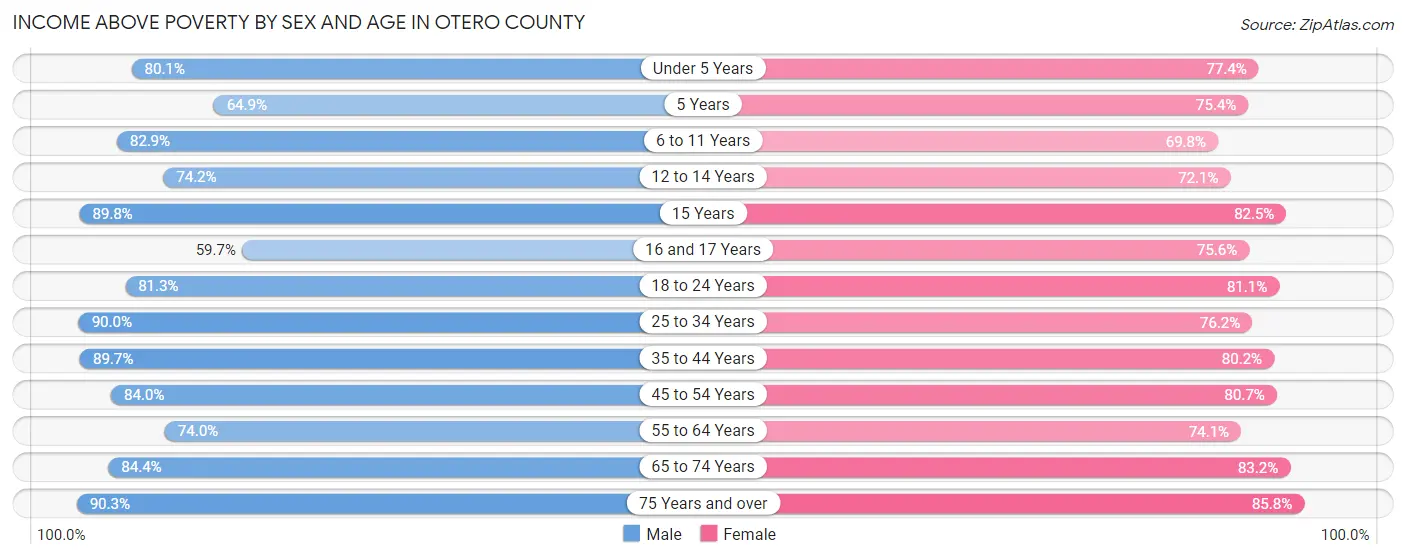
| Age Bracket | Male | Female |
| Under 5 Years | 1,694 (80.1%) | 1,545 (77.4%) |
| 5 Years | 305 (64.9%) | 359 (75.4%) |
| 6 to 11 Years | 2,284 (82.9%) | 1,652 (69.8%) |
| 12 to 14 Years | 876 (74.2%) | 853 (72.1%) |
| 15 Years | 238 (89.8%) | 273 (82.5%) |
| 16 and 17 Years | 600 (59.7%) | 653 (75.6%) |
| 18 to 24 Years | 3,125 (81.3%) | 2,306 (81.1%) |
| 25 to 34 Years | 4,699 (89.9%) | 3,364 (76.2%) |
| 35 to 44 Years | 3,250 (89.7%) | 3,033 (80.2%) |
| 45 to 54 Years | 2,620 (84.0%) | 2,678 (80.7%) |
| 55 to 64 Years | 2,734 (74.0%) | 3,092 (74.1%) |
| 65 to 74 Years | 2,756 (84.4%) | 2,823 (83.2%) |
| 75 Years and over | 1,904 (90.3%) | 2,159 (85.8%) |
| Total | 27,085 (82.9%) | 24,790 (78.3%) |
Income Below Poverty Among Married-Couple Families in Otero County
The poverty statistics for married-couple families in Otero County show that 8.9% or 959 of the total 10,788 families live below the poverty line. Families with 5 or more children have the highest poverty rate of 41.8%, comprising of 51 families. On the other hand, families with no children have the lowest poverty rate of 7.6%, which includes 507 families.
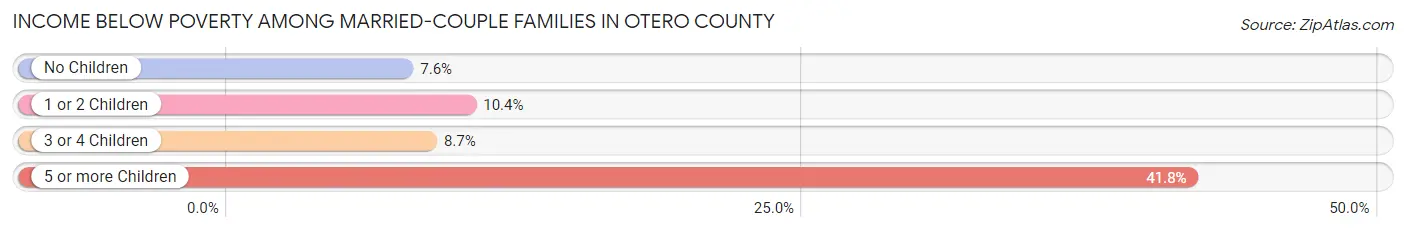
| Children | Above Poverty | Below Poverty |
| No Children | 6,142 (92.4%) | 507 (7.6%) |
| 1 or 2 Children | 2,783 (89.6%) | 322 (10.4%) |
| 3 or 4 Children | 833 (91.3%) | 79 (8.7%) |
| 5 or more Children | 71 (58.2%) | 51 (41.8%) |
| Total | 9,829 (91.1%) | 959 (8.9%) |
Income Below Poverty Among Single-Parent Households in Otero County
According to the poverty data in Otero County, 25.5% or 329 single-father households and 34.2% or 865 single-mother households are living below the poverty line. Among single-father households, those with 3 or 4 children have the highest poverty rate, with 49 households (50.0%) experiencing poverty. Likewise, among single-mother households, those with 5 or more children have the highest poverty rate, with 139 households (87.4%) falling below the poverty line.
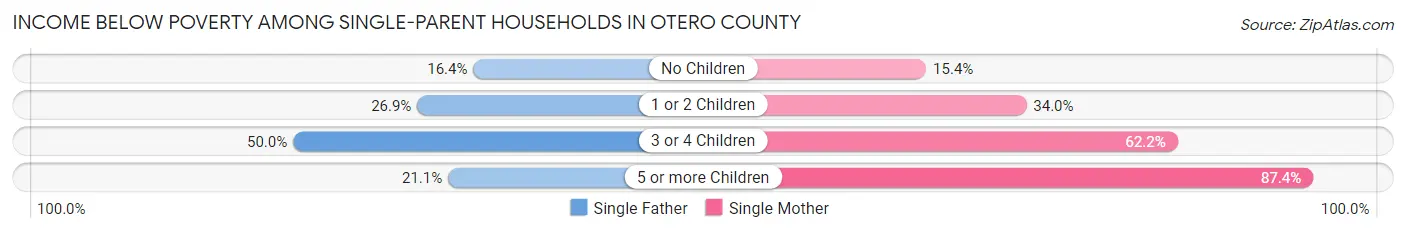
| Children | Single Father | Single Mother |
| No Children | 57 (16.4%) | 112 (15.4%) |
| 1 or 2 Children | 208 (26.9%) | 489 (34.0%) |
| 3 or 4 Children | 49 (50.0%) | 125 (62.2%) |
| 5 or more Children | 15 (21.1%) | 139 (87.4%) |
| Total | 329 (25.5%) | 865 (34.2%) |
Income Below Poverty Among Married-Couple vs Single-Parent Households in Otero County
The poverty data for Otero County shows that 959 of the married-couple family households (8.9%) and 1,194 of the single-parent households (31.3%) are living below the poverty level. Within the married-couple family households, those with 5 or more children have the highest poverty rate, with 51 households (41.8%) falling below the poverty line. Among the single-parent households, those with 5 or more children have the highest poverty rate, with 154 household (67.0%) living below poverty.
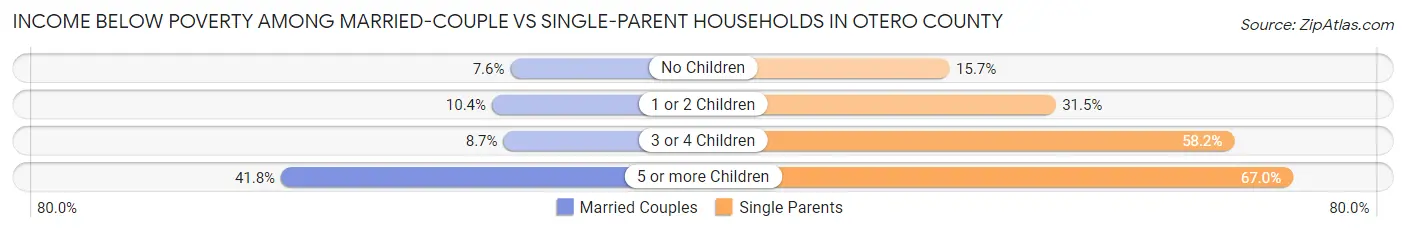
| Children | Married-Couple Families | Single-Parent Households |
| No Children | 507 (7.6%) | 169 (15.7%) |
| 1 or 2 Children | 322 (10.4%) | 697 (31.5%) |
| 3 or 4 Children | 79 (8.7%) | 174 (58.2%) |
| 5 or more Children | 51 (41.8%) | 154 (67.0%) |
| Total | 959 (8.9%) | 1,194 (31.3%) |
Race in Otero County
The most populous races in Otero County are White / Caucasian (43,549 | 64.2%), Hispanic or Latino (26,433 | 39.0%), and Two or more Races (10,849 | 16.0%).
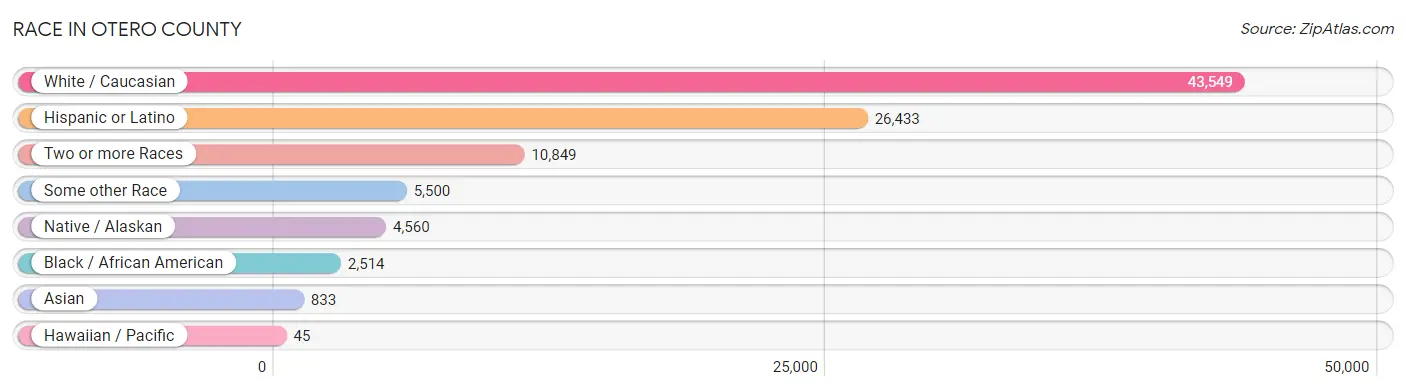
| Race | # Population | % Population |
| Asian | 833 | 1.2% |
| Black / African American | 2,514 | 3.7% |
| Hawaiian / Pacific | 45 | 0.1% |
| Hispanic or Latino | 26,433 | 39.0% |
| Native / Alaskan | 4,560 | 6.7% |
| White / Caucasian | 43,549 | 64.2% |
| Two or more Races | 10,849 | 16.0% |
| Some other Race | 5,500 | 8.1% |
| Total | 67,850 | 100.0% |
Ancestry in Otero County
The most populous ancestries reported in Otero County are Mexican (20,674 | 30.5%), German (6,799 | 10.0%), English (6,513 | 9.6%), Irish (5,586 | 8.2%), and American (3,897 | 5.7%), together accounting for 64.1% of all Otero County residents.
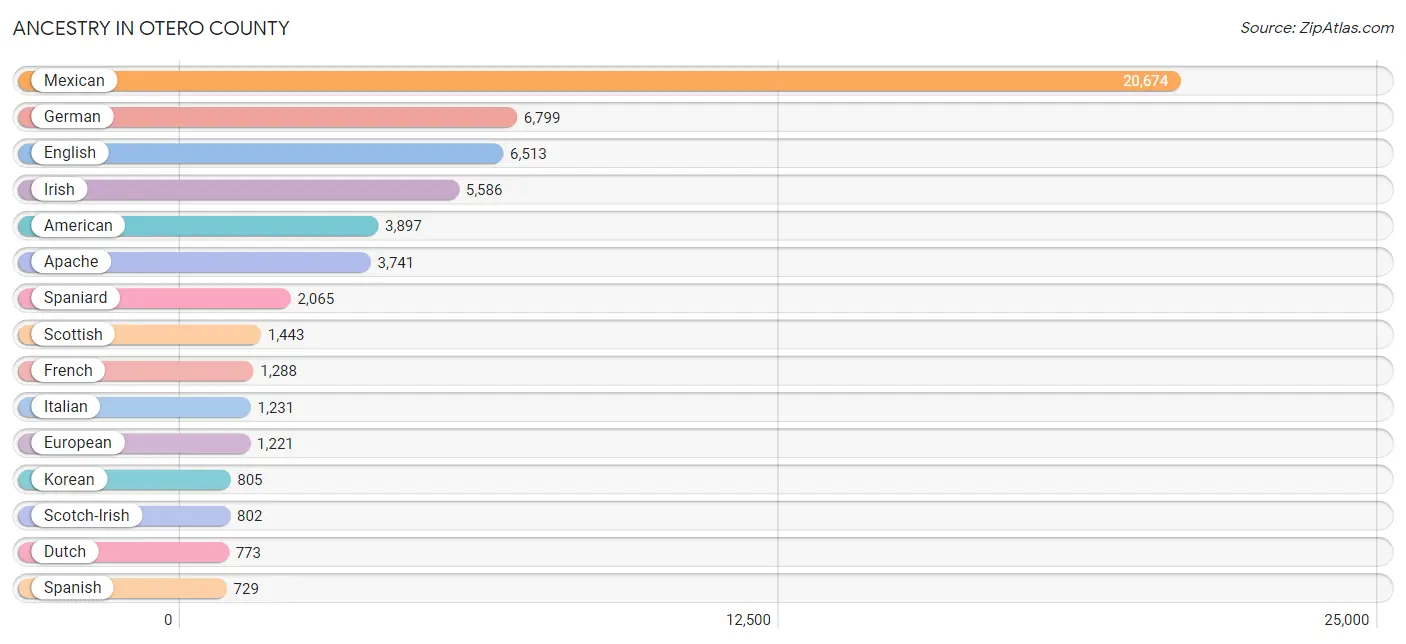
| Ancestry | # Population | % Population |
| African | 136 | 0.2% |
| Albanian | 10 | 0.0% |
| American | 3,897 | 5.7% |
| Apache | 3,741 | 5.5% |
| Arab | 208 | 0.3% |
| Australian | 29 | 0.0% |
| Austrian | 102 | 0.2% |
| Bahamian | 7 | 0.0% |
| Bangladeshi | 37 | 0.1% |
| Bhutanese | 200 | 0.3% |
| Blackfeet | 102 | 0.2% |
| Bolivian | 2 | 0.0% |
| Brazilian | 35 | 0.1% |
| British | 365 | 0.5% |
| Burmese | 198 | 0.3% |
| Cajun | 63 | 0.1% |
| Cambodian | 10 | 0.0% |
| Celtic | 38 | 0.1% |
| Central American | 205 | 0.3% |
| Central American Indian | 292 | 0.4% |
| Cherokee | 343 | 0.5% |
| Cheyenne | 60 | 0.1% |
| Choctaw | 79 | 0.1% |
| Colombian | 76 | 0.1% |
| Costa Rican | 4 | 0.0% |
| Croatian | 20 | 0.0% |
| Cuban | 310 | 0.5% |
| Czech | 173 | 0.3% |
| Czechoslovakian | 47 | 0.1% |
| Danish | 36 | 0.1% |
| Dominican | 292 | 0.4% |
| Dutch | 773 | 1.1% |
| Dutch West Indian | 4 | 0.0% |
| Eastern European | 64 | 0.1% |
| Ecuadorian | 25 | 0.0% |
| English | 6,513 | 9.6% |
| Estonian | 9 | 0.0% |
| European | 1,221 | 1.8% |
| Filipino | 72 | 0.1% |
| Finnish | 194 | 0.3% |
| French | 1,288 | 1.9% |
| French Canadian | 293 | 0.4% |
| German | 6,799 | 10.0% |
| Ghanaian | 25 | 0.0% |
| Greek | 30 | 0.0% |
| Guamanian / Chamorro | 98 | 0.1% |
| Guatemalan | 64 | 0.1% |
| Haitian | 4 | 0.0% |
| Honduran | 27 | 0.0% |
| Hungarian | 104 | 0.2% |
| Indian (Asian) | 171 | 0.3% |
| Iranian | 185 | 0.3% |
| Iraqi | 4 | 0.0% |
| Irish | 5,586 | 8.2% |
| Italian | 1,231 | 1.8% |
| Jamaican | 45 | 0.1% |
| Japanese | 11 | 0.0% |
| Korean | 805 | 1.2% |
| Laotian | 22 | 0.0% |
| Latvian | 4 | 0.0% |
| Lebanese | 185 | 0.3% |
| Lithuanian | 20 | 0.0% |
| Mexican | 20,674 | 30.5% |
| Mexican American Indian | 175 | 0.3% |
| Moroccan | 3 | 0.0% |
| Native Hawaiian | 119 | 0.2% |
| Navajo | 490 | 0.7% |
| Nicaraguan | 10 | 0.0% |
| Nigerian | 117 | 0.2% |
| Norwegian | 649 | 1.0% |
| Pakistani | 96 | 0.1% |
| Panamanian | 38 | 0.1% |
| Pennsylvania German | 34 | 0.1% |
| Peruvian | 111 | 0.2% |
| Pima | 26 | 0.0% |
| Polish | 370 | 0.5% |
| Portuguese | 43 | 0.1% |
| Pueblo | 328 | 0.5% |
| Puerto Rican | 271 | 0.4% |
| Romanian | 21 | 0.0% |
| Russian | 202 | 0.3% |
| Salvadoran | 62 | 0.1% |
| Samoan | 58 | 0.1% |
| Scandinavian | 291 | 0.4% |
| Scotch-Irish | 802 | 1.2% |
| Scottish | 1,443 | 2.1% |
| Shoshone | 51 | 0.1% |
| Sioux | 121 | 0.2% |
| Slovak | 44 | 0.1% |
| Slovene | 23 | 0.0% |
| South American | 301 | 0.4% |
| Spaniard | 2,065 | 3.0% |
| Spanish | 729 | 1.1% |
| Spanish American | 45 | 0.1% |
| Sri Lankan | 101 | 0.2% |
| Subsaharan African | 291 | 0.4% |
| Swedish | 344 | 0.5% |
| Swiss | 47 | 0.1% |
| Syrian | 16 | 0.0% |
| Turkish | 56 | 0.1% |
| Ukrainian | 76 | 0.1% |
| Uruguayan | 18 | 0.0% |
| Ute | 14 | 0.0% |
| Venezuelan | 69 | 0.1% |
| Welsh | 377 | 0.6% | View All 105 Rows |
Immigrants in Otero County
The most numerous immigrant groups reported in Otero County came from Latin America (4,997 | 7.4%), Central America (4,585 | 6.8%), Mexico (4,401 | 6.5%), Asia (740 | 1.1%), and Europe (604 | 0.9%), together accounting for 22.6% of all Otero County residents.
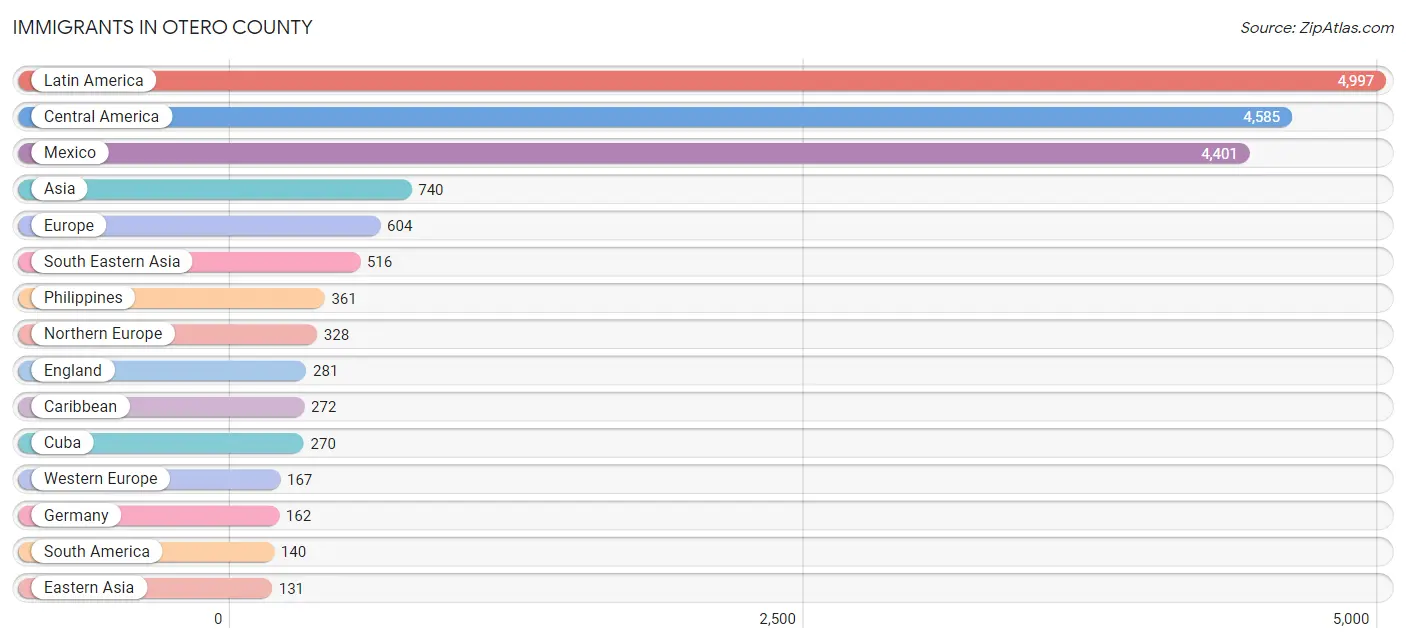
| Immigration Origin | # Population | % Population |
| Africa | 88 | 0.1% |
| Albania | 10 | 0.0% |
| Asia | 740 | 1.1% |
| Brazil | 23 | 0.0% |
| Cameroon | 1 | 0.0% |
| Canada | 72 | 0.1% |
| Caribbean | 272 | 0.4% |
| Central America | 4,585 | 6.8% |
| China | 45 | 0.1% |
| Colombia | 55 | 0.1% |
| Congo | 26 | 0.0% |
| Cuba | 270 | 0.4% |
| Dominican Republic | 2 | 0.0% |
| Eastern Asia | 131 | 0.2% |
| Eastern Europe | 99 | 0.2% |
| Ecuador | 24 | 0.0% |
| El Salvador | 42 | 0.1% |
| England | 281 | 0.4% |
| Europe | 604 | 0.9% |
| Germany | 162 | 0.2% |
| Ghana | 25 | 0.0% |
| Guatemala | 68 | 0.1% |
| Honduras | 32 | 0.1% |
| India | 9 | 0.0% |
| Indonesia | 22 | 0.0% |
| Iran | 17 | 0.0% |
| Iraq | 4 | 0.0% |
| Israel | 11 | 0.0% |
| Italy | 10 | 0.0% |
| Japan | 30 | 0.0% |
| Korea | 56 | 0.1% |
| Latin America | 4,997 | 7.4% |
| Mexico | 4,401 | 6.5% |
| Middle Africa | 27 | 0.0% |
| Netherlands | 5 | 0.0% |
| Nicaragua | 33 | 0.1% |
| Nigeria | 36 | 0.1% |
| Northern Europe | 328 | 0.5% |
| Oceania | 3 | 0.0% |
| Panama | 9 | 0.0% |
| Peru | 15 | 0.0% |
| Philippines | 361 | 0.5% |
| Poland | 23 | 0.0% |
| Russia | 66 | 0.1% |
| Singapore | 11 | 0.0% |
| South America | 140 | 0.2% |
| South Central Asia | 33 | 0.1% |
| South Eastern Asia | 516 | 0.8% |
| Southern Europe | 10 | 0.0% |
| Taiwan | 28 | 0.0% |
| Thailand | 82 | 0.1% |
| Turkey | 41 | 0.1% |
| Uruguay | 9 | 0.0% |
| Uzbekistan | 7 | 0.0% |
| Venezuela | 14 | 0.0% |
| Vietnam | 40 | 0.1% |
| Western Africa | 61 | 0.1% |
| Western Asia | 60 | 0.1% |
| Western Europe | 167 | 0.3% | View All 59 Rows |
Sex and Age in Otero County
Sex and Age in Otero County
The most populous age groups in Otero County are 20 to 24 Years (3,844 | 10.7%) for men and 25 to 29 Years (2,278 | 7.1%) for women.
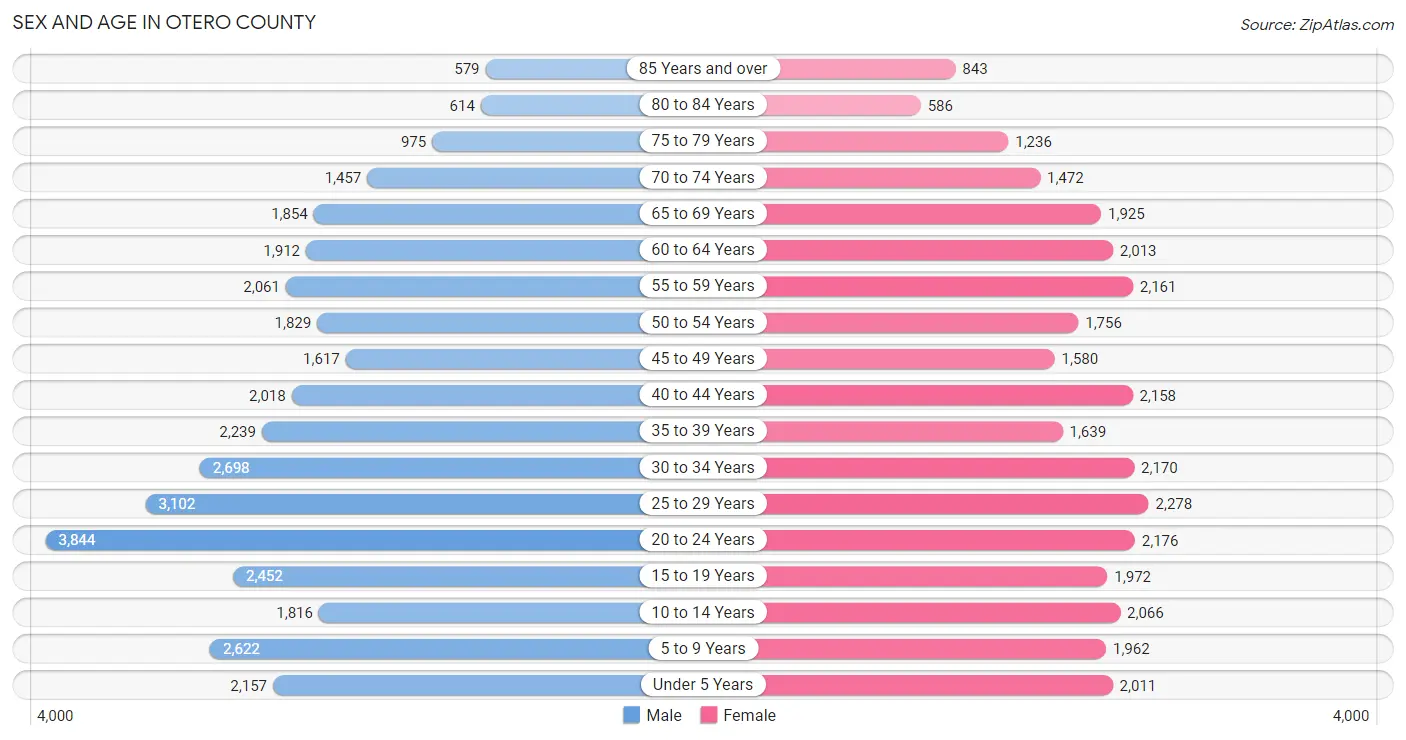
| Age Bracket | Male | Female |
| Under 5 Years | 2,157 (6.0%) | 2,011 (6.3%) |
| 5 to 9 Years | 2,622 (7.3%) | 1,962 (6.1%) |
| 10 to 14 Years | 1,816 (5.1%) | 2,066 (6.5%) |
| 15 to 19 Years | 2,452 (6.8%) | 1,972 (6.2%) |
| 20 to 24 Years | 3,844 (10.7%) | 2,176 (6.8%) |
| 25 to 29 Years | 3,102 (8.6%) | 2,278 (7.1%) |
| 30 to 34 Years | 2,698 (7.5%) | 2,170 (6.8%) |
| 35 to 39 Years | 2,239 (6.2%) | 1,639 (5.1%) |
| 40 to 44 Years | 2,018 (5.6%) | 2,158 (6.7%) |
| 45 to 49 Years | 1,617 (4.5%) | 1,580 (4.9%) |
| 50 to 54 Years | 1,829 (5.1%) | 1,756 (5.5%) |
| 55 to 59 Years | 2,061 (5.8%) | 2,161 (6.8%) |
| 60 to 64 Years | 1,912 (5.3%) | 2,013 (6.3%) |
| 65 to 69 Years | 1,854 (5.2%) | 1,925 (6.0%) |
| 70 to 74 Years | 1,457 (4.1%) | 1,472 (4.6%) |
| 75 to 79 Years | 975 (2.7%) | 1,236 (3.9%) |
| 80 to 84 Years | 614 (1.7%) | 586 (1.8%) |
| 85 Years and over | 579 (1.6%) | 843 (2.6%) |
| Total | 35,846 (100.0%) | 32,004 (100.0%) |
Families and Households in Otero County
Median Family Size in Otero County
The median family size in Otero County is 3.53 persons per family, with single female/mother families (2,526 | 17.3%) accounting for the largest median family size of 4.03 persons per family. On the other hand, married-couple families (10,788 | 73.9%) represent the smallest median family size with 3.37 persons per family.
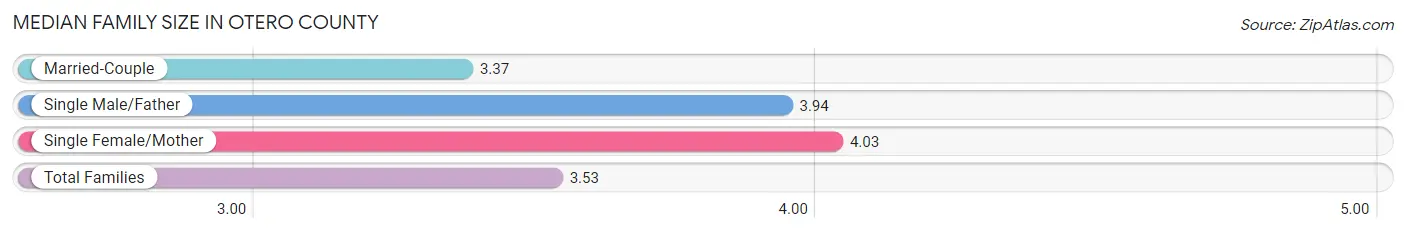
| Family Type | # Families | Family Size |
| Married-Couple | 10,788 (73.9%) | 3.37 |
| Single Male/Father | 1,290 (8.8%) | 3.94 |
| Single Female/Mother | 2,526 (17.3%) | 4.03 |
| Total Families | 14,604 (100.0%) | 3.53 |
Median Household Size in Otero County
The median household size in Otero County is 2.69 persons per household, with single male/father households (1,290 | 5.4%) accounting for the largest median household size of 4.34 persons per household. non-family households (9,228 | 38.7%) represent the smallest median household size with 1.23 persons per household.
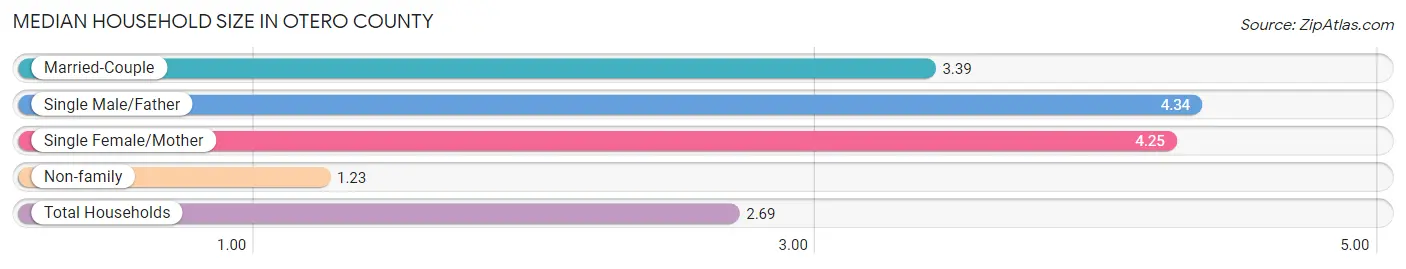
| Household Type | # Households | Household Size |
| Married-Couple | 10,788 (45.3%) | 3.39 |
| Single Male/Father | 1,290 (5.4%) | 4.34 |
| Single Female/Mother | 2,526 (10.6%) | 4.25 |
| Non-family | 9,228 (38.7%) | 1.23 |
| Total Households | 23,832 (100.0%) | 2.69 |
Household Size by Marriage Status in Otero County
Out of a total of 23,832 households in Otero County, 14,604 (61.3%) are family households, while 9,228 (38.7%) are nonfamily households. The most numerous type of family households are 2-person households, comprising 7,049, and the most common type of nonfamily households are 1-person households, comprising 8,060.
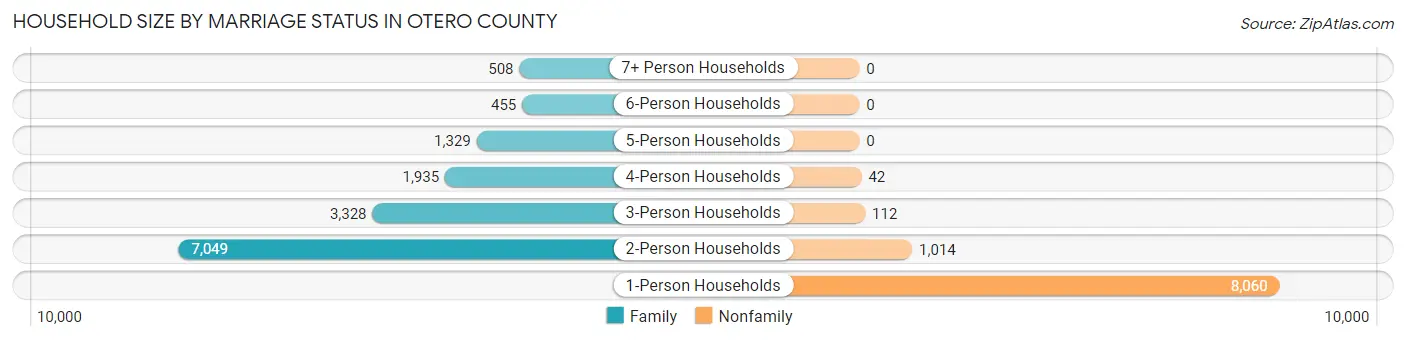
| Household Size | Family Households | Nonfamily Households |
| 1-Person Households | - | 8,060 (33.8%) |
| 2-Person Households | 7,049 (29.6%) | 1,014 (4.3%) |
| 3-Person Households | 3,328 (14.0%) | 112 (0.5%) |
| 4-Person Households | 1,935 (8.1%) | 42 (0.2%) |
| 5-Person Households | 1,329 (5.6%) | 0 (0.0%) |
| 6-Person Households | 455 (1.9%) | 0 (0.0%) |
| 7+ Person Households | 508 (2.1%) | 0 (0.0%) |
| Total | 14,604 (61.3%) | 9,228 (38.7%) |
Female Fertility in Otero County
Fertility by Age in Otero County
Average fertility rate in Otero County is 49.0 births per 1,000 women. Women in the age bracket of 20 to 34 years have the highest fertility rate with 86.0 births per 1,000 women. Women in the age bracket of 20 to 34 years acount for 80.7% of all women with births.
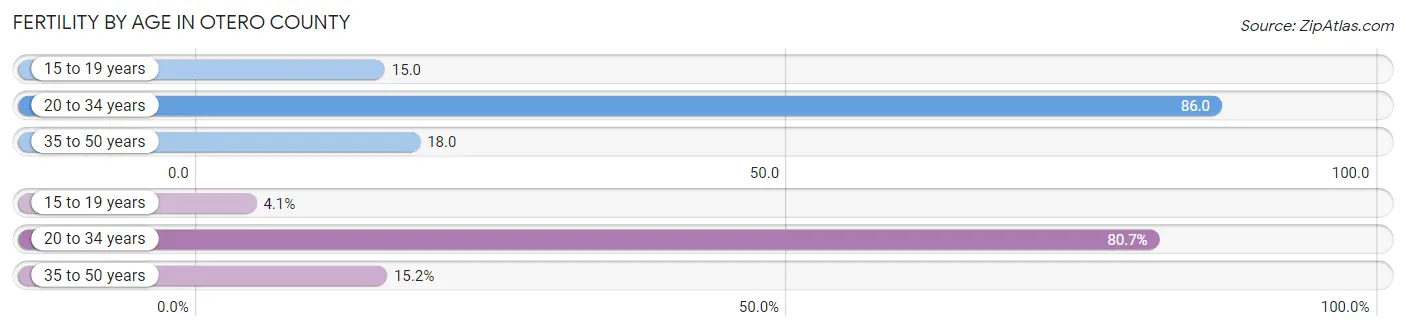
| Age Bracket | Women with Births | Births / 1,000 Women |
| 15 to 19 years | 29 (4.1%) | 15.0 |
| 20 to 34 years | 569 (80.7%) | 86.0 |
| 35 to 50 years | 107 (15.2%) | 18.0 |
| Total | 705 (100.0%) | 49.0 |
Fertility by Age by Marriage Status in Otero County
65.8% of women with births (705) in Otero County are married. The highest percentage of unmarried women with births falls into 15 to 19 years age bracket with 100.0% of them unmarried at the time of birth, while the lowest percentage of unmarried women with births belong to 35 to 50 years age bracket with 0.0% of them unmarried.
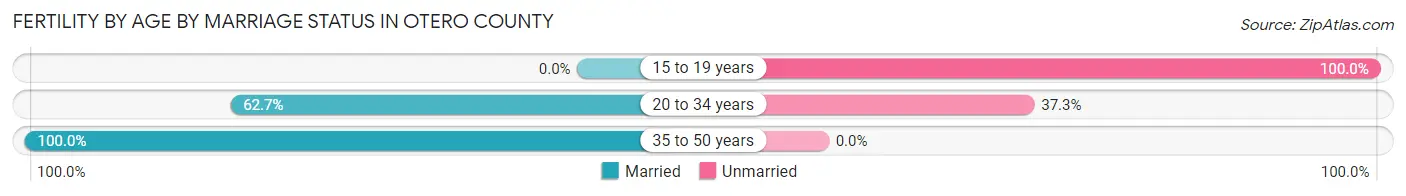
| Age Bracket | Married | Unmarried |
| 15 to 19 years | 0 (0.0%) | 29 (100.0%) |
| 20 to 34 years | 357 (62.7%) | 212 (37.3%) |
| 35 to 50 years | 107 (100.0%) | 0 (0.0%) |
| Total | 464 (65.8%) | 241 (34.2%) |
Fertility by Education in Otero County
Average fertility rate in Otero County is 49.0 births per 1,000 women. Women with the education attainment of graduate degree have the highest fertility rate of 96.0 births per 1,000 women, while women with the education attainment of bachelor's degree have the lowest fertility at 18.0 births per 1,000 women. Women with the education attainment of college or associate's degree represent 62.0% of all women with births.
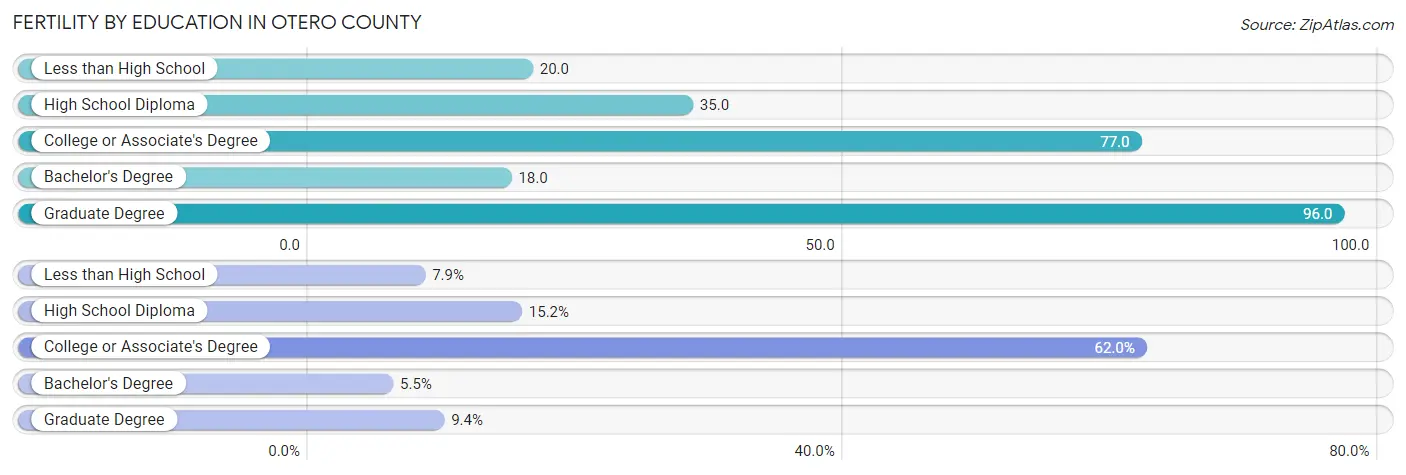
| Educational Attainment | Women with Births | Births / 1,000 Women |
| Less than High School | 56 (7.9%) | 20.0 |
| High School Diploma | 107 (15.2%) | 35.0 |
| College or Associate's Degree | 437 (62.0%) | 77.0 |
| Bachelor's Degree | 39 (5.5%) | 18.0 |
| Graduate Degree | 66 (9.4%) | 96.0 |
| Total | 705 (100.0%) | 49.0 |
Fertility by Education by Marriage Status in Otero County
34.2% of women with births in Otero County are unmarried. Women with the educational attainment of bachelor's degree are most likely to be married with 100.0% of them married at childbirth, while women with the educational attainment of less than high school are least likely to be married with 100.0% of them unmarried at childbirth.
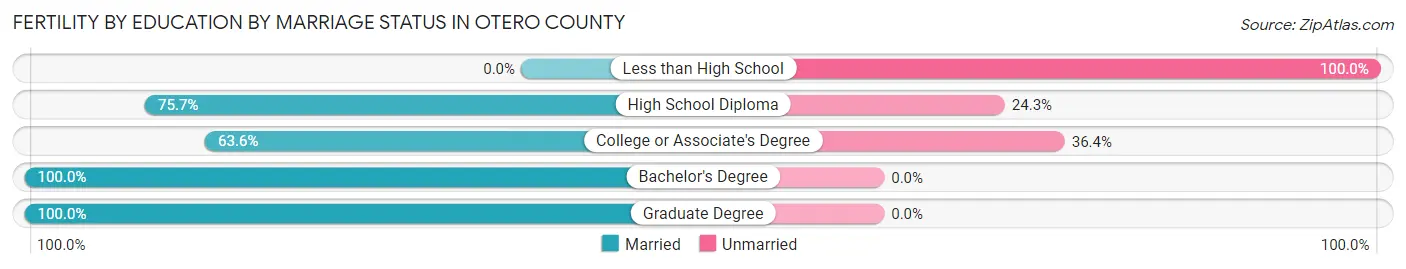
| Educational Attainment | Married | Unmarried |
| Less than High School | 0 (0.0%) | 56 (100.0%) |
| High School Diploma | 81 (75.7%) | 26 (24.3%) |
| College or Associate's Degree | 278 (63.6%) | 159 (36.4%) |
| Bachelor's Degree | 39 (100.0%) | 0 (0.0%) |
| Graduate Degree | 66 (100.0%) | 0 (0.0%) |
| Total | 464 (65.8%) | 241 (34.2%) |
Employment Characteristics in Otero County
Employment by Class of Employer in Otero County
Among the 26,803 employed individuals in Otero County, private company employees (12,815 | 47.8%), federal government employees (7,001 | 26.1%), and local government employees (2,044 | 7.6%) make up the most common classes of employment.
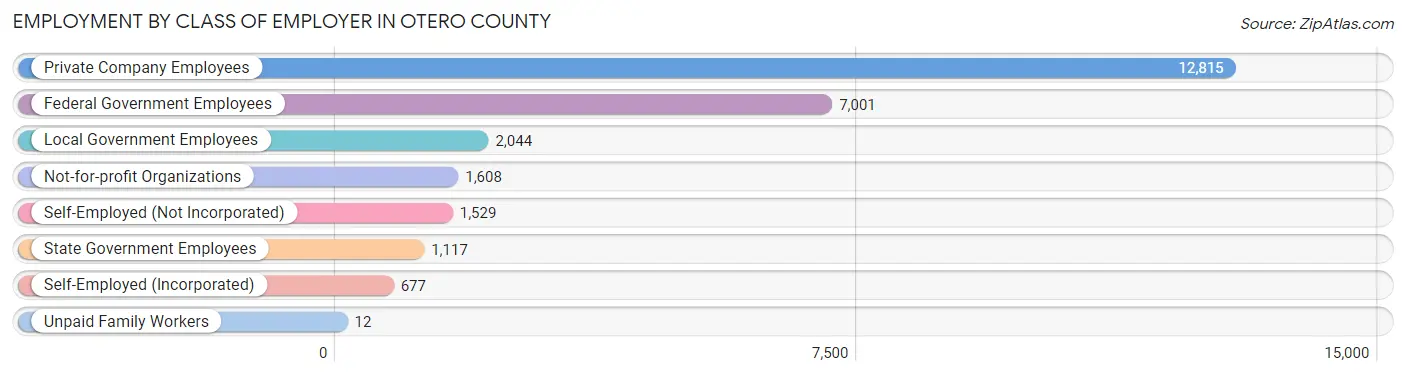
| Employer Class | # Employees | % Employees |
| Private Company Employees | 12,815 | 47.8% |
| Self-Employed (Incorporated) | 677 | 2.5% |
| Self-Employed (Not Incorporated) | 1,529 | 5.7% |
| Not-for-profit Organizations | 1,608 | 6.0% |
| Local Government Employees | 2,044 | 7.6% |
| State Government Employees | 1,117 | 4.2% |
| Federal Government Employees | 7,001 | 26.1% |
| Unpaid Family Workers | 12 | 0.0% |
| Total | 26,803 | 100.0% |
Employment Status by Age in Otero County
According to the labor force statistics for Otero County, out of the total population over 16 years of age (54,618), 54.1% or 29,548 individuals are in the labor force, with 9.6% or 2,837 of them unemployed. The age group with the highest labor force participation rate is 20 to 24 years, with 82.5% or 4,966 individuals in the labor force. Within the labor force, the 16 to 19 years age range has the highest percentage of unemployed individuals, with 30.4% or 444 of them being unemployed.

| Age Bracket | In Labor Force | Unemployed |
| 16 to 19 Years | 1,462 (38.2%) | 444 (30.4%) |
| 20 to 24 Years | 4,966 (82.5%) | 1,102 (22.2%) |
| 25 to 29 Years | 3,954 (73.5%) | 415 (10.5%) |
| 30 to 34 Years | 3,554 (73.0%) | 235 (6.6%) |
| 35 to 44 Years | 5,517 (68.5%) | 265 (4.8%) |
| 45 to 54 Years | 4,666 (68.8%) | 247 (5.3%) |
| 55 to 59 Years | 2,622 (62.1%) | 163 (6.2%) |
| 60 to 64 Years | 1,637 (41.7%) | 116 (7.1%) |
| 65 to 74 Years | 946 (14.1%) | 46 (4.9%) |
| 75 Years and over | 227 (4.7%) | 0 (0.0%) |
| Total | 29,548 (54.1%) | 2,837 (9.6%) |
Employment Status by Educational Attainment in Otero County
According to labor force statistics for Otero County, 66.0% of individuals (21,932) out of the total population between 25 and 64 years of age (33,231) are in the labor force, with 6.4% or 1,404 of them being unemployed. The group with the highest labor force participation rate are those with the educational attainment of bachelor's degree or higher, with 80.7% or 5,412 individuals in the labor force. Within the labor force, individuals with less than high school education have the highest percentage of unemployment, with 12.0% or 195 of them being unemployed.
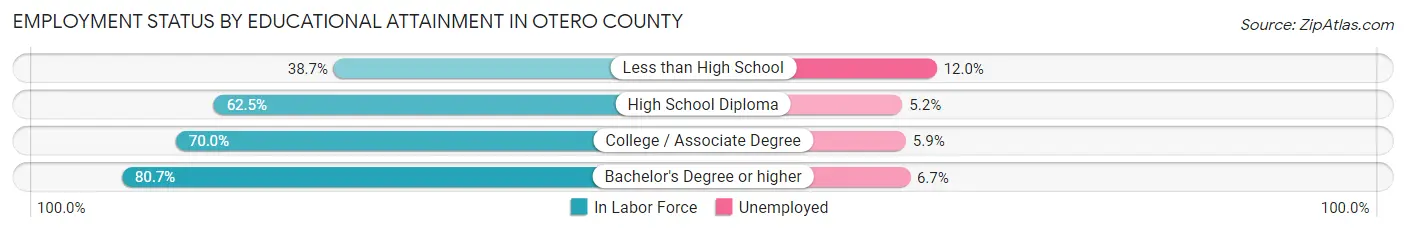
| Educational Attainment | In Labor Force | Unemployed |
| Less than High School | 1,627 (38.7%) | 505 (12.0%) |
| High School Diploma | 5,958 (62.5%) | 496 (5.2%) |
| College / Associate Degree | 8,951 (70.0%) | 754 (5.9%) |
| Bachelor's Degree or higher | 5,412 (80.7%) | 449 (6.7%) |
| Total | 21,932 (66.0%) | 2,127 (6.4%) |
Employment Occupations by Sex in Otero County
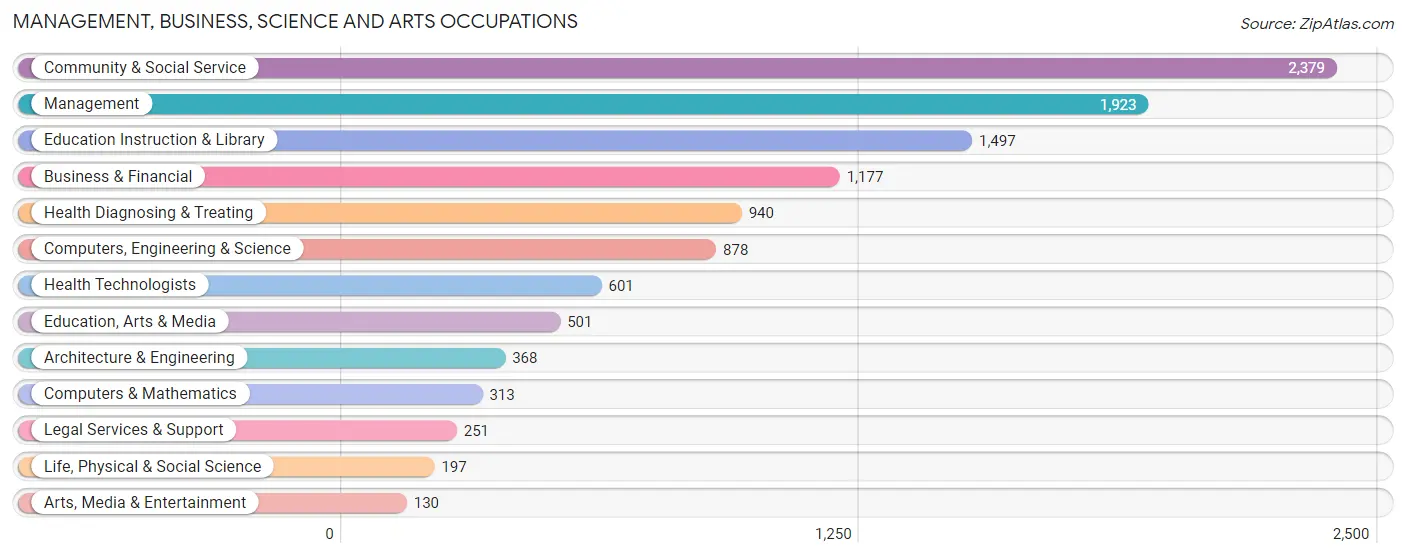
Management, Business, Science and Arts Occupations
The most common Management, Business, Science and Arts occupations in Otero County are Community & Social Service (2,379 | 10.3%), Management (1,923 | 8.3%), Education Instruction & Library (1,497 | 6.5%), Business & Financial (1,177 | 5.1%), and Health Diagnosing & Treating (940 | 4.1%).
Management, Business, Science and Arts Occupations by Sex
Within the Management, Business, Science and Arts occupations in Otero County, the most male-oriented occupations are Architecture & Engineering (86.1%), Computers, Engineering & Science (78.7%), and Computers & Mathematics (76.4%), while the most female-oriented occupations are Health Technologists (85.2%), Health Diagnosing & Treating (80.6%), and Education, Arts & Media (76.6%).
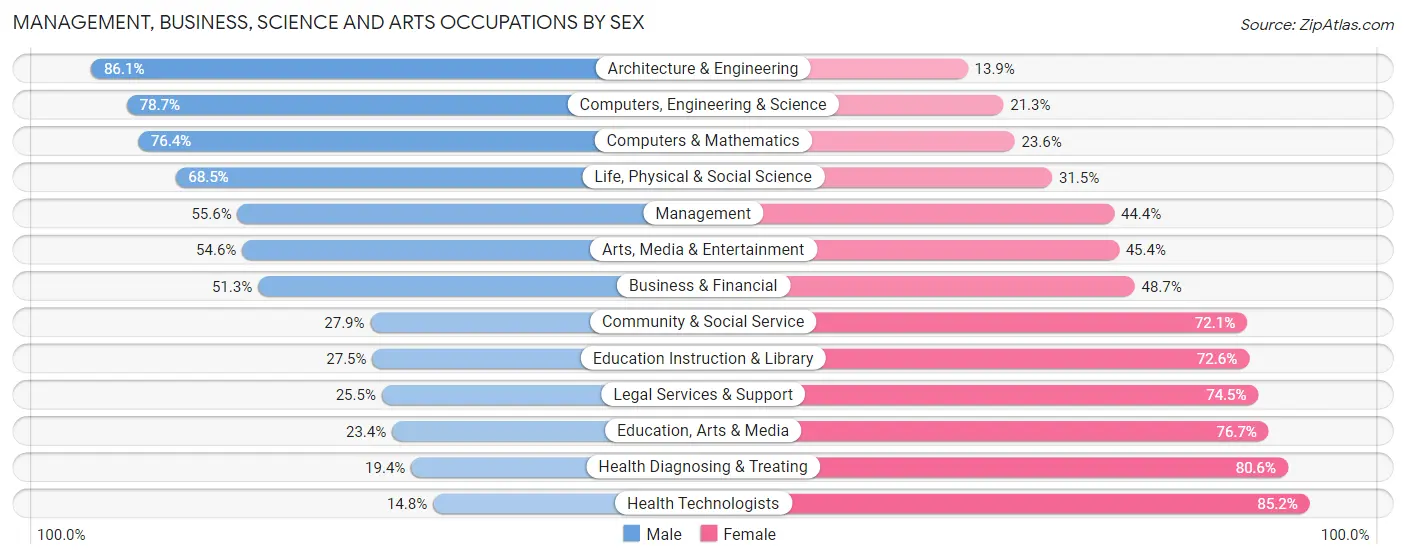
| Occupation | Male | Female |
| Management | 1,069 (55.6%) | 854 (44.4%) |
| Business & Financial | 604 (51.3%) | 573 (48.7%) |
| Computers, Engineering & Science | 691 (78.7%) | 187 (21.3%) |
| Computers & Mathematics | 239 (76.4%) | 74 (23.6%) |
| Architecture & Engineering | 317 (86.1%) | 51 (13.9%) |
| Life, Physical & Social Science | 135 (68.5%) | 62 (31.5%) |
| Community & Social Service | 663 (27.9%) | 1,716 (72.1%) |
| Education, Arts & Media | 117 (23.4%) | 384 (76.6%) |
| Legal Services & Support | 64 (25.5%) | 187 (74.5%) |
| Education Instruction & Library | 411 (27.5%) | 1,086 (72.6%) |
| Arts, Media & Entertainment | 71 (54.6%) | 59 (45.4%) |
| Health Diagnosing & Treating | 182 (19.4%) | 758 (80.6%) |
| Health Technologists | 89 (14.8%) | 512 (85.2%) |
| Total (Category) | 3,209 (44.0%) | 4,088 (56.0%) |
| Total (Overall) | 12,065 (52.3%) | 11,021 (47.7%) |
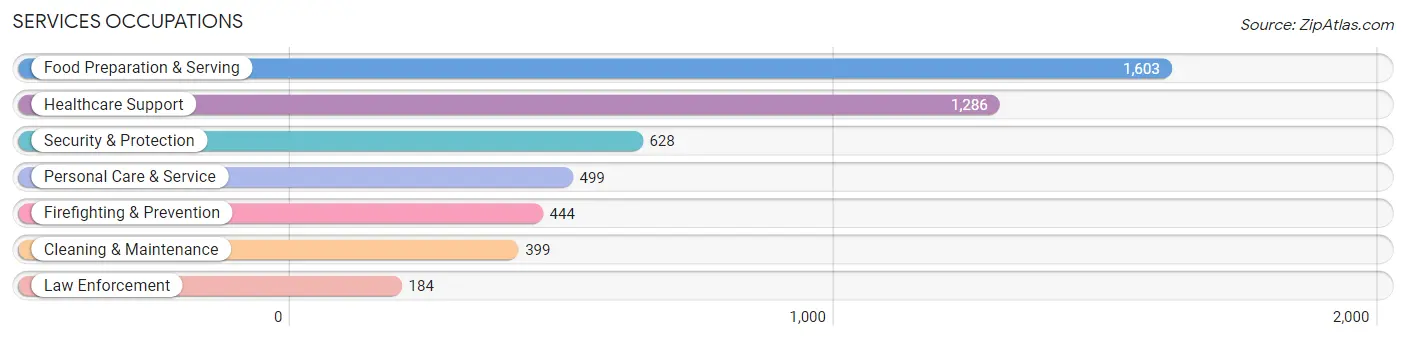
Services Occupations
The most common Services occupations in Otero County are Food Preparation & Serving (1,603 | 6.9%), Healthcare Support (1,286 | 5.6%), Security & Protection (628 | 2.7%), Personal Care & Service (499 | 2.2%), and Firefighting & Prevention (444 | 1.9%).
Services Occupations by Sex
Within the Services occupations in Otero County, the most male-oriented occupations are Law Enforcement (89.7%), Cleaning & Maintenance (63.7%), and Security & Protection (63.1%), while the most female-oriented occupations are Healthcare Support (70.5%), Personal Care & Service (65.9%), and Food Preparation & Serving (61.3%).
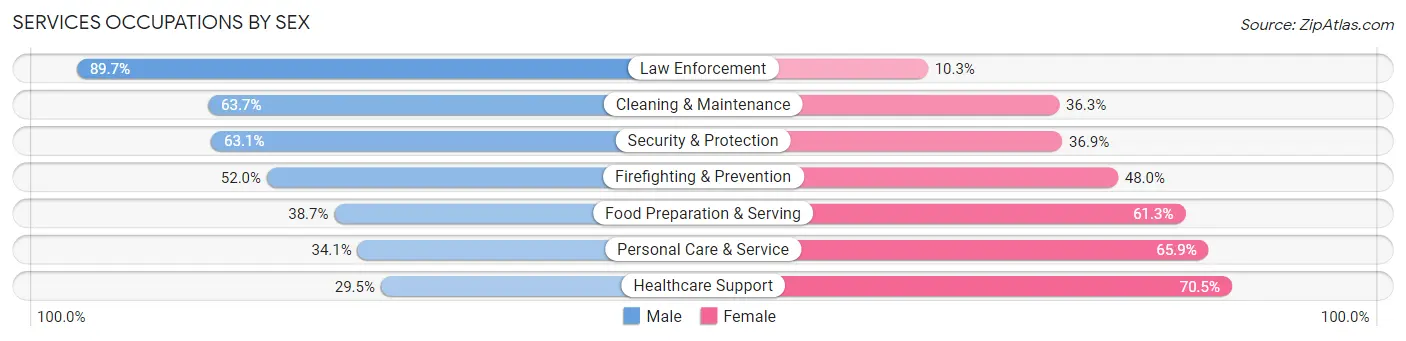
| Occupation | Male | Female |
| Healthcare Support | 379 (29.5%) | 907 (70.5%) |
| Security & Protection | 396 (63.1%) | 232 (36.9%) |
| Firefighting & Prevention | 231 (52.0%) | 213 (48.0%) |
| Law Enforcement | 165 (89.7%) | 19 (10.3%) |
| Food Preparation & Serving | 620 (38.7%) | 983 (61.3%) |
| Cleaning & Maintenance | 254 (63.7%) | 145 (36.3%) |
| Personal Care & Service | 170 (34.1%) | 329 (65.9%) |
| Total (Category) | 1,819 (41.2%) | 2,596 (58.8%) |
| Total (Overall) | 12,065 (52.3%) | 11,021 (47.7%) |
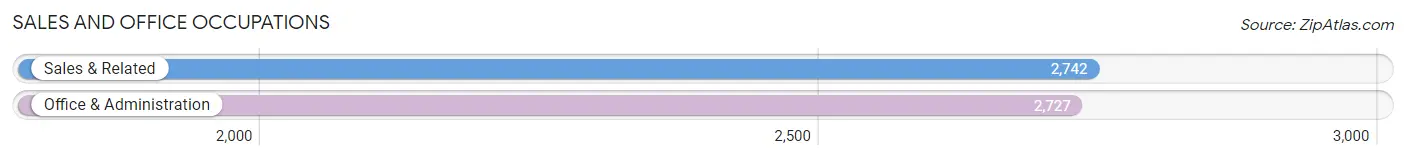
Sales and Office Occupations
The most common Sales and Office occupations in Otero County are Sales & Related (2,742 | 11.9%), and Office & Administration (2,727 | 11.8%).
Sales and Office Occupations by Sex
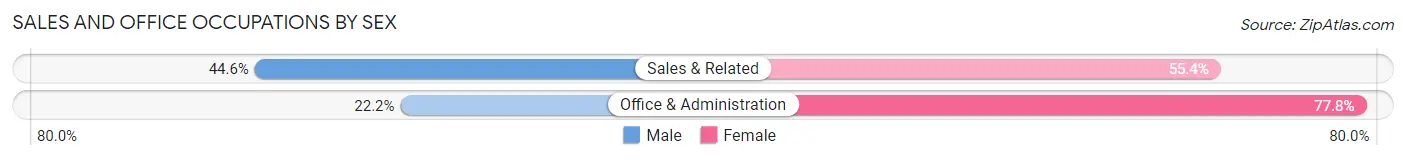
| Occupation | Male | Female |
| Sales & Related | 1,223 (44.6%) | 1,519 (55.4%) |
| Office & Administration | 605 (22.2%) | 2,122 (77.8%) |
| Total (Category) | 1,828 (33.4%) | 3,641 (66.6%) |
| Total (Overall) | 12,065 (52.3%) | 11,021 (47.7%) |
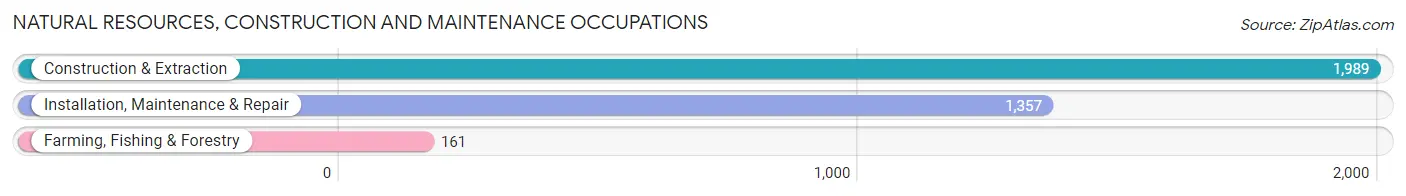
Natural Resources, Construction and Maintenance Occupations
The most common Natural Resources, Construction and Maintenance occupations in Otero County are Construction & Extraction (1,989 | 8.6%), Installation, Maintenance & Repair (1,357 | 5.9%), and Farming, Fishing & Forestry (161 | 0.7%).
Natural Resources, Construction and Maintenance Occupations by Sex
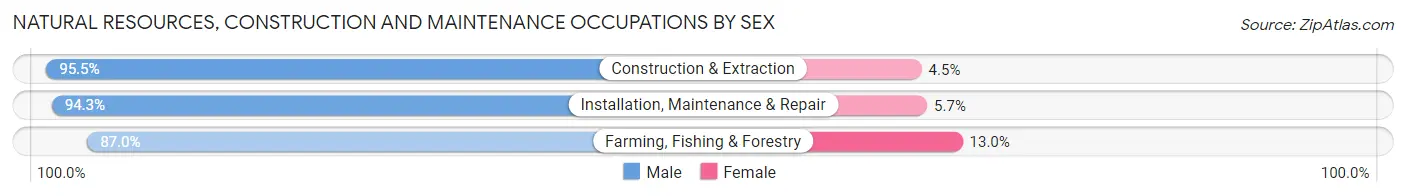
| Occupation | Male | Female |
| Farming, Fishing & Forestry | 140 (87.0%) | 21 (13.0%) |
| Construction & Extraction | 1,899 (95.5%) | 90 (4.5%) |
| Installation, Maintenance & Repair | 1,280 (94.3%) | 77 (5.7%) |
| Total (Category) | 3,319 (94.6%) | 188 (5.4%) |
| Total (Overall) | 12,065 (52.3%) | 11,021 (47.7%) |
Production, Transportation and Moving Occupations
The most common Production, Transportation and Moving occupations in Otero County are Transportation (1,148 | 5.0%), Material Moving (654 | 2.8%), and Production (596 | 2.6%).
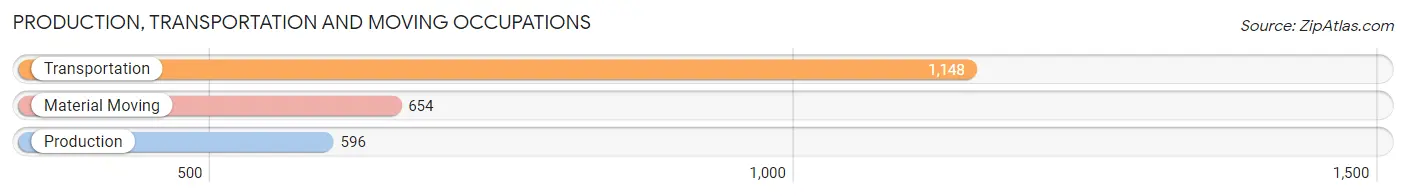
Production, Transportation and Moving Occupations by Sex
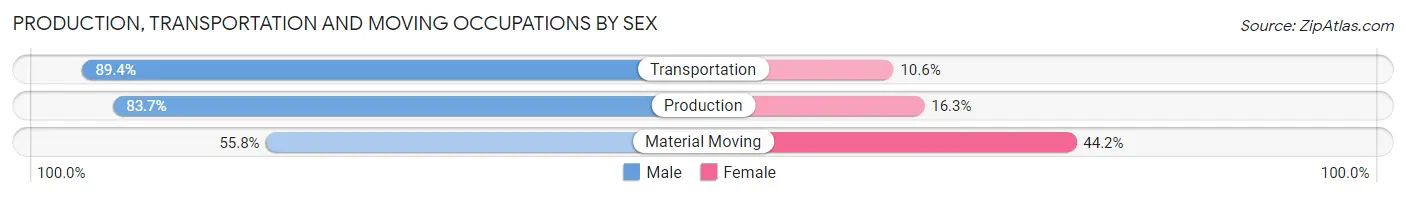
| Occupation | Male | Female |
| Production | 499 (83.7%) | 97 (16.3%) |
| Transportation | 1,026 (89.4%) | 122 (10.6%) |
| Material Moving | 365 (55.8%) | 289 (44.2%) |
| Total (Category) | 1,890 (78.8%) | 508 (21.2%) |
| Total (Overall) | 12,065 (52.3%) | 11,021 (47.7%) |
Employment Industries by Sex in Otero County
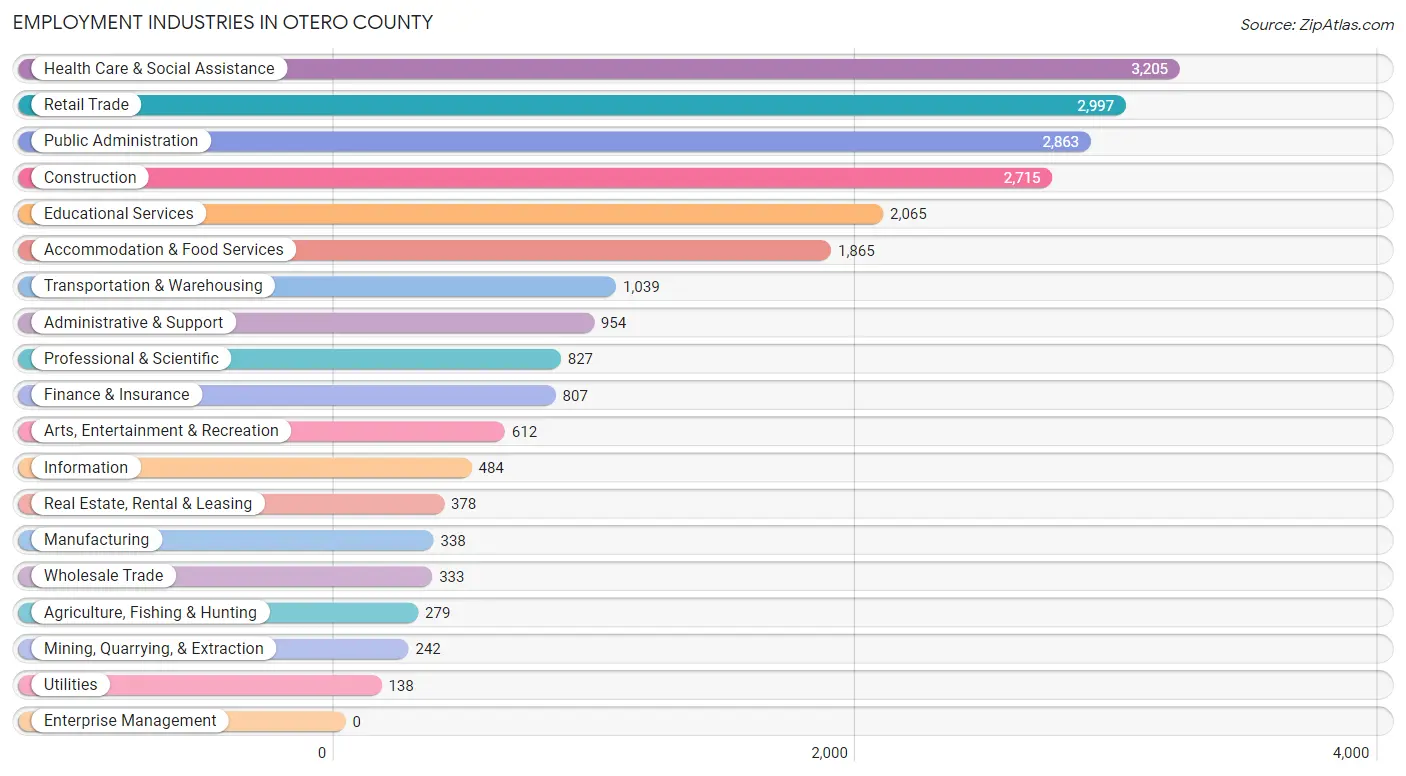
Employment Industries in Otero County
The major employment industries in Otero County include Health Care & Social Assistance (3,205 | 13.9%), Retail Trade (2,997 | 13.0%), Public Administration (2,863 | 12.4%), Construction (2,715 | 11.8%), and Educational Services (2,065 | 8.9%).
Employment Industries by Sex in Otero County
The Otero County industries that see more men than women are Construction (96.8%), Utilities (89.1%), and Manufacturing (87.3%), whereas the industries that tend to have a higher number of women are Health Care & Social Assistance (79.0%), Educational Services (72.6%), and Finance & Insurance (71.0%).
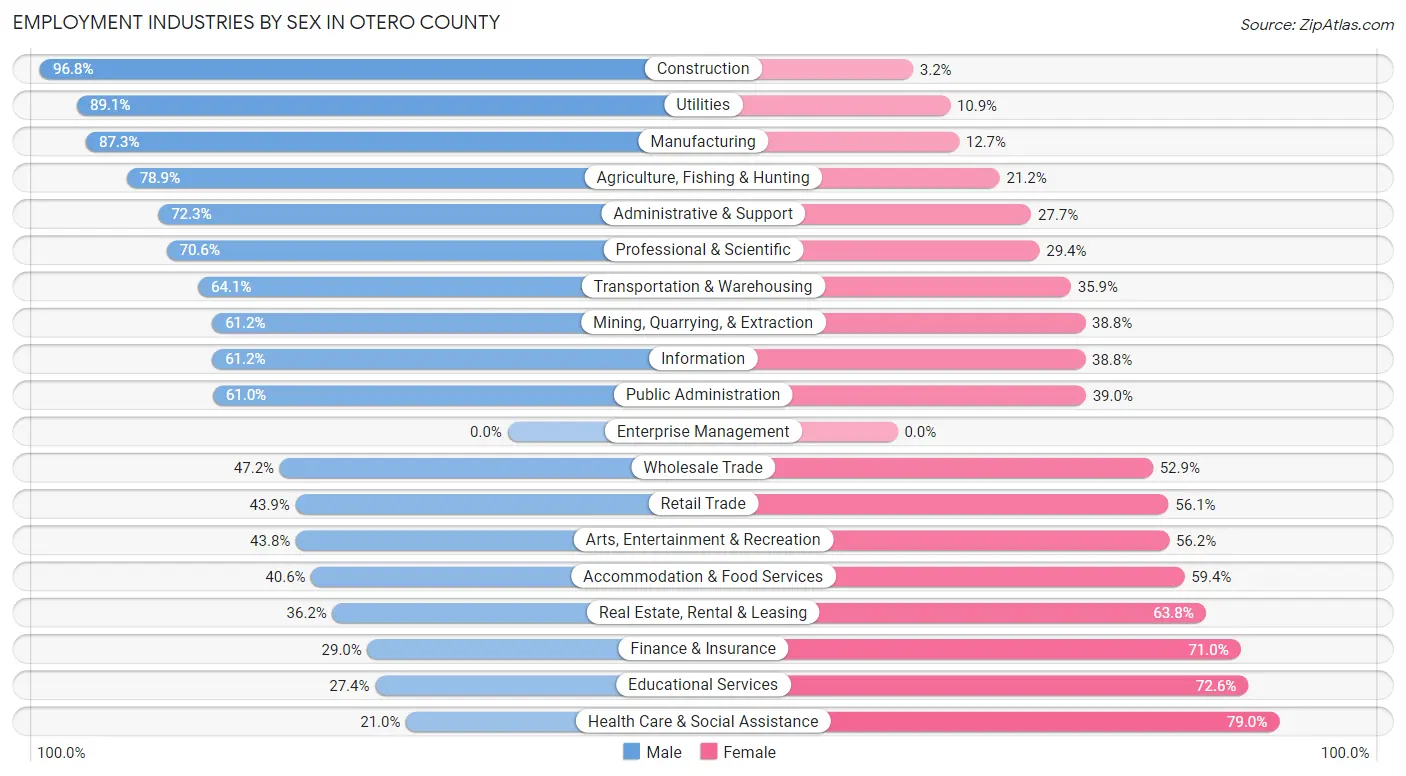
| Industry | Male | Female |
| Agriculture, Fishing & Hunting | 220 (78.8%) | 59 (21.1%) |
| Mining, Quarrying, & Extraction | 148 (61.2%) | 94 (38.8%) |
| Construction | 2,628 (96.8%) | 87 (3.2%) |
| Manufacturing | 295 (87.3%) | 43 (12.7%) |
| Wholesale Trade | 157 (47.1%) | 176 (52.8%) |
| Retail Trade | 1,316 (43.9%) | 1,681 (56.1%) |
| Transportation & Warehousing | 666 (64.1%) | 373 (35.9%) |
| Utilities | 123 (89.1%) | 15 (10.9%) |
| Information | 296 (61.2%) | 188 (38.8%) |
| Finance & Insurance | 234 (29.0%) | 573 (71.0%) |
| Real Estate, Rental & Leasing | 137 (36.2%) | 241 (63.8%) |
| Professional & Scientific | 584 (70.6%) | 243 (29.4%) |
| Enterprise Management | 0 (0.0%) | 0 (0.0%) |
| Administrative & Support | 690 (72.3%) | 264 (27.7%) |
| Educational Services | 566 (27.4%) | 1,499 (72.6%) |
| Health Care & Social Assistance | 673 (21.0%) | 2,532 (79.0%) |
| Arts, Entertainment & Recreation | 268 (43.8%) | 344 (56.2%) |
| Accommodation & Food Services | 758 (40.6%) | 1,107 (59.4%) |
| Public Administration | 1,747 (61.0%) | 1,116 (39.0%) |
| Total | 12,065 (52.3%) | 11,021 (47.7%) |
Education in Otero County
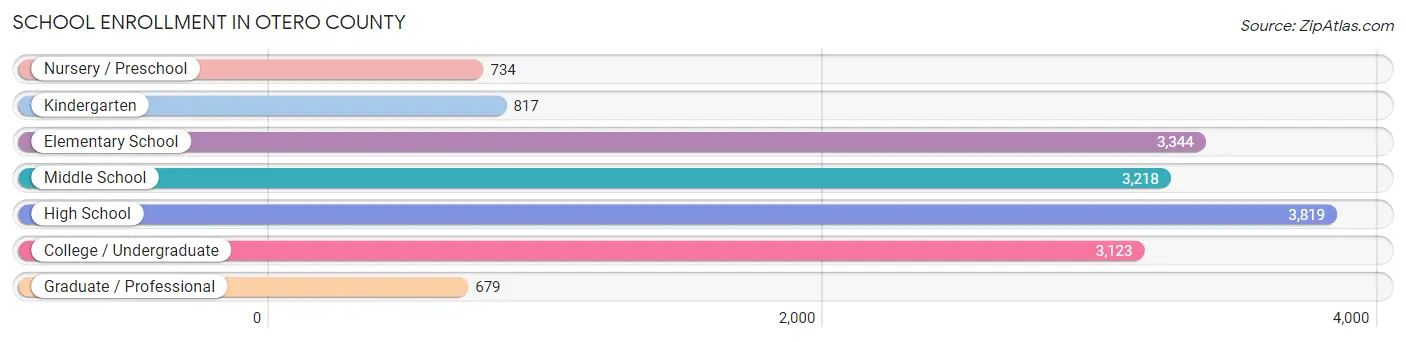
School Enrollment in Otero County
The most common levels of schooling among the 15,734 students in Otero County are high school (3,819 | 24.3%), elementary school (3,344 | 21.2%), and middle school (3,218 | 20.4%).
| School Level | # Students | % Students |
| Nursery / Preschool | 734 | 4.7% |
| Kindergarten | 817 | 5.2% |
| Elementary School | 3,344 | 21.2% |
| Middle School | 3,218 | 20.4% |
| High School | 3,819 | 24.3% |
| College / Undergraduate | 3,123 | 19.9% |
| Graduate / Professional | 679 | 4.3% |
| Total | 15,734 | 100.0% |
School Enrollment by Age by Funding Source in Otero County
Out of a total of 15,734 students who are enrolled in schools in Otero County, 2,171 (13.8%) attend a private institution, while the remaining 13,563 (86.2%) are enrolled in public schools. The age group of 20 to 24 year olds has the highest likelihood of being enrolled in private schools, with 614 (38.8% in the age bracket) enrolled. Conversely, the age group of 18 to 19 year olds has the lowest likelihood of being enrolled in a private school, with 998 (96.1% in the age bracket) attending a public institution.
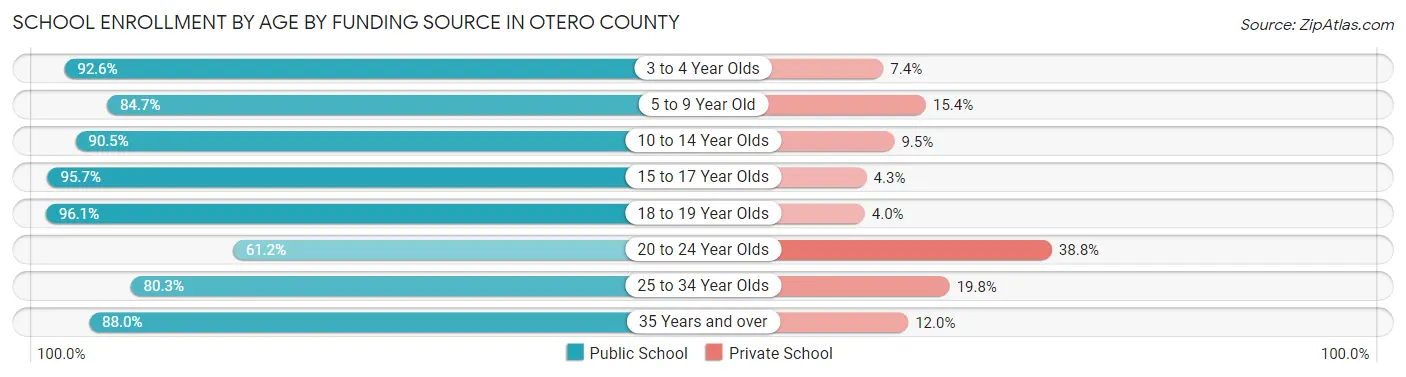
| Age Bracket | Public School | Private School |
| 3 to 4 Year Olds | 413 (92.6%) | 33 (7.4%) |
| 5 to 9 Year Old | 3,517 (84.7%) | 638 (15.3%) |
| 10 to 14 Year Olds | 3,388 (90.5%) | 354 (9.5%) |
| 15 to 17 Year Olds | 2,259 (95.7%) | 101 (4.3%) |
| 18 to 19 Year Olds | 998 (96.1%) | 41 (4.0%) |
| 20 to 24 Year Olds | 969 (61.2%) | 614 (38.8%) |
| 25 to 34 Year Olds | 1,073 (80.2%) | 264 (19.8%) |
| 35 Years and over | 943 (88.0%) | 129 (12.0%) |
| Total | 13,563 (86.2%) | 2,171 (13.8%) |
Educational Attainment by Field of Study in Otero County
Education (1,818 | 17.9%), business (1,769 | 17.4%), engineering (1,039 | 10.2%), arts & humanities (967 | 9.5%), and science & technology (852 | 8.4%) are the most common fields of study among 10,170 individuals in Otero County who have obtained a bachelor's degree or higher.
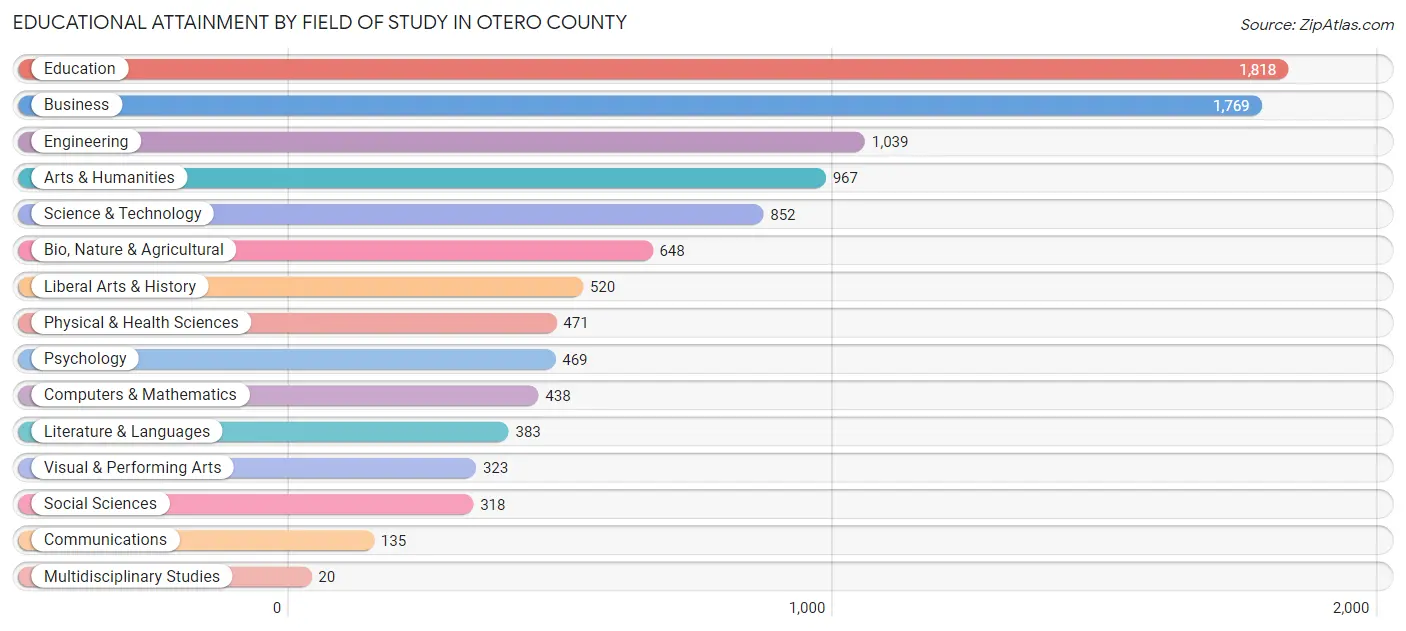
| Field of Study | # Graduates | % Graduates |
| Computers & Mathematics | 438 | 4.3% |
| Bio, Nature & Agricultural | 648 | 6.4% |
| Physical & Health Sciences | 471 | 4.6% |
| Psychology | 469 | 4.6% |
| Social Sciences | 318 | 3.1% |
| Engineering | 1,039 | 10.2% |
| Multidisciplinary Studies | 20 | 0.2% |
| Science & Technology | 852 | 8.4% |
| Business | 1,769 | 17.4% |
| Education | 1,818 | 17.9% |
| Literature & Languages | 383 | 3.8% |
| Liberal Arts & History | 520 | 5.1% |
| Visual & Performing Arts | 323 | 3.2% |
| Communications | 135 | 1.3% |
| Arts & Humanities | 967 | 9.5% |
| Total | 10,170 | 100.0% |
Transportation & Commute in Otero County
Vehicle Availability by Sex in Otero County
The most prevalent vehicle ownership categories in Otero County are males with 2 vehicles (5,838, accounting for 40.9%) and females with 2 vehicles (4,780, making up 51.0%).
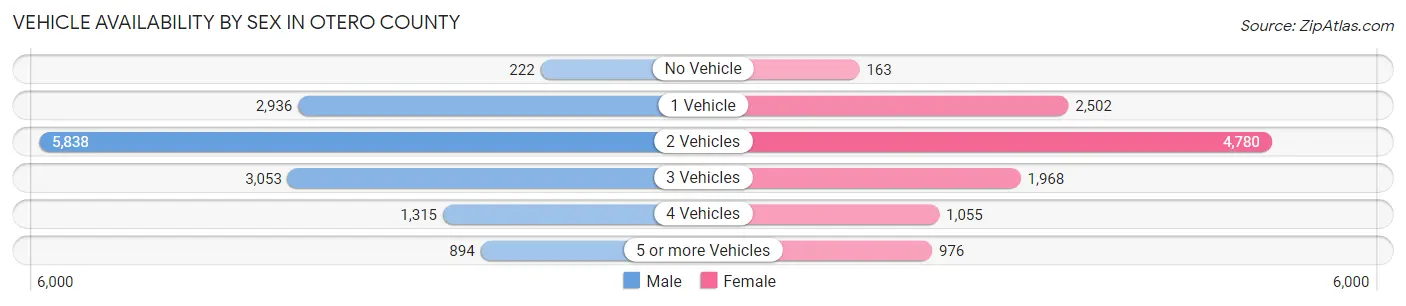
| Vehicles Available | Male | Female |
| No Vehicle | 222 (1.6%) | 163 (1.4%) |
| 1 Vehicle | 2,936 (20.6%) | 2,502 (21.9%) |
| 2 Vehicles | 5,838 (40.9%) | 4,780 (41.8%) |
| 3 Vehicles | 3,053 (21.4%) | 1,968 (17.2%) |
| 4 Vehicles | 1,315 (9.2%) | 1,055 (9.2%) |
| 5 or more Vehicles | 894 (6.3%) | 976 (8.5%) |
| Total | 14,258 (100.0%) | 11,444 (100.0%) |
Commute Time in Otero County
The most frequently occuring commute durations in Otero County are 5 to 9 minutes (4,901 commuters, 19.2%), 15 to 19 minutes (4,489 commuters, 17.6%), and 10 to 14 minutes (4,025 commuters, 15.8%).
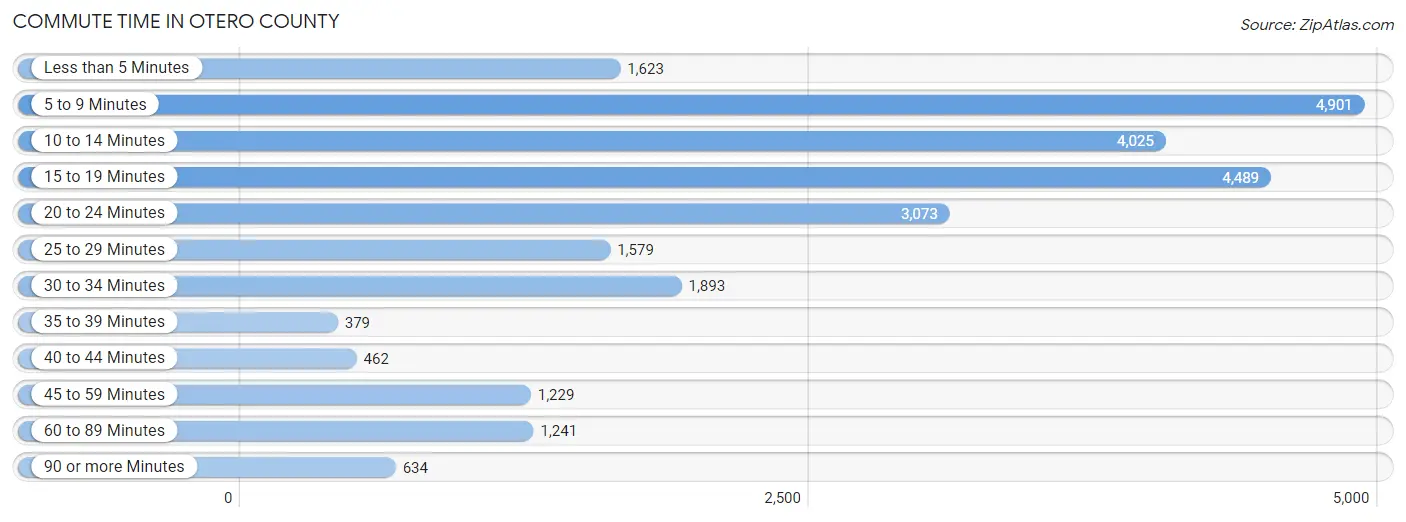
| Commute Time | # Commuters | % Commuters |
| Less than 5 Minutes | 1,623 | 6.4% |
| 5 to 9 Minutes | 4,901 | 19.2% |
| 10 to 14 Minutes | 4,025 | 15.8% |
| 15 to 19 Minutes | 4,489 | 17.6% |
| 20 to 24 Minutes | 3,073 | 12.0% |
| 25 to 29 Minutes | 1,579 | 6.2% |
| 30 to 34 Minutes | 1,893 | 7.4% |
| 35 to 39 Minutes | 379 | 1.5% |
| 40 to 44 Minutes | 462 | 1.8% |
| 45 to 59 Minutes | 1,229 | 4.8% |
| 60 to 89 Minutes | 1,241 | 4.9% |
| 90 or more Minutes | 634 | 2.5% |
Commute Time by Sex in Otero County
The most common commute times in Otero County are 5 to 9 minutes (2,691 commuters, 18.3%) for males and 5 to 9 minutes (2,210 commuters, 20.4%) for females.
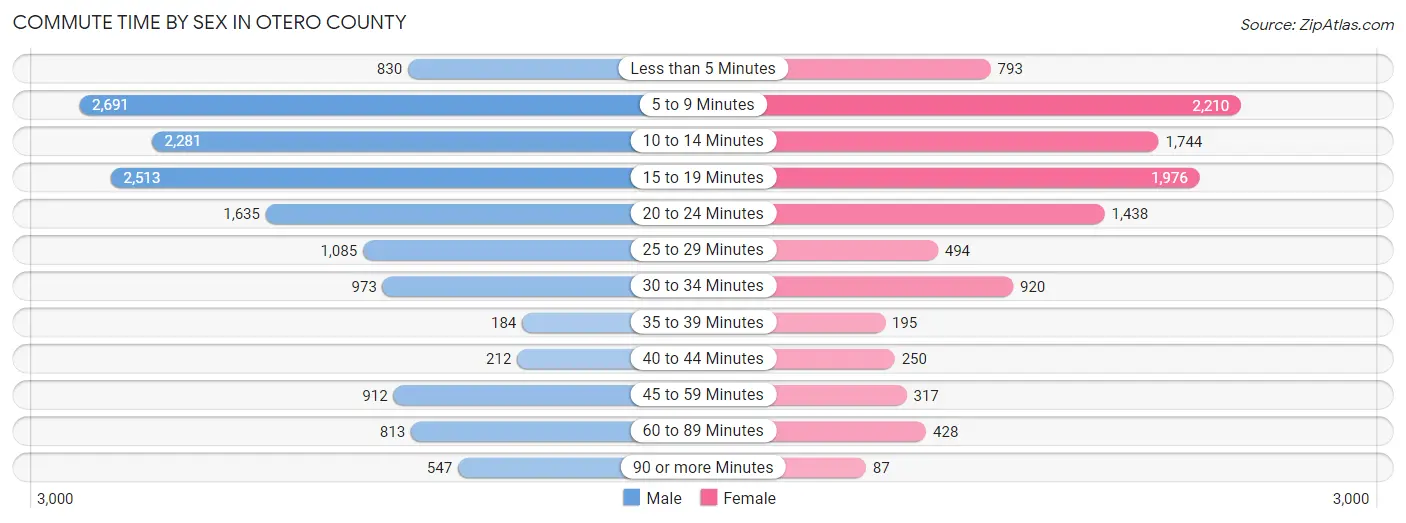
| Commute Time | Male | Female |
| Less than 5 Minutes | 830 (5.7%) | 793 (7.3%) |
| 5 to 9 Minutes | 2,691 (18.3%) | 2,210 (20.4%) |
| 10 to 14 Minutes | 2,281 (15.5%) | 1,744 (16.1%) |
| 15 to 19 Minutes | 2,513 (17.1%) | 1,976 (18.2%) |
| 20 to 24 Minutes | 1,635 (11.1%) | 1,438 (13.3%) |
| 25 to 29 Minutes | 1,085 (7.4%) | 494 (4.5%) |
| 30 to 34 Minutes | 973 (6.6%) | 920 (8.5%) |
| 35 to 39 Minutes | 184 (1.3%) | 195 (1.8%) |
| 40 to 44 Minutes | 212 (1.4%) | 250 (2.3%) |
| 45 to 59 Minutes | 912 (6.2%) | 317 (2.9%) |
| 60 to 89 Minutes | 813 (5.5%) | 428 (3.9%) |
| 90 or more Minutes | 547 (3.7%) | 87 (0.8%) |
Time of Departure to Work by Sex in Otero County
The most frequent times of departure to work in Otero County are 6:30 AM to 6:59 AM (2,310, 15.7%) for males and 7:30 AM to 7:59 AM (1,767, 16.3%) for females.
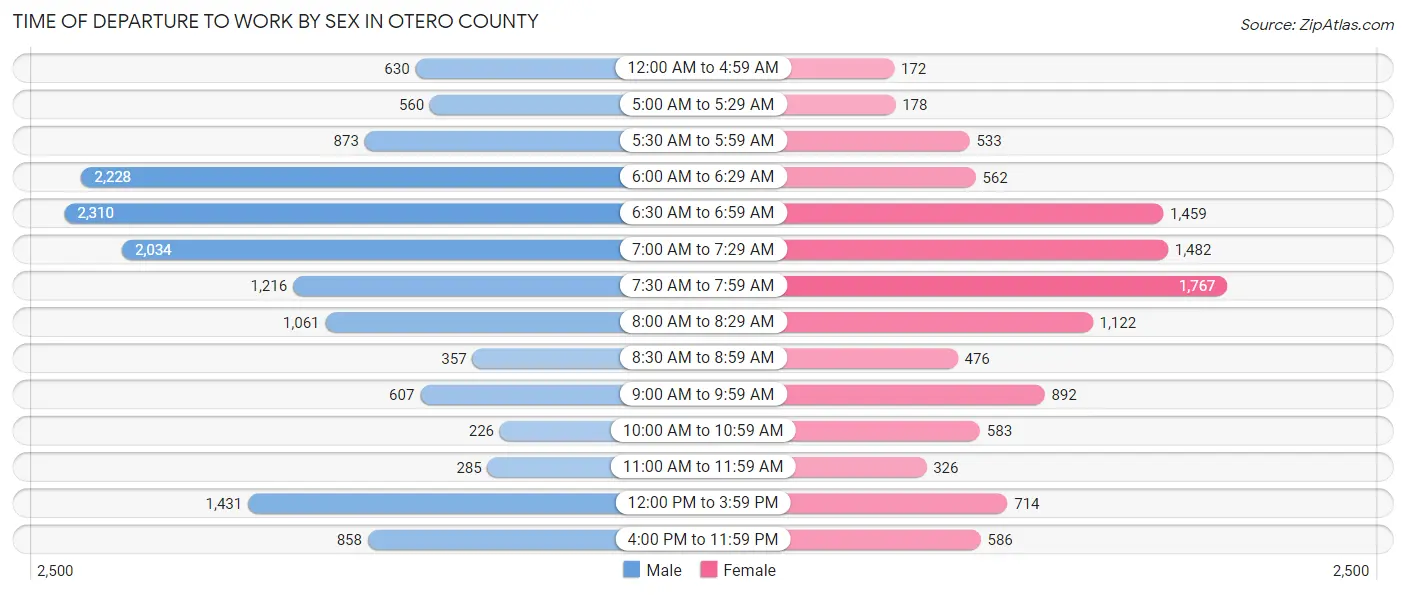
| Time of Departure | Male | Female |
| 12:00 AM to 4:59 AM | 630 (4.3%) | 172 (1.6%) |
| 5:00 AM to 5:29 AM | 560 (3.8%) | 178 (1.6%) |
| 5:30 AM to 5:59 AM | 873 (5.9%) | 533 (4.9%) |
| 6:00 AM to 6:29 AM | 2,228 (15.2%) | 562 (5.2%) |
| 6:30 AM to 6:59 AM | 2,310 (15.7%) | 1,459 (13.4%) |
| 7:00 AM to 7:29 AM | 2,034 (13.9%) | 1,482 (13.7%) |
| 7:30 AM to 7:59 AM | 1,216 (8.3%) | 1,767 (16.3%) |
| 8:00 AM to 8:29 AM | 1,061 (7.2%) | 1,122 (10.3%) |
| 8:30 AM to 8:59 AM | 357 (2.4%) | 476 (4.4%) |
| 9:00 AM to 9:59 AM | 607 (4.1%) | 892 (8.2%) |
| 10:00 AM to 10:59 AM | 226 (1.5%) | 583 (5.4%) |
| 11:00 AM to 11:59 AM | 285 (1.9%) | 326 (3.0%) |
| 12:00 PM to 3:59 PM | 1,431 (9.8%) | 714 (6.6%) |
| 4:00 PM to 11:59 PM | 858 (5.9%) | 586 (5.4%) |
| Total | 14,676 (100.0%) | 10,852 (100.0%) |
Housing Occupancy in Otero County
Occupancy by Ownership in Otero County
Of the total 23,832 dwellings in Otero County, owner-occupied units account for 15,649 (65.7%), while renter-occupied units make up 8,183 (34.3%).
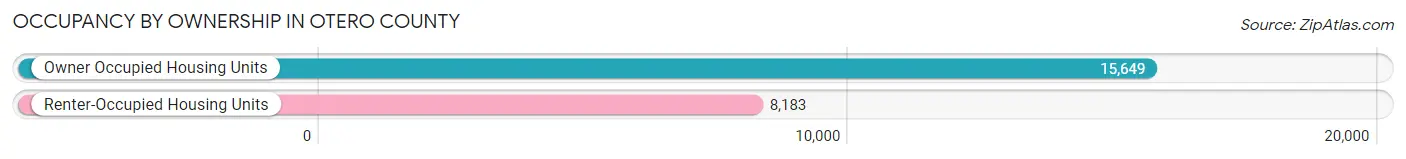
| Occupancy | # Housing Units | % Housing Units |
| Owner Occupied Housing Units | 15,649 | 65.7% |
| Renter-Occupied Housing Units | 8,183 | 34.3% |
| Total Occupied Housing Units | 23,832 | 100.0% |
Occupancy by Household Size in Otero County
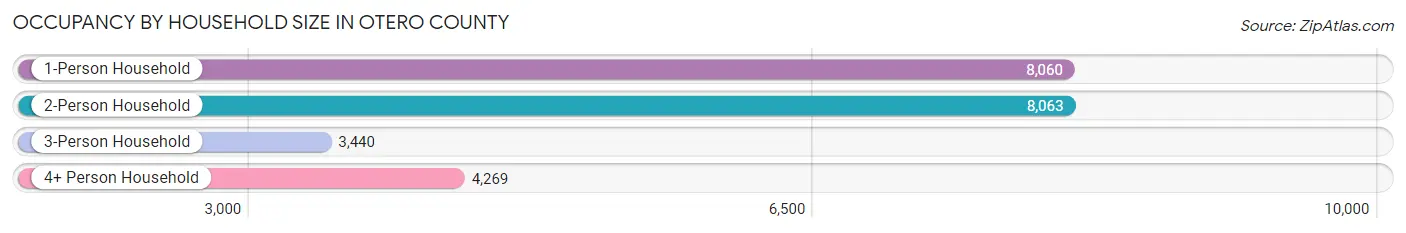
| Household Size | # Housing Units | % Housing Units |
| 1-Person Household | 8,060 | 33.8% |
| 2-Person Household | 8,063 | 33.8% |
| 3-Person Household | 3,440 | 14.4% |
| 4+ Person Household | 4,269 | 17.9% |
| Total Housing Units | 23,832 | 100.0% |
Occupancy by Ownership by Household Size in Otero County
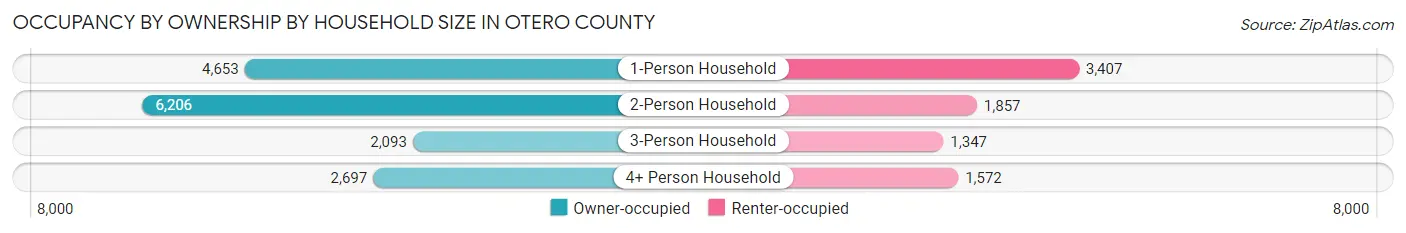
| Household Size | Owner-occupied | Renter-occupied |
| 1-Person Household | 4,653 (57.7%) | 3,407 (42.3%) |
| 2-Person Household | 6,206 (77.0%) | 1,857 (23.0%) |
| 3-Person Household | 2,093 (60.8%) | 1,347 (39.2%) |
| 4+ Person Household | 2,697 (63.2%) | 1,572 (36.8%) |
| Total Housing Units | 15,649 (65.7%) | 8,183 (34.3%) |
Occupancy by Educational Attainment in Otero County
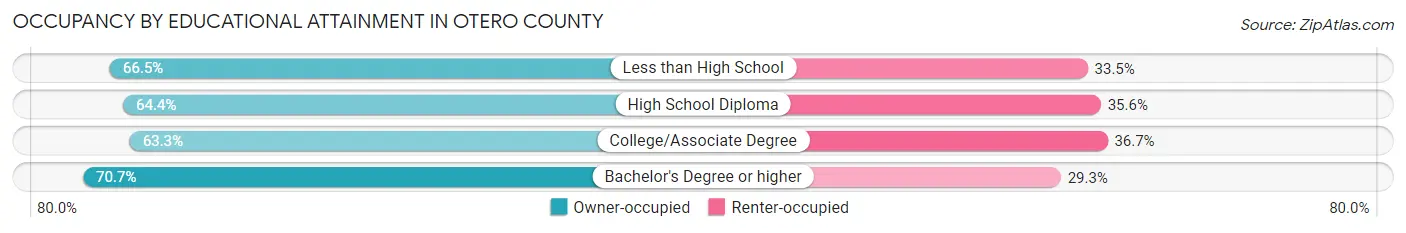
| Household Size | Owner-occupied | Renter-occupied |
| Less than High School | 1,298 (66.5%) | 655 (33.5%) |
| High School Diploma | 4,090 (64.4%) | 2,263 (35.6%) |
| College/Associate Degree | 6,156 (63.3%) | 3,566 (36.7%) |
| Bachelor's Degree or higher | 4,105 (70.7%) | 1,699 (29.3%) |
Occupancy by Age of Householder in Otero County
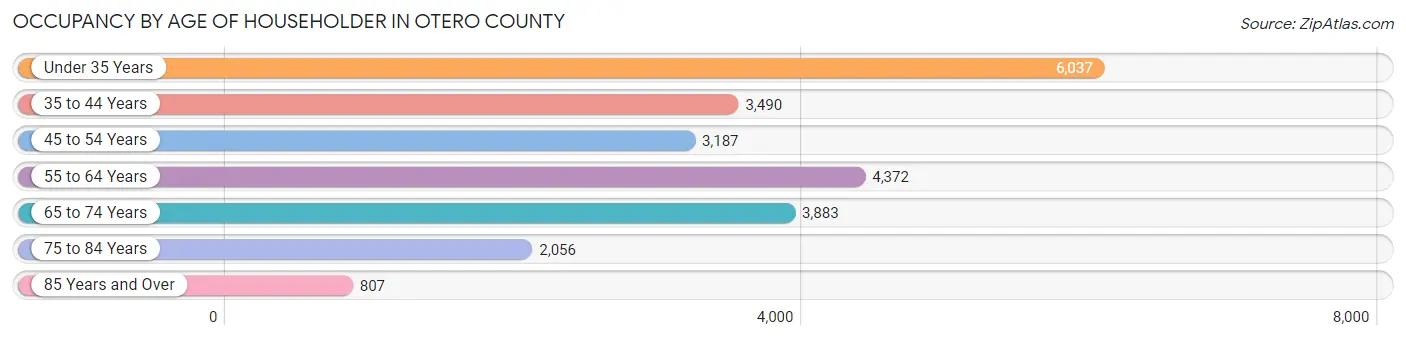
| Age Bracket | # Households | % Households |
| Under 35 Years | 6,037 | 25.3% |
| 35 to 44 Years | 3,490 | 14.6% |
| 45 to 54 Years | 3,187 | 13.4% |
| 55 to 64 Years | 4,372 | 18.3% |
| 65 to 74 Years | 3,883 | 16.3% |
| 75 to 84 Years | 2,056 | 8.6% |
| 85 Years and Over | 807 | 3.4% |
| Total | 23,832 | 100.0% |
Housing Finances in Otero County
Median Income by Occupancy in Otero County
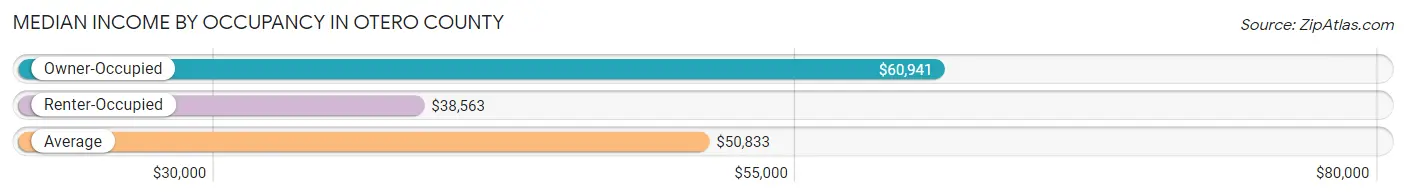
| Occupancy Type | # Households | Median Income |
| Owner-Occupied | 15,649 (65.7%) | $60,941 |
| Renter-Occupied | 8,183 (34.3%) | $38,563 |
| Average | 23,832 (100.0%) | $50,833 |
Occupancy by Householder Income Bracket in Otero County
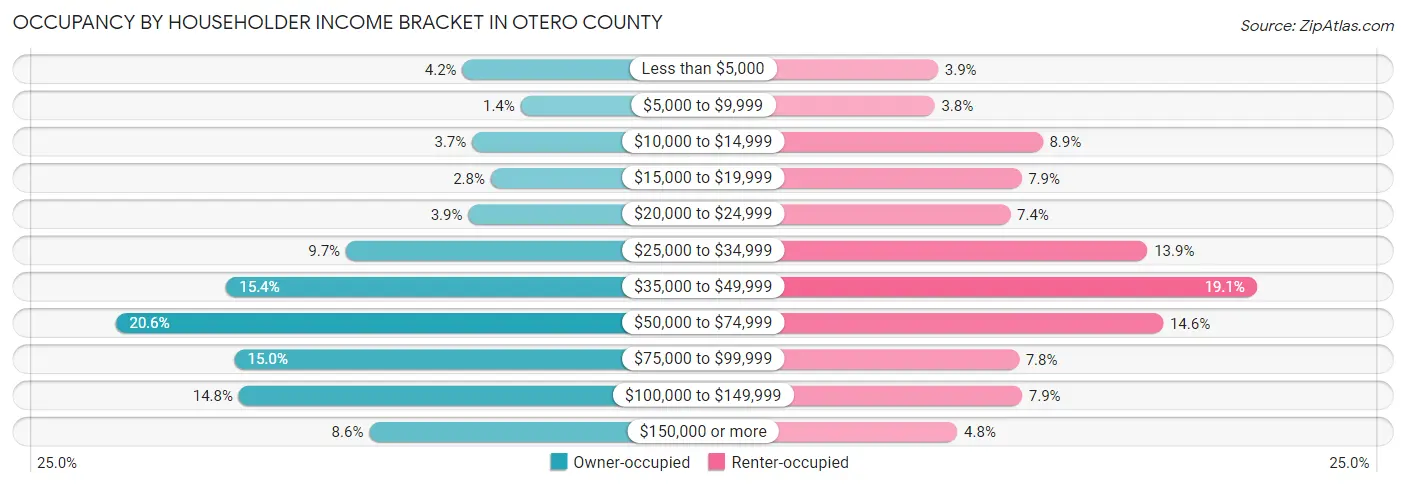
| Income Bracket | Owner-occupied | Renter-occupied |
| Less than $5,000 | 649 (4.2%) | 321 (3.9%) |
| $5,000 to $9,999 | 216 (1.4%) | 308 (3.8%) |
| $10,000 to $14,999 | 578 (3.7%) | 728 (8.9%) |
| $15,000 to $19,999 | 438 (2.8%) | 646 (7.9%) |
| $20,000 to $24,999 | 605 (3.9%) | 602 (7.4%) |
| $25,000 to $34,999 | 1,518 (9.7%) | 1,137 (13.9%) |
| $35,000 to $49,999 | 2,409 (15.4%) | 1,563 (19.1%) |
| $50,000 to $74,999 | 3,228 (20.6%) | 1,198 (14.6%) |
| $75,000 to $99,999 | 2,347 (15.0%) | 636 (7.8%) |
| $100,000 to $149,999 | 2,316 (14.8%) | 648 (7.9%) |
| $150,000 or more | 1,345 (8.6%) | 396 (4.8%) |
| Total | 15,649 (100.0%) | 8,183 (100.0%) |
Monthly Housing Cost Tiers in Otero County
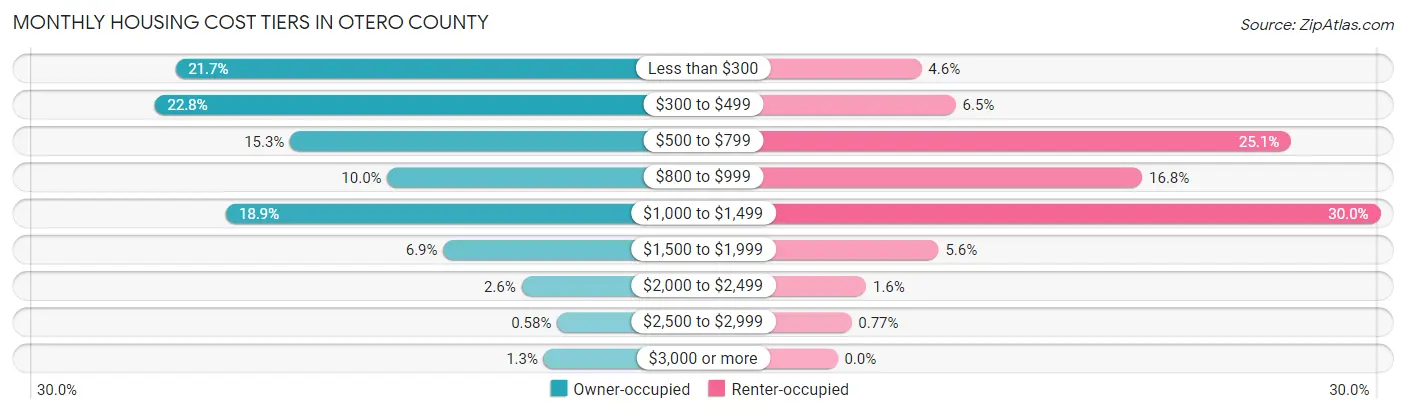
| Monthly Cost | Owner-occupied | Renter-occupied |
| Less than $300 | 3,393 (21.7%) | 380 (4.6%) |
| $300 to $499 | 3,573 (22.8%) | 534 (6.5%) |
| $500 to $799 | 2,399 (15.3%) | 2,051 (25.1%) |
| $800 to $999 | 1,559 (10.0%) | 1,377 (16.8%) |
| $1,000 to $1,499 | 2,954 (18.9%) | 2,454 (30.0%) |
| $1,500 to $1,999 | 1,075 (6.9%) | 457 (5.6%) |
| $2,000 to $2,499 | 399 (2.5%) | 129 (1.6%) |
| $2,500 to $2,999 | 90 (0.6%) | 63 (0.8%) |
| $3,000 or more | 207 (1.3%) | 0 (0.0%) |
| Total | 15,649 (100.0%) | 8,183 (100.0%) |
Physical Housing Characteristics in Otero County
Housing Structures in Otero County
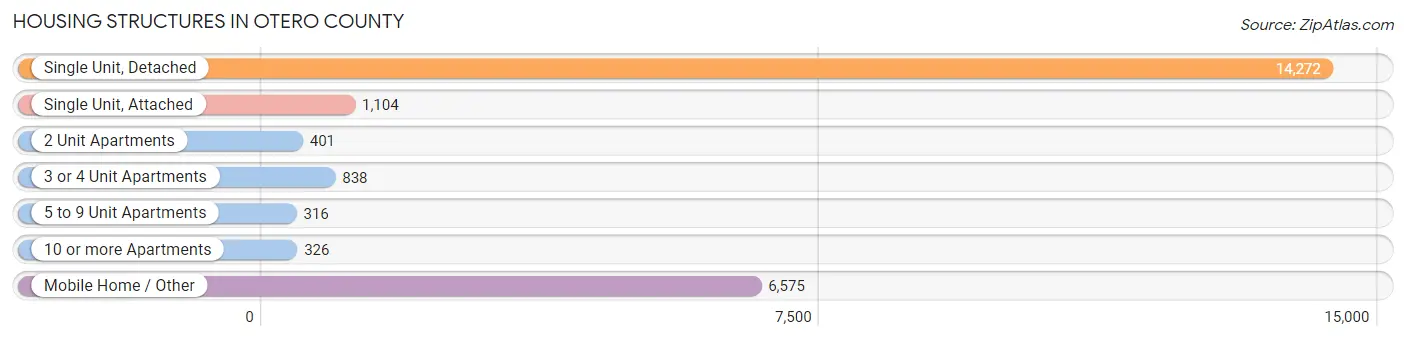
| Structure Type | # Housing Units | % Housing Units |
| Single Unit, Detached | 14,272 | 59.9% |
| Single Unit, Attached | 1,104 | 4.6% |
| 2 Unit Apartments | 401 | 1.7% |
| 3 or 4 Unit Apartments | 838 | 3.5% |
| 5 to 9 Unit Apartments | 316 | 1.3% |
| 10 or more Apartments | 326 | 1.4% |
| Mobile Home / Other | 6,575 | 27.6% |
| Total | 23,832 | 100.0% |
Housing Structures by Occupancy in Otero County
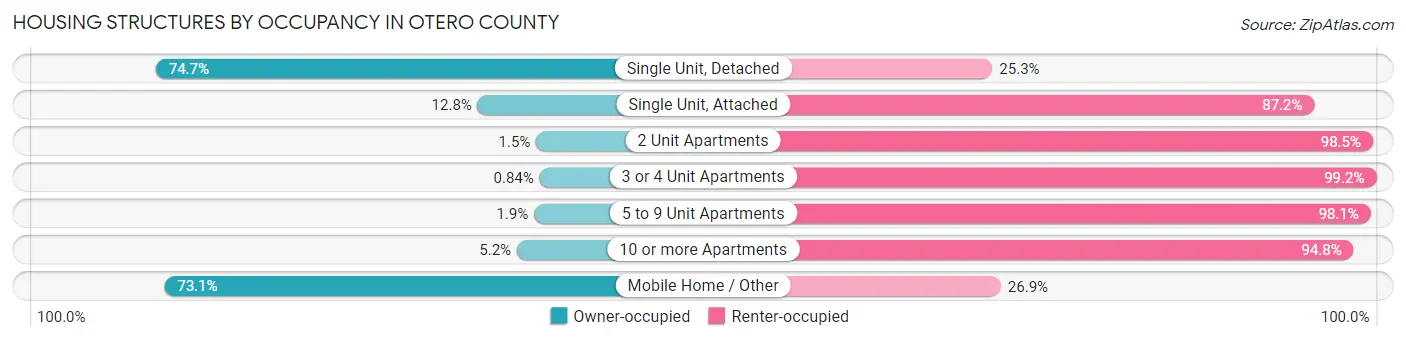
| Structure Type | Owner-occupied | Renter-occupied |
| Single Unit, Detached | 10,666 (74.7%) | 3,606 (25.3%) |
| Single Unit, Attached | 141 (12.8%) | 963 (87.2%) |
| 2 Unit Apartments | 6 (1.5%) | 395 (98.5%) |
| 3 or 4 Unit Apartments | 7 (0.8%) | 831 (99.2%) |
| 5 to 9 Unit Apartments | 6 (1.9%) | 310 (98.1%) |
| 10 or more Apartments | 17 (5.2%) | 309 (94.8%) |
| Mobile Home / Other | 4,806 (73.1%) | 1,769 (26.9%) |
| Total | 15,649 (65.7%) | 8,183 (34.3%) |
Housing Structures by Number of Rooms in Otero County
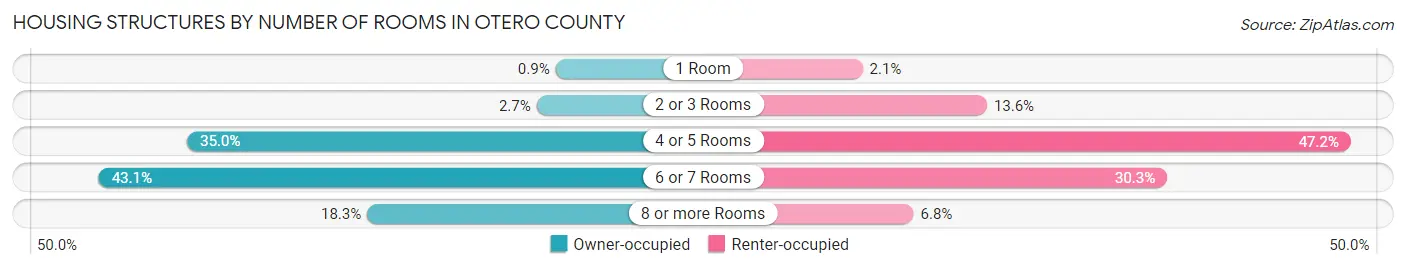
| Number of Rooms | Owner-occupied | Renter-occupied |
| 1 Room | 141 (0.9%) | 172 (2.1%) |
| 2 or 3 Rooms | 415 (2.6%) | 1,113 (13.6%) |
| 4 or 5 Rooms | 5,473 (35.0%) | 3,866 (47.2%) |
| 6 or 7 Rooms | 6,751 (43.1%) | 2,475 (30.2%) |
| 8 or more Rooms | 2,869 (18.3%) | 557 (6.8%) |
| Total | 15,649 (100.0%) | 8,183 (100.0%) |
Housing Structure by Heating Type in Otero County
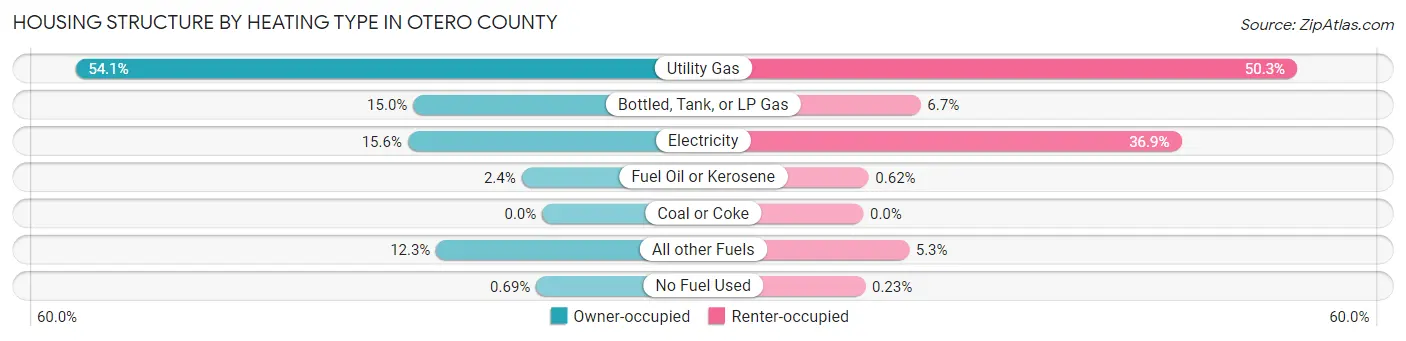
| Heating Type | Owner-occupied | Renter-occupied |
| Utility Gas | 8,469 (54.1%) | 4,116 (50.3%) |
| Bottled, Tank, or LP Gas | 2,339 (14.9%) | 544 (6.7%) |
| Electricity | 2,438 (15.6%) | 3,019 (36.9%) |
| Fuel Oil or Kerosene | 373 (2.4%) | 51 (0.6%) |
| Coal or Coke | 0 (0.0%) | 0 (0.0%) |
| All other Fuels | 1,922 (12.3%) | 434 (5.3%) |
| No Fuel Used | 108 (0.7%) | 19 (0.2%) |
| Total | 15,649 (100.0%) | 8,183 (100.0%) |
Household Vehicle Usage in Otero County
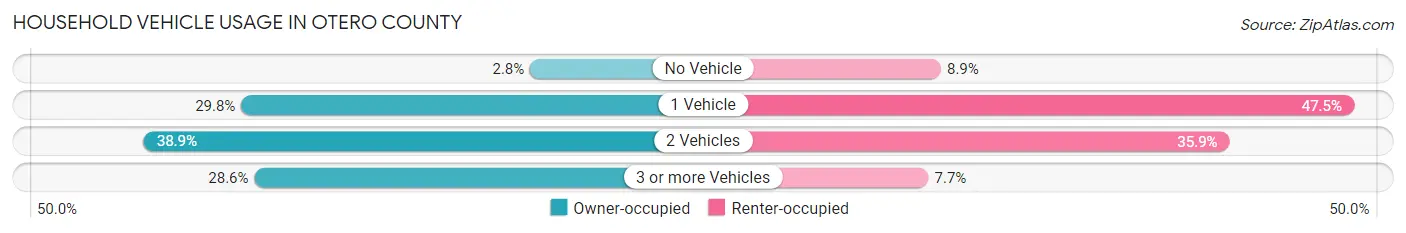
| Vehicles per Household | Owner-occupied | Renter-occupied |
| No Vehicle | 439 (2.8%) | 727 (8.9%) |
| 1 Vehicle | 4,660 (29.8%) | 3,887 (47.5%) |
| 2 Vehicles | 6,082 (38.9%) | 2,937 (35.9%) |
| 3 or more Vehicles | 4,468 (28.5%) | 632 (7.7%) |
| Total | 15,649 (100.0%) | 8,183 (100.0%) |
Real Estate & Mortgages in Otero County
Real Estate and Mortgage Overview in Otero County
| Characteristic | Without Mortgage | With Mortgage |
| Housing Units | 8,346 | 7,303 |
| Median Property Value | $114,200 | $165,500 |
| Median Household Income | $49,887 | $909 |
| Monthly Housing Costs | $343 | $207 |
| Real Estate Taxes | $630 | $398 |
Property Value by Mortgage Status in Otero County
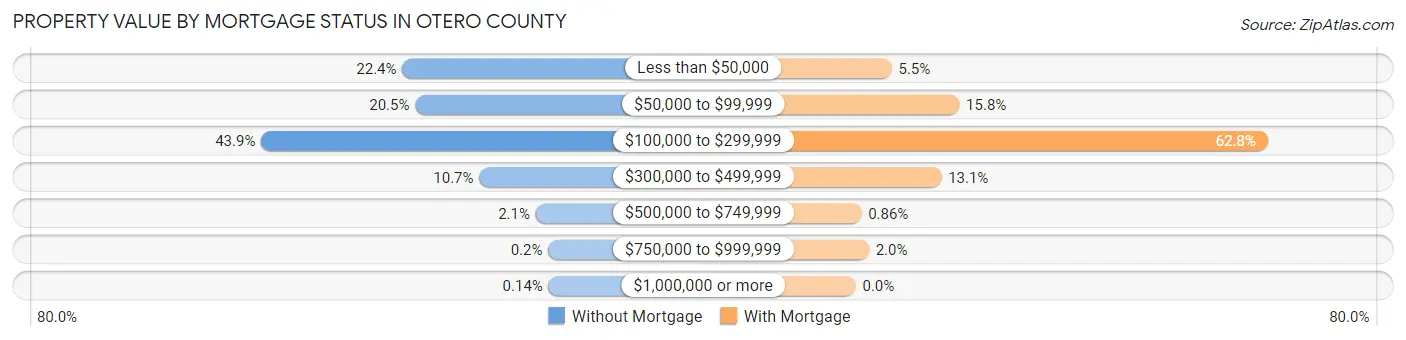
| Property Value | Without Mortgage | With Mortgage |
| Less than $50,000 | 1,873 (22.4%) | 400 (5.5%) |
| $50,000 to $99,999 | 1,708 (20.5%) | 1,153 (15.8%) |
| $100,000 to $299,999 | 3,667 (43.9%) | 4,588 (62.8%) |
| $300,000 to $499,999 | 893 (10.7%) | 953 (13.1%) |
| $500,000 to $749,999 | 176 (2.1%) | 63 (0.9%) |
| $750,000 to $999,999 | 17 (0.2%) | 146 (2.0%) |
| $1,000,000 or more | 12 (0.1%) | 0 (0.0%) |
| Total | 8,346 (100.0%) | 7,303 (100.0%) |
Household Income by Mortgage Status in Otero County
| Household Income | Without Mortgage | With Mortgage |
| Less than $10,000 | 572 (6.9%) | 49 (0.7%) |
| $10,000 to $24,999 | 1,113 (13.3%) | 293 (4.0%) |
| $25,000 to $34,999 | 865 (10.4%) | 508 (7.0%) |
| $35,000 to $49,999 | 1,633 (19.6%) | 653 (8.9%) |
| $50,000 to $74,999 | 1,718 (20.6%) | 776 (10.6%) |
| $75,000 to $99,999 | 1,026 (12.3%) | 1,510 (20.7%) |
| $100,000 to $149,999 | 983 (11.8%) | 1,321 (18.1%) |
| $150,000 or more | 436 (5.2%) | 1,333 (18.2%) |
| Total | 8,346 (100.0%) | 7,303 (100.0%) |
Property Value to Household Income Ratio in Otero County
| Value-to-Income Ratio | Without Mortgage | With Mortgage |
| Less than 2.0x | 3,680 (44.1%) | 73,810 (1,010.7%) |
| 2.0x to 2.9x | 1,379 (16.5%) | 2,850 (39.0%) |
| 3.0x to 3.9x | 930 (11.1%) | 1,871 (25.6%) |
| 4.0x or more | 2,254 (27.0%) | 854 (11.7%) |
| Total | 8,346 (100.0%) | 7,303 (100.0%) |
Real Estate Taxes by Mortgage Status in Otero County
| Property Taxes | Without Mortgage | With Mortgage |
| Less than $800 | 4,423 (53.0%) | 181 (2.5%) |
| $800 to $1,499 | 1,639 (19.6%) | 2,650 (36.3%) |
| $800 to $1,499 | 1,160 (13.9%) | 2,346 (32.1%) |
| Total | 8,346 (100.0%) | 7,303 (100.0%) |
Health & Disability in Otero County
Health Insurance Coverage by Age in Otero County
| Age Bracket | With Coverage | Without Coverage |
| Under 6 Years | 4,964 (97.1%) | 150 (2.9%) |
| 6 to 18 Years | 10,260 (95.3%) | 506 (4.7%) |
| 19 to 25 Years | 5,029 (80.5%) | 1,216 (19.5%) |
| 26 to 34 Years | 5,811 (86.9%) | 880 (13.2%) |
| 35 to 44 Years | 5,959 (85.5%) | 1,007 (14.5%) |
| 45 to 54 Years | 5,579 (86.7%) | 859 (13.3%) |
| 55 to 64 Years | 6,982 (88.7%) | 889 (11.3%) |
| 65 to 74 Years | 6,524 (98.0%) | 134 (2.0%) |
| 75 Years and older | 4,613 (99.7%) | 12 (0.3%) |
| Total | 55,721 (90.8%) | 5,653 (9.2%) |
Health Insurance Coverage by Citizenship Status in Otero County
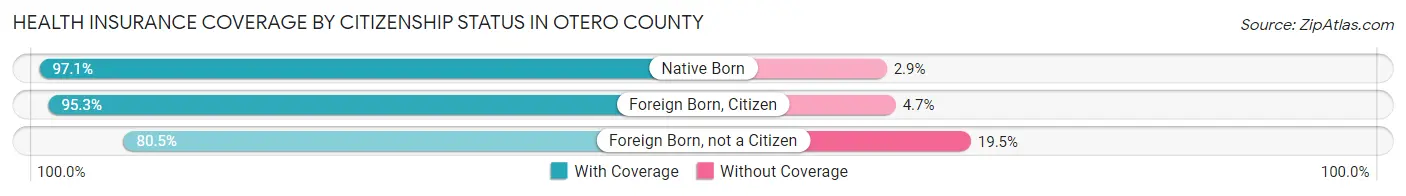
| Citizenship Status | With Coverage | Without Coverage |
| Native Born | 4,964 (97.1%) | 150 (2.9%) |
| Foreign Born, Citizen | 10,260 (95.3%) | 506 (4.7%) |
| Foreign Born, not a Citizen | 5,029 (80.5%) | 1,216 (19.5%) |
Health Insurance Coverage by Household Income in Otero County
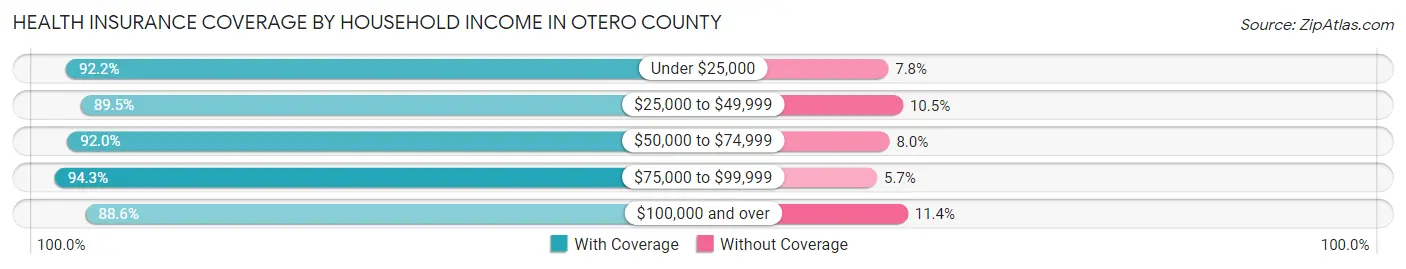
| Household Income | With Coverage | Without Coverage |
| Under $25,000 | 8,765 (92.2%) | 738 (7.8%) |
| $25,000 to $49,999 | 14,051 (89.5%) | 1,654 (10.5%) |
| $50,000 to $74,999 | 10,173 (92.0%) | 885 (8.0%) |
| $75,000 to $99,999 | 8,043 (94.3%) | 483 (5.7%) |
| $100,000 and over | 14,484 (88.6%) | 1,870 (11.4%) |
Public vs Private Health Insurance Coverage by Age in Otero County
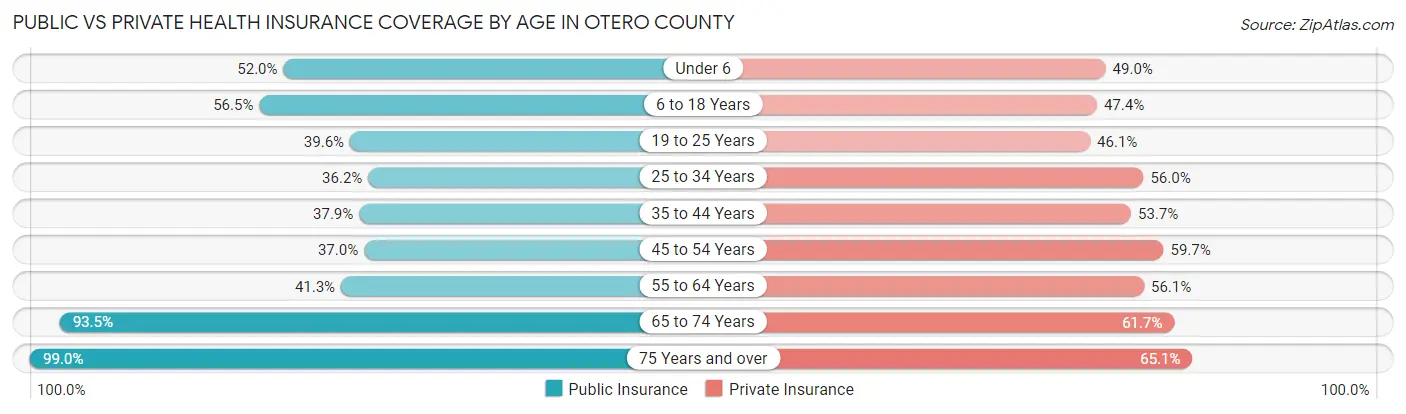
| Age Bracket | Public Insurance | Private Insurance |
| Under 6 | 2,658 (52.0%) | 2,505 (49.0%) |
| 6 to 18 Years | 6,077 (56.5%) | 5,100 (47.4%) |
| 19 to 25 Years | 2,474 (39.6%) | 2,879 (46.1%) |
| 25 to 34 Years | 2,424 (36.2%) | 3,747 (56.0%) |
| 35 to 44 Years | 2,641 (37.9%) | 3,741 (53.7%) |
| 45 to 54 Years | 2,382 (37.0%) | 3,845 (59.7%) |
| 55 to 64 Years | 3,249 (41.3%) | 4,416 (56.1%) |
| 65 to 74 Years | 6,223 (93.5%) | 4,108 (61.7%) |
| 75 Years and over | 4,578 (99.0%) | 3,009 (65.1%) |
| Total | 32,706 (53.3%) | 33,350 (54.3%) |
Disability Status by Sex by Age in Otero County
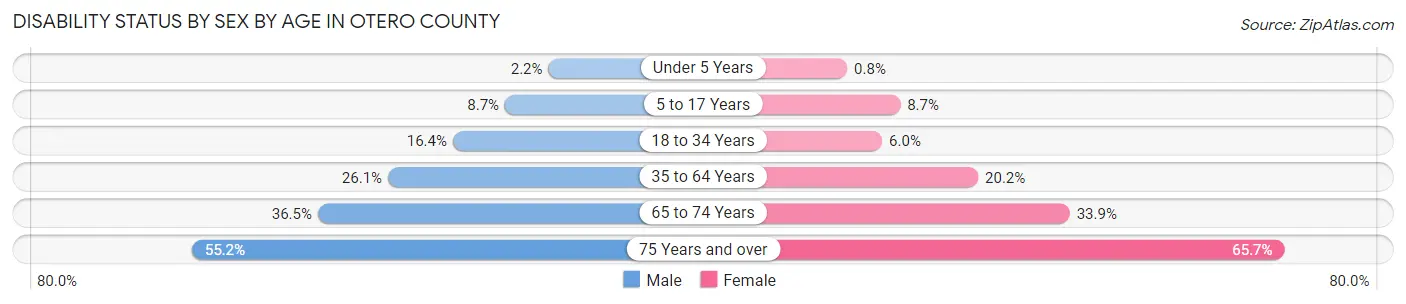
| Age Bracket | Male | Female |
| Under 5 Years | 48 (2.2%) | 16 (0.8%) |
| 5 to 17 Years | 495 (8.7%) | 453 (8.7%) |
| 18 to 34 Years | 1,148 (16.4%) | 403 (6.0%) |
| 35 to 64 Years | 2,621 (26.1%) | 2,270 (20.2%) |
| 65 to 74 Years | 1,190 (36.5%) | 1,149 (33.9%) |
| 75 Years and over | 1,163 (55.2%) | 1,654 (65.7%) |
Disability Class by Sex by Age in Otero County
Disability Class: Hearing Difficulty
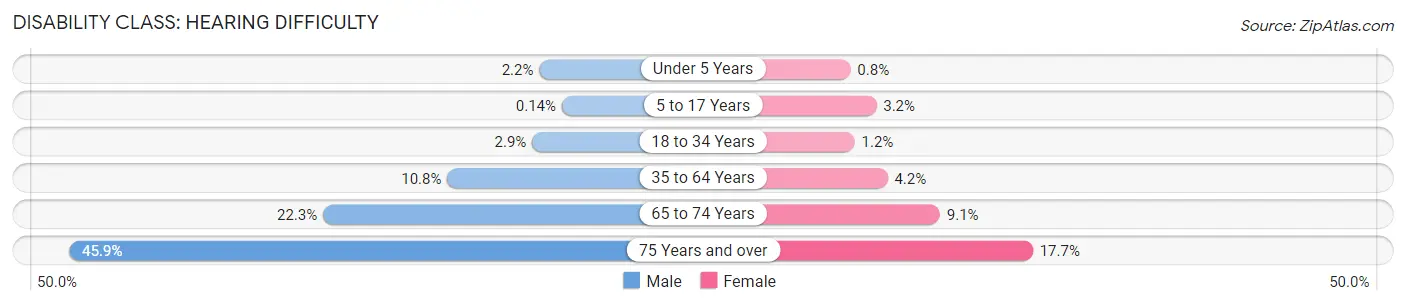
| Age Bracket | Male | Female |
| Under 5 Years | 48 (2.2%) | 16 (0.8%) |
| 5 to 17 Years | 8 (0.1%) | 167 (3.2%) |
| 18 to 34 Years | 202 (2.9%) | 80 (1.2%) |
| 35 to 64 Years | 1,084 (10.8%) | 476 (4.2%) |
| 65 to 74 Years | 728 (22.3%) | 309 (9.1%) |
| 75 Years and over | 967 (45.9%) | 446 (17.7%) |
Disability Class: Vision Difficulty
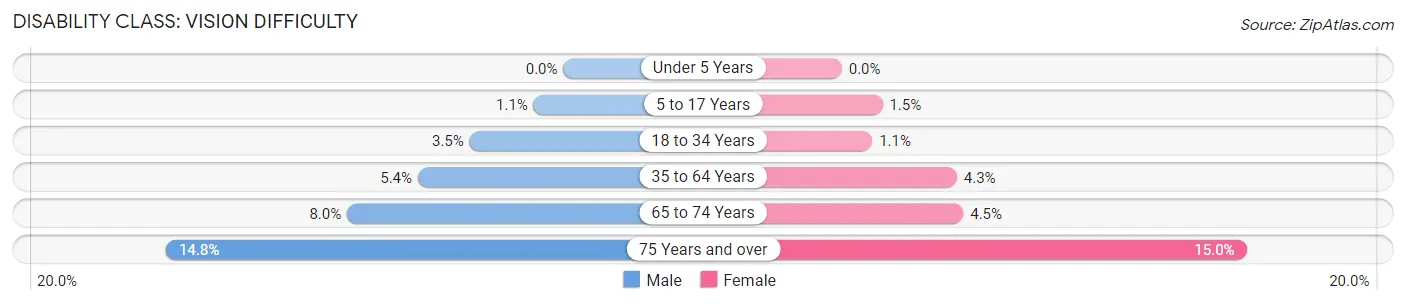
| Age Bracket | Male | Female |
| Under 5 Years | 0 (0.0%) | 0 (0.0%) |
| 5 to 17 Years | 63 (1.1%) | 79 (1.5%) |
| 18 to 34 Years | 243 (3.5%) | 76 (1.1%) |
| 35 to 64 Years | 543 (5.4%) | 479 (4.3%) |
| 65 to 74 Years | 262 (8.0%) | 153 (4.5%) |
| 75 Years and over | 311 (14.7%) | 378 (15.0%) |
Disability Class: Cognitive Difficulty
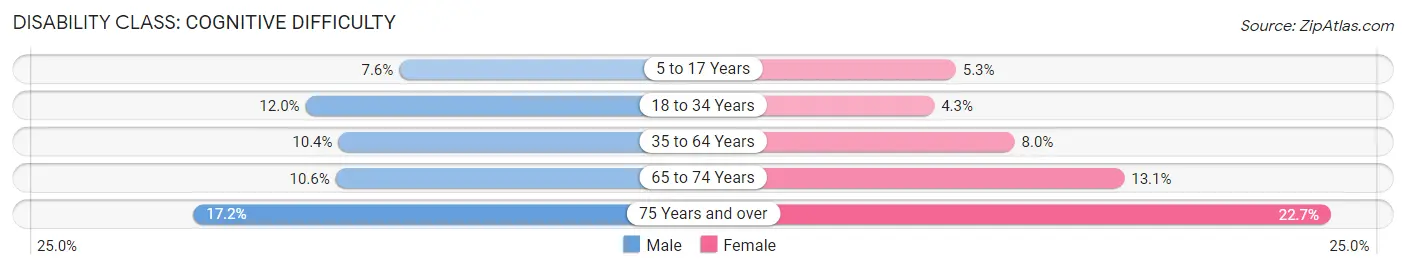
| Age Bracket | Male | Female |
| 5 to 17 Years | 435 (7.6%) | 276 (5.3%) |
| 18 to 34 Years | 837 (12.0%) | 289 (4.3%) |
| 35 to 64 Years | 1,050 (10.4%) | 899 (8.0%) |
| 65 to 74 Years | 345 (10.6%) | 445 (13.1%) |
| 75 Years and over | 362 (17.2%) | 571 (22.7%) |
Disability Class: Ambulatory Difficulty
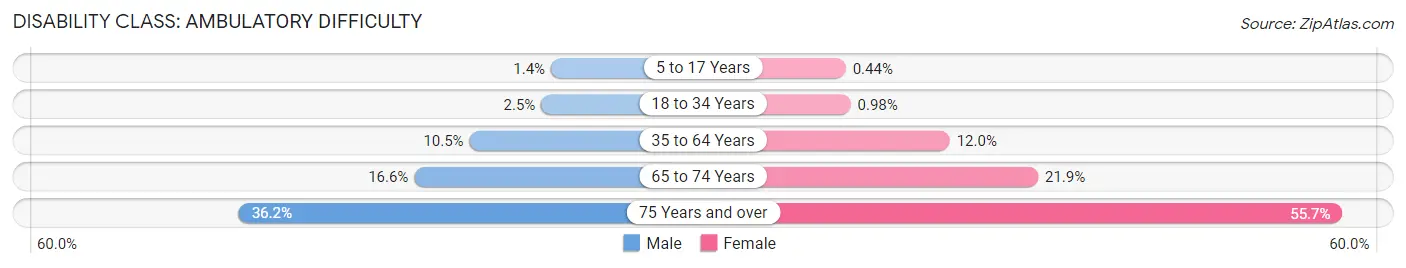
| Age Bracket | Male | Female |
| 5 to 17 Years | 79 (1.4%) | 23 (0.4%) |
| 18 to 34 Years | 173 (2.5%) | 66 (1.0%) |
| 35 to 64 Years | 1,052 (10.5%) | 1,348 (12.0%) |
| 65 to 74 Years | 542 (16.6%) | 742 (21.9%) |
| 75 Years and over | 762 (36.1%) | 1,403 (55.7%) |
Disability Class: Self-Care Difficulty
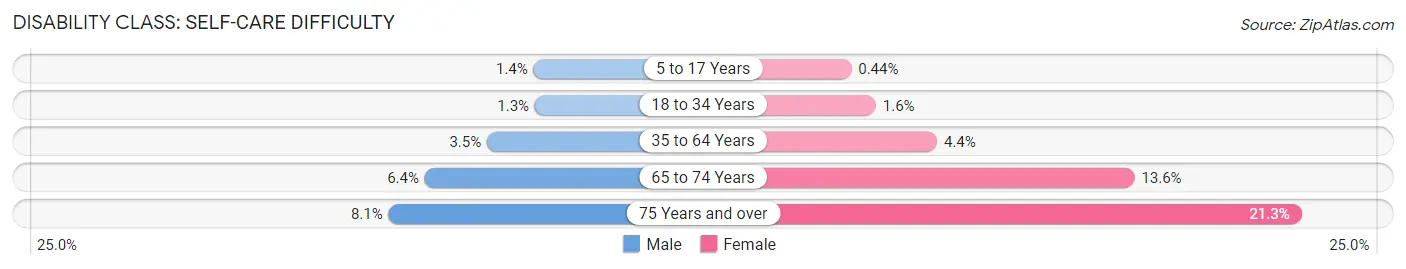
| Age Bracket | Male | Female |
| 5 to 17 Years | 79 (1.4%) | 23 (0.4%) |
| 18 to 34 Years | 92 (1.3%) | 106 (1.6%) |
| 35 to 64 Years | 356 (3.5%) | 496 (4.4%) |
| 65 to 74 Years | 210 (6.4%) | 461 (13.6%) |
| 75 Years and over | 171 (8.1%) | 537 (21.3%) |
Technology Access in Otero County
Computing Device Access in Otero County
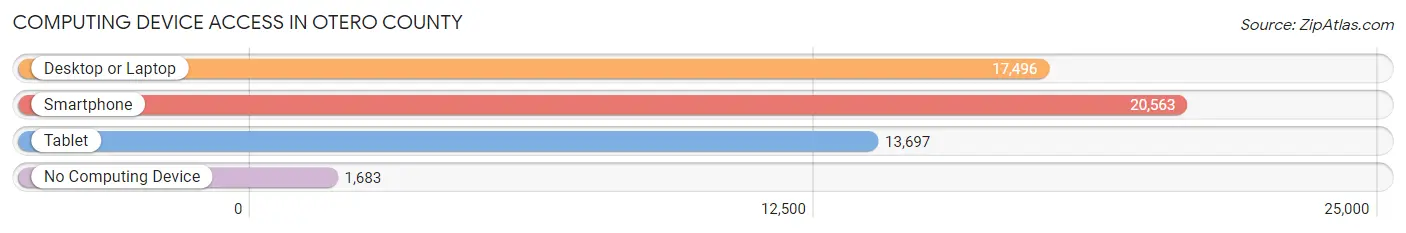
| Device Type | # Households | % Households |
| Desktop or Laptop | 17,496 | 73.4% |
| Smartphone | 20,563 | 86.3% |
| Tablet | 13,697 | 57.5% |
| No Computing Device | 1,683 | 7.1% |
| Total | 23,832 | 100.0% |
Internet Access in Otero County
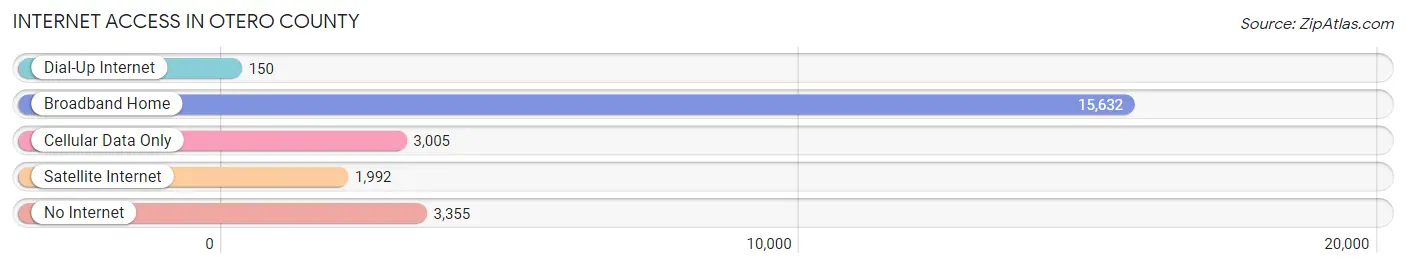
| Internet Type | # Households | % Households |
| Dial-Up Internet | 150 | 0.6% |
| Broadband Home | 15,632 | 65.6% |
| Cellular Data Only | 3,005 | 12.6% |
| Satellite Internet | 1,992 | 8.4% |
| No Internet | 3,355 | 14.1% |
| Total | 23,832 | 100.0% |
Otero County Summary
Otero County is a county located in the south-central region of the U.S. state of New Mexico. As of the 2010 census, the population was 63,797. The county seat is Alamogordo. Otero County comprises the Alamogordo, NM Micropolitan Statistical Area.
History
Otero County was created in 1899 from the eastern portion of Lincoln County. It was named for Miguel Antonio Otero, a prominent local politician. The county was originally much larger, but the western portion was split off to form Lincoln, Chaves, and Eddy counties.
Geography
Otero County is located in the south-central region of New Mexico. It is bordered by Lincoln County to the north, Chaves County to the east, Eddy County to the west, and Dona Ana County to the south. The county covers an area of 6,631 square miles, making it the second-largest county in the state.
The county is located in the Chihuahuan Desert, and is characterized by flat to rolling terrain. The Sacramento Mountains are located in the northern part of the county, and the San Andres Mountains are located in the southern part. The county is home to several large lakes, including Lake Lucero, Oliver Lee Memorial State Park, and Bottomless Lakes State Park.
Economy
Otero County’s economy is largely based on agriculture, tourism, and military installations. The county is home to White Sands Missile Range, Holloman Air Force Base, and the National Solar Observatory.
Agriculture is an important part of the county’s economy. The county is home to several large farms, including the Otero County Dairy, which produces milk, cheese, and other dairy products. The county is also home to several wineries, including the Otero County Winery and the White Sands Winery.
Tourism is also an important part of the county’s economy. The county is home to several popular attractions, including White Sands National Monument, Oliver Lee Memorial State Park, and Bottomless Lakes State Park.
Demographics
As of the 2010 census, there were 63,797 people, 24,845 households, and 17,845 families residing in the county. The population density was 9.6 people per square mile. The racial makeup of the county was 75.3% White, 4.2% Black or African American, 1.2% Native American, 0.7% Asian, 0.1% Pacific Islander, 15.7% from other races, and 2.9% from two or more races. Hispanic or Latino of any race were 37.2% of the population.
The median income for a household in the county was $37,845, and the median income for a family was $45,945. The per capita income for the county was $19,845. About 14.2% of families and 18.2% of the population were below the poverty line, including 25.2% of those under age 18 and 11.2% of those age 65 or over.
Common Questions
What is Per Capita Income in Otero County?
Per Capita income in Otero County is $26,319.
What is the Median Family Income in Otero County?
Median Family Income in Otero County is $65,947.
What is the Median Household income in Otero County?
Median Household Income in Otero County is $50,833.
What is Income or Wage Gap in Otero County?
Income or Wage Gap in Otero County is 23.9%.
Women in Otero County earn 76.1 cents for every dollar earned by a man.
What is Family Income Deficit in Otero County?
Family Income Deficit in Otero County is $8,763.
Families that are below poverty line in Otero County earn $8,763 less on average than the poverty threshold level.
What is Inequality or Gini Index in Otero County?
Inequality or Gini Index in Otero County is 0.43.
What is the Total Population of Otero County?
Total Population of Otero County is 67,850.
What is the Total Male Population of Otero County?
Total Male Population of Otero County is 35,846.
What is the Total Female Population of Otero County?
Total Female Population of Otero County is 32,004.
What is the Ratio of Males per 100 Females in Otero County?
There are 112.00 Males per 100 Females in Otero County.
What is the Ratio of Females per 100 Males in Otero County?
There are 89.28 Females per 100 Males in Otero County.
What is the Median Population Age in Otero County?
Median Population Age in Otero County is 35.9 Years.
What is the Average Family Size in Otero County
Average Family Size in Otero County is 3.5 People.
What is the Average Household Size in Otero County
Average Household Size in Otero County is 2.7 People.
How Large is the Labor Force in Otero County?
There are 29,548 People in the Labor Forcein in Otero County.
What is the Percentage of People in the Labor Force in Otero County?
54.1% of People are in the Labor Force in Otero County.
What is the Unemployment Rate in Otero County?
Unemployment Rate in Otero County is 9.6%.