Las Vegas, NM Map & Demographics
Las Vegas Map
Las Vegas Overview
$24,005
PER CAPITA INCOME
$47,991
AVG FAMILY INCOME
$39,558
AVG HOUSEHOLD INCOME
3.5%
WAGE / INCOME GAP [ % ]
96.5¢/ $1
WAGE / INCOME GAP [ $ ]
$10,155
FAMILY INCOME DEFICIT
0.49
INEQUALITY / GINI INDEX
13,194
TOTAL POPULATION
6,829
MALE POPULATION
6,365
FEMALE POPULATION
107.29
MALES / 100 FEMALES
93.21
FEMALES / 100 MALES
40.1
MEDIAN AGE
2.8
AVG FAMILY SIZE
2.1
AVG HOUSEHOLD SIZE
5,613
LABOR FORCE [ PEOPLE ]
49.6%
PERCENT IN LABOR FORCE
7.9%
UNEMPLOYMENT RATE
Las Vegas Zip Codes
Las Vegas Area Codes
Income in Las Vegas
Income Overview in Las Vegas
Per Capita Income in Las Vegas is $24,005, while median incomes of families and households are $47,991 and $39,558 respectively.
| Characteristic | Number | Measure |
| Per Capita Income | 13,194 | $24,005 |
| Median Family Income | 2,863 | $47,991 |
| Mean Family Income | 2,863 | $59,092 |
| Median Household Income | 5,658 | $39,558 |
| Mean Household Income | 5,658 | $53,475 |
| Income Deficit | 2,863 | $10,155 |
| Wage / Income Gap (%) | 13,194 | 3.55% |
| Wage / Income Gap ($) | 13,194 | 96.45¢ per $1 |
| Gini / Inequality Index | 13,194 | 0.49 |
Earnings by Sex in Las Vegas
Average Earnings in Las Vegas are $24,119, $23,750 for men and $24,624 for women, a difference of 3.5%.
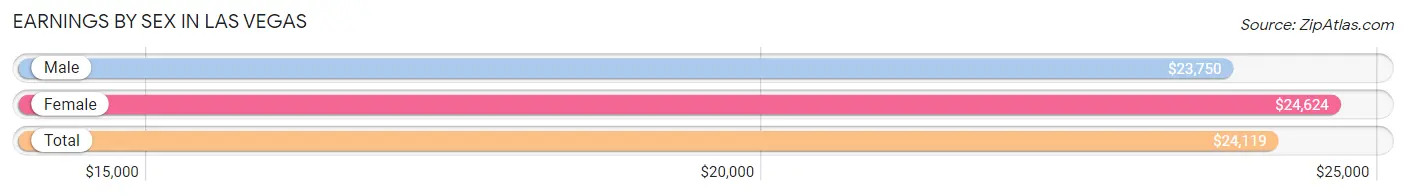
| Sex | Number | Average Earnings |
| Male | 3,003 (51.8%) | $23,750 |
| Female | 2,789 (48.1%) | $24,624 |
| Total | 5,792 (100.0%) | $24,119 |
Earnings by Sex by Income Bracket in Las Vegas
The most common earnings brackets in Las Vegas are $25,000 to $29,999 for men (314 | 10.5%) and $10,000 to $12,499 for women (285 | 10.2%).
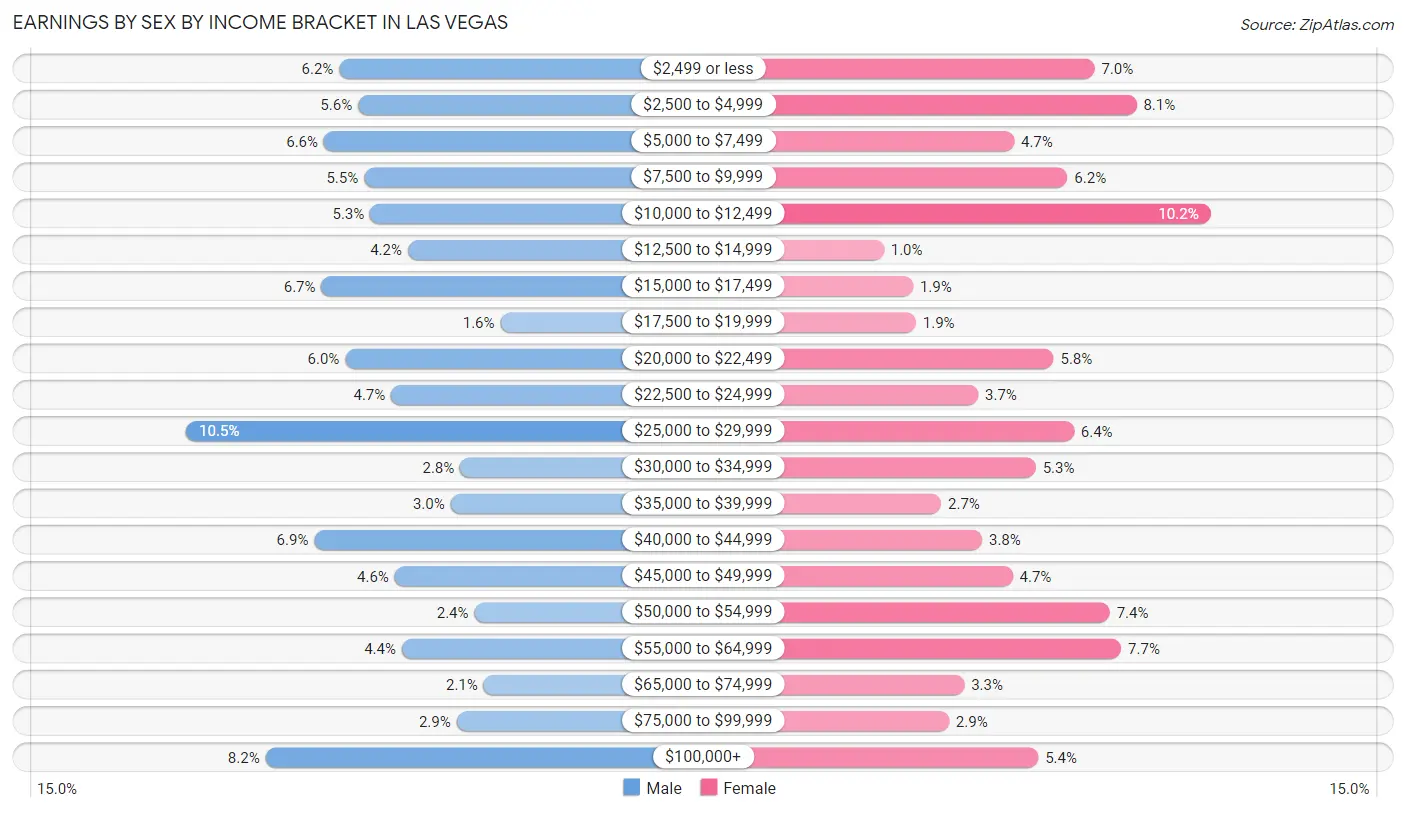
| Income | Male | Female |
| $2,499 or less | 185 (6.2%) | 194 (7.0%) |
| $2,500 to $4,999 | 169 (5.6%) | 227 (8.1%) |
| $5,000 to $7,499 | 198 (6.6%) | 131 (4.7%) |
| $7,500 to $9,999 | 164 (5.5%) | 173 (6.2%) |
| $10,000 to $12,499 | 159 (5.3%) | 285 (10.2%) |
| $12,500 to $14,999 | 127 (4.2%) | 29 (1.0%) |
| $15,000 to $17,499 | 200 (6.7%) | 52 (1.9%) |
| $17,500 to $19,999 | 49 (1.6%) | 54 (1.9%) |
| $20,000 to $22,499 | 180 (6.0%) | 162 (5.8%) |
| $22,500 to $24,999 | 141 (4.7%) | 103 (3.7%) |
| $25,000 to $29,999 | 314 (10.5%) | 178 (6.4%) |
| $30,000 to $34,999 | 83 (2.8%) | 148 (5.3%) |
| $35,000 to $39,999 | 91 (3.0%) | 74 (2.6%) |
| $40,000 to $44,999 | 206 (6.9%) | 106 (3.8%) |
| $45,000 to $49,999 | 138 (4.6%) | 130 (4.7%) |
| $50,000 to $54,999 | 71 (2.4%) | 206 (7.4%) |
| $55,000 to $64,999 | 132 (4.4%) | 215 (7.7%) |
| $65,000 to $74,999 | 63 (2.1%) | 92 (3.3%) |
| $75,000 to $99,999 | 86 (2.9%) | 80 (2.9%) |
| $100,000+ | 247 (8.2%) | 150 (5.4%) |
| Total | 3,003 (100.0%) | 2,789 (100.0%) |
Earnings by Sex by Educational Attainment in Las Vegas
Average earnings in Las Vegas are $28,026 for men and $33,374 for women, a difference of 16.0%. Men with an educational attainment of college or associate's degree enjoy the highest average annual earnings of $36,750, while those with less than high school education earn the least with $23,452. Women with an educational attainment of graduate degree earn the most with the average annual earnings of $60,341, while those with high school diploma education have the smallest earnings of $25,250.
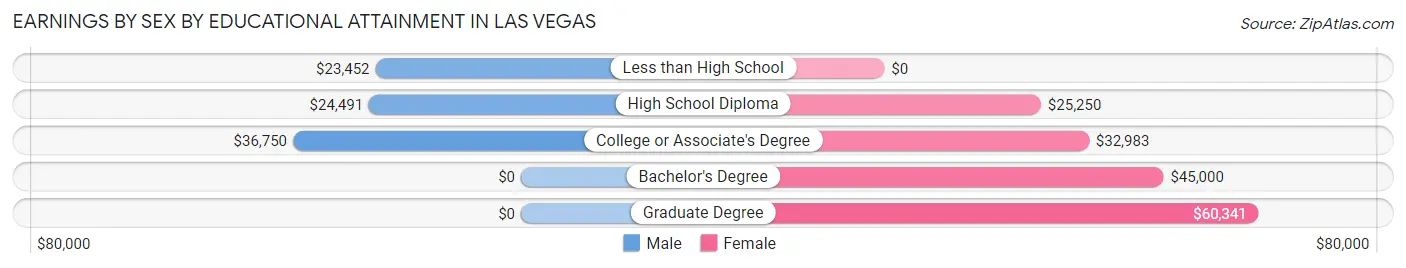
| Educational Attainment | Male Income | Female Income |
| Less than High School | $23,452 | $0 |
| High School Diploma | $24,491 | $25,250 |
| College or Associate's Degree | $36,750 | $32,983 |
| Bachelor's Degree | - | - |
| Graduate Degree | - | - |
| Total | $28,026 | $33,374 |
Family Income in Las Vegas
Family Income Brackets in Las Vegas
According to the Las Vegas family income data, there are 618 families falling into the $50,000 to $74,999 income range, which is the most common income bracket and makes up 21.6% of all families. Conversely, the $200,000+ income bracket is the least frequent group with only 52 families (1.8%) belonging to this category.
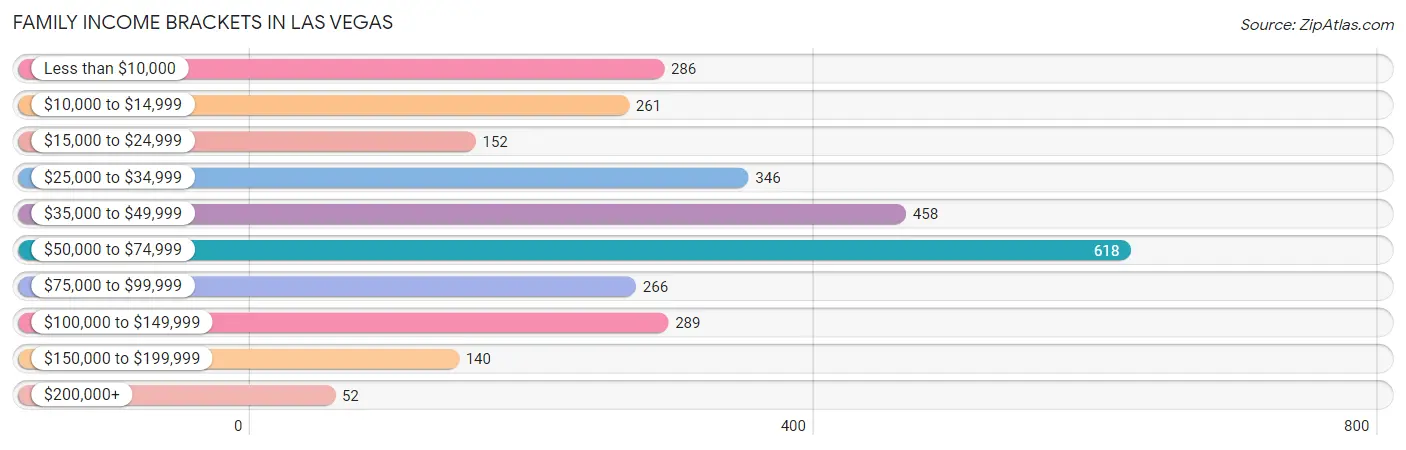
| Income Bracket | # Families | % Families |
| Less than $10,000 | 286 | 10.0% |
| $10,000 to $14,999 | 261 | 9.1% |
| $15,000 to $24,999 | 152 | 5.3% |
| $25,000 to $34,999 | 346 | 12.1% |
| $35,000 to $49,999 | 458 | 16.0% |
| $50,000 to $74,999 | 618 | 21.6% |
| $75,000 to $99,999 | 266 | 9.3% |
| $100,000 to $149,999 | 289 | 10.1% |
| $150,000 to $199,999 | 140 | 4.9% |
| $200,000+ | 52 | 1.8% |
Family Income by Famaliy Size in Las Vegas
6-person families (111 | 3.9%) account for the highest median family income in Las Vegas with $123,504 per family, while 2-person families (1,809 | 63.2%) have the highest median income of $23,149 per family member.
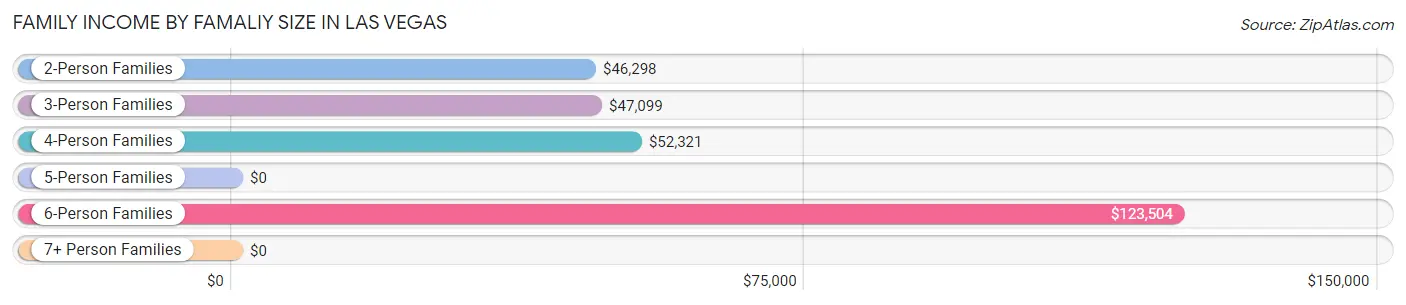
| Income Bracket | # Families | Median Income |
| 2-Person Families | 1,809 (63.2%) | $46,298 |
| 3-Person Families | 509 (17.8%) | $47,099 |
| 4-Person Families | 320 (11.2%) | $52,321 |
| 5-Person Families | 114 (4.0%) | $0 |
| 6-Person Families | 111 (3.9%) | $123,504 |
| 7+ Person Families | 0 (0.0%) | $0 |
| Total | 2,863 (100.0%) | $47,991 |
Family Income by Number of Earners in Las Vegas
The median family income in Las Vegas is $47,991, with families comprising 3+ earners (144) having the highest median family income of $127,194, while families with no earners (904) have the lowest median family income of $32,016, accounting for 5.0% and 31.6% of families, respectively.
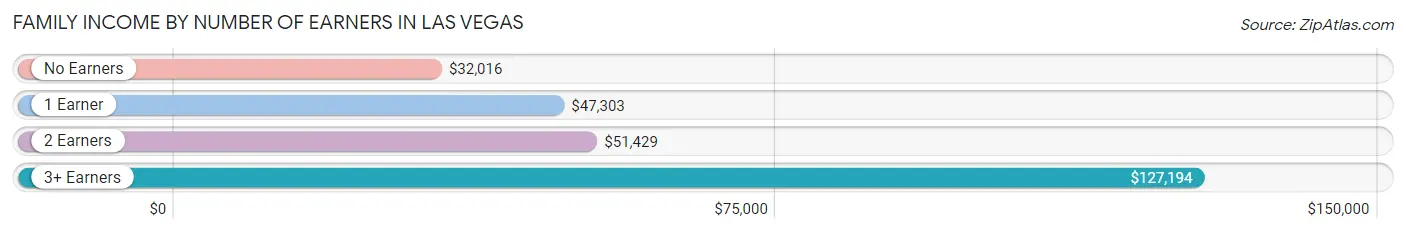
| Number of Earners | # Families | Median Income |
| No Earners | 904 (31.6%) | $32,016 |
| 1 Earner | 1,129 (39.4%) | $47,303 |
| 2 Earners | 686 (24.0%) | $51,429 |
| 3+ Earners | 144 (5.0%) | $127,194 |
| Total | 2,863 (100.0%) | $47,991 |
Household Income in Las Vegas
Household Income Brackets in Las Vegas
With 900 households falling in the category, the $50,000 to $74,999 income range is the most frequent in Las Vegas, accounting for 15.9% of all households. In contrast, only 108 households (1.9%) fall into the $200,000+ income bracket, making it the least populous group.
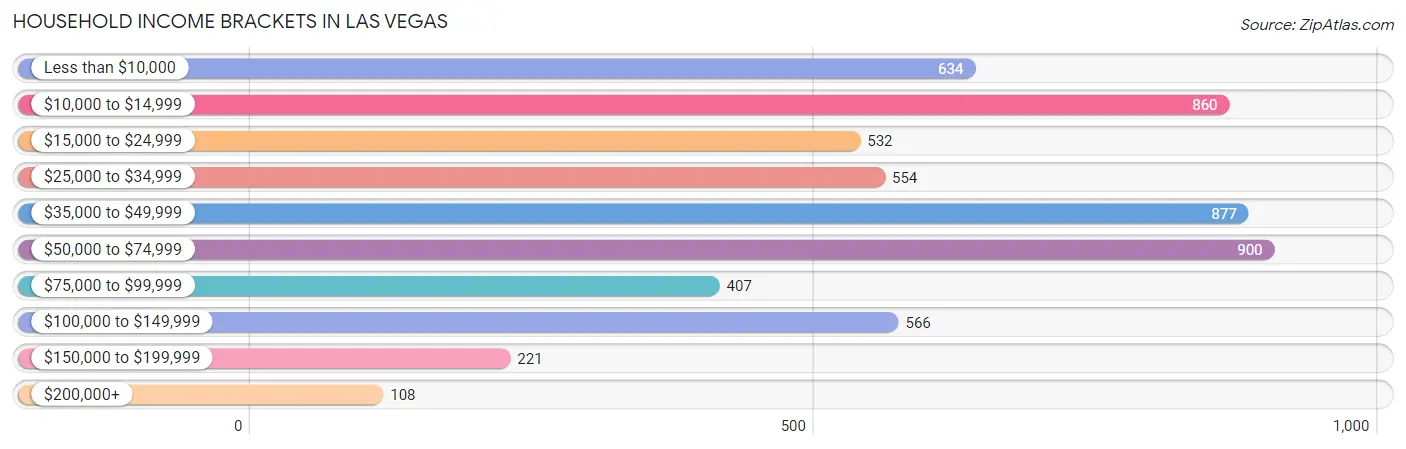
| Income Bracket | # Households | % Households |
| Less than $10,000 | 634 | 11.2% |
| $10,000 to $14,999 | 860 | 15.2% |
| $15,000 to $24,999 | 532 | 9.4% |
| $25,000 to $34,999 | 554 | 9.8% |
| $35,000 to $49,999 | 877 | 15.5% |
| $50,000 to $74,999 | 900 | 15.9% |
| $75,000 to $99,999 | 407 | 7.2% |
| $100,000 to $149,999 | 566 | 10.0% |
| $150,000 to $199,999 | 221 | 3.9% |
| $200,000+ | 108 | 1.9% |
Household Income by Householder Age in Las Vegas
The median household income in Las Vegas is $39,558, with the highest median household income of $47,361 found in the 65+ years age bracket for the primary householder. A total of 1,678 households (29.7%) fall into this category. Meanwhile, the 15 to 24 years age bracket for the primary householder has the lowest median household income of $0, with 389 households (6.9%) in this group.
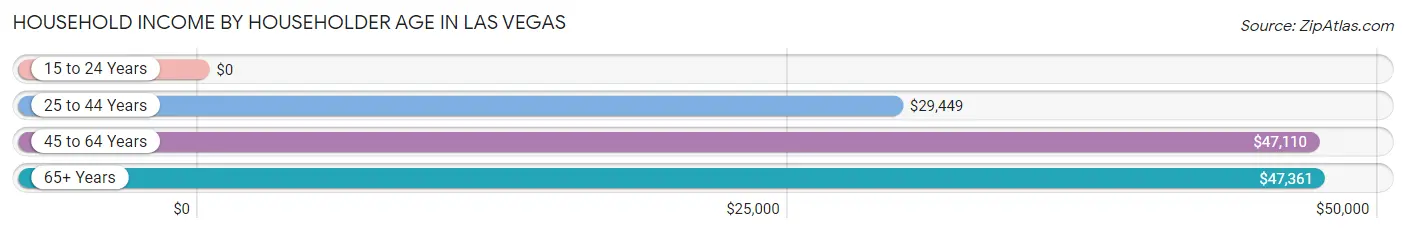
| Income Bracket | # Households | Median Income |
| 15 to 24 Years | 389 (6.9%) | $0 |
| 25 to 44 Years | 1,592 (28.1%) | $29,449 |
| 45 to 64 Years | 1,999 (35.3%) | $47,110 |
| 65+ Years | 1,678 (29.7%) | $47,361 |
| Total | 5,658 (100.0%) | $39,558 |
Poverty in Las Vegas
Income Below Poverty by Sex and Age in Las Vegas
With 33.0% poverty level for males and 29.3% for females among the residents of Las Vegas, 15 year old males and 18 to 24 year old females are the most vulnerable to poverty, with 29 males (100.0%) and 381 females (55.9%) in their respective age groups living below the poverty level.
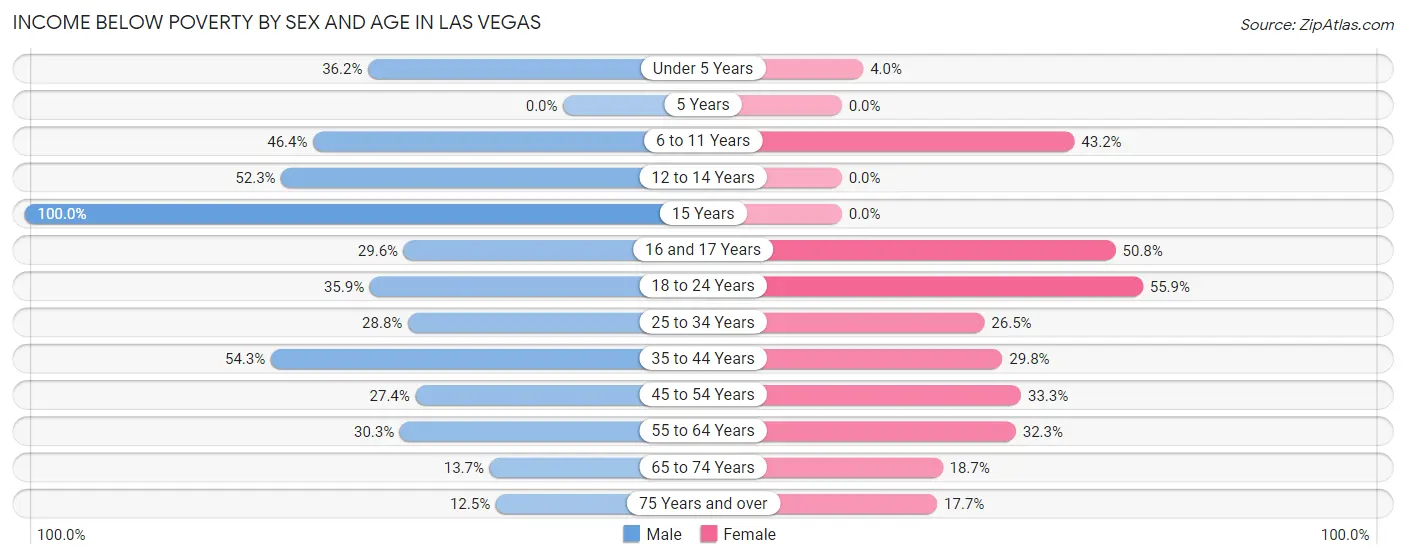
| Age Bracket | Male | Female |
| Under 5 Years | 113 (36.2%) | 15 (4.0%) |
| 5 Years | 0 (0.0%) | 0 (0.0%) |
| 6 to 11 Years | 175 (46.4%) | 152 (43.2%) |
| 12 to 14 Years | 101 (52.3%) | 0 (0.0%) |
| 15 Years | 29 (100.0%) | 0 (0.0%) |
| 16 and 17 Years | 58 (29.6%) | 62 (50.8%) |
| 18 to 24 Years | 300 (35.9%) | 381 (55.9%) |
| 25 to 34 Years | 221 (28.8%) | 144 (26.5%) |
| 35 to 44 Years | 439 (54.3%) | 265 (29.8%) |
| 45 to 54 Years | 190 (27.4%) | 216 (33.3%) |
| 55 to 64 Years | 291 (30.3%) | 280 (32.3%) |
| 65 to 74 Years | 84 (13.7%) | 129 (18.7%) |
| 75 Years and over | 54 (12.5%) | 101 (17.7%) |
| Total | 2,055 (33.0%) | 1,745 (29.3%) |
Income Above Poverty by Sex and Age in Las Vegas
According to the poverty statistics in Las Vegas, males aged 5 years and females aged 5 years are the age groups that are most secure financially, with 100.0% of males and 100.0% of females in these age groups living above the poverty line.
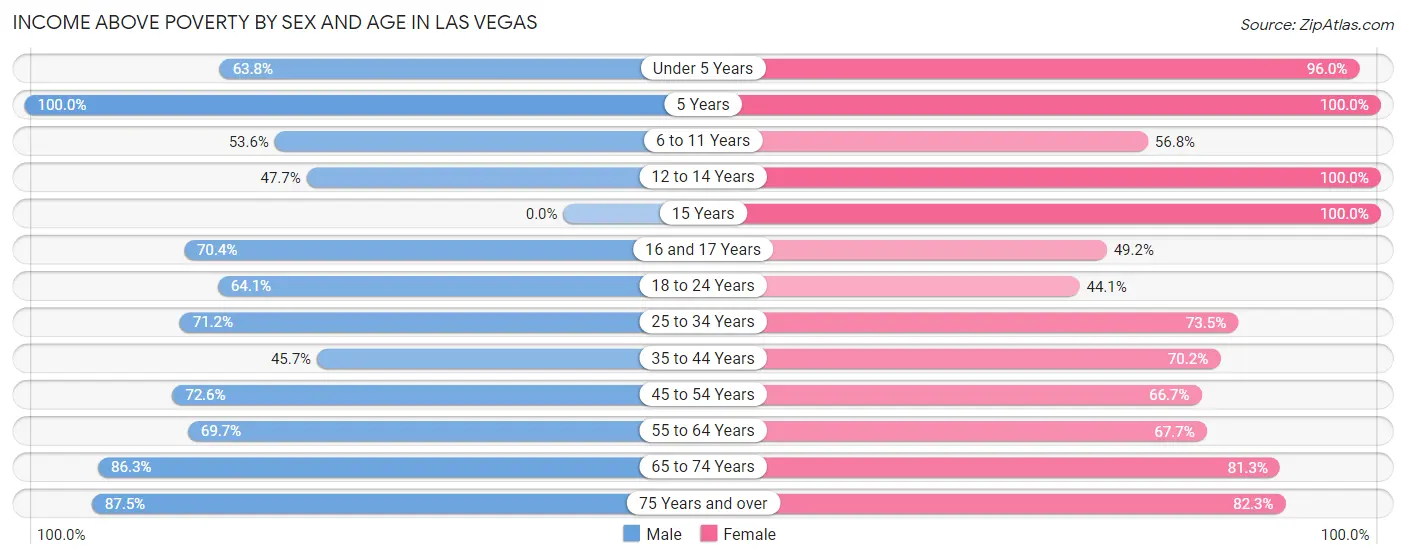
| Age Bracket | Male | Female |
| Under 5 Years | 199 (63.8%) | 362 (96.0%) |
| 5 Years | 13 (100.0%) | 13 (100.0%) |
| 6 to 11 Years | 202 (53.6%) | 200 (56.8%) |
| 12 to 14 Years | 92 (47.7%) | 160 (100.0%) |
| 15 Years | 0 (0.0%) | 36 (100.0%) |
| 16 and 17 Years | 138 (70.4%) | 60 (49.2%) |
| 18 to 24 Years | 536 (64.1%) | 301 (44.1%) |
| 25 to 34 Years | 546 (71.2%) | 400 (73.5%) |
| 35 to 44 Years | 370 (45.7%) | 624 (70.2%) |
| 45 to 54 Years | 503 (72.6%) | 433 (66.7%) |
| 55 to 64 Years | 669 (69.7%) | 587 (67.7%) |
| 65 to 74 Years | 531 (86.3%) | 561 (81.3%) |
| 75 Years and over | 378 (87.5%) | 470 (82.3%) |
| Total | 4,177 (67.0%) | 4,207 (70.7%) |
Income Below Poverty Among Married-Couple Families in Las Vegas
The poverty statistics for married-couple families in Las Vegas show that 20.0% or 265 of the total 1,327 families live below the poverty line. Families with 3 or 4 children have the highest poverty rate of 51.9%, comprising of 80 families. On the other hand, families with no children have the lowest poverty rate of 13.0%, which includes 120 families.
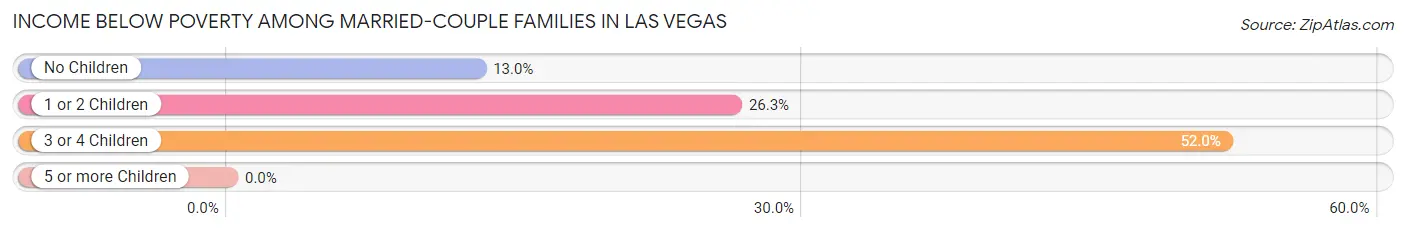
| Children | Above Poverty | Below Poverty |
| No Children | 806 (87.0%) | 120 (13.0%) |
| 1 or 2 Children | 182 (73.7%) | 65 (26.3%) |
| 3 or 4 Children | 74 (48.0%) | 80 (51.9%) |
| 5 or more Children | 0 (0.0%) | 0 (0.0%) |
| Total | 1,062 (80.0%) | 265 (20.0%) |
Income Below Poverty Among Single-Parent Households in Las Vegas
According to the poverty data in Las Vegas, 33.8% or 199 single-father households and 23.3% or 221 single-mother households are living below the poverty line. Among single-father households, those with 3 or 4 children have the highest poverty rate, with 18 households (64.3%) experiencing poverty. Likewise, among single-mother households, those with 1 or 2 children have the highest poverty rate, with 146 households (32.9%) falling below the poverty line.
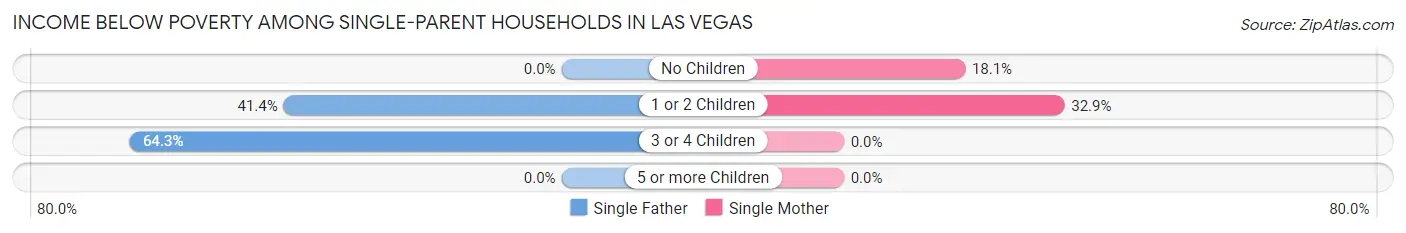
| Children | Single Father | Single Mother |
| No Children | 0 (0.0%) | 75 (18.1%) |
| 1 or 2 Children | 181 (41.4%) | 146 (32.9%) |
| 3 or 4 Children | 18 (64.3%) | 0 (0.0%) |
| 5 or more Children | 0 (0.0%) | 0 (0.0%) |
| Total | 199 (33.8%) | 221 (23.3%) |
Income Below Poverty Among Married-Couple vs Single-Parent Households in Las Vegas
The poverty data for Las Vegas shows that 265 of the married-couple family households (20.0%) and 420 of the single-parent households (27.3%) are living below the poverty level. Within the married-couple family households, those with 3 or 4 children have the highest poverty rate, with 80 households (51.9%) falling below the poverty line. Among the single-parent households, those with 1 or 2 children have the highest poverty rate, with 327 household (37.1%) living below poverty.
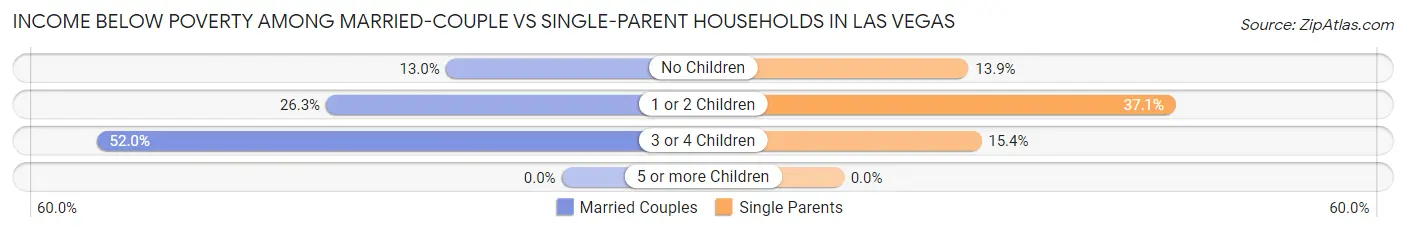
| Children | Married-Couple Families | Single-Parent Households |
| No Children | 120 (13.0%) | 75 (13.9%) |
| 1 or 2 Children | 65 (26.3%) | 327 (37.1%) |
| 3 or 4 Children | 80 (51.9%) | 18 (15.4%) |
| 5 or more Children | 0 (0.0%) | 0 (0.0%) |
| Total | 265 (20.0%) | 420 (27.3%) |
Race in Las Vegas
The most populous races in Las Vegas are Hispanic or Latino (10,340 | 78.4%), White / Caucasian (7,021 | 53.2%), and Some other Race (2,819 | 21.4%).
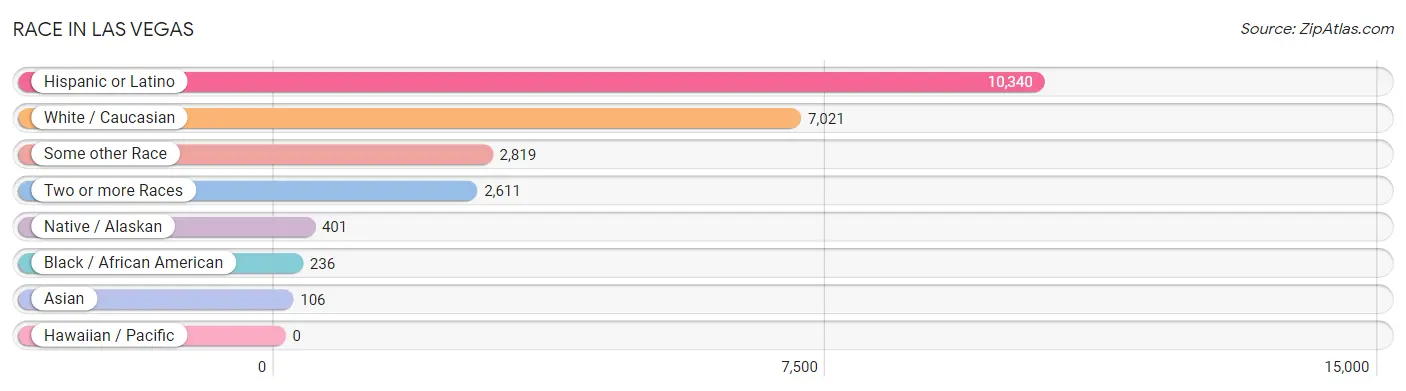
| Race | # Population | % Population |
| Asian | 106 | 0.8% |
| Black / African American | 236 | 1.8% |
| Hawaiian / Pacific | 0 | 0.0% |
| Hispanic or Latino | 10,340 | 78.4% |
| Native / Alaskan | 401 | 3.0% |
| White / Caucasian | 7,021 | 53.2% |
| Two or more Races | 2,611 | 19.8% |
| Some other Race | 2,819 | 21.4% |
| Total | 13,194 | 100.0% |
Ancestry in Las Vegas
The most populous ancestries reported in Las Vegas are Mexican (4,111 | 31.2%), Spaniard (1,365 | 10.3%), Spanish (1,171 | 8.9%), German (715 | 5.4%), and American (544 | 4.1%), together accounting for 59.9% of all Las Vegas residents.
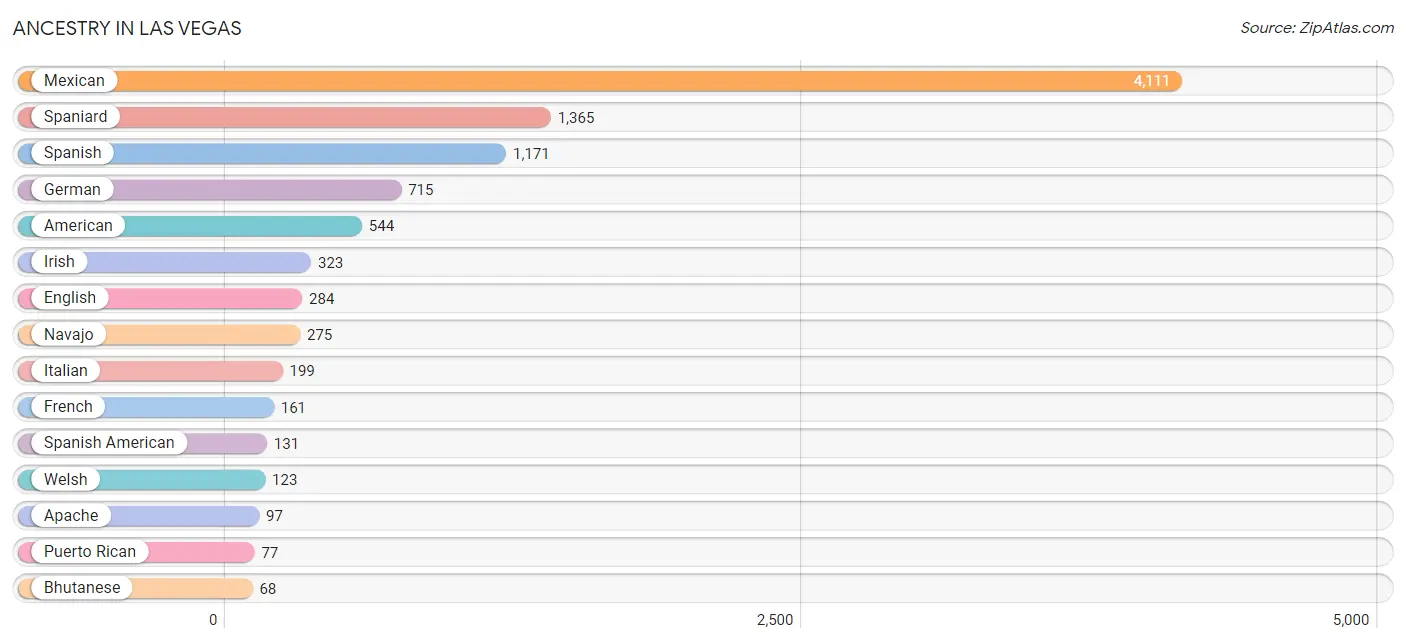
| Ancestry | # Population | % Population |
| Afghan | 33 | 0.3% |
| African | 9 | 0.1% |
| American | 544 | 4.1% |
| Apache | 97 | 0.7% |
| Arab | 7 | 0.1% |
| Austrian | 6 | 0.1% |
| Bhutanese | 68 | 0.5% |
| British | 58 | 0.4% |
| Burmese | 31 | 0.2% |
| Central American | 7 | 0.1% |
| Cuban | 5 | 0.0% |
| Dutch | 34 | 0.3% |
| Eastern European | 19 | 0.1% |
| English | 284 | 2.1% |
| European | 60 | 0.4% |
| Finnish | 7 | 0.1% |
| French | 161 | 1.2% |
| French Canadian | 5 | 0.0% |
| German | 715 | 5.4% |
| Guatemalan | 7 | 0.1% |
| Irish | 323 | 2.5% |
| Italian | 199 | 1.5% |
| Jamaican | 43 | 0.3% |
| Mexican | 4,111 | 31.2% |
| Mexican American Indian | 20 | 0.2% |
| Navajo | 275 | 2.1% |
| Northern European | 20 | 0.2% |
| Norwegian | 17 | 0.1% |
| Peruvian | 21 | 0.2% |
| Polish | 23 | 0.2% |
| Portuguese | 21 | 0.2% |
| Pueblo | 40 | 0.3% |
| Puerto Rican | 77 | 0.6% |
| Russian | 27 | 0.2% |
| Scotch-Irish | 44 | 0.3% |
| Scottish | 62 | 0.5% |
| Serbian | 33 | 0.3% |
| Sierra Leonean | 2 | 0.0% |
| Slovene | 11 | 0.1% |
| South American | 21 | 0.2% |
| Spaniard | 1,365 | 10.3% |
| Spanish | 1,171 | 8.9% |
| Spanish American | 131 | 1.0% |
| Sri Lankan | 16 | 0.1% |
| Subsaharan African | 11 | 0.1% |
| Swedish | 30 | 0.2% |
| Welsh | 123 | 0.9% | View All 47 Rows |
Immigrants in Las Vegas
The most numerous immigrant groups reported in Las Vegas came from Latin America (233 | 1.8%), Central America (188 | 1.4%), Mexico (181 | 1.4%), Asia (86 | 0.6%), and South Central Asia (54 | 0.4%), together accounting for 5.6% of all Las Vegas residents.
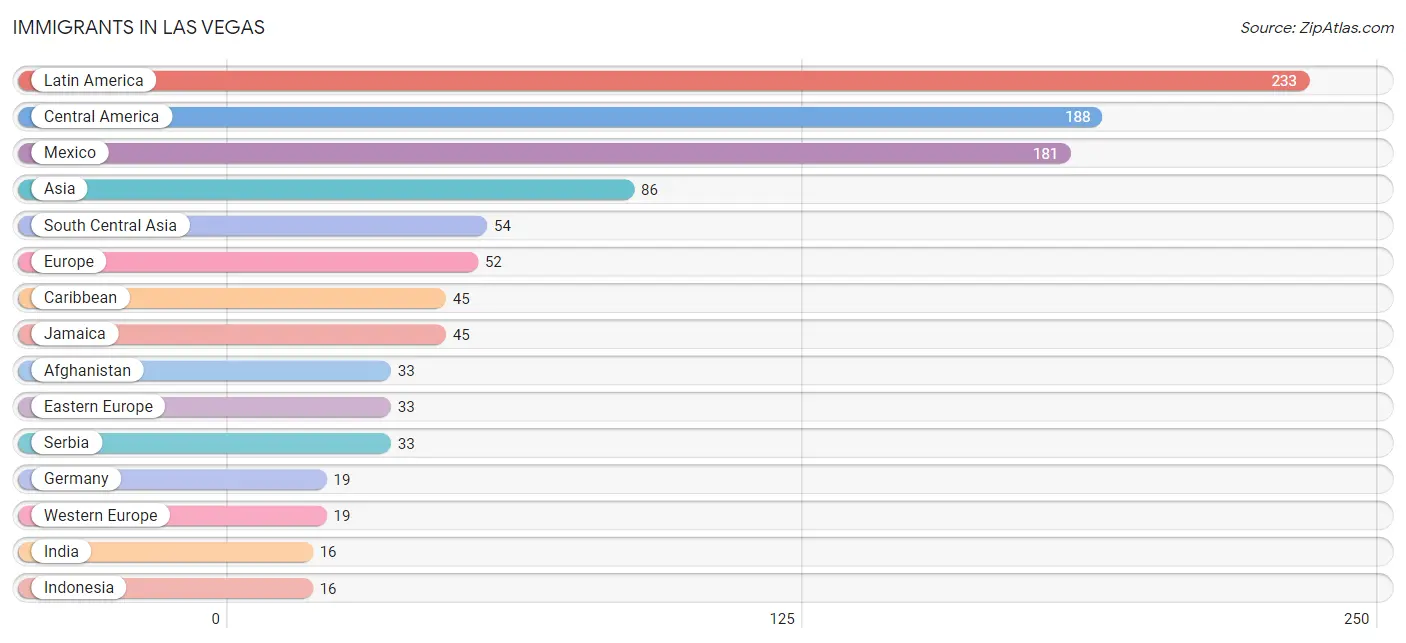
| Immigration Origin | # Population | % Population |
| Afghanistan | 33 | 0.3% |
| Africa | 3 | 0.0% |
| Asia | 86 | 0.6% |
| Caribbean | 45 | 0.3% |
| Central America | 188 | 1.4% |
| Eastern Asia | 9 | 0.1% |
| Eastern Europe | 33 | 0.3% |
| Europe | 52 | 0.4% |
| Germany | 19 | 0.1% |
| Guatemala | 7 | 0.1% |
| India | 16 | 0.1% |
| Indonesia | 16 | 0.1% |
| Jamaica | 45 | 0.3% |
| Japan | 9 | 0.1% |
| Latin America | 233 | 1.8% |
| Mexico | 181 | 1.4% |
| Oceania | 16 | 0.1% |
| Pakistan | 5 | 0.0% |
| Serbia | 33 | 0.3% |
| Sierra Leone | 2 | 0.0% |
| South Central Asia | 54 | 0.4% |
| South Eastern Asia | 16 | 0.1% |
| Western Africa | 2 | 0.0% |
| Western Europe | 19 | 0.1% | View All 24 Rows |
Sex and Age in Las Vegas
Sex and Age in Las Vegas
The most populous age groups in Las Vegas are 20 to 24 Years (730 | 10.7%) for men and 20 to 24 Years (657 | 10.3%) for women.
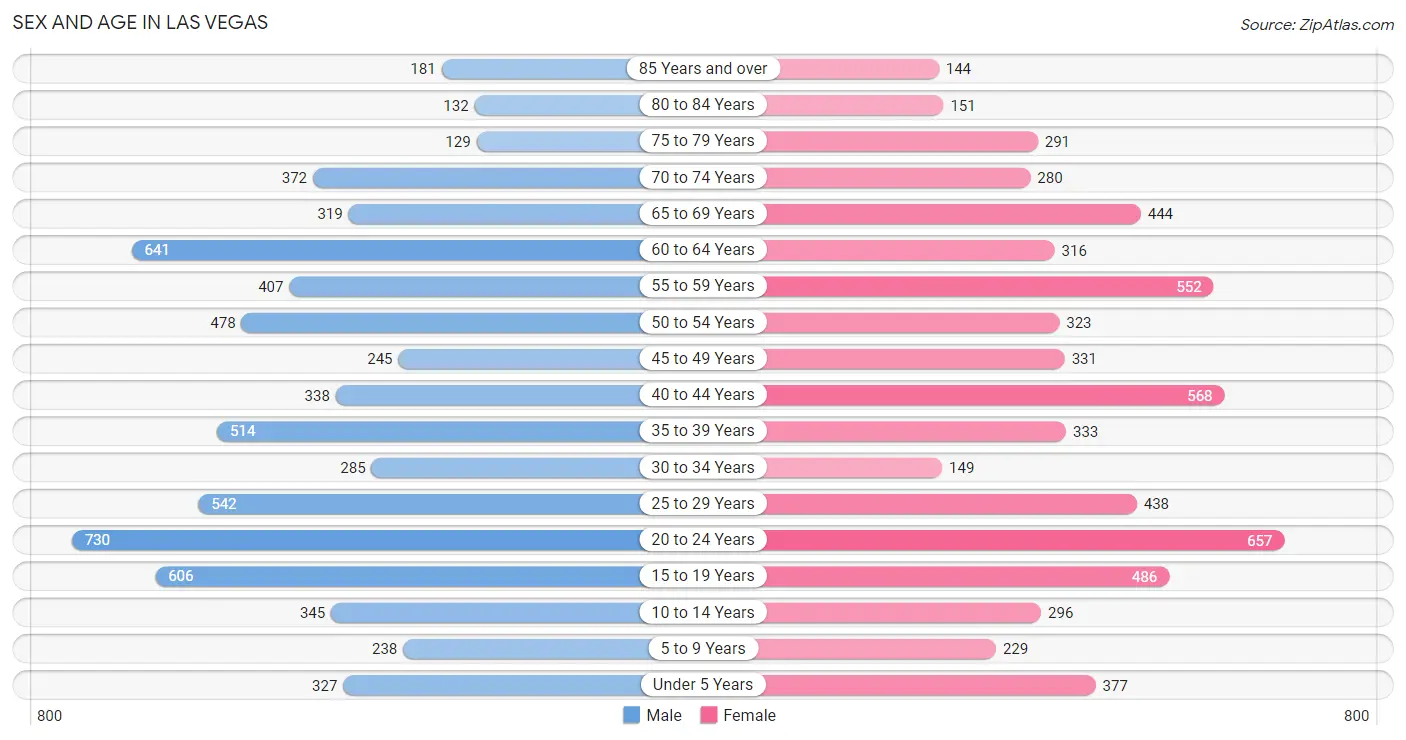
| Age Bracket | Male | Female |
| Under 5 Years | 327 (4.8%) | 377 (5.9%) |
| 5 to 9 Years | 238 (3.5%) | 229 (3.6%) |
| 10 to 14 Years | 345 (5.1%) | 296 (4.6%) |
| 15 to 19 Years | 606 (8.9%) | 486 (7.6%) |
| 20 to 24 Years | 730 (10.7%) | 657 (10.3%) |
| 25 to 29 Years | 542 (7.9%) | 438 (6.9%) |
| 30 to 34 Years | 285 (4.2%) | 149 (2.3%) |
| 35 to 39 Years | 514 (7.5%) | 333 (5.2%) |
| 40 to 44 Years | 338 (5.0%) | 568 (8.9%) |
| 45 to 49 Years | 245 (3.6%) | 331 (5.2%) |
| 50 to 54 Years | 478 (7.0%) | 323 (5.1%) |
| 55 to 59 Years | 407 (6.0%) | 552 (8.7%) |
| 60 to 64 Years | 641 (9.4%) | 316 (5.0%) |
| 65 to 69 Years | 319 (4.7%) | 444 (7.0%) |
| 70 to 74 Years | 372 (5.4%) | 280 (4.4%) |
| 75 to 79 Years | 129 (1.9%) | 291 (4.6%) |
| 80 to 84 Years | 132 (1.9%) | 151 (2.4%) |
| 85 Years and over | 181 (2.6%) | 144 (2.3%) |
| Total | 6,829 (100.0%) | 6,365 (100.0%) |
Families and Households in Las Vegas
Median Family Size in Las Vegas
The median family size in Las Vegas is 2.77 persons per family, with married-couple families (1,327 | 46.4%) accounting for the largest median family size of 2.98 persons per family. On the other hand, single male/father families (588 | 20.5%) represent the smallest median family size with 2.54 persons per family.
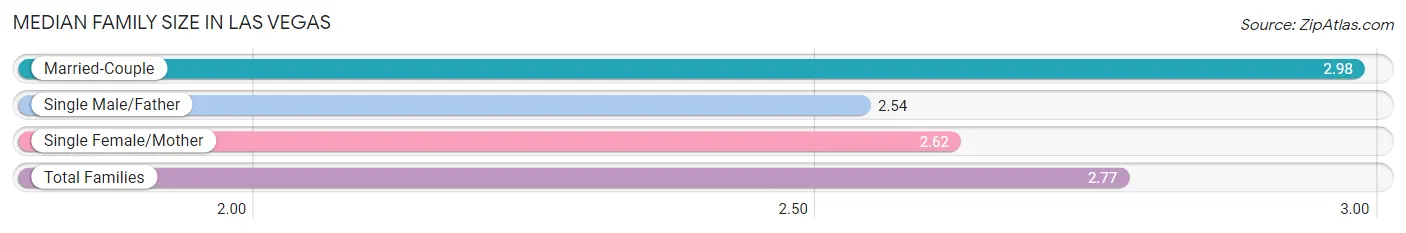
| Family Type | # Families | Family Size |
| Married-Couple | 1,327 (46.4%) | 2.98 |
| Single Male/Father | 588 (20.5%) | 2.54 |
| Single Female/Mother | 948 (33.1%) | 2.62 |
| Total Families | 2,863 (100.0%) | 2.77 |
Median Household Size in Las Vegas
The median household size in Las Vegas is 2.12 persons per household, with single male/father households (588 | 10.4%) accounting for the largest median household size of 3.21 persons per household. non-family households (2,795 | 49.4%) represent the smallest median household size with 1.18 persons per household.
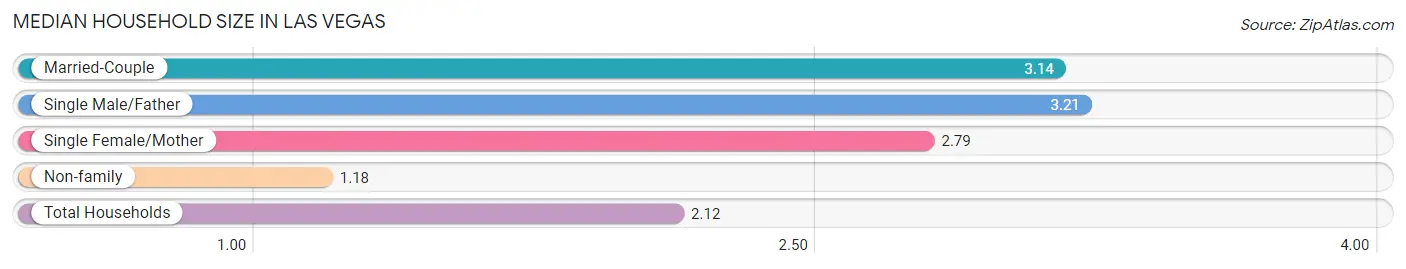
| Household Type | # Households | Household Size |
| Married-Couple | 1,327 (23.4%) | 3.14 |
| Single Male/Father | 588 (10.4%) | 3.21 |
| Single Female/Mother | 948 (16.8%) | 2.79 |
| Non-family | 2,795 (49.4%) | 1.18 |
| Total Households | 5,658 (100.0%) | 2.12 |
Household Size by Marriage Status in Las Vegas
Out of a total of 5,658 households in Las Vegas, 2,863 (50.6%) are family households, while 2,795 (49.4%) are nonfamily households. The most numerous type of family households are 2-person households, comprising 1,538, and the most common type of nonfamily households are 1-person households, comprising 2,444.
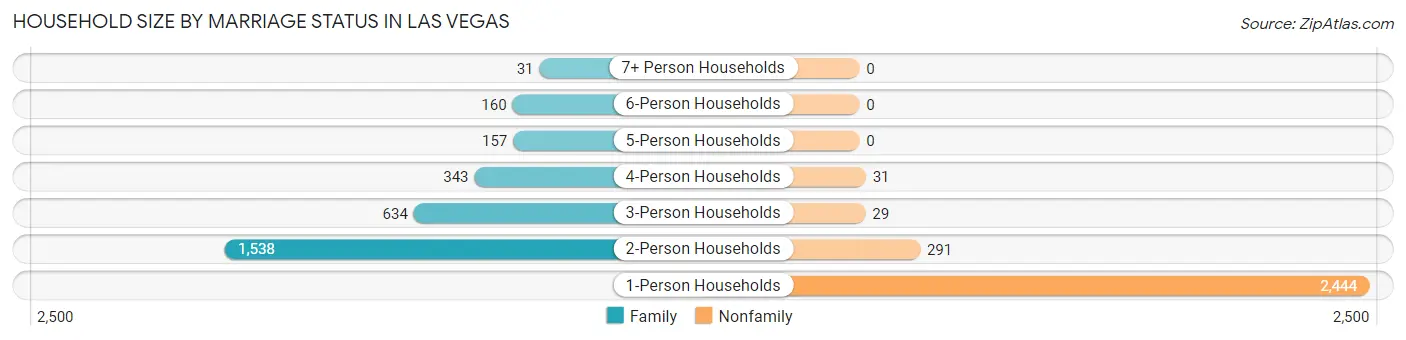
| Household Size | Family Households | Nonfamily Households |
| 1-Person Households | - | 2,444 (43.2%) |
| 2-Person Households | 1,538 (27.2%) | 291 (5.1%) |
| 3-Person Households | 634 (11.2%) | 29 (0.5%) |
| 4-Person Households | 343 (6.1%) | 31 (0.5%) |
| 5-Person Households | 157 (2.8%) | 0 (0.0%) |
| 6-Person Households | 160 (2.8%) | 0 (0.0%) |
| 7+ Person Households | 31 (0.5%) | 0 (0.0%) |
| Total | 2,863 (50.6%) | 2,795 (49.4%) |
Female Fertility in Las Vegas
Fertility by Age in Las Vegas
Average fertility rate in Las Vegas is 47.0 births per 1,000 women. Women in the age bracket of 20 to 34 years have the highest fertility rate with 101.0 births per 1,000 women. Women in the age bracket of 20 to 34 years acount for 86.9% of all women with births.
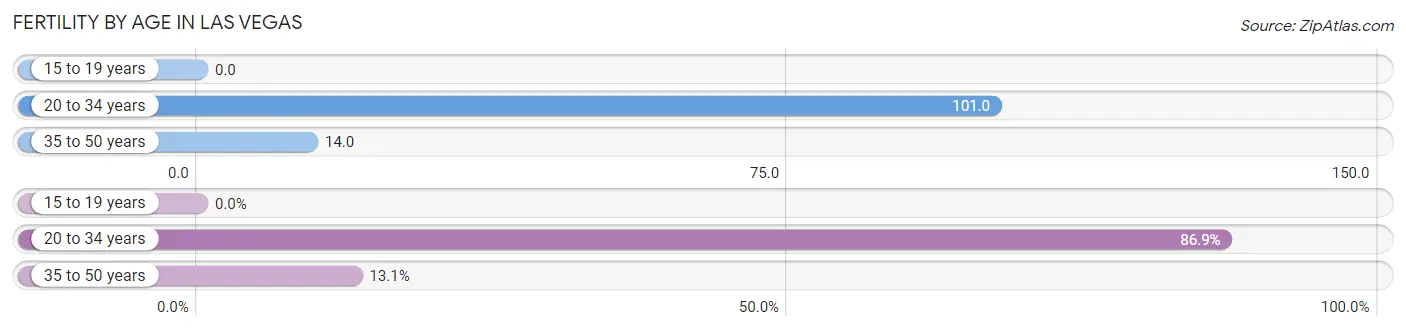
| Age Bracket | Women with Births | Births / 1,000 Women |
| 15 to 19 years | 0 (0.0%) | 0.0 |
| 20 to 34 years | 126 (86.9%) | 101.0 |
| 35 to 50 years | 19 (13.1%) | 14.0 |
| Total | 145 (100.0%) | 47.0 |
Fertility by Age by Marriage Status in Las Vegas
15.9% of women with births (145) in Las Vegas are married. The highest percentage of unmarried women with births falls into 20 to 34 years age bracket with 96.8% of them unmarried at the time of birth, while the lowest percentage of unmarried women with births belong to 35 to 50 years age bracket with 0.0% of them unmarried.
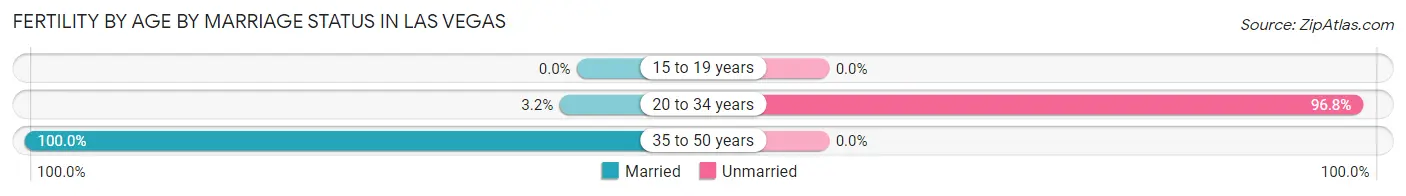
| Age Bracket | Married | Unmarried |
| 15 to 19 years | 0 (0.0%) | 0 (0.0%) |
| 20 to 34 years | 4 (3.2%) | 122 (96.8%) |
| 35 to 50 years | 19 (100.0%) | 0 (0.0%) |
| Total | 23 (15.9%) | 122 (84.1%) |
Fertility by Education in Las Vegas
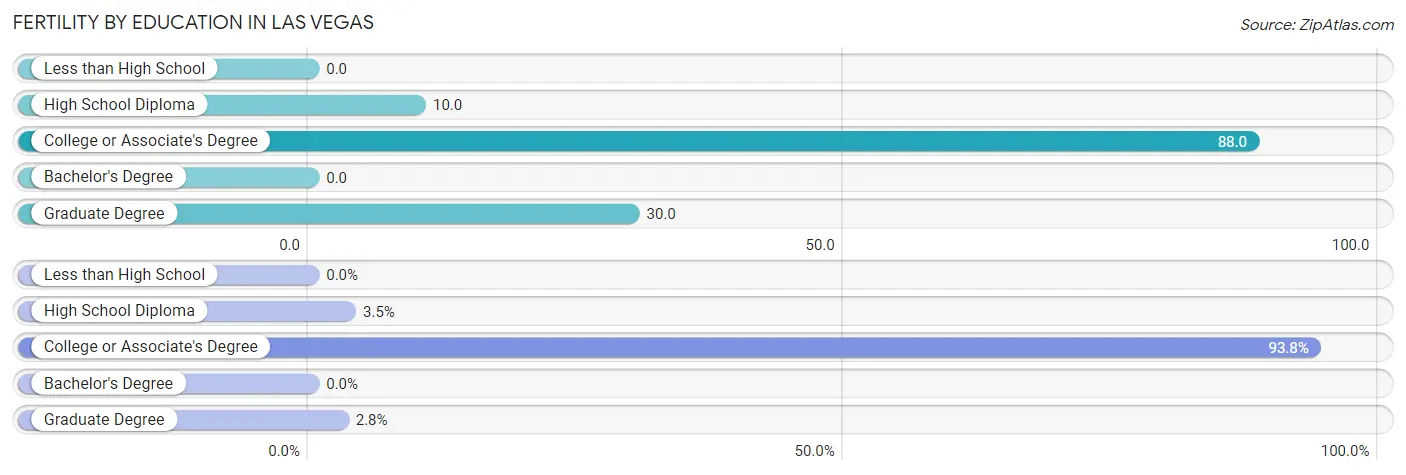
| Educational Attainment | Women with Births | Births / 1,000 Women |
| Less than High School | 0 (0.0%) | 0.0 |
| High School Diploma | 5 (3.5%) | 10.0 |
| College or Associate's Degree | 136 (93.8%) | 88.0 |
| Bachelor's Degree | 0 (0.0%) | 0.0 |
| Graduate Degree | 4 (2.8%) | 30.0 |
| Total | 145 (100.0%) | 47.0 |
Fertility by Education by Marriage Status in Las Vegas
84.1% of women with births in Las Vegas are unmarried. Women with the educational attainment of high school diploma are most likely to be married with 100.0% of them married at childbirth, while women with the educational attainment of college or associate's degree are least likely to be married with 89.7% of them unmarried at childbirth.
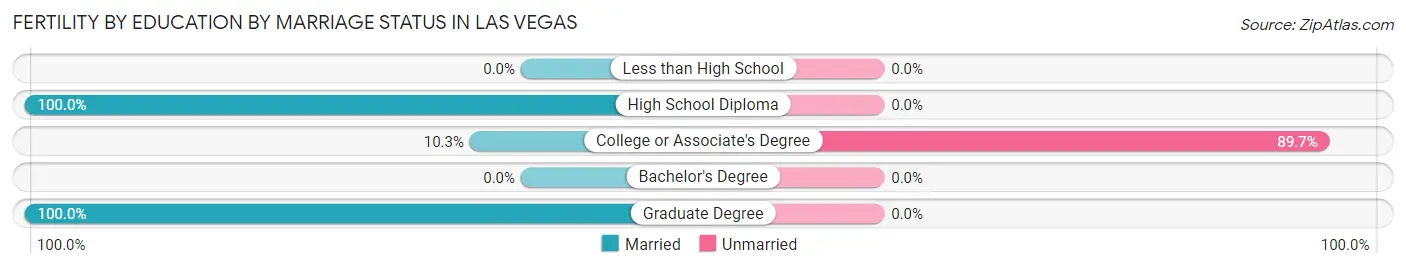
| Educational Attainment | Married | Unmarried |
| Less than High School | 0 (0.0%) | 0 (0.0%) |
| High School Diploma | 5 (100.0%) | 0 (0.0%) |
| College or Associate's Degree | 14 (10.3%) | 122 (89.7%) |
| Bachelor's Degree | 0 (0.0%) | 0 (0.0%) |
| Graduate Degree | 4 (100.0%) | 0 (0.0%) |
| Total | 23 (15.9%) | 122 (84.1%) |
Employment Characteristics in Las Vegas
Employment by Class of Employer in Las Vegas
Among the 4,848 employed individuals in Las Vegas, private company employees (1,951 | 40.2%), state government employees (1,387 | 28.6%), and local government employees (536 | 11.1%) make up the most common classes of employment.
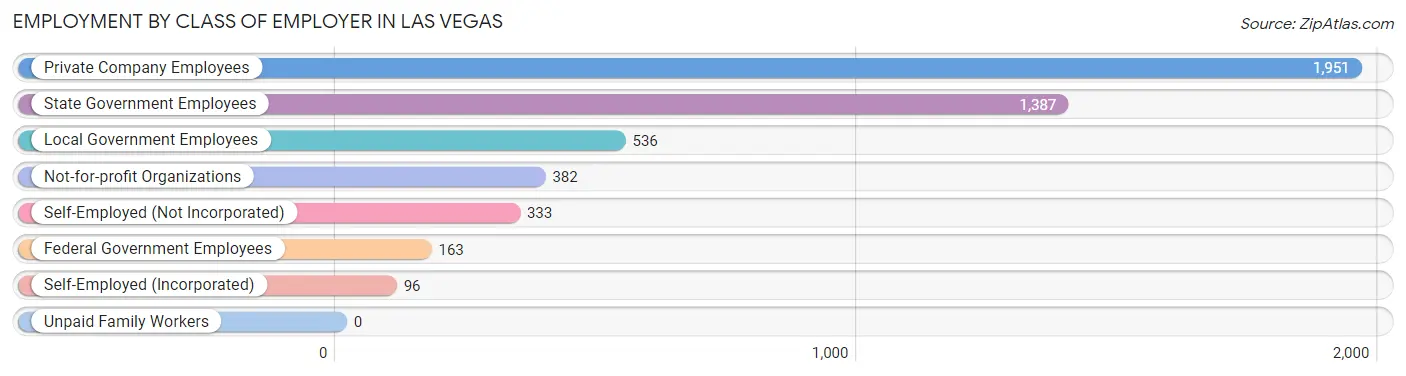
| Employer Class | # Employees | % Employees |
| Private Company Employees | 1,951 | 40.2% |
| Self-Employed (Incorporated) | 96 | 2.0% |
| Self-Employed (Not Incorporated) | 333 | 6.9% |
| Not-for-profit Organizations | 382 | 7.9% |
| Local Government Employees | 536 | 11.1% |
| State Government Employees | 1,387 | 28.6% |
| Federal Government Employees | 163 | 3.4% |
| Unpaid Family Workers | 0 | 0.0% |
| Total | 4,848 | 100.0% |
Employment Status by Age in Las Vegas
According to the labor force statistics for Las Vegas, out of the total population over 16 years of age (11,317), 49.6% or 5,613 individuals are in the labor force, with 7.9% or 443 of them unemployed. The age group with the highest labor force participation rate is 35 to 44 years, with 84.9% or 1,488 individuals in the labor force. Within the labor force, the 16 to 19 years age range has the highest percentage of unemployed individuals, with 16.9% or 38 of them being unemployed.
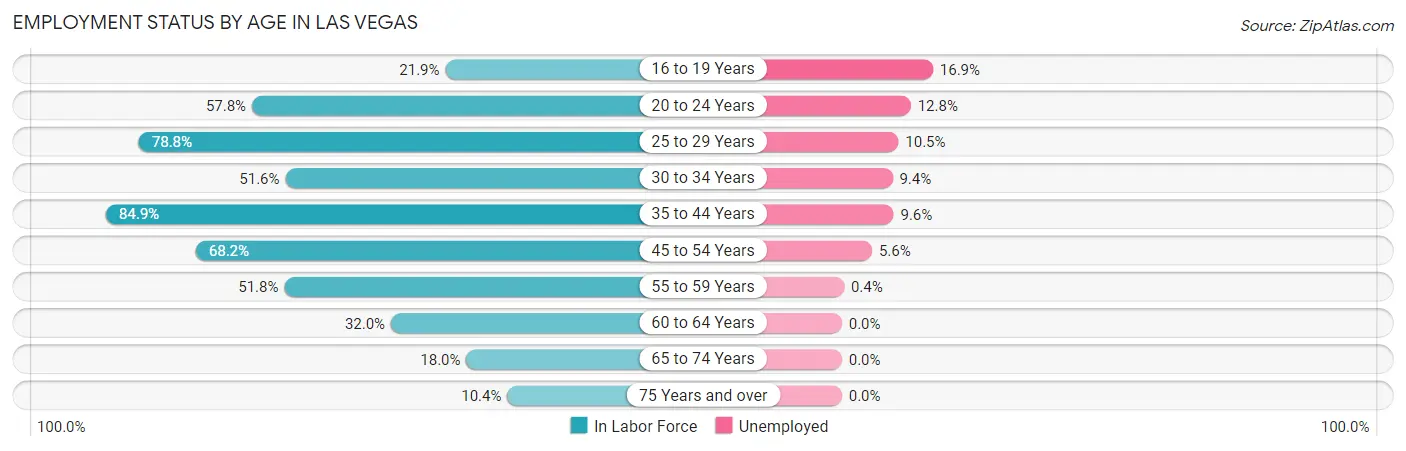
| Age Bracket | In Labor Force | Unemployed |
| 16 to 19 Years | 225 (21.9%) | 38 (16.9%) |
| 20 to 24 Years | 802 (57.8%) | 103 (12.8%) |
| 25 to 29 Years | 772 (78.8%) | 81 (10.5%) |
| 30 to 34 Years | 224 (51.6%) | 21 (9.4%) |
| 35 to 44 Years | 1,488 (84.9%) | 143 (9.6%) |
| 45 to 54 Years | 939 (68.2%) | 53 (5.6%) |
| 55 to 59 Years | 497 (51.8%) | 2 (0.4%) |
| 60 to 64 Years | 306 (32.0%) | 0 (0.0%) |
| 65 to 74 Years | 255 (18.0%) | 0 (0.0%) |
| 75 Years and over | 107 (10.4%) | 0 (0.0%) |
| Total | 5,613 (49.6%) | 443 (7.9%) |
Employment Status by Educational Attainment in Las Vegas
According to labor force statistics for Las Vegas, 65.4% of individuals (4,225) out of the total population between 25 and 64 years of age (6,460) are in the labor force, with 7.1% or 300 of them being unemployed. The group with the highest labor force participation rate are those with the educational attainment of college / associate degree, with 79.9% or 1,737 individuals in the labor force. Within the labor force, individuals with college / associate degree education have the highest percentage of unemployment, with 10.1% or 175 of them being unemployed.
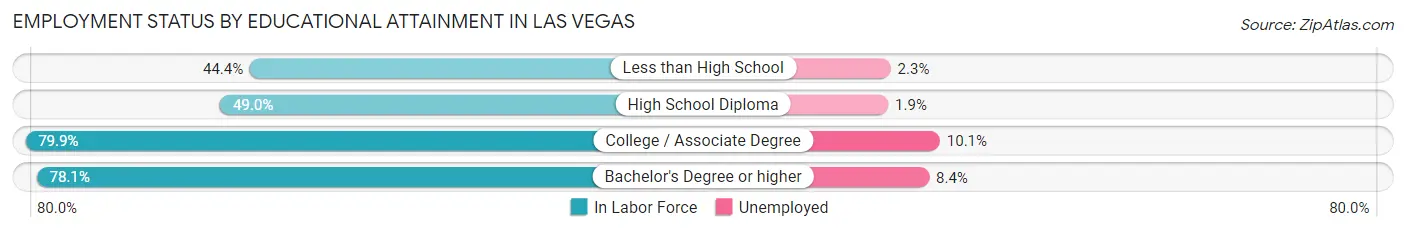
| Educational Attainment | In Labor Force | Unemployed |
| Less than High School | 427 (44.4%) | 22 (2.3%) |
| High School Diploma | 902 (49.0%) | 35 (1.9%) |
| College / Associate Degree | 1,737 (79.9%) | 220 (10.1%) |
| Bachelor's Degree or higher | 1,160 (78.1%) | 125 (8.4%) |
| Total | 4,225 (65.4%) | 459 (7.1%) |
Employment Occupations by Sex in Las Vegas
Management, Business, Science and Arts Occupations
The most common Management, Business, Science and Arts occupations in Las Vegas are Community & Social Service (771 | 14.9%), Education Instruction & Library (579 | 11.2%), Management (535 | 10.3%), Computers, Engineering & Science (231 | 4.5%), and Health Diagnosing & Treating (194 | 3.7%).
Management, Business, Science and Arts Occupations by Sex
Within the Management, Business, Science and Arts occupations in Las Vegas, the most male-oriented occupations are Architecture & Engineering (100.0%), Legal Services & Support (100.0%), and Management (54.2%), while the most female-oriented occupations are Health Diagnosing & Treating (96.4%), Health Technologists (94.4%), and Education, Arts & Media (90.5%).
| Occupation | Male | Female |
| Management | 290 (54.2%) | 245 (45.8%) |
| Business & Financial | 47 (43.5%) | 61 (56.5%) |
| Computers, Engineering & Science | 105 (45.5%) | 126 (54.5%) |
| Computers & Mathematics | 27 (30.3%) | 62 (69.7%) |
| Architecture & Engineering | 47 (100.0%) | 0 (0.0%) |
| Life, Physical & Social Science | 31 (32.6%) | 64 (67.4%) |
| Community & Social Service | 254 (32.9%) | 517 (67.1%) |
| Education, Arts & Media | 9 (9.5%) | 86 (90.5%) |
| Legal Services & Support | 16 (100.0%) | 0 (0.0%) |
| Education Instruction & Library | 189 (32.6%) | 390 (67.4%) |
| Arts, Media & Entertainment | 40 (49.4%) | 41 (50.6%) |
| Health Diagnosing & Treating | 7 (3.6%) | 187 (96.4%) |
| Health Technologists | 7 (5.7%) | 117 (94.4%) |
| Total (Category) | 703 (38.2%) | 1,136 (61.8%) |
| Total (Overall) | 2,561 (49.5%) | 2,612 (50.5%) |
Services Occupations
The most common Services occupations in Las Vegas are Food Preparation & Serving (473 | 9.1%), Cleaning & Maintenance (426 | 8.2%), Healthcare Support (340 | 6.6%), Security & Protection (259 | 5.0%), and Firefighting & Prevention (152 | 2.9%).
Services Occupations by Sex
Within the Services occupations in Las Vegas, the most male-oriented occupations are Firefighting & Prevention (100.0%), Security & Protection (86.5%), and Cleaning & Maintenance (86.4%), while the most female-oriented occupations are Food Preparation & Serving (69.6%), Healthcare Support (57.9%), and Personal Care & Service (43.7%).
| Occupation | Male | Female |
| Healthcare Support | 143 (42.1%) | 197 (57.9%) |
| Security & Protection | 224 (86.5%) | 35 (13.5%) |
| Firefighting & Prevention | 152 (100.0%) | 0 (0.0%) |
| Law Enforcement | 72 (67.3%) | 35 (32.7%) |
| Food Preparation & Serving | 144 (30.4%) | 329 (69.6%) |
| Cleaning & Maintenance | 368 (86.4%) | 58 (13.6%) |
| Personal Care & Service | 85 (56.3%) | 66 (43.7%) |
| Total (Category) | 964 (58.5%) | 685 (41.5%) |
| Total (Overall) | 2,561 (49.5%) | 2,612 (50.5%) |
Sales and Office Occupations
The most common Sales and Office occupations in Las Vegas are Office & Administration (472 | 9.1%), and Sales & Related (379 | 7.3%).

Sales and Office Occupations by Sex
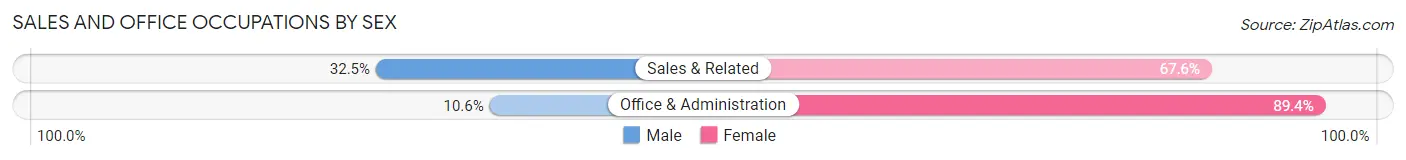
| Occupation | Male | Female |
| Sales & Related | 123 (32.5%) | 256 (67.5%) |
| Office & Administration | 50 (10.6%) | 422 (89.4%) |
| Total (Category) | 173 (20.3%) | 678 (79.7%) |
| Total (Overall) | 2,561 (49.5%) | 2,612 (50.5%) |
Natural Resources, Construction and Maintenance Occupations
The most common Natural Resources, Construction and Maintenance occupations in Las Vegas are Construction & Extraction (255 | 4.9%), Installation, Maintenance & Repair (115 | 2.2%), and Farming, Fishing & Forestry (30 | 0.6%).
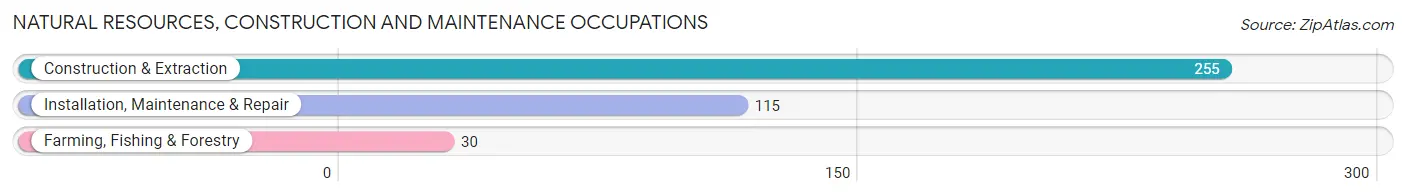
Natural Resources, Construction and Maintenance Occupations by Sex
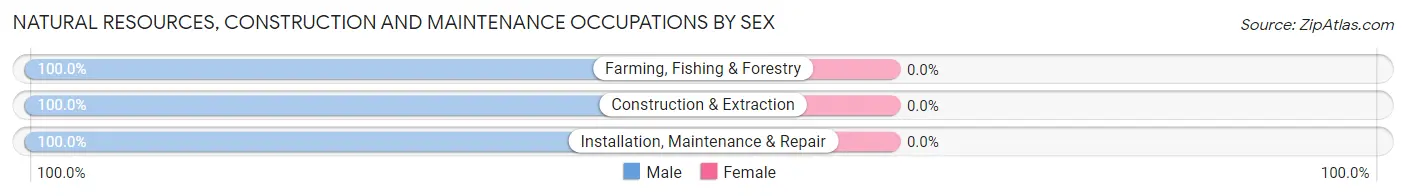
| Occupation | Male | Female |
| Farming, Fishing & Forestry | 30 (100.0%) | 0 (0.0%) |
| Construction & Extraction | 255 (100.0%) | 0 (0.0%) |
| Installation, Maintenance & Repair | 115 (100.0%) | 0 (0.0%) |
| Total (Category) | 400 (100.0%) | 0 (0.0%) |
| Total (Overall) | 2,561 (49.5%) | 2,612 (50.5%) |
Production, Transportation and Moving Occupations
The most common Production, Transportation and Moving occupations in Las Vegas are Transportation (190 | 3.7%), Production (129 | 2.5%), and Material Moving (115 | 2.2%).
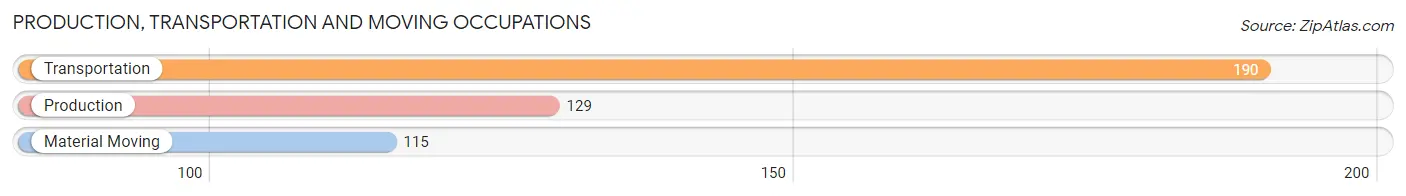
Production, Transportation and Moving Occupations by Sex
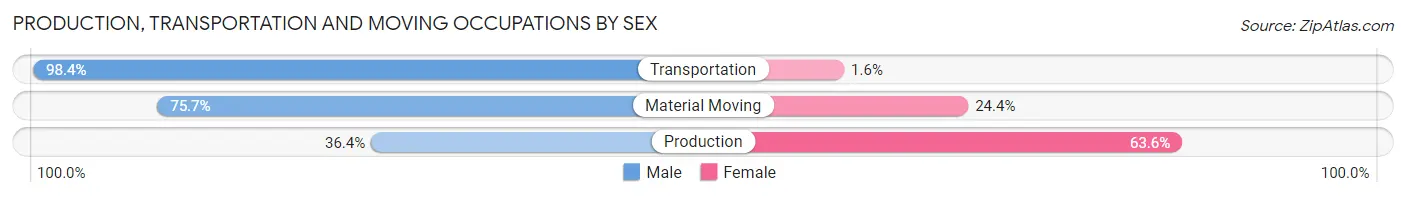
| Occupation | Male | Female |
| Production | 47 (36.4%) | 82 (63.6%) |
| Transportation | 187 (98.4%) | 3 (1.6%) |
| Material Moving | 87 (75.6%) | 28 (24.3%) |
| Total (Category) | 321 (74.0%) | 113 (26.0%) |
| Total (Overall) | 2,561 (49.5%) | 2,612 (50.5%) |
Employment Industries by Sex in Las Vegas
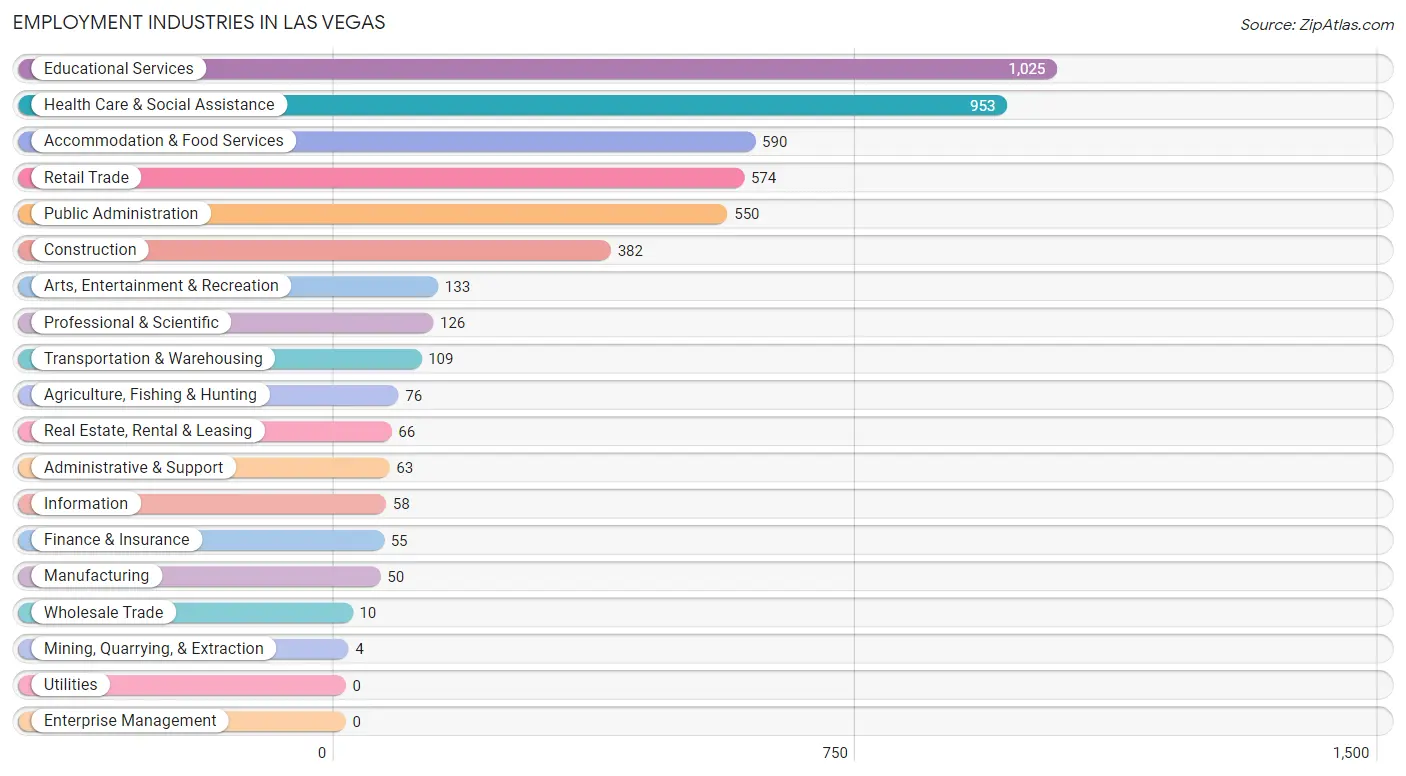
Employment Industries in Las Vegas
The major employment industries in Las Vegas include Educational Services (1,025 | 19.8%), Health Care & Social Assistance (953 | 18.4%), Accommodation & Food Services (590 | 11.4%), Retail Trade (574 | 11.1%), and Public Administration (550 | 10.6%).
Employment Industries by Sex in Las Vegas
The Las Vegas industries that see more men than women are Mining, Quarrying, & Extraction (100.0%), Construction (100.0%), and Wholesale Trade (100.0%), whereas the industries that tend to have a higher number of women are Finance & Insurance (100.0%), Arts, Entertainment & Recreation (75.9%), and Health Care & Social Assistance (67.7%).
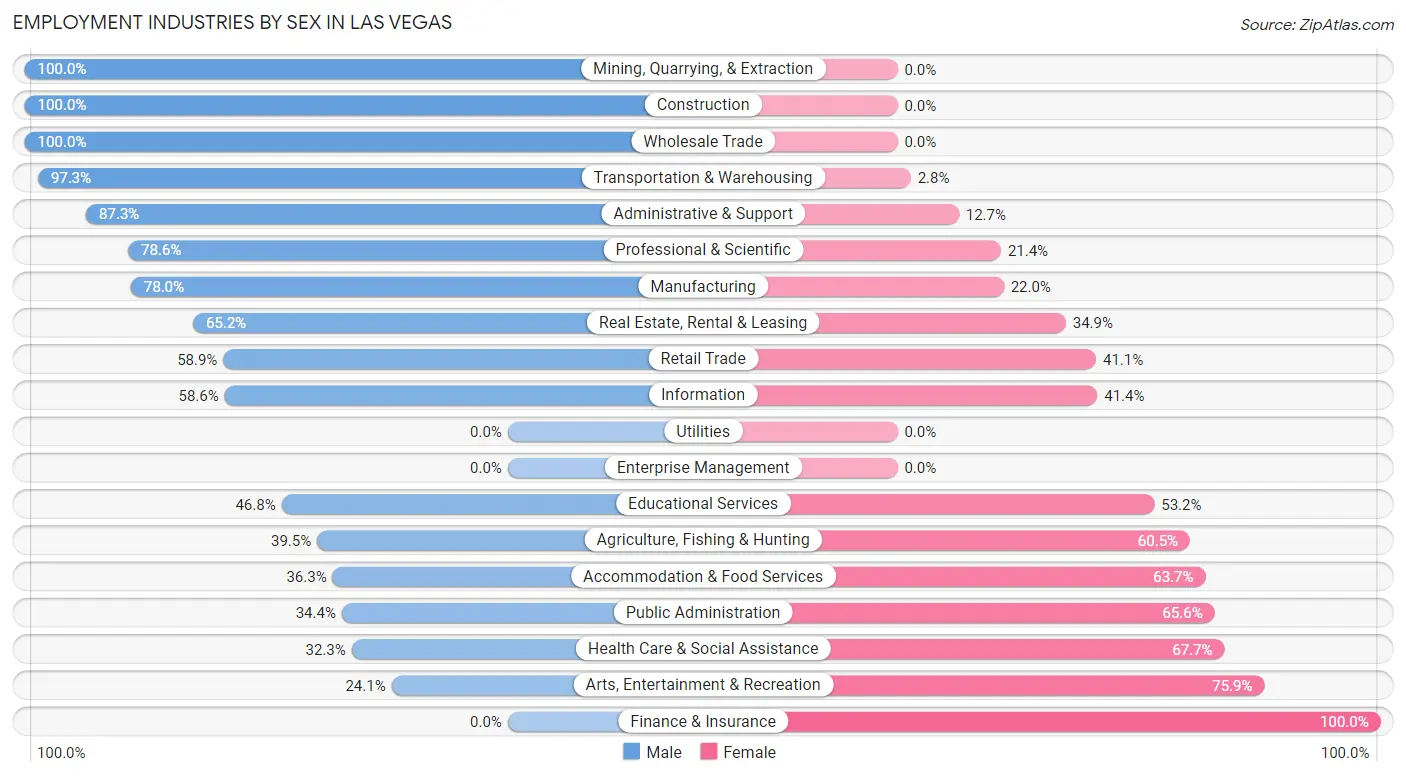
| Industry | Male | Female |
| Agriculture, Fishing & Hunting | 30 (39.5%) | 46 (60.5%) |
| Mining, Quarrying, & Extraction | 4 (100.0%) | 0 (0.0%) |
| Construction | 382 (100.0%) | 0 (0.0%) |
| Manufacturing | 39 (78.0%) | 11 (22.0%) |
| Wholesale Trade | 10 (100.0%) | 0 (0.0%) |
| Retail Trade | 338 (58.9%) | 236 (41.1%) |
| Transportation & Warehousing | 106 (97.3%) | 3 (2.8%) |
| Utilities | 0 (0.0%) | 0 (0.0%) |
| Information | 34 (58.6%) | 24 (41.4%) |
| Finance & Insurance | 0 (0.0%) | 55 (100.0%) |
| Real Estate, Rental & Leasing | 43 (65.1%) | 23 (34.8%) |
| Professional & Scientific | 99 (78.6%) | 27 (21.4%) |
| Enterprise Management | 0 (0.0%) | 0 (0.0%) |
| Administrative & Support | 55 (87.3%) | 8 (12.7%) |
| Educational Services | 480 (46.8%) | 545 (53.2%) |
| Health Care & Social Assistance | 308 (32.3%) | 645 (67.7%) |
| Arts, Entertainment & Recreation | 32 (24.1%) | 101 (75.9%) |
| Accommodation & Food Services | 214 (36.3%) | 376 (63.7%) |
| Public Administration | 189 (34.4%) | 361 (65.6%) |
| Total | 2,561 (49.5%) | 2,612 (50.5%) |
Education in Las Vegas
School Enrollment in Las Vegas
The most common levels of schooling among the 3,662 students in Las Vegas are college / undergraduate (1,754 | 47.9%), high school (672 | 18.3%), and elementary school (483 | 13.2%).
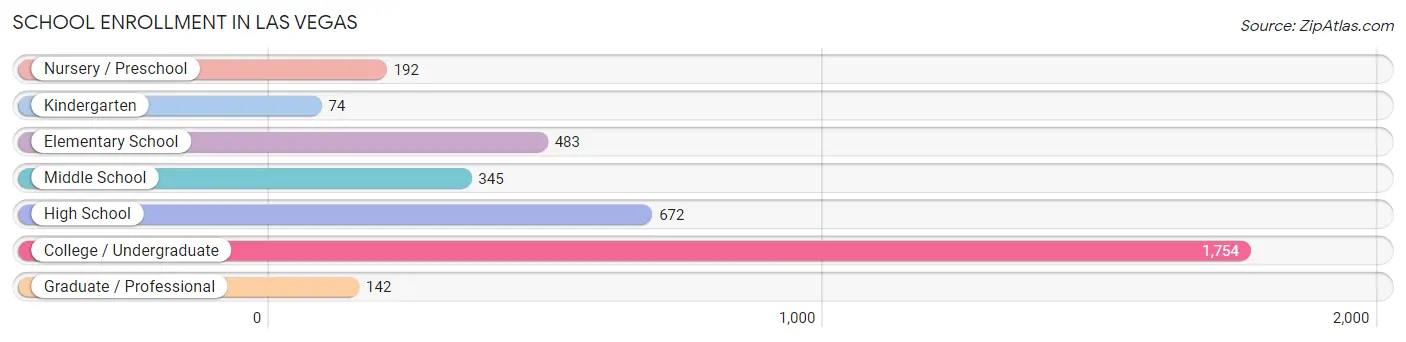
| School Level | # Students | % Students |
| Nursery / Preschool | 192 | 5.2% |
| Kindergarten | 74 | 2.0% |
| Elementary School | 483 | 13.2% |
| Middle School | 345 | 9.4% |
| High School | 672 | 18.3% |
| College / Undergraduate | 1,754 | 47.9% |
| Graduate / Professional | 142 | 3.9% |
| Total | 3,662 | 100.0% |
School Enrollment by Age by Funding Source in Las Vegas
Out of a total of 3,662 students who are enrolled in schools in Las Vegas, 168 (4.6%) attend a private institution, while the remaining 3,494 (95.4%) are enrolled in public schools. The age group of 15 to 17 year olds has the highest likelihood of being enrolled in private schools, with 47 (10.5% in the age bracket) enrolled. Conversely, the age group of 35 years and over has the lowest likelihood of being enrolled in a private school, with 435 (100.0% in the age bracket) attending a public institution.
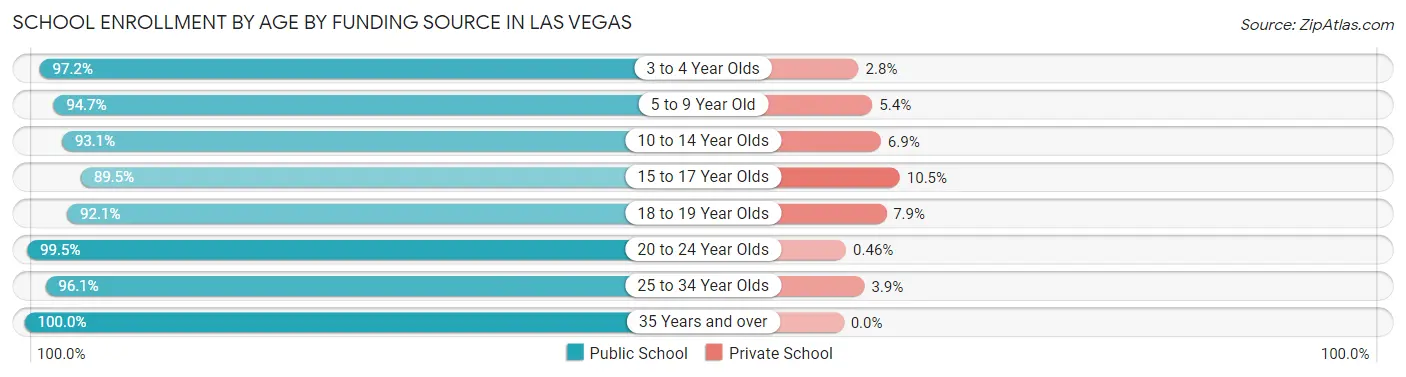
| Age Bracket | Public School | Private School |
| 3 to 4 Year Olds | 174 (97.2%) | 5 (2.8%) |
| 5 to 9 Year Old | 389 (94.7%) | 22 (5.3%) |
| 10 to 14 Year Olds | 577 (93.1%) | 43 (6.9%) |
| 15 to 17 Year Olds | 402 (89.5%) | 47 (10.5%) |
| 18 to 19 Year Olds | 499 (92.1%) | 43 (7.9%) |
| 20 to 24 Year Olds | 867 (99.5%) | 4 (0.5%) |
| 25 to 34 Year Olds | 149 (96.1%) | 6 (3.9%) |
| 35 Years and over | 435 (100.0%) | 0 (0.0%) |
| Total | 3,494 (95.4%) | 168 (4.6%) |
Educational Attainment by Field of Study in Las Vegas
Education (448 | 18.7%), business (430 | 18.0%), social sciences (213 | 8.9%), psychology (191 | 8.0%), and liberal arts & history (190 | 7.9%) are the most common fields of study among 2,394 individuals in Las Vegas who have obtained a bachelor's degree or higher.
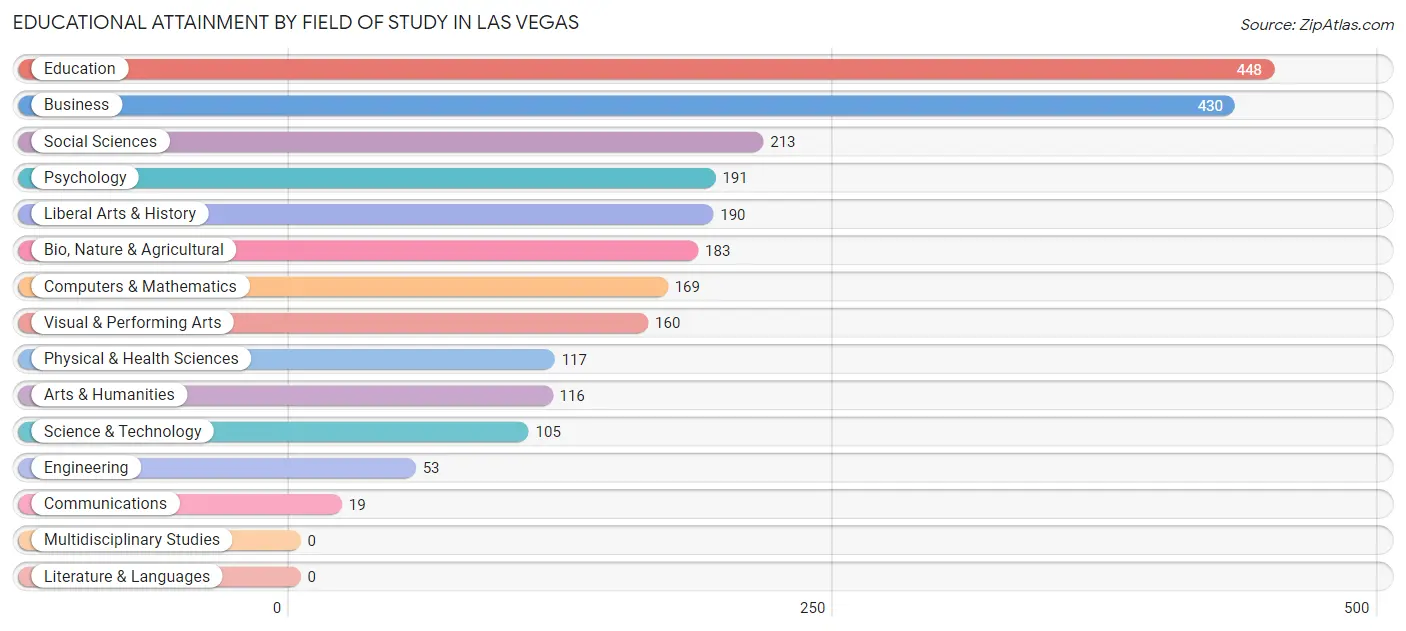
| Field of Study | # Graduates | % Graduates |
| Computers & Mathematics | 169 | 7.1% |
| Bio, Nature & Agricultural | 183 | 7.6% |
| Physical & Health Sciences | 117 | 4.9% |
| Psychology | 191 | 8.0% |
| Social Sciences | 213 | 8.9% |
| Engineering | 53 | 2.2% |
| Multidisciplinary Studies | 0 | 0.0% |
| Science & Technology | 105 | 4.4% |
| Business | 430 | 18.0% |
| Education | 448 | 18.7% |
| Literature & Languages | 0 | 0.0% |
| Liberal Arts & History | 190 | 7.9% |
| Visual & Performing Arts | 160 | 6.7% |
| Communications | 19 | 0.8% |
| Arts & Humanities | 116 | 4.9% |
| Total | 2,394 | 100.0% |
Transportation & Commute in Las Vegas
Vehicle Availability by Sex in Las Vegas
The most prevalent vehicle ownership categories in Las Vegas are males with 2 vehicles (1,031, accounting for 45.1%) and females with 2 vehicles (964, making up 44.4%).
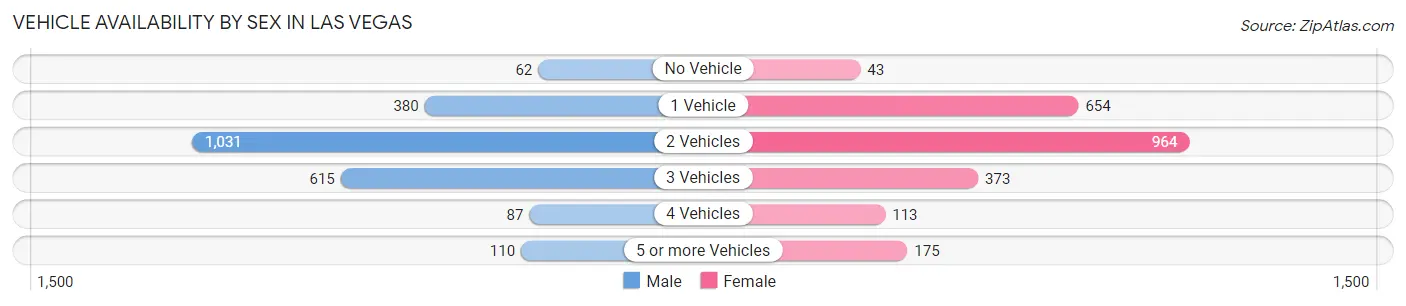
| Vehicles Available | Male | Female |
| No Vehicle | 62 (2.7%) | 43 (1.8%) |
| 1 Vehicle | 380 (16.6%) | 654 (28.2%) |
| 2 Vehicles | 1,031 (45.1%) | 964 (41.5%) |
| 3 Vehicles | 615 (26.9%) | 373 (16.1%) |
| 4 Vehicles | 87 (3.8%) | 113 (4.9%) |
| 5 or more Vehicles | 110 (4.8%) | 175 (7.5%) |
| Total | 2,285 (100.0%) | 2,322 (100.0%) |
Commute Time in Las Vegas
The most frequently occuring commute durations in Las Vegas are 5 to 9 minutes (1,812 commuters, 41.9%), 10 to 14 minutes (869 commuters, 20.1%), and less than 5 minutes (571 commuters, 13.2%).
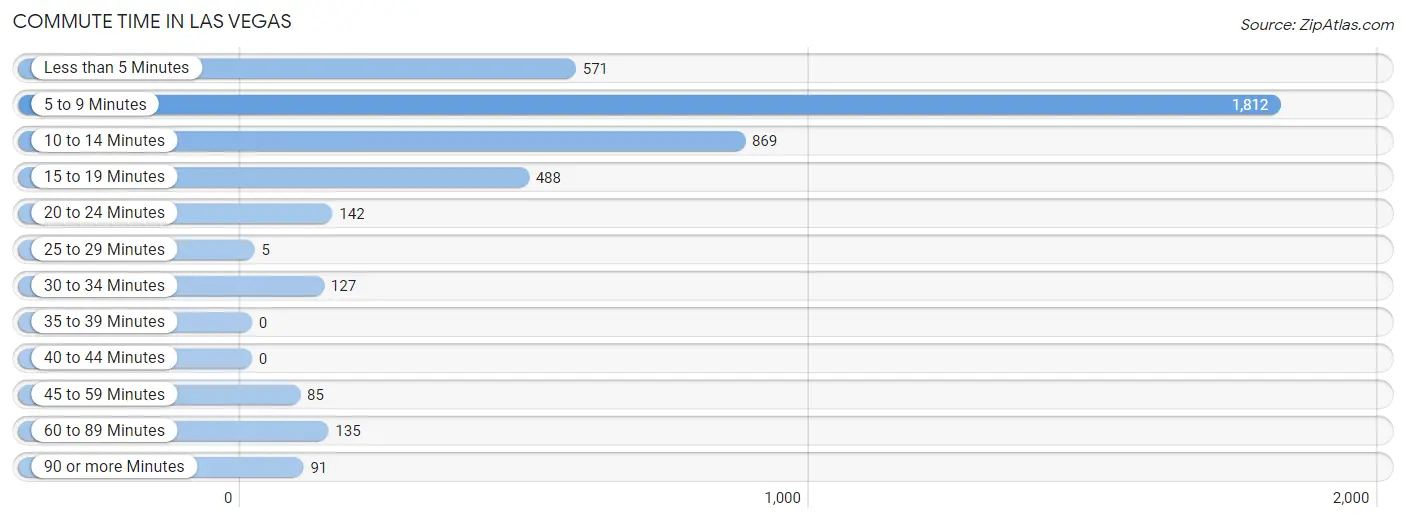
| Commute Time | # Commuters | % Commuters |
| Less than 5 Minutes | 571 | 13.2% |
| 5 to 9 Minutes | 1,812 | 41.9% |
| 10 to 14 Minutes | 869 | 20.1% |
| 15 to 19 Minutes | 488 | 11.3% |
| 20 to 24 Minutes | 142 | 3.3% |
| 25 to 29 Minutes | 5 | 0.1% |
| 30 to 34 Minutes | 127 | 2.9% |
| 35 to 39 Minutes | 0 | 0.0% |
| 40 to 44 Minutes | 0 | 0.0% |
| 45 to 59 Minutes | 85 | 2.0% |
| 60 to 89 Minutes | 135 | 3.1% |
| 90 or more Minutes | 91 | 2.1% |
Commute Time by Sex in Las Vegas
The most common commute times in Las Vegas are 5 to 9 minutes (822 commuters, 37.4%) for males and 5 to 9 minutes (990 commuters, 46.6%) for females.
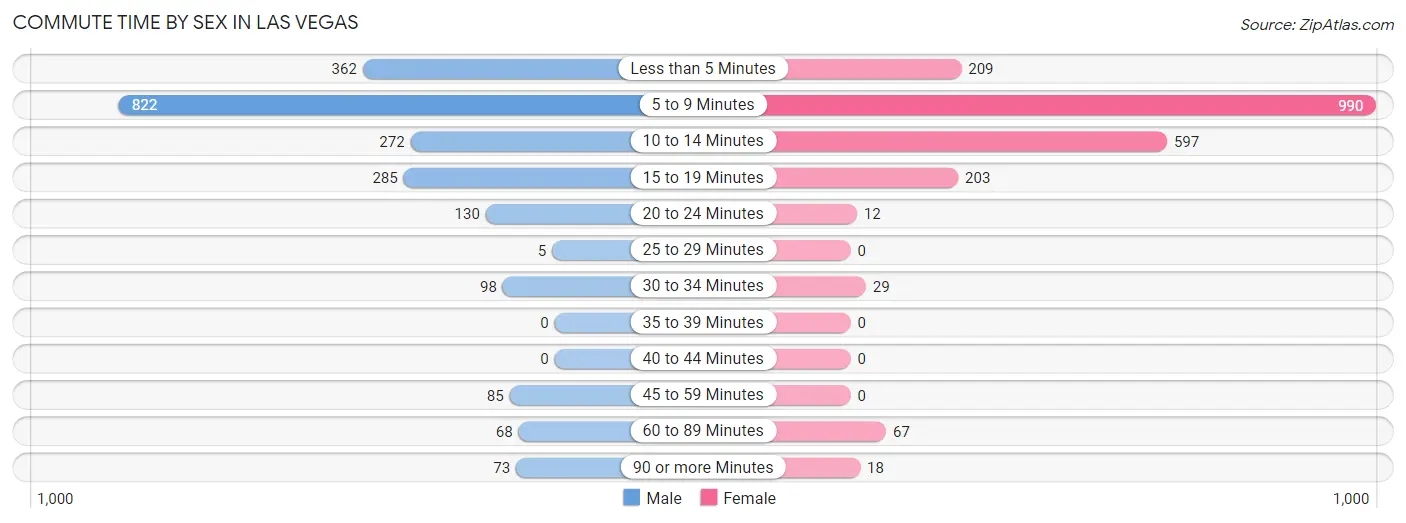
| Commute Time | Male | Female |
| Less than 5 Minutes | 362 (16.5%) | 209 (9.8%) |
| 5 to 9 Minutes | 822 (37.4%) | 990 (46.6%) |
| 10 to 14 Minutes | 272 (12.4%) | 597 (28.1%) |
| 15 to 19 Minutes | 285 (13.0%) | 203 (9.6%) |
| 20 to 24 Minutes | 130 (5.9%) | 12 (0.6%) |
| 25 to 29 Minutes | 5 (0.2%) | 0 (0.0%) |
| 30 to 34 Minutes | 98 (4.4%) | 29 (1.4%) |
| 35 to 39 Minutes | 0 (0.0%) | 0 (0.0%) |
| 40 to 44 Minutes | 0 (0.0%) | 0 (0.0%) |
| 45 to 59 Minutes | 85 (3.9%) | 0 (0.0%) |
| 60 to 89 Minutes | 68 (3.1%) | 67 (3.2%) |
| 90 or more Minutes | 73 (3.3%) | 18 (0.9%) |
Time of Departure to Work by Sex in Las Vegas
The most frequent times of departure to work in Las Vegas are 7:00 AM to 7:29 AM (483, 22.0%) for males and 7:30 AM to 7:59 AM (782, 36.8%) for females.
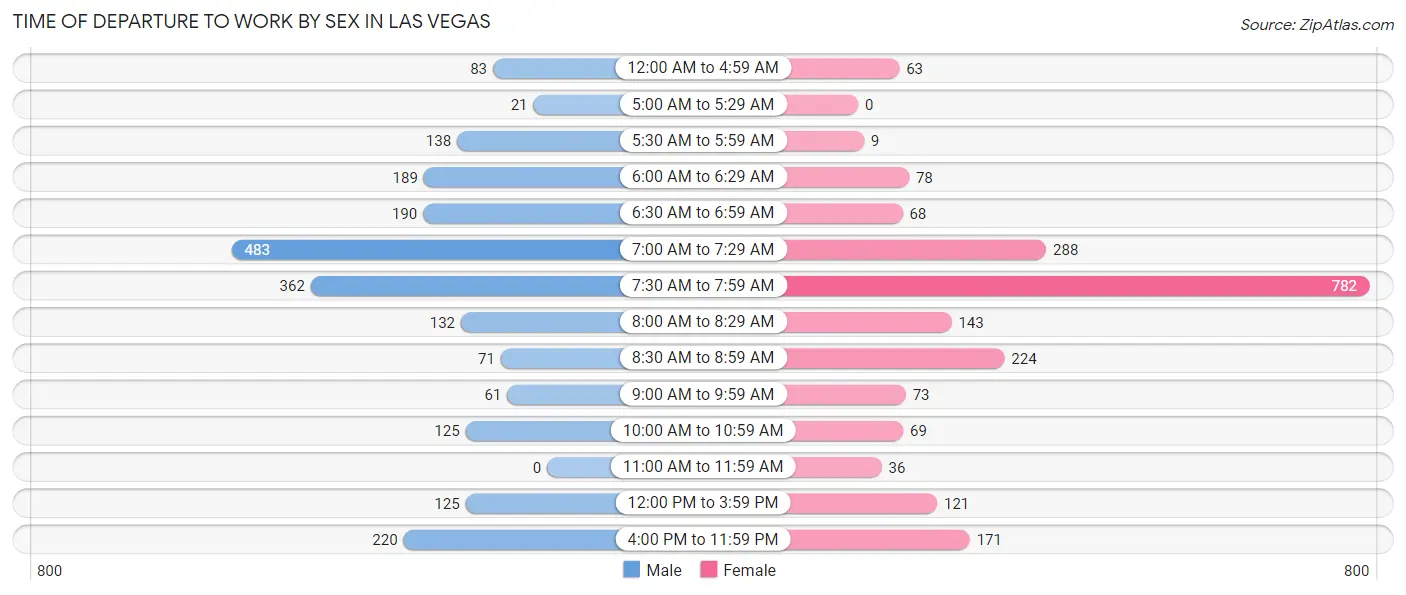
| Time of Departure | Male | Female |
| 12:00 AM to 4:59 AM | 83 (3.8%) | 63 (3.0%) |
| 5:00 AM to 5:29 AM | 21 (0.9%) | 0 (0.0%) |
| 5:30 AM to 5:59 AM | 138 (6.3%) | 9 (0.4%) |
| 6:00 AM to 6:29 AM | 189 (8.6%) | 78 (3.7%) |
| 6:30 AM to 6:59 AM | 190 (8.6%) | 68 (3.2%) |
| 7:00 AM to 7:29 AM | 483 (22.0%) | 288 (13.6%) |
| 7:30 AM to 7:59 AM | 362 (16.5%) | 782 (36.8%) |
| 8:00 AM to 8:29 AM | 132 (6.0%) | 143 (6.7%) |
| 8:30 AM to 8:59 AM | 71 (3.2%) | 224 (10.5%) |
| 9:00 AM to 9:59 AM | 61 (2.8%) | 73 (3.4%) |
| 10:00 AM to 10:59 AM | 125 (5.7%) | 69 (3.3%) |
| 11:00 AM to 11:59 AM | 0 (0.0%) | 36 (1.7%) |
| 12:00 PM to 3:59 PM | 125 (5.7%) | 121 (5.7%) |
| 4:00 PM to 11:59 PM | 220 (10.0%) | 171 (8.1%) |
| Total | 2,200 (100.0%) | 2,125 (100.0%) |
Housing Occupancy in Las Vegas
Occupancy by Ownership in Las Vegas
Of the total 5,658 dwellings in Las Vegas, owner-occupied units account for 3,309 (58.5%), while renter-occupied units make up 2,349 (41.5%).
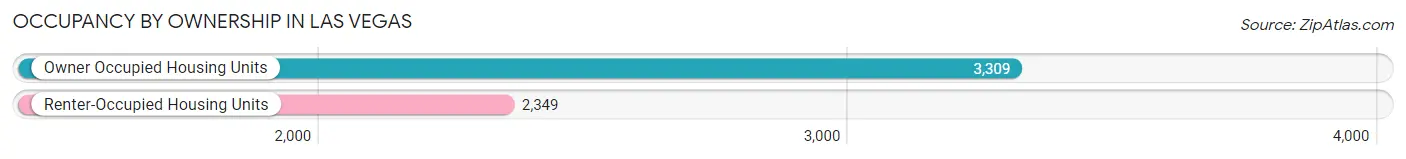
| Occupancy | # Housing Units | % Housing Units |
| Owner Occupied Housing Units | 3,309 | 58.5% |
| Renter-Occupied Housing Units | 2,349 | 41.5% |
| Total Occupied Housing Units | 5,658 | 100.0% |
Occupancy by Household Size in Las Vegas
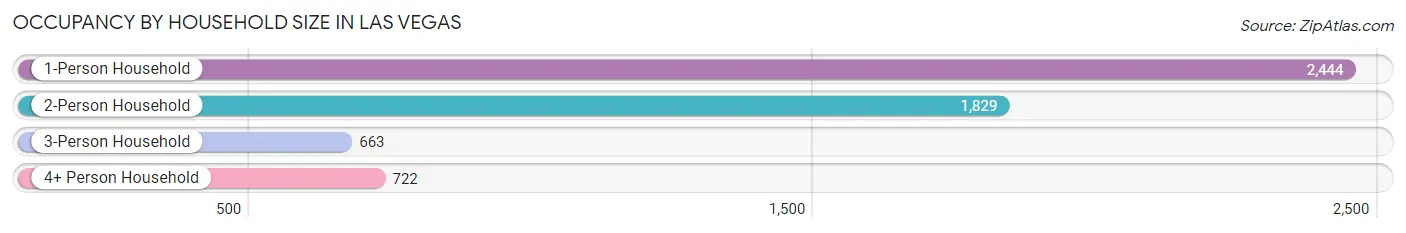
| Household Size | # Housing Units | % Housing Units |
| 1-Person Household | 2,444 | 43.2% |
| 2-Person Household | 1,829 | 32.3% |
| 3-Person Household | 663 | 11.7% |
| 4+ Person Household | 722 | 12.8% |
| Total Housing Units | 5,658 | 100.0% |
Occupancy by Ownership by Household Size in Las Vegas
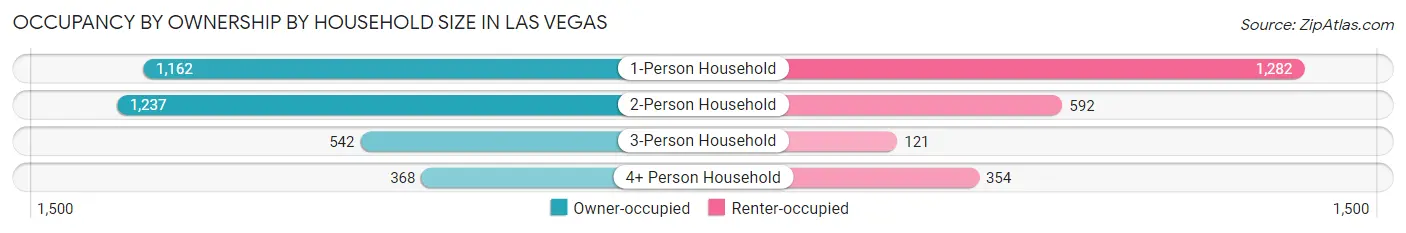
| Household Size | Owner-occupied | Renter-occupied |
| 1-Person Household | 1,162 (47.5%) | 1,282 (52.4%) |
| 2-Person Household | 1,237 (67.6%) | 592 (32.4%) |
| 3-Person Household | 542 (81.8%) | 121 (18.2%) |
| 4+ Person Household | 368 (51.0%) | 354 (49.0%) |
| Total Housing Units | 3,309 (58.5%) | 2,349 (41.5%) |
Occupancy by Educational Attainment in Las Vegas
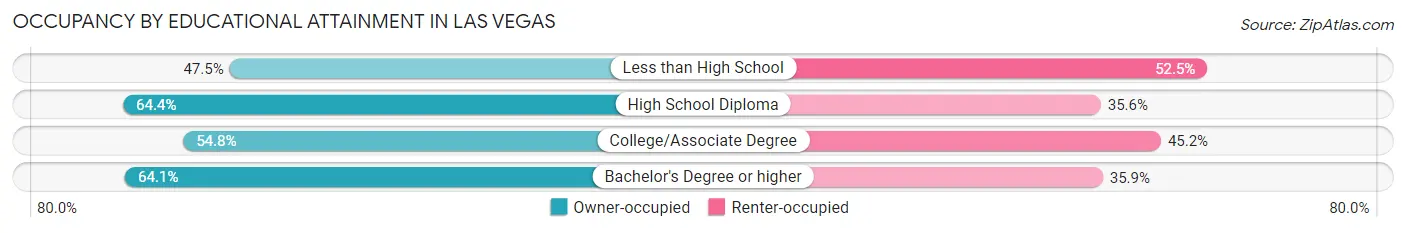
| Household Size | Owner-occupied | Renter-occupied |
| Less than High School | 371 (47.5%) | 410 (52.5%) |
| High School Diploma | 849 (64.4%) | 470 (35.6%) |
| College/Associate Degree | 1,130 (54.8%) | 931 (45.2%) |
| Bachelor's Degree or higher | 959 (64.1%) | 538 (35.9%) |
Occupancy by Age of Householder in Las Vegas
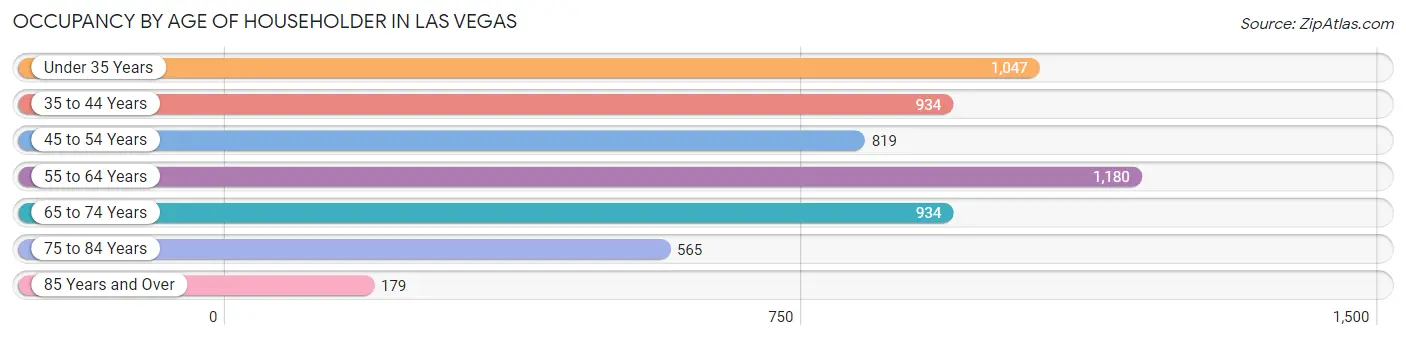
| Age Bracket | # Households | % Households |
| Under 35 Years | 1,047 | 18.5% |
| 35 to 44 Years | 934 | 16.5% |
| 45 to 54 Years | 819 | 14.5% |
| 55 to 64 Years | 1,180 | 20.9% |
| 65 to 74 Years | 934 | 16.5% |
| 75 to 84 Years | 565 | 10.0% |
| 85 Years and Over | 179 | 3.2% |
| Total | 5,658 | 100.0% |
Housing Finances in Las Vegas
Median Income by Occupancy in Las Vegas

| Occupancy Type | # Households | Median Income |
| Owner-Occupied | 3,309 (58.5%) | $51,642 |
| Renter-Occupied | 2,349 (41.5%) | $17,092 |
| Average | 5,658 (100.0%) | $39,558 |
Occupancy by Householder Income Bracket in Las Vegas
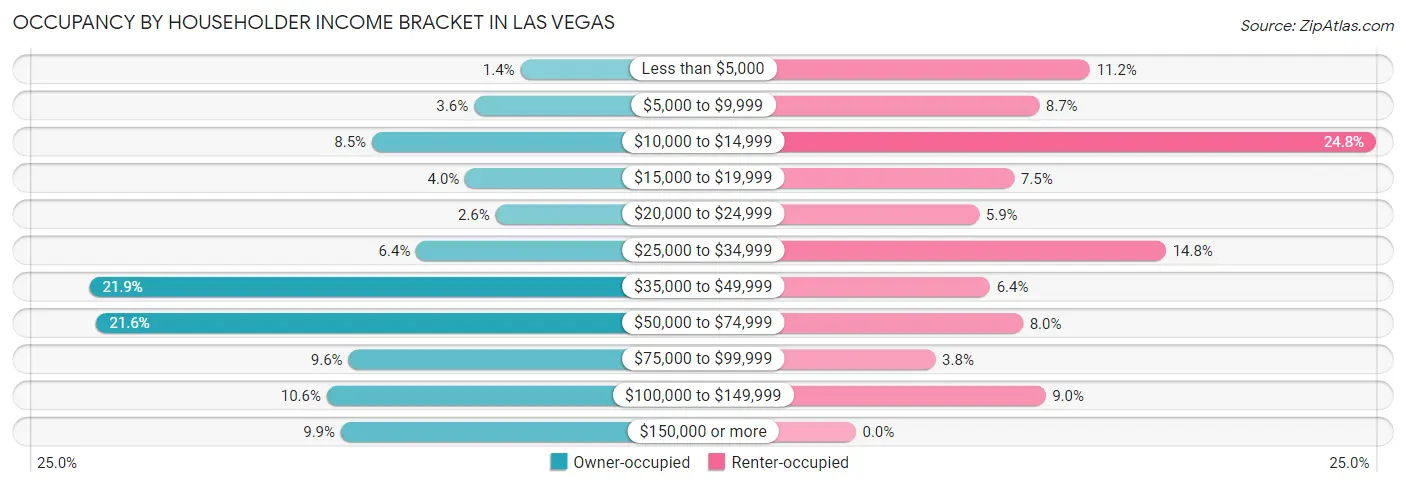
| Income Bracket | Owner-occupied | Renter-occupied |
| Less than $5,000 | 46 (1.4%) | 262 (11.2%) |
| $5,000 to $9,999 | 119 (3.6%) | 205 (8.7%) |
| $10,000 to $14,999 | 280 (8.5%) | 582 (24.8%) |
| $15,000 to $19,999 | 133 (4.0%) | 177 (7.5%) |
| $20,000 to $24,999 | 85 (2.6%) | 138 (5.9%) |
| $25,000 to $34,999 | 210 (6.4%) | 347 (14.8%) |
| $35,000 to $49,999 | 725 (21.9%) | 150 (6.4%) |
| $50,000 to $74,999 | 714 (21.6%) | 187 (8.0%) |
| $75,000 to $99,999 | 317 (9.6%) | 89 (3.8%) |
| $100,000 to $149,999 | 351 (10.6%) | 212 (9.0%) |
| $150,000 or more | 329 (9.9%) | 0 (0.0%) |
| Total | 3,309 (100.0%) | 2,349 (100.0%) |
Monthly Housing Cost Tiers in Las Vegas
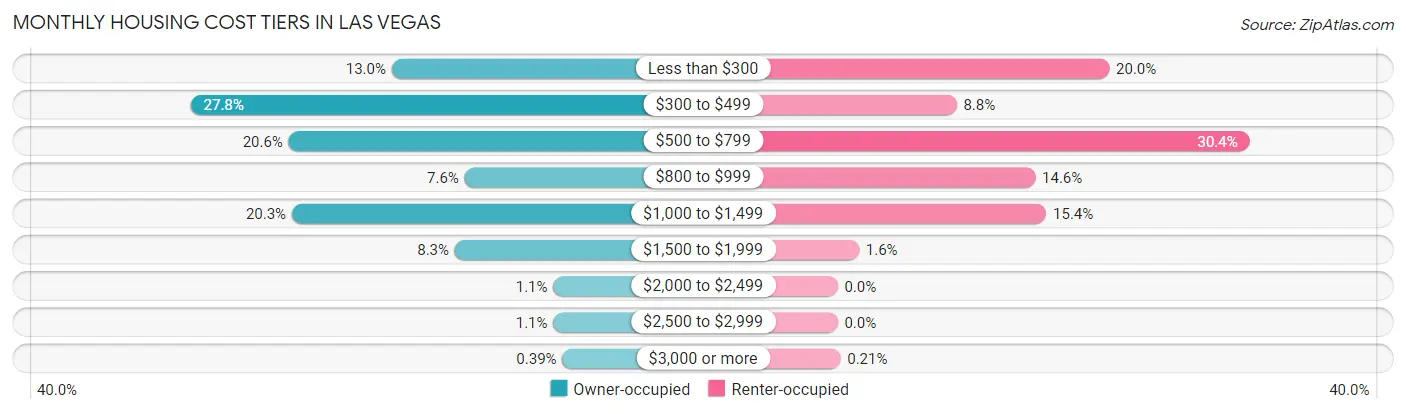
| Monthly Cost | Owner-occupied | Renter-occupied |
| Less than $300 | 429 (13.0%) | 470 (20.0%) |
| $300 to $499 | 919 (27.8%) | 206 (8.8%) |
| $500 to $799 | 680 (20.5%) | 713 (30.3%) |
| $800 to $999 | 251 (7.6%) | 342 (14.6%) |
| $1,000 to $1,499 | 672 (20.3%) | 361 (15.4%) |
| $1,500 to $1,999 | 275 (8.3%) | 37 (1.6%) |
| $2,000 to $2,499 | 35 (1.1%) | 0 (0.0%) |
| $2,500 to $2,999 | 35 (1.1%) | 0 (0.0%) |
| $3,000 or more | 13 (0.4%) | 5 (0.2%) |
| Total | 3,309 (100.0%) | 2,349 (100.0%) |
Physical Housing Characteristics in Las Vegas
Housing Structures in Las Vegas
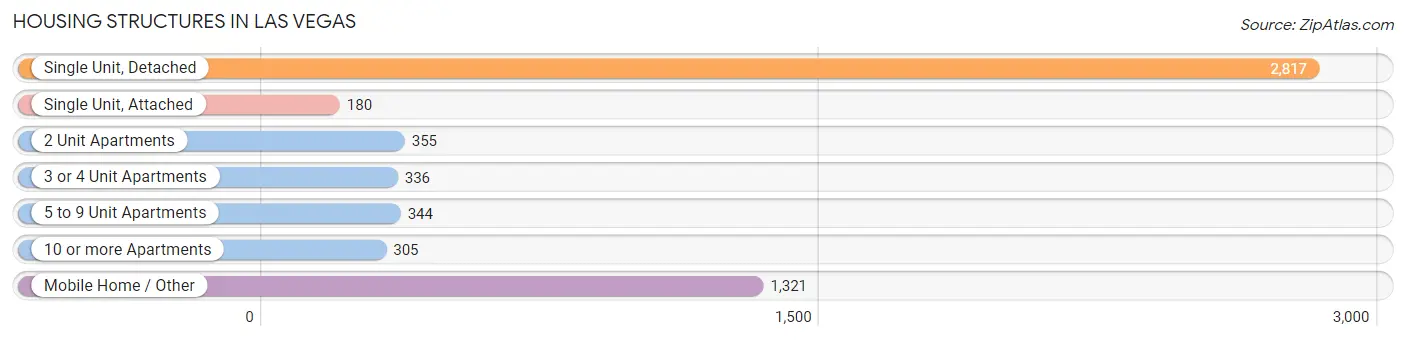
| Structure Type | # Housing Units | % Housing Units |
| Single Unit, Detached | 2,817 | 49.8% |
| Single Unit, Attached | 180 | 3.2% |
| 2 Unit Apartments | 355 | 6.3% |
| 3 or 4 Unit Apartments | 336 | 5.9% |
| 5 to 9 Unit Apartments | 344 | 6.1% |
| 10 or more Apartments | 305 | 5.4% |
| Mobile Home / Other | 1,321 | 23.4% |
| Total | 5,658 | 100.0% |
Housing Structures by Occupancy in Las Vegas
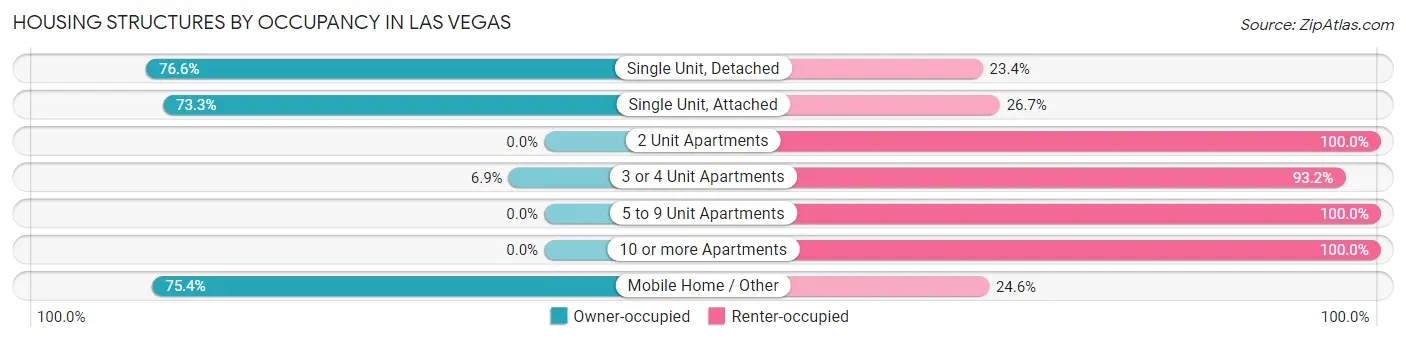
| Structure Type | Owner-occupied | Renter-occupied |
| Single Unit, Detached | 2,158 (76.6%) | 659 (23.4%) |
| Single Unit, Attached | 132 (73.3%) | 48 (26.7%) |
| 2 Unit Apartments | 0 (0.0%) | 355 (100.0%) |
| 3 or 4 Unit Apartments | 23 (6.9%) | 313 (93.1%) |
| 5 to 9 Unit Apartments | 0 (0.0%) | 344 (100.0%) |
| 10 or more Apartments | 0 (0.0%) | 305 (100.0%) |
| Mobile Home / Other | 996 (75.4%) | 325 (24.6%) |
| Total | 3,309 (58.5%) | 2,349 (41.5%) |
Housing Structures by Number of Rooms in Las Vegas
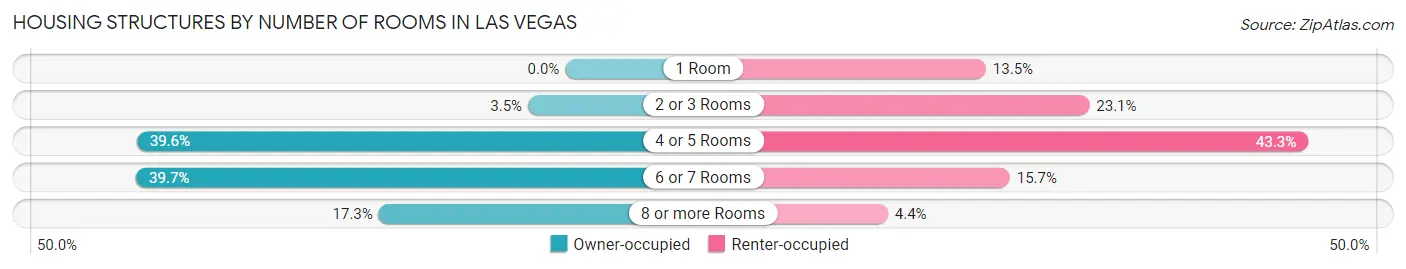
| Number of Rooms | Owner-occupied | Renter-occupied |
| 1 Room | 0 (0.0%) | 317 (13.5%) |
| 2 or 3 Rooms | 114 (3.5%) | 542 (23.1%) |
| 4 or 5 Rooms | 1,311 (39.6%) | 1,017 (43.3%) |
| 6 or 7 Rooms | 1,313 (39.7%) | 369 (15.7%) |
| 8 or more Rooms | 571 (17.3%) | 104 (4.4%) |
| Total | 3,309 (100.0%) | 2,349 (100.0%) |
Housing Structure by Heating Type in Las Vegas
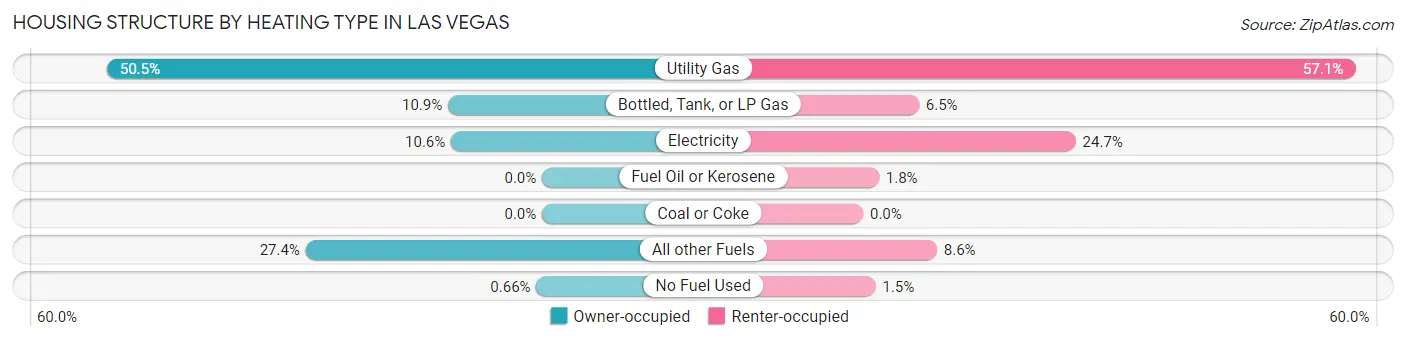
| Heating Type | Owner-occupied | Renter-occupied |
| Utility Gas | 1,670 (50.5%) | 1,340 (57.1%) |
| Bottled, Tank, or LP Gas | 361 (10.9%) | 152 (6.5%) |
| Electricity | 349 (10.5%) | 579 (24.6%) |
| Fuel Oil or Kerosene | 0 (0.0%) | 43 (1.8%) |
| Coal or Coke | 0 (0.0%) | 0 (0.0%) |
| All other Fuels | 907 (27.4%) | 201 (8.6%) |
| No Fuel Used | 22 (0.7%) | 34 (1.5%) |
| Total | 3,309 (100.0%) | 2,349 (100.0%) |
Household Vehicle Usage in Las Vegas
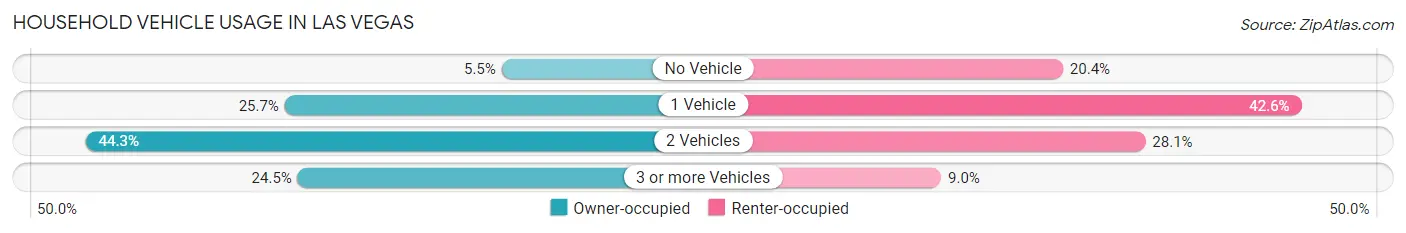
| Vehicles per Household | Owner-occupied | Renter-occupied |
| No Vehicle | 181 (5.5%) | 478 (20.3%) |
| 1 Vehicle | 851 (25.7%) | 1,001 (42.6%) |
| 2 Vehicles | 1,466 (44.3%) | 659 (28.1%) |
| 3 or more Vehicles | 811 (24.5%) | 211 (9.0%) |
| Total | 3,309 (100.0%) | 2,349 (100.0%) |
Real Estate & Mortgages in Las Vegas
Real Estate and Mortgage Overview in Las Vegas
| Characteristic | Without Mortgage | With Mortgage |
| Housing Units | 1,984 | 1,325 |
| Median Property Value | $100,800 | $150,200 |
| Median Household Income | $47,457 | $77 |
| Monthly Housing Costs | $426 | $13 |
| Real Estate Taxes | $991 | $6 |
Property Value by Mortgage Status in Las Vegas
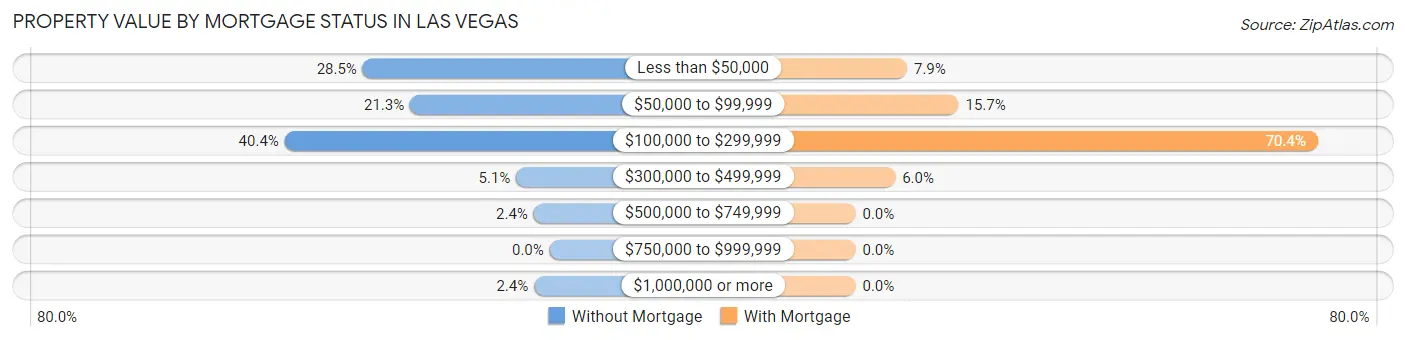
| Property Value | Without Mortgage | With Mortgage |
| Less than $50,000 | 565 (28.5%) | 104 (7.9%) |
| $50,000 to $99,999 | 422 (21.3%) | 208 (15.7%) |
| $100,000 to $299,999 | 801 (40.4%) | 933 (70.4%) |
| $300,000 to $499,999 | 101 (5.1%) | 80 (6.0%) |
| $500,000 to $749,999 | 48 (2.4%) | 0 (0.0%) |
| $750,000 to $999,999 | 0 (0.0%) | 0 (0.0%) |
| $1,000,000 or more | 47 (2.4%) | 0 (0.0%) |
| Total | 1,984 (100.0%) | 1,325 (100.0%) |
Household Income by Mortgage Status in Las Vegas
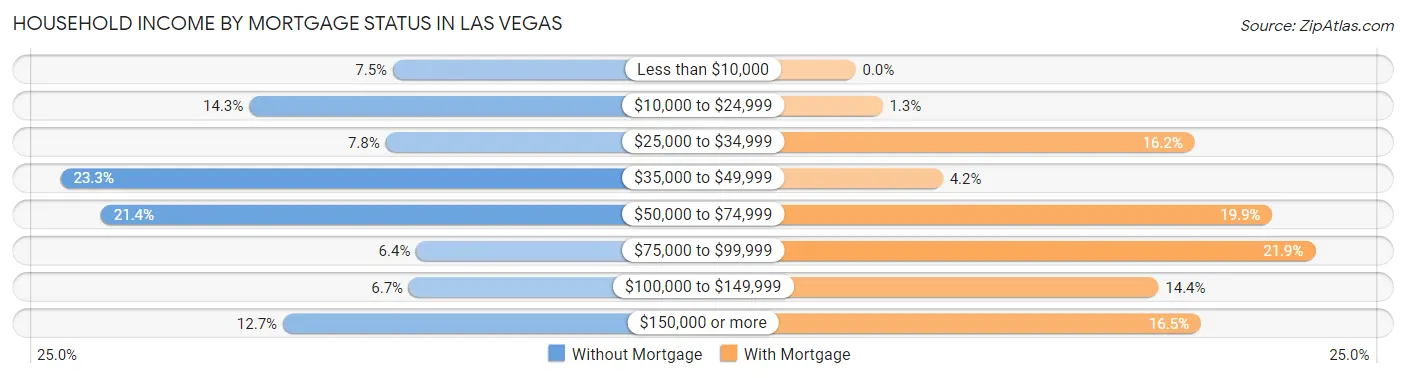
| Household Income | Without Mortgage | With Mortgage |
| Less than $10,000 | 148 (7.5%) | 0 (0.0%) |
| $10,000 to $24,999 | 284 (14.3%) | 17 (1.3%) |
| $25,000 to $34,999 | 155 (7.8%) | 214 (16.2%) |
| $35,000 to $49,999 | 462 (23.3%) | 55 (4.2%) |
| $50,000 to $74,999 | 424 (21.4%) | 263 (19.9%) |
| $75,000 to $99,999 | 126 (6.4%) | 290 (21.9%) |
| $100,000 to $149,999 | 133 (6.7%) | 191 (14.4%) |
| $150,000 or more | 252 (12.7%) | 218 (16.5%) |
| Total | 1,984 (100.0%) | 1,325 (100.0%) |
Property Value to Household Income Ratio in Las Vegas
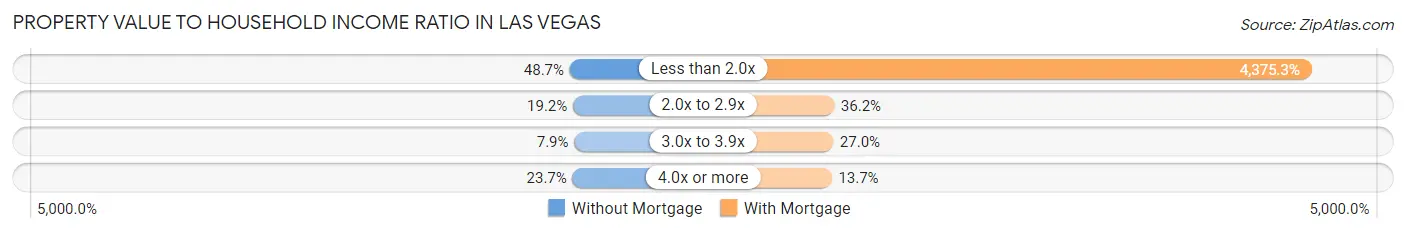
| Value-to-Income Ratio | Without Mortgage | With Mortgage |
| Less than 2.0x | 967 (48.7%) | 57,972 (4,375.2%) |
| 2.0x to 2.9x | 380 (19.2%) | 480 (36.2%) |
| 3.0x to 3.9x | 157 (7.9%) | 358 (27.0%) |
| 4.0x or more | 470 (23.7%) | 181 (13.7%) |
| Total | 1,984 (100.0%) | 1,325 (100.0%) |
Real Estate Taxes by Mortgage Status in Las Vegas
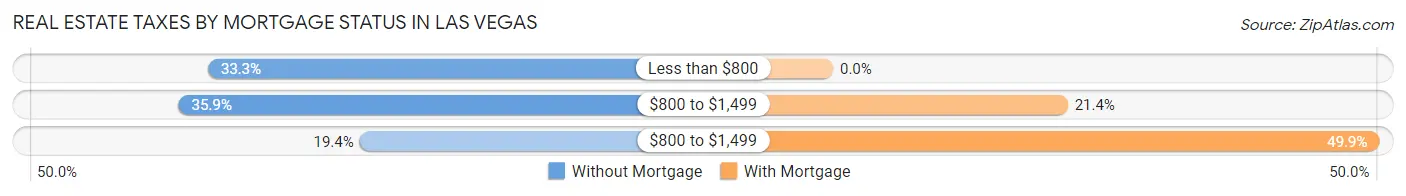
| Property Taxes | Without Mortgage | With Mortgage |
| Less than $800 | 660 (33.3%) | 0 (0.0%) |
| $800 to $1,499 | 713 (35.9%) | 284 (21.4%) |
| $800 to $1,499 | 385 (19.4%) | 661 (49.9%) |
| Total | 1,984 (100.0%) | 1,325 (100.0%) |
Health & Disability in Las Vegas
Health Insurance Coverage by Age in Las Vegas
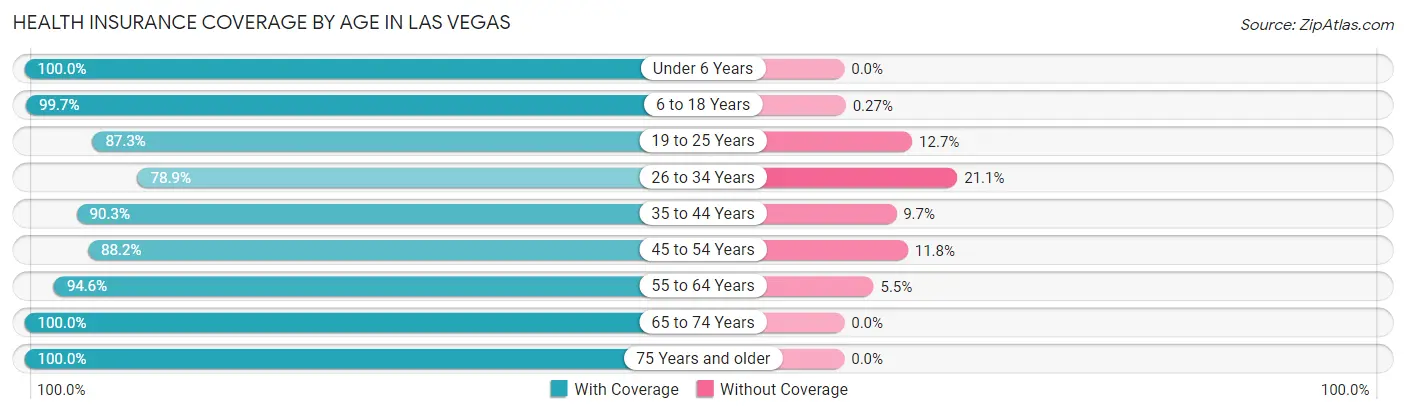
| Age Bracket | With Coverage | Without Coverage |
| Under 6 Years | 730 (100.0%) | 0 (0.0%) |
| 6 to 18 Years | 1,854 (99.7%) | 5 (0.3%) |
| 19 to 25 Years | 1,511 (87.3%) | 219 (12.7%) |
| 26 to 34 Years | 1,007 (78.9%) | 269 (21.1%) |
| 35 to 44 Years | 1,549 (90.3%) | 166 (9.7%) |
| 45 to 54 Years | 1,184 (88.2%) | 159 (11.8%) |
| 55 to 64 Years | 1,734 (94.6%) | 100 (5.4%) |
| 65 to 74 Years | 1,305 (100.0%) | 0 (0.0%) |
| 75 Years and older | 1,003 (100.0%) | 0 (0.0%) |
| Total | 11,877 (92.8%) | 918 (7.2%) |
Health Insurance Coverage by Citizenship Status in Las Vegas
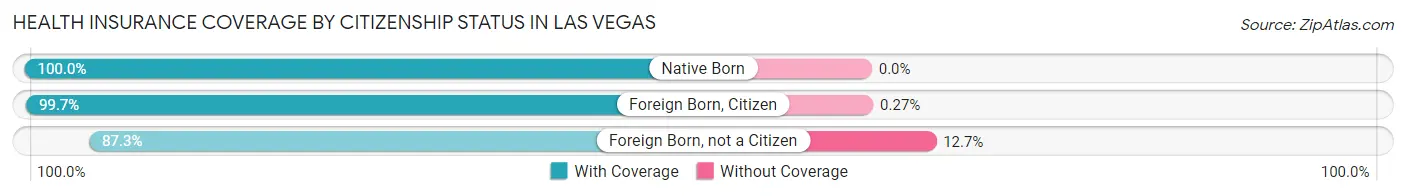
| Citizenship Status | With Coverage | Without Coverage |
| Native Born | 730 (100.0%) | 0 (0.0%) |
| Foreign Born, Citizen | 1,854 (99.7%) | 5 (0.3%) |
| Foreign Born, not a Citizen | 1,511 (87.3%) | 219 (12.7%) |
Health Insurance Coverage by Household Income in Las Vegas
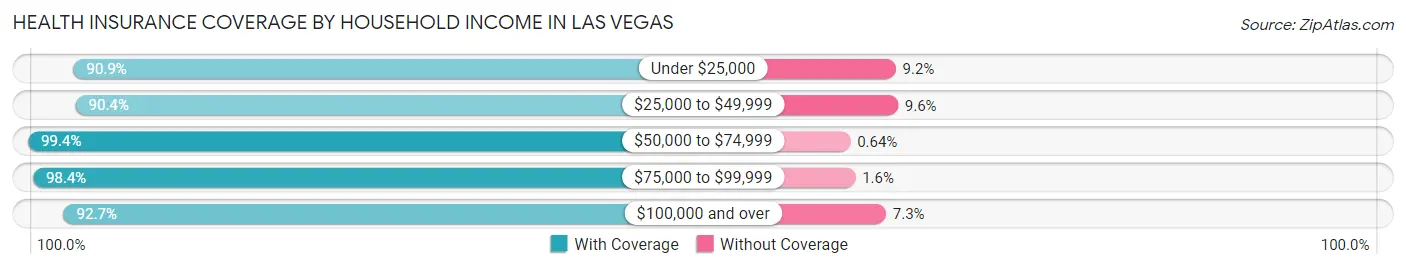
| Household Income | With Coverage | Without Coverage |
| Under $25,000 | 2,789 (90.8%) | 281 (9.1%) |
| $25,000 to $49,999 | 2,762 (90.4%) | 292 (9.6%) |
| $50,000 to $74,999 | 1,877 (99.4%) | 12 (0.6%) |
| $75,000 to $99,999 | 1,000 (98.4%) | 16 (1.6%) |
| $100,000 and over | 2,760 (92.7%) | 218 (7.3%) |
Public vs Private Health Insurance Coverage by Age in Las Vegas
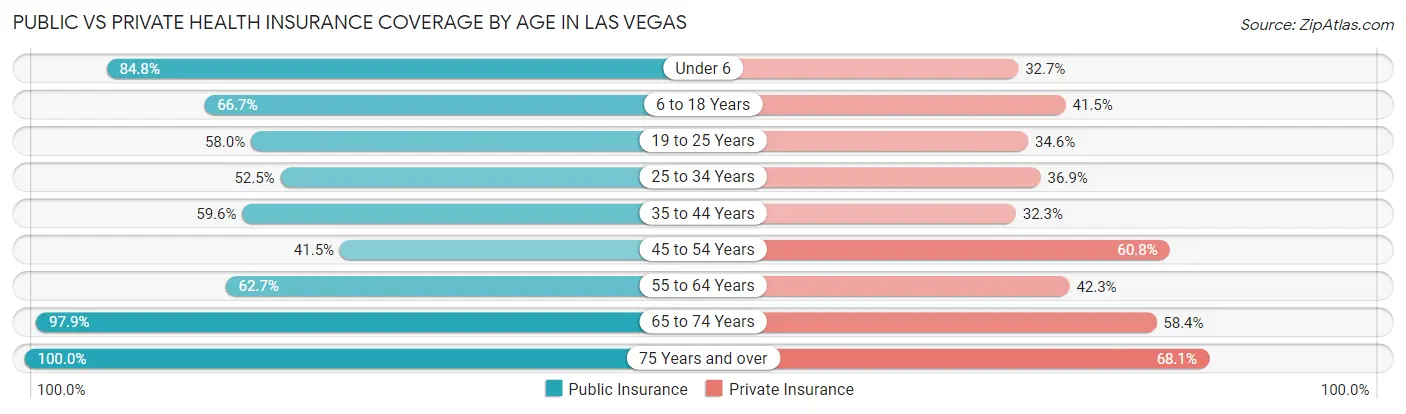
| Age Bracket | Public Insurance | Private Insurance |
| Under 6 | 619 (84.8%) | 239 (32.7%) |
| 6 to 18 Years | 1,239 (66.6%) | 772 (41.5%) |
| 19 to 25 Years | 1,003 (58.0%) | 598 (34.6%) |
| 25 to 34 Years | 670 (52.5%) | 471 (36.9%) |
| 35 to 44 Years | 1,022 (59.6%) | 554 (32.3%) |
| 45 to 54 Years | 557 (41.5%) | 817 (60.8%) |
| 55 to 64 Years | 1,150 (62.7%) | 775 (42.3%) |
| 65 to 74 Years | 1,277 (97.9%) | 762 (58.4%) |
| 75 Years and over | 1,003 (100.0%) | 683 (68.1%) |
| Total | 8,540 (66.7%) | 5,671 (44.3%) |
Disability Status by Sex by Age in Las Vegas
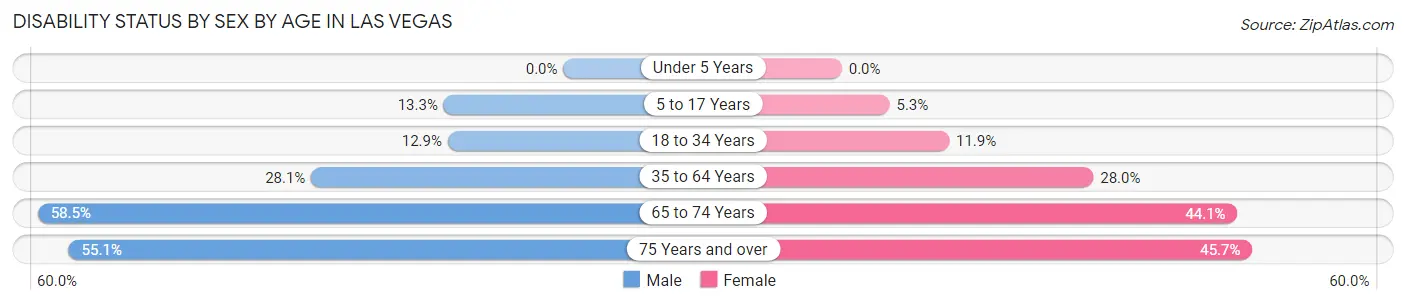
| Age Bracket | Male | Female |
| Under 5 Years | 0 (0.0%) | 0 (0.0%) |
| 5 to 17 Years | 112 (13.3%) | 38 (5.3%) |
| 18 to 34 Years | 232 (12.9%) | 183 (11.9%) |
| 35 to 64 Years | 698 (28.1%) | 674 (28.0%) |
| 65 to 74 Years | 360 (58.5%) | 304 (44.1%) |
| 75 Years and over | 238 (55.1%) | 261 (45.7%) |
Disability Class by Sex by Age in Las Vegas
Disability Class: Hearing Difficulty
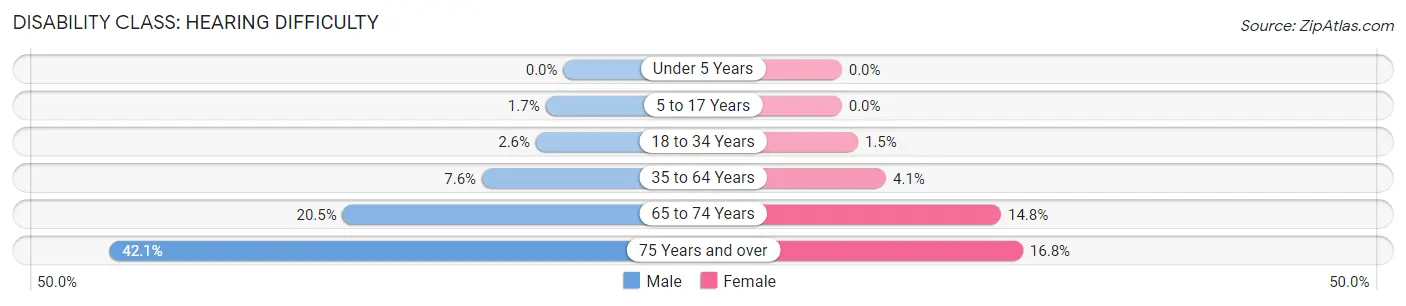
| Age Bracket | Male | Female |
| Under 5 Years | 0 (0.0%) | 0 (0.0%) |
| 5 to 17 Years | 14 (1.7%) | 0 (0.0%) |
| 18 to 34 Years | 46 (2.5%) | 23 (1.5%) |
| 35 to 64 Years | 188 (7.6%) | 99 (4.1%) |
| 65 to 74 Years | 126 (20.5%) | 102 (14.8%) |
| 75 Years and over | 182 (42.1%) | 96 (16.8%) |
Disability Class: Vision Difficulty
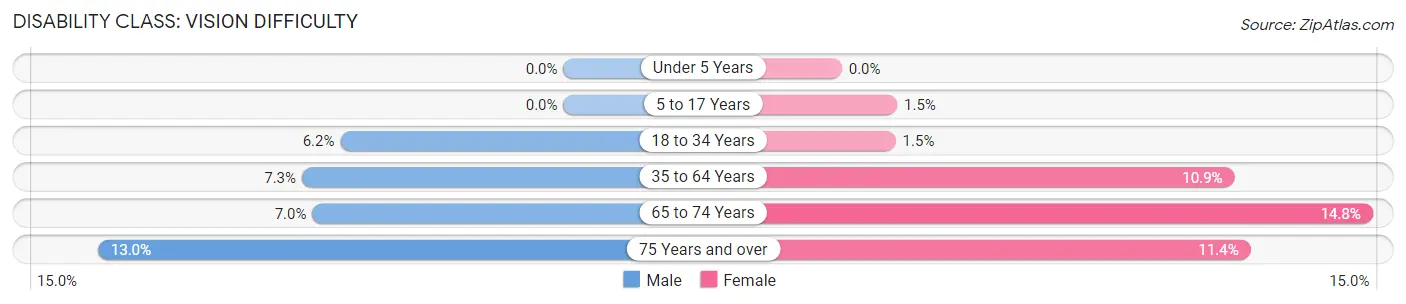
| Age Bracket | Male | Female |
| Under 5 Years | 0 (0.0%) | 0 (0.0%) |
| 5 to 17 Years | 0 (0.0%) | 11 (1.5%) |
| 18 to 34 Years | 112 (6.2%) | 23 (1.5%) |
| 35 to 64 Years | 181 (7.3%) | 263 (10.9%) |
| 65 to 74 Years | 43 (7.0%) | 102 (14.8%) |
| 75 Years and over | 56 (13.0%) | 65 (11.4%) |
Disability Class: Cognitive Difficulty
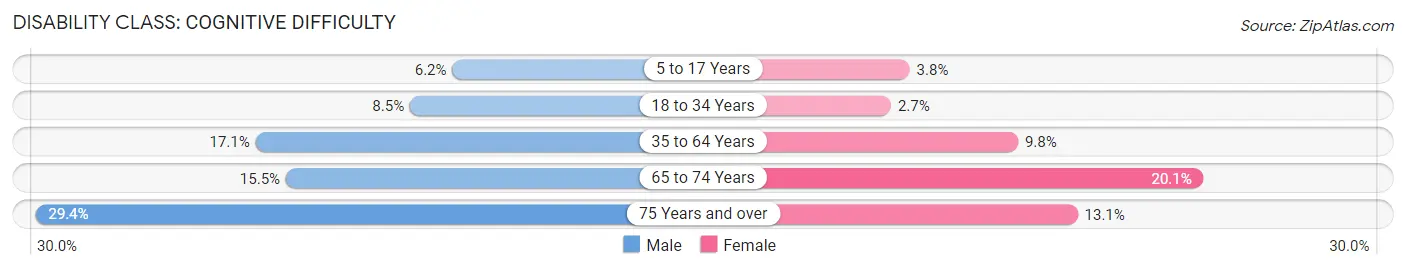
| Age Bracket | Male | Female |
| 5 to 17 Years | 52 (6.2%) | 27 (3.8%) |
| 18 to 34 Years | 154 (8.5%) | 42 (2.7%) |
| 35 to 64 Years | 426 (17.1%) | 236 (9.8%) |
| 65 to 74 Years | 95 (15.4%) | 139 (20.1%) |
| 75 Years and over | 127 (29.4%) | 75 (13.1%) |
Disability Class: Ambulatory Difficulty
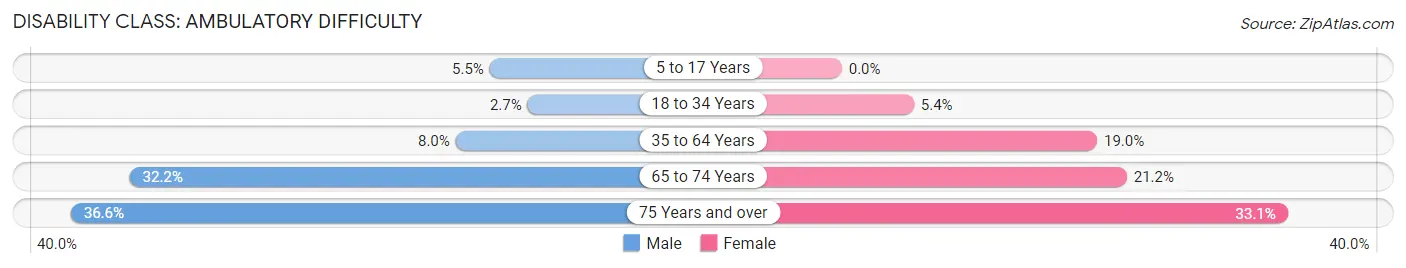
| Age Bracket | Male | Female |
| 5 to 17 Years | 46 (5.5%) | 0 (0.0%) |
| 18 to 34 Years | 48 (2.7%) | 82 (5.3%) |
| 35 to 64 Years | 199 (8.0%) | 456 (19.0%) |
| 65 to 74 Years | 198 (32.2%) | 146 (21.2%) |
| 75 Years and over | 158 (36.6%) | 189 (33.1%) |
Disability Class: Self-Care Difficulty
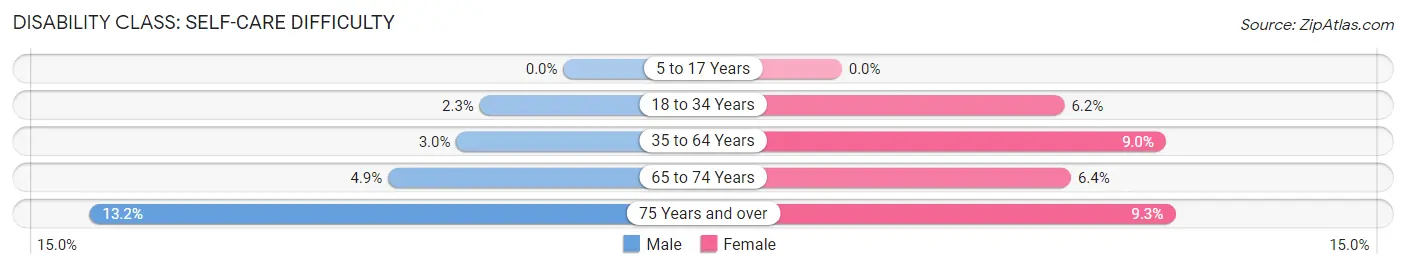
| Age Bracket | Male | Female |
| 5 to 17 Years | 0 (0.0%) | 0 (0.0%) |
| 18 to 34 Years | 42 (2.3%) | 95 (6.2%) |
| 35 to 64 Years | 74 (3.0%) | 217 (9.0%) |
| 65 to 74 Years | 30 (4.9%) | 44 (6.4%) |
| 75 Years and over | 57 (13.2%) | 53 (9.3%) |
Technology Access in Las Vegas
Computing Device Access in Las Vegas
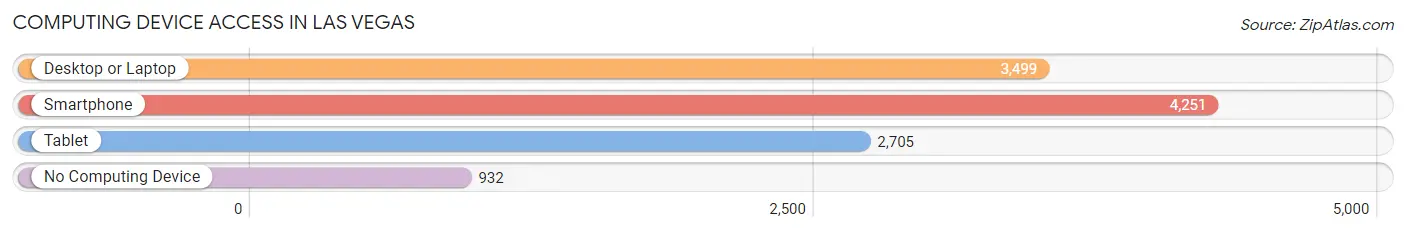
| Device Type | # Households | % Households |
| Desktop or Laptop | 3,499 | 61.8% |
| Smartphone | 4,251 | 75.1% |
| Tablet | 2,705 | 47.8% |
| No Computing Device | 932 | 16.5% |
| Total | 5,658 | 100.0% |
Internet Access in Las Vegas
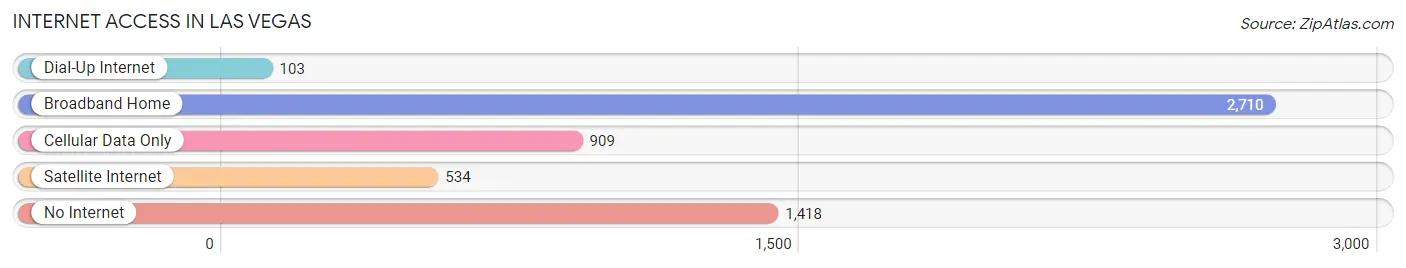
| Internet Type | # Households | % Households |
| Dial-Up Internet | 103 | 1.8% |
| Broadband Home | 2,710 | 47.9% |
| Cellular Data Only | 909 | 16.1% |
| Satellite Internet | 534 | 9.4% |
| No Internet | 1,418 | 25.1% |
| Total | 5,658 | 100.0% |
Las Vegas Summary
Las Vegas, New Mexico is a city located in San Miguel County in the state of New Mexico. It is the county seat of San Miguel County and is the fourth largest city in the state. The city is located in the high desert of the Sangre de Cristo Mountains and is situated along the Gallinas River. Las Vegas is known for its rich history, diverse geography, vibrant economy, and unique demographics.
History
Las Vegas was founded in 1835 by a group of settlers from the nearby Taos Pueblo. The city was named after the nearby Las Vegas Ranch, which was named after the Spanish term for “the meadows”. The city quickly grew and became an important trading post for the region. In 1846, the city was captured by the United States during the Mexican-American War. After the war, the city continued to grow and by the late 19th century, it had become an important railroad hub. The city was also home to a number of prominent figures, including Billy the Kid, who was born in the city in 1859.
Geography
Las Vegas is located in the high desert of the Sangre de Cristo Mountains. The city is situated along the Gallinas River and is surrounded by the San Miguel Mountains to the north, the San Juan Mountains to the east, and the Jemez Mountains to the south. The city has a total area of 8.3 square miles and an elevation of 6,500 feet. The climate in Las Vegas is semi-arid, with hot summers and cold winters.
Economy
Las Vegas has a vibrant economy that is driven by tourism, agriculture, and manufacturing. The city is home to a number of tourist attractions, including the Las Vegas National Wildlife Refuge, the Las Vegas Museum of Art, and the Las Vegas Plaza Historic District. The city is also home to a number of agricultural operations, including cattle ranches, dairies, and farms. The city is also home to a number of manufacturing operations, including a number of food processing plants.
Demographics
As of the 2010 census, Las Vegas had a population of 13,753. The city has a diverse population, with the largest ethnic groups being Hispanic (63.3%), White (25.2%), and Native American (4.2%). The median household income in the city is $30,945 and the median age is 36. The city has a poverty rate of 22.3%.
Las Vegas is a unique city with a rich history, diverse geography, vibrant economy, and unique demographics. The city is home to a number of tourist attractions, agricultural operations, and manufacturing operations. The city has a diverse population and a median household income of $30,945. Las Vegas is an important city in the state of New Mexico and is an important part of the region’s economy.
Common Questions
What is Per Capita Income in Las Vegas?
Per Capita income in Las Vegas is $24,005.
What is the Median Family Income in Las Vegas?
Median Family Income in Las Vegas is $47,991.
What is the Median Household income in Las Vegas?
Median Household Income in Las Vegas is $39,558.
What is Income or Wage Gap in Las Vegas?
Income or Wage Gap in Las Vegas is 3.5%.
Women in Las Vegas earn 96.5 cents for every dollar earned by a man.
What is Family Income Deficit in Las Vegas?
Family Income Deficit in Las Vegas is $10,155.
Families that are below poverty line in Las Vegas earn $10,155 less on average than the poverty threshold level.
What is Inequality or Gini Index in Las Vegas?
Inequality or Gini Index in Las Vegas is 0.49.
What is the Total Population of Las Vegas?
Total Population of Las Vegas is 13,194.
What is the Total Male Population of Las Vegas?
Total Male Population of Las Vegas is 6,829.
What is the Total Female Population of Las Vegas?
Total Female Population of Las Vegas is 6,365.
What is the Ratio of Males per 100 Females in Las Vegas?
There are 107.29 Males per 100 Females in Las Vegas.
What is the Ratio of Females per 100 Males in Las Vegas?
There are 93.21 Females per 100 Males in Las Vegas.
What is the Median Population Age in Las Vegas?
Median Population Age in Las Vegas is 40.1 Years.
What is the Average Family Size in Las Vegas
Average Family Size in Las Vegas is 2.8 People.
What is the Average Household Size in Las Vegas
Average Household Size in Las Vegas is 2.1 People.
How Large is the Labor Force in Las Vegas?
There are 5,613 People in the Labor Forcein in Las Vegas.
What is the Percentage of People in the Labor Force in Las Vegas?
49.6% of People are in the Labor Force in Las Vegas.
What is the Unemployment Rate in Las Vegas?
Unemployment Rate in Las Vegas is 7.9%.