Sierra County, NM Map & Demographics
Sierra County Map
Sierra County Overview
$26,396
PER CAPITA INCOME
$58,289
AVG FAMILY INCOME
$35,256
AVG HOUSEHOLD INCOME
0.4%
WAGE / INCOME GAP [ % ]
99.6¢/ $1
WAGE / INCOME GAP [ $ ]
0.47
INEQUALITY / GINI INDEX
11,506
TOTAL POPULATION
5,822
MALE POPULATION
5,684
FEMALE POPULATION
102.43
MALES / 100 FEMALES
97.63
FEMALES / 100 MALES
55.4
MEDIAN AGE
2.9
AVG FAMILY SIZE
2.1
AVG HOUSEHOLD SIZE
3,732
LABOR FORCE [ PEOPLE ]
38.1%
PERCENT IN LABOR FORCE
4.7%
UNEMPLOYMENT RATE
Income in Sierra County
Income Overview in Sierra County
Per Capita Income in Sierra County is $26,396, while median incomes of families and households are $58,289 and $35,256 respectively.
| Characteristic | Number | Measure |
| Per Capita Income | 11,506 | $26,396 |
| Median Family Income | 2,664 | $58,289 |
| Mean Family Income | 2,664 | $72,972 |
| Median Household Income | 5,285 | $35,256 |
| Mean Household Income | 5,285 | $53,994 |
| Income Deficit | 2,664 | $0 |
| Wage / Income Gap (%) | 11,506 | 0.43% |
| Wage / Income Gap ($) | 11,506 | 99.57¢ per $1 |
| Gini / Inequality Index | 11,506 | 0.47 |
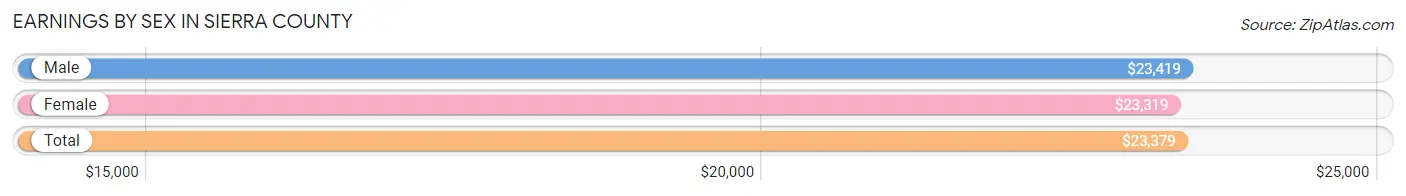
Earnings by Sex in Sierra County
Average Earnings in Sierra County are $23,379, $23,419 for men and $23,319 for women, a difference of 0.4%.
| Sex | Number | Average Earnings |
| Male | 2,069 (49.8%) | $23,419 |
| Female | 2,085 (50.2%) | $23,319 |
| Total | 4,154 (100.0%) | $23,379 |
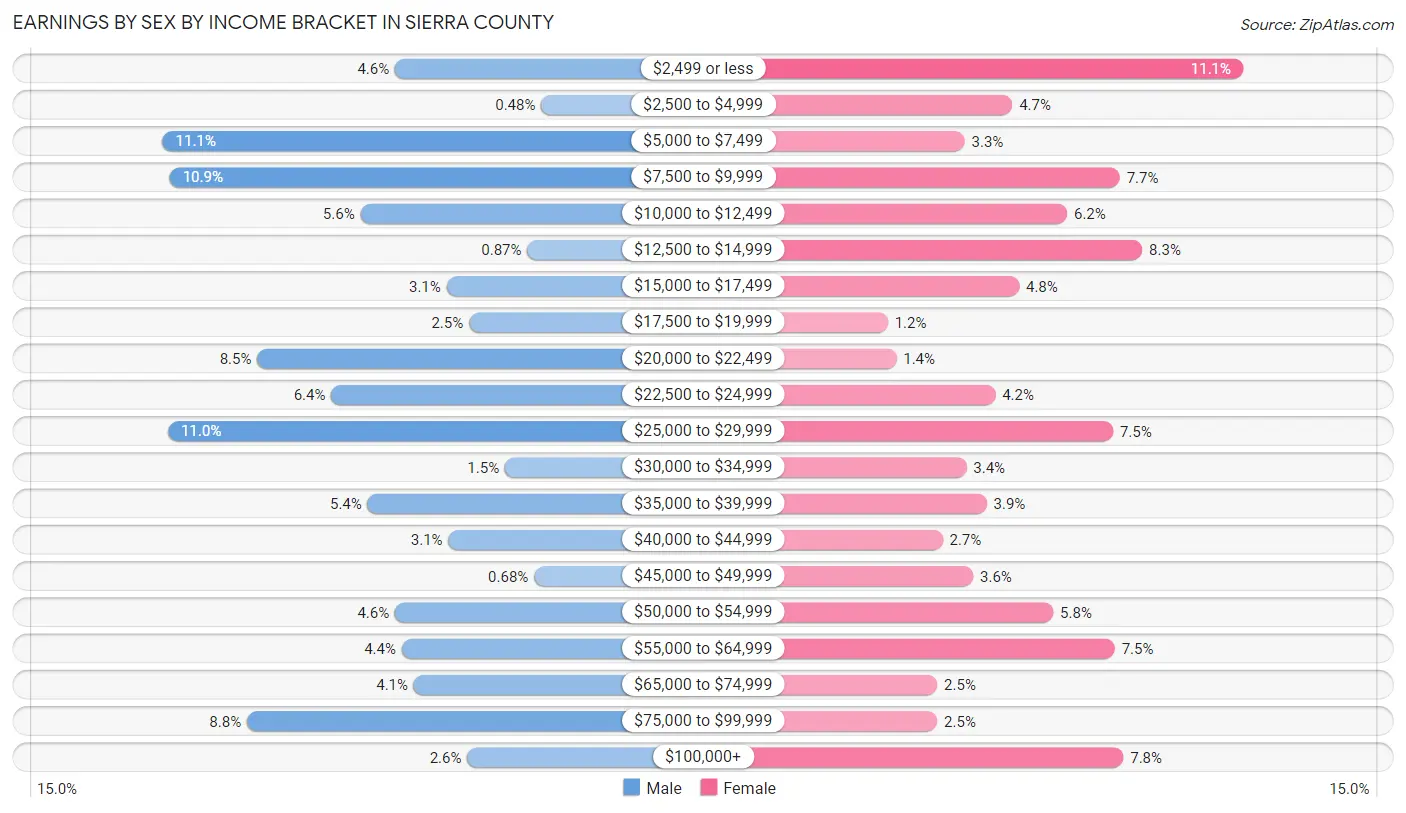
Earnings by Sex by Income Bracket in Sierra County
The most common earnings brackets in Sierra County are $5,000 to $7,499 for men (230 | 11.1%) and $2,499 or less for women (232 | 11.1%).
| Income | Male | Female |
| $2,499 or less | 95 (4.6%) | 232 (11.1%) |
| $2,500 to $4,999 | 10 (0.5%) | 97 (4.6%) |
| $5,000 to $7,499 | 230 (11.1%) | 69 (3.3%) |
| $7,500 to $9,999 | 226 (10.9%) | 160 (7.7%) |
| $10,000 to $12,499 | 115 (5.6%) | 129 (6.2%) |
| $12,500 to $14,999 | 18 (0.9%) | 173 (8.3%) |
| $15,000 to $17,499 | 65 (3.1%) | 101 (4.8%) |
| $17,500 to $19,999 | 52 (2.5%) | 24 (1.1%) |
| $20,000 to $22,499 | 175 (8.5%) | 29 (1.4%) |
| $22,500 to $24,999 | 132 (6.4%) | 87 (4.2%) |
| $25,000 to $29,999 | 227 (11.0%) | 156 (7.5%) |
| $30,000 to $34,999 | 31 (1.5%) | 70 (3.4%) |
| $35,000 to $39,999 | 111 (5.4%) | 82 (3.9%) |
| $40,000 to $44,999 | 64 (3.1%) | 56 (2.7%) |
| $45,000 to $49,999 | 14 (0.7%) | 74 (3.5%) |
| $50,000 to $54,999 | 95 (4.6%) | 121 (5.8%) |
| $55,000 to $64,999 | 91 (4.4%) | 157 (7.5%) |
| $65,000 to $74,999 | 84 (4.1%) | 53 (2.5%) |
| $75,000 to $99,999 | 181 (8.7%) | 53 (2.5%) |
| $100,000+ | 53 (2.6%) | 162 (7.8%) |
| Total | 2,069 (100.0%) | 2,085 (100.0%) |
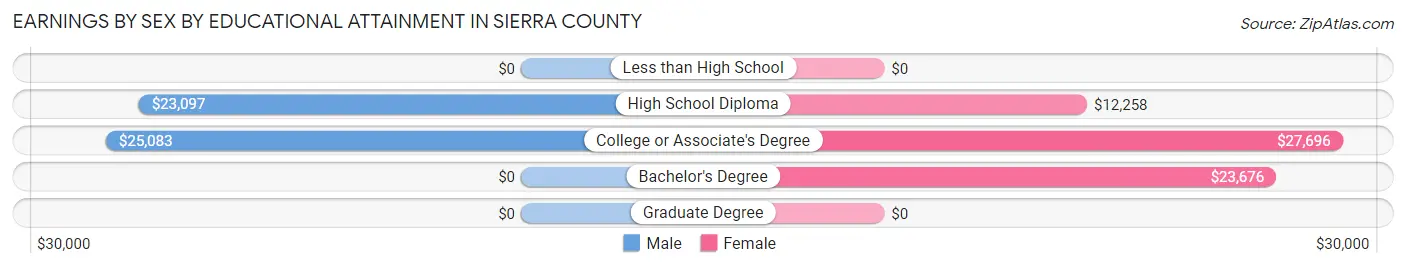
Earnings by Sex by Educational Attainment in Sierra County
Average earnings in Sierra County are $24,028 for men and $24,709 for women, a difference of 2.8%. Men with an educational attainment of college or associate's degree enjoy the highest average annual earnings of $25,083, while those with high school diploma education earn the least with $23,097. Women with an educational attainment of college or associate's degree earn the most with the average annual earnings of $27,696, while those with high school diploma education have the smallest earnings of $12,258.
| Educational Attainment | Male Income | Female Income |
| Less than High School | - | - |
| High School Diploma | $23,097 | $12,258 |
| College or Associate's Degree | $25,083 | $27,696 |
| Bachelor's Degree | - | - |
| Graduate Degree | - | - |
| Total | $24,028 | $24,709 |
Family Income in Sierra County
Family Income Brackets in Sierra County
According to the Sierra County family income data, there are 621 families falling into the $100,000 to $149,999 income range, which is the most common income bracket and makes up 23.3% of all families. Conversely, the $10,000 to $14,999 income bracket is the least frequent group with only 53 families (2.0%) belonging to this category.
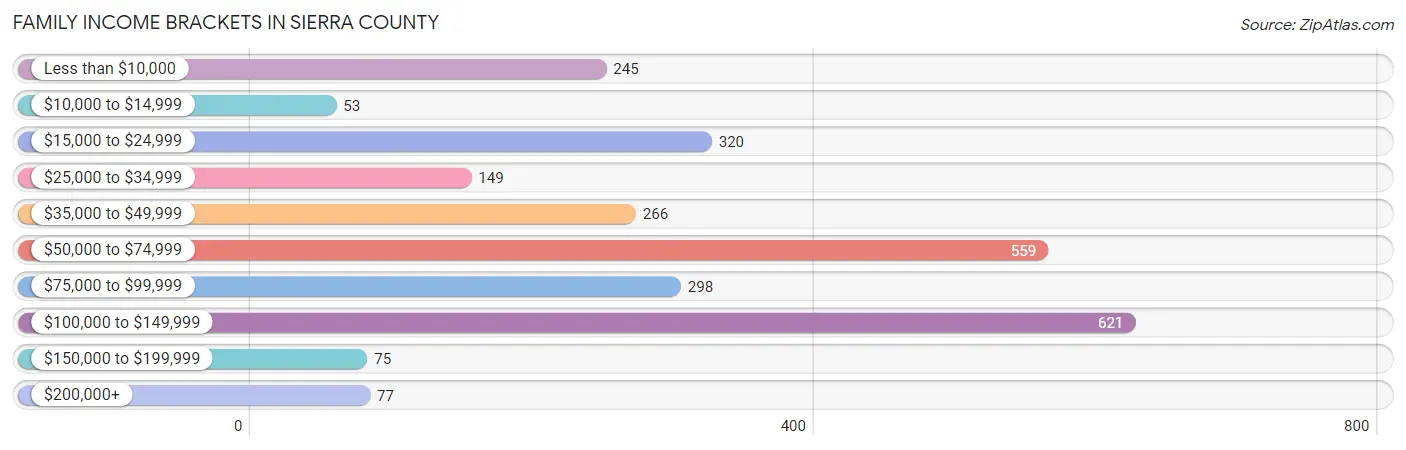
| Income Bracket | # Families | % Families |
| Less than $10,000 | 245 | 9.2% |
| $10,000 to $14,999 | 53 | 2.0% |
| $15,000 to $24,999 | 320 | 12.0% |
| $25,000 to $34,999 | 149 | 5.6% |
| $35,000 to $49,999 | 266 | 10.0% |
| $50,000 to $74,999 | 559 | 21.0% |
| $75,000 to $99,999 | 298 | 11.2% |
| $100,000 to $149,999 | 621 | 23.3% |
| $150,000 to $199,999 | 75 | 2.8% |
| $200,000+ | 77 | 2.9% |
Family Income by Famaliy Size in Sierra County
2-person families (1,860 | 69.8%) account for the highest median family income in Sierra County with $61,172 per family, while 2-person families (1,860 | 69.8%) have the highest median income of $30,586 per family member.
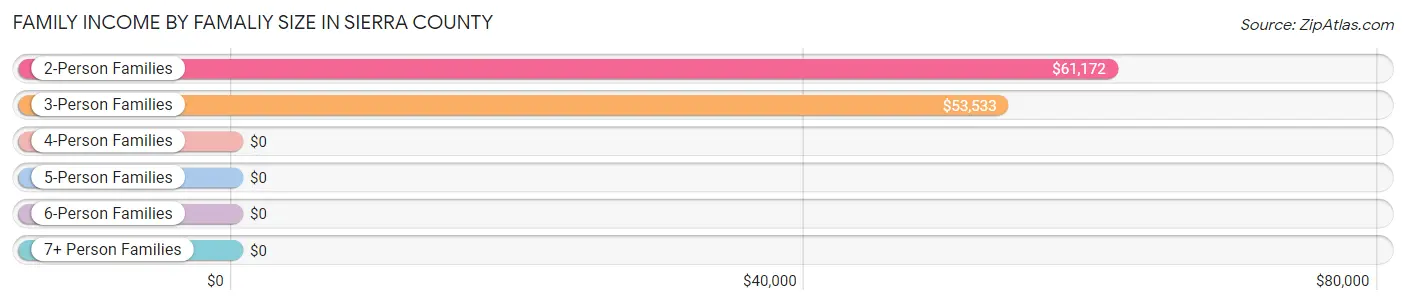
| Income Bracket | # Families | Median Income |
| 2-Person Families | 1,860 (69.8%) | $61,172 |
| 3-Person Families | 403 (15.1%) | $53,533 |
| 4-Person Families | 199 (7.5%) | $0 |
| 5-Person Families | 106 (4.0%) | $0 |
| 6-Person Families | 96 (3.6%) | $0 |
| 7+ Person Families | 0 (0.0%) | $0 |
| Total | 2,664 (100.0%) | $58,289 |
Family Income by Number of Earners in Sierra County
The median family income in Sierra County is $58,289, with families comprising 3+ earners (109) having the highest median family income of $113,711, while families with 1 earner (883) have the lowest median family income of $47,985, accounting for 4.1% and 33.2% of families, respectively.
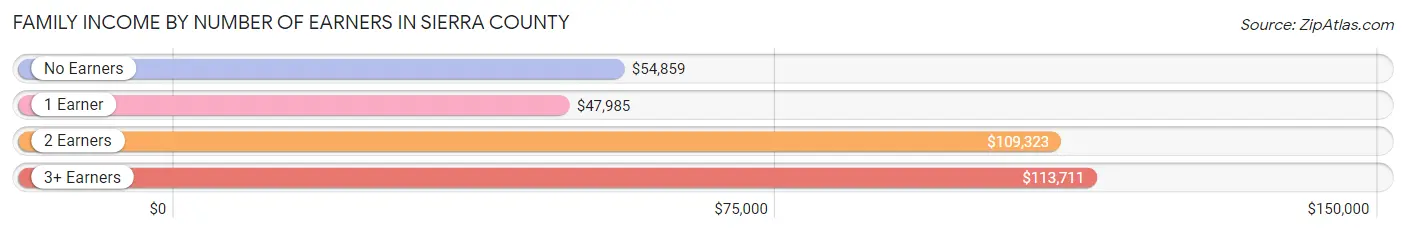
| Number of Earners | # Families | Median Income |
| No Earners | 971 (36.4%) | $54,859 |
| 1 Earner | 883 (33.2%) | $47,985 |
| 2 Earners | 701 (26.3%) | $109,323 |
| 3+ Earners | 109 (4.1%) | $113,711 |
| Total | 2,664 (100.0%) | $58,289 |
Household Income in Sierra County
Household Income Brackets in Sierra County
With 972 households falling in the category, the $15,000 to $24,999 income range is the most frequent in Sierra County, accounting for 18.4% of all households. In contrast, only 90 households (1.7%) fall into the $150,000 to $199,999 income bracket, making it the least populous group.
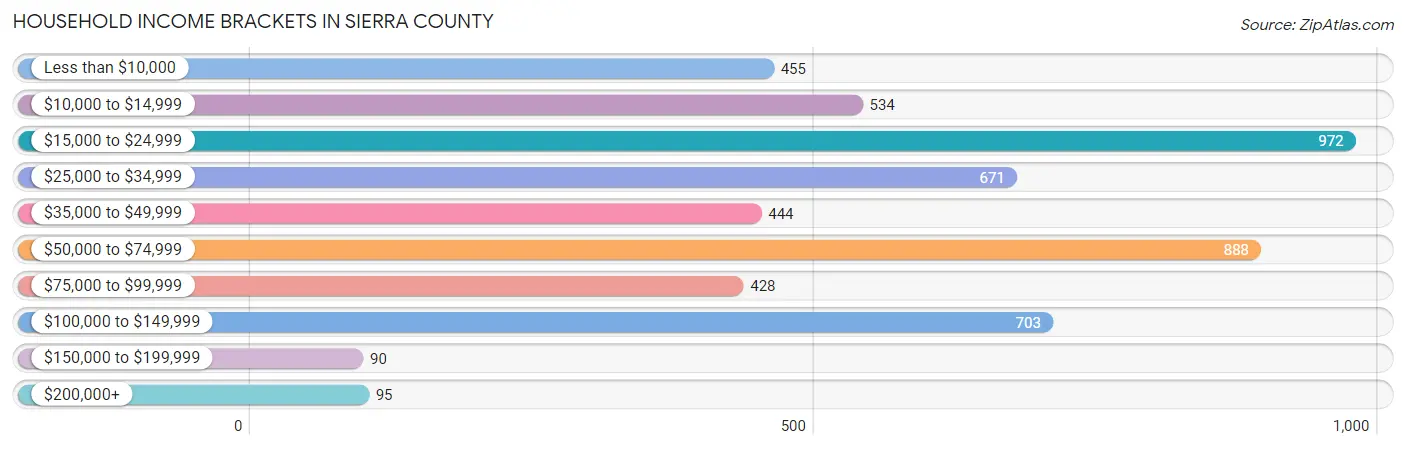
| Income Bracket | # Households | % Households |
| Less than $10,000 | 455 | 8.6% |
| $10,000 to $14,999 | 534 | 10.1% |
| $15,000 to $24,999 | 972 | 18.4% |
| $25,000 to $34,999 | 671 | 12.7% |
| $35,000 to $49,999 | 444 | 8.4% |
| $50,000 to $74,999 | 888 | 16.8% |
| $75,000 to $99,999 | 428 | 8.1% |
| $100,000 to $149,999 | 703 | 13.3% |
| $150,000 to $199,999 | 90 | 1.7% |
| $200,000+ | 95 | 1.8% |
Household Income by Householder Age in Sierra County
The median household income in Sierra County is $35,256, with the highest median household income of $57,841 found in the 25 to 44 years age bracket for the primary householder. A total of 915 households (17.3%) fall into this category. Meanwhile, the 15 to 24 years age bracket for the primary householder has the lowest median household income of $26,447, with 68 households (1.3%) in this group.
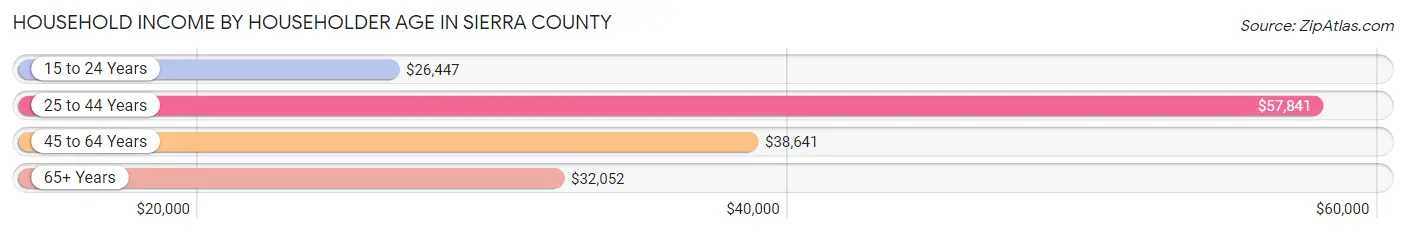
| Income Bracket | # Households | Median Income |
| 15 to 24 Years | 68 (1.3%) | $26,447 |
| 25 to 44 Years | 915 (17.3%) | $57,841 |
| 45 to 64 Years | 1,573 (29.8%) | $38,641 |
| 65+ Years | 2,729 (51.6%) | $32,052 |
| Total | 5,285 (100.0%) | $35,256 |
Poverty in Sierra County
Income Below Poverty by Sex and Age in Sierra County
With 25.8% poverty level for males and 24.6% for females among the residents of Sierra County, 5 year old males and 12 to 14 year old females are the most vulnerable to poverty, with 37 males (100.0%) and 78 females (62.9%) in their respective age groups living below the poverty level.
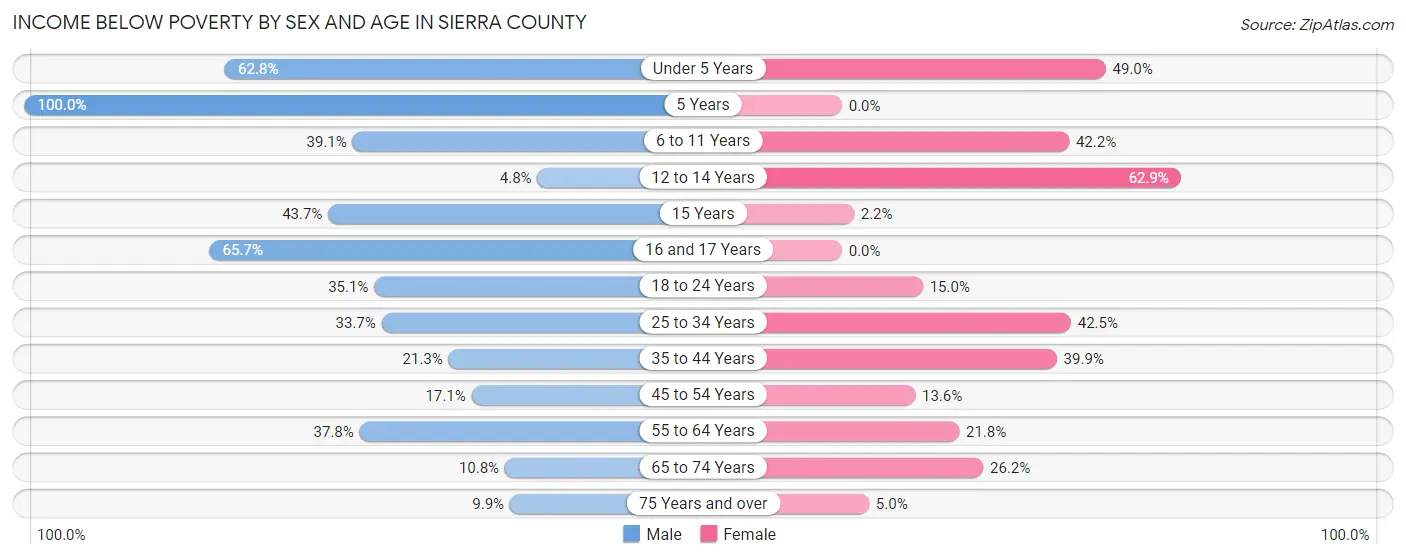
| Age Bracket | Male | Female |
| Under 5 Years | 216 (62.8%) | 70 (48.9%) |
| 5 Years | 37 (100.0%) | 0 (0.0%) |
| 6 to 11 Years | 124 (39.1%) | 132 (42.2%) |
| 12 to 14 Years | 5 (4.8%) | 78 (62.9%) |
| 15 Years | 55 (43.6%) | 4 (2.2%) |
| 16 and 17 Years | 44 (65.7%) | 0 (0.0%) |
| 18 to 24 Years | 99 (35.1%) | 32 (15.0%) |
| 25 to 34 Years | 172 (33.7%) | 156 (42.5%) |
| 35 to 44 Years | 121 (21.3%) | 274 (39.9%) |
| 45 to 54 Years | 96 (17.1%) | 85 (13.6%) |
| 55 to 64 Years | 295 (37.8%) | 185 (21.8%) |
| 65 to 74 Years | 121 (10.8%) | 304 (26.2%) |
| 75 Years and over | 90 (9.9%) | 39 (5.0%) |
| Total | 1,475 (25.8%) | 1,359 (24.6%) |
Income Above Poverty by Sex and Age in Sierra County
According to the poverty statistics in Sierra County, males aged 12 to 14 years and females aged 5 years are the age groups that are most secure financially, with 95.2% of males and 100.0% of females in these age groups living above the poverty line.
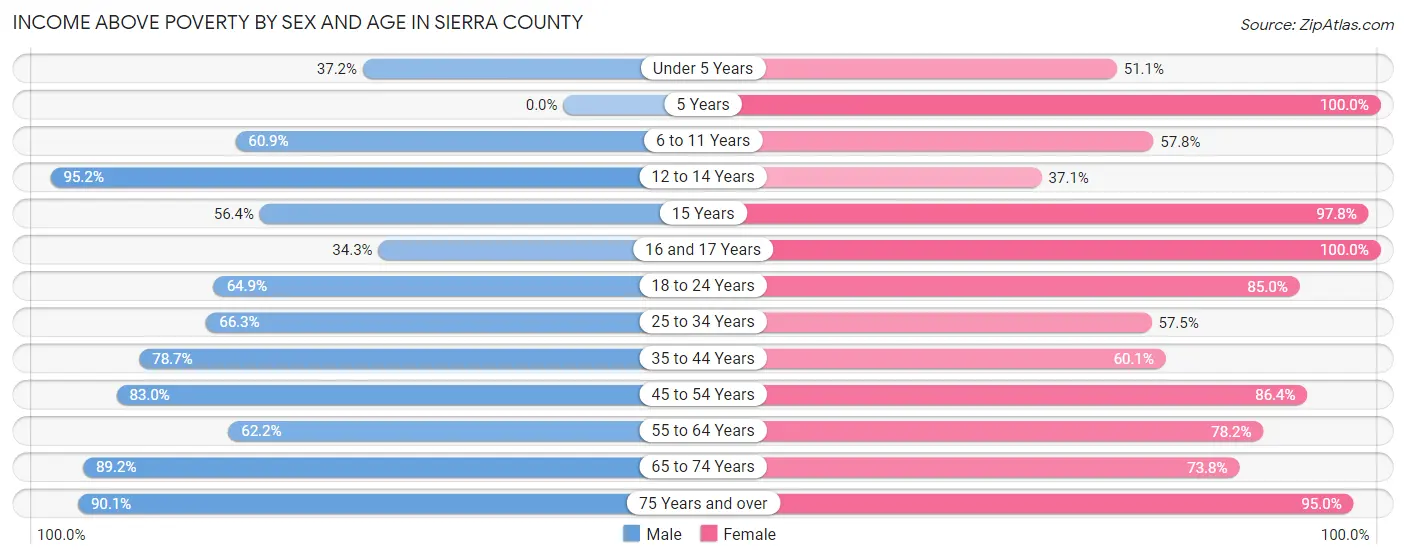
| Age Bracket | Male | Female |
| Under 5 Years | 128 (37.2%) | 73 (51.0%) |
| 5 Years | 0 (0.0%) | 22 (100.0%) |
| 6 to 11 Years | 193 (60.9%) | 181 (57.8%) |
| 12 to 14 Years | 99 (95.2%) | 46 (37.1%) |
| 15 Years | 71 (56.4%) | 176 (97.8%) |
| 16 and 17 Years | 23 (34.3%) | 66 (100.0%) |
| 18 to 24 Years | 183 (64.9%) | 181 (85.0%) |
| 25 to 34 Years | 338 (66.3%) | 211 (57.5%) |
| 35 to 44 Years | 447 (78.7%) | 413 (60.1%) |
| 45 to 54 Years | 467 (83.0%) | 540 (86.4%) |
| 55 to 64 Years | 485 (62.2%) | 665 (78.2%) |
| 65 to 74 Years | 995 (89.2%) | 855 (73.8%) |
| 75 Years and over | 818 (90.1%) | 736 (95.0%) |
| Total | 4,247 (74.2%) | 4,165 (75.4%) |
Income Below Poverty Among Married-Couple Families in Sierra County
The poverty statistics for married-couple families in Sierra County show that 10.5% or 217 of the total 2,073 families live below the poverty line. Families with 3 or 4 children have the highest poverty rate of 46.3%, comprising of 56 families. On the other hand, families with no children have the lowest poverty rate of 6.0%, which includes 101 families.
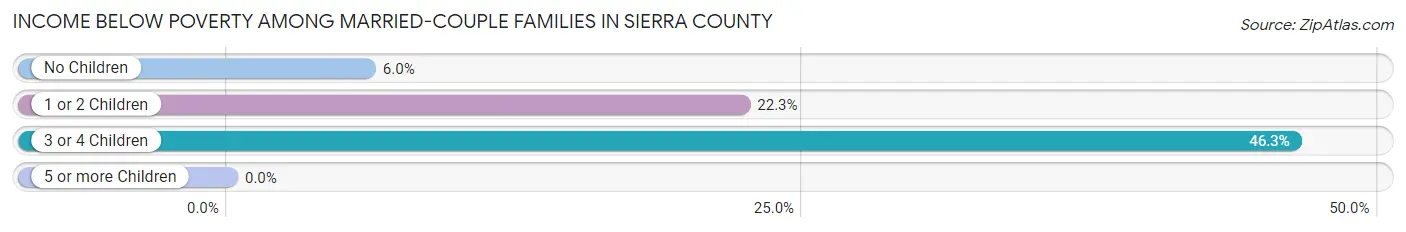
| Children | Above Poverty | Below Poverty |
| No Children | 1,582 (94.0%) | 101 (6.0%) |
| 1 or 2 Children | 209 (77.7%) | 60 (22.3%) |
| 3 or 4 Children | 65 (53.7%) | 56 (46.3%) |
| 5 or more Children | 0 (0.0%) | 0 (0.0%) |
| Total | 1,856 (89.5%) | 217 (10.5%) |
Income Below Poverty Among Single-Parent Households in Sierra County
According to the poverty data in Sierra County, 22.0% or 33 single-father households and 46.5% or 205 single-mother households are living below the poverty line. Among single-father households, those with no children have the highest poverty rate, with 30 households (66.7%) experiencing poverty. Likewise, among single-mother households, those with 3 or 4 children have the highest poverty rate, with 81 households (100.0%) falling below the poverty line.
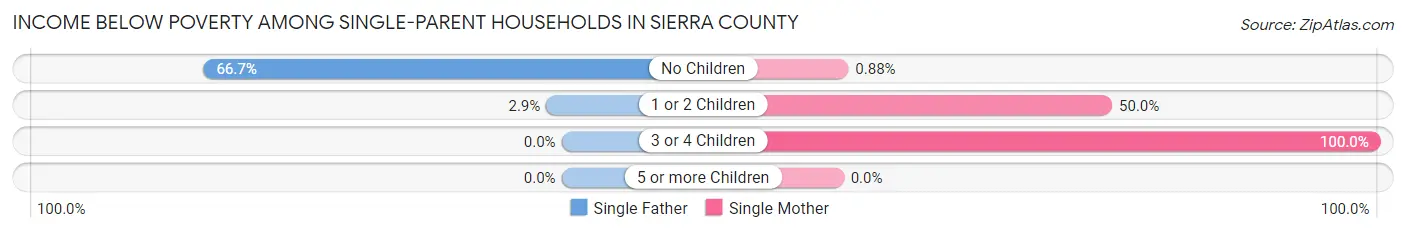
| Children | Single Father | Single Mother |
| No Children | 30 (66.7%) | 1 (0.9%) |
| 1 or 2 Children | 3 (2.9%) | 123 (50.0%) |
| 3 or 4 Children | 0 (0.0%) | 81 (100.0%) |
| 5 or more Children | 0 (0.0%) | 0 (0.0%) |
| Total | 33 (22.0%) | 205 (46.5%) |
Income Below Poverty Among Married-Couple vs Single-Parent Households in Sierra County
The poverty data for Sierra County shows that 217 of the married-couple family households (10.5%) and 238 of the single-parent households (40.3%) are living below the poverty level. Within the married-couple family households, those with 3 or 4 children have the highest poverty rate, with 56 households (46.3%) falling below the poverty line. Among the single-parent households, those with 3 or 4 children have the highest poverty rate, with 81 household (100.0%) living below poverty.
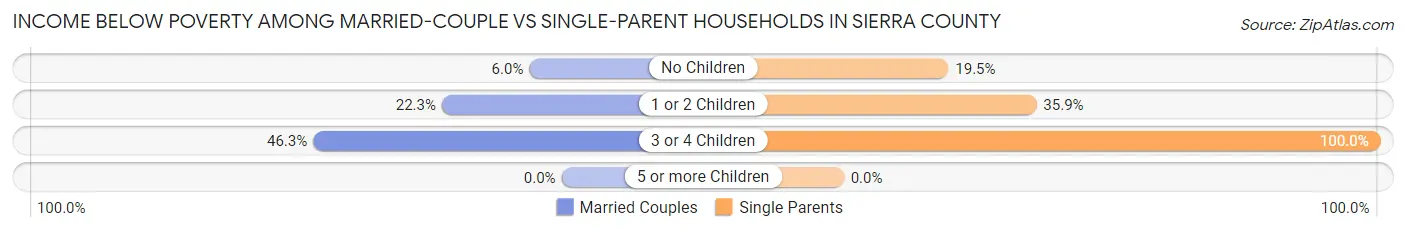
| Children | Married-Couple Families | Single-Parent Households |
| No Children | 101 (6.0%) | 31 (19.5%) |
| 1 or 2 Children | 60 (22.3%) | 126 (35.9%) |
| 3 or 4 Children | 56 (46.3%) | 81 (100.0%) |
| 5 or more Children | 0 (0.0%) | 0 (0.0%) |
| Total | 217 (10.5%) | 238 (40.3%) |
Race in Sierra County
The most populous races in Sierra County are White / Caucasian (9,020 | 78.4%), Hispanic or Latino (3,697 | 32.1%), and Two or more Races (1,569 | 13.6%).
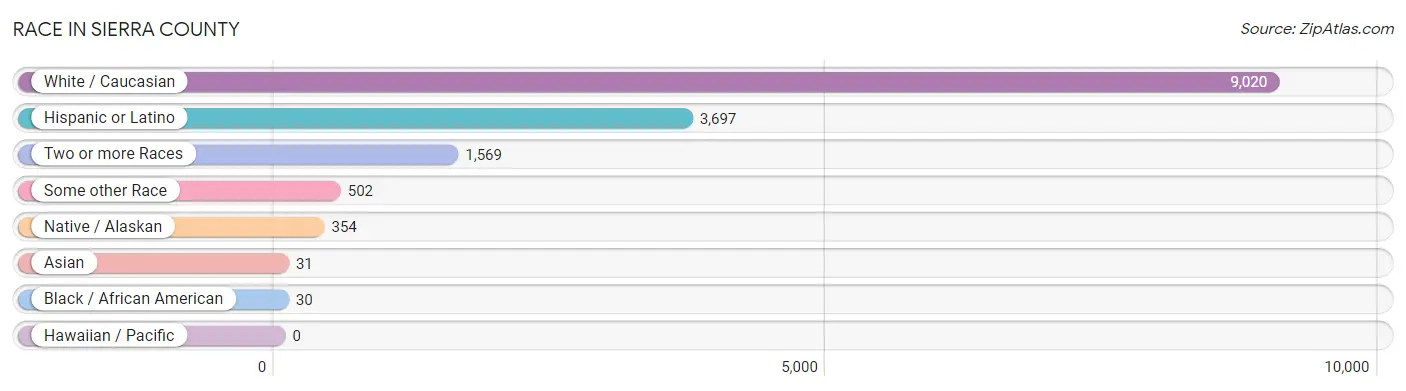
| Race | # Population | % Population |
| Asian | 31 | 0.3% |
| Black / African American | 30 | 0.3% |
| Hawaiian / Pacific | 0 | 0.0% |
| Hispanic or Latino | 3,697 | 32.1% |
| Native / Alaskan | 354 | 3.1% |
| White / Caucasian | 9,020 | 78.4% |
| Two or more Races | 1,569 | 13.6% |
| Some other Race | 502 | 4.4% |
| Total | 11,506 | 100.0% |
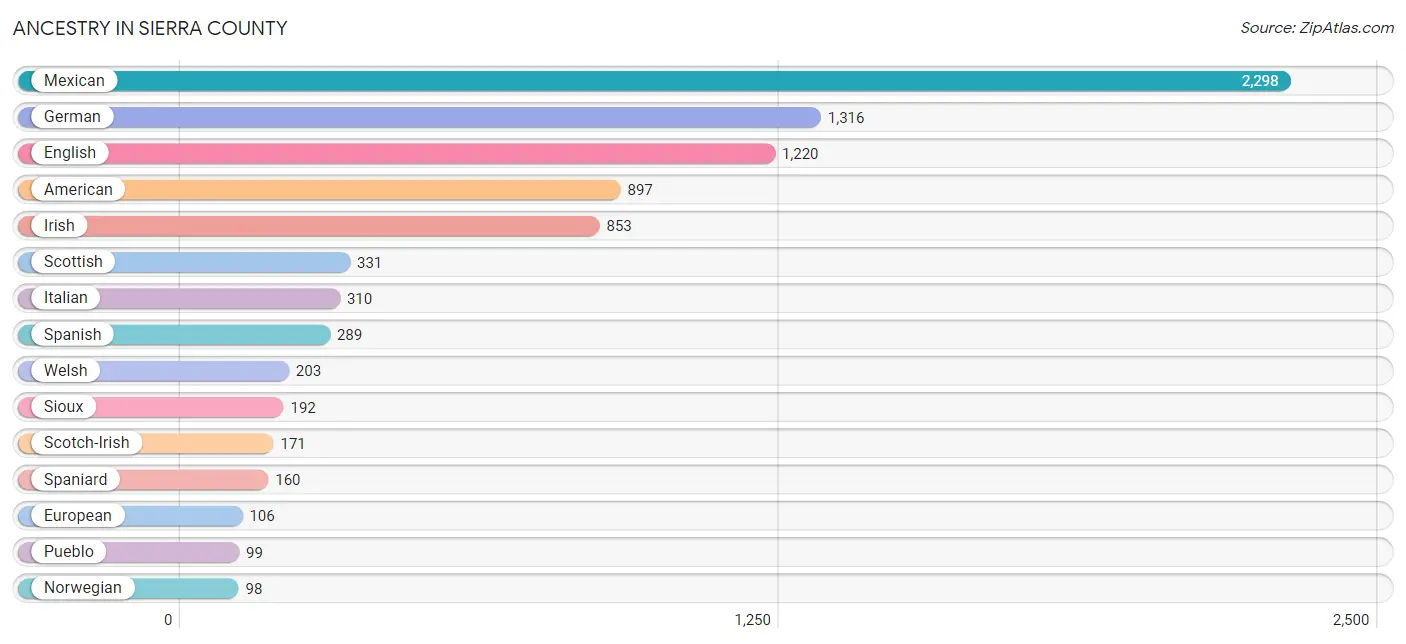
Ancestry in Sierra County
The most populous ancestries reported in Sierra County are Mexican (2,298 | 20.0%), German (1,316 | 11.4%), English (1,220 | 10.6%), American (897 | 7.8%), and Irish (853 | 7.4%), together accounting for 57.2% of all Sierra County residents.
| Ancestry | # Population | % Population |
| Alaskan Athabascan | 7 | 0.1% |
| Alsatian | 9 | 0.1% |
| American | 897 | 7.8% |
| Apache | 87 | 0.8% |
| Arab | 14 | 0.1% |
| Austrian | 50 | 0.4% |
| Bhutanese | 58 | 0.5% |
| Blackfeet | 5 | 0.0% |
| British | 14 | 0.1% |
| Canadian | 26 | 0.2% |
| Central American | 56 | 0.5% |
| Cherokee | 51 | 0.4% |
| Croatian | 8 | 0.1% |
| Czech | 23 | 0.2% |
| Danish | 28 | 0.2% |
| Dutch | 75 | 0.6% |
| Eastern European | 6 | 0.1% |
| English | 1,220 | 10.6% |
| European | 106 | 0.9% |
| Finnish | 8 | 0.1% |
| French | 89 | 0.8% |
| French Canadian | 33 | 0.3% |
| German | 1,316 | 11.4% |
| Greek | 17 | 0.2% |
| Guatemalan | 56 | 0.5% |
| Hungarian | 26 | 0.2% |
| Iranian | 8 | 0.1% |
| Iraqi | 14 | 0.1% |
| Irish | 853 | 7.4% |
| Iroquois | 58 | 0.5% |
| Italian | 310 | 2.7% |
| Korean | 43 | 0.4% |
| Lithuanian | 94 | 0.8% |
| Mexican | 2,298 | 20.0% |
| Navajo | 7 | 0.1% |
| Northern European | 13 | 0.1% |
| Norwegian | 98 | 0.9% |
| Polish | 78 | 0.7% |
| Portuguese | 18 | 0.2% |
| Pueblo | 99 | 0.9% |
| Puerto Rican | 22 | 0.2% |
| Romanian | 5 | 0.0% |
| Russian | 24 | 0.2% |
| Scandinavian | 16 | 0.1% |
| Scotch-Irish | 171 | 1.5% |
| Scottish | 331 | 2.9% |
| Serbian | 14 | 0.1% |
| Sioux | 192 | 1.7% |
| Spaniard | 160 | 1.4% |
| Spanish | 289 | 2.5% |
| Spanish American | 11 | 0.1% |
| Swedish | 88 | 0.8% |
| Swiss | 45 | 0.4% |
| Ukrainian | 21 | 0.2% |
| Welsh | 203 | 1.8% | View All 55 Rows |
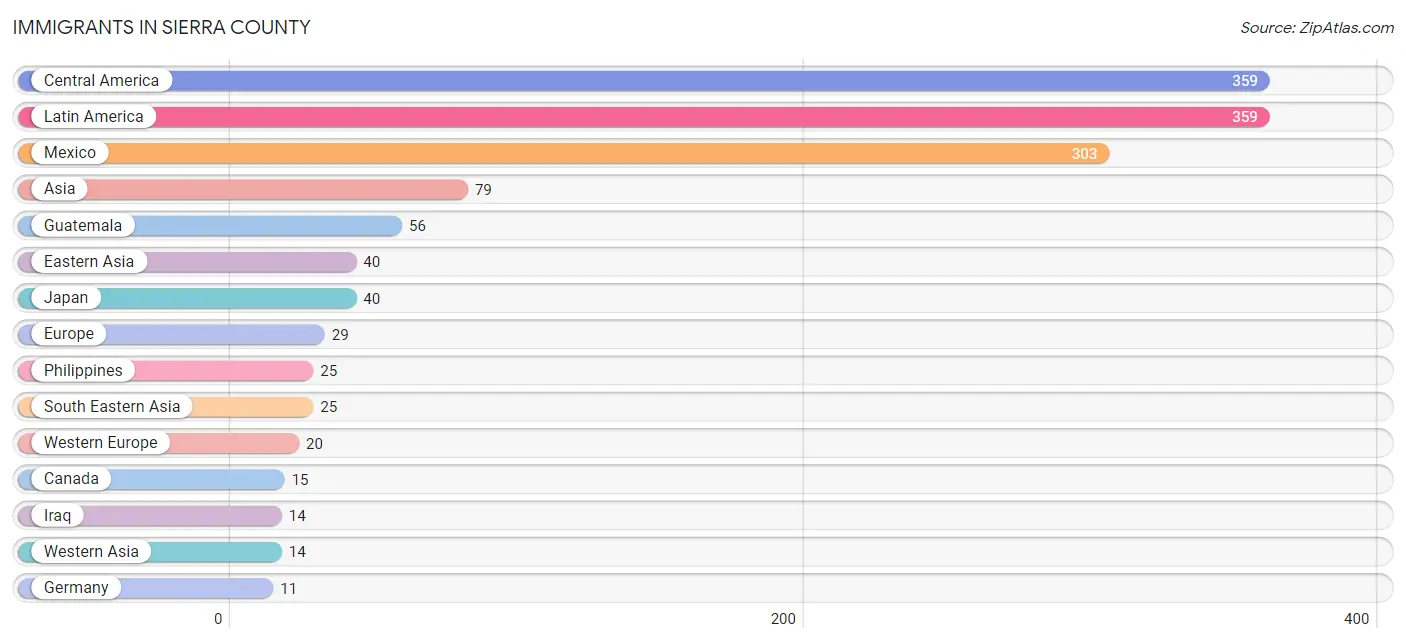
Immigrants in Sierra County
The most numerous immigrant groups reported in Sierra County came from Central America (359 | 3.1%), Latin America (359 | 3.1%), Mexico (303 | 2.6%), Asia (79 | 0.7%), and Guatemala (56 | 0.5%), together accounting for 10.1% of all Sierra County residents.
| Immigration Origin | # Population | % Population |
| Asia | 79 | 0.7% |
| Canada | 15 | 0.1% |
| Central America | 359 | 3.1% |
| Eastern Asia | 40 | 0.4% |
| England | 9 | 0.1% |
| Europe | 29 | 0.3% |
| France | 9 | 0.1% |
| Germany | 11 | 0.1% |
| Guatemala | 56 | 0.5% |
| Iraq | 14 | 0.1% |
| Japan | 40 | 0.4% |
| Latin America | 359 | 3.1% |
| Mexico | 303 | 2.6% |
| Northern Europe | 9 | 0.1% |
| Philippines | 25 | 0.2% |
| South Eastern Asia | 25 | 0.2% |
| Western Asia | 14 | 0.1% |
| Western Europe | 20 | 0.2% | View All 18 Rows |
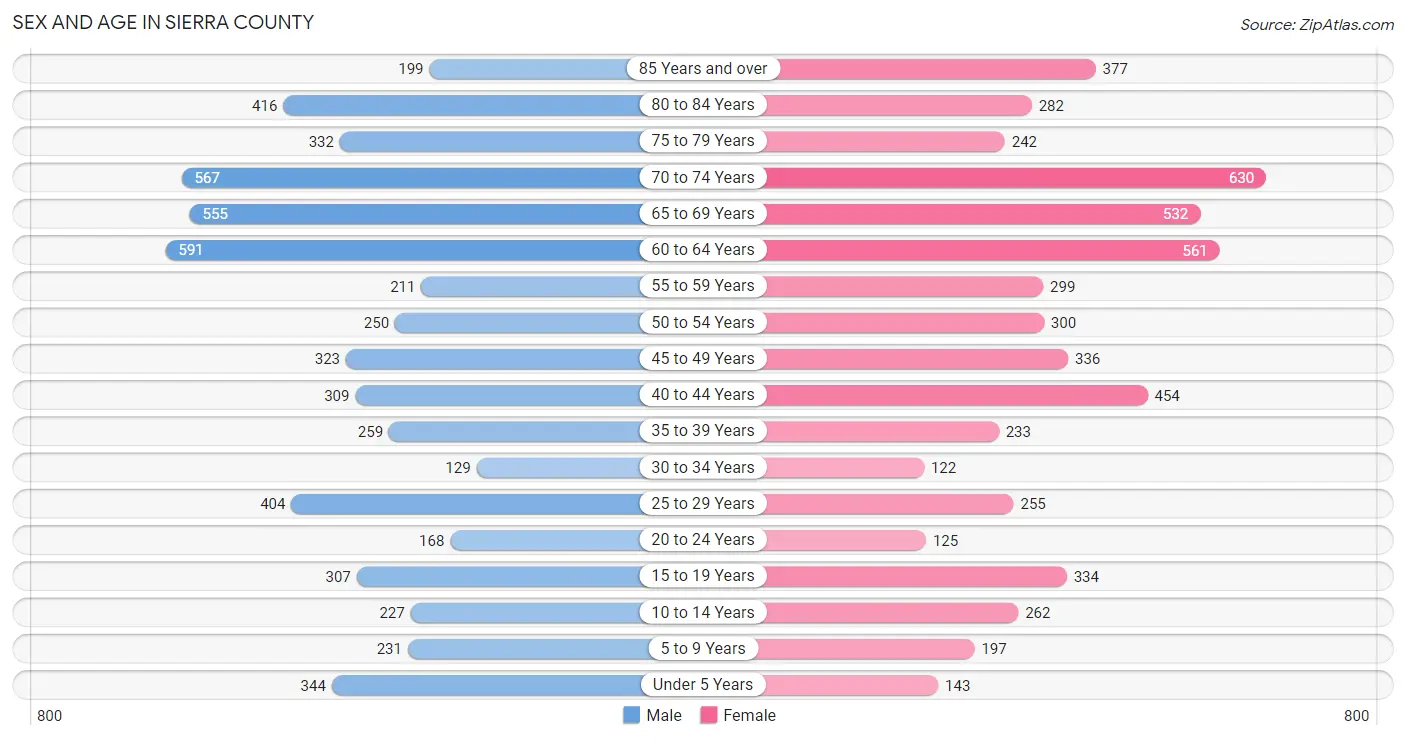
Sex and Age in Sierra County
Sex and Age in Sierra County
The most populous age groups in Sierra County are 60 to 64 Years (591 | 10.2%) for men and 70 to 74 Years (630 | 11.1%) for women.
| Age Bracket | Male | Female |
| Under 5 Years | 344 (5.9%) | 143 (2.5%) |
| 5 to 9 Years | 231 (4.0%) | 197 (3.5%) |
| 10 to 14 Years | 227 (3.9%) | 262 (4.6%) |
| 15 to 19 Years | 307 (5.3%) | 334 (5.9%) |
| 20 to 24 Years | 168 (2.9%) | 125 (2.2%) |
| 25 to 29 Years | 404 (6.9%) | 255 (4.5%) |
| 30 to 34 Years | 129 (2.2%) | 122 (2.1%) |
| 35 to 39 Years | 259 (4.4%) | 233 (4.1%) |
| 40 to 44 Years | 309 (5.3%) | 454 (8.0%) |
| 45 to 49 Years | 323 (5.6%) | 336 (5.9%) |
| 50 to 54 Years | 250 (4.3%) | 300 (5.3%) |
| 55 to 59 Years | 211 (3.6%) | 299 (5.3%) |
| 60 to 64 Years | 591 (10.2%) | 561 (9.9%) |
| 65 to 69 Years | 555 (9.5%) | 532 (9.4%) |
| 70 to 74 Years | 567 (9.7%) | 630 (11.1%) |
| 75 to 79 Years | 332 (5.7%) | 242 (4.3%) |
| 80 to 84 Years | 416 (7.1%) | 282 (5.0%) |
| 85 Years and over | 199 (3.4%) | 377 (6.6%) |
| Total | 5,822 (100.0%) | 5,684 (100.0%) |
Families and Households in Sierra County
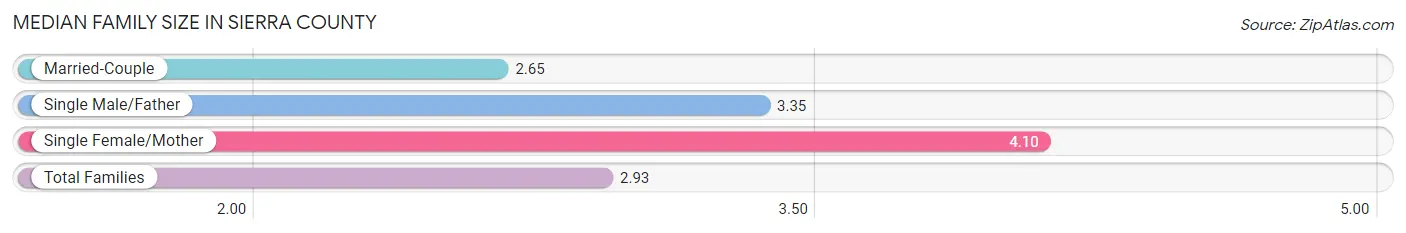
Median Family Size in Sierra County
The median family size in Sierra County is 2.93 persons per family, with single female/mother families (441 | 16.6%) accounting for the largest median family size of 4.1 persons per family. On the other hand, married-couple families (2,073 | 77.8%) represent the smallest median family size with 2.65 persons per family.
| Family Type | # Families | Family Size |
| Married-Couple | 2,073 (77.8%) | 2.65 |
| Single Male/Father | 150 (5.6%) | 3.35 |
| Single Female/Mother | 441 (16.6%) | 4.10 |
| Total Families | 2,664 (100.0%) | 2.93 |
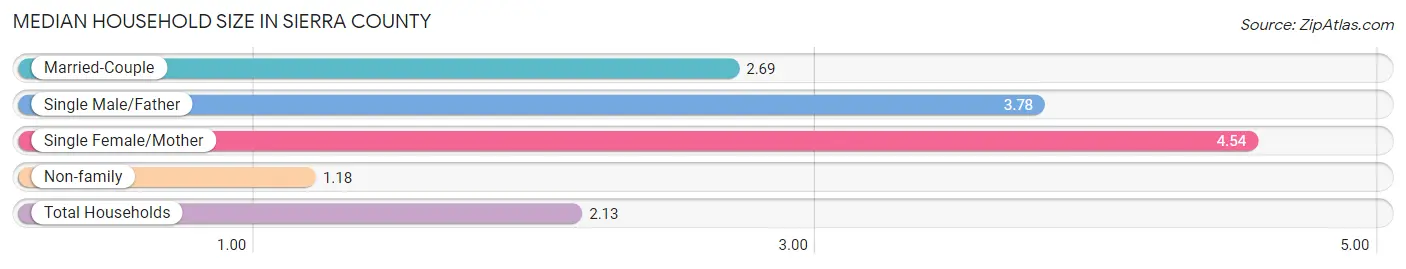
Median Household Size in Sierra County
The median household size in Sierra County is 2.13 persons per household, with single female/mother households (441 | 8.3%) accounting for the largest median household size of 4.54 persons per household. non-family households (2,621 | 49.6%) represent the smallest median household size with 1.18 persons per household.
| Household Type | # Households | Household Size |
| Married-Couple | 2,073 (39.2%) | 2.69 |
| Single Male/Father | 150 (2.8%) | 3.78 |
| Single Female/Mother | 441 (8.3%) | 4.54 |
| Non-family | 2,621 (49.6%) | 1.18 |
| Total Households | 5,285 (100.0%) | 2.13 |
Household Size by Marriage Status in Sierra County
Out of a total of 5,285 households in Sierra County, 2,664 (50.4%) are family households, while 2,621 (49.6%) are nonfamily households. The most numerous type of family households are 2-person households, comprising 1,793, and the most common type of nonfamily households are 1-person households, comprising 2,313.
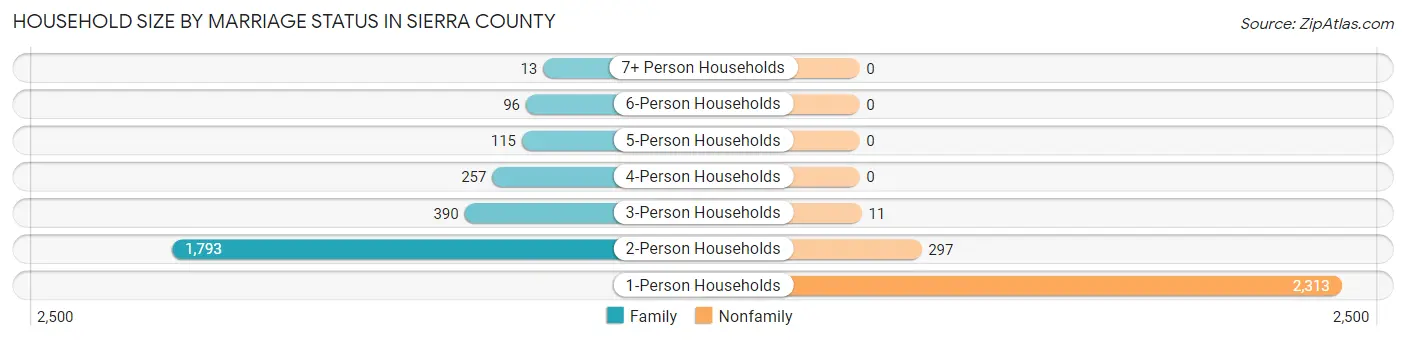
| Household Size | Family Households | Nonfamily Households |
| 1-Person Households | - | 2,313 (43.8%) |
| 2-Person Households | 1,793 (33.9%) | 297 (5.6%) |
| 3-Person Households | 390 (7.4%) | 11 (0.2%) |
| 4-Person Households | 257 (4.9%) | 0 (0.0%) |
| 5-Person Households | 115 (2.2%) | 0 (0.0%) |
| 6-Person Households | 96 (1.8%) | 0 (0.0%) |
| 7+ Person Households | 13 (0.3%) | 0 (0.0%) |
| Total | 2,664 (50.4%) | 2,621 (49.6%) |
Female Fertility in Sierra County
Fertility by Age in Sierra County
Average fertility rate in Sierra County is 31.0 births per 1,000 women. Women in the age bracket of 35 to 50 years have the highest fertility rate with 47.0 births per 1,000 women. Women in the age bracket of 35 to 50 years acount for 85.0% of all women with births.
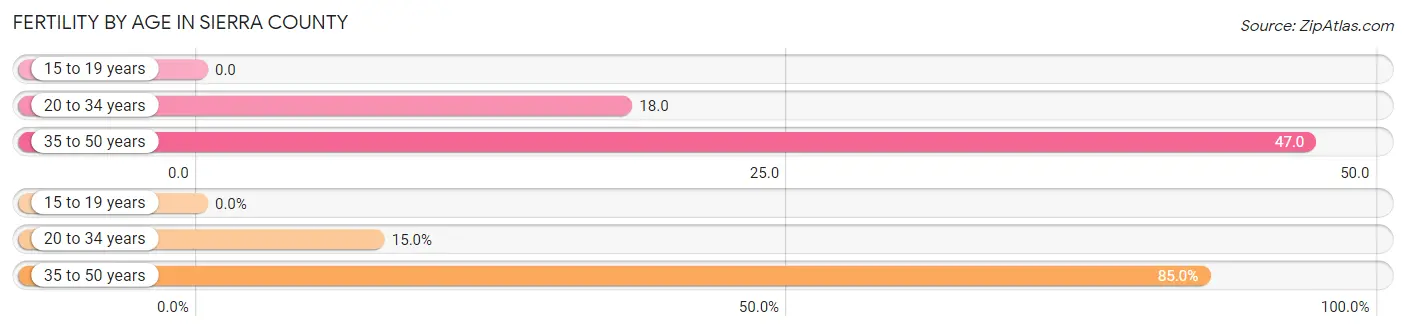
| Age Bracket | Women with Births | Births / 1,000 Women |
| 15 to 19 years | 0 (0.0%) | 0.0 |
| 20 to 34 years | 9 (15.0%) | 18.0 |
| 35 to 50 years | 51 (85.0%) | 47.0 |
| Total | 60 (100.0%) | 31.0 |
Fertility by Age by Marriage Status in Sierra County
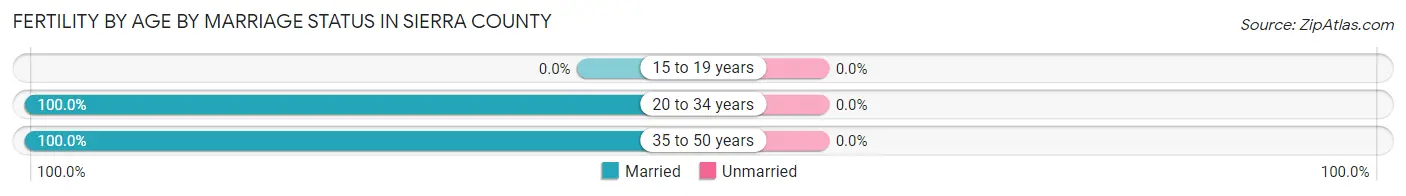
| Age Bracket | Married | Unmarried |
| 15 to 19 years | 0 (0.0%) | 0 (0.0%) |
| 20 to 34 years | 9 (100.0%) | 0 (0.0%) |
| 35 to 50 years | 51 (100.0%) | 0 (0.0%) |
| Total | 60 (100.0%) | 0 (0.0%) |
Fertility by Education in Sierra County
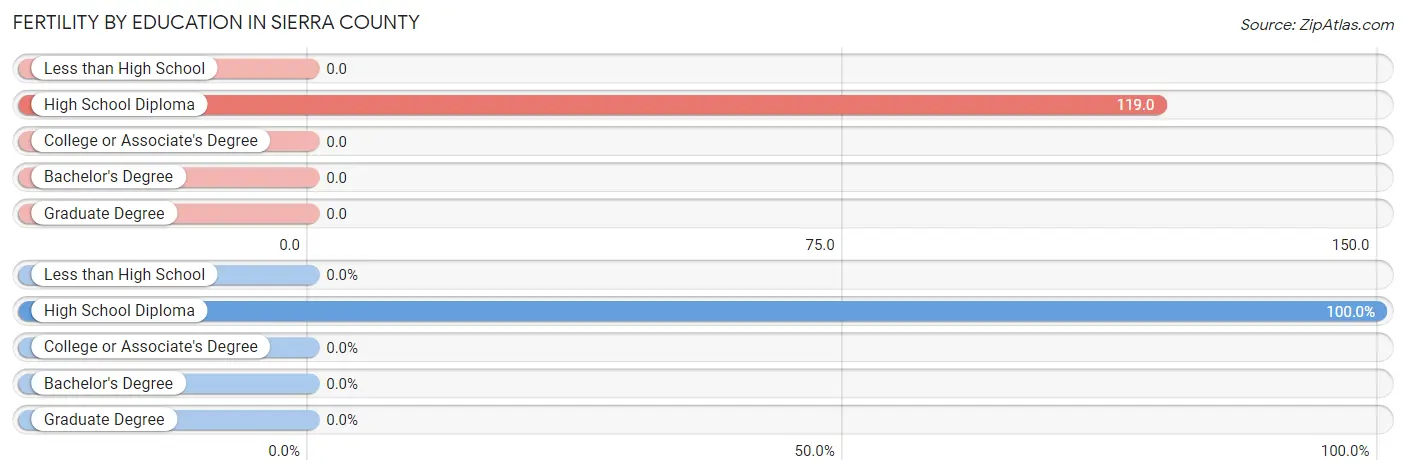
| Educational Attainment | Women with Births | Births / 1,000 Women |
| Less than High School | 0 (0.0%) | 0.0 |
| High School Diploma | 60 (100.0%) | 119.0 |
| College or Associate's Degree | 0 (0.0%) | 0.0 |
| Bachelor's Degree | 0 (0.0%) | 0.0 |
| Graduate Degree | 0 (0.0%) | 0.0 |
| Total | 60 (100.0%) | 31.0 |
Fertility by Education by Marriage Status in Sierra County
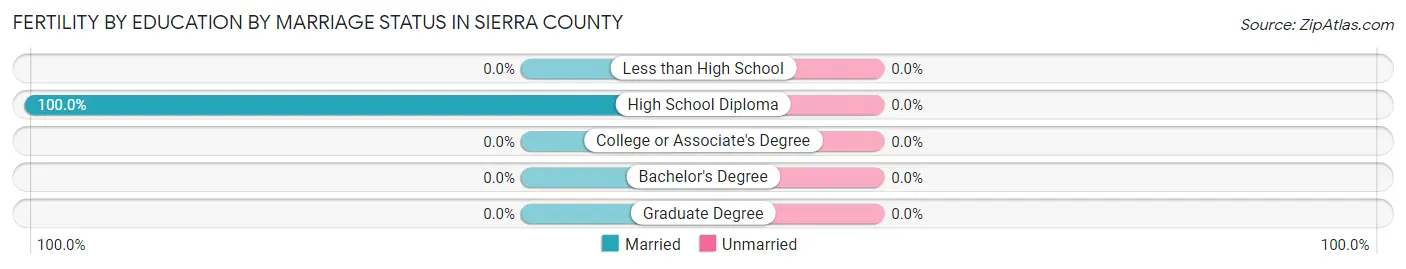
| Educational Attainment | Married | Unmarried |
| Less than High School | 0 (0.0%) | 0 (0.0%) |
| High School Diploma | 60 (100.0%) | 0 (0.0%) |
| College or Associate's Degree | 0 (0.0%) | 0 (0.0%) |
| Bachelor's Degree | 0 (0.0%) | 0 (0.0%) |
| Graduate Degree | 0 (0.0%) | 0 (0.0%) |
| Total | 60 (100.0%) | 0 (0.0%) |
Employment Characteristics in Sierra County
Employment by Class of Employer in Sierra County
Among the 3,546 employed individuals in Sierra County, private company employees (1,826 | 51.5%), self-employed (not incorporated) (610 | 17.2%), and local government employees (550 | 15.5%) make up the most common classes of employment.
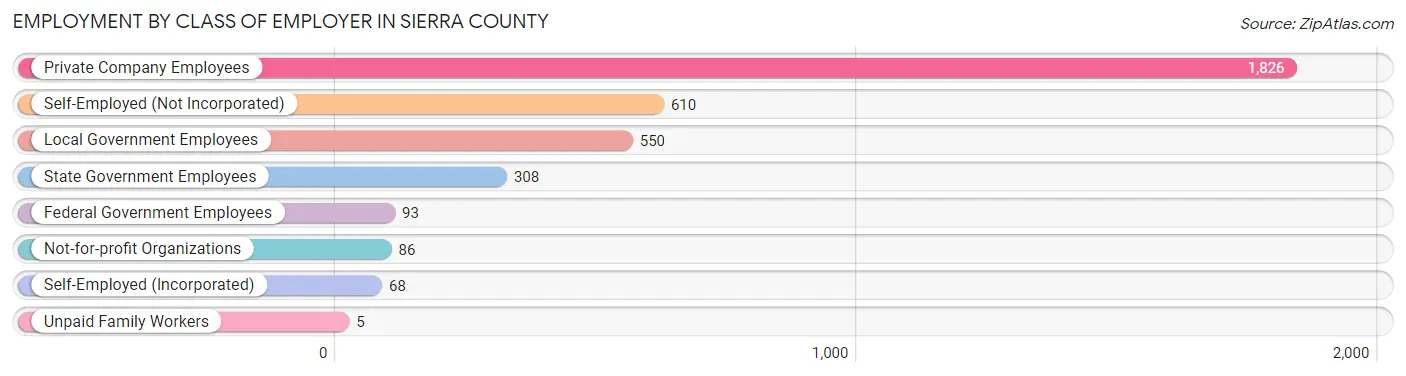
| Employer Class | # Employees | % Employees |
| Private Company Employees | 1,826 | 51.5% |
| Self-Employed (Incorporated) | 68 | 1.9% |
| Self-Employed (Not Incorporated) | 610 | 17.2% |
| Not-for-profit Organizations | 86 | 2.4% |
| Local Government Employees | 550 | 15.5% |
| State Government Employees | 308 | 8.7% |
| Federal Government Employees | 93 | 2.6% |
| Unpaid Family Workers | 5 | 0.1% |
| Total | 3,546 | 100.0% |
Employment Status by Age in Sierra County
According to the labor force statistics for Sierra County, out of the total population over 16 years of age (9,796), 38.1% or 3,732 individuals are in the labor force, with 4.7% or 175 of them unemployed. The age group with the highest labor force participation rate is 20 to 24 years, with 84.0% or 246 individuals in the labor force. Within the labor force, the 16 to 19 years age range has the highest percentage of unemployed individuals, with 19.5% or 42 of them being unemployed.
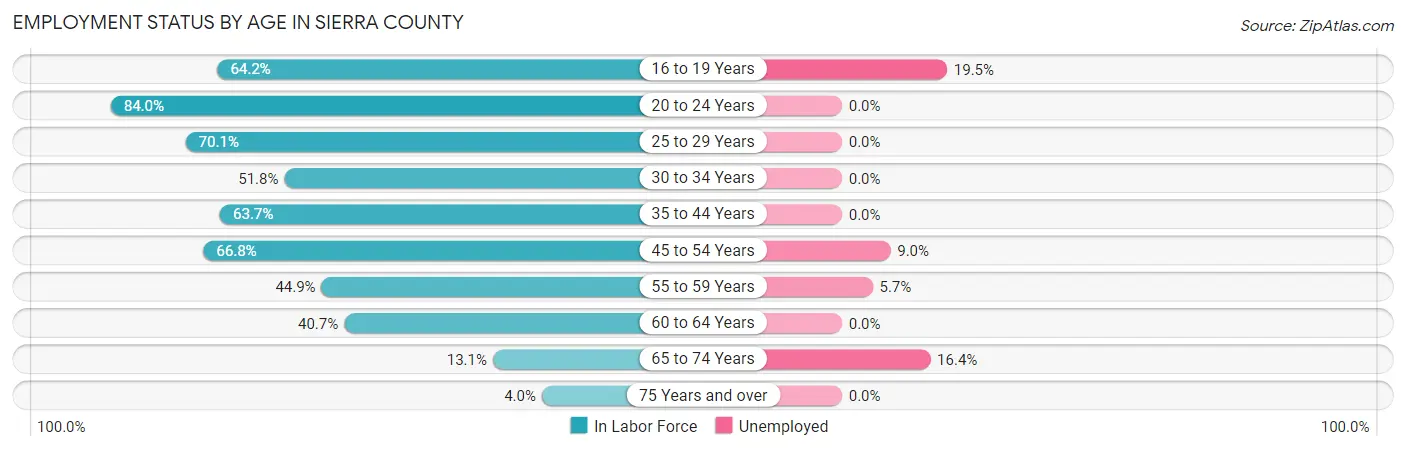
| Age Bracket | In Labor Force | Unemployed |
| 16 to 19 Years | 215 (64.2%) | 42 (19.5%) |
| 20 to 24 Years | 246 (84.0%) | 0 (0.0%) |
| 25 to 29 Years | 462 (70.1%) | 0 (0.0%) |
| 30 to 34 Years | 130 (51.8%) | 0 (0.0%) |
| 35 to 44 Years | 799 (63.7%) | 0 (0.0%) |
| 45 to 54 Years | 808 (66.8%) | 73 (9.0%) |
| 55 to 59 Years | 229 (44.9%) | 13 (5.7%) |
| 60 to 64 Years | 469 (40.7%) | 0 (0.0%) |
| 65 to 74 Years | 299 (13.1%) | 49 (16.4%) |
| 75 Years and over | 74 (4.0%) | 0 (0.0%) |
| Total | 3,732 (38.1%) | 175 (4.7%) |
Employment Status by Educational Attainment in Sierra County
According to labor force statistics for Sierra County, 57.5% of individuals (2,896) out of the total population between 25 and 64 years of age (5,036) are in the labor force, with 3.0% or 87 of them being unemployed. The group with the highest labor force participation rate are those with the educational attainment of bachelor's degree or higher, with 79.7% or 722 individuals in the labor force. Within the labor force, individuals with college / associate degree education have the highest percentage of unemployment, with 7.6% or 73 of them being unemployed.
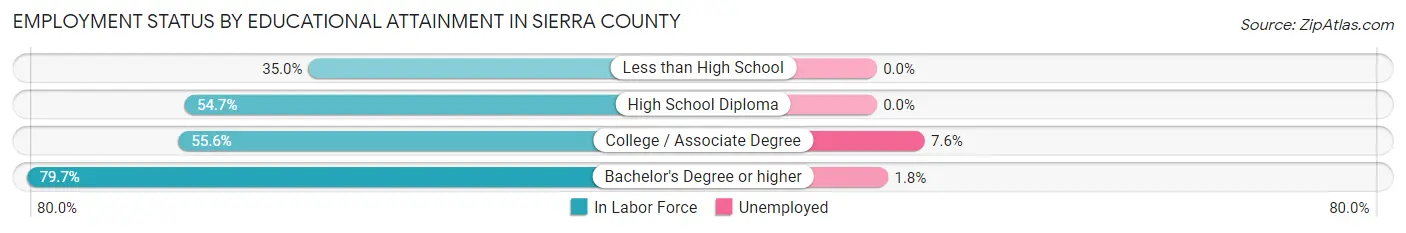
| Educational Attainment | In Labor Force | Unemployed |
| Less than High School | 173 (35.0%) | 0 (0.0%) |
| High School Diploma | 1,049 (54.7%) | 0 (0.0%) |
| College / Associate Degree | 956 (55.6%) | 131 (7.6%) |
| Bachelor's Degree or higher | 722 (79.7%) | 16 (1.8%) |
| Total | 2,896 (57.5%) | 151 (3.0%) |
Employment Occupations by Sex in Sierra County
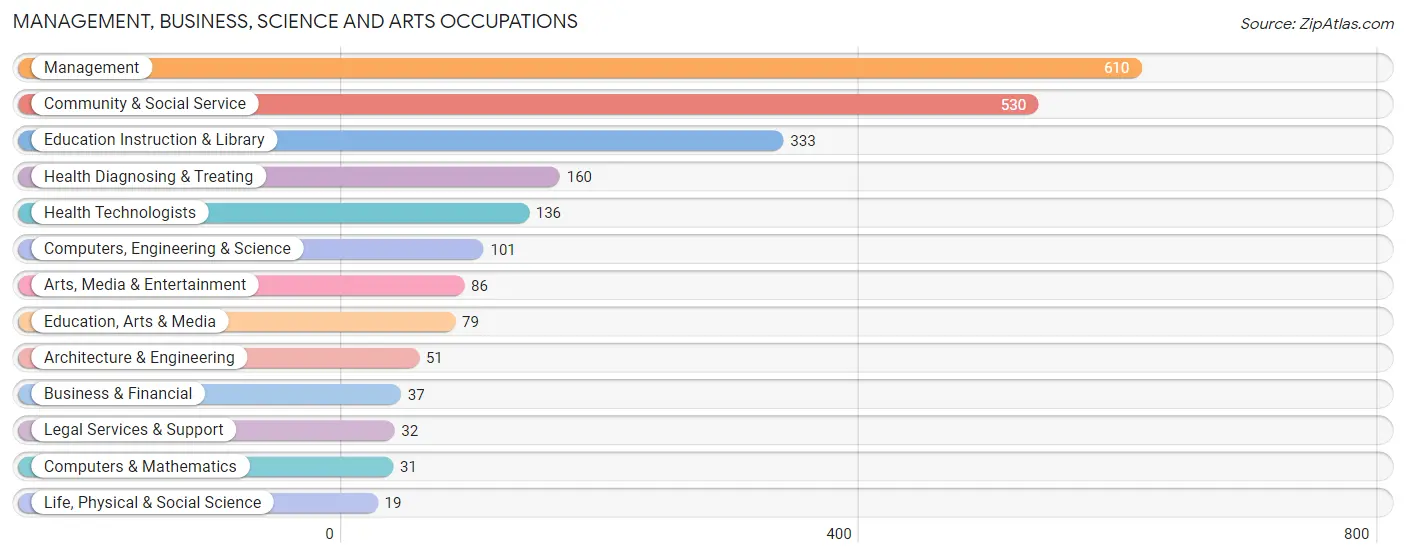
Management, Business, Science and Arts Occupations
The most common Management, Business, Science and Arts occupations in Sierra County are Management (610 | 17.2%), Community & Social Service (530 | 14.9%), Education Instruction & Library (333 | 9.4%), Health Diagnosing & Treating (160 | 4.5%), and Health Technologists (136 | 3.8%).
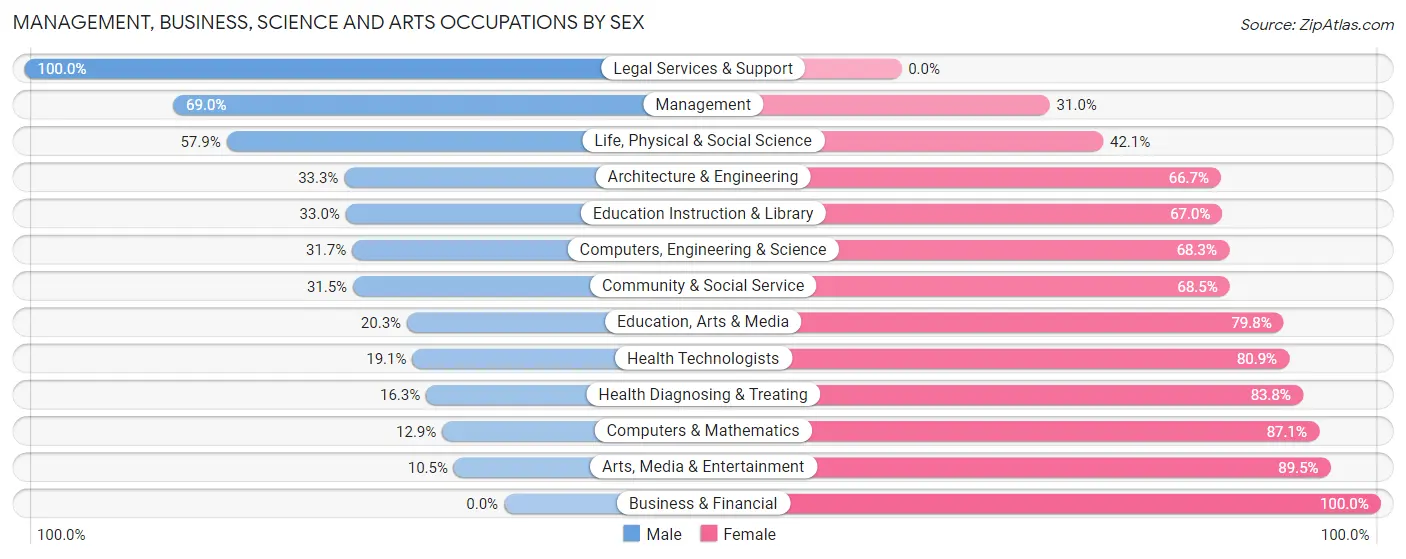
Management, Business, Science and Arts Occupations by Sex
Within the Management, Business, Science and Arts occupations in Sierra County, the most male-oriented occupations are Legal Services & Support (100.0%), Management (69.0%), and Life, Physical & Social Science (57.9%), while the most female-oriented occupations are Business & Financial (100.0%), Arts, Media & Entertainment (89.5%), and Computers & Mathematics (87.1%).
| Occupation | Male | Female |
| Management | 421 (69.0%) | 189 (31.0%) |
| Business & Financial | 0 (0.0%) | 37 (100.0%) |
| Computers, Engineering & Science | 32 (31.7%) | 69 (68.3%) |
| Computers & Mathematics | 4 (12.9%) | 27 (87.1%) |
| Architecture & Engineering | 17 (33.3%) | 34 (66.7%) |
| Life, Physical & Social Science | 11 (57.9%) | 8 (42.1%) |
| Community & Social Service | 167 (31.5%) | 363 (68.5%) |
| Education, Arts & Media | 16 (20.3%) | 63 (79.7%) |
| Legal Services & Support | 32 (100.0%) | 0 (0.0%) |
| Education Instruction & Library | 110 (33.0%) | 223 (67.0%) |
| Arts, Media & Entertainment | 9 (10.5%) | 77 (89.5%) |
| Health Diagnosing & Treating | 26 (16.3%) | 134 (83.8%) |
| Health Technologists | 26 (19.1%) | 110 (80.9%) |
| Total (Category) | 646 (44.9%) | 792 (55.1%) |
| Total (Overall) | 1,808 (50.9%) | 1,746 (49.1%) |
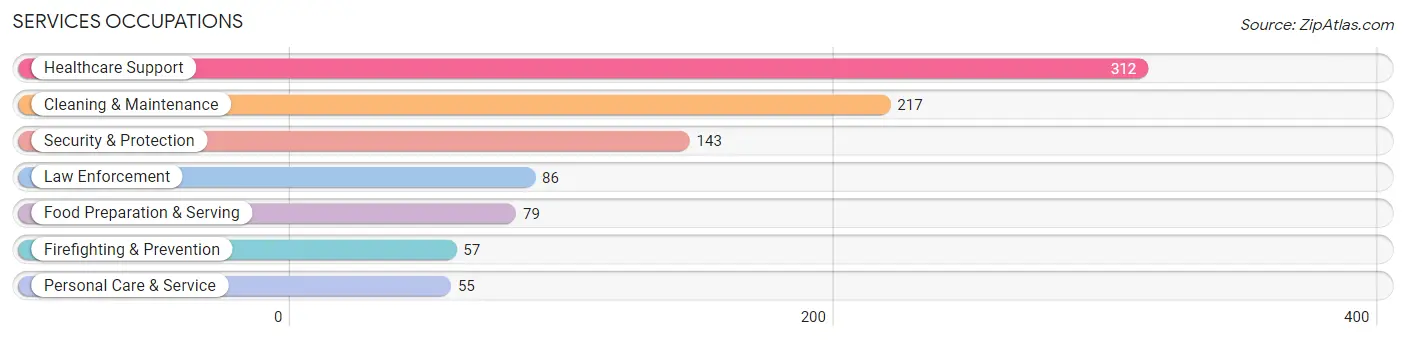
Services Occupations
The most common Services occupations in Sierra County are Healthcare Support (312 | 8.8%), Cleaning & Maintenance (217 | 6.1%), Security & Protection (143 | 4.0%), Law Enforcement (86 | 2.4%), and Food Preparation & Serving (79 | 2.2%).
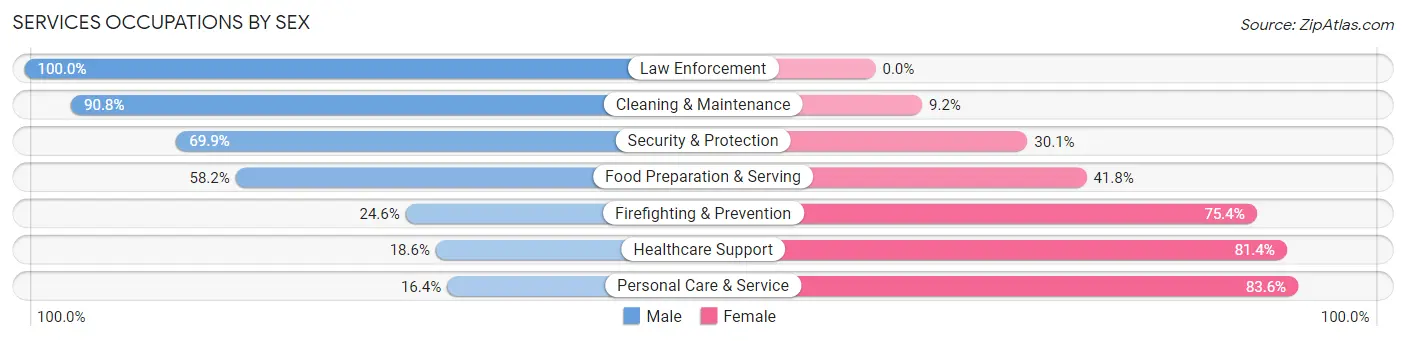
Services Occupations by Sex
Within the Services occupations in Sierra County, the most male-oriented occupations are Law Enforcement (100.0%), Cleaning & Maintenance (90.8%), and Security & Protection (69.9%), while the most female-oriented occupations are Personal Care & Service (83.6%), Healthcare Support (81.4%), and Firefighting & Prevention (75.4%).
| Occupation | Male | Female |
| Healthcare Support | 58 (18.6%) | 254 (81.4%) |
| Security & Protection | 100 (69.9%) | 43 (30.1%) |
| Firefighting & Prevention | 14 (24.6%) | 43 (75.4%) |
| Law Enforcement | 86 (100.0%) | 0 (0.0%) |
| Food Preparation & Serving | 46 (58.2%) | 33 (41.8%) |
| Cleaning & Maintenance | 197 (90.8%) | 20 (9.2%) |
| Personal Care & Service | 9 (16.4%) | 46 (83.6%) |
| Total (Category) | 410 (50.9%) | 396 (49.1%) |
| Total (Overall) | 1,808 (50.9%) | 1,746 (49.1%) |
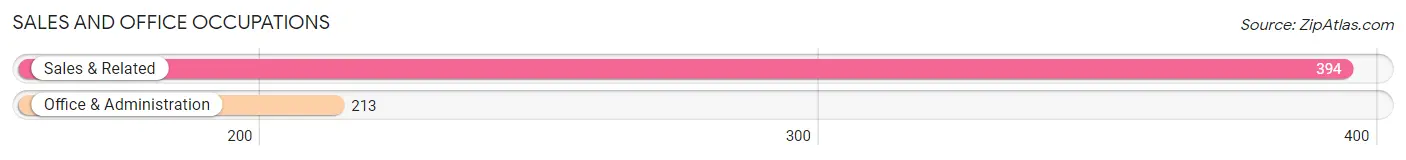
Sales and Office Occupations
The most common Sales and Office occupations in Sierra County are Sales & Related (394 | 11.1%), and Office & Administration (213 | 6.0%).
Sales and Office Occupations by Sex

| Occupation | Male | Female |
| Sales & Related | 243 (61.7%) | 151 (38.3%) |
| Office & Administration | 21 (9.9%) | 192 (90.1%) |
| Total (Category) | 264 (43.5%) | 343 (56.5%) |
| Total (Overall) | 1,808 (50.9%) | 1,746 (49.1%) |
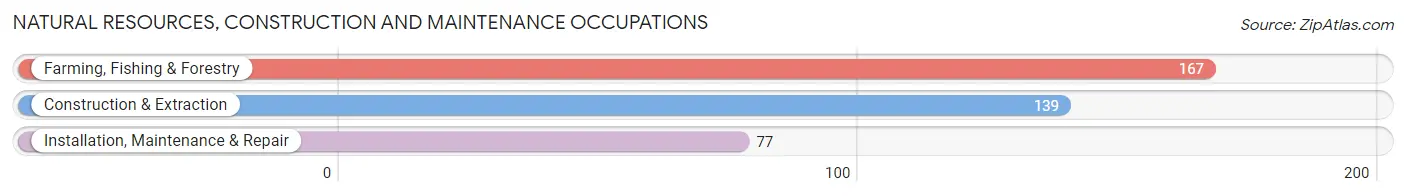
Natural Resources, Construction and Maintenance Occupations
The most common Natural Resources, Construction and Maintenance occupations in Sierra County are Farming, Fishing & Forestry (167 | 4.7%), Construction & Extraction (139 | 3.9%), and Installation, Maintenance & Repair (77 | 2.2%).
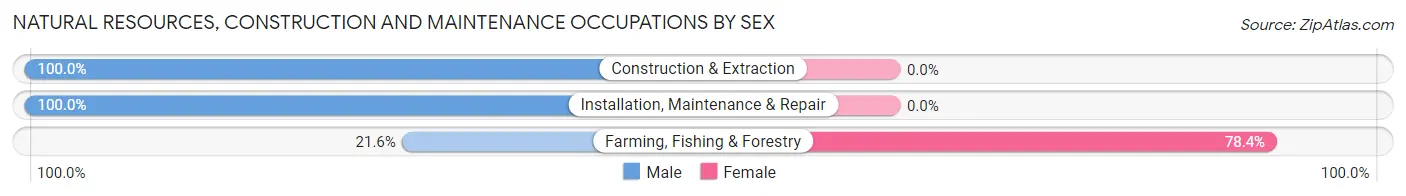
Natural Resources, Construction and Maintenance Occupations by Sex
| Occupation | Male | Female |
| Farming, Fishing & Forestry | 36 (21.6%) | 131 (78.4%) |
| Construction & Extraction | 139 (100.0%) | 0 (0.0%) |
| Installation, Maintenance & Repair | 77 (100.0%) | 0 (0.0%) |
| Total (Category) | 252 (65.8%) | 131 (34.2%) |
| Total (Overall) | 1,808 (50.9%) | 1,746 (49.1%) |
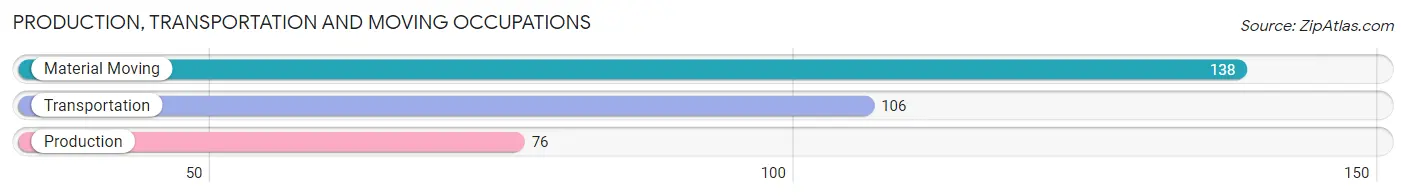
Production, Transportation and Moving Occupations
The most common Production, Transportation and Moving occupations in Sierra County are Material Moving (138 | 3.9%), Transportation (106 | 3.0%), and Production (76 | 2.1%).
Production, Transportation and Moving Occupations by Sex
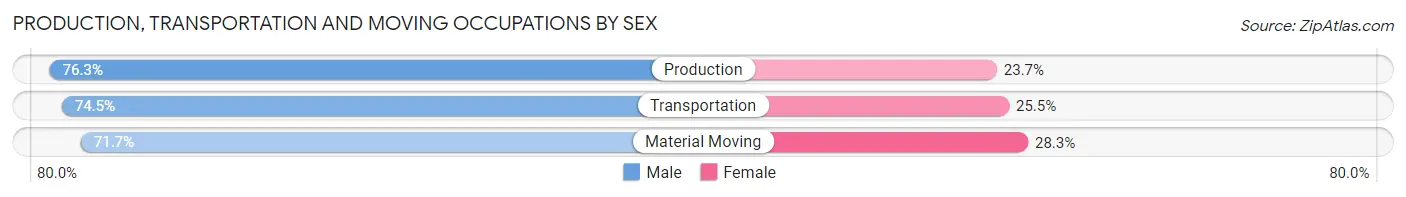
| Occupation | Male | Female |
| Production | 58 (76.3%) | 18 (23.7%) |
| Transportation | 79 (74.5%) | 27 (25.5%) |
| Material Moving | 99 (71.7%) | 39 (28.3%) |
| Total (Category) | 236 (73.8%) | 84 (26.3%) |
| Total (Overall) | 1,808 (50.9%) | 1,746 (49.1%) |
Employment Industries by Sex in Sierra County
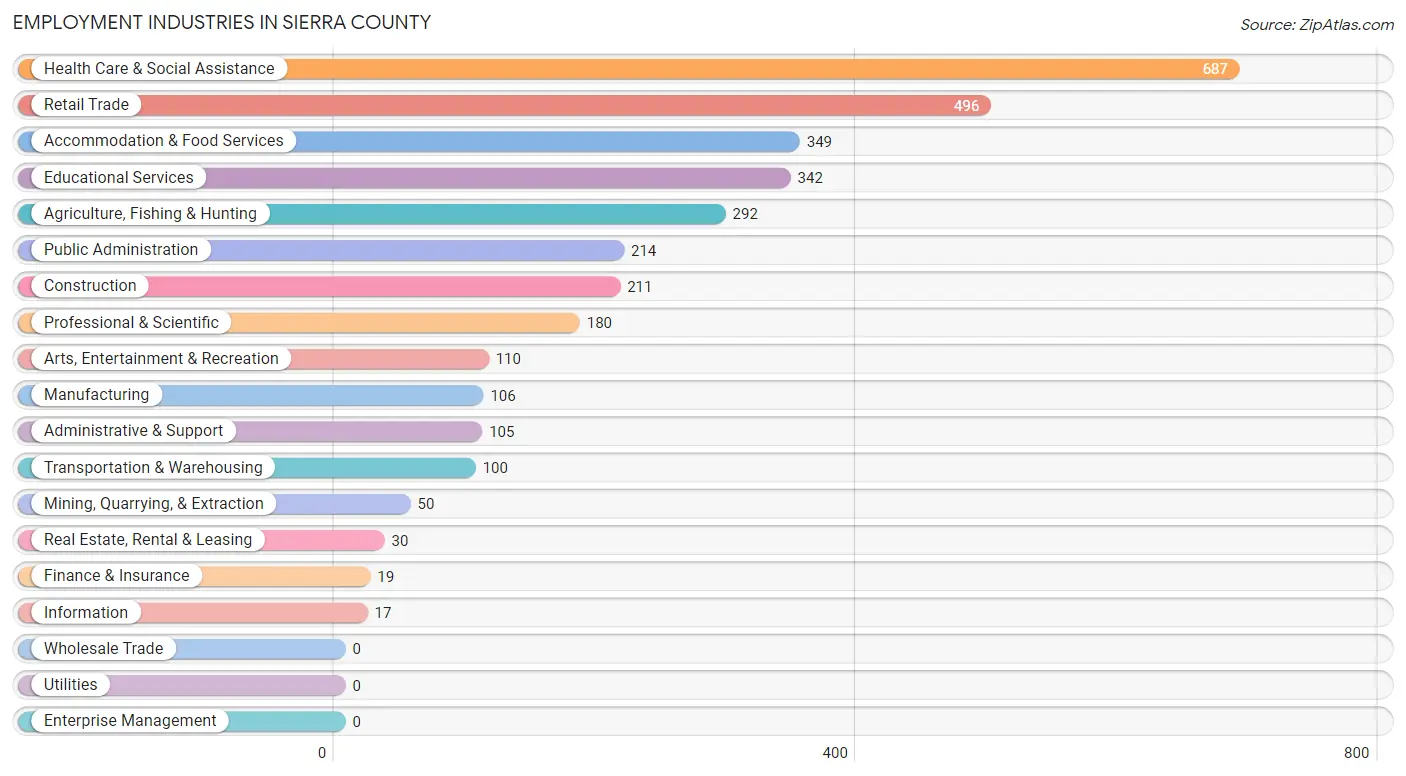
Employment Industries in Sierra County
The major employment industries in Sierra County include Health Care & Social Assistance (687 | 19.3%), Retail Trade (496 | 14.0%), Accommodation & Food Services (349 | 9.8%), Educational Services (342 | 9.6%), and Agriculture, Fishing & Hunting (292 | 8.2%).
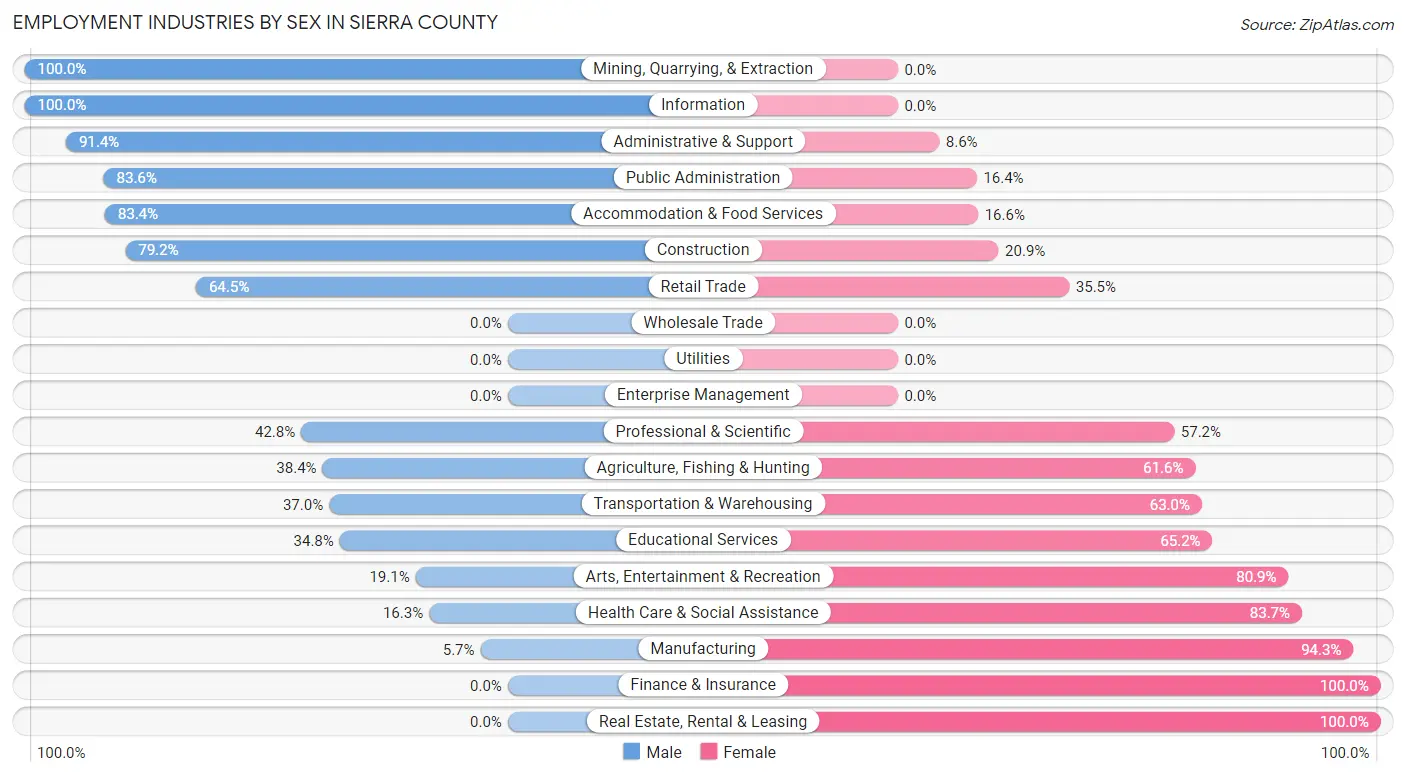
Employment Industries by Sex in Sierra County
The Sierra County industries that see more men than women are Mining, Quarrying, & Extraction (100.0%), Information (100.0%), and Administrative & Support (91.4%), whereas the industries that tend to have a higher number of women are Finance & Insurance (100.0%), Real Estate, Rental & Leasing (100.0%), and Manufacturing (94.3%).
| Industry | Male | Female |
| Agriculture, Fishing & Hunting | 112 (38.4%) | 180 (61.6%) |
| Mining, Quarrying, & Extraction | 50 (100.0%) | 0 (0.0%) |
| Construction | 167 (79.1%) | 44 (20.8%) |
| Manufacturing | 6 (5.7%) | 100 (94.3%) |
| Wholesale Trade | 0 (0.0%) | 0 (0.0%) |
| Retail Trade | 320 (64.5%) | 176 (35.5%) |
| Transportation & Warehousing | 37 (37.0%) | 63 (63.0%) |
| Utilities | 0 (0.0%) | 0 (0.0%) |
| Information | 17 (100.0%) | 0 (0.0%) |
| Finance & Insurance | 0 (0.0%) | 19 (100.0%) |
| Real Estate, Rental & Leasing | 0 (0.0%) | 30 (100.0%) |
| Professional & Scientific | 77 (42.8%) | 103 (57.2%) |
| Enterprise Management | 0 (0.0%) | 0 (0.0%) |
| Administrative & Support | 96 (91.4%) | 9 (8.6%) |
| Educational Services | 119 (34.8%) | 223 (65.2%) |
| Health Care & Social Assistance | 112 (16.3%) | 575 (83.7%) |
| Arts, Entertainment & Recreation | 21 (19.1%) | 89 (80.9%) |
| Accommodation & Food Services | 291 (83.4%) | 58 (16.6%) |
| Public Administration | 179 (83.6%) | 35 (16.4%) |
| Total | 1,808 (50.9%) | 1,746 (49.1%) |
Education in Sierra County
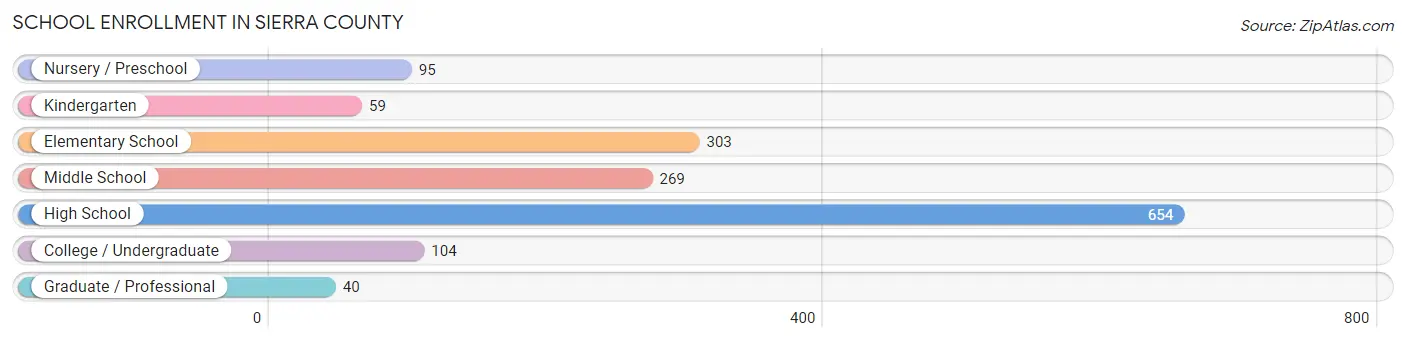
School Enrollment in Sierra County
The most common levels of schooling among the 1,524 students in Sierra County are high school (654 | 42.9%), elementary school (303 | 19.9%), and middle school (269 | 17.6%).
| School Level | # Students | % Students |
| Nursery / Preschool | 95 | 6.2% |
| Kindergarten | 59 | 3.9% |
| Elementary School | 303 | 19.9% |
| Middle School | 269 | 17.6% |
| High School | 654 | 42.9% |
| College / Undergraduate | 104 | 6.8% |
| Graduate / Professional | 40 | 2.6% |
| Total | 1,524 | 100.0% |
School Enrollment by Age by Funding Source in Sierra County
Out of a total of 1,524 students who are enrolled in schools in Sierra County, 433 (28.4%) attend a private institution, while the remaining 1,091 (71.6%) are enrolled in public schools. The age group of 20 to 24 year olds has the highest likelihood of being enrolled in private schools, with 16 (64.0% in the age bracket) enrolled. Conversely, the age group of 3 to 4 year olds has the lowest likelihood of being enrolled in a private school, with 80 (100.0% in the age bracket) attending a public institution.
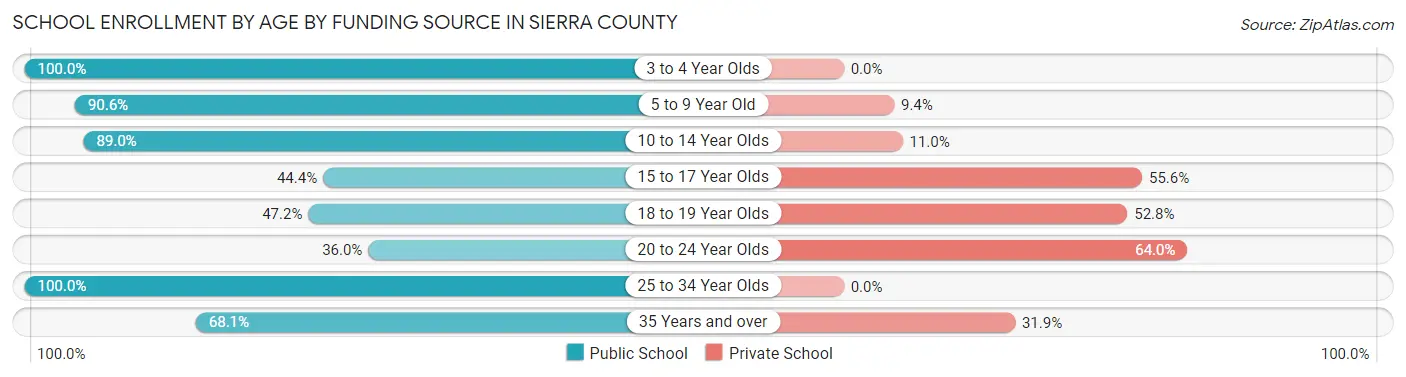
| Age Bracket | Public School | Private School |
| 3 to 4 Year Olds | 80 (100.0%) | 0 (0.0%) |
| 5 to 9 Year Old | 290 (90.6%) | 30 (9.4%) |
| 10 to 14 Year Olds | 357 (89.0%) | 44 (11.0%) |
| 15 to 17 Year Olds | 195 (44.4%) | 244 (55.6%) |
| 18 to 19 Year Olds | 75 (47.2%) | 84 (52.8%) |
| 20 to 24 Year Olds | 9 (36.0%) | 16 (64.0%) |
| 25 to 34 Year Olds | 53 (100.0%) | 0 (0.0%) |
| 35 Years and over | 32 (68.1%) | 15 (31.9%) |
| Total | 1,091 (71.6%) | 433 (28.4%) |
Educational Attainment by Field of Study in Sierra County
Education (473 | 24.6%), science & technology (277 | 14.4%), physical & health sciences (173 | 9.0%), engineering (167 | 8.7%), and literature & languages (153 | 8.0%) are the most common fields of study among 1,924 individuals in Sierra County who have obtained a bachelor's degree or higher.
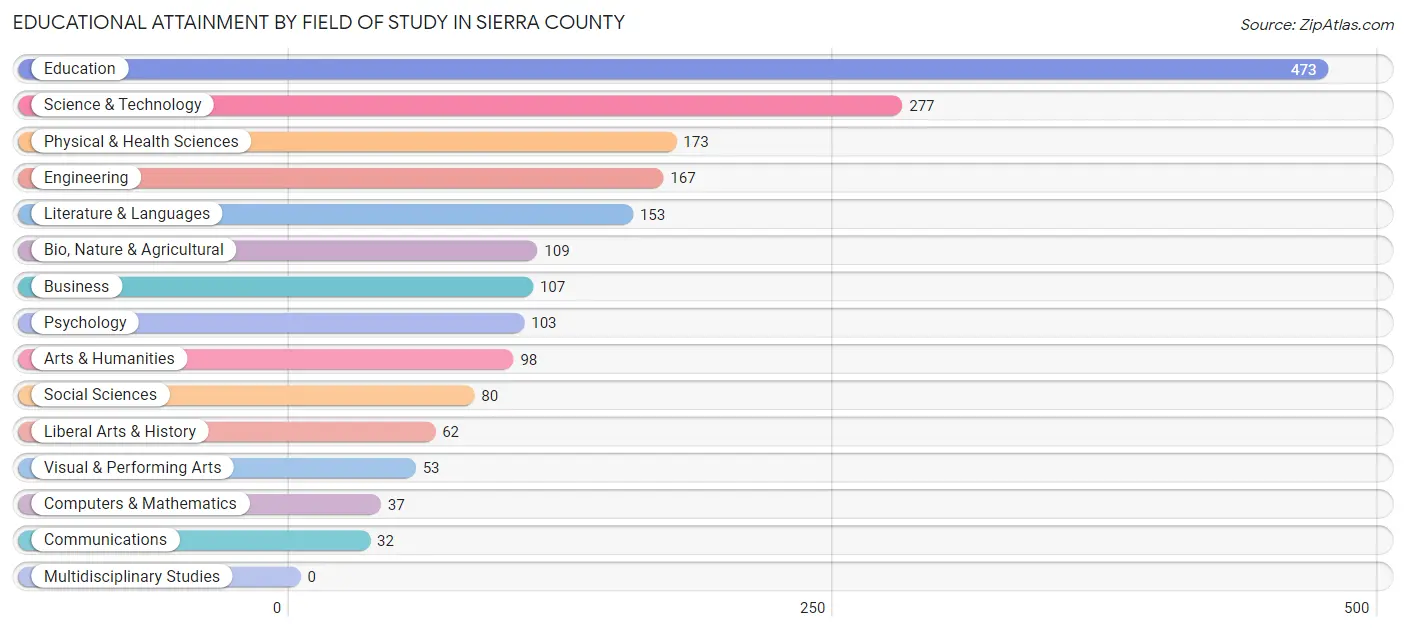
| Field of Study | # Graduates | % Graduates |
| Computers & Mathematics | 37 | 1.9% |
| Bio, Nature & Agricultural | 109 | 5.7% |
| Physical & Health Sciences | 173 | 9.0% |
| Psychology | 103 | 5.3% |
| Social Sciences | 80 | 4.2% |
| Engineering | 167 | 8.7% |
| Multidisciplinary Studies | 0 | 0.0% |
| Science & Technology | 277 | 14.4% |
| Business | 107 | 5.6% |
| Education | 473 | 24.6% |
| Literature & Languages | 153 | 8.0% |
| Liberal Arts & History | 62 | 3.2% |
| Visual & Performing Arts | 53 | 2.8% |
| Communications | 32 | 1.7% |
| Arts & Humanities | 98 | 5.1% |
| Total | 1,924 | 100.0% |
Transportation & Commute in Sierra County
Vehicle Availability by Sex in Sierra County
The most prevalent vehicle ownership categories in Sierra County are males with 2 vehicles (637, accounting for 35.4%) and females with 2 vehicles (689, making up 36.5%).
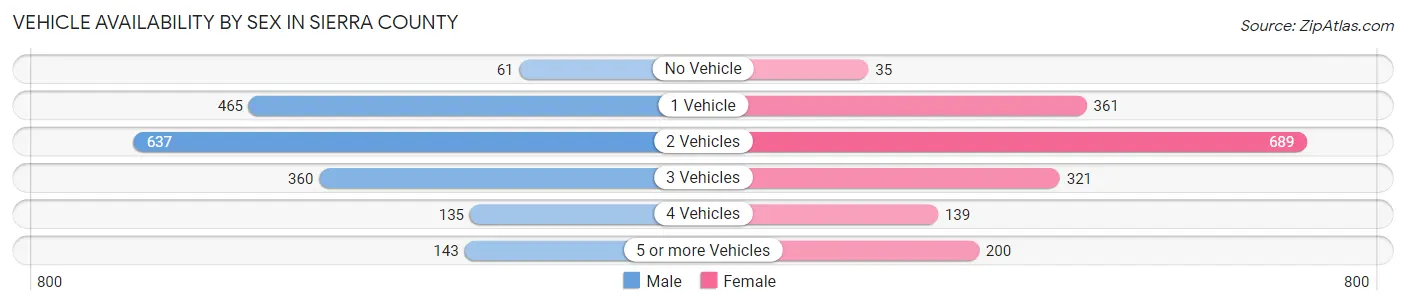
| Vehicles Available | Male | Female |
| No Vehicle | 61 (3.4%) | 35 (2.0%) |
| 1 Vehicle | 465 (25.8%) | 361 (20.7%) |
| 2 Vehicles | 637 (35.4%) | 689 (39.5%) |
| 3 Vehicles | 360 (20.0%) | 321 (18.4%) |
| 4 Vehicles | 135 (7.5%) | 139 (8.0%) |
| 5 or more Vehicles | 143 (7.9%) | 200 (11.5%) |
| Total | 1,801 (100.0%) | 1,745 (100.0%) |
Commute Time in Sierra County
The most frequently occuring commute durations in Sierra County are 5 to 9 minutes (966 commuters, 29.9%), 10 to 14 minutes (573 commuters, 17.7%), and less than 5 minutes (537 commuters, 16.6%).
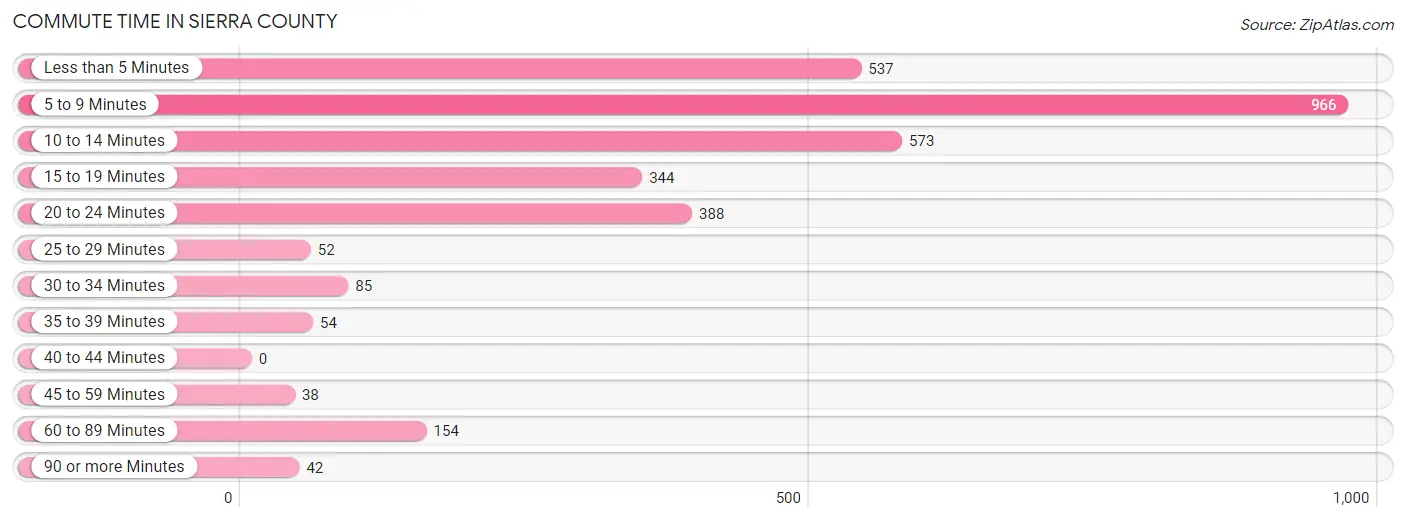
| Commute Time | # Commuters | % Commuters |
| Less than 5 Minutes | 537 | 16.6% |
| 5 to 9 Minutes | 966 | 29.9% |
| 10 to 14 Minutes | 573 | 17.7% |
| 15 to 19 Minutes | 344 | 10.6% |
| 20 to 24 Minutes | 388 | 12.0% |
| 25 to 29 Minutes | 52 | 1.6% |
| 30 to 34 Minutes | 85 | 2.6% |
| 35 to 39 Minutes | 54 | 1.7% |
| 40 to 44 Minutes | 0 | 0.0% |
| 45 to 59 Minutes | 38 | 1.2% |
| 60 to 89 Minutes | 154 | 4.8% |
| 90 or more Minutes | 42 | 1.3% |
Commute Time by Sex in Sierra County
The most common commute times in Sierra County are 10 to 14 minutes (378 commuters, 22.4%) for males and 5 to 9 minutes (711 commuters, 46.1%) for females.
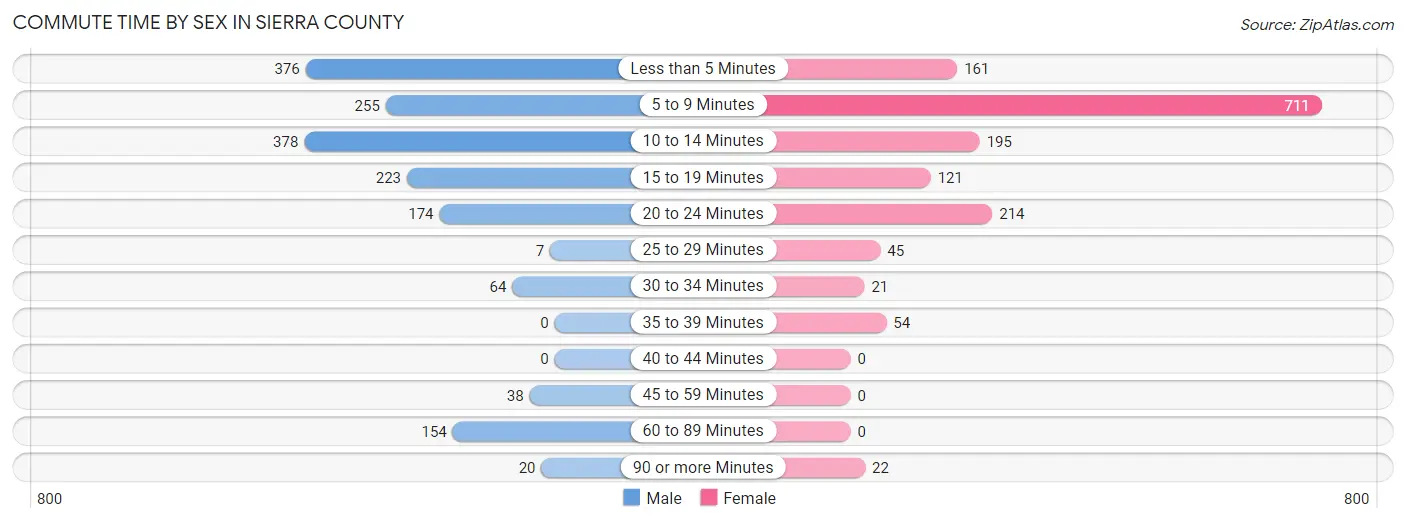
| Commute Time | Male | Female |
| Less than 5 Minutes | 376 (22.3%) | 161 (10.4%) |
| 5 to 9 Minutes | 255 (15.1%) | 711 (46.1%) |
| 10 to 14 Minutes | 378 (22.4%) | 195 (12.6%) |
| 15 to 19 Minutes | 223 (13.2%) | 121 (7.8%) |
| 20 to 24 Minutes | 174 (10.3%) | 214 (13.9%) |
| 25 to 29 Minutes | 7 (0.4%) | 45 (2.9%) |
| 30 to 34 Minutes | 64 (3.8%) | 21 (1.4%) |
| 35 to 39 Minutes | 0 (0.0%) | 54 (3.5%) |
| 40 to 44 Minutes | 0 (0.0%) | 0 (0.0%) |
| 45 to 59 Minutes | 38 (2.2%) | 0 (0.0%) |
| 60 to 89 Minutes | 154 (9.1%) | 0 (0.0%) |
| 90 or more Minutes | 20 (1.2%) | 22 (1.4%) |
Time of Departure to Work by Sex in Sierra County
The most frequent times of departure to work in Sierra County are 7:00 AM to 7:29 AM (278, 16.5%) for males and 7:30 AM to 7:59 AM (612, 39.6%) for females.
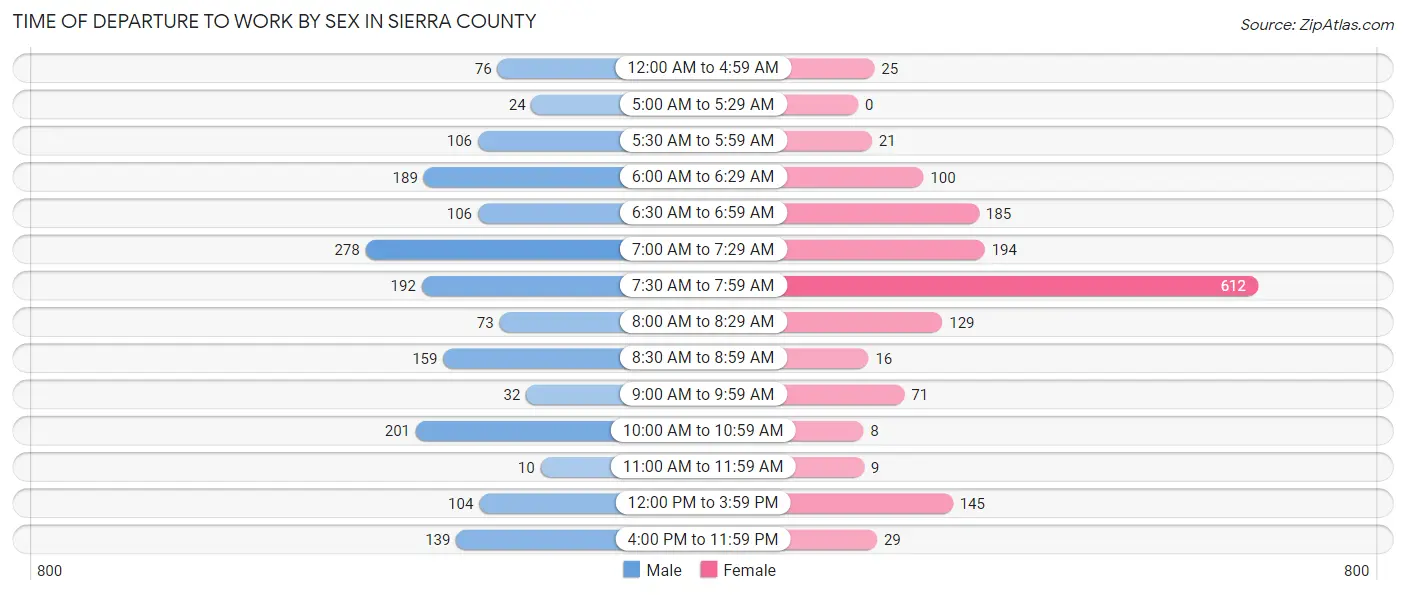
| Time of Departure | Male | Female |
| 12:00 AM to 4:59 AM | 76 (4.5%) | 25 (1.6%) |
| 5:00 AM to 5:29 AM | 24 (1.4%) | 0 (0.0%) |
| 5:30 AM to 5:59 AM | 106 (6.3%) | 21 (1.4%) |
| 6:00 AM to 6:29 AM | 189 (11.2%) | 100 (6.5%) |
| 6:30 AM to 6:59 AM | 106 (6.3%) | 185 (12.0%) |
| 7:00 AM to 7:29 AM | 278 (16.5%) | 194 (12.6%) |
| 7:30 AM to 7:59 AM | 192 (11.4%) | 612 (39.6%) |
| 8:00 AM to 8:29 AM | 73 (4.3%) | 129 (8.4%) |
| 8:30 AM to 8:59 AM | 159 (9.4%) | 16 (1.0%) |
| 9:00 AM to 9:59 AM | 32 (1.9%) | 71 (4.6%) |
| 10:00 AM to 10:59 AM | 201 (11.9%) | 8 (0.5%) |
| 11:00 AM to 11:59 AM | 10 (0.6%) | 9 (0.6%) |
| 12:00 PM to 3:59 PM | 104 (6.2%) | 145 (9.4%) |
| 4:00 PM to 11:59 PM | 139 (8.2%) | 29 (1.9%) |
| Total | 1,689 (100.0%) | 1,544 (100.0%) |
Housing Occupancy in Sierra County
Occupancy by Ownership in Sierra County
Of the total 5,285 dwellings in Sierra County, owner-occupied units account for 3,870 (73.2%), while renter-occupied units make up 1,415 (26.8%).
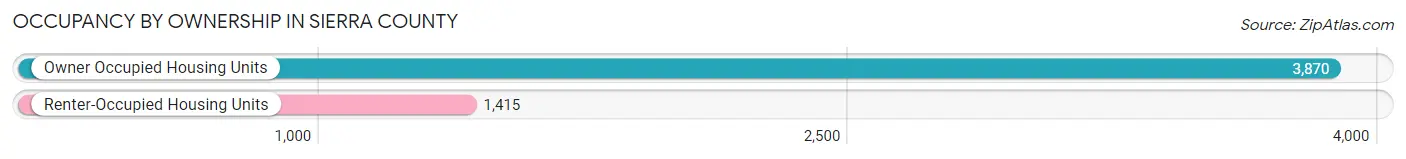
| Occupancy | # Housing Units | % Housing Units |
| Owner Occupied Housing Units | 3,870 | 73.2% |
| Renter-Occupied Housing Units | 1,415 | 26.8% |
| Total Occupied Housing Units | 5,285 | 100.0% |
Occupancy by Household Size in Sierra County
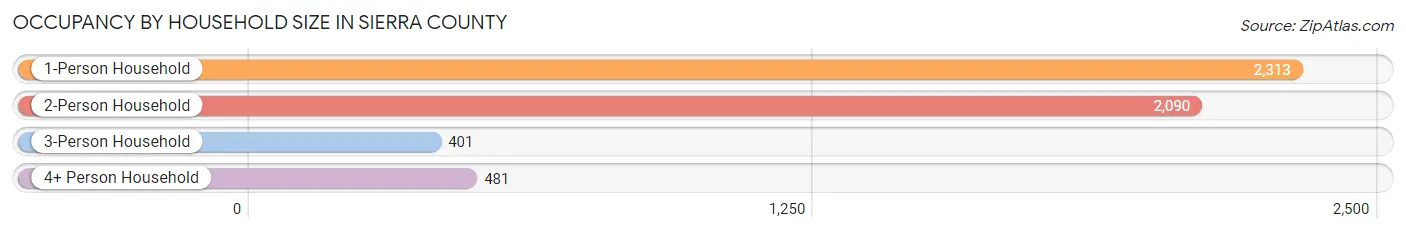
| Household Size | # Housing Units | % Housing Units |
| 1-Person Household | 2,313 | 43.8% |
| 2-Person Household | 2,090 | 39.6% |
| 3-Person Household | 401 | 7.6% |
| 4+ Person Household | 481 | 9.1% |
| Total Housing Units | 5,285 | 100.0% |
Occupancy by Ownership by Household Size in Sierra County
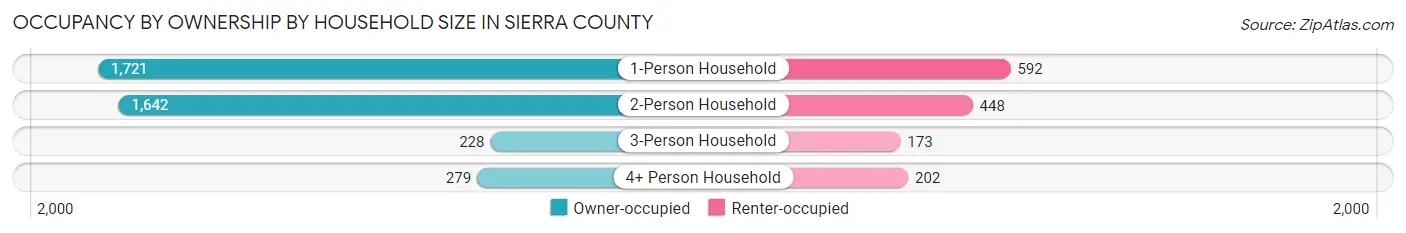
| Household Size | Owner-occupied | Renter-occupied |
| 1-Person Household | 1,721 (74.4%) | 592 (25.6%) |
| 2-Person Household | 1,642 (78.6%) | 448 (21.4%) |
| 3-Person Household | 228 (56.9%) | 173 (43.1%) |
| 4+ Person Household | 279 (58.0%) | 202 (42.0%) |
| Total Housing Units | 3,870 (73.2%) | 1,415 (26.8%) |
Occupancy by Educational Attainment in Sierra County
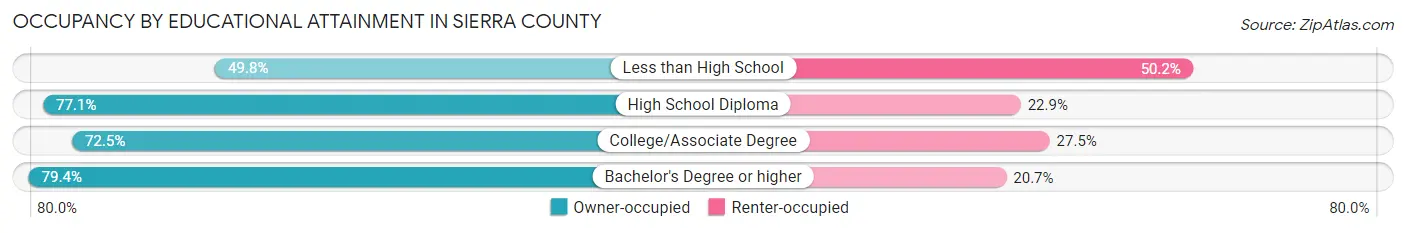
| Household Size | Owner-occupied | Renter-occupied |
| Less than High School | 249 (49.8%) | 251 (50.2%) |
| High School Diploma | 1,173 (77.1%) | 349 (22.9%) |
| College/Associate Degree | 1,491 (72.5%) | 566 (27.5%) |
| Bachelor's Degree or higher | 957 (79.3%) | 249 (20.6%) |
Occupancy by Age of Householder in Sierra County
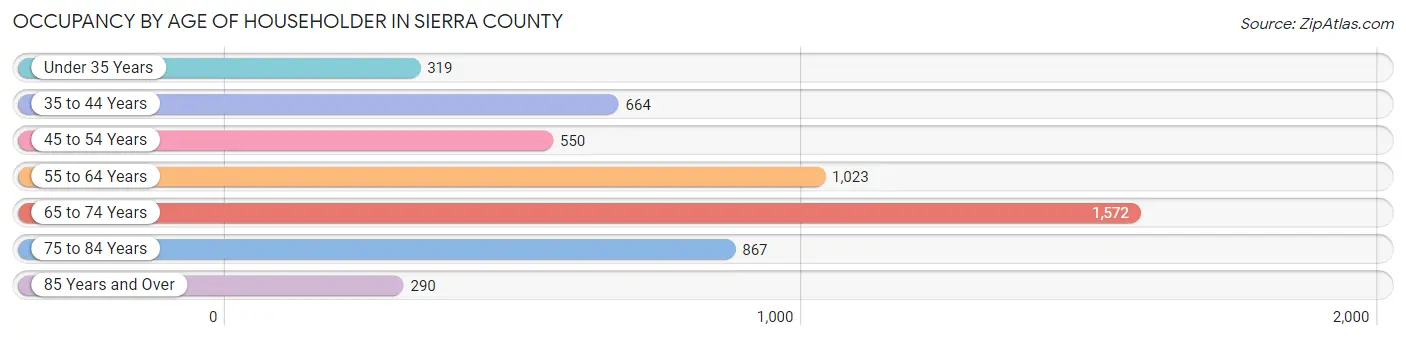
| Age Bracket | # Households | % Households |
| Under 35 Years | 319 | 6.0% |
| 35 to 44 Years | 664 | 12.6% |
| 45 to 54 Years | 550 | 10.4% |
| 55 to 64 Years | 1,023 | 19.4% |
| 65 to 74 Years | 1,572 | 29.7% |
| 75 to 84 Years | 867 | 16.4% |
| 85 Years and Over | 290 | 5.5% |
| Total | 5,285 | 100.0% |
Housing Finances in Sierra County
Median Income by Occupancy in Sierra County
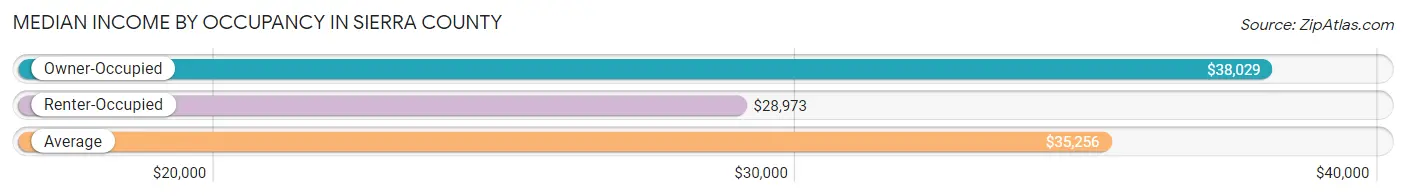
| Occupancy Type | # Households | Median Income |
| Owner-Occupied | 3,870 (73.2%) | $38,029 |
| Renter-Occupied | 1,415 (26.8%) | $28,973 |
| Average | 5,285 (100.0%) | $35,256 |
Occupancy by Householder Income Bracket in Sierra County
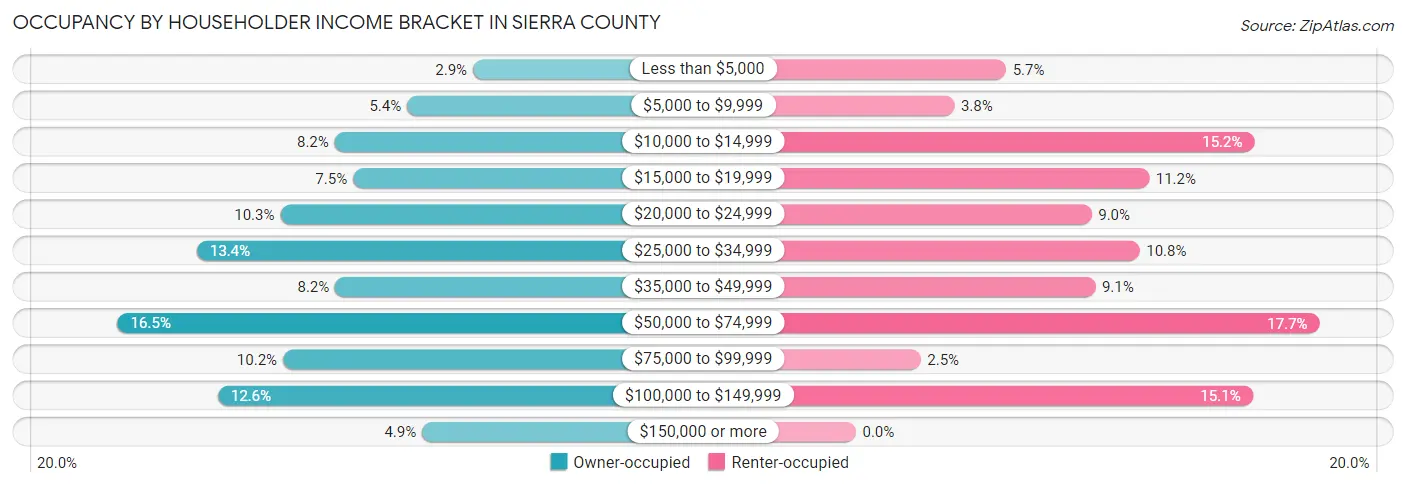
| Income Bracket | Owner-occupied | Renter-occupied |
| Less than $5,000 | 113 (2.9%) | 81 (5.7%) |
| $5,000 to $9,999 | 210 (5.4%) | 53 (3.7%) |
| $10,000 to $14,999 | 317 (8.2%) | 215 (15.2%) |
| $15,000 to $19,999 | 290 (7.5%) | 158 (11.2%) |
| $20,000 to $24,999 | 397 (10.3%) | 127 (9.0%) |
| $25,000 to $34,999 | 520 (13.4%) | 153 (10.8%) |
| $35,000 to $49,999 | 316 (8.2%) | 129 (9.1%) |
| $50,000 to $74,999 | 637 (16.5%) | 250 (17.7%) |
| $75,000 to $99,999 | 393 (10.2%) | 35 (2.5%) |
| $100,000 to $149,999 | 489 (12.6%) | 214 (15.1%) |
| $150,000 or more | 188 (4.9%) | 0 (0.0%) |
| Total | 3,870 (100.0%) | 1,415 (100.0%) |
Monthly Housing Cost Tiers in Sierra County
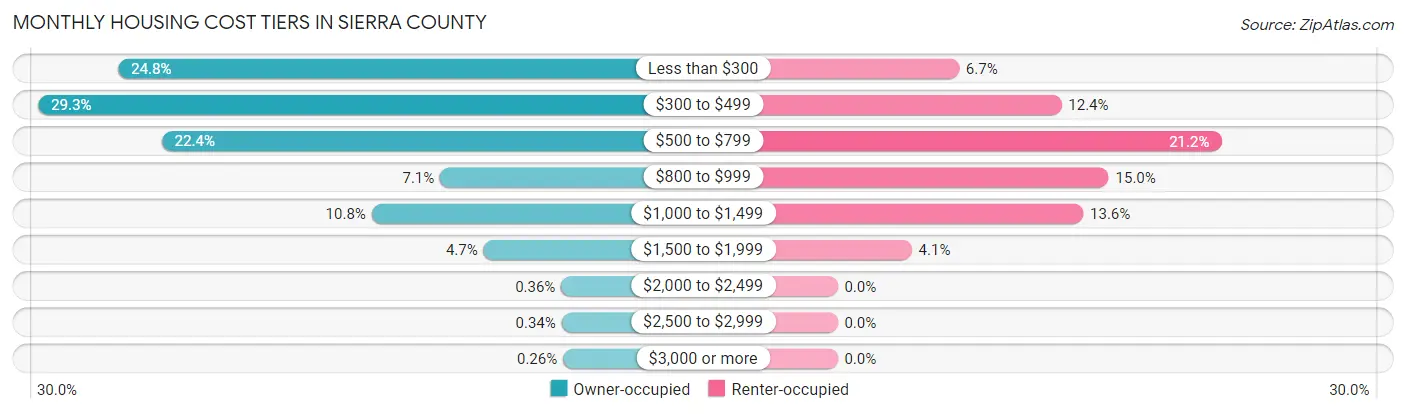
| Monthly Cost | Owner-occupied | Renter-occupied |
| Less than $300 | 961 (24.8%) | 95 (6.7%) |
| $300 to $499 | 1,132 (29.2%) | 175 (12.4%) |
| $500 to $799 | 868 (22.4%) | 300 (21.2%) |
| $800 to $999 | 273 (7.0%) | 212 (15.0%) |
| $1,000 to $1,499 | 419 (10.8%) | 192 (13.6%) |
| $1,500 to $1,999 | 180 (4.6%) | 58 (4.1%) |
| $2,000 to $2,499 | 14 (0.4%) | 0 (0.0%) |
| $2,500 to $2,999 | 13 (0.3%) | 0 (0.0%) |
| $3,000 or more | 10 (0.3%) | 0 (0.0%) |
| Total | 3,870 (100.0%) | 1,415 (100.0%) |
Physical Housing Characteristics in Sierra County
Housing Structures in Sierra County
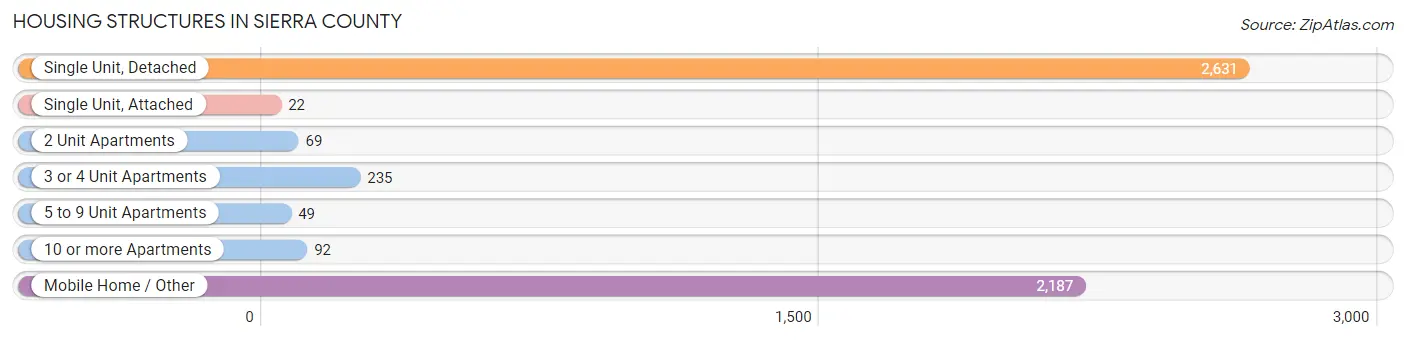
| Structure Type | # Housing Units | % Housing Units |
| Single Unit, Detached | 2,631 | 49.8% |
| Single Unit, Attached | 22 | 0.4% |
| 2 Unit Apartments | 69 | 1.3% |
| 3 or 4 Unit Apartments | 235 | 4.4% |
| 5 to 9 Unit Apartments | 49 | 0.9% |
| 10 or more Apartments | 92 | 1.7% |
| Mobile Home / Other | 2,187 | 41.4% |
| Total | 5,285 | 100.0% |
Housing Structures by Occupancy in Sierra County
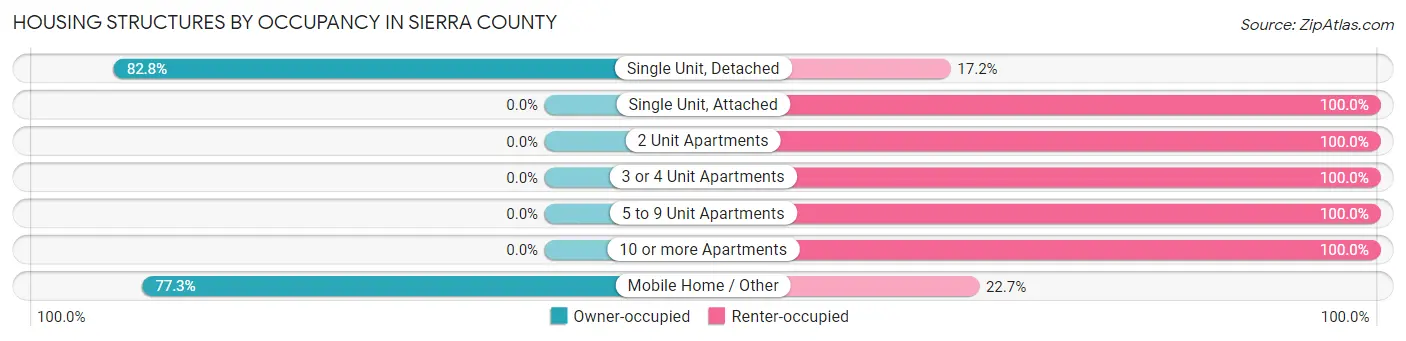
| Structure Type | Owner-occupied | Renter-occupied |
| Single Unit, Detached | 2,179 (82.8%) | 452 (17.2%) |
| Single Unit, Attached | 0 (0.0%) | 22 (100.0%) |
| 2 Unit Apartments | 0 (0.0%) | 69 (100.0%) |
| 3 or 4 Unit Apartments | 0 (0.0%) | 235 (100.0%) |
| 5 to 9 Unit Apartments | 0 (0.0%) | 49 (100.0%) |
| 10 or more Apartments | 0 (0.0%) | 92 (100.0%) |
| Mobile Home / Other | 1,691 (77.3%) | 496 (22.7%) |
| Total | 3,870 (73.2%) | 1,415 (26.8%) |
Housing Structures by Number of Rooms in Sierra County
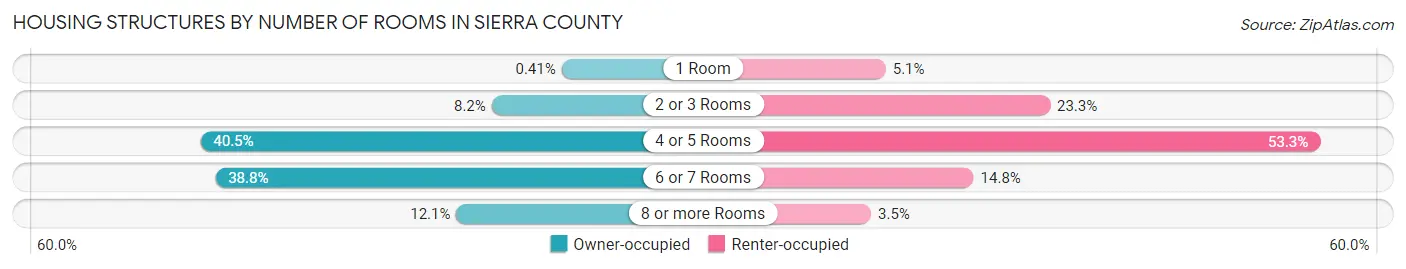
| Number of Rooms | Owner-occupied | Renter-occupied |
| 1 Room | 16 (0.4%) | 72 (5.1%) |
| 2 or 3 Rooms | 316 (8.2%) | 330 (23.3%) |
| 4 or 5 Rooms | 1,567 (40.5%) | 754 (53.3%) |
| 6 or 7 Rooms | 1,503 (38.8%) | 210 (14.8%) |
| 8 or more Rooms | 468 (12.1%) | 49 (3.5%) |
| Total | 3,870 (100.0%) | 1,415 (100.0%) |
Housing Structure by Heating Type in Sierra County
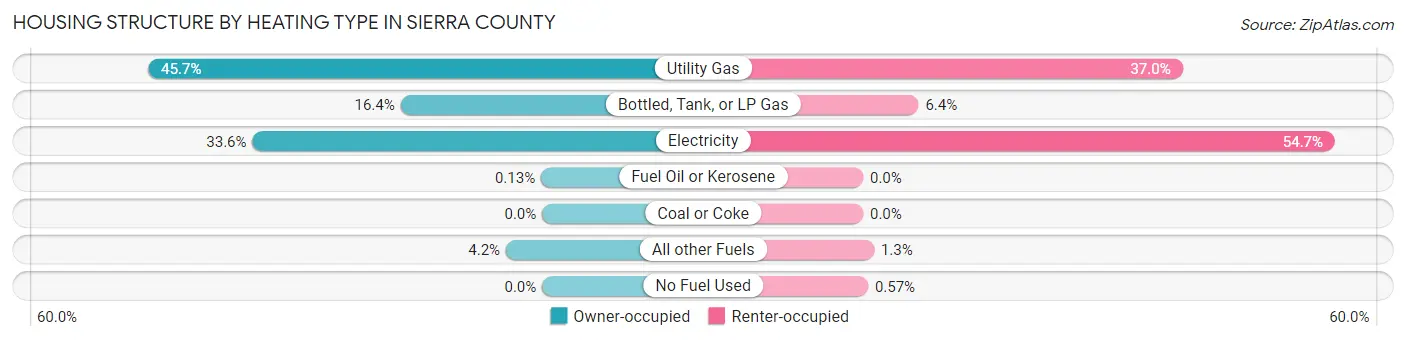
| Heating Type | Owner-occupied | Renter-occupied |
| Utility Gas | 1,768 (45.7%) | 524 (37.0%) |
| Bottled, Tank, or LP Gas | 635 (16.4%) | 91 (6.4%) |
| Electricity | 1,300 (33.6%) | 774 (54.7%) |
| Fuel Oil or Kerosene | 5 (0.1%) | 0 (0.0%) |
| Coal or Coke | 0 (0.0%) | 0 (0.0%) |
| All other Fuels | 162 (4.2%) | 18 (1.3%) |
| No Fuel Used | 0 (0.0%) | 8 (0.6%) |
| Total | 3,870 (100.0%) | 1,415 (100.0%) |
Household Vehicle Usage in Sierra County
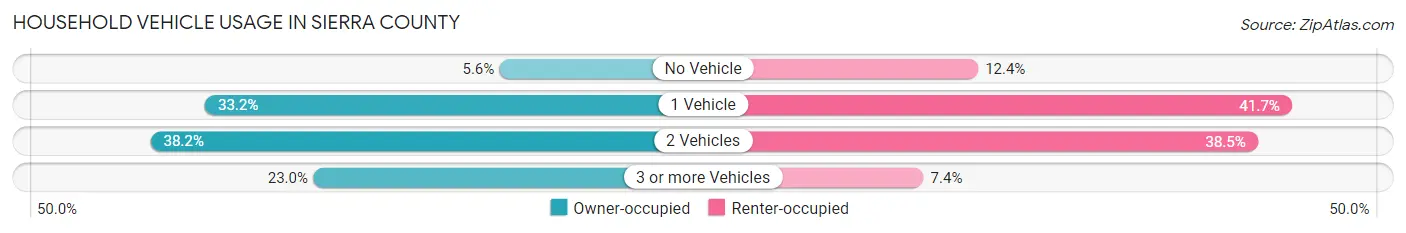
| Vehicles per Household | Owner-occupied | Renter-occupied |
| No Vehicle | 217 (5.6%) | 176 (12.4%) |
| 1 Vehicle | 1,283 (33.2%) | 590 (41.7%) |
| 2 Vehicles | 1,480 (38.2%) | 545 (38.5%) |
| 3 or more Vehicles | 890 (23.0%) | 104 (7.3%) |
| Total | 3,870 (100.0%) | 1,415 (100.0%) |
Real Estate & Mortgages in Sierra County
Real Estate and Mortgage Overview in Sierra County
| Characteristic | Without Mortgage | With Mortgage |
| Housing Units | 2,497 | 1,373 |
| Median Property Value | $135,000 | $143,700 |
| Median Household Income | $33,429 | $112 |
| Monthly Housing Costs | $341 | $10 |
| Real Estate Taxes | $686 | $42 |
Property Value by Mortgage Status in Sierra County
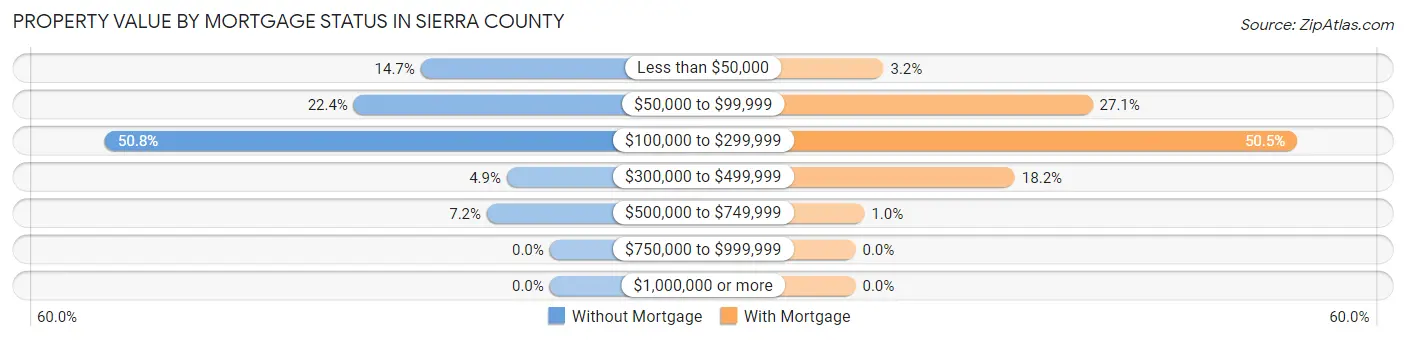
| Property Value | Without Mortgage | With Mortgage |
| Less than $50,000 | 368 (14.7%) | 44 (3.2%) |
| $50,000 to $99,999 | 559 (22.4%) | 372 (27.1%) |
| $100,000 to $299,999 | 1,269 (50.8%) | 693 (50.5%) |
| $300,000 to $499,999 | 122 (4.9%) | 250 (18.2%) |
| $500,000 to $749,999 | 179 (7.2%) | 14 (1.0%) |
| $750,000 to $999,999 | 0 (0.0%) | 0 (0.0%) |
| $1,000,000 or more | 0 (0.0%) | 0 (0.0%) |
| Total | 2,497 (100.0%) | 1,373 (100.0%) |
Household Income by Mortgage Status in Sierra County
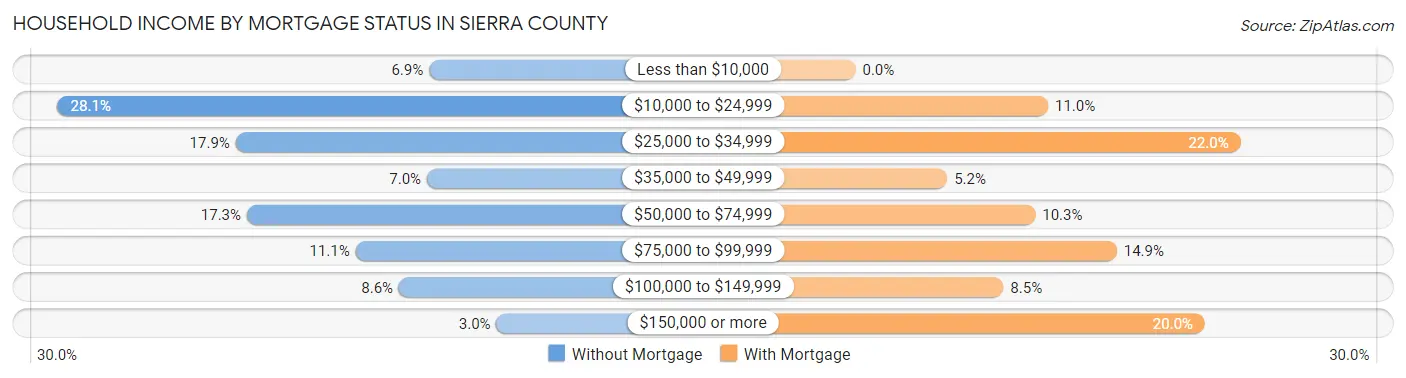
| Household Income | Without Mortgage | With Mortgage |
| Less than $10,000 | 172 (6.9%) | 0 (0.0%) |
| $10,000 to $24,999 | 702 (28.1%) | 151 (11.0%) |
| $25,000 to $34,999 | 448 (17.9%) | 302 (22.0%) |
| $35,000 to $49,999 | 175 (7.0%) | 72 (5.2%) |
| $50,000 to $74,999 | 432 (17.3%) | 141 (10.3%) |
| $75,000 to $99,999 | 277 (11.1%) | 205 (14.9%) |
| $100,000 to $149,999 | 215 (8.6%) | 116 (8.5%) |
| $150,000 or more | 76 (3.0%) | 274 (20.0%) |
| Total | 2,497 (100.0%) | 1,373 (100.0%) |
Property Value to Household Income Ratio in Sierra County
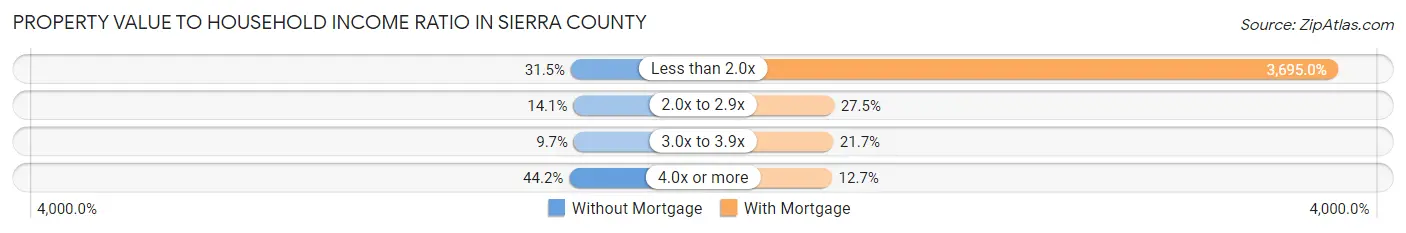
| Value-to-Income Ratio | Without Mortgage | With Mortgage |
| Less than 2.0x | 787 (31.5%) | 50,732 (3,695.0%) |
| 2.0x to 2.9x | 351 (14.1%) | 378 (27.5%) |
| 3.0x to 3.9x | 243 (9.7%) | 298 (21.7%) |
| 4.0x or more | 1,104 (44.2%) | 174 (12.7%) |
| Total | 2,497 (100.0%) | 1,373 (100.0%) |
Real Estate Taxes by Mortgage Status in Sierra County
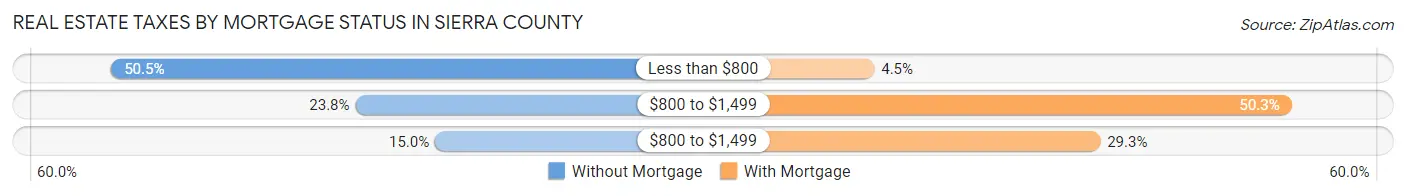
| Property Taxes | Without Mortgage | With Mortgage |
| Less than $800 | 1,261 (50.5%) | 62 (4.5%) |
| $800 to $1,499 | 593 (23.7%) | 690 (50.2%) |
| $800 to $1,499 | 375 (15.0%) | 402 (29.3%) |
| Total | 2,497 (100.0%) | 1,373 (100.0%) |
Health & Disability in Sierra County
Health Insurance Coverage by Age in Sierra County
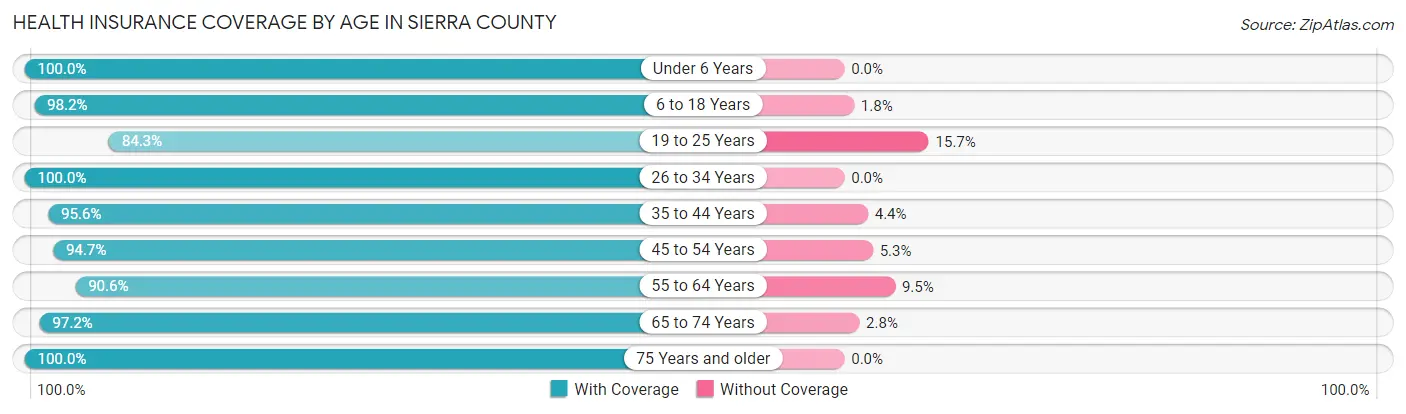
| Age Bracket | With Coverage | Without Coverage |
| Under 6 Years | 546 (100.0%) | 0 (0.0%) |
| 6 to 18 Years | 1,317 (98.2%) | 24 (1.8%) |
| 19 to 25 Years | 461 (84.3%) | 86 (15.7%) |
| 26 to 34 Years | 781 (100.0%) | 0 (0.0%) |
| 35 to 44 Years | 1,200 (95.6%) | 55 (4.4%) |
| 45 to 54 Years | 1,125 (94.7%) | 63 (5.3%) |
| 55 to 64 Years | 1,476 (90.5%) | 154 (9.5%) |
| 65 to 74 Years | 2,212 (97.2%) | 63 (2.8%) |
| 75 Years and older | 1,683 (100.0%) | 0 (0.0%) |
| Total | 10,801 (96.0%) | 445 (4.0%) |
Health Insurance Coverage by Citizenship Status in Sierra County
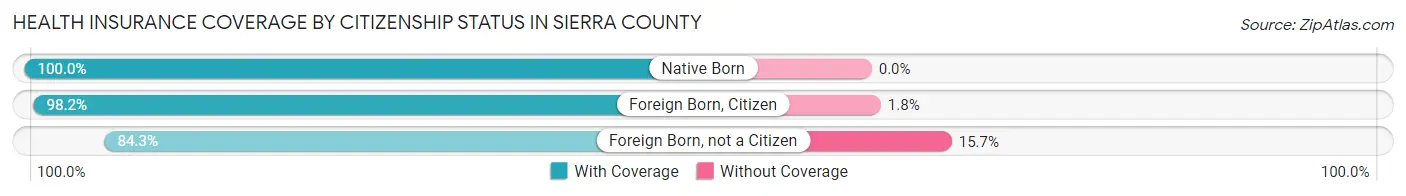
| Citizenship Status | With Coverage | Without Coverage |
| Native Born | 546 (100.0%) | 0 (0.0%) |
| Foreign Born, Citizen | 1,317 (98.2%) | 24 (1.8%) |
| Foreign Born, not a Citizen | 461 (84.3%) | 86 (15.7%) |
Health Insurance Coverage by Household Income in Sierra County
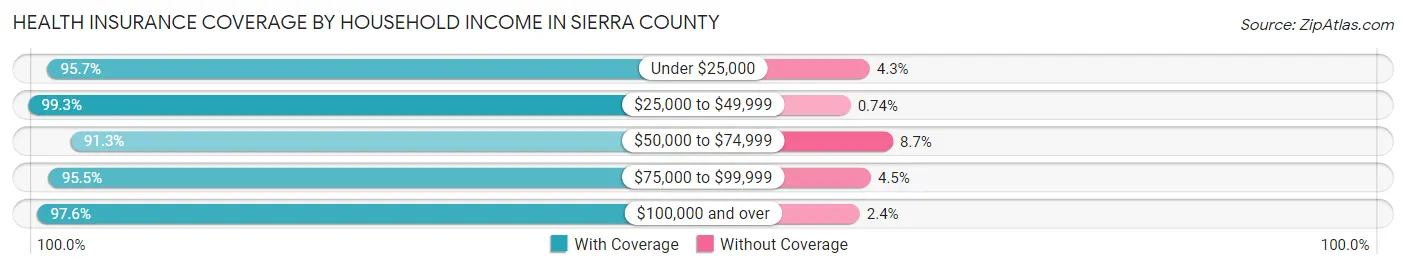
| Household Income | With Coverage | Without Coverage |
| Under $25,000 | 3,257 (95.7%) | 147 (4.3%) |
| $25,000 to $49,999 | 2,156 (99.3%) | 16 (0.7%) |
| $50,000 to $74,999 | 1,756 (91.3%) | 167 (8.7%) |
| $75,000 to $99,999 | 1,072 (95.5%) | 51 (4.5%) |
| $100,000 and over | 2,554 (97.6%) | 64 (2.4%) |
Public vs Private Health Insurance Coverage by Age in Sierra County
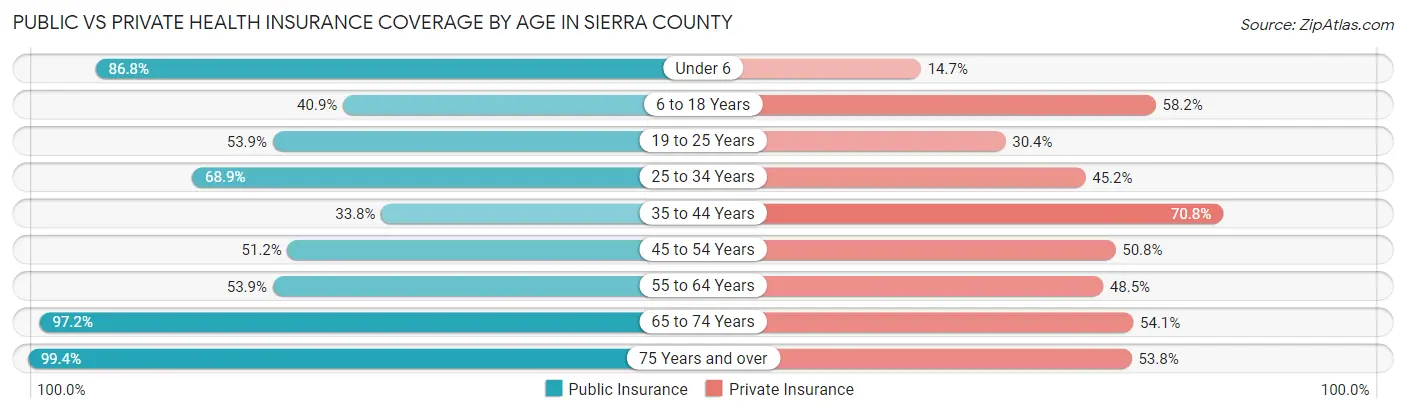
| Age Bracket | Public Insurance | Private Insurance |
| Under 6 | 474 (86.8%) | 80 (14.6%) |
| 6 to 18 Years | 548 (40.9%) | 781 (58.2%) |
| 19 to 25 Years | 295 (53.9%) | 166 (30.3%) |
| 25 to 34 Years | 538 (68.9%) | 353 (45.2%) |
| 35 to 44 Years | 424 (33.8%) | 888 (70.8%) |
| 45 to 54 Years | 608 (51.2%) | 603 (50.8%) |
| 55 to 64 Years | 879 (53.9%) | 790 (48.5%) |
| 65 to 74 Years | 2,212 (97.2%) | 1,230 (54.1%) |
| 75 Years and over | 1,673 (99.4%) | 905 (53.8%) |
| Total | 7,651 (68.0%) | 5,796 (51.5%) |
Disability Status by Sex by Age in Sierra County
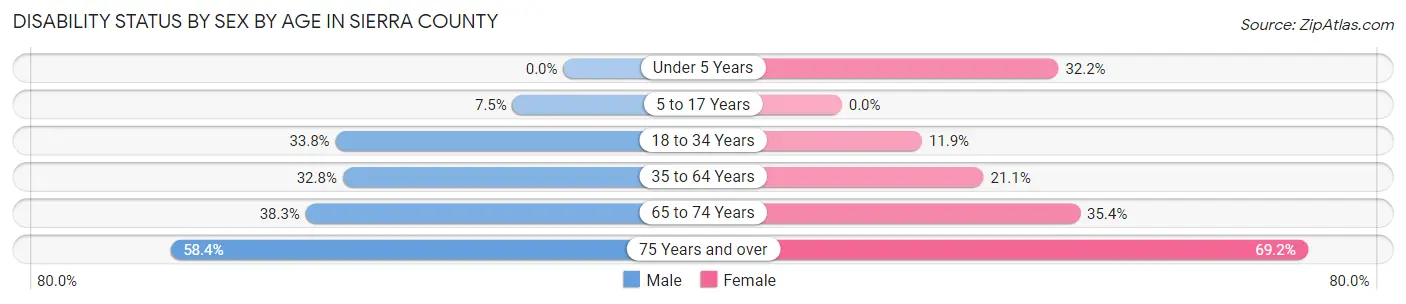
| Age Bracket | Male | Female |
| Under 5 Years | 0 (0.0%) | 46 (32.2%) |
| 5 to 17 Years | 49 (7.5%) | 0 (0.0%) |
| 18 to 34 Years | 268 (33.8%) | 69 (11.9%) |
| 35 to 64 Years | 626 (32.8%) | 455 (21.0%) |
| 65 to 74 Years | 427 (38.3%) | 410 (35.4%) |
| 75 Years and over | 530 (58.4%) | 536 (69.2%) |
Disability Class by Sex by Age in Sierra County
Disability Class: Hearing Difficulty
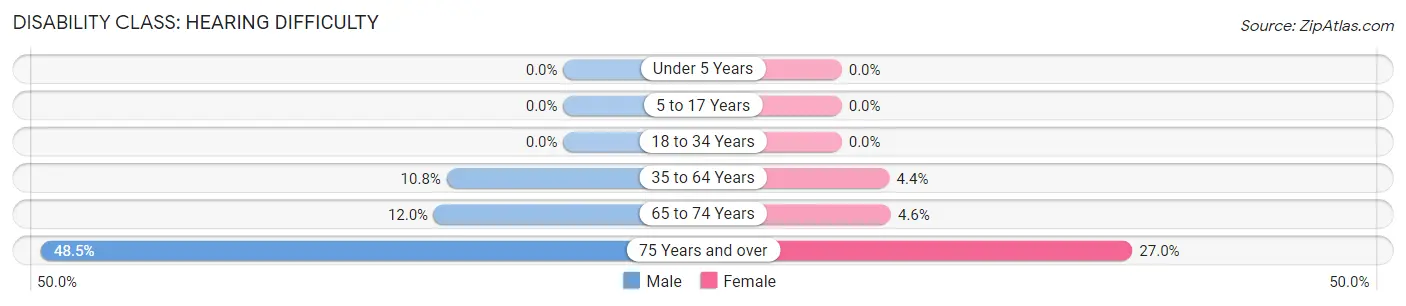
| Age Bracket | Male | Female |
| Under 5 Years | 0 (0.0%) | 0 (0.0%) |
| 5 to 17 Years | 0 (0.0%) | 0 (0.0%) |
| 18 to 34 Years | 0 (0.0%) | 0 (0.0%) |
| 35 to 64 Years | 207 (10.8%) | 96 (4.4%) |
| 65 to 74 Years | 134 (12.0%) | 53 (4.6%) |
| 75 Years and over | 440 (48.5%) | 209 (27.0%) |
Disability Class: Vision Difficulty
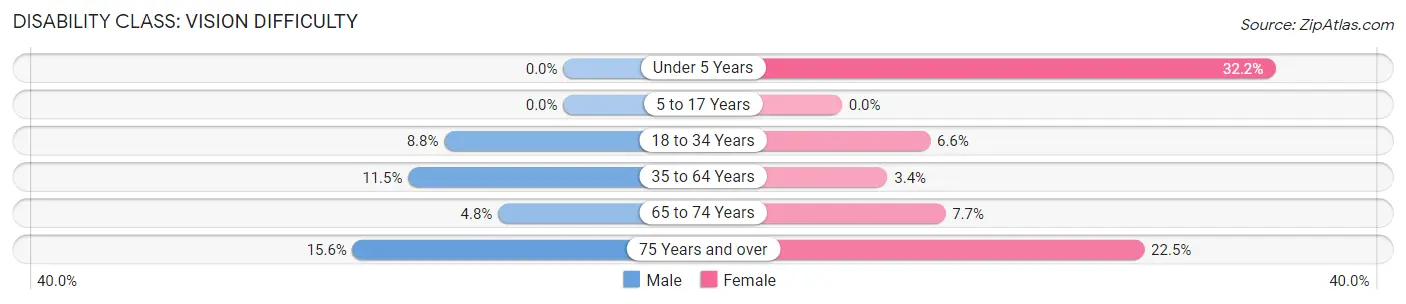
| Age Bracket | Male | Female |
| Under 5 Years | 0 (0.0%) | 46 (32.2%) |
| 5 to 17 Years | 0 (0.0%) | 0 (0.0%) |
| 18 to 34 Years | 70 (8.8%) | 38 (6.6%) |
| 35 to 64 Years | 220 (11.5%) | 73 (3.4%) |
| 65 to 74 Years | 54 (4.8%) | 89 (7.7%) |
| 75 Years and over | 142 (15.6%) | 174 (22.5%) |
Disability Class: Cognitive Difficulty
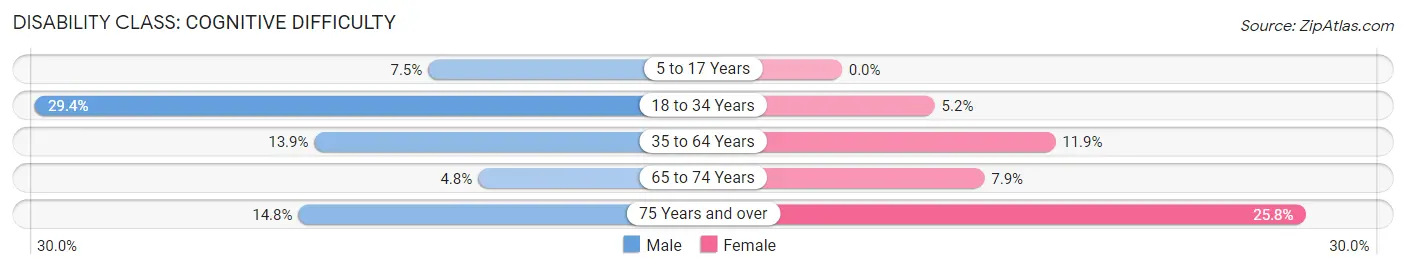
| Age Bracket | Male | Female |
| 5 to 17 Years | 49 (7.5%) | 0 (0.0%) |
| 18 to 34 Years | 233 (29.4%) | 30 (5.2%) |
| 35 to 64 Years | 265 (13.9%) | 257 (11.9%) |
| 65 to 74 Years | 53 (4.8%) | 92 (7.9%) |
| 75 Years and over | 134 (14.8%) | 200 (25.8%) |
Disability Class: Ambulatory Difficulty
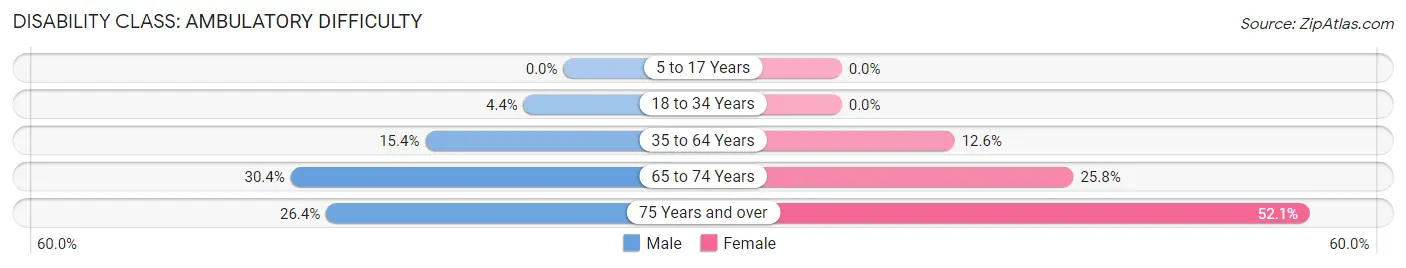
| Age Bracket | Male | Female |
| 5 to 17 Years | 0 (0.0%) | 0 (0.0%) |
| 18 to 34 Years | 35 (4.4%) | 0 (0.0%) |
| 35 to 64 Years | 294 (15.4%) | 272 (12.6%) |
| 65 to 74 Years | 339 (30.4%) | 299 (25.8%) |
| 75 Years and over | 240 (26.4%) | 404 (52.1%) |
Disability Class: Self-Care Difficulty
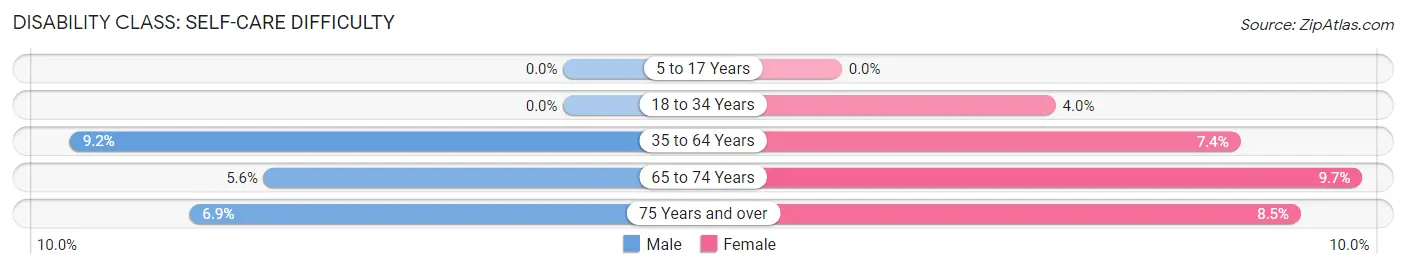
| Age Bracket | Male | Female |
| 5 to 17 Years | 0 (0.0%) | 0 (0.0%) |
| 18 to 34 Years | 0 (0.0%) | 23 (4.0%) |
| 35 to 64 Years | 175 (9.2%) | 160 (7.4%) |
| 65 to 74 Years | 62 (5.6%) | 112 (9.7%) |
| 75 Years and over | 63 (6.9%) | 66 (8.5%) |
Technology Access in Sierra County
Computing Device Access in Sierra County
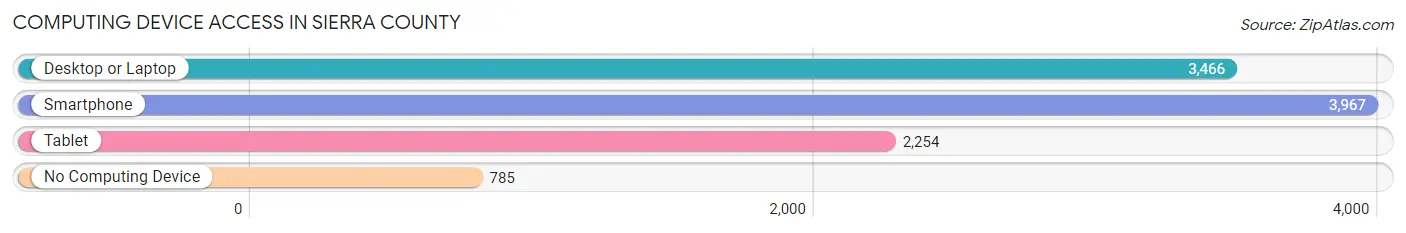
| Device Type | # Households | % Households |
| Desktop or Laptop | 3,466 | 65.6% |
| Smartphone | 3,967 | 75.1% |
| Tablet | 2,254 | 42.6% |
| No Computing Device | 785 | 14.8% |
| Total | 5,285 | 100.0% |
Internet Access in Sierra County
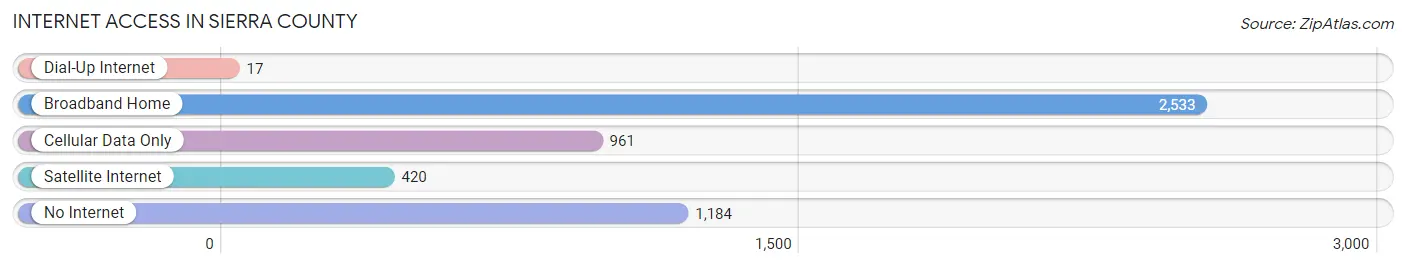
| Internet Type | # Households | % Households |
| Dial-Up Internet | 17 | 0.3% |
| Broadband Home | 2,533 | 47.9% |
| Cellular Data Only | 961 | 18.2% |
| Satellite Internet | 420 | 8.0% |
| No Internet | 1,184 | 22.4% |
| Total | 5,285 | 100.0% |
Sierra County Summary
Sierra County is a county located in the southwestern corner of the U.S. state of New Mexico. As of the 2010 census, the population was 11,988. Its county seat is Truth or Consequences. The county was created in 1884 from the western part of Doña Ana County.
History
Sierra County was established in 1884 from the western part of Doña Ana County. It was named for the Sierra Madre mountain range, which runs through the county. The county seat was originally located in Hot Springs, but was moved to Truth or Consequences in 1950.
Geography
Sierra County is located in the southwestern corner of New Mexico. It is bordered by Doña Ana County to the east, Grant County to the north, and Hidalgo County to the west. The Rio Grande forms the southern border of the county.
The county has a total area of 3,945 square miles, of which 3,943 square miles is land and 2.2 square miles (0.06%) is water.
The county is located in the Chihuahuan Desert and is mostly flat with some rolling hills. The highest point in the county is the summit of Caballo Mountain, which has an elevation of 8,717 feet.
Economy
The economy of Sierra County is largely based on agriculture and tourism. The county is home to several large farms and ranches, which produce a variety of crops, including alfalfa, cotton, and pecans.
The county is also home to several tourist attractions, including the Elephant Butte Lake State Park, the Caballo Mountains, and the Gila National Forest. These attractions draw visitors from all over the country, providing a boost to the local economy.
Demographics
As of the 2010 census, there were 11,988 people, 4,717 households, and 3,092 families residing in the county. The population density was 3 people per square mile. There were 5,845 housing units at an average density of 1.5 per square mile. The racial makeup of the county was 73.3% White, 0.7% Black or African American, 1.2% Native American, 0.3% Asian, 0.1% Pacific Islander, 21.2% from other races, and 3.3% from two or more races. 44.2% of the population were Hispanic or Latino of any race.
There were 4,717 households, out of which 28.2% had children under the age of 18 living with them, 48.2% were married couples living together, 13.7% had a female householder with no husband present, and 32.2% were non-families. 27.2% of all households were made up of individuals, and 11.2% had someone living alone who was 65 years of age or older. The average household size was 2.50 and the average family size was 3.05.
In the county, the population was spread out, with 25.7% under the age of 18, 7.7% from 18 to 24, 24.2% from 25 to 44, 27.2% from 45 to 64, and 15.2% who were 65 years of age or older. The median age was 39 years. For every 100 females there were 97.2 males. For every 100 females age 18 and over, there were 94.2 males.
The median income for a household in the county was $27,813, and the median income for a family was $32,917. Males had a median income of $27,917 versus $20,938 for females. The per capita income for the county was $14,945. About 16.2% of families and 20.2% of the population were below the poverty line, including 28.2% of those under age 18 and 11.7% of those age 65 or over.
Common Questions
What is Per Capita Income in Sierra County?
Per Capita income in Sierra County is $26,396.
What is the Median Family Income in Sierra County?
Median Family Income in Sierra County is $58,289.
What is the Median Household income in Sierra County?
Median Household Income in Sierra County is $35,256.
What is Income or Wage Gap in Sierra County?
Income or Wage Gap in Sierra County is 0.4%.
Women in Sierra County earn 99.6 cents for every dollar earned by a man.
What is Inequality or Gini Index in Sierra County?
Inequality or Gini Index in Sierra County is 0.47.
What is the Total Population of Sierra County?
Total Population of Sierra County is 11,506.
What is the Total Male Population of Sierra County?
Total Male Population of Sierra County is 5,822.
What is the Total Female Population of Sierra County?
Total Female Population of Sierra County is 5,684.
What is the Ratio of Males per 100 Females in Sierra County?
There are 102.43 Males per 100 Females in Sierra County.
What is the Ratio of Females per 100 Males in Sierra County?
There are 97.63 Females per 100 Males in Sierra County.
What is the Median Population Age in Sierra County?
Median Population Age in Sierra County is 55.4 Years.
What is the Average Family Size in Sierra County
Average Family Size in Sierra County is 2.9 People.
What is the Average Household Size in Sierra County
Average Household Size in Sierra County is 2.1 People.
How Large is the Labor Force in Sierra County?
There are 3,732 People in the Labor Forcein in Sierra County.
What is the Percentage of People in the Labor Force in Sierra County?
38.1% of People are in the Labor Force in Sierra County.
What is the Unemployment Rate in Sierra County?
Unemployment Rate in Sierra County is 4.7%.