Valencia County, NM Map & Demographics
Valencia County Overview
$28,817
PER CAPITA INCOME
$67,296
AVG FAMILY INCOME
$56,246
AVG HOUSEHOLD INCOME
16.7%
WAGE / INCOME GAP [ % ]
83.3¢/ $1
WAGE / INCOME GAP [ $ ]
$11,528
FAMILY INCOME DEFICIT
0.45
INEQUALITY / GINI INDEX
76,613
TOTAL POPULATION
38,604
MALE POPULATION
38,009
FEMALE POPULATION
101.57
MALES / 100 FEMALES
98.46
FEMALES / 100 MALES
38.8
MEDIAN AGE
3.6
AVG FAMILY SIZE
2.9
AVG HOUSEHOLD SIZE
31,612
LABOR FORCE [ PEOPLE ]
51.8%
PERCENT IN LABOR FORCE
7.5%
UNEMPLOYMENT RATE
Valencia County Area Codes
Income in Valencia County
Income Overview in Valencia County
Per Capita Income in Valencia County is $28,817, while median incomes of families and households are $67,296 and $56,246 respectively.
| Characteristic | Number | Measure |
| Per Capita Income | 76,613 | $28,817 |
| Median Family Income | 17,335 | $67,296 |
| Mean Family Income | 17,335 | $83,339 |
| Median Household Income | 26,272 | $56,246 |
| Mean Household Income | 26,272 | $74,341 |
| Income Deficit | 17,335 | $11,528 |
| Wage / Income Gap (%) | 76,613 | 16.72% |
| Wage / Income Gap ($) | 76,613 | 83.28¢ per $1 |
| Gini / Inequality Index | 76,613 | 0.45 |
Earnings by Sex in Valencia County
Average Earnings in Valencia County are $33,651, $35,513 for men and $29,577 for women, a difference of 16.7%.
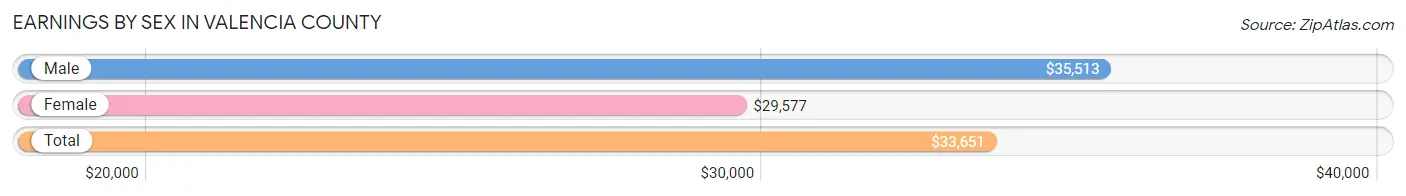
| Sex | Number | Average Earnings |
| Male | 17,650 (52.7%) | $35,513 |
| Female | 15,836 (47.3%) | $29,577 |
| Total | 33,486 (100.0%) | $33,651 |
Earnings by Sex by Income Bracket in Valencia County
The most common earnings brackets in Valencia County are $100,000+ for men (2,167 | 12.3%) and $55,000 to $64,999 for women (1,602 | 10.1%).
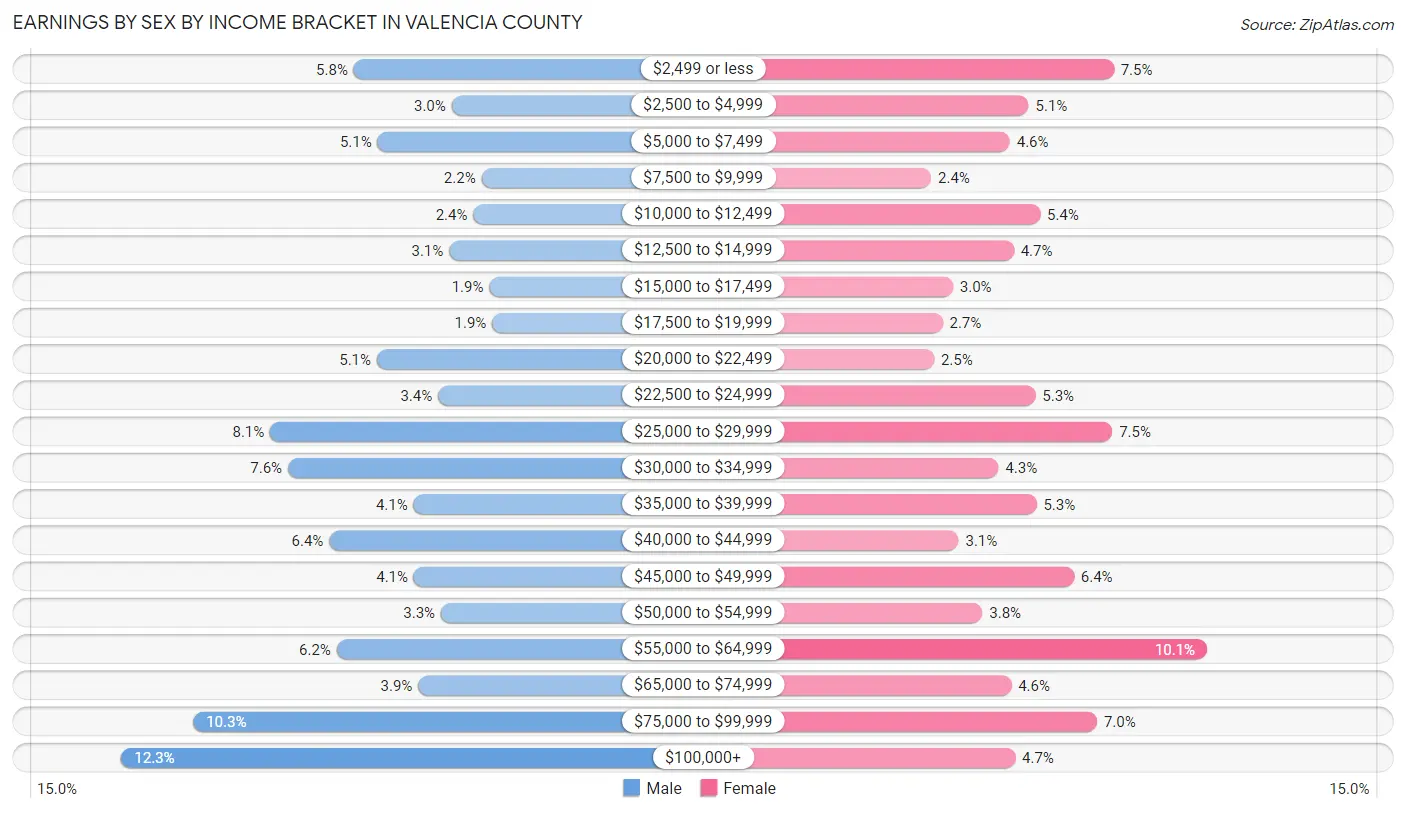
| Income | Male | Female |
| $2,499 or less | 1,014 (5.8%) | 1,188 (7.5%) |
| $2,500 to $4,999 | 529 (3.0%) | 810 (5.1%) |
| $5,000 to $7,499 | 897 (5.1%) | 726 (4.6%) |
| $7,500 to $9,999 | 382 (2.2%) | 376 (2.4%) |
| $10,000 to $12,499 | 421 (2.4%) | 860 (5.4%) |
| $12,500 to $14,999 | 542 (3.1%) | 743 (4.7%) |
| $15,000 to $17,499 | 342 (1.9%) | 472 (3.0%) |
| $17,500 to $19,999 | 329 (1.9%) | 426 (2.7%) |
| $20,000 to $22,499 | 900 (5.1%) | 388 (2.5%) |
| $22,500 to $24,999 | 596 (3.4%) | 840 (5.3%) |
| $25,000 to $29,999 | 1,430 (8.1%) | 1,181 (7.5%) |
| $30,000 to $34,999 | 1,342 (7.6%) | 675 (4.3%) |
| $35,000 to $39,999 | 719 (4.1%) | 844 (5.3%) |
| $40,000 to $44,999 | 1,136 (6.4%) | 497 (3.1%) |
| $45,000 to $49,999 | 716 (4.1%) | 1,010 (6.4%) |
| $50,000 to $54,999 | 582 (3.3%) | 603 (3.8%) |
| $55,000 to $64,999 | 1,100 (6.2%) | 1,602 (10.1%) |
| $65,000 to $74,999 | 695 (3.9%) | 732 (4.6%) |
| $75,000 to $99,999 | 1,811 (10.3%) | 1,114 (7.0%) |
| $100,000+ | 2,167 (12.3%) | 749 (4.7%) |
| Total | 17,650 (100.0%) | 15,836 (100.0%) |
Earnings by Sex by Educational Attainment in Valencia County
Average earnings in Valencia County are $42,870 for men and $37,247 for women, a difference of 13.1%. Men with an educational attainment of graduate degree enjoy the highest average annual earnings of $108,783, while those with less than high school education earn the least with $29,142. Women with an educational attainment of graduate degree earn the most with the average annual earnings of $58,740, while those with less than high school education have the smallest earnings of $11,839.
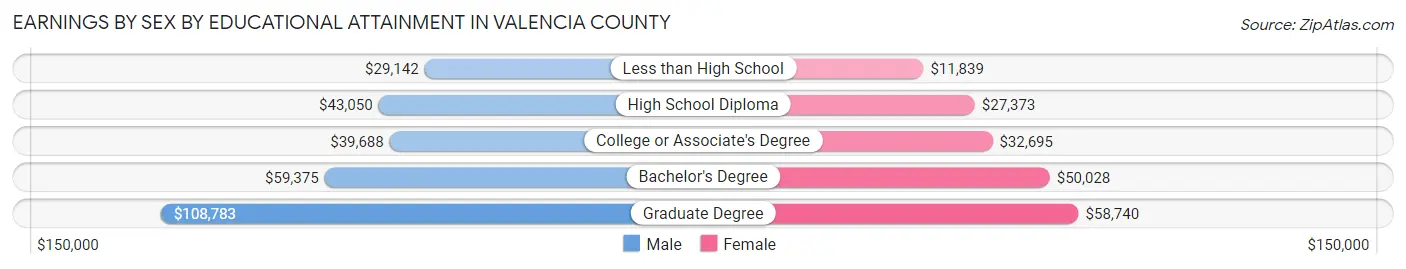
| Educational Attainment | Male Income | Female Income |
| Less than High School | $29,142 | $11,839 |
| High School Diploma | $43,050 | $27,373 |
| College or Associate's Degree | $39,688 | $32,695 |
| Bachelor's Degree | $59,375 | $50,028 |
| Graduate Degree | $108,783 | $58,740 |
| Total | $42,870 | $37,247 |
Family Income in Valencia County
Family Income Brackets in Valencia County
According to the Valencia County family income data, there are 3,796 families falling into the $50,000 to $74,999 income range, which is the most common income bracket and makes up 21.9% of all families. Conversely, the $10,000 to $14,999 income bracket is the least frequent group with only 347 families (2.0%) belonging to this category.
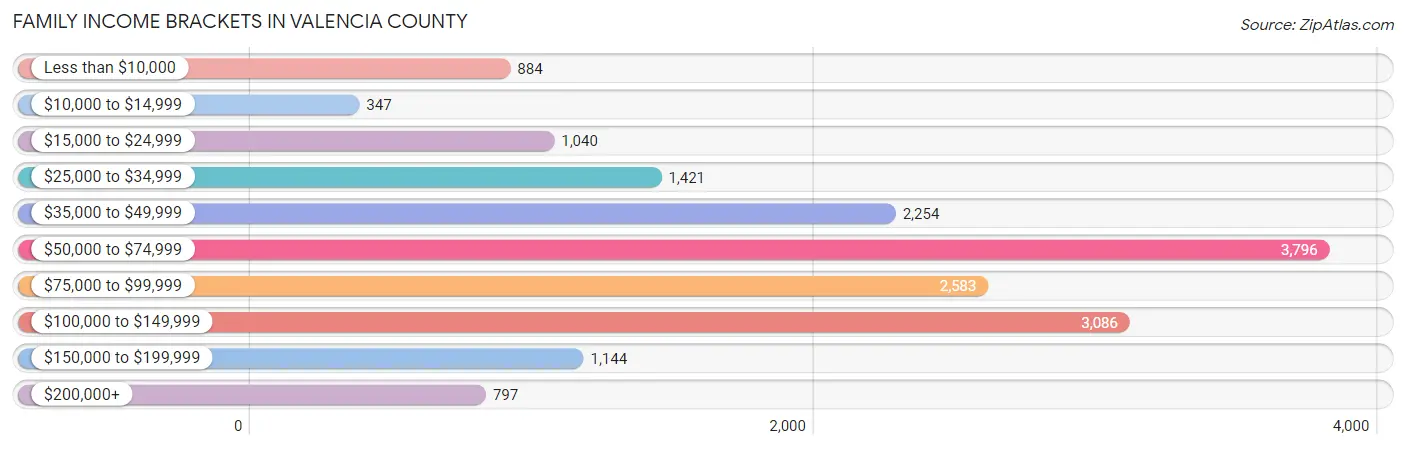
| Income Bracket | # Families | % Families |
| Less than $10,000 | 884 | 5.1% |
| $10,000 to $14,999 | 347 | 2.0% |
| $15,000 to $24,999 | 1,040 | 6.0% |
| $25,000 to $34,999 | 1,421 | 8.2% |
| $35,000 to $49,999 | 2,254 | 13.0% |
| $50,000 to $74,999 | 3,796 | 21.9% |
| $75,000 to $99,999 | 2,583 | 14.9% |
| $100,000 to $149,999 | 3,086 | 17.8% |
| $150,000 to $199,999 | 1,144 | 6.6% |
| $200,000+ | 797 | 4.6% |
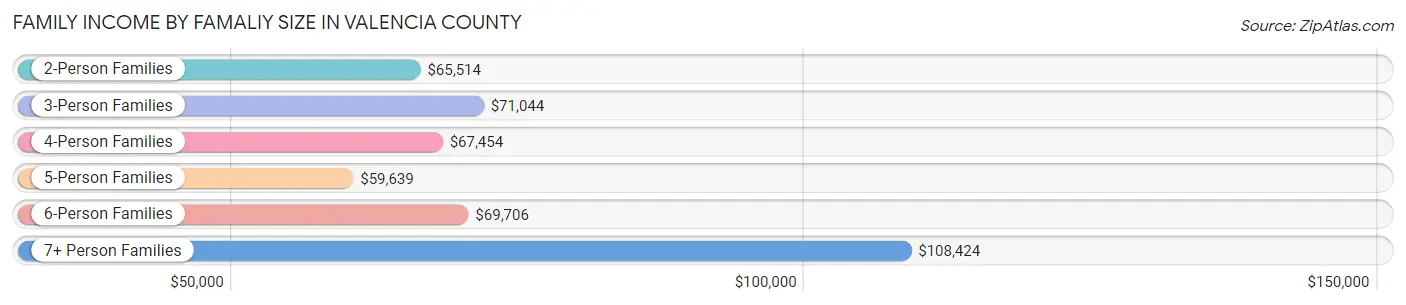
Family Income by Famaliy Size in Valencia County
7+ person families (279 | 1.6%) account for the highest median family income in Valencia County with $108,424 per family, while 2-person families (8,573 | 49.4%) have the highest median income of $32,757 per family member.
| Income Bracket | # Families | Median Income |
| 2-Person Families | 8,573 (49.4%) | $65,514 |
| 3-Person Families | 3,588 (20.7%) | $71,044 |
| 4-Person Families | 2,896 (16.7%) | $67,454 |
| 5-Person Families | 1,231 (7.1%) | $59,639 |
| 6-Person Families | 768 (4.4%) | $69,706 |
| 7+ Person Families | 279 (1.6%) | $108,424 |
| Total | 17,335 (100.0%) | $67,296 |
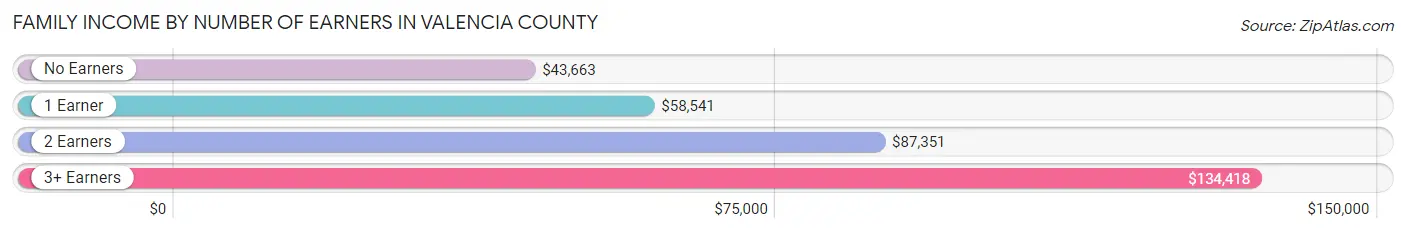
Family Income by Number of Earners in Valencia County
The median family income in Valencia County is $67,296, with families comprising 3+ earners (1,091) having the highest median family income of $134,418, while families with no earners (3,785) have the lowest median family income of $43,663, accounting for 6.3% and 21.8% of families, respectively.
| Number of Earners | # Families | Median Income |
| No Earners | 3,785 (21.8%) | $43,663 |
| 1 Earner | 7,100 (41.0%) | $58,541 |
| 2 Earners | 5,359 (30.9%) | $87,351 |
| 3+ Earners | 1,091 (6.3%) | $134,418 |
| Total | 17,335 (100.0%) | $67,296 |
Household Income in Valencia County
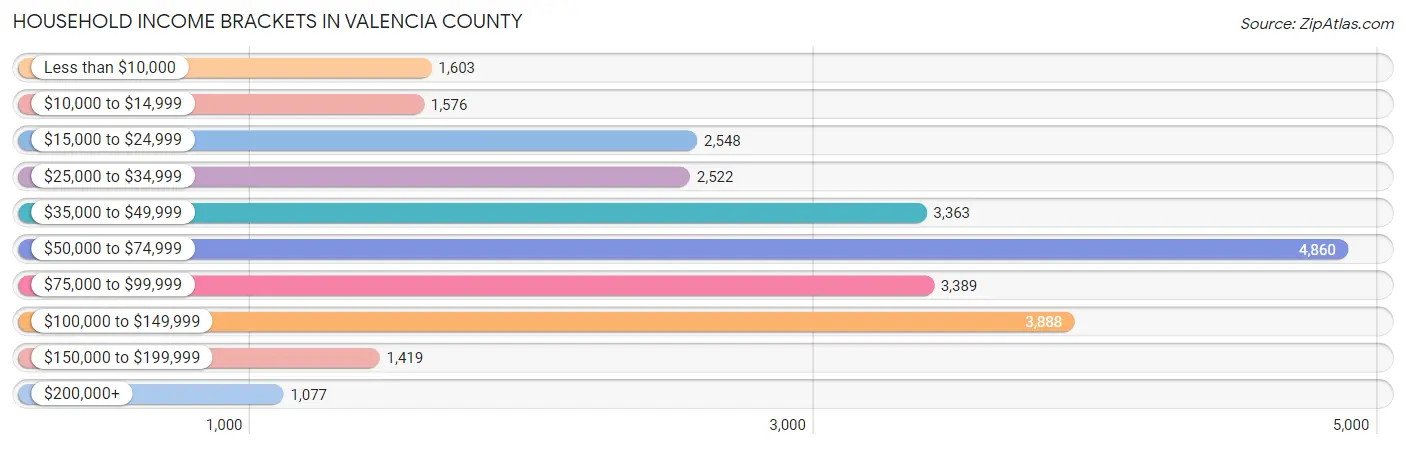
Household Income Brackets in Valencia County
With 4,860 households falling in the category, the $50,000 to $74,999 income range is the most frequent in Valencia County, accounting for 18.5% of all households. In contrast, only 1,077 households (4.1%) fall into the $200,000+ income bracket, making it the least populous group.
| Income Bracket | # Households | % Households |
| Less than $10,000 | 1,603 | 6.1% |
| $10,000 to $14,999 | 1,576 | 6.0% |
| $15,000 to $24,999 | 2,548 | 9.7% |
| $25,000 to $34,999 | 2,522 | 9.6% |
| $35,000 to $49,999 | 3,363 | 12.8% |
| $50,000 to $74,999 | 4,860 | 18.5% |
| $75,000 to $99,999 | 3,389 | 12.9% |
| $100,000 to $149,999 | 3,888 | 14.8% |
| $150,000 to $199,999 | 1,419 | 5.4% |
| $200,000+ | 1,077 | 4.1% |
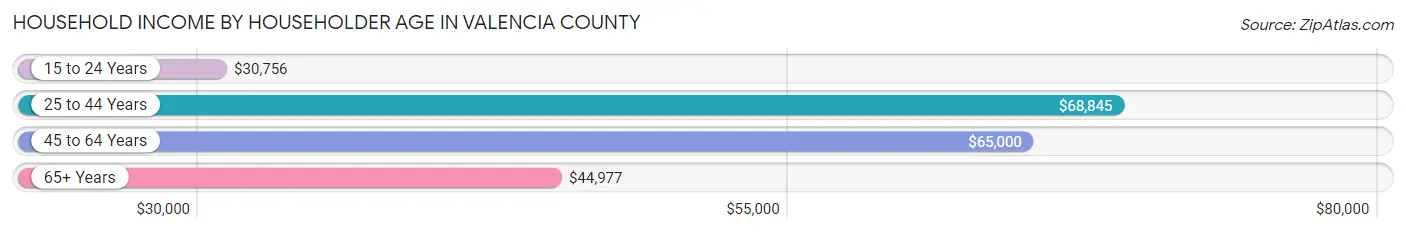
Household Income by Householder Age in Valencia County
The median household income in Valencia County is $56,246, with the highest median household income of $68,845 found in the 25 to 44 years age bracket for the primary householder. A total of 6,973 households (26.5%) fall into this category. Meanwhile, the 15 to 24 years age bracket for the primary householder has the lowest median household income of $30,756, with 475 households (1.8%) in this group.
| Income Bracket | # Households | Median Income |
| 15 to 24 Years | 475 (1.8%) | $30,756 |
| 25 to 44 Years | 6,973 (26.5%) | $68,845 |
| 45 to 64 Years | 10,554 (40.2%) | $65,000 |
| 65+ Years | 8,270 (31.5%) | $44,977 |
| Total | 26,272 (100.0%) | $56,246 |
Poverty in Valencia County
Income Below Poverty by Sex and Age in Valencia County
With 15.0% poverty level for males and 20.4% for females among the residents of Valencia County, 15 year old males and 16 and 17 year old females are the most vulnerable to poverty, with 132 males (31.4%) and 271 females (31.3%) in their respective age groups living below the poverty level.
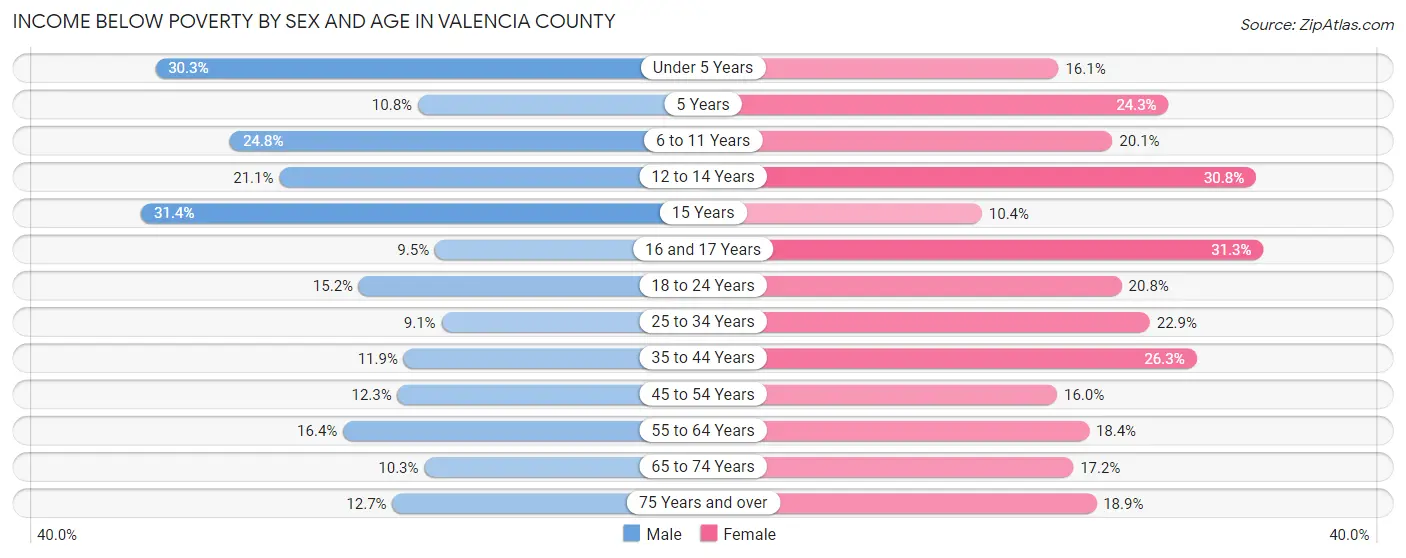
| Age Bracket | Male | Female |
| Under 5 Years | 613 (30.3%) | 328 (16.1%) |
| 5 Years | 46 (10.8%) | 177 (24.2%) |
| 6 to 11 Years | 732 (24.7%) | 559 (20.1%) |
| 12 to 14 Years | 399 (21.1%) | 416 (30.7%) |
| 15 Years | 132 (31.4%) | 68 (10.4%) |
| 16 and 17 Years | 107 (9.5%) | 271 (31.3%) |
| 18 to 24 Years | 524 (15.2%) | 663 (20.8%) |
| 25 to 34 Years | 387 (9.0%) | 1,082 (22.9%) |
| 35 to 44 Years | 551 (11.8%) | 1,205 (26.3%) |
| 45 to 54 Years | 532 (12.3%) | 686 (16.0%) |
| 55 to 64 Years | 799 (16.4%) | 966 (18.3%) |
| 65 to 74 Years | 436 (10.3%) | 733 (17.2%) |
| 75 Years and over | 306 (12.7%) | 574 (18.9%) |
| Total | 5,564 (15.0%) | 7,728 (20.4%) |
Income Above Poverty by Sex and Age in Valencia County
According to the poverty statistics in Valencia County, males aged 25 to 34 years and females aged 15 years are the age groups that are most secure financially, with 90.9% of males and 89.6% of females in these age groups living above the poverty line.
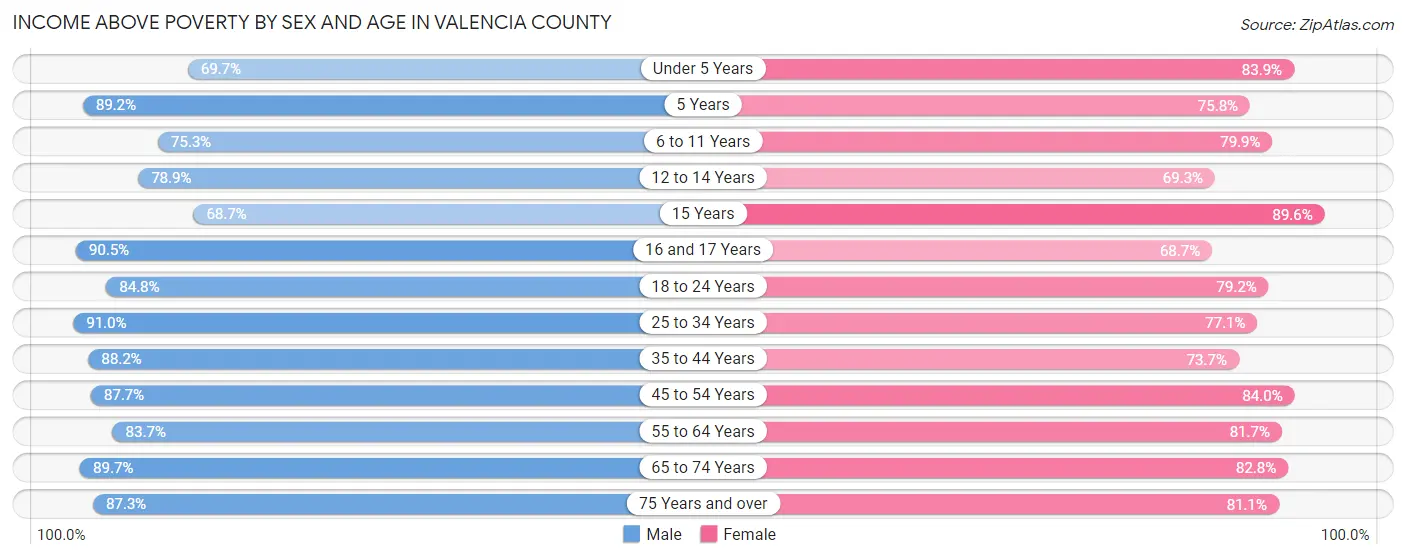
| Age Bracket | Male | Female |
| Under 5 Years | 1,410 (69.7%) | 1,711 (83.9%) |
| 5 Years | 380 (89.2%) | 553 (75.7%) |
| 6 to 11 Years | 2,226 (75.2%) | 2,224 (79.9%) |
| 12 to 14 Years | 1,493 (78.9%) | 937 (69.3%) |
| 15 Years | 289 (68.6%) | 586 (89.6%) |
| 16 and 17 Years | 1,016 (90.5%) | 595 (68.7%) |
| 18 to 24 Years | 2,927 (84.8%) | 2,527 (79.2%) |
| 25 to 34 Years | 3,887 (90.9%) | 3,650 (77.1%) |
| 35 to 44 Years | 4,098 (88.1%) | 3,372 (73.7%) |
| 45 to 54 Years | 3,788 (87.7%) | 3,607 (84.0%) |
| 55 to 64 Years | 4,087 (83.7%) | 4,299 (81.7%) |
| 65 to 74 Years | 3,790 (89.7%) | 3,534 (82.8%) |
| 75 Years and over | 2,106 (87.3%) | 2,464 (81.1%) |
| Total | 31,497 (85.0%) | 30,059 (79.5%) |
Income Below Poverty Among Married-Couple Families in Valencia County
The poverty statistics for married-couple families in Valencia County show that 7.8% or 924 of the total 11,812 families live below the poverty line. Families with 3 or 4 children have the highest poverty rate of 13.7%, comprising of 161 families. On the other hand, families with 5 or more children have the lowest poverty rate of 0.0%, which includes 0 families.
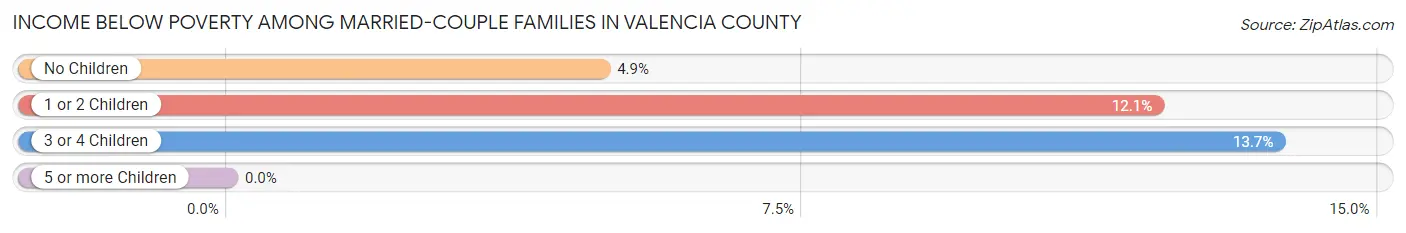
| Children | Above Poverty | Below Poverty |
| No Children | 6,817 (95.1%) | 348 (4.9%) |
| 1 or 2 Children | 3,017 (87.9%) | 415 (12.1%) |
| 3 or 4 Children | 1,017 (86.3%) | 161 (13.7%) |
| 5 or more Children | 37 (100.0%) | 0 (0.0%) |
| Total | 10,888 (92.2%) | 924 (7.8%) |
Income Below Poverty Among Single-Parent Households in Valencia County
According to the poverty data in Valencia County, 16.0% or 265 single-father households and 25.2% or 975 single-mother households are living below the poverty line. Among single-father households, those with 3 or 4 children have the highest poverty rate, with 119 households (74.4%) experiencing poverty. Likewise, among single-mother households, those with 5 or more children have the highest poverty rate, with 12 households (50.0%) falling below the poverty line.
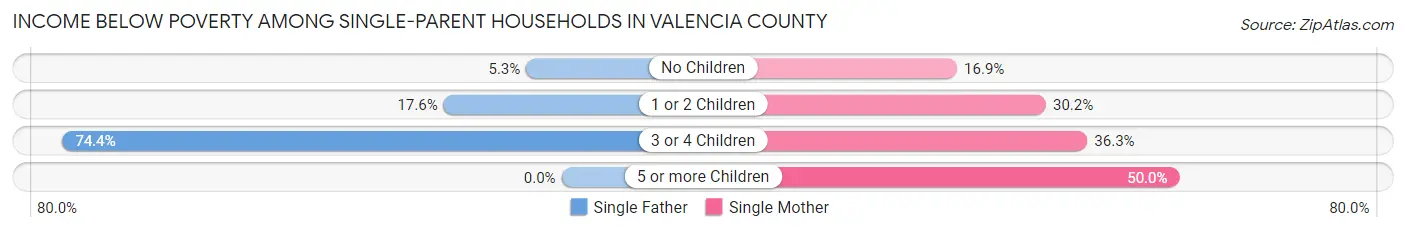
| Children | Single Father | Single Mother |
| No Children | 50 (5.3%) | 287 (16.9%) |
| 1 or 2 Children | 96 (17.6%) | 510 (30.2%) |
| 3 or 4 Children | 119 (74.4%) | 166 (36.3%) |
| 5 or more Children | 0 (0.0%) | 12 (50.0%) |
| Total | 265 (16.0%) | 975 (25.2%) |
Income Below Poverty Among Married-Couple vs Single-Parent Households in Valencia County
The poverty data for Valencia County shows that 924 of the married-couple family households (7.8%) and 1,240 of the single-parent households (22.5%) are living below the poverty level. Within the married-couple family households, those with 3 or 4 children have the highest poverty rate, with 161 households (13.7%) falling below the poverty line. Among the single-parent households, those with 5 or more children have the highest poverty rate, with 12 household (50.0%) living below poverty.
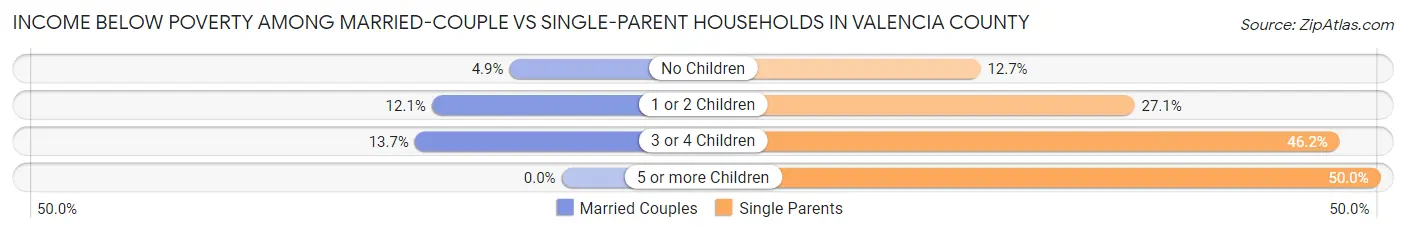
| Children | Married-Couple Families | Single-Parent Households |
| No Children | 348 (4.9%) | 337 (12.7%) |
| 1 or 2 Children | 415 (12.1%) | 606 (27.1%) |
| 3 or 4 Children | 161 (13.7%) | 285 (46.2%) |
| 5 or more Children | 0 (0.0%) | 12 (50.0%) |
| Total | 924 (7.8%) | 1,240 (22.5%) |
Race in Valencia County
The most populous races in Valencia County are White / Caucasian (48,321 | 63.1%), Hispanic or Latino (46,825 | 61.1%), and Two or more Races (15,197 | 19.8%).
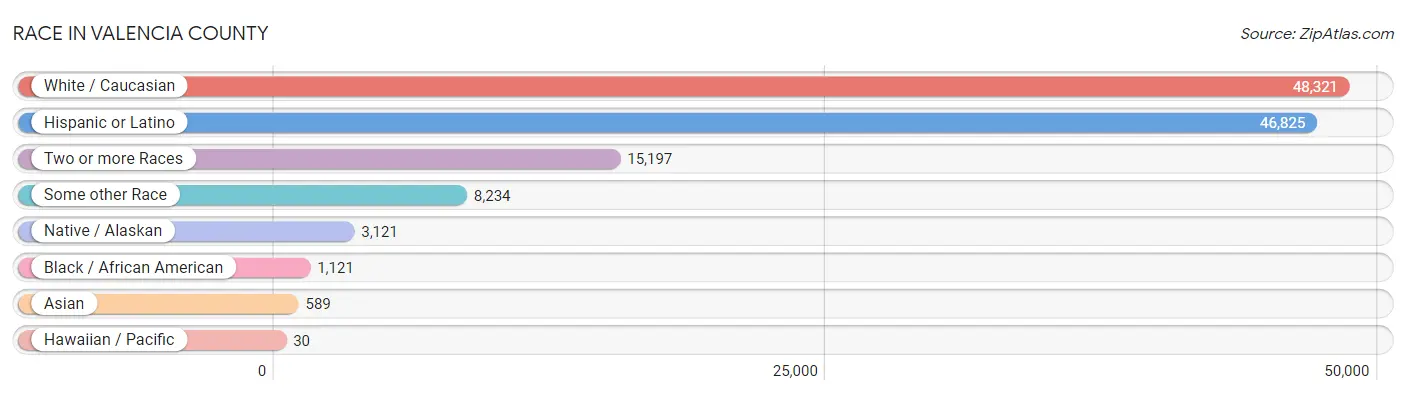
| Race | # Population | % Population |
| Asian | 589 | 0.8% |
| Black / African American | 1,121 | 1.5% |
| Hawaiian / Pacific | 30 | 0.0% |
| Hispanic or Latino | 46,825 | 61.1% |
| Native / Alaskan | 3,121 | 4.1% |
| White / Caucasian | 48,321 | 63.1% |
| Two or more Races | 15,197 | 19.8% |
| Some other Race | 8,234 | 10.7% |
| Total | 76,613 | 100.0% |
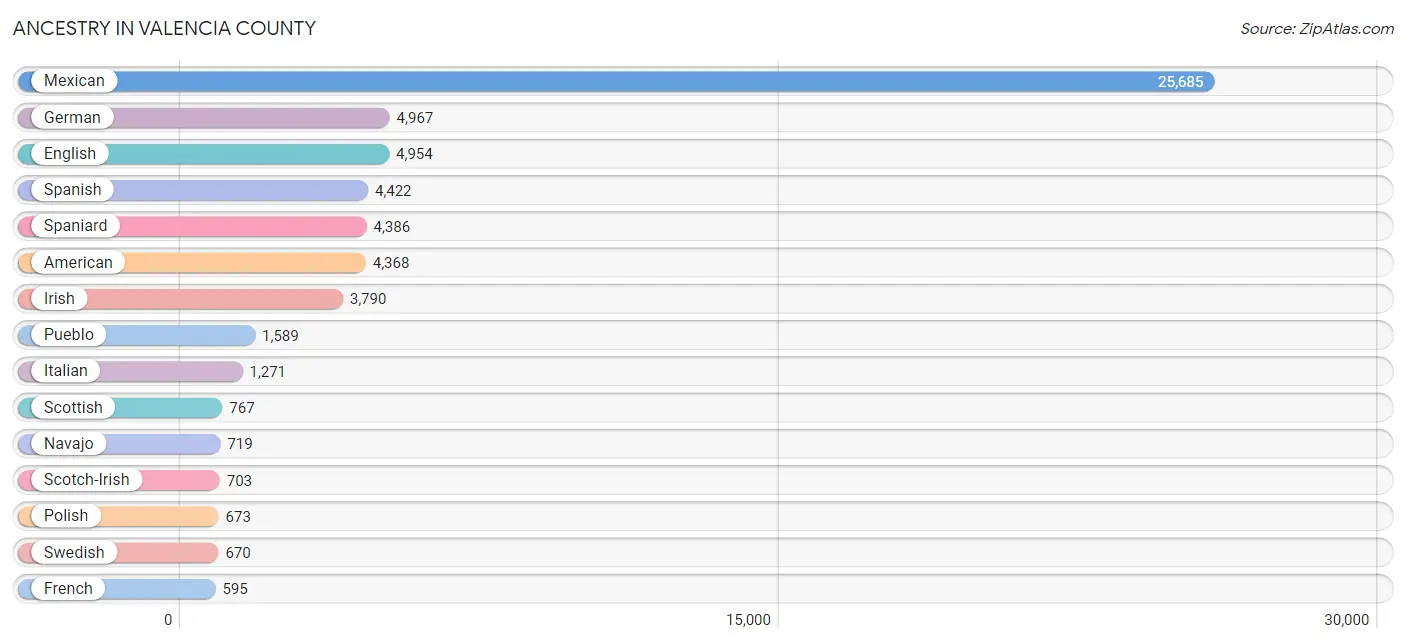
Ancestry in Valencia County
The most populous ancestries reported in Valencia County are Mexican (25,685 | 33.5%), German (4,967 | 6.5%), English (4,954 | 6.5%), Spanish (4,422 | 5.8%), and Spaniard (4,386 | 5.7%), together accounting for 58.0% of all Valencia County residents.
| Ancestry | # Population | % Population |
| Afghan | 39 | 0.1% |
| African | 216 | 0.3% |
| Albanian | 4 | 0.0% |
| American | 4,368 | 5.7% |
| Apache | 85 | 0.1% |
| Arab | 234 | 0.3% |
| Armenian | 11 | 0.0% |
| Australian | 36 | 0.1% |
| Austrian | 43 | 0.1% |
| Basque | 75 | 0.1% |
| Belgian | 69 | 0.1% |
| Bhutanese | 230 | 0.3% |
| Blackfeet | 61 | 0.1% |
| Bolivian | 68 | 0.1% |
| British | 310 | 0.4% |
| Burmese | 30 | 0.0% |
| Canadian | 7 | 0.0% |
| Celtic | 23 | 0.0% |
| Central American | 57 | 0.1% |
| Cherokee | 371 | 0.5% |
| Cheyenne | 57 | 0.1% |
| Chickasaw | 123 | 0.2% |
| Chippewa | 122 | 0.2% |
| Choctaw | 136 | 0.2% |
| Colombian | 34 | 0.0% |
| Comanche | 18 | 0.0% |
| Creek | 65 | 0.1% |
| Croatian | 25 | 0.0% |
| Cuban | 226 | 0.3% |
| Czech | 69 | 0.1% |
| Czechoslovakian | 19 | 0.0% |
| Danish | 186 | 0.2% |
| Dutch | 317 | 0.4% |
| Dutch West Indian | 19 | 0.0% |
| Eastern European | 64 | 0.1% |
| English | 4,954 | 6.5% |
| European | 457 | 0.6% |
| Finnish | 96 | 0.1% |
| French | 595 | 0.8% |
| French Canadian | 277 | 0.4% |
| German | 4,967 | 6.5% |
| Greek | 98 | 0.1% |
| Guamanian / Chamorro | 30 | 0.0% |
| Guatemalan | 5 | 0.0% |
| Haitian | 19 | 0.0% |
| Hopi | 578 | 0.7% |
| Hungarian | 228 | 0.3% |
| Indian (Asian) | 60 | 0.1% |
| Iranian | 56 | 0.1% |
| Irish | 3,790 | 5.0% |
| Iroquois | 19 | 0.0% |
| Italian | 1,271 | 1.7% |
| Jamaican | 32 | 0.0% |
| Korean | 488 | 0.6% |
| Latvian | 20 | 0.0% |
| Lebanese | 56 | 0.1% |
| Lithuanian | 22 | 0.0% |
| Mexican | 25,685 | 33.5% |
| Mexican American Indian | 292 | 0.4% |
| Native Hawaiian | 38 | 0.1% |
| Navajo | 719 | 0.9% |
| Northern European | 123 | 0.2% |
| Norwegian | 422 | 0.5% |
| Pakistani | 12 | 0.0% |
| Palestinian | 178 | 0.2% |
| Peruvian | 51 | 0.1% |
| Pima | 337 | 0.4% |
| Polish | 673 | 0.9% |
| Portuguese | 453 | 0.6% |
| Potawatomi | 66 | 0.1% |
| Pueblo | 1,589 | 2.1% |
| Puerto Rican | 497 | 0.6% |
| Romanian | 88 | 0.1% |
| Russian | 196 | 0.3% |
| Salvadoran | 52 | 0.1% |
| Samoan | 11 | 0.0% |
| Scandinavian | 167 | 0.2% |
| Scotch-Irish | 703 | 0.9% |
| Scottish | 767 | 1.0% |
| Sioux | 4 | 0.0% |
| Slavic | 10 | 0.0% |
| Slovak | 6 | 0.0% |
| Slovene | 15 | 0.0% |
| South American | 177 | 0.2% |
| Spaniard | 4,386 | 5.7% |
| Spanish | 4,422 | 5.8% |
| Spanish American | 260 | 0.3% |
| Sri Lankan | 107 | 0.1% |
| Subsaharan African | 216 | 0.3% |
| Swedish | 670 | 0.9% |
| Swiss | 58 | 0.1% |
| Tlingit-Haida | 5 | 0.0% |
| Ukrainian | 93 | 0.1% |
| Ute | 38 | 0.1% |
| Venezuelan | 24 | 0.0% |
| Welsh | 286 | 0.4% |
| Yugoslavian | 13 | 0.0% | View All 97 Rows |
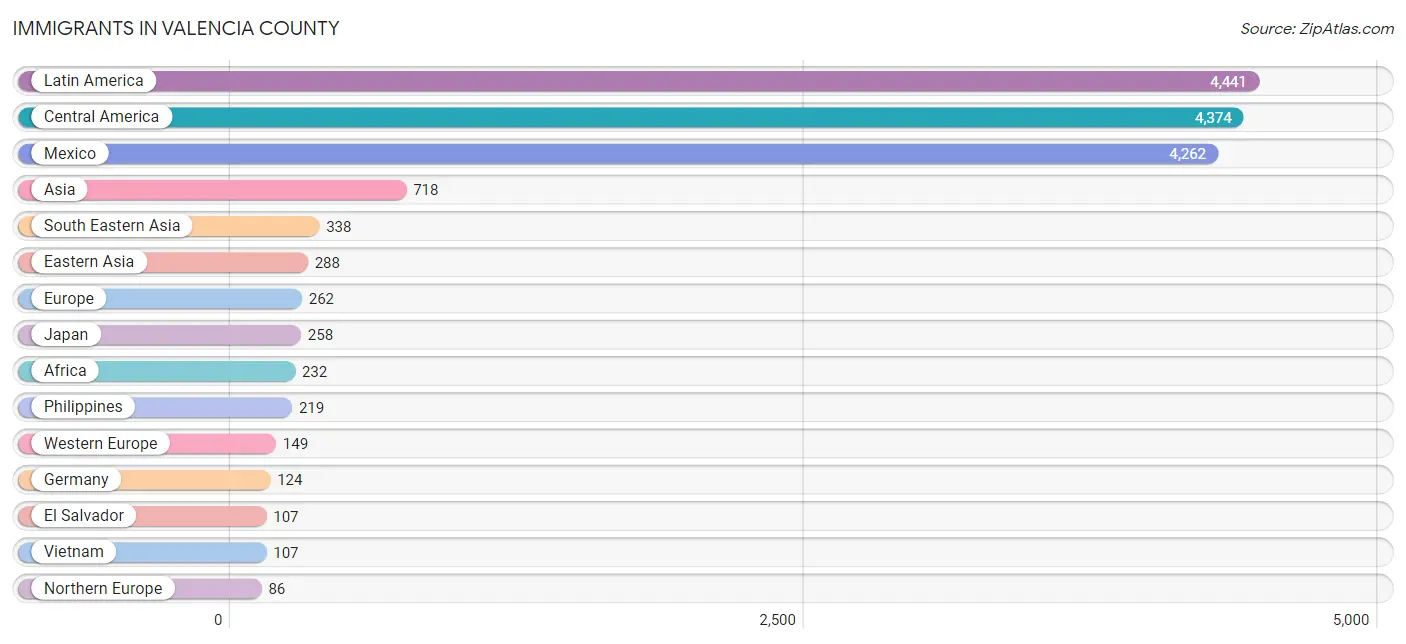
Immigrants in Valencia County
The most numerous immigrant groups reported in Valencia County came from Latin America (4,441 | 5.8%), Central America (4,374 | 5.7%), Mexico (4,262 | 5.6%), Asia (718 | 0.9%), and South Eastern Asia (338 | 0.4%), together accounting for 18.4% of all Valencia County residents.
| Immigration Origin | # Population | % Population |
| Afghanistan | 39 | 0.1% |
| Africa | 232 | 0.3% |
| Asia | 718 | 0.9% |
| Australia | 43 | 0.1% |
| Austria | 15 | 0.0% |
| Bolivia | 9 | 0.0% |
| Canada | 13 | 0.0% |
| Caribbean | 8 | 0.0% |
| Central America | 4,374 | 5.7% |
| Chile | 26 | 0.0% |
| China | 30 | 0.0% |
| Cuba | 7 | 0.0% |
| Eastern Asia | 288 | 0.4% |
| Eastern Europe | 27 | 0.0% |
| El Salvador | 107 | 0.1% |
| England | 70 | 0.1% |
| Europe | 262 | 0.3% |
| Germany | 124 | 0.2% |
| Guatemala | 5 | 0.0% |
| Haiti | 1 | 0.0% |
| Iran | 31 | 0.0% |
| Ireland | 5 | 0.0% |
| Japan | 258 | 0.3% |
| Latin America | 4,441 | 5.8% |
| Mexico | 4,262 | 5.6% |
| Netherlands | 10 | 0.0% |
| Northern Europe | 86 | 0.1% |
| Oceania | 43 | 0.1% |
| Philippines | 219 | 0.3% |
| Poland | 5 | 0.0% |
| Russia | 22 | 0.0% |
| South Africa | 70 | 0.1% |
| South America | 59 | 0.1% |
| South Central Asia | 70 | 0.1% |
| South Eastern Asia | 338 | 0.4% |
| Thailand | 12 | 0.0% |
| Venezuela | 24 | 0.0% |
| Vietnam | 107 | 0.1% |
| Western Asia | 22 | 0.0% |
| Western Europe | 149 | 0.2% | View All 40 Rows |
Sex and Age in Valencia County
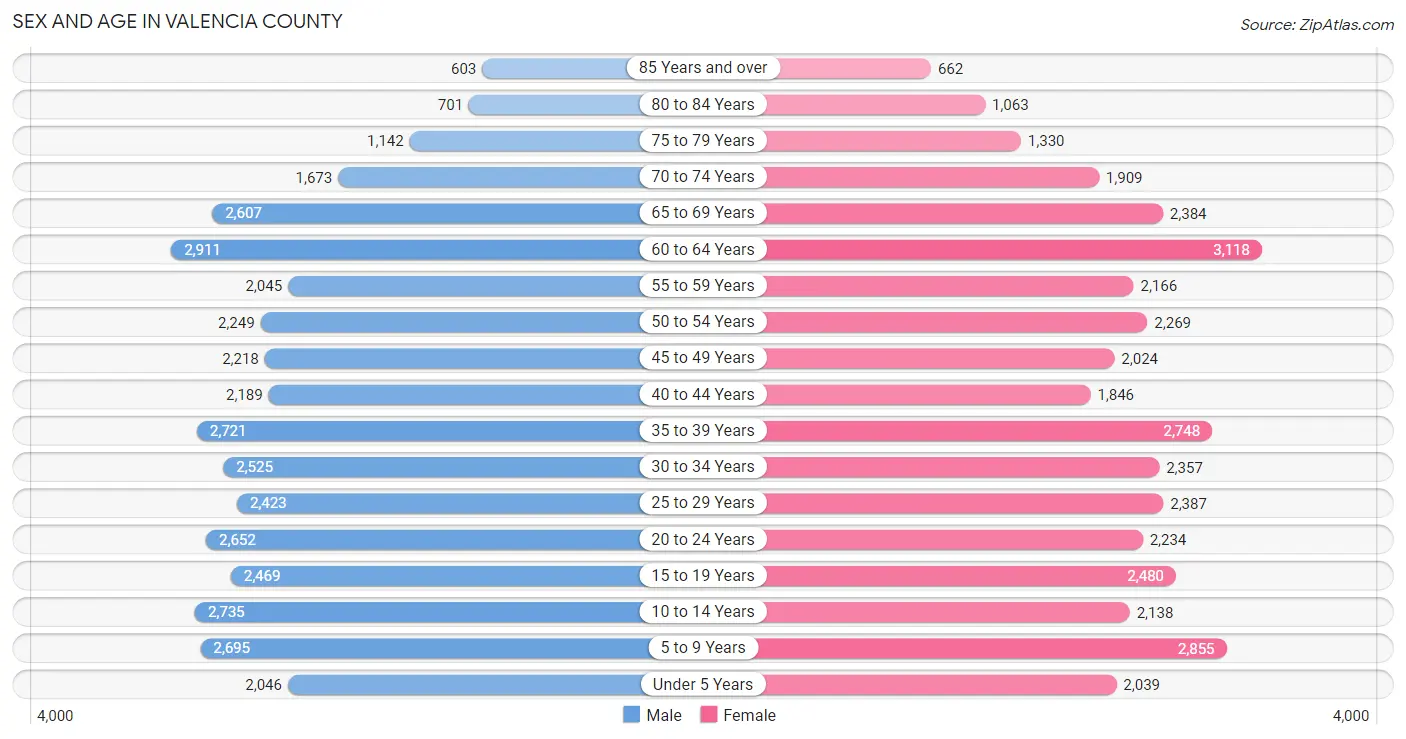
Sex and Age in Valencia County
The most populous age groups in Valencia County are 60 to 64 Years (2,911 | 7.5%) for men and 60 to 64 Years (3,118 | 8.2%) for women.
| Age Bracket | Male | Female |
| Under 5 Years | 2,046 (5.3%) | 2,039 (5.4%) |
| 5 to 9 Years | 2,695 (7.0%) | 2,855 (7.5%) |
| 10 to 14 Years | 2,735 (7.1%) | 2,138 (5.6%) |
| 15 to 19 Years | 2,469 (6.4%) | 2,480 (6.5%) |
| 20 to 24 Years | 2,652 (6.9%) | 2,234 (5.9%) |
| 25 to 29 Years | 2,423 (6.3%) | 2,387 (6.3%) |
| 30 to 34 Years | 2,525 (6.5%) | 2,357 (6.2%) |
| 35 to 39 Years | 2,721 (7.0%) | 2,748 (7.2%) |
| 40 to 44 Years | 2,189 (5.7%) | 1,846 (4.9%) |
| 45 to 49 Years | 2,218 (5.8%) | 2,024 (5.3%) |
| 50 to 54 Years | 2,249 (5.8%) | 2,269 (6.0%) |
| 55 to 59 Years | 2,045 (5.3%) | 2,166 (5.7%) |
| 60 to 64 Years | 2,911 (7.5%) | 3,118 (8.2%) |
| 65 to 69 Years | 2,607 (6.8%) | 2,384 (6.3%) |
| 70 to 74 Years | 1,673 (4.3%) | 1,909 (5.0%) |
| 75 to 79 Years | 1,142 (3.0%) | 1,330 (3.5%) |
| 80 to 84 Years | 701 (1.8%) | 1,063 (2.8%) |
| 85 Years and over | 603 (1.6%) | 662 (1.7%) |
| Total | 38,604 (100.0%) | 38,009 (100.0%) |
Families and Households in Valencia County
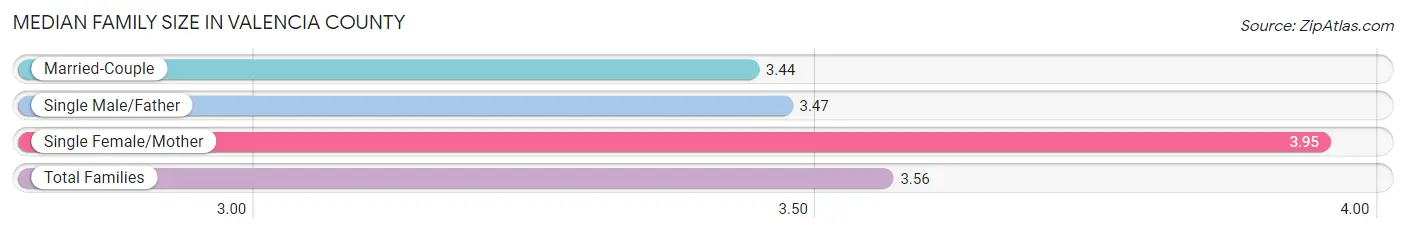
Median Family Size in Valencia County
The median family size in Valencia County is 3.56 persons per family, with single female/mother families (3,869 | 22.3%) accounting for the largest median family size of 3.95 persons per family. On the other hand, married-couple families (11,812 | 68.1%) represent the smallest median family size with 3.44 persons per family.
| Family Type | # Families | Family Size |
| Married-Couple | 11,812 (68.1%) | 3.44 |
| Single Male/Father | 1,654 (9.5%) | 3.47 |
| Single Female/Mother | 3,869 (22.3%) | 3.95 |
| Total Families | 17,335 (100.0%) | 3.56 |
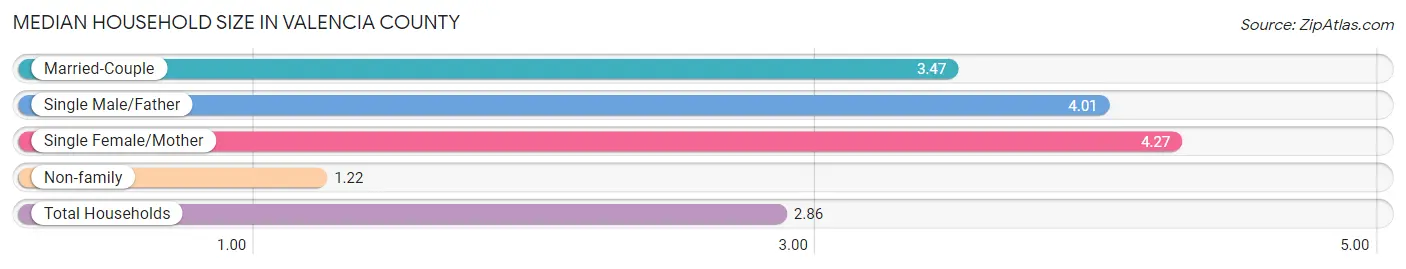
Median Household Size in Valencia County
The median household size in Valencia County is 2.86 persons per household, with single female/mother households (3,869 | 14.7%) accounting for the largest median household size of 4.27 persons per household. non-family households (8,937 | 34.0%) represent the smallest median household size with 1.22 persons per household.
| Household Type | # Households | Household Size |
| Married-Couple | 11,812 (45.0%) | 3.47 |
| Single Male/Father | 1,654 (6.3%) | 4.01 |
| Single Female/Mother | 3,869 (14.7%) | 4.27 |
| Non-family | 8,937 (34.0%) | 1.22 |
| Total Households | 26,272 (100.0%) | 2.86 |
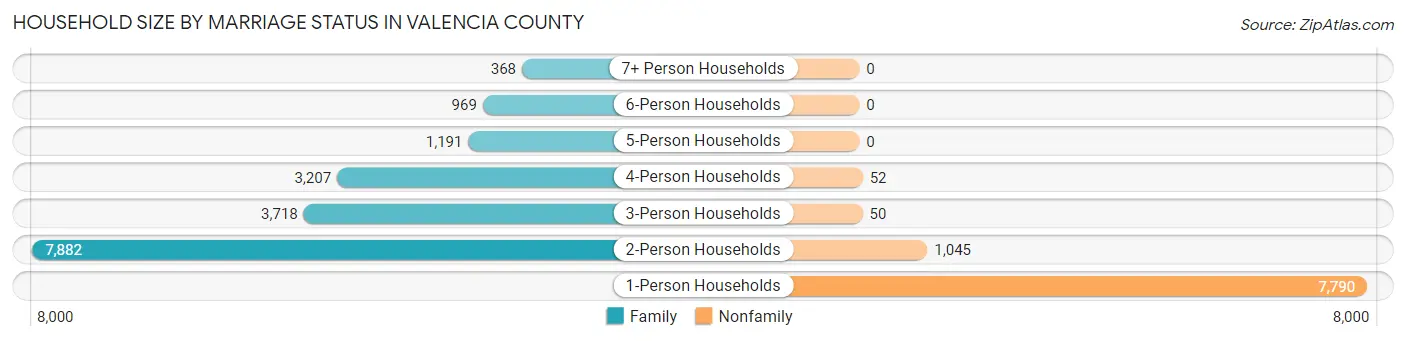
Household Size by Marriage Status in Valencia County
Out of a total of 26,272 households in Valencia County, 17,335 (66.0%) are family households, while 8,937 (34.0%) are nonfamily households. The most numerous type of family households are 2-person households, comprising 7,882, and the most common type of nonfamily households are 1-person households, comprising 7,790.
| Household Size | Family Households | Nonfamily Households |
| 1-Person Households | - | 7,790 (29.6%) |
| 2-Person Households | 7,882 (30.0%) | 1,045 (4.0%) |
| 3-Person Households | 3,718 (14.1%) | 50 (0.2%) |
| 4-Person Households | 3,207 (12.2%) | 52 (0.2%) |
| 5-Person Households | 1,191 (4.5%) | 0 (0.0%) |
| 6-Person Households | 969 (3.7%) | 0 (0.0%) |
| 7+ Person Households | 368 (1.4%) | 0 (0.0%) |
| Total | 17,335 (66.0%) | 8,937 (34.0%) |
Female Fertility in Valencia County
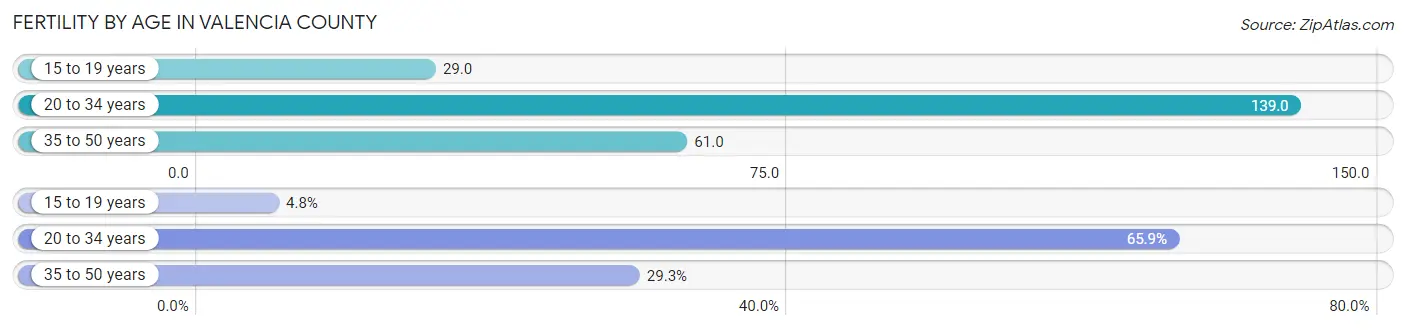
Fertility by Age in Valencia County
Average fertility rate in Valencia County is 89.0 births per 1,000 women. Women in the age bracket of 20 to 34 years have the highest fertility rate with 139.0 births per 1,000 women. Women in the age bracket of 20 to 34 years acount for 65.9% of all women with births.
| Age Bracket | Women with Births | Births / 1,000 Women |
| 15 to 19 years | 71 (4.8%) | 29.0 |
| 20 to 34 years | 971 (65.9%) | 139.0 |
| 35 to 50 years | 432 (29.3%) | 61.0 |
| Total | 1,474 (100.0%) | 89.0 |
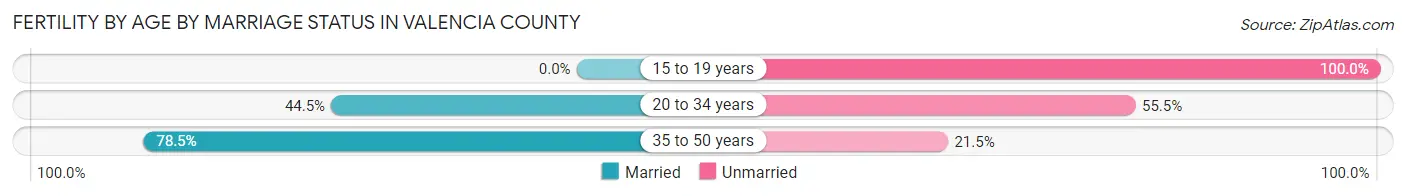
Fertility by Age by Marriage Status in Valencia County
52.3% of women with births (1,474) in Valencia County are married. The highest percentage of unmarried women with births falls into 15 to 19 years age bracket with 100.0% of them unmarried at the time of birth, while the lowest percentage of unmarried women with births belong to 35 to 50 years age bracket with 21.5% of them unmarried.
| Age Bracket | Married | Unmarried |
| 15 to 19 years | 0 (0.0%) | 71 (100.0%) |
| 20 to 34 years | 432 (44.5%) | 539 (55.5%) |
| 35 to 50 years | 339 (78.5%) | 93 (21.5%) |
| Total | 771 (52.3%) | 703 (47.7%) |
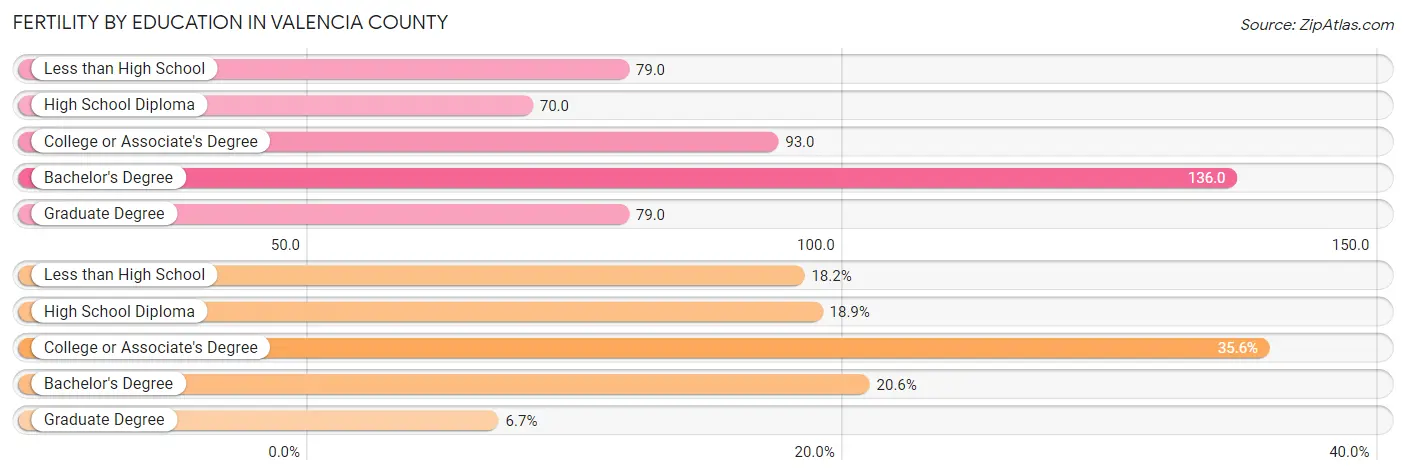
Fertility by Education in Valencia County
Average fertility rate in Valencia County is 89.0 births per 1,000 women. Women with the education attainment of bachelor's degree have the highest fertility rate of 136.0 births per 1,000 women, while women with the education attainment of high school diploma have the lowest fertility at 70.0 births per 1,000 women. Women with the education attainment of college or associate's degree represent 35.6% of all women with births.
| Educational Attainment | Women with Births | Births / 1,000 Women |
| Less than High School | 268 (18.2%) | 79.0 |
| High School Diploma | 278 (18.9%) | 70.0 |
| College or Associate's Degree | 525 (35.6%) | 93.0 |
| Bachelor's Degree | 304 (20.6%) | 136.0 |
| Graduate Degree | 99 (6.7%) | 79.0 |
| Total | 1,474 (100.0%) | 89.0 |
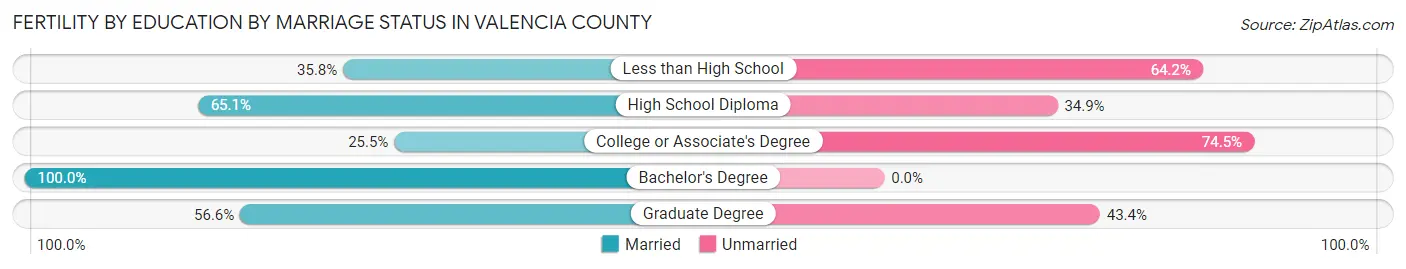
Fertility by Education by Marriage Status in Valencia County
47.7% of women with births in Valencia County are unmarried. Women with the educational attainment of bachelor's degree are most likely to be married with 100.0% of them married at childbirth, while women with the educational attainment of college or associate's degree are least likely to be married with 74.5% of them unmarried at childbirth.
| Educational Attainment | Married | Unmarried |
| Less than High School | 96 (35.8%) | 172 (64.2%) |
| High School Diploma | 181 (65.1%) | 97 (34.9%) |
| College or Associate's Degree | 134 (25.5%) | 391 (74.5%) |
| Bachelor's Degree | 304 (100.0%) | 0 (0.0%) |
| Graduate Degree | 56 (56.6%) | 43 (43.4%) |
| Total | 771 (52.3%) | 703 (47.7%) |
Employment Characteristics in Valencia County
Employment by Class of Employer in Valencia County
Among the 28,823 employed individuals in Valencia County, private company employees (17,265 | 59.9%), state government employees (2,872 | 10.0%), and local government employees (2,433 | 8.4%) make up the most common classes of employment.
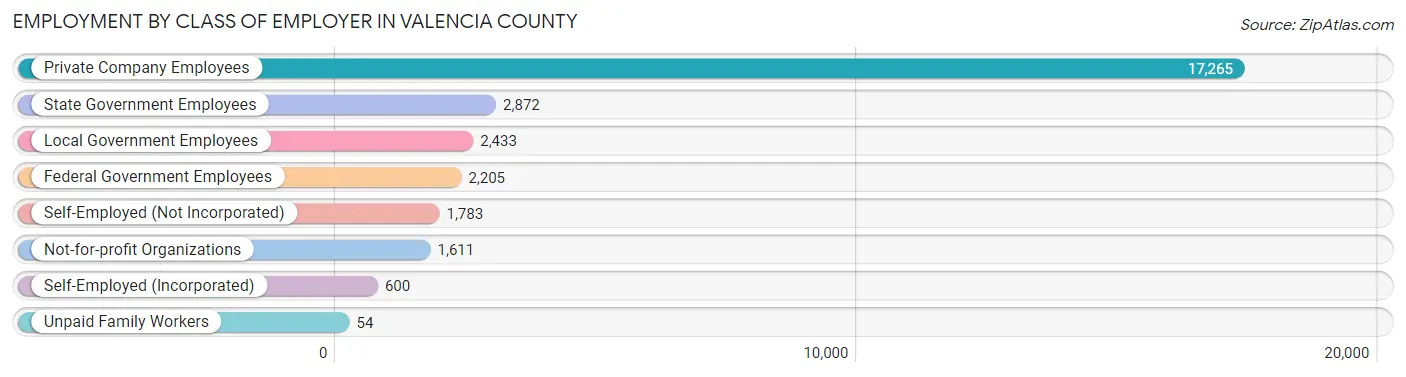
| Employer Class | # Employees | % Employees |
| Private Company Employees | 17,265 | 59.9% |
| Self-Employed (Incorporated) | 600 | 2.1% |
| Self-Employed (Not Incorporated) | 1,783 | 6.2% |
| Not-for-profit Organizations | 1,611 | 5.6% |
| Local Government Employees | 2,433 | 8.4% |
| State Government Employees | 2,872 | 10.0% |
| Federal Government Employees | 2,205 | 7.6% |
| Unpaid Family Workers | 54 | 0.2% |
| Total | 28,823 | 100.0% |
Employment Status by Age in Valencia County
According to the labor force statistics for Valencia County, out of the total population over 16 years of age (61,027), 51.8% or 31,612 individuals are in the labor force, with 7.5% or 2,371 of them unemployed. The age group with the highest labor force participation rate is 20 to 24 years, with 73.9% or 3,611 individuals in the labor force. Within the labor force, the 16 to 19 years age range has the highest percentage of unemployed individuals, with 27.0% or 321 of them being unemployed.
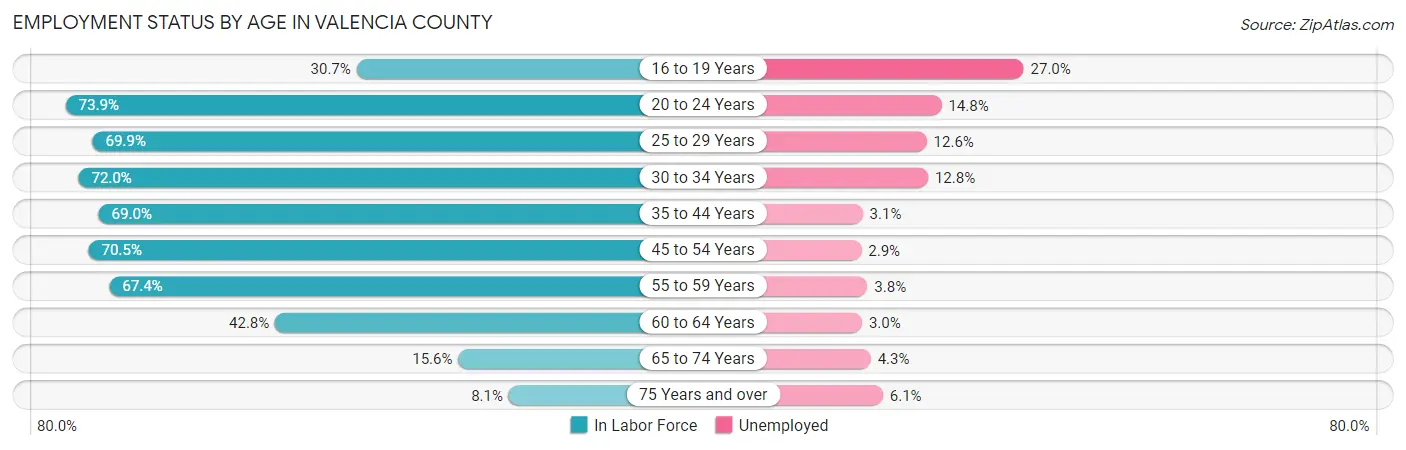
| Age Bracket | In Labor Force | Unemployed |
| 16 to 19 Years | 1,188 (30.7%) | 321 (27.0%) |
| 20 to 24 Years | 3,611 (73.9%) | 534 (14.8%) |
| 25 to 29 Years | 3,362 (69.9%) | 424 (12.6%) |
| 30 to 34 Years | 3,515 (72.0%) | 450 (12.8%) |
| 35 to 44 Years | 6,558 (69.0%) | 203 (3.1%) |
| 45 to 54 Years | 6,176 (70.5%) | 179 (2.9%) |
| 55 to 59 Years | 2,838 (67.4%) | 108 (3.8%) |
| 60 to 64 Years | 2,580 (42.8%) | 77 (3.0%) |
| 65 to 74 Years | 1,337 (15.6%) | 57 (4.3%) |
| 75 Years and over | 446 (8.1%) | 27 (6.1%) |
| Total | 31,612 (51.8%) | 2,371 (7.5%) |
Employment Status by Educational Attainment in Valencia County
According to labor force statistics for Valencia County, 65.5% of individuals (25,018) out of the total population between 25 and 64 years of age (38,196) are in the labor force, with 5.8% or 1,451 of them being unemployed. The group with the highest labor force participation rate are those with the educational attainment of bachelor's degree or higher, with 80.4% or 6,343 individuals in the labor force. Within the labor force, individuals with less than high school education have the highest percentage of unemployment, with 8.4% or 231 of them being unemployed.
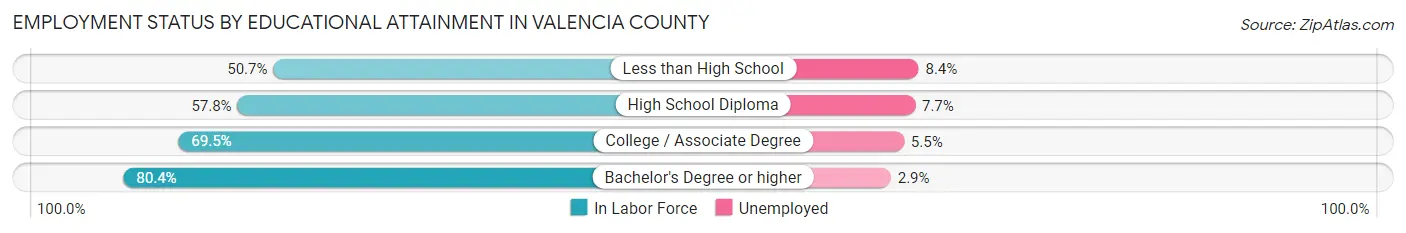
| Educational Attainment | In Labor Force | Unemployed |
| Less than High School | 2,750 (50.7%) | 456 (8.4%) |
| High School Diploma | 6,663 (57.8%) | 888 (7.7%) |
| College / Associate Degree | 9,281 (69.5%) | 734 (5.5%) |
| Bachelor's Degree or higher | 6,343 (80.4%) | 229 (2.9%) |
| Total | 25,018 (65.5%) | 2,215 (5.8%) |
Employment Occupations by Sex in Valencia County
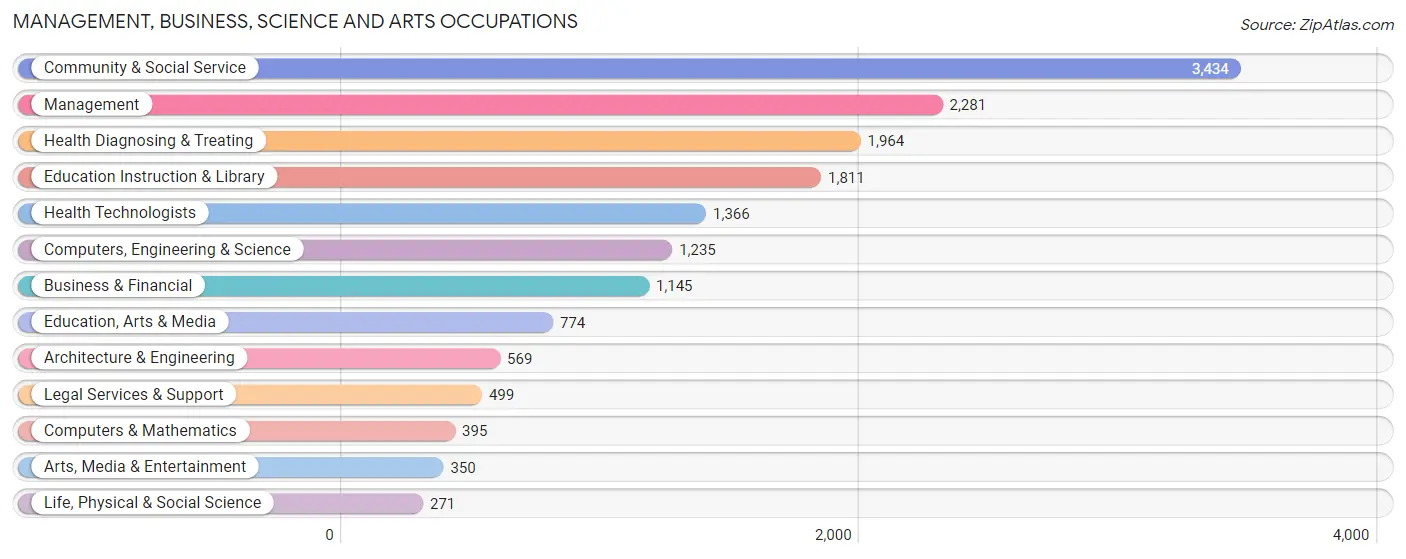
Management, Business, Science and Arts Occupations
The most common Management, Business, Science and Arts occupations in Valencia County are Community & Social Service (3,434 | 11.8%), Management (2,281 | 7.8%), Health Diagnosing & Treating (1,964 | 6.7%), Education Instruction & Library (1,811 | 6.2%), and Health Technologists (1,366 | 4.7%).
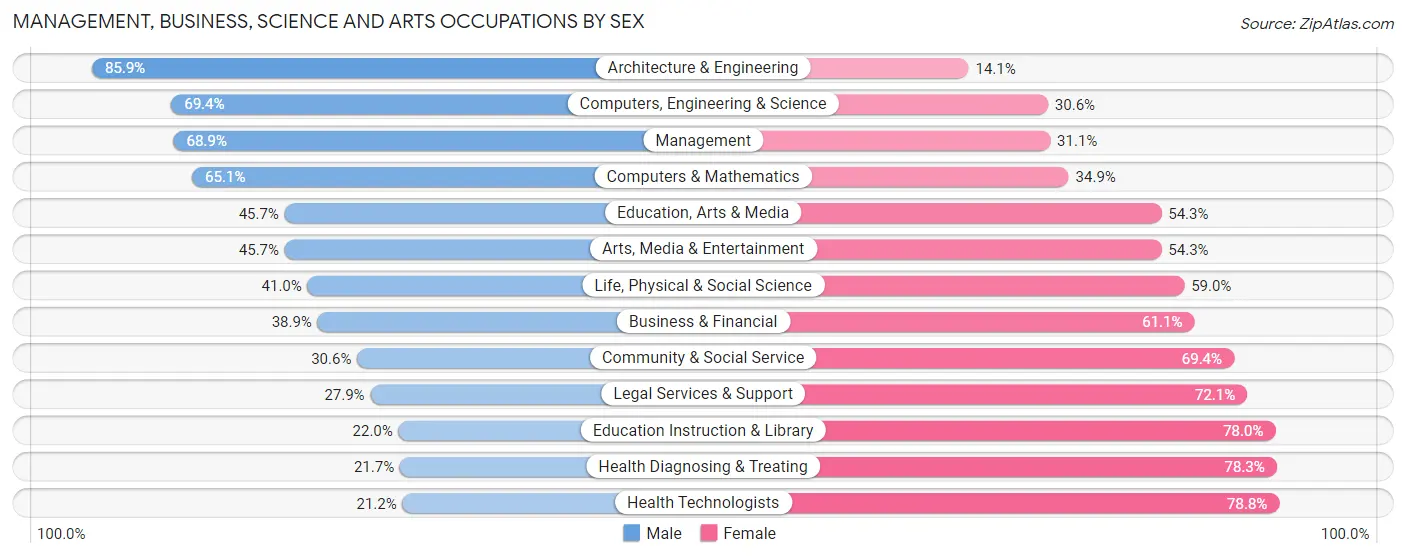
Management, Business, Science and Arts Occupations by Sex
Within the Management, Business, Science and Arts occupations in Valencia County, the most male-oriented occupations are Architecture & Engineering (85.9%), Computers, Engineering & Science (69.4%), and Management (68.9%), while the most female-oriented occupations are Health Technologists (78.8%), Health Diagnosing & Treating (78.3%), and Education Instruction & Library (78.0%).
| Occupation | Male | Female |
| Management | 1,572 (68.9%) | 709 (31.1%) |
| Business & Financial | 445 (38.9%) | 700 (61.1%) |
| Computers, Engineering & Science | 857 (69.4%) | 378 (30.6%) |
| Computers & Mathematics | 257 (65.1%) | 138 (34.9%) |
| Architecture & Engineering | 489 (85.9%) | 80 (14.1%) |
| Life, Physical & Social Science | 111 (41.0%) | 160 (59.0%) |
| Community & Social Service | 1,051 (30.6%) | 2,383 (69.4%) |
| Education, Arts & Media | 354 (45.7%) | 420 (54.3%) |
| Legal Services & Support | 139 (27.9%) | 360 (72.1%) |
| Education Instruction & Library | 398 (22.0%) | 1,413 (78.0%) |
| Arts, Media & Entertainment | 160 (45.7%) | 190 (54.3%) |
| Health Diagnosing & Treating | 426 (21.7%) | 1,538 (78.3%) |
| Health Technologists | 289 (21.2%) | 1,077 (78.8%) |
| Total (Category) | 4,351 (43.2%) | 5,708 (56.8%) |
| Total (Overall) | 15,040 (51.6%) | 14,089 (48.4%) |
Services Occupations
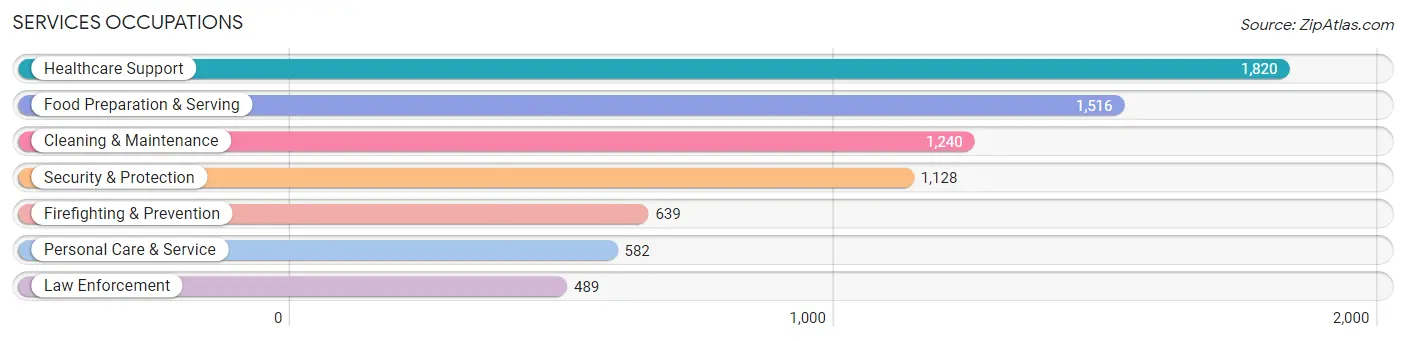
The most common Services occupations in Valencia County are Healthcare Support (1,820 | 6.2%), Food Preparation & Serving (1,516 | 5.2%), Cleaning & Maintenance (1,240 | 4.3%), Security & Protection (1,128 | 3.9%), and Firefighting & Prevention (639 | 2.2%).
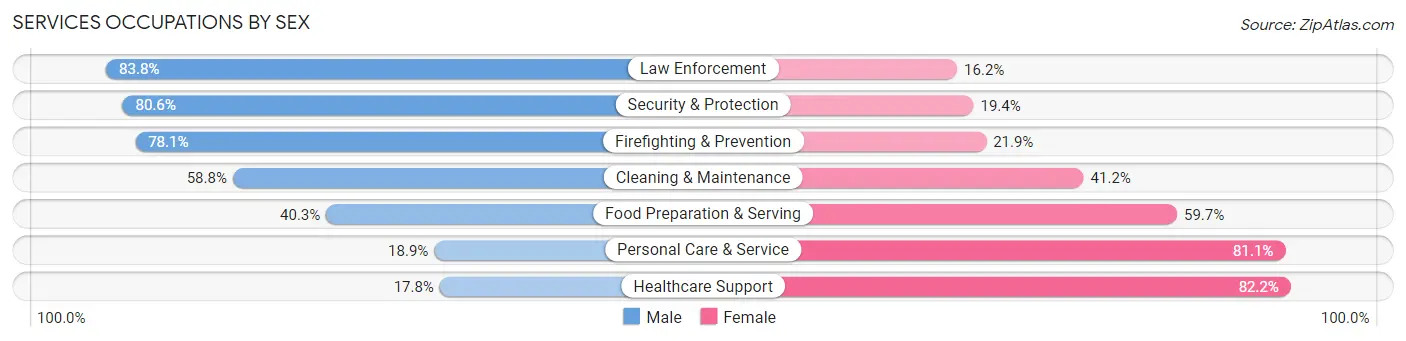
Services Occupations by Sex
Within the Services occupations in Valencia County, the most male-oriented occupations are Law Enforcement (83.8%), Security & Protection (80.6%), and Firefighting & Prevention (78.1%), while the most female-oriented occupations are Healthcare Support (82.2%), Personal Care & Service (81.1%), and Food Preparation & Serving (59.7%).
| Occupation | Male | Female |
| Healthcare Support | 324 (17.8%) | 1,496 (82.2%) |
| Security & Protection | 909 (80.6%) | 219 (19.4%) |
| Firefighting & Prevention | 499 (78.1%) | 140 (21.9%) |
| Law Enforcement | 410 (83.8%) | 79 (16.2%) |
| Food Preparation & Serving | 611 (40.3%) | 905 (59.7%) |
| Cleaning & Maintenance | 729 (58.8%) | 511 (41.2%) |
| Personal Care & Service | 110 (18.9%) | 472 (81.1%) |
| Total (Category) | 2,683 (42.7%) | 3,603 (57.3%) |
| Total (Overall) | 15,040 (51.6%) | 14,089 (48.4%) |
Sales and Office Occupations
The most common Sales and Office occupations in Valencia County are Office & Administration (3,553 | 12.2%), and Sales & Related (2,100 | 7.2%).

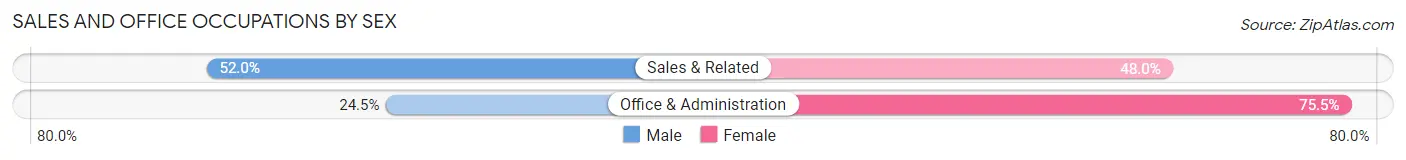
Sales and Office Occupations by Sex
| Occupation | Male | Female |
| Sales & Related | 1,092 (52.0%) | 1,008 (48.0%) |
| Office & Administration | 871 (24.5%) | 2,682 (75.5%) |
| Total (Category) | 1,963 (34.7%) | 3,690 (65.3%) |
| Total (Overall) | 15,040 (51.6%) | 14,089 (48.4%) |
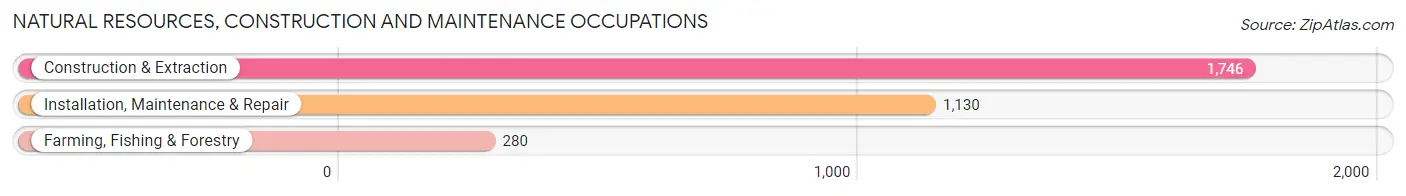
Natural Resources, Construction and Maintenance Occupations
The most common Natural Resources, Construction and Maintenance occupations in Valencia County are Construction & Extraction (1,746 | 6.0%), Installation, Maintenance & Repair (1,130 | 3.9%), and Farming, Fishing & Forestry (280 | 1.0%).
Natural Resources, Construction and Maintenance Occupations by Sex
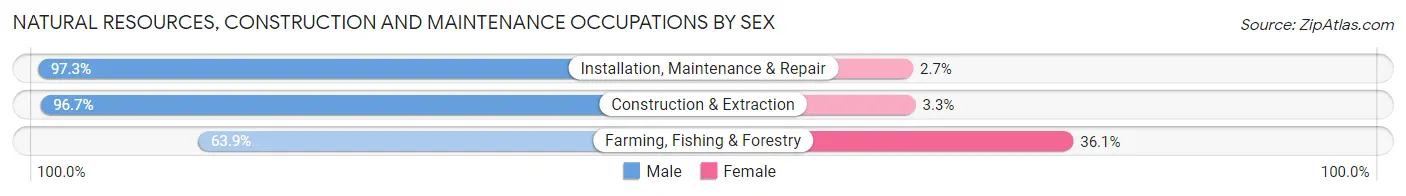
| Occupation | Male | Female |
| Farming, Fishing & Forestry | 179 (63.9%) | 101 (36.1%) |
| Construction & Extraction | 1,689 (96.7%) | 57 (3.3%) |
| Installation, Maintenance & Repair | 1,099 (97.3%) | 31 (2.7%) |
| Total (Category) | 2,967 (94.0%) | 189 (6.0%) |
| Total (Overall) | 15,040 (51.6%) | 14,089 (48.4%) |
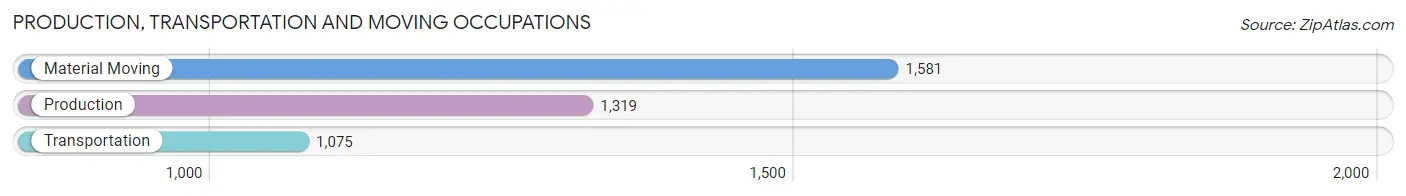
Production, Transportation and Moving Occupations
The most common Production, Transportation and Moving occupations in Valencia County are Material Moving (1,581 | 5.4%), Production (1,319 | 4.5%), and Transportation (1,075 | 3.7%).
Production, Transportation and Moving Occupations by Sex
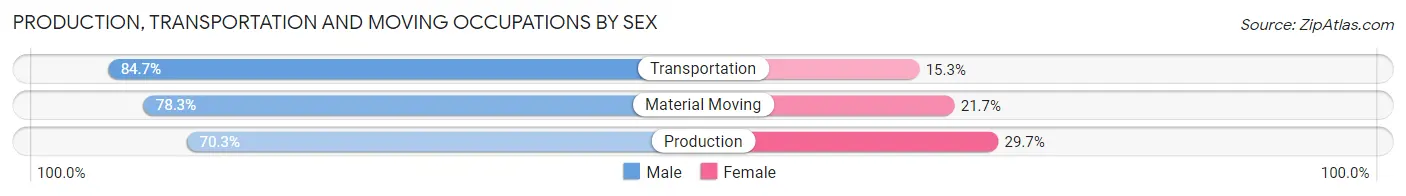
| Occupation | Male | Female |
| Production | 927 (70.3%) | 392 (29.7%) |
| Transportation | 911 (84.7%) | 164 (15.3%) |
| Material Moving | 1,238 (78.3%) | 343 (21.7%) |
| Total (Category) | 3,076 (77.4%) | 899 (22.6%) |
| Total (Overall) | 15,040 (51.6%) | 14,089 (48.4%) |
Employment Industries by Sex in Valencia County
Employment Industries in Valencia County
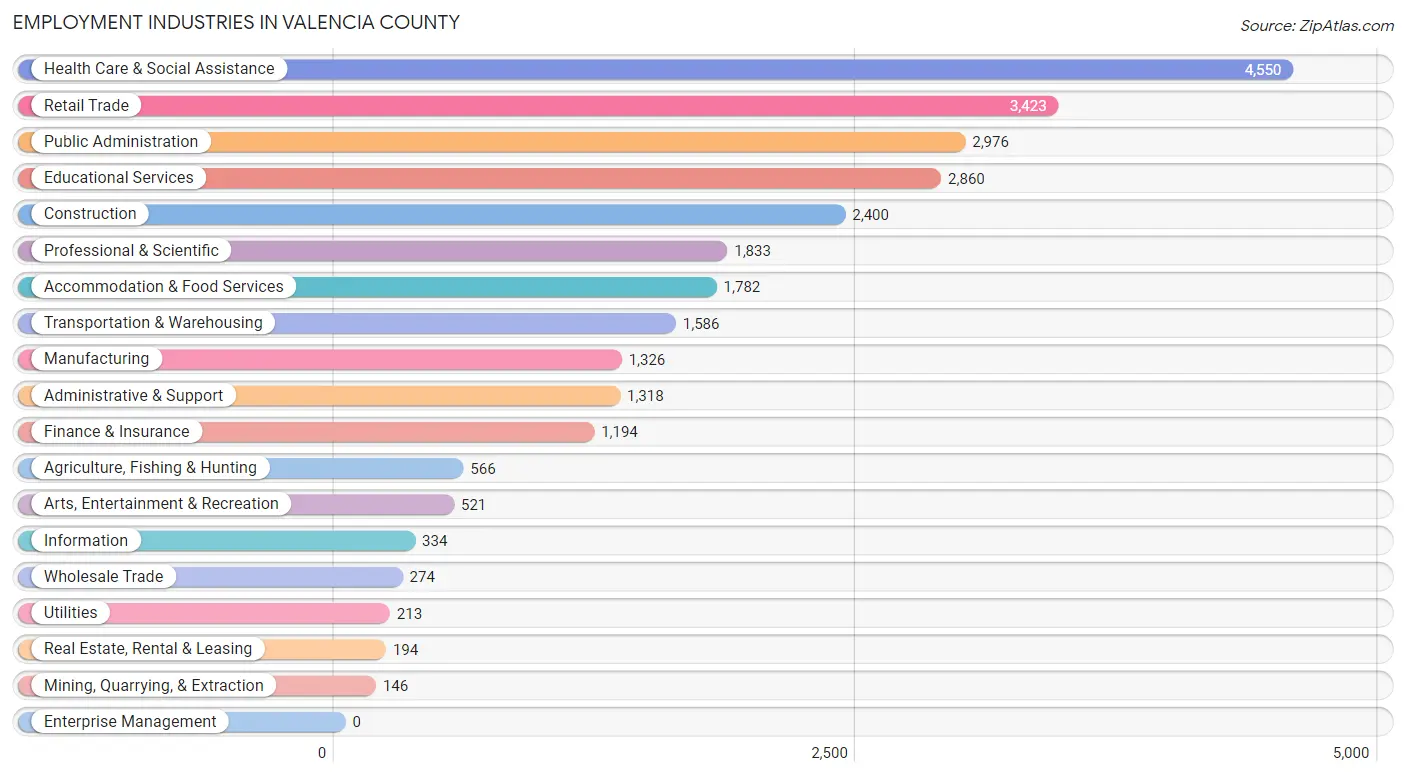
The major employment industries in Valencia County include Health Care & Social Assistance (4,550 | 15.6%), Retail Trade (3,423 | 11.7%), Public Administration (2,976 | 10.2%), Educational Services (2,860 | 9.8%), and Construction (2,400 | 8.2%).
Employment Industries by Sex in Valencia County
The Valencia County industries that see more men than women are Utilities (96.7%), Construction (87.3%), and Wholesale Trade (87.2%), whereas the industries that tend to have a higher number of women are Health Care & Social Assistance (83.3%), Educational Services (75.6%), and Finance & Insurance (69.3%).
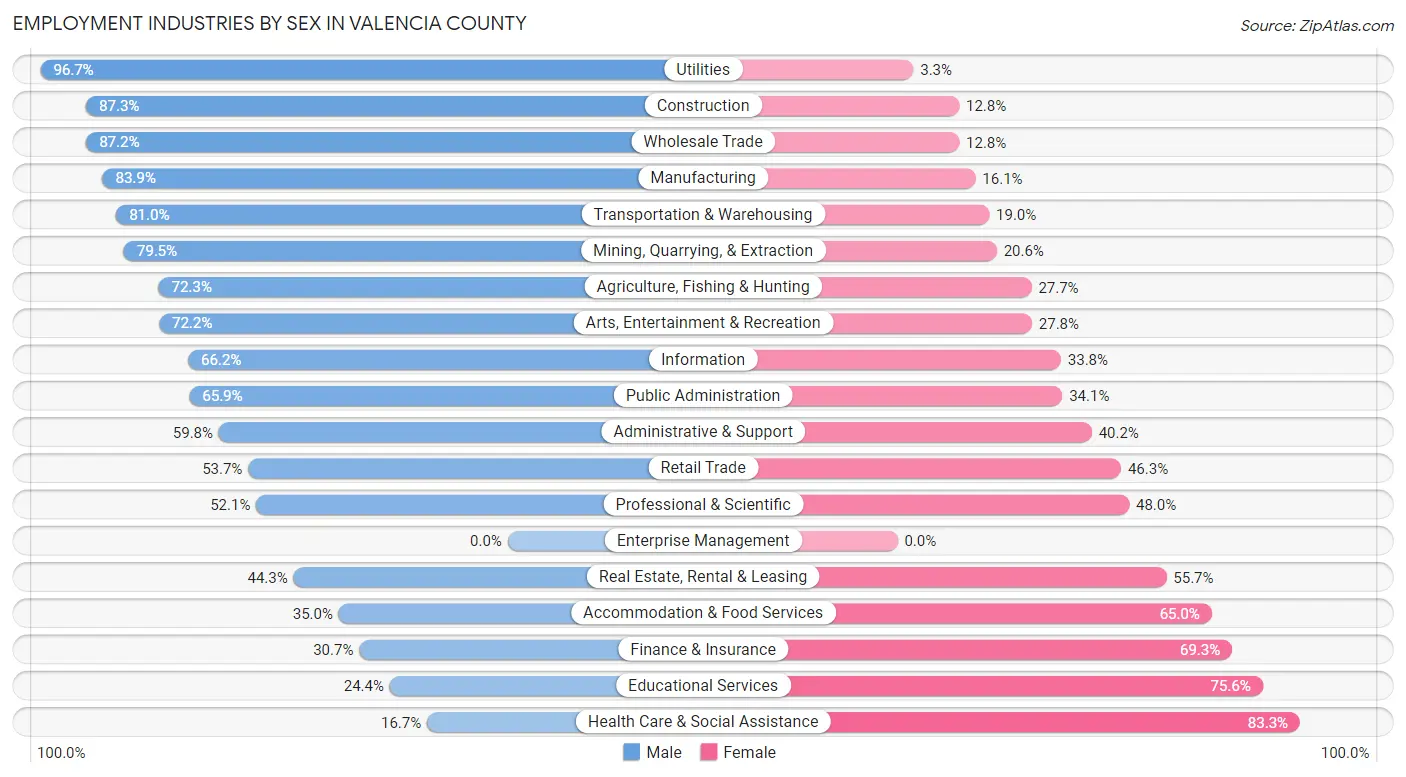
| Industry | Male | Female |
| Agriculture, Fishing & Hunting | 409 (72.3%) | 157 (27.7%) |
| Mining, Quarrying, & Extraction | 116 (79.4%) | 30 (20.5%) |
| Construction | 2,094 (87.3%) | 306 (12.8%) |
| Manufacturing | 1,112 (83.9%) | 214 (16.1%) |
| Wholesale Trade | 239 (87.2%) | 35 (12.8%) |
| Retail Trade | 1,839 (53.7%) | 1,584 (46.3%) |
| Transportation & Warehousing | 1,285 (81.0%) | 301 (19.0%) |
| Utilities | 206 (96.7%) | 7 (3.3%) |
| Information | 221 (66.2%) | 113 (33.8%) |
| Finance & Insurance | 367 (30.7%) | 827 (69.3%) |
| Real Estate, Rental & Leasing | 86 (44.3%) | 108 (55.7%) |
| Professional & Scientific | 954 (52.0%) | 879 (47.9%) |
| Enterprise Management | 0 (0.0%) | 0 (0.0%) |
| Administrative & Support | 788 (59.8%) | 530 (40.2%) |
| Educational Services | 698 (24.4%) | 2,162 (75.6%) |
| Health Care & Social Assistance | 760 (16.7%) | 3,790 (83.3%) |
| Arts, Entertainment & Recreation | 376 (72.2%) | 145 (27.8%) |
| Accommodation & Food Services | 623 (35.0%) | 1,159 (65.0%) |
| Public Administration | 1,961 (65.9%) | 1,015 (34.1%) |
| Total | 15,040 (51.6%) | 14,089 (48.4%) |
Education in Valencia County
School Enrollment in Valencia County
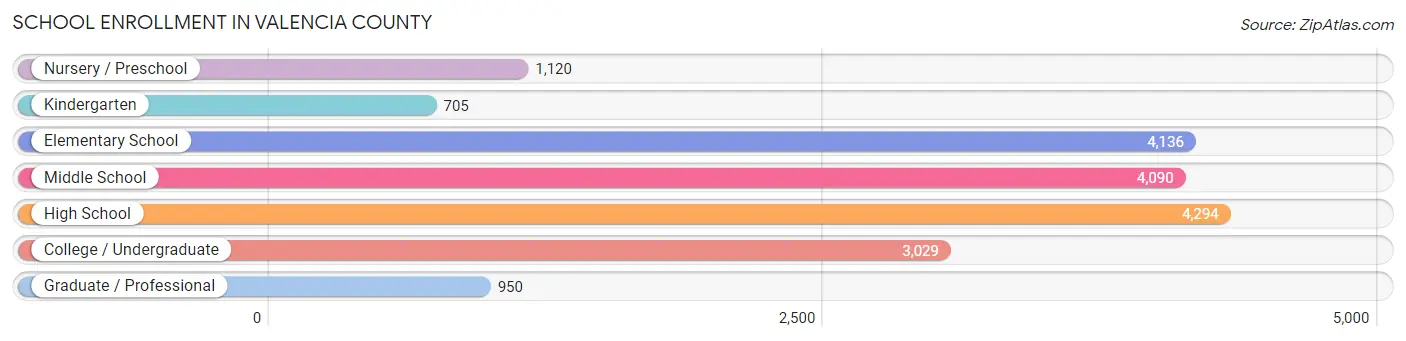
The most common levels of schooling among the 18,324 students in Valencia County are high school (4,294 | 23.4%), elementary school (4,136 | 22.6%), and middle school (4,090 | 22.3%).
| School Level | # Students | % Students |
| Nursery / Preschool | 1,120 | 6.1% |
| Kindergarten | 705 | 3.8% |
| Elementary School | 4,136 | 22.6% |
| Middle School | 4,090 | 22.3% |
| High School | 4,294 | 23.4% |
| College / Undergraduate | 3,029 | 16.5% |
| Graduate / Professional | 950 | 5.2% |
| Total | 18,324 | 100.0% |
School Enrollment by Age by Funding Source in Valencia County
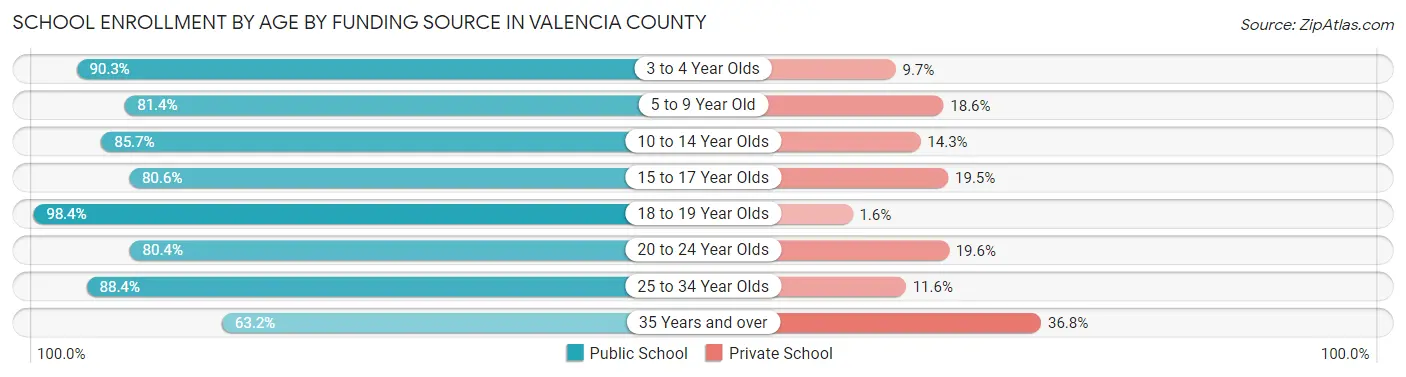
Out of a total of 18,324 students who are enrolled in schools in Valencia County, 3,188 (17.4%) attend a private institution, while the remaining 15,136 (82.6%) are enrolled in public schools. The age group of 35 years and over has the highest likelihood of being enrolled in private schools, with 561 (36.8% in the age bracket) enrolled. Conversely, the age group of 18 to 19 year olds has the lowest likelihood of being enrolled in a private school, with 1,150 (98.4% in the age bracket) attending a public institution.
| Age Bracket | Public School | Private School |
| 3 to 4 Year Olds | 711 (90.3%) | 76 (9.7%) |
| 5 to 9 Year Old | 3,963 (81.4%) | 904 (18.6%) |
| 10 to 14 Year Olds | 4,079 (85.7%) | 680 (14.3%) |
| 15 to 17 Year Olds | 2,261 (80.5%) | 546 (19.5%) |
| 18 to 19 Year Olds | 1,150 (98.4%) | 19 (1.6%) |
| 20 to 24 Year Olds | 1,221 (80.4%) | 297 (19.6%) |
| 25 to 34 Year Olds | 788 (88.4%) | 103 (11.6%) |
| 35 Years and over | 965 (63.2%) | 561 (36.8%) |
| Total | 15,136 (82.6%) | 3,188 (17.4%) |
Educational Attainment by Field of Study in Valencia County
Education (2,357 | 19.5%), business (1,984 | 16.4%), science & technology (1,580 | 13.1%), physical & health sciences (823 | 6.8%), and social sciences (800 | 6.6%) are the most common fields of study among 12,084 individuals in Valencia County who have obtained a bachelor's degree or higher.
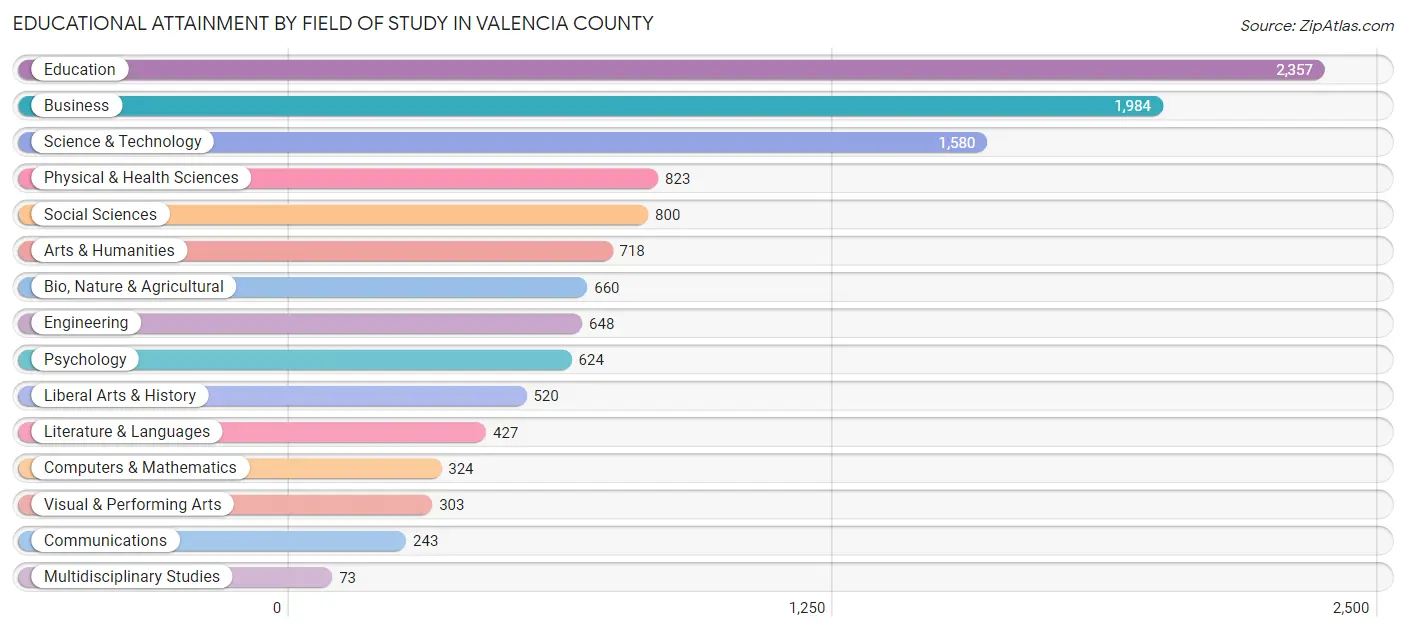
| Field of Study | # Graduates | % Graduates |
| Computers & Mathematics | 324 | 2.7% |
| Bio, Nature & Agricultural | 660 | 5.5% |
| Physical & Health Sciences | 823 | 6.8% |
| Psychology | 624 | 5.2% |
| Social Sciences | 800 | 6.6% |
| Engineering | 648 | 5.4% |
| Multidisciplinary Studies | 73 | 0.6% |
| Science & Technology | 1,580 | 13.1% |
| Business | 1,984 | 16.4% |
| Education | 2,357 | 19.5% |
| Literature & Languages | 427 | 3.5% |
| Liberal Arts & History | 520 | 4.3% |
| Visual & Performing Arts | 303 | 2.5% |
| Communications | 243 | 2.0% |
| Arts & Humanities | 718 | 5.9% |
| Total | 12,084 | 100.0% |
Transportation & Commute in Valencia County
Vehicle Availability by Sex in Valencia County
The most prevalent vehicle ownership categories in Valencia County are males with 2 vehicles (5,028, accounting for 33.5%) and females with 2 vehicles (4,327, making up 36.6%).
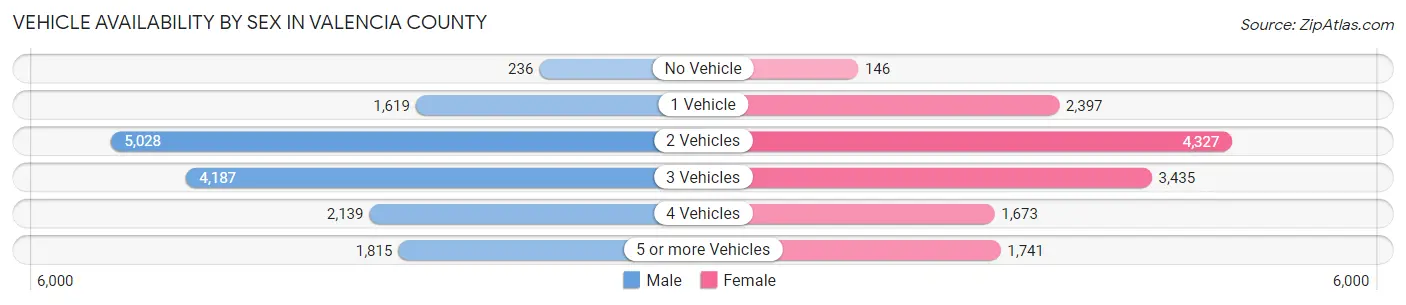
| Vehicles Available | Male | Female |
| No Vehicle | 236 (1.6%) | 146 (1.1%) |
| 1 Vehicle | 1,619 (10.8%) | 2,397 (17.5%) |
| 2 Vehicles | 5,028 (33.5%) | 4,327 (31.5%) |
| 3 Vehicles | 4,187 (27.9%) | 3,435 (25.0%) |
| 4 Vehicles | 2,139 (14.2%) | 1,673 (12.2%) |
| 5 or more Vehicles | 1,815 (12.1%) | 1,741 (12.7%) |
| Total | 15,024 (100.0%) | 13,719 (100.0%) |
Commute Time in Valencia County
The most frequently occuring commute durations in Valencia County are 45 to 59 minutes (4,025 commuters, 15.1%), 30 to 34 minutes (3,584 commuters, 13.5%), and 15 to 19 minutes (3,293 commuters, 12.4%).
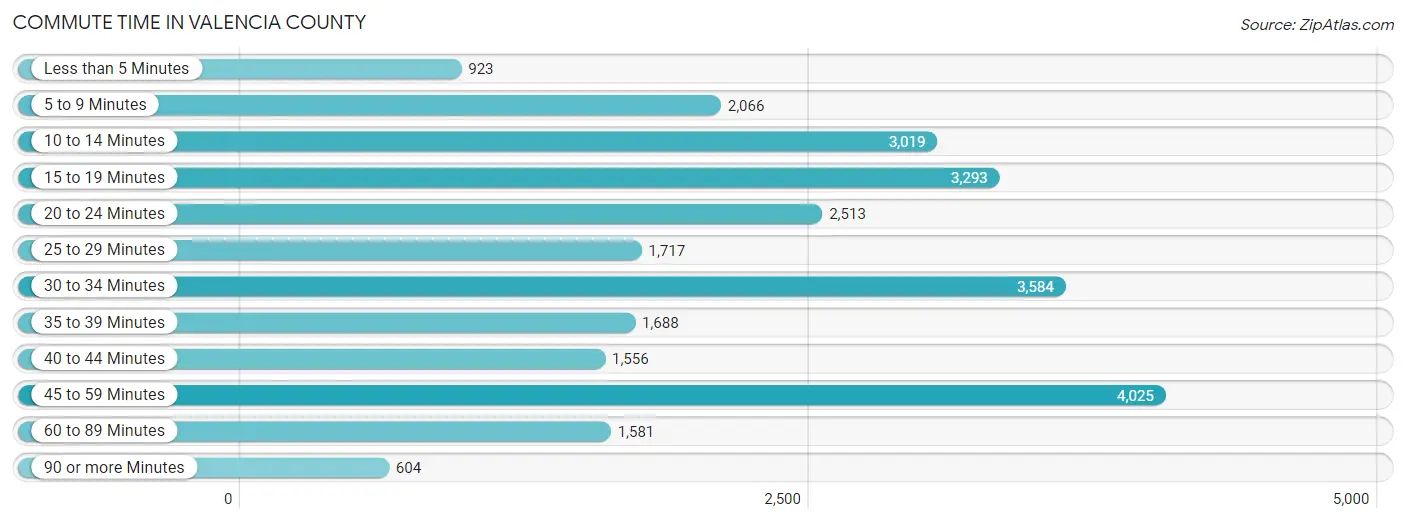
| Commute Time | # Commuters | % Commuters |
| Less than 5 Minutes | 923 | 3.5% |
| 5 to 9 Minutes | 2,066 | 7.8% |
| 10 to 14 Minutes | 3,019 | 11.4% |
| 15 to 19 Minutes | 3,293 | 12.4% |
| 20 to 24 Minutes | 2,513 | 9.5% |
| 25 to 29 Minutes | 1,717 | 6.5% |
| 30 to 34 Minutes | 3,584 | 13.5% |
| 35 to 39 Minutes | 1,688 | 6.4% |
| 40 to 44 Minutes | 1,556 | 5.9% |
| 45 to 59 Minutes | 4,025 | 15.1% |
| 60 to 89 Minutes | 1,581 | 5.9% |
| 90 or more Minutes | 604 | 2.3% |
Commute Time by Sex in Valencia County
The most common commute times in Valencia County are 45 to 59 minutes (2,340 commuters, 16.5%) for males and 45 to 59 minutes (1,685 commuters, 13.6%) for females.
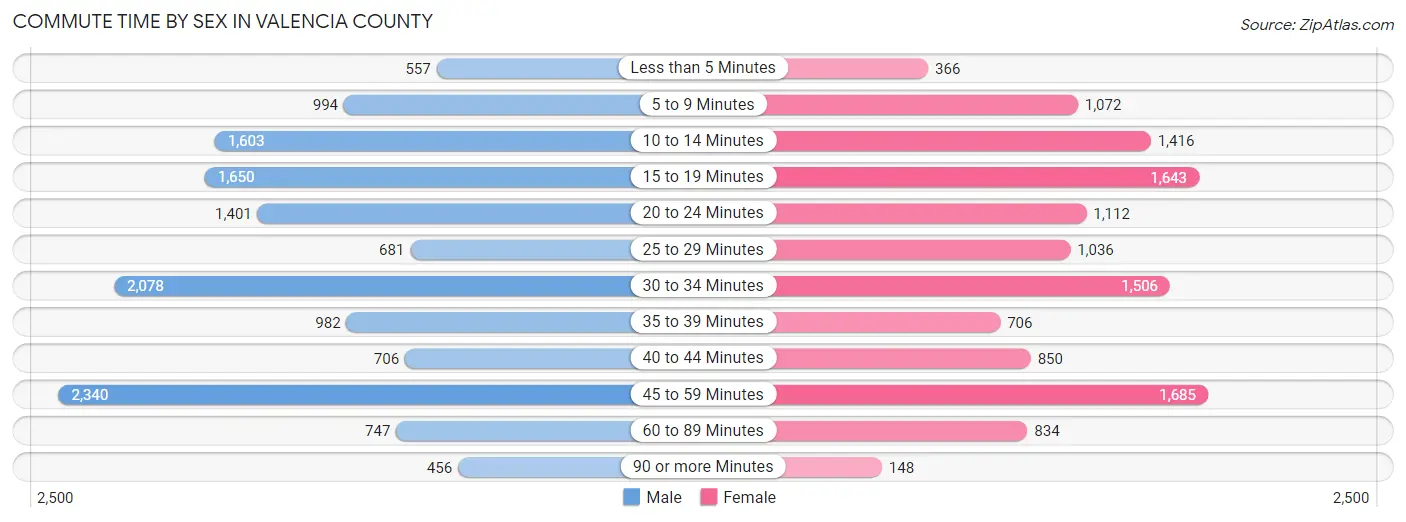
| Commute Time | Male | Female |
| Less than 5 Minutes | 557 (3.9%) | 366 (3.0%) |
| 5 to 9 Minutes | 994 (7.0%) | 1,072 (8.7%) |
| 10 to 14 Minutes | 1,603 (11.3%) | 1,416 (11.4%) |
| 15 to 19 Minutes | 1,650 (11.6%) | 1,643 (13.3%) |
| 20 to 24 Minutes | 1,401 (9.9%) | 1,112 (9.0%) |
| 25 to 29 Minutes | 681 (4.8%) | 1,036 (8.4%) |
| 30 to 34 Minutes | 2,078 (14.6%) | 1,506 (12.2%) |
| 35 to 39 Minutes | 982 (6.9%) | 706 (5.7%) |
| 40 to 44 Minutes | 706 (5.0%) | 850 (6.9%) |
| 45 to 59 Minutes | 2,340 (16.5%) | 1,685 (13.6%) |
| 60 to 89 Minutes | 747 (5.3%) | 834 (6.7%) |
| 90 or more Minutes | 456 (3.2%) | 148 (1.2%) |
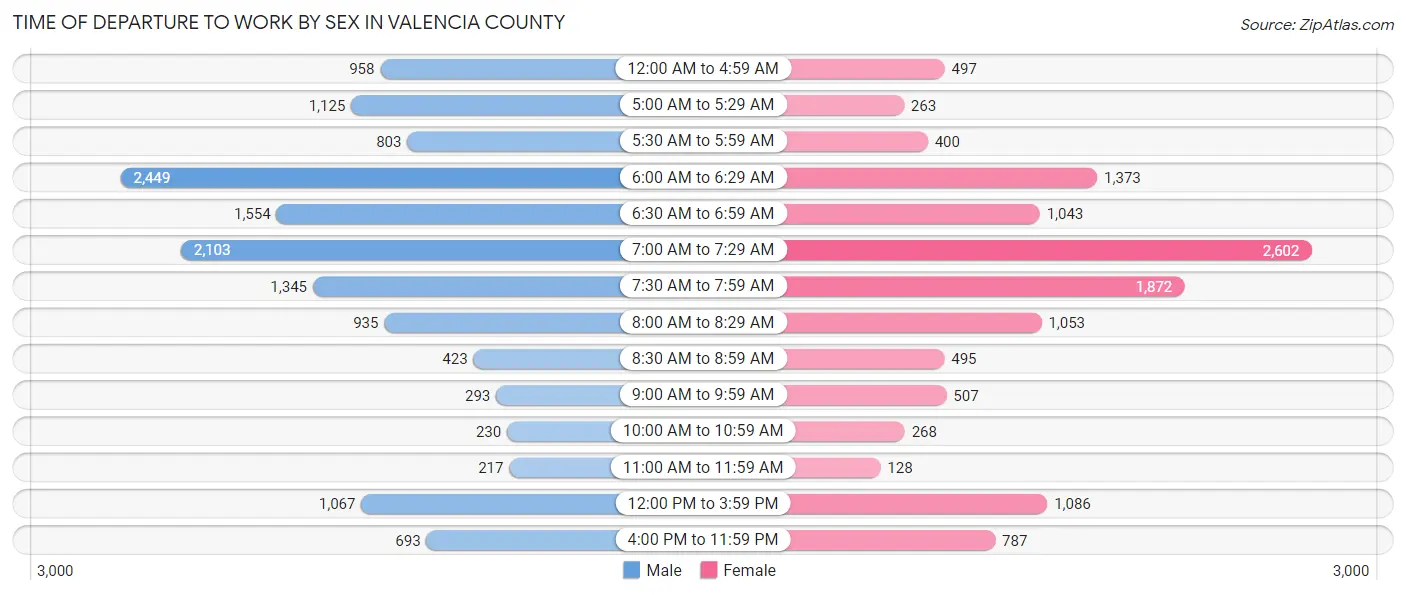
Time of Departure to Work by Sex in Valencia County
The most frequent times of departure to work in Valencia County are 6:00 AM to 6:29 AM (2,449, 17.2%) for males and 7:00 AM to 7:29 AM (2,602, 21.0%) for females.
| Time of Departure | Male | Female |
| 12:00 AM to 4:59 AM | 958 (6.8%) | 497 (4.0%) |
| 5:00 AM to 5:29 AM | 1,125 (7.9%) | 263 (2.1%) |
| 5:30 AM to 5:59 AM | 803 (5.7%) | 400 (3.2%) |
| 6:00 AM to 6:29 AM | 2,449 (17.2%) | 1,373 (11.1%) |
| 6:30 AM to 6:59 AM | 1,554 (11.0%) | 1,043 (8.4%) |
| 7:00 AM to 7:29 AM | 2,103 (14.8%) | 2,602 (21.0%) |
| 7:30 AM to 7:59 AM | 1,345 (9.5%) | 1,872 (15.1%) |
| 8:00 AM to 8:29 AM | 935 (6.6%) | 1,053 (8.5%) |
| 8:30 AM to 8:59 AM | 423 (3.0%) | 495 (4.0%) |
| 9:00 AM to 9:59 AM | 293 (2.1%) | 507 (4.1%) |
| 10:00 AM to 10:59 AM | 230 (1.6%) | 268 (2.2%) |
| 11:00 AM to 11:59 AM | 217 (1.5%) | 128 (1.0%) |
| 12:00 PM to 3:59 PM | 1,067 (7.5%) | 1,086 (8.8%) |
| 4:00 PM to 11:59 PM | 693 (4.9%) | 787 (6.4%) |
| Total | 14,195 (100.0%) | 12,374 (100.0%) |
Housing Occupancy in Valencia County
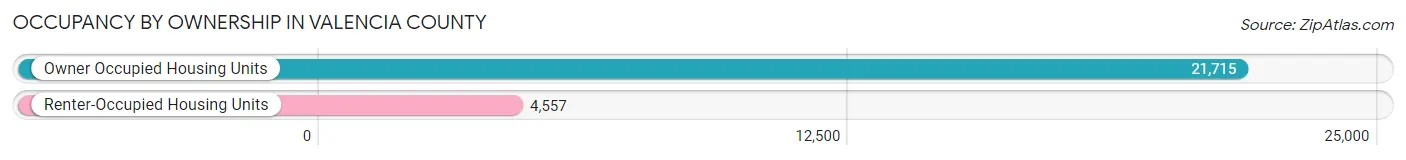
Occupancy by Ownership in Valencia County
Of the total 26,272 dwellings in Valencia County, owner-occupied units account for 21,715 (82.7%), while renter-occupied units make up 4,557 (17.3%).
| Occupancy | # Housing Units | % Housing Units |
| Owner Occupied Housing Units | 21,715 | 82.7% |
| Renter-Occupied Housing Units | 4,557 | 17.3% |
| Total Occupied Housing Units | 26,272 | 100.0% |
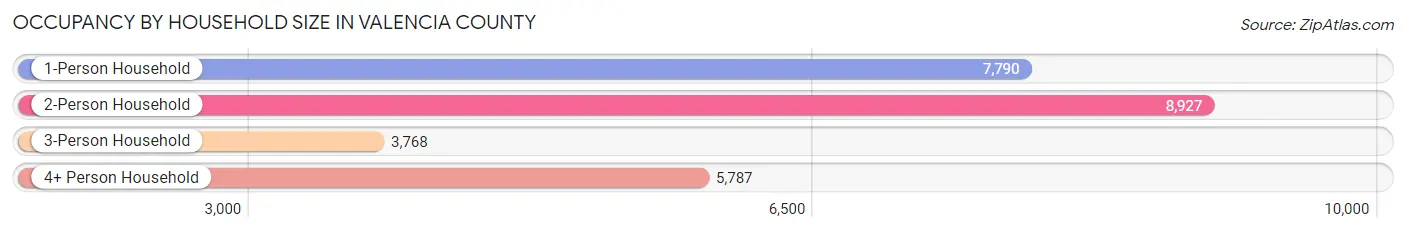
Occupancy by Household Size in Valencia County
| Household Size | # Housing Units | % Housing Units |
| 1-Person Household | 7,790 | 29.6% |
| 2-Person Household | 8,927 | 34.0% |
| 3-Person Household | 3,768 | 14.3% |
| 4+ Person Household | 5,787 | 22.0% |
| Total Housing Units | 26,272 | 100.0% |
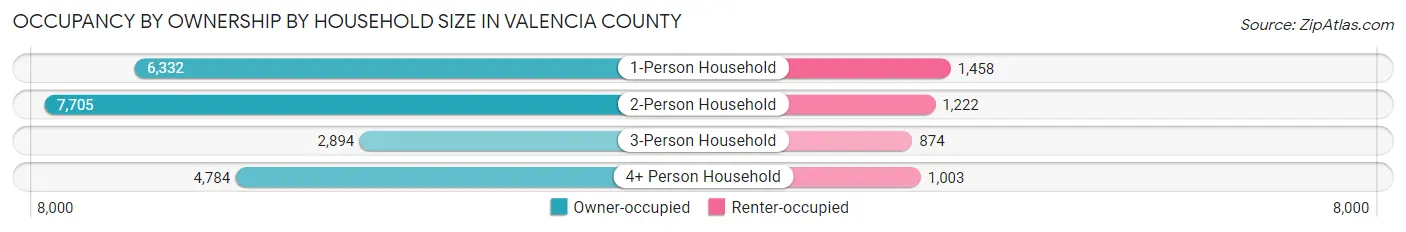
Occupancy by Ownership by Household Size in Valencia County
| Household Size | Owner-occupied | Renter-occupied |
| 1-Person Household | 6,332 (81.3%) | 1,458 (18.7%) |
| 2-Person Household | 7,705 (86.3%) | 1,222 (13.7%) |
| 3-Person Household | 2,894 (76.8%) | 874 (23.2%) |
| 4+ Person Household | 4,784 (82.7%) | 1,003 (17.3%) |
| Total Housing Units | 21,715 (82.7%) | 4,557 (17.3%) |
Occupancy by Educational Attainment in Valencia County
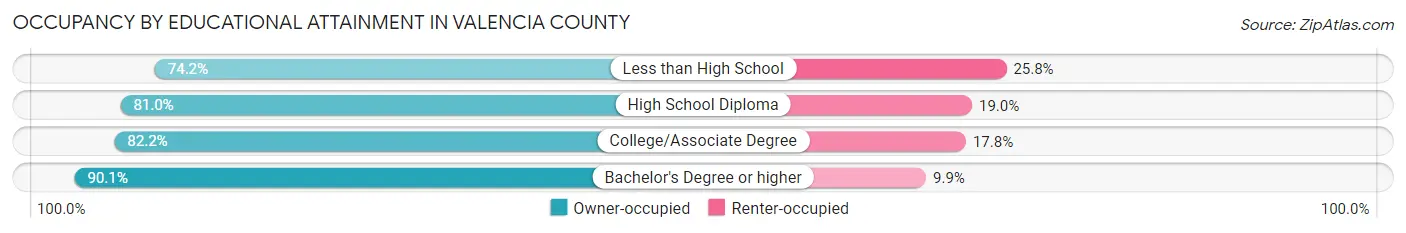
| Household Size | Owner-occupied | Renter-occupied |
| Less than High School | 2,559 (74.2%) | 891 (25.8%) |
| High School Diploma | 5,923 (81.0%) | 1,390 (19.0%) |
| College/Associate Degree | 7,697 (82.2%) | 1,668 (17.8%) |
| Bachelor's Degree or higher | 5,536 (90.1%) | 608 (9.9%) |
Occupancy by Age of Householder in Valencia County
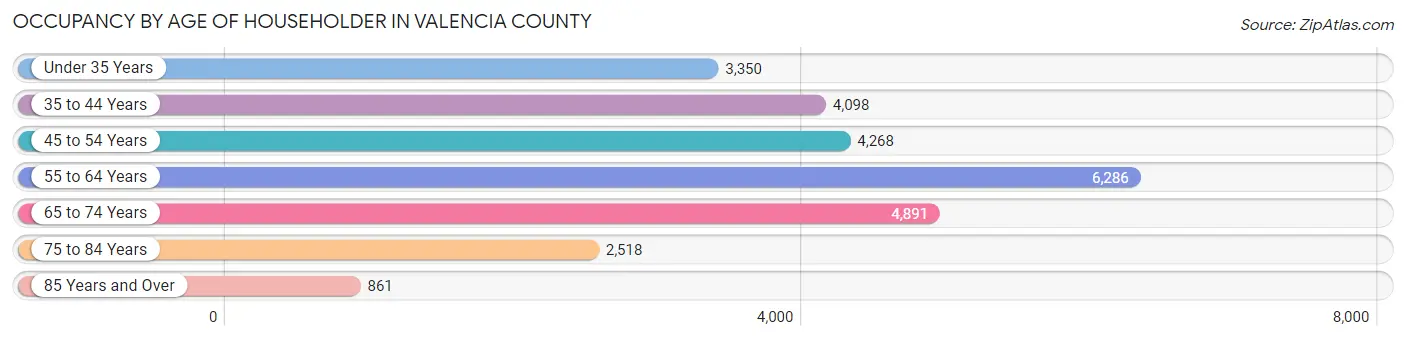
| Age Bracket | # Households | % Households |
| Under 35 Years | 3,350 | 12.8% |
| 35 to 44 Years | 4,098 | 15.6% |
| 45 to 54 Years | 4,268 | 16.3% |
| 55 to 64 Years | 6,286 | 23.9% |
| 65 to 74 Years | 4,891 | 18.6% |
| 75 to 84 Years | 2,518 | 9.6% |
| 85 Years and Over | 861 | 3.3% |
| Total | 26,272 | 100.0% |
Housing Finances in Valencia County
Median Income by Occupancy in Valencia County
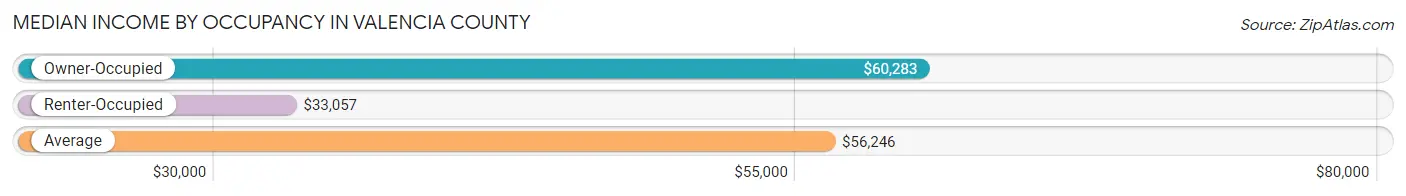
| Occupancy Type | # Households | Median Income |
| Owner-Occupied | 21,715 (82.7%) | $60,283 |
| Renter-Occupied | 4,557 (17.3%) | $33,057 |
| Average | 26,272 (100.0%) | $56,246 |
Occupancy by Householder Income Bracket in Valencia County
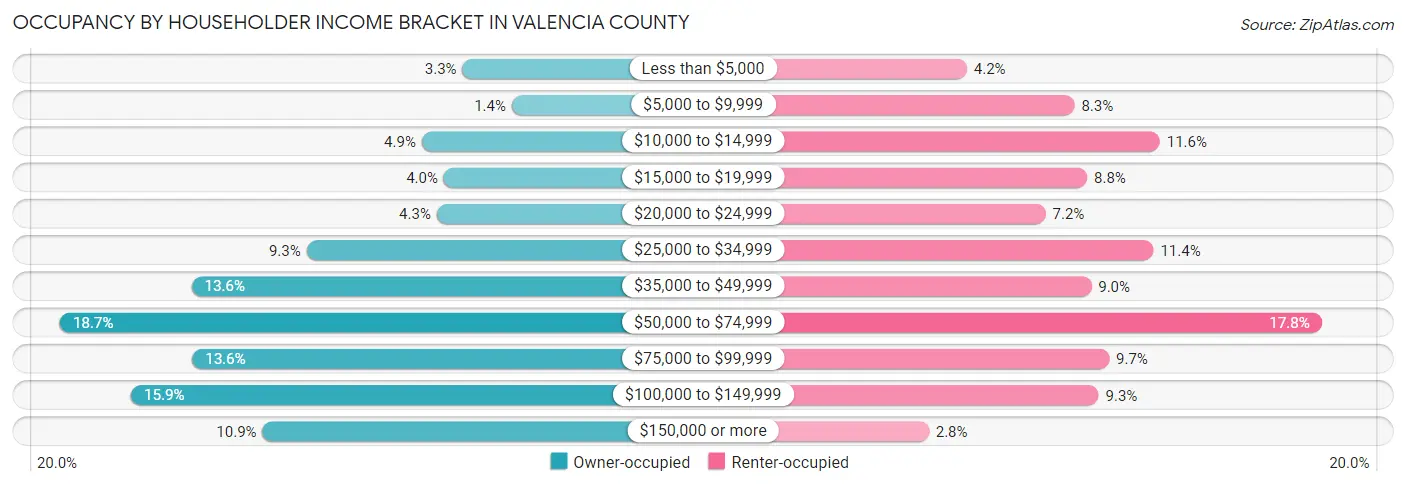
| Income Bracket | Owner-occupied | Renter-occupied |
| Less than $5,000 | 720 (3.3%) | 193 (4.2%) |
| $5,000 to $9,999 | 313 (1.4%) | 380 (8.3%) |
| $10,000 to $14,999 | 1,057 (4.9%) | 528 (11.6%) |
| $15,000 to $19,999 | 875 (4.0%) | 402 (8.8%) |
| $20,000 to $24,999 | 934 (4.3%) | 330 (7.2%) |
| $25,000 to $34,999 | 2,010 (9.3%) | 517 (11.4%) |
| $35,000 to $49,999 | 2,963 (13.6%) | 409 (9.0%) |
| $50,000 to $74,999 | 4,050 (18.6%) | 809 (17.7%) |
| $75,000 to $99,999 | 2,956 (13.6%) | 440 (9.7%) |
| $100,000 to $149,999 | 3,461 (15.9%) | 422 (9.3%) |
| $150,000 or more | 2,376 (10.9%) | 127 (2.8%) |
| Total | 21,715 (100.0%) | 4,557 (100.0%) |
Monthly Housing Cost Tiers in Valencia County
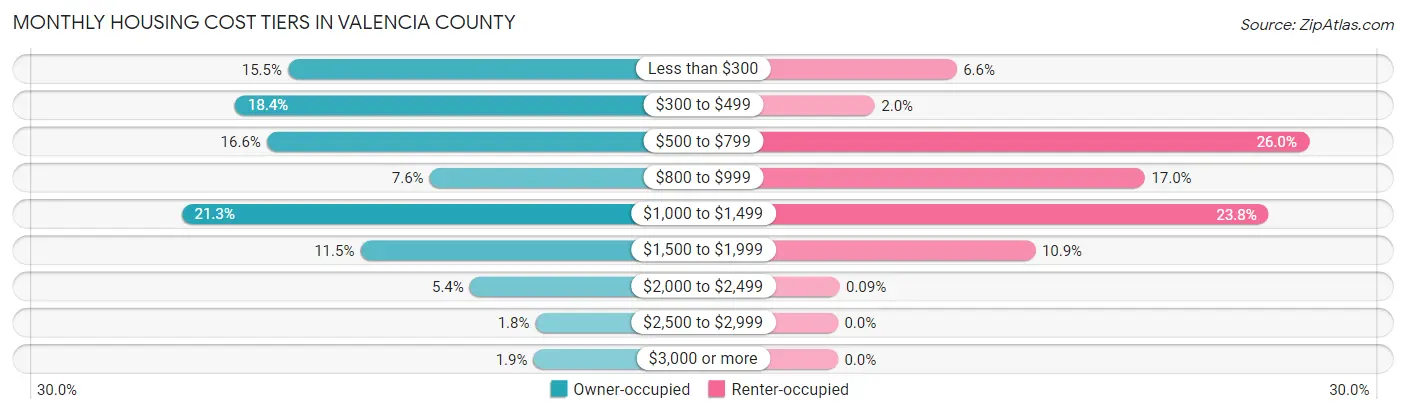
| Monthly Cost | Owner-occupied | Renter-occupied |
| Less than $300 | 3,358 (15.5%) | 299 (6.6%) |
| $300 to $499 | 3,991 (18.4%) | 93 (2.0%) |
| $500 to $799 | 3,611 (16.6%) | 1,186 (26.0%) |
| $800 to $999 | 1,658 (7.6%) | 773 (17.0%) |
| $1,000 to $1,499 | 4,632 (21.3%) | 1,085 (23.8%) |
| $1,500 to $1,999 | 2,489 (11.5%) | 497 (10.9%) |
| $2,000 to $2,499 | 1,176 (5.4%) | 4 (0.1%) |
| $2,500 to $2,999 | 388 (1.8%) | 0 (0.0%) |
| $3,000 or more | 412 (1.9%) | 0 (0.0%) |
| Total | 21,715 (100.0%) | 4,557 (100.0%) |
Physical Housing Characteristics in Valencia County
Housing Structures in Valencia County
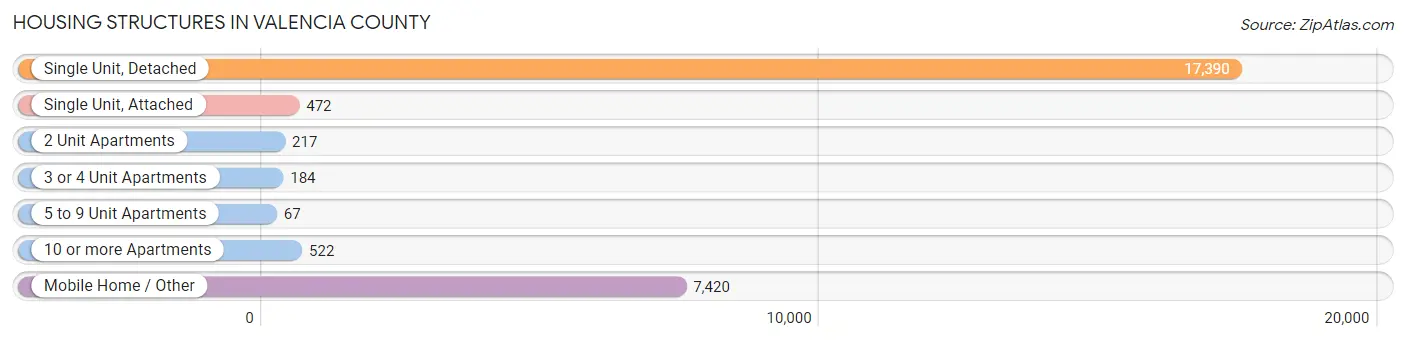
| Structure Type | # Housing Units | % Housing Units |
| Single Unit, Detached | 17,390 | 66.2% |
| Single Unit, Attached | 472 | 1.8% |
| 2 Unit Apartments | 217 | 0.8% |
| 3 or 4 Unit Apartments | 184 | 0.7% |
| 5 to 9 Unit Apartments | 67 | 0.3% |
| 10 or more Apartments | 522 | 2.0% |
| Mobile Home / Other | 7,420 | 28.2% |
| Total | 26,272 | 100.0% |
Housing Structures by Occupancy in Valencia County
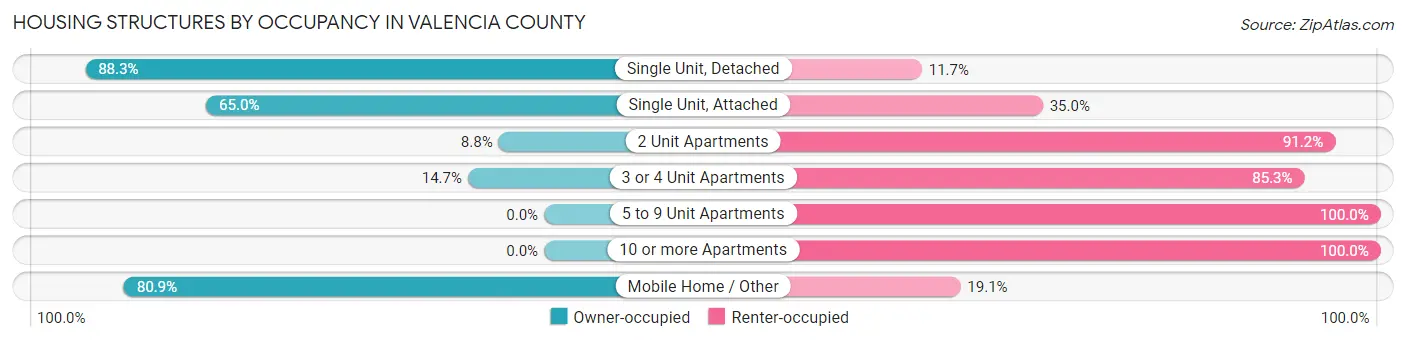
| Structure Type | Owner-occupied | Renter-occupied |
| Single Unit, Detached | 15,360 (88.3%) | 2,030 (11.7%) |
| Single Unit, Attached | 307 (65.0%) | 165 (35.0%) |
| 2 Unit Apartments | 19 (8.8%) | 198 (91.2%) |
| 3 or 4 Unit Apartments | 27 (14.7%) | 157 (85.3%) |
| 5 to 9 Unit Apartments | 0 (0.0%) | 67 (100.0%) |
| 10 or more Apartments | 0 (0.0%) | 522 (100.0%) |
| Mobile Home / Other | 6,002 (80.9%) | 1,418 (19.1%) |
| Total | 21,715 (82.7%) | 4,557 (17.3%) |
Housing Structures by Number of Rooms in Valencia County
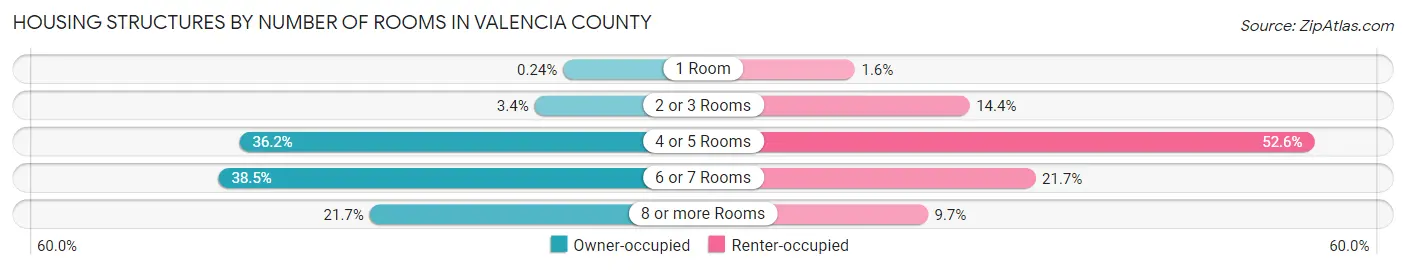
| Number of Rooms | Owner-occupied | Renter-occupied |
| 1 Room | 52 (0.2%) | 74 (1.6%) |
| 2 or 3 Rooms | 741 (3.4%) | 654 (14.3%) |
| 4 or 5 Rooms | 7,851 (36.1%) | 2,399 (52.6%) |
| 6 or 7 Rooms | 8,356 (38.5%) | 987 (21.7%) |
| 8 or more Rooms | 4,715 (21.7%) | 443 (9.7%) |
| Total | 21,715 (100.0%) | 4,557 (100.0%) |
Housing Structure by Heating Type in Valencia County
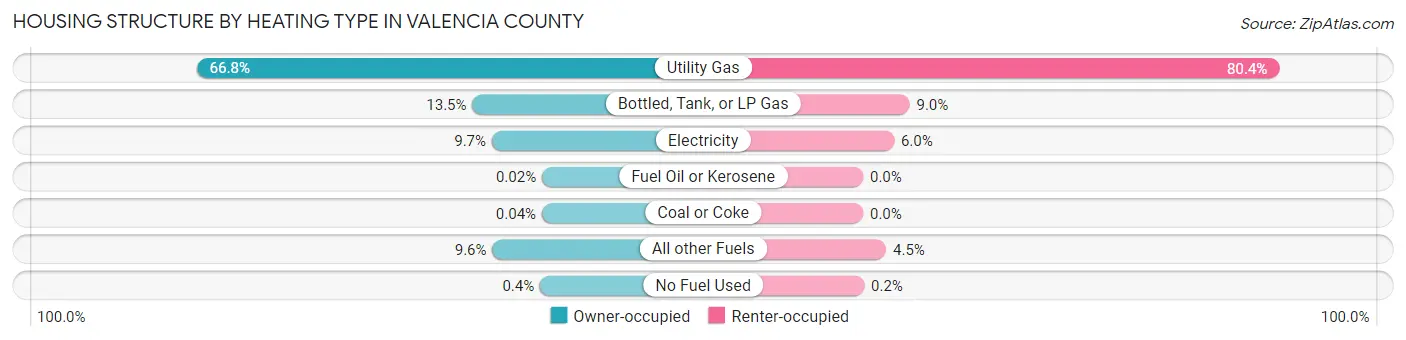
| Heating Type | Owner-occupied | Renter-occupied |
| Utility Gas | 14,494 (66.7%) | 3,664 (80.4%) |
| Bottled, Tank, or LP Gas | 2,926 (13.5%) | 409 (9.0%) |
| Electricity | 2,109 (9.7%) | 272 (6.0%) |
| Fuel Oil or Kerosene | 5 (0.0%) | 0 (0.0%) |
| Coal or Coke | 9 (0.0%) | 0 (0.0%) |
| All other Fuels | 2,086 (9.6%) | 203 (4.4%) |
| No Fuel Used | 86 (0.4%) | 9 (0.2%) |
| Total | 21,715 (100.0%) | 4,557 (100.0%) |
Household Vehicle Usage in Valencia County
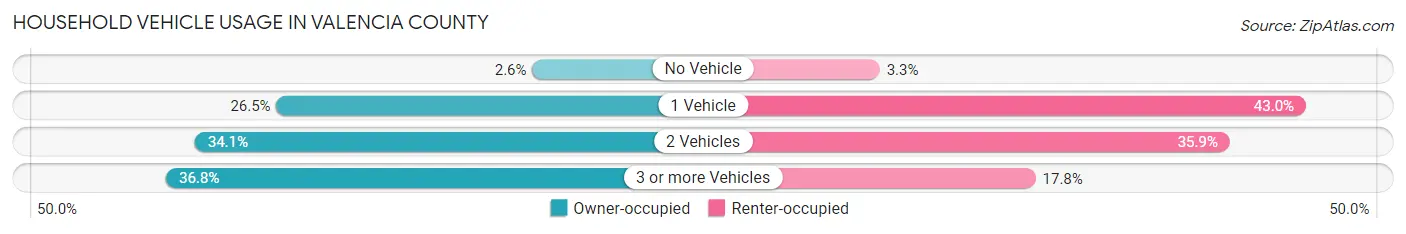
| Vehicles per Household | Owner-occupied | Renter-occupied |
| No Vehicle | 565 (2.6%) | 148 (3.3%) |
| 1 Vehicle | 5,752 (26.5%) | 1,961 (43.0%) |
| 2 Vehicles | 7,408 (34.1%) | 1,637 (35.9%) |
| 3 or more Vehicles | 7,990 (36.8%) | 811 (17.8%) |
| Total | 21,715 (100.0%) | 4,557 (100.0%) |
Real Estate & Mortgages in Valencia County
Real Estate and Mortgage Overview in Valencia County
| Characteristic | Without Mortgage | With Mortgage |
| Housing Units | 10,558 | 11,157 |
| Median Property Value | $157,000 | $199,300 |
| Median Household Income | $47,430 | $1,622 |
| Monthly Housing Costs | $394 | $391 |
| Real Estate Taxes | $1,131 | $662 |
Property Value by Mortgage Status in Valencia County
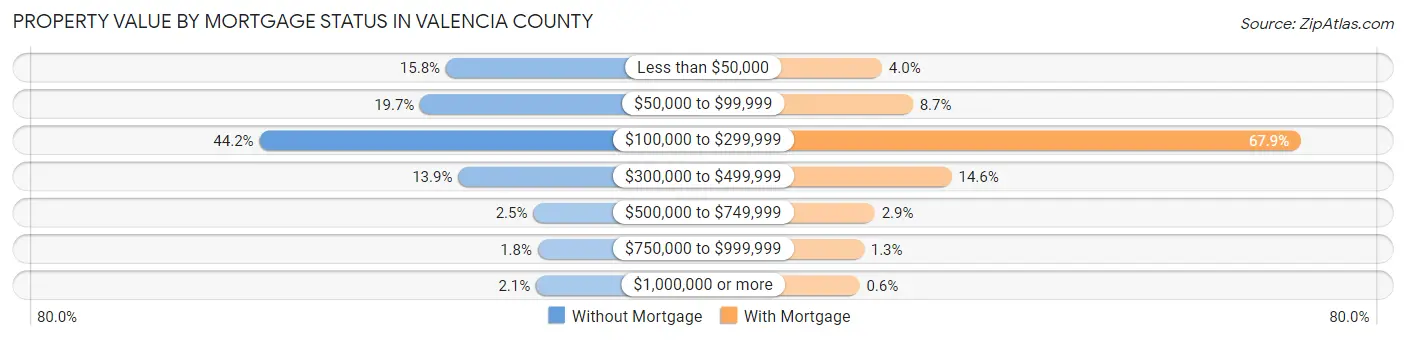
| Property Value | Without Mortgage | With Mortgage |
| Less than $50,000 | 1,668 (15.8%) | 448 (4.0%) |
| $50,000 to $99,999 | 2,082 (19.7%) | 972 (8.7%) |
| $100,000 to $299,999 | 4,669 (44.2%) | 7,573 (67.9%) |
| $300,000 to $499,999 | 1,470 (13.9%) | 1,632 (14.6%) |
| $500,000 to $749,999 | 262 (2.5%) | 326 (2.9%) |
| $750,000 to $999,999 | 190 (1.8%) | 139 (1.3%) |
| $1,000,000 or more | 217 (2.1%) | 67 (0.6%) |
| Total | 10,558 (100.0%) | 11,157 (100.0%) |
Household Income by Mortgage Status in Valencia County
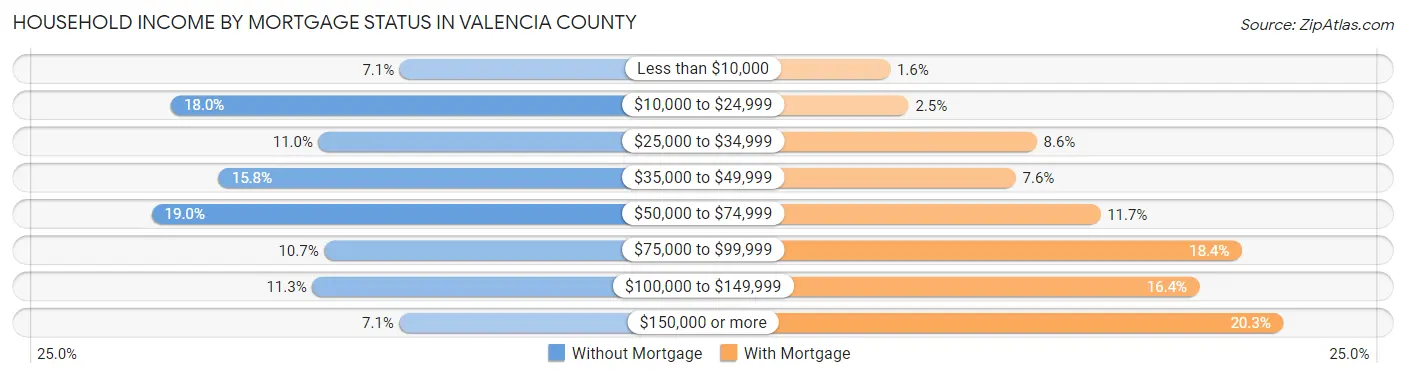
| Household Income | Without Mortgage | With Mortgage |
| Less than $10,000 | 752 (7.1%) | 183 (1.6%) |
| $10,000 to $24,999 | 1,904 (18.0%) | 281 (2.5%) |
| $25,000 to $34,999 | 1,160 (11.0%) | 962 (8.6%) |
| $35,000 to $49,999 | 1,663 (15.8%) | 850 (7.6%) |
| $50,000 to $74,999 | 2,001 (19.0%) | 1,300 (11.7%) |
| $75,000 to $99,999 | 1,132 (10.7%) | 2,049 (18.4%) |
| $100,000 to $149,999 | 1,192 (11.3%) | 1,824 (16.4%) |
| $150,000 or more | 754 (7.1%) | 2,269 (20.3%) |
| Total | 10,558 (100.0%) | 11,157 (100.0%) |
Property Value to Household Income Ratio in Valencia County
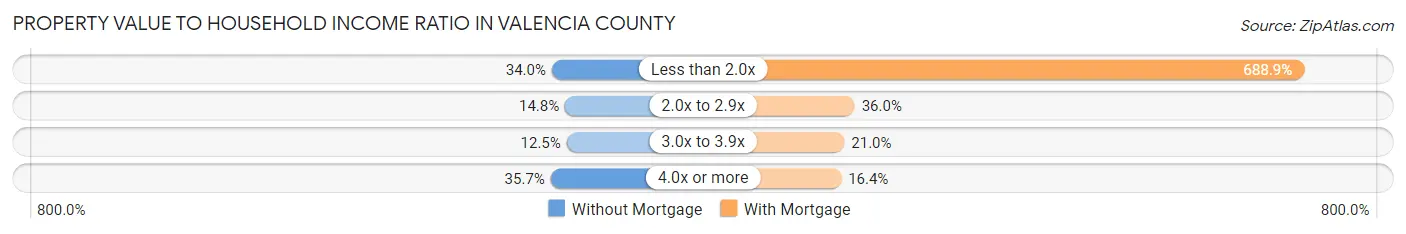
| Value-to-Income Ratio | Without Mortgage | With Mortgage |
| Less than 2.0x | 3,590 (34.0%) | 76,855 (688.8%) |
| 2.0x to 2.9x | 1,557 (14.7%) | 4,019 (36.0%) |
| 3.0x to 3.9x | 1,321 (12.5%) | 2,345 (21.0%) |
| 4.0x or more | 3,771 (35.7%) | 1,825 (16.4%) |
| Total | 10,558 (100.0%) | 11,157 (100.0%) |
Real Estate Taxes by Mortgage Status in Valencia County
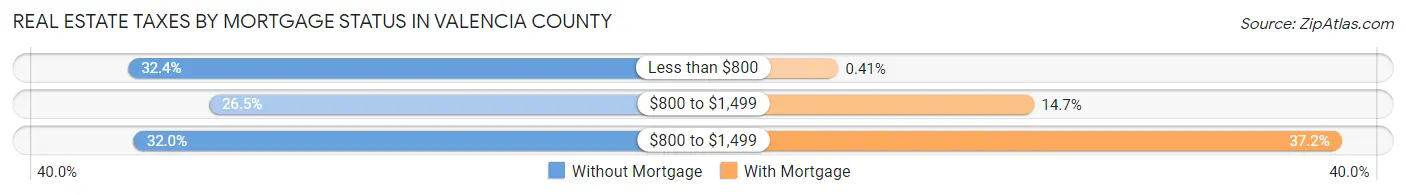
| Property Taxes | Without Mortgage | With Mortgage |
| Less than $800 | 3,424 (32.4%) | 46 (0.4%) |
| $800 to $1,499 | 2,801 (26.5%) | 1,642 (14.7%) |
| $800 to $1,499 | 3,381 (32.0%) | 4,145 (37.1%) |
| Total | 10,558 (100.0%) | 11,157 (100.0%) |
Health & Disability in Valencia County
Health Insurance Coverage by Age in Valencia County
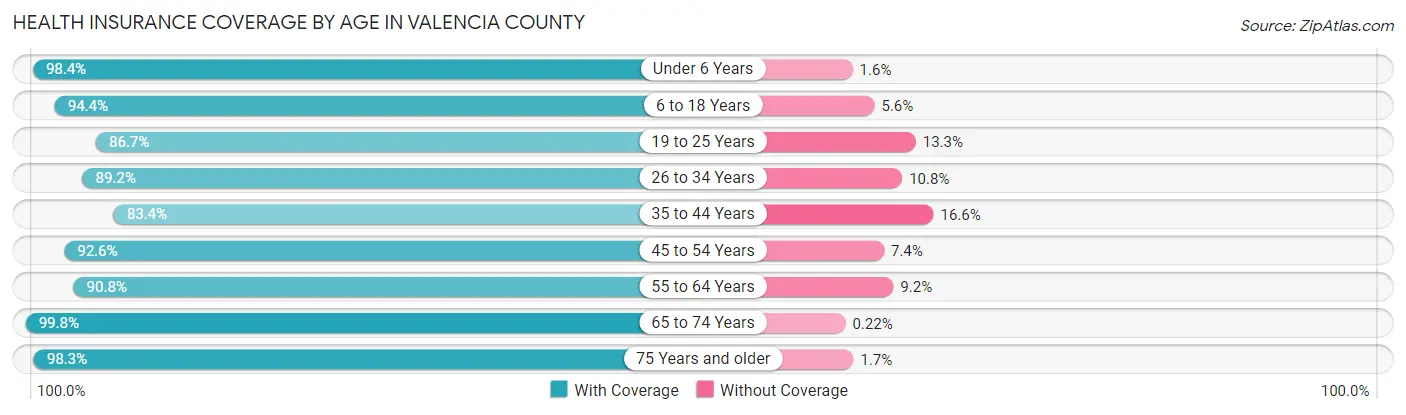
| Age Bracket | With Coverage | Without Coverage |
| Under 6 Years | 5,159 (98.4%) | 82 (1.6%) |
| 6 to 18 Years | 12,635 (94.4%) | 755 (5.6%) |
| 19 to 25 Years | 5,810 (86.7%) | 894 (13.3%) |
| 26 to 34 Years | 7,000 (89.2%) | 848 (10.8%) |
| 35 to 44 Years | 7,639 (83.4%) | 1,525 (16.6%) |
| 45 to 54 Years | 7,959 (92.6%) | 637 (7.4%) |
| 55 to 64 Years | 9,221 (90.8%) | 930 (9.2%) |
| 65 to 74 Years | 8,474 (99.8%) | 19 (0.2%) |
| 75 Years and older | 5,356 (98.3%) | 94 (1.7%) |
| Total | 69,253 (92.3%) | 5,784 (7.7%) |
Health Insurance Coverage by Citizenship Status in Valencia County
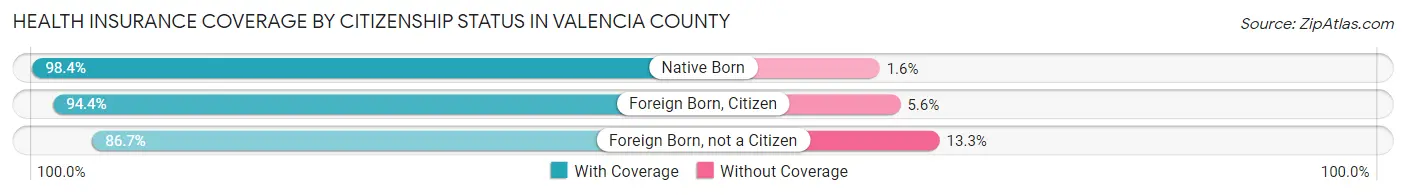
| Citizenship Status | With Coverage | Without Coverage |
| Native Born | 5,159 (98.4%) | 82 (1.6%) |
| Foreign Born, Citizen | 12,635 (94.4%) | 755 (5.6%) |
| Foreign Born, not a Citizen | 5,810 (86.7%) | 894 (13.3%) |
Health Insurance Coverage by Household Income in Valencia County
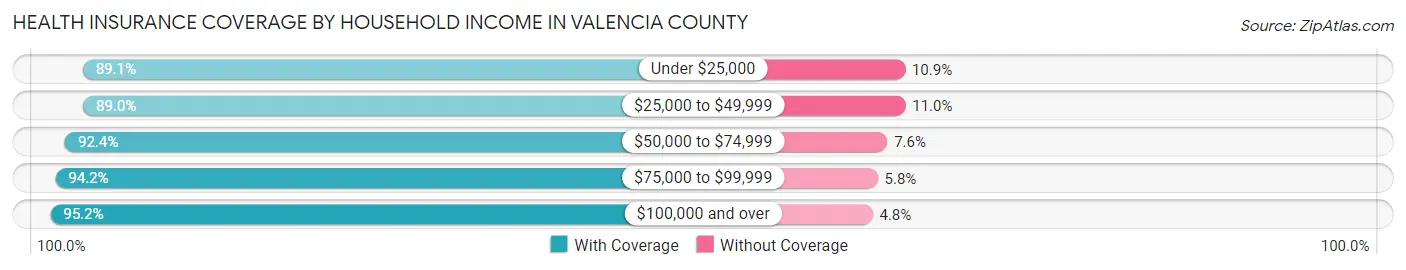
| Household Income | With Coverage | Without Coverage |
| Under $25,000 | 10,689 (89.1%) | 1,308 (10.9%) |
| $25,000 to $49,999 | 13,812 (89.0%) | 1,701 (11.0%) |
| $50,000 to $74,999 | 13,128 (92.4%) | 1,077 (7.6%) |
| $75,000 to $99,999 | 9,160 (94.2%) | 561 (5.8%) |
| $100,000 and over | 22,326 (95.2%) | 1,131 (4.8%) |
Public vs Private Health Insurance Coverage by Age in Valencia County
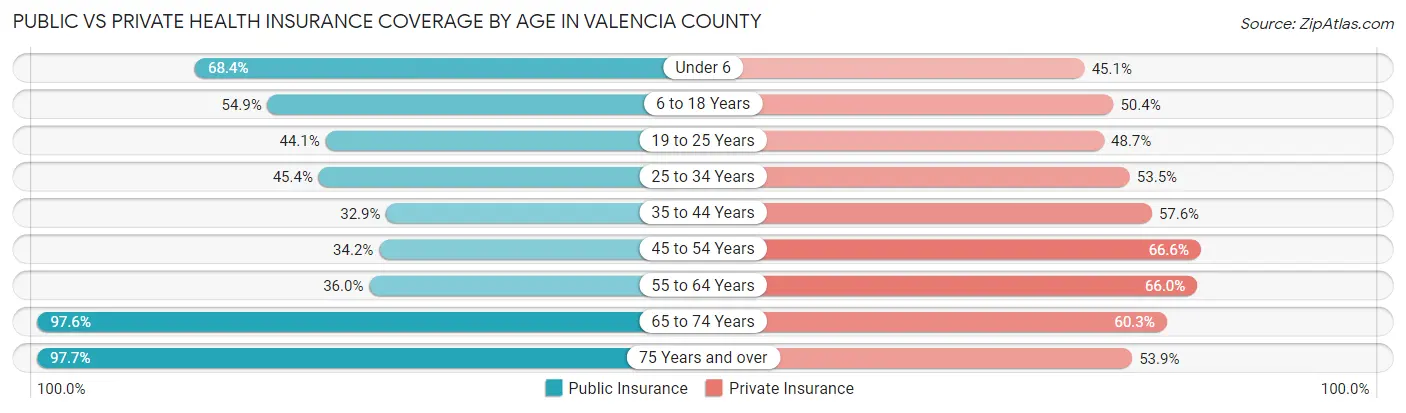
| Age Bracket | Public Insurance | Private Insurance |
| Under 6 | 3,582 (68.3%) | 2,363 (45.1%) |
| 6 to 18 Years | 7,352 (54.9%) | 6,753 (50.4%) |
| 19 to 25 Years | 2,959 (44.1%) | 3,264 (48.7%) |
| 25 to 34 Years | 3,563 (45.4%) | 4,197 (53.5%) |
| 35 to 44 Years | 3,012 (32.9%) | 5,276 (57.6%) |
| 45 to 54 Years | 2,939 (34.2%) | 5,727 (66.6%) |
| 55 to 64 Years | 3,657 (36.0%) | 6,695 (65.9%) |
| 65 to 74 Years | 8,289 (97.6%) | 5,119 (60.3%) |
| 75 Years and over | 5,323 (97.7%) | 2,938 (53.9%) |
| Total | 40,676 (54.2%) | 42,332 (56.4%) |
Disability Status by Sex by Age in Valencia County
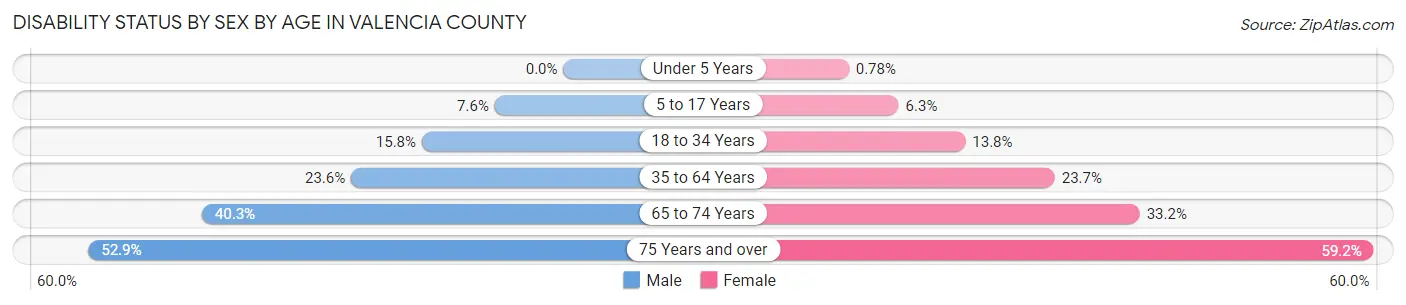
| Age Bracket | Male | Female |
| Under 5 Years | 0 (0.0%) | 16 (0.8%) |
| 5 to 17 Years | 533 (7.6%) | 412 (6.3%) |
| 18 to 34 Years | 1,214 (15.8%) | 1,088 (13.8%) |
| 35 to 64 Years | 3,256 (23.6%) | 3,353 (23.7%) |
| 65 to 74 Years | 1,701 (40.3%) | 1,416 (33.2%) |
| 75 Years and over | 1,276 (52.9%) | 1,799 (59.2%) |
Disability Class by Sex by Age in Valencia County
Disability Class: Hearing Difficulty
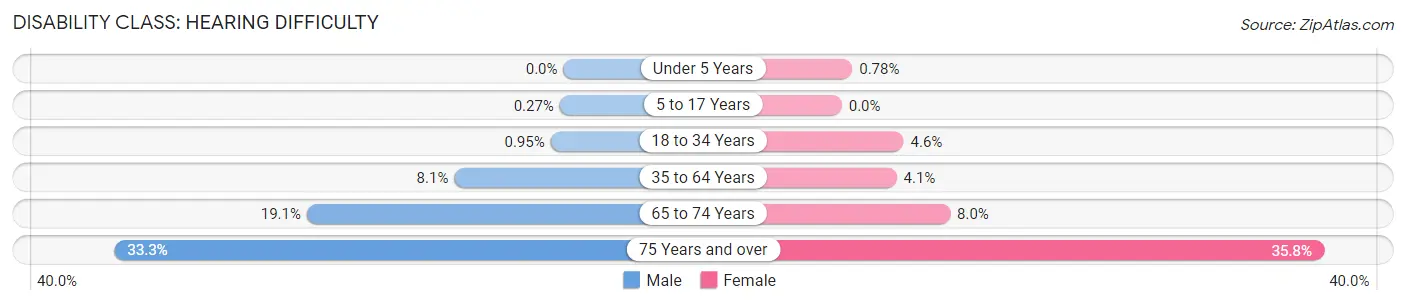
| Age Bracket | Male | Female |
| Under 5 Years | 0 (0.0%) | 16 (0.8%) |
| 5 to 17 Years | 19 (0.3%) | 0 (0.0%) |
| 18 to 34 Years | 73 (0.9%) | 363 (4.6%) |
| 35 to 64 Years | 1,116 (8.1%) | 575 (4.1%) |
| 65 to 74 Years | 805 (19.1%) | 343 (8.0%) |
| 75 Years and over | 804 (33.3%) | 1,087 (35.8%) |
Disability Class: Vision Difficulty
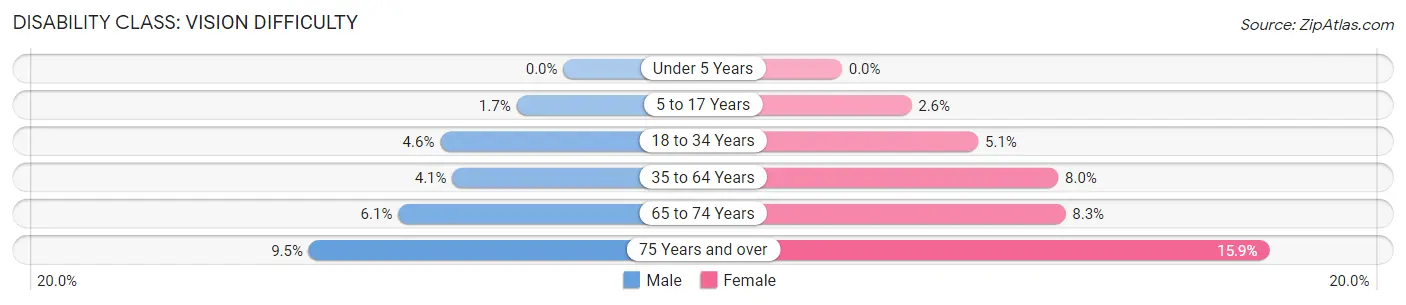
| Age Bracket | Male | Female |
| Under 5 Years | 0 (0.0%) | 0 (0.0%) |
| 5 to 17 Years | 121 (1.7%) | 168 (2.6%) |
| 18 to 34 Years | 352 (4.6%) | 400 (5.1%) |
| 35 to 64 Years | 567 (4.1%) | 1,135 (8.0%) |
| 65 to 74 Years | 259 (6.1%) | 354 (8.3%) |
| 75 Years and over | 228 (9.5%) | 482 (15.9%) |
Disability Class: Cognitive Difficulty
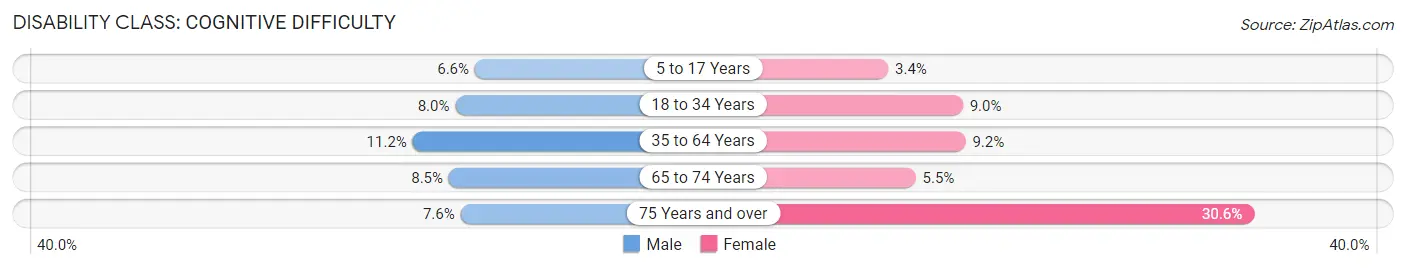
| Age Bracket | Male | Female |
| 5 to 17 Years | 458 (6.6%) | 224 (3.4%) |
| 18 to 34 Years | 618 (8.0%) | 710 (9.0%) |
| 35 to 64 Years | 1,541 (11.2%) | 1,298 (9.2%) |
| 65 to 74 Years | 359 (8.5%) | 234 (5.5%) |
| 75 Years and over | 184 (7.6%) | 930 (30.6%) |
Disability Class: Ambulatory Difficulty
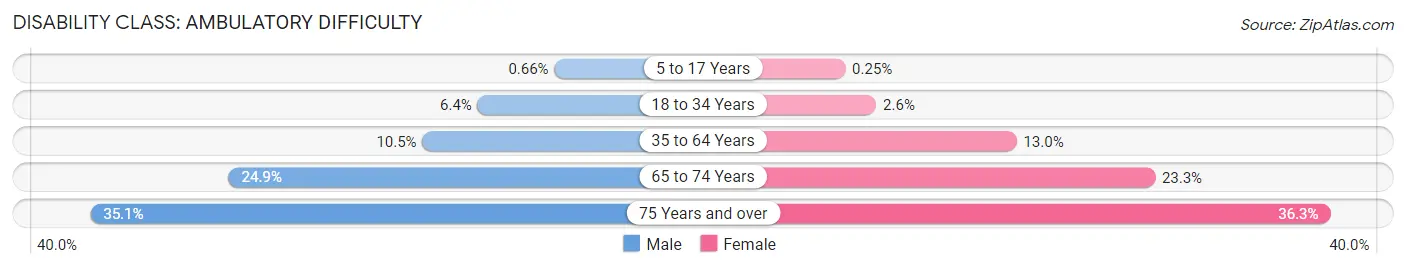
| Age Bracket | Male | Female |
| 5 to 17 Years | 46 (0.7%) | 16 (0.3%) |
| 18 to 34 Years | 490 (6.4%) | 202 (2.5%) |
| 35 to 64 Years | 1,441 (10.5%) | 1,834 (13.0%) |
| 65 to 74 Years | 1,050 (24.8%) | 992 (23.3%) |
| 75 Years and over | 847 (35.1%) | 1,102 (36.3%) |
Disability Class: Self-Care Difficulty
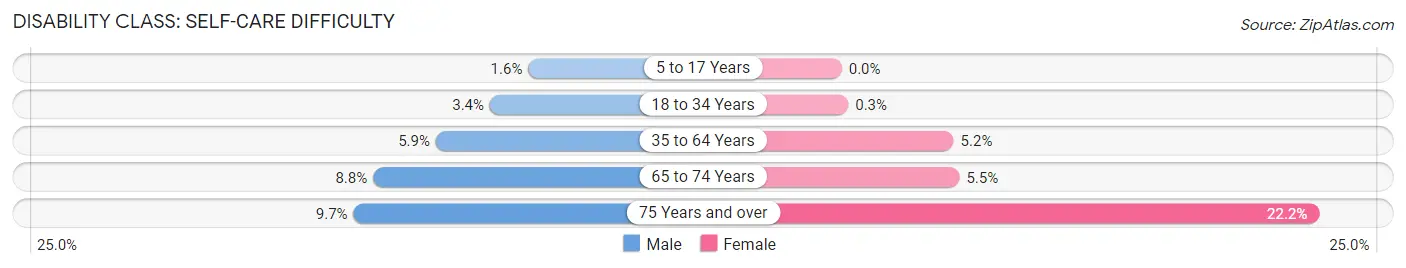
| Age Bracket | Male | Female |
| 5 to 17 Years | 114 (1.6%) | 0 (0.0%) |
| 18 to 34 Years | 263 (3.4%) | 24 (0.3%) |
| 35 to 64 Years | 816 (5.9%) | 733 (5.2%) |
| 65 to 74 Years | 373 (8.8%) | 233 (5.5%) |
| 75 Years and over | 235 (9.7%) | 673 (22.2%) |
Technology Access in Valencia County
Computing Device Access in Valencia County
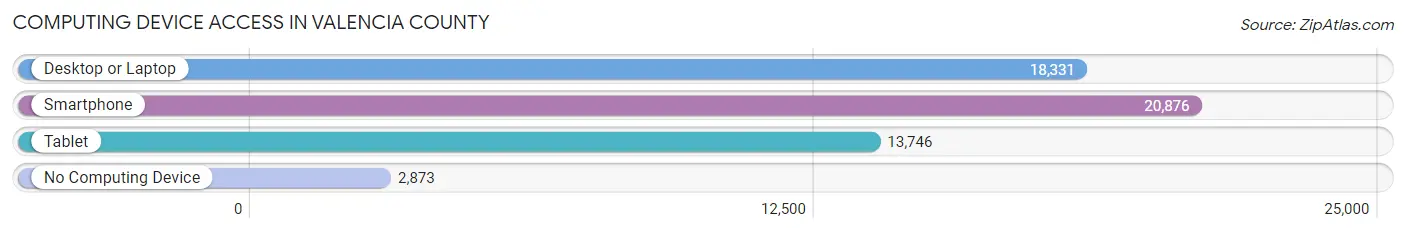
| Device Type | # Households | % Households |
| Desktop or Laptop | 18,331 | 69.8% |
| Smartphone | 20,876 | 79.5% |
| Tablet | 13,746 | 52.3% |
| No Computing Device | 2,873 | 10.9% |
| Total | 26,272 | 100.0% |
Internet Access in Valencia County
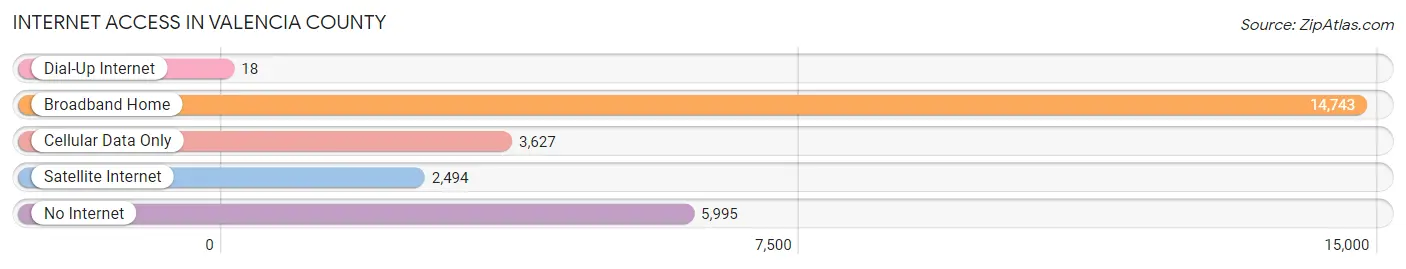
| Internet Type | # Households | % Households |
| Dial-Up Internet | 18 | 0.1% |
| Broadband Home | 14,743 | 56.1% |
| Cellular Data Only | 3,627 | 13.8% |
| Satellite Internet | 2,494 | 9.5% |
| No Internet | 5,995 | 22.8% |
| Total | 26,272 | 100.0% |
Valencia County Summary
Valencia County is located in the central part of New Mexico, and is bordered by Bernalillo County to the north, Socorro County to the east, Torrance County to the south, and Cibola County to the west. The county seat is Los Lunas, and the largest city is Belen. The county has a total area of 1,914 square miles, and a population of 76,569 as of the 2010 census.
History
Valencia County was established in 1852, and was named after the Spanish province of Valencia. The county was originally part of the New Mexico Territory, and was later part of the Arizona Territory before becoming part of the state of New Mexico in 1912.
The area was originally inhabited by Native American tribes, including the Pueblo, Apache, and Navajo. The first European settlers arrived in the area in the late 1700s, and the county was officially established in 1852.
The county was largely rural until the 1950s, when the population began to grow rapidly due to the development of the oil and gas industry. The county has since become a major center for agriculture, manufacturing, and tourism.
Geography
Valencia County is located in the central part of New Mexico, and is bordered by Bernalillo County to the north, Socorro County to the east, Torrance County to the south, and Cibola County to the west. The county has a total area of 1,914 square miles, and is located at an elevation of 4,500 feet.
The county is mostly flat, with some rolling hills in the northern and western parts. The Rio Grande runs through the county, and the Manzano Mountains are located in the eastern part of the county.
Economy
Valencia County has a diverse economy, with a mix of agriculture, manufacturing, and tourism. The county is home to several large agricultural operations, including dairy farms, cattle ranches, and vegetable farms. The county is also home to several manufacturing companies, including a large paper mill and a plastics plant.
Tourism is also an important part of the county’s economy, with several popular attractions, including the Coronado Historic Site, the Bosque del Apache National Wildlife Refuge, and the Rio Grande Nature Center.
Demographics
As of the 2010 census, Valencia County had a population of 76,569. The population was 53.2% Hispanic or Latino, 40.2% White, 2.2% Native American, 1.3% Asian, 0.2% Black or African American, and 2.9% from other races.
The median household income was $41,945, and the median family income was $48,945. The per capita income was $19,945. About 16.2% of the population was below the poverty line.
Common Questions
What is Per Capita Income in Valencia County?
Per Capita income in Valencia County is $28,817.
What is the Median Family Income in Valencia County?
Median Family Income in Valencia County is $67,296.
What is the Median Household income in Valencia County?
Median Household Income in Valencia County is $56,246.
What is Income or Wage Gap in Valencia County?
Income or Wage Gap in Valencia County is 16.7%.
Women in Valencia County earn 83.3 cents for every dollar earned by a man.
What is Family Income Deficit in Valencia County?
Family Income Deficit in Valencia County is $11,528.
Families that are below poverty line in Valencia County earn $11,528 less on average than the poverty threshold level.
What is Inequality or Gini Index in Valencia County?
Inequality or Gini Index in Valencia County is 0.45.
What is the Total Population of Valencia County?
Total Population of Valencia County is 76,613.
What is the Total Male Population of Valencia County?
Total Male Population of Valencia County is 38,604.
What is the Total Female Population of Valencia County?
Total Female Population of Valencia County is 38,009.
What is the Ratio of Males per 100 Females in Valencia County?
There are 101.57 Males per 100 Females in Valencia County.
What is the Ratio of Females per 100 Males in Valencia County?
There are 98.46 Females per 100 Males in Valencia County.
What is the Median Population Age in Valencia County?
Median Population Age in Valencia County is 38.8 Years.
What is the Average Family Size in Valencia County
Average Family Size in Valencia County is 3.6 People.
What is the Average Household Size in Valencia County
Average Household Size in Valencia County is 2.9 People.
How Large is the Labor Force in Valencia County?
There are 31,612 People in the Labor Forcein in Valencia County.
What is the Percentage of People in the Labor Force in Valencia County?
51.8% of People are in the Labor Force in Valencia County.
What is the Unemployment Rate in Valencia County?
Unemployment Rate in Valencia County is 7.5%.