Lea County, NM Map & Demographics
Lea County Map
Lea County Overview
$29,635
PER CAPITA INCOME
$75,953
AVG FAMILY INCOME
$65,855
AVG HOUSEHOLD INCOME
49.3%
WAGE / INCOME GAP [ % ]
50.7¢/ $1
WAGE / INCOME GAP [ $ ]
$12,260
FAMILY INCOME DEFICIT
0.47
INEQUALITY / GINI INDEX
73,103
TOTAL POPULATION
37,934
MALE POPULATION
35,169
FEMALE POPULATION
107.86
MALES / 100 FEMALES
92.71
FEMALES / 100 MALES
32.2
MEDIAN AGE
3.5
AVG FAMILY SIZE
2.9
AVG HOUSEHOLD SIZE
33,330
LABOR FORCE [ PEOPLE ]
62.3%
PERCENT IN LABOR FORCE
7.4%
UNEMPLOYMENT RATE
Income in Lea County
Income Overview in Lea County
Per Capita Income in Lea County is $29,635, while median incomes of families and households are $75,953 and $65,855 respectively.
| Characteristic | Number | Measure |
| Per Capita Income | 73,103 | $29,635 |
| Median Family Income | 16,829 | $75,953 |
| Mean Family Income | 16,829 | $96,403 |
| Median Household Income | 24,379 | $65,855 |
| Mean Household Income | 24,379 | $86,086 |
| Income Deficit | 16,829 | $12,260 |
| Wage / Income Gap (%) | 73,103 | 49.25% |
| Wage / Income Gap ($) | 73,103 | 50.75¢ per $1 |
| Gini / Inequality Index | 73,103 | 0.47 |
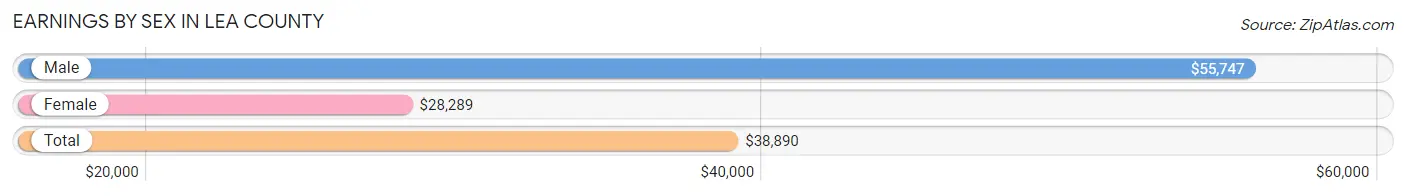
Earnings by Sex in Lea County
Average Earnings in Lea County are $38,890, $55,747 for men and $28,289 for women, a difference of 49.2%.
| Sex | Number | Average Earnings |
| Male | 20,544 (59.4%) | $55,747 |
| Female | 14,066 (40.6%) | $28,289 |
| Total | 34,610 (100.0%) | $38,890 |
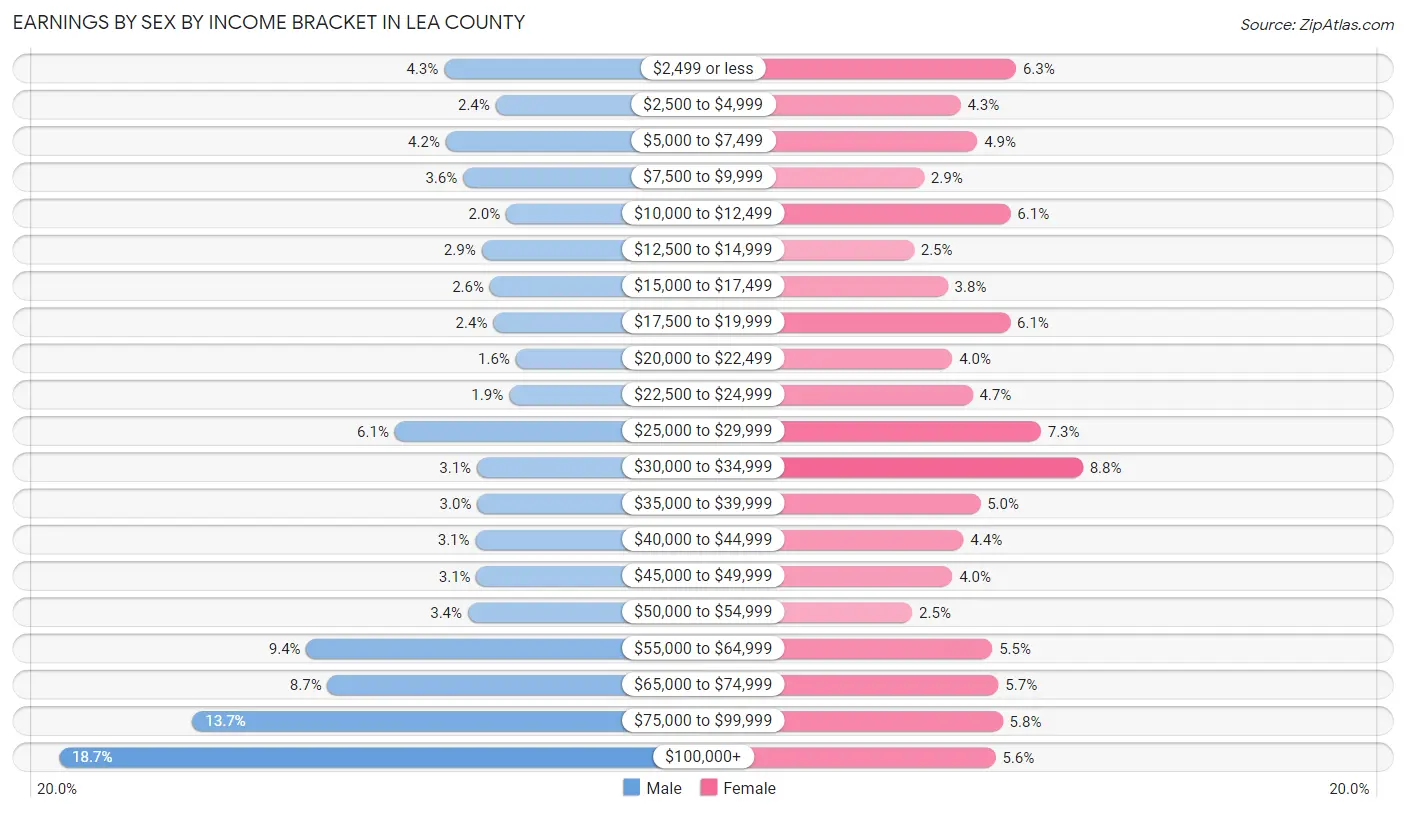
Earnings by Sex by Income Bracket in Lea County
The most common earnings brackets in Lea County are $100,000+ for men (3,843 | 18.7%) and $30,000 to $34,999 for women (1,244 | 8.8%).
| Income | Male | Female |
| $2,499 or less | 879 (4.3%) | 892 (6.3%) |
| $2,500 to $4,999 | 482 (2.4%) | 599 (4.3%) |
| $5,000 to $7,499 | 867 (4.2%) | 688 (4.9%) |
| $7,500 to $9,999 | 733 (3.6%) | 407 (2.9%) |
| $10,000 to $12,499 | 402 (2.0%) | 862 (6.1%) |
| $12,500 to $14,999 | 591 (2.9%) | 353 (2.5%) |
| $15,000 to $17,499 | 529 (2.6%) | 531 (3.8%) |
| $17,500 to $19,999 | 501 (2.4%) | 861 (6.1%) |
| $20,000 to $22,499 | 329 (1.6%) | 556 (4.0%) |
| $22,500 to $24,999 | 381 (1.8%) | 662 (4.7%) |
| $25,000 to $29,999 | 1,260 (6.1%) | 1,023 (7.3%) |
| $30,000 to $34,999 | 626 (3.0%) | 1,244 (8.8%) |
| $35,000 to $39,999 | 624 (3.0%) | 704 (5.0%) |
| $40,000 to $44,999 | 638 (3.1%) | 614 (4.4%) |
| $45,000 to $49,999 | 630 (3.1%) | 556 (4.0%) |
| $50,000 to $54,999 | 696 (3.4%) | 345 (2.5%) |
| $55,000 to $64,999 | 1,939 (9.4%) | 766 (5.4%) |
| $65,000 to $74,999 | 1,777 (8.6%) | 799 (5.7%) |
| $75,000 to $99,999 | 2,817 (13.7%) | 821 (5.8%) |
| $100,000+ | 3,843 (18.7%) | 783 (5.6%) |
| Total | 20,544 (100.0%) | 14,066 (100.0%) |
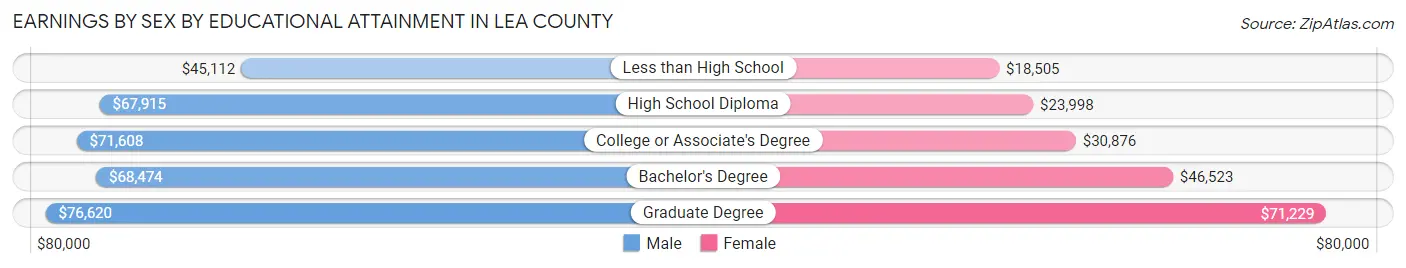
Earnings by Sex by Educational Attainment in Lea County
Average earnings in Lea County are $62,423 for men and $32,689 for women, a difference of 47.6%. Men with an educational attainment of graduate degree enjoy the highest average annual earnings of $76,620, while those with less than high school education earn the least with $45,112. Women with an educational attainment of graduate degree earn the most with the average annual earnings of $71,229, while those with less than high school education have the smallest earnings of $18,505.
| Educational Attainment | Male Income | Female Income |
| Less than High School | $45,112 | $18,505 |
| High School Diploma | $67,915 | $23,998 |
| College or Associate's Degree | $71,608 | $30,876 |
| Bachelor's Degree | $68,474 | $46,523 |
| Graduate Degree | $76,620 | $71,229 |
| Total | $62,423 | $32,689 |
Family Income in Lea County
Family Income Brackets in Lea County
According to the Lea County family income data, there are 3,130 families falling into the $100,000 to $149,999 income range, which is the most common income bracket and makes up 18.6% of all families. Conversely, the $10,000 to $14,999 income bracket is the least frequent group with only 387 families (2.3%) belonging to this category.
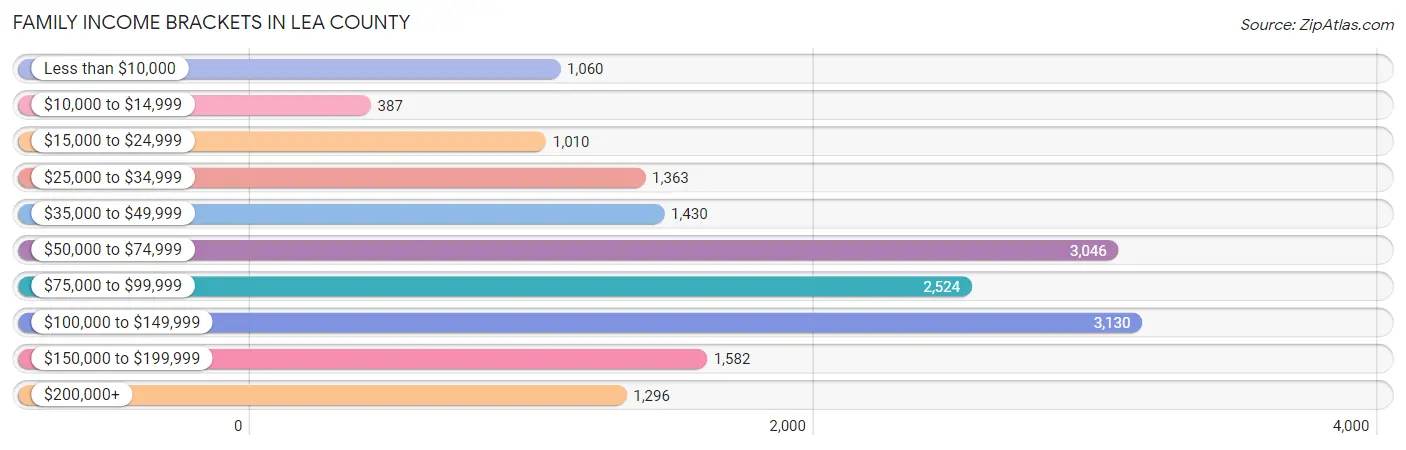
| Income Bracket | # Families | % Families |
| Less than $10,000 | 1,060 | 6.3% |
| $10,000 to $14,999 | 387 | 2.3% |
| $15,000 to $24,999 | 1,010 | 6.0% |
| $25,000 to $34,999 | 1,363 | 8.1% |
| $35,000 to $49,999 | 1,430 | 8.5% |
| $50,000 to $74,999 | 3,046 | 18.1% |
| $75,000 to $99,999 | 2,524 | 15.0% |
| $100,000 to $149,999 | 3,130 | 18.6% |
| $150,000 to $199,999 | 1,582 | 9.4% |
| $200,000+ | 1,296 | 7.7% |
Family Income by Famaliy Size in Lea County
5-person families (1,952 | 11.6%) account for the highest median family income in Lea County with $93,226 per family, while 2-person families (7,141 | 42.4%) have the highest median income of $34,471 per family member.
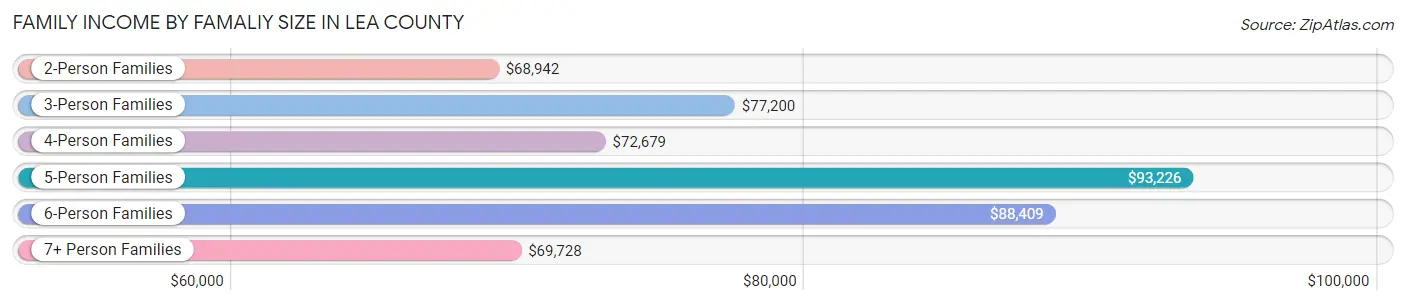
| Income Bracket | # Families | Median Income |
| 2-Person Families | 7,141 (42.4%) | $68,942 |
| 3-Person Families | 3,172 (18.9%) | $77,200 |
| 4-Person Families | 3,631 (21.6%) | $72,679 |
| 5-Person Families | 1,952 (11.6%) | $93,226 |
| 6-Person Families | 502 (3.0%) | $88,409 |
| 7+ Person Families | 431 (2.6%) | $69,728 |
| Total | 16,829 (100.0%) | $75,953 |
Family Income by Number of Earners in Lea County
The median family income in Lea County is $75,953, with families comprising 3+ earners (1,743) having the highest median family income of $126,202, while families with no earners (1,931) have the lowest median family income of $30,095, accounting for 10.4% and 11.5% of families, respectively.
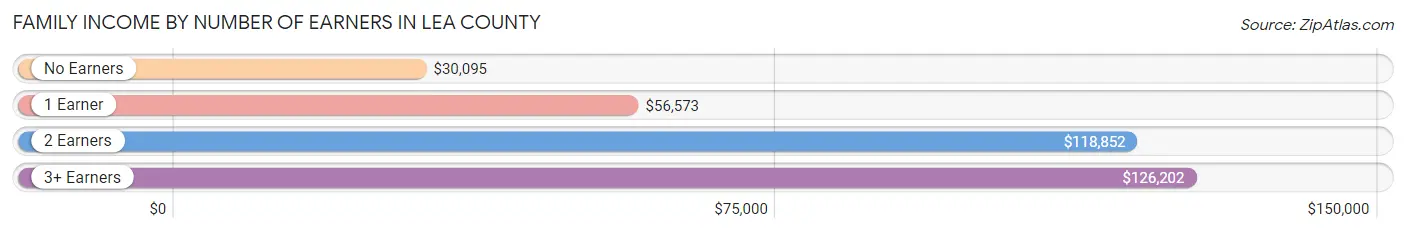
| Number of Earners | # Families | Median Income |
| No Earners | 1,931 (11.5%) | $30,095 |
| 1 Earner | 7,325 (43.5%) | $56,573 |
| 2 Earners | 5,830 (34.6%) | $118,852 |
| 3+ Earners | 1,743 (10.4%) | $126,202 |
| Total | 16,829 (100.0%) | $75,953 |
Household Income in Lea County
Household Income Brackets in Lea County
With 4,218 households falling in the category, the $50,000 to $74,999 income range is the most frequent in Lea County, accounting for 17.3% of all households. In contrast, only 1,195 households (4.9%) fall into the $10,000 to $14,999 income bracket, making it the least populous group.
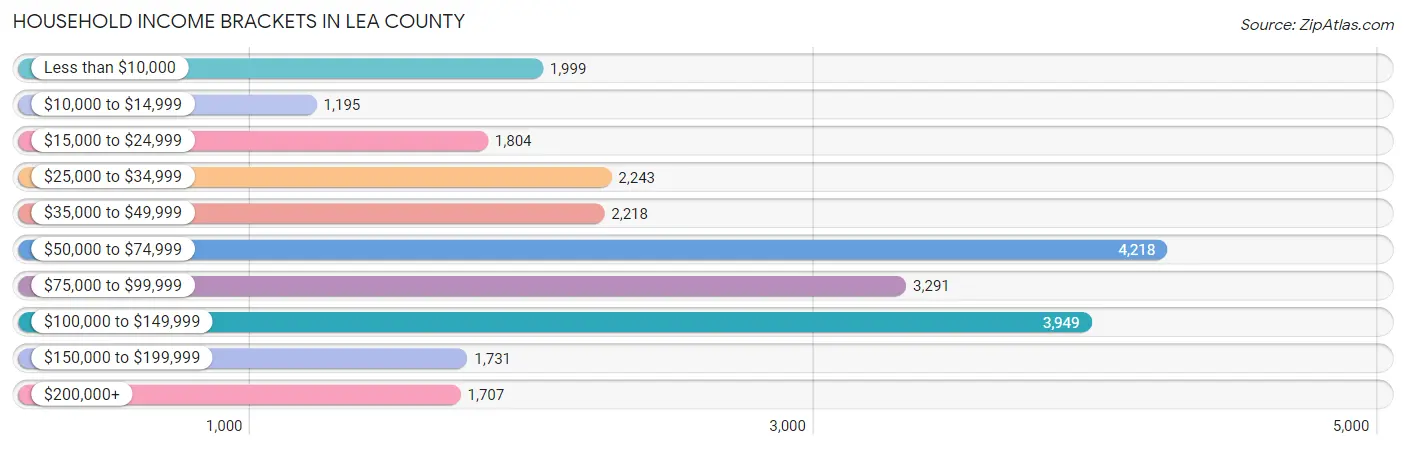
| Income Bracket | # Households | % Households |
| Less than $10,000 | 1,999 | 8.2% |
| $10,000 to $14,999 | 1,195 | 4.9% |
| $15,000 to $24,999 | 1,804 | 7.4% |
| $25,000 to $34,999 | 2,243 | 9.2% |
| $35,000 to $49,999 | 2,218 | 9.1% |
| $50,000 to $74,999 | 4,218 | 17.3% |
| $75,000 to $99,999 | 3,291 | 13.5% |
| $100,000 to $149,999 | 3,949 | 16.2% |
| $150,000 to $199,999 | 1,731 | 7.1% |
| $200,000+ | 1,707 | 7.0% |
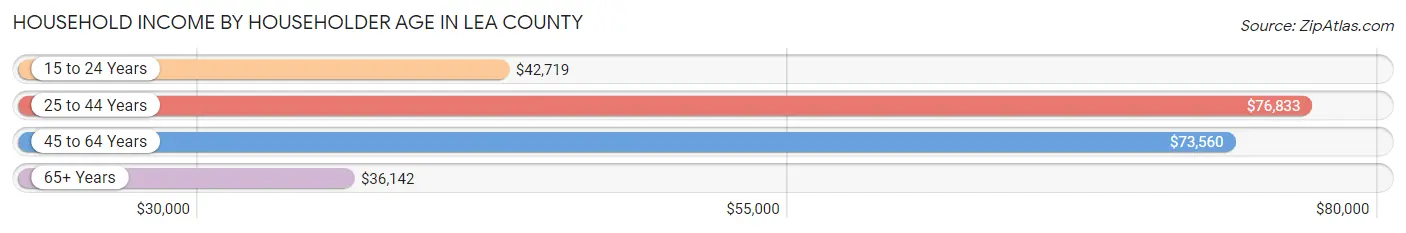
Household Income by Householder Age in Lea County
The median household income in Lea County is $65,855, with the highest median household income of $76,833 found in the 25 to 44 years age bracket for the primary householder. A total of 9,095 households (37.3%) fall into this category. Meanwhile, the 65+ years age bracket for the primary householder has the lowest median household income of $36,142, with 4,715 households (19.3%) in this group.
| Income Bracket | # Households | Median Income |
| 15 to 24 Years | 1,627 (6.7%) | $42,719 |
| 25 to 44 Years | 9,095 (37.3%) | $76,833 |
| 45 to 64 Years | 8,942 (36.7%) | $73,560 |
| 65+ Years | 4,715 (19.3%) | $36,142 |
| Total | 24,379 (100.0%) | $65,855 |
Poverty in Lea County
Income Below Poverty by Sex and Age in Lea County
With 15.5% poverty level for males and 20.2% for females among the residents of Lea County, 5 year old males and 5 year old females are the most vulnerable to poverty, with 268 males (45.7%) and 232 females (50.2%) in their respective age groups living below the poverty level.
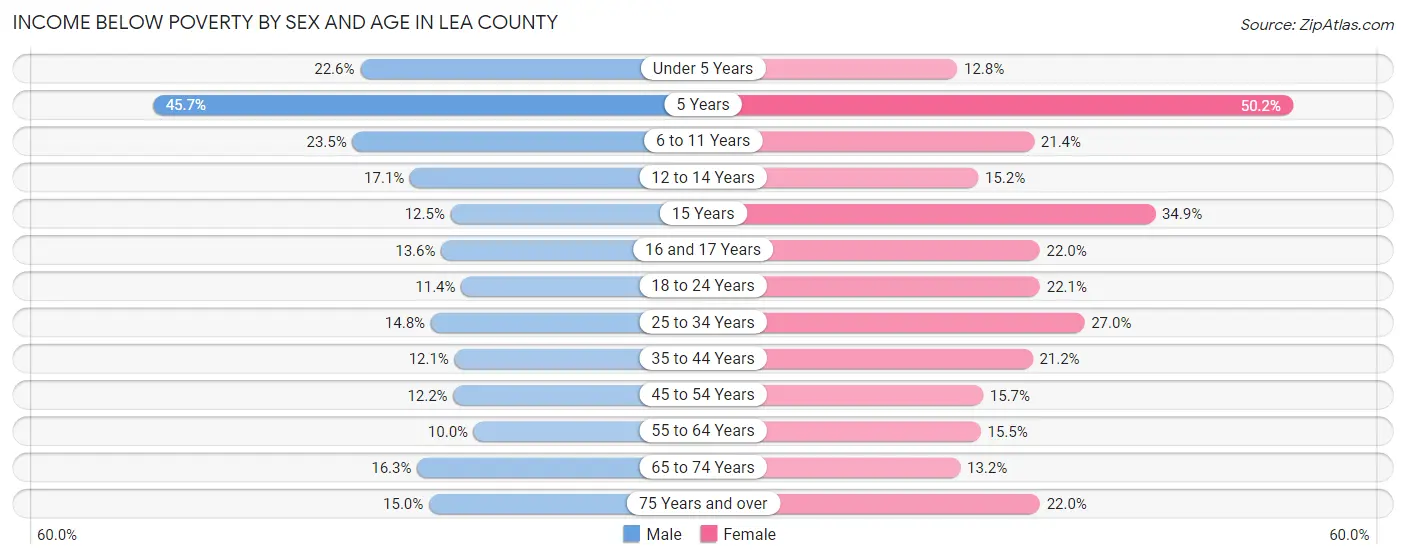
| Age Bracket | Male | Female |
| Under 5 Years | 677 (22.6%) | 339 (12.8%) |
| 5 Years | 268 (45.7%) | 232 (50.2%) |
| 6 to 11 Years | 893 (23.5%) | 824 (21.4%) |
| 12 to 14 Years | 325 (17.1%) | 242 (15.2%) |
| 15 Years | 83 (12.5%) | 278 (34.9%) |
| 16 and 17 Years | 170 (13.6%) | 228 (22.0%) |
| 18 to 24 Years | 426 (11.4%) | 773 (22.1%) |
| 25 to 34 Years | 729 (14.7%) | 1,255 (27.0%) |
| 35 to 44 Years | 564 (12.1%) | 961 (21.2%) |
| 45 to 54 Years | 474 (12.2%) | 598 (15.7%) |
| 55 to 64 Years | 392 (10.0%) | 556 (15.4%) |
| 65 to 74 Years | 385 (16.3%) | 329 (13.2%) |
| 75 Years and over | 200 (14.9%) | 356 (22.0%) |
| Total | 5,586 (15.5%) | 6,971 (20.2%) |
Income Above Poverty by Sex and Age in Lea County
According to the poverty statistics in Lea County, males aged 55 to 64 years and females aged under 5 years are the age groups that are most secure financially, with 90.0% of males and 87.2% of females in these age groups living above the poverty line.
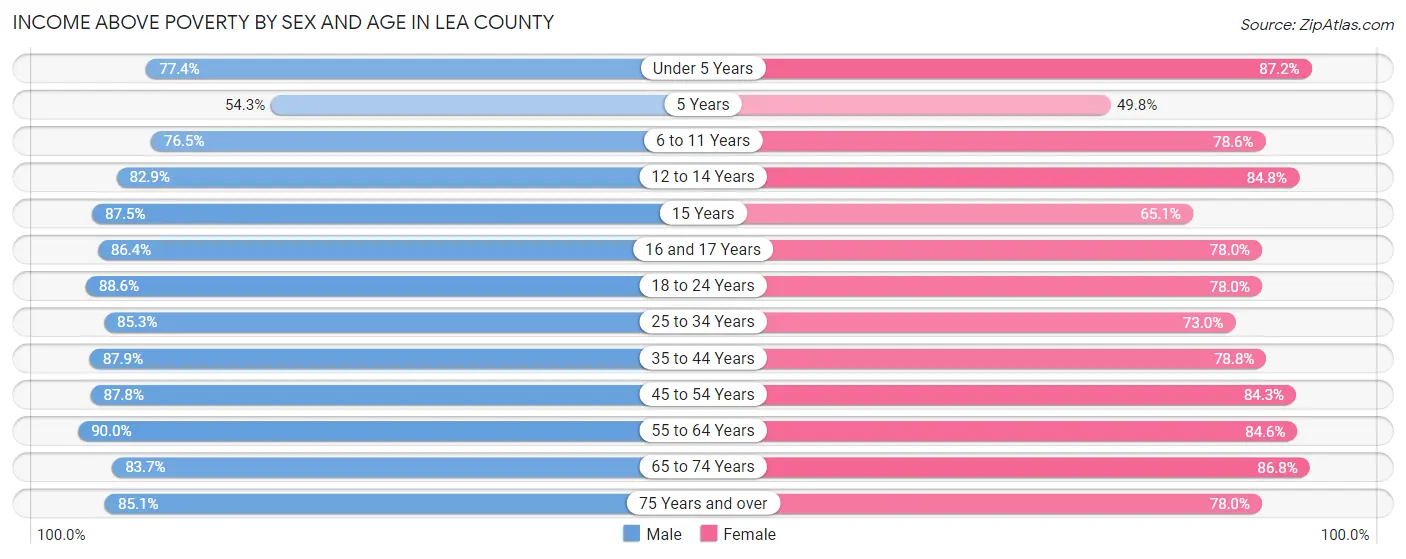
| Age Bracket | Male | Female |
| Under 5 Years | 2,317 (77.4%) | 2,301 (87.2%) |
| 5 Years | 318 (54.3%) | 230 (49.8%) |
| 6 to 11 Years | 2,911 (76.5%) | 3,028 (78.6%) |
| 12 to 14 Years | 1,580 (82.9%) | 1,353 (84.8%) |
| 15 Years | 579 (87.5%) | 519 (65.1%) |
| 16 and 17 Years | 1,081 (86.4%) | 807 (78.0%) |
| 18 to 24 Years | 3,324 (88.6%) | 2,733 (77.9%) |
| 25 to 34 Years | 4,212 (85.3%) | 3,394 (73.0%) |
| 35 to 44 Years | 4,096 (87.9%) | 3,566 (78.8%) |
| 45 to 54 Years | 3,400 (87.8%) | 3,208 (84.3%) |
| 55 to 64 Years | 3,544 (90.0%) | 3,043 (84.6%) |
| 65 to 74 Years | 1,982 (83.7%) | 2,170 (86.8%) |
| 75 Years and over | 1,138 (85.1%) | 1,259 (78.0%) |
| Total | 30,482 (84.5%) | 27,611 (79.8%) |
Income Below Poverty Among Married-Couple Families in Lea County
The poverty statistics for married-couple families in Lea County show that 6.3% or 728 of the total 11,597 families live below the poverty line. Families with 1 or 2 children have the highest poverty rate of 7.8%, comprising of 330 families. On the other hand, families with 5 or more children have the lowest poverty rate of 4.3%, which includes 5 families.
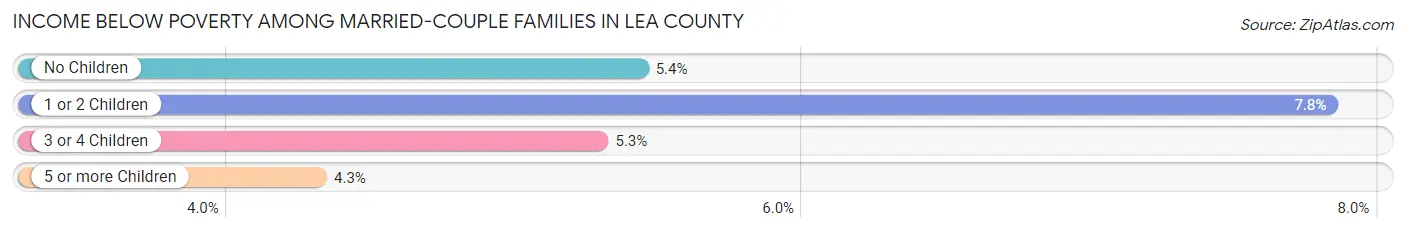
| Children | Above Poverty | Below Poverty |
| No Children | 5,638 (94.6%) | 324 (5.4%) |
| 1 or 2 Children | 3,885 (92.2%) | 330 (7.8%) |
| 3 or 4 Children | 1,235 (94.7%) | 69 (5.3%) |
| 5 or more Children | 111 (95.7%) | 5 (4.3%) |
| Total | 10,869 (93.7%) | 728 (6.3%) |
Income Below Poverty Among Single-Parent Households in Lea County
According to the poverty data in Lea County, 21.8% or 469 single-father households and 38.1% or 1,174 single-mother households are living below the poverty line. Among single-father households, those with 3 or 4 children have the highest poverty rate, with 198 households (47.7%) experiencing poverty. Likewise, among single-mother households, those with 3 or 4 children have the highest poverty rate, with 362 households (73.6%) falling below the poverty line.
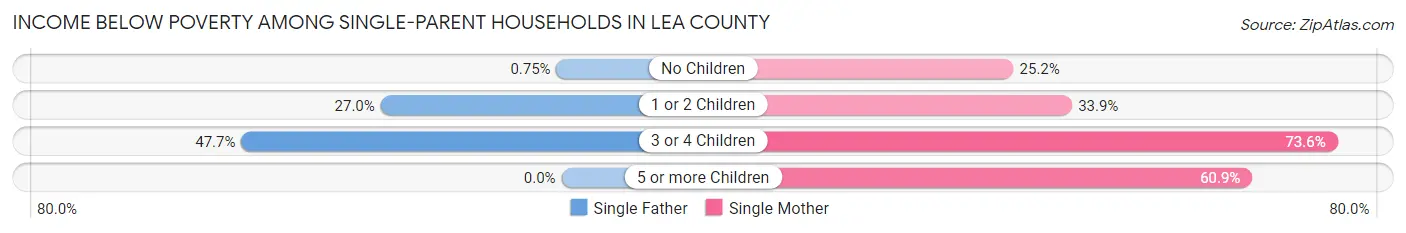
| Children | Single Father | Single Mother |
| No Children | 5 (0.7%) | 227 (25.2%) |
| 1 or 2 Children | 266 (27.0%) | 557 (33.9%) |
| 3 or 4 Children | 198 (47.7%) | 362 (73.6%) |
| 5 or more Children | 0 (0.0%) | 28 (60.9%) |
| Total | 469 (21.8%) | 1,174 (38.1%) |
Income Below Poverty Among Married-Couple vs Single-Parent Households in Lea County
The poverty data for Lea County shows that 728 of the married-couple family households (6.3%) and 1,643 of the single-parent households (31.4%) are living below the poverty level. Within the married-couple family households, those with 1 or 2 children have the highest poverty rate, with 330 households (7.8%) falling below the poverty line. Among the single-parent households, those with 3 or 4 children have the highest poverty rate, with 560 household (61.7%) living below poverty.
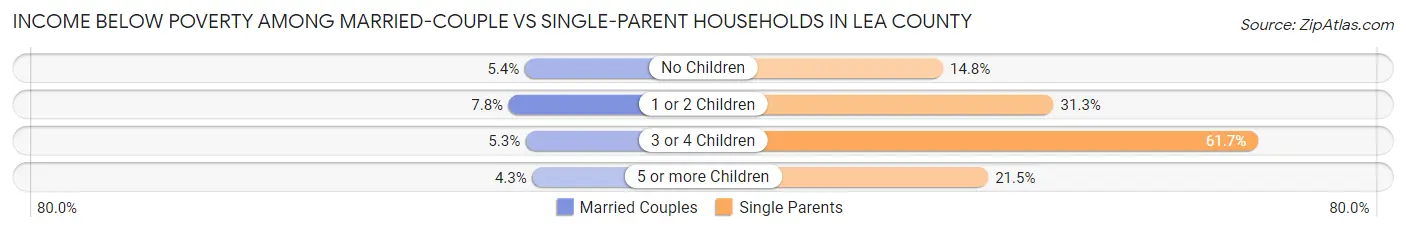
| Children | Married-Couple Families | Single-Parent Households |
| No Children | 324 (5.4%) | 232 (14.8%) |
| 1 or 2 Children | 330 (7.8%) | 823 (31.3%) |
| 3 or 4 Children | 69 (5.3%) | 560 (61.7%) |
| 5 or more Children | 5 (4.3%) | 28 (21.5%) |
| Total | 728 (6.3%) | 1,643 (31.4%) |
Race in Lea County
The most populous races in Lea County are White / Caucasian (45,587 | 62.4%), Hispanic or Latino (44,987 | 61.5%), and Two or more Races (17,350 | 23.7%).
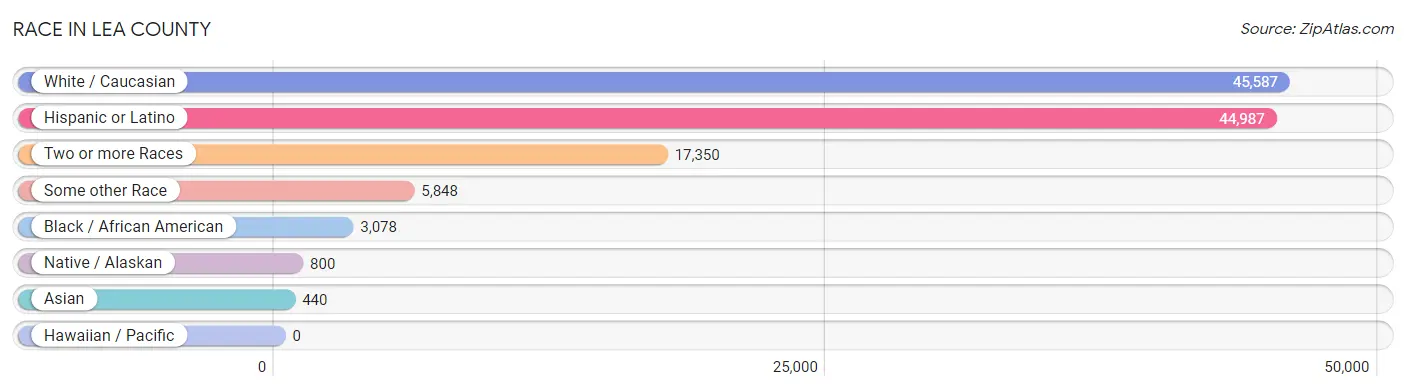
| Race | # Population | % Population |
| Asian | 440 | 0.6% |
| Black / African American | 3,078 | 4.2% |
| Hawaiian / Pacific | 0 | 0.0% |
| Hispanic or Latino | 44,987 | 61.5% |
| Native / Alaskan | 800 | 1.1% |
| White / Caucasian | 45,587 | 62.4% |
| Two or more Races | 17,350 | 23.7% |
| Some other Race | 5,848 | 8.0% |
| Total | 73,103 | 100.0% |
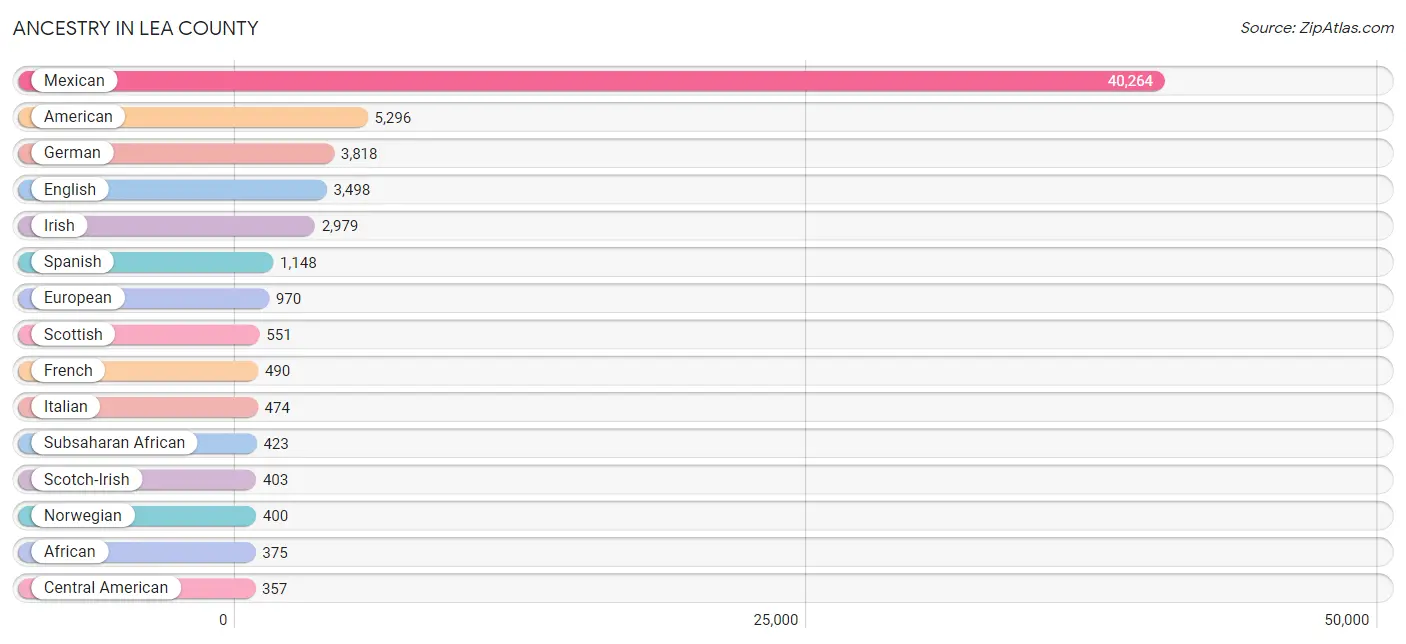
Ancestry in Lea County
The most populous ancestries reported in Lea County are Mexican (40,264 | 55.1%), American (5,296 | 7.2%), German (3,818 | 5.2%), English (3,498 | 4.8%), and Irish (2,979 | 4.1%), together accounting for 76.4% of all Lea County residents.
| Ancestry | # Population | % Population |
| African | 375 | 0.5% |
| American | 5,296 | 7.2% |
| Apache | 10 | 0.0% |
| Arab | 52 | 0.1% |
| Australian | 6 | 0.0% |
| Austrian | 10 | 0.0% |
| Belgian | 18 | 0.0% |
| Bhutanese | 5 | 0.0% |
| Brazilian | 52 | 0.1% |
| British | 222 | 0.3% |
| Canadian | 49 | 0.1% |
| Celtic | 19 | 0.0% |
| Central American | 357 | 0.5% |
| Central American Indian | 23 | 0.0% |
| Cherokee | 231 | 0.3% |
| Chickasaw | 41 | 0.1% |
| Choctaw | 87 | 0.1% |
| Colombian | 54 | 0.1% |
| Creek | 8 | 0.0% |
| Cuban | 355 | 0.5% |
| Czech | 67 | 0.1% |
| Czechoslovakian | 25 | 0.0% |
| Danish | 96 | 0.1% |
| Delaware | 21 | 0.0% |
| Dominican | 8 | 0.0% |
| Dutch | 229 | 0.3% |
| Dutch West Indian | 42 | 0.1% |
| English | 3,498 | 4.8% |
| Ethiopian | 4 | 0.0% |
| European | 970 | 1.3% |
| Finnish | 16 | 0.0% |
| French | 490 | 0.7% |
| French Canadian | 51 | 0.1% |
| German | 3,818 | 5.2% |
| Greek | 21 | 0.0% |
| Guatemalan | 38 | 0.1% |
| Haitian | 21 | 0.0% |
| Honduran | 211 | 0.3% |
| Hungarian | 3 | 0.0% |
| Icelander | 6 | 0.0% |
| Indian (Asian) | 6 | 0.0% |
| Irish | 2,979 | 4.1% |
| Italian | 474 | 0.6% |
| Jordanian | 14 | 0.0% |
| Kenyan | 19 | 0.0% |
| Kiowa | 8 | 0.0% |
| Korean | 142 | 0.2% |
| Laotian | 3 | 0.0% |
| Lebanese | 38 | 0.1% |
| Mexican | 40,264 | 55.1% |
| Mexican American Indian | 42 | 0.1% |
| Navajo | 318 | 0.4% |
| Nicaraguan | 4 | 0.0% |
| Nigerian | 44 | 0.1% |
| Norwegian | 400 | 0.5% |
| Pakistani | 6 | 0.0% |
| Polish | 92 | 0.1% |
| Portuguese | 140 | 0.2% |
| Pueblo | 108 | 0.2% |
| Puerto Rican | 189 | 0.3% |
| Russian | 20 | 0.0% |
| Salvadoran | 104 | 0.1% |
| Scandinavian | 43 | 0.1% |
| Scotch-Irish | 403 | 0.5% |
| Scottish | 551 | 0.7% |
| Seminole | 8 | 0.0% |
| Shoshone | 23 | 0.0% |
| Sioux | 11 | 0.0% |
| South American | 54 | 0.1% |
| Spaniard | 194 | 0.3% |
| Spanish | 1,148 | 1.6% |
| Sri Lankan | 4 | 0.0% |
| Subsaharan African | 423 | 0.6% |
| Swedish | 57 | 0.1% |
| Swiss | 106 | 0.2% |
| Thai | 73 | 0.1% |
| Ukrainian | 7 | 0.0% |
| Welsh | 245 | 0.3% | View All 78 Rows |
Immigrants in Lea County
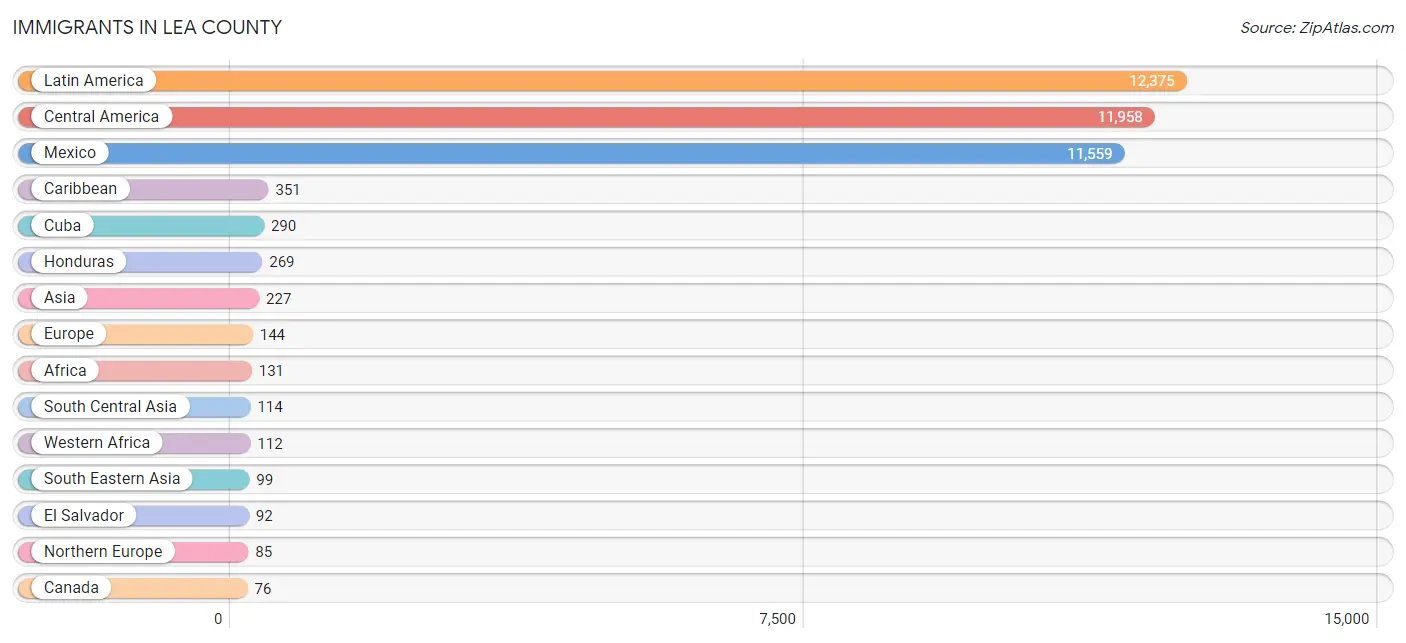
The most numerous immigrant groups reported in Lea County came from Latin America (12,375 | 16.9%), Central America (11,958 | 16.4%), Mexico (11,559 | 15.8%), Caribbean (351 | 0.5%), and Cuba (290 | 0.4%), together accounting for 50.0% of all Lea County residents.
| Immigration Origin | # Population | % Population |
| Africa | 131 | 0.2% |
| Asia | 227 | 0.3% |
| Brazil | 46 | 0.1% |
| Canada | 76 | 0.1% |
| Caribbean | 351 | 0.5% |
| Central America | 11,958 | 16.4% |
| China | 1 | 0.0% |
| Colombia | 20 | 0.0% |
| Cuba | 290 | 0.4% |
| Dominican Republic | 1 | 0.0% |
| Eastern Africa | 19 | 0.0% |
| Eastern Asia | 1 | 0.0% |
| Eastern Europe | 1 | 0.0% |
| El Salvador | 92 | 0.1% |
| Europe | 144 | 0.2% |
| France | 16 | 0.0% |
| Germany | 42 | 0.1% |
| Guatemala | 38 | 0.1% |
| Honduras | 269 | 0.4% |
| India | 31 | 0.0% |
| Indonesia | 3 | 0.0% |
| Jamaica | 60 | 0.1% |
| Kenya | 19 | 0.0% |
| Latin America | 12,375 | 16.9% |
| Lebanon | 13 | 0.0% |
| Malaysia | 5 | 0.0% |
| Mexico | 11,559 | 15.8% |
| Nepal | 43 | 0.1% |
| Nigeria | 44 | 0.1% |
| Northern Europe | 85 | 0.1% |
| Norway | 46 | 0.1% |
| Pakistan | 40 | 0.1% |
| Philippines | 73 | 0.1% |
| Russia | 1 | 0.0% |
| South America | 66 | 0.1% |
| South Central Asia | 114 | 0.2% |
| South Eastern Asia | 99 | 0.1% |
| Taiwan | 1 | 0.0% |
| Vietnam | 4 | 0.0% |
| Western Africa | 112 | 0.2% |
| Western Asia | 13 | 0.0% |
| Western Europe | 58 | 0.1% | View All 42 Rows |
Sex and Age in Lea County
Sex and Age in Lea County
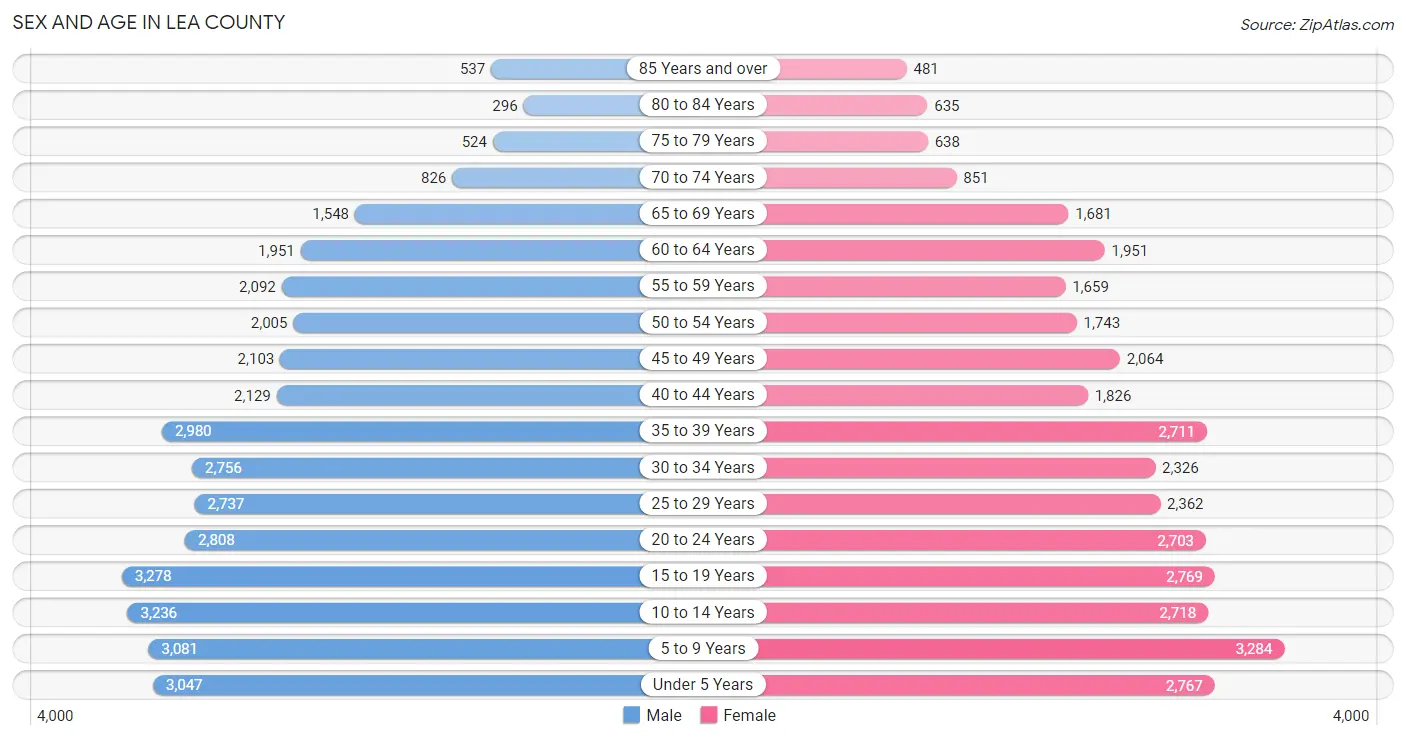
The most populous age groups in Lea County are 15 to 19 Years (3,278 | 8.6%) for men and 5 to 9 Years (3,284 | 9.3%) for women.
| Age Bracket | Male | Female |
| Under 5 Years | 3,047 (8.0%) | 2,767 (7.9%) |
| 5 to 9 Years | 3,081 (8.1%) | 3,284 (9.3%) |
| 10 to 14 Years | 3,236 (8.5%) | 2,718 (7.7%) |
| 15 to 19 Years | 3,278 (8.6%) | 2,769 (7.9%) |
| 20 to 24 Years | 2,808 (7.4%) | 2,703 (7.7%) |
| 25 to 29 Years | 2,737 (7.2%) | 2,362 (6.7%) |
| 30 to 34 Years | 2,756 (7.3%) | 2,326 (6.6%) |
| 35 to 39 Years | 2,980 (7.9%) | 2,711 (7.7%) |
| 40 to 44 Years | 2,129 (5.6%) | 1,826 (5.2%) |
| 45 to 49 Years | 2,103 (5.5%) | 2,064 (5.9%) |
| 50 to 54 Years | 2,005 (5.3%) | 1,743 (5.0%) |
| 55 to 59 Years | 2,092 (5.5%) | 1,659 (4.7%) |
| 60 to 64 Years | 1,951 (5.1%) | 1,951 (5.6%) |
| 65 to 69 Years | 1,548 (4.1%) | 1,681 (4.8%) |
| 70 to 74 Years | 826 (2.2%) | 851 (2.4%) |
| 75 to 79 Years | 524 (1.4%) | 638 (1.8%) |
| 80 to 84 Years | 296 (0.8%) | 635 (1.8%) |
| 85 Years and over | 537 (1.4%) | 481 (1.4%) |
| Total | 37,934 (100.0%) | 35,169 (100.0%) |
Families and Households in Lea County
Median Family Size in Lea County
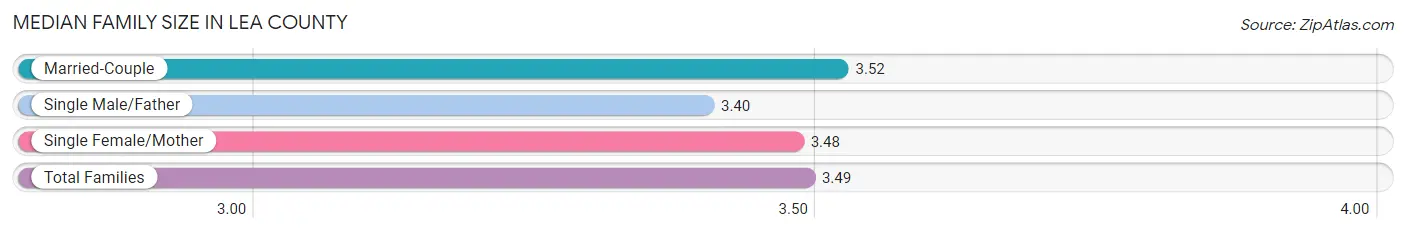
The median family size in Lea County is 3.49 persons per family, with married-couple families (11,597 | 68.9%) accounting for the largest median family size of 3.52 persons per family. On the other hand, single male/father families (2,149 | 12.8%) represent the smallest median family size with 3.40 persons per family.
| Family Type | # Families | Family Size |
| Married-Couple | 11,597 (68.9%) | 3.52 |
| Single Male/Father | 2,149 (12.8%) | 3.40 |
| Single Female/Mother | 3,083 (18.3%) | 3.48 |
| Total Families | 16,829 (100.0%) | 3.49 |
Median Household Size in Lea County
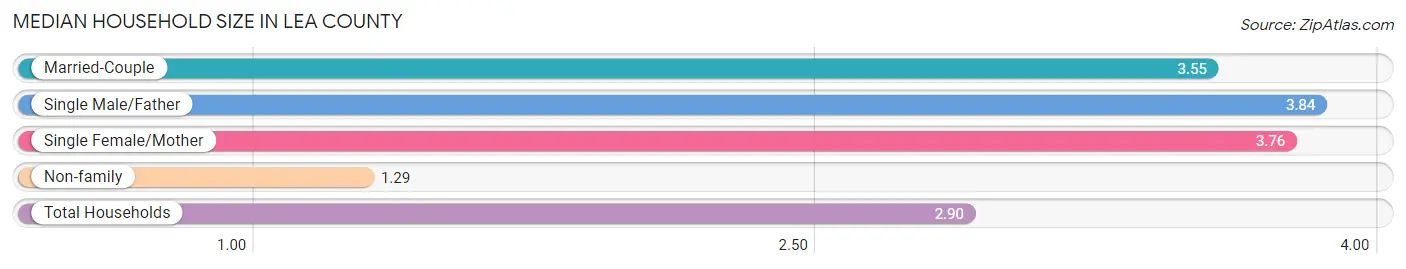
The median household size in Lea County is 2.90 persons per household, with single male/father households (2,149 | 8.8%) accounting for the largest median household size of 3.84 persons per household. non-family households (7,550 | 31.0%) represent the smallest median household size with 1.29 persons per household.
| Household Type | # Households | Household Size |
| Married-Couple | 11,597 (47.6%) | 3.55 |
| Single Male/Father | 2,149 (8.8%) | 3.84 |
| Single Female/Mother | 3,083 (12.7%) | 3.76 |
| Non-family | 7,550 (31.0%) | 1.29 |
| Total Households | 24,379 (100.0%) | 2.90 |
Household Size by Marriage Status in Lea County
Out of a total of 24,379 households in Lea County, 16,829 (69.0%) are family households, while 7,550 (31.0%) are nonfamily households. The most numerous type of family households are 2-person households, comprising 6,544, and the most common type of nonfamily households are 1-person households, comprising 6,213.
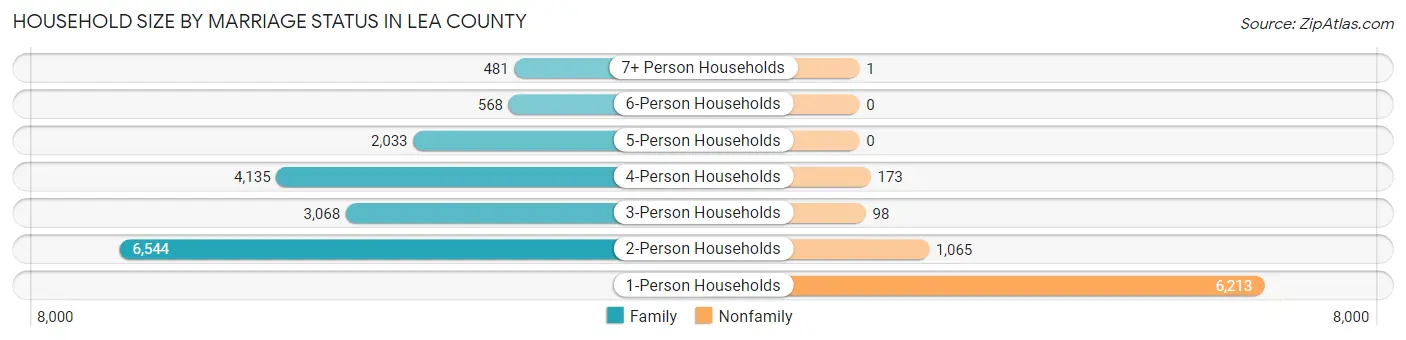
| Household Size | Family Households | Nonfamily Households |
| 1-Person Households | - | 6,213 (25.5%) |
| 2-Person Households | 6,544 (26.8%) | 1,065 (4.4%) |
| 3-Person Households | 3,068 (12.6%) | 98 (0.4%) |
| 4-Person Households | 4,135 (17.0%) | 173 (0.7%) |
| 5-Person Households | 2,033 (8.3%) | 0 (0.0%) |
| 6-Person Households | 568 (2.3%) | 0 (0.0%) |
| 7+ Person Households | 481 (2.0%) | 1 (0.0%) |
| Total | 16,829 (69.0%) | 7,550 (31.0%) |
Female Fertility in Lea County
Fertility by Age in Lea County
Average fertility rate in Lea County is 74.0 births per 1,000 women. Women in the age bracket of 20 to 34 years have the highest fertility rate with 122.0 births per 1,000 women. Women in the age bracket of 20 to 34 years acount for 71.3% of all women with births.
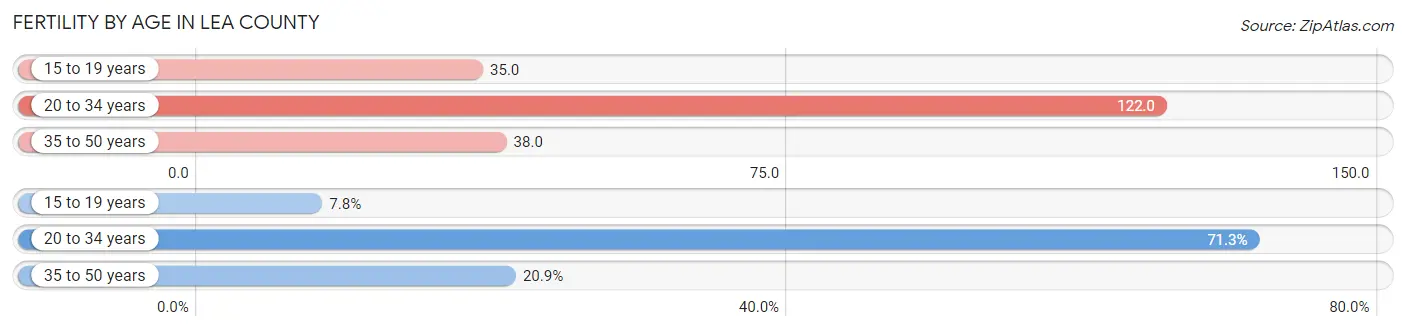
| Age Bracket | Women with Births | Births / 1,000 Women |
| 15 to 19 years | 98 (7.8%) | 35.0 |
| 20 to 34 years | 901 (71.3%) | 122.0 |
| 35 to 50 years | 264 (20.9%) | 38.0 |
| Total | 1,263 (100.0%) | 74.0 |
Fertility by Age by Marriage Status in Lea County
50.7% of women with births (1,263) in Lea County are married. The highest percentage of unmarried women with births falls into 15 to 19 years age bracket with 68.4% of them unmarried at the time of birth, while the lowest percentage of unmarried women with births belong to 35 to 50 years age bracket with 37.9% of them unmarried.
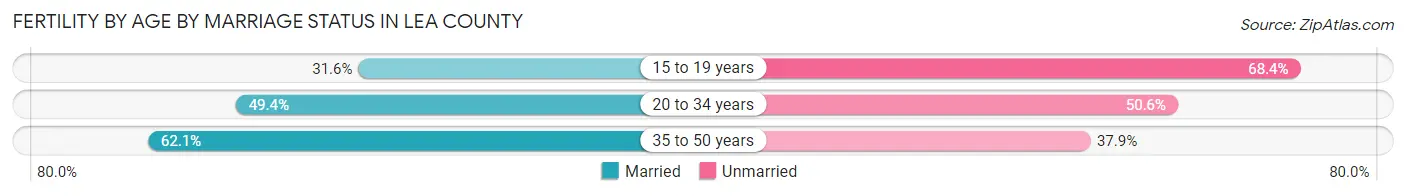
| Age Bracket | Married | Unmarried |
| 15 to 19 years | 31 (31.6%) | 67 (68.4%) |
| 20 to 34 years | 445 (49.4%) | 456 (50.6%) |
| 35 to 50 years | 164 (62.1%) | 100 (37.9%) |
| Total | 640 (50.7%) | 623 (49.3%) |
Fertility by Education in Lea County
Average fertility rate in Lea County is 74.0 births per 1,000 women. Women with the education attainment of graduate degree have the highest fertility rate of 108.0 births per 1,000 women, while women with the education attainment of bachelor's degree have the lowest fertility at 40.0 births per 1,000 women. Women with the education attainment of high school diploma represent 37.4% of all women with births.
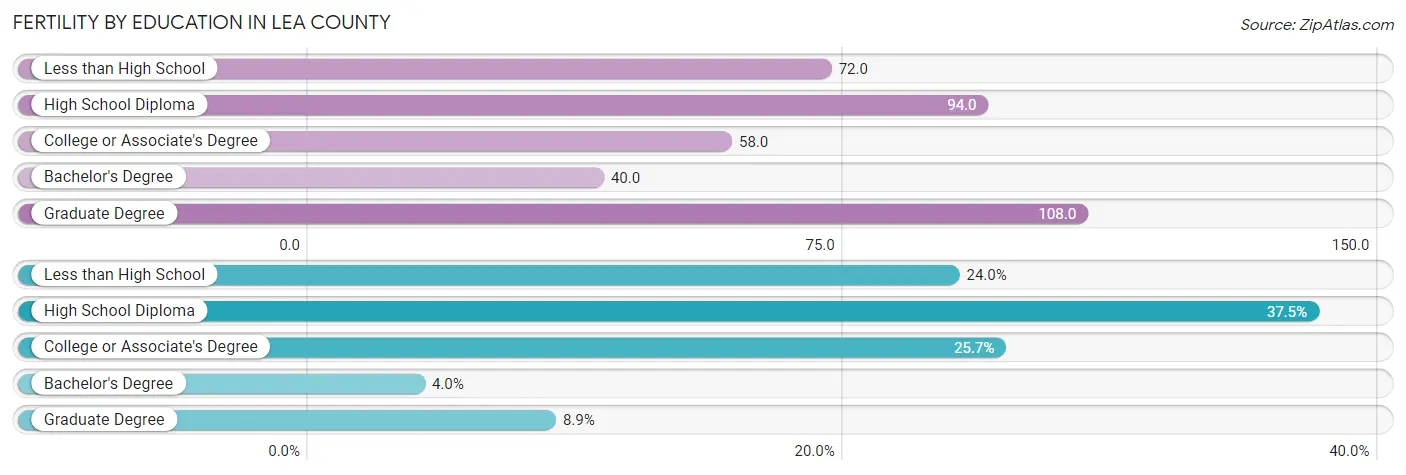
| Educational Attainment | Women with Births | Births / 1,000 Women |
| Less than High School | 303 (24.0%) | 72.0 |
| High School Diploma | 473 (37.4%) | 94.0 |
| College or Associate's Degree | 325 (25.7%) | 58.0 |
| Bachelor's Degree | 50 (4.0%) | 40.0 |
| Graduate Degree | 112 (8.9%) | 108.0 |
| Total | 1,263 (100.0%) | 74.0 |
Fertility by Education by Marriage Status in Lea County
49.3% of women with births in Lea County are unmarried. Women with the educational attainment of college or associate's degree are most likely to be married with 74.2% of them married at childbirth, while women with the educational attainment of high school diploma are least likely to be married with 64.9% of them unmarried at childbirth.
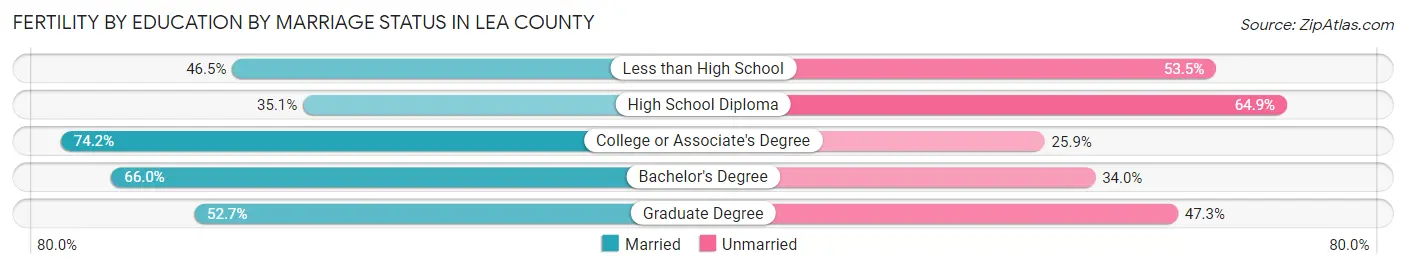
| Educational Attainment | Married | Unmarried |
| Less than High School | 141 (46.5%) | 162 (53.5%) |
| High School Diploma | 166 (35.1%) | 307 (64.9%) |
| College or Associate's Degree | 241 (74.2%) | 84 (25.9%) |
| Bachelor's Degree | 33 (66.0%) | 17 (34.0%) |
| Graduate Degree | 59 (52.7%) | 53 (47.3%) |
| Total | 640 (50.7%) | 623 (49.3%) |
Employment Characteristics in Lea County
Employment by Class of Employer in Lea County
Among the 30,122 employed individuals in Lea County, private company employees (21,301 | 70.7%), local government employees (2,643 | 8.8%), and self-employed (not incorporated) (1,806 | 6.0%) make up the most common classes of employment.
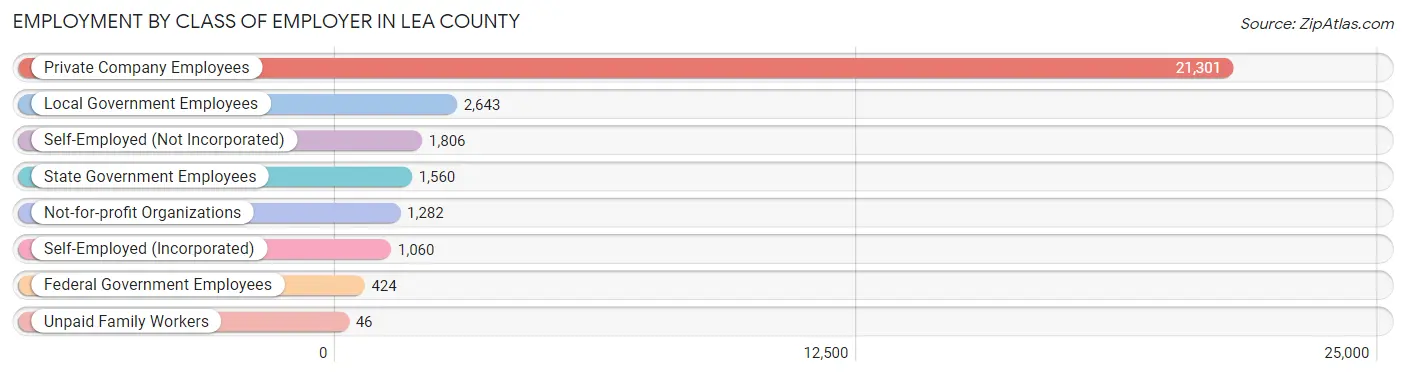
| Employer Class | # Employees | % Employees |
| Private Company Employees | 21,301 | 70.7% |
| Self-Employed (Incorporated) | 1,060 | 3.5% |
| Self-Employed (Not Incorporated) | 1,806 | 6.0% |
| Not-for-profit Organizations | 1,282 | 4.3% |
| Local Government Employees | 2,643 | 8.8% |
| State Government Employees | 1,560 | 5.2% |
| Federal Government Employees | 424 | 1.4% |
| Unpaid Family Workers | 46 | 0.2% |
| Total | 30,122 | 100.0% |
Employment Status by Age in Lea County
According to the labor force statistics for Lea County, out of the total population over 16 years of age (53,500), 62.3% or 33,330 individuals are in the labor force, with 7.4% or 2,466 of them unemployed. The age group with the highest labor force participation rate is 35 to 44 years, with 74.5% or 7,186 individuals in the labor force. Within the labor force, the 16 to 19 years age range has the highest percentage of unemployed individuals, with 18.9% or 385 of them being unemployed.
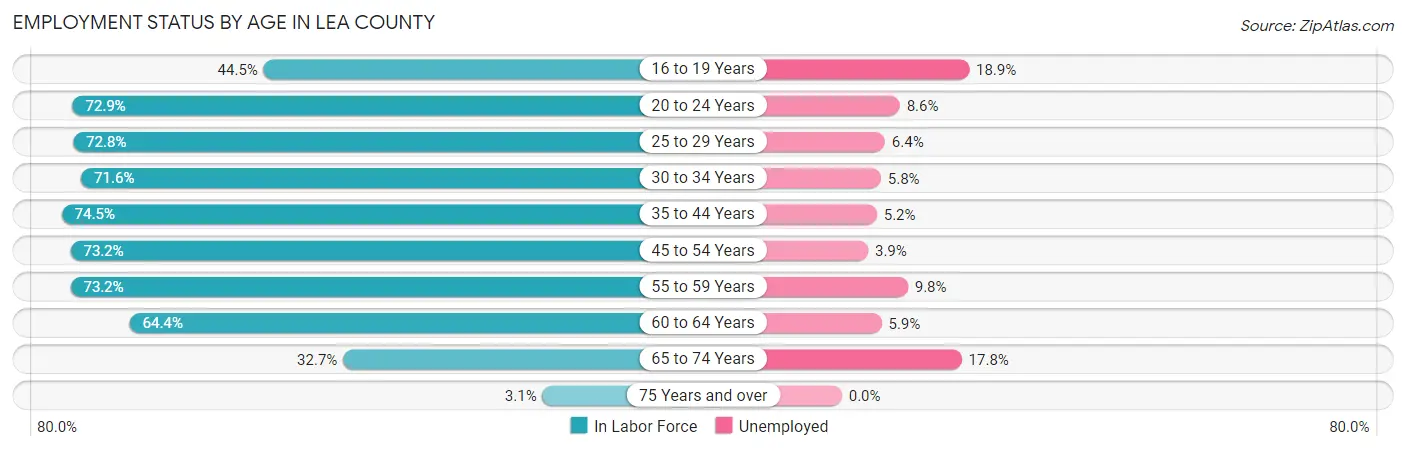
| Age Bracket | In Labor Force | Unemployed |
| 16 to 19 Years | 2,037 (44.5%) | 385 (18.9%) |
| 20 to 24 Years | 4,018 (72.9%) | 346 (8.6%) |
| 25 to 29 Years | 3,712 (72.8%) | 238 (6.4%) |
| 30 to 34 Years | 3,639 (71.6%) | 211 (5.8%) |
| 35 to 44 Years | 7,186 (74.5%) | 374 (5.2%) |
| 45 to 54 Years | 5,794 (73.2%) | 226 (3.9%) |
| 55 to 59 Years | 2,746 (73.2%) | 269 (9.8%) |
| 60 to 64 Years | 2,513 (64.4%) | 148 (5.9%) |
| 65 to 74 Years | 1,604 (32.7%) | 286 (17.8%) |
| 75 Years and over | 96 (3.1%) | 0 (0.0%) |
| Total | 33,330 (62.3%) | 2,466 (7.4%) |
Employment Status by Educational Attainment in Lea County
According to labor force statistics for Lea County, 72.3% of individuals (25,591) out of the total population between 25 and 64 years of age (35,395) are in the labor force, with 5.7% or 1,459 of them being unemployed. The group with the highest labor force participation rate are those with the educational attainment of bachelor's degree or higher, with 86.3% or 4,410 individuals in the labor force. Within the labor force, individuals with high school diploma education have the highest percentage of unemployment, with 8.6% or 701 of them being unemployed.
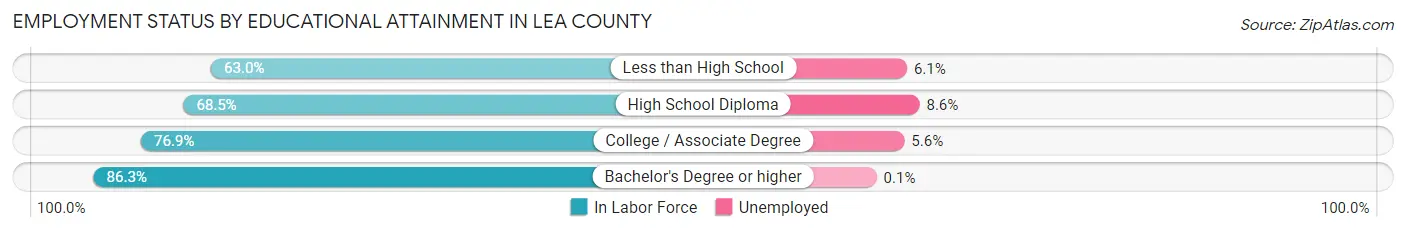
| Educational Attainment | In Labor Force | Unemployed |
| Less than High School | 5,010 (63.0%) | 485 (6.1%) |
| High School Diploma | 8,147 (68.5%) | 1,023 (8.6%) |
| College / Associate Degree | 8,027 (76.9%) | 585 (5.6%) |
| Bachelor's Degree or higher | 4,410 (86.3%) | 5 (0.1%) |
| Total | 25,591 (72.3%) | 2,018 (5.7%) |
Employment Occupations by Sex in Lea County
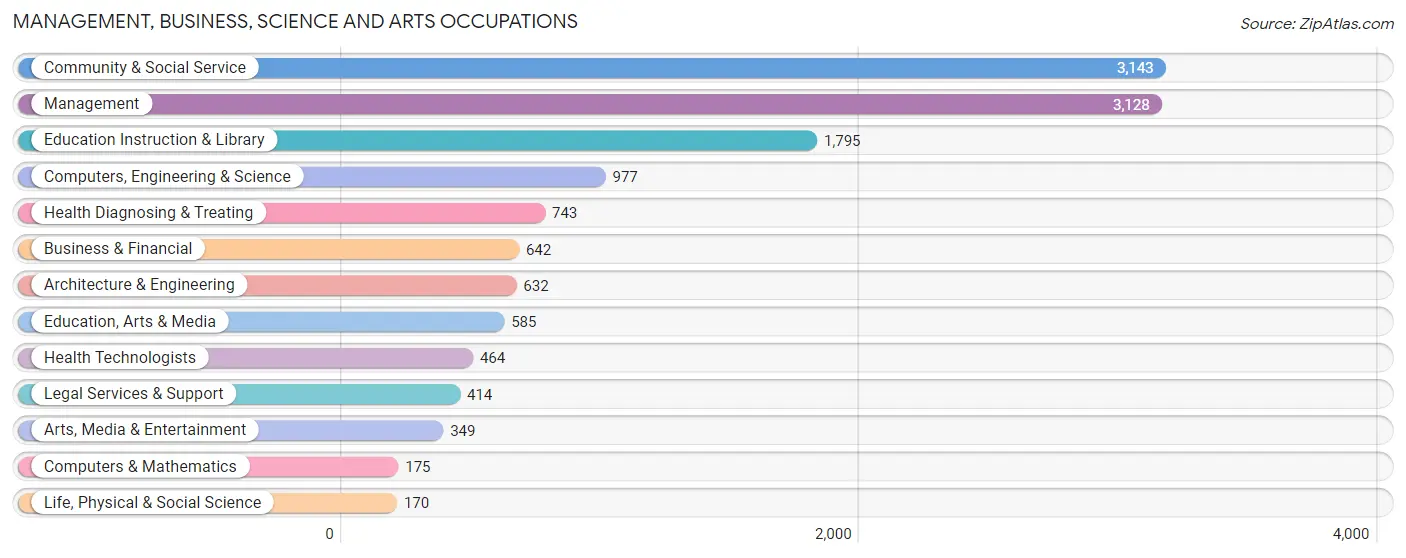
Management, Business, Science and Arts Occupations
The most common Management, Business, Science and Arts occupations in Lea County are Community & Social Service (3,143 | 10.2%), Management (3,128 | 10.2%), Education Instruction & Library (1,795 | 5.8%), Computers, Engineering & Science (977 | 3.2%), and Health Diagnosing & Treating (743 | 2.4%).
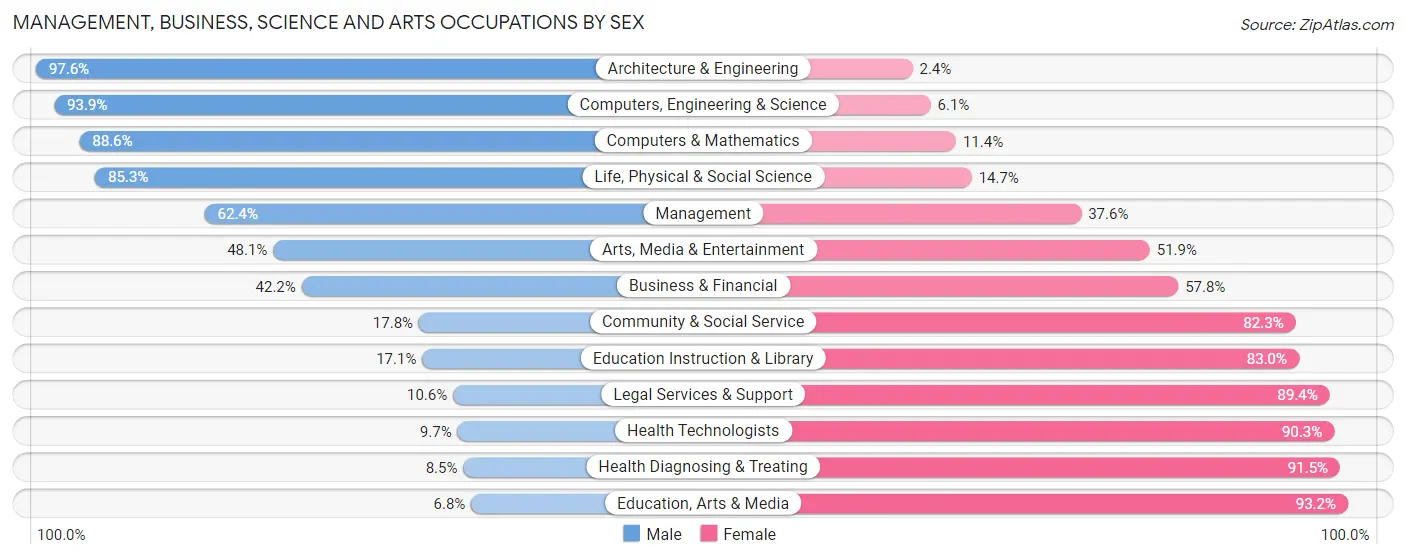
Management, Business, Science and Arts Occupations by Sex
Within the Management, Business, Science and Arts occupations in Lea County, the most male-oriented occupations are Architecture & Engineering (97.6%), Computers, Engineering & Science (93.9%), and Computers & Mathematics (88.6%), while the most female-oriented occupations are Education, Arts & Media (93.2%), Health Diagnosing & Treating (91.5%), and Health Technologists (90.3%).
| Occupation | Male | Female |
| Management | 1,953 (62.4%) | 1,175 (37.6%) |
| Business & Financial | 271 (42.2%) | 371 (57.8%) |
| Computers, Engineering & Science | 917 (93.9%) | 60 (6.1%) |
| Computers & Mathematics | 155 (88.6%) | 20 (11.4%) |
| Architecture & Engineering | 617 (97.6%) | 15 (2.4%) |
| Life, Physical & Social Science | 145 (85.3%) | 25 (14.7%) |
| Community & Social Service | 558 (17.7%) | 2,585 (82.3%) |
| Education, Arts & Media | 40 (6.8%) | 545 (93.2%) |
| Legal Services & Support | 44 (10.6%) | 370 (89.4%) |
| Education Instruction & Library | 306 (17.1%) | 1,489 (83.0%) |
| Arts, Media & Entertainment | 168 (48.1%) | 181 (51.9%) |
| Health Diagnosing & Treating | 63 (8.5%) | 680 (91.5%) |
| Health Technologists | 45 (9.7%) | 419 (90.3%) |
| Total (Category) | 3,762 (43.6%) | 4,871 (56.4%) |
| Total (Overall) | 18,529 (60.2%) | 12,274 (39.9%) |
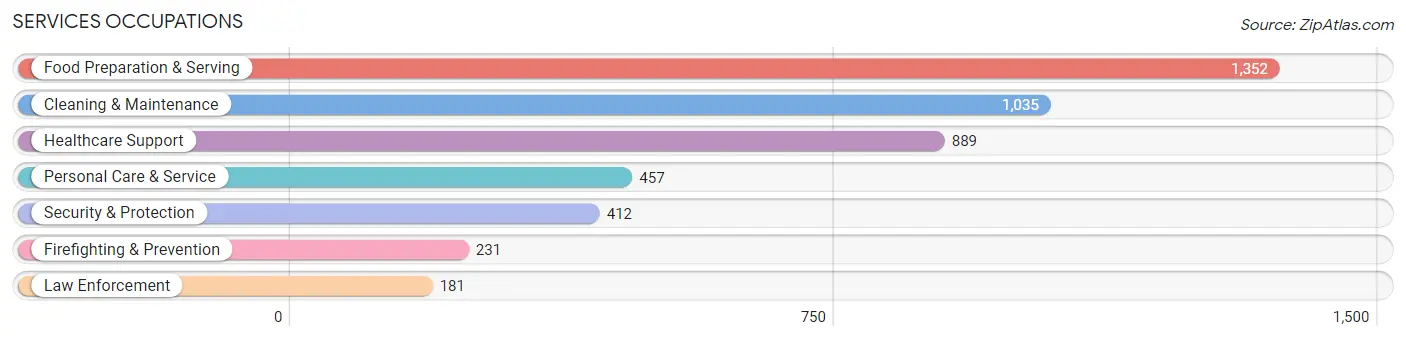
Services Occupations
The most common Services occupations in Lea County are Food Preparation & Serving (1,352 | 4.4%), Cleaning & Maintenance (1,035 | 3.4%), Healthcare Support (889 | 2.9%), Personal Care & Service (457 | 1.5%), and Security & Protection (412 | 1.3%).
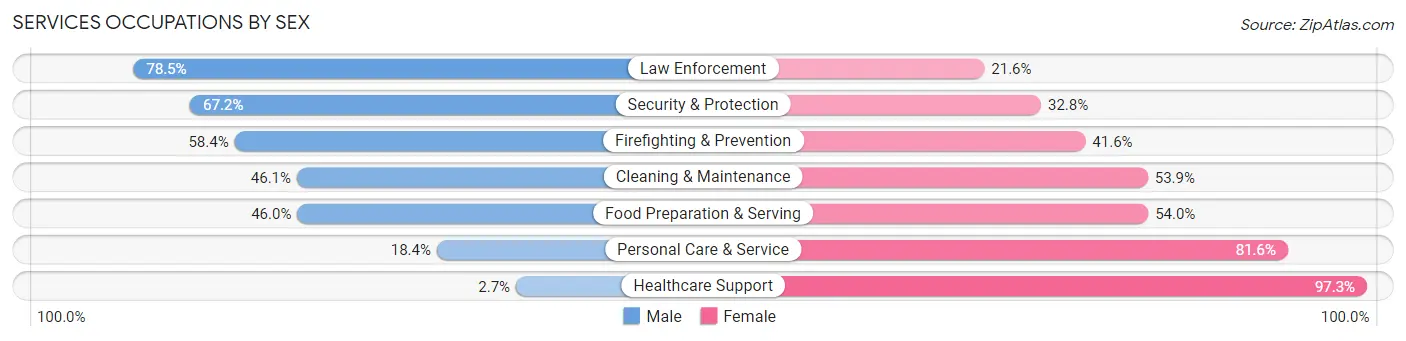
Services Occupations by Sex
Within the Services occupations in Lea County, the most male-oriented occupations are Law Enforcement (78.4%), Security & Protection (67.2%), and Firefighting & Prevention (58.4%), while the most female-oriented occupations are Healthcare Support (97.3%), Personal Care & Service (81.6%), and Food Preparation & Serving (54.0%).
| Occupation | Male | Female |
| Healthcare Support | 24 (2.7%) | 865 (97.3%) |
| Security & Protection | 277 (67.2%) | 135 (32.8%) |
| Firefighting & Prevention | 135 (58.4%) | 96 (41.6%) |
| Law Enforcement | 142 (78.4%) | 39 (21.5%) |
| Food Preparation & Serving | 622 (46.0%) | 730 (54.0%) |
| Cleaning & Maintenance | 477 (46.1%) | 558 (53.9%) |
| Personal Care & Service | 84 (18.4%) | 373 (81.6%) |
| Total (Category) | 1,484 (35.8%) | 2,661 (64.2%) |
| Total (Overall) | 18,529 (60.2%) | 12,274 (39.9%) |
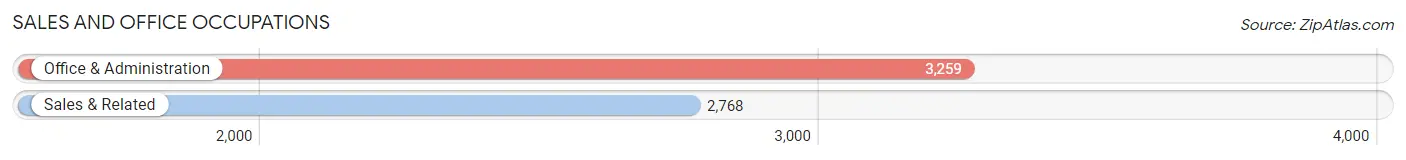
Sales and Office Occupations
The most common Sales and Office occupations in Lea County are Office & Administration (3,259 | 10.6%), and Sales & Related (2,768 | 9.0%).
Sales and Office Occupations by Sex
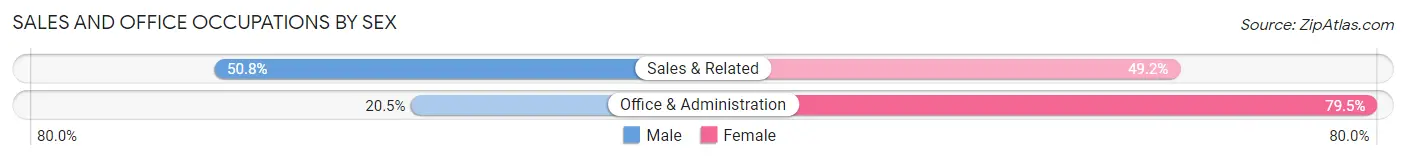
| Occupation | Male | Female |
| Sales & Related | 1,407 (50.8%) | 1,361 (49.2%) |
| Office & Administration | 668 (20.5%) | 2,591 (79.5%) |
| Total (Category) | 2,075 (34.4%) | 3,952 (65.6%) |
| Total (Overall) | 18,529 (60.2%) | 12,274 (39.9%) |
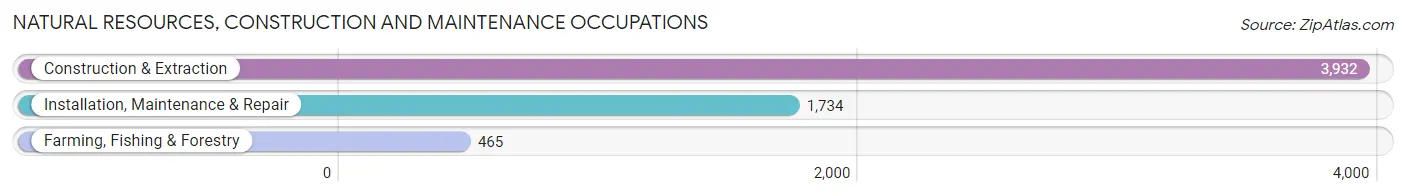
Natural Resources, Construction and Maintenance Occupations
The most common Natural Resources, Construction and Maintenance occupations in Lea County are Construction & Extraction (3,932 | 12.8%), Installation, Maintenance & Repair (1,734 | 5.6%), and Farming, Fishing & Forestry (465 | 1.5%).
Natural Resources, Construction and Maintenance Occupations by Sex
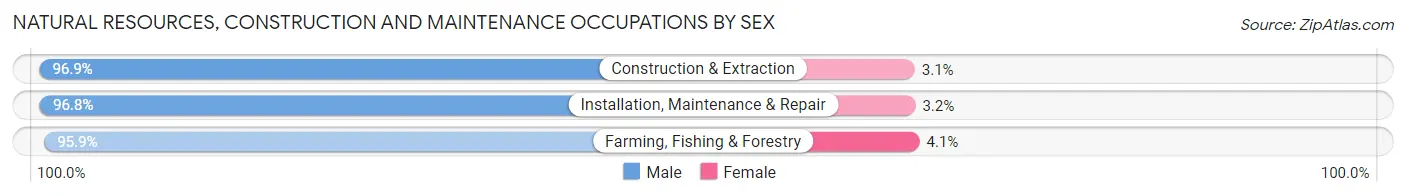
| Occupation | Male | Female |
| Farming, Fishing & Forestry | 446 (95.9%) | 19 (4.1%) |
| Construction & Extraction | 3,810 (96.9%) | 122 (3.1%) |
| Installation, Maintenance & Repair | 1,678 (96.8%) | 56 (3.2%) |
| Total (Category) | 5,934 (96.8%) | 197 (3.2%) |
| Total (Overall) | 18,529 (60.2%) | 12,274 (39.9%) |
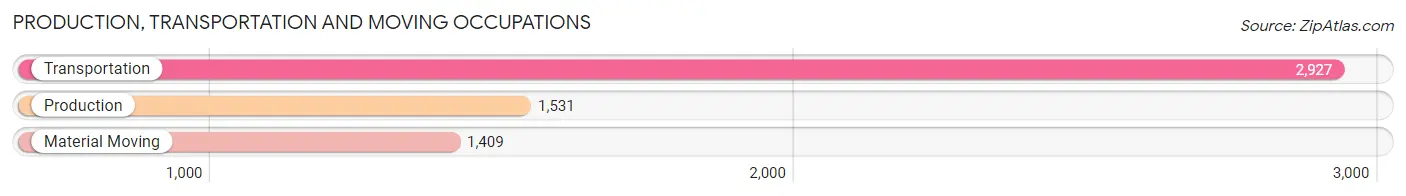
Production, Transportation and Moving Occupations
The most common Production, Transportation and Moving occupations in Lea County are Transportation (2,927 | 9.5%), Production (1,531 | 5.0%), and Material Moving (1,409 | 4.6%).
Production, Transportation and Moving Occupations by Sex
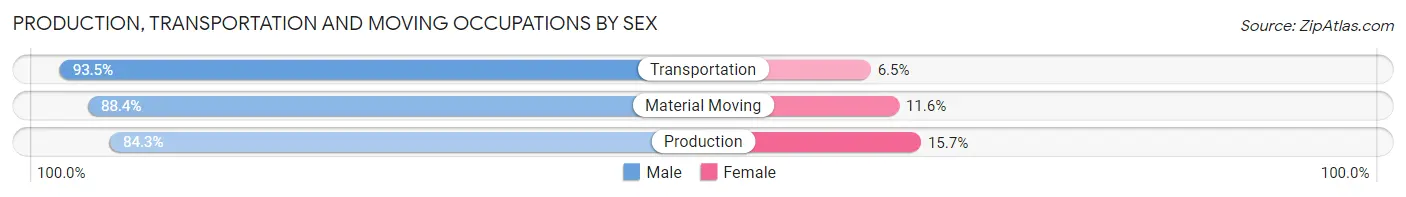
| Occupation | Male | Female |
| Production | 1,291 (84.3%) | 240 (15.7%) |
| Transportation | 2,738 (93.5%) | 189 (6.5%) |
| Material Moving | 1,245 (88.4%) | 164 (11.6%) |
| Total (Category) | 5,274 (89.9%) | 593 (10.1%) |
| Total (Overall) | 18,529 (60.2%) | 12,274 (39.9%) |
Employment Industries by Sex in Lea County
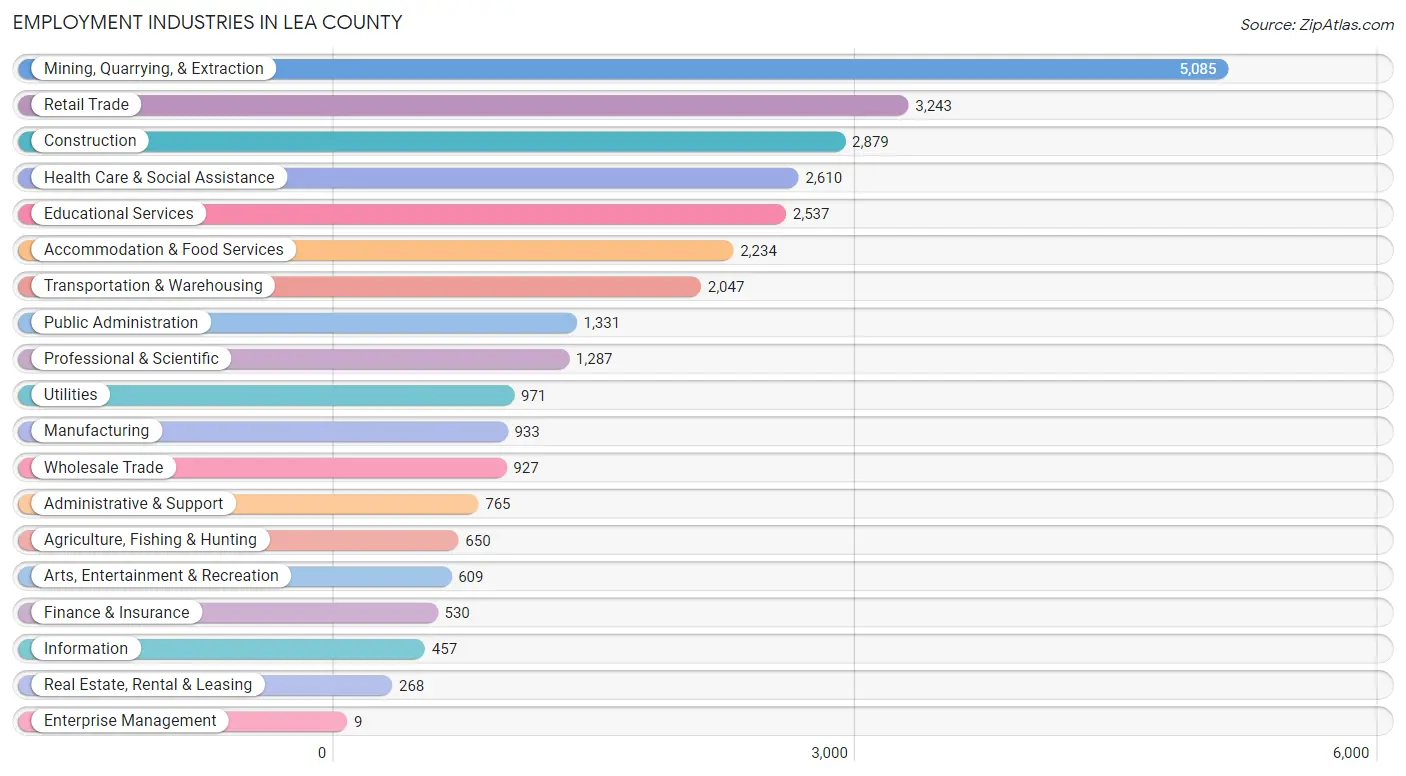
Employment Industries in Lea County
The major employment industries in Lea County include Mining, Quarrying, & Extraction (5,085 | 16.5%), Retail Trade (3,243 | 10.5%), Construction (2,879 | 9.3%), Health Care & Social Assistance (2,610 | 8.5%), and Educational Services (2,537 | 8.2%).
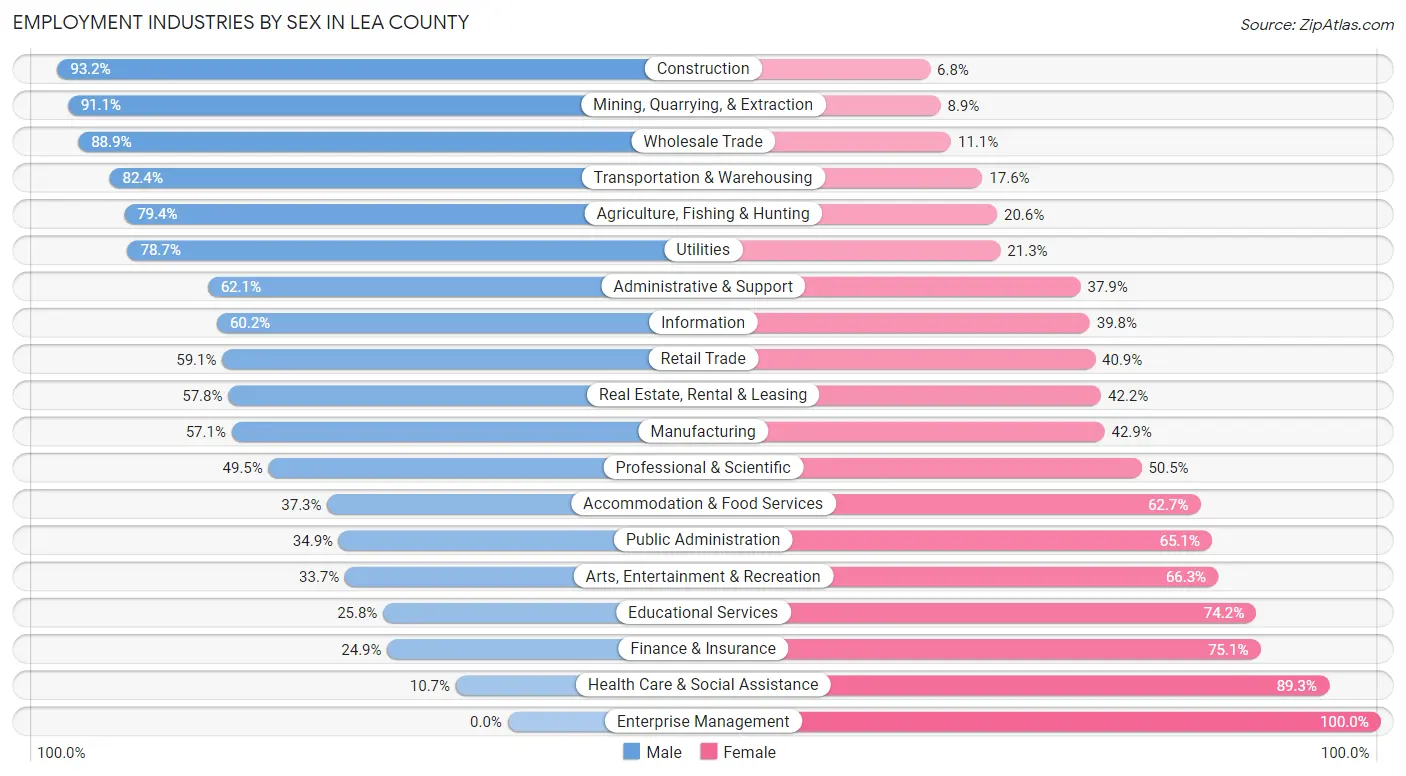
Employment Industries by Sex in Lea County
The Lea County industries that see more men than women are Construction (93.2%), Mining, Quarrying, & Extraction (91.1%), and Wholesale Trade (88.9%), whereas the industries that tend to have a higher number of women are Enterprise Management (100.0%), Health Care & Social Assistance (89.3%), and Finance & Insurance (75.1%).
| Industry | Male | Female |
| Agriculture, Fishing & Hunting | 516 (79.4%) | 134 (20.6%) |
| Mining, Quarrying, & Extraction | 4,631 (91.1%) | 454 (8.9%) |
| Construction | 2,684 (93.2%) | 195 (6.8%) |
| Manufacturing | 533 (57.1%) | 400 (42.9%) |
| Wholesale Trade | 824 (88.9%) | 103 (11.1%) |
| Retail Trade | 1,916 (59.1%) | 1,327 (40.9%) |
| Transportation & Warehousing | 1,687 (82.4%) | 360 (17.6%) |
| Utilities | 764 (78.7%) | 207 (21.3%) |
| Information | 275 (60.2%) | 182 (39.8%) |
| Finance & Insurance | 132 (24.9%) | 398 (75.1%) |
| Real Estate, Rental & Leasing | 155 (57.8%) | 113 (42.2%) |
| Professional & Scientific | 637 (49.5%) | 650 (50.5%) |
| Enterprise Management | 0 (0.0%) | 9 (100.0%) |
| Administrative & Support | 475 (62.1%) | 290 (37.9%) |
| Educational Services | 654 (25.8%) | 1,883 (74.2%) |
| Health Care & Social Assistance | 280 (10.7%) | 2,330 (89.3%) |
| Arts, Entertainment & Recreation | 205 (33.7%) | 404 (66.3%) |
| Accommodation & Food Services | 834 (37.3%) | 1,400 (62.7%) |
| Public Administration | 465 (34.9%) | 866 (65.1%) |
| Total | 18,529 (60.2%) | 12,274 (39.9%) |
Education in Lea County
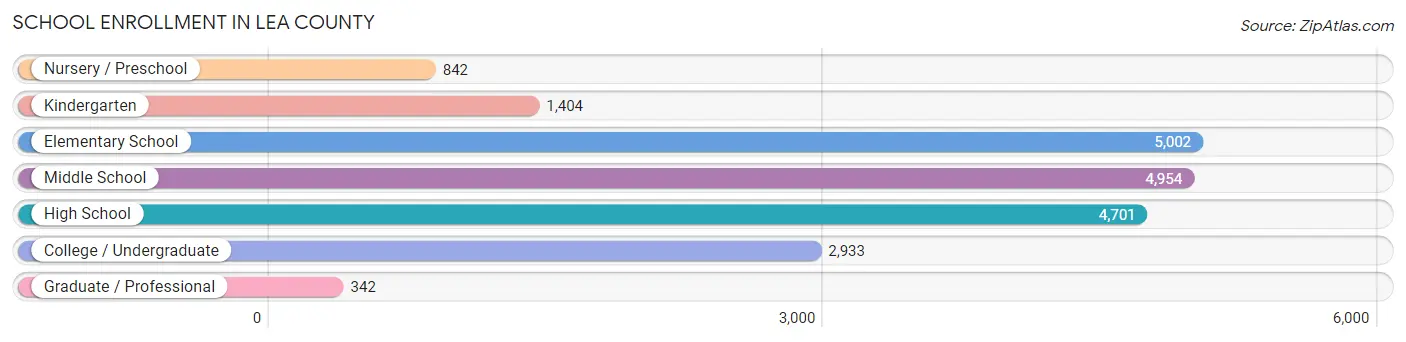
School Enrollment in Lea County
The most common levels of schooling among the 20,178 students in Lea County are elementary school (5,002 | 24.8%), middle school (4,954 | 24.5%), and high school (4,701 | 23.3%).
| School Level | # Students | % Students |
| Nursery / Preschool | 842 | 4.2% |
| Kindergarten | 1,404 | 7.0% |
| Elementary School | 5,002 | 24.8% |
| Middle School | 4,954 | 24.5% |
| High School | 4,701 | 23.3% |
| College / Undergraduate | 2,933 | 14.5% |
| Graduate / Professional | 342 | 1.7% |
| Total | 20,178 | 100.0% |
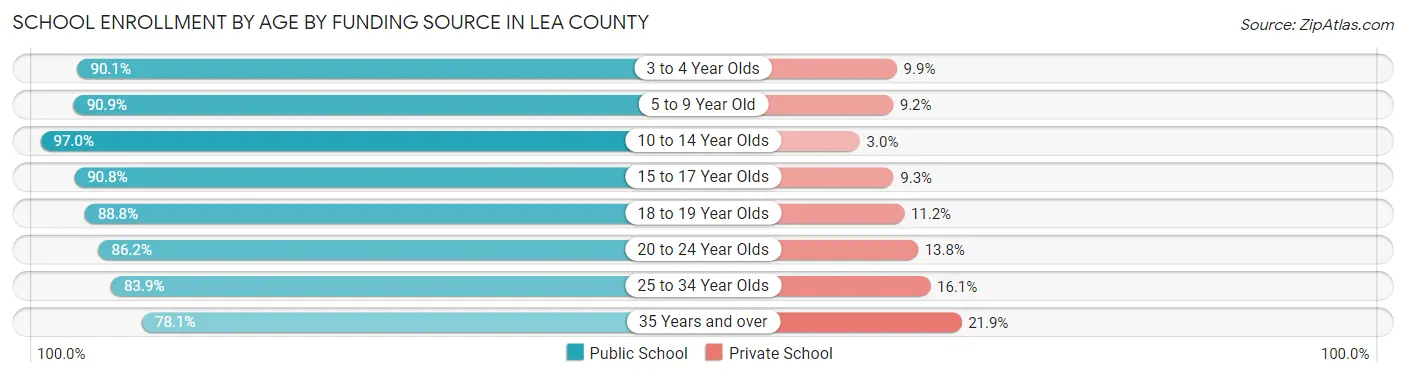
School Enrollment by Age by Funding Source in Lea County
Out of a total of 20,178 students who are enrolled in schools in Lea County, 1,695 (8.4%) attend a private institution, while the remaining 18,483 (91.6%) are enrolled in public schools. The age group of 35 years and over has the highest likelihood of being enrolled in private schools, with 118 (21.9% in the age bracket) enrolled. Conversely, the age group of 10 to 14 year olds has the lowest likelihood of being enrolled in a private school, with 5,688 (97.0% in the age bracket) attending a public institution.
| Age Bracket | Public School | Private School |
| 3 to 4 Year Olds | 557 (90.1%) | 61 (9.9%) |
| 5 to 9 Year Old | 5,540 (90.8%) | 558 (9.1%) |
| 10 to 14 Year Olds | 5,688 (97.0%) | 175 (3.0%) |
| 15 to 17 Year Olds | 3,357 (90.7%) | 342 (9.2%) |
| 18 to 19 Year Olds | 1,209 (88.8%) | 153 (11.2%) |
| 20 to 24 Year Olds | 1,038 (86.2%) | 166 (13.8%) |
| 25 to 34 Year Olds | 667 (83.9%) | 128 (16.1%) |
| 35 Years and over | 421 (78.1%) | 118 (21.9%) |
| Total | 18,483 (91.6%) | 1,695 (8.4%) |
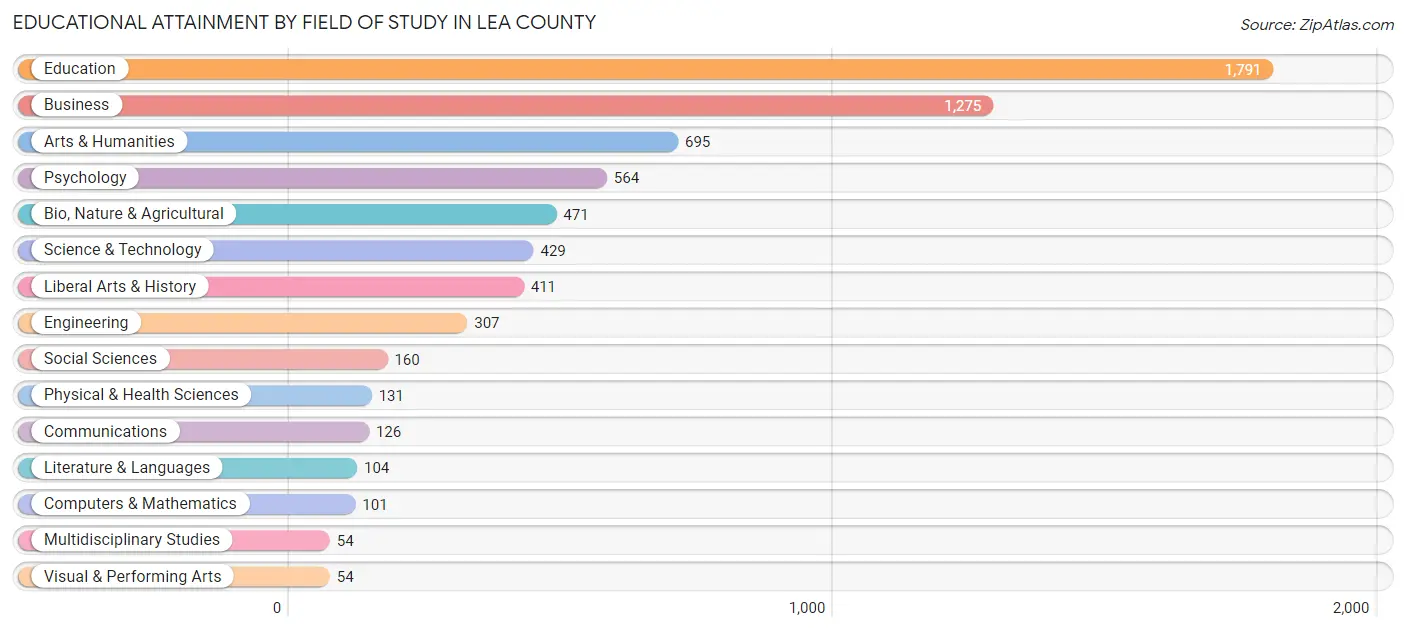
Educational Attainment by Field of Study in Lea County
Education (1,791 | 26.8%), business (1,275 | 19.1%), arts & humanities (695 | 10.4%), psychology (564 | 8.5%), and bio, nature & agricultural (471 | 7.1%) are the most common fields of study among 6,673 individuals in Lea County who have obtained a bachelor's degree or higher.
| Field of Study | # Graduates | % Graduates |
| Computers & Mathematics | 101 | 1.5% |
| Bio, Nature & Agricultural | 471 | 7.1% |
| Physical & Health Sciences | 131 | 2.0% |
| Psychology | 564 | 8.5% |
| Social Sciences | 160 | 2.4% |
| Engineering | 307 | 4.6% |
| Multidisciplinary Studies | 54 | 0.8% |
| Science & Technology | 429 | 6.4% |
| Business | 1,275 | 19.1% |
| Education | 1,791 | 26.8% |
| Literature & Languages | 104 | 1.6% |
| Liberal Arts & History | 411 | 6.2% |
| Visual & Performing Arts | 54 | 0.8% |
| Communications | 126 | 1.9% |
| Arts & Humanities | 695 | 10.4% |
| Total | 6,673 | 100.0% |
Transportation & Commute in Lea County
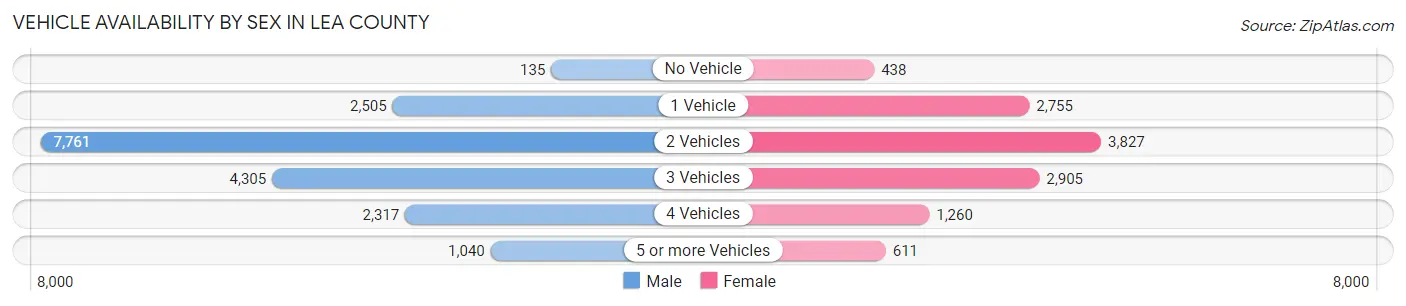
Vehicle Availability by Sex in Lea County
The most prevalent vehicle ownership categories in Lea County are males with 2 vehicles (7,761, accounting for 43.0%) and females with 2 vehicles (3,827, making up 65.8%).
| Vehicles Available | Male | Female |
| No Vehicle | 135 (0.7%) | 438 (3.7%) |
| 1 Vehicle | 2,505 (13.9%) | 2,755 (23.4%) |
| 2 Vehicles | 7,761 (43.0%) | 3,827 (32.4%) |
| 3 Vehicles | 4,305 (23.8%) | 2,905 (24.6%) |
| 4 Vehicles | 2,317 (12.8%) | 1,260 (10.7%) |
| 5 or more Vehicles | 1,040 (5.8%) | 611 (5.2%) |
| Total | 18,063 (100.0%) | 11,796 (100.0%) |
Commute Time in Lea County
The most frequently occuring commute durations in Lea County are 10 to 14 minutes (5,957 commuters, 20.5%), 5 to 9 minutes (5,725 commuters, 19.7%), and 15 to 19 minutes (4,196 commuters, 14.4%).
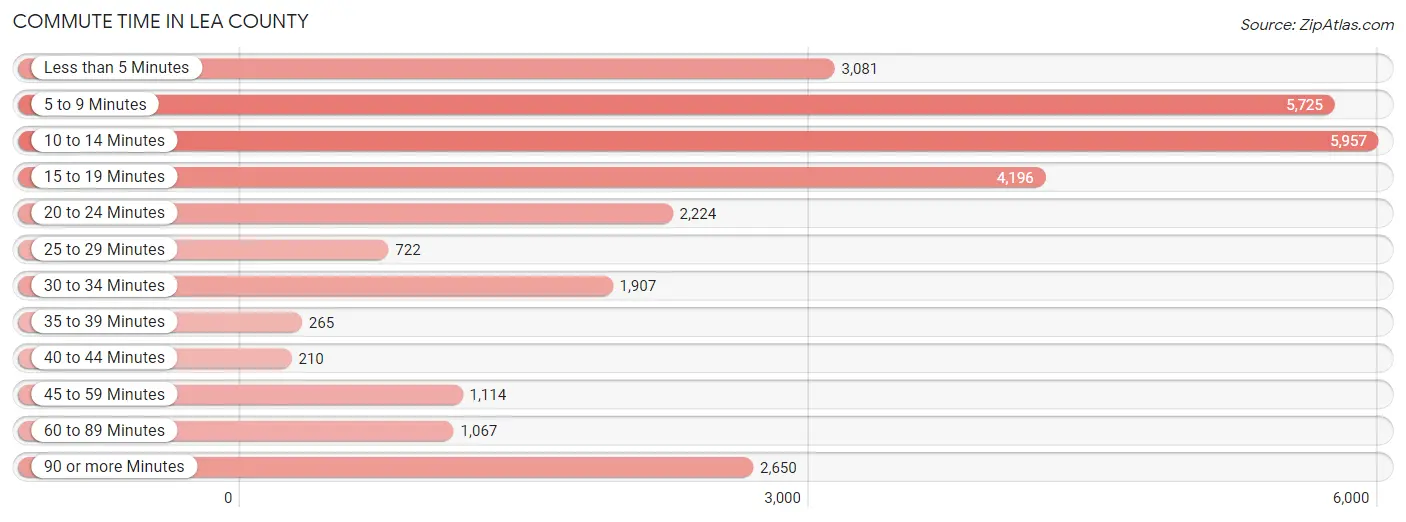
| Commute Time | # Commuters | % Commuters |
| Less than 5 Minutes | 3,081 | 10.6% |
| 5 to 9 Minutes | 5,725 | 19.7% |
| 10 to 14 Minutes | 5,957 | 20.5% |
| 15 to 19 Minutes | 4,196 | 14.4% |
| 20 to 24 Minutes | 2,224 | 7.6% |
| 25 to 29 Minutes | 722 | 2.5% |
| 30 to 34 Minutes | 1,907 | 6.6% |
| 35 to 39 Minutes | 265 | 0.9% |
| 40 to 44 Minutes | 210 | 0.7% |
| 45 to 59 Minutes | 1,114 | 3.8% |
| 60 to 89 Minutes | 1,067 | 3.7% |
| 90 or more Minutes | 2,650 | 9.1% |
Commute Time by Sex in Lea County
The most common commute times in Lea County are 10 to 14 minutes (3,004 commuters, 17.0%) for males and 10 to 14 minutes (2,953 commuters, 25.7%) for females.
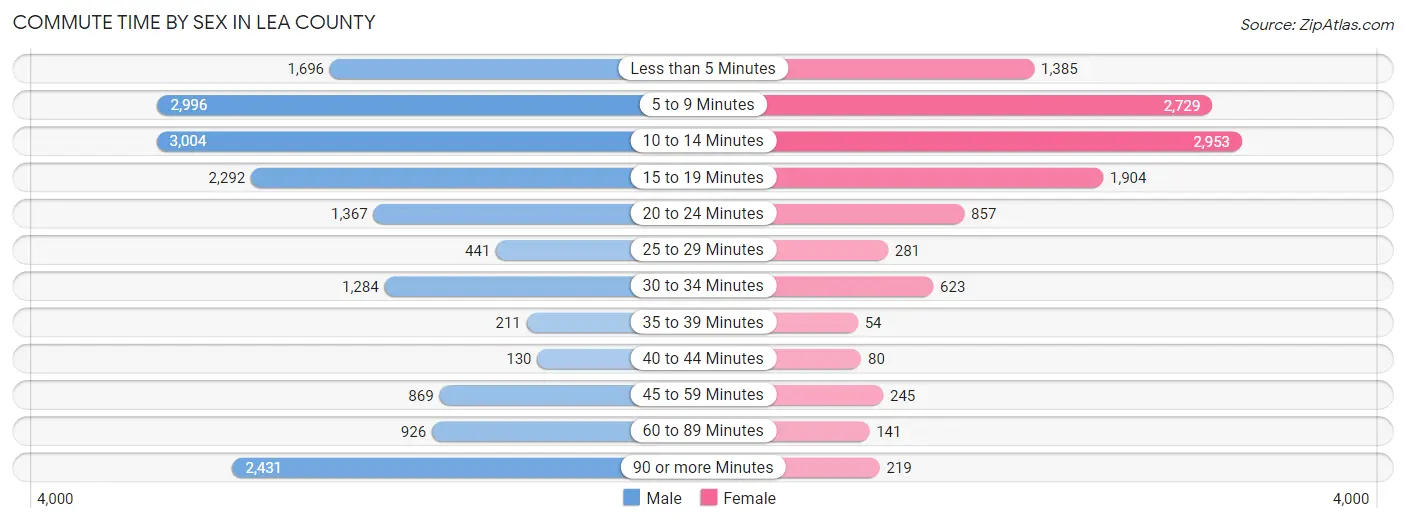
| Commute Time | Male | Female |
| Less than 5 Minutes | 1,696 (9.6%) | 1,385 (12.1%) |
| 5 to 9 Minutes | 2,996 (17.0%) | 2,729 (23.8%) |
| 10 to 14 Minutes | 3,004 (17.0%) | 2,953 (25.7%) |
| 15 to 19 Minutes | 2,292 (13.0%) | 1,904 (16.6%) |
| 20 to 24 Minutes | 1,367 (7.7%) | 857 (7.5%) |
| 25 to 29 Minutes | 441 (2.5%) | 281 (2.5%) |
| 30 to 34 Minutes | 1,284 (7.3%) | 623 (5.4%) |
| 35 to 39 Minutes | 211 (1.2%) | 54 (0.5%) |
| 40 to 44 Minutes | 130 (0.7%) | 80 (0.7%) |
| 45 to 59 Minutes | 869 (4.9%) | 245 (2.1%) |
| 60 to 89 Minutes | 926 (5.2%) | 141 (1.2%) |
| 90 or more Minutes | 2,431 (13.8%) | 219 (1.9%) |
Time of Departure to Work by Sex in Lea County
The most frequent times of departure to work in Lea County are 5:00 AM to 5:29 AM (2,817, 16.0%) for males and 7:30 AM to 7:59 AM (3,558, 31.0%) for females.
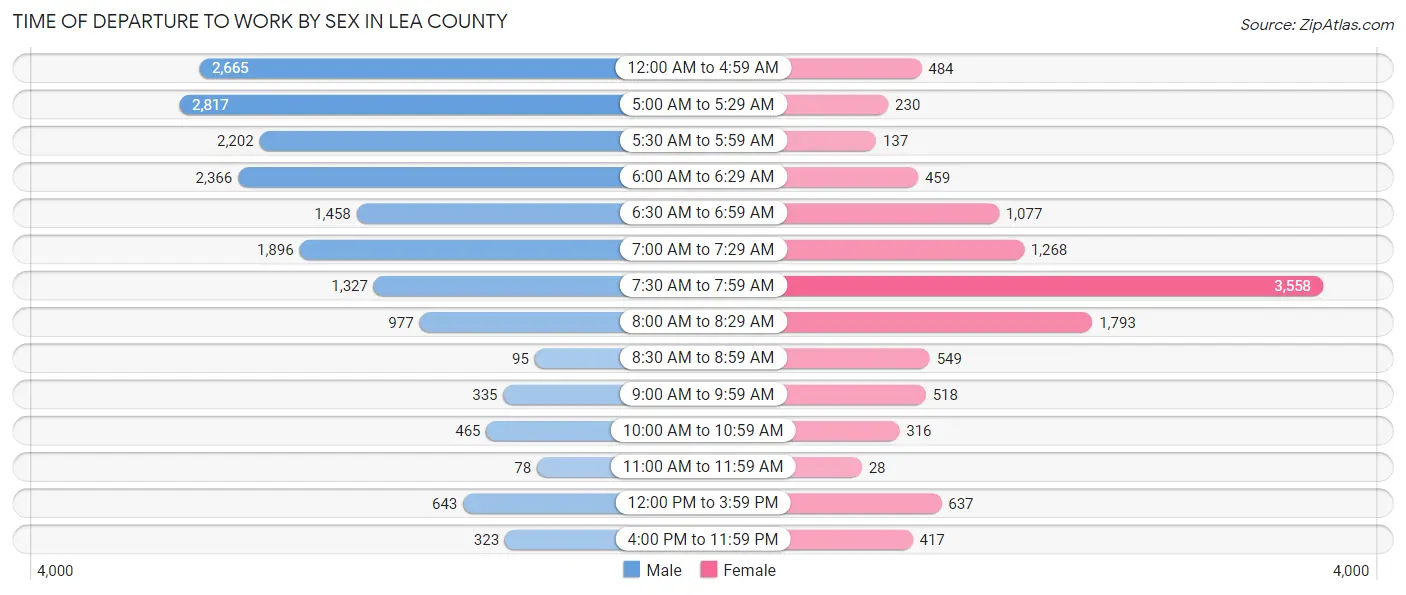
| Time of Departure | Male | Female |
| 12:00 AM to 4:59 AM | 2,665 (15.1%) | 484 (4.2%) |
| 5:00 AM to 5:29 AM | 2,817 (16.0%) | 230 (2.0%) |
| 5:30 AM to 5:59 AM | 2,202 (12.5%) | 137 (1.2%) |
| 6:00 AM to 6:29 AM | 2,366 (13.4%) | 459 (4.0%) |
| 6:30 AM to 6:59 AM | 1,458 (8.3%) | 1,077 (9.4%) |
| 7:00 AM to 7:29 AM | 1,896 (10.7%) | 1,268 (11.1%) |
| 7:30 AM to 7:59 AM | 1,327 (7.5%) | 3,558 (31.0%) |
| 8:00 AM to 8:29 AM | 977 (5.5%) | 1,793 (15.6%) |
| 8:30 AM to 8:59 AM | 95 (0.5%) | 549 (4.8%) |
| 9:00 AM to 9:59 AM | 335 (1.9%) | 518 (4.5%) |
| 10:00 AM to 10:59 AM | 465 (2.6%) | 316 (2.8%) |
| 11:00 AM to 11:59 AM | 78 (0.4%) | 28 (0.2%) |
| 12:00 PM to 3:59 PM | 643 (3.6%) | 637 (5.6%) |
| 4:00 PM to 11:59 PM | 323 (1.8%) | 417 (3.6%) |
| Total | 17,647 (100.0%) | 11,471 (100.0%) |
Housing Occupancy in Lea County
Occupancy by Ownership in Lea County
Of the total 24,379 dwellings in Lea County, owner-occupied units account for 16,679 (68.4%), while renter-occupied units make up 7,700 (31.6%).
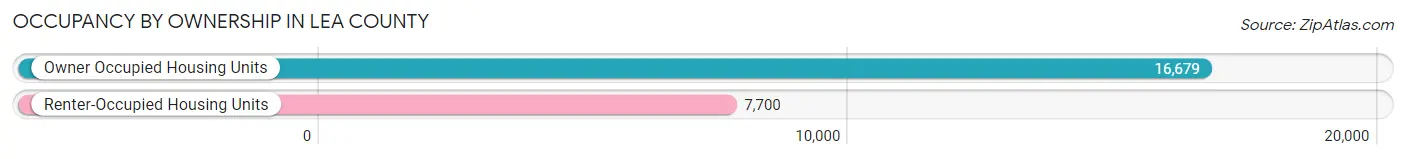
| Occupancy | # Housing Units | % Housing Units |
| Owner Occupied Housing Units | 16,679 | 68.4% |
| Renter-Occupied Housing Units | 7,700 | 31.6% |
| Total Occupied Housing Units | 24,379 | 100.0% |
Occupancy by Household Size in Lea County
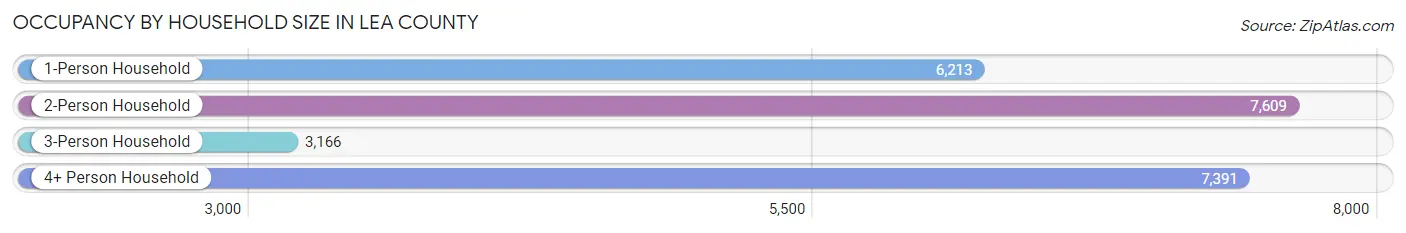
| Household Size | # Housing Units | % Housing Units |
| 1-Person Household | 6,213 | 25.5% |
| 2-Person Household | 7,609 | 31.2% |
| 3-Person Household | 3,166 | 13.0% |
| 4+ Person Household | 7,391 | 30.3% |
| Total Housing Units | 24,379 | 100.0% |
Occupancy by Ownership by Household Size in Lea County
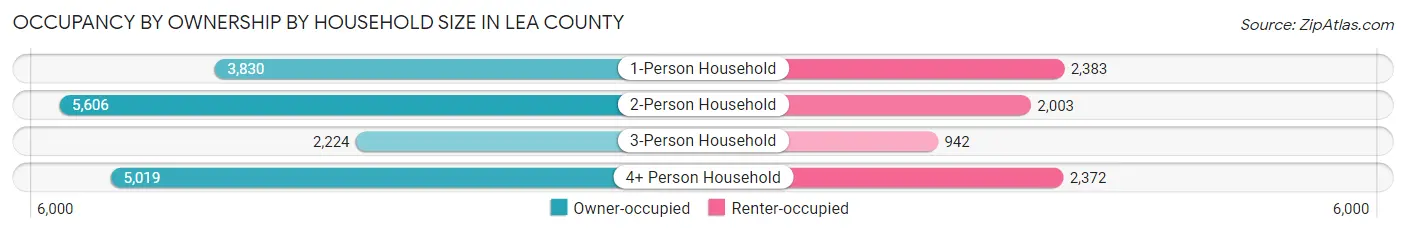
| Household Size | Owner-occupied | Renter-occupied |
| 1-Person Household | 3,830 (61.6%) | 2,383 (38.4%) |
| 2-Person Household | 5,606 (73.7%) | 2,003 (26.3%) |
| 3-Person Household | 2,224 (70.3%) | 942 (29.7%) |
| 4+ Person Household | 5,019 (67.9%) | 2,372 (32.1%) |
| Total Housing Units | 16,679 (68.4%) | 7,700 (31.6%) |
Occupancy by Educational Attainment in Lea County
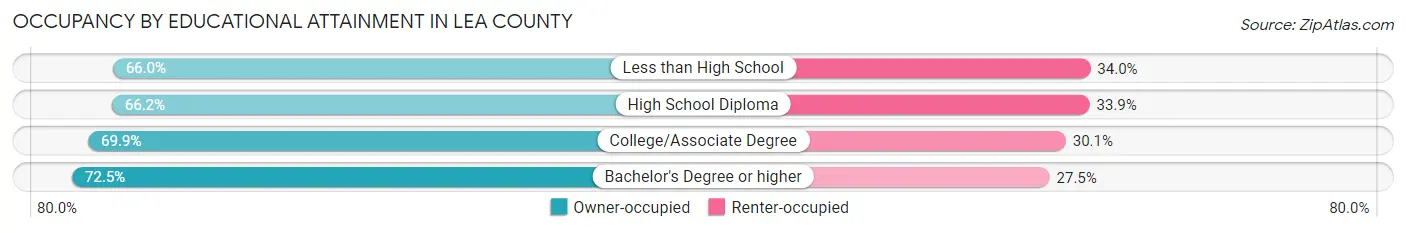
| Household Size | Owner-occupied | Renter-occupied |
| Less than High School | 3,391 (66.0%) | 1,745 (34.0%) |
| High School Diploma | 4,736 (66.1%) | 2,423 (33.9%) |
| College/Associate Degree | 5,651 (69.9%) | 2,431 (30.1%) |
| Bachelor's Degree or higher | 2,901 (72.5%) | 1,101 (27.5%) |
Occupancy by Age of Householder in Lea County
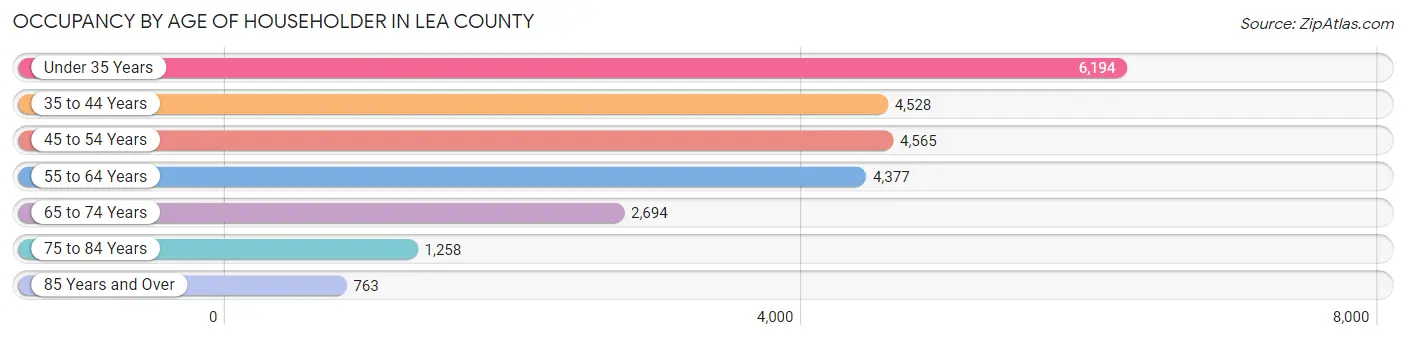
| Age Bracket | # Households | % Households |
| Under 35 Years | 6,194 | 25.4% |
| 35 to 44 Years | 4,528 | 18.6% |
| 45 to 54 Years | 4,565 | 18.7% |
| 55 to 64 Years | 4,377 | 17.9% |
| 65 to 74 Years | 2,694 | 11.1% |
| 75 to 84 Years | 1,258 | 5.2% |
| 85 Years and Over | 763 | 3.1% |
| Total | 24,379 | 100.0% |
Housing Finances in Lea County
Median Income by Occupancy in Lea County
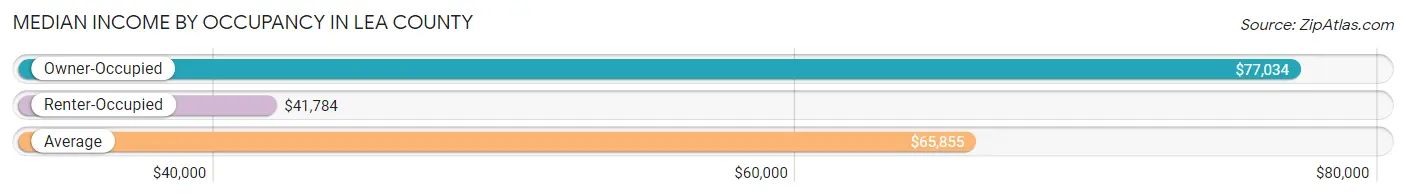
| Occupancy Type | # Households | Median Income |
| Owner-Occupied | 16,679 (68.4%) | $77,034 |
| Renter-Occupied | 7,700 (31.6%) | $41,784 |
| Average | 24,379 (100.0%) | $65,855 |
Occupancy by Householder Income Bracket in Lea County
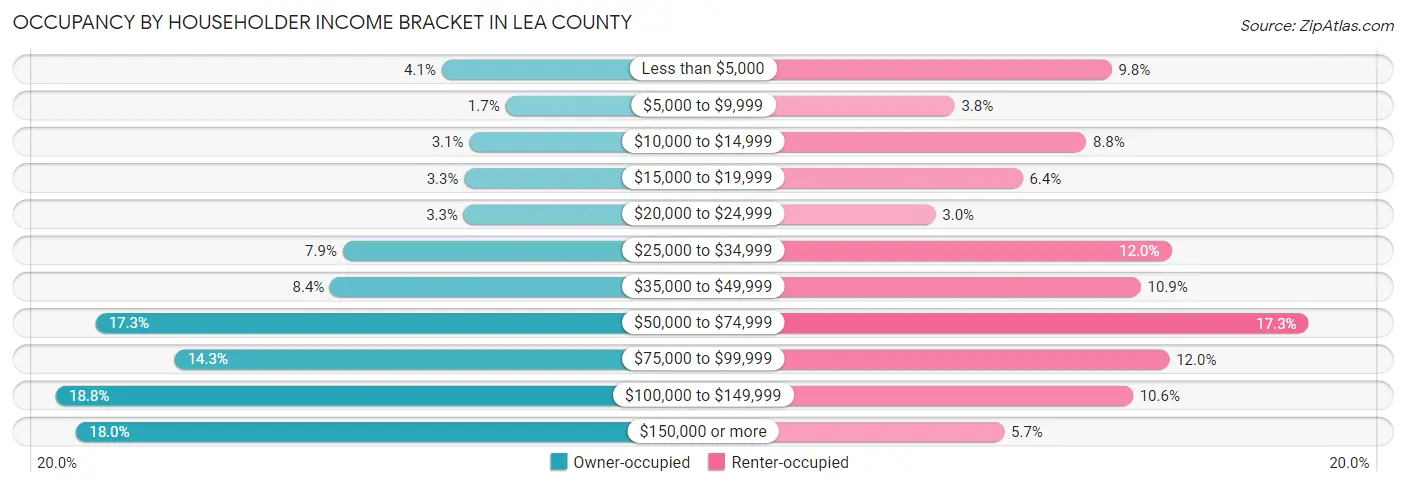
| Income Bracket | Owner-occupied | Renter-occupied |
| Less than $5,000 | 685 (4.1%) | 751 (9.8%) |
| $5,000 to $9,999 | 280 (1.7%) | 290 (3.8%) |
| $10,000 to $14,999 | 510 (3.1%) | 676 (8.8%) |
| $15,000 to $19,999 | 542 (3.3%) | 490 (6.4%) |
| $20,000 to $24,999 | 545 (3.3%) | 234 (3.0%) |
| $25,000 to $34,999 | 1,315 (7.9%) | 926 (12.0%) |
| $35,000 to $49,999 | 1,394 (8.4%) | 836 (10.9%) |
| $50,000 to $74,999 | 2,883 (17.3%) | 1,328 (17.2%) |
| $75,000 to $99,999 | 2,382 (14.3%) | 920 (11.9%) |
| $100,000 to $149,999 | 3,136 (18.8%) | 813 (10.6%) |
| $150,000 or more | 3,007 (18.0%) | 436 (5.7%) |
| Total | 16,679 (100.0%) | 7,700 (100.0%) |
Monthly Housing Cost Tiers in Lea County
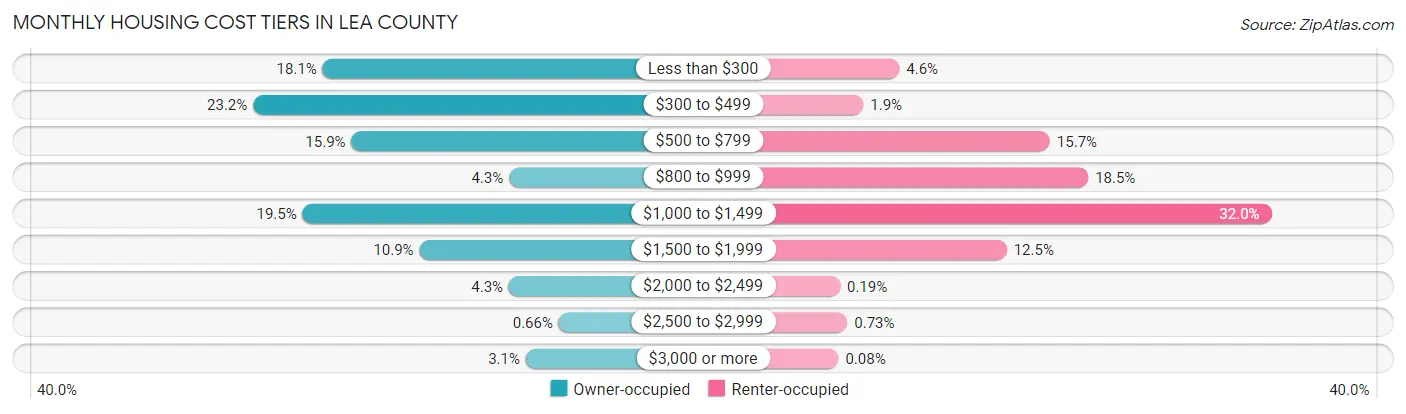
| Monthly Cost | Owner-occupied | Renter-occupied |
| Less than $300 | 3,011 (18.0%) | 351 (4.6%) |
| $300 to $499 | 3,864 (23.2%) | 147 (1.9%) |
| $500 to $799 | 2,657 (15.9%) | 1,205 (15.7%) |
| $800 to $999 | 720 (4.3%) | 1,422 (18.5%) |
| $1,000 to $1,499 | 3,257 (19.5%) | 2,461 (32.0%) |
| $1,500 to $1,999 | 1,822 (10.9%) | 960 (12.5%) |
| $2,000 to $2,499 | 723 (4.3%) | 15 (0.2%) |
| $2,500 to $2,999 | 110 (0.7%) | 56 (0.7%) |
| $3,000 or more | 515 (3.1%) | 6 (0.1%) |
| Total | 16,679 (100.0%) | 7,700 (100.0%) |
Physical Housing Characteristics in Lea County
Housing Structures in Lea County
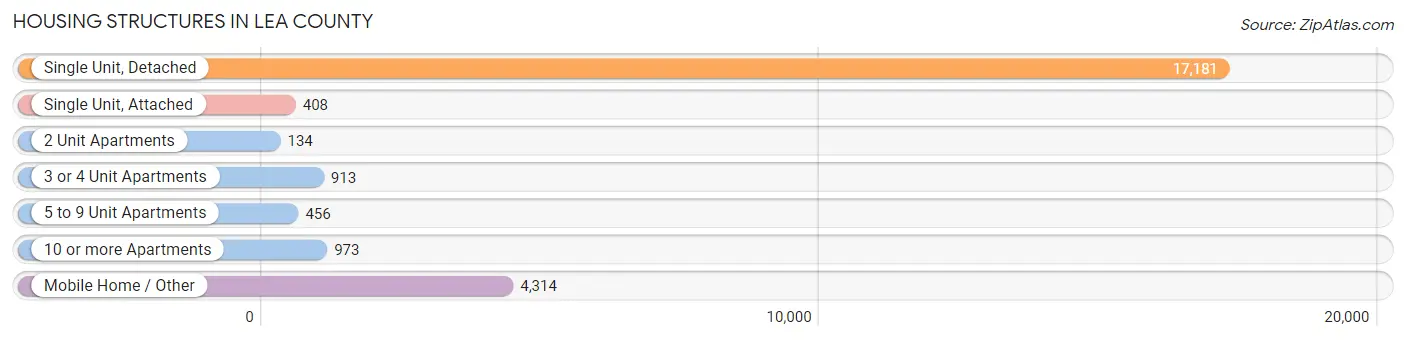
| Structure Type | # Housing Units | % Housing Units |
| Single Unit, Detached | 17,181 | 70.5% |
| Single Unit, Attached | 408 | 1.7% |
| 2 Unit Apartments | 134 | 0.5% |
| 3 or 4 Unit Apartments | 913 | 3.7% |
| 5 to 9 Unit Apartments | 456 | 1.9% |
| 10 or more Apartments | 973 | 4.0% |
| Mobile Home / Other | 4,314 | 17.7% |
| Total | 24,379 | 100.0% |
Housing Structures by Occupancy in Lea County
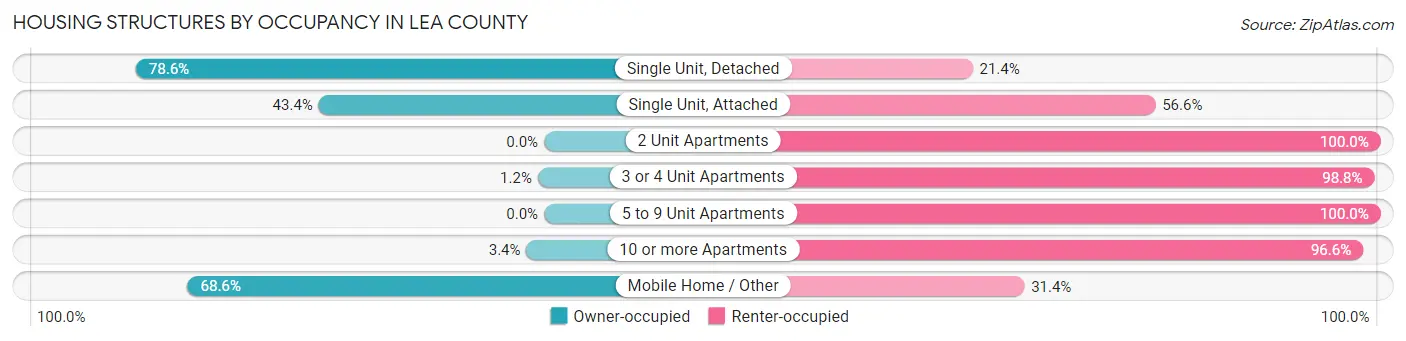
| Structure Type | Owner-occupied | Renter-occupied |
| Single Unit, Detached | 13,498 (78.6%) | 3,683 (21.4%) |
| Single Unit, Attached | 177 (43.4%) | 231 (56.6%) |
| 2 Unit Apartments | 0 (0.0%) | 134 (100.0%) |
| 3 or 4 Unit Apartments | 11 (1.2%) | 902 (98.8%) |
| 5 to 9 Unit Apartments | 0 (0.0%) | 456 (100.0%) |
| 10 or more Apartments | 33 (3.4%) | 940 (96.6%) |
| Mobile Home / Other | 2,960 (68.6%) | 1,354 (31.4%) |
| Total | 16,679 (68.4%) | 7,700 (31.6%) |
Housing Structures by Number of Rooms in Lea County
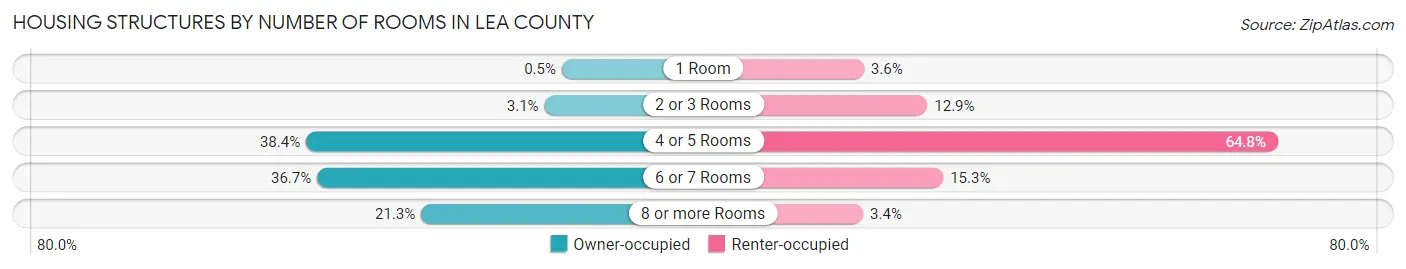
| Number of Rooms | Owner-occupied | Renter-occupied |
| 1 Room | 83 (0.5%) | 273 (3.5%) |
| 2 or 3 Rooms | 514 (3.1%) | 996 (12.9%) |
| 4 or 5 Rooms | 6,398 (38.4%) | 4,989 (64.8%) |
| 6 or 7 Rooms | 6,126 (36.7%) | 1,177 (15.3%) |
| 8 or more Rooms | 3,558 (21.3%) | 265 (3.4%) |
| Total | 16,679 (100.0%) | 7,700 (100.0%) |
Housing Structure by Heating Type in Lea County
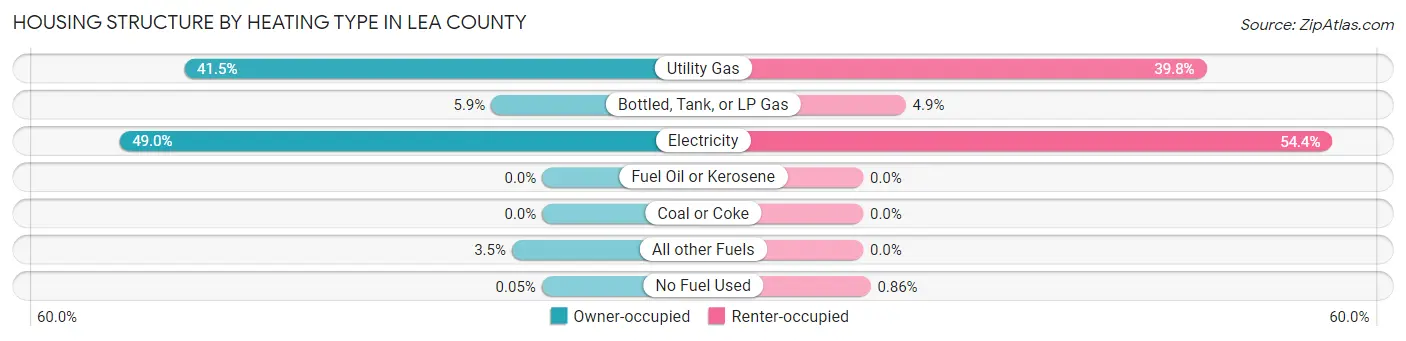
| Heating Type | Owner-occupied | Renter-occupied |
| Utility Gas | 6,923 (41.5%) | 3,065 (39.8%) |
| Bottled, Tank, or LP Gas | 985 (5.9%) | 380 (4.9%) |
| Electricity | 8,178 (49.0%) | 4,189 (54.4%) |
| Fuel Oil or Kerosene | 0 (0.0%) | 0 (0.0%) |
| Coal or Coke | 0 (0.0%) | 0 (0.0%) |
| All other Fuels | 585 (3.5%) | 0 (0.0%) |
| No Fuel Used | 8 (0.1%) | 66 (0.9%) |
| Total | 16,679 (100.0%) | 7,700 (100.0%) |
Household Vehicle Usage in Lea County
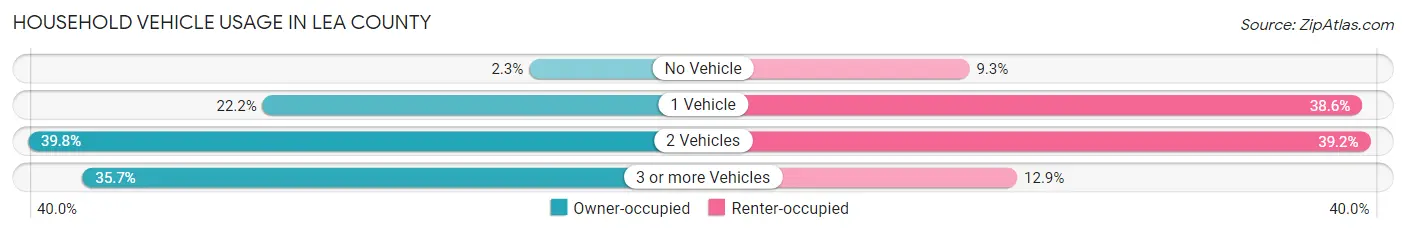
| Vehicles per Household | Owner-occupied | Renter-occupied |
| No Vehicle | 389 (2.3%) | 716 (9.3%) |
| 1 Vehicle | 3,707 (22.2%) | 2,973 (38.6%) |
| 2 Vehicles | 6,632 (39.8%) | 3,021 (39.2%) |
| 3 or more Vehicles | 5,951 (35.7%) | 990 (12.9%) |
| Total | 16,679 (100.0%) | 7,700 (100.0%) |
Real Estate & Mortgages in Lea County
Real Estate and Mortgage Overview in Lea County
| Characteristic | Without Mortgage | With Mortgage |
| Housing Units | 9,487 | 7,192 |
| Median Property Value | $145,200 | $193,000 |
| Median Household Income | $62,905 | $1,773 |
| Monthly Housing Costs | $378 | $515 |
| Real Estate Taxes | $530 | $287 |
Property Value by Mortgage Status in Lea County
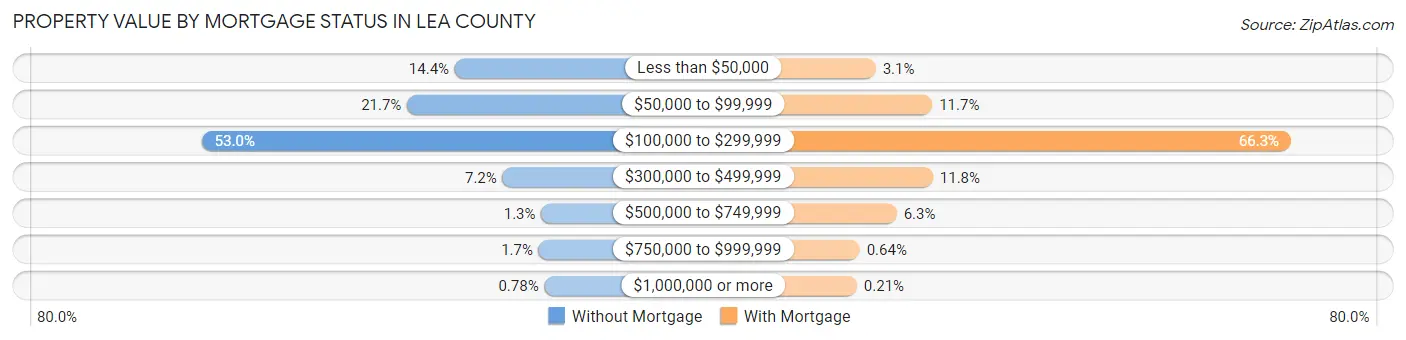
| Property Value | Without Mortgage | With Mortgage |
| Less than $50,000 | 1,369 (14.4%) | 221 (3.1%) |
| $50,000 to $99,999 | 2,059 (21.7%) | 841 (11.7%) |
| $100,000 to $299,999 | 5,030 (53.0%) | 4,771 (66.3%) |
| $300,000 to $499,999 | 679 (7.2%) | 847 (11.8%) |
| $500,000 to $749,999 | 119 (1.3%) | 451 (6.3%) |
| $750,000 to $999,999 | 157 (1.7%) | 46 (0.6%) |
| $1,000,000 or more | 74 (0.8%) | 15 (0.2%) |
| Total | 9,487 (100.0%) | 7,192 (100.0%) |
Household Income by Mortgage Status in Lea County
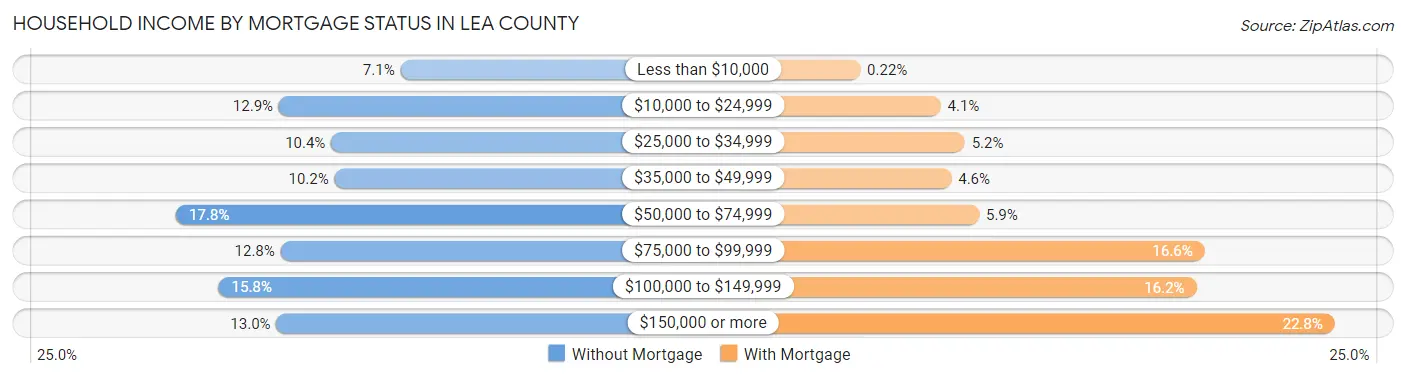
| Household Income | Without Mortgage | With Mortgage |
| Less than $10,000 | 674 (7.1%) | 16 (0.2%) |
| $10,000 to $24,999 | 1,223 (12.9%) | 291 (4.1%) |
| $25,000 to $34,999 | 987 (10.4%) | 374 (5.2%) |
| $35,000 to $49,999 | 971 (10.2%) | 328 (4.6%) |
| $50,000 to $74,999 | 1,688 (17.8%) | 423 (5.9%) |
| $75,000 to $99,999 | 1,215 (12.8%) | 1,195 (16.6%) |
| $100,000 to $149,999 | 1,495 (15.8%) | 1,167 (16.2%) |
| $150,000 or more | 1,234 (13.0%) | 1,641 (22.8%) |
| Total | 9,487 (100.0%) | 7,192 (100.0%) |
Property Value to Household Income Ratio in Lea County
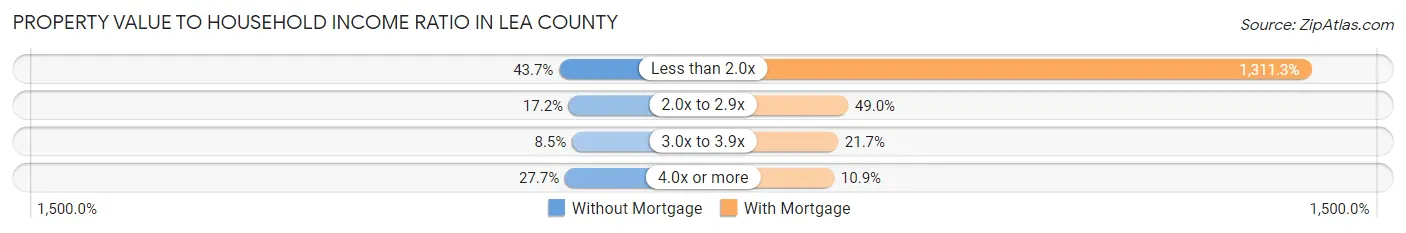
| Value-to-Income Ratio | Without Mortgage | With Mortgage |
| Less than 2.0x | 4,149 (43.7%) | 94,311 (1,311.3%) |
| 2.0x to 2.9x | 1,630 (17.2%) | 3,527 (49.0%) |
| 3.0x to 3.9x | 804 (8.5%) | 1,557 (21.6%) |
| 4.0x or more | 2,624 (27.7%) | 783 (10.9%) |
| Total | 9,487 (100.0%) | 7,192 (100.0%) |
Real Estate Taxes by Mortgage Status in Lea County
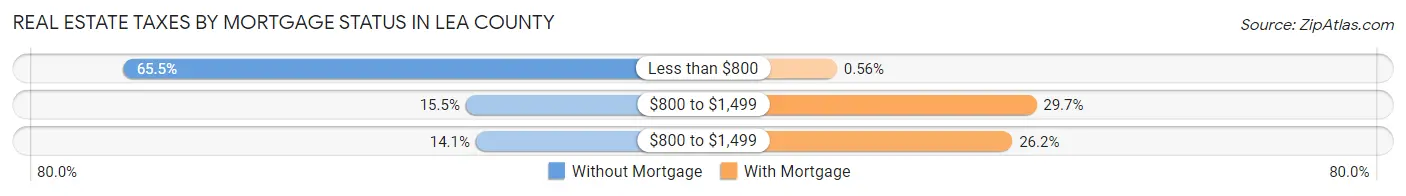
| Property Taxes | Without Mortgage | With Mortgage |
| Less than $800 | 6,215 (65.5%) | 40 (0.6%) |
| $800 to $1,499 | 1,474 (15.5%) | 2,136 (29.7%) |
| $800 to $1,499 | 1,335 (14.1%) | 1,883 (26.2%) |
| Total | 9,487 (100.0%) | 7,192 (100.0%) |
Health & Disability in Lea County
Health Insurance Coverage by Age in Lea County
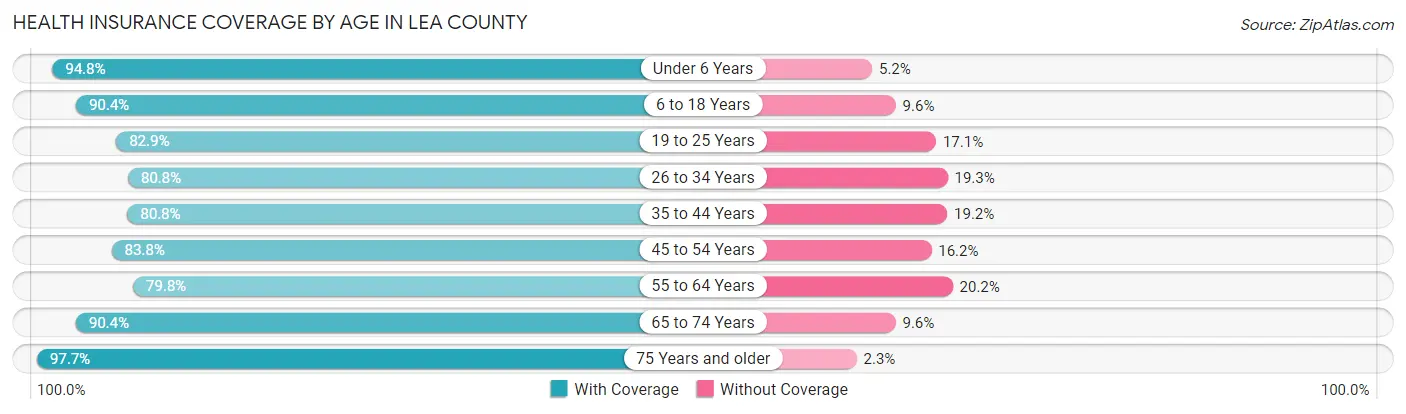
| Age Bracket | With Coverage | Without Coverage |
| Under 6 Years | 6,507 (94.8%) | 355 (5.2%) |
| 6 to 18 Years | 14,700 (90.4%) | 1,557 (9.6%) |
| 19 to 25 Years | 6,325 (82.9%) | 1,305 (17.1%) |
| 26 to 34 Years | 6,774 (80.7%) | 1,615 (19.3%) |
| 35 to 44 Years | 7,413 (80.8%) | 1,758 (19.2%) |
| 45 to 54 Years | 6,434 (83.8%) | 1,246 (16.2%) |
| 55 to 64 Years | 6,013 (79.8%) | 1,522 (20.2%) |
| 65 to 74 Years | 4,401 (90.4%) | 465 (9.6%) |
| 75 Years and older | 2,885 (97.7%) | 68 (2.3%) |
| Total | 61,452 (86.1%) | 9,891 (13.9%) |
Health Insurance Coverage by Citizenship Status in Lea County
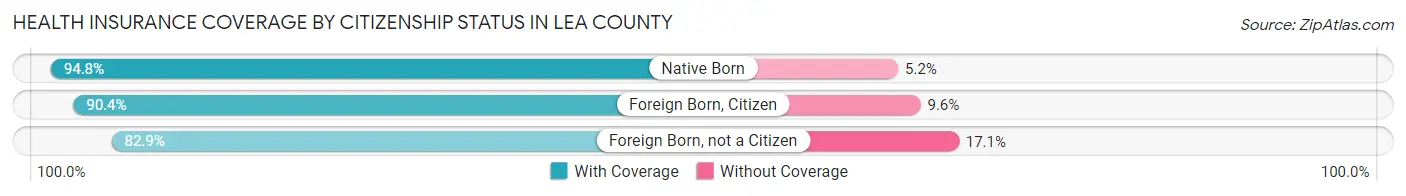
| Citizenship Status | With Coverage | Without Coverage |
| Native Born | 6,507 (94.8%) | 355 (5.2%) |
| Foreign Born, Citizen | 14,700 (90.4%) | 1,557 (9.6%) |
| Foreign Born, not a Citizen | 6,325 (82.9%) | 1,305 (17.1%) |
Health Insurance Coverage by Household Income in Lea County
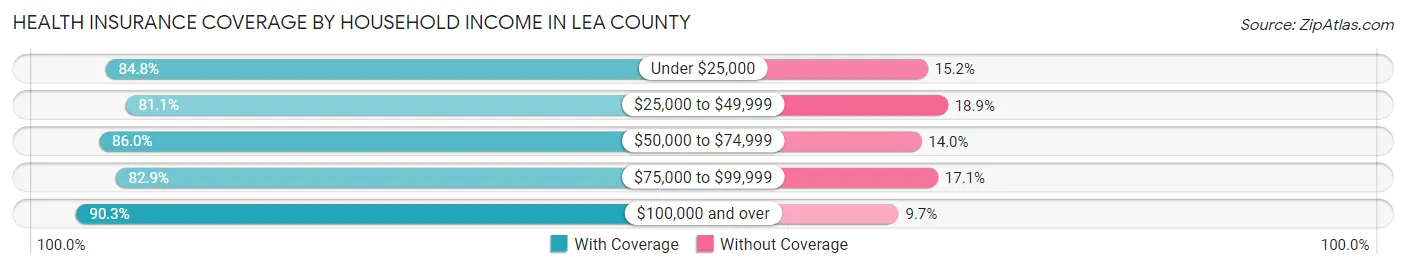
| Household Income | With Coverage | Without Coverage |
| Under $25,000 | 8,757 (84.8%) | 1,568 (15.2%) |
| $25,000 to $49,999 | 8,944 (81.1%) | 2,086 (18.9%) |
| $50,000 to $74,999 | 11,211 (86.0%) | 1,821 (14.0%) |
| $75,000 to $99,999 | 9,170 (82.9%) | 1,888 (17.1%) |
| $100,000 and over | 22,741 (90.3%) | 2,441 (9.7%) |
Public vs Private Health Insurance Coverage by Age in Lea County
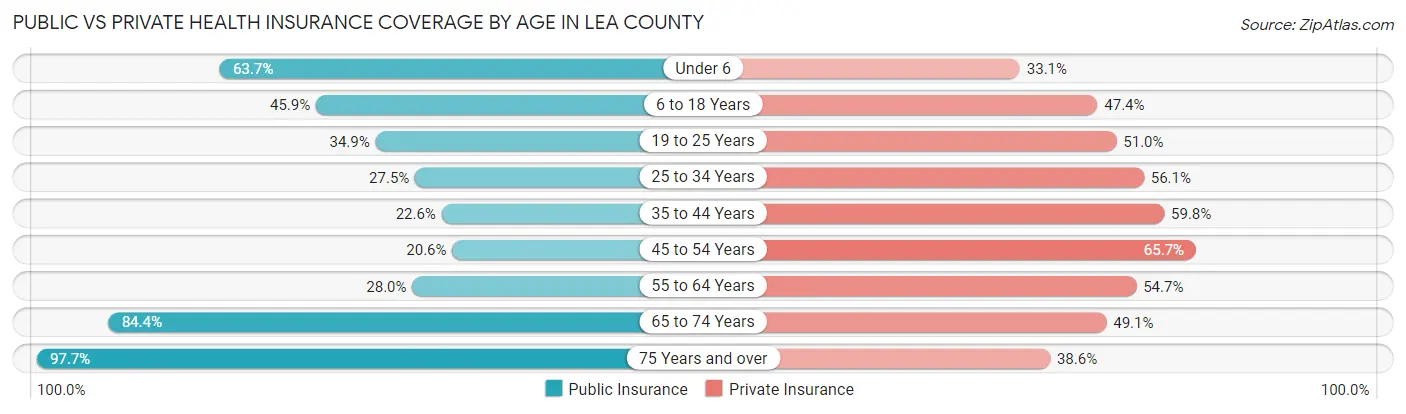
| Age Bracket | Public Insurance | Private Insurance |
| Under 6 | 4,373 (63.7%) | 2,268 (33.1%) |
| 6 to 18 Years | 7,464 (45.9%) | 7,713 (47.4%) |
| 19 to 25 Years | 2,660 (34.9%) | 3,888 (51.0%) |
| 25 to 34 Years | 2,308 (27.5%) | 4,703 (56.1%) |
| 35 to 44 Years | 2,071 (22.6%) | 5,487 (59.8%) |
| 45 to 54 Years | 1,582 (20.6%) | 5,047 (65.7%) |
| 55 to 64 Years | 2,111 (28.0%) | 4,118 (54.6%) |
| 65 to 74 Years | 4,106 (84.4%) | 2,389 (49.1%) |
| 75 Years and over | 2,885 (97.7%) | 1,141 (38.6%) |
| Total | 29,560 (41.4%) | 36,754 (51.5%) |
Disability Status by Sex by Age in Lea County
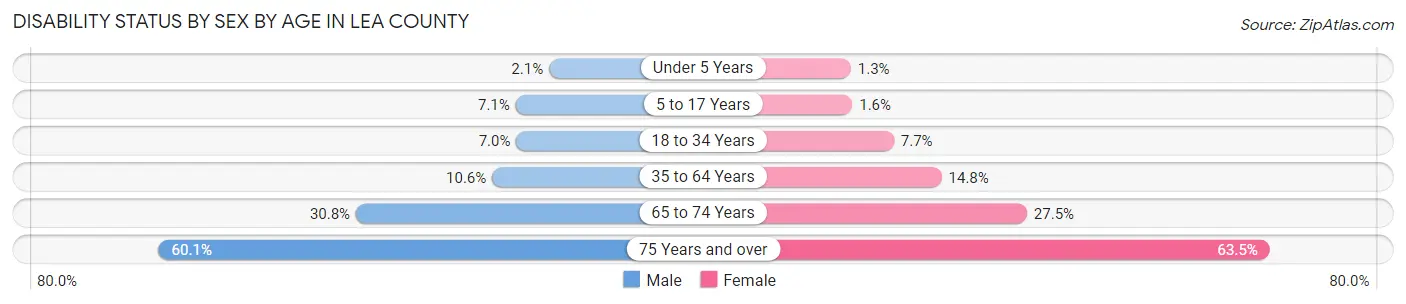
| Age Bracket | Male | Female |
| Under 5 Years | 65 (2.1%) | 37 (1.3%) |
| 5 to 17 Years | 585 (7.1%) | 122 (1.6%) |
| 18 to 34 Years | 628 (7.0%) | 639 (7.7%) |
| 35 to 64 Years | 1,318 (10.6%) | 1,768 (14.8%) |
| 65 to 74 Years | 729 (30.8%) | 687 (27.5%) |
| 75 Years and over | 804 (60.1%) | 1,026 (63.5%) |
Disability Class by Sex by Age in Lea County
Disability Class: Hearing Difficulty
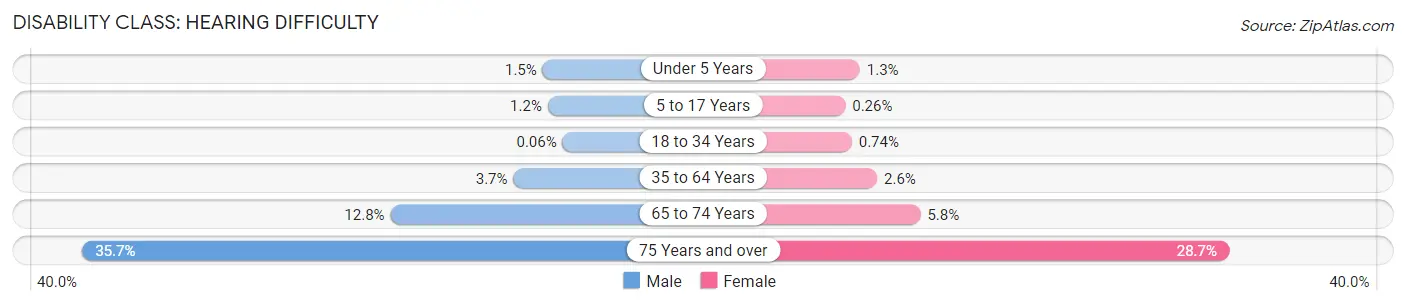
| Age Bracket | Male | Female |
| Under 5 Years | 47 (1.5%) | 37 (1.3%) |
| 5 to 17 Years | 96 (1.2%) | 20 (0.3%) |
| 18 to 34 Years | 5 (0.1%) | 61 (0.7%) |
| 35 to 64 Years | 462 (3.7%) | 313 (2.6%) |
| 65 to 74 Years | 304 (12.8%) | 146 (5.8%) |
| 75 Years and over | 478 (35.7%) | 464 (28.7%) |
Disability Class: Vision Difficulty
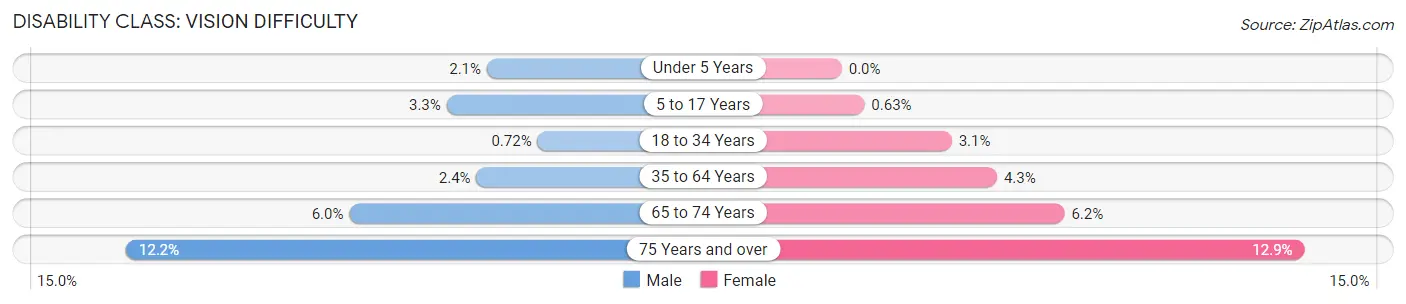
| Age Bracket | Male | Female |
| Under 5 Years | 65 (2.1%) | 0 (0.0%) |
| 5 to 17 Years | 268 (3.3%) | 49 (0.6%) |
| 18 to 34 Years | 65 (0.7%) | 253 (3.1%) |
| 35 to 64 Years | 301 (2.4%) | 515 (4.3%) |
| 65 to 74 Years | 141 (6.0%) | 155 (6.2%) |
| 75 Years and over | 163 (12.2%) | 208 (12.9%) |
Disability Class: Cognitive Difficulty
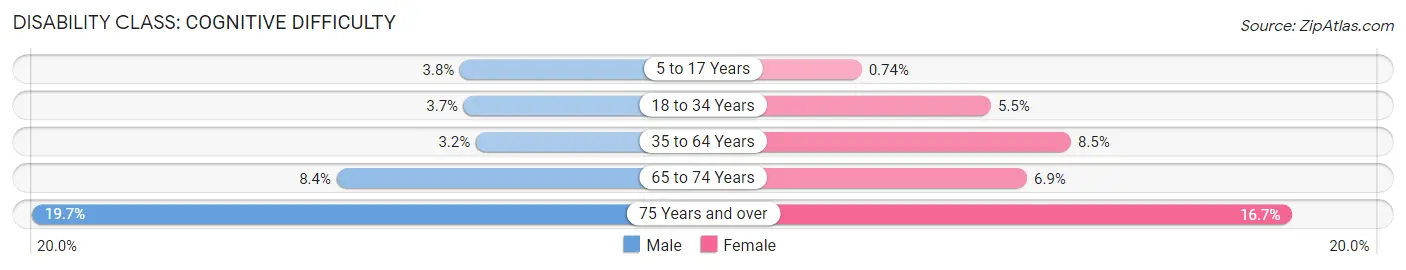
| Age Bracket | Male | Female |
| 5 to 17 Years | 316 (3.8%) | 58 (0.7%) |
| 18 to 34 Years | 331 (3.7%) | 458 (5.5%) |
| 35 to 64 Years | 404 (3.2%) | 1,016 (8.5%) |
| 65 to 74 Years | 199 (8.4%) | 172 (6.9%) |
| 75 Years and over | 264 (19.7%) | 270 (16.7%) |
Disability Class: Ambulatory Difficulty
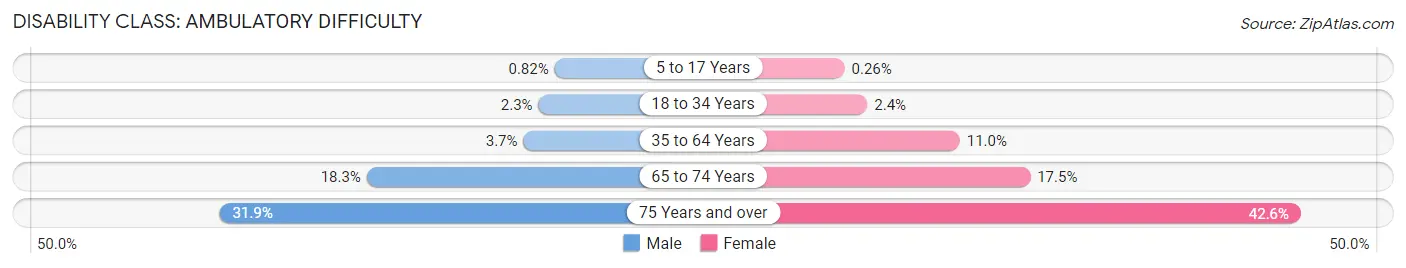
| Age Bracket | Male | Female |
| 5 to 17 Years | 68 (0.8%) | 20 (0.3%) |
| 18 to 34 Years | 207 (2.3%) | 196 (2.4%) |
| 35 to 64 Years | 462 (3.7%) | 1,306 (11.0%) |
| 65 to 74 Years | 432 (18.2%) | 437 (17.5%) |
| 75 Years and over | 427 (31.9%) | 688 (42.6%) |
Disability Class: Self-Care Difficulty
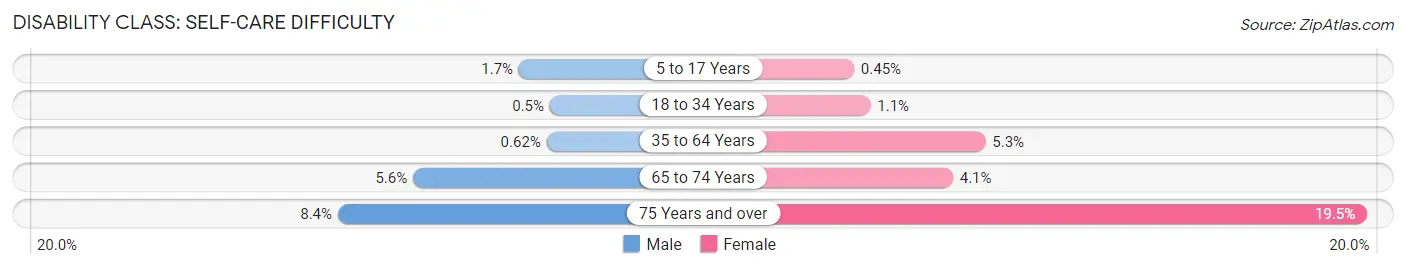
| Age Bracket | Male | Female |
| 5 to 17 Years | 136 (1.7%) | 35 (0.4%) |
| 18 to 34 Years | 45 (0.5%) | 88 (1.1%) |
| 35 to 64 Years | 77 (0.6%) | 636 (5.3%) |
| 65 to 74 Years | 132 (5.6%) | 103 (4.1%) |
| 75 Years and over | 112 (8.4%) | 315 (19.5%) |
Technology Access in Lea County
Computing Device Access in Lea County

| Device Type | # Households | % Households |
| Desktop or Laptop | 15,690 | 64.4% |
| Smartphone | 21,208 | 87.0% |
| Tablet | 13,284 | 54.5% |
| No Computing Device | 2,113 | 8.7% |
| Total | 24,379 | 100.0% |
Internet Access in Lea County
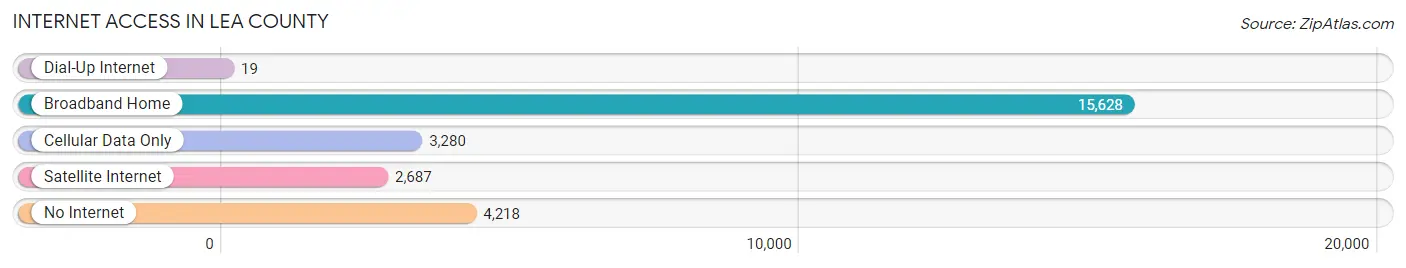
| Internet Type | # Households | % Households |
| Dial-Up Internet | 19 | 0.1% |
| Broadband Home | 15,628 | 64.1% |
| Cellular Data Only | 3,280 | 13.5% |
| Satellite Internet | 2,687 | 11.0% |
| No Internet | 4,218 | 17.3% |
| Total | 24,379 | 100.0% |
Lea County Summary
Lea County is located in the southeastern corner of New Mexico, and is bordered by Texas to the east and Chaves County to the north. The county seat is Lovington, and the largest city is Hobbs. The county was established in 1917 and named after Captain Joseph Lea, a Confederate soldier and early settler of the area.
Geography
Lea County covers an area of 4,393 square miles, making it the fourth largest county in New Mexico. The county is mostly flat, with some rolling hills in the western part. The Pecos River runs through the county, and there are several small lakes and reservoirs. The climate is semi-arid, with hot summers and mild winters.
Demographics
As of the 2010 census, Lea County had a population of 64,727. The population is mostly white (77.3%), with a significant Hispanic population (20.2%). The median household income is $45,845, and the median age is 33.7.
Economy
Lea County is an important center for oil and gas production, and is one of the top oil-producing counties in the United States. The county is also home to several large industrial plants, including a uranium enrichment facility and a nuclear power plant. Agriculture is also an important part of the economy, with cattle ranching and cotton farming being the main activities.
History
Lea County was first settled by Native Americans, including the Apache, Comanche, and Kiowa tribes. The area was later explored by Spanish settlers in the late 1700s, and the first permanent settlement was established in 1881. The county was officially established in 1917, and the county seat was moved to Lovington in 1919.
Oil was discovered in the area in the 1920s, and the county quickly became an important center for oil production. The oil boom led to a population boom, and the county's population grew from just over 10,000 in 1930 to over 60,000 in 2010.
Lea County has continued to be an important center for oil and gas production, and the county has also become an important center for agriculture and industry. The county has also become a popular destination for tourists, with several state parks and recreational areas.
Common Questions
What is Per Capita Income in Lea County?
Per Capita income in Lea County is $29,635.
What is the Median Family Income in Lea County?
Median Family Income in Lea County is $75,953.
What is the Median Household income in Lea County?
Median Household Income in Lea County is $65,855.
What is Income or Wage Gap in Lea County?
Income or Wage Gap in Lea County is 49.3%.
Women in Lea County earn 50.7 cents for every dollar earned by a man.
What is Family Income Deficit in Lea County?
Family Income Deficit in Lea County is $12,260.
Families that are below poverty line in Lea County earn $12,260 less on average than the poverty threshold level.
What is Inequality or Gini Index in Lea County?
Inequality or Gini Index in Lea County is 0.47.
What is the Total Population of Lea County?
Total Population of Lea County is 73,103.
What is the Total Male Population of Lea County?
Total Male Population of Lea County is 37,934.
What is the Total Female Population of Lea County?
Total Female Population of Lea County is 35,169.
What is the Ratio of Males per 100 Females in Lea County?
There are 107.86 Males per 100 Females in Lea County.
What is the Ratio of Females per 100 Males in Lea County?
There are 92.71 Females per 100 Males in Lea County.
What is the Median Population Age in Lea County?
Median Population Age in Lea County is 32.2 Years.
What is the Average Family Size in Lea County
Average Family Size in Lea County is 3.5 People.
What is the Average Household Size in Lea County
Average Household Size in Lea County is 2.9 People.
How Large is the Labor Force in Lea County?
There are 33,330 People in the Labor Forcein in Lea County.
What is the Percentage of People in the Labor Force in Lea County?
62.3% of People are in the Labor Force in Lea County.
What is the Unemployment Rate in Lea County?
Unemployment Rate in Lea County is 7.4%.