Union County, NM Map & Demographics
Union County Map
Union County Overview
$20,779
PER CAPITA INCOME
$51,944
AVG FAMILY INCOME
$41,714
AVG HOUSEHOLD INCOME
40.0%
WAGE / INCOME GAP [ % ]
60.0¢/ $1
WAGE / INCOME GAP [ $ ]
0.41
INEQUALITY / GINI INDEX
4,074
TOTAL POPULATION
2,182
MALE POPULATION
1,892
FEMALE POPULATION
115.33
MALES / 100 FEMALES
86.71
FEMALES / 100 MALES
39.4
MEDIAN AGE
3.3
AVG FAMILY SIZE
2.5
AVG HOUSEHOLD SIZE
1,440
LABOR FORCE [ PEOPLE ]
43.9%
PERCENT IN LABOR FORCE
5.8%
UNEMPLOYMENT RATE
Income in Union County
Income Overview in Union County
Per Capita Income in Union County is $20,779, while median incomes of families and households are $51,944 and $41,714 respectively.
| Characteristic | Number | Measure |
| Per Capita Income | 4,074 | $20,779 |
| Median Family Income | 822 | $51,944 |
| Mean Family Income | 822 | $58,921 |
| Median Household Income | 1,463 | $41,714 |
| Mean Household Income | 1,463 | $53,388 |
| Income Deficit | 822 | $0 |
| Wage / Income Gap (%) | 4,074 | 40.03% |
| Wage / Income Gap ($) | 4,074 | 59.97¢ per $1 |
| Gini / Inequality Index | 4,074 | 0.41 |
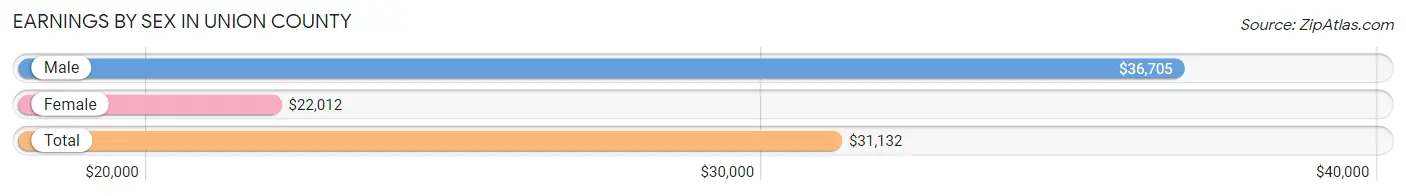
Earnings by Sex in Union County
Average Earnings in Union County are $31,132, $36,705 for men and $22,012 for women, a difference of 40.0%.
| Sex | Number | Average Earnings |
| Male | 808 (53.0%) | $36,705 |
| Female | 716 (47.0%) | $22,012 |
| Total | 1,524 (100.0%) | $31,132 |
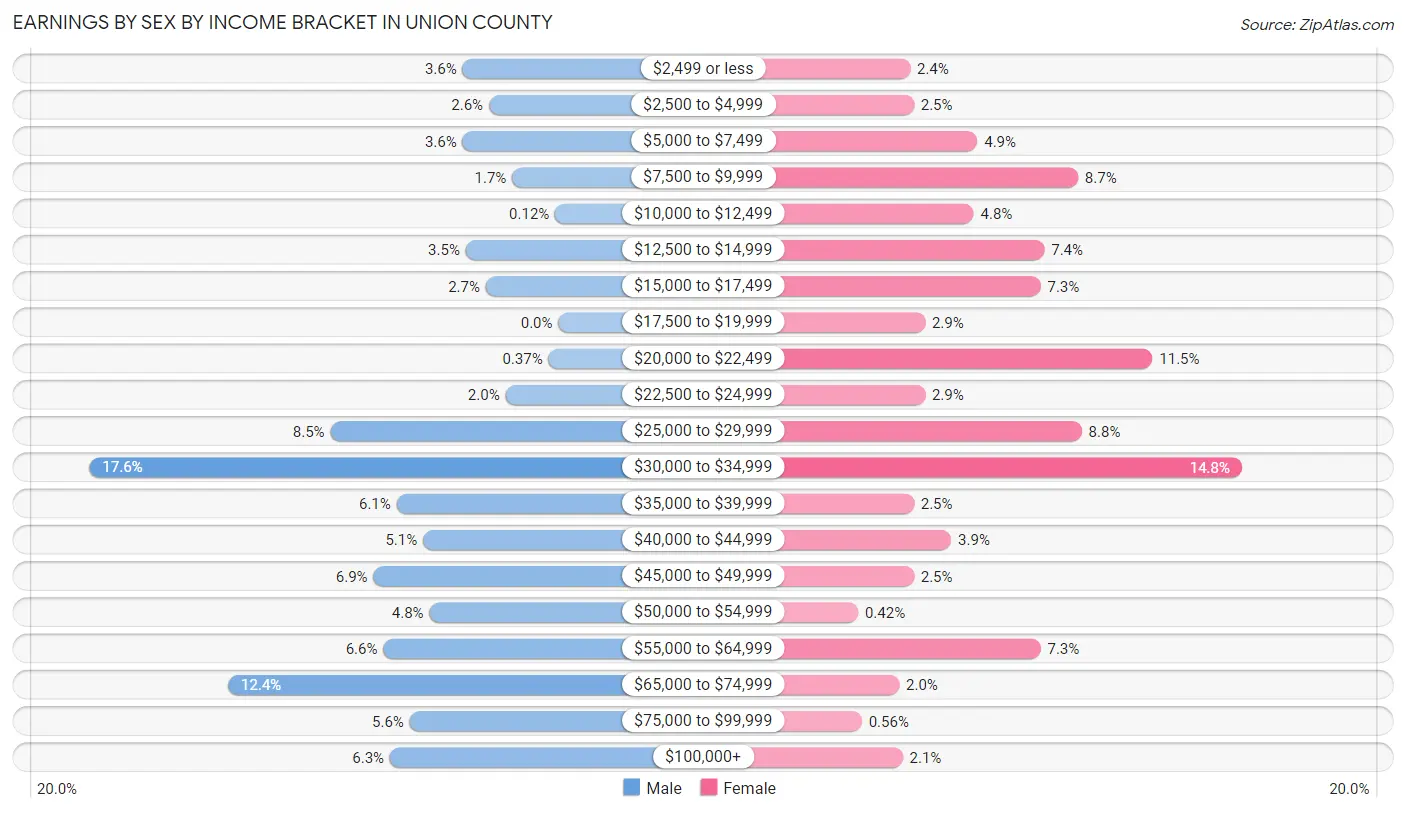
Earnings by Sex by Income Bracket in Union County
The most common earnings brackets in Union County are $30,000 to $34,999 for men (142 | 17.6%) and $30,000 to $34,999 for women (106 | 14.8%).
| Income | Male | Female |
| $2,499 or less | 29 (3.6%) | 17 (2.4%) |
| $2,500 to $4,999 | 21 (2.6%) | 18 (2.5%) |
| $5,000 to $7,499 | 29 (3.6%) | 35 (4.9%) |
| $7,500 to $9,999 | 14 (1.7%) | 62 (8.7%) |
| $10,000 to $12,499 | 1 (0.1%) | 34 (4.8%) |
| $12,500 to $14,999 | 28 (3.5%) | 53 (7.4%) |
| $15,000 to $17,499 | 22 (2.7%) | 52 (7.3%) |
| $17,500 to $19,999 | 0 (0.0%) | 21 (2.9%) |
| $20,000 to $22,499 | 3 (0.4%) | 82 (11.5%) |
| $22,500 to $24,999 | 16 (2.0%) | 21 (2.9%) |
| $25,000 to $29,999 | 69 (8.5%) | 63 (8.8%) |
| $30,000 to $34,999 | 142 (17.6%) | 106 (14.8%) |
| $35,000 to $39,999 | 49 (6.1%) | 18 (2.5%) |
| $40,000 to $44,999 | 41 (5.1%) | 28 (3.9%) |
| $45,000 to $49,999 | 56 (6.9%) | 18 (2.5%) |
| $50,000 to $54,999 | 39 (4.8%) | 3 (0.4%) |
| $55,000 to $64,999 | 53 (6.6%) | 52 (7.3%) |
| $65,000 to $74,999 | 100 (12.4%) | 14 (2.0%) |
| $75,000 to $99,999 | 45 (5.6%) | 4 (0.6%) |
| $100,000+ | 51 (6.3%) | 15 (2.1%) |
| Total | 808 (100.0%) | 716 (100.0%) |
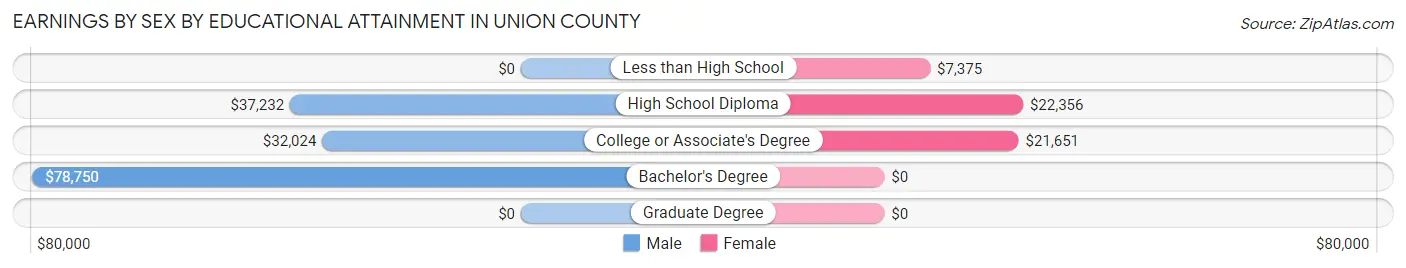
Earnings by Sex by Educational Attainment in Union County
Average earnings in Union County are $42,240 for men and $21,829 for women, a difference of 48.3%. Men with an educational attainment of bachelor's degree enjoy the highest average annual earnings of $78,750, while those with college or associate's degree education earn the least with $32,024. Women with an educational attainment of high school diploma earn the most with the average annual earnings of $22,356, while those with less than high school education have the smallest earnings of $7,375.
| Educational Attainment | Male Income | Female Income |
| Less than High School | - | - |
| High School Diploma | $37,232 | $22,356 |
| College or Associate's Degree | $32,024 | $21,651 |
| Bachelor's Degree | $78,750 | $0 |
| Graduate Degree | - | - |
| Total | $42,240 | $21,829 |
Family Income in Union County
Family Income Brackets in Union County
According to the Union County family income data, there are 190 families falling into the $50,000 to $74,999 income range, which is the most common income bracket and makes up 23.1% of all families. Conversely, the $200,000+ income bracket is the least frequent group with only 19 families (2.3%) belonging to this category.
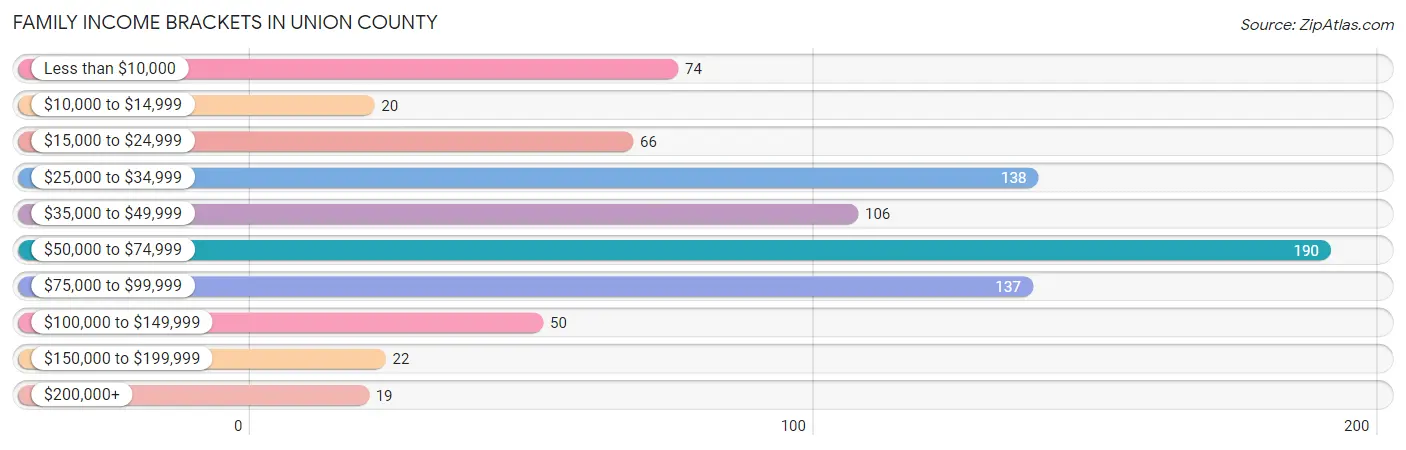
| Income Bracket | # Families | % Families |
| Less than $10,000 | 74 | 9.0% |
| $10,000 to $14,999 | 20 | 2.4% |
| $15,000 to $24,999 | 66 | 8.0% |
| $25,000 to $34,999 | 138 | 16.8% |
| $35,000 to $49,999 | 106 | 12.9% |
| $50,000 to $74,999 | 190 | 23.1% |
| $75,000 to $99,999 | 137 | 16.7% |
| $100,000 to $149,999 | 50 | 6.1% |
| $150,000 to $199,999 | 22 | 2.7% |
| $200,000+ | 19 | 2.3% |
Family Income by Famaliy Size in Union County
4-person families (134 | 16.3%) account for the highest median family income in Union County with $68,250 per family, while 2-person families (479 | 58.3%) have the highest median income of $21,532 per family member.
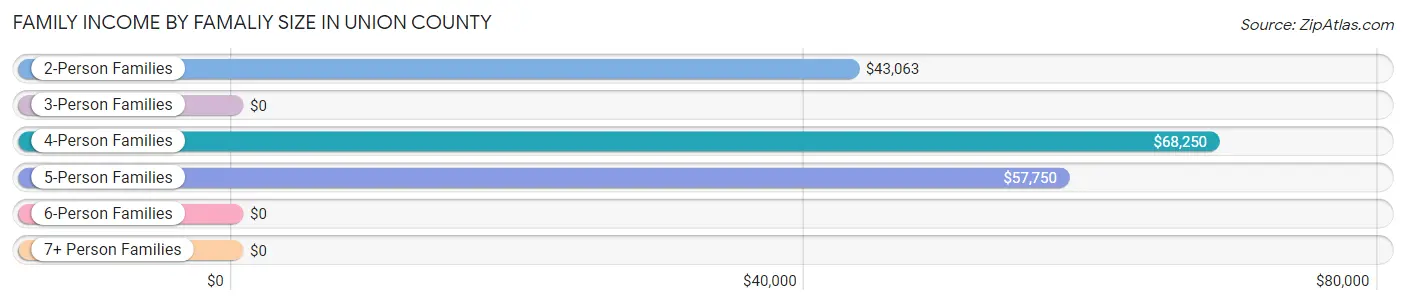
| Income Bracket | # Families | Median Income |
| 2-Person Families | 479 (58.3%) | $43,063 |
| 3-Person Families | 136 (16.6%) | $0 |
| 4-Person Families | 134 (16.3%) | $68,250 |
| 5-Person Families | 58 (7.1%) | $57,750 |
| 6-Person Families | 4 (0.5%) | $0 |
| 7+ Person Families | 11 (1.3%) | $0 |
| Total | 822 (100.0%) | $51,944 |
Family Income by Number of Earners in Union County
The median family income in Union County is $51,944, with families comprising 3+ earners (40) having the highest median family income of $136,667, while families with no earners (255) have the lowest median family income of $30,240, accounting for 4.9% and 31.0% of families, respectively.
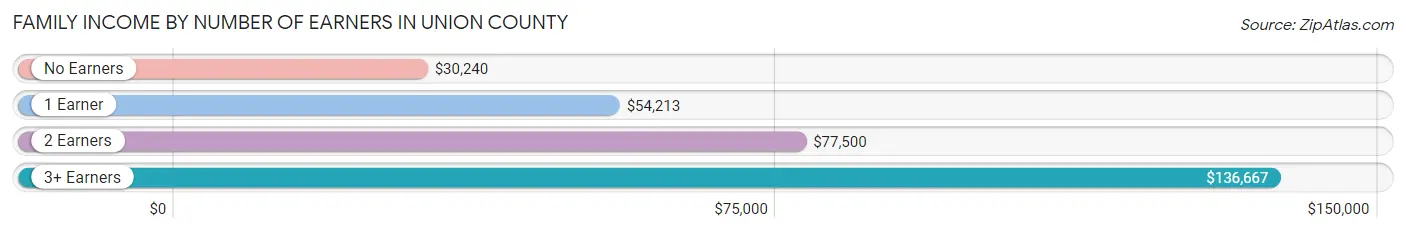
| Number of Earners | # Families | Median Income |
| No Earners | 255 (31.0%) | $30,240 |
| 1 Earner | 287 (34.9%) | $54,213 |
| 2 Earners | 240 (29.2%) | $77,500 |
| 3+ Earners | 40 (4.9%) | $136,667 |
| Total | 822 (100.0%) | $51,944 |
Household Income in Union County
Household Income Brackets in Union County
With 331 households falling in the category, the $50,000 to $74,999 income range is the most frequent in Union County, accounting for 22.6% of all households. In contrast, only 19 households (1.3%) fall into the $200,000+ income bracket, making it the least populous group.
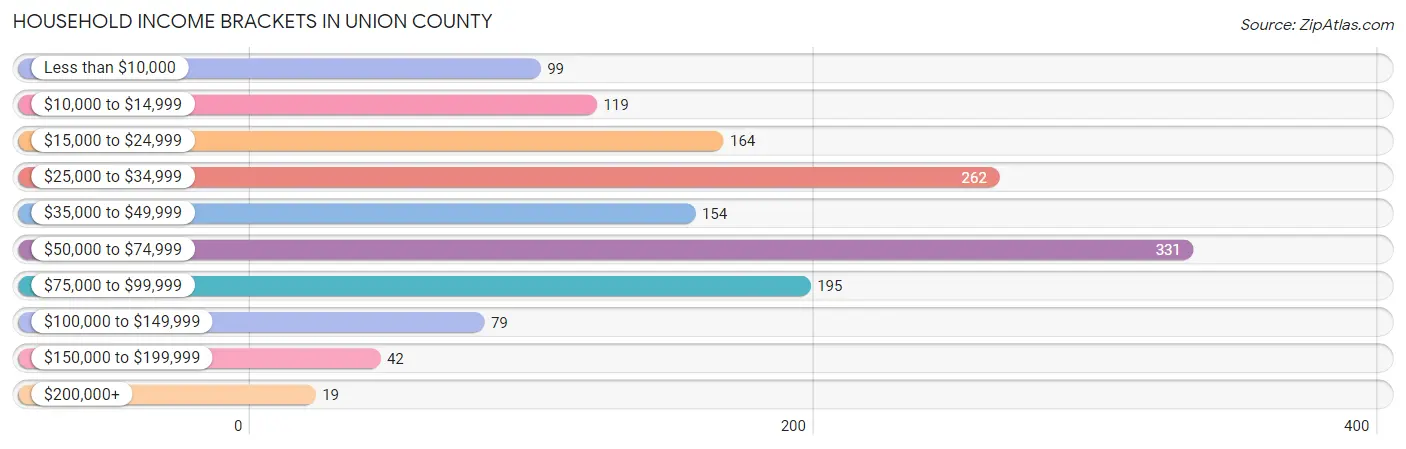
| Income Bracket | # Households | % Households |
| Less than $10,000 | 99 | 6.8% |
| $10,000 to $14,999 | 119 | 8.1% |
| $15,000 to $24,999 | 164 | 11.2% |
| $25,000 to $34,999 | 262 | 17.9% |
| $35,000 to $49,999 | 154 | 10.5% |
| $50,000 to $74,999 | 331 | 22.6% |
| $75,000 to $99,999 | 195 | 13.3% |
| $100,000 to $149,999 | 79 | 5.4% |
| $150,000 to $199,999 | 42 | 2.9% |
| $200,000+ | 19 | 1.3% |
Household Income by Householder Age in Union County
The median household income in Union County is $41,714, with the highest median household income of $58,614 found in the 45 to 64 years age bracket for the primary householder. A total of 475 households (32.5%) fall into this category. Meanwhile, the 25 to 44 years age bracket for the primary householder has the lowest median household income of $0, with 287 households (19.6%) in this group.
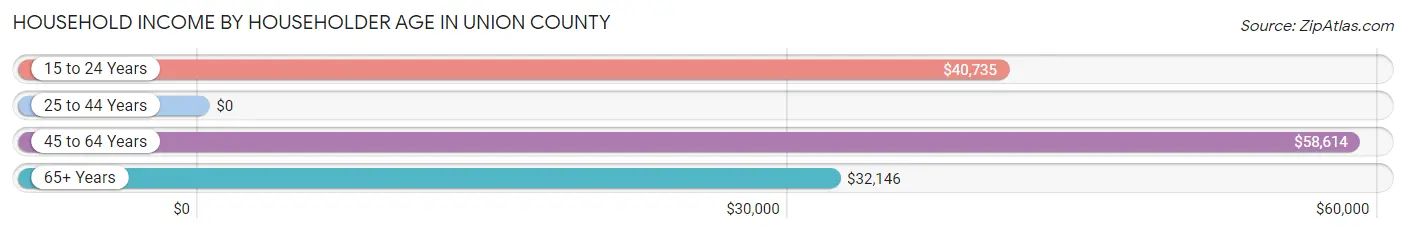
| Income Bracket | # Households | Median Income |
| 15 to 24 Years | 78 (5.3%) | $40,735 |
| 25 to 44 Years | 287 (19.6%) | $0 |
| 45 to 64 Years | 475 (32.5%) | $58,614 |
| 65+ Years | 623 (42.6%) | $32,146 |
| Total | 1,463 (100.0%) | $41,714 |
Poverty in Union County
Income Below Poverty by Sex and Age in Union County
With 15.1% poverty level for males and 20.3% for females among the residents of Union County, 45 to 54 year old males and 16 and 17 year old females are the most vulnerable to poverty, with 57 males (35.6%) and 37 females (67.3%) in their respective age groups living below the poverty level.
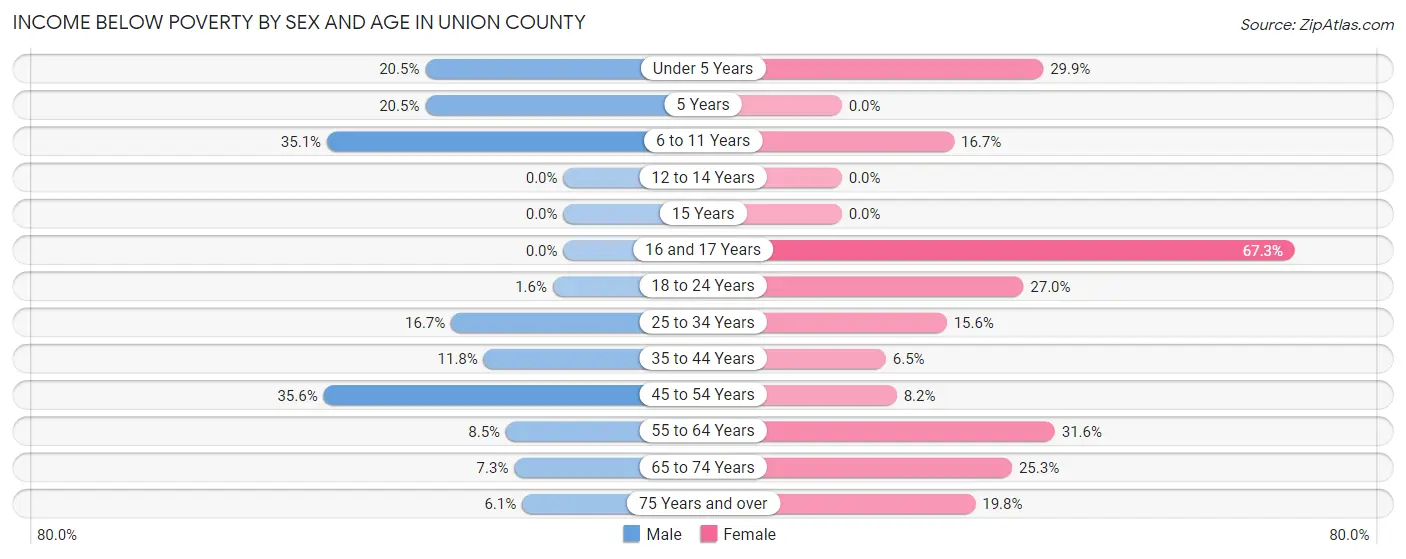
| Age Bracket | Male | Female |
| Under 5 Years | 32 (20.5%) | 32 (29.9%) |
| 5 Years | 8 (20.5%) | 0 (0.0%) |
| 6 to 11 Years | 66 (35.1%) | 30 (16.7%) |
| 12 to 14 Years | 0 (0.0%) | 0 (0.0%) |
| 15 Years | 0 (0.0%) | 0 (0.0%) |
| 16 and 17 Years | 0 (0.0%) | 37 (67.3%) |
| 18 to 24 Years | 3 (1.6%) | 31 (27.0%) |
| 25 to 34 Years | 28 (16.7%) | 43 (15.6%) |
| 35 to 44 Years | 18 (11.8%) | 10 (6.5%) |
| 45 to 54 Years | 57 (35.6%) | 11 (8.2%) |
| 55 to 64 Years | 25 (8.5%) | 68 (31.6%) |
| 65 to 74 Years | 14 (7.3%) | 71 (25.3%) |
| 75 Years and over | 10 (6.1%) | 45 (19.8%) |
| Total | 261 (15.1%) | 378 (20.3%) |
Income Above Poverty by Sex and Age in Union County
According to the poverty statistics in Union County, males aged 16 and 17 years and females aged 5 years are the age groups that are most secure financially, with 100.0% of males and 100.0% of females in these age groups living above the poverty line.
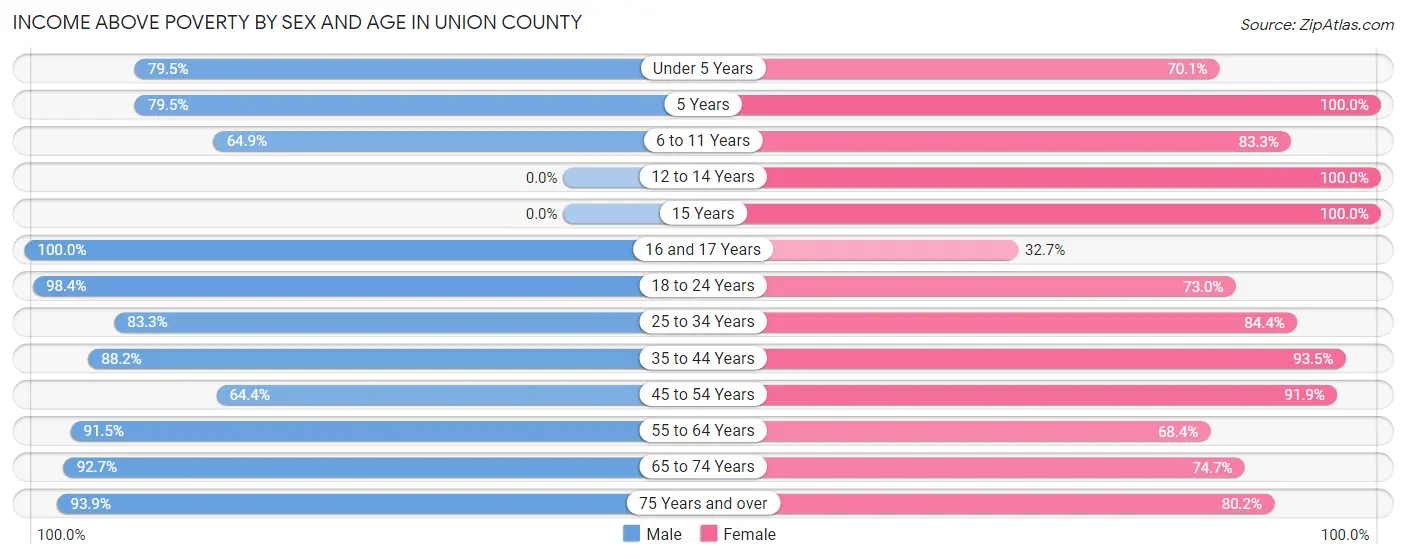
| Age Bracket | Male | Female |
| Under 5 Years | 124 (79.5%) | 75 (70.1%) |
| 5 Years | 31 (79.5%) | 71 (100.0%) |
| 6 to 11 Years | 122 (64.9%) | 150 (83.3%) |
| 12 to 14 Years | 0 (0.0%) | 37 (100.0%) |
| 15 Years | 0 (0.0%) | 11 (100.0%) |
| 16 and 17 Years | 22 (100.0%) | 18 (32.7%) |
| 18 to 24 Years | 188 (98.4%) | 84 (73.0%) |
| 25 to 34 Years | 140 (83.3%) | 233 (84.4%) |
| 35 to 44 Years | 134 (88.2%) | 143 (93.5%) |
| 45 to 54 Years | 103 (64.4%) | 124 (91.8%) |
| 55 to 64 Years | 268 (91.5%) | 147 (68.4%) |
| 65 to 74 Years | 178 (92.7%) | 210 (74.7%) |
| 75 Years and over | 153 (93.9%) | 182 (80.2%) |
| Total | 1,463 (84.9%) | 1,485 (79.7%) |
Income Below Poverty Among Married-Couple Families in Union County
The poverty statistics for married-couple families in Union County show that 5.9% or 29 of the total 490 families live below the poverty line. Families with 1 or 2 children have the highest poverty rate of 7.0%, comprising of 9 families. On the other hand, families with 3 or 4 children have the lowest poverty rate of 0.0%, which includes 0 families.
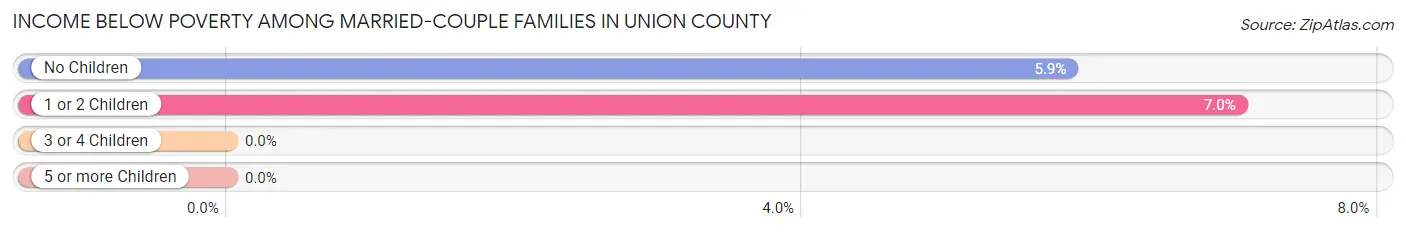
| Children | Above Poverty | Below Poverty |
| No Children | 322 (94.2%) | 20 (5.9%) |
| 1 or 2 Children | 119 (93.0%) | 9 (7.0%) |
| 3 or 4 Children | 18 (100.0%) | 0 (0.0%) |
| 5 or more Children | 2 (100.0%) | 0 (0.0%) |
| Total | 461 (94.1%) | 29 (5.9%) |
Income Below Poverty Among Single-Parent Households in Union County
According to the poverty data in Union County, 43.3% or 52 single-father households and 29.2% or 62 single-mother households are living below the poverty line. Among single-father households, those with 1 or 2 children have the highest poverty rate, with 52 households (43.3%) experiencing poverty. Likewise, among single-mother households, those with 1 or 2 children have the highest poverty rate, with 43 households (34.1%) falling below the poverty line.
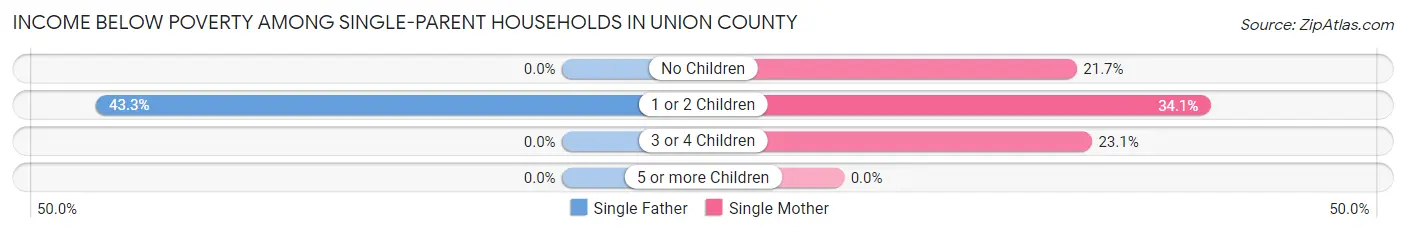
| Children | Single Father | Single Mother |
| No Children | 0 (0.0%) | 13 (21.7%) |
| 1 or 2 Children | 52 (43.3%) | 43 (34.1%) |
| 3 or 4 Children | 0 (0.0%) | 6 (23.1%) |
| 5 or more Children | 0 (0.0%) | 0 (0.0%) |
| Total | 52 (43.3%) | 62 (29.2%) |
Income Below Poverty Among Married-Couple vs Single-Parent Households in Union County
The poverty data for Union County shows that 29 of the married-couple family households (5.9%) and 114 of the single-parent households (34.3%) are living below the poverty level. Within the married-couple family households, those with 1 or 2 children have the highest poverty rate, with 9 households (7.0%) falling below the poverty line. Among the single-parent households, those with 1 or 2 children have the highest poverty rate, with 95 household (38.6%) living below poverty.
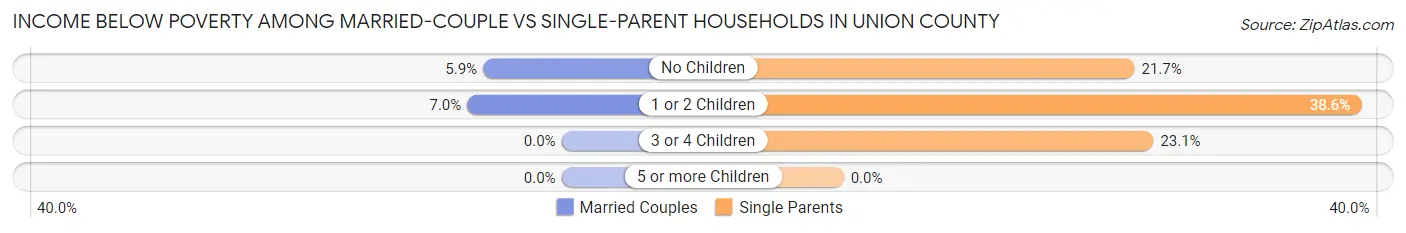
| Children | Married-Couple Families | Single-Parent Households |
| No Children | 20 (5.9%) | 13 (21.7%) |
| 1 or 2 Children | 9 (7.0%) | 95 (38.6%) |
| 3 or 4 Children | 0 (0.0%) | 6 (23.1%) |
| 5 or more Children | 0 (0.0%) | 0 (0.0%) |
| Total | 29 (5.9%) | 114 (34.3%) |
Race in Union County
The most populous races in Union County are White / Caucasian (2,851 | 70.0%), Hispanic or Latino (1,718 | 42.2%), and Two or more Races (835 | 20.5%).
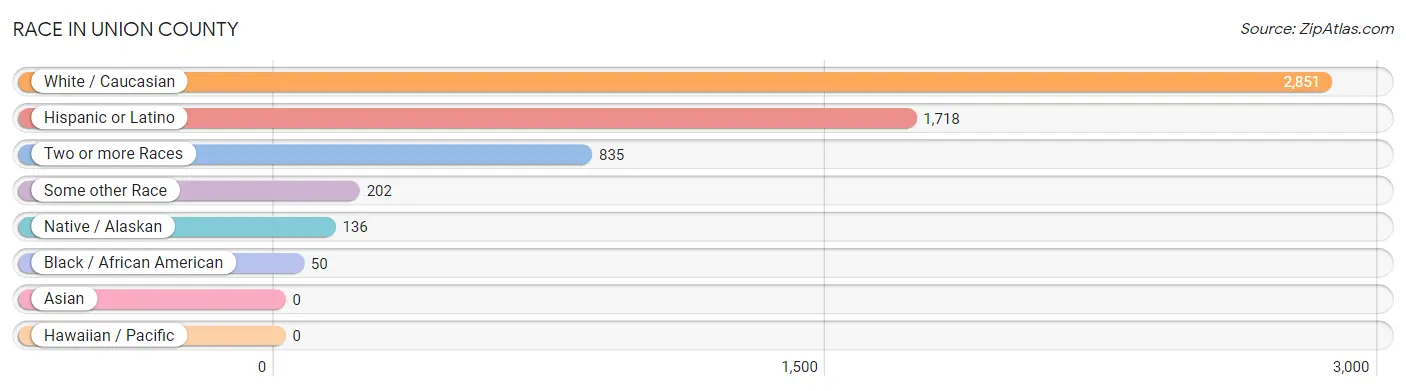
| Race | # Population | % Population |
| Asian | 0 | 0.0% |
| Black / African American | 50 | 1.2% |
| Hawaiian / Pacific | 0 | 0.0% |
| Hispanic or Latino | 1,718 | 42.2% |
| Native / Alaskan | 136 | 3.3% |
| White / Caucasian | 2,851 | 70.0% |
| Two or more Races | 835 | 20.5% |
| Some other Race | 202 | 5.0% |
| Total | 4,074 | 100.0% |
Ancestry in Union County
The most populous ancestries reported in Union County are Mexican (800 | 19.6%), German (639 | 15.7%), Spanish (578 | 14.2%), Irish (402 | 9.9%), and English (385 | 9.5%), together accounting for 68.8% of all Union County residents.
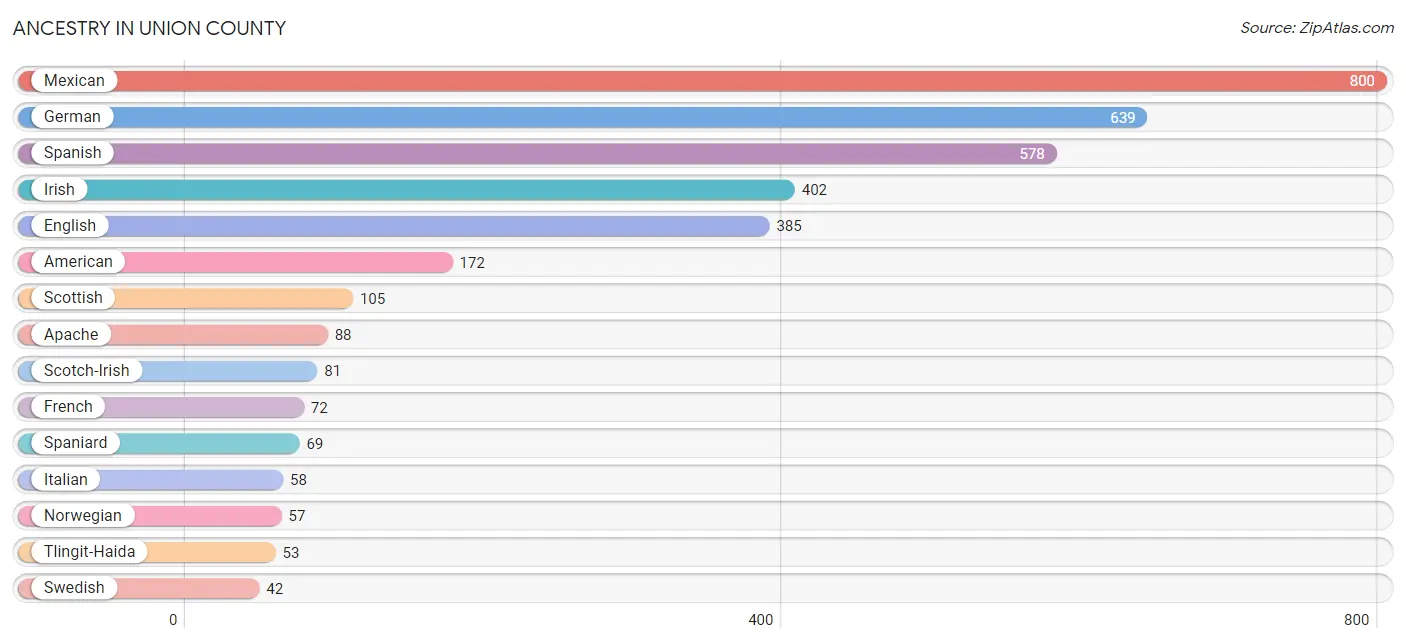
| Ancestry | # Population | % Population |
| African | 8 | 0.2% |
| Alaska Native | 5 | 0.1% |
| American | 172 | 4.2% |
| Apache | 88 | 2.2% |
| Arab | 7 | 0.2% |
| Basque | 8 | 0.2% |
| Belgian | 20 | 0.5% |
| British | 32 | 0.8% |
| Celtic | 7 | 0.2% |
| Cherokee | 10 | 0.3% |
| Croatian | 1 | 0.0% |
| Danish | 1 | 0.0% |
| Dutch | 34 | 0.8% |
| Eastern European | 11 | 0.3% |
| English | 385 | 9.5% |
| European | 16 | 0.4% |
| Finnish | 19 | 0.5% |
| French | 72 | 1.8% |
| French Canadian | 1 | 0.0% |
| German | 639 | 15.7% |
| Irish | 402 | 9.9% |
| Italian | 58 | 1.4% |
| Lumbee | 4 | 0.1% |
| Mexican | 800 | 19.6% |
| Navajo | 24 | 0.6% |
| Northern European | 6 | 0.2% |
| Norwegian | 57 | 1.4% |
| Peruvian | 7 | 0.2% |
| Polish | 20 | 0.5% |
| Portuguese | 6 | 0.2% |
| Russian | 10 | 0.3% |
| Scandinavian | 9 | 0.2% |
| Scotch-Irish | 81 | 2.0% |
| Scottish | 105 | 2.6% |
| Slovak | 3 | 0.1% |
| South American | 7 | 0.2% |
| Spaniard | 69 | 1.7% |
| Spanish | 578 | 14.2% |
| Spanish American | 27 | 0.7% |
| Sri Lankan | 6 | 0.2% |
| Subsaharan African | 8 | 0.2% |
| Swedish | 42 | 1.0% |
| Swiss | 7 | 0.2% |
| Tlingit-Haida | 53 | 1.3% |
| Welsh | 6 | 0.2% | View All 45 Rows |
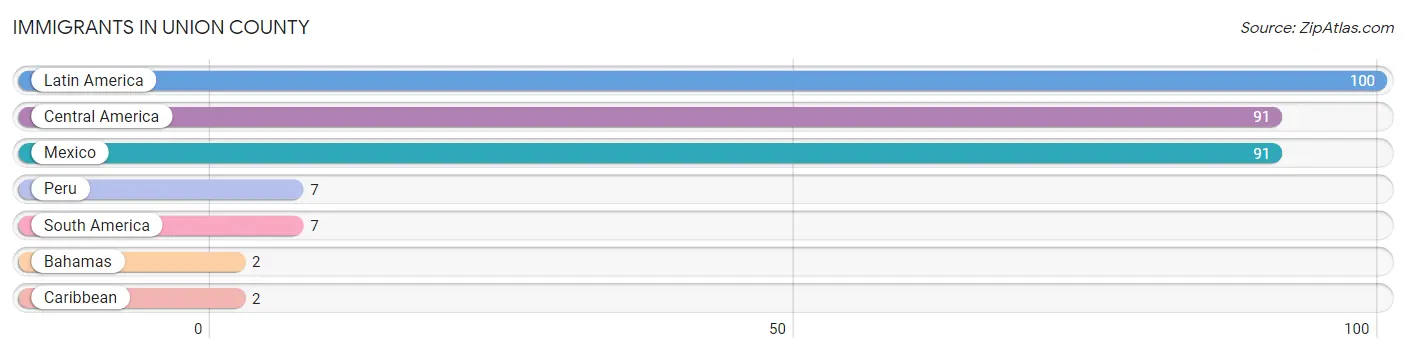
Immigrants in Union County
The most numerous immigrant groups reported in Union County came from Latin America (100 | 2.5%), Central America (91 | 2.2%), Mexico (91 | 2.2%), Peru (7 | 0.2%), and South America (7 | 0.2%), together accounting for 7.2% of all Union County residents.
| Immigration Origin | # Population | % Population |
| Bahamas | 2 | 0.1% |
| Caribbean | 2 | 0.1% |
| Central America | 91 | 2.2% |
| Latin America | 100 | 2.5% |
| Mexico | 91 | 2.2% |
| Peru | 7 | 0.2% |
| South America | 7 | 0.2% | View All 7 Rows |
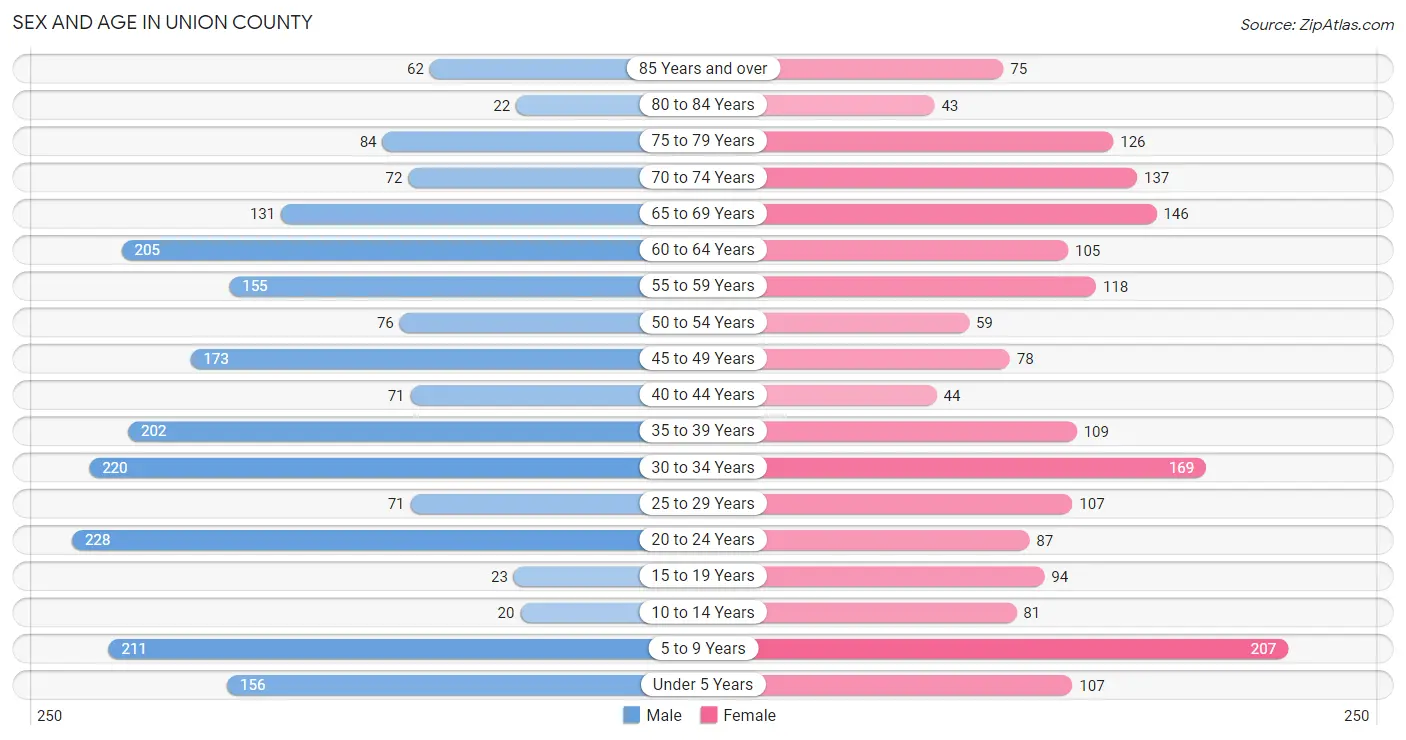
Sex and Age in Union County
Sex and Age in Union County
The most populous age groups in Union County are 20 to 24 Years (228 | 10.4%) for men and 5 to 9 Years (207 | 10.9%) for women.
| Age Bracket | Male | Female |
| Under 5 Years | 156 (7.1%) | 107 (5.7%) |
| 5 to 9 Years | 211 (9.7%) | 207 (10.9%) |
| 10 to 14 Years | 20 (0.9%) | 81 (4.3%) |
| 15 to 19 Years | 23 (1.1%) | 94 (5.0%) |
| 20 to 24 Years | 228 (10.4%) | 87 (4.6%) |
| 25 to 29 Years | 71 (3.3%) | 107 (5.7%) |
| 30 to 34 Years | 220 (10.1%) | 169 (8.9%) |
| 35 to 39 Years | 202 (9.3%) | 109 (5.8%) |
| 40 to 44 Years | 71 (3.3%) | 44 (2.3%) |
| 45 to 49 Years | 173 (7.9%) | 78 (4.1%) |
| 50 to 54 Years | 76 (3.5%) | 59 (3.1%) |
| 55 to 59 Years | 155 (7.1%) | 118 (6.2%) |
| 60 to 64 Years | 205 (9.4%) | 105 (5.6%) |
| 65 to 69 Years | 131 (6.0%) | 146 (7.7%) |
| 70 to 74 Years | 72 (3.3%) | 137 (7.2%) |
| 75 to 79 Years | 84 (3.8%) | 126 (6.7%) |
| 80 to 84 Years | 22 (1.0%) | 43 (2.3%) |
| 85 Years and over | 62 (2.8%) | 75 (4.0%) |
| Total | 2,182 (100.0%) | 1,892 (100.0%) |
Families and Households in Union County
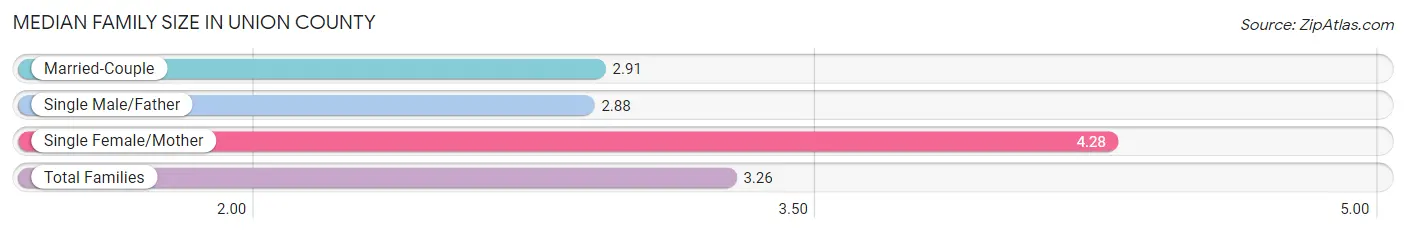
Median Family Size in Union County
The median family size in Union County is 3.26 persons per family, with single female/mother families (212 | 25.8%) accounting for the largest median family size of 4.28 persons per family. On the other hand, single male/father families (120 | 14.6%) represent the smallest median family size with 2.88 persons per family.
| Family Type | # Families | Family Size |
| Married-Couple | 490 (59.6%) | 2.91 |
| Single Male/Father | 120 (14.6%) | 2.88 |
| Single Female/Mother | 212 (25.8%) | 4.28 |
| Total Families | 822 (100.0%) | 3.26 |
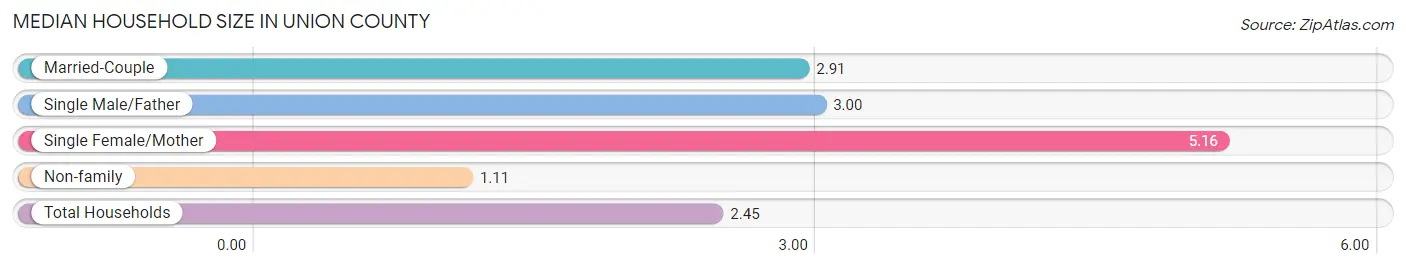
Median Household Size in Union County
The median household size in Union County is 2.45 persons per household, with single female/mother households (212 | 14.5%) accounting for the largest median household size of 5.16 persons per household. non-family households (641 | 43.8%) represent the smallest median household size with 1.11 persons per household.
| Household Type | # Households | Household Size |
| Married-Couple | 490 (33.5%) | 2.91 |
| Single Male/Father | 120 (8.2%) | 3.00 |
| Single Female/Mother | 212 (14.5%) | 5.16 |
| Non-family | 641 (43.8%) | 1.11 |
| Total Households | 1,463 (100.0%) | 2.45 |
Household Size by Marriage Status in Union County
Out of a total of 1,463 households in Union County, 822 (56.2%) are family households, while 641 (43.8%) are nonfamily households. The most numerous type of family households are 2-person households, comprising 455, and the most common type of nonfamily households are 1-person households, comprising 583.
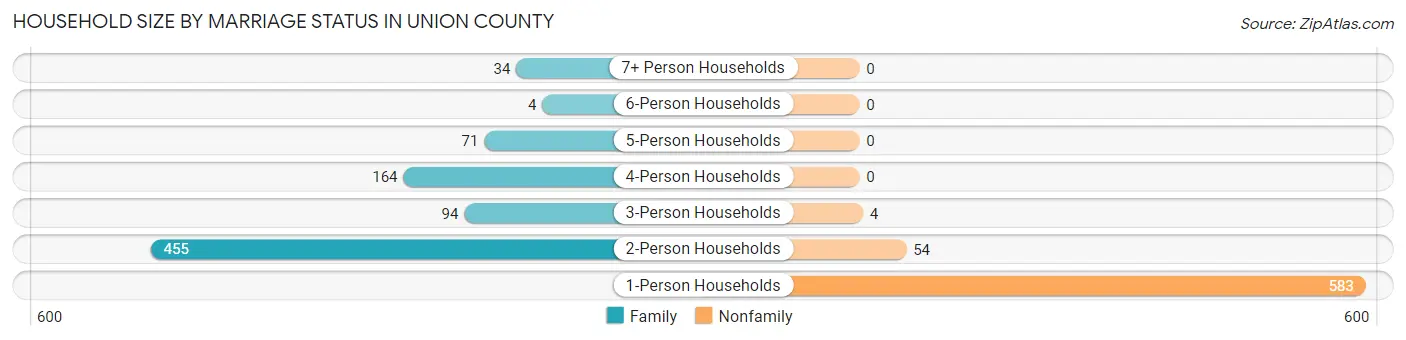
| Household Size | Family Households | Nonfamily Households |
| 1-Person Households | - | 583 (39.9%) |
| 2-Person Households | 455 (31.1%) | 54 (3.7%) |
| 3-Person Households | 94 (6.4%) | 4 (0.3%) |
| 4-Person Households | 164 (11.2%) | 0 (0.0%) |
| 5-Person Households | 71 (4.9%) | 0 (0.0%) |
| 6-Person Households | 4 (0.3%) | 0 (0.0%) |
| 7+ Person Households | 34 (2.3%) | 0 (0.0%) |
| Total | 822 (56.2%) | 641 (43.8%) |
Female Fertility in Union County
Fertility by Age in Union County
Average fertility rate in Union County is 65.0 births per 1,000 women. Women in the age bracket of 20 to 34 years have the highest fertility rate with 124.0 births per 1,000 women. Women in the age bracket of 20 to 34 years acount for 100.0% of all women with births.
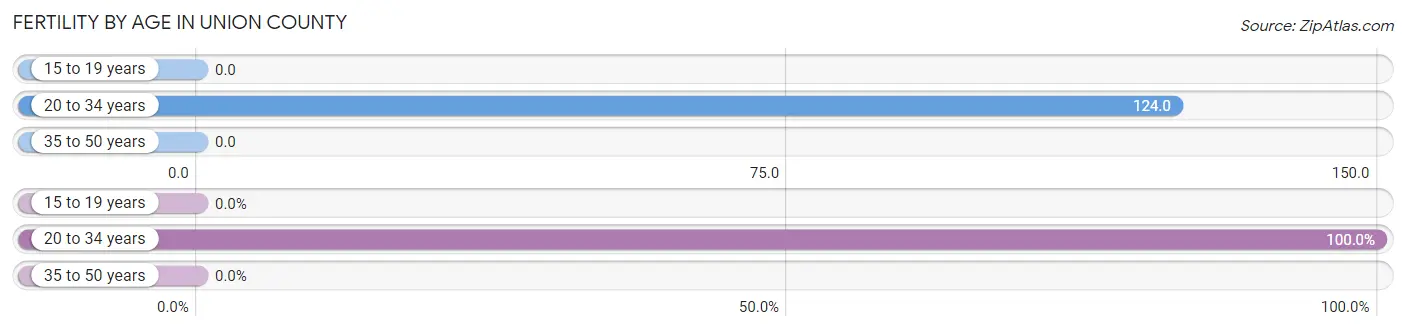
| Age Bracket | Women with Births | Births / 1,000 Women |
| 15 to 19 years | 0 (0.0%) | 0.0 |
| 20 to 34 years | 45 (100.0%) | 124.0 |
| 35 to 50 years | 0 (0.0%) | 0.0 |
| Total | 45 (100.0%) | 65.0 |
Fertility by Age by Marriage Status in Union County
46.7% of women with births (45) in Union County are married. The highest percentage of unmarried women with births falls into 20 to 34 years age bracket with 53.3% of them unmarried at the time of birth, while the lowest percentage of unmarried women with births belong to 20 to 34 years age bracket with 53.3% of them unmarried.
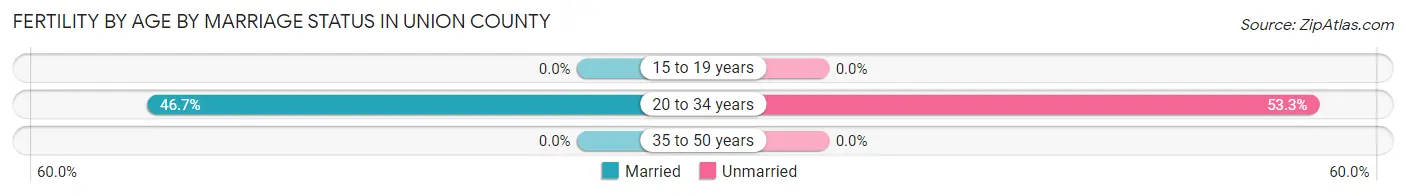
| Age Bracket | Married | Unmarried |
| 15 to 19 years | 0 (0.0%) | 0 (0.0%) |
| 20 to 34 years | 21 (46.7%) | 24 (53.3%) |
| 35 to 50 years | 0 (0.0%) | 0 (0.0%) |
| Total | 21 (46.7%) | 24 (53.3%) |
Fertility by Education in Union County
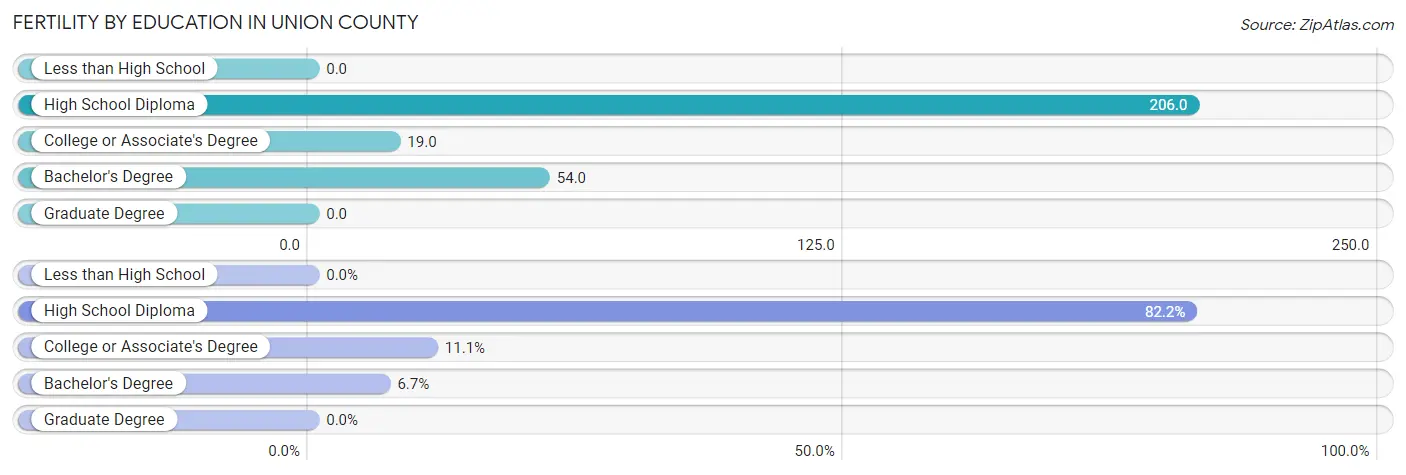
| Educational Attainment | Women with Births | Births / 1,000 Women |
| Less than High School | 0 (0.0%) | 0.0 |
| High School Diploma | 37 (82.2%) | 206.0 |
| College or Associate's Degree | 5 (11.1%) | 19.0 |
| Bachelor's Degree | 3 (6.7%) | 54.0 |
| Graduate Degree | 0 (0.0%) | 0.0 |
| Total | 45 (100.0%) | 65.0 |
Fertility by Education by Marriage Status in Union County
53.3% of women with births in Union County are unmarried. Women with the educational attainment of college or associate's degree are most likely to be married with 100.0% of them married at childbirth, while women with the educational attainment of high school diploma are least likely to be married with 64.9% of them unmarried at childbirth.
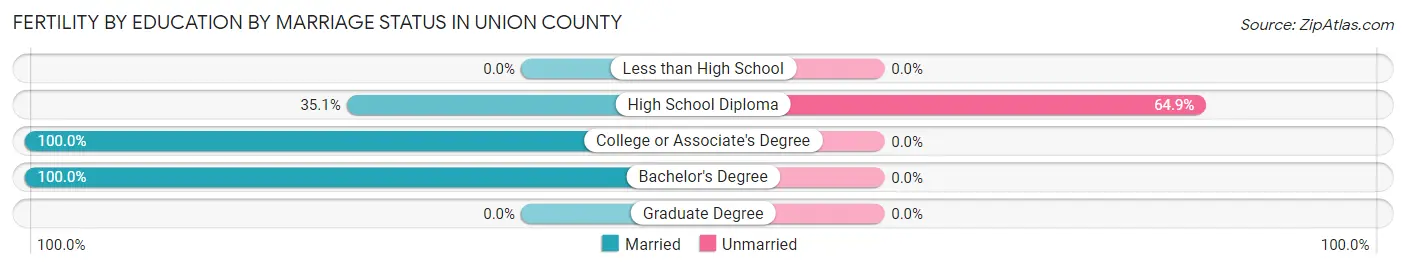
| Educational Attainment | Married | Unmarried |
| Less than High School | 0 (0.0%) | 0 (0.0%) |
| High School Diploma | 13 (35.1%) | 24 (64.9%) |
| College or Associate's Degree | 5 (100.0%) | 0 (0.0%) |
| Bachelor's Degree | 3 (100.0%) | 0 (0.0%) |
| Graduate Degree | 0 (0.0%) | 0 (0.0%) |
| Total | 21 (46.7%) | 24 (53.3%) |
Employment Characteristics in Union County
Employment by Class of Employer in Union County
Among the 1,315 employed individuals in Union County, private company employees (722 | 54.9%), local government employees (222 | 16.9%), and self-employed (not incorporated) (133 | 10.1%) make up the most common classes of employment.
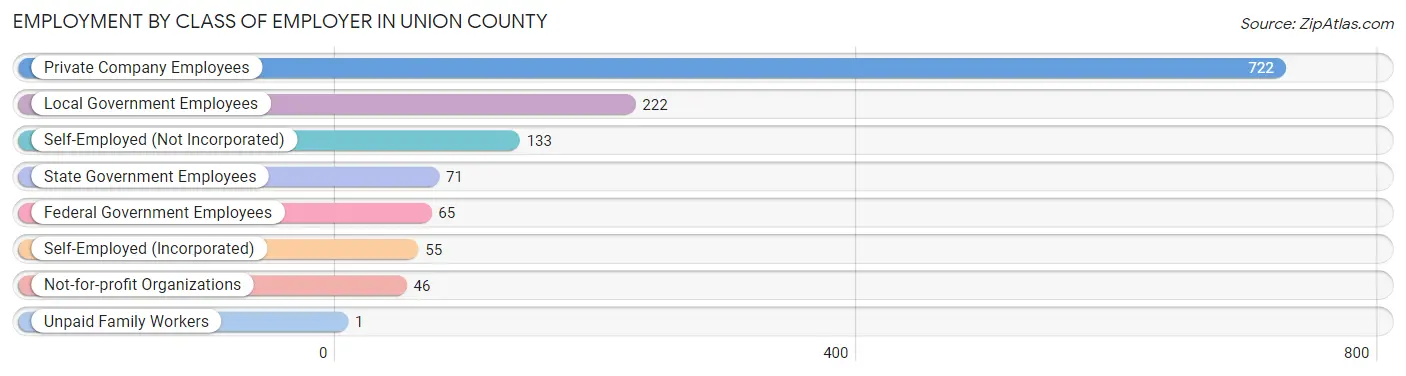
| Employer Class | # Employees | % Employees |
| Private Company Employees | 722 | 54.9% |
| Self-Employed (Incorporated) | 55 | 4.2% |
| Self-Employed (Not Incorporated) | 133 | 10.1% |
| Not-for-profit Organizations | 46 | 3.5% |
| Local Government Employees | 222 | 16.9% |
| State Government Employees | 71 | 5.4% |
| Federal Government Employees | 65 | 4.9% |
| Unpaid Family Workers | 1 | 0.1% |
| Total | 1,315 | 100.0% |
Employment Status by Age in Union County
According to the labor force statistics for Union County, out of the total population over 16 years of age (3,281), 43.9% or 1,440 individuals are in the labor force, with 5.8% or 84 of them unemployed. The age group with the highest labor force participation rate is 30 to 34 years, with 61.7% or 240 individuals in the labor force. Within the labor force, the 20 to 24 years age range has the highest percentage of unemployed individuals, with 14.3% or 26 of them being unemployed.
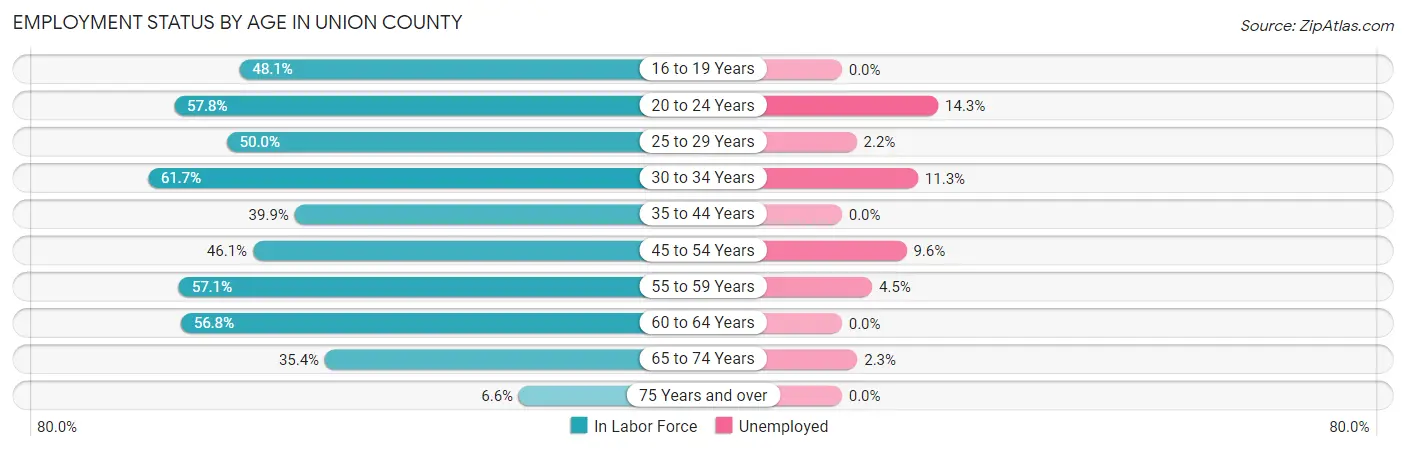
| Age Bracket | In Labor Force | Unemployed |
| 16 to 19 Years | 51 (48.1%) | 0 (0.0%) |
| 20 to 24 Years | 182 (57.8%) | 26 (14.3%) |
| 25 to 29 Years | 89 (50.0%) | 2 (2.2%) |
| 30 to 34 Years | 240 (61.7%) | 27 (11.3%) |
| 35 to 44 Years | 170 (39.9%) | 0 (0.0%) |
| 45 to 54 Years | 178 (46.1%) | 17 (9.6%) |
| 55 to 59 Years | 156 (57.1%) | 7 (4.5%) |
| 60 to 64 Years | 176 (56.8%) | 0 (0.0%) |
| 65 to 74 Years | 172 (35.4%) | 4 (2.3%) |
| 75 Years and over | 27 (6.6%) | 0 (0.0%) |
| Total | 1,440 (43.9%) | 84 (5.8%) |
Employment Status by Educational Attainment in Union County
According to labor force statistics for Union County, 51.4% of individuals (1,008) out of the total population between 25 and 64 years of age (1,962) are in the labor force, with 5.3% or 53 of them being unemployed. The group with the highest labor force participation rate are those with the educational attainment of bachelor's degree or higher, with 72.7% or 194 individuals in the labor force. Within the labor force, individuals with less than high school education have the highest percentage of unemployment, with 32.4% or 34 of them being unemployed.
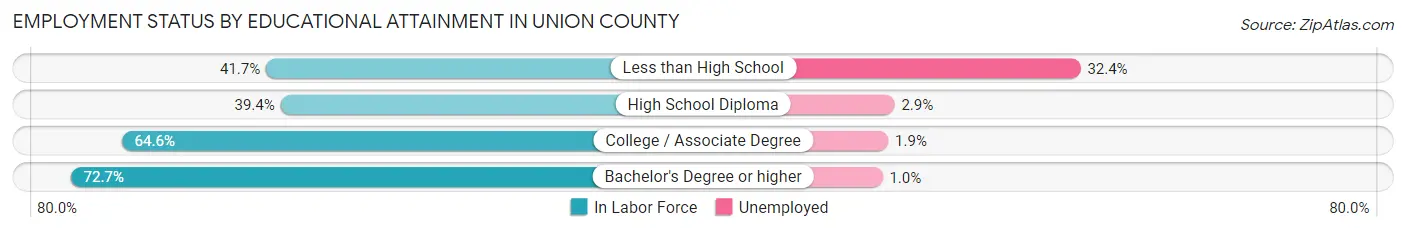
| Educational Attainment | In Labor Force | Unemployed |
| Less than High School | 105 (41.7%) | 82 (32.4%) |
| High School Diploma | 348 (39.4%) | 26 (2.9%) |
| College / Associate Degree | 362 (64.6%) | 11 (1.9%) |
| Bachelor's Degree or higher | 194 (72.7%) | 3 (1.0%) |
| Total | 1,008 (51.4%) | 104 (5.3%) |
Employment Occupations by Sex in Union County
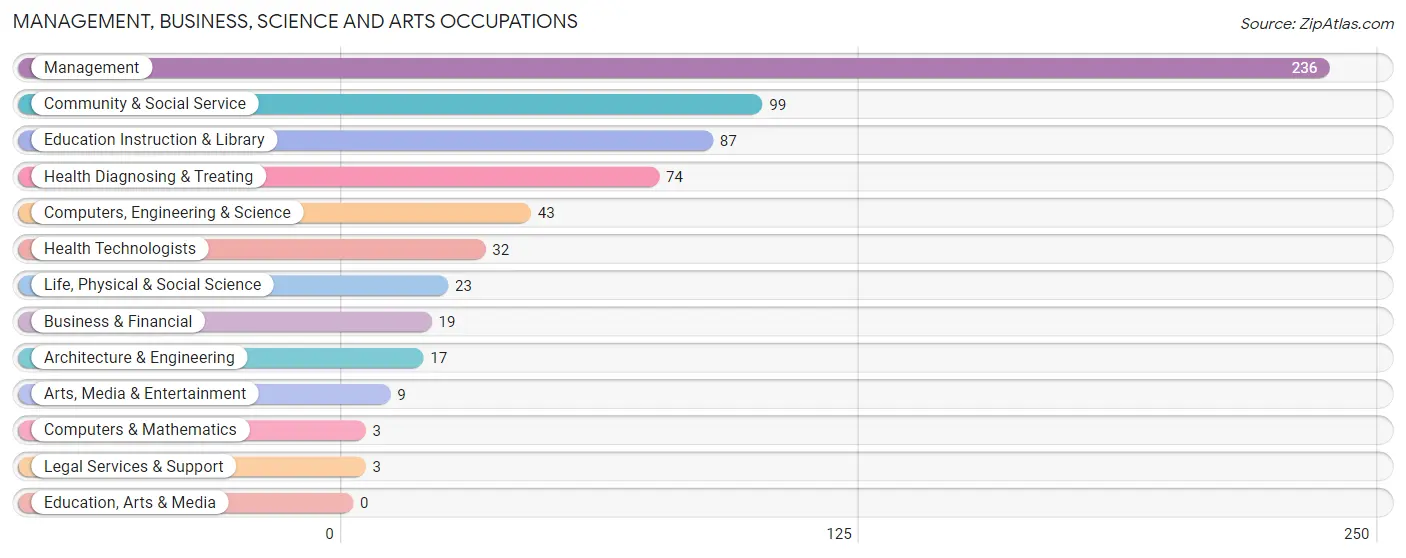
Management, Business, Science and Arts Occupations
The most common Management, Business, Science and Arts occupations in Union County are Management (236 | 17.4%), Community & Social Service (99 | 7.3%), Education Instruction & Library (87 | 6.4%), Health Diagnosing & Treating (74 | 5.4%), and Computers, Engineering & Science (43 | 3.2%).
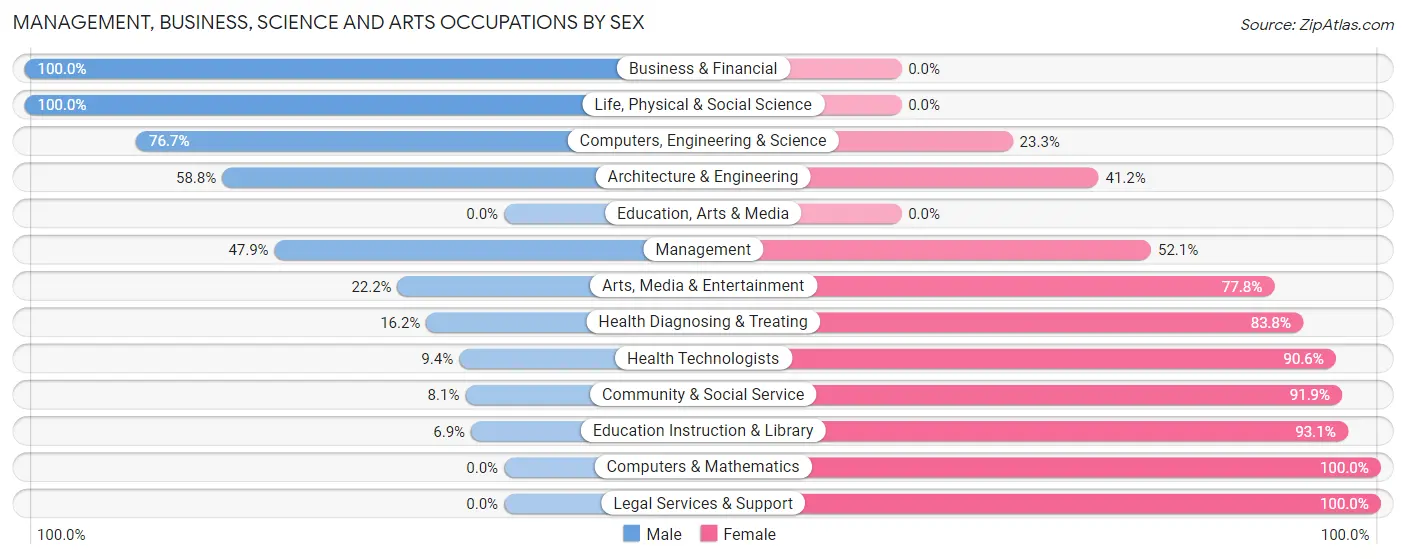
Management, Business, Science and Arts Occupations by Sex
Within the Management, Business, Science and Arts occupations in Union County, the most male-oriented occupations are Business & Financial (100.0%), Life, Physical & Social Science (100.0%), and Computers, Engineering & Science (76.7%), while the most female-oriented occupations are Computers & Mathematics (100.0%), Legal Services & Support (100.0%), and Education Instruction & Library (93.1%).
| Occupation | Male | Female |
| Management | 113 (47.9%) | 123 (52.1%) |
| Business & Financial | 19 (100.0%) | 0 (0.0%) |
| Computers, Engineering & Science | 33 (76.7%) | 10 (23.3%) |
| Computers & Mathematics | 0 (0.0%) | 3 (100.0%) |
| Architecture & Engineering | 10 (58.8%) | 7 (41.2%) |
| Life, Physical & Social Science | 23 (100.0%) | 0 (0.0%) |
| Community & Social Service | 8 (8.1%) | 91 (91.9%) |
| Education, Arts & Media | 0 (0.0%) | 0 (0.0%) |
| Legal Services & Support | 0 (0.0%) | 3 (100.0%) |
| Education Instruction & Library | 6 (6.9%) | 81 (93.1%) |
| Arts, Media & Entertainment | 2 (22.2%) | 7 (77.8%) |
| Health Diagnosing & Treating | 12 (16.2%) | 62 (83.8%) |
| Health Technologists | 3 (9.4%) | 29 (90.6%) |
| Total (Category) | 185 (39.3%) | 286 (60.7%) |
| Total (Overall) | 709 (52.2%) | 649 (47.8%) |
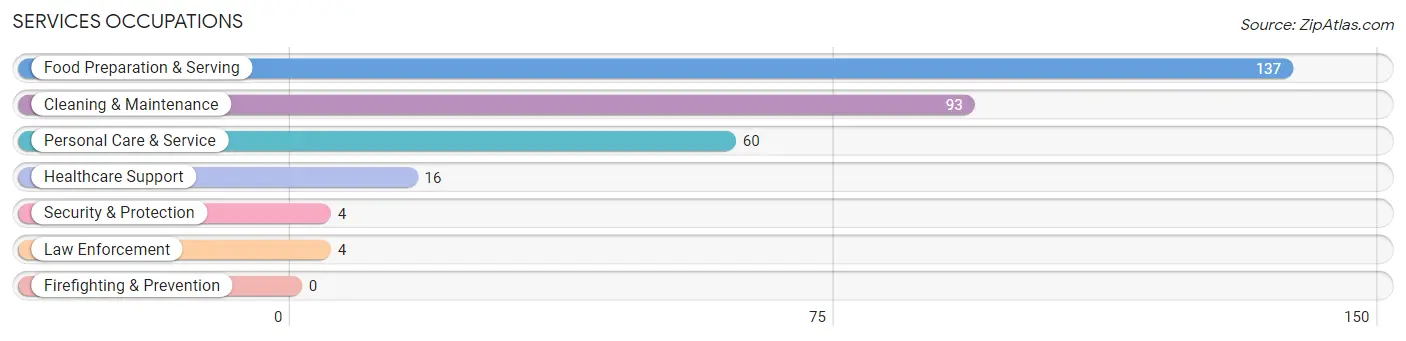
Services Occupations
The most common Services occupations in Union County are Food Preparation & Serving (137 | 10.1%), Cleaning & Maintenance (93 | 6.9%), Personal Care & Service (60 | 4.4%), Healthcare Support (16 | 1.2%), and Security & Protection (4 | 0.3%).
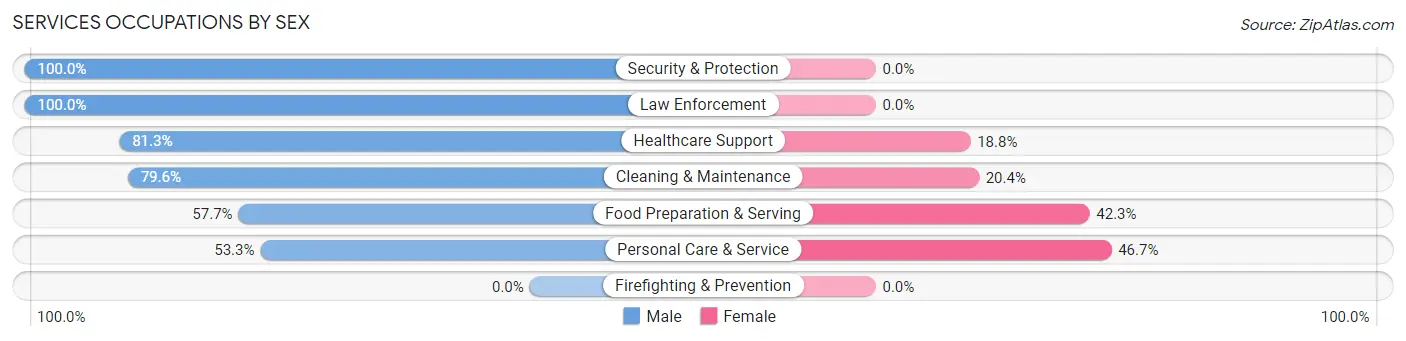
Services Occupations by Sex
Within the Services occupations in Union County, the most male-oriented occupations are Security & Protection (100.0%), Law Enforcement (100.0%), and Healthcare Support (81.2%), while the most female-oriented occupations are Personal Care & Service (46.7%), Food Preparation & Serving (42.3%), and Cleaning & Maintenance (20.4%).
| Occupation | Male | Female |
| Healthcare Support | 13 (81.2%) | 3 (18.8%) |
| Security & Protection | 4 (100.0%) | 0 (0.0%) |
| Firefighting & Prevention | 0 (0.0%) | 0 (0.0%) |
| Law Enforcement | 4 (100.0%) | 0 (0.0%) |
| Food Preparation & Serving | 79 (57.7%) | 58 (42.3%) |
| Cleaning & Maintenance | 74 (79.6%) | 19 (20.4%) |
| Personal Care & Service | 32 (53.3%) | 28 (46.7%) |
| Total (Category) | 202 (65.2%) | 108 (34.8%) |
| Total (Overall) | 709 (52.2%) | 649 (47.8%) |
Sales and Office Occupations
The most common Sales and Office occupations in Union County are Office & Administration (109 | 8.0%), and Sales & Related (90 | 6.6%).
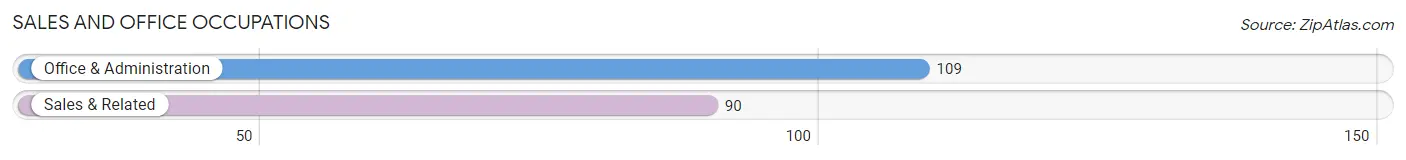
Sales and Office Occupations by Sex
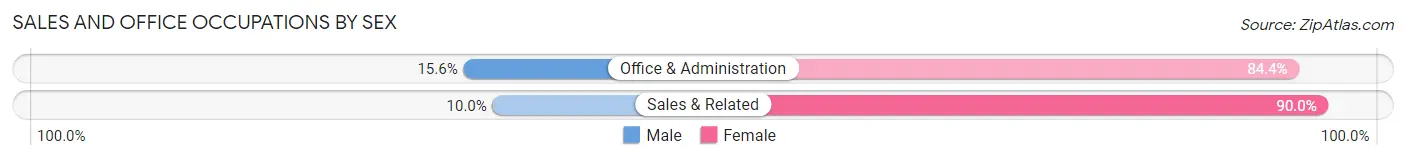
| Occupation | Male | Female |
| Sales & Related | 9 (10.0%) | 81 (90.0%) |
| Office & Administration | 17 (15.6%) | 92 (84.4%) |
| Total (Category) | 26 (13.1%) | 173 (86.9%) |
| Total (Overall) | 709 (52.2%) | 649 (47.8%) |
Natural Resources, Construction and Maintenance Occupations
The most common Natural Resources, Construction and Maintenance occupations in Union County are Farming, Fishing & Forestry (103 | 7.6%), Construction & Extraction (18 | 1.3%), and Installation, Maintenance & Repair (14 | 1.0%).
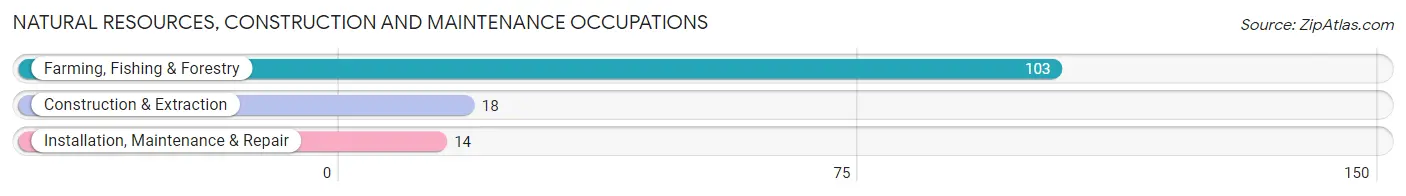
Natural Resources, Construction and Maintenance Occupations by Sex
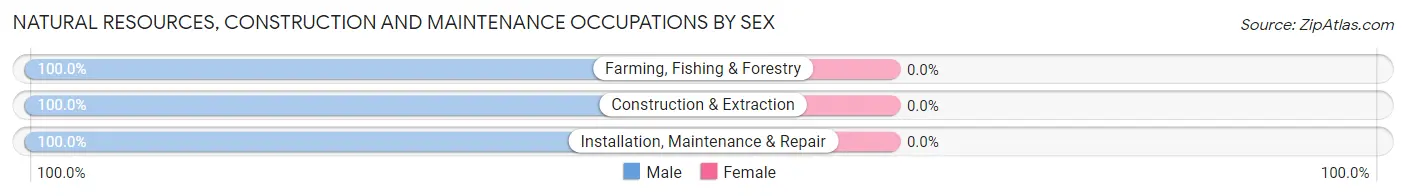
| Occupation | Male | Female |
| Farming, Fishing & Forestry | 103 (100.0%) | 0 (0.0%) |
| Construction & Extraction | 18 (100.0%) | 0 (0.0%) |
| Installation, Maintenance & Repair | 14 (100.0%) | 0 (0.0%) |
| Total (Category) | 135 (100.0%) | 0 (0.0%) |
| Total (Overall) | 709 (52.2%) | 649 (47.8%) |
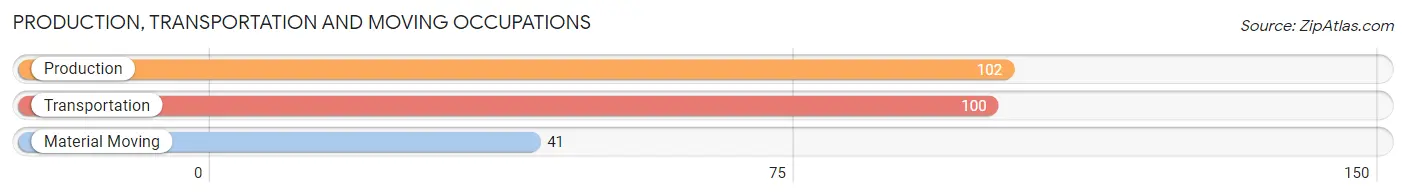
Production, Transportation and Moving Occupations
The most common Production, Transportation and Moving occupations in Union County are Production (102 | 7.5%), Transportation (100 | 7.4%), and Material Moving (41 | 3.0%).
Production, Transportation and Moving Occupations by Sex
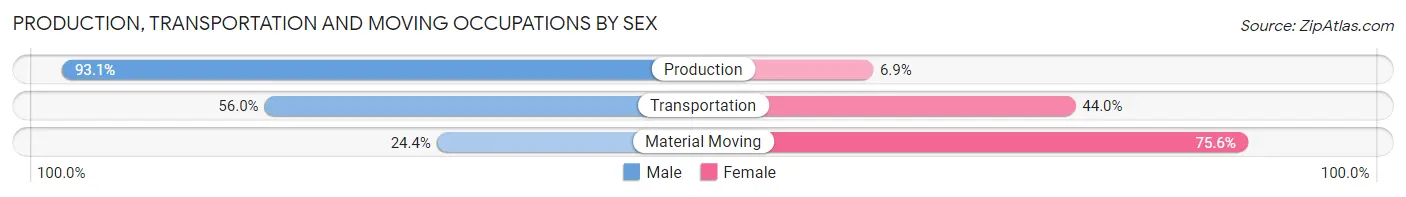
| Occupation | Male | Female |
| Production | 95 (93.1%) | 7 (6.9%) |
| Transportation | 56 (56.0%) | 44 (44.0%) |
| Material Moving | 10 (24.4%) | 31 (75.6%) |
| Total (Category) | 161 (66.3%) | 82 (33.7%) |
| Total (Overall) | 709 (52.2%) | 649 (47.8%) |
Employment Industries by Sex in Union County
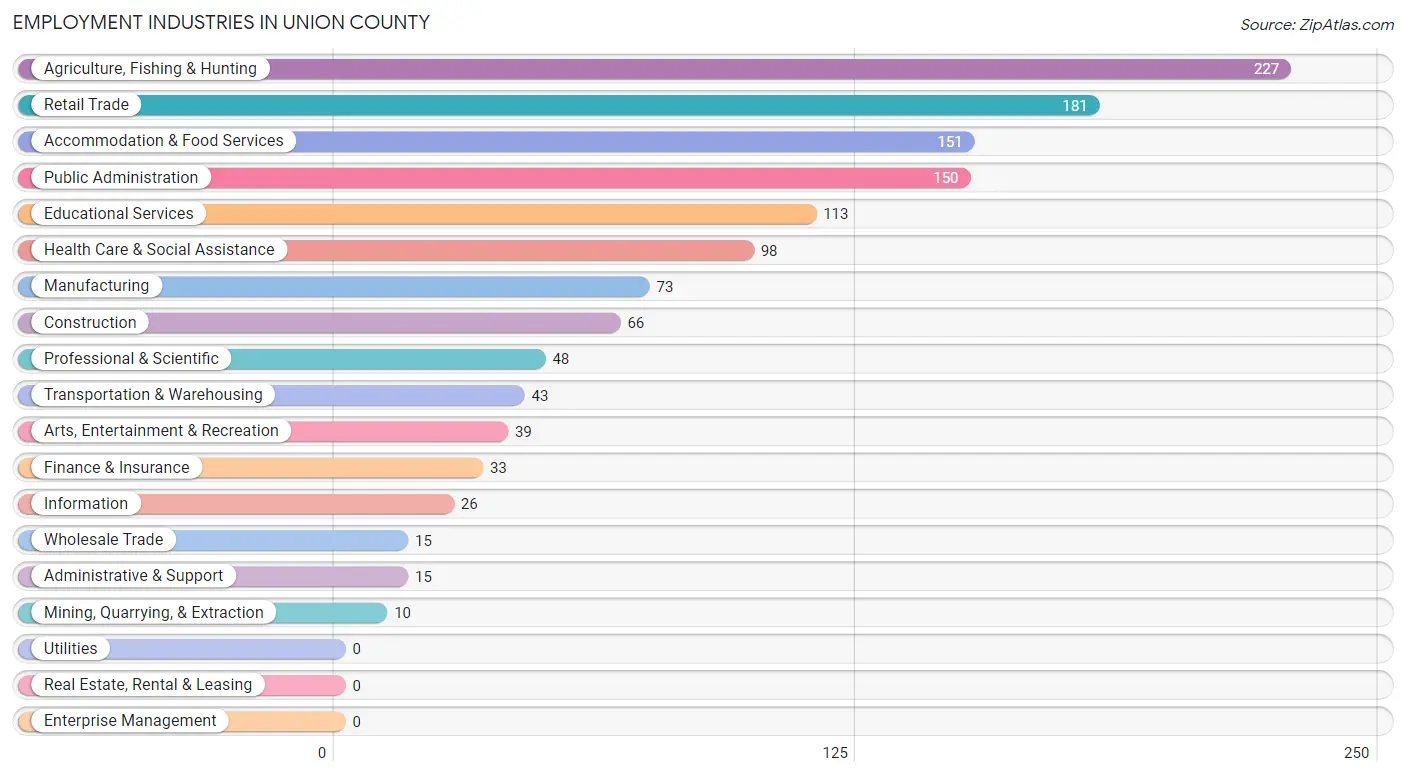
Employment Industries in Union County
The major employment industries in Union County include Agriculture, Fishing & Hunting (227 | 16.7%), Retail Trade (181 | 13.3%), Accommodation & Food Services (151 | 11.1%), Public Administration (150 | 11.1%), and Educational Services (113 | 8.3%).
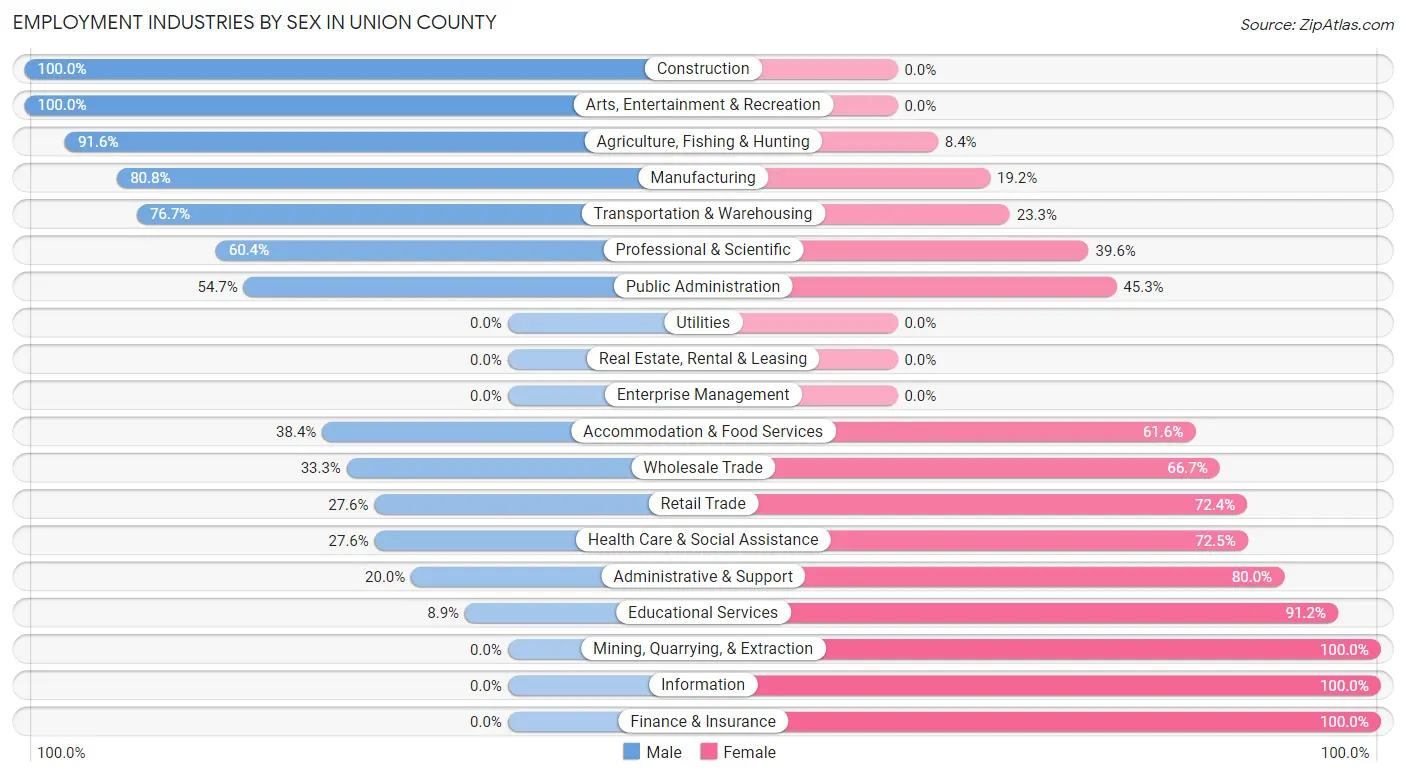
Employment Industries by Sex in Union County
The Union County industries that see more men than women are Construction (100.0%), Arts, Entertainment & Recreation (100.0%), and Agriculture, Fishing & Hunting (91.6%), whereas the industries that tend to have a higher number of women are Mining, Quarrying, & Extraction (100.0%), Information (100.0%), and Finance & Insurance (100.0%).
| Industry | Male | Female |
| Agriculture, Fishing & Hunting | 208 (91.6%) | 19 (8.4%) |
| Mining, Quarrying, & Extraction | 0 (0.0%) | 10 (100.0%) |
| Construction | 66 (100.0%) | 0 (0.0%) |
| Manufacturing | 59 (80.8%) | 14 (19.2%) |
| Wholesale Trade | 5 (33.3%) | 10 (66.7%) |
| Retail Trade | 50 (27.6%) | 131 (72.4%) |
| Transportation & Warehousing | 33 (76.7%) | 10 (23.3%) |
| Utilities | 0 (0.0%) | 0 (0.0%) |
| Information | 0 (0.0%) | 26 (100.0%) |
| Finance & Insurance | 0 (0.0%) | 33 (100.0%) |
| Real Estate, Rental & Leasing | 0 (0.0%) | 0 (0.0%) |
| Professional & Scientific | 29 (60.4%) | 19 (39.6%) |
| Enterprise Management | 0 (0.0%) | 0 (0.0%) |
| Administrative & Support | 3 (20.0%) | 12 (80.0%) |
| Educational Services | 10 (8.8%) | 103 (91.1%) |
| Health Care & Social Assistance | 27 (27.6%) | 71 (72.5%) |
| Arts, Entertainment & Recreation | 39 (100.0%) | 0 (0.0%) |
| Accommodation & Food Services | 58 (38.4%) | 93 (61.6%) |
| Public Administration | 82 (54.7%) | 68 (45.3%) |
| Total | 709 (52.2%) | 649 (47.8%) |
Education in Union County
School Enrollment in Union County
The most common levels of schooling among the 784 students in Union County are elementary school (298 | 38.0%), college / undergraduate (123 | 15.7%), and high school (109 | 13.9%).
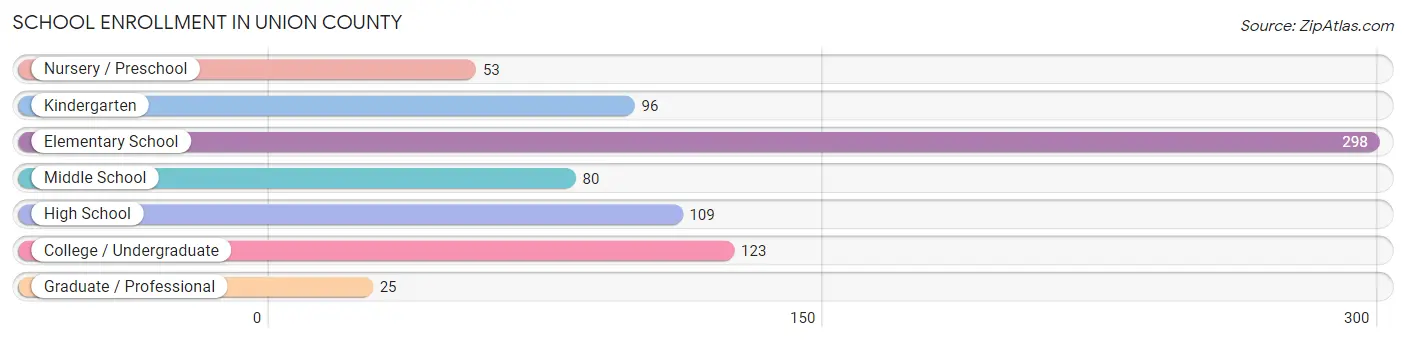
| School Level | # Students | % Students |
| Nursery / Preschool | 53 | 6.8% |
| Kindergarten | 96 | 12.2% |
| Elementary School | 298 | 38.0% |
| Middle School | 80 | 10.2% |
| High School | 109 | 13.9% |
| College / Undergraduate | 123 | 15.7% |
| Graduate / Professional | 25 | 3.2% |
| Total | 784 | 100.0% |
School Enrollment by Age by Funding Source in Union County
Out of a total of 784 students who are enrolled in schools in Union County, 89 (11.4%) attend a private institution, while the remaining 695 (88.6%) are enrolled in public schools. The age group of 15 to 17 year olds has the highest likelihood of being enrolled in private schools, with 18 (20.4% in the age bracket) enrolled. Conversely, the age group of 3 to 4 year olds has the lowest likelihood of being enrolled in a private school, with 15 (100.0% in the age bracket) attending a public institution.
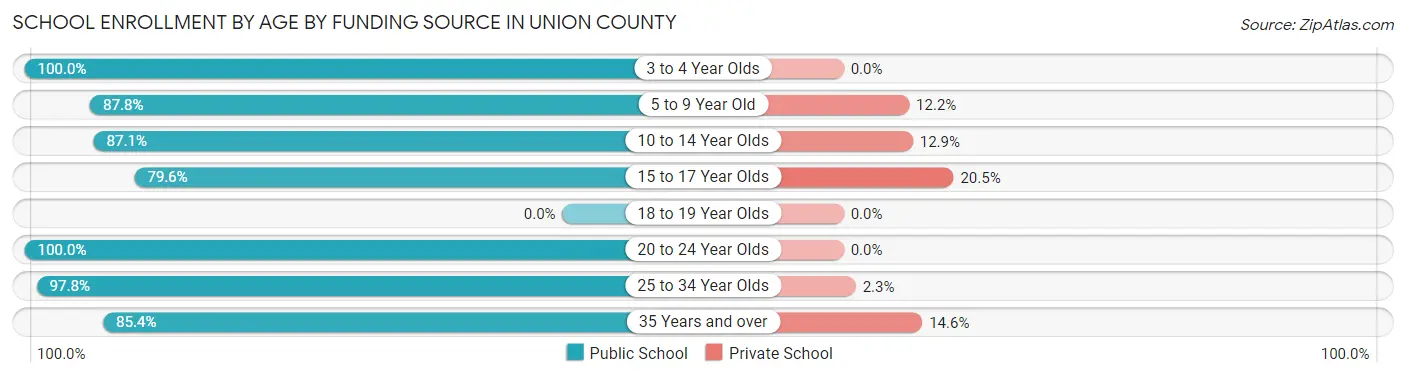
| Age Bracket | Public School | Private School |
| 3 to 4 Year Olds | 15 (100.0%) | 0 (0.0%) |
| 5 to 9 Year Old | 360 (87.8%) | 50 (12.2%) |
| 10 to 14 Year Olds | 88 (87.1%) | 13 (12.9%) |
| 15 to 17 Year Olds | 70 (79.5%) | 18 (20.4%) |
| 18 to 19 Year Olds | 0 (0.0%) | 0 (0.0%) |
| 20 to 24 Year Olds | 40 (100.0%) | 0 (0.0%) |
| 25 to 34 Year Olds | 87 (97.8%) | 2 (2.2%) |
| 35 Years and over | 35 (85.4%) | 6 (14.6%) |
| Total | 695 (88.6%) | 89 (11.4%) |
Educational Attainment by Field of Study in Union County
Bio, nature & agricultural (148 | 30.6%), education (117 | 24.2%), social sciences (56 | 11.6%), business (39 | 8.1%), and liberal arts & history (27 | 5.6%) are the most common fields of study among 484 individuals in Union County who have obtained a bachelor's degree or higher.
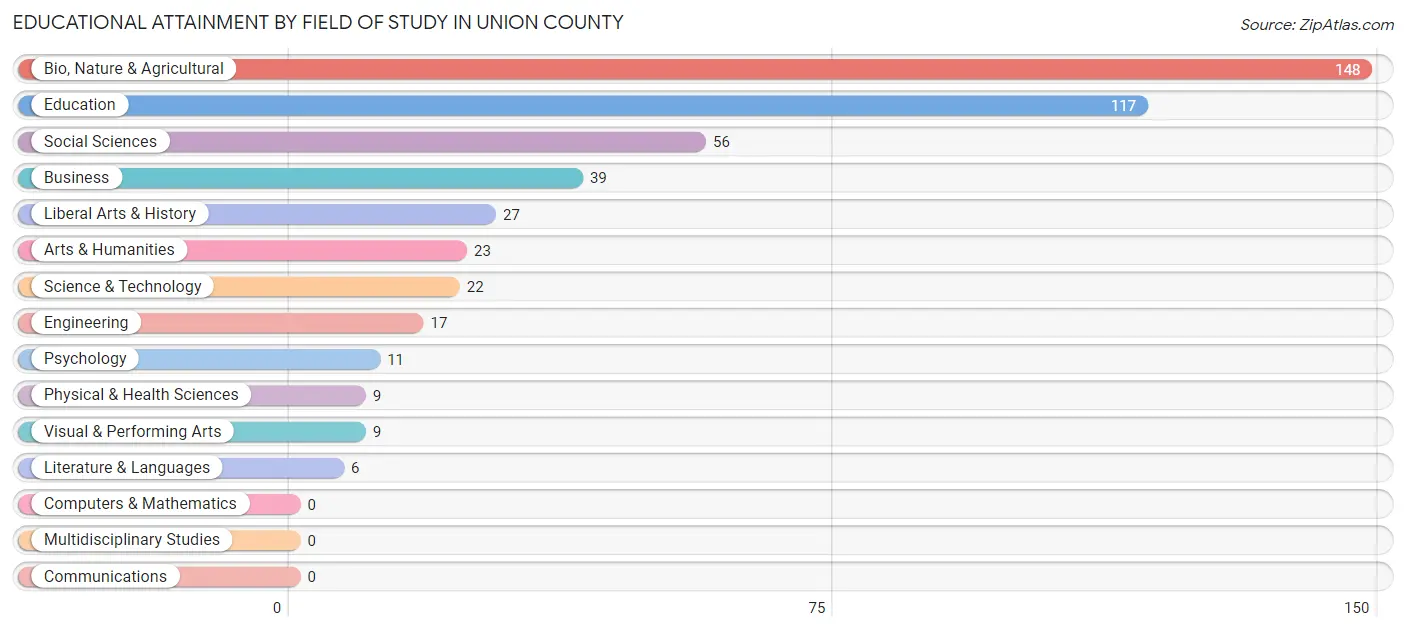
| Field of Study | # Graduates | % Graduates |
| Computers & Mathematics | 0 | 0.0% |
| Bio, Nature & Agricultural | 148 | 30.6% |
| Physical & Health Sciences | 9 | 1.9% |
| Psychology | 11 | 2.3% |
| Social Sciences | 56 | 11.6% |
| Engineering | 17 | 3.5% |
| Multidisciplinary Studies | 0 | 0.0% |
| Science & Technology | 22 | 4.5% |
| Business | 39 | 8.1% |
| Education | 117 | 24.2% |
| Literature & Languages | 6 | 1.2% |
| Liberal Arts & History | 27 | 5.6% |
| Visual & Performing Arts | 9 | 1.9% |
| Communications | 0 | 0.0% |
| Arts & Humanities | 23 | 4.8% |
| Total | 484 | 100.0% |
Transportation & Commute in Union County
Vehicle Availability by Sex in Union County
The most prevalent vehicle ownership categories in Union County are males with 2 vehicles (213, accounting for 30.0%) and females with 2 vehicles (213, making up 35.1%).
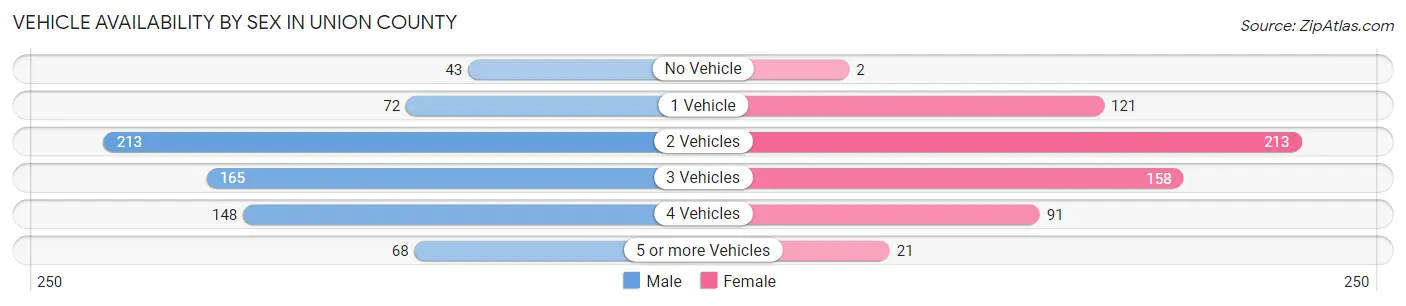
| Vehicles Available | Male | Female |
| No Vehicle | 43 (6.1%) | 2 (0.3%) |
| 1 Vehicle | 72 (10.2%) | 121 (20.0%) |
| 2 Vehicles | 213 (30.0%) | 213 (35.1%) |
| 3 Vehicles | 165 (23.3%) | 158 (26.1%) |
| 4 Vehicles | 148 (20.9%) | 91 (15.0%) |
| 5 or more Vehicles | 68 (9.6%) | 21 (3.5%) |
| Total | 709 (100.0%) | 606 (100.0%) |
Commute Time in Union County
The most frequently occuring commute durations in Union County are 5 to 9 minutes (405 commuters, 33.1%), 10 to 14 minutes (210 commuters, 17.2%), and less than 5 minutes (190 commuters, 15.5%).
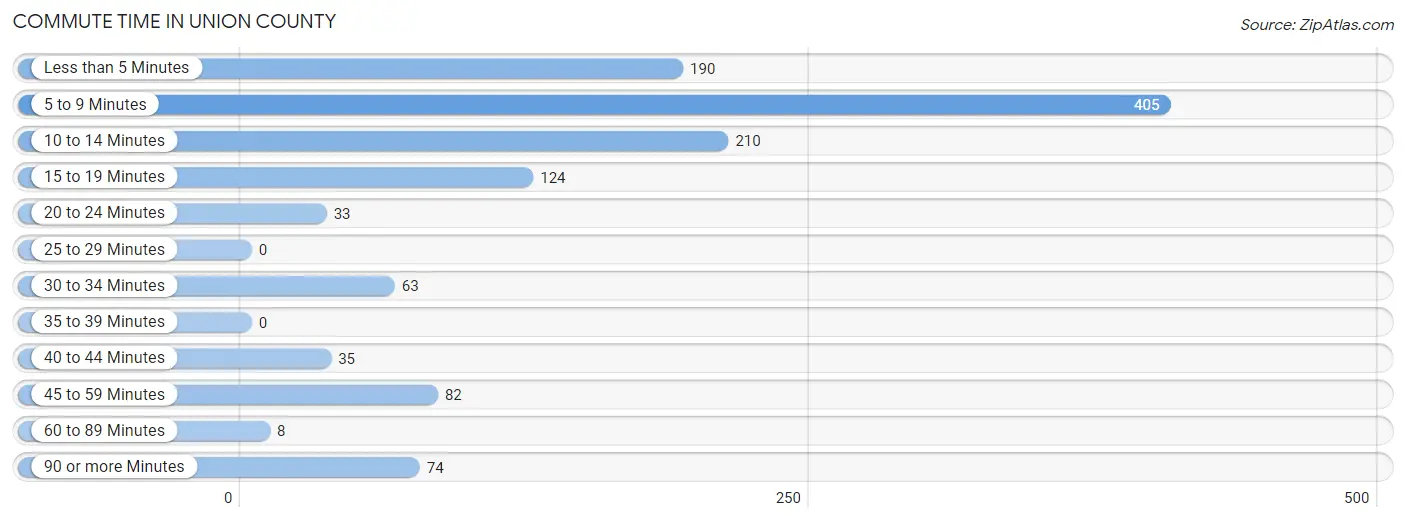
| Commute Time | # Commuters | % Commuters |
| Less than 5 Minutes | 190 | 15.5% |
| 5 to 9 Minutes | 405 | 33.1% |
| 10 to 14 Minutes | 210 | 17.2% |
| 15 to 19 Minutes | 124 | 10.1% |
| 20 to 24 Minutes | 33 | 2.7% |
| 25 to 29 Minutes | 0 | 0.0% |
| 30 to 34 Minutes | 63 | 5.1% |
| 35 to 39 Minutes | 0 | 0.0% |
| 40 to 44 Minutes | 35 | 2.9% |
| 45 to 59 Minutes | 82 | 6.7% |
| 60 to 89 Minutes | 8 | 0.6% |
| 90 or more Minutes | 74 | 6.0% |
Commute Time by Sex in Union County
The most common commute times in Union County are 5 to 9 minutes (151 commuters, 23.8%) for males and 5 to 9 minutes (254 commuters, 43.0%) for females.
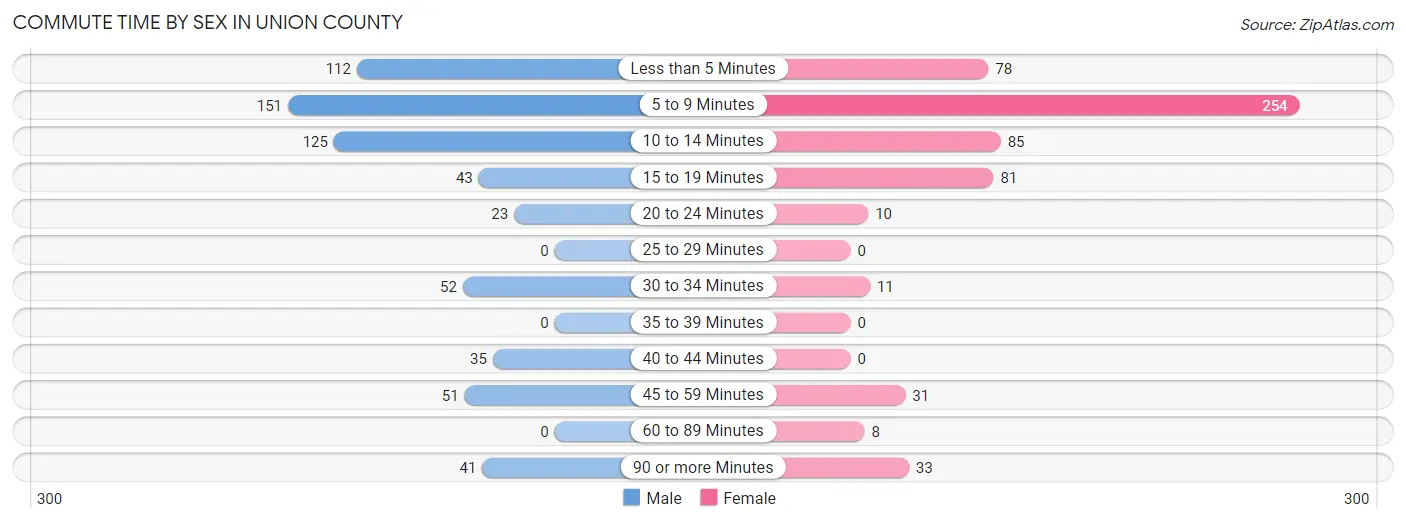
| Commute Time | Male | Female |
| Less than 5 Minutes | 112 (17.7%) | 78 (13.2%) |
| 5 to 9 Minutes | 151 (23.8%) | 254 (43.0%) |
| 10 to 14 Minutes | 125 (19.8%) | 85 (14.4%) |
| 15 to 19 Minutes | 43 (6.8%) | 81 (13.7%) |
| 20 to 24 Minutes | 23 (3.6%) | 10 (1.7%) |
| 25 to 29 Minutes | 0 (0.0%) | 0 (0.0%) |
| 30 to 34 Minutes | 52 (8.2%) | 11 (1.9%) |
| 35 to 39 Minutes | 0 (0.0%) | 0 (0.0%) |
| 40 to 44 Minutes | 35 (5.5%) | 0 (0.0%) |
| 45 to 59 Minutes | 51 (8.1%) | 31 (5.2%) |
| 60 to 89 Minutes | 0 (0.0%) | 8 (1.3%) |
| 90 or more Minutes | 41 (6.5%) | 33 (5.6%) |
Time of Departure to Work by Sex in Union County
The most frequent times of departure to work in Union County are 8:00 AM to 8:29 AM (117, 18.5%) for males and 7:30 AM to 7:59 AM (106, 17.9%) for females.
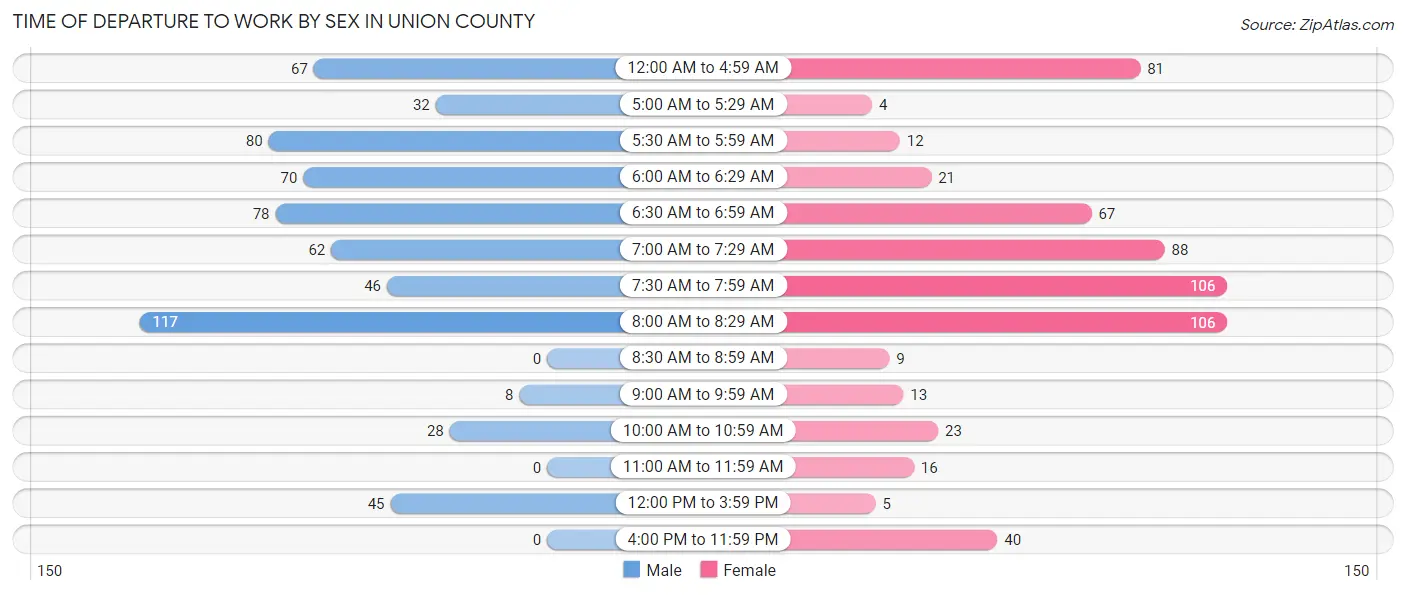
| Time of Departure | Male | Female |
| 12:00 AM to 4:59 AM | 67 (10.6%) | 81 (13.7%) |
| 5:00 AM to 5:29 AM | 32 (5.1%) | 4 (0.7%) |
| 5:30 AM to 5:59 AM | 80 (12.6%) | 12 (2.0%) |
| 6:00 AM to 6:29 AM | 70 (11.1%) | 21 (3.5%) |
| 6:30 AM to 6:59 AM | 78 (12.3%) | 67 (11.3%) |
| 7:00 AM to 7:29 AM | 62 (9.8%) | 88 (14.9%) |
| 7:30 AM to 7:59 AM | 46 (7.3%) | 106 (17.9%) |
| 8:00 AM to 8:29 AM | 117 (18.5%) | 106 (17.9%) |
| 8:30 AM to 8:59 AM | 0 (0.0%) | 9 (1.5%) |
| 9:00 AM to 9:59 AM | 8 (1.3%) | 13 (2.2%) |
| 10:00 AM to 10:59 AM | 28 (4.4%) | 23 (3.9%) |
| 11:00 AM to 11:59 AM | 0 (0.0%) | 16 (2.7%) |
| 12:00 PM to 3:59 PM | 45 (7.1%) | 5 (0.9%) |
| 4:00 PM to 11:59 PM | 0 (0.0%) | 40 (6.8%) |
| Total | 633 (100.0%) | 591 (100.0%) |
Housing Occupancy in Union County
Occupancy by Ownership in Union County
Of the total 1,463 dwellings in Union County, owner-occupied units account for 952 (65.1%), while renter-occupied units make up 511 (34.9%).
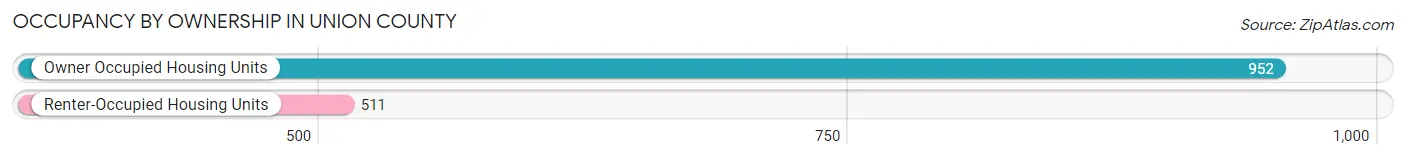
| Occupancy | # Housing Units | % Housing Units |
| Owner Occupied Housing Units | 952 | 65.1% |
| Renter-Occupied Housing Units | 511 | 34.9% |
| Total Occupied Housing Units | 1,463 | 100.0% |
Occupancy by Household Size in Union County
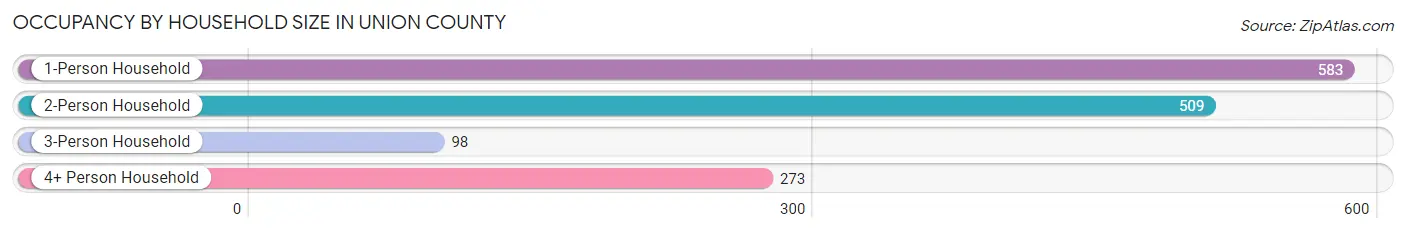
| Household Size | # Housing Units | % Housing Units |
| 1-Person Household | 583 | 39.9% |
| 2-Person Household | 509 | 34.8% |
| 3-Person Household | 98 | 6.7% |
| 4+ Person Household | 273 | 18.7% |
| Total Housing Units | 1,463 | 100.0% |
Occupancy by Ownership by Household Size in Union County
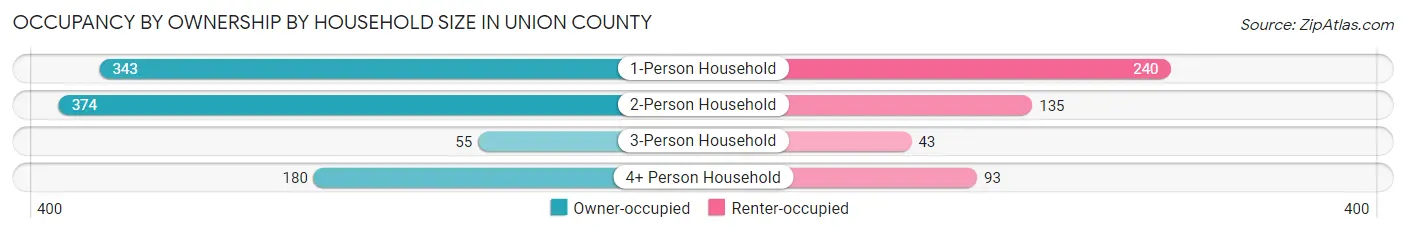
| Household Size | Owner-occupied | Renter-occupied |
| 1-Person Household | 343 (58.8%) | 240 (41.2%) |
| 2-Person Household | 374 (73.5%) | 135 (26.5%) |
| 3-Person Household | 55 (56.1%) | 43 (43.9%) |
| 4+ Person Household | 180 (65.9%) | 93 (34.1%) |
| Total Housing Units | 952 (65.1%) | 511 (34.9%) |
Occupancy by Educational Attainment in Union County
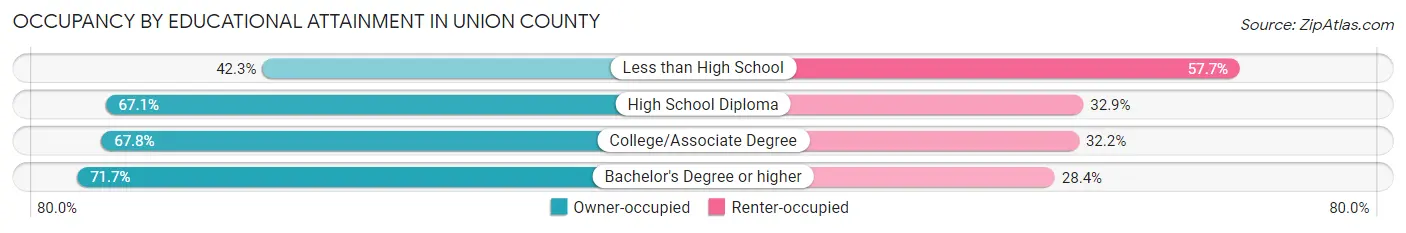
| Household Size | Owner-occupied | Renter-occupied |
| Less than High School | 77 (42.3%) | 105 (57.7%) |
| High School Diploma | 378 (67.1%) | 185 (32.9%) |
| College/Associate Degree | 310 (67.8%) | 147 (32.2%) |
| Bachelor's Degree or higher | 187 (71.7%) | 74 (28.3%) |
Occupancy by Age of Householder in Union County
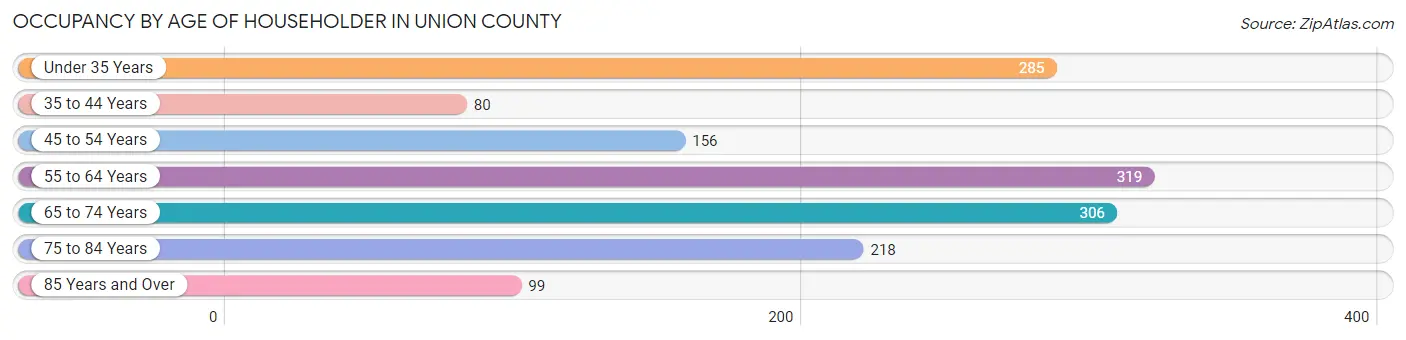
| Age Bracket | # Households | % Households |
| Under 35 Years | 285 | 19.5% |
| 35 to 44 Years | 80 | 5.5% |
| 45 to 54 Years | 156 | 10.7% |
| 55 to 64 Years | 319 | 21.8% |
| 65 to 74 Years | 306 | 20.9% |
| 75 to 84 Years | 218 | 14.9% |
| 85 Years and Over | 99 | 6.8% |
| Total | 1,463 | 100.0% |
Housing Finances in Union County
Median Income by Occupancy in Union County
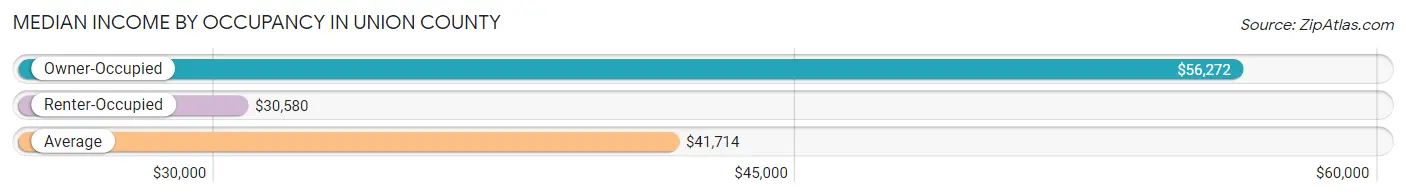
| Occupancy Type | # Households | Median Income |
| Owner-Occupied | 952 (65.1%) | $56,272 |
| Renter-Occupied | 511 (34.9%) | $30,580 |
| Average | 1,463 (100.0%) | $41,714 |
Occupancy by Householder Income Bracket in Union County
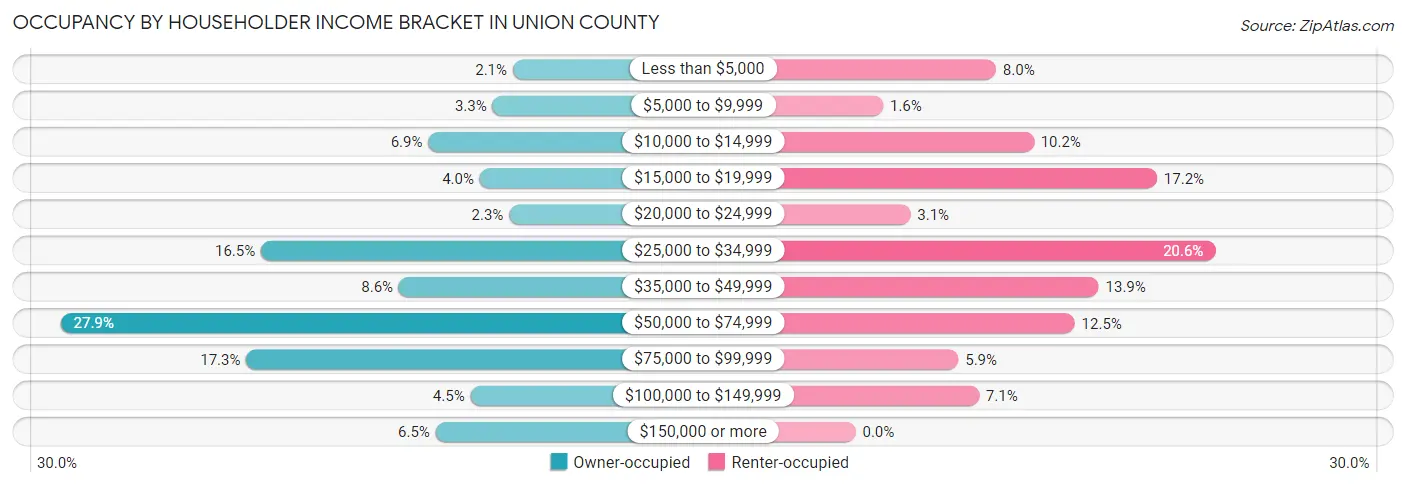
| Income Bracket | Owner-occupied | Renter-occupied |
| Less than $5,000 | 20 (2.1%) | 41 (8.0%) |
| $5,000 to $9,999 | 31 (3.3%) | 8 (1.6%) |
| $10,000 to $14,999 | 66 (6.9%) | 52 (10.2%) |
| $15,000 to $19,999 | 38 (4.0%) | 88 (17.2%) |
| $20,000 to $24,999 | 22 (2.3%) | 16 (3.1%) |
| $25,000 to $34,999 | 157 (16.5%) | 105 (20.5%) |
| $35,000 to $49,999 | 82 (8.6%) | 71 (13.9%) |
| $50,000 to $74,999 | 266 (27.9%) | 64 (12.5%) |
| $75,000 to $99,999 | 165 (17.3%) | 30 (5.9%) |
| $100,000 to $149,999 | 43 (4.5%) | 36 (7.0%) |
| $150,000 or more | 62 (6.5%) | 0 (0.0%) |
| Total | 952 (100.0%) | 511 (100.0%) |
Monthly Housing Cost Tiers in Union County
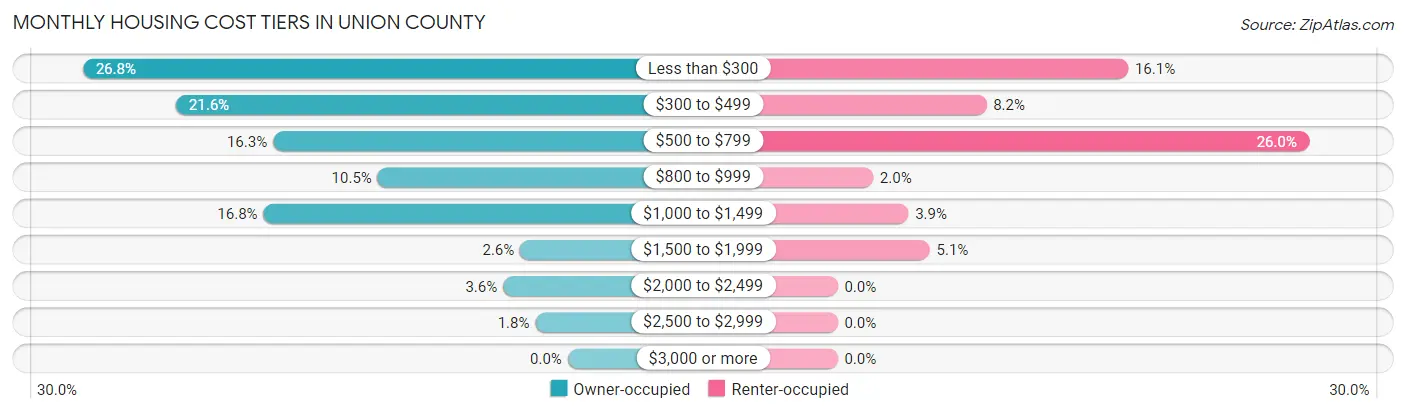
| Monthly Cost | Owner-occupied | Renter-occupied |
| Less than $300 | 255 (26.8%) | 82 (16.1%) |
| $300 to $499 | 206 (21.6%) | 42 (8.2%) |
| $500 to $799 | 155 (16.3%) | 133 (26.0%) |
| $800 to $999 | 100 (10.5%) | 10 (2.0%) |
| $1,000 to $1,499 | 160 (16.8%) | 20 (3.9%) |
| $1,500 to $1,999 | 25 (2.6%) | 26 (5.1%) |
| $2,000 to $2,499 | 34 (3.6%) | 0 (0.0%) |
| $2,500 to $2,999 | 17 (1.8%) | 0 (0.0%) |
| $3,000 or more | 0 (0.0%) | 0 (0.0%) |
| Total | 952 (100.0%) | 511 (100.0%) |
Physical Housing Characteristics in Union County
Housing Structures in Union County
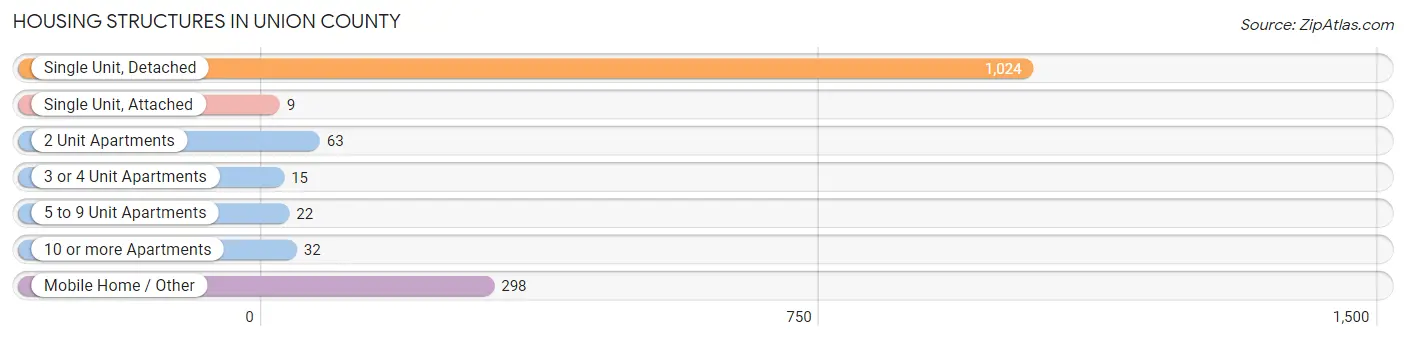
| Structure Type | # Housing Units | % Housing Units |
| Single Unit, Detached | 1,024 | 70.0% |
| Single Unit, Attached | 9 | 0.6% |
| 2 Unit Apartments | 63 | 4.3% |
| 3 or 4 Unit Apartments | 15 | 1.0% |
| 5 to 9 Unit Apartments | 22 | 1.5% |
| 10 or more Apartments | 32 | 2.2% |
| Mobile Home / Other | 298 | 20.4% |
| Total | 1,463 | 100.0% |
Housing Structures by Occupancy in Union County
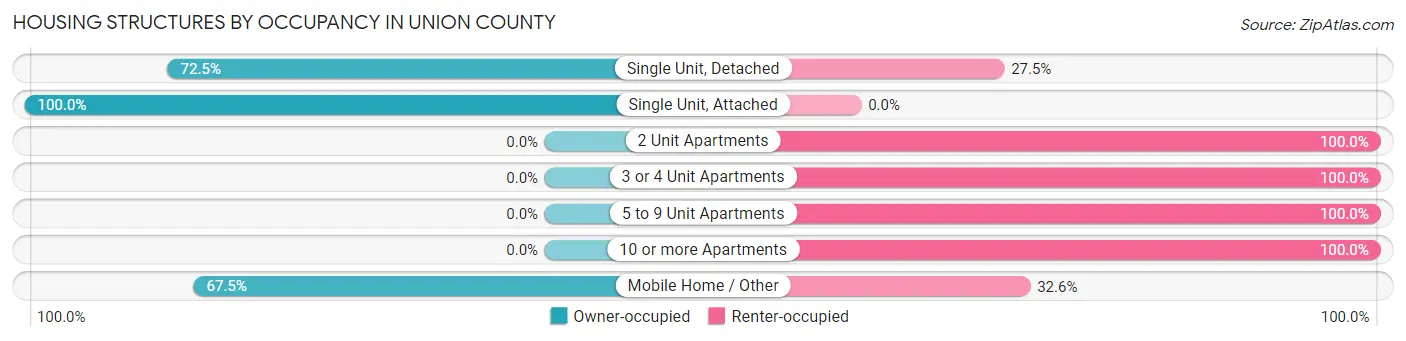
| Structure Type | Owner-occupied | Renter-occupied |
| Single Unit, Detached | 742 (72.5%) | 282 (27.5%) |
| Single Unit, Attached | 9 (100.0%) | 0 (0.0%) |
| 2 Unit Apartments | 0 (0.0%) | 63 (100.0%) |
| 3 or 4 Unit Apartments | 0 (0.0%) | 15 (100.0%) |
| 5 to 9 Unit Apartments | 0 (0.0%) | 22 (100.0%) |
| 10 or more Apartments | 0 (0.0%) | 32 (100.0%) |
| Mobile Home / Other | 201 (67.4%) | 97 (32.6%) |
| Total | 952 (65.1%) | 511 (34.9%) |
Housing Structures by Number of Rooms in Union County
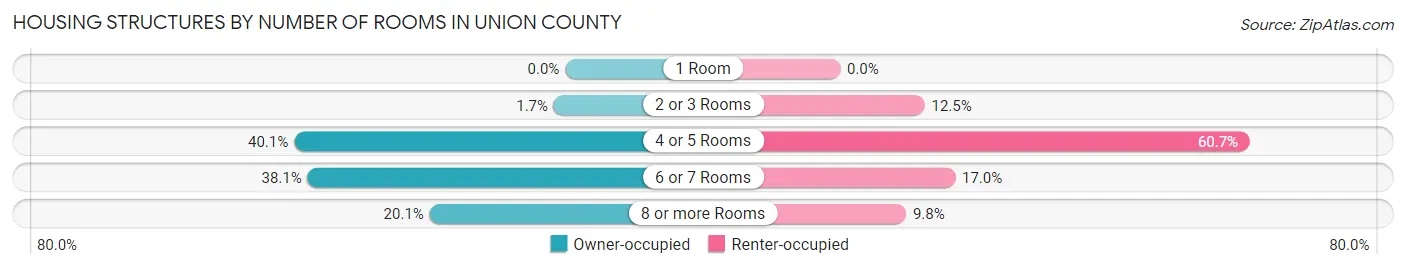
| Number of Rooms | Owner-occupied | Renter-occupied |
| 1 Room | 0 (0.0%) | 0 (0.0%) |
| 2 or 3 Rooms | 16 (1.7%) | 64 (12.5%) |
| 4 or 5 Rooms | 382 (40.1%) | 310 (60.7%) |
| 6 or 7 Rooms | 363 (38.1%) | 87 (17.0%) |
| 8 or more Rooms | 191 (20.1%) | 50 (9.8%) |
| Total | 952 (100.0%) | 511 (100.0%) |
Housing Structure by Heating Type in Union County
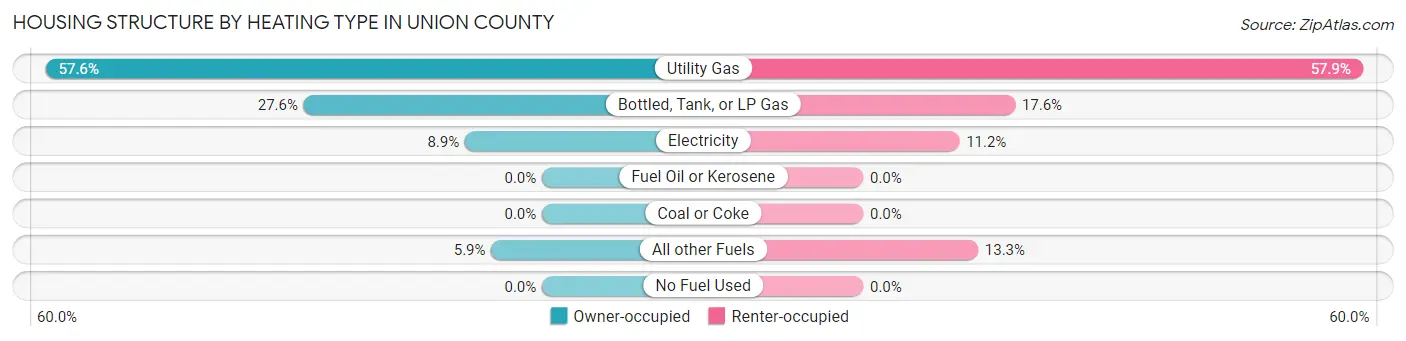
| Heating Type | Owner-occupied | Renter-occupied |
| Utility Gas | 548 (57.6%) | 296 (57.9%) |
| Bottled, Tank, or LP Gas | 263 (27.6%) | 90 (17.6%) |
| Electricity | 85 (8.9%) | 57 (11.2%) |
| Fuel Oil or Kerosene | 0 (0.0%) | 0 (0.0%) |
| Coal or Coke | 0 (0.0%) | 0 (0.0%) |
| All other Fuels | 56 (5.9%) | 68 (13.3%) |
| No Fuel Used | 0 (0.0%) | 0 (0.0%) |
| Total | 952 (100.0%) | 511 (100.0%) |
Household Vehicle Usage in Union County
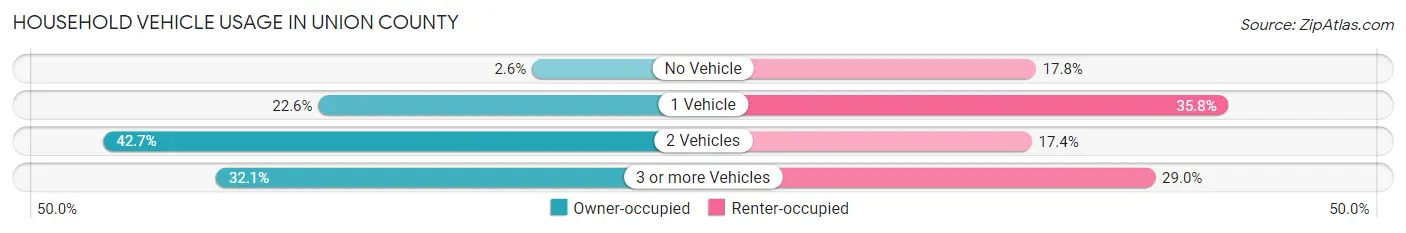
| Vehicles per Household | Owner-occupied | Renter-occupied |
| No Vehicle | 25 (2.6%) | 91 (17.8%) |
| 1 Vehicle | 215 (22.6%) | 183 (35.8%) |
| 2 Vehicles | 406 (42.6%) | 89 (17.4%) |
| 3 or more Vehicles | 306 (32.1%) | 148 (29.0%) |
| Total | 952 (100.0%) | 511 (100.0%) |
Real Estate & Mortgages in Union County
Real Estate and Mortgage Overview in Union County
| Characteristic | Without Mortgage | With Mortgage |
| Housing Units | 656 | 296 |
| Median Property Value | $98,100 | $131,500 |
| Median Household Income | $50,000 | $11 |
| Monthly Housing Costs | $345 | $0 |
| Real Estate Taxes | $434 | $23 |
Property Value by Mortgage Status in Union County
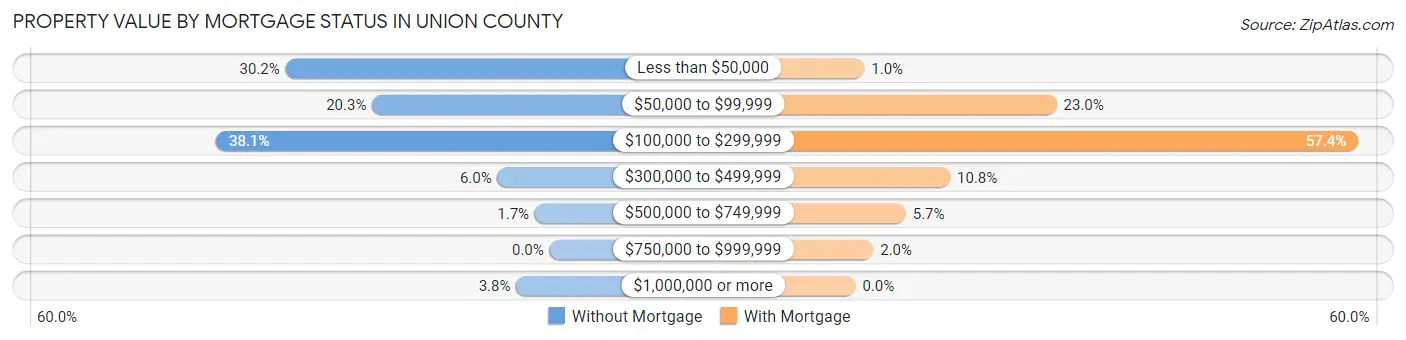
| Property Value | Without Mortgage | With Mortgage |
| Less than $50,000 | 198 (30.2%) | 3 (1.0%) |
| $50,000 to $99,999 | 133 (20.3%) | 68 (23.0%) |
| $100,000 to $299,999 | 250 (38.1%) | 170 (57.4%) |
| $300,000 to $499,999 | 39 (5.9%) | 32 (10.8%) |
| $500,000 to $749,999 | 11 (1.7%) | 17 (5.7%) |
| $750,000 to $999,999 | 0 (0.0%) | 6 (2.0%) |
| $1,000,000 or more | 25 (3.8%) | 0 (0.0%) |
| Total | 656 (100.0%) | 296 (100.0%) |
Household Income by Mortgage Status in Union County
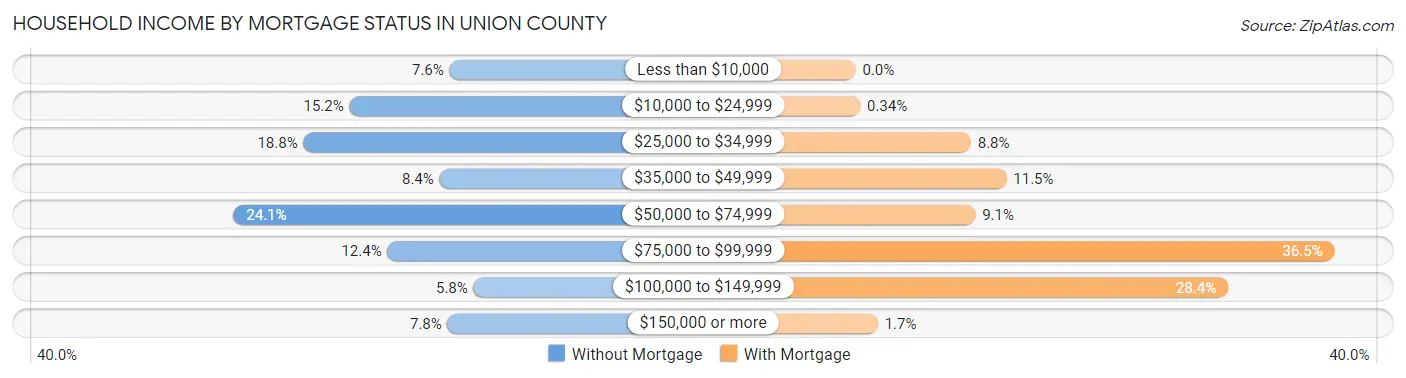
| Household Income | Without Mortgage | With Mortgage |
| Less than $10,000 | 50 (7.6%) | 0 (0.0%) |
| $10,000 to $24,999 | 100 (15.2%) | 1 (0.3%) |
| $25,000 to $34,999 | 123 (18.8%) | 26 (8.8%) |
| $35,000 to $49,999 | 55 (8.4%) | 34 (11.5%) |
| $50,000 to $74,999 | 158 (24.1%) | 27 (9.1%) |
| $75,000 to $99,999 | 81 (12.3%) | 108 (36.5%) |
| $100,000 to $149,999 | 38 (5.8%) | 84 (28.4%) |
| $150,000 or more | 51 (7.8%) | 5 (1.7%) |
| Total | 656 (100.0%) | 296 (100.0%) |
Property Value to Household Income Ratio in Union County
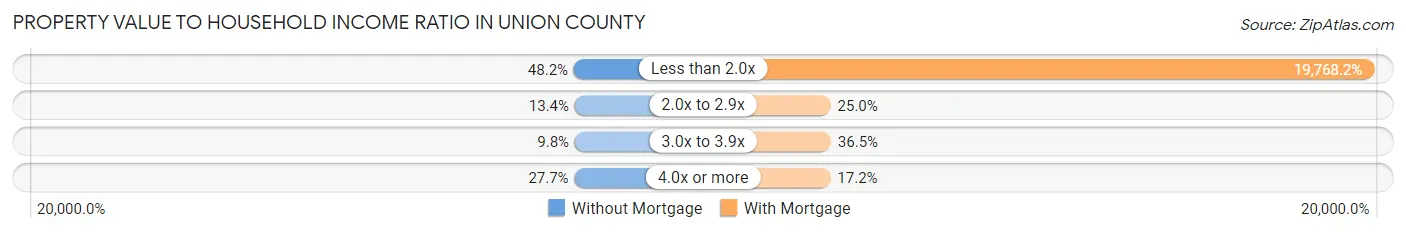
| Value-to-Income Ratio | Without Mortgage | With Mortgage |
| Less than 2.0x | 316 (48.2%) | 58,514 (19,768.2%) |
| 2.0x to 2.9x | 88 (13.4%) | 74 (25.0%) |
| 3.0x to 3.9x | 64 (9.8%) | 108 (36.5%) |
| 4.0x or more | 182 (27.7%) | 51 (17.2%) |
| Total | 656 (100.0%) | 296 (100.0%) |
Real Estate Taxes by Mortgage Status in Union County
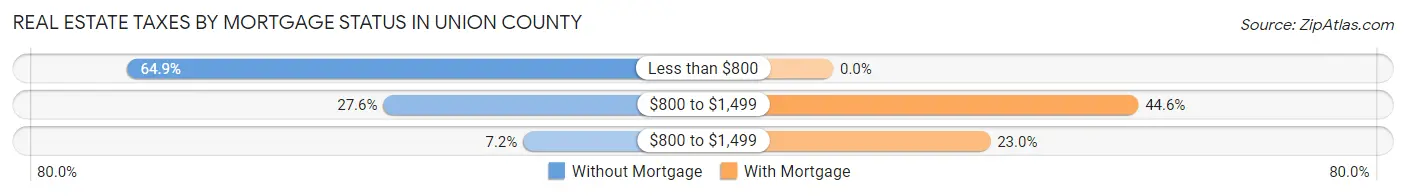
| Property Taxes | Without Mortgage | With Mortgage |
| Less than $800 | 426 (64.9%) | 0 (0.0%) |
| $800 to $1,499 | 181 (27.6%) | 132 (44.6%) |
| $800 to $1,499 | 47 (7.2%) | 68 (23.0%) |
| Total | 656 (100.0%) | 296 (100.0%) |
Health & Disability in Union County
Health Insurance Coverage by Age in Union County
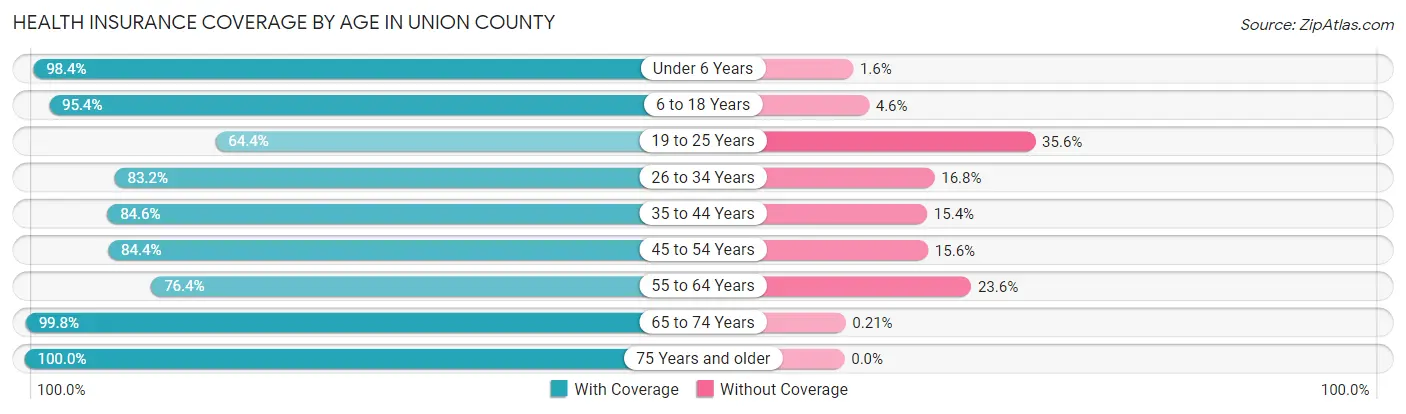
| Age Bracket | With Coverage | Without Coverage |
| Under 6 Years | 367 (98.4%) | 6 (1.6%) |
| 6 to 18 Years | 501 (95.4%) | 24 (4.6%) |
| 19 to 25 Years | 181 (64.4%) | 100 (35.6%) |
| 26 to 34 Years | 367 (83.2%) | 74 (16.8%) |
| 35 to 44 Years | 258 (84.6%) | 47 (15.4%) |
| 45 to 54 Years | 249 (84.4%) | 46 (15.6%) |
| 55 to 64 Years | 388 (76.4%) | 120 (23.6%) |
| 65 to 74 Years | 472 (99.8%) | 1 (0.2%) |
| 75 Years and older | 390 (100.0%) | 0 (0.0%) |
| Total | 3,173 (88.4%) | 418 (11.6%) |
Health Insurance Coverage by Citizenship Status in Union County
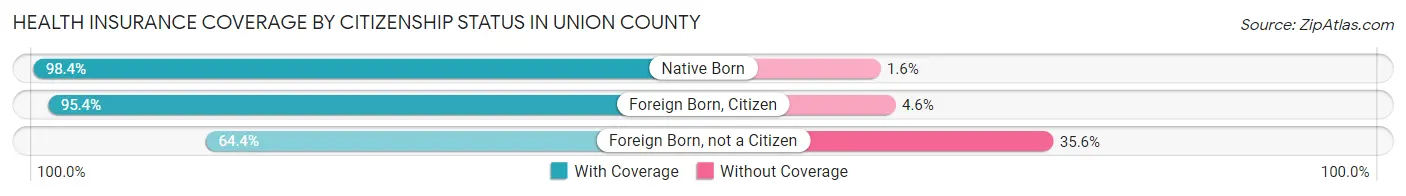
| Citizenship Status | With Coverage | Without Coverage |
| Native Born | 367 (98.4%) | 6 (1.6%) |
| Foreign Born, Citizen | 501 (95.4%) | 24 (4.6%) |
| Foreign Born, not a Citizen | 181 (64.4%) | 100 (35.6%) |
Health Insurance Coverage by Household Income in Union County
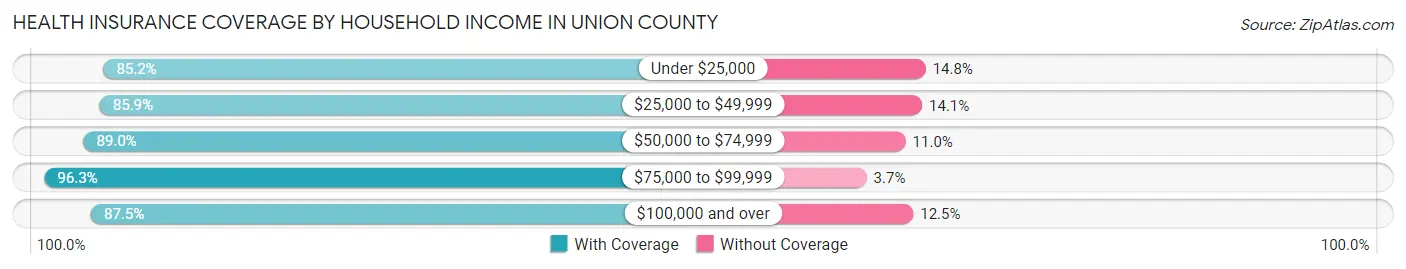
| Household Income | With Coverage | Without Coverage |
| Under $25,000 | 565 (85.2%) | 98 (14.8%) |
| $25,000 to $49,999 | 706 (85.9%) | 116 (14.1%) |
| $50,000 to $74,999 | 855 (89.0%) | 106 (11.0%) |
| $75,000 to $99,999 | 492 (96.3%) | 19 (3.7%) |
| $100,000 and over | 555 (87.5%) | 79 (12.5%) |
Public vs Private Health Insurance Coverage by Age in Union County
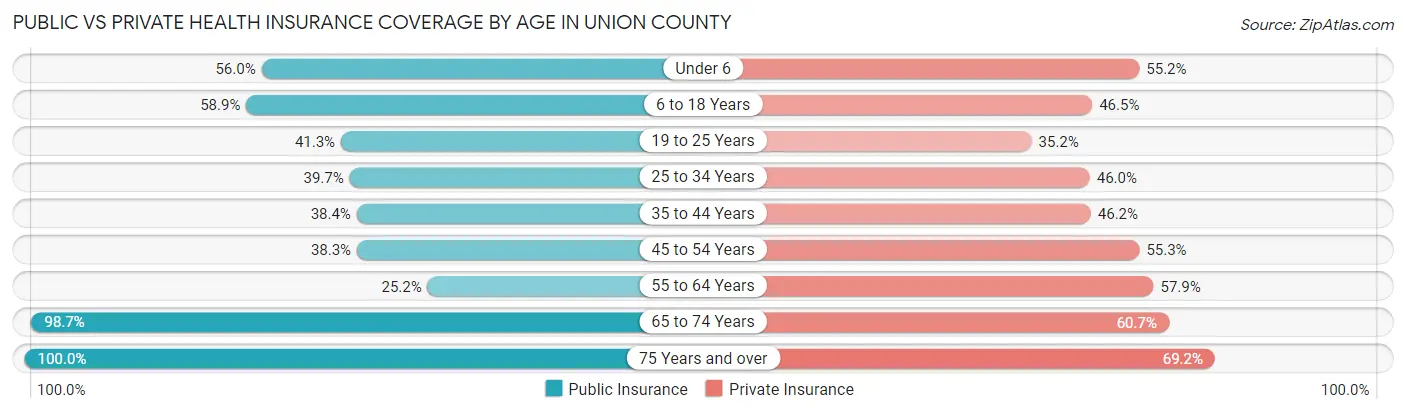
| Age Bracket | Public Insurance | Private Insurance |
| Under 6 | 209 (56.0%) | 206 (55.2%) |
| 6 to 18 Years | 309 (58.9%) | 244 (46.5%) |
| 19 to 25 Years | 116 (41.3%) | 99 (35.2%) |
| 25 to 34 Years | 175 (39.7%) | 203 (46.0%) |
| 35 to 44 Years | 117 (38.4%) | 141 (46.2%) |
| 45 to 54 Years | 113 (38.3%) | 163 (55.2%) |
| 55 to 64 Years | 128 (25.2%) | 294 (57.9%) |
| 65 to 74 Years | 467 (98.7%) | 287 (60.7%) |
| 75 Years and over | 390 (100.0%) | 270 (69.2%) |
| Total | 2,024 (56.4%) | 1,907 (53.1%) |
Disability Status by Sex by Age in Union County
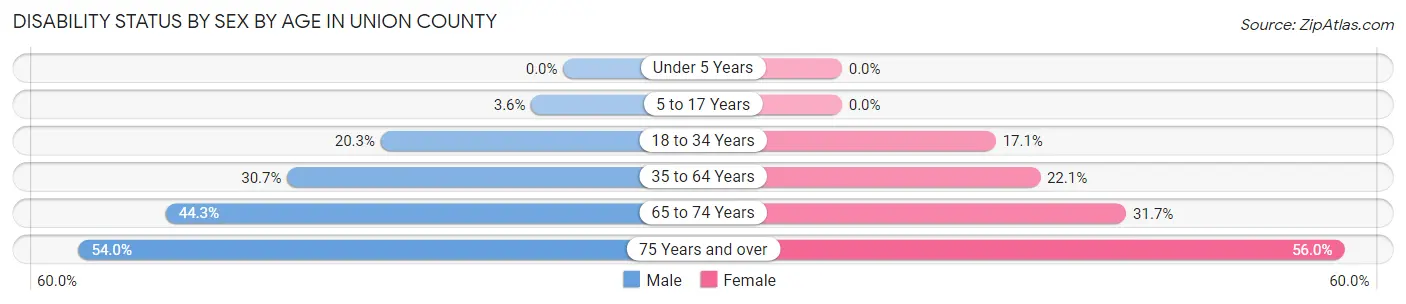
| Age Bracket | Male | Female |
| Under 5 Years | 0 (0.0%) | 0 (0.0%) |
| 5 to 17 Years | 9 (3.6%) | 0 (0.0%) |
| 18 to 34 Years | 73 (20.3%) | 67 (17.1%) |
| 35 to 64 Years | 186 (30.7%) | 111 (22.1%) |
| 65 to 74 Years | 85 (44.3%) | 89 (31.7%) |
| 75 Years and over | 88 (54.0%) | 127 (55.9%) |
Disability Class by Sex by Age in Union County
Disability Class: Hearing Difficulty
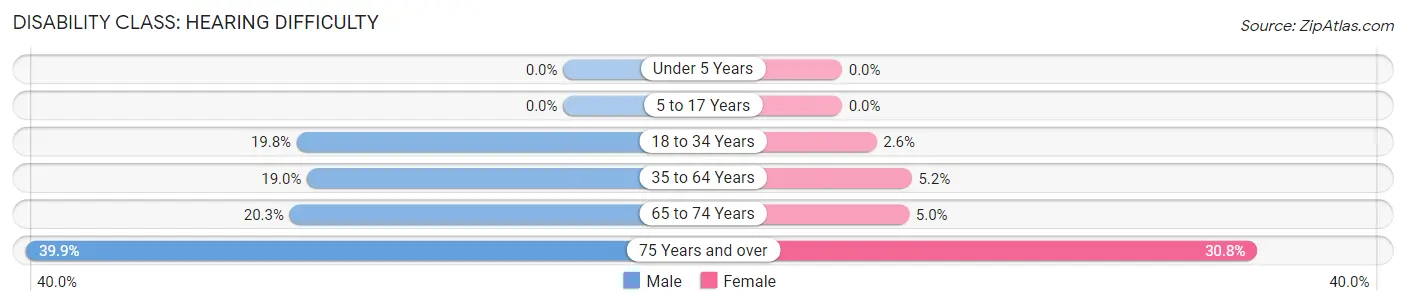
| Age Bracket | Male | Female |
| Under 5 Years | 0 (0.0%) | 0 (0.0%) |
| 5 to 17 Years | 0 (0.0%) | 0 (0.0%) |
| 18 to 34 Years | 71 (19.8%) | 10 (2.6%) |
| 35 to 64 Years | 115 (19.0%) | 26 (5.2%) |
| 65 to 74 Years | 39 (20.3%) | 14 (5.0%) |
| 75 Years and over | 65 (39.9%) | 70 (30.8%) |
Disability Class: Vision Difficulty
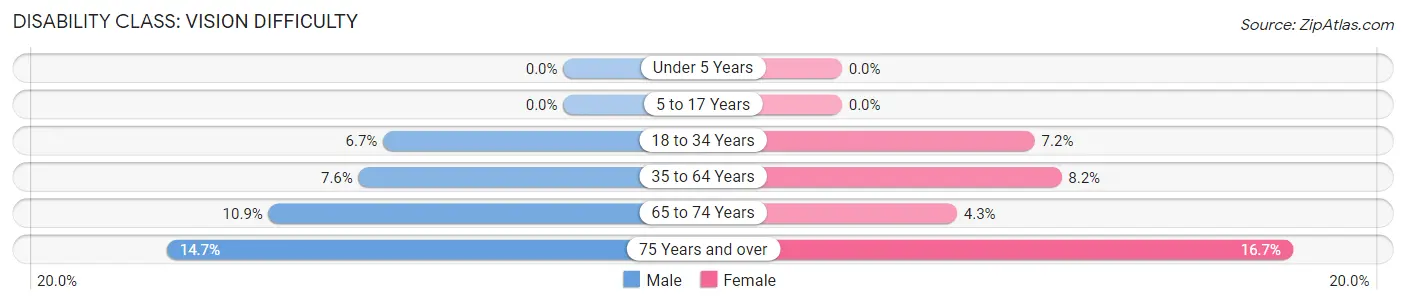
| Age Bracket | Male | Female |
| Under 5 Years | 0 (0.0%) | 0 (0.0%) |
| 5 to 17 Years | 0 (0.0%) | 0 (0.0%) |
| 18 to 34 Years | 24 (6.7%) | 28 (7.2%) |
| 35 to 64 Years | 46 (7.6%) | 41 (8.2%) |
| 65 to 74 Years | 21 (10.9%) | 12 (4.3%) |
| 75 Years and over | 24 (14.7%) | 38 (16.7%) |
Disability Class: Cognitive Difficulty
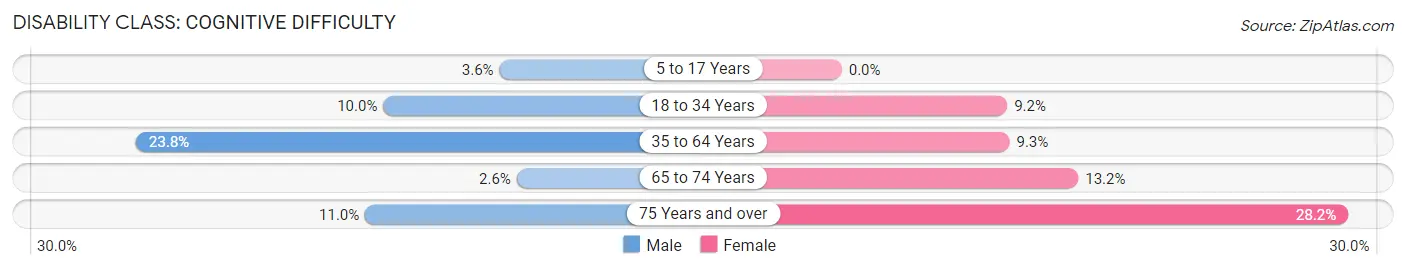
| Age Bracket | Male | Female |
| 5 to 17 Years | 9 (3.6%) | 0 (0.0%) |
| 18 to 34 Years | 36 (10.0%) | 36 (9.2%) |
| 35 to 64 Years | 144 (23.8%) | 47 (9.3%) |
| 65 to 74 Years | 5 (2.6%) | 37 (13.2%) |
| 75 Years and over | 18 (11.0%) | 64 (28.2%) |
Disability Class: Ambulatory Difficulty
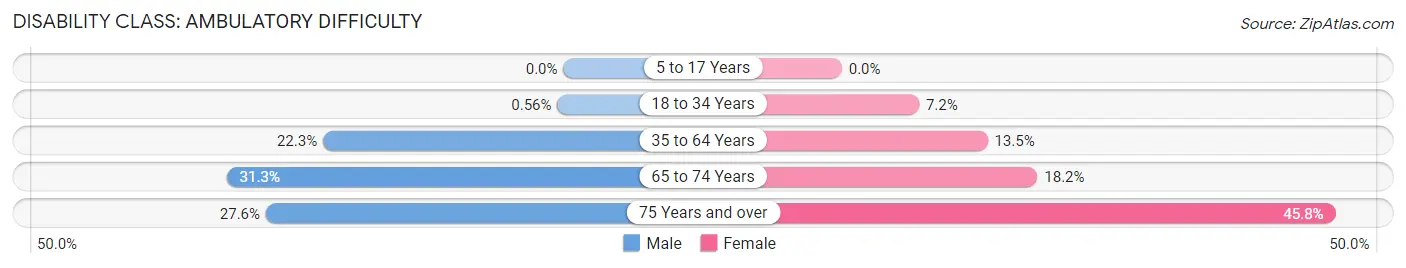
| Age Bracket | Male | Female |
| 5 to 17 Years | 0 (0.0%) | 0 (0.0%) |
| 18 to 34 Years | 2 (0.6%) | 28 (7.2%) |
| 35 to 64 Years | 135 (22.3%) | 68 (13.5%) |
| 65 to 74 Years | 60 (31.2%) | 51 (18.1%) |
| 75 Years and over | 45 (27.6%) | 104 (45.8%) |
Disability Class: Self-Care Difficulty
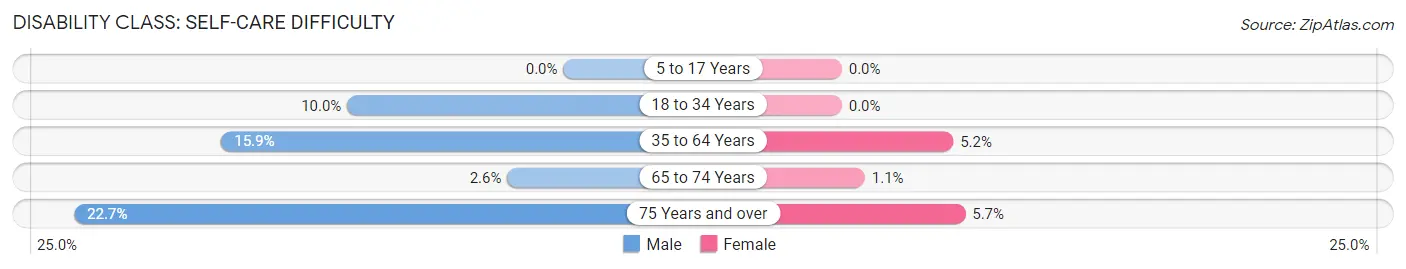
| Age Bracket | Male | Female |
| 5 to 17 Years | 0 (0.0%) | 0 (0.0%) |
| 18 to 34 Years | 36 (10.0%) | 0 (0.0%) |
| 35 to 64 Years | 96 (15.9%) | 26 (5.2%) |
| 65 to 74 Years | 5 (2.6%) | 3 (1.1%) |
| 75 Years and over | 37 (22.7%) | 13 (5.7%) |
Technology Access in Union County
Computing Device Access in Union County
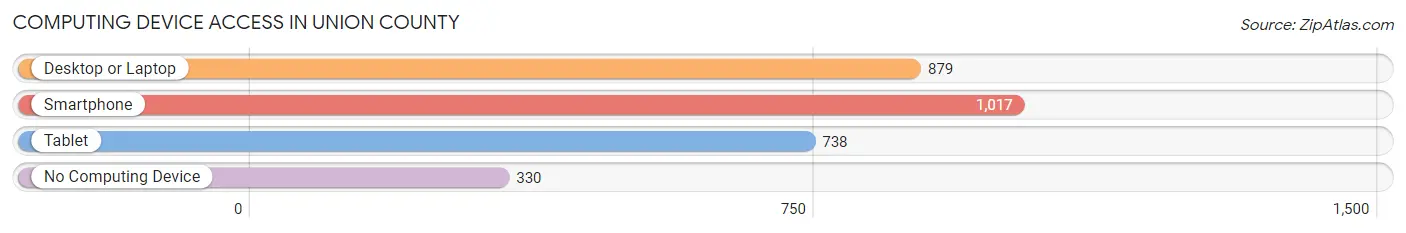
| Device Type | # Households | % Households |
| Desktop or Laptop | 879 | 60.1% |
| Smartphone | 1,017 | 69.5% |
| Tablet | 738 | 50.4% |
| No Computing Device | 330 | 22.6% |
| Total | 1,463 | 100.0% |
Internet Access in Union County
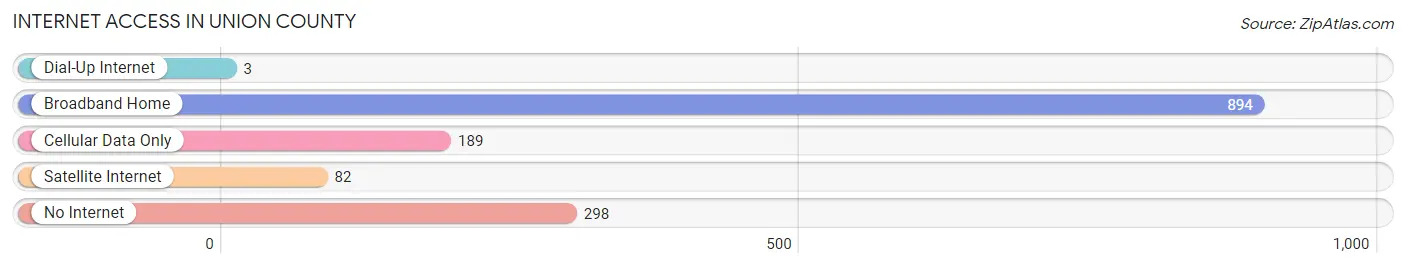
| Internet Type | # Households | % Households |
| Dial-Up Internet | 3 | 0.2% |
| Broadband Home | 894 | 61.1% |
| Cellular Data Only | 189 | 12.9% |
| Satellite Internet | 82 | 5.6% |
| No Internet | 298 | 20.4% |
| Total | 1,463 | 100.0% |
Union County Summary
Introduction
Union County is located in the northeastern corner of New Mexico, and is bordered by Colorado to the north and Oklahoma to the east. It is the sixth-largest county in the state, with an area of 2,945 square miles. The county seat is Clayton, and the population was estimated to be 4,845 in 2019.
History
Union County was established in 1893, and was named for the Union Pacific Railroad, which ran through the area. The county was originally part of Colfax County, but was split off in 1893. The first settlers in the area were ranchers, who were attracted by the abundance of grass and water.
The county was largely rural until the early 20th century, when oil and gas were discovered in the area. This led to an influx of people and businesses, and the county's population grew rapidly. The county also became a major agricultural center, with wheat, corn, and alfalfa being the main crops.
Geography
Union County is located in the northeastern corner of New Mexico, and is bordered by Colorado to the north and Oklahoma to the east. It is the sixth-largest county in the state, with an area of 2,945 square miles. The county is mostly flat, with some rolling hills in the western part. The highest point in the county is the summit of Mount Dora, which has an elevation of 8,890 feet.
The county is drained by the Canadian River, which flows through the western part of the county. The county also contains several small lakes, including Lake Clayton, Lake Conchas, and Lake Maloya.
Economy
Union County's economy is largely based on agriculture and oil and gas production. The county is a major producer of wheat, corn, and alfalfa, and is also home to several large cattle ranches. Oil and gas production is also an important part of the economy, and the county is home to several large oil and gas fields.
The county is also home to several manufacturing companies, including a plastics plant and a food processing plant. The county is also home to several retail stores, restaurants, and other businesses.
Demographics
As of the 2010 census, the population of Union County was 4,549. The racial makeup of the county was 79.3% White, 0.7% African American, 0.9% Native American, 0.2% Asian, 0.1% Pacific Islander, 16.2% from other races, and 2.7% from two or more races. Hispanic or Latino of any race were 37.2% of the population.
The median income for a household in the county was $31,944, and the median income for a family was $37,813. The per capita income for the county was $16,845. About 17.2% of families and 22.2% of the population were below the poverty line, including 28.3% of those under age 18 and 16.2% of those age 65 or over.
Conclusion
Union County is a rural county located in the northeastern corner of New Mexico. It is the sixth-largest county in the state, with an area of 2,945 square miles. The county's economy is largely based on agriculture and oil and gas production, and the population was estimated to be 4,845 in 2019. The county is home to a diverse population, with a median income of $31,944 and a poverty rate of 17.2%.
Common Questions
What is Per Capita Income in Union County?
Per Capita income in Union County is $20,779.
What is the Median Family Income in Union County?
Median Family Income in Union County is $51,944.
What is the Median Household income in Union County?
Median Household Income in Union County is $41,714.
What is Income or Wage Gap in Union County?
Income or Wage Gap in Union County is 40.0%.
Women in Union County earn 60.0 cents for every dollar earned by a man.
What is Inequality or Gini Index in Union County?
Inequality or Gini Index in Union County is 0.41.
What is the Total Population of Union County?
Total Population of Union County is 4,074.
What is the Total Male Population of Union County?
Total Male Population of Union County is 2,182.
What is the Total Female Population of Union County?
Total Female Population of Union County is 1,892.
What is the Ratio of Males per 100 Females in Union County?
There are 115.33 Males per 100 Females in Union County.
What is the Ratio of Females per 100 Males in Union County?
There are 86.71 Females per 100 Males in Union County.
What is the Median Population Age in Union County?
Median Population Age in Union County is 39.4 Years.
What is the Average Family Size in Union County
Average Family Size in Union County is 3.3 People.
What is the Average Household Size in Union County
Average Household Size in Union County is 2.5 People.
How Large is the Labor Force in Union County?
There are 1,440 People in the Labor Forcein in Union County.
What is the Percentage of People in the Labor Force in Union County?
43.9% of People are in the Labor Force in Union County.
What is the Unemployment Rate in Union County?
Unemployment Rate in Union County is 5.8%.