Curry County, NM Map & Demographics
Curry County Map
Curry County Overview
$28,045
PER CAPITA INCOME
$64,813
AVG FAMILY INCOME
$55,427
AVG HOUSEHOLD INCOME
37.3%
WAGE / INCOME GAP [ % ]
62.7¢/ $1
WAGE / INCOME GAP [ $ ]
$11,932
FAMILY INCOME DEFICIT
0.45
INEQUALITY / GINI INDEX
48,327
TOTAL POPULATION
24,945
MALE POPULATION
23,382
FEMALE POPULATION
106.68
MALES / 100 FEMALES
93.73
FEMALES / 100 MALES
31.7
MEDIAN AGE
3.2
AVG FAMILY SIZE
2.5
AVG HOUSEHOLD SIZE
23,458
LABOR FORCE [ PEOPLE ]
63.5%
PERCENT IN LABOR FORCE
7.9%
UNEMPLOYMENT RATE
Income in Curry County
Income Overview in Curry County
Per Capita Income in Curry County is $28,045, while median incomes of families and households are $64,813 and $55,427 respectively.
| Characteristic | Number | Measure |
| Per Capita Income | 48,327 | $28,045 |
| Median Family Income | 11,679 | $64,813 |
| Mean Family Income | 11,679 | $81,904 |
| Median Household Income | 18,535 | $55,427 |
| Mean Household Income | 18,535 | $70,128 |
| Income Deficit | 11,679 | $11,932 |
| Wage / Income Gap (%) | 48,327 | 37.34% |
| Wage / Income Gap ($) | 48,327 | 62.66¢ per $1 |
| Gini / Inequality Index | 48,327 | 0.45 |
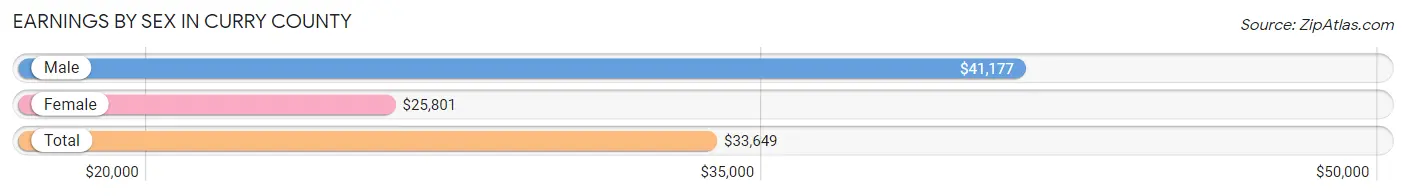
Earnings by Sex in Curry County
Average Earnings in Curry County are $33,649, $41,177 for men and $25,801 for women, a difference of 37.3%.
| Sex | Number | Average Earnings |
| Male | 14,315 (58.5%) | $41,177 |
| Female | 10,156 (41.5%) | $25,801 |
| Total | 24,471 (100.0%) | $33,649 |
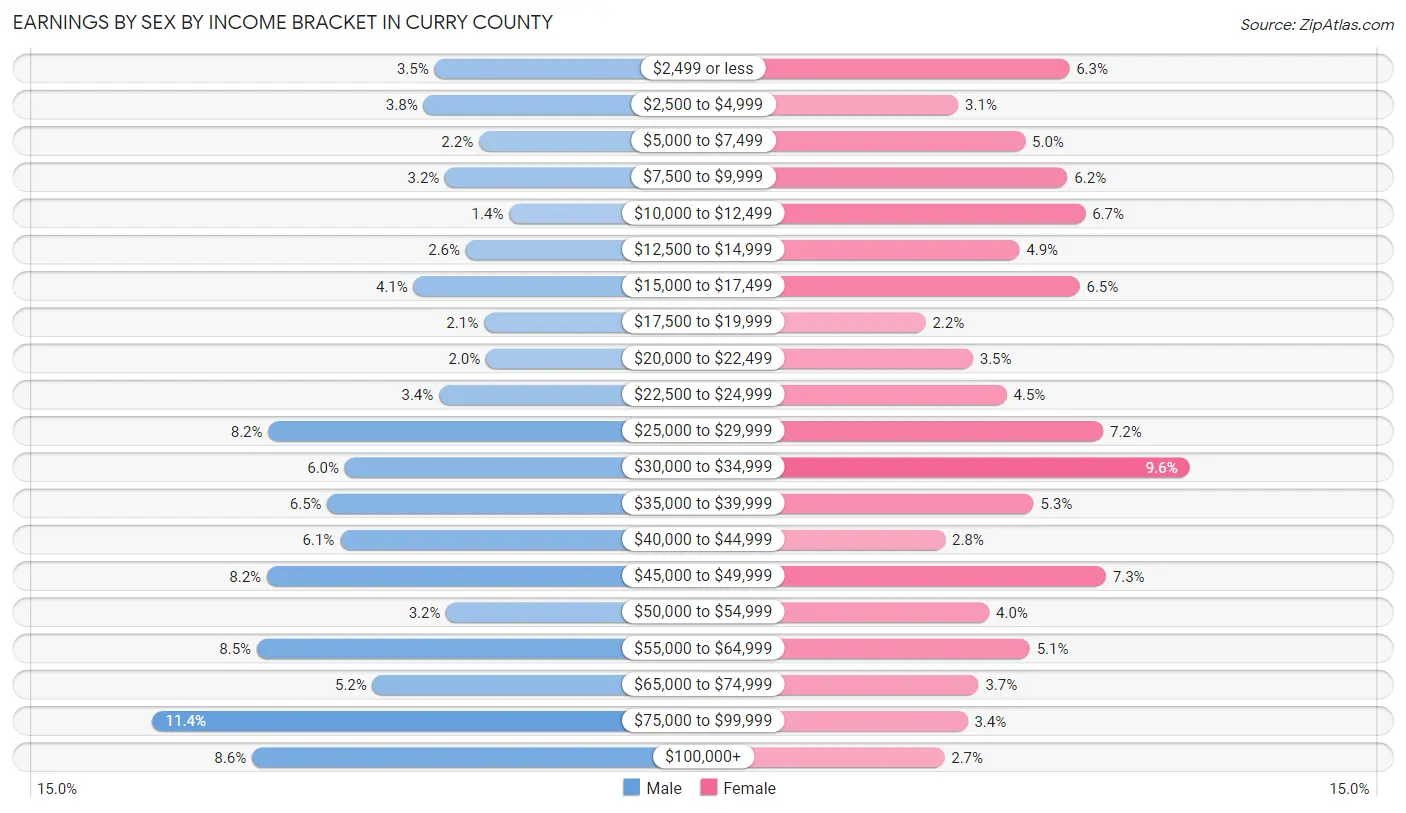
Earnings by Sex by Income Bracket in Curry County
The most common earnings brackets in Curry County are $75,000 to $99,999 for men (1,632 | 11.4%) and $30,000 to $34,999 for women (978 | 9.6%).
| Income | Male | Female |
| $2,499 or less | 498 (3.5%) | 635 (6.2%) |
| $2,500 to $4,999 | 542 (3.8%) | 318 (3.1%) |
| $5,000 to $7,499 | 319 (2.2%) | 509 (5.0%) |
| $7,500 to $9,999 | 455 (3.2%) | 630 (6.2%) |
| $10,000 to $12,499 | 197 (1.4%) | 680 (6.7%) |
| $12,500 to $14,999 | 372 (2.6%) | 493 (4.9%) |
| $15,000 to $17,499 | 582 (4.1%) | 664 (6.5%) |
| $17,500 to $19,999 | 299 (2.1%) | 224 (2.2%) |
| $20,000 to $22,499 | 291 (2.0%) | 360 (3.5%) |
| $22,500 to $24,999 | 479 (3.4%) | 456 (4.5%) |
| $25,000 to $29,999 | 1,167 (8.2%) | 731 (7.2%) |
| $30,000 to $34,999 | 859 (6.0%) | 978 (9.6%) |
| $35,000 to $39,999 | 929 (6.5%) | 533 (5.2%) |
| $40,000 to $44,999 | 878 (6.1%) | 280 (2.8%) |
| $45,000 to $49,999 | 1,173 (8.2%) | 739 (7.3%) |
| $50,000 to $54,999 | 451 (3.2%) | 406 (4.0%) |
| $55,000 to $64,999 | 1,212 (8.5%) | 522 (5.1%) |
| $65,000 to $74,999 | 747 (5.2%) | 376 (3.7%) |
| $75,000 to $99,999 | 1,632 (11.4%) | 344 (3.4%) |
| $100,000+ | 1,233 (8.6%) | 278 (2.7%) |
| Total | 14,315 (100.0%) | 10,156 (100.0%) |
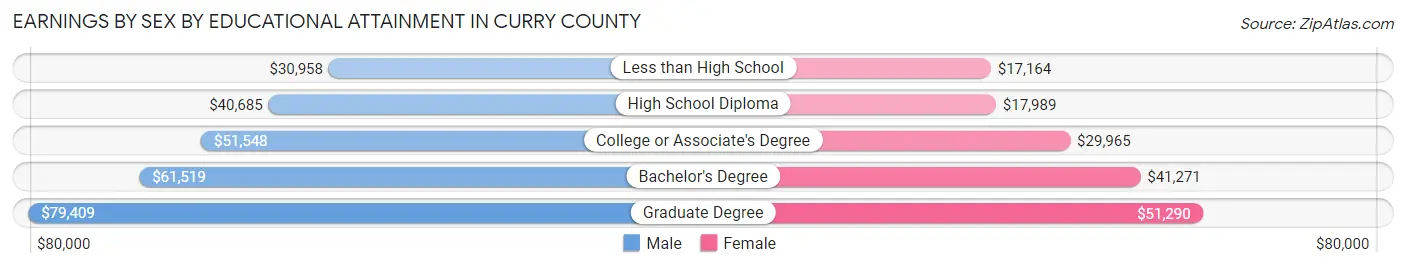
Earnings by Sex by Educational Attainment in Curry County
Average earnings in Curry County are $46,815 for men and $29,751 for women, a difference of 36.4%. Men with an educational attainment of graduate degree enjoy the highest average annual earnings of $79,409, while those with less than high school education earn the least with $30,958. Women with an educational attainment of graduate degree earn the most with the average annual earnings of $51,290, while those with less than high school education have the smallest earnings of $17,164.
| Educational Attainment | Male Income | Female Income |
| Less than High School | $30,958 | $17,164 |
| High School Diploma | $40,685 | $17,989 |
| College or Associate's Degree | $51,548 | $29,965 |
| Bachelor's Degree | $61,519 | $41,271 |
| Graduate Degree | $79,409 | $51,290 |
| Total | $46,815 | $29,751 |
Family Income in Curry County
Family Income Brackets in Curry County
According to the Curry County family income data, there are 2,464 families falling into the $50,000 to $74,999 income range, which is the most common income bracket and makes up 21.1% of all families. Conversely, the $10,000 to $14,999 income bracket is the least frequent group with only 444 families (3.8%) belonging to this category.
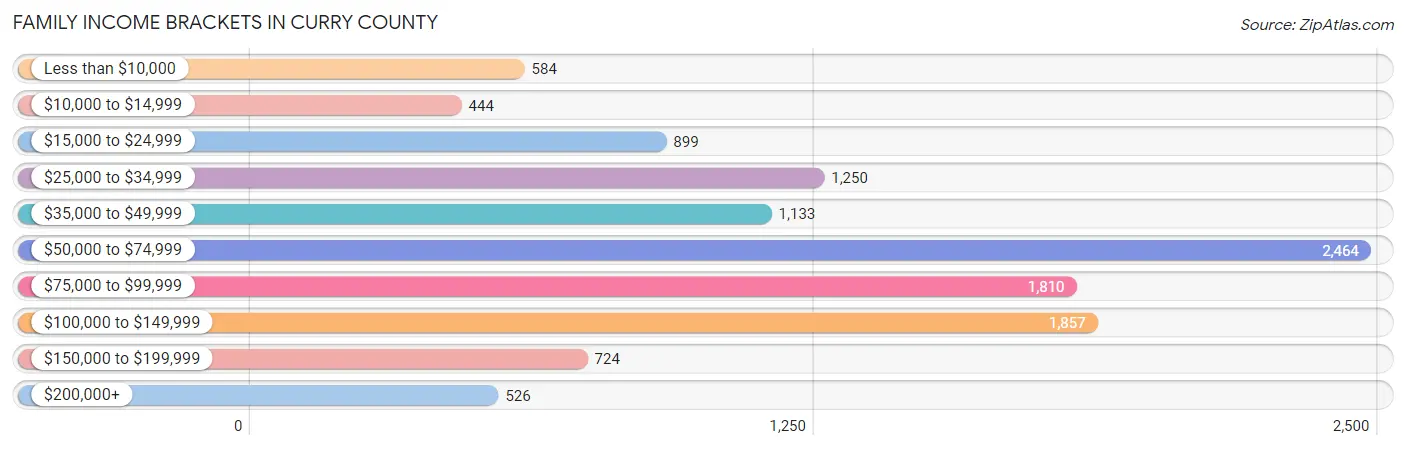
| Income Bracket | # Families | % Families |
| Less than $10,000 | 584 | 5.0% |
| $10,000 to $14,999 | 444 | 3.8% |
| $15,000 to $24,999 | 899 | 7.7% |
| $25,000 to $34,999 | 1,250 | 10.7% |
| $35,000 to $49,999 | 1,133 | 9.7% |
| $50,000 to $74,999 | 2,464 | 21.1% |
| $75,000 to $99,999 | 1,810 | 15.5% |
| $100,000 to $149,999 | 1,857 | 15.9% |
| $150,000 to $199,999 | 724 | 6.2% |
| $200,000+ | 526 | 4.5% |
Family Income by Famaliy Size in Curry County
4-person families (1,723 | 14.7%) account for the highest median family income in Curry County with $79,564 per family, while 2-person families (5,602 | 48.0%) have the highest median income of $30,140 per family member.
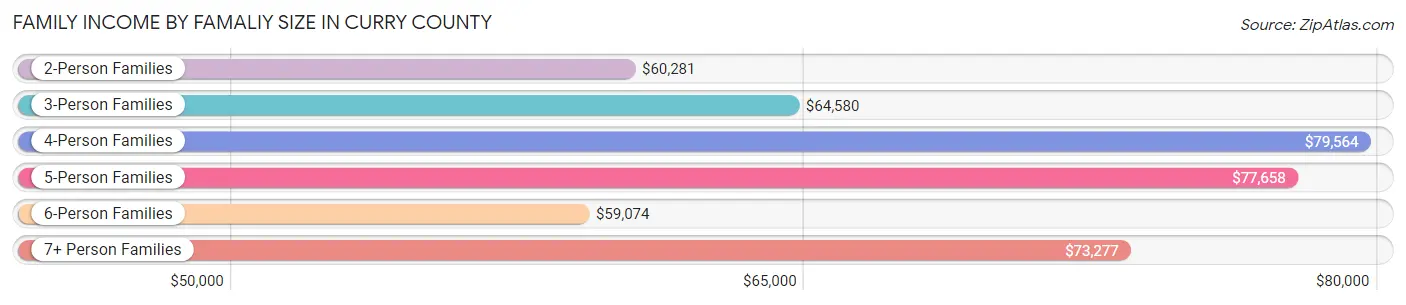
| Income Bracket | # Families | Median Income |
| 2-Person Families | 5,602 (48.0%) | $60,281 |
| 3-Person Families | 2,436 (20.9%) | $64,580 |
| 4-Person Families | 1,723 (14.7%) | $79,564 |
| 5-Person Families | 1,335 (11.4%) | $77,658 |
| 6-Person Families | 438 (3.7%) | $59,074 |
| 7+ Person Families | 145 (1.2%) | $73,277 |
| Total | 11,679 (100.0%) | $64,813 |
Family Income by Number of Earners in Curry County
The median family income in Curry County is $64,813, with families comprising 3+ earners (1,063) having the highest median family income of $110,828, while families with no earners (1,690) have the lowest median family income of $26,250, accounting for 9.1% and 14.5% of families, respectively.
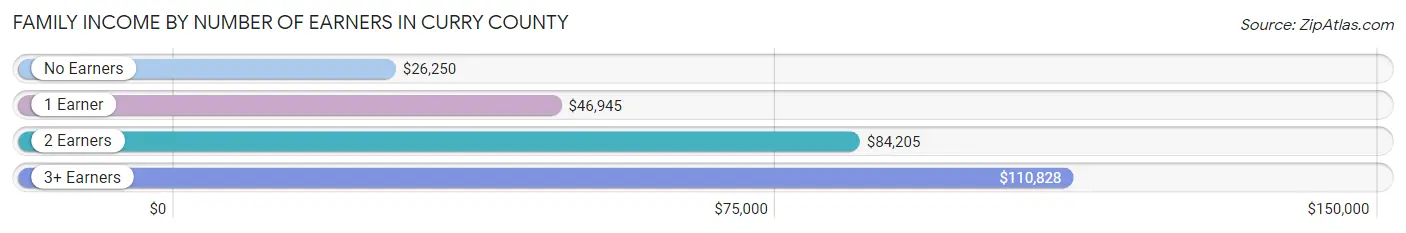
| Number of Earners | # Families | Median Income |
| No Earners | 1,690 (14.5%) | $26,250 |
| 1 Earner | 4,509 (38.6%) | $46,945 |
| 2 Earners | 4,417 (37.8%) | $84,205 |
| 3+ Earners | 1,063 (9.1%) | $110,828 |
| Total | 11,679 (100.0%) | $64,813 |
Household Income in Curry County
Household Income Brackets in Curry County
With 3,688 households falling in the category, the $50,000 to $74,999 income range is the most frequent in Curry County, accounting for 19.9% of all households. In contrast, only 556 households (3.0%) fall into the $200,000+ income bracket, making it the least populous group.
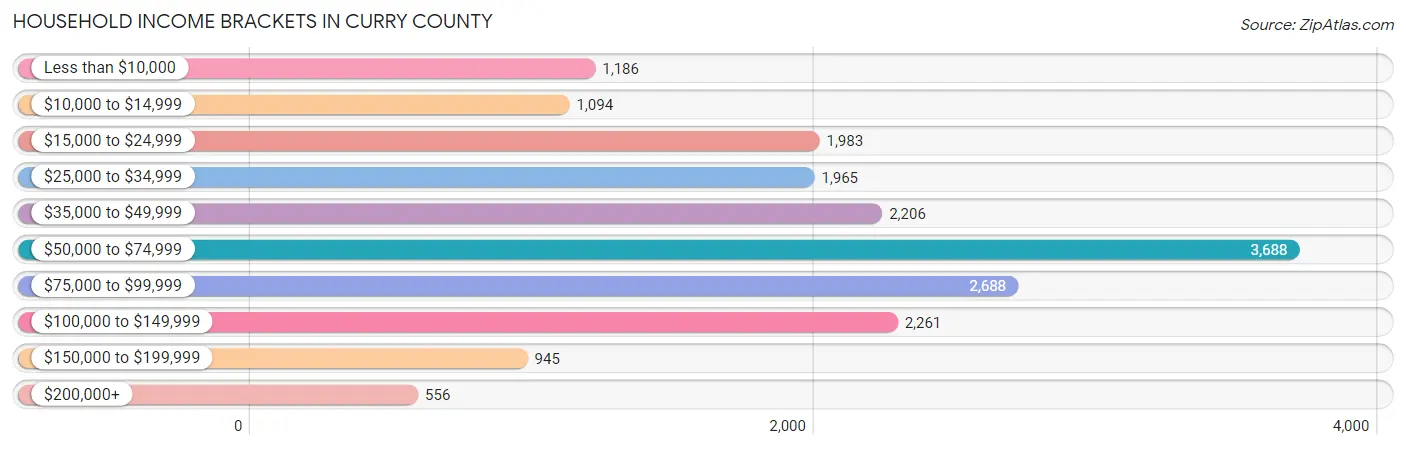
| Income Bracket | # Households | % Households |
| Less than $10,000 | 1,186 | 6.4% |
| $10,000 to $14,999 | 1,094 | 5.9% |
| $15,000 to $24,999 | 1,983 | 10.7% |
| $25,000 to $34,999 | 1,965 | 10.6% |
| $35,000 to $49,999 | 2,206 | 11.9% |
| $50,000 to $74,999 | 3,688 | 19.9% |
| $75,000 to $99,999 | 2,688 | 14.5% |
| $100,000 to $149,999 | 2,261 | 12.2% |
| $150,000 to $199,999 | 945 | 5.1% |
| $200,000+ | 556 | 3.0% |
Household Income by Householder Age in Curry County
The median household income in Curry County is $55,427, with the highest median household income of $63,421 found in the 45 to 64 years age bracket for the primary householder. A total of 5,511 households (29.7%) fall into this category. Meanwhile, the 15 to 24 years age bracket for the primary householder has the lowest median household income of $35,068, with 1,218 households (6.6%) in this group.
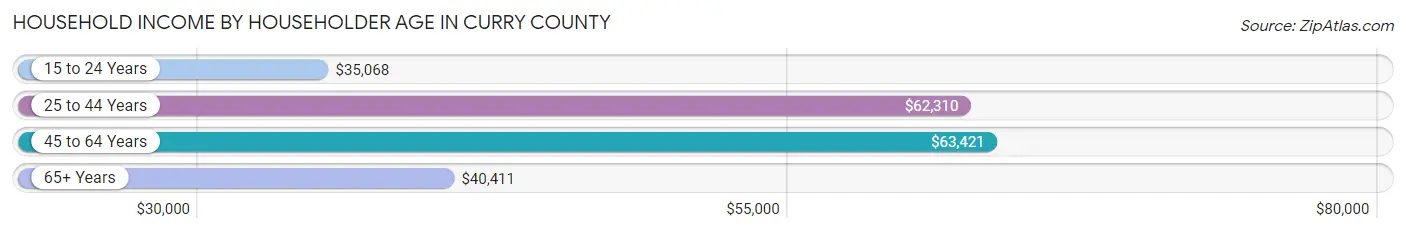
| Income Bracket | # Households | Median Income |
| 15 to 24 Years | 1,218 (6.6%) | $35,068 |
| 25 to 44 Years | 7,674 (41.4%) | $62,310 |
| 45 to 64 Years | 5,511 (29.7%) | $63,421 |
| 65+ Years | 4,132 (22.3%) | $40,411 |
| Total | 18,535 (100.0%) | $55,427 |
Poverty in Curry County
Income Below Poverty by Sex and Age in Curry County
With 16.3% poverty level for males and 22.5% for females among the residents of Curry County, 5 year old males and 15 year old females are the most vulnerable to poverty, with 185 males (50.4%) and 55 females (39.9%) in their respective age groups living below the poverty level.
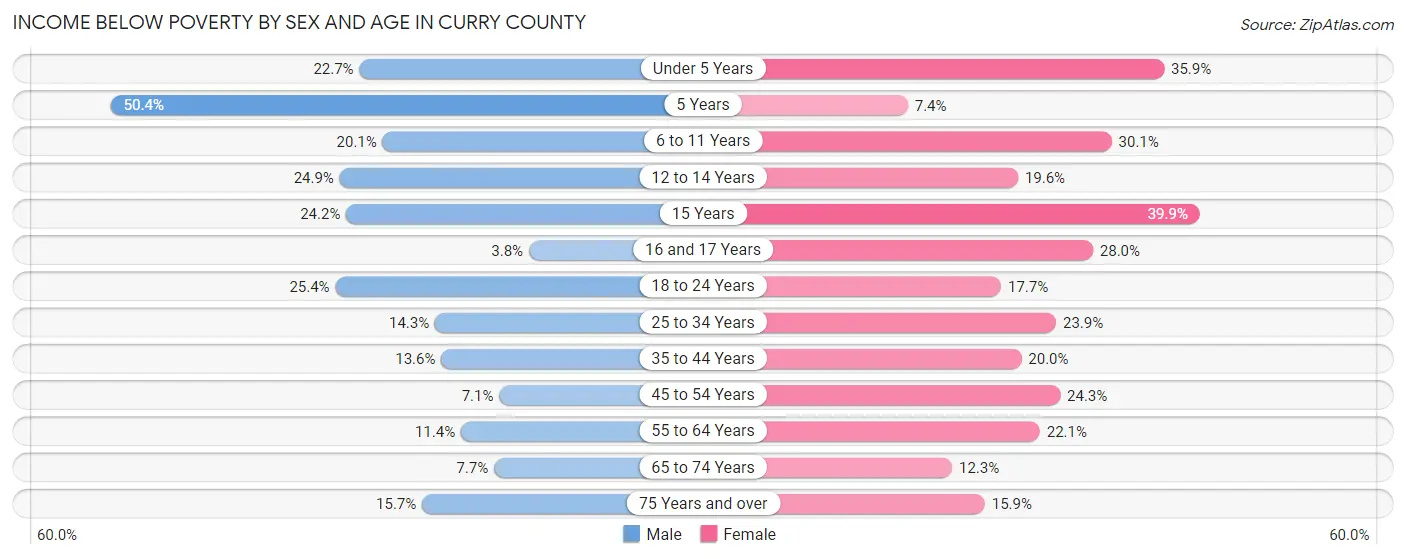
| Age Bracket | Male | Female |
| Under 5 Years | 420 (22.7%) | 682 (35.9%) |
| 5 Years | 185 (50.4%) | 28 (7.3%) |
| 6 to 11 Years | 383 (20.1%) | 573 (30.0%) |
| 12 to 14 Years | 344 (24.9%) | 194 (19.6%) |
| 15 Years | 88 (24.2%) | 55 (39.9%) |
| 16 and 17 Years | 23 (3.8%) | 222 (28.0%) |
| 18 to 24 Years | 726 (25.4%) | 400 (17.7%) |
| 25 to 34 Years | 614 (14.3%) | 886 (23.9%) |
| 35 to 44 Years | 413 (13.6%) | 566 (20.0%) |
| 45 to 54 Years | 158 (7.1%) | 550 (24.3%) |
| 55 to 64 Years | 281 (11.4%) | 567 (22.1%) |
| 65 to 74 Years | 132 (7.7%) | 220 (12.3%) |
| 75 Years and over | 157 (15.7%) | 246 (15.9%) |
| Total | 3,924 (16.3%) | 5,189 (22.5%) |
Income Above Poverty by Sex and Age in Curry County
According to the poverty statistics in Curry County, males aged 16 and 17 years and females aged 5 years are the age groups that are most secure financially, with 96.2% of males and 92.6% of females in these age groups living above the poverty line.
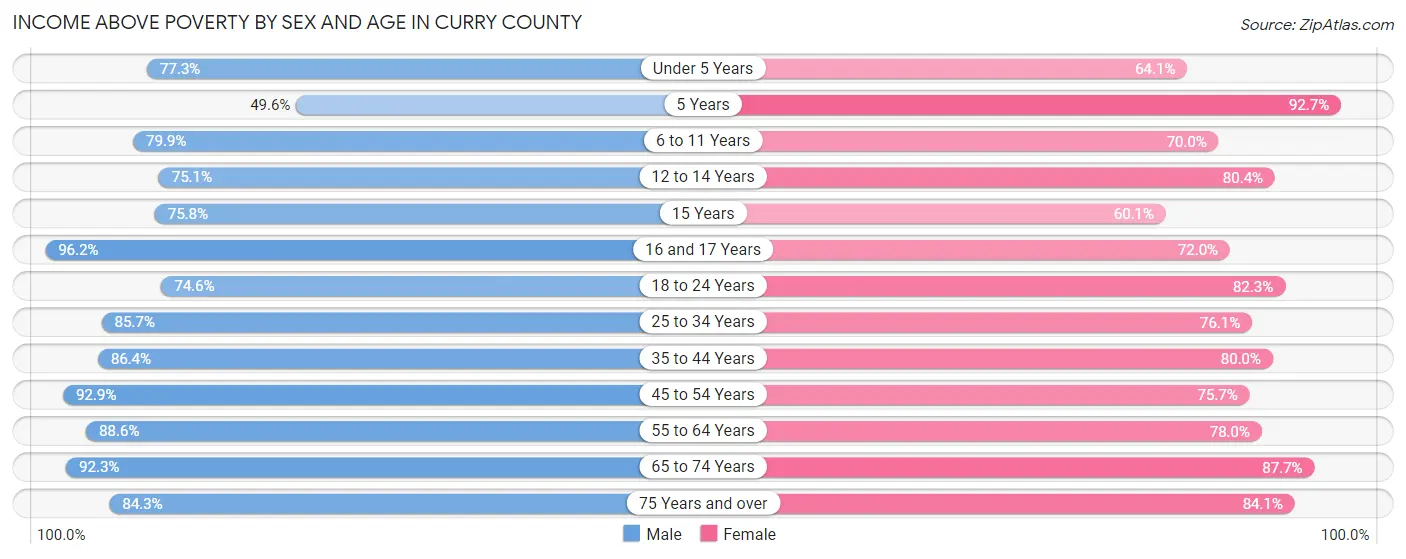
| Age Bracket | Male | Female |
| Under 5 Years | 1,429 (77.3%) | 1,218 (64.1%) |
| 5 Years | 182 (49.6%) | 353 (92.6%) |
| 6 to 11 Years | 1,520 (79.9%) | 1,334 (70.0%) |
| 12 to 14 Years | 1,037 (75.1%) | 795 (80.4%) |
| 15 Years | 276 (75.8%) | 83 (60.1%) |
| 16 and 17 Years | 577 (96.2%) | 572 (72.0%) |
| 18 to 24 Years | 2,134 (74.6%) | 1,855 (82.3%) |
| 25 to 34 Years | 3,684 (85.7%) | 2,828 (76.1%) |
| 35 to 44 Years | 2,626 (86.4%) | 2,264 (80.0%) |
| 45 to 54 Years | 2,058 (92.9%) | 1,712 (75.7%) |
| 55 to 64 Years | 2,184 (88.6%) | 2,005 (77.9%) |
| 65 to 74 Years | 1,577 (92.3%) | 1,571 (87.7%) |
| 75 Years and over | 841 (84.3%) | 1,298 (84.1%) |
| Total | 20,125 (83.7%) | 17,888 (77.5%) |
Income Below Poverty Among Married-Couple Families in Curry County
The poverty statistics for married-couple families in Curry County show that 7.3% or 624 of the total 8,496 families live below the poverty line. Families with 3 or 4 children have the highest poverty rate of 18.0%, comprising of 184 families. On the other hand, families with 5 or more children have the lowest poverty rate of 0.0%, which includes 0 families.
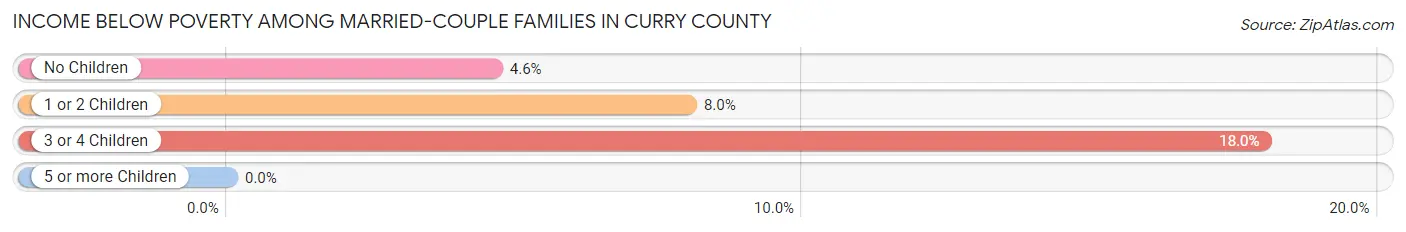
| Children | Above Poverty | Below Poverty |
| No Children | 4,428 (95.4%) | 214 (4.6%) |
| 1 or 2 Children | 2,603 (92.0%) | 226 (8.0%) |
| 3 or 4 Children | 839 (82.0%) | 184 (18.0%) |
| 5 or more Children | 2 (100.0%) | 0 (0.0%) |
| Total | 7,872 (92.7%) | 624 (7.3%) |
Income Below Poverty Among Single-Parent Households in Curry County
According to the poverty data in Curry County, 25.8% or 181 single-father households and 43.5% or 1,080 single-mother households are living below the poverty line. Among single-father households, those with 5 or more children have the highest poverty rate, with 17 households (100.0%) experiencing poverty. Likewise, among single-mother households, those with 3 or 4 children have the highest poverty rate, with 325 households (90.0%) falling below the poverty line.
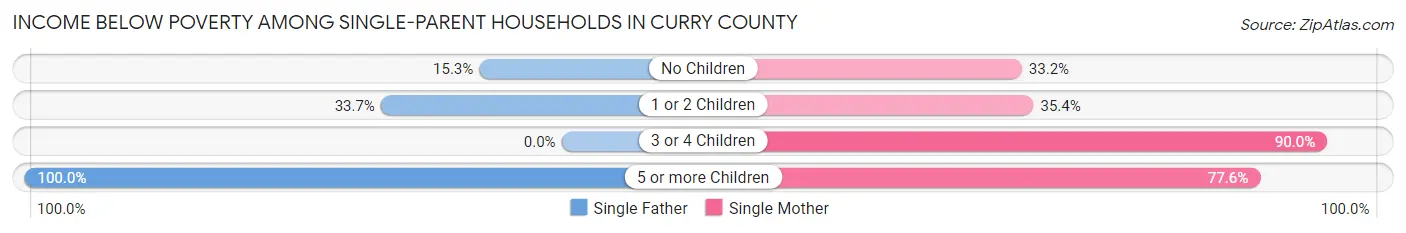
| Children | Single Father | Single Mother |
| No Children | 29 (15.3%) | 242 (33.2%) |
| 1 or 2 Children | 135 (33.7%) | 475 (35.4%) |
| 3 or 4 Children | 0 (0.0%) | 325 (90.0%) |
| 5 or more Children | 17 (100.0%) | 38 (77.5%) |
| Total | 181 (25.8%) | 1,080 (43.5%) |
Income Below Poverty Among Married-Couple vs Single-Parent Households in Curry County
The poverty data for Curry County shows that 624 of the married-couple family households (7.3%) and 1,261 of the single-parent households (39.6%) are living below the poverty level. Within the married-couple family households, those with 3 or 4 children have the highest poverty rate, with 184 households (18.0%) falling below the poverty line. Among the single-parent households, those with 5 or more children have the highest poverty rate, with 55 household (83.3%) living below poverty.
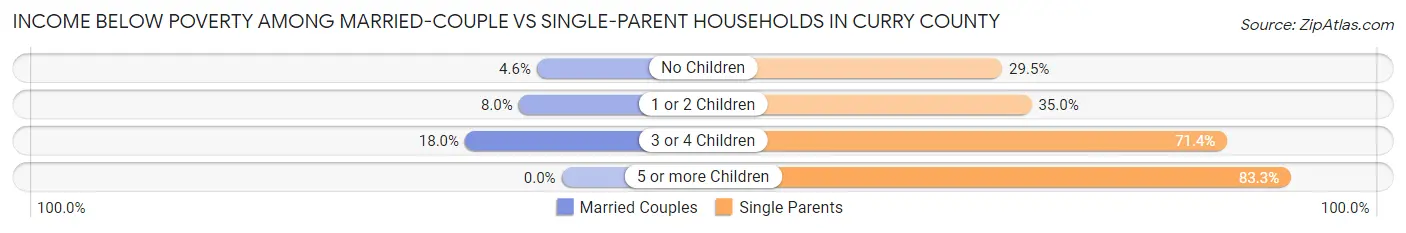
| Children | Married-Couple Families | Single-Parent Households |
| No Children | 214 (4.6%) | 271 (29.5%) |
| 1 or 2 Children | 226 (8.0%) | 610 (35.0%) |
| 3 or 4 Children | 184 (18.0%) | 325 (71.4%) |
| 5 or more Children | 0 (0.0%) | 55 (83.3%) |
| Total | 624 (7.3%) | 1,261 (39.6%) |
Race in Curry County
The most populous races in Curry County are White / Caucasian (29,180 | 60.4%), Hispanic or Latino (21,475 | 44.4%), and Some other Race (9,583 | 19.8%).
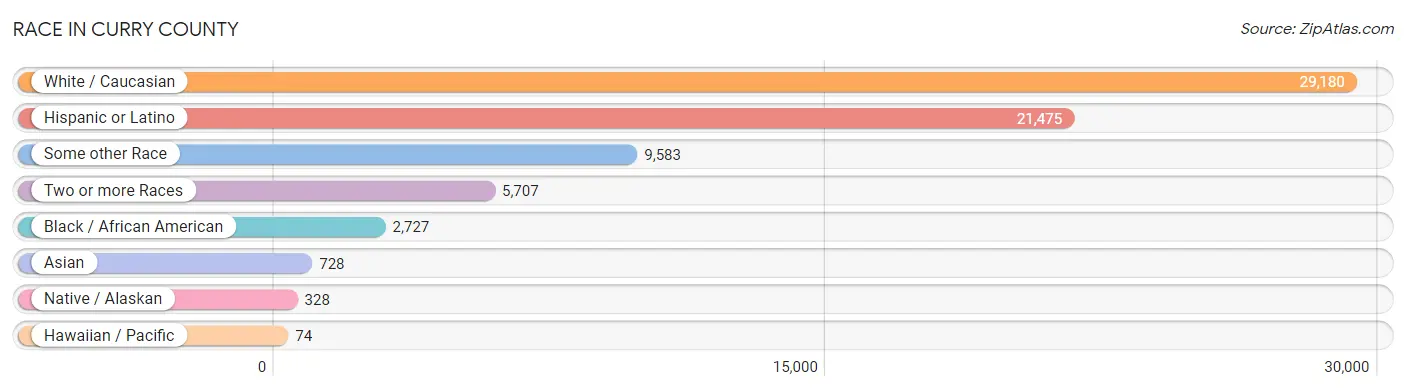
| Race | # Population | % Population |
| Asian | 728 | 1.5% |
| Black / African American | 2,727 | 5.6% |
| Hawaiian / Pacific | 74 | 0.2% |
| Hispanic or Latino | 21,475 | 44.4% |
| Native / Alaskan | 328 | 0.7% |
| White / Caucasian | 29,180 | 60.4% |
| Two or more Races | 5,707 | 11.8% |
| Some other Race | 9,583 | 19.8% |
| Total | 48,327 | 100.0% |
Ancestry in Curry County
The most populous ancestries reported in Curry County are Mexican (16,432 | 34.0%), German (4,755 | 9.8%), English (4,176 | 8.6%), Irish (3,731 | 7.7%), and American (2,329 | 4.8%), together accounting for 65.0% of all Curry County residents.
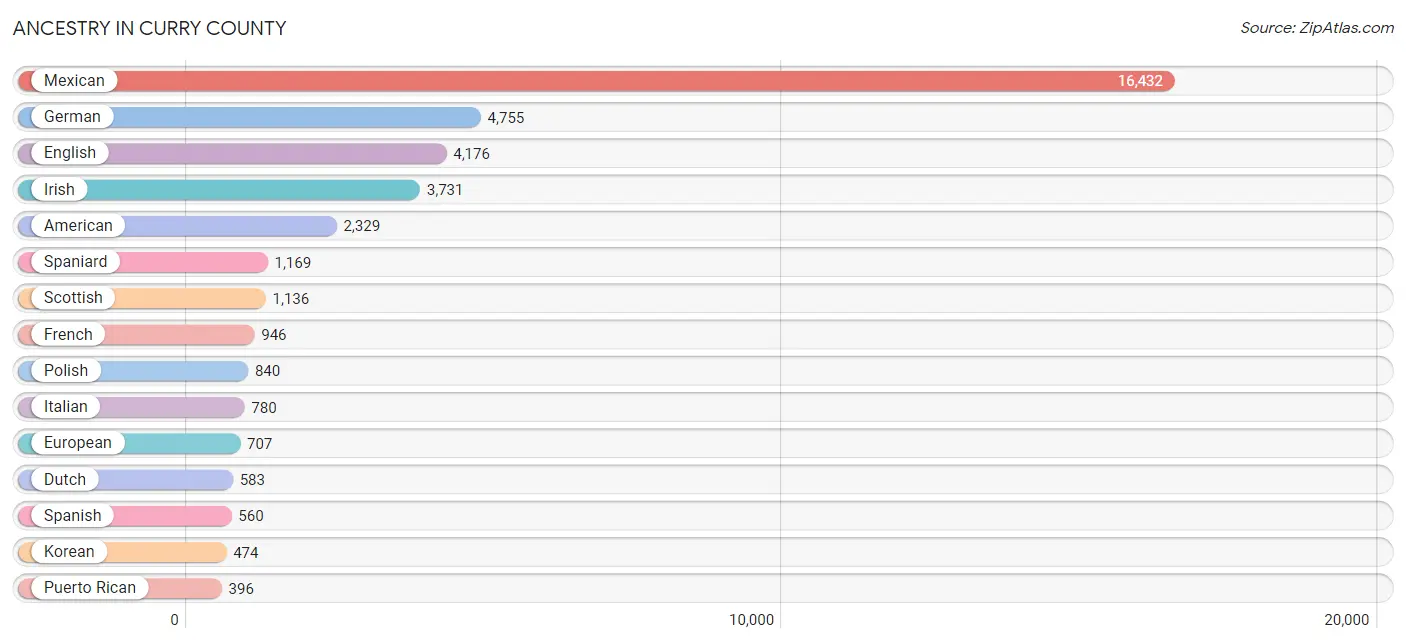
| Ancestry | # Population | % Population |
| African | 252 | 0.5% |
| American | 2,329 | 4.8% |
| Apache | 16 | 0.0% |
| Arab | 31 | 0.1% |
| Argentinean | 26 | 0.1% |
| Austrian | 23 | 0.1% |
| Bahamian | 9 | 0.0% |
| Bangladeshi | 16 | 0.0% |
| Belgian | 13 | 0.0% |
| Bhutanese | 63 | 0.1% |
| Blackfeet | 7 | 0.0% |
| British | 240 | 0.5% |
| Burmese | 260 | 0.5% |
| Canadian | 41 | 0.1% |
| Central American | 351 | 0.7% |
| Central American Indian | 9 | 0.0% |
| Cherokee | 240 | 0.5% |
| Cheyenne | 18 | 0.0% |
| Chickasaw | 3 | 0.0% |
| Chippewa | 1 | 0.0% |
| Choctaw | 65 | 0.1% |
| Colombian | 88 | 0.2% |
| Comanche | 8 | 0.0% |
| Costa Rican | 34 | 0.1% |
| Cree | 58 | 0.1% |
| Croatian | 34 | 0.1% |
| Czech | 18 | 0.0% |
| Danish | 57 | 0.1% |
| Dutch | 583 | 1.2% |
| Dutch West Indian | 43 | 0.1% |
| Eastern European | 113 | 0.2% |
| Ecuadorian | 1 | 0.0% |
| English | 4,176 | 8.6% |
| European | 707 | 1.5% |
| Finnish | 46 | 0.1% |
| French | 946 | 2.0% |
| French Canadian | 72 | 0.2% |
| German | 4,755 | 9.8% |
| Greek | 231 | 0.5% |
| Guatemalan | 9 | 0.0% |
| Haitian | 34 | 0.1% |
| Honduran | 216 | 0.4% |
| Hungarian | 62 | 0.1% |
| Indian (Asian) | 50 | 0.1% |
| Irish | 3,731 | 7.7% |
| Italian | 780 | 1.6% |
| Jamaican | 10 | 0.0% |
| Kenyan | 3 | 0.0% |
| Kiowa | 87 | 0.2% |
| Korean | 474 | 1.0% |
| Laotian | 24 | 0.1% |
| Lithuanian | 60 | 0.1% |
| Malaysian | 69 | 0.1% |
| Mexican | 16,432 | 34.0% |
| Mexican American Indian | 55 | 0.1% |
| Native Hawaiian | 15 | 0.0% |
| Navajo | 135 | 0.3% |
| Northern European | 111 | 0.2% |
| Norwegian | 180 | 0.4% |
| Pakistani | 2 | 0.0% |
| Palestinian | 31 | 0.1% |
| Panamanian | 92 | 0.2% |
| Peruvian | 23 | 0.1% |
| Pima | 1 | 0.0% |
| Polish | 840 | 1.7% |
| Portuguese | 201 | 0.4% |
| Pueblo | 32 | 0.1% |
| Puerto Rican | 396 | 0.8% |
| Russian | 50 | 0.1% |
| Samoan | 5 | 0.0% |
| Scandinavian | 130 | 0.3% |
| Scotch-Irish | 143 | 0.3% |
| Scottish | 1,136 | 2.4% |
| Seminole | 3 | 0.0% |
| Sioux | 64 | 0.1% |
| Slovene | 4 | 0.0% |
| South American | 138 | 0.3% |
| Spaniard | 1,169 | 2.4% |
| Spanish | 560 | 1.2% |
| Spanish American | 155 | 0.3% |
| Sri Lankan | 141 | 0.3% |
| Subsaharan African | 255 | 0.5% |
| Swedish | 293 | 0.6% |
| Swiss | 21 | 0.0% |
| Thai | 52 | 0.1% |
| Tlingit-Haida | 5 | 0.0% |
| Ukrainian | 15 | 0.0% |
| Welsh | 224 | 0.5% | View All 88 Rows |
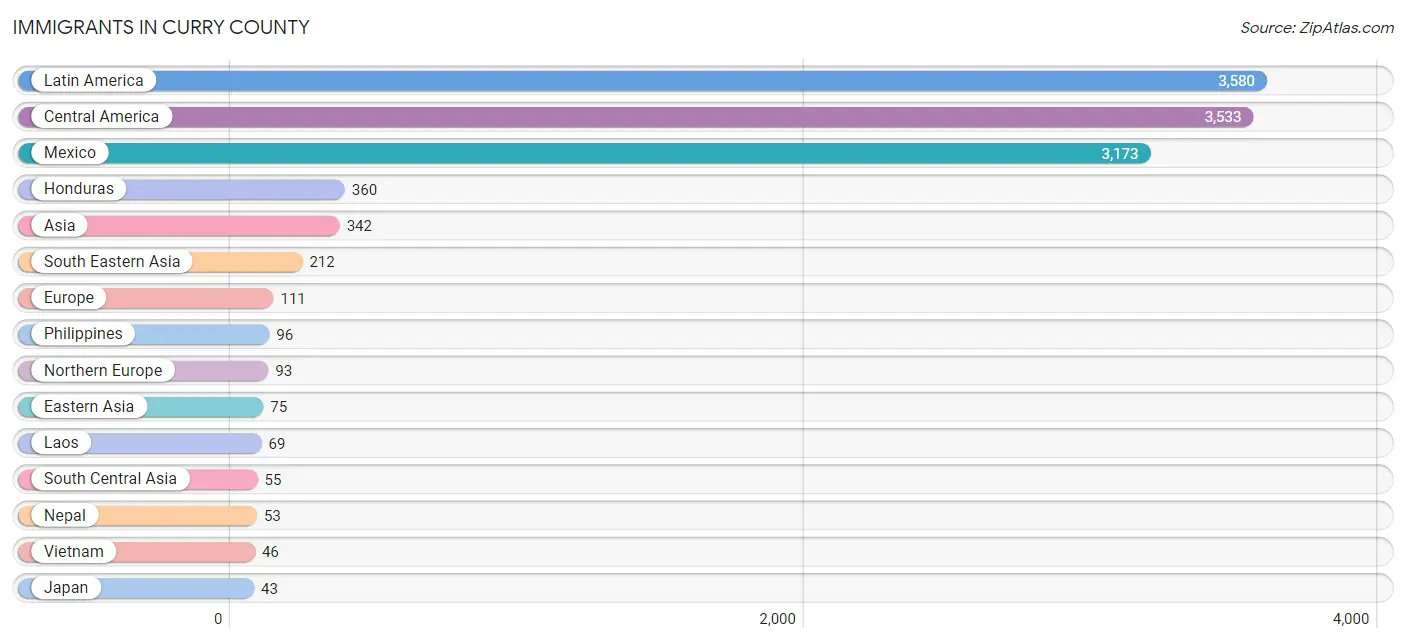
Immigrants in Curry County
The most numerous immigrant groups reported in Curry County came from Latin America (3,580 | 7.4%), Central America (3,533 | 7.3%), Mexico (3,173 | 6.6%), Honduras (360 | 0.7%), and Asia (342 | 0.7%), together accounting for 22.7% of all Curry County residents.
| Immigration Origin | # Population | % Population |
| Africa | 7 | 0.0% |
| Asia | 342 | 0.7% |
| Bahamas | 9 | 0.0% |
| Canada | 23 | 0.1% |
| Caribbean | 9 | 0.0% |
| Central America | 3,533 | 7.3% |
| Colombia | 30 | 0.1% |
| Eastern Asia | 75 | 0.2% |
| England | 14 | 0.0% |
| Europe | 111 | 0.2% |
| Germany | 18 | 0.0% |
| Honduras | 360 | 0.7% |
| India | 2 | 0.0% |
| Ireland | 14 | 0.0% |
| Japan | 43 | 0.1% |
| Korea | 32 | 0.1% |
| Laos | 69 | 0.1% |
| Latin America | 3,580 | 7.4% |
| Mexico | 3,173 | 6.6% |
| Nepal | 53 | 0.1% |
| Northern Europe | 93 | 0.2% |
| Peru | 8 | 0.0% |
| Philippines | 96 | 0.2% |
| South Africa | 1 | 0.0% |
| South America | 38 | 0.1% |
| South Central Asia | 55 | 0.1% |
| South Eastern Asia | 212 | 0.4% |
| Thailand | 1 | 0.0% |
| Vietnam | 46 | 0.1% |
| Western Europe | 18 | 0.0% | View All 30 Rows |
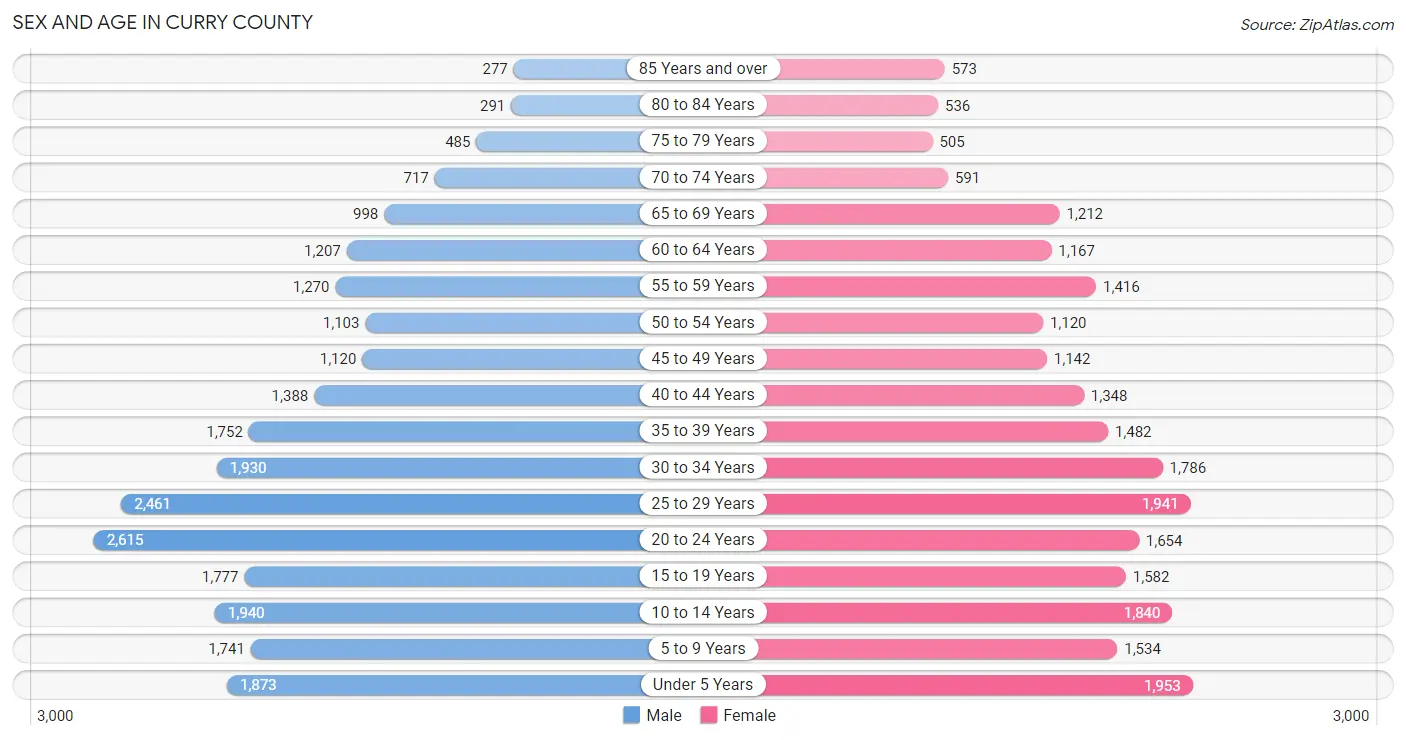
Sex and Age in Curry County
Sex and Age in Curry County
The most populous age groups in Curry County are 20 to 24 Years (2,615 | 10.5%) for men and Under 5 Years (1,953 | 8.4%) for women.
| Age Bracket | Male | Female |
| Under 5 Years | 1,873 (7.5%) | 1,953 (8.4%) |
| 5 to 9 Years | 1,741 (7.0%) | 1,534 (6.6%) |
| 10 to 14 Years | 1,940 (7.8%) | 1,840 (7.9%) |
| 15 to 19 Years | 1,777 (7.1%) | 1,582 (6.8%) |
| 20 to 24 Years | 2,615 (10.5%) | 1,654 (7.1%) |
| 25 to 29 Years | 2,461 (9.9%) | 1,941 (8.3%) |
| 30 to 34 Years | 1,930 (7.7%) | 1,786 (7.6%) |
| 35 to 39 Years | 1,752 (7.0%) | 1,482 (6.3%) |
| 40 to 44 Years | 1,388 (5.6%) | 1,348 (5.8%) |
| 45 to 49 Years | 1,120 (4.5%) | 1,142 (4.9%) |
| 50 to 54 Years | 1,103 (4.4%) | 1,120 (4.8%) |
| 55 to 59 Years | 1,270 (5.1%) | 1,416 (6.1%) |
| 60 to 64 Years | 1,207 (4.8%) | 1,167 (5.0%) |
| 65 to 69 Years | 998 (4.0%) | 1,212 (5.2%) |
| 70 to 74 Years | 717 (2.9%) | 591 (2.5%) |
| 75 to 79 Years | 485 (1.9%) | 505 (2.2%) |
| 80 to 84 Years | 291 (1.2%) | 536 (2.3%) |
| 85 Years and over | 277 (1.1%) | 573 (2.5%) |
| Total | 24,945 (100.0%) | 23,382 (100.0%) |
Families and Households in Curry County
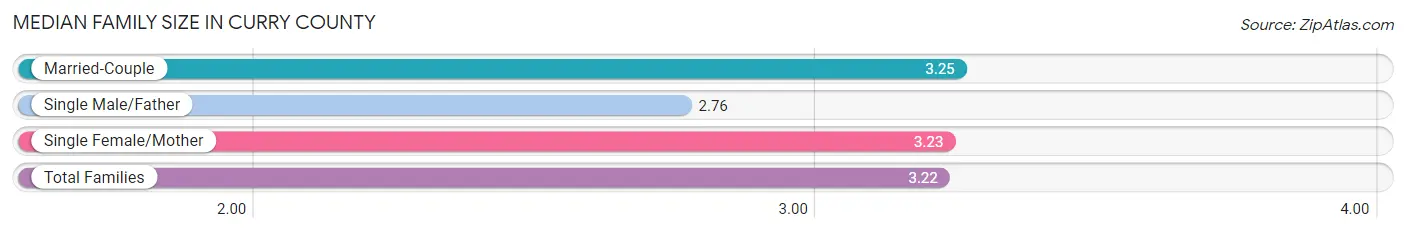
Median Family Size in Curry County
The median family size in Curry County is 3.22 persons per family, with married-couple families (8,496 | 72.8%) accounting for the largest median family size of 3.25 persons per family. On the other hand, single male/father families (701 | 6.0%) represent the smallest median family size with 2.76 persons per family.
| Family Type | # Families | Family Size |
| Married-Couple | 8,496 (72.8%) | 3.25 |
| Single Male/Father | 701 (6.0%) | 2.76 |
| Single Female/Mother | 2,482 (21.2%) | 3.23 |
| Total Families | 11,679 (100.0%) | 3.22 |
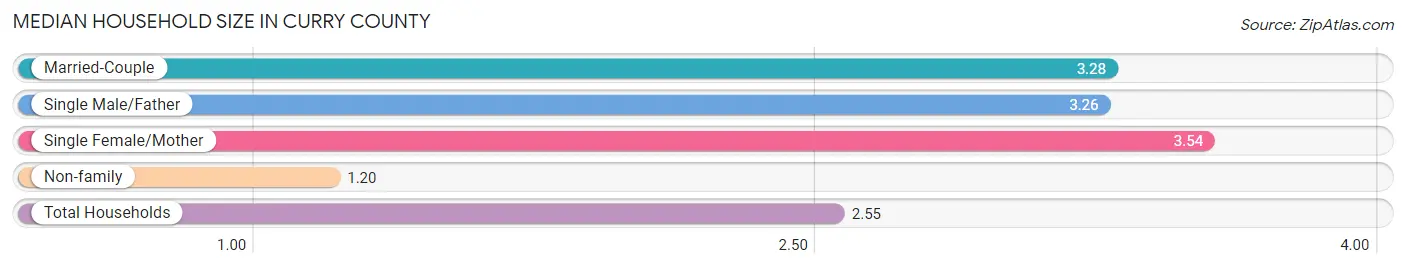
Median Household Size in Curry County
The median household size in Curry County is 2.55 persons per household, with single female/mother households (2,482 | 13.4%) accounting for the largest median household size of 3.54 persons per household. non-family households (6,856 | 37.0%) represent the smallest median household size with 1.20 persons per household.
| Household Type | # Households | Household Size |
| Married-Couple | 8,496 (45.8%) | 3.28 |
| Single Male/Father | 701 (3.8%) | 3.26 |
| Single Female/Mother | 2,482 (13.4%) | 3.54 |
| Non-family | 6,856 (37.0%) | 1.20 |
| Total Households | 18,535 (100.0%) | 2.55 |
Household Size by Marriage Status in Curry County
Out of a total of 18,535 households in Curry County, 11,679 (63.0%) are family households, while 6,856 (37.0%) are nonfamily households. The most numerous type of family households are 2-person households, comprising 4,967, and the most common type of nonfamily households are 1-person households, comprising 5,750.
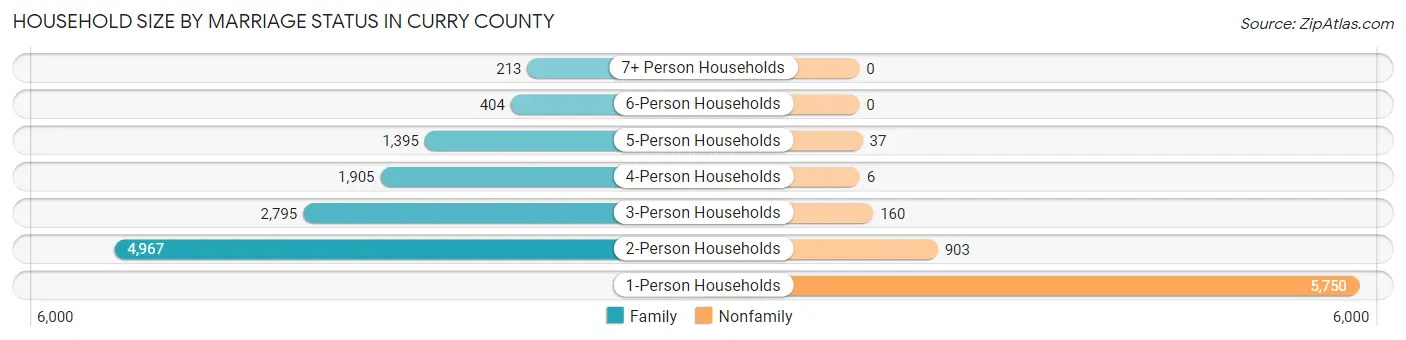
| Household Size | Family Households | Nonfamily Households |
| 1-Person Households | - | 5,750 (31.0%) |
| 2-Person Households | 4,967 (26.8%) | 903 (4.9%) |
| 3-Person Households | 2,795 (15.1%) | 160 (0.9%) |
| 4-Person Households | 1,905 (10.3%) | 6 (0.0%) |
| 5-Person Households | 1,395 (7.5%) | 37 (0.2%) |
| 6-Person Households | 404 (2.2%) | 0 (0.0%) |
| 7+ Person Households | 213 (1.1%) | 0 (0.0%) |
| Total | 11,679 (63.0%) | 6,856 (37.0%) |
Female Fertility in Curry County
Fertility by Age in Curry County
Average fertility rate in Curry County is 73.0 births per 1,000 women. Women in the age bracket of 15 to 19 years have the highest fertility rate with 133.0 births per 1,000 women. Women in the age bracket of 20 to 34 years acount for 66.5% of all women with births.
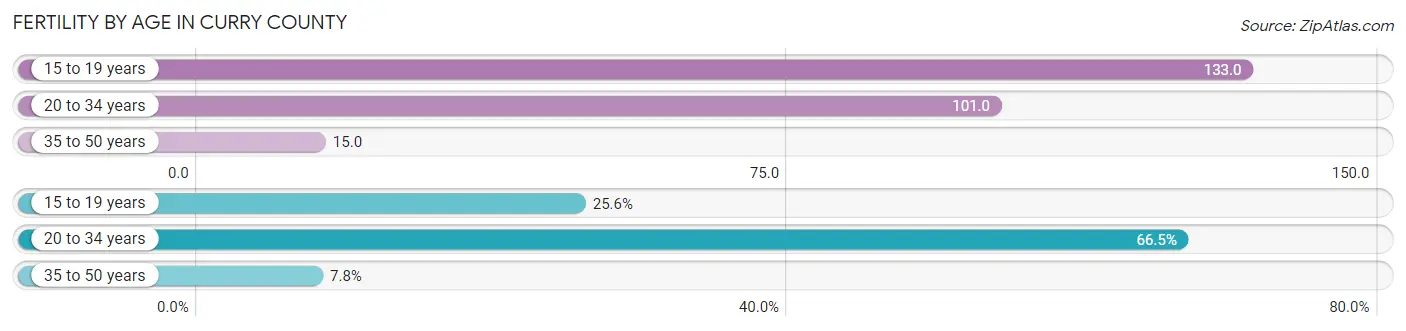
| Age Bracket | Women with Births | Births / 1,000 Women |
| 15 to 19 years | 210 (25.6%) | 133.0 |
| 20 to 34 years | 545 (66.5%) | 101.0 |
| 35 to 50 years | 64 (7.8%) | 15.0 |
| Total | 819 (100.0%) | 73.0 |
Fertility by Age by Marriage Status in Curry County
38.9% of women with births (819) in Curry County are married. The highest percentage of unmarried women with births falls into 15 to 19 years age bracket with 100.0% of them unmarried at the time of birth, while the lowest percentage of unmarried women with births belong to 35 to 50 years age bracket with 23.4% of them unmarried.
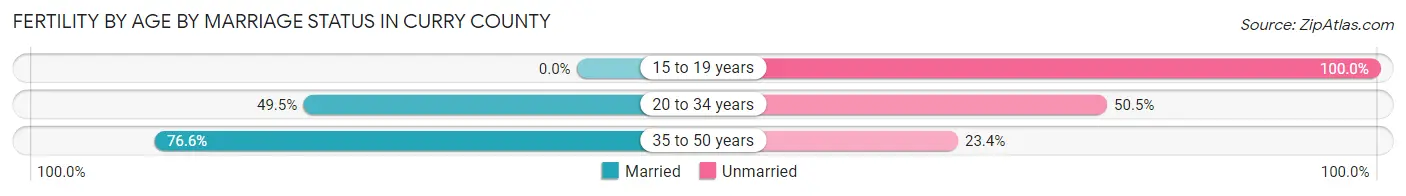
| Age Bracket | Married | Unmarried |
| 15 to 19 years | 0 (0.0%) | 210 (100.0%) |
| 20 to 34 years | 270 (49.5%) | 275 (50.5%) |
| 35 to 50 years | 49 (76.6%) | 15 (23.4%) |
| Total | 319 (39.0%) | 500 (61.1%) |
Fertility by Education in Curry County
Average fertility rate in Curry County is 73.0 births per 1,000 women. Women with the education attainment of less than high school have the highest fertility rate of 136.0 births per 1,000 women, while women with the education attainment of college or associate's degree have the lowest fertility at 34.0 births per 1,000 women. Women with the education attainment of less than high school represent 48.7% of all women with births.
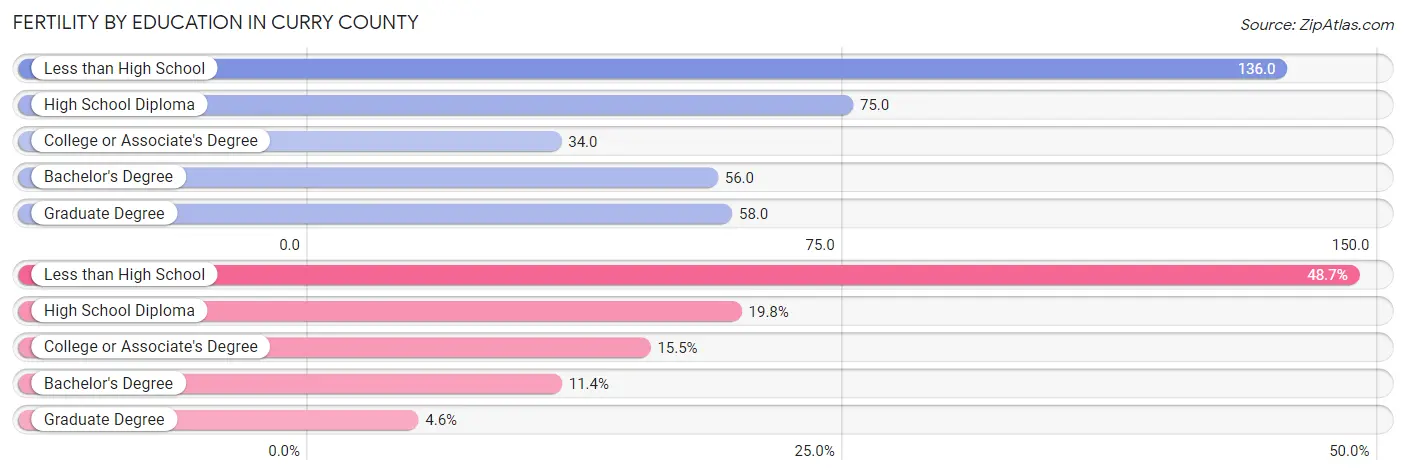
| Educational Attainment | Women with Births | Births / 1,000 Women |
| Less than High School | 399 (48.7%) | 136.0 |
| High School Diploma | 162 (19.8%) | 75.0 |
| College or Associate's Degree | 127 (15.5%) | 34.0 |
| Bachelor's Degree | 93 (11.4%) | 56.0 |
| Graduate Degree | 38 (4.6%) | 58.0 |
| Total | 819 (100.0%) | 73.0 |
Fertility by Education by Marriage Status in Curry County
61.1% of women with births in Curry County are unmarried. Women with the educational attainment of bachelor's degree are most likely to be married with 100.0% of them married at childbirth, while women with the educational attainment of less than high school are least likely to be married with 97.2% of them unmarried at childbirth.
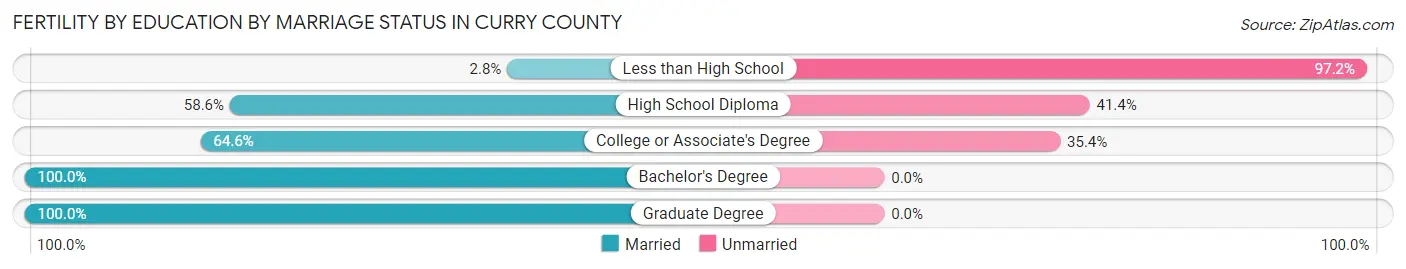
| Educational Attainment | Married | Unmarried |
| Less than High School | 11 (2.8%) | 388 (97.2%) |
| High School Diploma | 95 (58.6%) | 67 (41.4%) |
| College or Associate's Degree | 82 (64.6%) | 45 (35.4%) |
| Bachelor's Degree | 93 (100.0%) | 0 (0.0%) |
| Graduate Degree | 38 (100.0%) | 0 (0.0%) |
| Total | 319 (39.0%) | 500 (61.1%) |
Employment Characteristics in Curry County
Employment by Class of Employer in Curry County
Among the 21,564 employed individuals in Curry County, private company employees (12,146 | 56.3%), federal government employees (4,594 | 21.3%), and not-for-profit organizations (1,421 | 6.6%) make up the most common classes of employment.
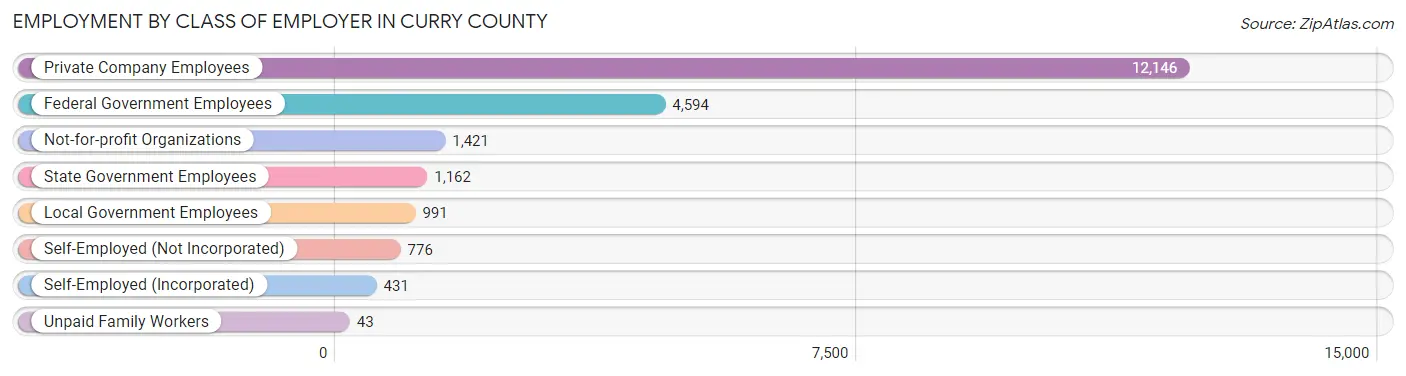
| Employer Class | # Employees | % Employees |
| Private Company Employees | 12,146 | 56.3% |
| Self-Employed (Incorporated) | 431 | 2.0% |
| Self-Employed (Not Incorporated) | 776 | 3.6% |
| Not-for-profit Organizations | 1,421 | 6.6% |
| Local Government Employees | 991 | 4.6% |
| State Government Employees | 1,162 | 5.4% |
| Federal Government Employees | 4,594 | 21.3% |
| Unpaid Family Workers | 43 | 0.2% |
| Total | 21,564 | 100.0% |
Employment Status by Age in Curry County
According to the labor force statistics for Curry County, out of the total population over 16 years of age (36,942), 63.5% or 23,458 individuals are in the labor force, with 7.9% or 1,853 of them unemployed. The age group with the highest labor force participation rate is 20 to 24 years, with 83.7% or 3,573 individuals in the labor force. Within the labor force, the 20 to 24 years age range has the highest percentage of unemployed individuals, with 16.8% or 600 of them being unemployed.
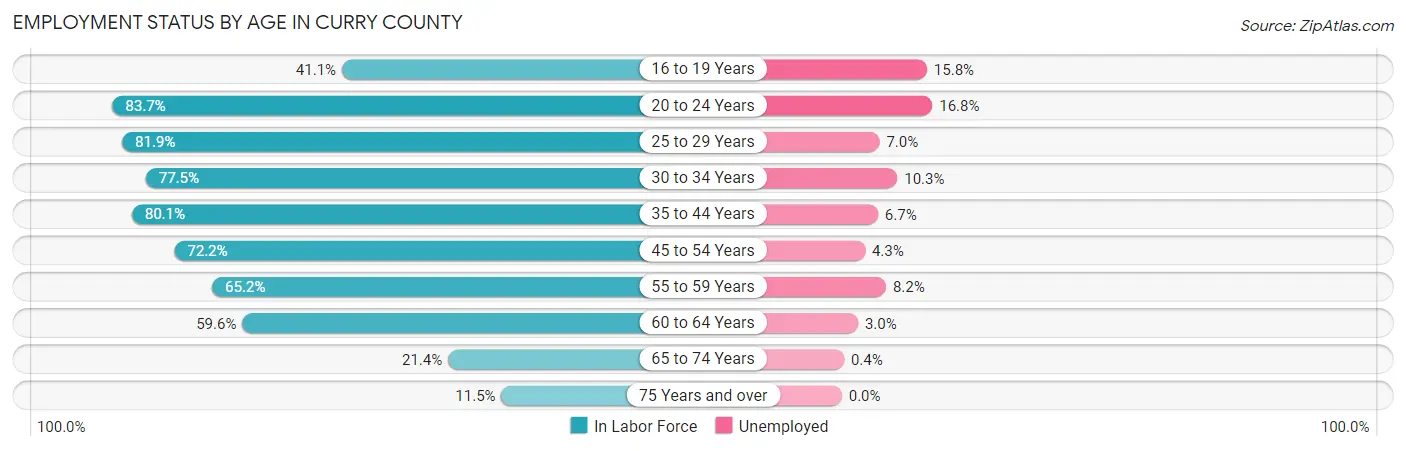
| Age Bracket | In Labor Force | Unemployed |
| 16 to 19 Years | 1,173 (41.1%) | 185 (15.8%) |
| 20 to 24 Years | 3,573 (83.7%) | 600 (16.8%) |
| 25 to 29 Years | 3,605 (81.9%) | 252 (7.0%) |
| 30 to 34 Years | 2,880 (77.5%) | 297 (10.3%) |
| 35 to 44 Years | 4,782 (80.1%) | 320 (6.7%) |
| 45 to 54 Years | 3,238 (72.2%) | 139 (4.3%) |
| 55 to 59 Years | 1,751 (65.2%) | 144 (8.2%) |
| 60 to 64 Years | 1,415 (59.6%) | 42 (3.0%) |
| 65 to 74 Years | 753 (21.4%) | 3 (0.4%) |
| 75 Years and over | 307 (11.5%) | 0 (0.0%) |
| Total | 23,458 (63.5%) | 1,853 (7.9%) |
Employment Status by Educational Attainment in Curry County
According to labor force statistics for Curry County, 74.8% of individuals (17,677) out of the total population between 25 and 64 years of age (23,633) are in the labor force, with 6.6% or 1,167 of them being unemployed. The group with the highest labor force participation rate are those with the educational attainment of bachelor's degree or higher, with 87.3% or 4,643 individuals in the labor force. Within the labor force, individuals with less than high school education have the highest percentage of unemployment, with 12.5% or 314 of them being unemployed.
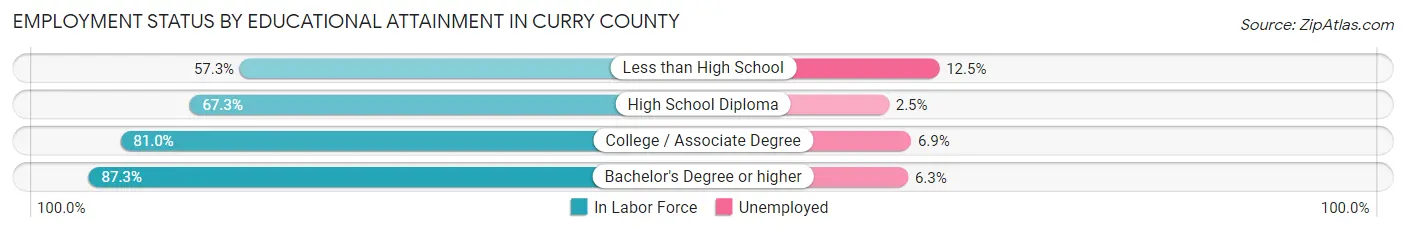
| Educational Attainment | In Labor Force | Unemployed |
| Less than High School | 2,515 (57.3%) | 549 (12.5%) |
| High School Diploma | 3,770 (67.3%) | 140 (2.5%) |
| College / Associate Degree | 6,742 (81.0%) | 574 (6.9%) |
| Bachelor's Degree or higher | 4,643 (87.3%) | 335 (6.3%) |
| Total | 17,677 (74.8%) | 1,560 (6.6%) |
Employment Occupations by Sex in Curry County
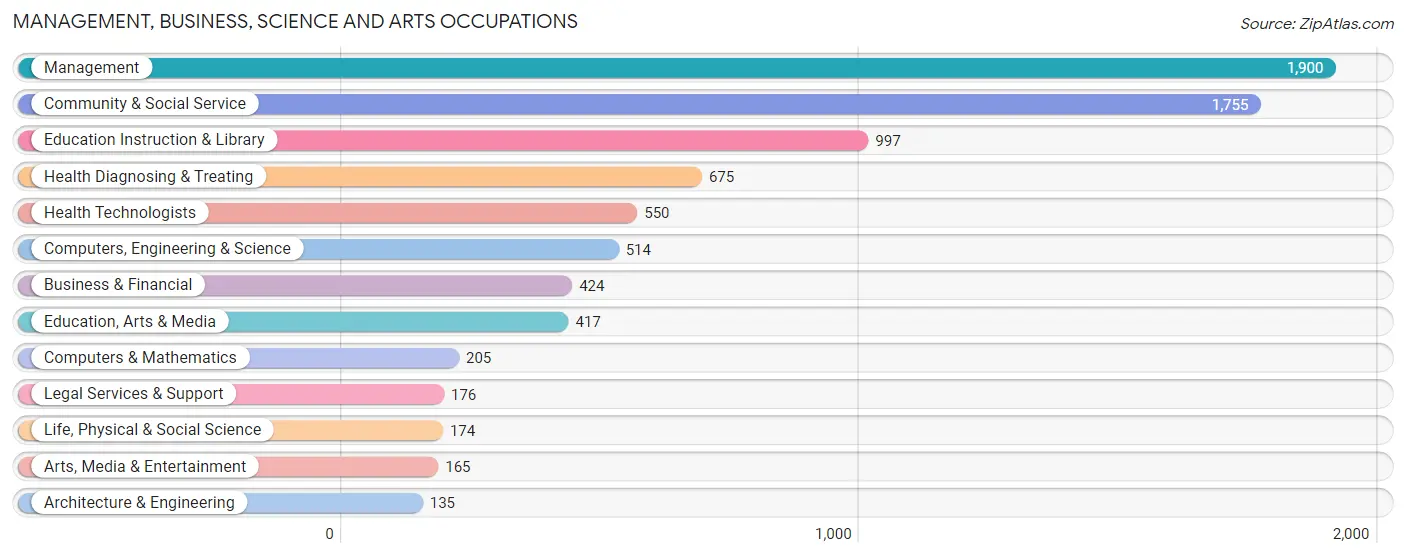
Management, Business, Science and Arts Occupations
The most common Management, Business, Science and Arts occupations in Curry County are Management (1,900 | 10.3%), Community & Social Service (1,755 | 9.5%), Education Instruction & Library (997 | 5.4%), Health Diagnosing & Treating (675 | 3.7%), and Health Technologists (550 | 3.0%).
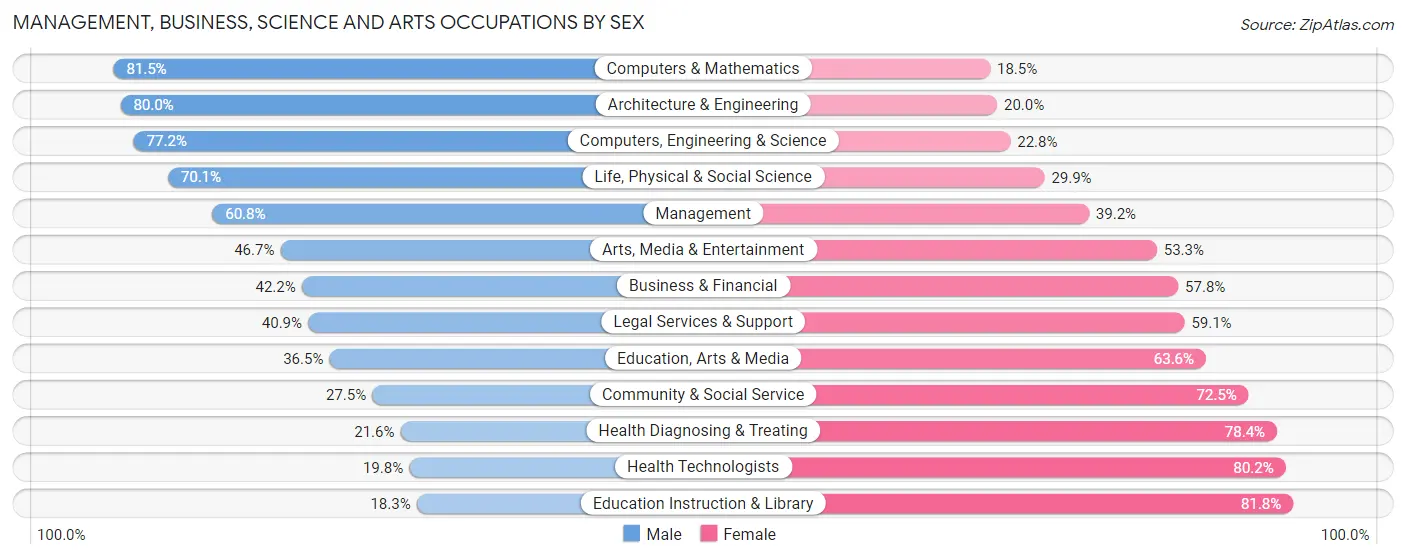
Management, Business, Science and Arts Occupations by Sex
Within the Management, Business, Science and Arts occupations in Curry County, the most male-oriented occupations are Computers & Mathematics (81.5%), Architecture & Engineering (80.0%), and Computers, Engineering & Science (77.2%), while the most female-oriented occupations are Education Instruction & Library (81.8%), Health Technologists (80.2%), and Health Diagnosing & Treating (78.4%).
| Occupation | Male | Female |
| Management | 1,156 (60.8%) | 744 (39.2%) |
| Business & Financial | 179 (42.2%) | 245 (57.8%) |
| Computers, Engineering & Science | 397 (77.2%) | 117 (22.8%) |
| Computers & Mathematics | 167 (81.5%) | 38 (18.5%) |
| Architecture & Engineering | 108 (80.0%) | 27 (20.0%) |
| Life, Physical & Social Science | 122 (70.1%) | 52 (29.9%) |
| Community & Social Service | 483 (27.5%) | 1,272 (72.5%) |
| Education, Arts & Media | 152 (36.4%) | 265 (63.5%) |
| Legal Services & Support | 72 (40.9%) | 104 (59.1%) |
| Education Instruction & Library | 182 (18.2%) | 815 (81.8%) |
| Arts, Media & Entertainment | 77 (46.7%) | 88 (53.3%) |
| Health Diagnosing & Treating | 146 (21.6%) | 529 (78.4%) |
| Health Technologists | 109 (19.8%) | 441 (80.2%) |
| Total (Category) | 2,361 (44.8%) | 2,907 (55.2%) |
| Total (Overall) | 10,119 (54.9%) | 8,318 (45.1%) |
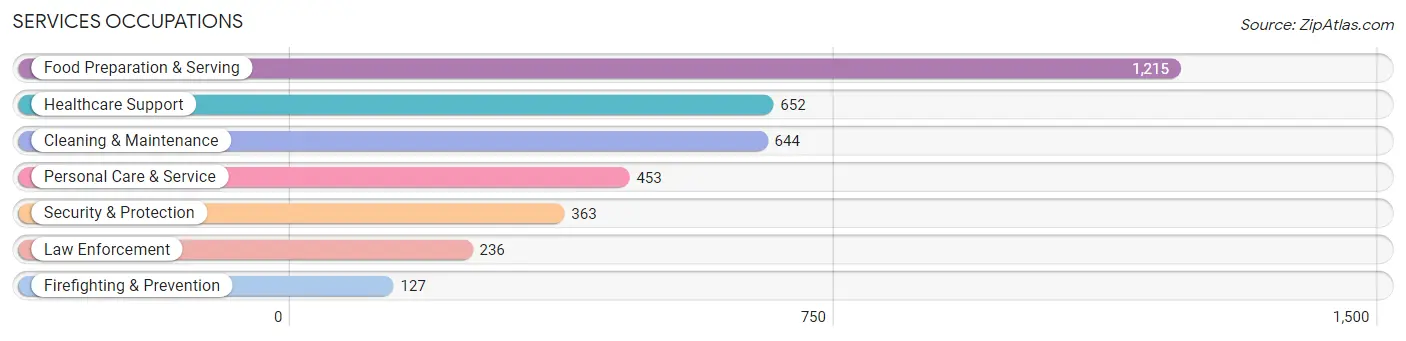
Services Occupations
The most common Services occupations in Curry County are Food Preparation & Serving (1,215 | 6.6%), Healthcare Support (652 | 3.5%), Cleaning & Maintenance (644 | 3.5%), Personal Care & Service (453 | 2.5%), and Security & Protection (363 | 2.0%).
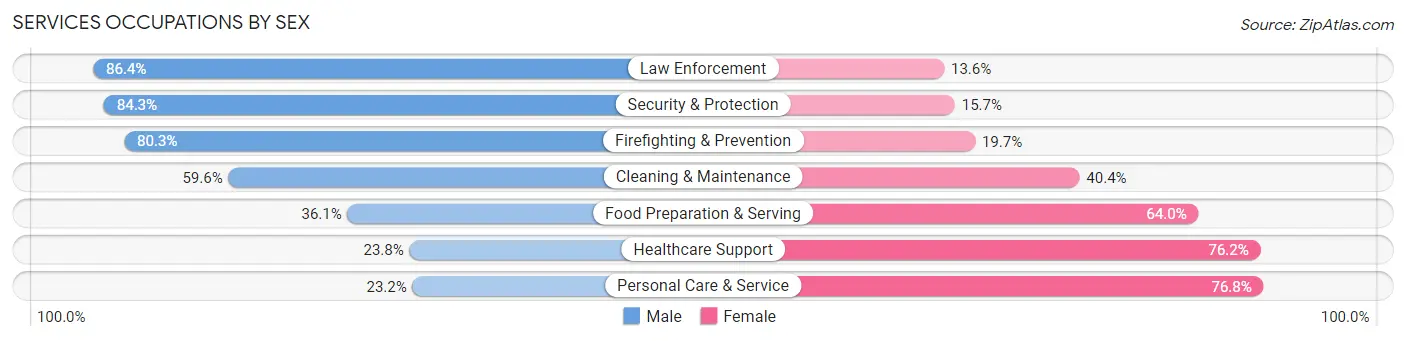
Services Occupations by Sex
Within the Services occupations in Curry County, the most male-oriented occupations are Law Enforcement (86.4%), Security & Protection (84.3%), and Firefighting & Prevention (80.3%), while the most female-oriented occupations are Personal Care & Service (76.8%), Healthcare Support (76.2%), and Food Preparation & Serving (63.9%).
| Occupation | Male | Female |
| Healthcare Support | 155 (23.8%) | 497 (76.2%) |
| Security & Protection | 306 (84.3%) | 57 (15.7%) |
| Firefighting & Prevention | 102 (80.3%) | 25 (19.7%) |
| Law Enforcement | 204 (86.4%) | 32 (13.6%) |
| Food Preparation & Serving | 438 (36.0%) | 777 (63.9%) |
| Cleaning & Maintenance | 384 (59.6%) | 260 (40.4%) |
| Personal Care & Service | 105 (23.2%) | 348 (76.8%) |
| Total (Category) | 1,388 (41.7%) | 1,939 (58.3%) |
| Total (Overall) | 10,119 (54.9%) | 8,318 (45.1%) |
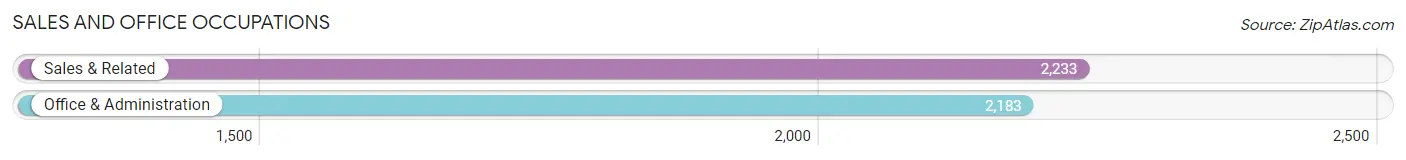
Sales and Office Occupations
The most common Sales and Office occupations in Curry County are Sales & Related (2,233 | 12.1%), and Office & Administration (2,183 | 11.8%).
Sales and Office Occupations by Sex
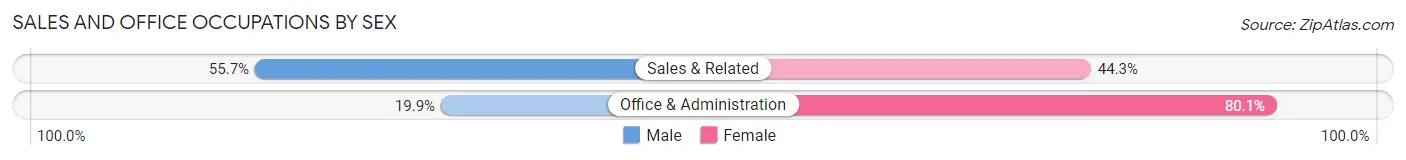
| Occupation | Male | Female |
| Sales & Related | 1,244 (55.7%) | 989 (44.3%) |
| Office & Administration | 435 (19.9%) | 1,748 (80.1%) |
| Total (Category) | 1,679 (38.0%) | 2,737 (62.0%) |
| Total (Overall) | 10,119 (54.9%) | 8,318 (45.1%) |
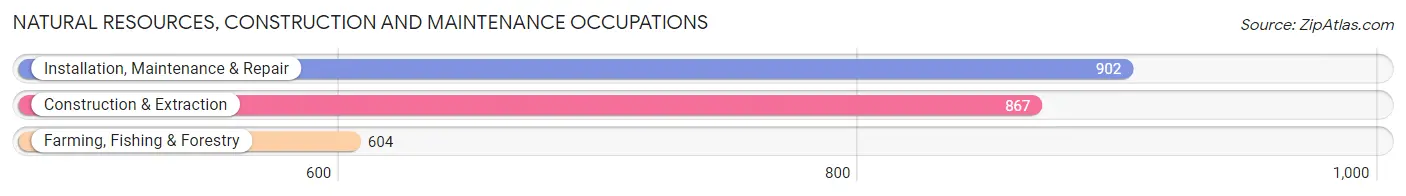
Natural Resources, Construction and Maintenance Occupations
The most common Natural Resources, Construction and Maintenance occupations in Curry County are Installation, Maintenance & Repair (902 | 4.9%), Construction & Extraction (867 | 4.7%), and Farming, Fishing & Forestry (604 | 3.3%).
Natural Resources, Construction and Maintenance Occupations by Sex
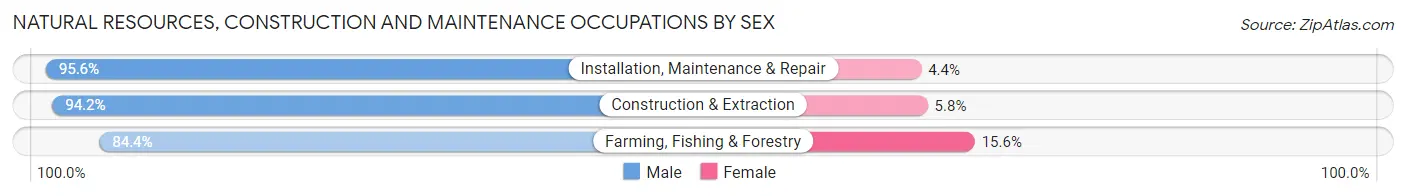
| Occupation | Male | Female |
| Farming, Fishing & Forestry | 510 (84.4%) | 94 (15.6%) |
| Construction & Extraction | 817 (94.2%) | 50 (5.8%) |
| Installation, Maintenance & Repair | 862 (95.6%) | 40 (4.4%) |
| Total (Category) | 2,189 (92.2%) | 184 (7.7%) |
| Total (Overall) | 10,119 (54.9%) | 8,318 (45.1%) |
Production, Transportation and Moving Occupations
The most common Production, Transportation and Moving occupations in Curry County are Transportation (1,460 | 7.9%), Production (875 | 4.8%), and Material Moving (718 | 3.9%).
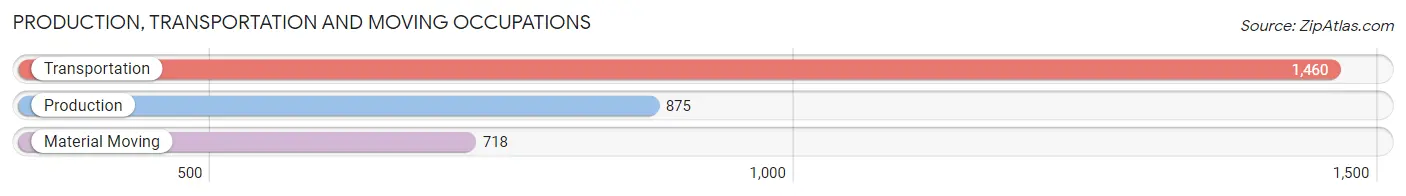
Production, Transportation and Moving Occupations by Sex
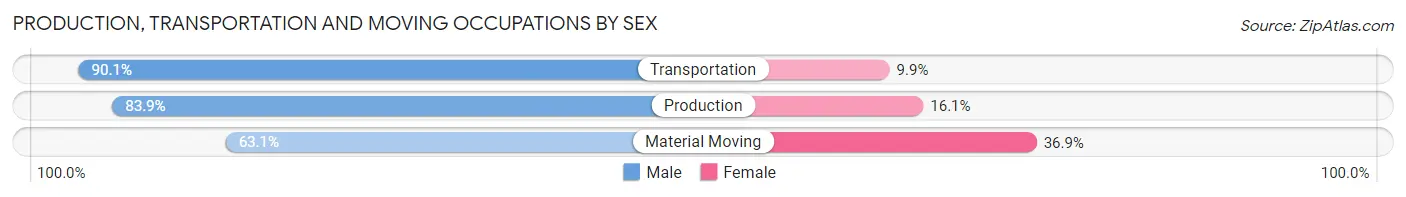
| Occupation | Male | Female |
| Production | 734 (83.9%) | 141 (16.1%) |
| Transportation | 1,315 (90.1%) | 145 (9.9%) |
| Material Moving | 453 (63.1%) | 265 (36.9%) |
| Total (Category) | 2,502 (82.0%) | 551 (18.0%) |
| Total (Overall) | 10,119 (54.9%) | 8,318 (45.1%) |
Employment Industries by Sex in Curry County
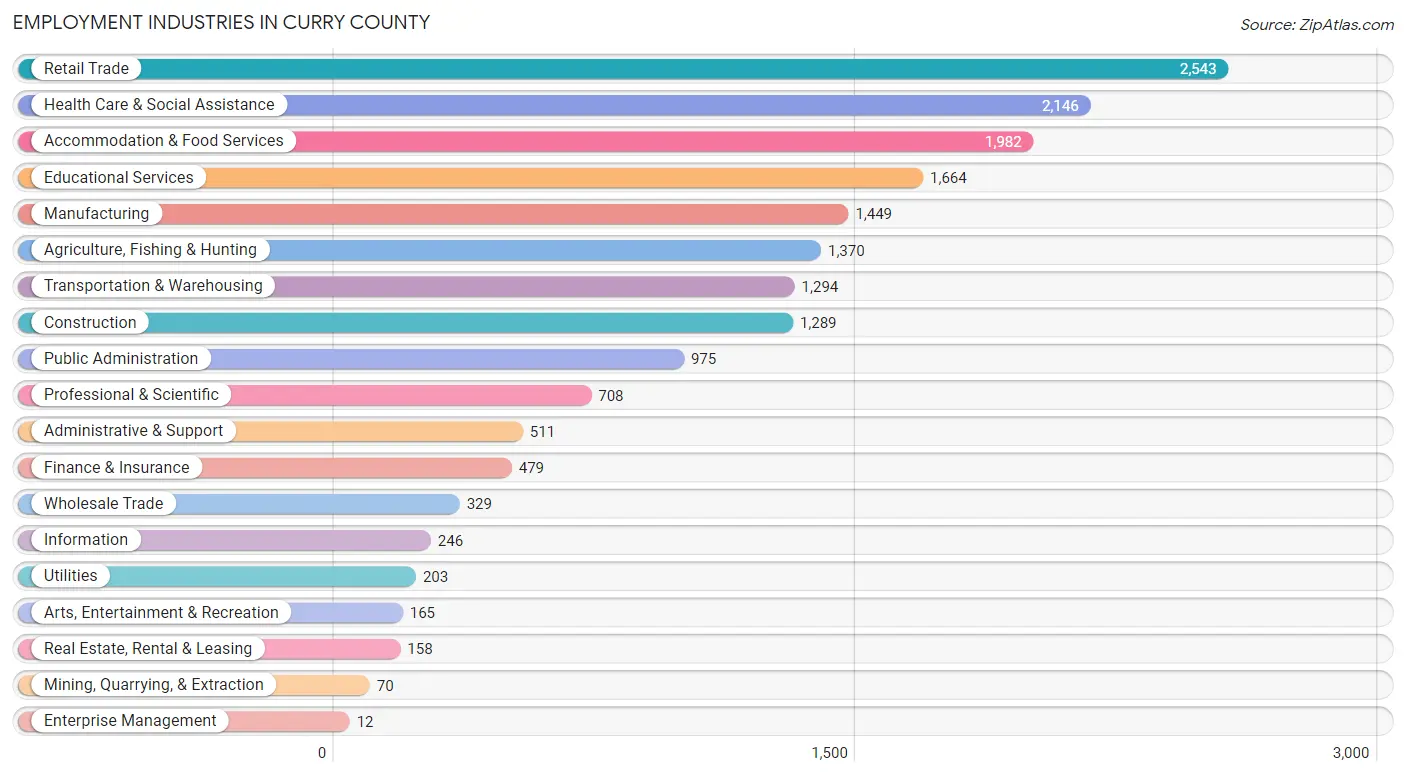
Employment Industries in Curry County
The major employment industries in Curry County include Retail Trade (2,543 | 13.8%), Health Care & Social Assistance (2,146 | 11.6%), Accommodation & Food Services (1,982 | 10.7%), Educational Services (1,664 | 9.0%), and Manufacturing (1,449 | 7.9%).
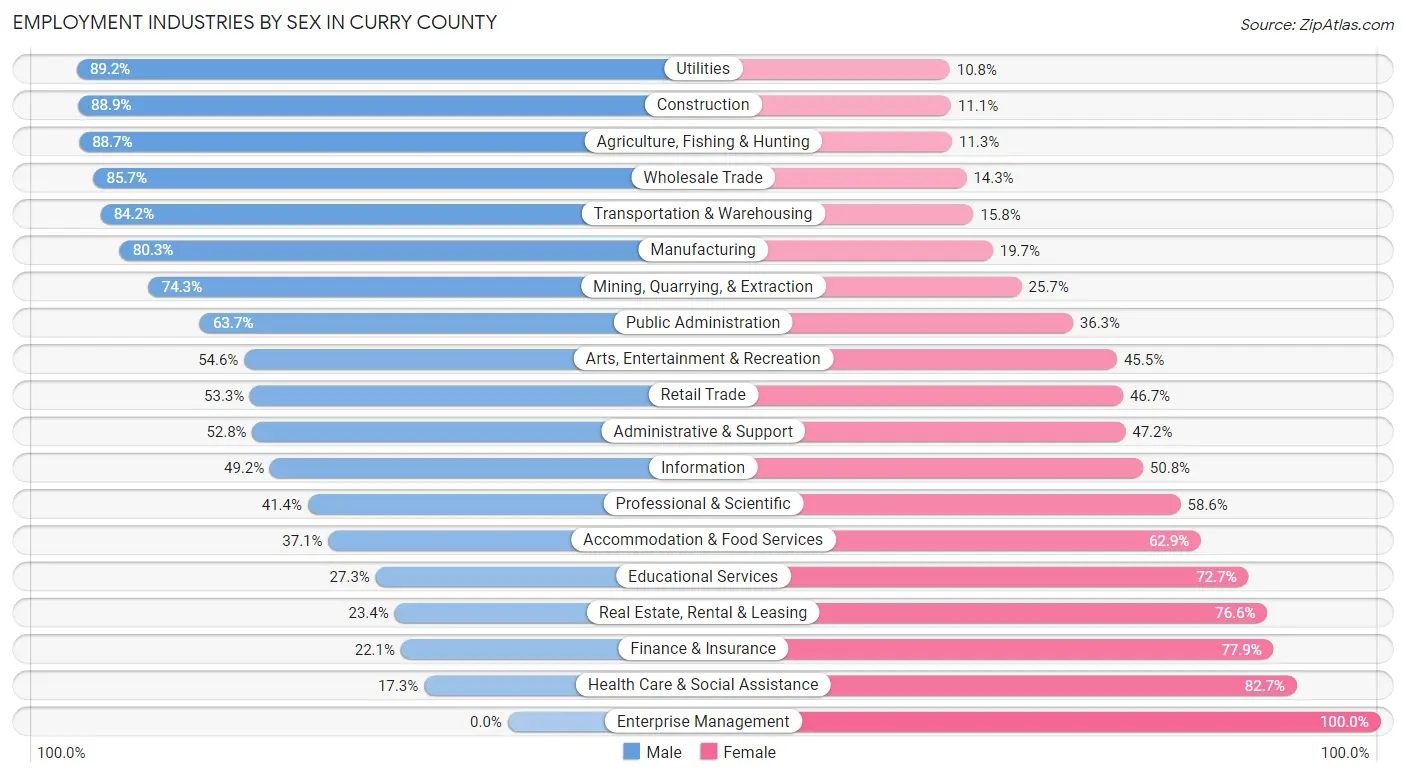
Employment Industries by Sex in Curry County
The Curry County industries that see more men than women are Utilities (89.2%), Construction (88.9%), and Agriculture, Fishing & Hunting (88.7%), whereas the industries that tend to have a higher number of women are Enterprise Management (100.0%), Health Care & Social Assistance (82.7%), and Finance & Insurance (77.9%).
| Industry | Male | Female |
| Agriculture, Fishing & Hunting | 1,215 (88.7%) | 155 (11.3%) |
| Mining, Quarrying, & Extraction | 52 (74.3%) | 18 (25.7%) |
| Construction | 1,146 (88.9%) | 143 (11.1%) |
| Manufacturing | 1,163 (80.3%) | 286 (19.7%) |
| Wholesale Trade | 282 (85.7%) | 47 (14.3%) |
| Retail Trade | 1,356 (53.3%) | 1,187 (46.7%) |
| Transportation & Warehousing | 1,090 (84.2%) | 204 (15.8%) |
| Utilities | 181 (89.2%) | 22 (10.8%) |
| Information | 121 (49.2%) | 125 (50.8%) |
| Finance & Insurance | 106 (22.1%) | 373 (77.9%) |
| Real Estate, Rental & Leasing | 37 (23.4%) | 121 (76.6%) |
| Professional & Scientific | 293 (41.4%) | 415 (58.6%) |
| Enterprise Management | 0 (0.0%) | 12 (100.0%) |
| Administrative & Support | 270 (52.8%) | 241 (47.2%) |
| Educational Services | 455 (27.3%) | 1,209 (72.7%) |
| Health Care & Social Assistance | 372 (17.3%) | 1,774 (82.7%) |
| Arts, Entertainment & Recreation | 90 (54.5%) | 75 (45.5%) |
| Accommodation & Food Services | 736 (37.1%) | 1,246 (62.9%) |
| Public Administration | 621 (63.7%) | 354 (36.3%) |
| Total | 10,119 (54.9%) | 8,318 (45.1%) |
Education in Curry County
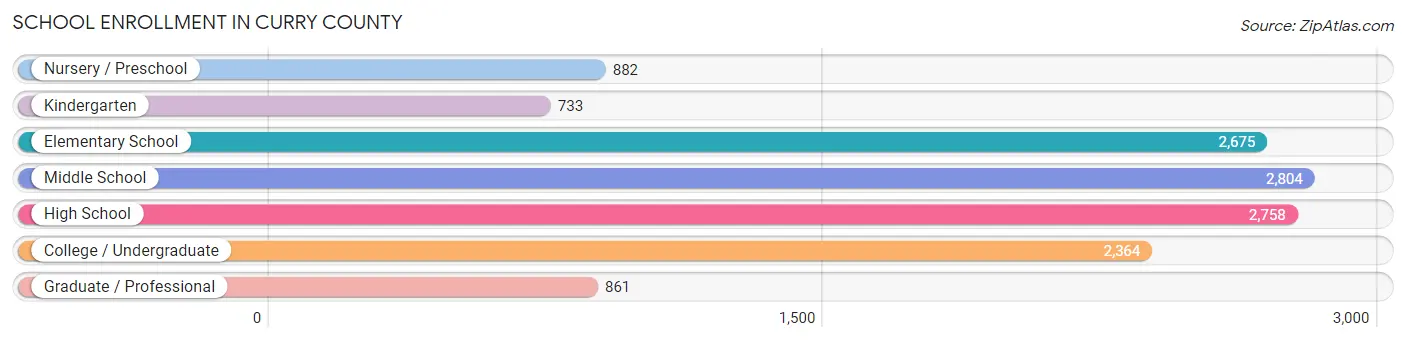
School Enrollment in Curry County
The most common levels of schooling among the 13,077 students in Curry County are middle school (2,804 | 21.4%), high school (2,758 | 21.1%), and elementary school (2,675 | 20.5%).
| School Level | # Students | % Students |
| Nursery / Preschool | 882 | 6.7% |
| Kindergarten | 733 | 5.6% |
| Elementary School | 2,675 | 20.5% |
| Middle School | 2,804 | 21.4% |
| High School | 2,758 | 21.1% |
| College / Undergraduate | 2,364 | 18.1% |
| Graduate / Professional | 861 | 6.6% |
| Total | 13,077 | 100.0% |
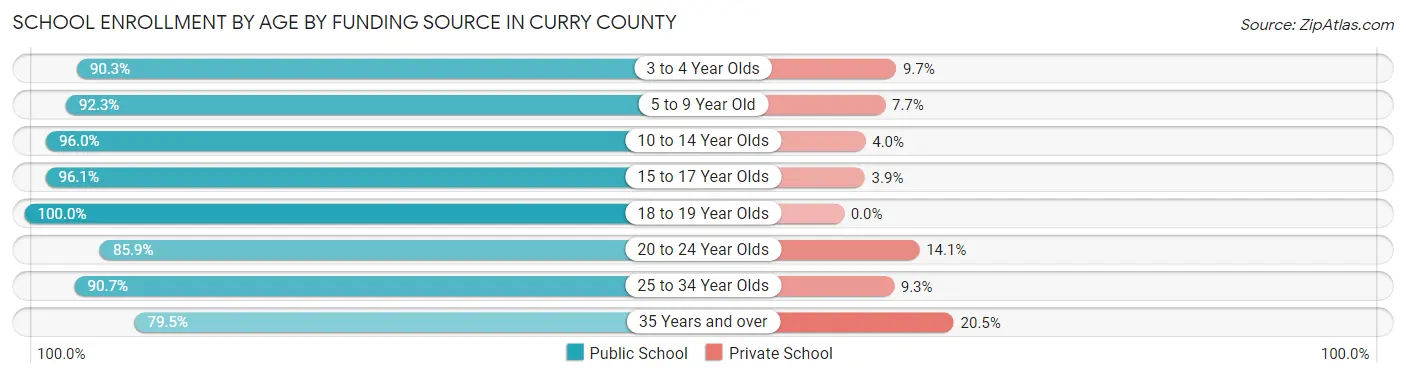
School Enrollment by Age by Funding Source in Curry County
Out of a total of 13,077 students who are enrolled in schools in Curry County, 955 (7.3%) attend a private institution, while the remaining 12,122 (92.7%) are enrolled in public schools. The age group of 35 years and over has the highest likelihood of being enrolled in private schools, with 180 (20.5% in the age bracket) enrolled. Conversely, the age group of 18 to 19 year olds has the lowest likelihood of being enrolled in a private school, with 643 (100.0% in the age bracket) attending a public institution.
| Age Bracket | Public School | Private School |
| 3 to 4 Year Olds | 751 (90.3%) | 81 (9.7%) |
| 5 to 9 Year Old | 2,815 (92.3%) | 235 (7.7%) |
| 10 to 14 Year Olds | 3,578 (96.0%) | 150 (4.0%) |
| 15 to 17 Year Olds | 1,719 (96.1%) | 70 (3.9%) |
| 18 to 19 Year Olds | 643 (100.0%) | 0 (0.0%) |
| 20 to 24 Year Olds | 757 (85.9%) | 124 (14.1%) |
| 25 to 34 Year Olds | 1,156 (90.7%) | 119 (9.3%) |
| 35 Years and over | 699 (79.5%) | 180 (20.5%) |
| Total | 12,122 (92.7%) | 955 (7.3%) |
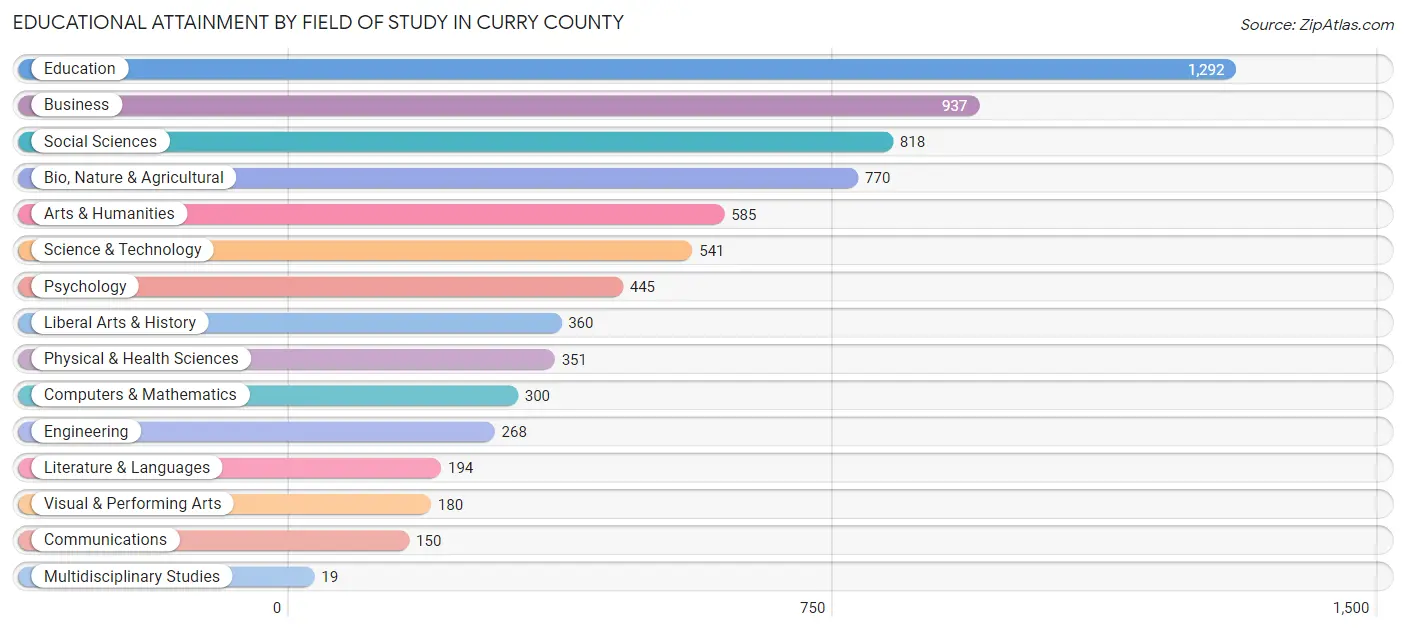
Educational Attainment by Field of Study in Curry County
Education (1,292 | 17.9%), business (937 | 13.0%), social sciences (818 | 11.4%), bio, nature & agricultural (770 | 10.7%), and arts & humanities (585 | 8.1%) are the most common fields of study among 7,210 individuals in Curry County who have obtained a bachelor's degree or higher.
| Field of Study | # Graduates | % Graduates |
| Computers & Mathematics | 300 | 4.2% |
| Bio, Nature & Agricultural | 770 | 10.7% |
| Physical & Health Sciences | 351 | 4.9% |
| Psychology | 445 | 6.2% |
| Social Sciences | 818 | 11.4% |
| Engineering | 268 | 3.7% |
| Multidisciplinary Studies | 19 | 0.3% |
| Science & Technology | 541 | 7.5% |
| Business | 937 | 13.0% |
| Education | 1,292 | 17.9% |
| Literature & Languages | 194 | 2.7% |
| Liberal Arts & History | 360 | 5.0% |
| Visual & Performing Arts | 180 | 2.5% |
| Communications | 150 | 2.1% |
| Arts & Humanities | 585 | 8.1% |
| Total | 7,210 | 100.0% |
Transportation & Commute in Curry County
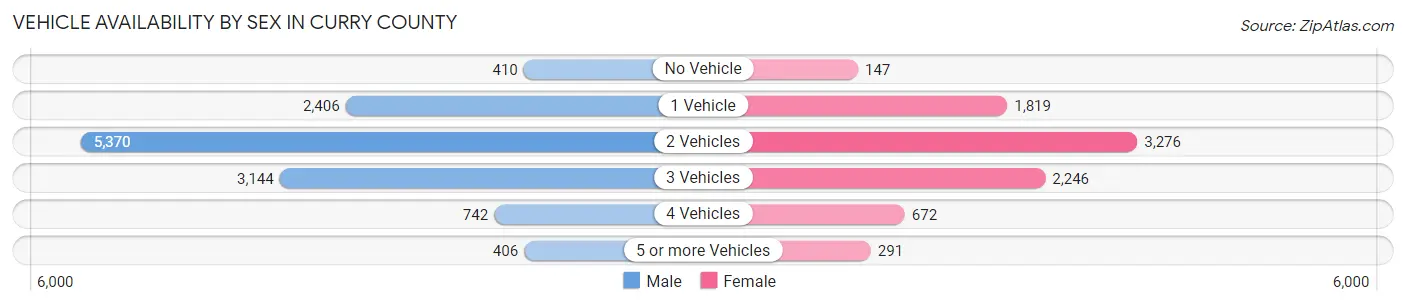
Vehicle Availability by Sex in Curry County
The most prevalent vehicle ownership categories in Curry County are males with 2 vehicles (5,370, accounting for 43.0%) and females with 2 vehicles (3,276, making up 63.5%).
| Vehicles Available | Male | Female |
| No Vehicle | 410 (3.3%) | 147 (1.7%) |
| 1 Vehicle | 2,406 (19.3%) | 1,819 (21.5%) |
| 2 Vehicles | 5,370 (43.0%) | 3,276 (38.8%) |
| 3 Vehicles | 3,144 (25.2%) | 2,246 (26.6%) |
| 4 Vehicles | 742 (5.9%) | 672 (8.0%) |
| 5 or more Vehicles | 406 (3.3%) | 291 (3.4%) |
| Total | 12,478 (100.0%) | 8,451 (100.0%) |
Commute Time in Curry County
The most frequently occuring commute durations in Curry County are 10 to 14 minutes (5,127 commuters, 24.4%), 5 to 9 minutes (4,448 commuters, 21.2%), and 15 to 19 minutes (3,068 commuters, 14.6%).
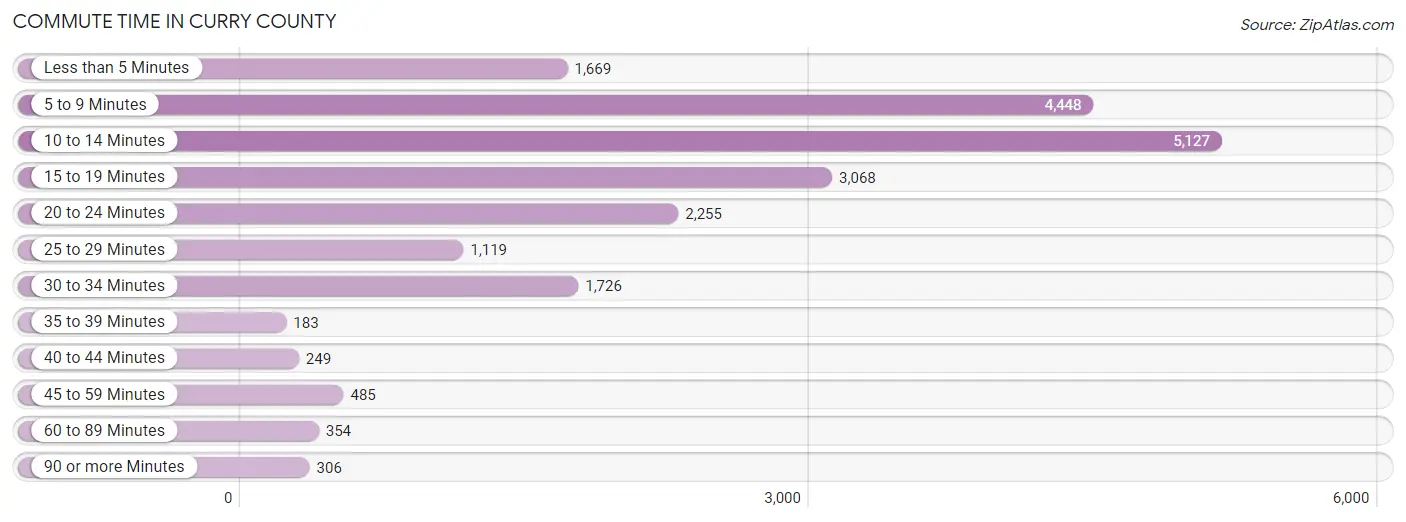
| Commute Time | # Commuters | % Commuters |
| Less than 5 Minutes | 1,669 | 8.0% |
| 5 to 9 Minutes | 4,448 | 21.2% |
| 10 to 14 Minutes | 5,127 | 24.4% |
| 15 to 19 Minutes | 3,068 | 14.6% |
| 20 to 24 Minutes | 2,255 | 10.7% |
| 25 to 29 Minutes | 1,119 | 5.3% |
| 30 to 34 Minutes | 1,726 | 8.2% |
| 35 to 39 Minutes | 183 | 0.9% |
| 40 to 44 Minutes | 249 | 1.2% |
| 45 to 59 Minutes | 485 | 2.3% |
| 60 to 89 Minutes | 354 | 1.7% |
| 90 or more Minutes | 306 | 1.5% |
Commute Time by Sex in Curry County
The most common commute times in Curry County are 10 to 14 minutes (2,755 commuters, 21.4%) for males and 10 to 14 minutes (2,372 commuters, 29.2%) for females.
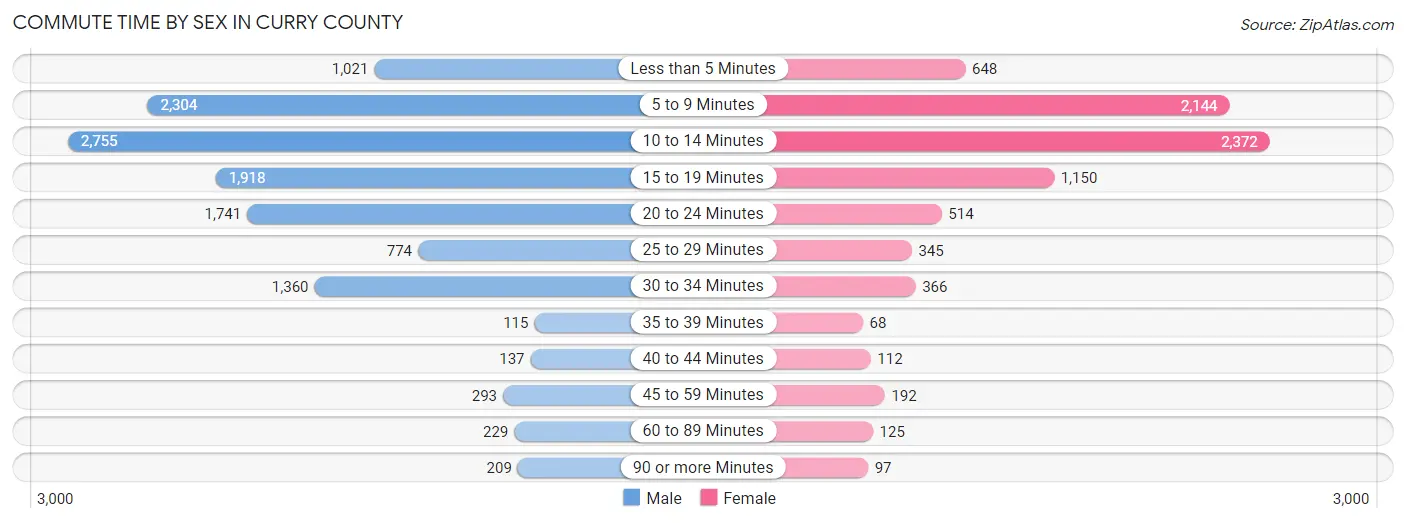
| Commute Time | Male | Female |
| Less than 5 Minutes | 1,021 (7.9%) | 648 (8.0%) |
| 5 to 9 Minutes | 2,304 (17.9%) | 2,144 (26.4%) |
| 10 to 14 Minutes | 2,755 (21.4%) | 2,372 (29.2%) |
| 15 to 19 Minutes | 1,918 (14.9%) | 1,150 (14.1%) |
| 20 to 24 Minutes | 1,741 (13.5%) | 514 (6.3%) |
| 25 to 29 Minutes | 774 (6.0%) | 345 (4.2%) |
| 30 to 34 Minutes | 1,360 (10.6%) | 366 (4.5%) |
| 35 to 39 Minutes | 115 (0.9%) | 68 (0.8%) |
| 40 to 44 Minutes | 137 (1.1%) | 112 (1.4%) |
| 45 to 59 Minutes | 293 (2.3%) | 192 (2.4%) |
| 60 to 89 Minutes | 229 (1.8%) | 125 (1.5%) |
| 90 or more Minutes | 209 (1.6%) | 97 (1.2%) |
Time of Departure to Work by Sex in Curry County
The most frequent times of departure to work in Curry County are 7:00 AM to 7:29 AM (2,377, 18.5%) for males and 7:30 AM to 7:59 AM (2,071, 25.5%) for females.
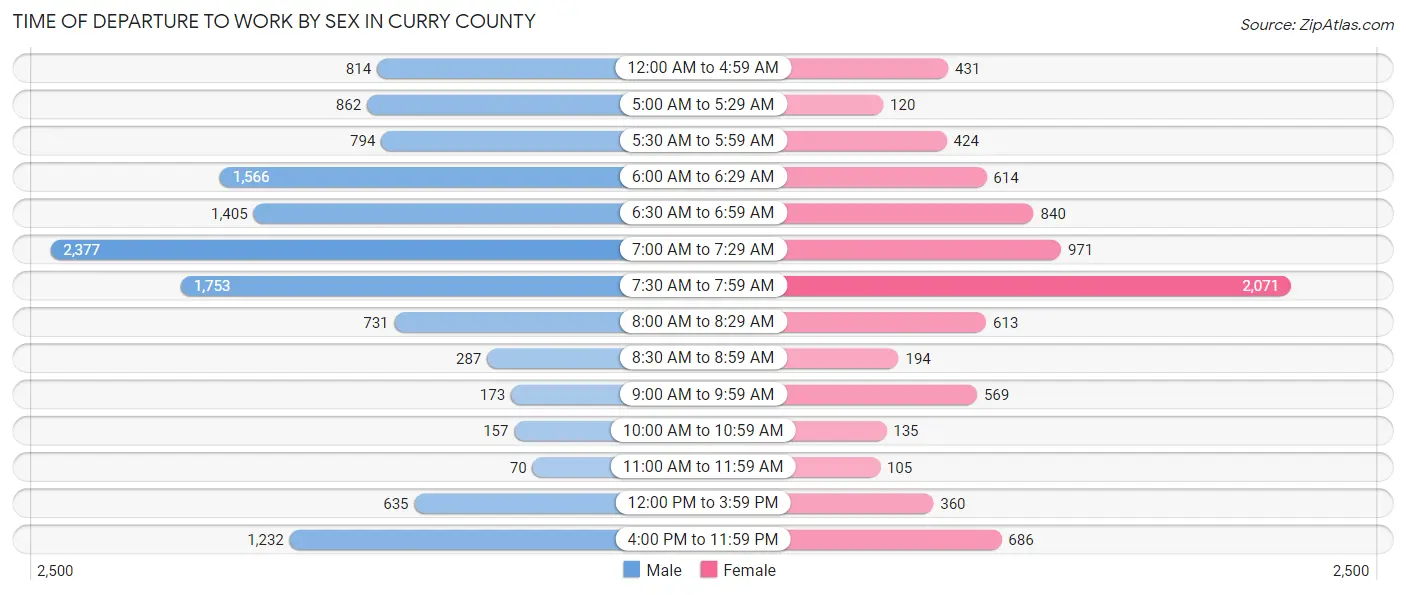
| Time of Departure | Male | Female |
| 12:00 AM to 4:59 AM | 814 (6.3%) | 431 (5.3%) |
| 5:00 AM to 5:29 AM | 862 (6.7%) | 120 (1.5%) |
| 5:30 AM to 5:59 AM | 794 (6.2%) | 424 (5.2%) |
| 6:00 AM to 6:29 AM | 1,566 (12.2%) | 614 (7.5%) |
| 6:30 AM to 6:59 AM | 1,405 (10.9%) | 840 (10.3%) |
| 7:00 AM to 7:29 AM | 2,377 (18.5%) | 971 (11.9%) |
| 7:30 AM to 7:59 AM | 1,753 (13.6%) | 2,071 (25.5%) |
| 8:00 AM to 8:29 AM | 731 (5.7%) | 613 (7.5%) |
| 8:30 AM to 8:59 AM | 287 (2.2%) | 194 (2.4%) |
| 9:00 AM to 9:59 AM | 173 (1.3%) | 569 (7.0%) |
| 10:00 AM to 10:59 AM | 157 (1.2%) | 135 (1.7%) |
| 11:00 AM to 11:59 AM | 70 (0.5%) | 105 (1.3%) |
| 12:00 PM to 3:59 PM | 635 (4.9%) | 360 (4.4%) |
| 4:00 PM to 11:59 PM | 1,232 (9.6%) | 686 (8.4%) |
| Total | 12,856 (100.0%) | 8,133 (100.0%) |
Housing Occupancy in Curry County
Occupancy by Ownership in Curry County
Of the total 18,535 dwellings in Curry County, owner-occupied units account for 10,999 (59.3%), while renter-occupied units make up 7,536 (40.7%).
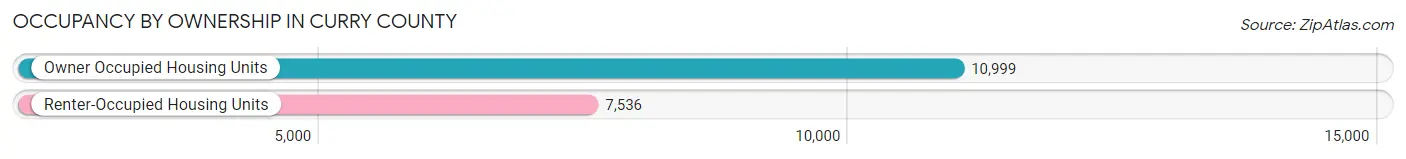
| Occupancy | # Housing Units | % Housing Units |
| Owner Occupied Housing Units | 10,999 | 59.3% |
| Renter-Occupied Housing Units | 7,536 | 40.7% |
| Total Occupied Housing Units | 18,535 | 100.0% |
Occupancy by Household Size in Curry County
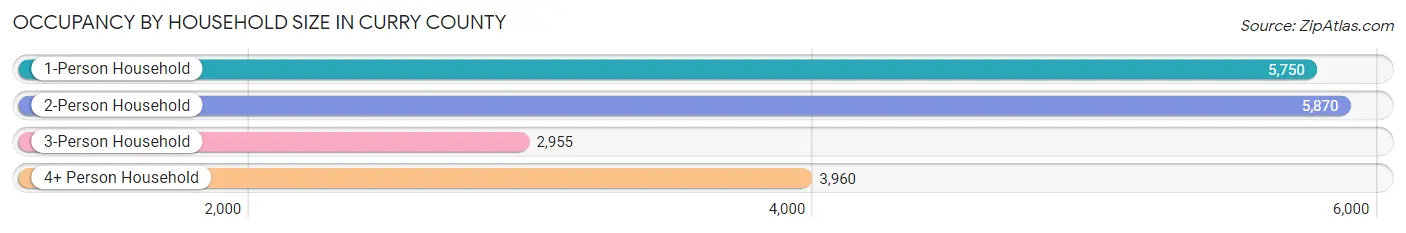
| Household Size | # Housing Units | % Housing Units |
| 1-Person Household | 5,750 | 31.0% |
| 2-Person Household | 5,870 | 31.7% |
| 3-Person Household | 2,955 | 15.9% |
| 4+ Person Household | 3,960 | 21.4% |
| Total Housing Units | 18,535 | 100.0% |
Occupancy by Ownership by Household Size in Curry County
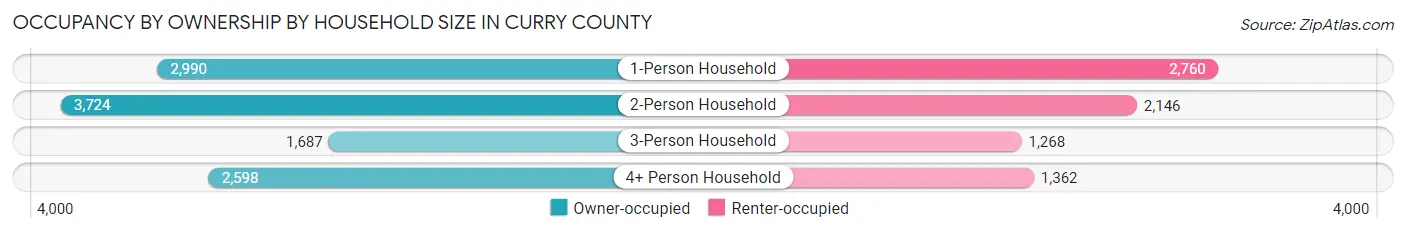
| Household Size | Owner-occupied | Renter-occupied |
| 1-Person Household | 2,990 (52.0%) | 2,760 (48.0%) |
| 2-Person Household | 3,724 (63.4%) | 2,146 (36.6%) |
| 3-Person Household | 1,687 (57.1%) | 1,268 (42.9%) |
| 4+ Person Household | 2,598 (65.6%) | 1,362 (34.4%) |
| Total Housing Units | 10,999 (59.3%) | 7,536 (40.7%) |
Occupancy by Educational Attainment in Curry County
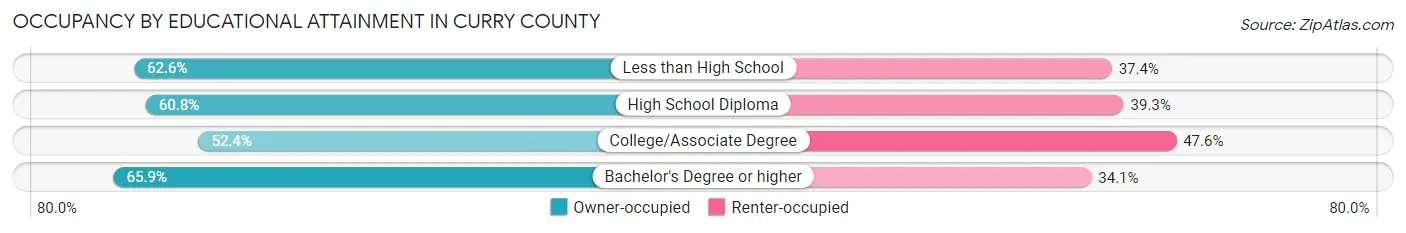
| Household Size | Owner-occupied | Renter-occupied |
| Less than High School | 1,990 (62.6%) | 1,187 (37.4%) |
| High School Diploma | 2,766 (60.8%) | 1,787 (39.3%) |
| College/Associate Degree | 3,404 (52.4%) | 3,091 (47.6%) |
| Bachelor's Degree or higher | 2,839 (65.9%) | 1,471 (34.1%) |
Occupancy by Age of Householder in Curry County
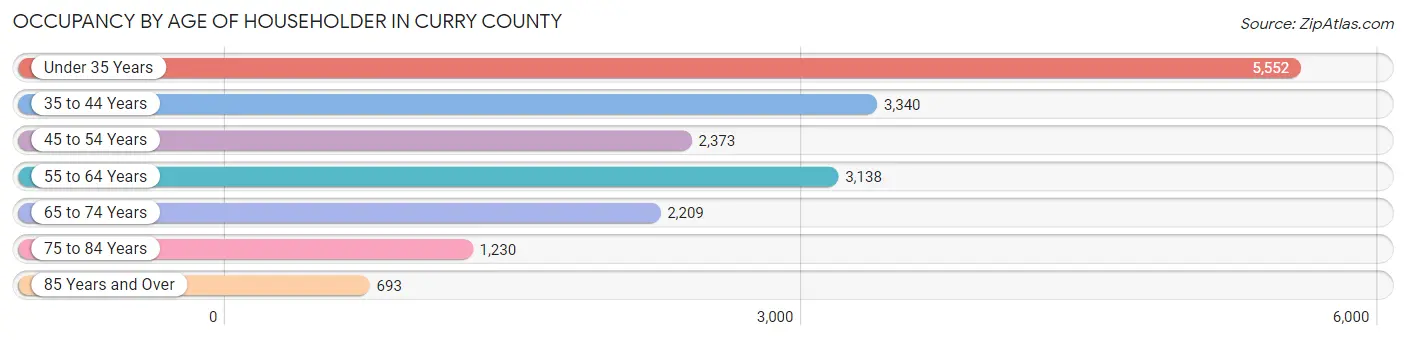
| Age Bracket | # Households | % Households |
| Under 35 Years | 5,552 | 29.9% |
| 35 to 44 Years | 3,340 | 18.0% |
| 45 to 54 Years | 2,373 | 12.8% |
| 55 to 64 Years | 3,138 | 16.9% |
| 65 to 74 Years | 2,209 | 11.9% |
| 75 to 84 Years | 1,230 | 6.6% |
| 85 Years and Over | 693 | 3.7% |
| Total | 18,535 | 100.0% |
Housing Finances in Curry County
Median Income by Occupancy in Curry County
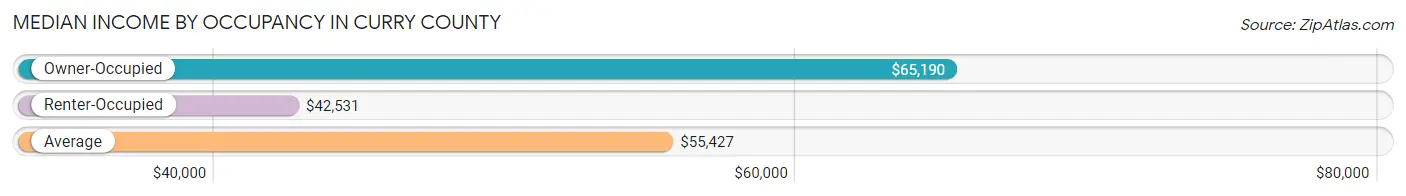
| Occupancy Type | # Households | Median Income |
| Owner-Occupied | 10,999 (59.3%) | $65,190 |
| Renter-Occupied | 7,536 (40.7%) | $42,531 |
| Average | 18,535 (100.0%) | $55,427 |
Occupancy by Householder Income Bracket in Curry County
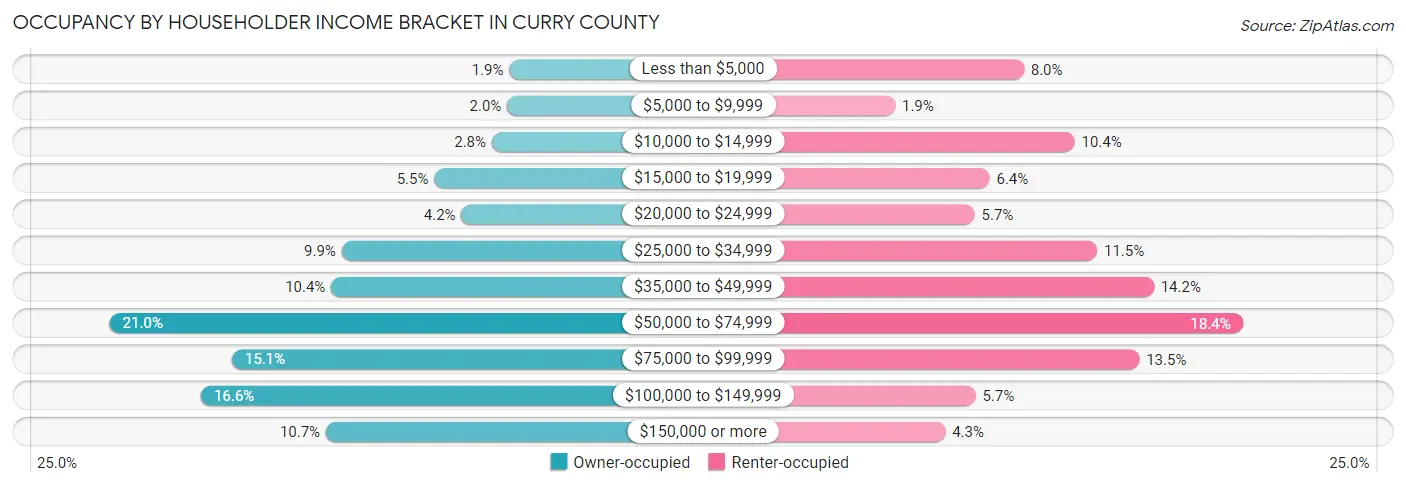
| Income Bracket | Owner-occupied | Renter-occupied |
| Less than $5,000 | 211 (1.9%) | 604 (8.0%) |
| $5,000 to $9,999 | 222 (2.0%) | 142 (1.9%) |
| $10,000 to $14,999 | 302 (2.8%) | 786 (10.4%) |
| $15,000 to $19,999 | 604 (5.5%) | 481 (6.4%) |
| $20,000 to $24,999 | 462 (4.2%) | 427 (5.7%) |
| $25,000 to $34,999 | 1,089 (9.9%) | 867 (11.5%) |
| $35,000 to $49,999 | 1,144 (10.4%) | 1,070 (14.2%) |
| $50,000 to $74,999 | 2,304 (20.9%) | 1,389 (18.4%) |
| $75,000 to $99,999 | 1,664 (15.1%) | 1,018 (13.5%) |
| $100,000 to $149,999 | 1,826 (16.6%) | 430 (5.7%) |
| $150,000 or more | 1,171 (10.6%) | 322 (4.3%) |
| Total | 10,999 (100.0%) | 7,536 (100.0%) |
Monthly Housing Cost Tiers in Curry County
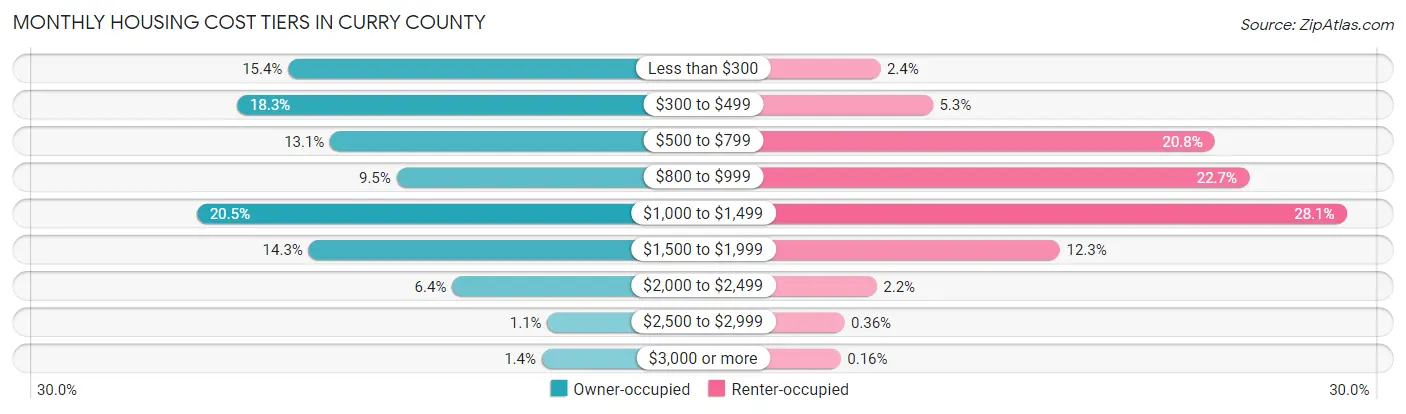
| Monthly Cost | Owner-occupied | Renter-occupied |
| Less than $300 | 1,698 (15.4%) | 177 (2.4%) |
| $300 to $499 | 2,009 (18.3%) | 396 (5.2%) |
| $500 to $799 | 1,443 (13.1%) | 1,570 (20.8%) |
| $800 to $999 | 1,039 (9.5%) | 1,712 (22.7%) |
| $1,000 to $1,499 | 2,254 (20.5%) | 2,118 (28.1%) |
| $1,500 to $1,999 | 1,574 (14.3%) | 925 (12.3%) |
| $2,000 to $2,499 | 702 (6.4%) | 162 (2.1%) |
| $2,500 to $2,999 | 123 (1.1%) | 27 (0.4%) |
| $3,000 or more | 157 (1.4%) | 12 (0.2%) |
| Total | 10,999 (100.0%) | 7,536 (100.0%) |
Physical Housing Characteristics in Curry County
Housing Structures in Curry County
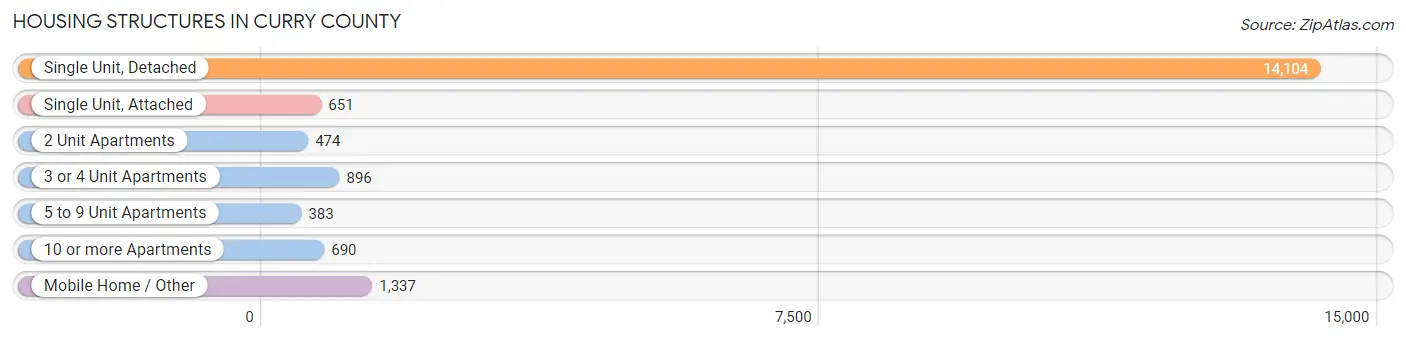
| Structure Type | # Housing Units | % Housing Units |
| Single Unit, Detached | 14,104 | 76.1% |
| Single Unit, Attached | 651 | 3.5% |
| 2 Unit Apartments | 474 | 2.6% |
| 3 or 4 Unit Apartments | 896 | 4.8% |
| 5 to 9 Unit Apartments | 383 | 2.1% |
| 10 or more Apartments | 690 | 3.7% |
| Mobile Home / Other | 1,337 | 7.2% |
| Total | 18,535 | 100.0% |
Housing Structures by Occupancy in Curry County
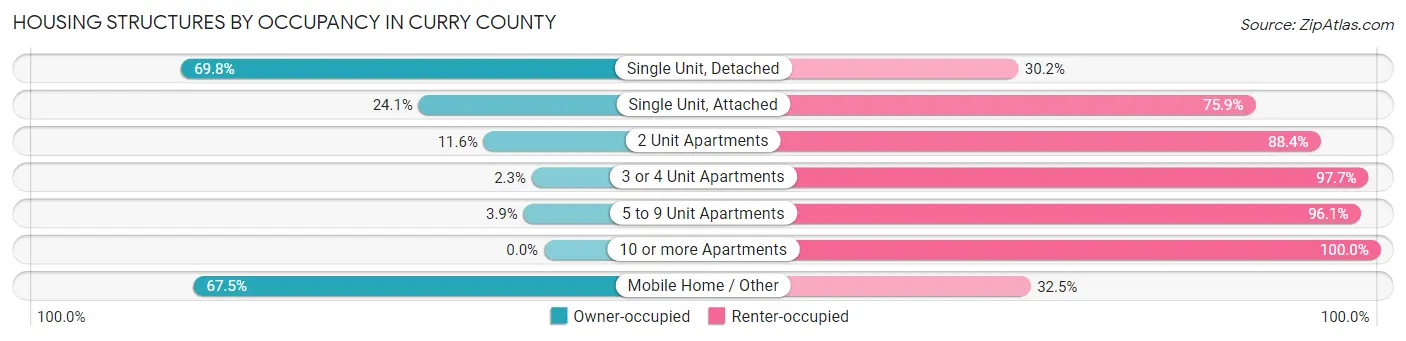
| Structure Type | Owner-occupied | Renter-occupied |
| Single Unit, Detached | 9,849 (69.8%) | 4,255 (30.2%) |
| Single Unit, Attached | 157 (24.1%) | 494 (75.9%) |
| 2 Unit Apartments | 55 (11.6%) | 419 (88.4%) |
| 3 or 4 Unit Apartments | 21 (2.3%) | 875 (97.7%) |
| 5 to 9 Unit Apartments | 15 (3.9%) | 368 (96.1%) |
| 10 or more Apartments | 0 (0.0%) | 690 (100.0%) |
| Mobile Home / Other | 902 (67.5%) | 435 (32.5%) |
| Total | 10,999 (59.3%) | 7,536 (40.7%) |
Housing Structures by Number of Rooms in Curry County
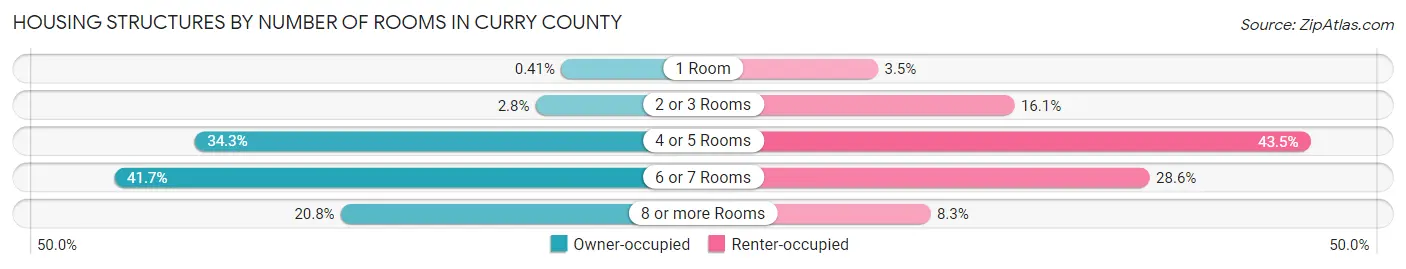
| Number of Rooms | Owner-occupied | Renter-occupied |
| 1 Room | 45 (0.4%) | 262 (3.5%) |
| 2 or 3 Rooms | 305 (2.8%) | 1,213 (16.1%) |
| 4 or 5 Rooms | 3,773 (34.3%) | 3,278 (43.5%) |
| 6 or 7 Rooms | 4,589 (41.7%) | 2,155 (28.6%) |
| 8 or more Rooms | 2,287 (20.8%) | 628 (8.3%) |
| Total | 10,999 (100.0%) | 7,536 (100.0%) |
Housing Structure by Heating Type in Curry County
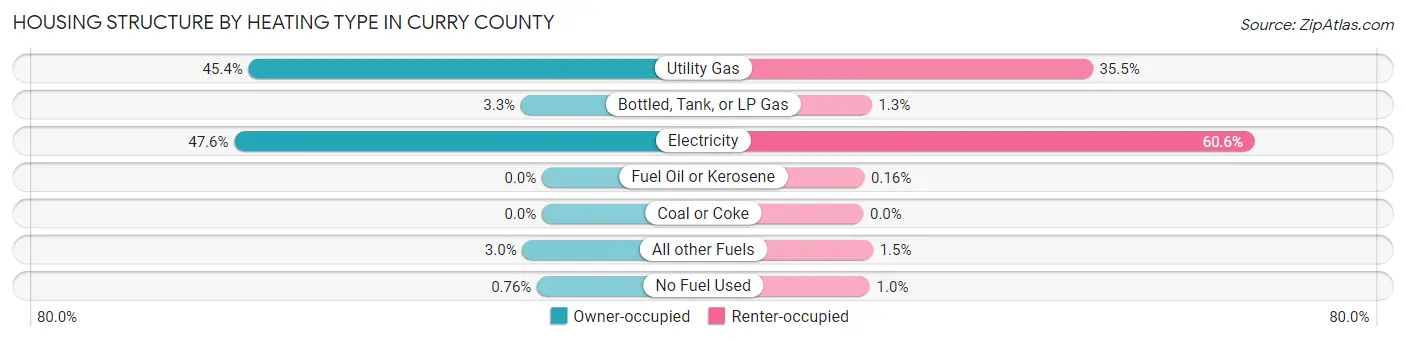
| Heating Type | Owner-occupied | Renter-occupied |
| Utility Gas | 4,989 (45.4%) | 2,673 (35.5%) |
| Bottled, Tank, or LP Gas | 360 (3.3%) | 98 (1.3%) |
| Electricity | 5,233 (47.6%) | 4,564 (60.6%) |
| Fuel Oil or Kerosene | 0 (0.0%) | 12 (0.2%) |
| Coal or Coke | 0 (0.0%) | 0 (0.0%) |
| All other Fuels | 333 (3.0%) | 112 (1.5%) |
| No Fuel Used | 84 (0.8%) | 77 (1.0%) |
| Total | 10,999 (100.0%) | 7,536 (100.0%) |
Household Vehicle Usage in Curry County
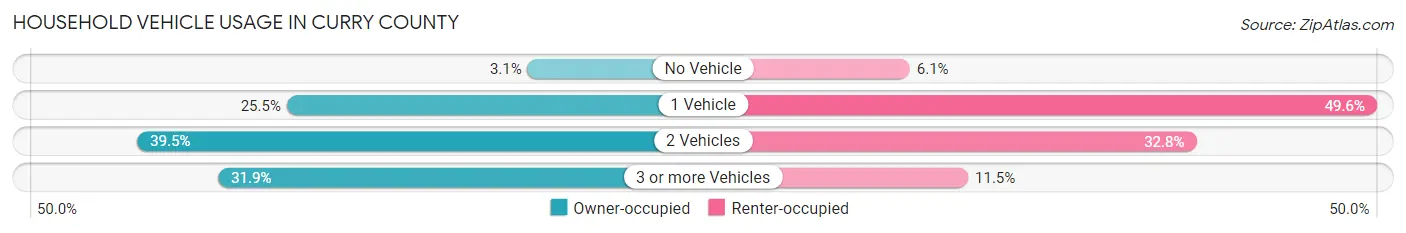
| Vehicles per Household | Owner-occupied | Renter-occupied |
| No Vehicle | 336 (3.0%) | 457 (6.1%) |
| 1 Vehicle | 2,808 (25.5%) | 3,741 (49.6%) |
| 2 Vehicles | 4,343 (39.5%) | 2,471 (32.8%) |
| 3 or more Vehicles | 3,512 (31.9%) | 867 (11.5%) |
| Total | 10,999 (100.0%) | 7,536 (100.0%) |
Real Estate & Mortgages in Curry County
Real Estate and Mortgage Overview in Curry County
| Characteristic | Without Mortgage | With Mortgage |
| Housing Units | 4,728 | 6,271 |
| Median Property Value | $108,100 | $184,600 |
| Median Household Income | $49,598 | $924 |
| Monthly Housing Costs | $368 | $157 |
| Real Estate Taxes | $499 | $300 |
Property Value by Mortgage Status in Curry County
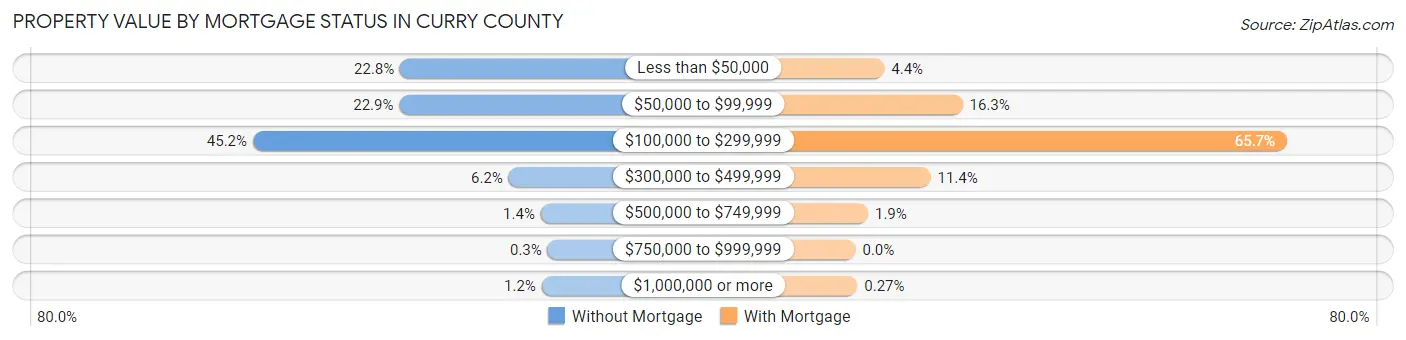
| Property Value | Without Mortgage | With Mortgage |
| Less than $50,000 | 1,077 (22.8%) | 275 (4.4%) |
| $50,000 to $99,999 | 1,083 (22.9%) | 1,022 (16.3%) |
| $100,000 to $299,999 | 2,138 (45.2%) | 4,121 (65.7%) |
| $300,000 to $499,999 | 295 (6.2%) | 717 (11.4%) |
| $500,000 to $749,999 | 64 (1.3%) | 119 (1.9%) |
| $750,000 to $999,999 | 14 (0.3%) | 0 (0.0%) |
| $1,000,000 or more | 57 (1.2%) | 17 (0.3%) |
| Total | 4,728 (100.0%) | 6,271 (100.0%) |
Household Income by Mortgage Status in Curry County
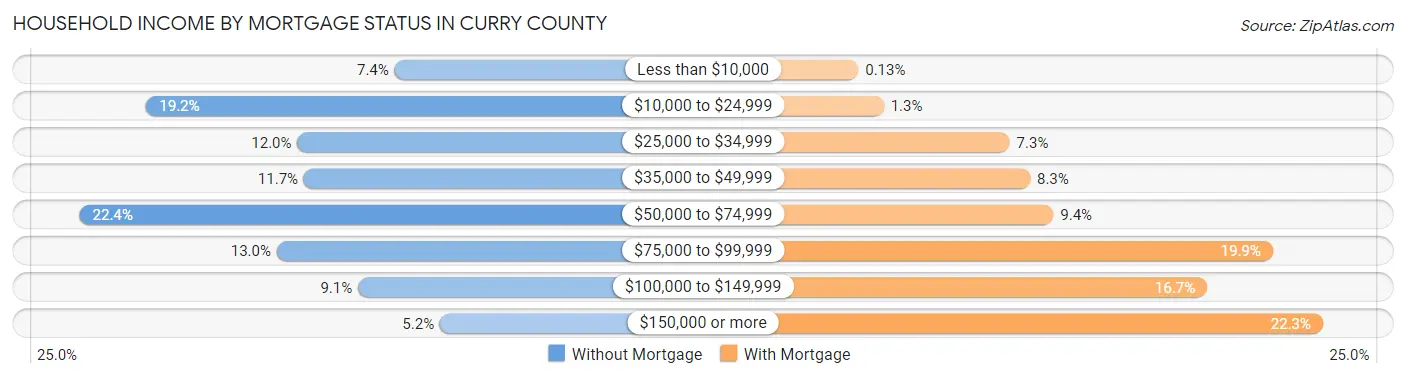
| Household Income | Without Mortgage | With Mortgage |
| Less than $10,000 | 349 (7.4%) | 8 (0.1%) |
| $10,000 to $24,999 | 908 (19.2%) | 84 (1.3%) |
| $25,000 to $34,999 | 568 (12.0%) | 460 (7.3%) |
| $35,000 to $49,999 | 553 (11.7%) | 521 (8.3%) |
| $50,000 to $74,999 | 1,058 (22.4%) | 591 (9.4%) |
| $75,000 to $99,999 | 614 (13.0%) | 1,246 (19.9%) |
| $100,000 to $149,999 | 431 (9.1%) | 1,050 (16.7%) |
| $150,000 or more | 247 (5.2%) | 1,395 (22.3%) |
| Total | 4,728 (100.0%) | 6,271 (100.0%) |
Property Value to Household Income Ratio in Curry County
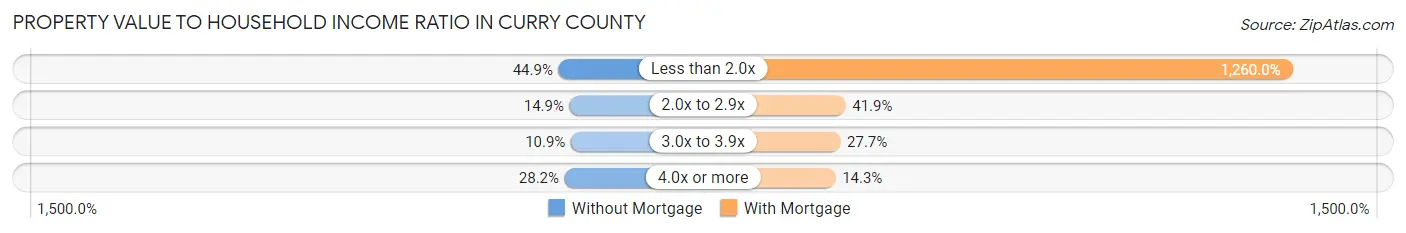
| Value-to-Income Ratio | Without Mortgage | With Mortgage |
| Less than 2.0x | 2,121 (44.9%) | 79,016 (1,260.0%) |
| 2.0x to 2.9x | 702 (14.8%) | 2,628 (41.9%) |
| 3.0x to 3.9x | 516 (10.9%) | 1,737 (27.7%) |
| 4.0x or more | 1,334 (28.2%) | 898 (14.3%) |
| Total | 4,728 (100.0%) | 6,271 (100.0%) |
Real Estate Taxes by Mortgage Status in Curry County
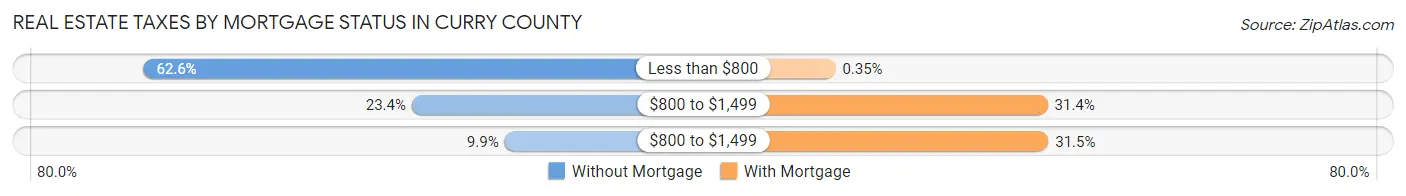
| Property Taxes | Without Mortgage | With Mortgage |
| Less than $800 | 2,961 (62.6%) | 22 (0.4%) |
| $800 to $1,499 | 1,108 (23.4%) | 1,966 (31.4%) |
| $800 to $1,499 | 467 (9.9%) | 1,972 (31.5%) |
| Total | 4,728 (100.0%) | 6,271 (100.0%) |
Health & Disability in Curry County
Health Insurance Coverage by Age in Curry County
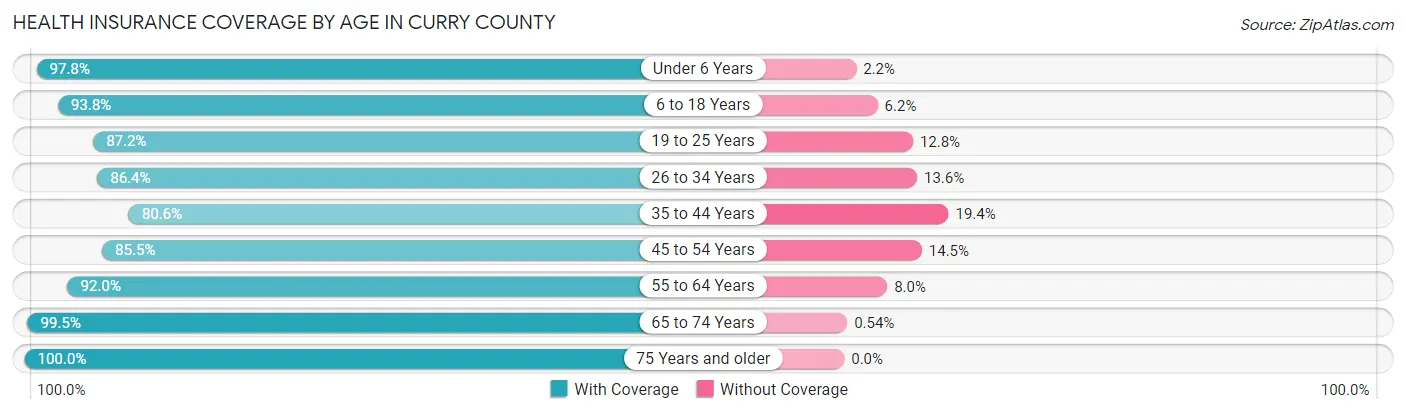
| Age Bracket | With Coverage | Without Coverage |
| Under 6 Years | 4,472 (97.8%) | 102 (2.2%) |
| 6 to 18 Years | 8,312 (93.8%) | 551 (6.2%) |
| 19 to 25 Years | 3,848 (87.2%) | 565 (12.8%) |
| 26 to 34 Years | 5,064 (86.4%) | 795 (13.6%) |
| 35 to 44 Years | 4,180 (80.6%) | 1,009 (19.4%) |
| 45 to 54 Years | 3,830 (85.5%) | 648 (14.5%) |
| 55 to 64 Years | 4,634 (92.0%) | 403 (8.0%) |
| 65 to 74 Years | 3,481 (99.5%) | 19 (0.5%) |
| 75 Years and older | 2,542 (100.0%) | 0 (0.0%) |
| Total | 40,363 (90.8%) | 4,092 (9.2%) |
Health Insurance Coverage by Citizenship Status in Curry County
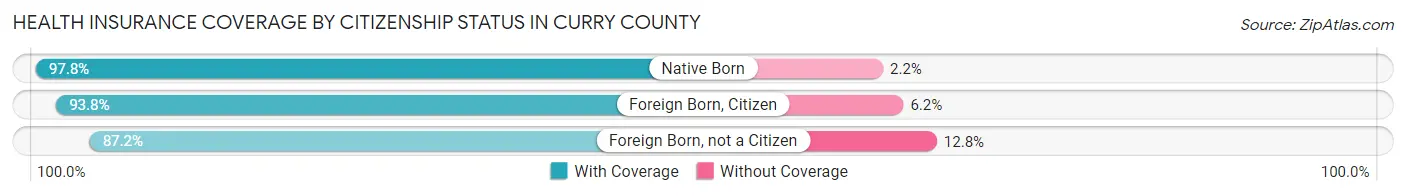
| Citizenship Status | With Coverage | Without Coverage |
| Native Born | 4,472 (97.8%) | 102 (2.2%) |
| Foreign Born, Citizen | 8,312 (93.8%) | 551 (6.2%) |
| Foreign Born, not a Citizen | 3,848 (87.2%) | 565 (12.8%) |
Health Insurance Coverage by Household Income in Curry County
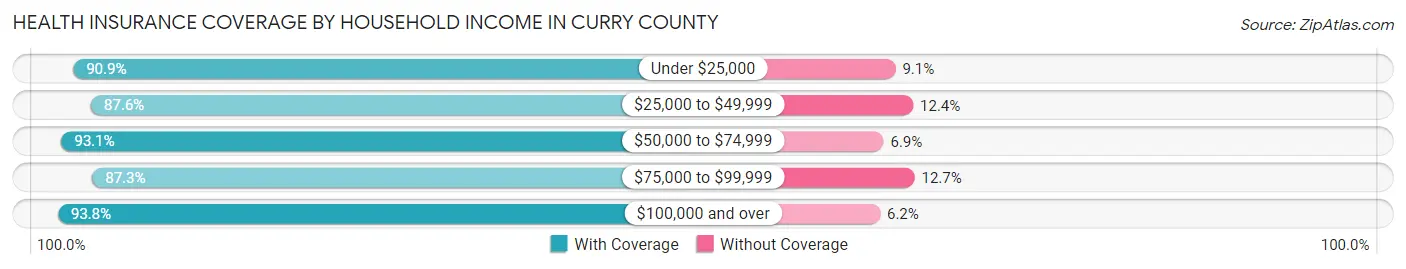
| Household Income | With Coverage | Without Coverage |
| Under $25,000 | 7,087 (90.9%) | 711 (9.1%) |
| $25,000 to $49,999 | 7,826 (87.6%) | 1,111 (12.4%) |
| $50,000 to $74,999 | 8,917 (93.1%) | 659 (6.9%) |
| $75,000 to $99,999 | 6,360 (87.3%) | 924 (12.7%) |
| $100,000 and over | 10,095 (93.8%) | 671 (6.2%) |
Public vs Private Health Insurance Coverage by Age in Curry County
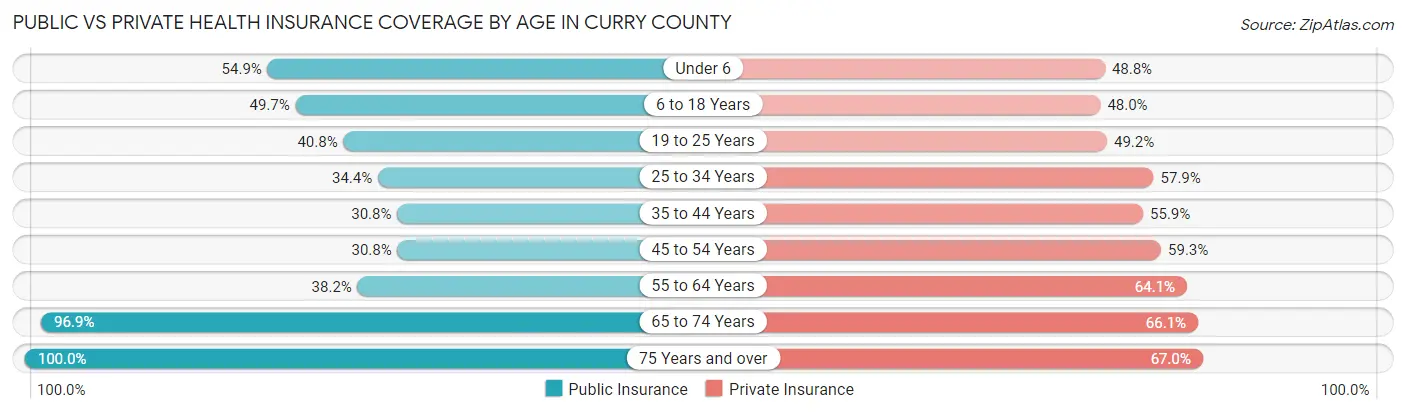
| Age Bracket | Public Insurance | Private Insurance |
| Under 6 | 2,510 (54.9%) | 2,234 (48.8%) |
| 6 to 18 Years | 4,406 (49.7%) | 4,255 (48.0%) |
| 19 to 25 Years | 1,801 (40.8%) | 2,173 (49.2%) |
| 25 to 34 Years | 2,015 (34.4%) | 3,391 (57.9%) |
| 35 to 44 Years | 1,599 (30.8%) | 2,902 (55.9%) |
| 45 to 54 Years | 1,378 (30.8%) | 2,654 (59.3%) |
| 55 to 64 Years | 1,923 (38.2%) | 3,226 (64.0%) |
| 65 to 74 Years | 3,393 (96.9%) | 2,313 (66.1%) |
| 75 Years and over | 2,541 (100.0%) | 1,703 (67.0%) |
| Total | 21,566 (48.5%) | 24,851 (55.9%) |
Disability Status by Sex by Age in Curry County
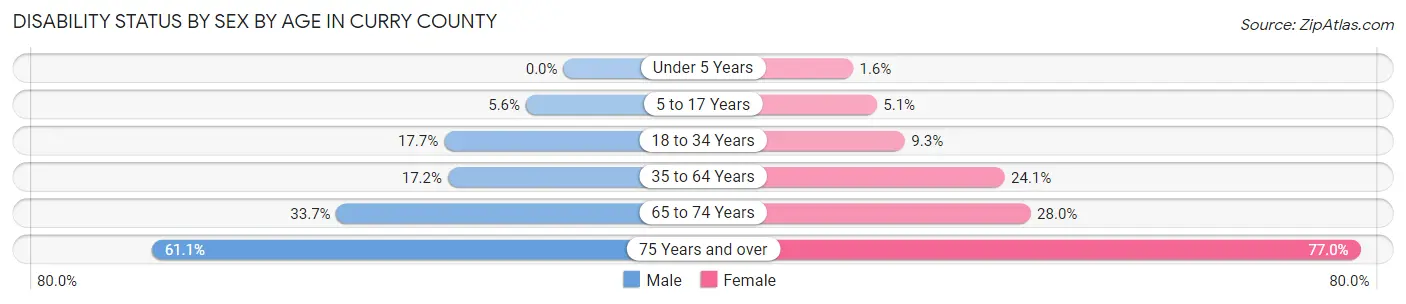
| Age Bracket | Male | Female |
| Under 5 Years | 0 (0.0%) | 31 (1.6%) |
| 5 to 17 Years | 258 (5.6%) | 221 (5.1%) |
| 18 to 34 Years | 906 (17.7%) | 542 (9.3%) |
| 35 to 64 Years | 1,229 (17.2%) | 1,818 (24.1%) |
| 65 to 74 Years | 576 (33.7%) | 501 (28.0%) |
| 75 Years and over | 610 (61.1%) | 1,189 (77.0%) |
Disability Class by Sex by Age in Curry County
Disability Class: Hearing Difficulty
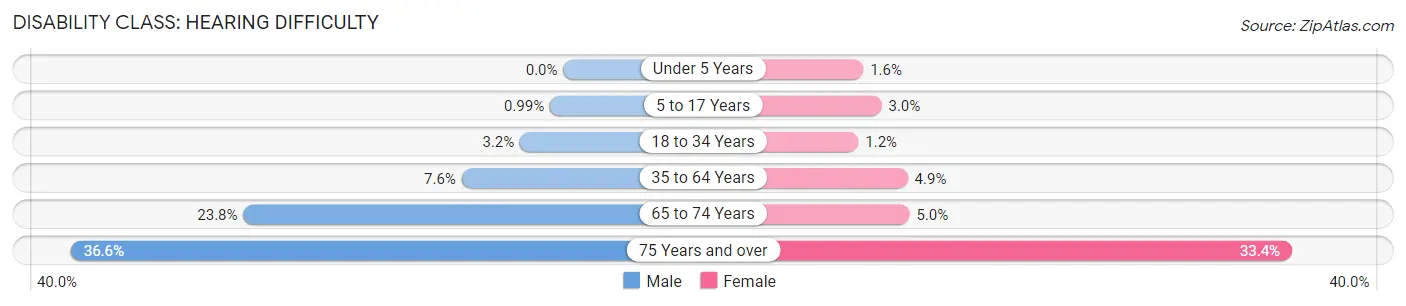
| Age Bracket | Male | Female |
| Under 5 Years | 0 (0.0%) | 31 (1.6%) |
| 5 to 17 Years | 46 (1.0%) | 127 (2.9%) |
| 18 to 34 Years | 164 (3.2%) | 72 (1.2%) |
| 35 to 64 Years | 541 (7.5%) | 369 (4.9%) |
| 65 to 74 Years | 406 (23.8%) | 90 (5.0%) |
| 75 Years and over | 365 (36.6%) | 516 (33.4%) |
Disability Class: Vision Difficulty
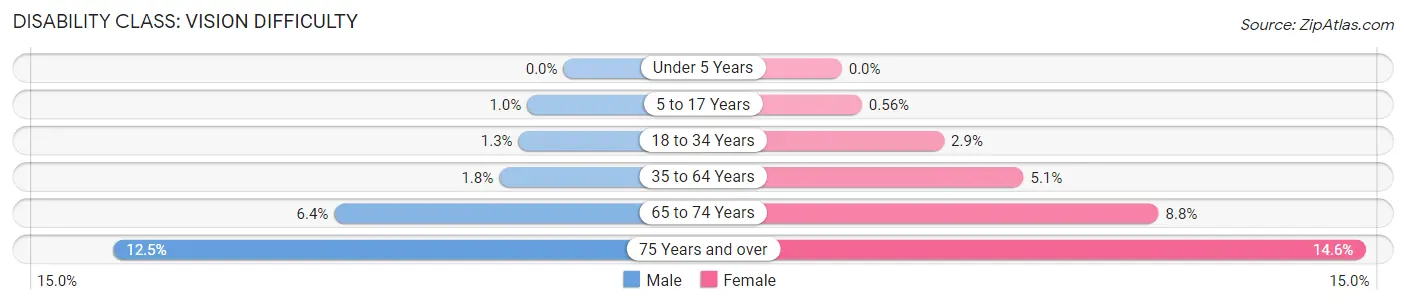
| Age Bracket | Male | Female |
| Under 5 Years | 0 (0.0%) | 0 (0.0%) |
| 5 to 17 Years | 47 (1.0%) | 24 (0.6%) |
| 18 to 34 Years | 64 (1.3%) | 166 (2.9%) |
| 35 to 64 Years | 128 (1.8%) | 382 (5.1%) |
| 65 to 74 Years | 109 (6.4%) | 158 (8.8%) |
| 75 Years and over | 125 (12.5%) | 225 (14.6%) |
Disability Class: Cognitive Difficulty
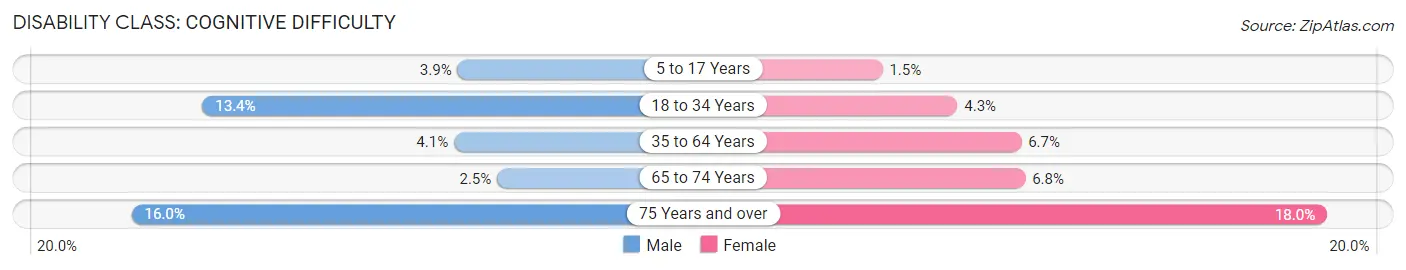
| Age Bracket | Male | Female |
| 5 to 17 Years | 182 (3.9%) | 65 (1.5%) |
| 18 to 34 Years | 685 (13.4%) | 250 (4.3%) |
| 35 to 64 Years | 291 (4.1%) | 502 (6.7%) |
| 65 to 74 Years | 42 (2.5%) | 122 (6.8%) |
| 75 Years and over | 160 (16.0%) | 278 (18.0%) |
Disability Class: Ambulatory Difficulty
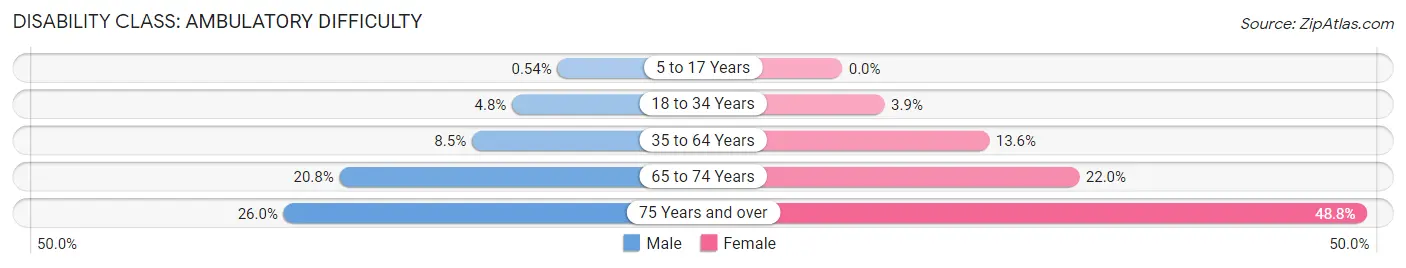
| Age Bracket | Male | Female |
| 5 to 17 Years | 25 (0.5%) | 0 (0.0%) |
| 18 to 34 Years | 243 (4.8%) | 229 (3.9%) |
| 35 to 64 Years | 607 (8.5%) | 1,029 (13.6%) |
| 65 to 74 Years | 355 (20.8%) | 394 (22.0%) |
| 75 Years and over | 259 (26.0%) | 753 (48.8%) |
Disability Class: Self-Care Difficulty
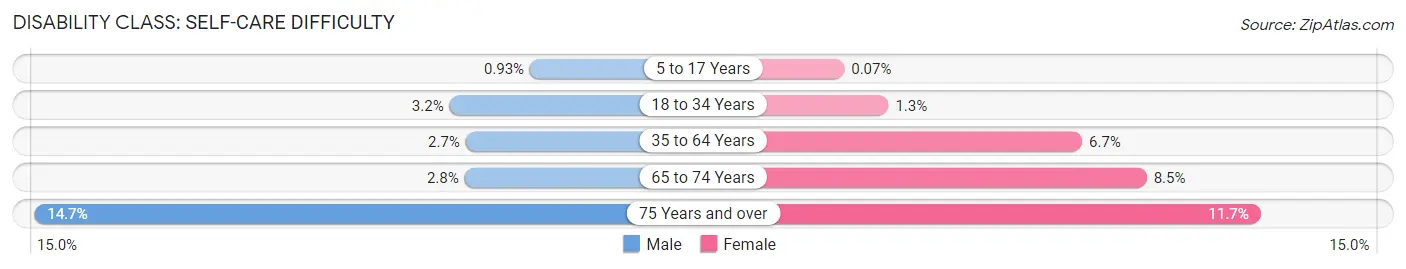
| Age Bracket | Male | Female |
| 5 to 17 Years | 43 (0.9%) | 3 (0.1%) |
| 18 to 34 Years | 162 (3.2%) | 76 (1.3%) |
| 35 to 64 Years | 195 (2.7%) | 505 (6.7%) |
| 65 to 74 Years | 47 (2.8%) | 152 (8.5%) |
| 75 Years and over | 147 (14.7%) | 180 (11.7%) |
Technology Access in Curry County
Computing Device Access in Curry County
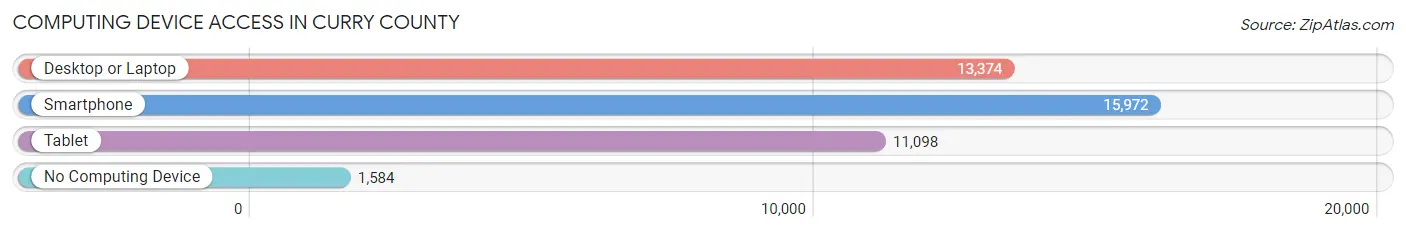
| Device Type | # Households | % Households |
| Desktop or Laptop | 13,374 | 72.2% |
| Smartphone | 15,972 | 86.2% |
| Tablet | 11,098 | 59.9% |
| No Computing Device | 1,584 | 8.6% |
| Total | 18,535 | 100.0% |
Internet Access in Curry County
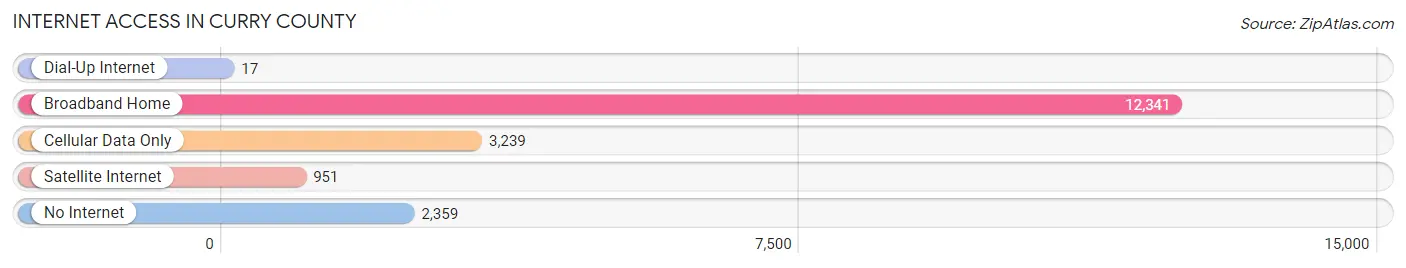
| Internet Type | # Households | % Households |
| Dial-Up Internet | 17 | 0.1% |
| Broadband Home | 12,341 | 66.6% |
| Cellular Data Only | 3,239 | 17.5% |
| Satellite Internet | 951 | 5.1% |
| No Internet | 2,359 | 12.7% |
| Total | 18,535 | 100.0% |
Curry County Summary
Curry County is located in the southeastern corner of the state of New Mexico. It is bordered by Roosevelt County to the north, Quay County to the east, and Texas to the south and west. The county seat is Clovis, which is also the largest city in the county. The county was established in 1909 and named after George Curry, the first territorial governor of New Mexico.
Geography
Curry County covers an area of 2,945 square miles, making it the fourth largest county in New Mexico. The county is located in the Llano Estacado region of the state, which is characterized by flat plains and rolling hills. The county is drained by the Canadian River and its tributaries, including the North Canadian River, the South Canadian River, and the Pecos River. The county is also home to several small lakes, including Lake Curry, Lake Maloya, and Lake Carlsbad.
The climate of Curry County is semi-arid, with hot summers and mild winters. The average annual temperature is around 64°F, and the average annual precipitation is around 17 inches.
Demographics
As of the 2010 census, there were 48,376 people, 17,845 households, and 12,717 families living in Curry County. The population density was 16.4 people per square mile. The racial makeup of the county was 75.3% White, 1.7% African American, 1.2% Native American, 0.7% Asian, 0.1% Pacific Islander, 17.7% from other races, and 3.4% from two or more races. Hispanic or Latino of any race were 37.2% of the population.
The median income for a household in the county was $35,945, and the median income for a family was $41,945. The per capita income for the county was $17,845. About 17.2% of families and 21.7% of the population were below the poverty line, including 28.3% of those under age 18 and 11.7% of those age 65 or over.
Economy
Curry County’s economy is largely based on agriculture and ranching. The county is home to several large cattle ranches, as well as several smaller farms that produce cotton, wheat, and other crops. The county is also home to several oil and gas fields, which provide jobs and revenue for the county.
In addition to agriculture and oil and gas, Curry County is home to several manufacturing companies, including a large cheese factory and a large meat packing plant. The county is also home to several retail stores, restaurants, and other businesses.
The county is served by two airports, the Clovis Municipal Airport and the Cannon Air Force Base. The county is also served by several major highways, including Interstate 40, U.S. Route 60, and U.S. Route 84.
Conclusion
Curry County is a large county located in the southeastern corner of New Mexico. The county is characterized by flat plains and rolling hills, and is home to several small lakes. The county’s economy is largely based on agriculture and ranching, as well as oil and gas production. The county is also home to several manufacturing companies, retail stores, restaurants, and other businesses. The county is served by two airports and several major highways.
Common Questions
What is Per Capita Income in Curry County?
Per Capita income in Curry County is $28,045.
What is the Median Family Income in Curry County?
Median Family Income in Curry County is $64,813.
What is the Median Household income in Curry County?
Median Household Income in Curry County is $55,427.
What is Income or Wage Gap in Curry County?
Income or Wage Gap in Curry County is 37.3%.
Women in Curry County earn 62.7 cents for every dollar earned by a man.
What is Family Income Deficit in Curry County?
Family Income Deficit in Curry County is $11,932.
Families that are below poverty line in Curry County earn $11,932 less on average than the poverty threshold level.
What is Inequality or Gini Index in Curry County?
Inequality or Gini Index in Curry County is 0.45.
What is the Total Population of Curry County?
Total Population of Curry County is 48,327.
What is the Total Male Population of Curry County?
Total Male Population of Curry County is 24,945.
What is the Total Female Population of Curry County?
Total Female Population of Curry County is 23,382.
What is the Ratio of Males per 100 Females in Curry County?
There are 106.68 Males per 100 Females in Curry County.
What is the Ratio of Females per 100 Males in Curry County?
There are 93.73 Females per 100 Males in Curry County.
What is the Median Population Age in Curry County?
Median Population Age in Curry County is 31.7 Years.
What is the Average Family Size in Curry County
Average Family Size in Curry County is 3.2 People.
What is the Average Household Size in Curry County
Average Household Size in Curry County is 2.5 People.
How Large is the Labor Force in Curry County?
There are 23,458 People in the Labor Forcein in Curry County.
What is the Percentage of People in the Labor Force in Curry County?
63.5% of People are in the Labor Force in Curry County.
What is the Unemployment Rate in Curry County?
Unemployment Rate in Curry County is 7.9%.