Area Code 505 Map & Demographics
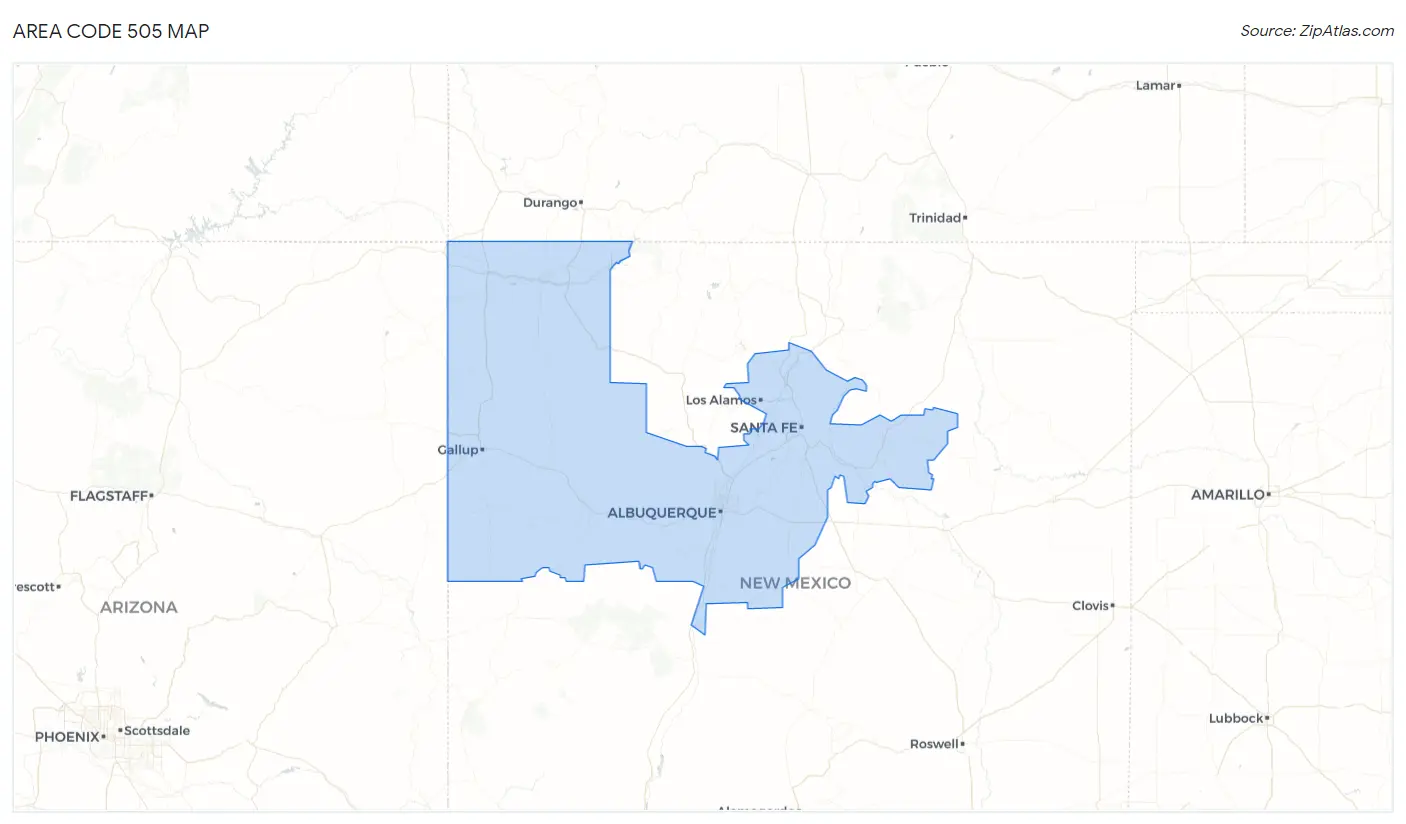
Area Code 505 Map
Area Code 505 Overview
$29,268
PER CAPITA INCOME
$71,082
AVG FAMILY INCOME
$56,005
AVG HOUSEHOLD INCOME
28.6%
WAGE / INCOME GAP [ % ]
71.4¢/ $1
WAGE / INCOME GAP [ $ ]
$12,176
FAMILY INCOME DEFICIT
85.38
INEQUALITY / GINI INDEX
1,464,216
TOTAL POPULATION
725,236
MALE POPULATION
738,980
FEMALE POPULATION
98.14
MALES / 100 FEMALES
101.90
FEMALES / 100 MALES
45.2
MEDIAN AGE
3.3
AVG FAMILY SIZE
2.7
AVG HOUSEHOLD SIZE
630,865
LABOR FORCE [ PEOPLE ]
53.2%
PERCENT IN LABOR FORCE
10.8%
UNEMPLOYMENT RATE
Income in Area Code 505
Income Overview in Area Code 505
Per Capita Income in Area Code 505 is $29,268, while median incomes of families and households are $71,082 and $56,005 respectively.
| Characteristic | Number | Measure |
| Per Capita Income | 1,464,216 | $29,268 |
| Median Family Income | 351,803 | $71,082 |
| Mean Family Income | 351,803 | $15,875,649 |
| Median Household Income | 570,675 | $56,005 |
| Mean Household Income | 570,675 | $13,995,234 |
| Income Deficit | 351,803 | $12,176 |
| Wage / Income Gap (%) | 1,464,216 | 28.61% |
| Wage / Income Gap ($) | 1,464,216 | 71.39¢ per $1 |
| Gini / Inequality Index | 1,464,216 | 85.38 |
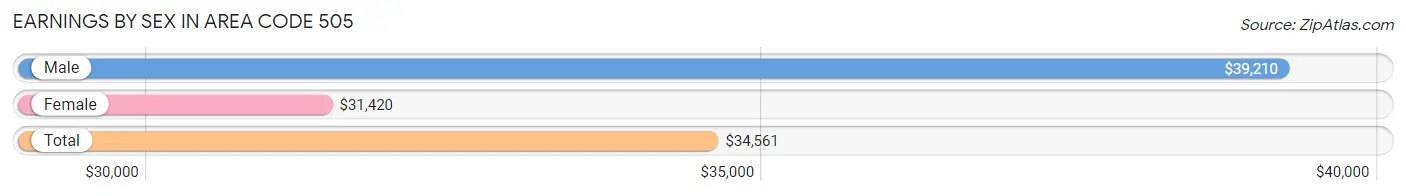
Earnings by Sex in Area Code 505
Average Earnings in Area Code 505 are $34,561, $39,210 for men and $31,420 for women, a difference of 19.9%.
| Sex | Number | Average Earnings |
| Male | 374,143 (52.1%) | $39,210 |
| Female | 343,294 (47.8%) | $31,420 |
| Total | 717,437 (100.0%) | $34,561 |
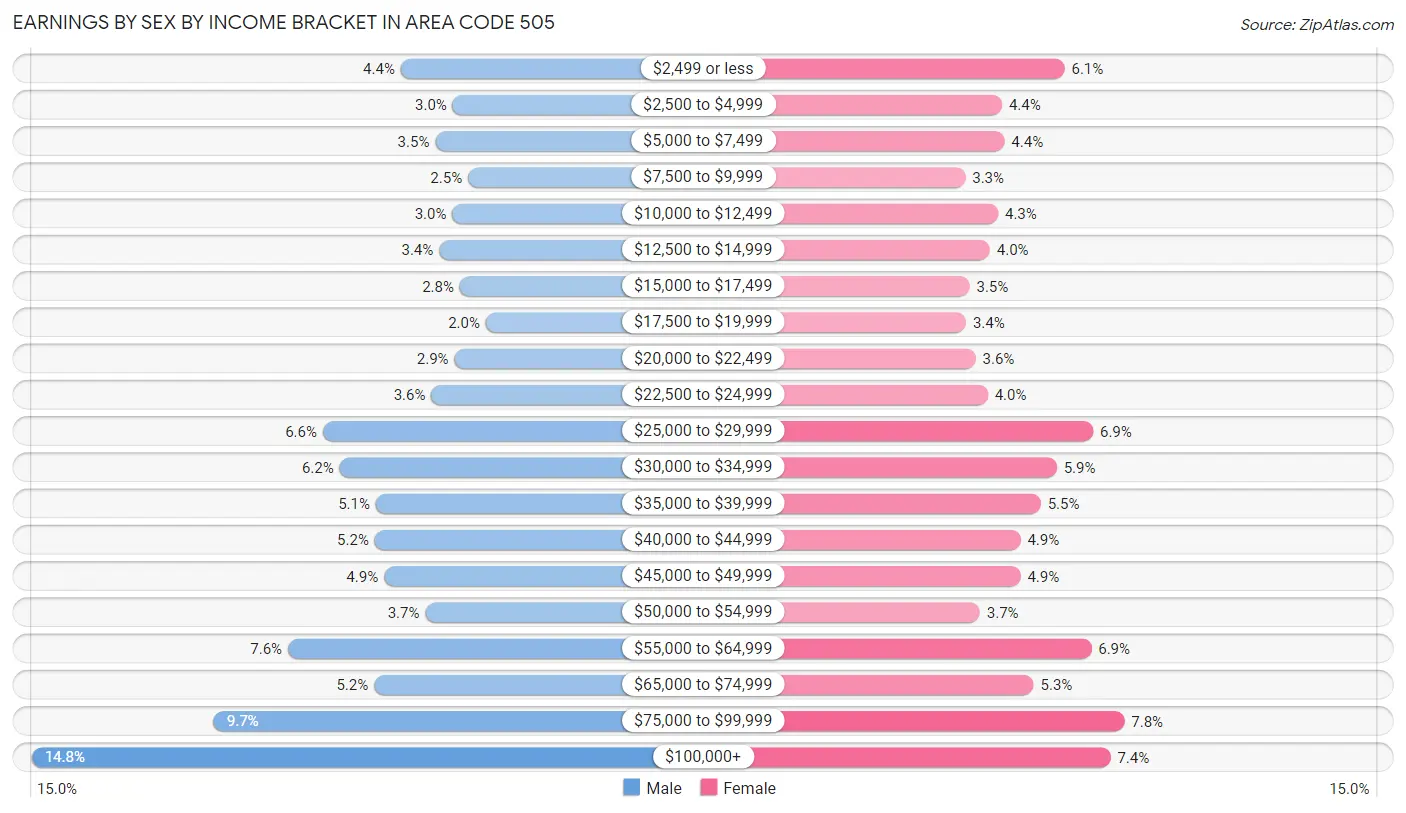
Earnings by Sex by Income Bracket in Area Code 505
The most common earnings brackets in Area Code 505 are $100,000+ for men (55,376 | 14.8%) and $75,000 to $99,999 for women (26,763 | 7.8%).
| Income | Male | Female |
| $2,499 or less | 16,576 (4.4%) | 20,999 (6.1%) |
| $2,500 to $4,999 | 11,119 (3.0%) | 14,982 (4.4%) |
| $5,000 to $7,499 | 12,956 (3.5%) | 15,208 (4.4%) |
| $7,500 to $9,999 | 9,508 (2.5%) | 11,427 (3.3%) |
| $10,000 to $12,499 | 11,132 (3.0%) | 14,606 (4.3%) |
| $12,500 to $14,999 | 12,528 (3.4%) | 13,806 (4.0%) |
| $15,000 to $17,499 | 10,381 (2.8%) | 11,849 (3.5%) |
| $17,500 to $19,999 | 7,631 (2.0%) | 11,494 (3.4%) |
| $20,000 to $22,499 | 10,943 (2.9%) | 12,441 (3.6%) |
| $22,500 to $24,999 | 13,372 (3.6%) | 13,597 (4.0%) |
| $25,000 to $29,999 | 24,757 (6.6%) | 23,762 (6.9%) |
| $30,000 to $34,999 | 23,007 (6.1%) | 20,247 (5.9%) |
| $35,000 to $39,999 | 19,187 (5.1%) | 18,720 (5.4%) |
| $40,000 to $44,999 | 19,292 (5.2%) | 16,752 (4.9%) |
| $45,000 to $49,999 | 18,338 (4.9%) | 16,750 (4.9%) |
| $50,000 to $54,999 | 13,983 (3.7%) | 12,826 (3.7%) |
| $55,000 to $64,999 | 28,448 (7.6%) | 23,601 (6.9%) |
| $65,000 to $74,999 | 19,393 (5.2%) | 18,016 (5.2%) |
| $75,000 to $99,999 | 36,216 (9.7%) | 26,763 (7.8%) |
| $100,000+ | 55,376 (14.8%) | 25,448 (7.4%) |
| Total | 374,143 (100.0%) | 343,294 (100.0%) |
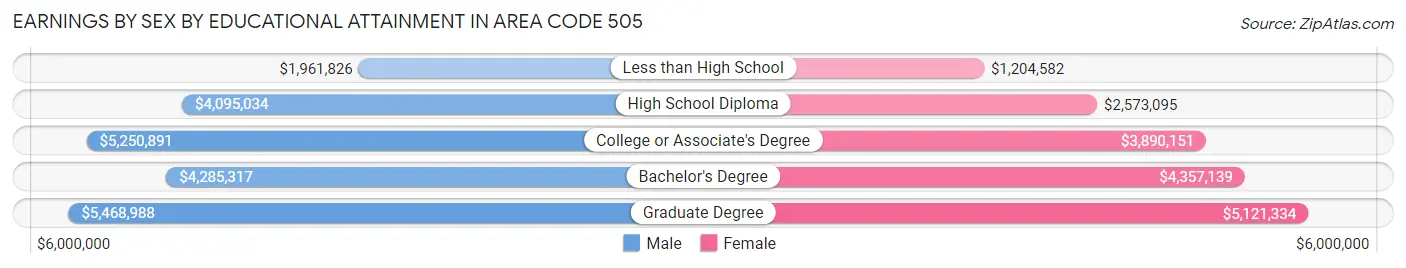
Earnings by Sex by Educational Attainment in Area Code 505
Average earnings in Area Code 505 are $6,571,394 for men and $5,322,102 for women, a difference of 19.0%. Men with an educational attainment of graduate degree enjoy the highest average annual earnings of $5,468,988, while those with less than high school education earn the least with $1,961,826. Women with an educational attainment of graduate degree earn the most with the average annual earnings of $5,121,334, while those with less than high school education have the smallest earnings of $1,204,582.
| Educational Attainment | Male Income | Female Income |
| Less than High School | $1,961,826 | $1,204,582 |
| High School Diploma | $4,095,034 | $2,573,095 |
| College or Associate's Degree | $5,250,891 | $3,890,151 |
| Bachelor's Degree | $4,285,317 | $4,357,139 |
| Graduate Degree | $5,468,988 | $5,121,334 |
| Total | $6,571,394 | $5,322,102 |
Family Income in Area Code 505
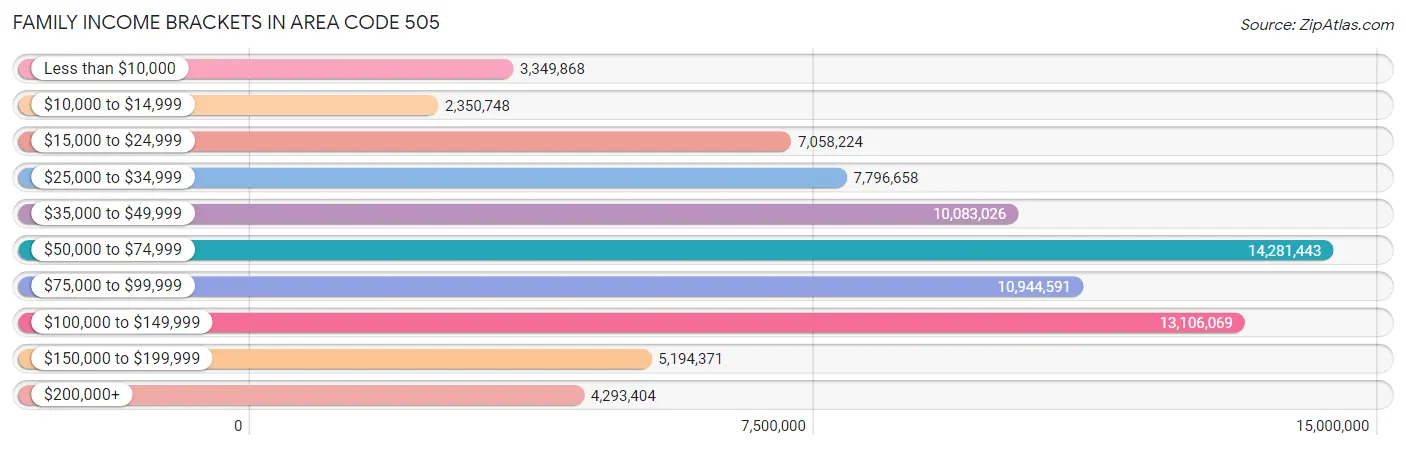
Family Income Brackets in Area Code 505
According to the Area Code 505 family income data, there are 14,281,443 families falling into the $50,000 to $74,999 income range, which is the most common income bracket and makes up 4,059.5% of all families. Conversely, the $10,000 to $14,999 income bracket is the least frequent group with only 2,350,748 families (668.2%) belonging to this category.
| Income Bracket | # Families | % Families |
| Less than $10,000 | 3,349,868 | 952.2% |
| $10,000 to $14,999 | 2,350,748 | 668.2% |
| $15,000 to $24,999 | 7,058,224 | 2,006.3% |
| $25,000 to $34,999 | 7,796,658 | 2,216.2% |
| $35,000 to $49,999 | 10,083,026 | 2,866.1% |
| $50,000 to $74,999 | 14,281,443 | 4,059.5% |
| $75,000 to $99,999 | 10,944,591 | 3,111.0% |
| $100,000 to $149,999 | 13,106,069 | 3,725.4% |
| $150,000 to $199,999 | 5,194,371 | 1,476.5% |
| $200,000+ | 4,293,404 | 1,220.4% |
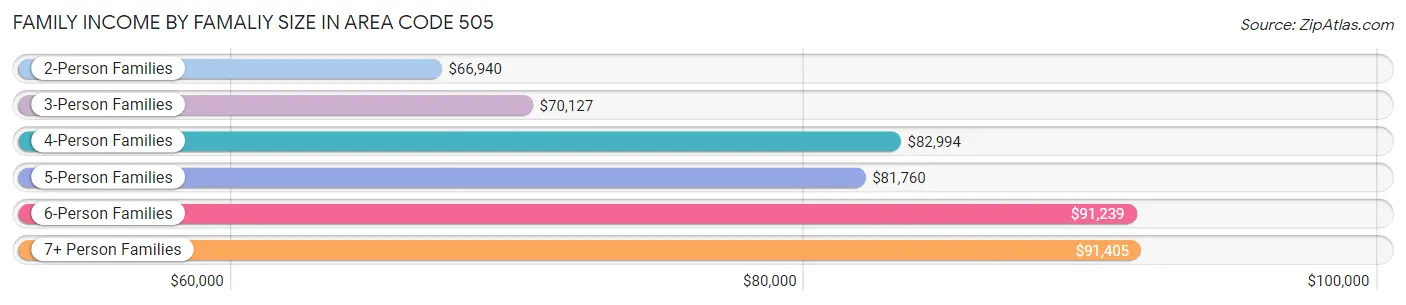
Family Income by Famaliy Size in Area Code 505
7+ person families (6,278 | 1.8%) account for the highest median family income in Area Code 505 with $91,405 per family, while 2-person families (179,560 | 51.0%) have the highest median income of $33,470 per family member.
| Income Bracket | # Families | Median Income |
| 2-Person Families | 179,560 (51.0%) | $66,940 |
| 3-Person Families | 74,018 (21.0%) | $70,127 |
| 4-Person Families | 55,340 (15.7%) | $82,994 |
| 5-Person Families | 26,362 (7.5%) | $81,760 |
| 6-Person Families | 10,245 (2.9%) | $91,239 |
| 7+ Person Families | 6,278 (1.8%) | $91,405 |
| Total | 351,803 (100.0%) | $71,082 |
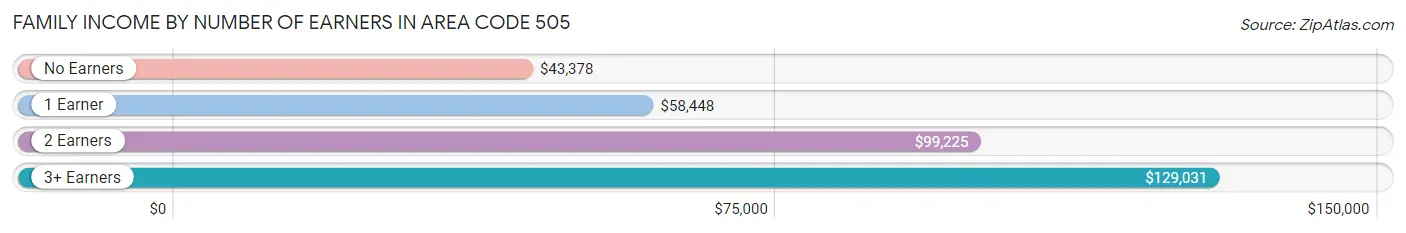
Family Income by Number of Earners in Area Code 505
The median family income in Area Code 505 is $71,082, with families comprising 3+ earners (30,210) having the highest median family income of $129,031, while families with no earners (68,402) have the lowest median family income of $43,378, accounting for 8.6% and 19.4% of families, respectively.
| Number of Earners | # Families | Median Income |
| No Earners | 68,402 (19.4%) | $43,378 |
| 1 Earner | 127,386 (36.2%) | $58,448 |
| 2 Earners | 125,805 (35.8%) | $99,225 |
| 3+ Earners | 30,210 (8.6%) | $129,031 |
| Total | 351,803 (100.0%) | $71,082 |
Household Income in Area Code 505
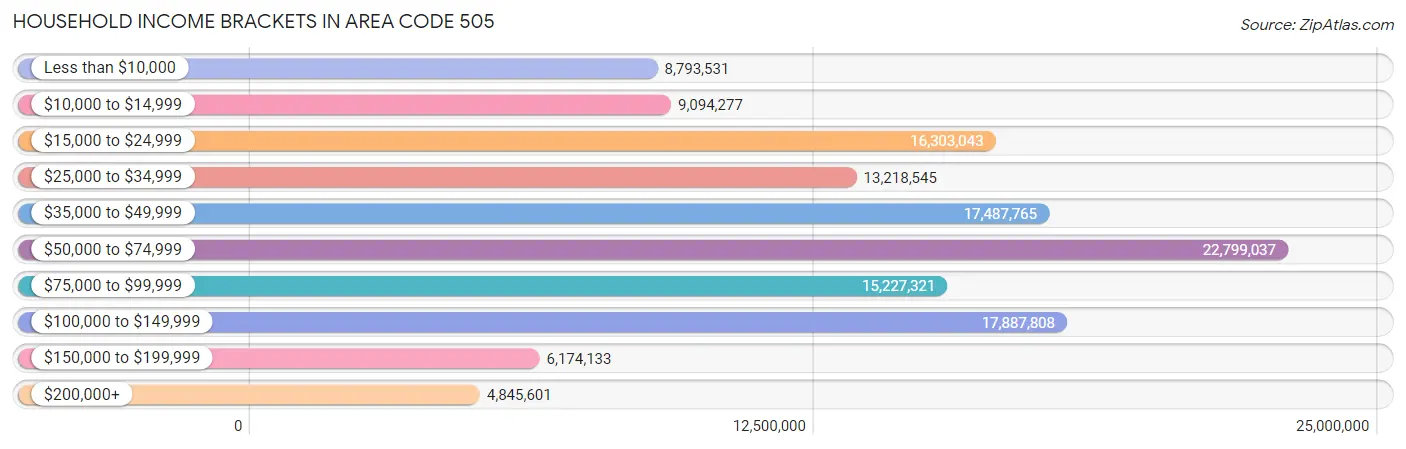
Household Income Brackets in Area Code 505
With 22,799,037 households falling in the category, the $50,000 to $74,999 income range is the most frequent in Area Code 505, accounting for 3,995.1% of all households. In contrast, only 4,845,601 households (849.1%) fall into the $200,000+ income bracket, making it the least populous group.
| Income Bracket | # Households | % Households |
| Less than $10,000 | 8,793,531 | 1,540.9% |
| $10,000 to $14,999 | 9,094,277 | 1,593.6% |
| $15,000 to $24,999 | 16,303,043 | 2,856.8% |
| $25,000 to $34,999 | 13,218,545 | 2,316.3% |
| $35,000 to $49,999 | 17,487,765 | 3,064.4% |
| $50,000 to $74,999 | 22,799,037 | 3,995.1% |
| $75,000 to $99,999 | 15,227,321 | 2,668.3% |
| $100,000 to $149,999 | 17,887,808 | 3,134.5% |
| $150,000 to $199,999 | 6,174,133 | 1,081.9% |
| $200,000+ | 4,845,601 | 849.1% |
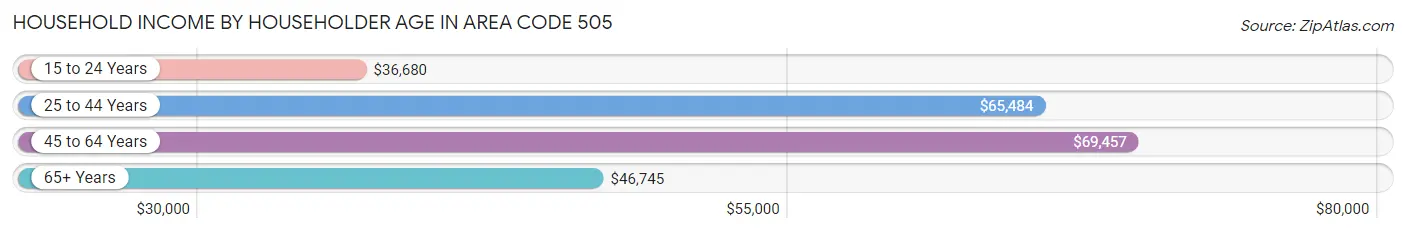
Household Income by Householder Age in Area Code 505
The median household income in Area Code 505 is $56,005, with the highest median household income of $69,457 found in the 45 to 64 years age bracket for the primary householder. A total of 208,486 households (36.5%) fall into this category. Meanwhile, the 15 to 24 years age bracket for the primary householder has the lowest median household income of $36,680, with 19,791 households (3.5%) in this group.
| Income Bracket | # Households | Median Income |
| 15 to 24 Years | 19,791 (3.5%) | $36,680 |
| 25 to 44 Years | 170,522 (29.9%) | $65,484 |
| 45 to 64 Years | 208,486 (36.5%) | $69,457 |
| 65+ Years | 171,876 (30.1%) | $46,745 |
| Total | 570,675 (100.0%) | $56,005 |
Poverty in Area Code 505
Income Below Poverty by Sex and Age in Area Code 505
With 16.4% poverty level for males and 18.6% for females among the residents of Area Code 505, under 5 year old males and under 5 year old females are the most vulnerable to poverty, with 10,097 males (26.8%) and 9,677 females (27.0%) in their respective age groups living below the poverty level.
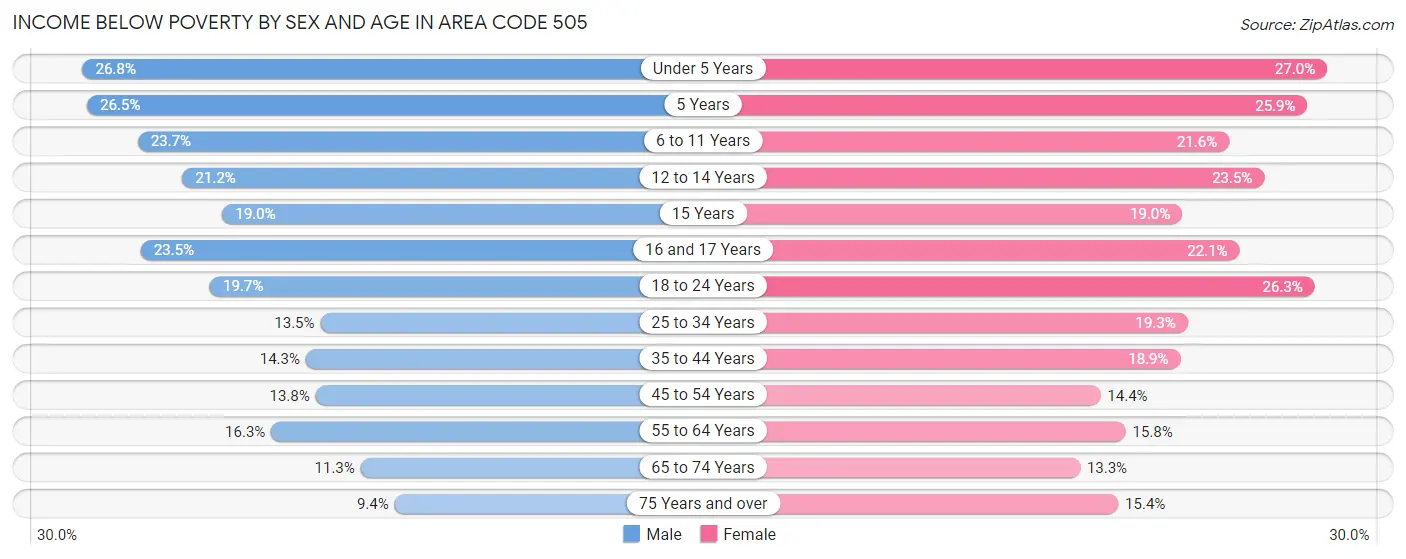
| Age Bracket | Male | Female |
| Under 5 Years | 10,097 (26.8%) | 9,677 (27.0%) |
| 5 Years | 2,154 (26.5%) | 2,097 (25.9%) |
| 6 to 11 Years | 12,848 (23.7%) | 11,132 (21.6%) |
| 12 to 14 Years | 6,241 (21.2%) | 6,856 (23.5%) |
| 15 Years | 1,824 (19.0%) | 1,792 (19.0%) |
| 16 and 17 Years | 4,713 (23.5%) | 4,191 (22.1%) |
| 18 to 24 Years | 12,531 (19.7%) | 16,128 (26.3%) |
| 25 to 34 Years | 12,955 (13.5%) | 18,067 (19.3%) |
| 35 to 44 Years | 13,236 (14.3%) | 17,183 (18.9%) |
| 45 to 54 Years | 11,534 (13.8%) | 12,334 (14.4%) |
| 55 to 64 Years | 15,136 (16.3%) | 15,758 (15.8%) |
| 65 to 74 Years | 8,585 (11.3%) | 11,514 (13.3%) |
| 75 Years and over | 4,271 (9.4%) | 9,143 (15.4%) |
| Total | 116,125 (16.4%) | 135,872 (18.6%) |
Income Above Poverty by Sex and Age in Area Code 505
According to the poverty statistics in Area Code 505, males aged 75 years and over and females aged 65 to 74 years are the age groups that are most secure financially, with 90.6% of males and 86.7% of females in these age groups living above the poverty line.
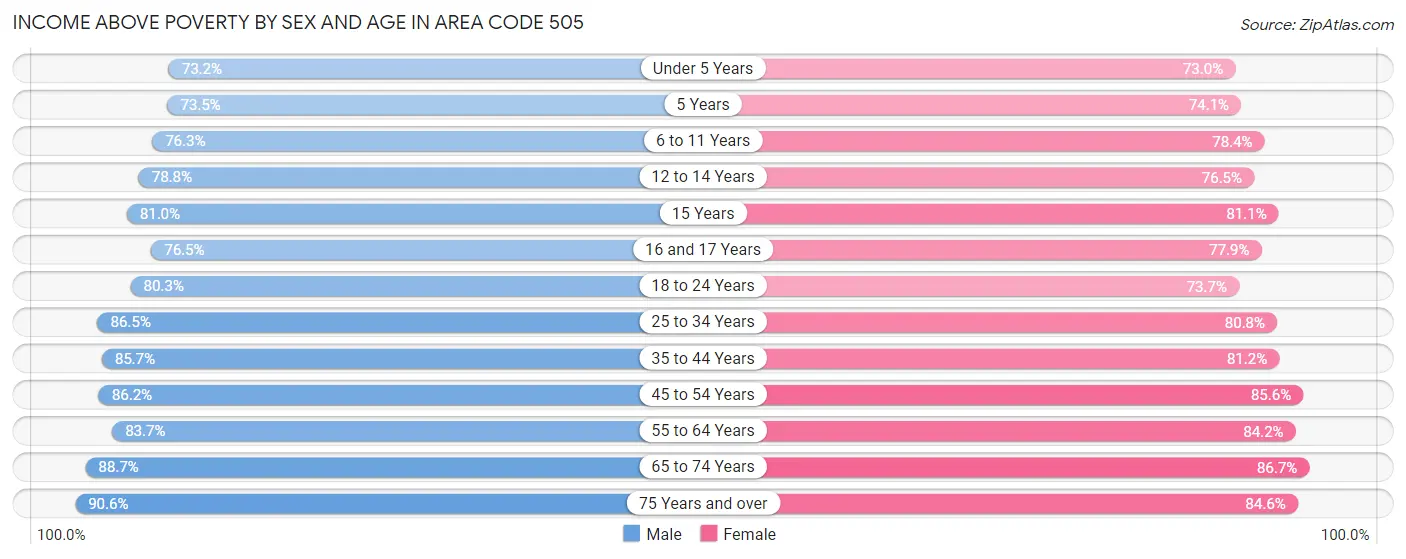
| Age Bracket | Male | Female |
| Under 5 Years | 27,614 (73.2%) | 26,140 (73.0%) |
| 5 Years | 5,969 (73.5%) | 5,992 (74.1%) |
| 6 to 11 Years | 41,369 (76.3%) | 40,503 (78.4%) |
| 12 to 14 Years | 23,187 (78.8%) | 22,298 (76.5%) |
| 15 Years | 7,779 (81.0%) | 7,662 (81.0%) |
| 16 and 17 Years | 15,321 (76.5%) | 14,737 (77.9%) |
| 18 to 24 Years | 51,182 (80.3%) | 45,126 (73.7%) |
| 25 to 34 Years | 82,781 (86.5%) | 75,804 (80.7%) |
| 35 to 44 Years | 79,088 (85.7%) | 73,964 (81.1%) |
| 45 to 54 Years | 72,027 (86.2%) | 73,295 (85.6%) |
| 55 to 64 Years | 77,898 (83.7%) | 83,990 (84.2%) |
| 65 to 74 Years | 67,431 (88.7%) | 75,290 (86.7%) |
| 75 Years and over | 41,152 (90.6%) | 50,256 (84.6%) |
| Total | 592,798 (83.6%) | 595,057 (81.4%) |
Income Below Poverty Among Married-Couple Families in Area Code 505
The poverty statistics for married-couple families in Area Code 505 show that 7.4% or 17,443 of the total 236,259 families live below the poverty line. Families with 5 or more children have the highest poverty rate of 35.4%, comprising of 676 families. On the other hand, families with no children have the lowest poverty rate of 5.3%, which includes 7,936 families.
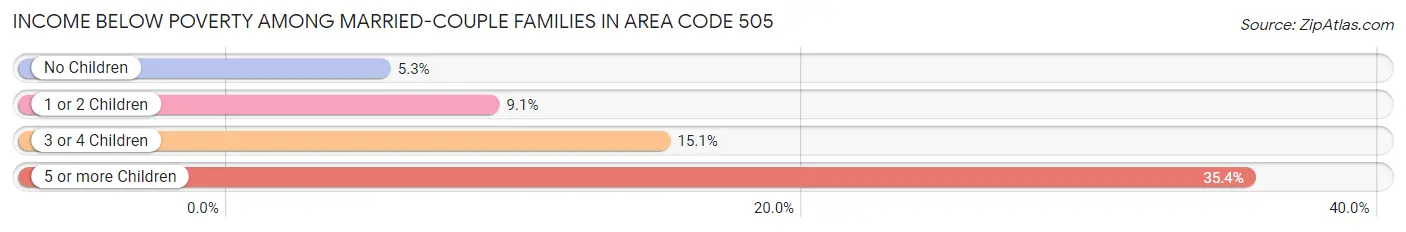
| Children | Above Poverty | Below Poverty |
| No Children | 141,293 (94.7%) | 7,936 (5.3%) |
| 1 or 2 Children | 60,970 (90.9%) | 6,114 (9.1%) |
| 3 or 4 Children | 15,321 (84.9%) | 2,717 (15.1%) |
| 5 or more Children | 1,232 (64.6%) | 676 (35.4%) |
| Total | 218,816 (92.6%) | 17,443 (7.4%) |
Income Below Poverty Among Single-Parent Households in Area Code 505
According to the poverty data in Area Code 505, 18.1% or 6,338 single-father households and 26.3% or 21,197 single-mother households are living below the poverty line. Among single-father households, those with 5 or more children have the highest poverty rate, with 264 households (77.9%) experiencing poverty. Likewise, among single-mother households, those with 5 or more children have the highest poverty rate, with 599 households (62.2%) falling below the poverty line.
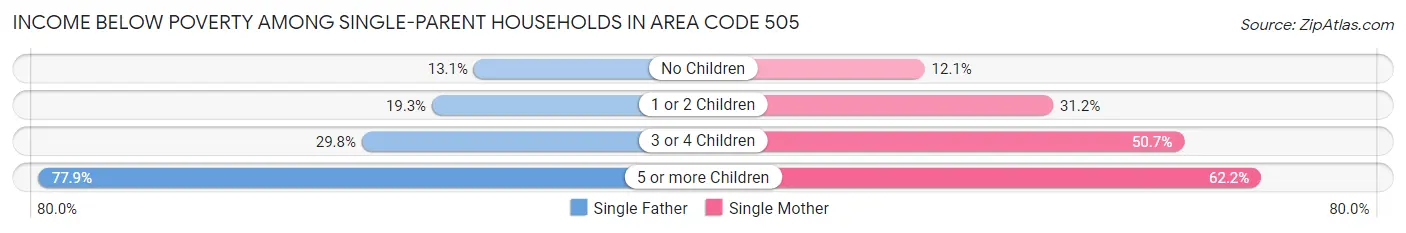
| Children | Single Father | Single Mother |
| No Children | 1,910 (13.1%) | 3,669 (12.1%) |
| 1 or 2 Children | 3,290 (19.3%) | 12,865 (31.2%) |
| 3 or 4 Children | 874 (29.8%) | 4,064 (50.7%) |
| 5 or more Children | 264 (77.9%) | 599 (62.2%) |
| Total | 6,338 (18.1%) | 21,197 (26.3%) |
Income Below Poverty Among Married-Couple vs Single-Parent Households in Area Code 505
The poverty data for Area Code 505 shows that 17,443 of the married-couple family households (7.4%) and 27,535 of the single-parent households (23.8%) are living below the poverty level. Within the married-couple family households, those with 5 or more children have the highest poverty rate, with 676 households (35.4%) falling below the poverty line. Among the single-parent households, those with 5 or more children have the highest poverty rate, with 863 household (66.3%) living below poverty.
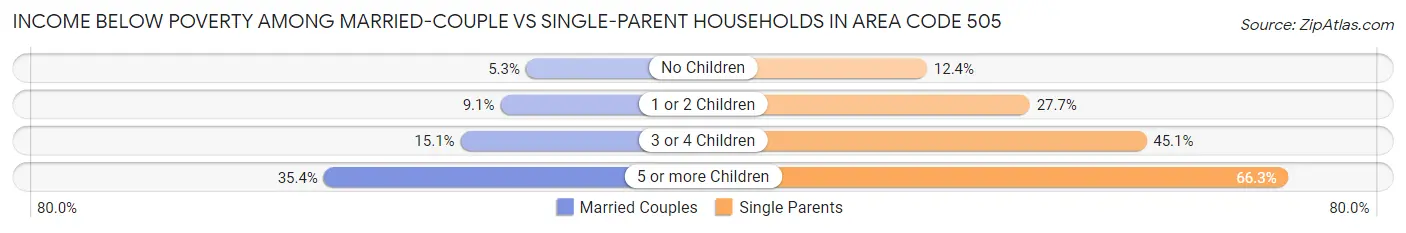
| Children | Married-Couple Families | Single-Parent Households |
| No Children | 7,936 (5.3%) | 5,579 (12.4%) |
| 1 or 2 Children | 6,114 (9.1%) | 16,155 (27.7%) |
| 3 or 4 Children | 2,717 (15.1%) | 4,938 (45.1%) |
| 5 or more Children | 676 (35.4%) | 863 (66.3%) |
| Total | 17,443 (7.4%) | 27,535 (23.8%) |
Race in Area Code 505
The most populous races in Area Code 505 are White / Caucasian (836,152 | 57.1%), Hispanic or Latino (690,467 | 47.2%), and Two or more Races (236,388 | 16.1%).
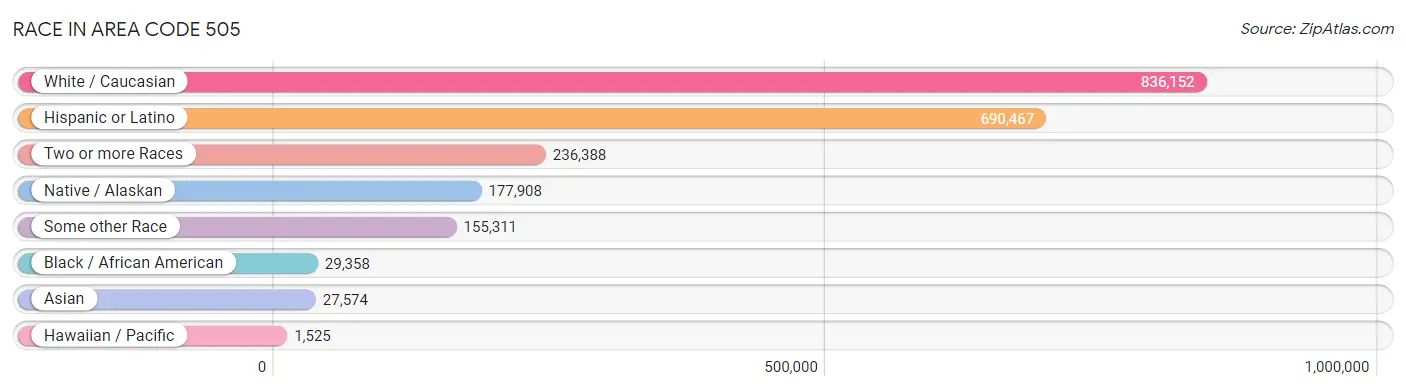
| Race | # Population | % Population |
| Asian | 27,574 | 1.9% |
| Black / African American | 29,358 | 2.0% |
| Hawaiian / Pacific | 1,525 | 0.1% |
| Hispanic or Latino | 690,467 | 47.2% |
| Native / Alaskan | 177,908 | 12.1% |
| White / Caucasian | 836,152 | 57.1% |
| Two or more Races | 236,388 | 16.1% |
| Some other Race | 155,311 | 10.6% |
| Total | 1,464,216 | 100.0% |
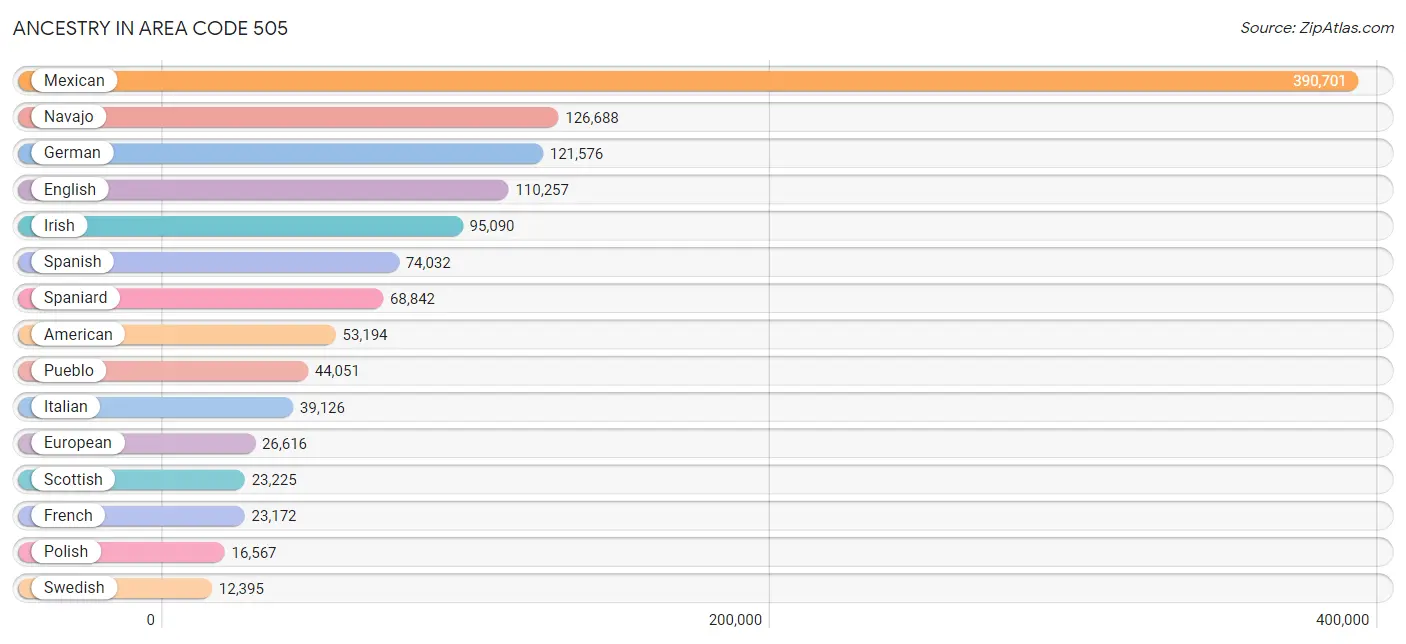
Ancestry in Area Code 505
The most populous ancestries reported in Area Code 505 are Mexican (390,701 | 26.7%), Navajo (126,688 | 8.6%), German (121,576 | 8.3%), English (110,257 | 7.5%), and Irish (95,090 | 6.5%), together accounting for 57.6% of all Area Code 505 residents.
| Ancestry | # Population | % Population |
| Afghan | 399 | 0.0% |
| African | 2,758 | 0.2% |
| Alaska Native | 34 | 0.0% |
| Alaskan Athabascan | 223 | 0.0% |
| Albanian | 77 | 0.0% |
| Aleut | 103 | 0.0% |
| Alsatian | 10 | 0.0% |
| American | 53,194 | 3.6% |
| Apache | 6,479 | 0.4% |
| Arab | 4,839 | 0.3% |
| Arapaho | 32 | 0.0% |
| Argentinean | 513 | 0.0% |
| Armenian | 448 | 0.0% |
| Australian | 306 | 0.0% |
| Austrian | 1,842 | 0.1% |
| Bangladeshi | 47 | 0.0% |
| Barbadian | 9 | 0.0% |
| Basque | 678 | 0.1% |
| Belgian | 1,178 | 0.1% |
| Belizean | 59 | 0.0% |
| Bhutanese | 4,342 | 0.3% |
| Blackfeet | 606 | 0.0% |
| Bolivian | 461 | 0.0% |
| Brazilian | 382 | 0.0% |
| British | 8,893 | 0.6% |
| British West Indian | 54 | 0.0% |
| Bulgarian | 183 | 0.0% |
| Burmese | 3,181 | 0.2% |
| Cajun | 311 | 0.0% |
| Cambodian | 93 | 0.0% |
| Canadian | 2,076 | 0.1% |
| Celtic | 612 | 0.0% |
| Central American | 7,928 | 0.5% |
| Central American Indian | 1,694 | 0.1% |
| Cherokee | 4,404 | 0.3% |
| Cheyenne | 248 | 0.0% |
| Chickasaw | 424 | 0.0% |
| Chilean | 859 | 0.1% |
| Chinese | 6 | 0.0% |
| Chippewa | 802 | 0.1% |
| Choctaw | 1,377 | 0.1% |
| Colombian | 2,444 | 0.2% |
| Comanche | 598 | 0.0% |
| Costa Rican | 420 | 0.0% |
| Cree | 67 | 0.0% |
| Creek | 423 | 0.0% |
| Croatian | 825 | 0.1% |
| Crow | 49 | 0.0% |
| Cuban | 4,353 | 0.3% |
| Cypriot | 12 | 0.0% |
| Czech | 2,886 | 0.2% |
| Czechoslovakian | 577 | 0.0% |
| Danish | 5,051 | 0.3% |
| Delaware | 23 | 0.0% |
| Dominican | 2,383 | 0.2% |
| Dutch | 10,738 | 0.7% |
| Dutch West Indian | 142 | 0.0% |
| Eastern European | 3,112 | 0.2% |
| Ecuadorian | 1,060 | 0.1% |
| Egyptian | 214 | 0.0% |
| English | 110,257 | 7.5% |
| Estonian | 159 | 0.0% |
| Ethiopian | 324 | 0.0% |
| European | 26,616 | 1.8% |
| Filipino | 371 | 0.0% |
| Finnish | 1,748 | 0.1% |
| French | 23,172 | 1.6% |
| French American Indian | 35 | 0.0% |
| French Canadian | 3,714 | 0.3% |
| German | 121,576 | 8.3% |
| German Russian | 20 | 0.0% |
| Ghanaian | 82 | 0.0% |
| Greek | 3,398 | 0.2% |
| Guamanian / Chamorro | 616 | 0.0% |
| Guatemalan | 2,934 | 0.2% |
| Guyanese | 122 | 0.0% |
| Haitian | 295 | 0.0% |
| Honduran | 615 | 0.0% |
| Hopi | 1,283 | 0.1% |
| Houma | 4 | 0.0% |
| Hungarian | 2,979 | 0.2% |
| Icelander | 63 | 0.0% |
| Indian (Asian) | 7,140 | 0.5% |
| Indonesian | 21 | 0.0% |
| Inupiat | 131 | 0.0% |
| Iranian | 1,013 | 0.1% |
| Iraqi | 450 | 0.0% |
| Irish | 95,090 | 6.5% |
| Iroquois | 393 | 0.0% |
| Israeli | 136 | 0.0% |
| Italian | 39,126 | 2.7% |
| Jamaican | 723 | 0.1% |
| Japanese | 177 | 0.0% |
| Jordanian | 124 | 0.0% |
| Kenyan | 184 | 0.0% |
| Kiowa | 279 | 0.0% |
| Korean | 11,498 | 0.8% |
| Laotian | 282 | 0.0% |
| Latvian | 201 | 0.0% |
| Lebanese | 1,711 | 0.1% |
| Liberian | 185 | 0.0% |
| Lithuanian | 1,335 | 0.1% |
| Lumbee | 26 | 0.0% |
| Luxembourger | 79 | 0.0% |
| Macedonian | 16 | 0.0% |
| Malaysian | 335 | 0.0% |
| Maltese | 38 | 0.0% |
| Menominee | 40 | 0.0% |
| Mexican | 390,701 | 26.7% |
| Mexican American Indian | 3,975 | 0.3% |
| Mongolian | 27 | 0.0% |
| Moroccan | 108 | 0.0% |
| Native Hawaiian | 2,030 | 0.1% |
| Navajo | 126,688 | 8.6% |
| New Zealander | 126 | 0.0% |
| Nicaraguan | 863 | 0.1% |
| Nigerian | 922 | 0.1% |
| Northern European | 4,224 | 0.3% |
| Norwegian | 10,919 | 0.7% |
| Osage | 171 | 0.0% |
| Paiute | 92 | 0.0% |
| Pakistani | 1,154 | 0.1% |
| Palestinian | 627 | 0.0% |
| Panamanian | 357 | 0.0% |
| Paraguayan | 36 | 0.0% |
| Pennsylvania German | 271 | 0.0% |
| Peruvian | 1,468 | 0.1% |
| Pima | 871 | 0.1% |
| Polish | 16,567 | 1.1% |
| Portuguese | 3,507 | 0.2% |
| Potawatomi | 350 | 0.0% |
| Pueblo | 44,051 | 3.0% |
| Puerto Rican | 8,358 | 0.6% |
| Puget Sound Salish | 1 | 0.0% |
| Romanian | 792 | 0.1% |
| Russian | 6,650 | 0.4% |
| Salvadoran | 2,597 | 0.2% |
| Samoan | 560 | 0.0% |
| Scandinavian | 5,110 | 0.4% |
| Scotch-Irish | 12,189 | 0.8% |
| Scottish | 23,225 | 1.6% |
| Seminole | 214 | 0.0% |
| Serbian | 634 | 0.0% |
| Shoshone | 80 | 0.0% |
| Sierra Leonean | 45 | 0.0% |
| Sioux | 1,203 | 0.1% |
| Slavic | 583 | 0.0% |
| Slovak | 1,041 | 0.1% |
| Slovene | 326 | 0.0% |
| Somali | 2 | 0.0% |
| South African | 126 | 0.0% |
| South American | 7,624 | 0.5% |
| South American Indian | 300 | 0.0% |
| Spaniard | 68,842 | 4.7% |
| Spanish | 74,032 | 5.1% |
| Spanish American | 5,800 | 0.4% |
| Spanish American Indian | 468 | 0.0% |
| Sri Lankan | 5,590 | 0.4% |
| Subsaharan African | 6,054 | 0.4% |
| Sudanese | 29 | 0.0% |
| Swedish | 12,395 | 0.9% |
| Swiss | 3,072 | 0.2% |
| Syrian | 388 | 0.0% |
| Thai | 4,843 | 0.3% |
| Tlingit-Haida | 75 | 0.0% |
| Tohono O'Odham | 228 | 0.0% |
| Trinidadian and Tobagonian | 57 | 0.0% |
| Tsimshian | 78 | 0.0% |
| Turkish | 513 | 0.0% |
| U.S. Virgin Islander | 16 | 0.0% |
| Ugandan | 31 | 0.0% |
| Ukrainian | 2,531 | 0.2% |
| Uruguayan | 65 | 0.0% |
| Ute | 563 | 0.0% |
| Venezuelan | 662 | 0.1% |
| Vietnamese | 629 | 0.0% |
| Welsh | 7,679 | 0.5% |
| West Indian | 254 | 0.0% |
| Yakama | 9 | 0.0% |
| Yaqui | 158 | 0.0% |
| Yugoslavian | 357 | 0.0% |
| Yuman | 54 | 0.0% |
| Zimbabwean | 143 | 0.0% | View All 183 Rows |
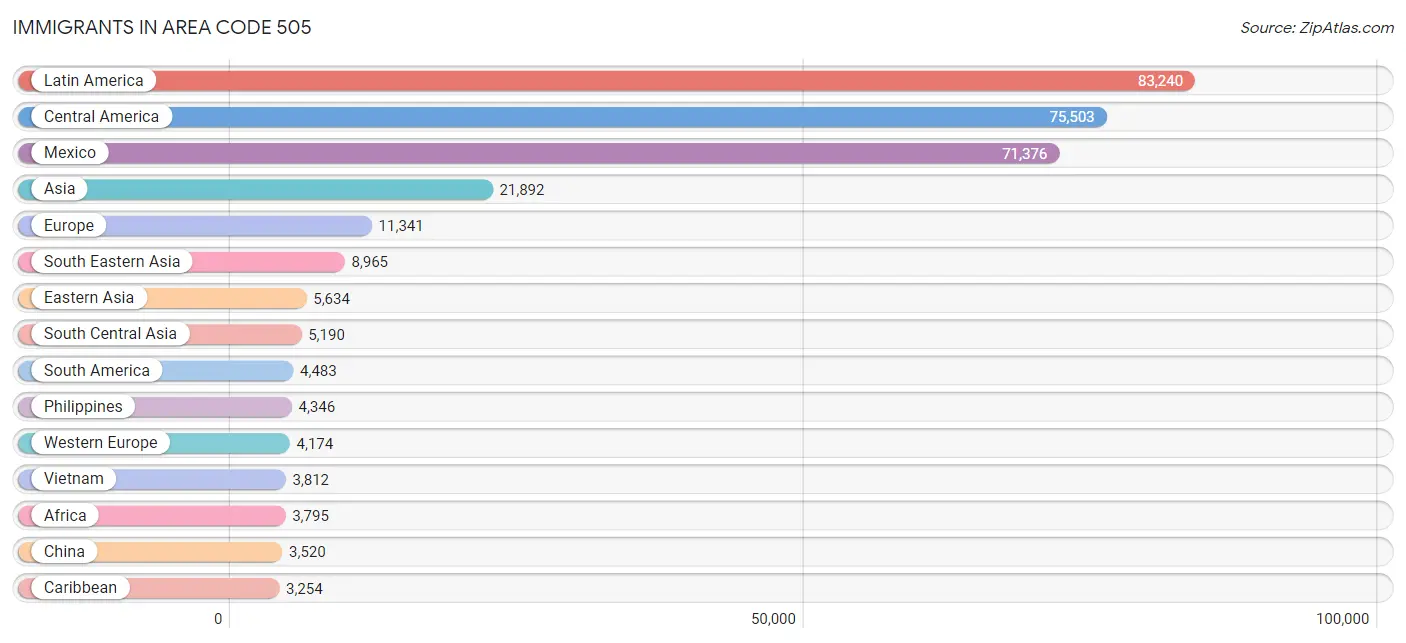
Immigrants in Area Code 505
The most numerous immigrant groups reported in Area Code 505 came from Latin America (83,240 | 5.7%), Central America (75,503 | 5.2%), Mexico (71,376 | 4.9%), Asia (21,892 | 1.5%), and Europe (11,341 | 0.8%), together accounting for 18.0% of all Area Code 505 residents.
| Immigration Origin | # Population | % Population |
| Afghanistan | 387 | 0.0% |
| Africa | 3,795 | 0.3% |
| Albania | 34 | 0.0% |
| Argentina | 346 | 0.0% |
| Armenia | 26 | 0.0% |
| Asia | 21,892 | 1.5% |
| Australia | 315 | 0.0% |
| Austria | 160 | 0.0% |
| Azores | 10 | 0.0% |
| Bangladesh | 295 | 0.0% |
| Belarus | 20 | 0.0% |
| Belgium | 117 | 0.0% |
| Belize | 7 | 0.0% |
| Bolivia | 255 | 0.0% |
| Bosnia and Herzegovina | 23 | 0.0% |
| Brazil | 345 | 0.0% |
| Bulgaria | 92 | 0.0% |
| Cambodia | 39 | 0.0% |
| Cameroon | 186 | 0.0% |
| Canada | 1,719 | 0.1% |
| Caribbean | 3,254 | 0.2% |
| Central America | 75,503 | 5.2% |
| Chile | 441 | 0.0% |
| China | 3,520 | 0.2% |
| Colombia | 1,018 | 0.1% |
| Congo | 51 | 0.0% |
| Costa Rica | 179 | 0.0% |
| Croatia | 6 | 0.0% |
| Cuba | 2,198 | 0.2% |
| Czechoslovakia | 213 | 0.0% |
| Denmark | 45 | 0.0% |
| Dominica | 40 | 0.0% |
| Dominican Republic | 377 | 0.0% |
| Eastern Africa | 1,240 | 0.1% |
| Eastern Asia | 5,634 | 0.4% |
| Eastern Europe | 2,485 | 0.2% |
| Ecuador | 635 | 0.0% |
| Egypt | 65 | 0.0% |
| El Salvador | 1,266 | 0.1% |
| England | 1,285 | 0.1% |
| Eritrea | 20 | 0.0% |
| Ethiopia | 205 | 0.0% |
| Europe | 11,341 | 0.8% |
| Fiji | 14 | 0.0% |
| France | 588 | 0.0% |
| Germany | 2,895 | 0.2% |
| Ghana | 98 | 0.0% |
| Greece | 542 | 0.0% |
| Guatemala | 1,779 | 0.1% |
| Guyana | 114 | 0.0% |
| Haiti | 99 | 0.0% |
| Honduras | 365 | 0.0% |
| Hong Kong | 104 | 0.0% |
| Hungary | 51 | 0.0% |
| India | 2,448 | 0.2% |
| Indonesia | 192 | 0.0% |
| Iran | 804 | 0.1% |
| Iraq | 549 | 0.0% |
| Ireland | 152 | 0.0% |
| Israel | 221 | 0.0% |
| Italy | 518 | 0.0% |
| Jamaica | 282 | 0.0% |
| Japan | 1,029 | 0.1% |
| Jordan | 340 | 0.0% |
| Kazakhstan | 48 | 0.0% |
| Kenya | 330 | 0.0% |
| Korea | 1,085 | 0.1% |
| Kuwait | 23 | 0.0% |
| Laos | 132 | 0.0% |
| Latin America | 83,240 | 5.7% |
| Latvia | 15 | 0.0% |
| Lebanon | 222 | 0.0% |
| Liberia | 140 | 0.0% |
| Lithuania | 8 | 0.0% |
| Malaysia | 76 | 0.0% |
| Mexico | 71,376 | 4.9% |
| Micronesia | 147 | 0.0% |
| Middle Africa | 716 | 0.1% |
| Moldova | 22 | 0.0% |
| Morocco | 119 | 0.0% |
| Nepal | 393 | 0.0% |
| Netherlands | 278 | 0.0% |
| Nicaragua | 315 | 0.0% |
| Nigeria | 664 | 0.1% |
| Northern Africa | 240 | 0.0% |
| Northern Europe | 3,018 | 0.2% |
| Norway | 69 | 0.0% |
| Oceania | 677 | 0.1% |
| Pakistan | 577 | 0.0% |
| Panama | 127 | 0.0% |
| Peru | 850 | 0.1% |
| Philippines | 4,346 | 0.3% |
| Poland | 287 | 0.0% |
| Portugal | 51 | 0.0% |
| Romania | 281 | 0.0% |
| Russia | 588 | 0.0% |
| Saudi Arabia | 67 | 0.0% |
| Scotland | 116 | 0.0% |
| Serbia | 283 | 0.0% |
| Sierra Leone | 23 | 0.0% |
| Singapore | 13 | 0.0% |
| South Africa | 351 | 0.0% |
| South America | 4,483 | 0.3% |
| South Central Asia | 5,190 | 0.4% |
| South Eastern Asia | 8,965 | 0.6% |
| Southern Europe | 1,654 | 0.1% |
| Spain | 542 | 0.0% |
| Sri Lanka | 66 | 0.0% |
| St. Vincent and the Grenadines | 9 | 0.0% |
| Sudan | 29 | 0.0% |
| Sweden | 130 | 0.0% |
| Switzerland | 112 | 0.0% |
| Syria | 154 | 0.0% |
| Taiwan | 504 | 0.0% |
| Thailand | 351 | 0.0% |
| Trinidad and Tobago | 78 | 0.0% |
| Turkey | 314 | 0.0% |
| Uganda | 23 | 0.0% |
| Ukraine | 383 | 0.0% |
| Uruguay | 19 | 0.0% |
| Uzbekistan | 121 | 0.0% |
| Venezuela | 420 | 0.0% |
| Vietnam | 3,812 | 0.3% |
| West Indies | 100 | 0.0% |
| Western Africa | 1,002 | 0.1% |
| Western Asia | 1,978 | 0.1% |
| Western Europe | 4,174 | 0.3% |
| Zaire | 459 | 0.0% |
| Zimbabwe | 118 | 0.0% | View All 129 Rows |
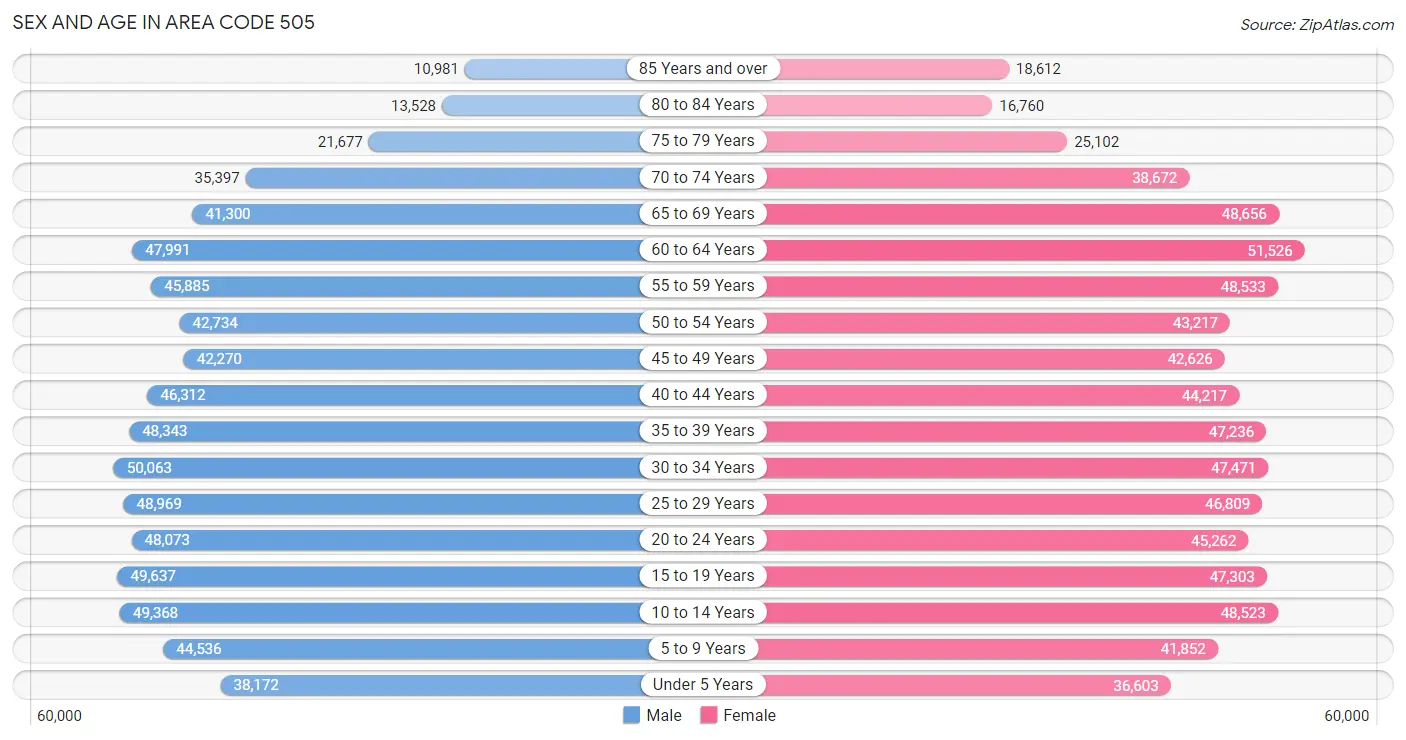
Sex and Age in Area Code 505
Sex and Age in Area Code 505
The most populous age groups in Area Code 505 are 30 to 34 Years (50,063 | 6.9%) for men and 60 to 64 Years (51,526 | 7.0%) for women.
| Age Bracket | Male | Female |
| Under 5 Years | 38,172 (5.3%) | 36,603 (5.0%) |
| 5 to 9 Years | 44,536 (6.1%) | 41,852 (5.7%) |
| 10 to 14 Years | 49,368 (6.8%) | 48,523 (6.6%) |
| 15 to 19 Years | 49,637 (6.8%) | 47,303 (6.4%) |
| 20 to 24 Years | 48,073 (6.6%) | 45,262 (6.1%) |
| 25 to 29 Years | 48,969 (6.8%) | 46,809 (6.3%) |
| 30 to 34 Years | 50,063 (6.9%) | 47,471 (6.4%) |
| 35 to 39 Years | 48,343 (6.7%) | 47,236 (6.4%) |
| 40 to 44 Years | 46,312 (6.4%) | 44,217 (6.0%) |
| 45 to 49 Years | 42,270 (5.8%) | 42,626 (5.8%) |
| 50 to 54 Years | 42,734 (5.9%) | 43,217 (5.9%) |
| 55 to 59 Years | 45,885 (6.3%) | 48,533 (6.6%) |
| 60 to 64 Years | 47,991 (6.6%) | 51,526 (7.0%) |
| 65 to 69 Years | 41,300 (5.7%) | 48,656 (6.6%) |
| 70 to 74 Years | 35,397 (4.9%) | 38,672 (5.2%) |
| 75 to 79 Years | 21,677 (3.0%) | 25,102 (3.4%) |
| 80 to 84 Years | 13,528 (1.9%) | 16,760 (2.3%) |
| 85 Years and over | 10,981 (1.5%) | 18,612 (2.5%) |
| Total | 725,236 (100.0%) | 738,980 (100.0%) |
Families and Households in Area Code 505
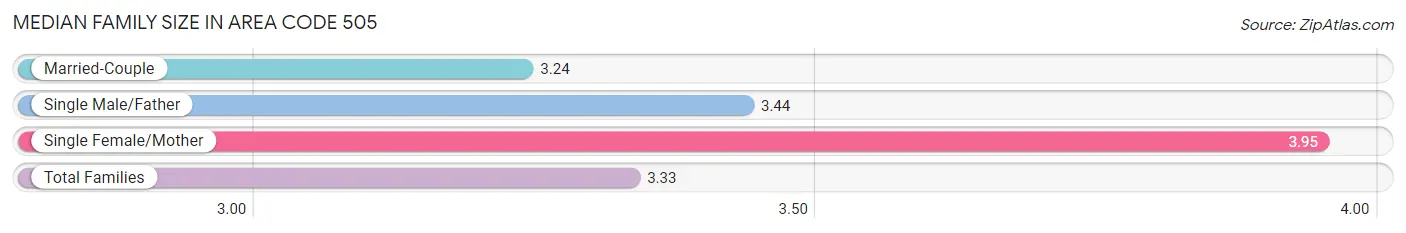
Median Family Size in Area Code 505
The median family size in Area Code 505 is 3.33 persons per family, with single female/mother families (80,608 | 22.9%) accounting for the largest median family size of 3.94906 persons per family. On the other hand, married-couple families (236,259 | 67.2%) represent the smallest median family size with 3.24 persons per family.
| Family Type | # Families | Family Size |
| Married-Couple | 236,259 (67.2%) | 3.24 |
| Single Male/Father | 34,936 (9.9%) | 3.44 |
| Single Female/Mother | 80,608 (22.9%) | 3.95 |
| Total Families | 351,803 (100.0%) | 3.33 |
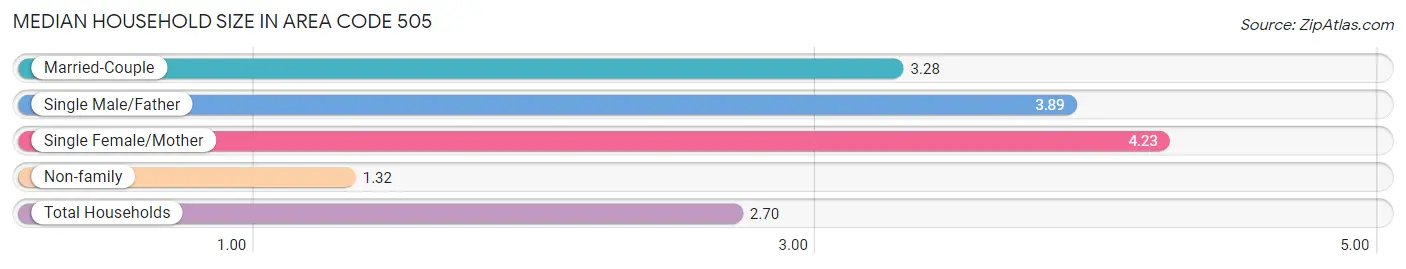
Median Household Size in Area Code 505
The median household size in Area Code 505 is 2.70 persons per household, with single female/mother households (80,608 | 14.1%) accounting for the largest median household size of 4.2254 persons per household. non-family households (218,872 | 38.4%) represent the smallest median household size with 1.32 persons per household.
| Household Type | # Households | Household Size |
| Married-Couple | 236,259 (41.4%) | 3.28 |
| Single Male/Father | 34,936 (6.1%) | 3.89 |
| Single Female/Mother | 80,608 (14.1%) | 4.23 |
| Non-family | 218,872 (38.4%) | 1.32 |
| Total Households | 570,675 (100.0%) | 2.70 |
Household Size by Marriage Status in Area Code 505
Out of a total of 570,675 households in Area Code 505, 351,803 (61.7%) are family households, while 218,872 (38.4%) are nonfamily households. The most numerous type of family households are 2-person households, comprising 165,475, and the most common type of nonfamily households are 1-person households, comprising 181,314.
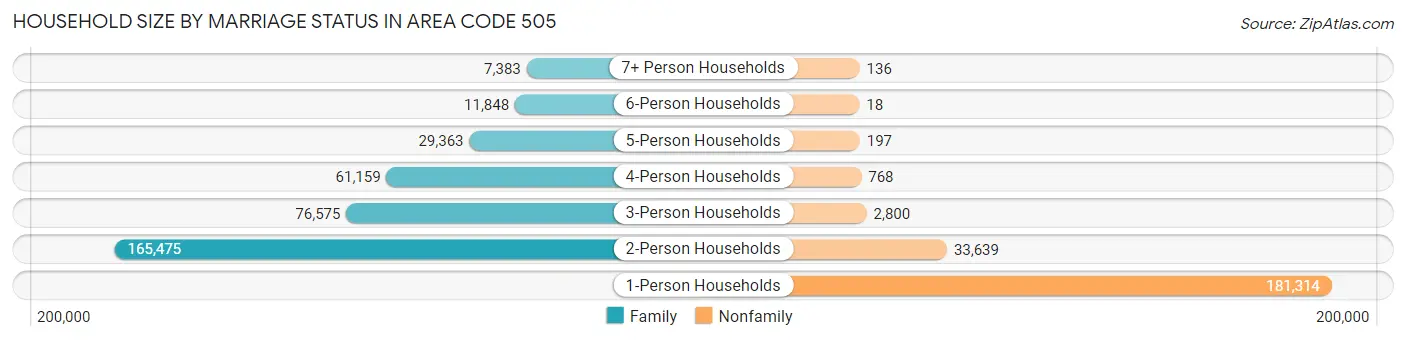
| Household Size | Family Households | Nonfamily Households |
| 1-Person Households | - | 181,314 (31.8%) |
| 2-Person Households | 165,475 (29.0%) | 33,639 (5.9%) |
| 3-Person Households | 76,575 (13.4%) | 2,800 (0.5%) |
| 4-Person Households | 61,159 (10.7%) | 768 (0.1%) |
| 5-Person Households | 29,363 (5.1%) | 197 (0.0%) |
| 6-Person Households | 11,848 (2.1%) | 18 (0.0%) |
| 7+ Person Households | 7,383 (1.3%) | 136 (0.0%) |
| Total | 351,803 (61.7%) | 218,872 (38.4%) |
Female Fertility in Area Code 505
Fertility by Age in Area Code 505
Average fertility rate in Area Code 505 is 63.8 births per 1,000 women. Women in the age bracket of 20 to 34 years have the highest fertility rate with 122.4 births per 1,000 women. Women in the age bracket of 20 to 34 years acount for 70.0% of all women with births.
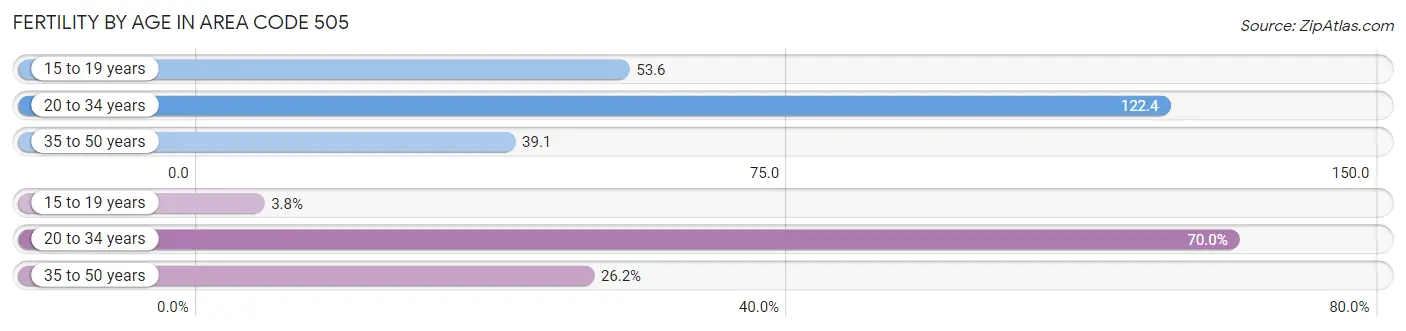
| Age Bracket | Women with Births | Births / 1,000 Women |
| 15 to 19 years | 639 (3.8%) | 53.6 |
| 20 to 34 years | 11,751 (70.0%) | 122.4 |
| 35 to 50 years | 4,396 (26.2%) | 39.1 |
| Total | 16,786 (100.0%) | 63.8 |
Fertility by Age by Marriage Status in Area Code 505
34.2% of women with births (16,786) in Area Code 505 are married. The highest percentage of unmarried women with births falls into 15 to 19 years age bracket with 100.0% of them unmarried at the time of birth, while the lowest percentage of unmarried women with births belong to 35 to 50 years age bracket with 57.4% of them unmarried.
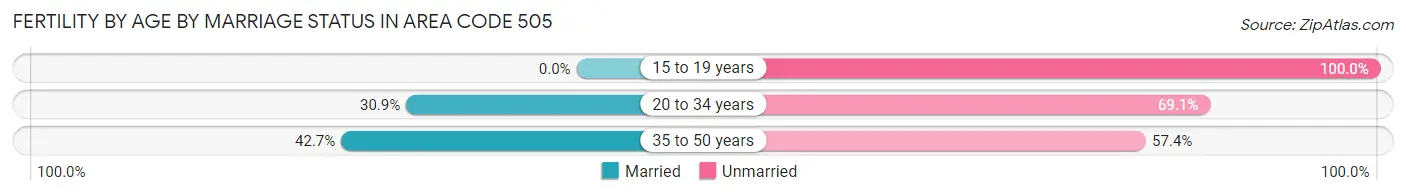
| Age Bracket | Married | Unmarried |
| 15 to 19 years | 0 (0.0%) | 639 (100.0%) |
| 20 to 34 years | 3,629 (30.9%) | 8,122 (69.1%) |
| 35 to 50 years | 1,875 (42.6%) | 2,521 (57.4%) |
| Total | 5,734 (34.2%) | 11,052 (65.8%) |
Fertility by Education in Area Code 505
Average fertility rate in Area Code 505 is 63.8 births per 1,000 women. Women with the education attainment of graduate degree have the highest fertility rate of 134.7 births per 1,000 women, while women with the education attainment of less than high school have the lowest fertility at 67.1 births per 1,000 women. Women with the education attainment of college or associate's degree represent 34.8% of all women with births.
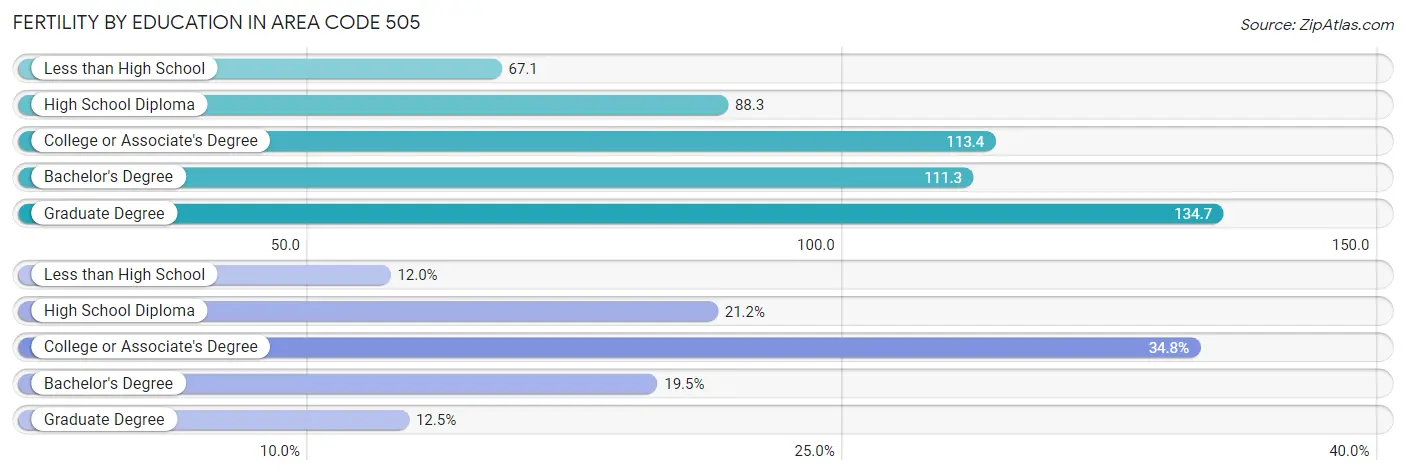
| Educational Attainment | Women with Births | Births / 1,000 Women |
| Less than High School | 2,015 (12.0%) | 67.1 |
| High School Diploma | 3,559 (21.2%) | 88.3 |
| College or Associate's Degree | 5,837 (34.8%) | 113.4 |
| Bachelor's Degree | 3,274 (19.5%) | 111.3 |
| Graduate Degree | 2,101 (12.5%) | 134.7 |
| Total | 16,786 (100.0%) | 63.8 |
Fertility by Education by Marriage Status in Area Code 505
65.8% of women with births in Area Code 505 are unmarried. Women with the educational attainment of bachelor's degree are most likely to be married with 48.7% of them married at childbirth, while women with the educational attainment of less than high school are least likely to be married with 85.5% of them unmarried at childbirth.
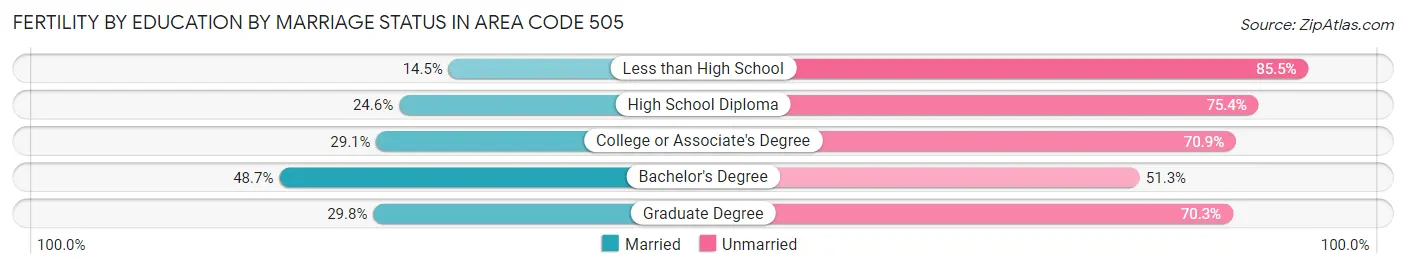
| Educational Attainment | Married | Unmarried |
| Less than High School | 293 (14.5%) | 1,722 (85.5%) |
| High School Diploma | 874 (24.6%) | 2,685 (75.4%) |
| College or Associate's Degree | 1,700 (29.1%) | 4,137 (70.9%) |
| Bachelor's Degree | 1,594 (48.7%) | 1,680 (51.3%) |
| Graduate Degree | 625 (29.7%) | 1,476 (70.3%) |
| Total | 5,734 (34.2%) | 11,052 (65.8%) |
Employment Characteristics in Area Code 505
Employment by Class of Employer in Area Code 505
Among the 637,943 employed individuals in Area Code 505, private company employees (366,945 | 57.5%), local government employees (54,737 | 8.6%), and not-for-profit organizations (53,884 | 8.5%) make up the most common classes of employment.
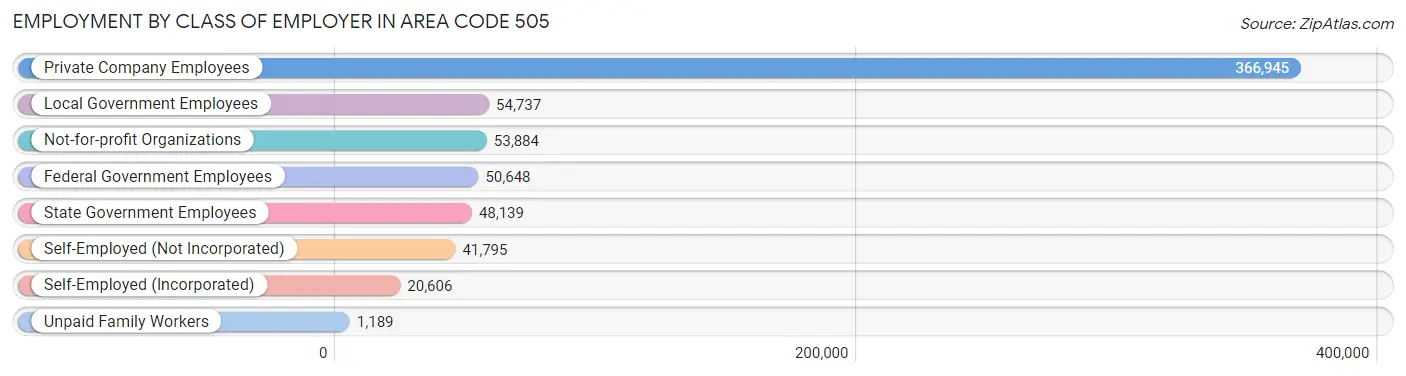
| Employer Class | # Employees | % Employees |
| Private Company Employees | 366,945 | 57.5% |
| Self-Employed (Incorporated) | 20,606 | 3.2% |
| Self-Employed (Not Incorporated) | 41,795 | 6.6% |
| Not-for-profit Organizations | 53,884 | 8.5% |
| Local Government Employees | 54,737 | 8.6% |
| State Government Employees | 48,139 | 7.5% |
| Federal Government Employees | 50,648 | 7.9% |
| Unpaid Family Workers | 1,189 | 0.2% |
| Total | 637,943 | 100.0% |
Employment Status by Age in Area Code 505
According to the labor force statistics for Area Code 505, out of the total population over 16 years of age (1,186,070), 53.2% or 630,871 individuals are in the labor force, with 10.8% or 67,882 of them unemployed. The age group with the highest labor force participation rate is 25 to 29 years, with 79.1% or 75,760 individuals in the labor force. Within the labor force, the 16 to 19 years age range has the highest percentage of unemployed individuals, with 2,400.6% or 723,229 of them being unemployed.
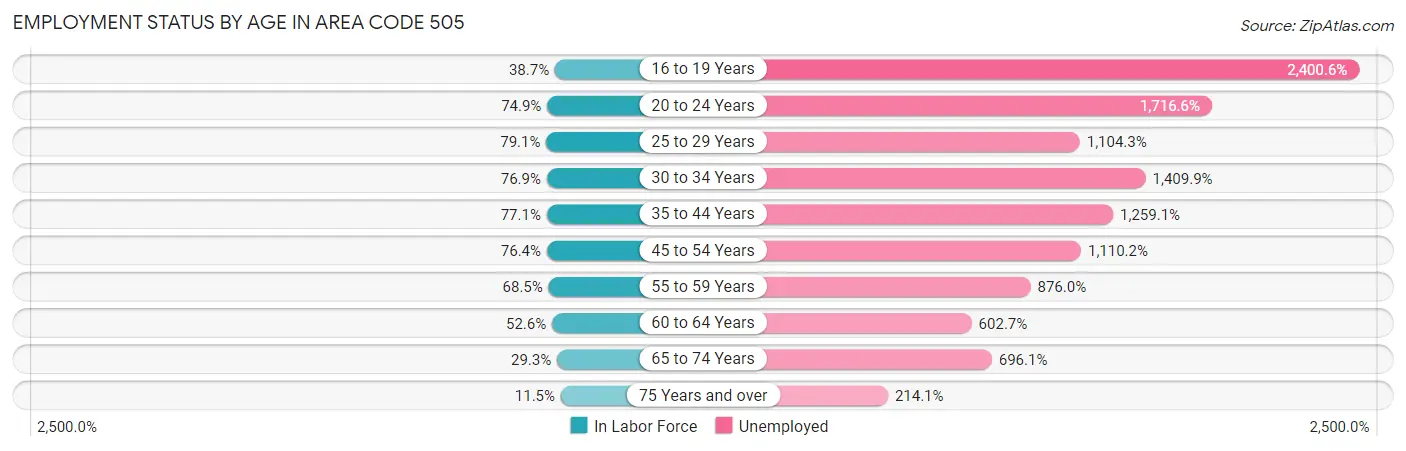
| Age Bracket | In Labor Force | Unemployed |
| 16 to 19 Years | 30,128 (38.7%) | 723,229 (2,400.6%) |
| 20 to 24 Years | 69,886 (74.9%) | 1,199,715 (1,716.6%) |
| 25 to 29 Years | 75,764 (79.1%) | 836,618 (1,104.3%) |
| 30 to 34 Years | 74,975 (76.9%) | 1,057,058 (1,409.9%) |
| 35 to 44 Years | 143,466 (77.1%) | 1,806,443 (1,259.1%) |
| 45 to 54 Years | 130,594 (76.4%) | 1,449,866 (1,110.2%) |
| 55 to 59 Years | 64,624 (68.4%) | 566,150 (876.0%) |
| 60 to 64 Years | 52,351 (52.6%) | 315,489 (602.7%) |
| 65 to 74 Years | 47,978 (29.2%) | 333,968 (696.1%) |
| 75 Years and over | 12,228 (11.5%) | 26,169 (214.1%) |
| Total | 630,865 (53.2%) | 67,889 (10.8%) |
Employment Status by Educational Attainment in Area Code 505
According to labor force statistics for Area Code 505, 69.6% of individuals (517,741) out of the total population between 25 and 64 years of age (744,202) are in the labor force, with 1,563.0% or 8,092,292 of them being unemployed. The group with the highest labor force participation rate are those with the educational attainment of bachelor's degree or higher, with 80.3% or 180,929 individuals in the labor force. Within the labor force, individuals with less than high school education have the highest percentage of unemployment, with 1,657.5% or 816,302 of them being unemployed.
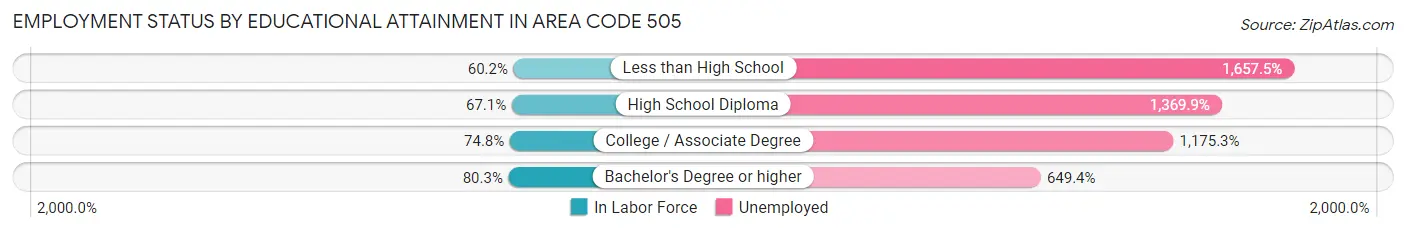
| Educational Attainment | In Labor Force | Unemployed |
| Less than High School | 49,247 (60.2%) | 1,355,984 (1,657.5%) |
| High School Diploma | 126,913 (67.1%) | 2,589,577 (1,369.9%) |
| College / Associate Degree | 185,486 (74.8%) | 2,914,591 (1,175.3%) |
| Bachelor's Degree or higher | 180,933 (80.3%) | 1,463,566 (649.4%) |
| Total | 517,734 (69.6%) | 11,631,877 (1,563.0%) |
Employment Occupations by Sex in Area Code 505
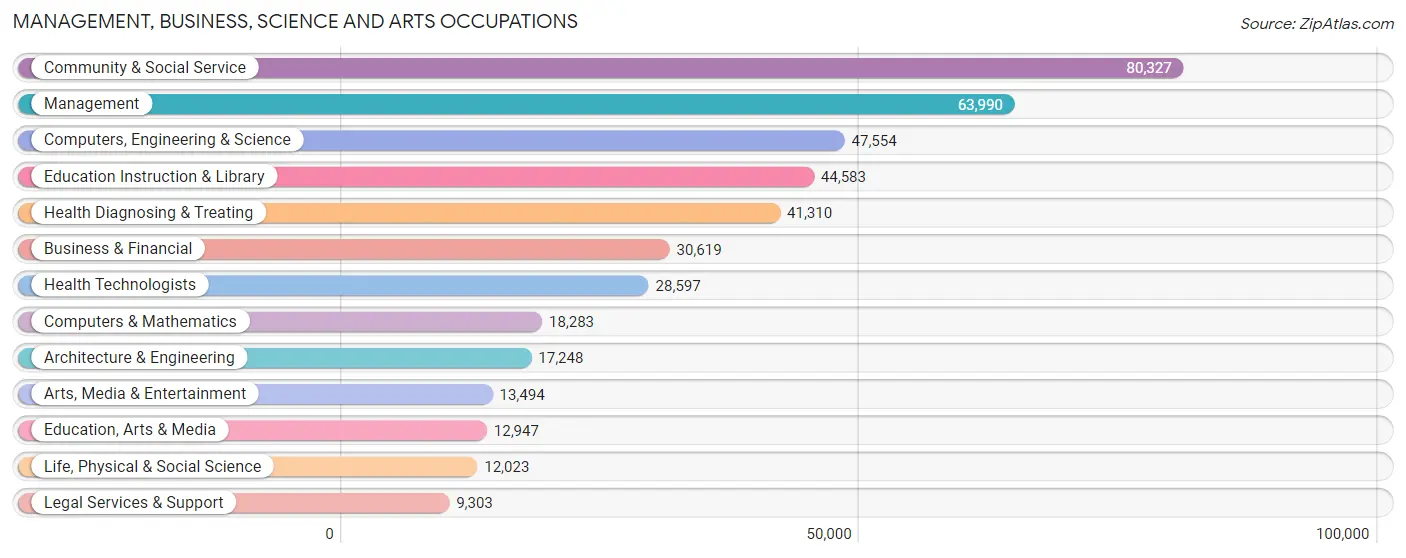
Management, Business, Science and Arts Occupations
The most common Management, Business, Science and Arts occupations in Area Code 505 are Community & Social Service (80,327 | 12.5%), Management (63,990 | 10.0%), Computers, Engineering & Science (47,554 | 7.4%), Education Instruction & Library (44,583 | 6.9%), and Health Diagnosing & Treating (41,310 | 6.4%).
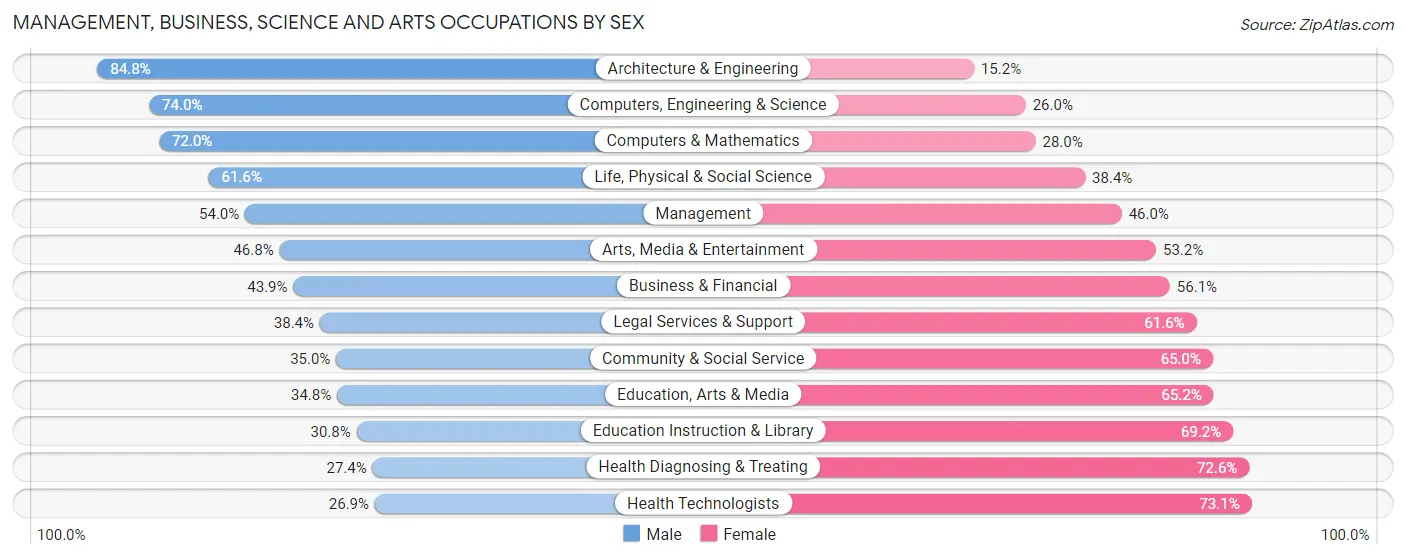
Management, Business, Science and Arts Occupations by Sex
Within the Management, Business, Science and Arts occupations in Area Code 505, the most male-oriented occupations are Architecture & Engineering (84.8%), Computers, Engineering & Science (74.0%), and Computers & Mathematics (72.0%), while the most female-oriented occupations are Health Technologists (73.1%), Health Diagnosing & Treating (72.6%), and Education Instruction & Library (69.2%).
| Occupation | Male | Female |
| Management | 34,552 (54.0%) | 29,438 (46.0%) |
| Business & Financial | 13,455 (43.9%) | 17,164 (56.1%) |
| Computers, Engineering & Science | 35,195 (74.0%) | 12,359 (26.0%) |
| Computers & Mathematics | 13,158 (72.0%) | 5,125 (28.0%) |
| Architecture & Engineering | 14,628 (84.8%) | 2,620 (15.2%) |
| Life, Physical & Social Science | 7,409 (61.6%) | 4,614 (38.4%) |
| Community & Social Service | 28,114 (35.0%) | 52,213 (65.0%) |
| Education, Arts & Media | 4,508 (34.8%) | 8,439 (65.2%) |
| Legal Services & Support | 3,573 (38.4%) | 5,730 (61.6%) |
| Education Instruction & Library | 13,714 (30.8%) | 30,869 (69.2%) |
| Arts, Media & Entertainment | 6,319 (46.8%) | 7,175 (53.2%) |
| Health Diagnosing & Treating | 11,329 (27.4%) | 29,981 (72.6%) |
| Health Technologists | 7,701 (26.9%) | 20,896 (73.1%) |
| Total (Category) | 122,645 (46.5%) | 141,155 (53.5%) |
| Total (Overall) | 333,842 (52.0%) | 308,478 (48.0%) |
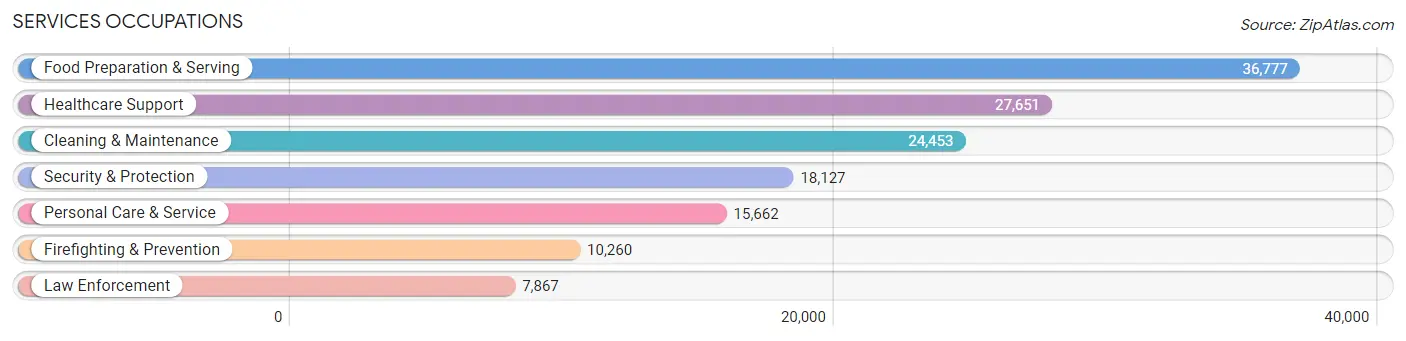
Services Occupations
The most common Services occupations in Area Code 505 are Food Preparation & Serving (36,777 | 5.7%), Healthcare Support (27,651 | 4.3%), Cleaning & Maintenance (24,453 | 3.8%), Security & Protection (18,127 | 2.8%), and Personal Care & Service (15,662 | 2.4%).
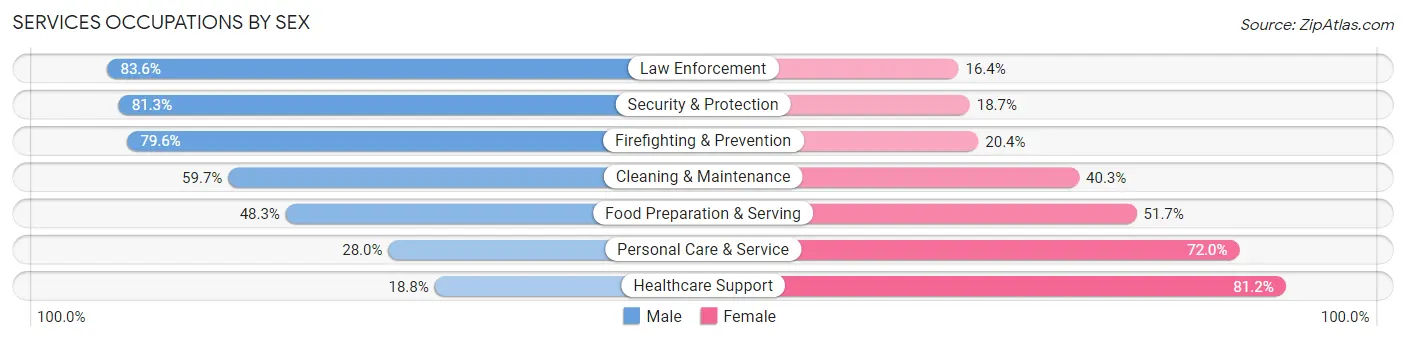
Services Occupations by Sex
Within the Services occupations in Area Code 505, the most male-oriented occupations are Law Enforcement (83.6%), Security & Protection (81.3%), and Firefighting & Prevention (79.6%), while the most female-oriented occupations are Healthcare Support (81.2%), Personal Care & Service (72.0%), and Food Preparation & Serving (51.7%).
| Occupation | Male | Female |
| Healthcare Support | 5,206 (18.8%) | 22,445 (81.2%) |
| Security & Protection | 14,745 (81.3%) | 3,382 (18.7%) |
| Firefighting & Prevention | 8,171 (79.6%) | 2,089 (20.4%) |
| Law Enforcement | 6,574 (83.6%) | 1,293 (16.4%) |
| Food Preparation & Serving | 17,763 (48.3%) | 19,014 (51.7%) |
| Cleaning & Maintenance | 14,597 (59.7%) | 9,856 (40.3%) |
| Personal Care & Service | 4,382 (28.0%) | 11,280 (72.0%) |
| Total (Category) | 56,693 (46.2%) | 65,977 (53.8%) |
| Total (Overall) | 333,842 (52.0%) | 308,478 (48.0%) |
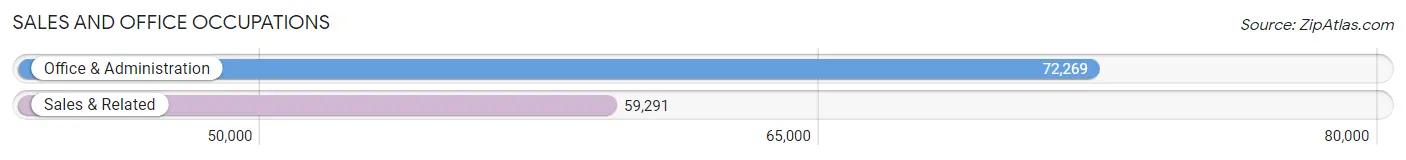
Sales and Office Occupations
The most common Sales and Office occupations in Area Code 505 are Office & Administration (72,269 | 11.3%), and Sales & Related (59,291 | 9.2%).
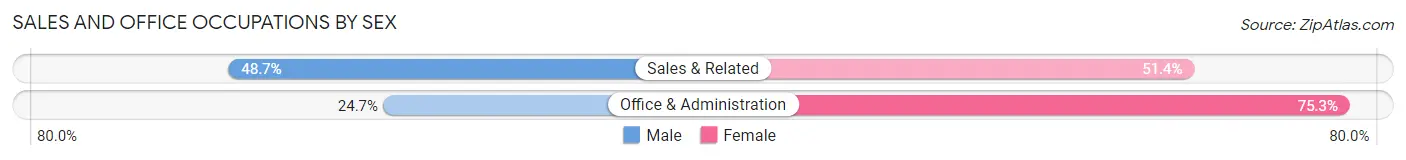
Sales and Office Occupations by Sex
| Occupation | Male | Female |
| Sales & Related | 28,846 (48.6%) | 30,445 (51.3%) |
| Office & Administration | 17,870 (24.7%) | 54,399 (75.3%) |
| Total (Category) | 46,716 (35.5%) | 84,844 (64.5%) |
| Total (Overall) | 333,842 (52.0%) | 308,478 (48.0%) |
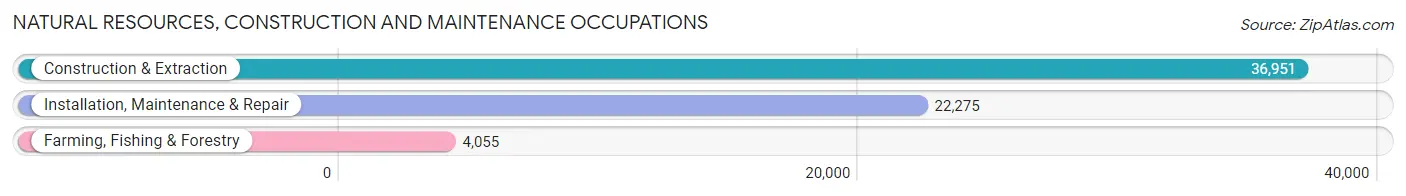
Natural Resources, Construction and Maintenance Occupations
The most common Natural Resources, Construction and Maintenance occupations in Area Code 505 are Construction & Extraction (36,951 | 5.8%), Installation, Maintenance & Repair (22,275 | 3.5%), and Farming, Fishing & Forestry (4,055 | 0.6%).
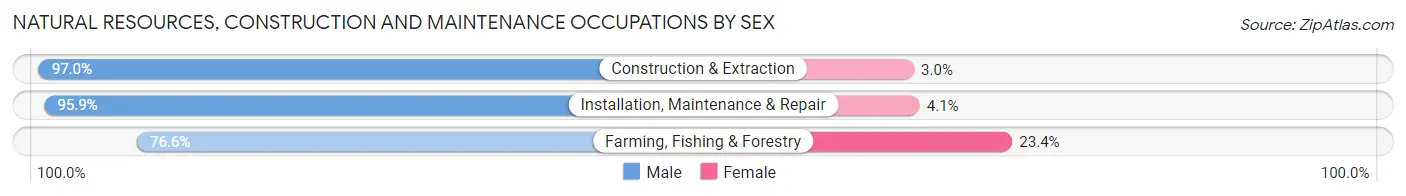
Natural Resources, Construction and Maintenance Occupations by Sex
| Occupation | Male | Female |
| Farming, Fishing & Forestry | 3,106 (76.6%) | 949 (23.4%) |
| Construction & Extraction | 35,858 (97.0%) | 1,093 (3.0%) |
| Installation, Maintenance & Repair | 21,352 (95.9%) | 923 (4.1%) |
| Total (Category) | 60,316 (95.3%) | 2,965 (4.7%) |
| Total (Overall) | 333,842 (52.0%) | 308,478 (48.0%) |
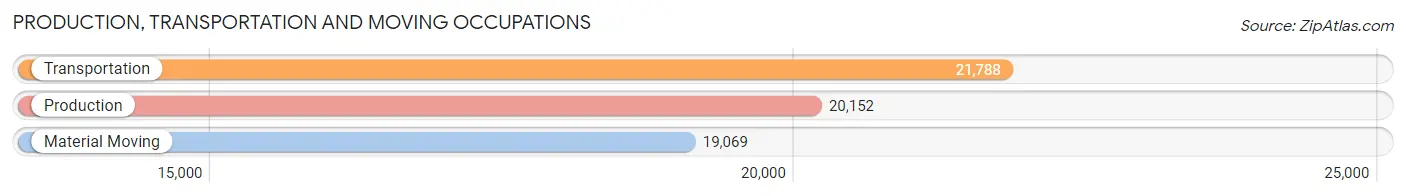
Production, Transportation and Moving Occupations
The most common Production, Transportation and Moving occupations in Area Code 505 are Transportation (21,788 | 3.4%), Production (20,152 | 3.1%), and Material Moving (19,069 | 3.0%).
Production, Transportation and Moving Occupations by Sex
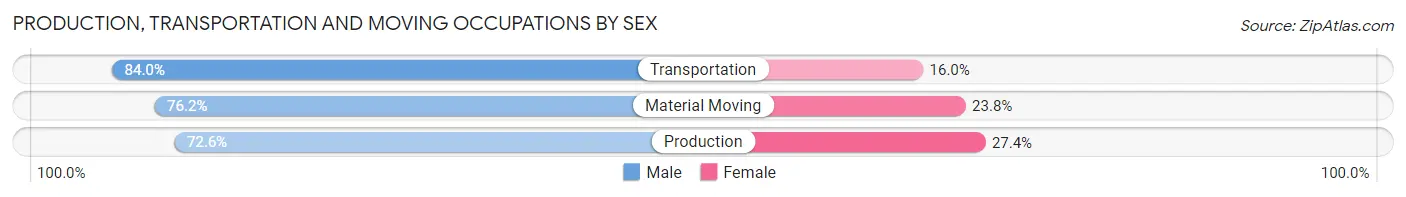
| Occupation | Male | Female |
| Production | 14,628 (72.6%) | 5,524 (27.4%) |
| Transportation | 18,309 (84.0%) | 3,479 (16.0%) |
| Material Moving | 14,535 (76.2%) | 4,534 (23.8%) |
| Total (Category) | 47,472 (77.8%) | 13,537 (22.2%) |
| Total (Overall) | 333,842 (52.0%) | 308,478 (48.0%) |
Employment Industries by Sex in Area Code 505
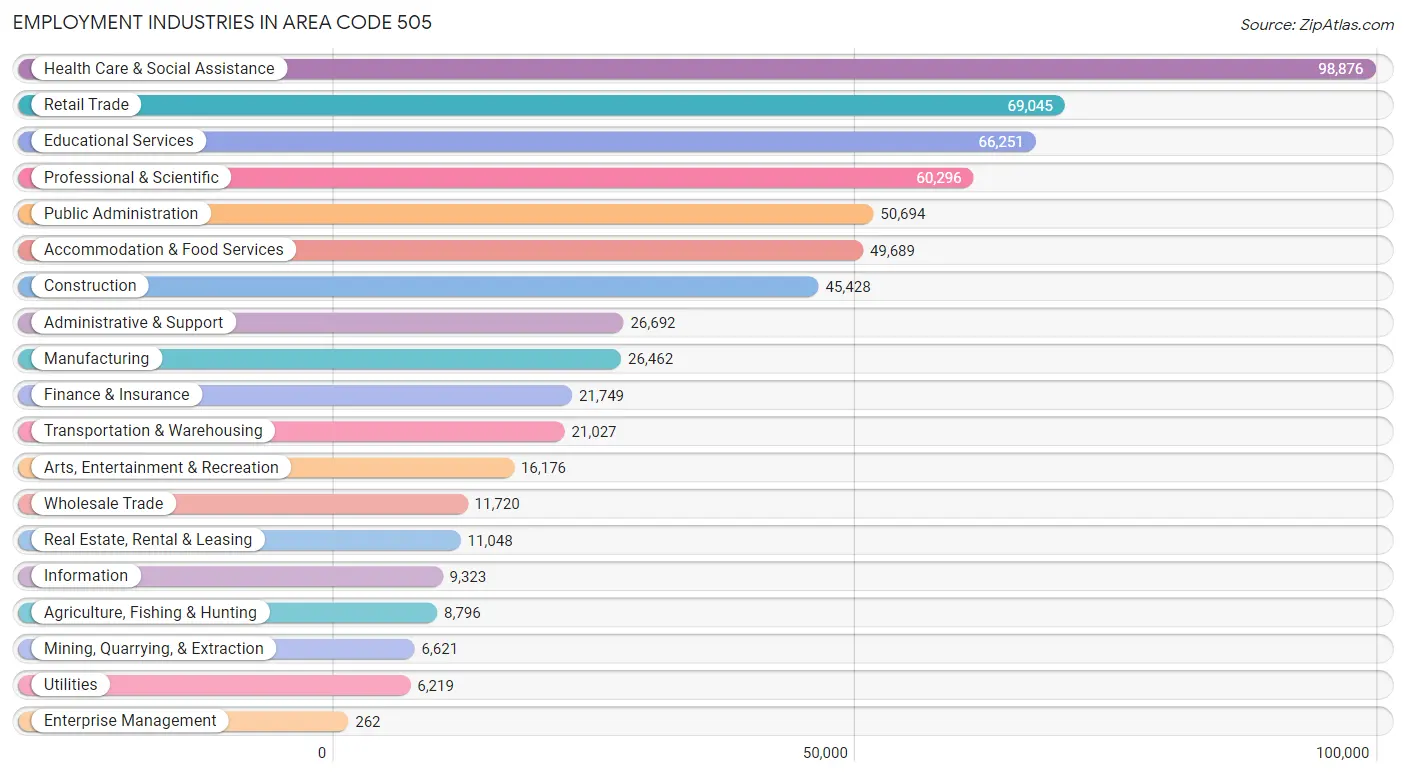
Employment Industries in Area Code 505
The major employment industries in Area Code 505 include Health Care & Social Assistance (98,876 | 15.4%), Retail Trade (69,045 | 10.7%), Educational Services (66,251 | 10.3%), Professional & Scientific (60,296 | 9.4%), and Public Administration (50,694 | 7.9%).
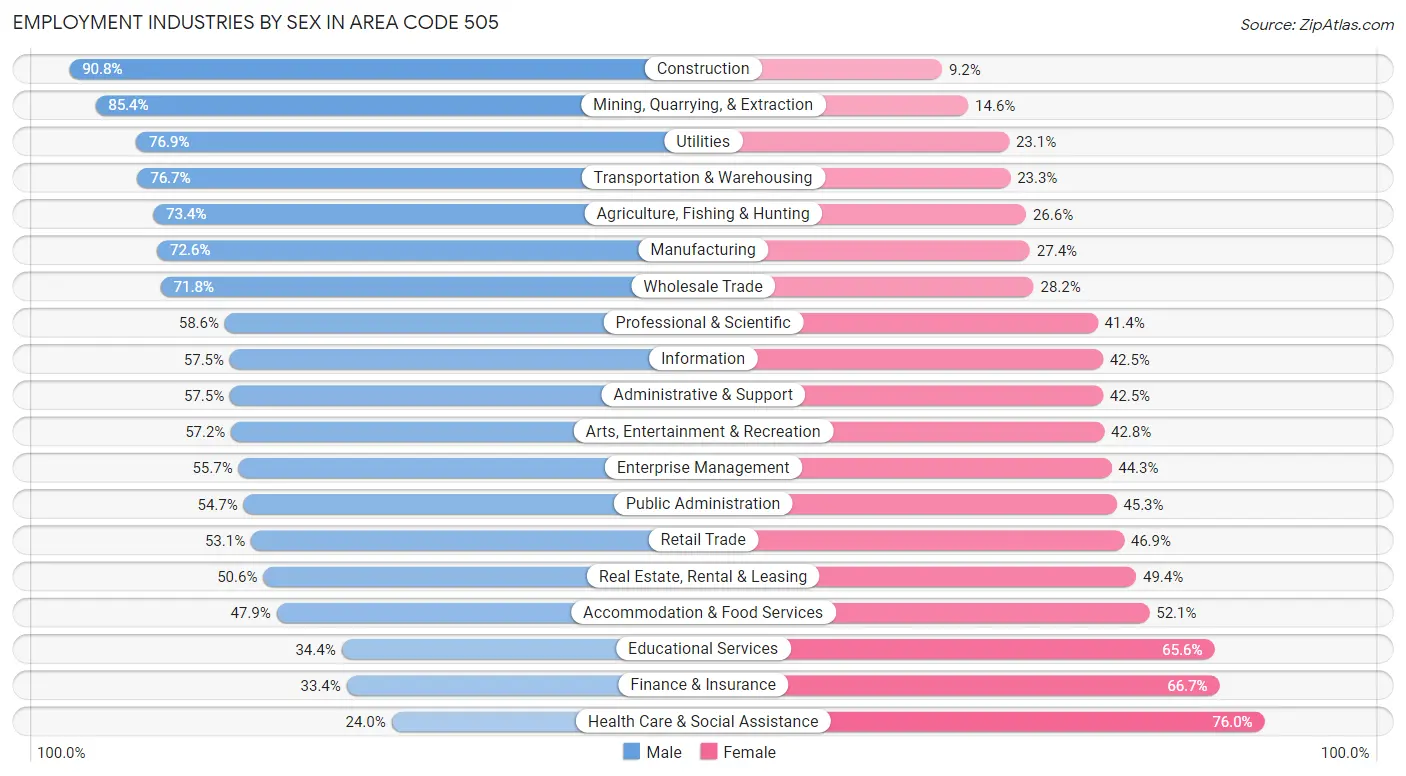
Employment Industries by Sex in Area Code 505
The Area Code 505 industries that see more men than women are Construction (90.8%), Mining, Quarrying, & Extraction (85.4%), and Utilities (76.9%), whereas the industries that tend to have a higher number of women are Health Care & Social Assistance (76.0%), Finance & Insurance (66.6%), and Educational Services (65.6%).
| Industry | Male | Female |
| Agriculture, Fishing & Hunting | 6,455 (73.4%) | 2,341 (26.6%) |
| Mining, Quarrying, & Extraction | 5,652 (85.4%) | 969 (14.6%) |
| Construction | 41,230 (90.8%) | 4,198 (9.2%) |
| Manufacturing | 19,205 (72.6%) | 7,257 (27.4%) |
| Wholesale Trade | 8,418 (71.8%) | 3,302 (28.2%) |
| Retail Trade | 36,688 (53.1%) | 32,357 (46.9%) |
| Transportation & Warehousing | 16,120 (76.7%) | 4,907 (23.3%) |
| Utilities | 4,783 (76.9%) | 1,436 (23.1%) |
| Information | 5,362 (57.5%) | 3,961 (42.5%) |
| Finance & Insurance | 7,253 (33.4%) | 14,496 (66.6%) |
| Real Estate, Rental & Leasing | 5,591 (50.6%) | 5,457 (49.4%) |
| Professional & Scientific | 35,313 (58.6%) | 24,983 (41.4%) |
| Enterprise Management | 146 (55.7%) | 116 (44.3%) |
| Administrative & Support | 15,341 (57.5%) | 11,351 (42.5%) |
| Educational Services | 22,798 (34.4%) | 43,453 (65.6%) |
| Health Care & Social Assistance | 23,771 (24.0%) | 75,105 (76.0%) |
| Arts, Entertainment & Recreation | 9,259 (57.2%) | 6,917 (42.8%) |
| Accommodation & Food Services | 23,781 (47.9%) | 25,908 (52.1%) |
| Public Administration | 27,719 (54.7%) | 22,975 (45.3%) |
| Total | 333,842 (52.0%) | 308,478 (48.0%) |
Education in Area Code 505
School Enrollment in Area Code 505
The most common levels of schooling among the 349,430 students in Area Code 505 are middle school (77,255 | 22.1%), high school (76,676 | 21.9%), and college / undergraduate (72,815 | 20.8%).
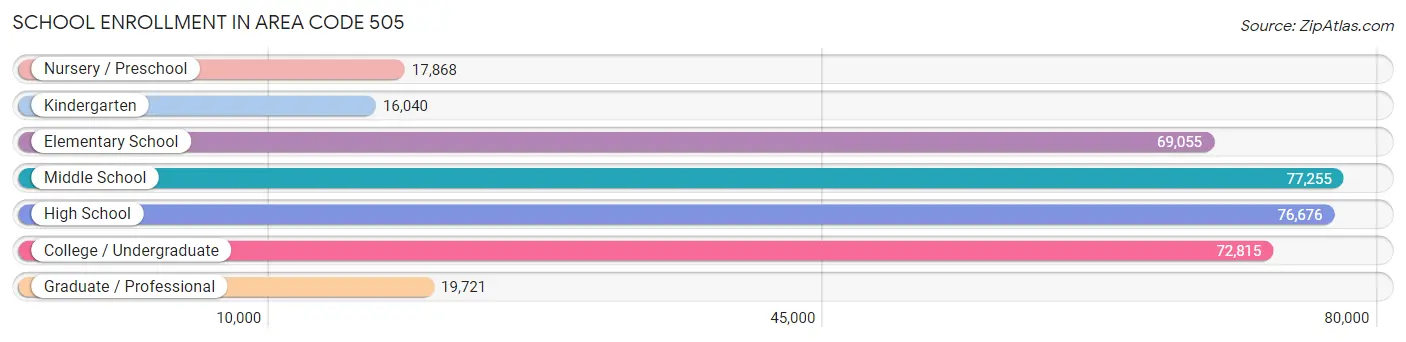
| School Level | # Students | % Students |
| Nursery / Preschool | 17,868 | 5.1% |
| Kindergarten | 16,040 | 4.6% |
| Elementary School | 69,055 | 19.8% |
| Middle School | 77,255 | 22.1% |
| High School | 76,676 | 21.9% |
| College / Undergraduate | 72,815 | 20.8% |
| Graduate / Professional | 19,721 | 5.6% |
| Total | 349,430 | 100.0% |
School Enrollment by Age by Funding Source in Area Code 505
Out of a total of 349,430 students who are enrolled in schools in Area Code 505, 42,322 (12.1%) attend a private institution, while the remaining 307,108 (87.9%) are enrolled in public schools. The age group of 3 to 4 year olds has the highest likelihood of being enrolled in private schools, with 4,130 (30.0% in the age bracket) enrolled. Conversely, the age group of 18 to 19 year olds has the lowest likelihood of being enrolled in a private school, with 23,573 (92.0% in the age bracket) attending a public institution.
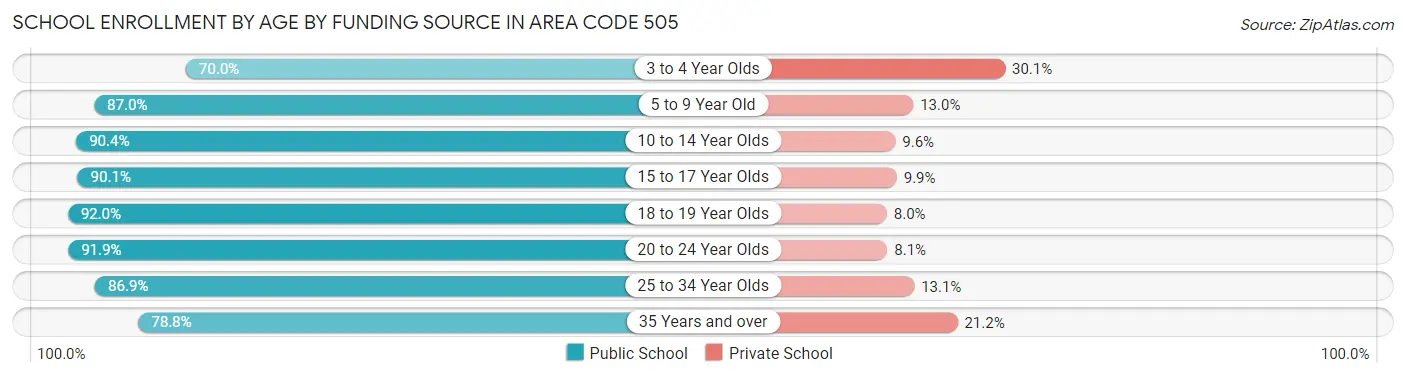
| Age Bracket | Public School | Private School |
| 3 to 4 Year Olds | 9,612 (70.0%) | 4,130 (30.0%) |
| 5 to 9 Year Old | 69,833 (87.0%) | 10,402 (13.0%) |
| 10 to 14 Year Olds | 85,327 (90.4%) | 9,086 (9.6%) |
| 15 to 17 Year Olds | 49,564 (90.1%) | 5,437 (9.9%) |
| 18 to 19 Year Olds | 23,573 (92.0%) | 2,060 (8.0%) |
| 20 to 24 Year Olds | 27,157 (91.9%) | 2,403 (8.1%) |
| 25 to 34 Year Olds | 21,246 (86.9%) | 3,214 (13.1%) |
| 35 Years and over | 20,793 (78.8%) | 5,593 (21.2%) |
| Total | 307,108 (87.9%) | 42,322 (12.1%) |
Educational Attainment by Field of Study in Area Code 505
Business (53,619 | 15.3%), education (43,355 | 12.3%), science & technology (32,571 | 9.3%), social sciences (29,931 | 8.5%), and engineering (27,016 | 7.7%) are the most common fields of study among 350,925 individuals in Area Code 505 who have obtained a bachelor's degree or higher.
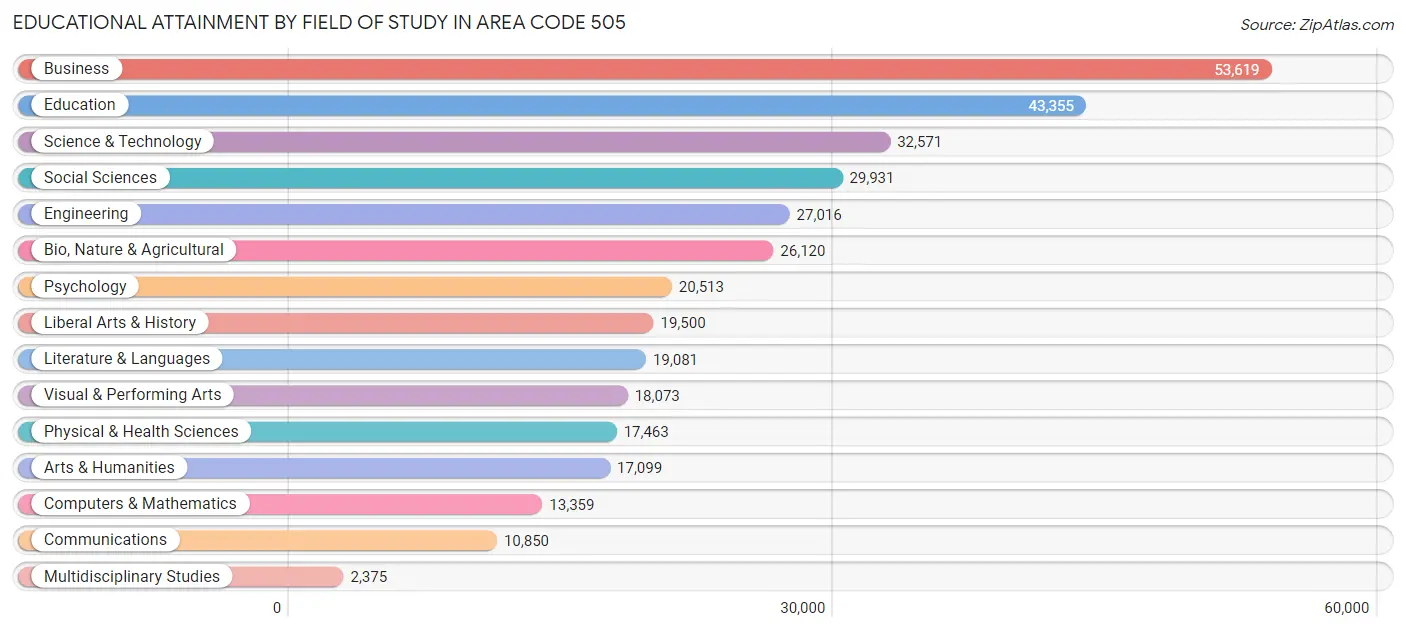
| Field of Study | # Graduates | % Graduates |
| Computers & Mathematics | 13,359 | 3.8% |
| Bio, Nature & Agricultural | 26,120 | 7.4% |
| Physical & Health Sciences | 17,463 | 5.0% |
| Psychology | 20,513 | 5.9% |
| Social Sciences | 29,931 | 8.5% |
| Engineering | 27,016 | 7.7% |
| Multidisciplinary Studies | 2,375 | 0.7% |
| Science & Technology | 32,571 | 9.3% |
| Business | 53,619 | 15.3% |
| Education | 43,355 | 12.3% |
| Literature & Languages | 19,081 | 5.4% |
| Liberal Arts & History | 19,500 | 5.6% |
| Visual & Performing Arts | 18,073 | 5.1% |
| Communications | 10,850 | 3.1% |
| Arts & Humanities | 17,099 | 4.9% |
| Total | 350,925 | 100.0% |
Transportation & Commute in Area Code 505
Vehicle Availability by Sex in Area Code 505
The most prevalent vehicle ownership categories in Area Code 505 are males with 2 vehicles (130,776, accounting for 39.5%) and females with 2 vehicles (114,501, making up 43.4%).
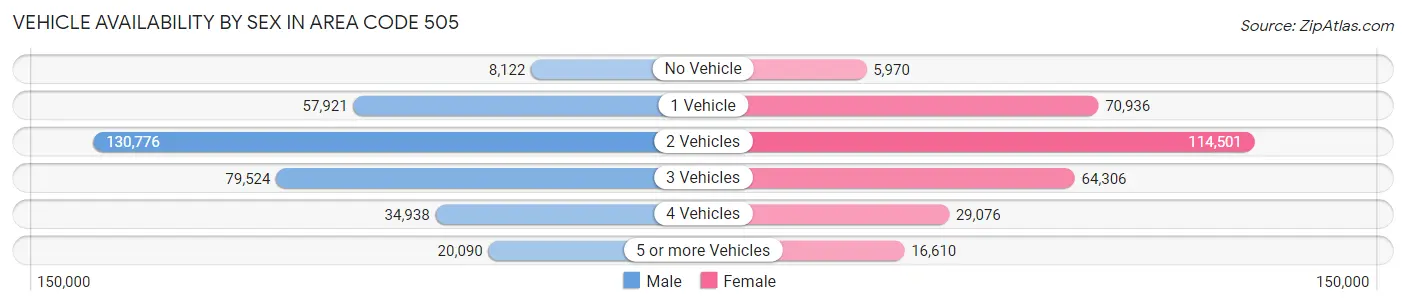
| Vehicles Available | Male | Female |
| No Vehicle | 8,122 (2.5%) | 5,970 (2.0%) |
| 1 Vehicle | 57,921 (17.5%) | 70,936 (23.5%) |
| 2 Vehicles | 130,776 (39.5%) | 114,501 (38.0%) |
| 3 Vehicles | 79,524 (24.0%) | 64,306 (21.3%) |
| 4 Vehicles | 34,938 (10.5%) | 29,076 (9.7%) |
| 5 or more Vehicles | 20,090 (6.1%) | 16,610 (5.5%) |
| Total | 331,371 (100.0%) | 301,399 (100.0%) |
Commute Time in Area Code 505
The most frequently occuring commute durations in Area Code 505 are 15 to 19 minutes (99,931 commuters, 17.6%), 20 to 24 minutes (94,227 commuters, 16.6%), and 10 to 14 minutes (80,284 commuters, 14.1%).
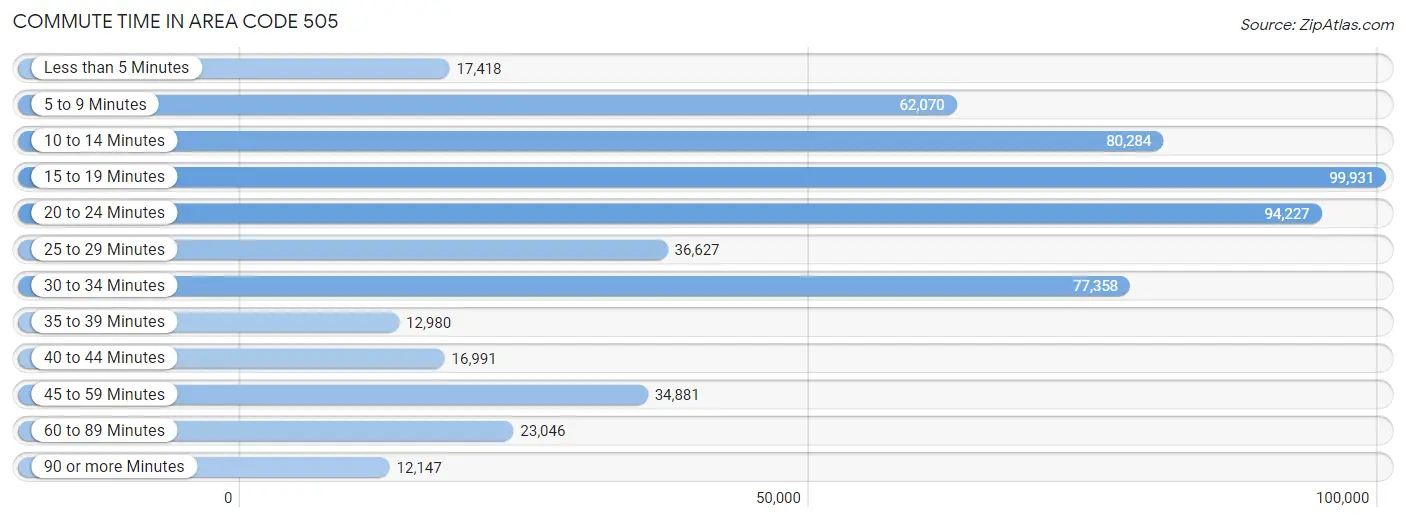
| Commute Time | # Commuters | % Commuters |
| Less than 5 Minutes | 17,418 | 3.1% |
| 5 to 9 Minutes | 62,070 | 10.9% |
| 10 to 14 Minutes | 80,284 | 14.1% |
| 15 to 19 Minutes | 99,931 | 17.6% |
| 20 to 24 Minutes | 94,227 | 16.6% |
| 25 to 29 Minutes | 36,627 | 6.5% |
| 30 to 34 Minutes | 77,358 | 13.6% |
| 35 to 39 Minutes | 12,980 | 2.3% |
| 40 to 44 Minutes | 16,991 | 3.0% |
| 45 to 59 Minutes | 34,881 | 6.1% |
| 60 to 89 Minutes | 23,046 | 4.1% |
| 90 or more Minutes | 12,147 | 2.1% |
Commute Time by Sex in Area Code 505
The most common commute times in Area Code 505 are 15 to 19 minutes (52,915 commuters, 17.5%) for males and 15 to 19 minutes (47,016 commuters, 17.7%) for females.
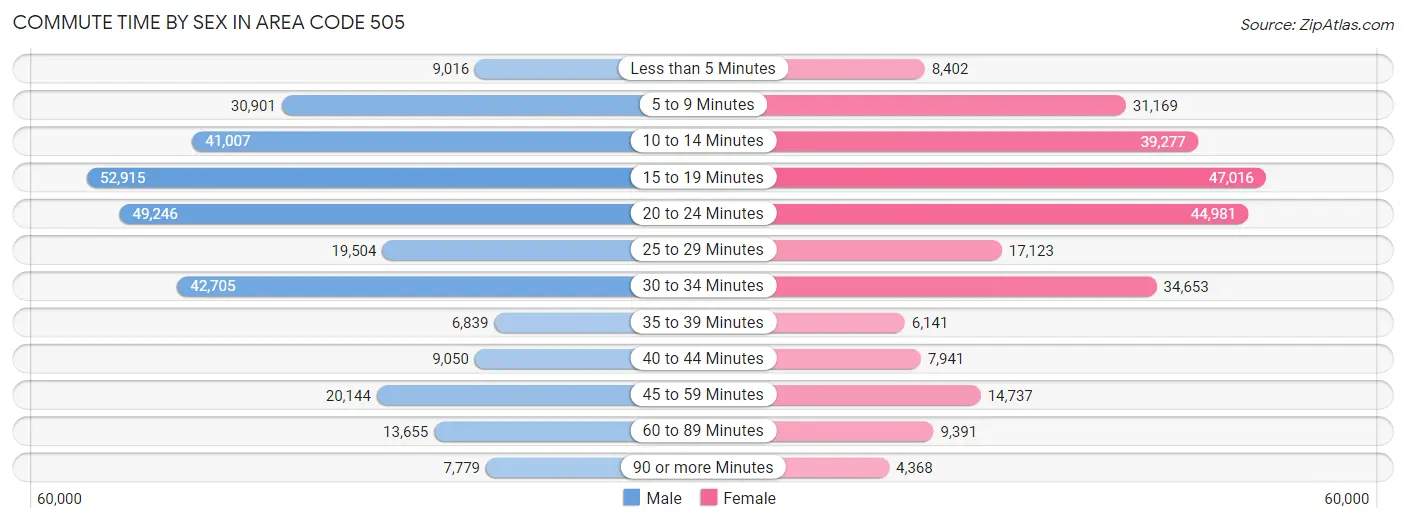
| Commute Time | Male | Female |
| Less than 5 Minutes | 9,016 (3.0%) | 8,402 (3.2%) |
| 5 to 9 Minutes | 30,901 (10.2%) | 31,169 (11.7%) |
| 10 to 14 Minutes | 41,007 (13.5%) | 39,277 (14.8%) |
| 15 to 19 Minutes | 52,915 (17.5%) | 47,016 (17.7%) |
| 20 to 24 Minutes | 49,246 (16.3%) | 44,981 (17.0%) |
| 25 to 29 Minutes | 19,504 (6.4%) | 17,123 (6.5%) |
| 30 to 34 Minutes | 42,705 (14.1%) | 34,653 (13.1%) |
| 35 to 39 Minutes | 6,839 (2.3%) | 6,141 (2.3%) |
| 40 to 44 Minutes | 9,050 (3.0%) | 7,941 (3.0%) |
| 45 to 59 Minutes | 20,144 (6.7%) | 14,737 (5.6%) |
| 60 to 89 Minutes | 13,655 (4.5%) | 9,391 (3.5%) |
| 90 or more Minutes | 7,779 (2.6%) | 4,368 (1.7%) |
Time of Departure to Work by Sex in Area Code 505
The most frequent times of departure to work in Area Code 505 are 7:00 AM to 7:29 AM (46,259, 15.3%) for males and 7:30 AM to 7:59 AM (45,716, 17.2%) for females.
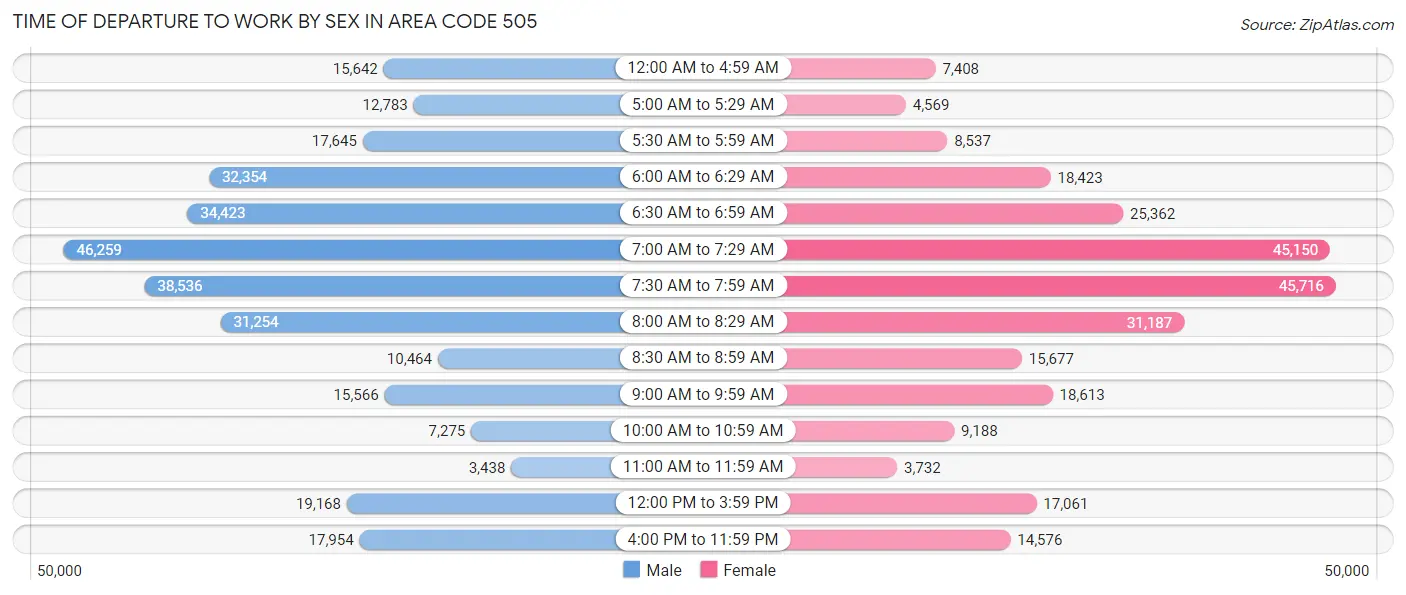
| Time of Departure | Male | Female |
| 12:00 AM to 4:59 AM | 15,642 (5.2%) | 7,408 (2.8%) |
| 5:00 AM to 5:29 AM | 12,783 (4.2%) | 4,569 (1.7%) |
| 5:30 AM to 5:59 AM | 17,645 (5.8%) | 8,537 (3.2%) |
| 6:00 AM to 6:29 AM | 32,354 (10.7%) | 18,423 (7.0%) |
| 6:30 AM to 6:59 AM | 34,423 (11.4%) | 25,362 (9.6%) |
| 7:00 AM to 7:29 AM | 46,259 (15.3%) | 45,150 (17.0%) |
| 7:30 AM to 7:59 AM | 38,536 (12.7%) | 45,716 (17.2%) |
| 8:00 AM to 8:29 AM | 31,254 (10.3%) | 31,187 (11.8%) |
| 8:30 AM to 8:59 AM | 10,464 (3.5%) | 15,677 (5.9%) |
| 9:00 AM to 9:59 AM | 15,566 (5.1%) | 18,613 (7.0%) |
| 10:00 AM to 10:59 AM | 7,275 (2.4%) | 9,188 (3.5%) |
| 11:00 AM to 11:59 AM | 3,438 (1.1%) | 3,732 (1.4%) |
| 12:00 PM to 3:59 PM | 19,168 (6.3%) | 17,061 (6.4%) |
| 4:00 PM to 11:59 PM | 17,954 (5.9%) | 14,576 (5.5%) |
| Total | 302,761 (100.0%) | 265,199 (100.0%) |
Housing Occupancy in Area Code 505
Occupancy by Ownership in Area Code 505
Of the total 570,675 dwellings in Area Code 505, owner-occupied units account for 396,443 (69.5%), while renter-occupied units make up 174,232 (30.5%).
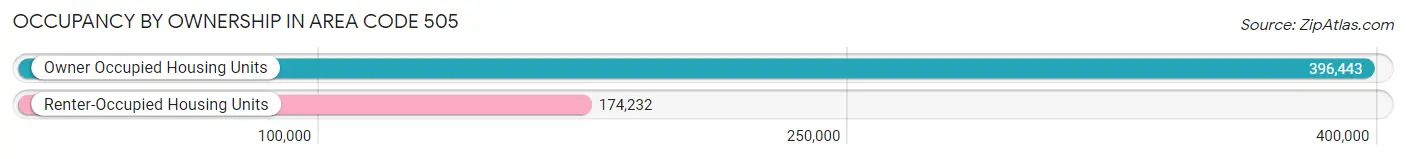
| Occupancy | # Housing Units | % Housing Units |
| Owner Occupied Housing Units | 396,443 | 69.5% |
| Renter-Occupied Housing Units | 174,232 | 30.5% |
| Total Occupied Housing Units | 570,675 | 100.0% |
Occupancy by Household Size in Area Code 505
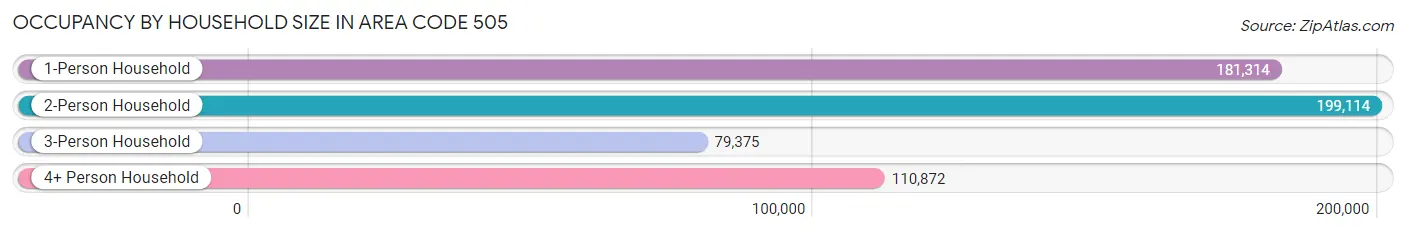
| Household Size | # Housing Units | % Housing Units |
| 1-Person Household | 181,314 | 31.8% |
| 2-Person Household | 199,114 | 34.9% |
| 3-Person Household | 79,375 | 13.9% |
| 4+ Person Household | 110,872 | 19.4% |
| Total Housing Units | 570,675 | 100.0% |
Occupancy by Ownership by Household Size in Area Code 505
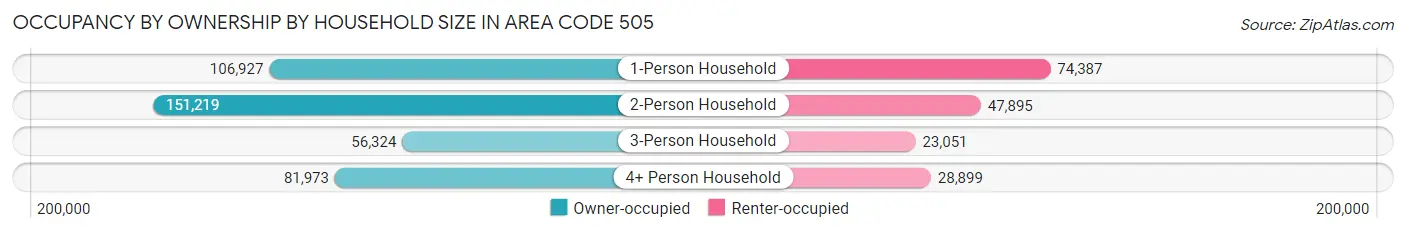
| Household Size | Owner-occupied | Renter-occupied |
| 1-Person Household | 106,927 (59.0%) | 74,387 (41.0%) |
| 2-Person Household | 151,219 (75.9%) | 47,895 (24.0%) |
| 3-Person Household | 56,324 (71.0%) | 23,051 (29.0%) |
| 4+ Person Household | 81,973 (73.9%) | 28,899 (26.1%) |
| Total Housing Units | 396,443 (69.5%) | 174,232 (30.5%) |
Occupancy by Educational Attainment in Area Code 505
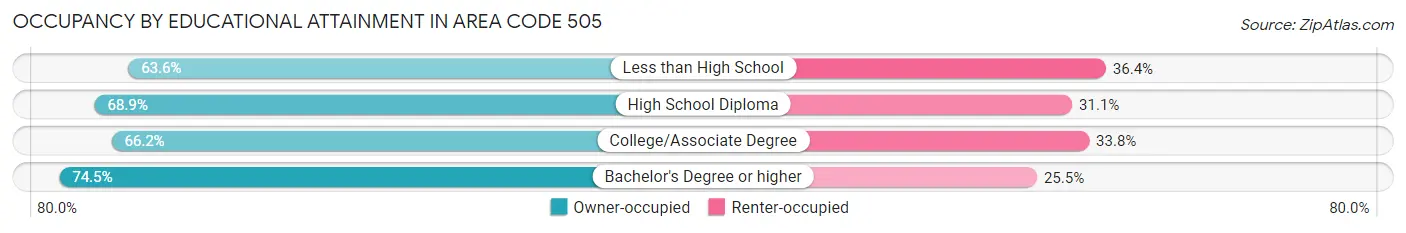
| Household Size | Owner-occupied | Renter-occupied |
| Less than High School | 35,234 (63.6%) | 20,197 (36.4%) |
| High School Diploma | 84,820 (68.9%) | 38,267 (31.1%) |
| College/Associate Degree | 125,992 (66.2%) | 64,259 (33.8%) |
| Bachelor's Degree or higher | 150,397 (74.5%) | 51,509 (25.5%) |
Occupancy by Age of Householder in Area Code 505
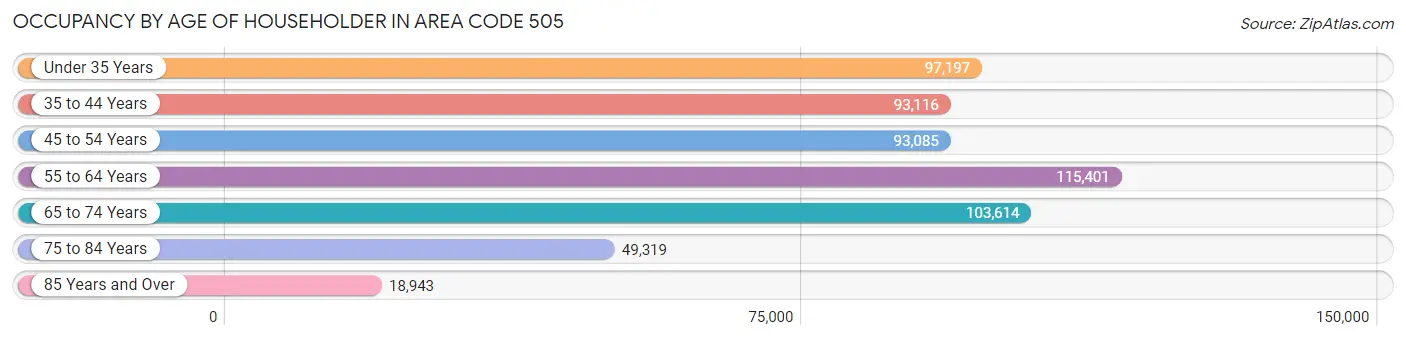
| Age Bracket | # Households | % Households |
| Under 35 Years | 97,197 | 17.0% |
| 35 to 44 Years | 93,116 | 16.3% |
| 45 to 54 Years | 93,085 | 16.3% |
| 55 to 64 Years | 115,401 | 20.2% |
| 65 to 74 Years | 103,614 | 18.2% |
| 75 to 84 Years | 49,319 | 8.6% |
| 85 Years and Over | 18,943 | 3.3% |
| Total | 570,675 | 100.0% |
Housing Finances in Area Code 505
Median Income by Occupancy in Area Code 505
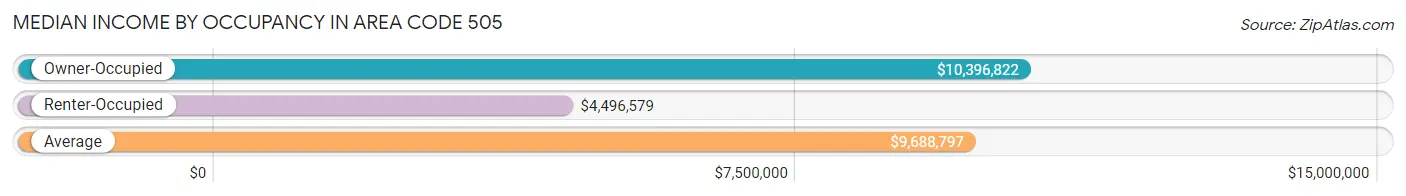
| Occupancy Type | # Households | Median Income |
| Owner-Occupied | 396,443 (69.5%) | $10,396,822 |
| Renter-Occupied | 174,232 (30.5%) | $4,496,579 |
| Average | 570,675 (100.0%) | $9,688,797 |
Occupancy by Householder Income Bracket in Area Code 505
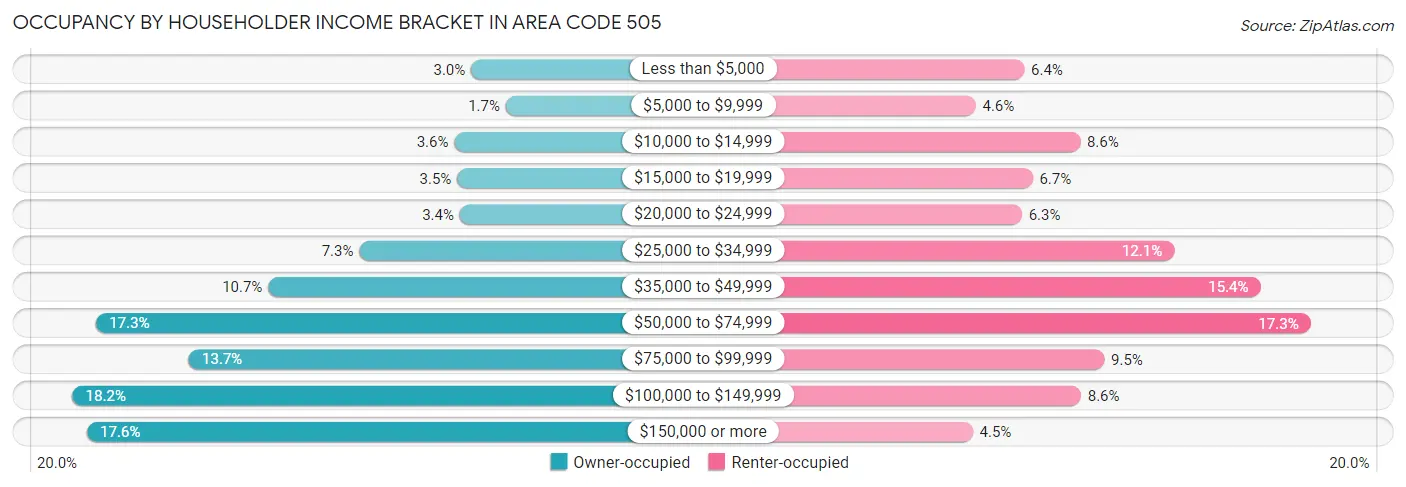
| Income Bracket | Owner-occupied | Renter-occupied |
| Less than $5,000 | 11,844 (3.0%) | 11,190 (6.4%) |
| $5,000 to $9,999 | 6,611 (1.7%) | 7,960 (4.6%) |
| $10,000 to $14,999 | 14,380 (3.6%) | 14,904 (8.6%) |
| $15,000 to $19,999 | 13,956 (3.5%) | 11,737 (6.7%) |
| $20,000 to $24,999 | 13,558 (3.4%) | 11,022 (6.3%) |
| $25,000 to $34,999 | 28,754 (7.2%) | 21,127 (12.1%) |
| $35,000 to $49,999 | 42,503 (10.7%) | 26,868 (15.4%) |
| $50,000 to $74,999 | 68,472 (17.3%) | 30,199 (17.3%) |
| $75,000 to $99,999 | 54,464 (13.7%) | 16,499 (9.5%) |
| $100,000 to $149,999 | 72,052 (18.2%) | 14,952 (8.6%) |
| $150,000 or more | 69,849 (17.6%) | 7,774 (4.5%) |
| Total | 396,443 (100.0%) | 174,232 (100.0%) |
Monthly Housing Cost Tiers in Area Code 505
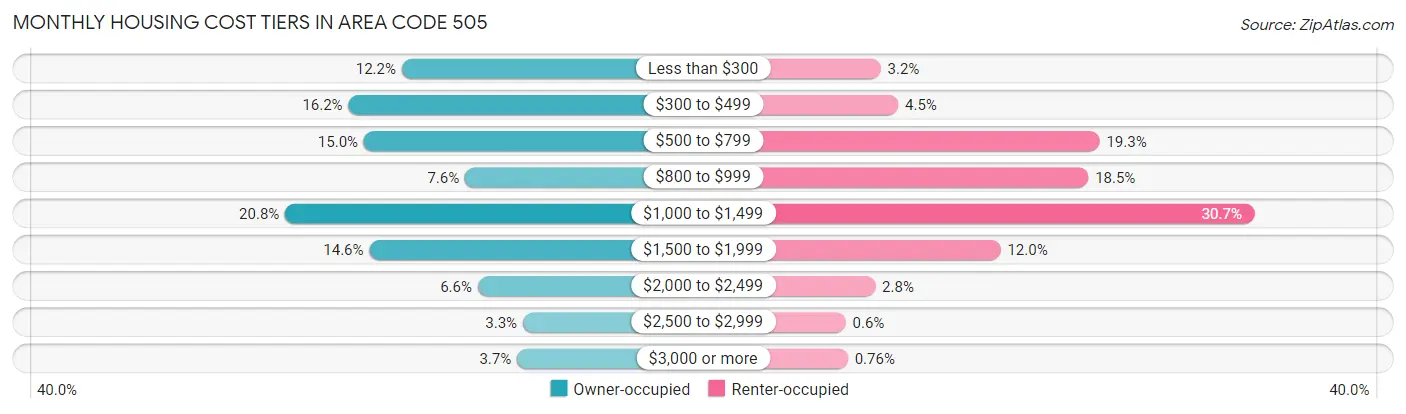
| Monthly Cost | Owner-occupied | Renter-occupied |
| Less than $300 | 48,442 (12.2%) | 5,544 (3.2%) |
| $300 to $499 | 64,027 (16.2%) | 7,793 (4.5%) |
| $500 to $799 | 59,505 (15.0%) | 33,619 (19.3%) |
| $800 to $999 | 29,955 (7.6%) | 32,175 (18.5%) |
| $1,000 to $1,499 | 82,502 (20.8%) | 53,414 (30.7%) |
| $1,500 to $1,999 | 57,909 (14.6%) | 20,929 (12.0%) |
| $2,000 to $2,499 | 26,228 (6.6%) | 4,849 (2.8%) |
| $2,500 to $2,999 | 13,069 (3.3%) | 1,047 (0.6%) |
| $3,000 or more | 14,806 (3.7%) | 1,331 (0.8%) |
| Total | 396,443 (100.0%) | 174,232 (100.0%) |
Physical Housing Characteristics in Area Code 505
Housing Structures in Area Code 505
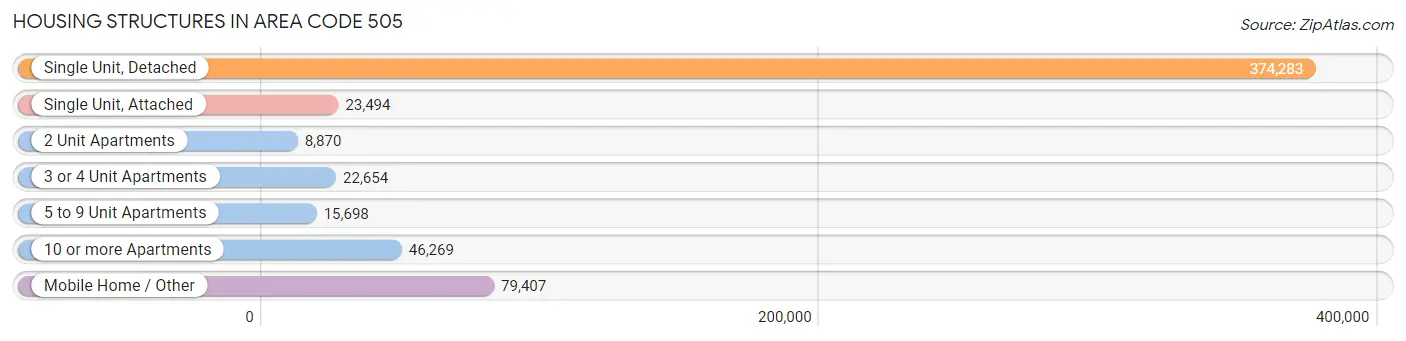
| Structure Type | # Housing Units | % Housing Units |
| Single Unit, Detached | 374,283 | 65.6% |
| Single Unit, Attached | 23,494 | 4.1% |
| 2 Unit Apartments | 8,870 | 1.5% |
| 3 or 4 Unit Apartments | 22,654 | 4.0% |
| 5 to 9 Unit Apartments | 15,698 | 2.8% |
| 10 or more Apartments | 46,269 | 8.1% |
| Mobile Home / Other | 79,407 | 13.9% |
| Total | 570,675 | 100.0% |
Housing Structures by Occupancy in Area Code 505
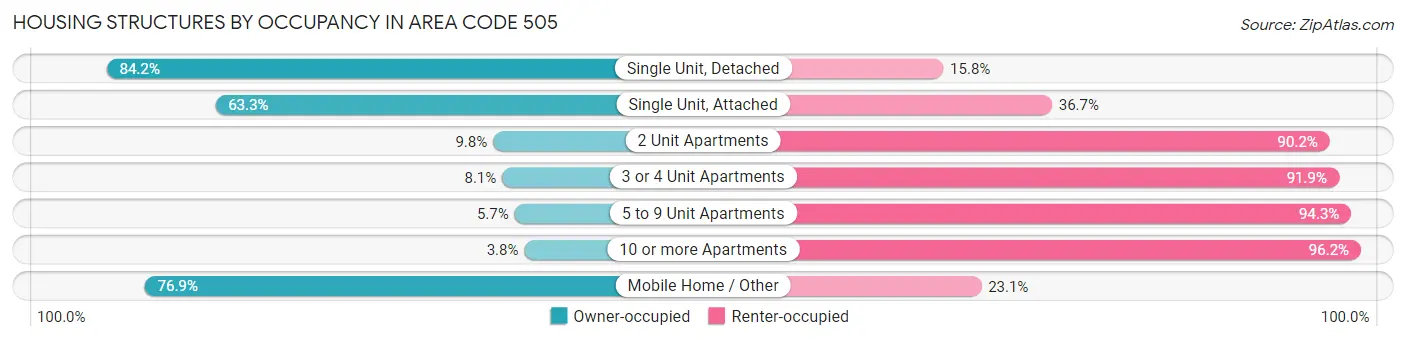
| Structure Type | Owner-occupied | Renter-occupied |
| Single Unit, Detached | 315,181 (84.2%) | 59,102 (15.8%) |
| Single Unit, Attached | 14,871 (63.3%) | 8,623 (36.7%) |
| 2 Unit Apartments | 869 (9.8%) | 8,001 (90.2%) |
| 3 or 4 Unit Apartments | 1,825 (8.1%) | 20,829 (91.9%) |
| 5 to 9 Unit Apartments | 889 (5.7%) | 14,809 (94.3%) |
| 10 or more Apartments | 1,755 (3.8%) | 44,514 (96.2%) |
| Mobile Home / Other | 61,053 (76.9%) | 18,354 (23.1%) |
| Total | 396,443 (69.5%) | 174,232 (30.5%) |
Housing Structures by Number of Rooms in Area Code 505
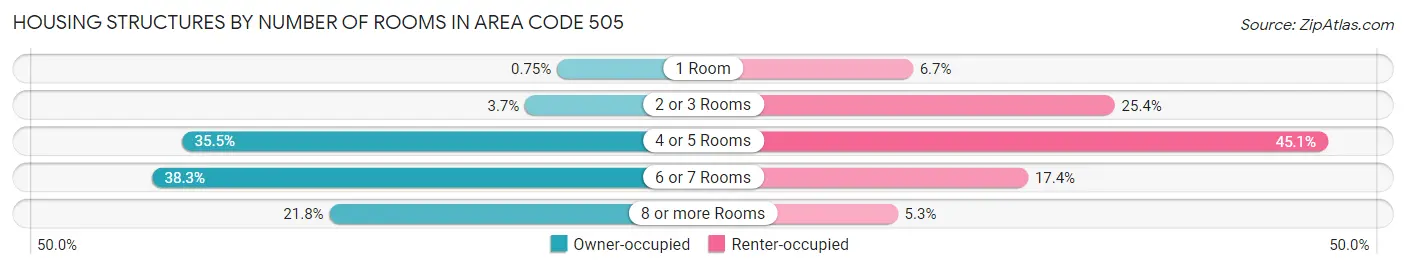
| Number of Rooms | Owner-occupied | Renter-occupied |
| 1 Room | 2,992 (0.7%) | 11,722 (6.7%) |
| 2 or 3 Rooms | 14,713 (3.7%) | 44,275 (25.4%) |
| 4 or 5 Rooms | 140,630 (35.5%) | 78,620 (45.1%) |
| 6 or 7 Rooms | 151,643 (38.3%) | 30,305 (17.4%) |
| 8 or more Rooms | 86,465 (21.8%) | 9,310 (5.3%) |
| Total | 396,443 (100.0%) | 174,232 (100.0%) |
Housing Structure by Heating Type in Area Code 505
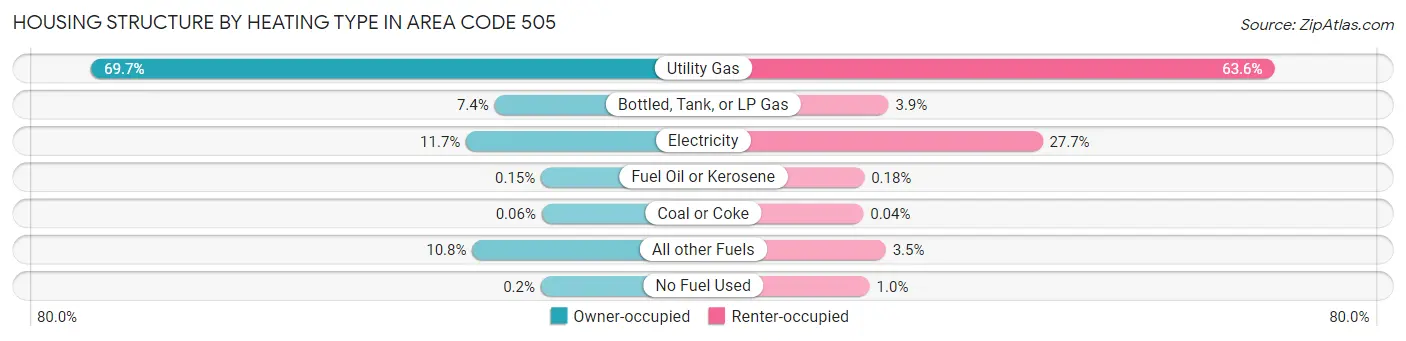
| Heating Type | Owner-occupied | Renter-occupied |
| Utility Gas | 276,376 (69.7%) | 110,772 (63.6%) |
| Bottled, Tank, or LP Gas | 29,141 (7.3%) | 6,857 (3.9%) |
| Electricity | 46,529 (11.7%) | 48,317 (27.7%) |
| Fuel Oil or Kerosene | 578 (0.2%) | 307 (0.2%) |
| Coal or Coke | 252 (0.1%) | 75 (0.0%) |
| All other Fuels | 42,781 (10.8%) | 6,119 (3.5%) |
| No Fuel Used | 786 (0.2%) | 1,785 (1.0%) |
| Total | 396,443 (100.0%) | 174,232 (100.0%) |
Household Vehicle Usage in Area Code 505
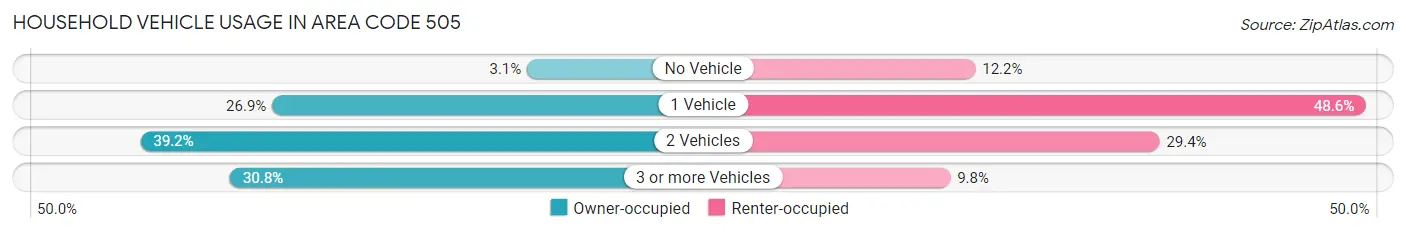
| Vehicles per Household | Owner-occupied | Renter-occupied |
| No Vehicle | 12,269 (3.1%) | 21,198 (12.2%) |
| 1 Vehicle | 106,612 (26.9%) | 84,755 (48.6%) |
| 2 Vehicles | 155,348 (39.2%) | 51,153 (29.4%) |
| 3 or more Vehicles | 122,214 (30.8%) | 17,126 (9.8%) |
| Total | 396,443 (100.0%) | 174,232 (100.0%) |
Real Estate & Mortgages in Area Code 505
Real Estate and Mortgage Overview in Area Code 505
| Characteristic | Without Mortgage | With Mortgage |
| Housing Units | 178,568 | 217,875 |
| Median Property Value | $27,197,898 | $28,019,699 |
| Median Household Income | $7,523,997 | $48,071 |
| Monthly Housing Costs | $64,751 | $14,436 |
| Real Estate Taxes | $161,070 | $11,565 |
Property Value by Mortgage Status in Area Code 505
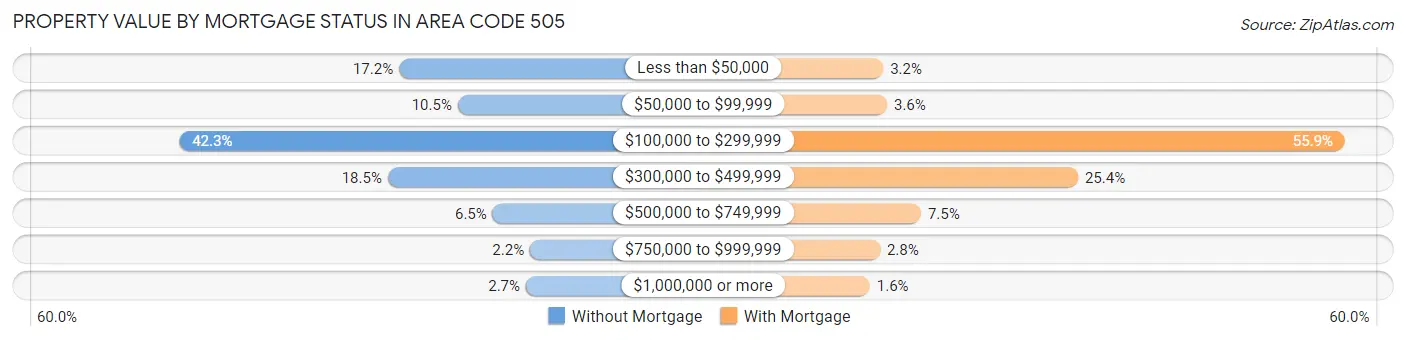
| Property Value | Without Mortgage | With Mortgage |
| Less than $50,000 | 30,732 (17.2%) | 6,881 (3.2%) |
| $50,000 to $99,999 | 18,756 (10.5%) | 7,849 (3.6%) |
| $100,000 to $299,999 | 75,593 (42.3%) | 121,829 (55.9%) |
| $300,000 to $499,999 | 33,031 (18.5%) | 55,378 (25.4%) |
| $500,000 to $749,999 | 11,623 (6.5%) | 16,302 (7.5%) |
| $750,000 to $999,999 | 3,991 (2.2%) | 6,074 (2.8%) |
| $1,000,000 or more | 4,842 (2.7%) | 3,562 (1.6%) |
| Total | 178,568 (100.0%) | 217,875 (100.0%) |
Household Income by Mortgage Status in Area Code 505
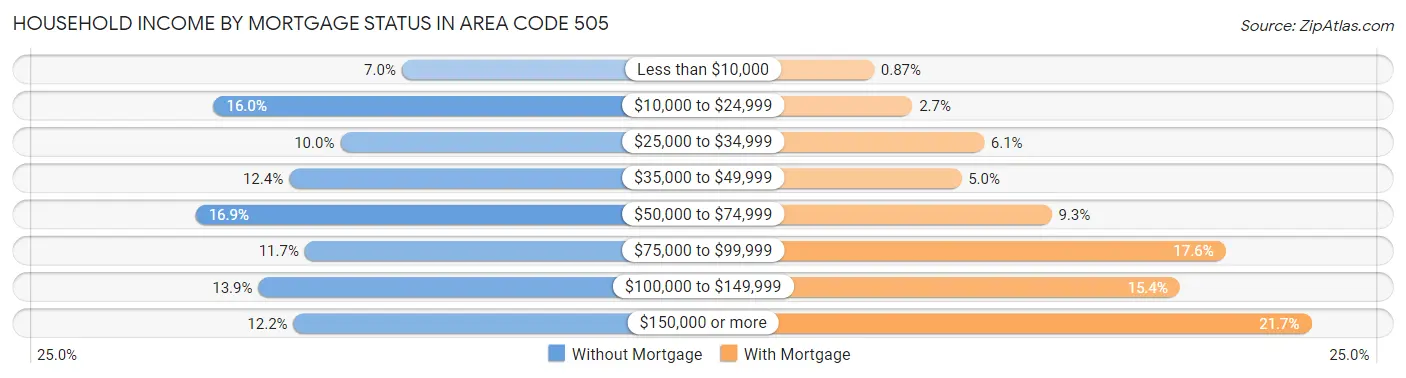
| Household Income | Without Mortgage | With Mortgage |
| Less than $10,000 | 12,575 (7.0%) | 1,905 (0.9%) |
| $10,000 to $24,999 | 28,574 (16.0%) | 5,880 (2.7%) |
| $25,000 to $34,999 | 17,801 (10.0%) | 13,320 (6.1%) |
| $35,000 to $49,999 | 22,166 (12.4%) | 10,953 (5.0%) |
| $50,000 to $74,999 | 30,091 (16.9%) | 20,337 (9.3%) |
| $75,000 to $99,999 | 20,818 (11.7%) | 38,381 (17.6%) |
| $100,000 to $149,999 | 24,765 (13.9%) | 33,646 (15.4%) |
| $150,000 or more | 21,778 (12.2%) | 47,287 (21.7%) |
| Total | 178,568 (100.0%) | 217,875 (100.0%) |
Property Value to Household Income Ratio in Area Code 505
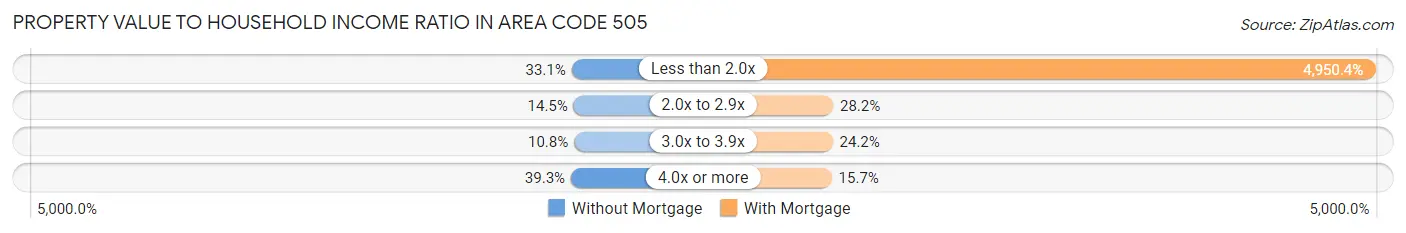
| Value-to-Income Ratio | Without Mortgage | With Mortgage |
| Less than 2.0x | 59,065 (33.1%) | 10,785,569 (4,950.4%) |
| 2.0x to 2.9x | 25,972 (14.5%) | 61,406 (28.2%) |
| 3.0x to 3.9x | 19,312 (10.8%) | 52,765 (24.2%) |
| 4.0x or more | 70,186 (39.3%) | 34,301 (15.7%) |
| Total | 178,568 (100.0%) | 217,875 (100.0%) |
Real Estate Taxes by Mortgage Status in Area Code 505
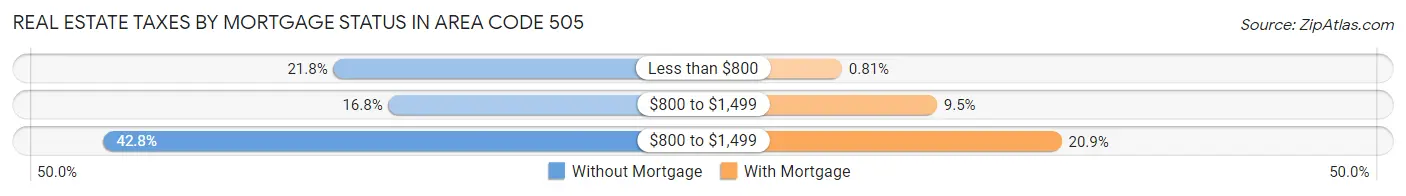
| Property Taxes | Without Mortgage | With Mortgage |
| Less than $800 | 38,909 (21.8%) | 1,766 (0.8%) |
| $800 to $1,499 | 29,943 (16.8%) | 20,644 (9.5%) |
| $800 to $1,499 | 76,408 (42.8%) | 45,467 (20.9%) |
| Total | 178,568 (100.0%) | 217,875 (100.0%) |
Health & Disability in Area Code 505
Health Insurance Coverage by Age in Area Code 505
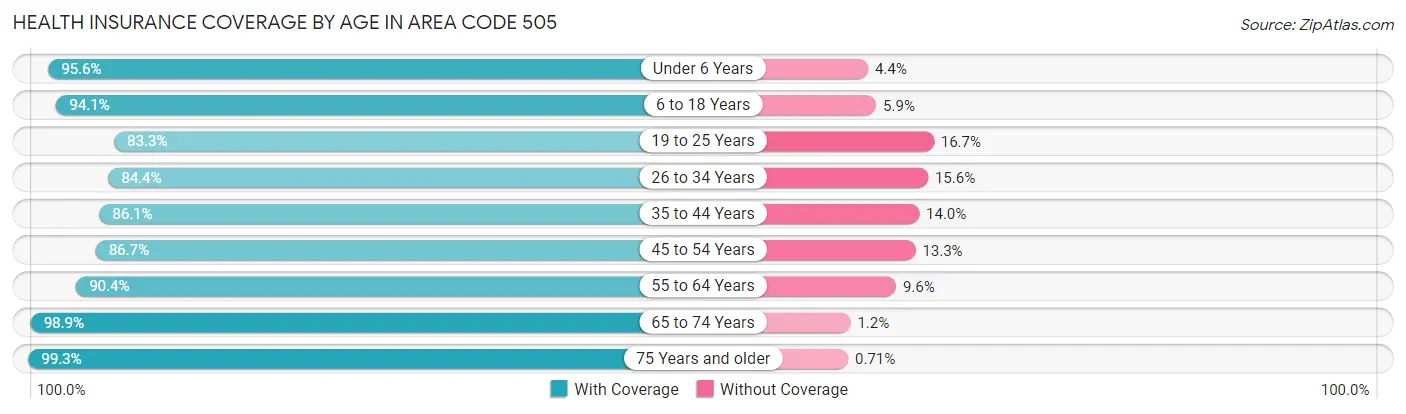
| Age Bracket | With Coverage | Without Coverage |
| Under 6 Years | 87,347 (95.6%) | 4,034 (4.4%) |
| 6 to 18 Years | 230,605 (94.1%) | 14,565 (5.9%) |
| 19 to 25 Years | 106,136 (83.3%) | 21,266 (16.7%) |
| 26 to 34 Years | 143,077 (84.4%) | 26,472 (15.6%) |
| 35 to 44 Years | 156,952 (86.1%) | 25,436 (14.0%) |
| 45 to 54 Years | 146,391 (86.7%) | 22,397 (13.3%) |
| 55 to 64 Years | 174,219 (90.4%) | 18,563 (9.6%) |
| 65 to 74 Years | 160,950 (98.9%) | 1,870 (1.1%) |
| 75 Years and older | 104,074 (99.3%) | 748 (0.7%) |
| Total | 1,309,751 (90.6%) | 135,351 (9.4%) |
Health Insurance Coverage by Citizenship Status in Area Code 505
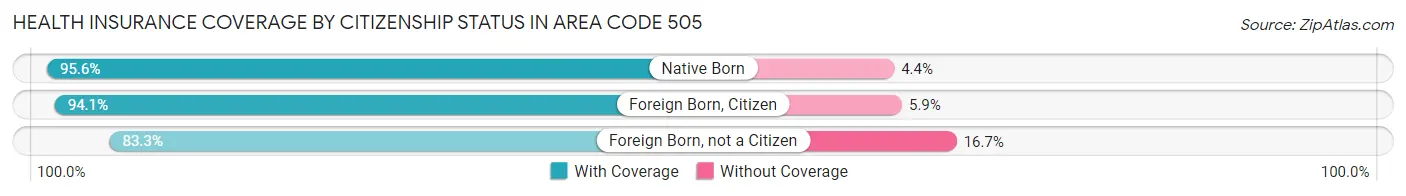
| Citizenship Status | With Coverage | Without Coverage |
| Native Born | 87,347 (95.6%) | 4,034 (4.4%) |
| Foreign Born, Citizen | 230,605 (94.1%) | 14,565 (5.9%) |
| Foreign Born, not a Citizen | 106,136 (83.3%) | 21,266 (16.7%) |
Health Insurance Coverage by Household Income in Area Code 505
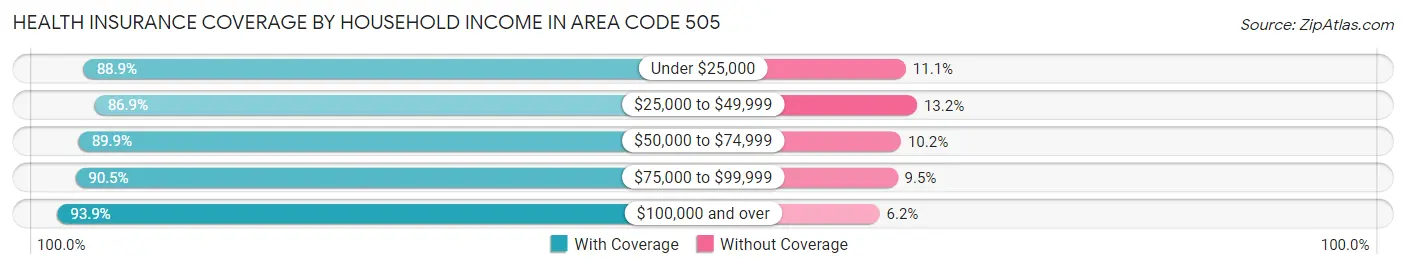
| Household Income | With Coverage | Without Coverage |
| Under $25,000 | 197,732 (88.9%) | 24,630 (11.1%) |
| $25,000 to $49,999 | 236,997 (86.9%) | 35,886 (13.2%) |
| $50,000 to $74,999 | 217,224 (89.8%) | 24,528 (10.2%) |
| $75,000 to $99,999 | 179,150 (90.5%) | 18,849 (9.5%) |
| $100,000 and over | 468,064 (93.9%) | 30,672 (6.1%) |
Public vs Private Health Insurance Coverage by Age in Area Code 505
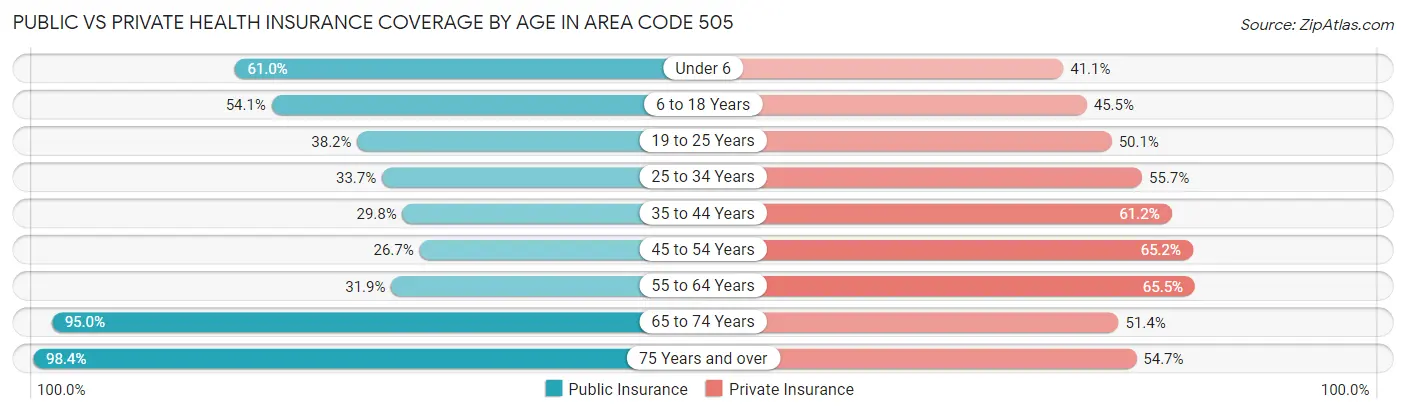
| Age Bracket | Public Insurance | Private Insurance |
| Under 6 | 55,782 (61.0%) | 37,566 (41.1%) |
| 6 to 18 Years | 132,731 (54.1%) | 111,489 (45.5%) |
| 19 to 25 Years | 48,711 (38.2%) | 63,826 (50.1%) |
| 25 to 34 Years | 57,048 (33.7%) | 94,512 (55.7%) |
| 35 to 44 Years | 54,422 (29.8%) | 111,602 (61.2%) |
| 45 to 54 Years | 45,044 (26.7%) | 109,967 (65.1%) |
| 55 to 64 Years | 61,569 (31.9%) | 126,340 (65.5%) |
| 65 to 74 Years | 154,619 (95.0%) | 83,648 (51.4%) |
| 75 Years and over | 103,175 (98.4%) | 57,320 (54.7%) |
| Total | 713,101 (49.3%) | 796,270 (55.1%) |
Disability Status by Sex by Age in Area Code 505
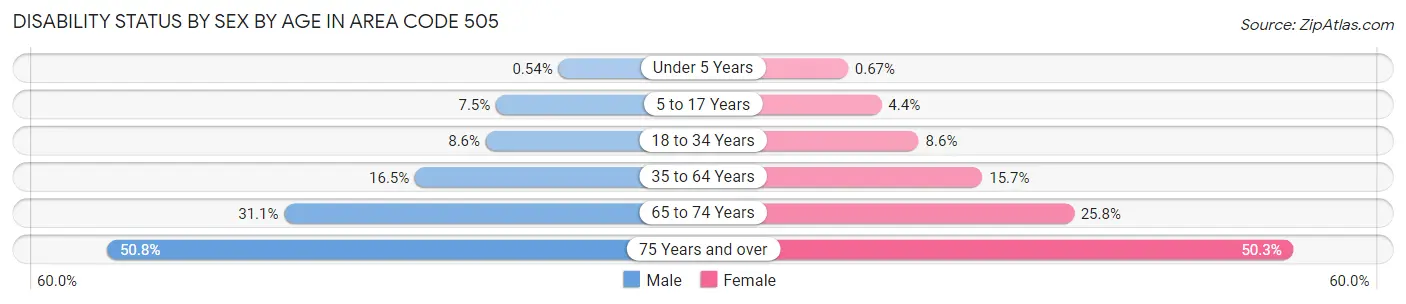
| Age Bracket | Male | Female |
| Under 5 Years | 205 (0.5%) | 244 (0.7%) |
| 5 to 17 Years | 9,258 (7.5%) | 5,239 (4.4%) |
| 18 to 34 Years | 13,746 (8.6%) | 13,455 (8.6%) |
| 35 to 64 Years | 44,207 (16.5%) | 43,234 (15.7%) |
| 65 to 74 Years | 23,629 (31.1%) | 22,425 (25.8%) |
| 75 Years and over | 23,084 (50.8%) | 29,879 (50.3%) |
Disability Class by Sex by Age in Area Code 505
Disability Class: Hearing Difficulty
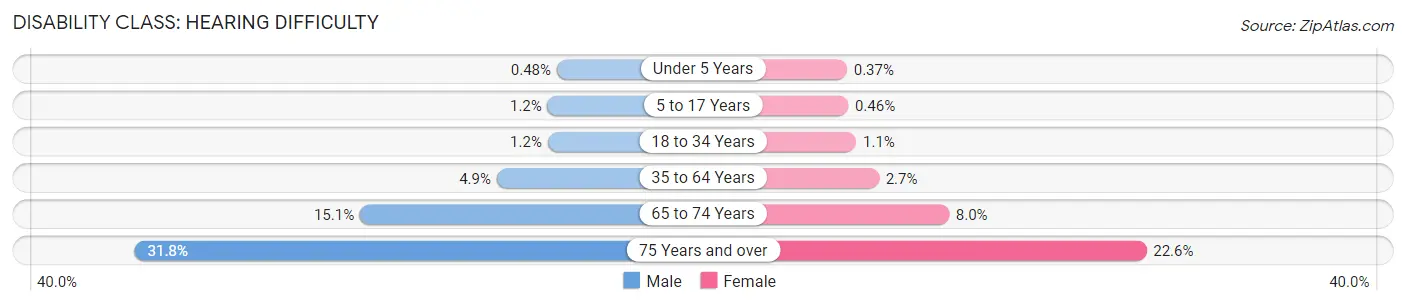
| Age Bracket | Male | Female |
| Under 5 Years | 184 (0.5%) | 136 (0.4%) |
| 5 to 17 Years | 1,449 (1.2%) | 544 (0.5%) |
| 18 to 34 Years | 1,855 (1.2%) | 1,670 (1.1%) |
| 35 to 64 Years | 13,217 (4.9%) | 7,562 (2.7%) |
| 65 to 74 Years | 11,482 (15.1%) | 6,900 (8.0%) |
| 75 Years and over | 14,457 (31.8%) | 13,430 (22.6%) |
Disability Class: Vision Difficulty
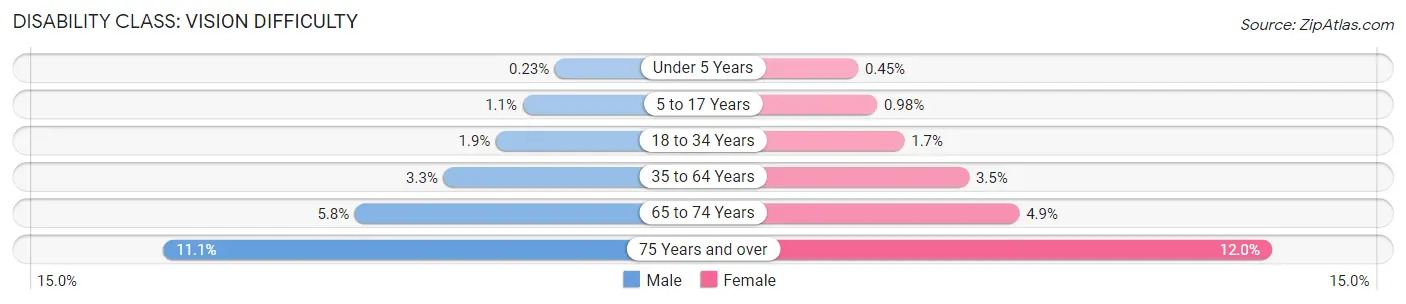
| Age Bracket | Male | Female |
| Under 5 Years | 88 (0.2%) | 166 (0.4%) |
| 5 to 17 Years | 1,398 (1.1%) | 1,160 (1.0%) |
| 18 to 34 Years | 2,973 (1.9%) | 2,732 (1.7%) |
| 35 to 64 Years | 8,910 (3.3%) | 9,773 (3.5%) |
| 65 to 74 Years | 4,408 (5.8%) | 4,285 (4.9%) |
| 75 Years and over | 5,062 (11.1%) | 7,113 (12.0%) |
Disability Class: Cognitive Difficulty
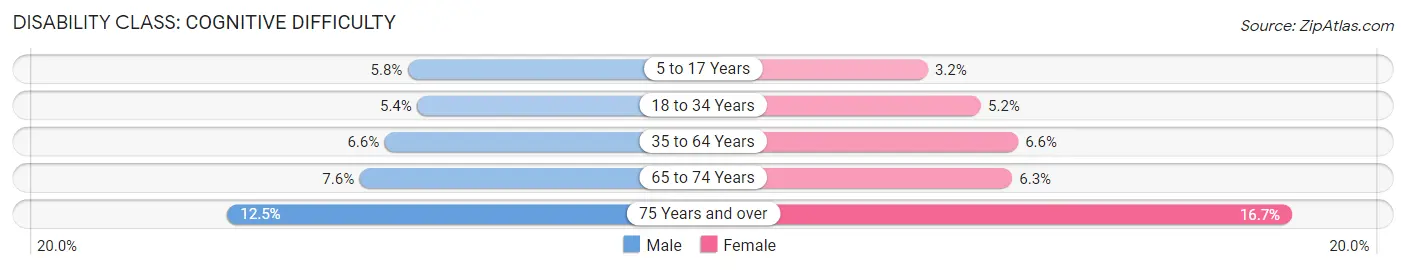
| Age Bracket | Male | Female |
| 5 to 17 Years | 7,115 (5.8%) | 3,800 (3.2%) |
| 18 to 34 Years | 8,619 (5.4%) | 8,127 (5.2%) |
| 35 to 64 Years | 17,716 (6.6%) | 18,096 (6.6%) |
| 65 to 74 Years | 5,738 (7.5%) | 5,494 (6.3%) |
| 75 Years and over | 5,666 (12.5%) | 9,927 (16.7%) |
Disability Class: Ambulatory Difficulty
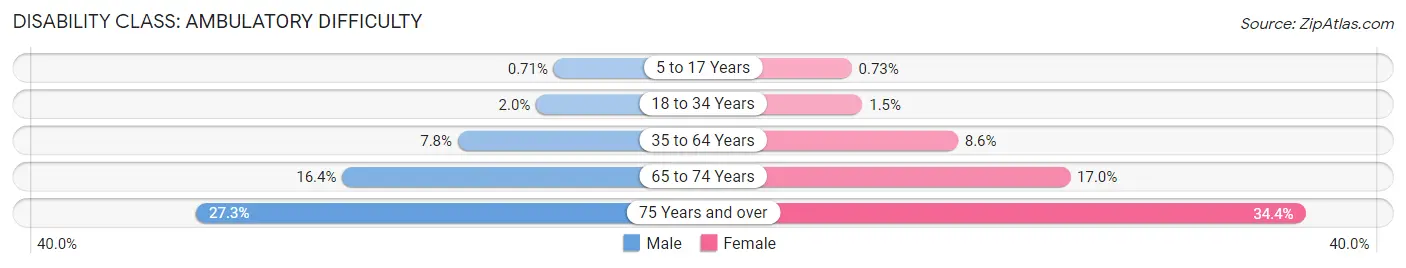
| Age Bracket | Male | Female |
| 5 to 17 Years | 882 (0.7%) | 867 (0.7%) |
| 18 to 34 Years | 3,211 (2.0%) | 2,384 (1.5%) |
| 35 to 64 Years | 20,951 (7.8%) | 23,794 (8.6%) |
| 65 to 74 Years | 12,477 (16.4%) | 14,709 (17.0%) |
| 75 Years and over | 12,386 (27.3%) | 20,443 (34.4%) |
Disability Class: Self-Care Difficulty
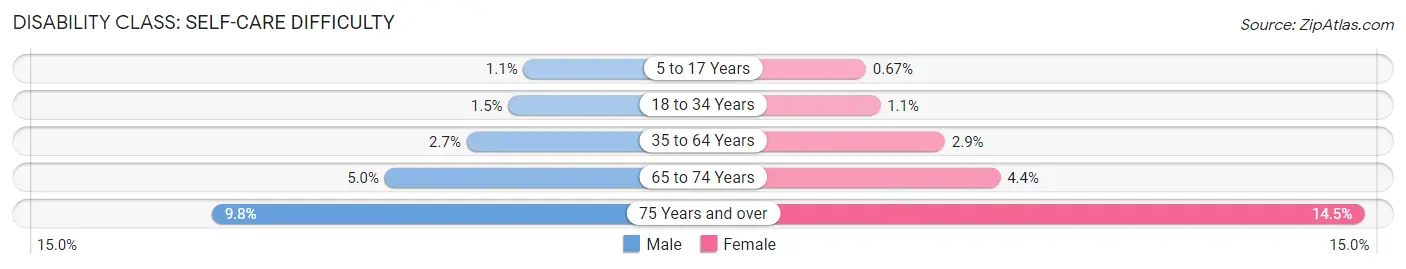
| Age Bracket | Male | Female |
| 5 to 17 Years | 1,376 (1.1%) | 791 (0.7%) |
| 18 to 34 Years | 2,441 (1.5%) | 1,674 (1.1%) |
| 35 to 64 Years | 7,191 (2.7%) | 7,923 (2.9%) |
| 65 to 74 Years | 3,779 (5.0%) | 3,830 (4.4%) |
| 75 Years and over | 4,447 (9.8%) | 8,638 (14.5%) |
Technology Access in Area Code 505
Computing Device Access in Area Code 505
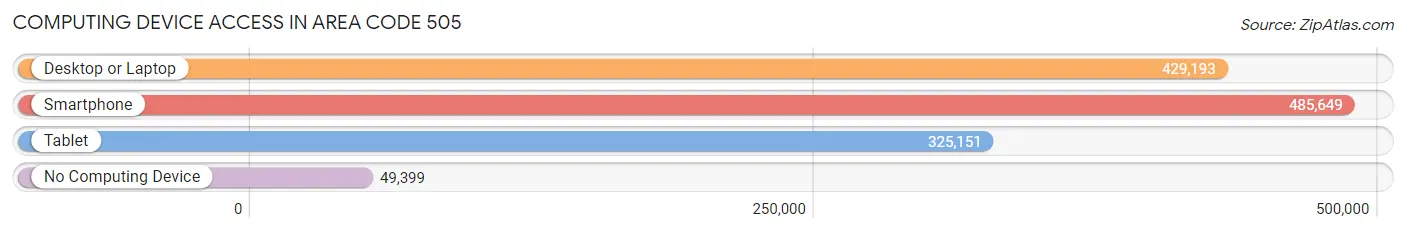
| Device Type | # Households | % Households |
| Desktop or Laptop | 429,193 | 75.2% |
| Smartphone | 485,649 | 85.1% |
| Tablet | 325,151 | 57.0% |
| No Computing Device | 49,399 | 8.7% |
| Total | 570,675 | 100.0% |
Internet Access in Area Code 505
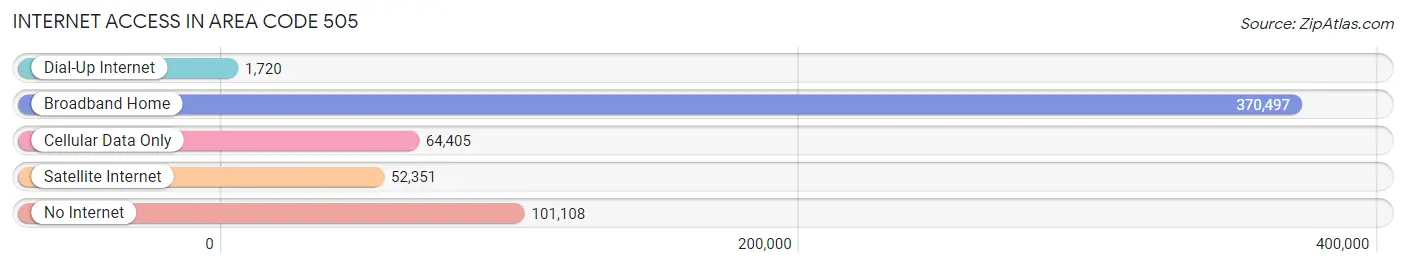
| Internet Type | # Households | % Households |
| Dial-Up Internet | 1,720 | 0.3% |
| Broadband Home | 370,497 | 64.9% |
| Cellular Data Only | 64,405 | 11.3% |
| Satellite Internet | 52,351 | 9.2% |
| No Internet | 101,108 | 17.7% |
| Total | 570,675 | 100.0% |
Area Code 505 Summary
Geography
Area code 505 is a telephone area code in the North American Numbering Plan (NANP) for the state of New Mexico. It was created in October 1947 as one of the original 86 area codes. It covers the entire state of New Mexico, including the cities of Albuquerque, Santa Fe, Las Cruces, and Roswell.
Social
Area code 505 is a vibrant and diverse area, with a rich cultural heritage. It is home to a variety of Native American tribes, including the Navajo, Pueblo, and Apache. The area is also home to a large Hispanic population, with many Spanish-speaking residents.
Economics
Area code 505 is an economically diverse area, with a mix of rural and urban areas. The area is home to a variety of industries, including agriculture, manufacturing, and tourism. The area is also home to a number of large companies, such as Intel, Sandia National Laboratories, and the University of New Mexico.
Demographics
Area code 505 is home to a population of over 1.9 million people. The population is diverse, with a mix of Native American, Hispanic, and White residents. The median household income is $45,000, and the median age is 35. The area is also home to a large number of college students, with the University of New Mexico located in Albuquerque.
Common Questions
What is Per Capita Income in Area Code 505?
Per Capita income in Area Code 505 is $29,268.
What is the Median Family Income in Area Code 505?
Median Family Income in Area Code 505 is $71,082.
What is the Median Household income in Area Code 505?
Median Household Income in Area Code 505 is $56,005.
What is Income or Wage Gap in Area Code 505?
Income or Wage Gap in Area Code 505 is 28.6%.
Women in Area Code 505 earn 71.4 cents for every dollar earned by a man.
What is Family Income Deficit in Area Code 505?
Family Income Deficit in Area Code 505 is $12,176.
Families that are below poverty line in Area Code 505 earn $12,176 less on average than the poverty threshold level.
What is Inequality or Gini Index in Area Code 505?
Inequality or Gini Index in Area Code 505 is 85.38.
What is the Total Population of Area Code 505?
Total Population of Area Code 505 is 1,464,216.
What is the Total Male Population of Area Code 505?
Total Male Population of Area Code 505 is 725,236.
What is the Total Female Population of Area Code 505?
Total Female Population of Area Code 505 is 738,980.
What is the Ratio of Males per 100 Females in Area Code 505?
There are 98.14 Males per 100 Females in Area Code 505.
What is the Ratio of Females per 100 Males in Area Code 505?
There are 101.90 Females per 100 Males in Area Code 505.
What is the Median Population Age in Area Code 505?
Median Population Age in Area Code 505 is 45.2 Years.
What is the Average Family Size in Area Code 505
Average Family Size in Area Code 505 is 3.3 People.
What is the Average Household Size in Area Code 505
Average Household Size in Area Code 505 is 2.7 People.
How Large is the Labor Force in Area Code 505?
There are 630,865 People in the Labor Forcein in Area Code 505.
What is the Percentage of People in the Labor Force in Area Code 505?
53.2% of People are in the Labor Force in Area Code 505.
What is the Unemployment Rate in Area Code 505?
Unemployment Rate in Area Code 505 is 10.8%.