Chaparral, NM Map & Demographics
Chaparral Map
Chaparral Overview
$17,781
PER CAPITA INCOME
$46,694
AVG FAMILY INCOME
$44,219
AVG HOUSEHOLD INCOME
41.2%
WAGE / INCOME GAP [ % ]
58.8¢/ $1
WAGE / INCOME GAP [ $ ]
$10,019
FAMILY INCOME DEFICIT
0.41
INEQUALITY / GINI INDEX
15,290
TOTAL POPULATION
7,282
MALE POPULATION
8,008
FEMALE POPULATION
90.93
MALES / 100 FEMALES
109.97
FEMALES / 100 MALES
31.3
MEDIAN AGE
3.9
AVG FAMILY SIZE
3.4
AVG HOUSEHOLD SIZE
6,241
LABOR FORCE [ PEOPLE ]
54.7%
PERCENT IN LABOR FORCE
8.0%
UNEMPLOYMENT RATE
Chaparral Zip Codes
Chaparral Area Codes
Income in Chaparral
Income Overview in Chaparral
Per Capita Income in Chaparral is $17,781, while median incomes of families and households are $46,694 and $44,219 respectively.
| Characteristic | Number | Measure |
| Per Capita Income | 15,290 | $17,781 |
| Median Family Income | 3,575 | $46,694 |
| Mean Family Income | 3,575 | $55,389 |
| Median Household Income | 4,500 | $44,219 |
| Mean Household Income | 4,500 | $52,963 |
| Income Deficit | 3,575 | $10,019 |
| Wage / Income Gap (%) | 15,290 | 41.22% |
| Wage / Income Gap ($) | 15,290 | 58.78¢ per $1 |
| Gini / Inequality Index | 15,290 | 0.41 |
Earnings by Sex in Chaparral
Average Earnings in Chaparral are $28,518, $34,048 for men and $20,012 for women, a difference of 41.2%.
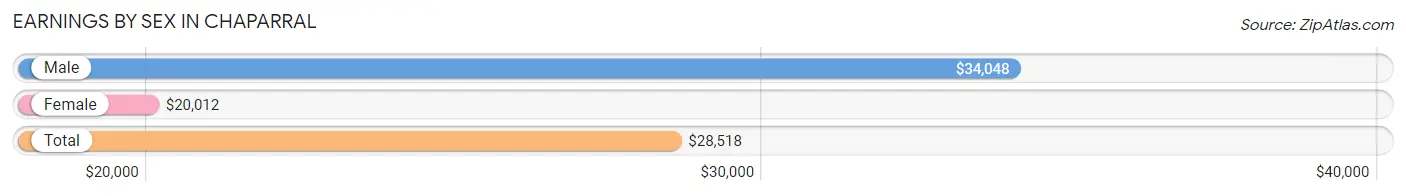
| Sex | Number | Average Earnings |
| Male | 3,338 (54.0%) | $34,048 |
| Female | 2,847 (46.0%) | $20,012 |
| Total | 6,185 (100.0%) | $28,518 |
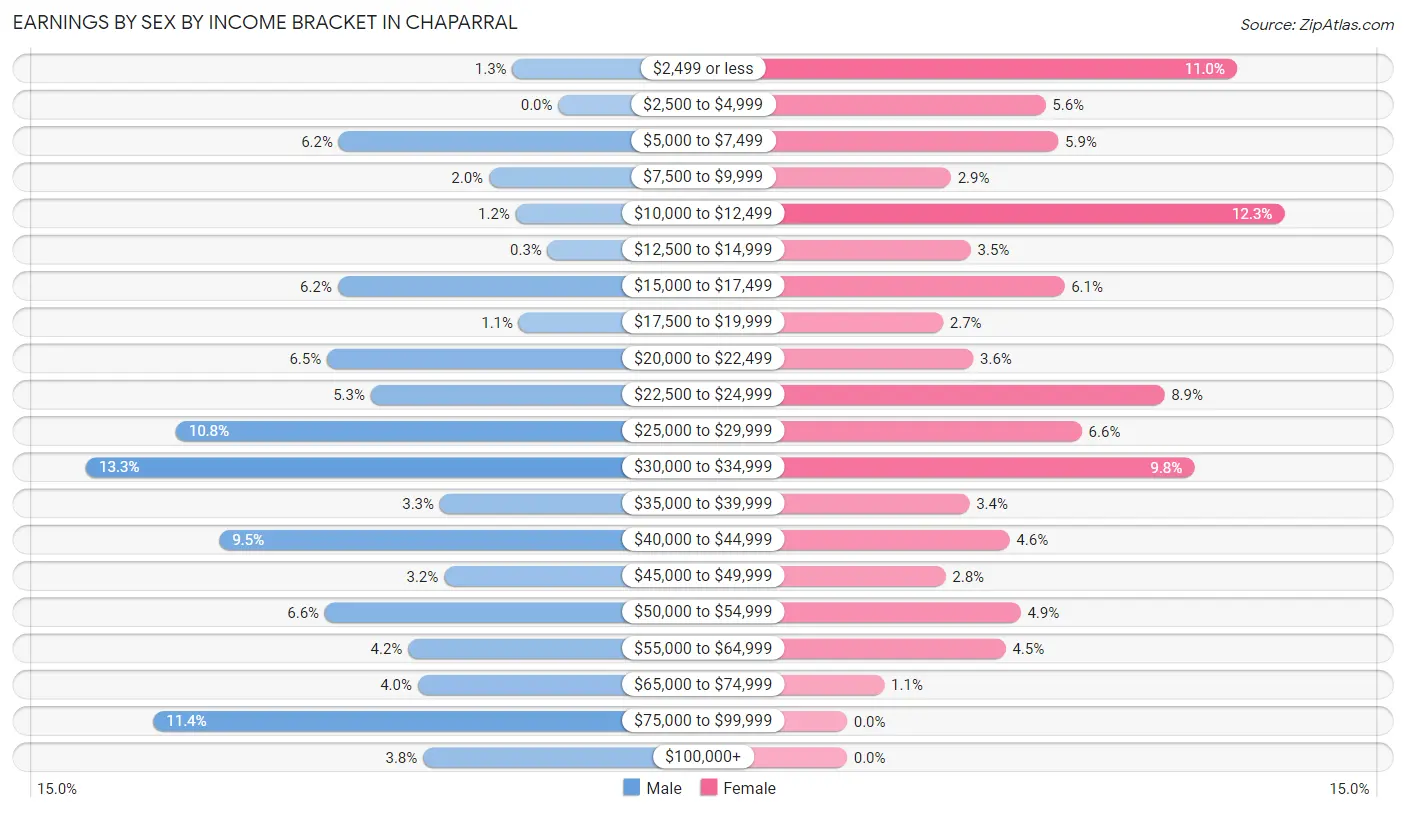
Earnings by Sex by Income Bracket in Chaparral
The most common earnings brackets in Chaparral are $30,000 to $34,999 for men (443 | 13.3%) and $10,000 to $12,499 for women (350 | 12.3%).
| Income | Male | Female |
| $2,499 or less | 43 (1.3%) | 312 (11.0%) |
| $2,500 to $4,999 | 0 (0.0%) | 159 (5.6%) |
| $5,000 to $7,499 | 206 (6.2%) | 169 (5.9%) |
| $7,500 to $9,999 | 65 (1.9%) | 83 (2.9%) |
| $10,000 to $12,499 | 40 (1.2%) | 350 (12.3%) |
| $12,500 to $14,999 | 10 (0.3%) | 99 (3.5%) |
| $15,000 to $17,499 | 207 (6.2%) | 174 (6.1%) |
| $17,500 to $19,999 | 37 (1.1%) | 77 (2.7%) |
| $20,000 to $22,499 | 217 (6.5%) | 101 (3.5%) |
| $22,500 to $24,999 | 176 (5.3%) | 254 (8.9%) |
| $25,000 to $29,999 | 359 (10.7%) | 188 (6.6%) |
| $30,000 to $34,999 | 443 (13.3%) | 278 (9.8%) |
| $35,000 to $39,999 | 111 (3.3%) | 98 (3.4%) |
| $40,000 to $44,999 | 318 (9.5%) | 130 (4.6%) |
| $45,000 to $49,999 | 107 (3.2%) | 79 (2.8%) |
| $50,000 to $54,999 | 219 (6.6%) | 139 (4.9%) |
| $55,000 to $64,999 | 141 (4.2%) | 127 (4.5%) |
| $65,000 to $74,999 | 132 (4.0%) | 30 (1.1%) |
| $75,000 to $99,999 | 380 (11.4%) | 0 (0.0%) |
| $100,000+ | 127 (3.8%) | 0 (0.0%) |
| Total | 3,338 (100.0%) | 2,847 (100.0%) |
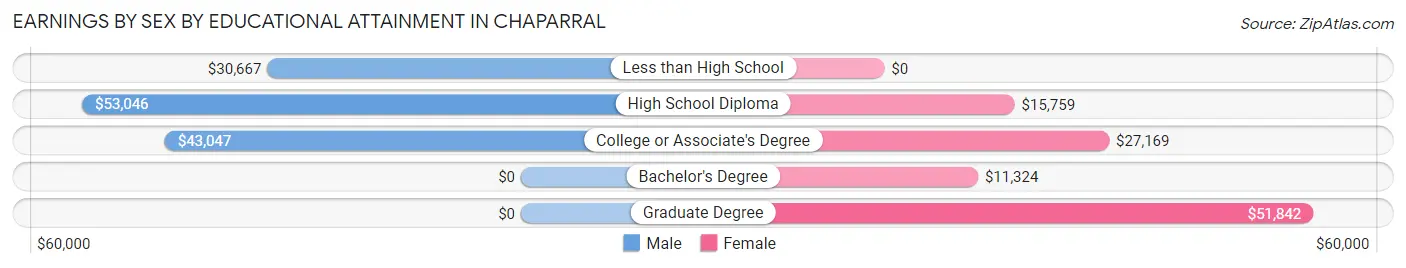
Earnings by Sex by Educational Attainment in Chaparral
Average earnings in Chaparral are $38,141 for men and $21,807 for women, a difference of 42.8%. Men with an educational attainment of high school diploma enjoy the highest average annual earnings of $53,046, while those with less than high school education earn the least with $30,667. Women with an educational attainment of graduate degree earn the most with the average annual earnings of $51,842, while those with bachelor's degree education have the smallest earnings of $11,324.
| Educational Attainment | Male Income | Female Income |
| Less than High School | $30,667 | $0 |
| High School Diploma | $53,046 | $15,759 |
| College or Associate's Degree | $43,047 | $27,169 |
| Bachelor's Degree | - | - |
| Graduate Degree | - | - |
| Total | $38,141 | $21,807 |
Family Income in Chaparral
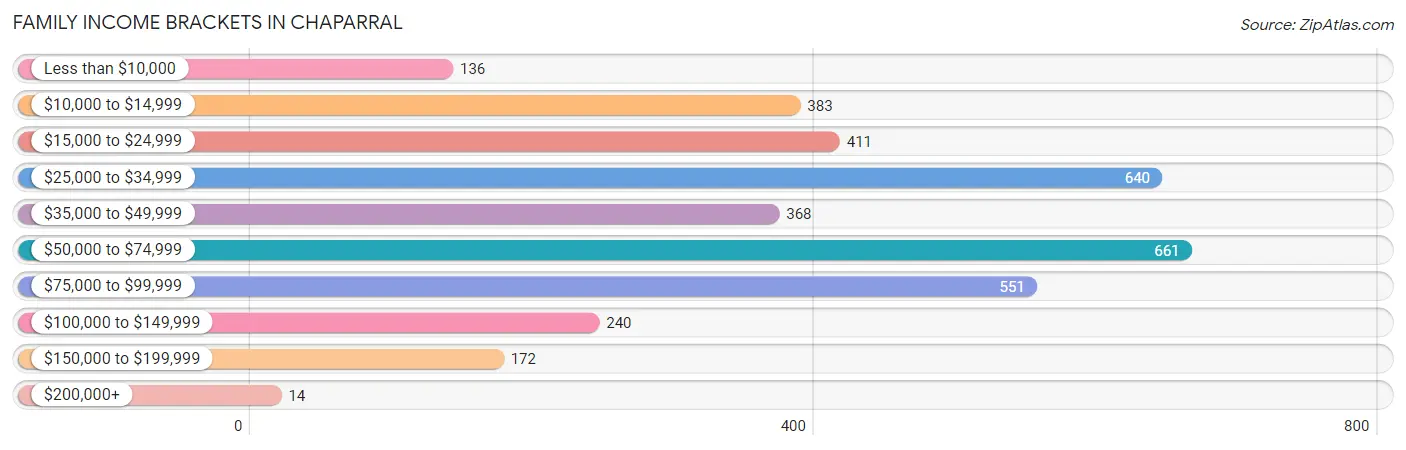
Family Income Brackets in Chaparral
According to the Chaparral family income data, there are 661 families falling into the $50,000 to $74,999 income range, which is the most common income bracket and makes up 18.5% of all families. Conversely, the $200,000+ income bracket is the least frequent group with only 14 families (0.4%) belonging to this category.
| Income Bracket | # Families | % Families |
| Less than $10,000 | 136 | 3.8% |
| $10,000 to $14,999 | 383 | 10.7% |
| $15,000 to $24,999 | 411 | 11.5% |
| $25,000 to $34,999 | 640 | 17.9% |
| $35,000 to $49,999 | 368 | 10.3% |
| $50,000 to $74,999 | 661 | 18.5% |
| $75,000 to $99,999 | 551 | 15.4% |
| $100,000 to $149,999 | 240 | 6.7% |
| $150,000 to $199,999 | 172 | 4.8% |
| $200,000+ | 14 | 0.4% |
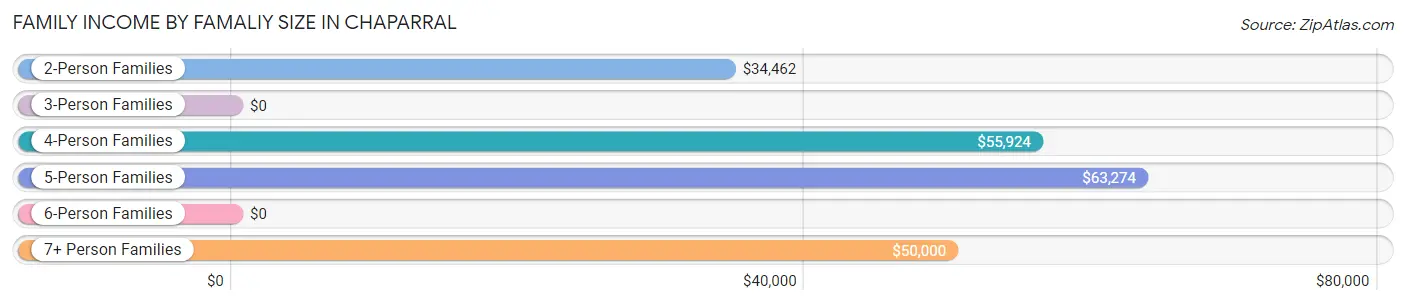
Family Income by Famaliy Size in Chaparral
5-person families (520 | 14.5%) account for the highest median family income in Chaparral with $63,274 per family, while 2-person families (1,565 | 43.8%) have the highest median income of $17,231 per family member.
| Income Bracket | # Families | Median Income |
| 2-Person Families | 1,565 (43.8%) | $34,462 |
| 3-Person Families | 583 (16.3%) | $0 |
| 4-Person Families | 595 (16.6%) | $55,924 |
| 5-Person Families | 520 (14.5%) | $63,274 |
| 6-Person Families | 148 (4.1%) | $0 |
| 7+ Person Families | 164 (4.6%) | $50,000 |
| Total | 3,575 (100.0%) | $46,694 |
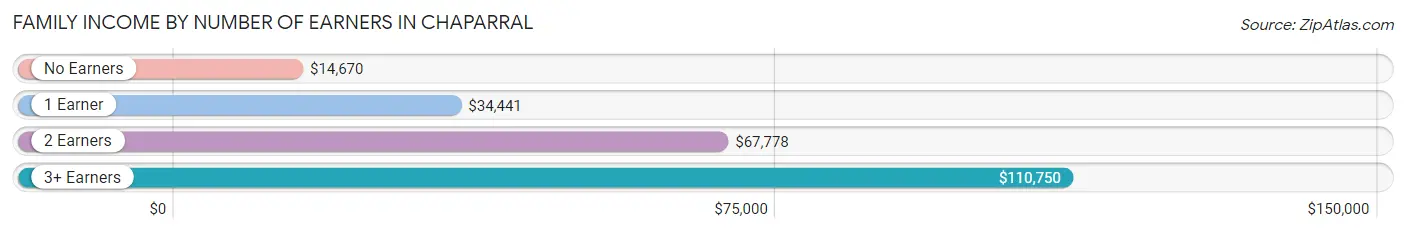
Family Income by Number of Earners in Chaparral
The median family income in Chaparral is $46,694, with families comprising 3+ earners (184) having the highest median family income of $110,750, while families with no earners (736) have the lowest median family income of $14,670, accounting for 5.1% and 20.6% of families, respectively.
| Number of Earners | # Families | Median Income |
| No Earners | 736 (20.6%) | $14,670 |
| 1 Earner | 1,613 (45.1%) | $34,441 |
| 2 Earners | 1,042 (29.1%) | $67,778 |
| 3+ Earners | 184 (5.1%) | $110,750 |
| Total | 3,575 (100.0%) | $46,694 |
Household Income in Chaparral
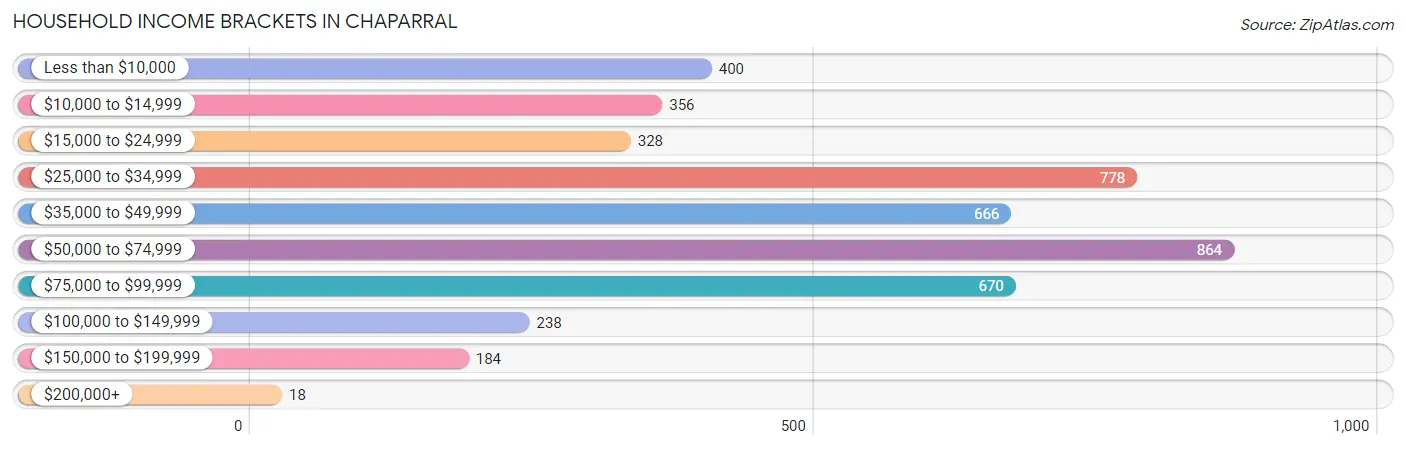
Household Income Brackets in Chaparral
With 864 households falling in the category, the $50,000 to $74,999 income range is the most frequent in Chaparral, accounting for 19.2% of all households. In contrast, only 18 households (0.4%) fall into the $200,000+ income bracket, making it the least populous group.
| Income Bracket | # Households | % Households |
| Less than $10,000 | 400 | 8.9% |
| $10,000 to $14,999 | 356 | 7.9% |
| $15,000 to $24,999 | 328 | 7.3% |
| $25,000 to $34,999 | 778 | 17.3% |
| $35,000 to $49,999 | 666 | 14.8% |
| $50,000 to $74,999 | 864 | 19.2% |
| $75,000 to $99,999 | 670 | 14.9% |
| $100,000 to $149,999 | 238 | 5.3% |
| $150,000 to $199,999 | 184 | 4.1% |
| $200,000+ | 18 | 0.4% |
Household Income by Householder Age in Chaparral
The median household income in Chaparral is $44,219, with the highest median household income of $55,598 found in the 15 to 24 years age bracket for the primary householder. A total of 339 households (7.5%) fall into this category. Meanwhile, the 65+ years age bracket for the primary householder has the lowest median household income of $36,389, with 992 households (22.0%) in this group.
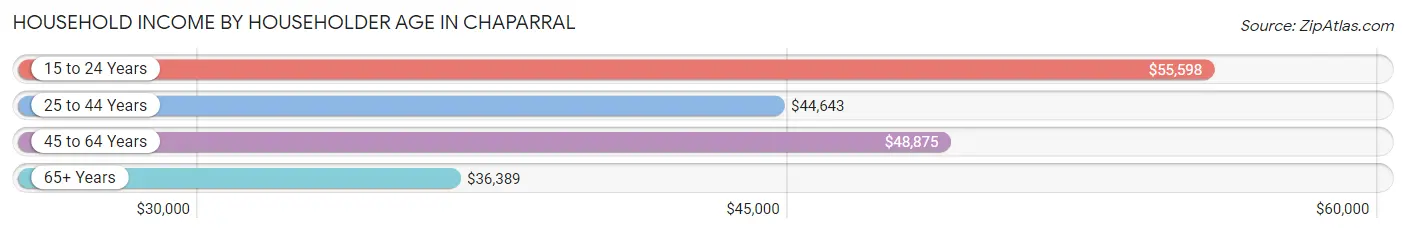
| Income Bracket | # Households | Median Income |
| 15 to 24 Years | 339 (7.5%) | $55,598 |
| 25 to 44 Years | 1,514 (33.6%) | $44,643 |
| 45 to 64 Years | 1,655 (36.8%) | $48,875 |
| 65+ Years | 992 (22.0%) | $36,389 |
| Total | 4,500 (100.0%) | $44,219 |
Poverty in Chaparral
Income Below Poverty by Sex and Age in Chaparral
With 20.8% poverty level for males and 27.0% for females among the residents of Chaparral, 65 to 74 year old males and 65 to 74 year old females are the most vulnerable to poverty, with 228 males (71.3%) and 354 females (52.0%) in their respective age groups living below the poverty level.
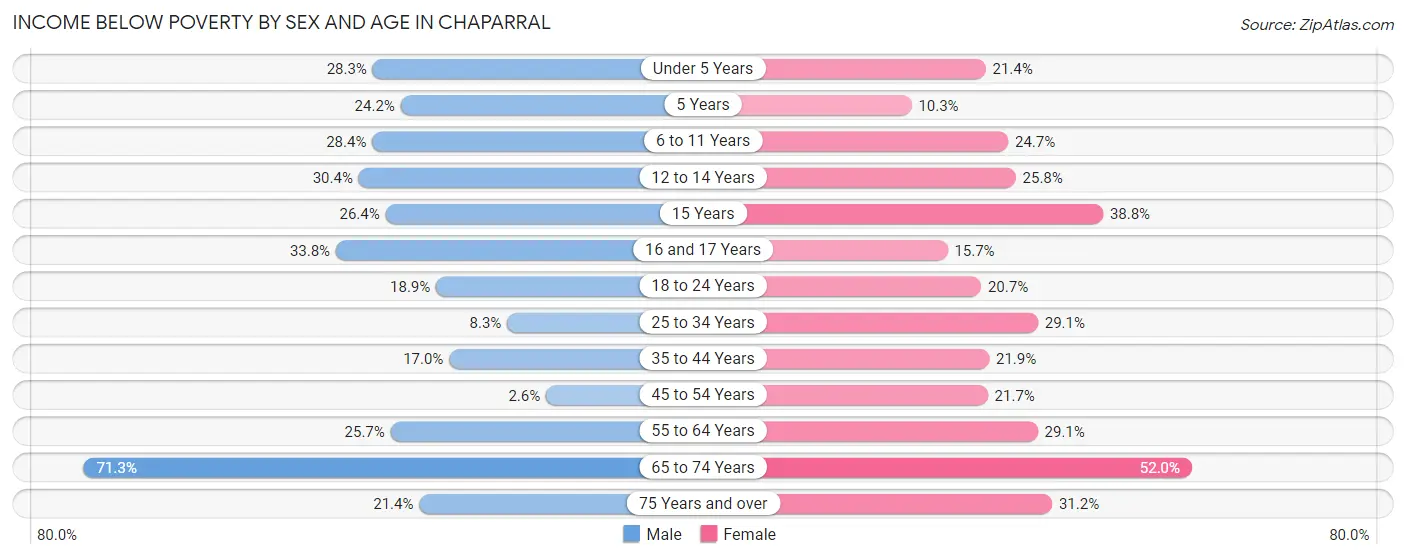
| Age Bracket | Male | Female |
| Under 5 Years | 124 (28.3%) | 98 (21.3%) |
| 5 Years | 36 (24.2%) | 18 (10.3%) |
| 6 to 11 Years | 212 (28.4%) | 240 (24.7%) |
| 12 to 14 Years | 89 (30.4%) | 96 (25.8%) |
| 15 Years | 47 (26.4%) | 38 (38.8%) |
| 16 and 17 Years | 104 (33.8%) | 40 (15.7%) |
| 18 to 24 Years | 160 (18.9%) | 173 (20.7%) |
| 25 to 34 Years | 104 (8.3%) | 307 (29.1%) |
| 35 to 44 Years | 121 (17.0%) | 202 (21.9%) |
| 45 to 54 Years | 24 (2.6%) | 141 (21.7%) |
| 55 to 64 Years | 177 (25.7%) | 308 (29.1%) |
| 65 to 74 Years | 228 (71.3%) | 354 (52.0%) |
| 75 Years and over | 89 (21.4%) | 147 (31.2%) |
| Total | 1,515 (20.8%) | 2,162 (27.0%) |
Income Above Poverty by Sex and Age in Chaparral
According to the poverty statistics in Chaparral, males aged 45 to 54 years and females aged 5 years are the age groups that are most secure financially, with 97.4% of males and 89.7% of females in these age groups living above the poverty line.
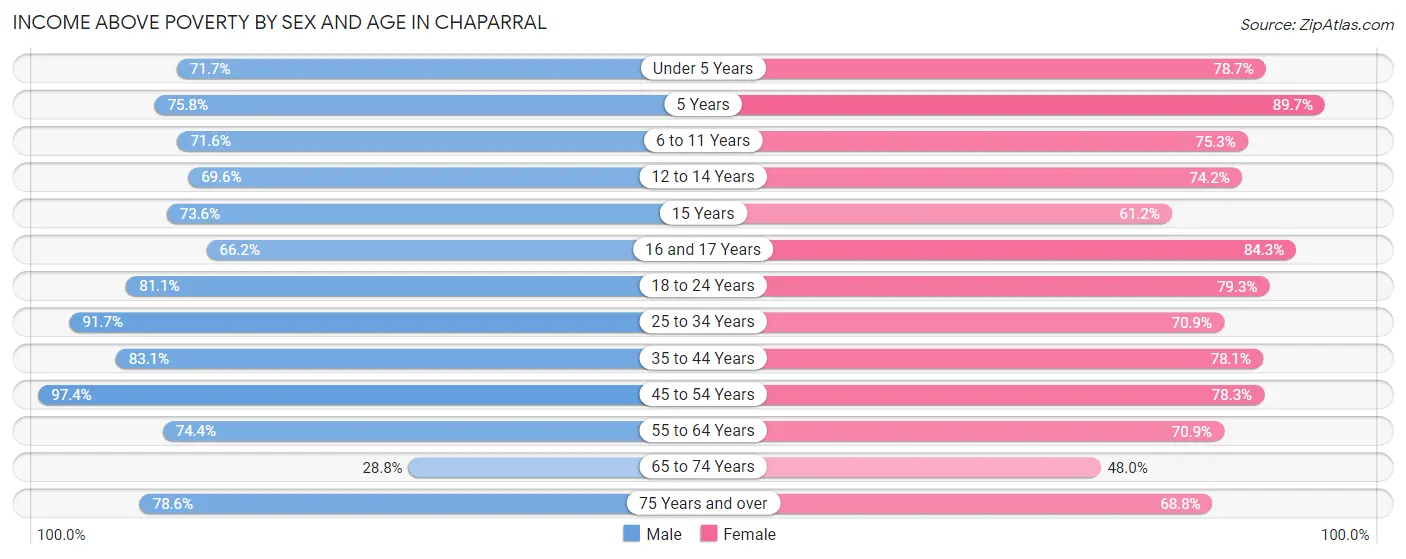
| Age Bracket | Male | Female |
| Under 5 Years | 314 (71.7%) | 361 (78.6%) |
| 5 Years | 113 (75.8%) | 156 (89.7%) |
| 6 to 11 Years | 535 (71.6%) | 732 (75.3%) |
| 12 to 14 Years | 204 (69.6%) | 276 (74.2%) |
| 15 Years | 131 (73.6%) | 60 (61.2%) |
| 16 and 17 Years | 204 (66.2%) | 215 (84.3%) |
| 18 to 24 Years | 687 (81.1%) | 664 (79.3%) |
| 25 to 34 Years | 1,143 (91.7%) | 748 (70.9%) |
| 35 to 44 Years | 593 (83.1%) | 722 (78.1%) |
| 45 to 54 Years | 911 (97.4%) | 510 (78.3%) |
| 55 to 64 Years | 513 (74.4%) | 751 (70.9%) |
| 65 to 74 Years | 92 (28.7%) | 327 (48.0%) |
| 75 Years and over | 327 (78.6%) | 324 (68.8%) |
| Total | 5,767 (79.2%) | 5,846 (73.0%) |
Income Below Poverty Among Married-Couple Families in Chaparral
The poverty statistics for married-couple families in Chaparral show that 24.3% or 570 of the total 2,350 families live below the poverty line. Families with 5 or more children have the highest poverty rate of 49.1%, comprising of 27 families. On the other hand, families with 1 or 2 children have the lowest poverty rate of 11.7%, which includes 96 families.
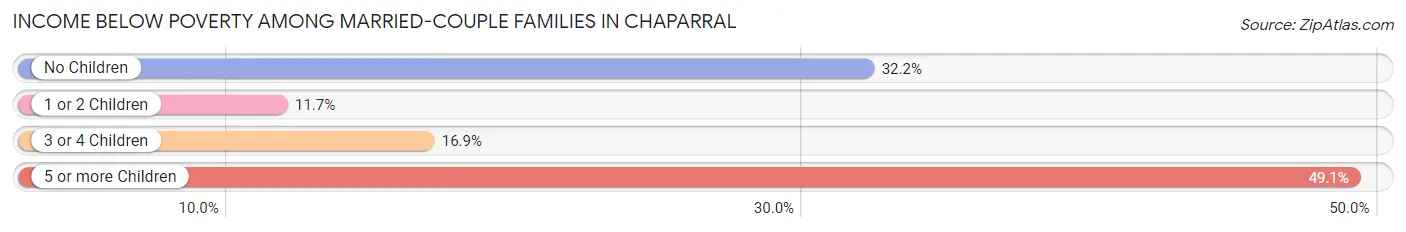
| Children | Above Poverty | Below Poverty |
| No Children | 877 (67.8%) | 416 (32.2%) |
| 1 or 2 Children | 722 (88.3%) | 96 (11.7%) |
| 3 or 4 Children | 153 (83.2%) | 31 (16.9%) |
| 5 or more Children | 28 (50.9%) | 27 (49.1%) |
| Total | 1,780 (75.7%) | 570 (24.3%) |
Income Below Poverty Among Single-Parent Households in Chaparral
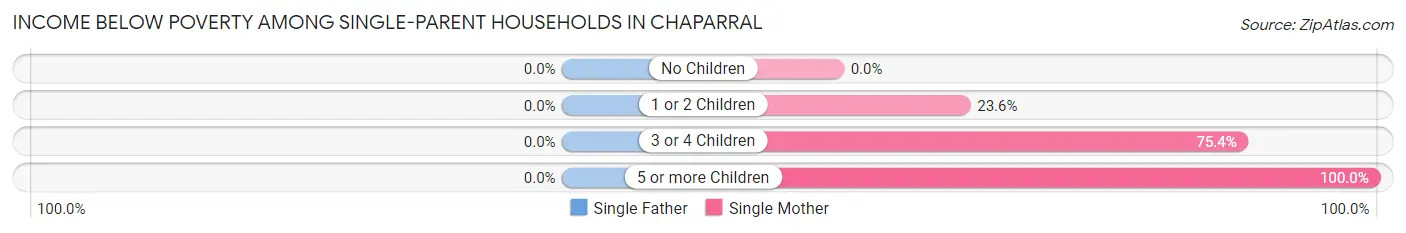
| Children | Single Father | Single Mother |
| No Children | 0 (0.0%) | 0 (0.0%) |
| 1 or 2 Children | 0 (0.0%) | 104 (23.6%) |
| 3 or 4 Children | 0 (0.0%) | 92 (75.4%) |
| 5 or more Children | 0 (0.0%) | 86 (100.0%) |
| Total | 0 (0.0%) | 282 (32.8%) |
Income Below Poverty Among Married-Couple vs Single-Parent Households in Chaparral
The poverty data for Chaparral shows that 570 of the married-couple family households (24.3%) and 282 of the single-parent households (23.0%) are living below the poverty level. Within the married-couple family households, those with 5 or more children have the highest poverty rate, with 27 households (49.1%) falling below the poverty line. Among the single-parent households, those with 3 or 4 children have the highest poverty rate, with 92 household (75.4%) living below poverty.
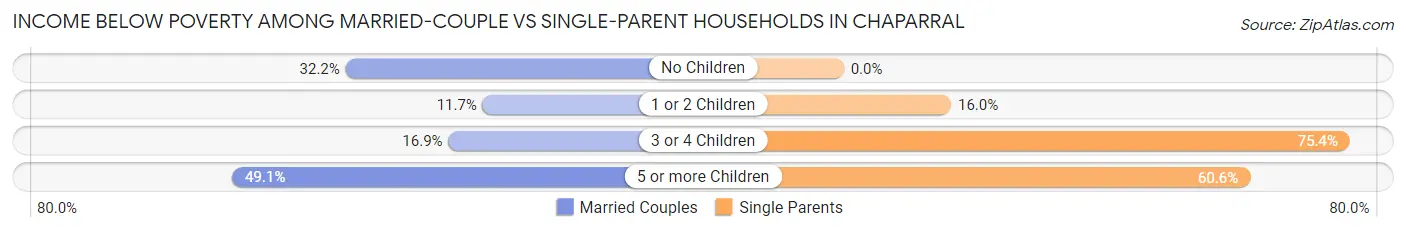
| Children | Married-Couple Families | Single-Parent Households |
| No Children | 416 (32.2%) | 0 (0.0%) |
| 1 or 2 Children | 96 (11.7%) | 104 (16.0%) |
| 3 or 4 Children | 31 (16.9%) | 92 (75.4%) |
| 5 or more Children | 27 (49.1%) | 86 (60.6%) |
| Total | 570 (24.3%) | 282 (23.0%) |
Race in Chaparral
The most populous races in Chaparral are Hispanic or Latino (13,721 | 89.7%), White / Caucasian (6,977 | 45.6%), and Two or more Races (4,363 | 28.5%).
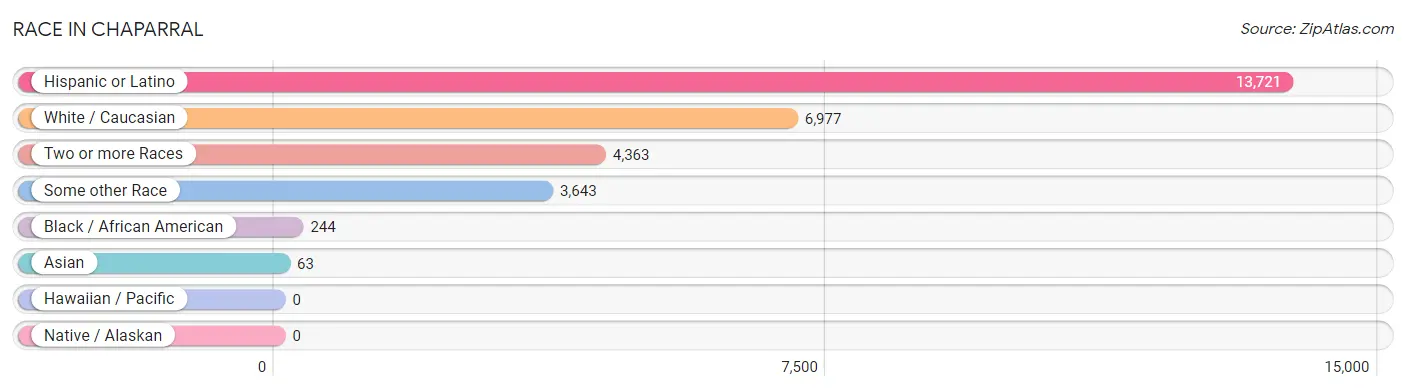
| Race | # Population | % Population |
| Asian | 63 | 0.4% |
| Black / African American | 244 | 1.6% |
| Hawaiian / Pacific | 0 | 0.0% |
| Hispanic or Latino | 13,721 | 89.7% |
| Native / Alaskan | 0 | 0.0% |
| White / Caucasian | 6,977 | 45.6% |
| Two or more Races | 4,363 | 28.5% |
| Some other Race | 3,643 | 23.8% |
| Total | 15,290 | 100.0% |
Ancestry in Chaparral
The most populous ancestries reported in Chaparral are Mexican (12,835 | 83.9%), German (384 | 2.5%), English (361 | 2.4%), French (344 | 2.2%), and Irish (168 | 1.1%), together accounting for 92.2% of all Chaparral residents.
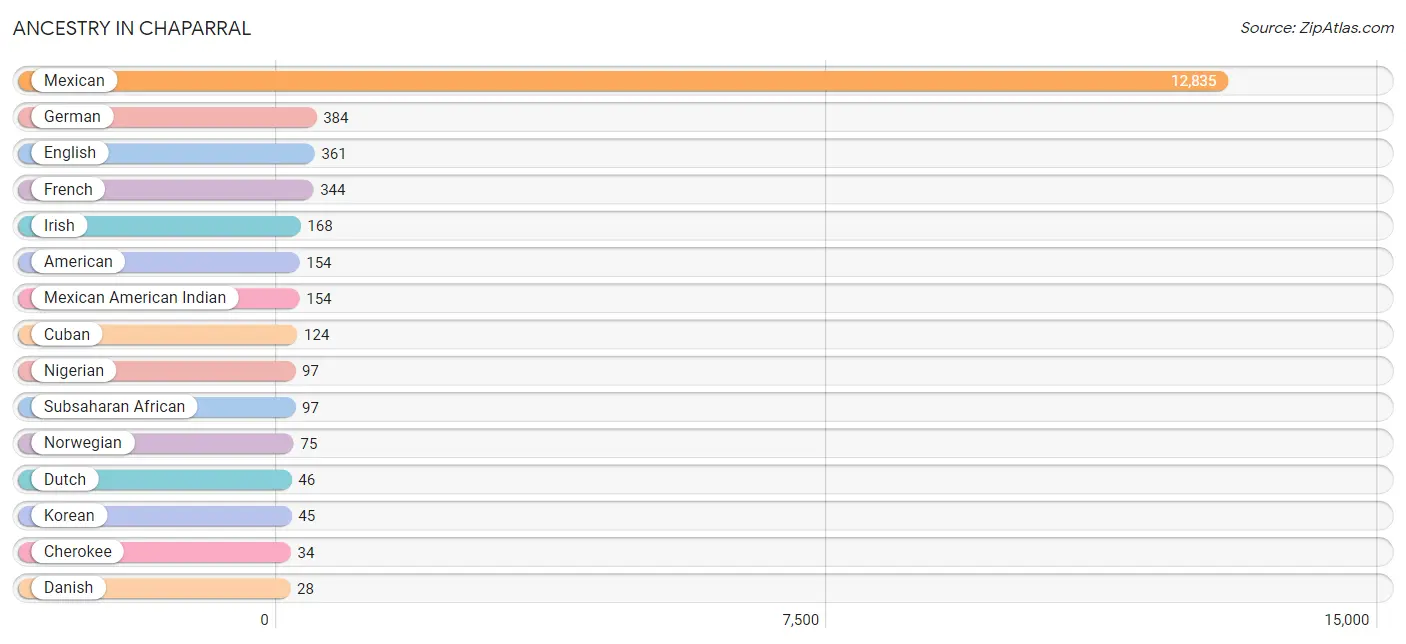
| Ancestry | # Population | % Population |
| American | 154 | 1.0% |
| Bhutanese | 18 | 0.1% |
| Burmese | 2 | 0.0% |
| Cherokee | 34 | 0.2% |
| Cuban | 124 | 0.8% |
| Danish | 28 | 0.2% |
| Dutch | 46 | 0.3% |
| English | 361 | 2.4% |
| European | 12 | 0.1% |
| French | 344 | 2.2% |
| German | 384 | 2.5% |
| Irish | 168 | 1.1% |
| Italian | 27 | 0.2% |
| Korean | 45 | 0.3% |
| Mexican | 12,835 | 83.9% |
| Mexican American Indian | 154 | 1.0% |
| Nigerian | 97 | 0.6% |
| Norwegian | 75 | 0.5% |
| Polish | 8 | 0.1% |
| Scotch-Irish | 3 | 0.0% |
| Scottish | 4 | 0.0% |
| Spaniard | 7 | 0.1% |
| Spanish | 26 | 0.2% |
| Subsaharan African | 97 | 0.6% |
| Welsh | 9 | 0.1% | View All 25 Rows |
Immigrants in Chaparral
The most numerous immigrant groups reported in Chaparral came from Latin America (4,593 | 30.0%), Central America (4,469 | 29.2%), Mexico (4,469 | 29.2%), Caribbean (124 | 0.8%), and Cuba (124 | 0.8%), together accounting for 90.1% of all Chaparral residents.
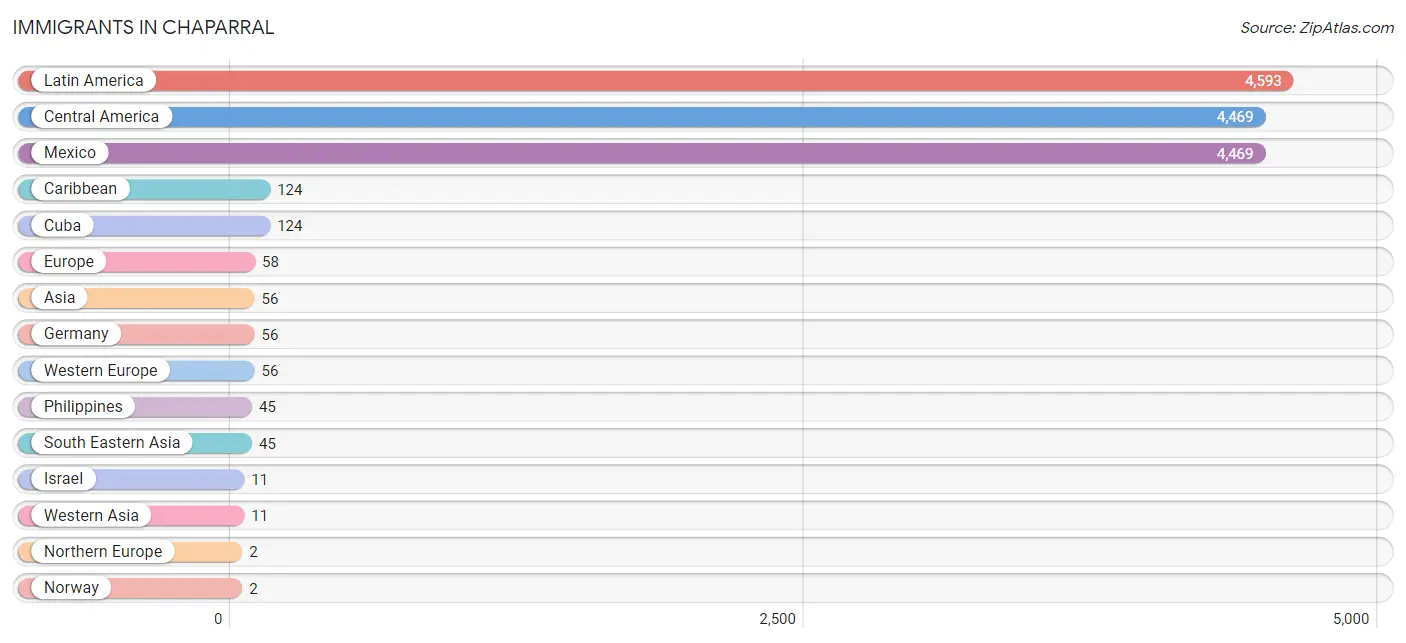
| Immigration Origin | # Population | % Population |
| Asia | 56 | 0.4% |
| Caribbean | 124 | 0.8% |
| Central America | 4,469 | 29.2% |
| Cuba | 124 | 0.8% |
| Europe | 58 | 0.4% |
| Germany | 56 | 0.4% |
| Israel | 11 | 0.1% |
| Latin America | 4,593 | 30.0% |
| Mexico | 4,469 | 29.2% |
| Northern Europe | 2 | 0.0% |
| Norway | 2 | 0.0% |
| Philippines | 45 | 0.3% |
| South Eastern Asia | 45 | 0.3% |
| Western Asia | 11 | 0.1% |
| Western Europe | 56 | 0.4% | View All 15 Rows |
Sex and Age in Chaparral
Sex and Age in Chaparral
The most populous age groups in Chaparral are 25 to 29 Years (855 | 11.7%) for men and 5 to 9 Years (762 | 9.5%) for women.
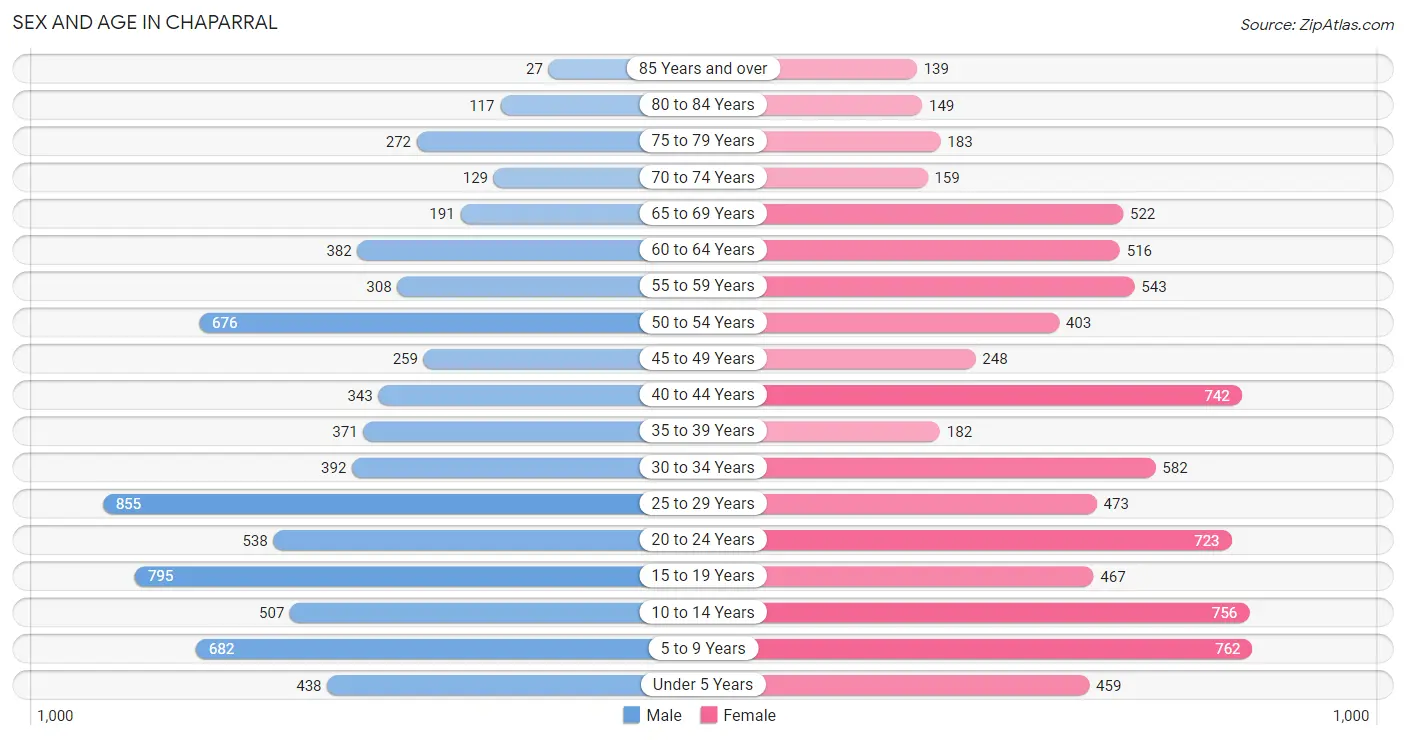
| Age Bracket | Male | Female |
| Under 5 Years | 438 (6.0%) | 459 (5.7%) |
| 5 to 9 Years | 682 (9.4%) | 762 (9.5%) |
| 10 to 14 Years | 507 (7.0%) | 756 (9.4%) |
| 15 to 19 Years | 795 (10.9%) | 467 (5.8%) |
| 20 to 24 Years | 538 (7.4%) | 723 (9.0%) |
| 25 to 29 Years | 855 (11.7%) | 473 (5.9%) |
| 30 to 34 Years | 392 (5.4%) | 582 (7.3%) |
| 35 to 39 Years | 371 (5.1%) | 182 (2.3%) |
| 40 to 44 Years | 343 (4.7%) | 742 (9.3%) |
| 45 to 49 Years | 259 (3.6%) | 248 (3.1%) |
| 50 to 54 Years | 676 (9.3%) | 403 (5.0%) |
| 55 to 59 Years | 308 (4.2%) | 543 (6.8%) |
| 60 to 64 Years | 382 (5.2%) | 516 (6.4%) |
| 65 to 69 Years | 191 (2.6%) | 522 (6.5%) |
| 70 to 74 Years | 129 (1.8%) | 159 (2.0%) |
| 75 to 79 Years | 272 (3.7%) | 183 (2.3%) |
| 80 to 84 Years | 117 (1.6%) | 149 (1.9%) |
| 85 Years and over | 27 (0.4%) | 139 (1.7%) |
| Total | 7,282 (100.0%) | 8,008 (100.0%) |
Families and Households in Chaparral
Median Family Size in Chaparral
The median family size in Chaparral is 3.89 persons per family, with single male/father families (365 | 10.2%) accounting for the largest median family size of 4.63 persons per family. On the other hand, single female/mother families (860 | 24.1%) represent the smallest median family size with 3.34 persons per family.
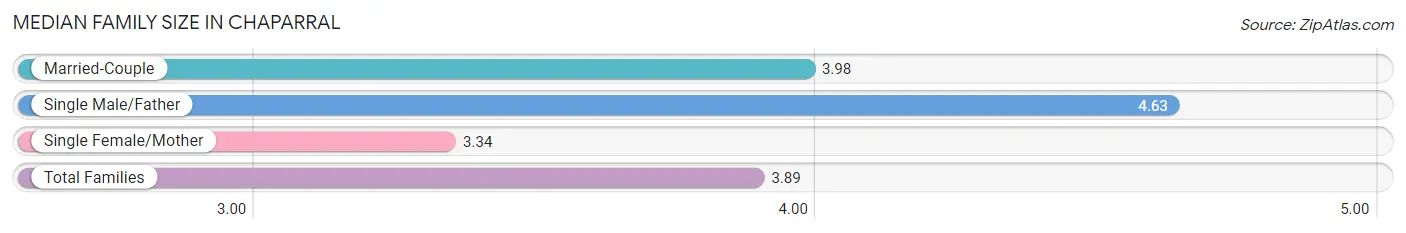
| Family Type | # Families | Family Size |
| Married-Couple | 2,350 (65.7%) | 3.98 |
| Single Male/Father | 365 (10.2%) | 4.63 |
| Single Female/Mother | 860 (24.1%) | 3.34 |
| Total Families | 3,575 (100.0%) | 3.89 |
Median Household Size in Chaparral
The median household size in Chaparral is 3.39 persons per household, with single male/father households (365 | 8.1%) accounting for the largest median household size of 4.77 persons per household. non-family households (925 | 20.6%) represent the smallest median household size with 1.15 persons per household.
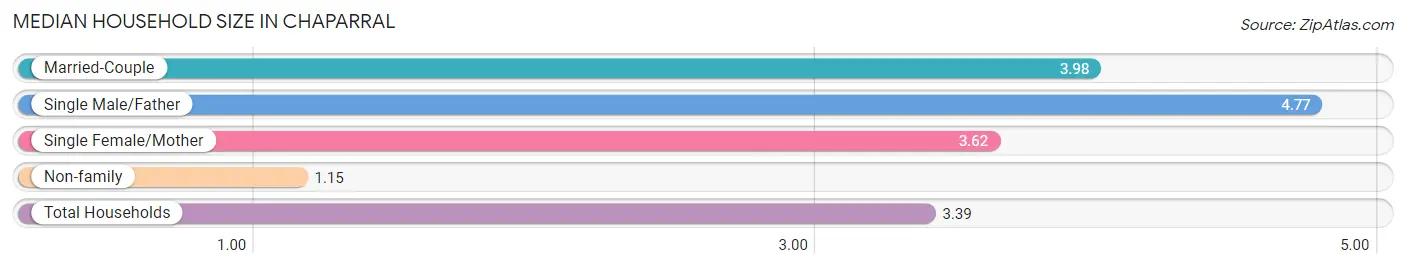
| Household Type | # Households | Household Size |
| Married-Couple | 2,350 (52.2%) | 3.98 |
| Single Male/Father | 365 (8.1%) | 4.77 |
| Single Female/Mother | 860 (19.1%) | 3.62 |
| Non-family | 925 (20.6%) | 1.15 |
| Total Households | 4,500 (100.0%) | 3.39 |
Household Size by Marriage Status in Chaparral
Out of a total of 4,500 households in Chaparral, 3,575 (79.4%) are family households, while 925 (20.6%) are nonfamily households. The most numerous type of family households are 2-person households, comprising 1,417, and the most common type of nonfamily households are 1-person households, comprising 823.
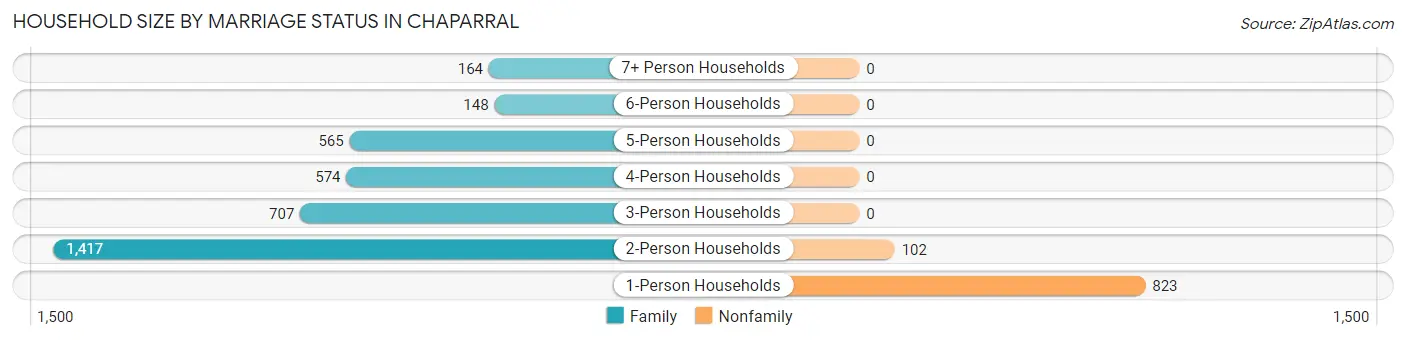
| Household Size | Family Households | Nonfamily Households |
| 1-Person Households | - | 823 (18.3%) |
| 2-Person Households | 1,417 (31.5%) | 102 (2.3%) |
| 3-Person Households | 707 (15.7%) | 0 (0.0%) |
| 4-Person Households | 574 (12.8%) | 0 (0.0%) |
| 5-Person Households | 565 (12.6%) | 0 (0.0%) |
| 6-Person Households | 148 (3.3%) | 0 (0.0%) |
| 7+ Person Households | 164 (3.6%) | 0 (0.0%) |
| Total | 3,575 (79.4%) | 925 (20.6%) |
Female Fertility in Chaparral
Fertility by Age in Chaparral
Average fertility rate in Chaparral is 43.0 births per 1,000 women. Women in the age bracket of 20 to 34 years have the highest fertility rate with 69.0 births per 1,000 women. Women in the age bracket of 20 to 34 years acount for 81.9% of all women with births.
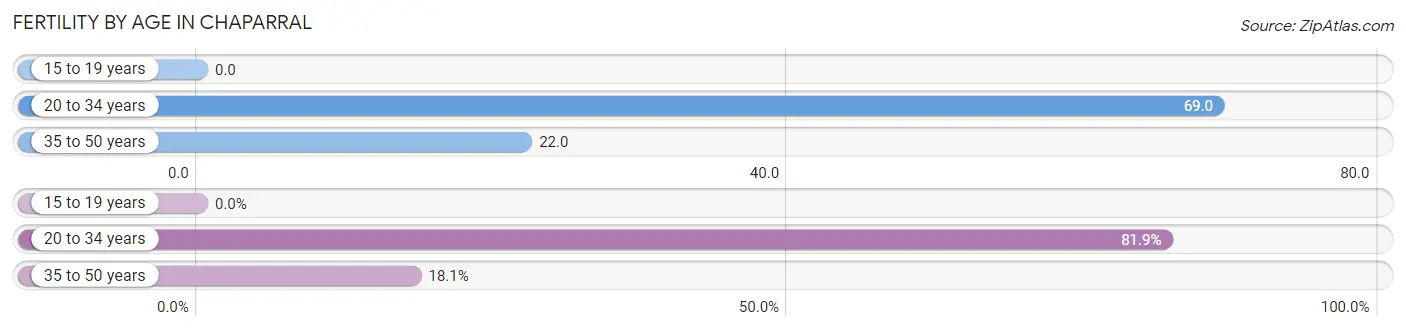
| Age Bracket | Women with Births | Births / 1,000 Women |
| 15 to 19 years | 0 (0.0%) | 0.0 |
| 20 to 34 years | 122 (81.9%) | 69.0 |
| 35 to 50 years | 27 (18.1%) | 22.0 |
| Total | 149 (100.0%) | 43.0 |
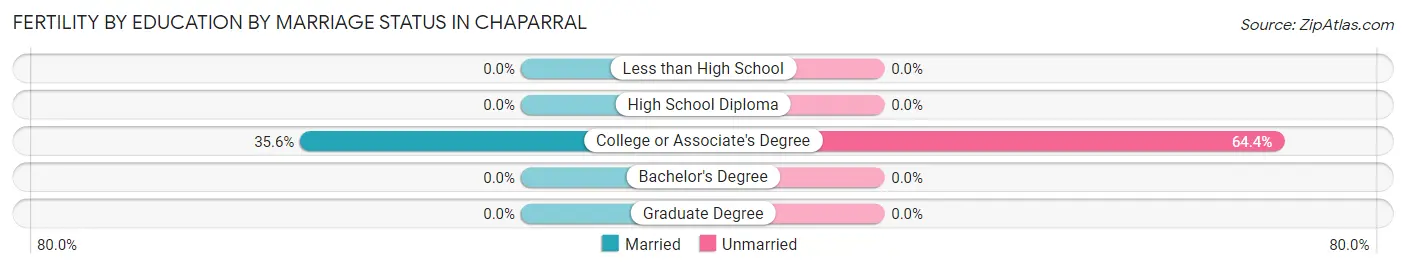
Fertility by Age by Marriage Status in Chaparral
35.6% of women with births (149) in Chaparral are married. The highest percentage of unmarried women with births falls into 20 to 34 years age bracket with 78.7% of them unmarried at the time of birth, while the lowest percentage of unmarried women with births belong to 35 to 50 years age bracket with 0.0% of them unmarried.
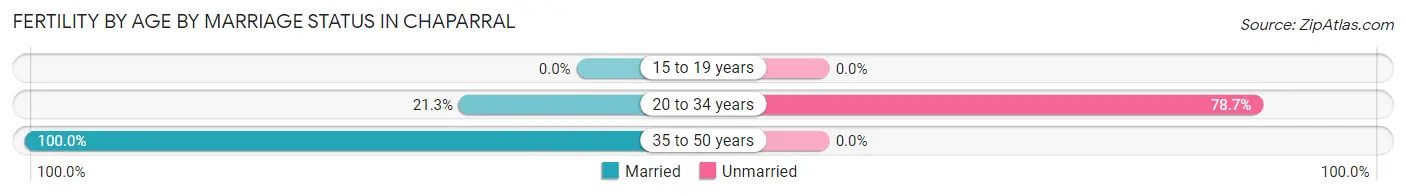
| Age Bracket | Married | Unmarried |
| 15 to 19 years | 0 (0.0%) | 0 (0.0%) |
| 20 to 34 years | 26 (21.3%) | 96 (78.7%) |
| 35 to 50 years | 27 (100.0%) | 0 (0.0%) |
| Total | 53 (35.6%) | 96 (64.4%) |
Fertility by Education in Chaparral
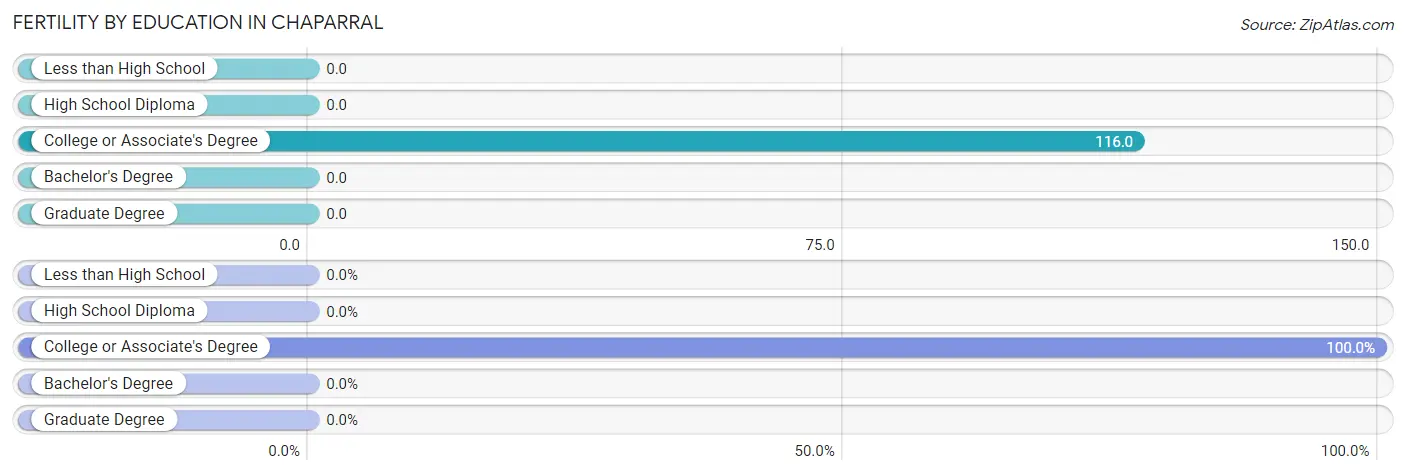
| Educational Attainment | Women with Births | Births / 1,000 Women |
| Less than High School | 0 (0.0%) | 0.0 |
| High School Diploma | 0 (0.0%) | 0.0 |
| College or Associate's Degree | 149 (100.0%) | 116.0 |
| Bachelor's Degree | 0 (0.0%) | 0.0 |
| Graduate Degree | 0 (0.0%) | 0.0 |
| Total | 149 (100.0%) | 43.0 |
Fertility by Education by Marriage Status in Chaparral
64.4% of women with births in Chaparral are unmarried. Women with the educational attainment of college or associate's degree are most likely to be married with 35.6% of them married at childbirth, while women with the educational attainment of college or associate's degree are least likely to be married with 64.4% of them unmarried at childbirth.
| Educational Attainment | Married | Unmarried |
| Less than High School | 0 (0.0%) | 0 (0.0%) |
| High School Diploma | 0 (0.0%) | 0 (0.0%) |
| College or Associate's Degree | 53 (35.6%) | 96 (64.4%) |
| Bachelor's Degree | 0 (0.0%) | 0 (0.0%) |
| Graduate Degree | 0 (0.0%) | 0 (0.0%) |
| Total | 53 (35.6%) | 96 (64.4%) |
Employment Characteristics in Chaparral
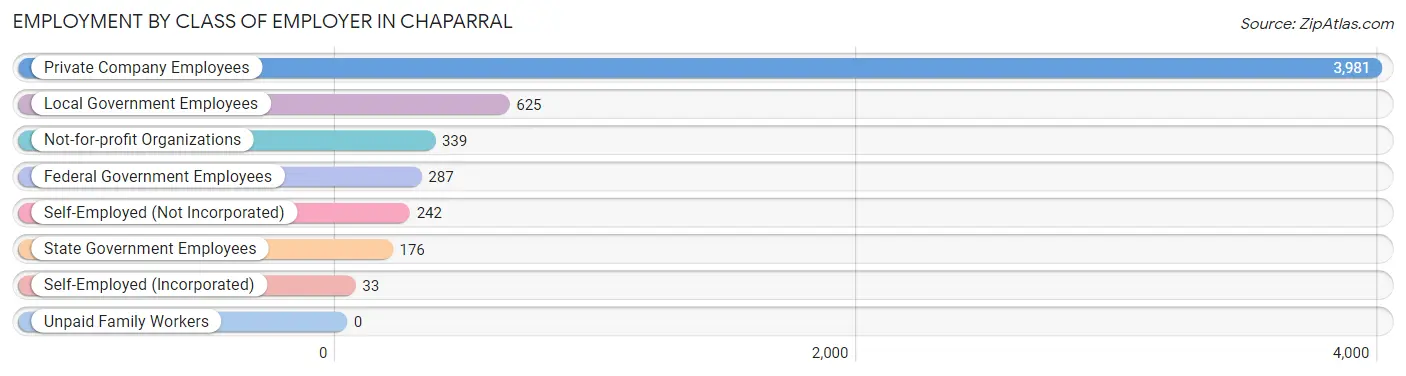
Employment by Class of Employer in Chaparral
Among the 5,683 employed individuals in Chaparral, private company employees (3,981 | 70.1%), local government employees (625 | 11.0%), and not-for-profit organizations (339 | 6.0%) make up the most common classes of employment.
| Employer Class | # Employees | % Employees |
| Private Company Employees | 3,981 | 70.1% |
| Self-Employed (Incorporated) | 33 | 0.6% |
| Self-Employed (Not Incorporated) | 242 | 4.3% |
| Not-for-profit Organizations | 339 | 6.0% |
| Local Government Employees | 625 | 11.0% |
| State Government Employees | 176 | 3.1% |
| Federal Government Employees | 287 | 5.1% |
| Unpaid Family Workers | 0 | 0.0% |
| Total | 5,683 | 100.0% |
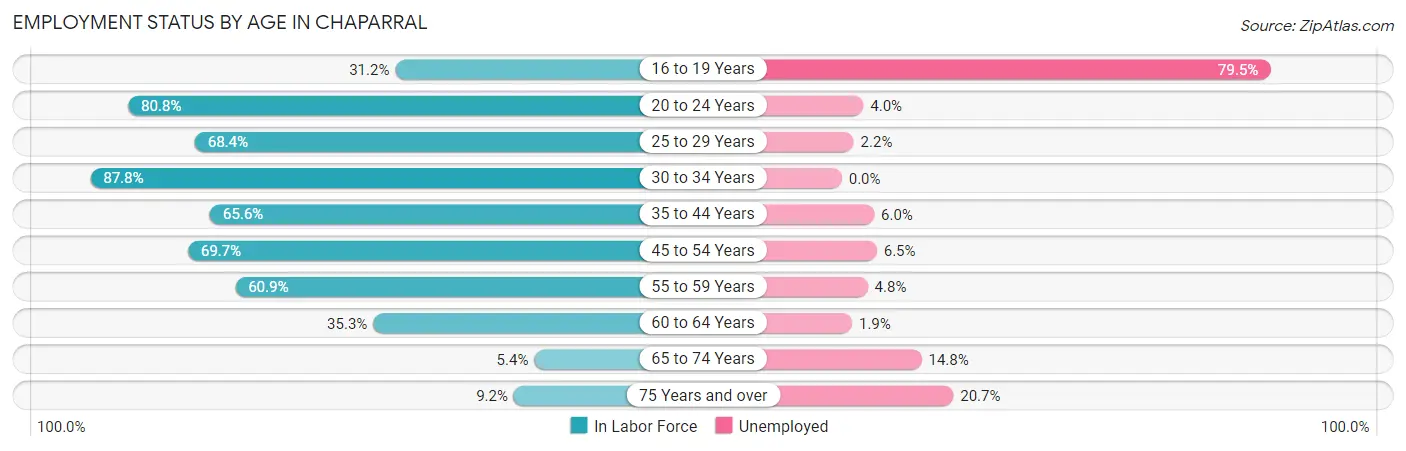
Employment Status by Age in Chaparral
According to the labor force statistics for Chaparral, out of the total population over 16 years of age (11,410), 54.7% or 6,241 individuals are in the labor force, with 8.0% or 499 of them unemployed. The age group with the highest labor force participation rate is 30 to 34 years, with 87.8% or 855 individuals in the labor force. Within the labor force, the 16 to 19 years age range has the highest percentage of unemployed individuals, with 79.5% or 245 of them being unemployed.
| Age Bracket | In Labor Force | Unemployed |
| 16 to 19 Years | 308 (31.2%) | 245 (79.5%) |
| 20 to 24 Years | 1,019 (80.8%) | 41 (4.0%) |
| 25 to 29 Years | 908 (68.4%) | 20 (2.2%) |
| 30 to 34 Years | 855 (87.8%) | 0 (0.0%) |
| 35 to 44 Years | 1,075 (65.6%) | 64 (6.0%) |
| 45 to 54 Years | 1,105 (69.7%) | 72 (6.5%) |
| 55 to 59 Years | 518 (60.9%) | 25 (4.8%) |
| 60 to 64 Years | 317 (35.3%) | 6 (1.9%) |
| 65 to 74 Years | 54 (5.4%) | 8 (14.8%) |
| 75 Years and over | 82 (9.2%) | 17 (20.7%) |
| Total | 6,241 (54.7%) | 499 (8.0%) |
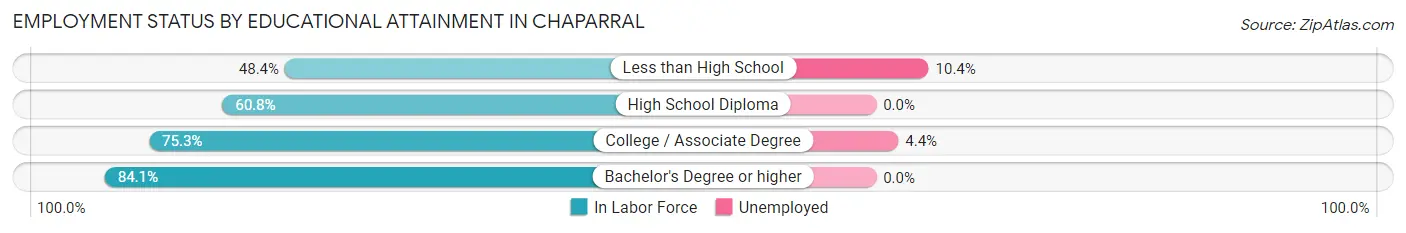
Employment Status by Educational Attainment in Chaparral
According to labor force statistics for Chaparral, 65.7% of individuals (4,780) out of the total population between 25 and 64 years of age (7,275) are in the labor force, with 3.9% or 186 of them being unemployed. The group with the highest labor force participation rate are those with the educational attainment of bachelor's degree or higher, with 84.1% or 770 individuals in the labor force. Within the labor force, individuals with less than high school education have the highest percentage of unemployment, with 10.4% or 98 of them being unemployed.
| Educational Attainment | In Labor Force | Unemployed |
| Less than High School | 947 (48.4%) | 203 (10.4%) |
| High School Diploma | 1,058 (60.8%) | 0 (0.0%) |
| College / Associate Degree | 2,005 (75.3%) | 117 (4.4%) |
| Bachelor's Degree or higher | 770 (84.1%) | 0 (0.0%) |
| Total | 4,780 (65.7%) | 284 (3.9%) |
Employment Occupations by Sex in Chaparral
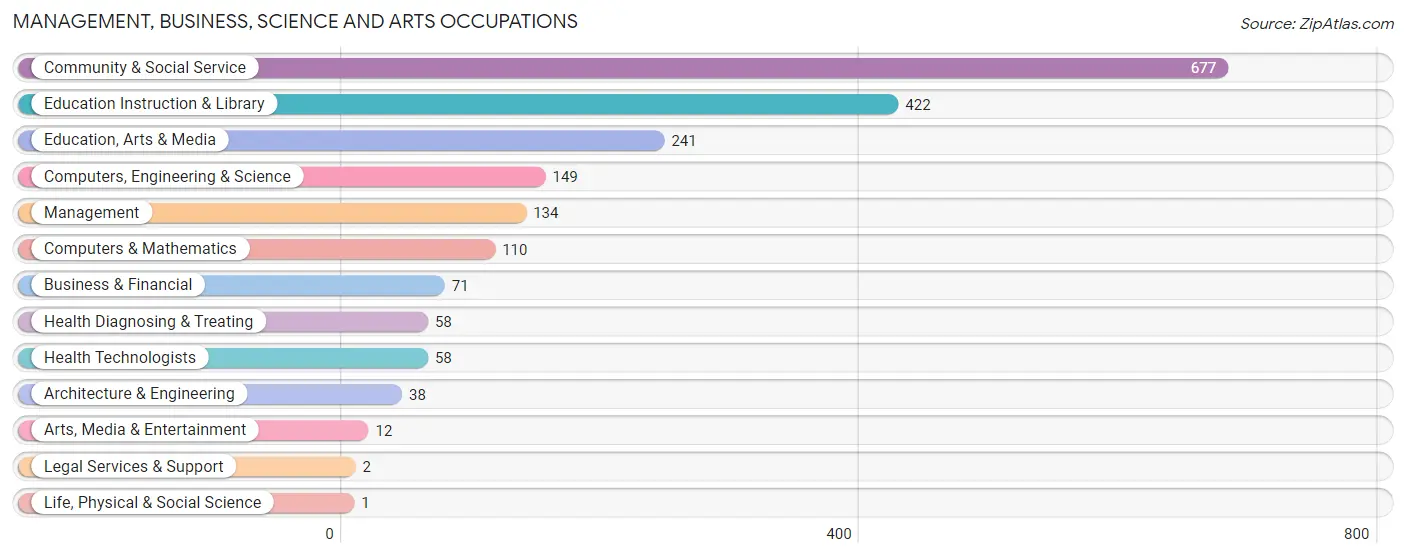
Management, Business, Science and Arts Occupations
The most common Management, Business, Science and Arts occupations in Chaparral are Community & Social Service (677 | 11.8%), Education Instruction & Library (422 | 7.4%), Education, Arts & Media (241 | 4.2%), Computers, Engineering & Science (149 | 2.6%), and Management (134 | 2.3%).
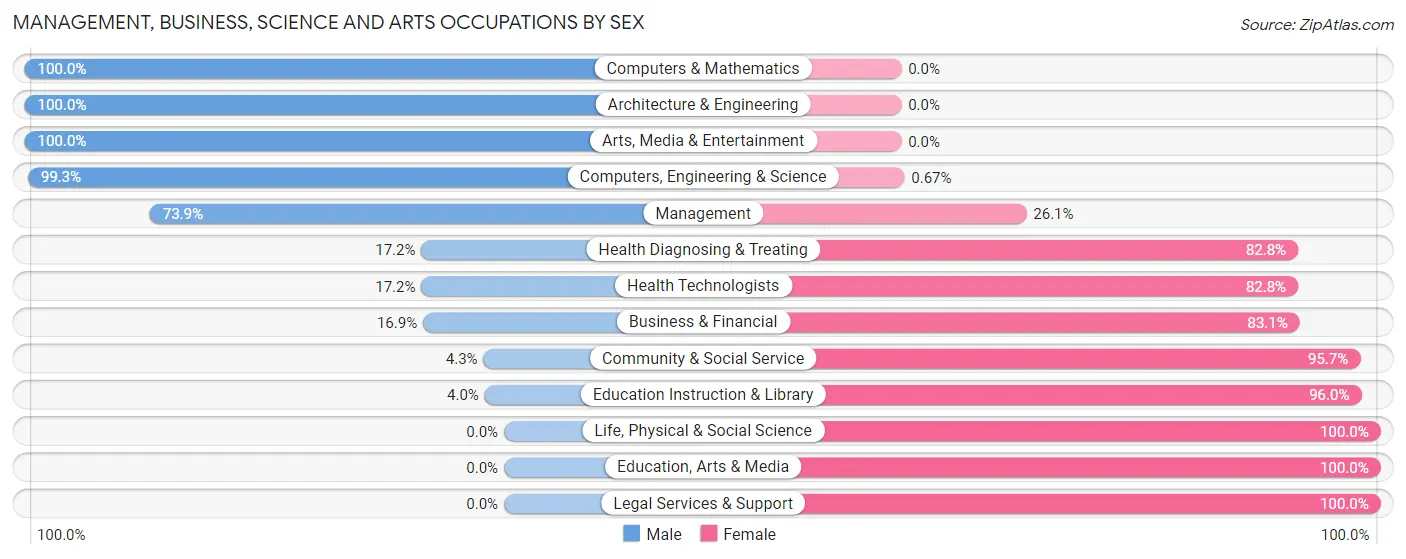
Management, Business, Science and Arts Occupations by Sex
Within the Management, Business, Science and Arts occupations in Chaparral, the most male-oriented occupations are Computers & Mathematics (100.0%), Architecture & Engineering (100.0%), and Arts, Media & Entertainment (100.0%), while the most female-oriented occupations are Life, Physical & Social Science (100.0%), Education, Arts & Media (100.0%), and Legal Services & Support (100.0%).
| Occupation | Male | Female |
| Management | 99 (73.9%) | 35 (26.1%) |
| Business & Financial | 12 (16.9%) | 59 (83.1%) |
| Computers, Engineering & Science | 148 (99.3%) | 1 (0.7%) |
| Computers & Mathematics | 110 (100.0%) | 0 (0.0%) |
| Architecture & Engineering | 38 (100.0%) | 0 (0.0%) |
| Life, Physical & Social Science | 0 (0.0%) | 1 (100.0%) |
| Community & Social Service | 29 (4.3%) | 648 (95.7%) |
| Education, Arts & Media | 0 (0.0%) | 241 (100.0%) |
| Legal Services & Support | 0 (0.0%) | 2 (100.0%) |
| Education Instruction & Library | 17 (4.0%) | 405 (96.0%) |
| Arts, Media & Entertainment | 12 (100.0%) | 0 (0.0%) |
| Health Diagnosing & Treating | 10 (17.2%) | 48 (82.8%) |
| Health Technologists | 10 (17.2%) | 48 (82.8%) |
| Total (Category) | 298 (27.4%) | 791 (72.6%) |
| Total (Overall) | 3,143 (54.9%) | 2,577 (45.1%) |
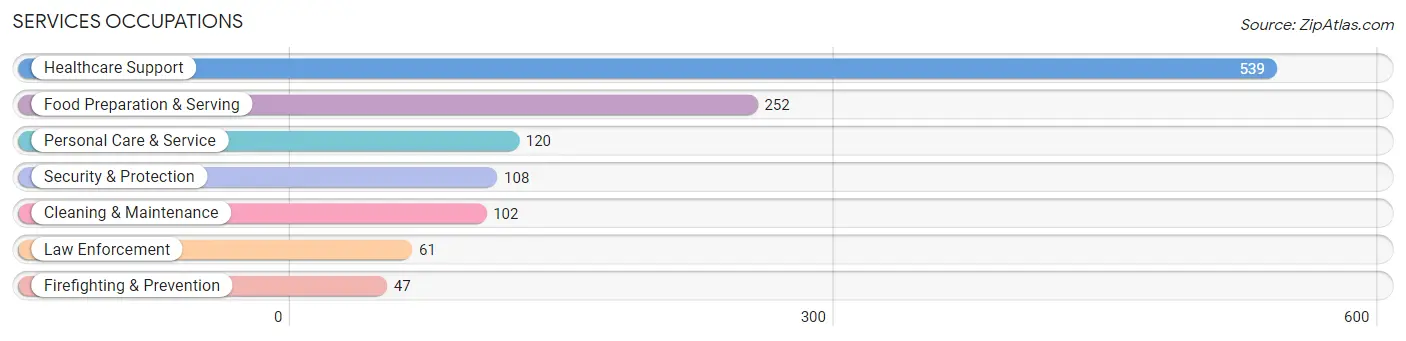
Services Occupations
The most common Services occupations in Chaparral are Healthcare Support (539 | 9.4%), Food Preparation & Serving (252 | 4.4%), Personal Care & Service (120 | 2.1%), Security & Protection (108 | 1.9%), and Cleaning & Maintenance (102 | 1.8%).
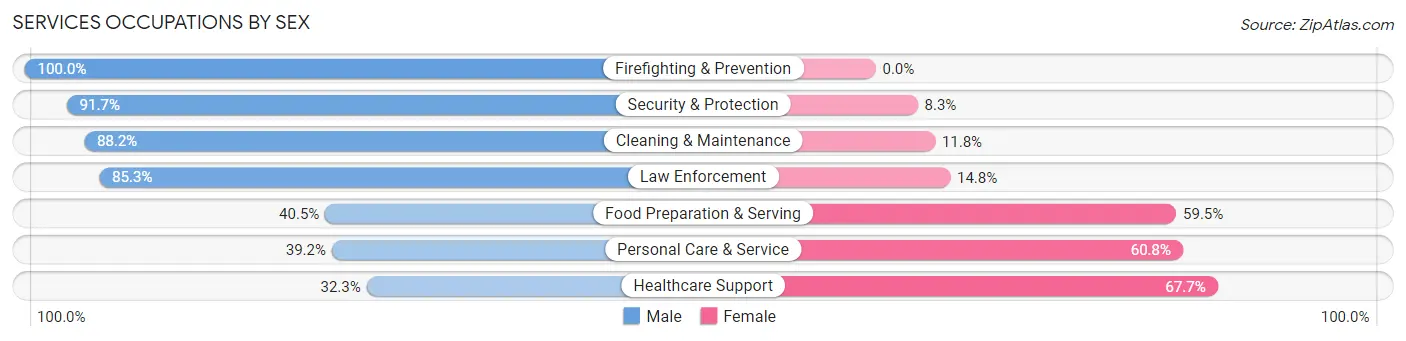
Services Occupations by Sex
Within the Services occupations in Chaparral, the most male-oriented occupations are Firefighting & Prevention (100.0%), Security & Protection (91.7%), and Cleaning & Maintenance (88.2%), while the most female-oriented occupations are Healthcare Support (67.7%), Personal Care & Service (60.8%), and Food Preparation & Serving (59.5%).
| Occupation | Male | Female |
| Healthcare Support | 174 (32.3%) | 365 (67.7%) |
| Security & Protection | 99 (91.7%) | 9 (8.3%) |
| Firefighting & Prevention | 47 (100.0%) | 0 (0.0%) |
| Law Enforcement | 52 (85.3%) | 9 (14.7%) |
| Food Preparation & Serving | 102 (40.5%) | 150 (59.5%) |
| Cleaning & Maintenance | 90 (88.2%) | 12 (11.8%) |
| Personal Care & Service | 47 (39.2%) | 73 (60.8%) |
| Total (Category) | 512 (45.7%) | 609 (54.3%) |
| Total (Overall) | 3,143 (54.9%) | 2,577 (45.1%) |
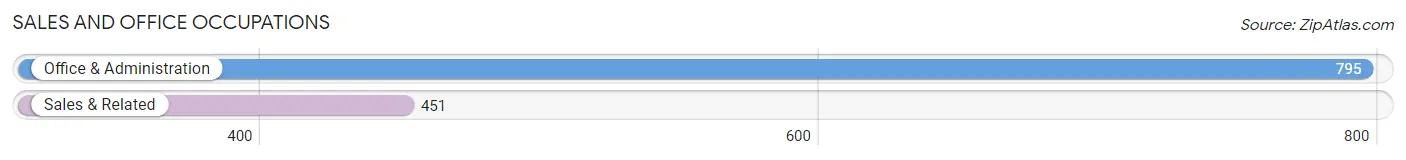
Sales and Office Occupations
The most common Sales and Office occupations in Chaparral are Office & Administration (795 | 13.9%), and Sales & Related (451 | 7.9%).
Sales and Office Occupations by Sex
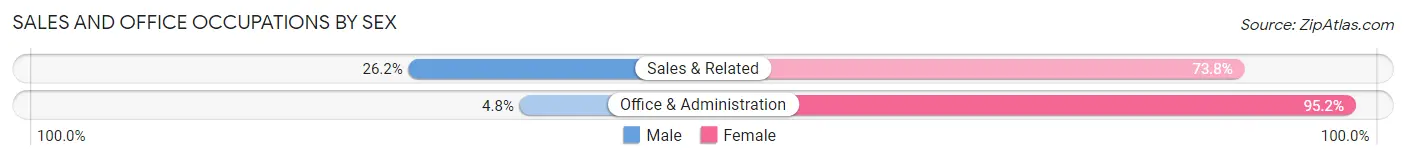
| Occupation | Male | Female |
| Sales & Related | 118 (26.2%) | 333 (73.8%) |
| Office & Administration | 38 (4.8%) | 757 (95.2%) |
| Total (Category) | 156 (12.5%) | 1,090 (87.5%) |
| Total (Overall) | 3,143 (54.9%) | 2,577 (45.1%) |
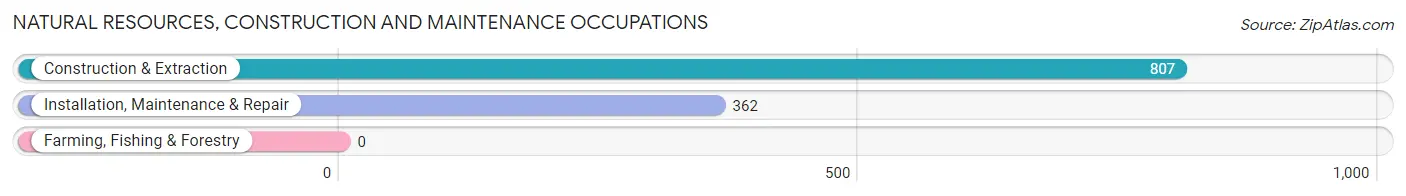
Natural Resources, Construction and Maintenance Occupations
The most common Natural Resources, Construction and Maintenance occupations in Chaparral are Construction & Extraction (807 | 14.1%), and Installation, Maintenance & Repair (362 | 6.3%).
Natural Resources, Construction and Maintenance Occupations by Sex
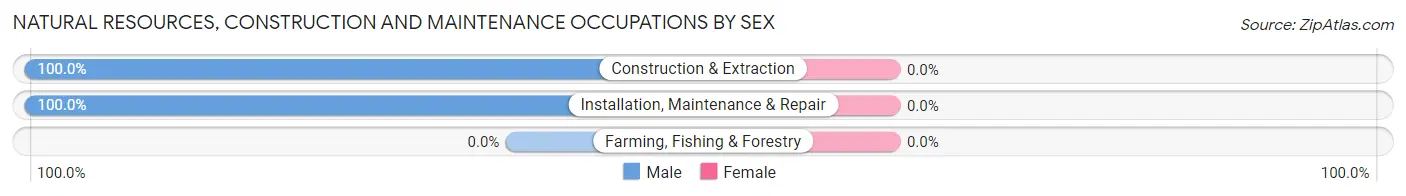
| Occupation | Male | Female |
| Farming, Fishing & Forestry | 0 (0.0%) | 0 (0.0%) |
| Construction & Extraction | 807 (100.0%) | 0 (0.0%) |
| Installation, Maintenance & Repair | 362 (100.0%) | 0 (0.0%) |
| Total (Category) | 1,169 (100.0%) | 0 (0.0%) |
| Total (Overall) | 3,143 (54.9%) | 2,577 (45.1%) |
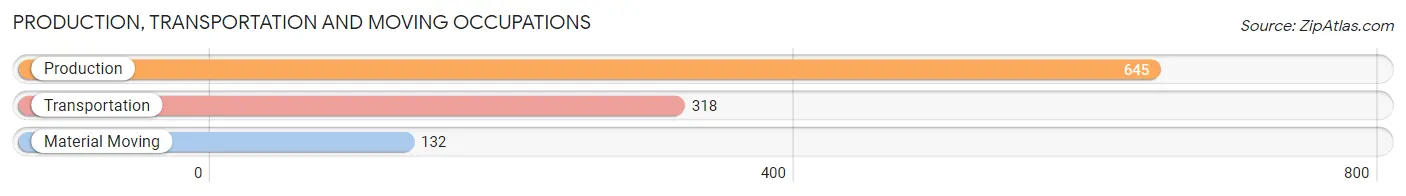
Production, Transportation and Moving Occupations
The most common Production, Transportation and Moving occupations in Chaparral are Production (645 | 11.3%), Transportation (318 | 5.6%), and Material Moving (132 | 2.3%).
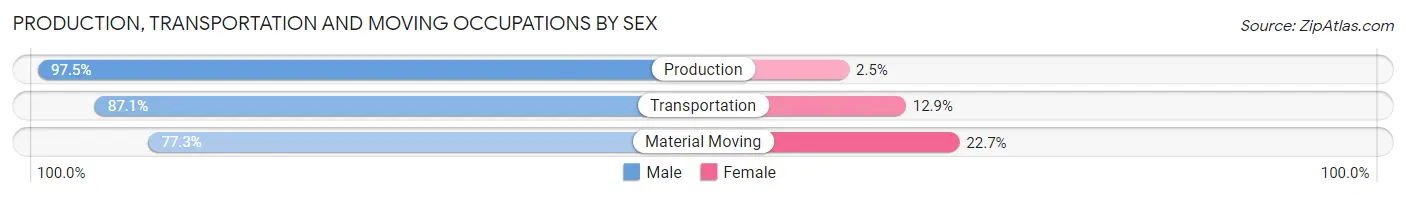
Production, Transportation and Moving Occupations by Sex
| Occupation | Male | Female |
| Production | 629 (97.5%) | 16 (2.5%) |
| Transportation | 277 (87.1%) | 41 (12.9%) |
| Material Moving | 102 (77.3%) | 30 (22.7%) |
| Total (Category) | 1,008 (92.0%) | 87 (8.0%) |
| Total (Overall) | 3,143 (54.9%) | 2,577 (45.1%) |
Employment Industries by Sex in Chaparral
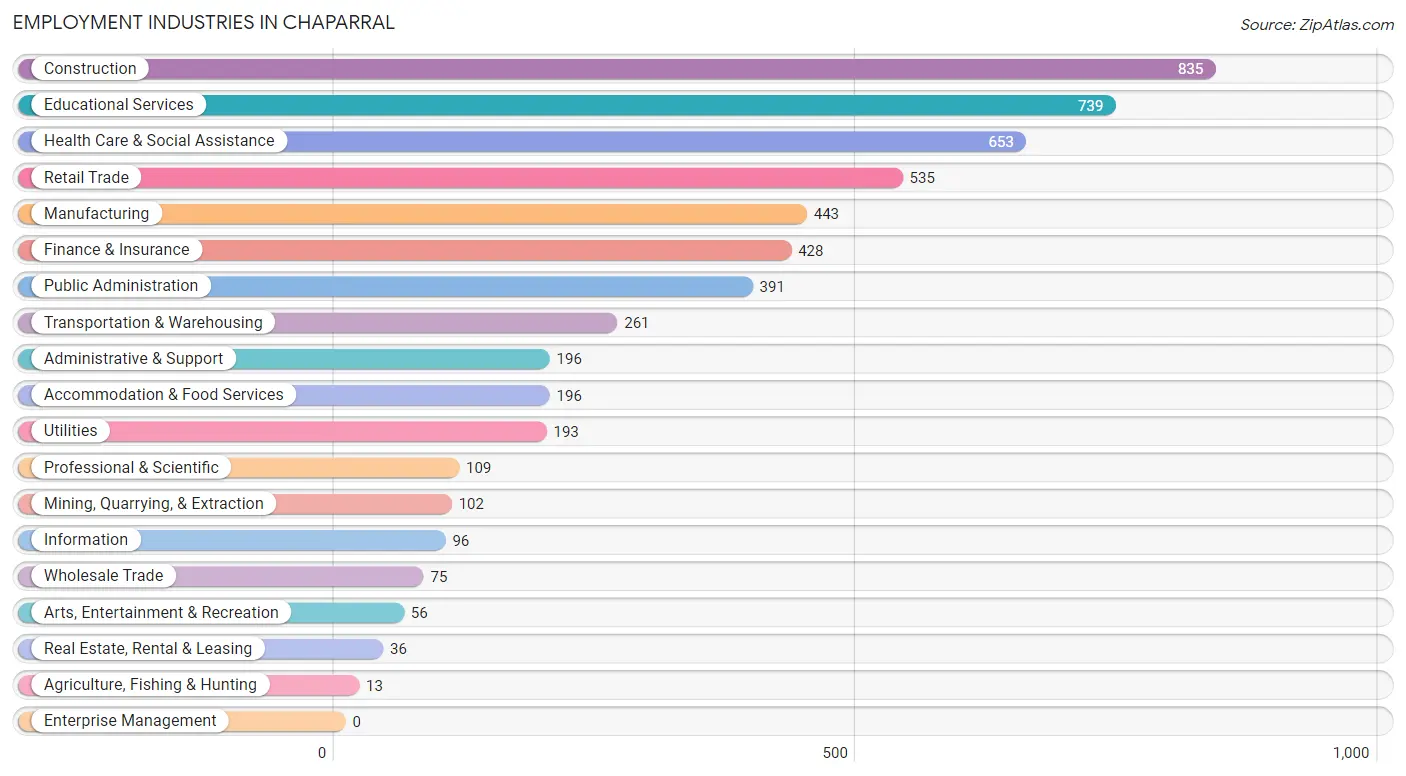
Employment Industries in Chaparral
The major employment industries in Chaparral include Construction (835 | 14.6%), Educational Services (739 | 12.9%), Health Care & Social Assistance (653 | 11.4%), Retail Trade (535 | 9.3%), and Manufacturing (443 | 7.7%).
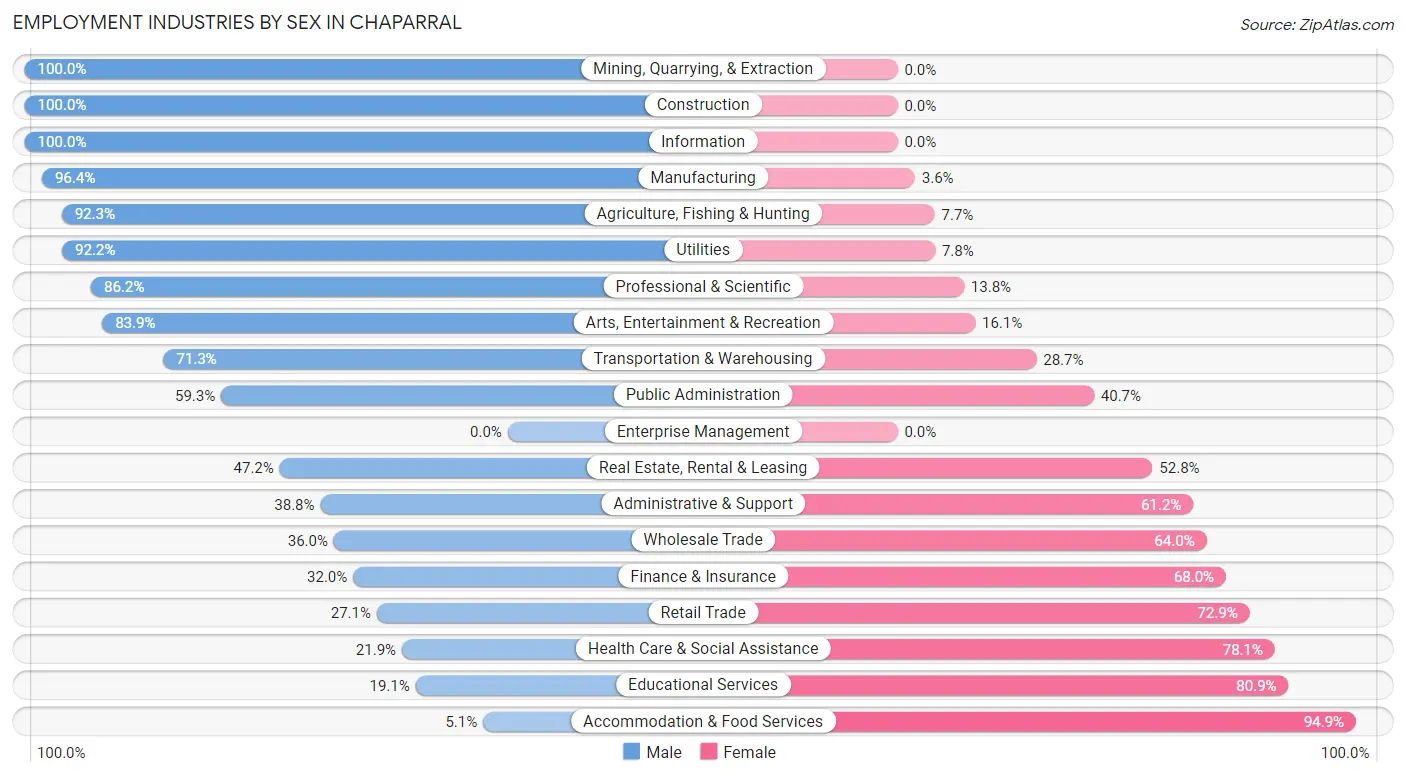
Employment Industries by Sex in Chaparral
The Chaparral industries that see more men than women are Mining, Quarrying, & Extraction (100.0%), Construction (100.0%), and Information (100.0%), whereas the industries that tend to have a higher number of women are Accommodation & Food Services (94.9%), Educational Services (80.9%), and Health Care & Social Assistance (78.1%).
| Industry | Male | Female |
| Agriculture, Fishing & Hunting | 12 (92.3%) | 1 (7.7%) |
| Mining, Quarrying, & Extraction | 102 (100.0%) | 0 (0.0%) |
| Construction | 835 (100.0%) | 0 (0.0%) |
| Manufacturing | 427 (96.4%) | 16 (3.6%) |
| Wholesale Trade | 27 (36.0%) | 48 (64.0%) |
| Retail Trade | 145 (27.1%) | 390 (72.9%) |
| Transportation & Warehousing | 186 (71.3%) | 75 (28.7%) |
| Utilities | 178 (92.2%) | 15 (7.8%) |
| Information | 96 (100.0%) | 0 (0.0%) |
| Finance & Insurance | 137 (32.0%) | 291 (68.0%) |
| Real Estate, Rental & Leasing | 17 (47.2%) | 19 (52.8%) |
| Professional & Scientific | 94 (86.2%) | 15 (13.8%) |
| Enterprise Management | 0 (0.0%) | 0 (0.0%) |
| Administrative & Support | 76 (38.8%) | 120 (61.2%) |
| Educational Services | 141 (19.1%) | 598 (80.9%) |
| Health Care & Social Assistance | 143 (21.9%) | 510 (78.1%) |
| Arts, Entertainment & Recreation | 47 (83.9%) | 9 (16.1%) |
| Accommodation & Food Services | 10 (5.1%) | 186 (94.9%) |
| Public Administration | 232 (59.3%) | 159 (40.7%) |
| Total | 3,143 (54.9%) | 2,577 (45.1%) |
Education in Chaparral
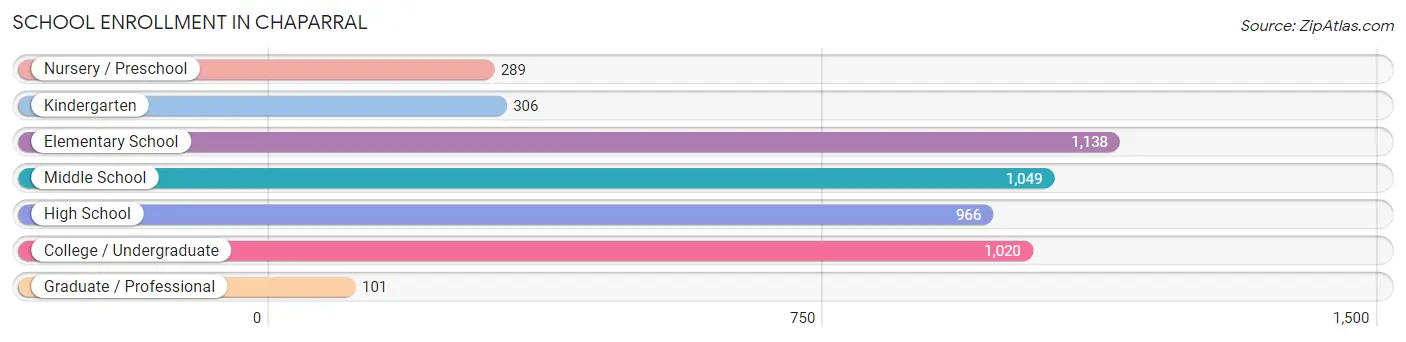
School Enrollment in Chaparral
The most common levels of schooling among the 4,869 students in Chaparral are elementary school (1,138 | 23.4%), middle school (1,049 | 21.5%), and college / undergraduate (1,020 | 20.9%).
| School Level | # Students | % Students |
| Nursery / Preschool | 289 | 5.9% |
| Kindergarten | 306 | 6.3% |
| Elementary School | 1,138 | 23.4% |
| Middle School | 1,049 | 21.5% |
| High School | 966 | 19.8% |
| College / Undergraduate | 1,020 | 20.9% |
| Graduate / Professional | 101 | 2.1% |
| Total | 4,869 | 100.0% |
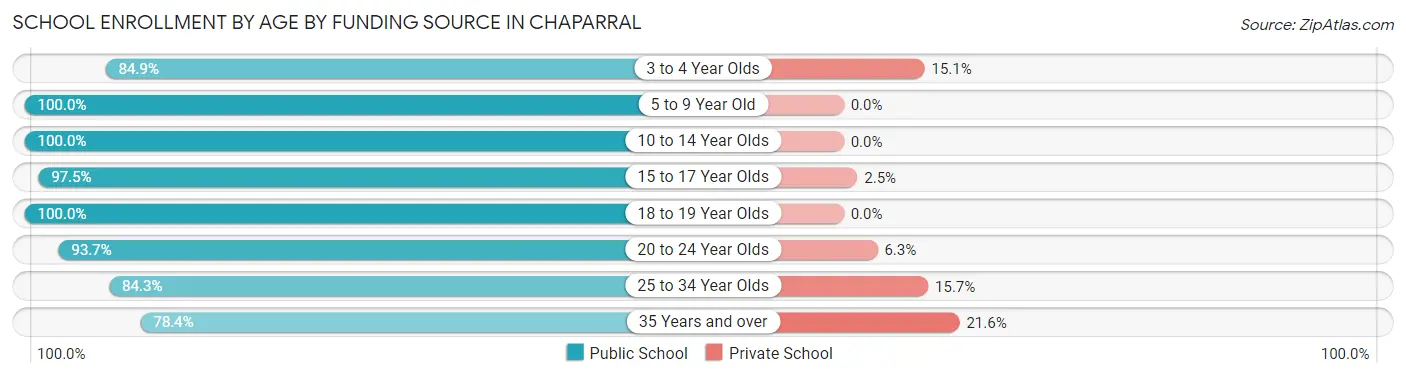
School Enrollment by Age by Funding Source in Chaparral
Out of a total of 4,869 students who are enrolled in schools in Chaparral, 146 (3.0%) attend a private institution, while the remaining 4,723 (97.0%) are enrolled in public schools. The age group of 35 years and over has the highest likelihood of being enrolled in private schools, with 44 (21.6% in the age bracket) enrolled. Conversely, the age group of 5 to 9 year old has the lowest likelihood of being enrolled in a private school, with 1,420 (100.0% in the age bracket) attending a public institution.
| Age Bracket | Public School | Private School |
| 3 to 4 Year Olds | 124 (84.9%) | 22 (15.1%) |
| 5 to 9 Year Old | 1,420 (100.0%) | 0 (0.0%) |
| 10 to 14 Year Olds | 1,248 (100.0%) | 0 (0.0%) |
| 15 to 17 Year Olds | 768 (97.5%) | 20 (2.5%) |
| 18 to 19 Year Olds | 393 (100.0%) | 0 (0.0%) |
| 20 to 24 Year Olds | 461 (93.7%) | 31 (6.3%) |
| 25 to 34 Year Olds | 150 (84.3%) | 28 (15.7%) |
| 35 Years and over | 160 (78.4%) | 44 (21.6%) |
| Total | 4,723 (97.0%) | 146 (3.0%) |
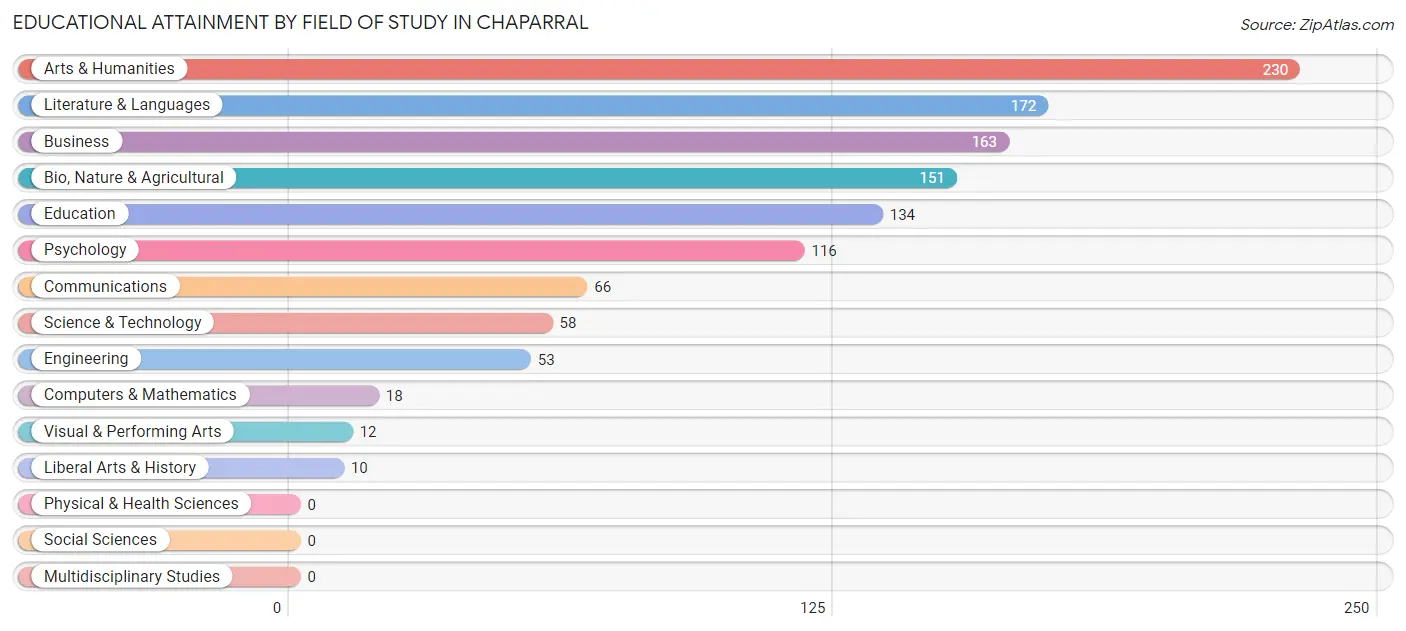
Educational Attainment by Field of Study in Chaparral
Arts & humanities (230 | 19.4%), literature & languages (172 | 14.5%), business (163 | 13.8%), bio, nature & agricultural (151 | 12.8%), and education (134 | 11.3%) are the most common fields of study among 1,183 individuals in Chaparral who have obtained a bachelor's degree or higher.
| Field of Study | # Graduates | % Graduates |
| Computers & Mathematics | 18 | 1.5% |
| Bio, Nature & Agricultural | 151 | 12.8% |
| Physical & Health Sciences | 0 | 0.0% |
| Psychology | 116 | 9.8% |
| Social Sciences | 0 | 0.0% |
| Engineering | 53 | 4.5% |
| Multidisciplinary Studies | 0 | 0.0% |
| Science & Technology | 58 | 4.9% |
| Business | 163 | 13.8% |
| Education | 134 | 11.3% |
| Literature & Languages | 172 | 14.5% |
| Liberal Arts & History | 10 | 0.9% |
| Visual & Performing Arts | 12 | 1.0% |
| Communications | 66 | 5.6% |
| Arts & Humanities | 230 | 19.4% |
| Total | 1,183 | 100.0% |
Transportation & Commute in Chaparral
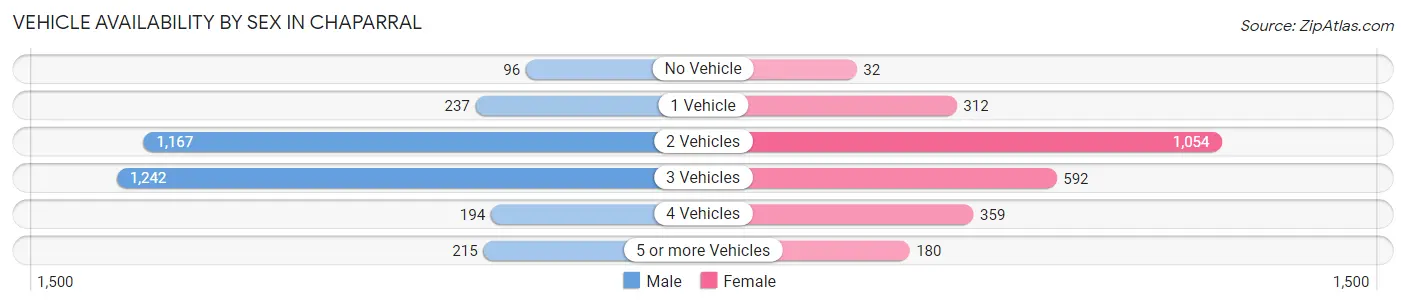
Vehicle Availability by Sex in Chaparral
The most prevalent vehicle ownership categories in Chaparral are males with 3 vehicles (1,242, accounting for 39.4%) and females with 3 vehicles (592, making up 49.1%).
| Vehicles Available | Male | Female |
| No Vehicle | 96 (3.0%) | 32 (1.3%) |
| 1 Vehicle | 237 (7.5%) | 312 (12.3%) |
| 2 Vehicles | 1,167 (37.0%) | 1,054 (41.7%) |
| 3 Vehicles | 1,242 (39.4%) | 592 (23.4%) |
| 4 Vehicles | 194 (6.2%) | 359 (14.2%) |
| 5 or more Vehicles | 215 (6.8%) | 180 (7.1%) |
| Total | 3,151 (100.0%) | 2,529 (100.0%) |
Commute Time in Chaparral
The most frequently occuring commute durations in Chaparral are 45 to 59 minutes (977 commuters, 18.1%), 30 to 34 minutes (854 commuters, 15.8%), and 15 to 19 minutes (586 commuters, 10.8%).
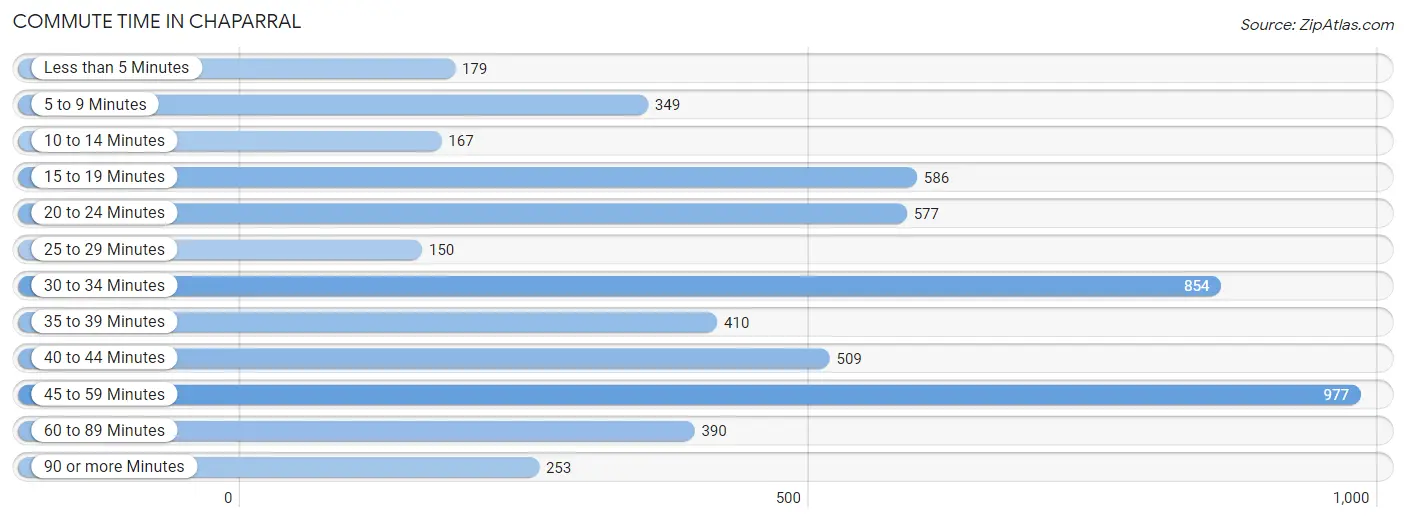
| Commute Time | # Commuters | % Commuters |
| Less than 5 Minutes | 179 | 3.3% |
| 5 to 9 Minutes | 349 | 6.5% |
| 10 to 14 Minutes | 167 | 3.1% |
| 15 to 19 Minutes | 586 | 10.8% |
| 20 to 24 Minutes | 577 | 10.7% |
| 25 to 29 Minutes | 150 | 2.8% |
| 30 to 34 Minutes | 854 | 15.8% |
| 35 to 39 Minutes | 410 | 7.6% |
| 40 to 44 Minutes | 509 | 9.4% |
| 45 to 59 Minutes | 977 | 18.1% |
| 60 to 89 Minutes | 390 | 7.2% |
| 90 or more Minutes | 253 | 4.7% |
Commute Time by Sex in Chaparral
The most common commute times in Chaparral are 45 to 59 minutes (860 commuters, 27.7%) for males and 20 to 24 minutes (489 commuters, 21.2%) for females.
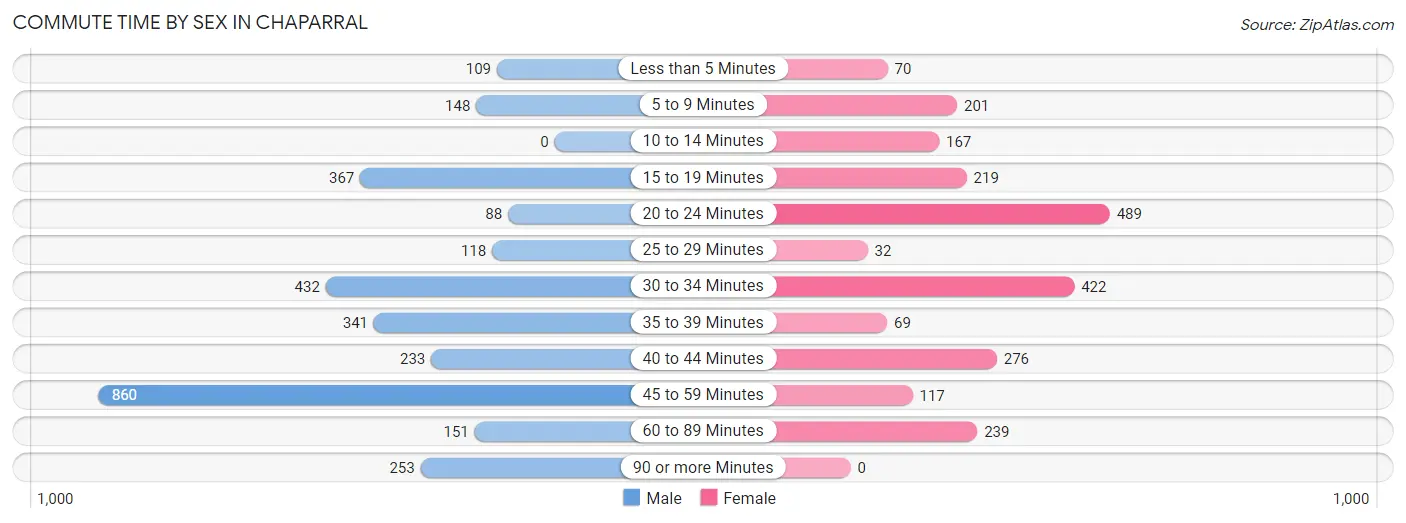
| Commute Time | Male | Female |
| Less than 5 Minutes | 109 (3.5%) | 70 (3.0%) |
| 5 to 9 Minutes | 148 (4.8%) | 201 (8.7%) |
| 10 to 14 Minutes | 0 (0.0%) | 167 (7.3%) |
| 15 to 19 Minutes | 367 (11.8%) | 219 (9.5%) |
| 20 to 24 Minutes | 88 (2.8%) | 489 (21.2%) |
| 25 to 29 Minutes | 118 (3.8%) | 32 (1.4%) |
| 30 to 34 Minutes | 432 (13.9%) | 422 (18.3%) |
| 35 to 39 Minutes | 341 (11.0%) | 69 (3.0%) |
| 40 to 44 Minutes | 233 (7.5%) | 276 (12.0%) |
| 45 to 59 Minutes | 860 (27.7%) | 117 (5.1%) |
| 60 to 89 Minutes | 151 (4.9%) | 239 (10.4%) |
| 90 or more Minutes | 253 (8.2%) | 0 (0.0%) |
Time of Departure to Work by Sex in Chaparral
The most frequent times of departure to work in Chaparral are 6:00 AM to 6:29 AM (485, 15.7%) for males and 7:00 AM to 7:29 AM (552, 24.0%) for females.
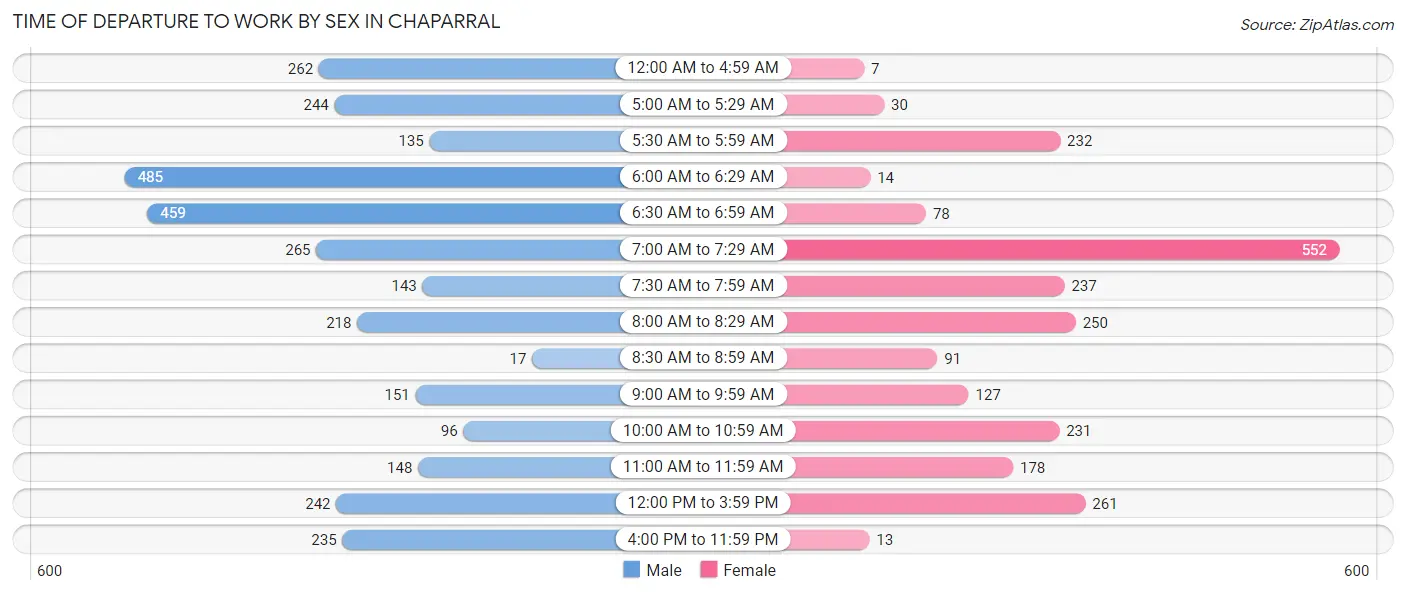
| Time of Departure | Male | Female |
| 12:00 AM to 4:59 AM | 262 (8.5%) | 7 (0.3%) |
| 5:00 AM to 5:29 AM | 244 (7.9%) | 30 (1.3%) |
| 5:30 AM to 5:59 AM | 135 (4.3%) | 232 (10.1%) |
| 6:00 AM to 6:29 AM | 485 (15.7%) | 14 (0.6%) |
| 6:30 AM to 6:59 AM | 459 (14.8%) | 78 (3.4%) |
| 7:00 AM to 7:29 AM | 265 (8.6%) | 552 (24.0%) |
| 7:30 AM to 7:59 AM | 143 (4.6%) | 237 (10.3%) |
| 8:00 AM to 8:29 AM | 218 (7.0%) | 250 (10.9%) |
| 8:30 AM to 8:59 AM | 17 (0.5%) | 91 (4.0%) |
| 9:00 AM to 9:59 AM | 151 (4.9%) | 127 (5.5%) |
| 10:00 AM to 10:59 AM | 96 (3.1%) | 231 (10.0%) |
| 11:00 AM to 11:59 AM | 148 (4.8%) | 178 (7.7%) |
| 12:00 PM to 3:59 PM | 242 (7.8%) | 261 (11.3%) |
| 4:00 PM to 11:59 PM | 235 (7.6%) | 13 (0.6%) |
| Total | 3,100 (100.0%) | 2,301 (100.0%) |
Housing Occupancy in Chaparral
Occupancy by Ownership in Chaparral
Of the total 4,500 dwellings in Chaparral, owner-occupied units account for 3,180 (70.7%), while renter-occupied units make up 1,320 (29.3%).
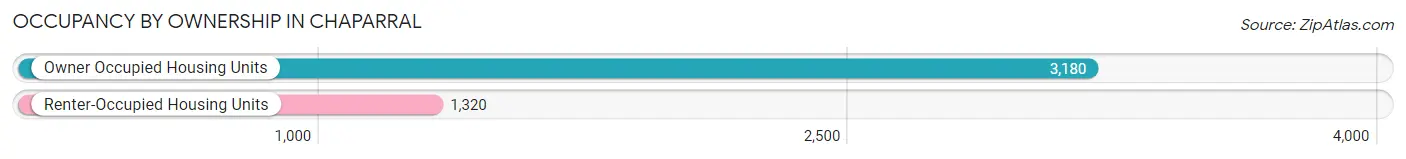
| Occupancy | # Housing Units | % Housing Units |
| Owner Occupied Housing Units | 3,180 | 70.7% |
| Renter-Occupied Housing Units | 1,320 | 29.3% |
| Total Occupied Housing Units | 4,500 | 100.0% |
Occupancy by Household Size in Chaparral
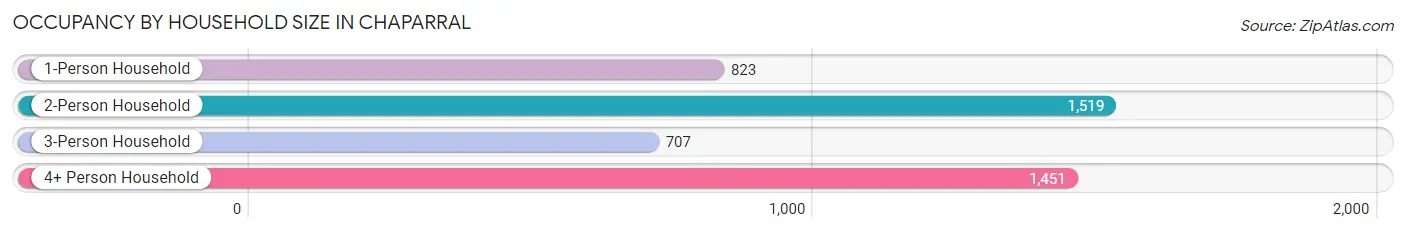
| Household Size | # Housing Units | % Housing Units |
| 1-Person Household | 823 | 18.3% |
| 2-Person Household | 1,519 | 33.8% |
| 3-Person Household | 707 | 15.7% |
| 4+ Person Household | 1,451 | 32.2% |
| Total Housing Units | 4,500 | 100.0% |
Occupancy by Ownership by Household Size in Chaparral
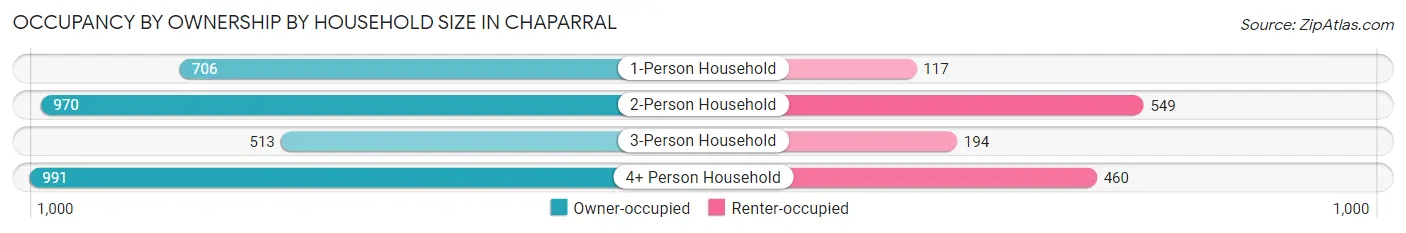
| Household Size | Owner-occupied | Renter-occupied |
| 1-Person Household | 706 (85.8%) | 117 (14.2%) |
| 2-Person Household | 970 (63.9%) | 549 (36.1%) |
| 3-Person Household | 513 (72.6%) | 194 (27.4%) |
| 4+ Person Household | 991 (68.3%) | 460 (31.7%) |
| Total Housing Units | 3,180 (70.7%) | 1,320 (29.3%) |
Occupancy by Educational Attainment in Chaparral
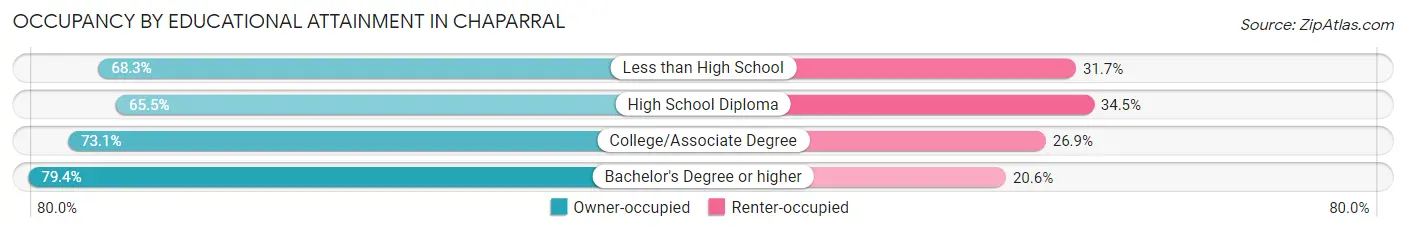
| Household Size | Owner-occupied | Renter-occupied |
| Less than High School | 924 (68.3%) | 429 (31.7%) |
| High School Diploma | 565 (65.5%) | 298 (34.5%) |
| College/Associate Degree | 1,421 (73.1%) | 523 (26.9%) |
| Bachelor's Degree or higher | 270 (79.4%) | 70 (20.6%) |
Occupancy by Age of Householder in Chaparral
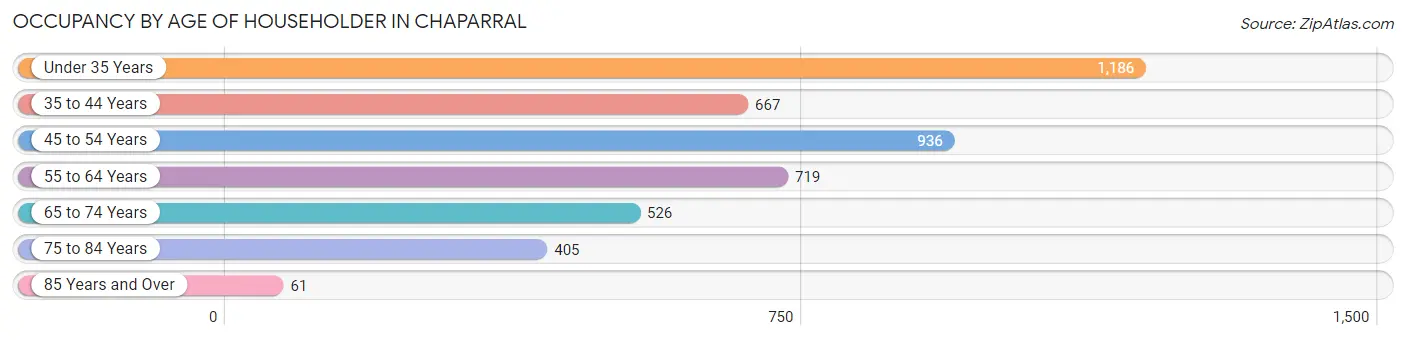
| Age Bracket | # Households | % Households |
| Under 35 Years | 1,186 | 26.4% |
| 35 to 44 Years | 667 | 14.8% |
| 45 to 54 Years | 936 | 20.8% |
| 55 to 64 Years | 719 | 16.0% |
| 65 to 74 Years | 526 | 11.7% |
| 75 to 84 Years | 405 | 9.0% |
| 85 Years and Over | 61 | 1.4% |
| Total | 4,500 | 100.0% |
Housing Finances in Chaparral
Median Income by Occupancy in Chaparral
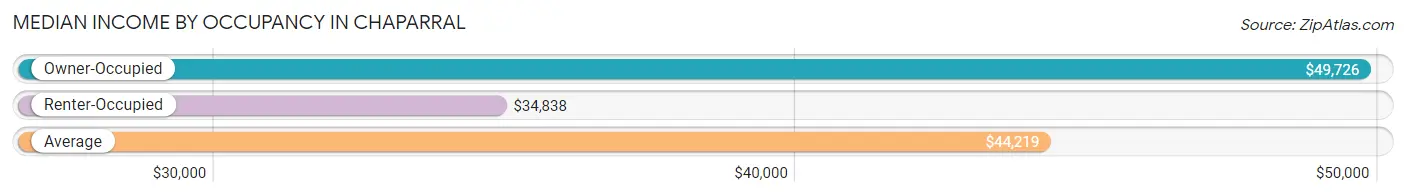
| Occupancy Type | # Households | Median Income |
| Owner-Occupied | 3,180 (70.7%) | $49,726 |
| Renter-Occupied | 1,320 (29.3%) | $34,838 |
| Average | 4,500 (100.0%) | $44,219 |
Occupancy by Householder Income Bracket in Chaparral
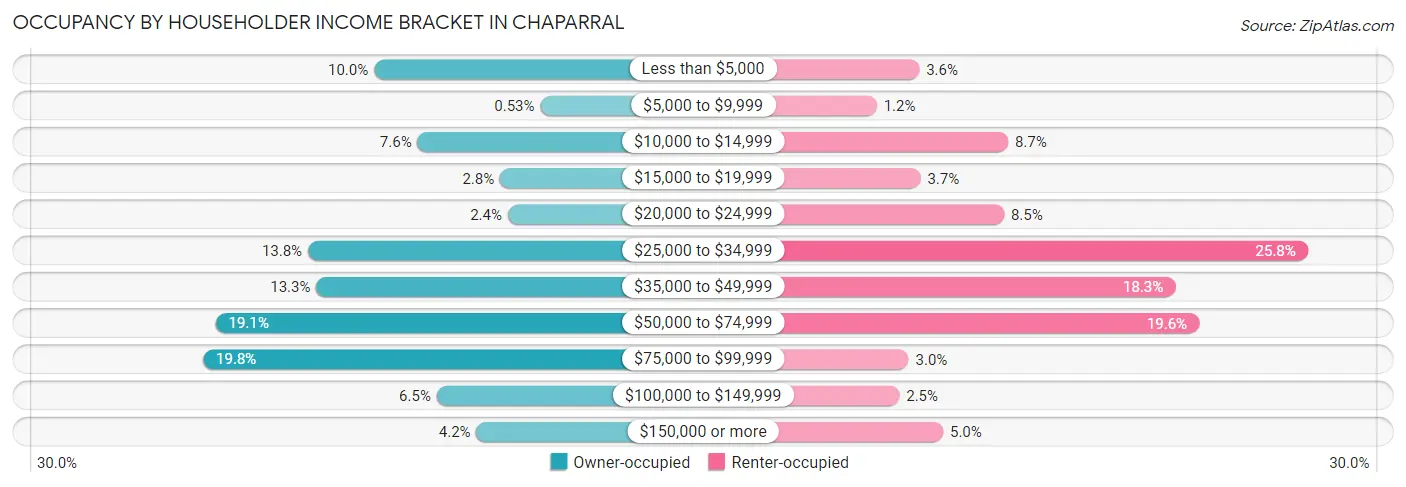
| Income Bracket | Owner-occupied | Renter-occupied |
| Less than $5,000 | 319 (10.0%) | 48 (3.6%) |
| $5,000 to $9,999 | 17 (0.5%) | 16 (1.2%) |
| $10,000 to $14,999 | 240 (7.5%) | 115 (8.7%) |
| $15,000 to $19,999 | 90 (2.8%) | 49 (3.7%) |
| $20,000 to $24,999 | 76 (2.4%) | 112 (8.5%) |
| $25,000 to $34,999 | 439 (13.8%) | 341 (25.8%) |
| $35,000 to $49,999 | 424 (13.3%) | 241 (18.3%) |
| $50,000 to $74,999 | 607 (19.1%) | 259 (19.6%) |
| $75,000 to $99,999 | 630 (19.8%) | 40 (3.0%) |
| $100,000 to $149,999 | 205 (6.5%) | 33 (2.5%) |
| $150,000 or more | 133 (4.2%) | 66 (5.0%) |
| Total | 3,180 (100.0%) | 1,320 (100.0%) |
Monthly Housing Cost Tiers in Chaparral
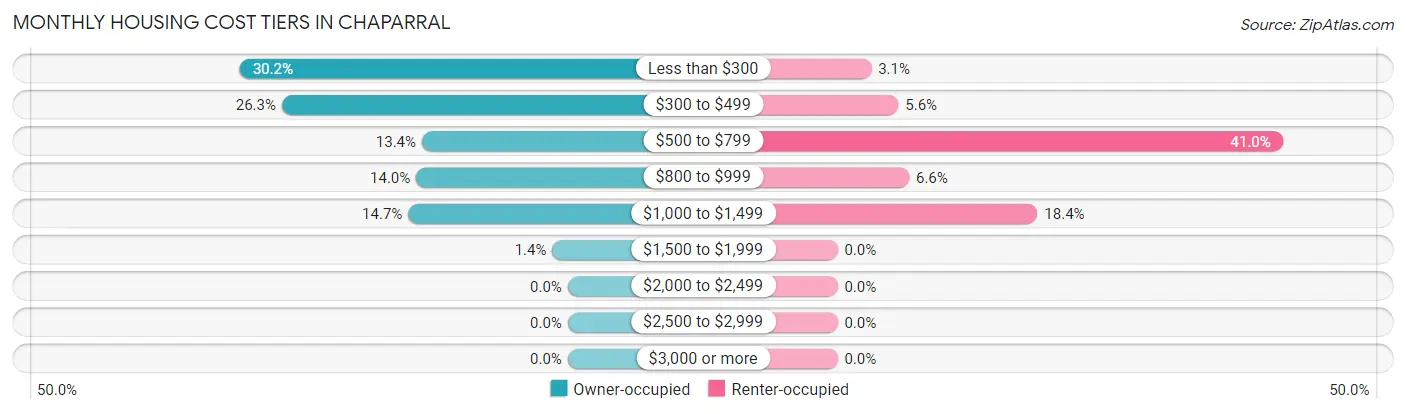
| Monthly Cost | Owner-occupied | Renter-occupied |
| Less than $300 | 960 (30.2%) | 41 (3.1%) |
| $300 to $499 | 837 (26.3%) | 74 (5.6%) |
| $500 to $799 | 427 (13.4%) | 541 (41.0%) |
| $800 to $999 | 444 (14.0%) | 87 (6.6%) |
| $1,000 to $1,499 | 467 (14.7%) | 243 (18.4%) |
| $1,500 to $1,999 | 45 (1.4%) | 0 (0.0%) |
| $2,000 to $2,499 | 0 (0.0%) | 0 (0.0%) |
| $2,500 to $2,999 | 0 (0.0%) | 0 (0.0%) |
| $3,000 or more | 0 (0.0%) | 0 (0.0%) |
| Total | 3,180 (100.0%) | 1,320 (100.0%) |
Physical Housing Characteristics in Chaparral
Housing Structures in Chaparral
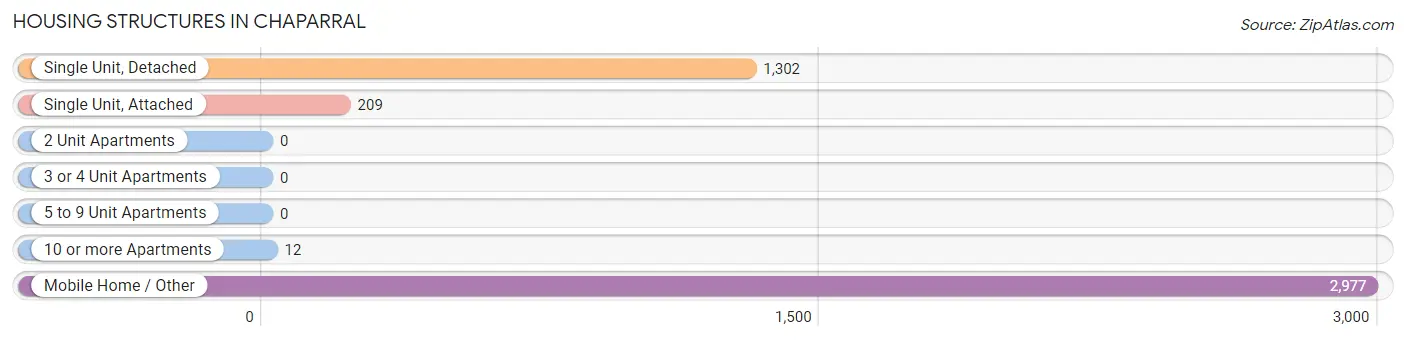
| Structure Type | # Housing Units | % Housing Units |
| Single Unit, Detached | 1,302 | 28.9% |
| Single Unit, Attached | 209 | 4.6% |
| 2 Unit Apartments | 0 | 0.0% |
| 3 or 4 Unit Apartments | 0 | 0.0% |
| 5 to 9 Unit Apartments | 0 | 0.0% |
| 10 or more Apartments | 12 | 0.3% |
| Mobile Home / Other | 2,977 | 66.2% |
| Total | 4,500 | 100.0% |
Housing Structures by Occupancy in Chaparral
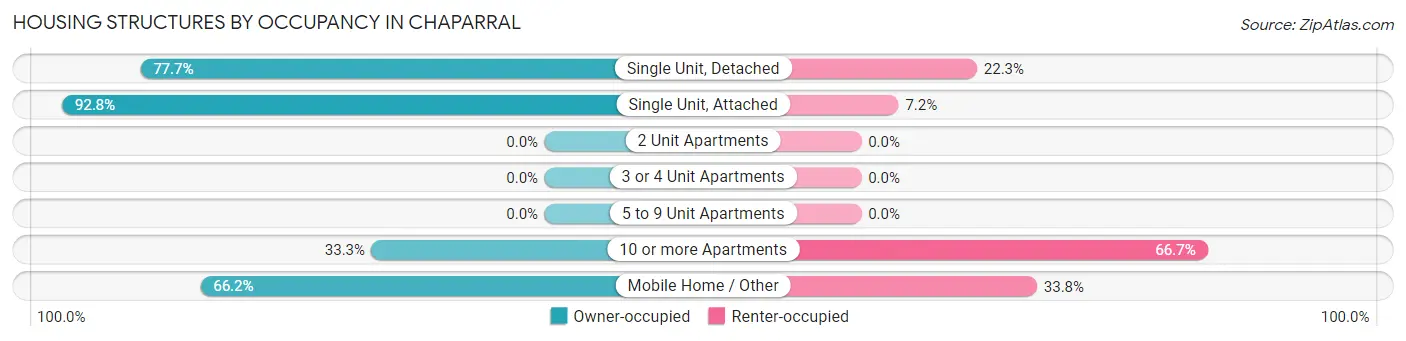
| Structure Type | Owner-occupied | Renter-occupied |
| Single Unit, Detached | 1,012 (77.7%) | 290 (22.3%) |
| Single Unit, Attached | 194 (92.8%) | 15 (7.2%) |
| 2 Unit Apartments | 0 (0.0%) | 0 (0.0%) |
| 3 or 4 Unit Apartments | 0 (0.0%) | 0 (0.0%) |
| 5 to 9 Unit Apartments | 0 (0.0%) | 0 (0.0%) |
| 10 or more Apartments | 4 (33.3%) | 8 (66.7%) |
| Mobile Home / Other | 1,970 (66.2%) | 1,007 (33.8%) |
| Total | 3,180 (70.7%) | 1,320 (29.3%) |
Housing Structures by Number of Rooms in Chaparral
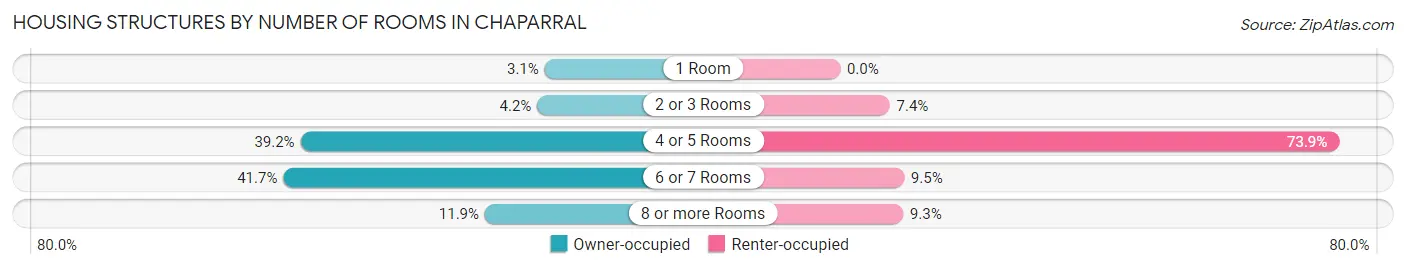
| Number of Rooms | Owner-occupied | Renter-occupied |
| 1 Room | 97 (3.0%) | 0 (0.0%) |
| 2 or 3 Rooms | 132 (4.2%) | 97 (7.3%) |
| 4 or 5 Rooms | 1,246 (39.2%) | 975 (73.9%) |
| 6 or 7 Rooms | 1,327 (41.7%) | 125 (9.5%) |
| 8 or more Rooms | 378 (11.9%) | 123 (9.3%) |
| Total | 3,180 (100.0%) | 1,320 (100.0%) |
Housing Structure by Heating Type in Chaparral
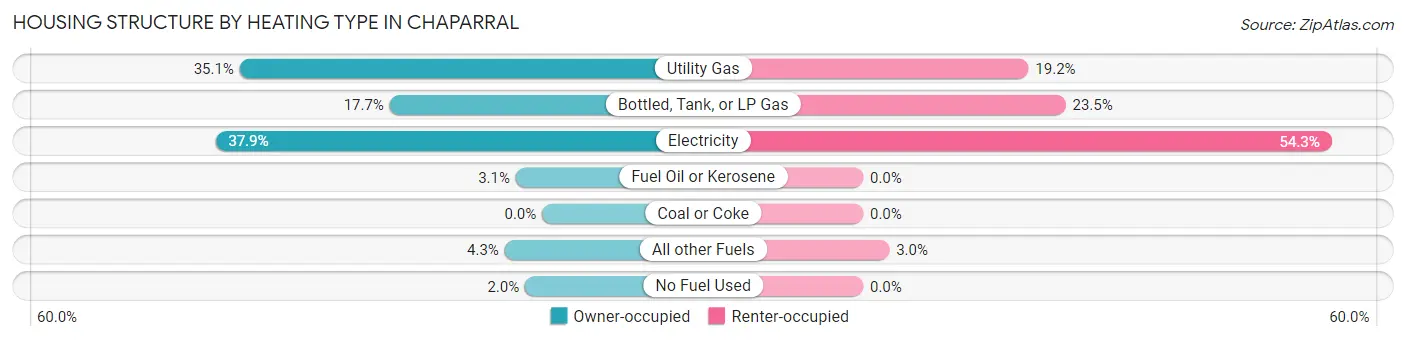
| Heating Type | Owner-occupied | Renter-occupied |
| Utility Gas | 1,115 (35.1%) | 253 (19.2%) |
| Bottled, Tank, or LP Gas | 562 (17.7%) | 310 (23.5%) |
| Electricity | 1,205 (37.9%) | 717 (54.3%) |
| Fuel Oil or Kerosene | 97 (3.0%) | 0 (0.0%) |
| Coal or Coke | 0 (0.0%) | 0 (0.0%) |
| All other Fuels | 138 (4.3%) | 40 (3.0%) |
| No Fuel Used | 63 (2.0%) | 0 (0.0%) |
| Total | 3,180 (100.0%) | 1,320 (100.0%) |
Household Vehicle Usage in Chaparral
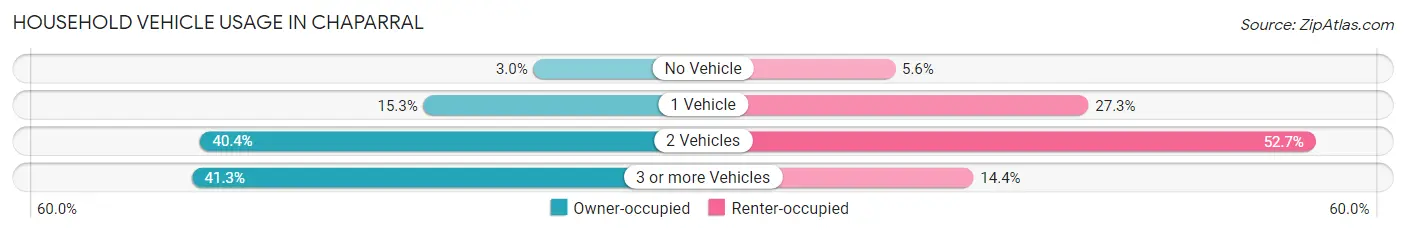
| Vehicles per Household | Owner-occupied | Renter-occupied |
| No Vehicle | 95 (3.0%) | 74 (5.6%) |
| 1 Vehicle | 487 (15.3%) | 360 (27.3%) |
| 2 Vehicles | 1,285 (40.4%) | 696 (52.7%) |
| 3 or more Vehicles | 1,313 (41.3%) | 190 (14.4%) |
| Total | 3,180 (100.0%) | 1,320 (100.0%) |
Real Estate & Mortgages in Chaparral
Real Estate and Mortgage Overview in Chaparral
| Characteristic | Without Mortgage | With Mortgage |
| Housing Units | 1,988 | 1,192 |
| Median Property Value | $84,400 | $101,100 |
| Median Household Income | $51,958 | $53 |
| Monthly Housing Costs | $311 | $0 |
| Real Estate Taxes | $525 | $28 |
Property Value by Mortgage Status in Chaparral
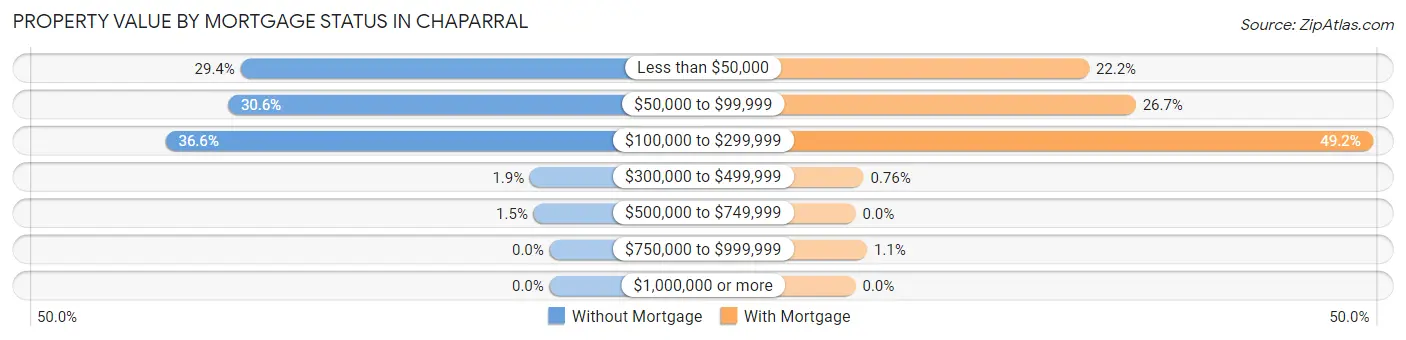
| Property Value | Without Mortgage | With Mortgage |
| Less than $50,000 | 585 (29.4%) | 265 (22.2%) |
| $50,000 to $99,999 | 609 (30.6%) | 318 (26.7%) |
| $100,000 to $299,999 | 727 (36.6%) | 587 (49.2%) |
| $300,000 to $499,999 | 37 (1.9%) | 9 (0.8%) |
| $500,000 to $749,999 | 30 (1.5%) | 0 (0.0%) |
| $750,000 to $999,999 | 0 (0.0%) | 13 (1.1%) |
| $1,000,000 or more | 0 (0.0%) | 0 (0.0%) |
| Total | 1,988 (100.0%) | 1,192 (100.0%) |
Household Income by Mortgage Status in Chaparral
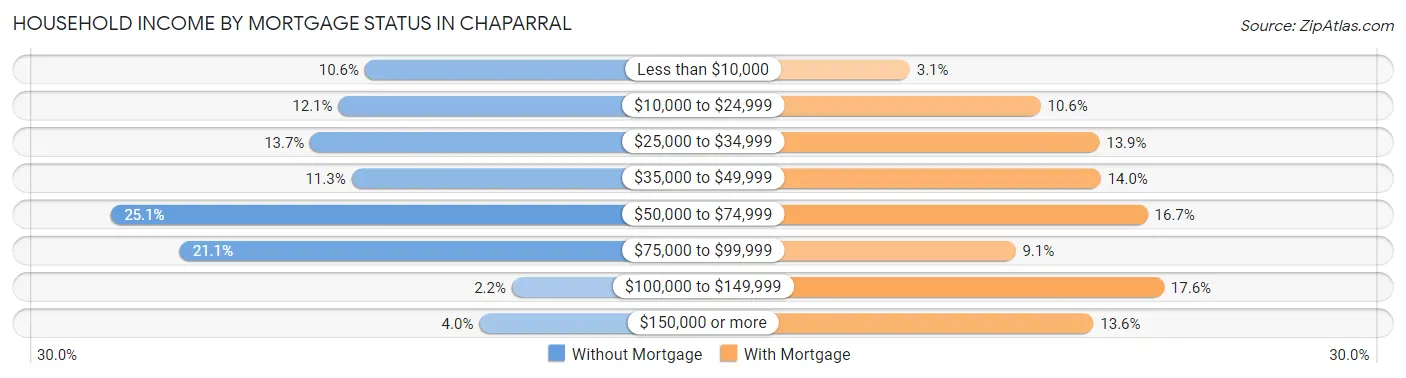
| Household Income | Without Mortgage | With Mortgage |
| Less than $10,000 | 210 (10.6%) | 37 (3.1%) |
| $10,000 to $24,999 | 240 (12.1%) | 126 (10.6%) |
| $25,000 to $34,999 | 272 (13.7%) | 166 (13.9%) |
| $35,000 to $49,999 | 225 (11.3%) | 167 (14.0%) |
| $50,000 to $74,999 | 498 (25.1%) | 199 (16.7%) |
| $75,000 to $99,999 | 420 (21.1%) | 109 (9.1%) |
| $100,000 to $149,999 | 43 (2.2%) | 210 (17.6%) |
| $150,000 or more | 80 (4.0%) | 162 (13.6%) |
| Total | 1,988 (100.0%) | 1,192 (100.0%) |
Property Value to Household Income Ratio in Chaparral
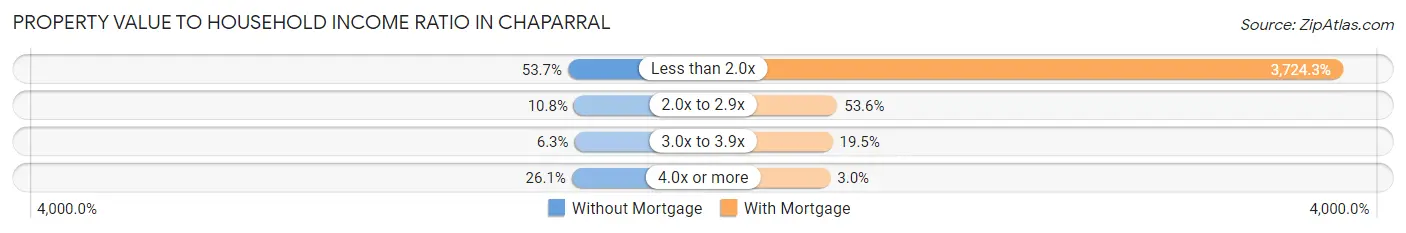
| Value-to-Income Ratio | Without Mortgage | With Mortgage |
| Less than 2.0x | 1,068 (53.7%) | 44,394 (3,724.3%) |
| 2.0x to 2.9x | 215 (10.8%) | 639 (53.6%) |
| 3.0x to 3.9x | 125 (6.3%) | 232 (19.5%) |
| 4.0x or more | 518 (26.1%) | 36 (3.0%) |
| Total | 1,988 (100.0%) | 1,192 (100.0%) |
Real Estate Taxes by Mortgage Status in Chaparral
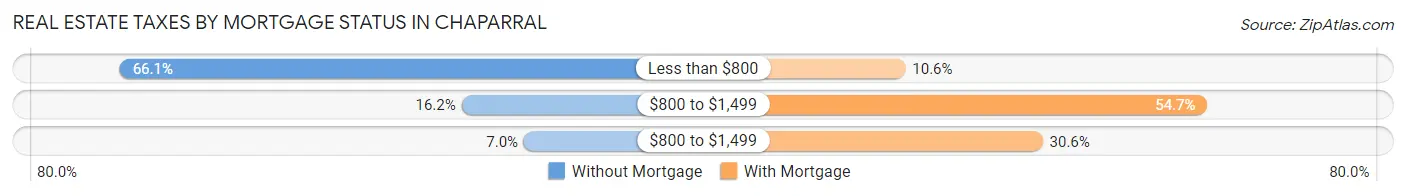
| Property Taxes | Without Mortgage | With Mortgage |
| Less than $800 | 1,314 (66.1%) | 126 (10.6%) |
| $800 to $1,499 | 321 (16.2%) | 652 (54.7%) |
| $800 to $1,499 | 140 (7.0%) | 365 (30.6%) |
| Total | 1,988 (100.0%) | 1,192 (100.0%) |
Health & Disability in Chaparral
Health Insurance Coverage by Age in Chaparral
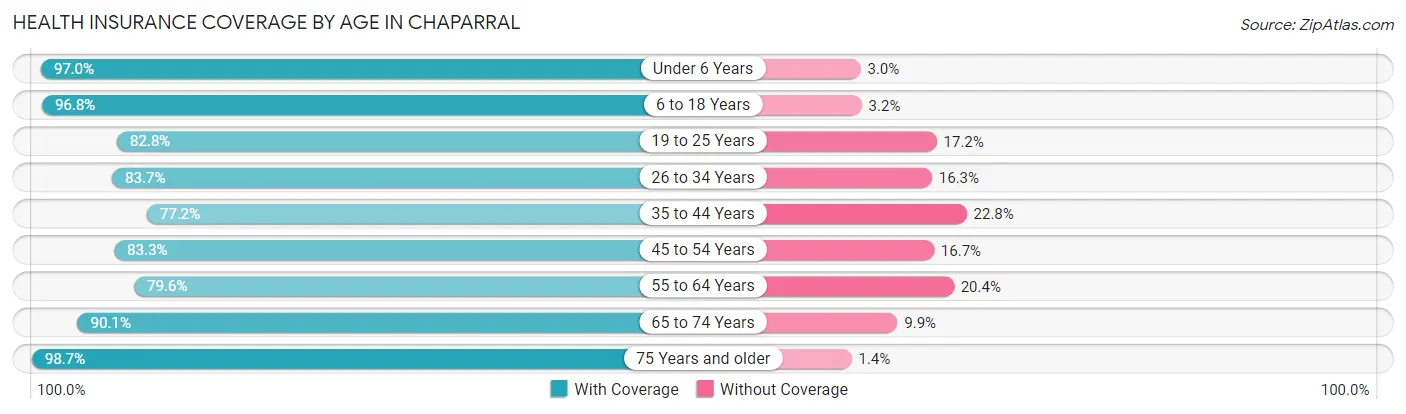
| Age Bracket | With Coverage | Without Coverage |
| Under 6 Years | 1,183 (97.0%) | 37 (3.0%) |
| 6 to 18 Years | 3,134 (96.8%) | 105 (3.2%) |
| 19 to 25 Years | 1,457 (82.8%) | 303 (17.2%) |
| 26 to 34 Years | 1,849 (83.7%) | 361 (16.3%) |
| 35 to 44 Years | 1,245 (77.2%) | 368 (22.8%) |
| 45 to 54 Years | 1,321 (83.3%) | 265 (16.7%) |
| 55 to 64 Years | 1,392 (79.6%) | 357 (20.4%) |
| 65 to 74 Years | 902 (90.1%) | 99 (9.9%) |
| 75 Years and older | 875 (98.7%) | 12 (1.3%) |
| Total | 13,358 (87.5%) | 1,907 (12.5%) |
Health Insurance Coverage by Citizenship Status in Chaparral
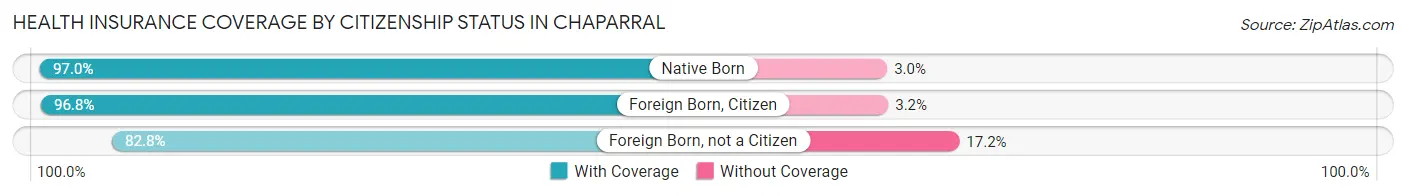
| Citizenship Status | With Coverage | Without Coverage |
| Native Born | 1,183 (97.0%) | 37 (3.0%) |
| Foreign Born, Citizen | 3,134 (96.8%) | 105 (3.2%) |
| Foreign Born, not a Citizen | 1,457 (82.8%) | 303 (17.2%) |
Health Insurance Coverage by Household Income in Chaparral
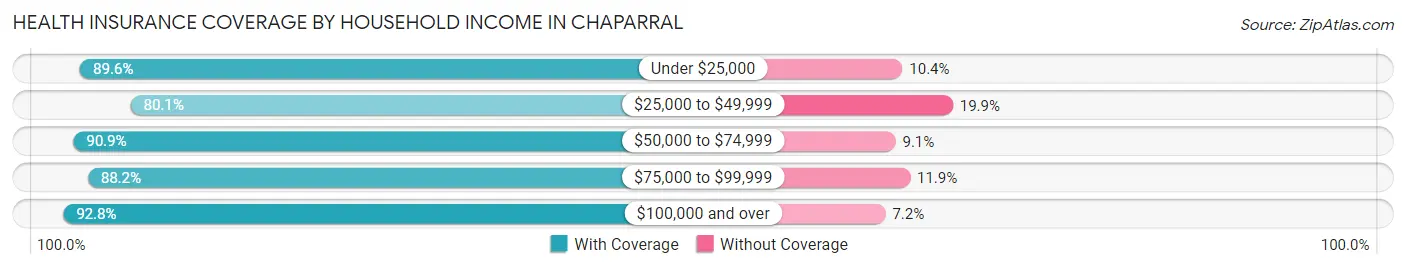
| Household Income | With Coverage | Without Coverage |
| Under $25,000 | 2,564 (89.6%) | 298 (10.4%) |
| $25,000 to $49,999 | 3,374 (80.1%) | 836 (19.9%) |
| $50,000 to $74,999 | 3,165 (90.9%) | 318 (9.1%) |
| $75,000 to $99,999 | 2,179 (88.1%) | 293 (11.8%) |
| $100,000 and over | 2,050 (92.8%) | 160 (7.2%) |
Public vs Private Health Insurance Coverage by Age in Chaparral
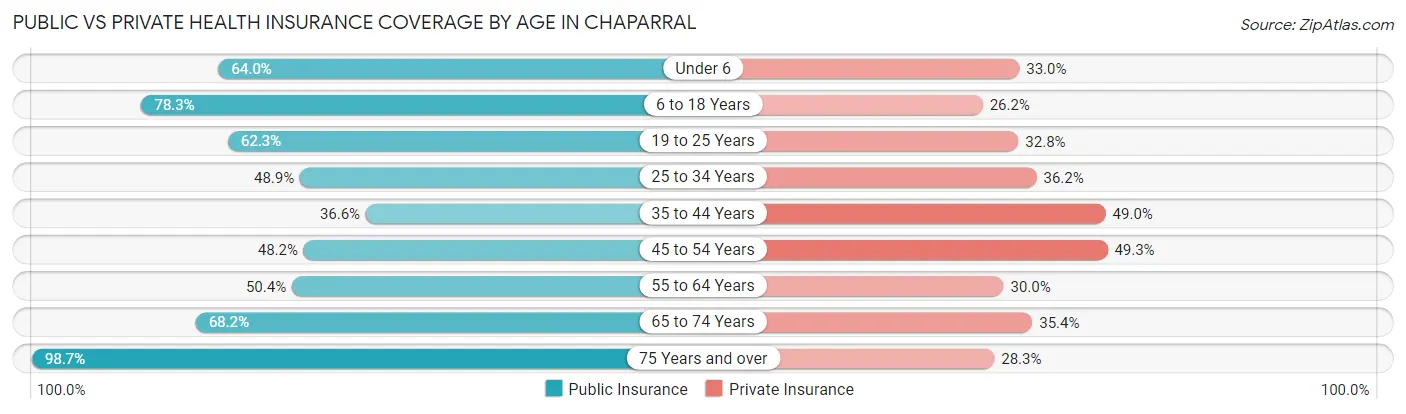
| Age Bracket | Public Insurance | Private Insurance |
| Under 6 | 781 (64.0%) | 402 (33.0%) |
| 6 to 18 Years | 2,537 (78.3%) | 847 (26.2%) |
| 19 to 25 Years | 1,096 (62.3%) | 577 (32.8%) |
| 25 to 34 Years | 1,080 (48.9%) | 799 (36.1%) |
| 35 to 44 Years | 591 (36.6%) | 790 (49.0%) |
| 45 to 54 Years | 764 (48.2%) | 782 (49.3%) |
| 55 to 64 Years | 881 (50.4%) | 525 (30.0%) |
| 65 to 74 Years | 683 (68.2%) | 354 (35.4%) |
| 75 Years and over | 875 (98.7%) | 251 (28.3%) |
| Total | 9,288 (60.9%) | 5,327 (34.9%) |
Disability Status by Sex by Age in Chaparral
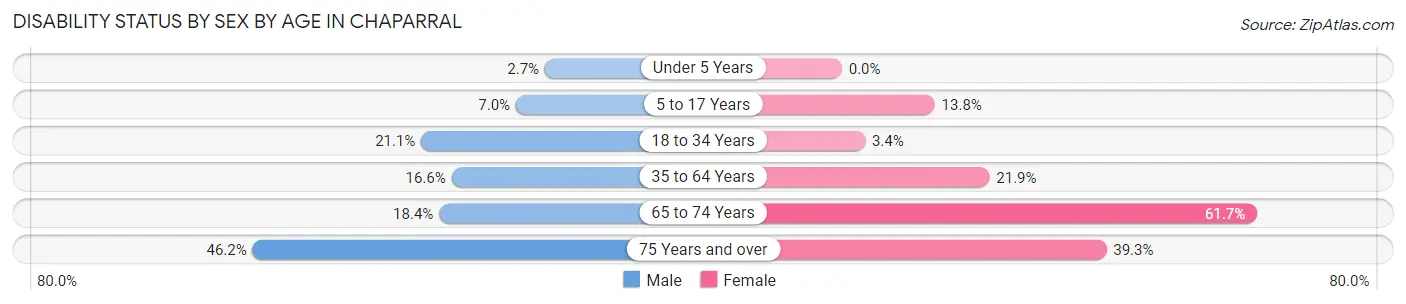
| Age Bracket | Male | Female |
| Under 5 Years | 12 (2.7%) | 0 (0.0%) |
| 5 to 17 Years | 118 (7.0%) | 258 (13.8%) |
| 18 to 34 Years | 442 (21.1%) | 65 (3.4%) |
| 35 to 64 Years | 384 (16.6%) | 577 (21.9%) |
| 65 to 74 Years | 59 (18.4%) | 420 (61.7%) |
| 75 Years and over | 192 (46.2%) | 185 (39.3%) |
Disability Class by Sex by Age in Chaparral
Disability Class: Hearing Difficulty
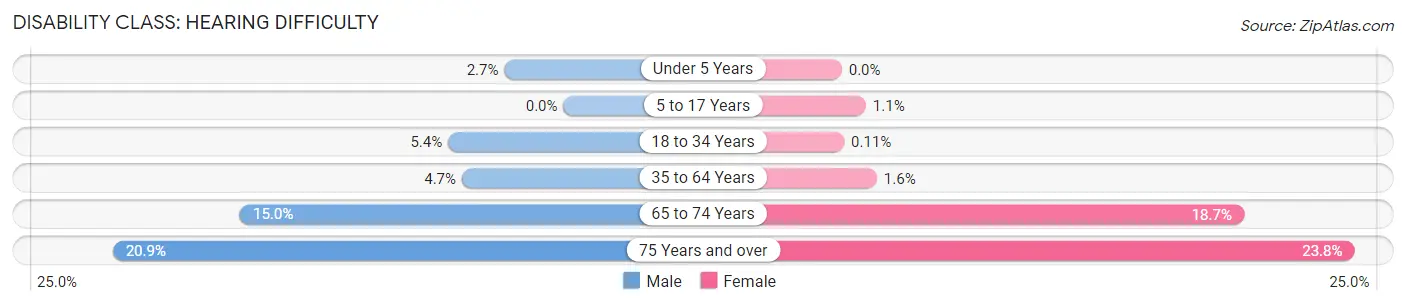
| Age Bracket | Male | Female |
| Under 5 Years | 12 (2.7%) | 0 (0.0%) |
| 5 to 17 Years | 0 (0.0%) | 21 (1.1%) |
| 18 to 34 Years | 112 (5.3%) | 2 (0.1%) |
| 35 to 64 Years | 109 (4.7%) | 43 (1.6%) |
| 65 to 74 Years | 48 (15.0%) | 127 (18.6%) |
| 75 Years and over | 87 (20.9%) | 112 (23.8%) |
Disability Class: Vision Difficulty
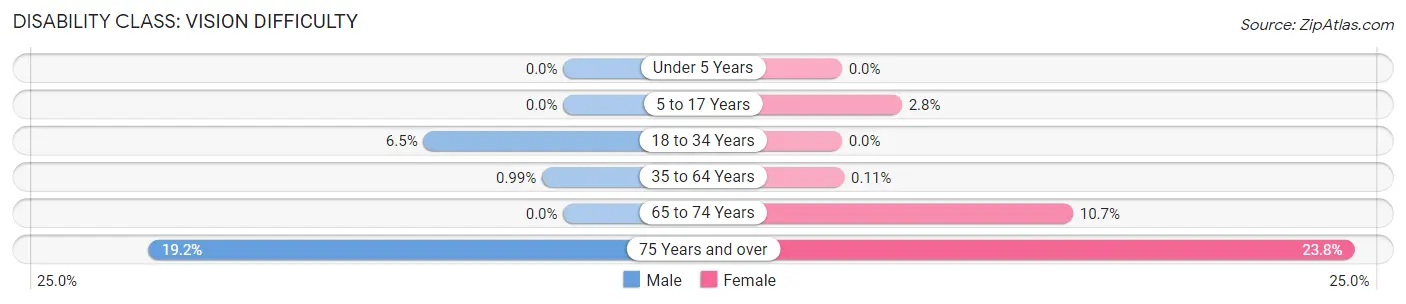
| Age Bracket | Male | Female |
| Under 5 Years | 0 (0.0%) | 0 (0.0%) |
| 5 to 17 Years | 0 (0.0%) | 52 (2.8%) |
| 18 to 34 Years | 136 (6.5%) | 0 (0.0%) |
| 35 to 64 Years | 23 (1.0%) | 3 (0.1%) |
| 65 to 74 Years | 0 (0.0%) | 73 (10.7%) |
| 75 Years and over | 80 (19.2%) | 112 (23.8%) |
Disability Class: Cognitive Difficulty
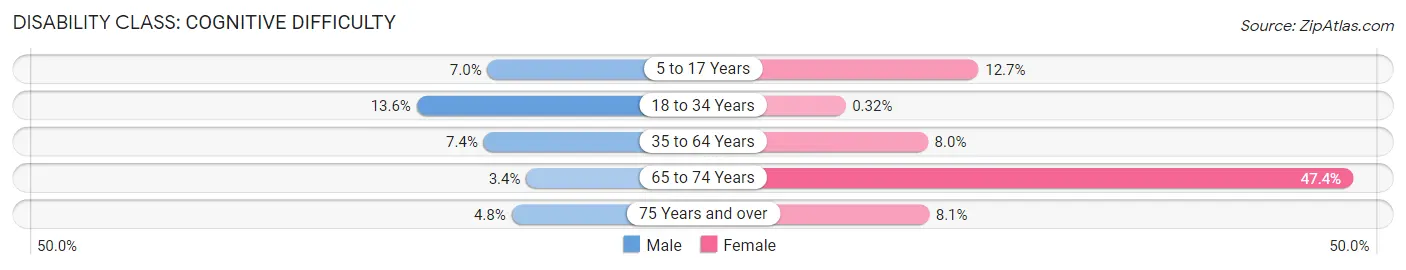
| Age Bracket | Male | Female |
| 5 to 17 Years | 118 (7.0%) | 237 (12.7%) |
| 18 to 34 Years | 285 (13.6%) | 6 (0.3%) |
| 35 to 64 Years | 171 (7.4%) | 210 (8.0%) |
| 65 to 74 Years | 11 (3.4%) | 323 (47.4%) |
| 75 Years and over | 20 (4.8%) | 38 (8.1%) |
Disability Class: Ambulatory Difficulty
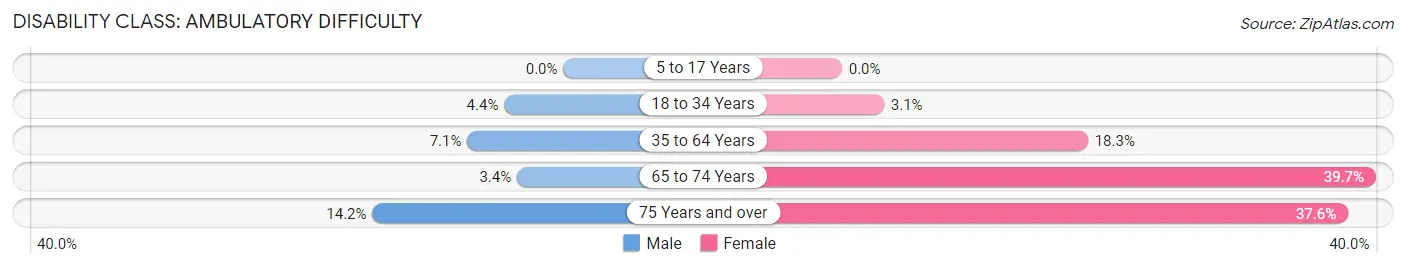
| Age Bracket | Male | Female |
| 5 to 17 Years | 0 (0.0%) | 0 (0.0%) |
| 18 to 34 Years | 92 (4.4%) | 59 (3.1%) |
| 35 to 64 Years | 165 (7.1%) | 481 (18.3%) |
| 65 to 74 Years | 11 (3.4%) | 270 (39.7%) |
| 75 Years and over | 59 (14.2%) | 177 (37.6%) |
Disability Class: Self-Care Difficulty
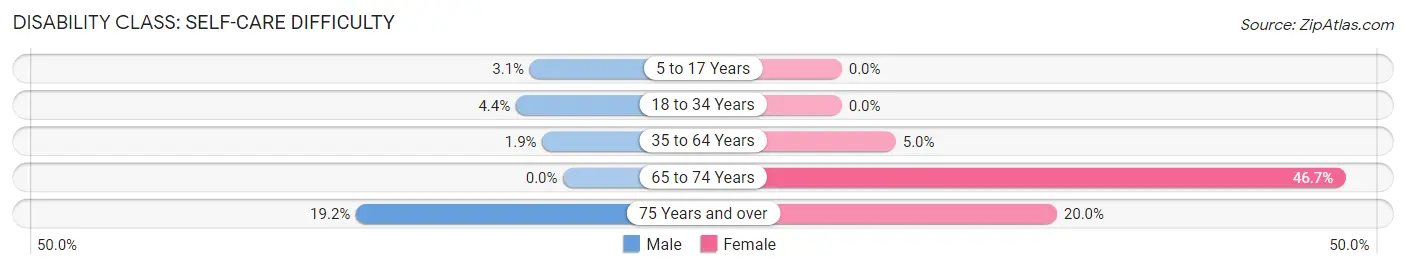
| Age Bracket | Male | Female |
| 5 to 17 Years | 52 (3.1%) | 0 (0.0%) |
| 18 to 34 Years | 92 (4.4%) | 0 (0.0%) |
| 35 to 64 Years | 45 (1.9%) | 132 (5.0%) |
| 65 to 74 Years | 0 (0.0%) | 318 (46.7%) |
| 75 Years and over | 80 (19.2%) | 94 (20.0%) |
Technology Access in Chaparral
Computing Device Access in Chaparral
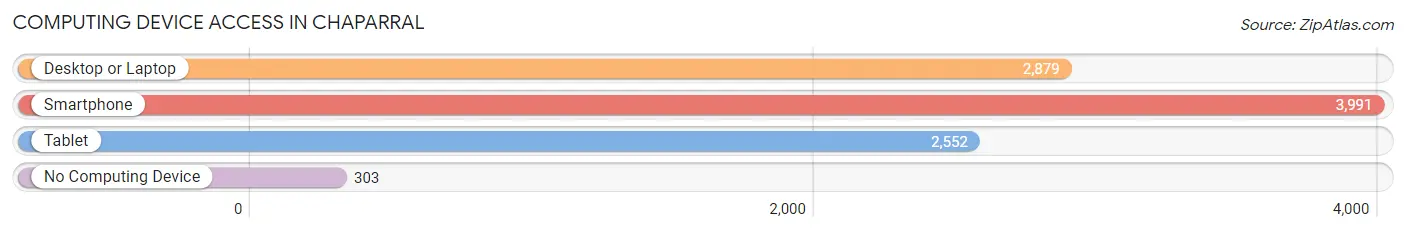
| Device Type | # Households | % Households |
| Desktop or Laptop | 2,879 | 64.0% |
| Smartphone | 3,991 | 88.7% |
| Tablet | 2,552 | 56.7% |
| No Computing Device | 303 | 6.7% |
| Total | 4,500 | 100.0% |
Internet Access in Chaparral
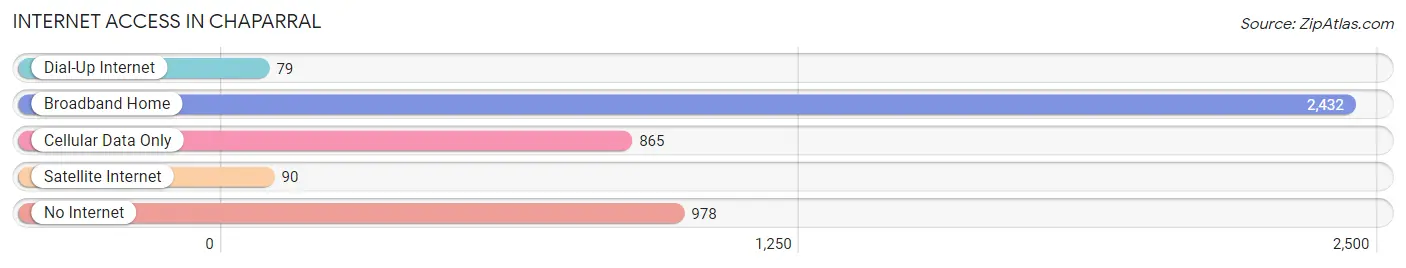
| Internet Type | # Households | % Households |
| Dial-Up Internet | 79 | 1.8% |
| Broadband Home | 2,432 | 54.0% |
| Cellular Data Only | 865 | 19.2% |
| Satellite Internet | 90 | 2.0% |
| No Internet | 978 | 21.7% |
| Total | 4,500 | 100.0% |
Chaparral Summary
Chaparral is a small town located in Otero County, New Mexico. It is situated in the Tularosa Basin, approximately 20 miles south of Las Cruces and 30 miles north of El Paso, Texas. The town was founded in the late 1800s and has a population of approximately 8,000 people.
History
Chaparral was founded in 1881 by a group of settlers from El Paso, Texas. The town was named after the nearby Chaparral Mountains, which were named for the abundant shrubbery that grew in the area. The town was originally a farming community, but it soon became a trading post for the surrounding area. In the early 1900s, the town was home to a number of businesses, including a hotel, a general store, a saloon, and a blacksmith shop.
In the 1920s, the town began to experience a period of growth. The railroad arrived in the area, bringing with it new businesses and opportunities. The town also became a popular tourist destination, as it was located near the White Sands National Monument.
In the 1950s, the town experienced a period of decline. The railroad was abandoned and many businesses closed. However, in the late 1970s, the town began to experience a resurgence. The town was designated as a National Historic District in 1978, and the downtown area was revitalized. Today, the town is home to a number of businesses, including restaurants, shops, and galleries.
Geography
Chaparral is located in the Tularosa Basin, a large desert basin located in south-central New Mexico. The town is situated at an elevation of 4,000 feet, and the surrounding area is characterized by flat, arid terrain. The nearby San Andres Mountains provide a backdrop to the town.
The climate in Chaparral is semi-arid, with hot summers and mild winters. The average annual temperature is 64°F, and the average annual precipitation is 8.5 inches.
Economy
The economy of Chaparral is largely based on agriculture and tourism. The town is home to a number of farms, which produce a variety of crops, including alfalfa, cotton, and pecans. The town is also home to a number of tourist attractions, including the White Sands National Monument and the nearby San Andres Mountains.
In addition to agriculture and tourism, the town is home to a number of businesses, including restaurants, shops, and galleries. The town is also home to a number of manufacturing companies, which produce a variety of products, including furniture, clothing, and electronics.
Demographics
As of the 2010 census, the population of Chaparral was 8,072. The racial makeup of the town was 75.3% White, 0.7% African American, 0.9% Native American, 0.3% Asian, 0.1% Pacific Islander, 19.2% from other races, and 3.5% from two or more races. Hispanic or Latino of any race were 57.2% of the population.
The median household income in Chaparral was $30,938, and the median family income was $35,938. The per capita income was $14,945. About 18.2% of families and 22.2% of the population were below the poverty line, including 28.3% of those under age 18 and 16.2% of those age 65 or over.
Common Questions
What is Per Capita Income in Chaparral?
Per Capita income in Chaparral is $17,781.
What is the Median Family Income in Chaparral?
Median Family Income in Chaparral is $46,694.
What is the Median Household income in Chaparral?
Median Household Income in Chaparral is $44,219.
What is Income or Wage Gap in Chaparral?
Income or Wage Gap in Chaparral is 41.2%.
Women in Chaparral earn 58.8 cents for every dollar earned by a man.
What is Family Income Deficit in Chaparral?
Family Income Deficit in Chaparral is $10,019.
Families that are below poverty line in Chaparral earn $10,019 less on average than the poverty threshold level.
What is Inequality or Gini Index in Chaparral?
Inequality or Gini Index in Chaparral is 0.41.
What is the Total Population of Chaparral?
Total Population of Chaparral is 15,290.
What is the Total Male Population of Chaparral?
Total Male Population of Chaparral is 7,282.
What is the Total Female Population of Chaparral?
Total Female Population of Chaparral is 8,008.
What is the Ratio of Males per 100 Females in Chaparral?
There are 90.93 Males per 100 Females in Chaparral.
What is the Ratio of Females per 100 Males in Chaparral?
There are 109.97 Females per 100 Males in Chaparral.
What is the Median Population Age in Chaparral?
Median Population Age in Chaparral is 31.3 Years.
What is the Average Family Size in Chaparral
Average Family Size in Chaparral is 3.9 People.
What is the Average Household Size in Chaparral
Average Household Size in Chaparral is 3.4 People.
How Large is the Labor Force in Chaparral?
There are 6,241 People in the Labor Forcein in Chaparral.
What is the Percentage of People in the Labor Force in Chaparral?
54.7% of People are in the Labor Force in Chaparral.
What is the Unemployment Rate in Chaparral?
Unemployment Rate in Chaparral is 8.0%.