Roosevelt County, NM Map & Demographics
Roosevelt County Map
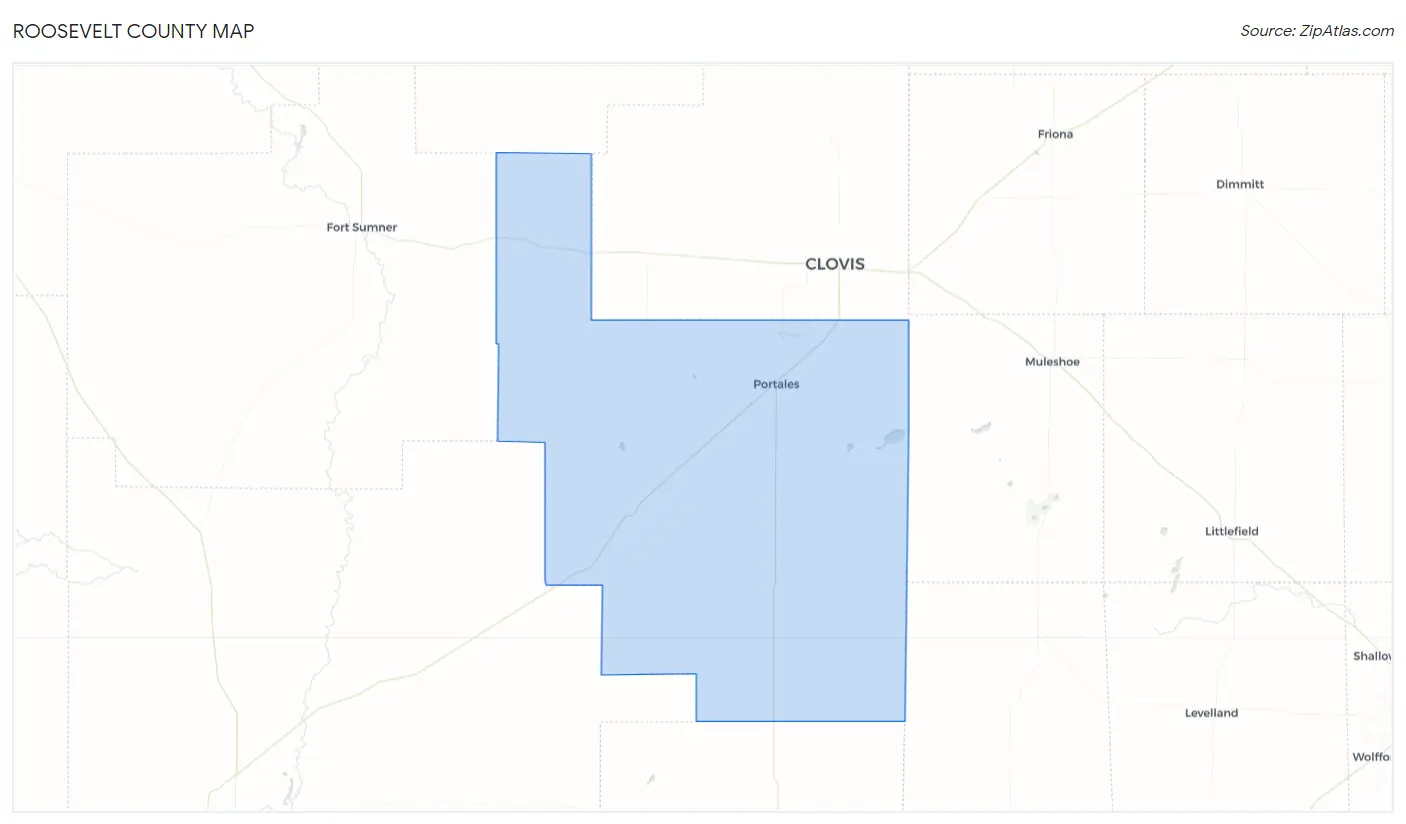
Roosevelt County Overview
$24,954
PER CAPITA INCOME
$68,717
AVG FAMILY INCOME
$52,644
AVG HOUSEHOLD INCOME
49.2%
WAGE / INCOME GAP [ % ]
50.8¢/ $1
WAGE / INCOME GAP [ $ ]
$12,151
FAMILY INCOME DEFICIT
0.43
INEQUALITY / GINI INDEX
19,142
TOTAL POPULATION
9,583
MALE POPULATION
9,559
FEMALE POPULATION
100.25
MALES / 100 FEMALES
99.75
FEMALES / 100 MALES
31.3
MEDIAN AGE
3.3
AVG FAMILY SIZE
2.6
AVG HOUSEHOLD SIZE
9,331
LABOR FORCE [ PEOPLE ]
62.6%
PERCENT IN LABOR FORCE
6.6%
UNEMPLOYMENT RATE
Income in Roosevelt County
Income Overview in Roosevelt County
Per Capita Income in Roosevelt County is $24,954, while median incomes of families and households are $68,717 and $52,644 respectively.
| Characteristic | Number | Measure |
| Per Capita Income | 19,142 | $24,954 |
| Median Family Income | 4,219 | $68,717 |
| Mean Family Income | 4,219 | $83,694 |
| Median Household Income | 6,961 | $52,644 |
| Mean Household Income | 6,961 | $67,904 |
| Income Deficit | 4,219 | $12,151 |
| Wage / Income Gap (%) | 19,142 | 49.20% |
| Wage / Income Gap ($) | 19,142 | 50.80¢ per $1 |
| Gini / Inequality Index | 19,142 | 0.43 |
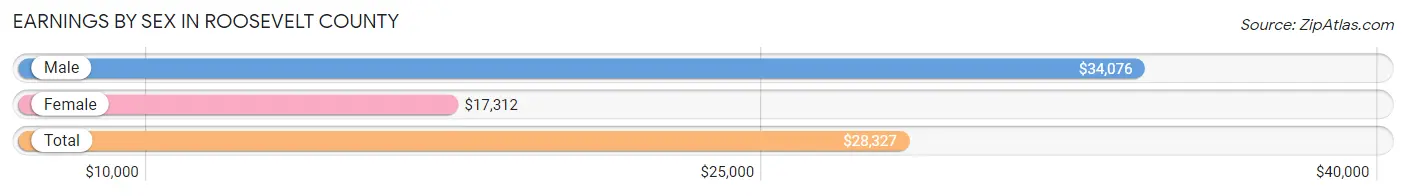
Earnings by Sex in Roosevelt County
Average Earnings in Roosevelt County are $28,327, $34,076 for men and $17,312 for women, a difference of 49.2%.
| Sex | Number | Average Earnings |
| Male | 5,629 (55.5%) | $34,076 |
| Female | 4,511 (44.5%) | $17,312 |
| Total | 10,140 (100.0%) | $28,327 |
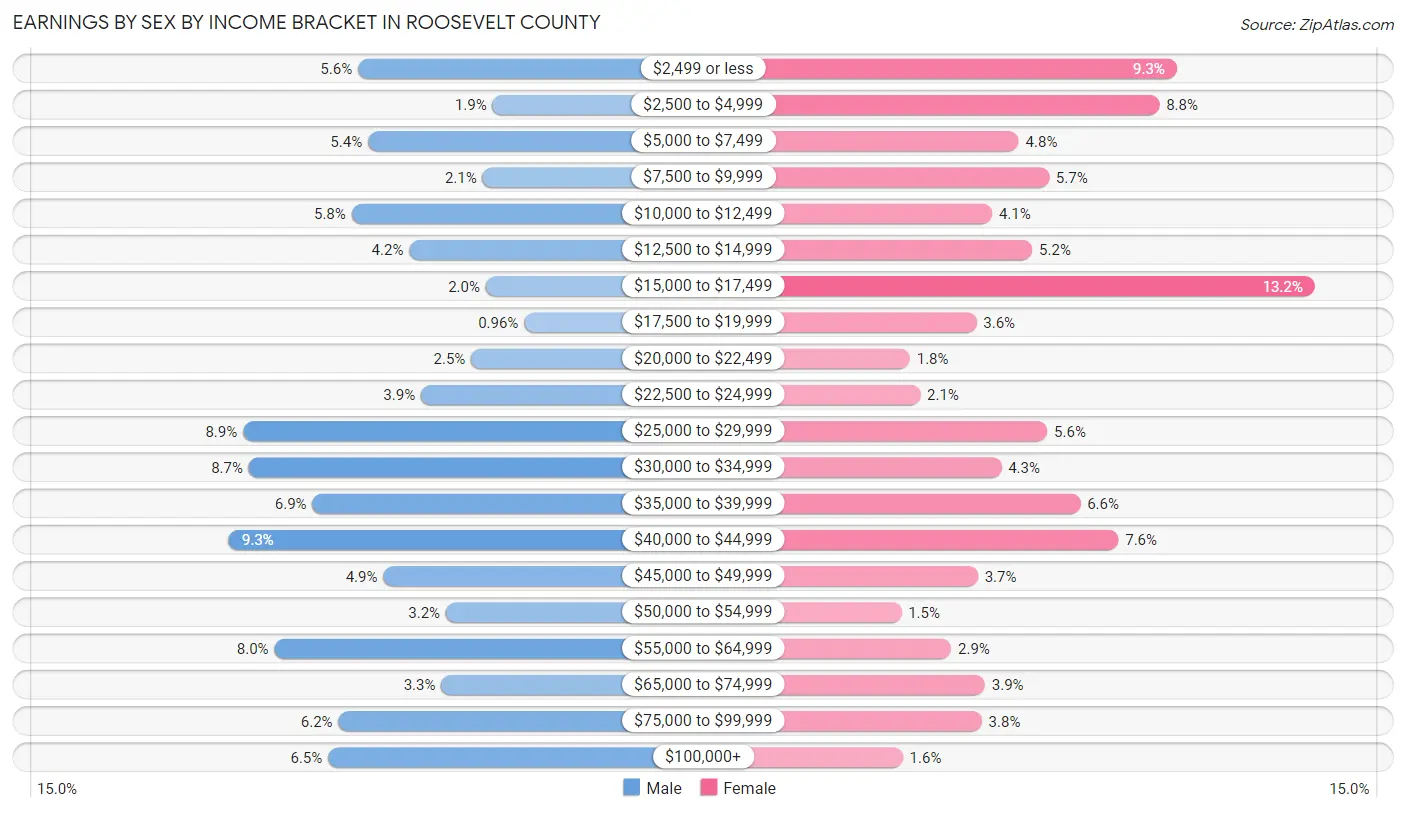
Earnings by Sex by Income Bracket in Roosevelt County
The most common earnings brackets in Roosevelt County are $40,000 to $44,999 for men (521 | 9.3%) and $15,000 to $17,499 for women (593 | 13.2%).
| Income | Male | Female |
| $2,499 or less | 317 (5.6%) | 418 (9.3%) |
| $2,500 to $4,999 | 104 (1.8%) | 396 (8.8%) |
| $5,000 to $7,499 | 301 (5.3%) | 218 (4.8%) |
| $7,500 to $9,999 | 120 (2.1%) | 256 (5.7%) |
| $10,000 to $12,499 | 327 (5.8%) | 184 (4.1%) |
| $12,500 to $14,999 | 236 (4.2%) | 235 (5.2%) |
| $15,000 to $17,499 | 115 (2.0%) | 593 (13.2%) |
| $17,500 to $19,999 | 54 (1.0%) | 164 (3.6%) |
| $20,000 to $22,499 | 138 (2.5%) | 80 (1.8%) |
| $22,500 to $24,999 | 217 (3.9%) | 93 (2.1%) |
| $25,000 to $29,999 | 499 (8.9%) | 254 (5.6%) |
| $30,000 to $34,999 | 490 (8.7%) | 196 (4.3%) |
| $35,000 to $39,999 | 389 (6.9%) | 296 (6.6%) |
| $40,000 to $44,999 | 521 (9.3%) | 344 (7.6%) |
| $45,000 to $49,999 | 277 (4.9%) | 166 (3.7%) |
| $50,000 to $54,999 | 178 (3.2%) | 69 (1.5%) |
| $55,000 to $64,999 | 449 (8.0%) | 132 (2.9%) |
| $65,000 to $74,999 | 185 (3.3%) | 175 (3.9%) |
| $75,000 to $99,999 | 348 (6.2%) | 171 (3.8%) |
| $100,000+ | 364 (6.5%) | 71 (1.6%) |
| Total | 5,629 (100.0%) | 4,511 (100.0%) |
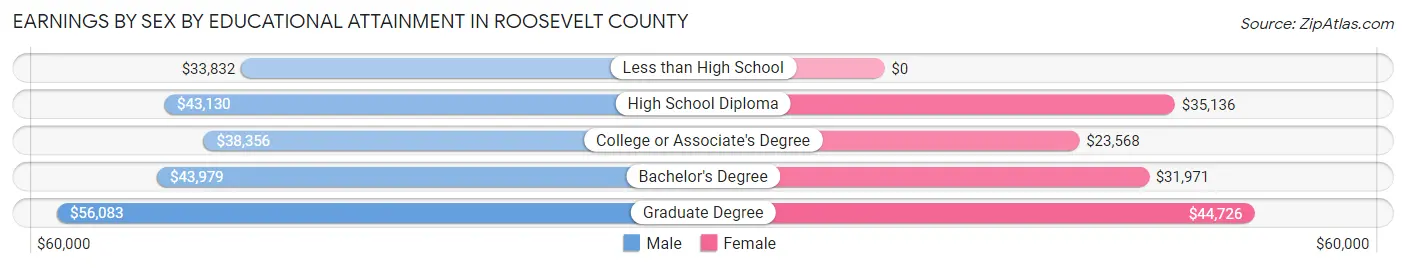
Earnings by Sex by Educational Attainment in Roosevelt County
Average earnings in Roosevelt County are $40,869 for men and $28,125 for women, a difference of 31.2%. Men with an educational attainment of graduate degree enjoy the highest average annual earnings of $56,083, while those with less than high school education earn the least with $33,832. Women with an educational attainment of graduate degree earn the most with the average annual earnings of $44,726, while those with college or associate's degree education have the smallest earnings of $23,568.
| Educational Attainment | Male Income | Female Income |
| Less than High School | $33,832 | $0 |
| High School Diploma | $43,130 | $35,136 |
| College or Associate's Degree | $38,356 | $23,568 |
| Bachelor's Degree | $43,979 | $31,971 |
| Graduate Degree | $56,083 | $44,726 |
| Total | $40,869 | $28,125 |
Family Income in Roosevelt County
Family Income Brackets in Roosevelt County
According to the Roosevelt County family income data, there are 861 families falling into the $100,000 to $149,999 income range, which is the most common income bracket and makes up 20.4% of all families. Conversely, the $10,000 to $14,999 income bracket is the least frequent group with only 89 families (2.1%) belonging to this category.
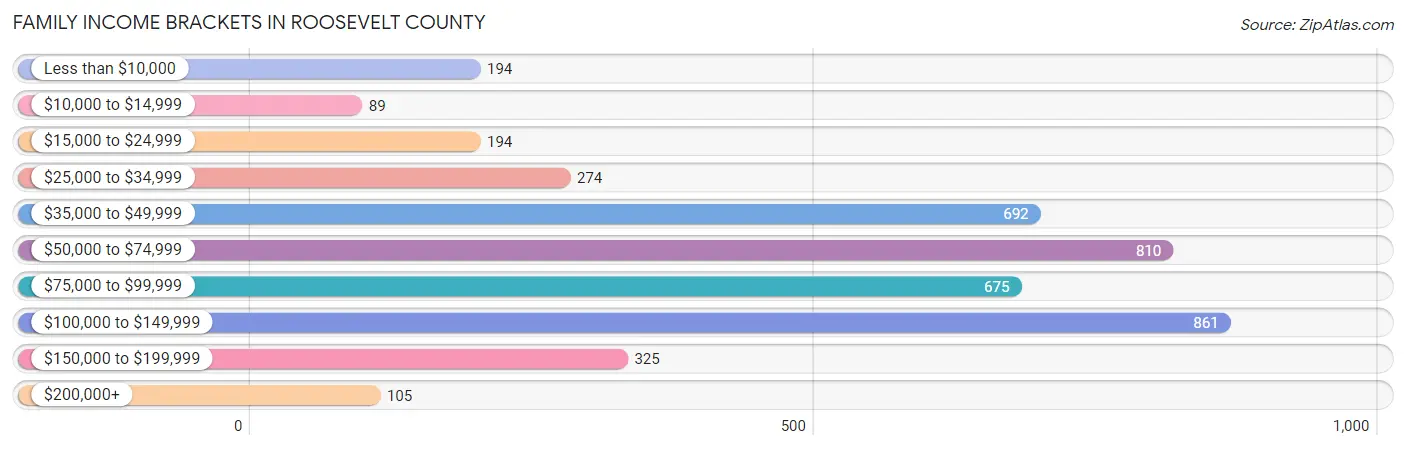
| Income Bracket | # Families | % Families |
| Less than $10,000 | 194 | 4.6% |
| $10,000 to $14,999 | 89 | 2.1% |
| $15,000 to $24,999 | 194 | 4.6% |
| $25,000 to $34,999 | 274 | 6.5% |
| $35,000 to $49,999 | 692 | 16.4% |
| $50,000 to $74,999 | 810 | 19.2% |
| $75,000 to $99,999 | 675 | 16.0% |
| $100,000 to $149,999 | 861 | 20.4% |
| $150,000 to $199,999 | 325 | 7.7% |
| $200,000+ | 105 | 2.5% |
Family Income by Famaliy Size in Roosevelt County
5-person families (695 | 16.5%) account for the highest median family income in Roosevelt County with $107,917 per family, while 2-person families (1,927 | 45.7%) have the highest median income of $31,374 per family member.
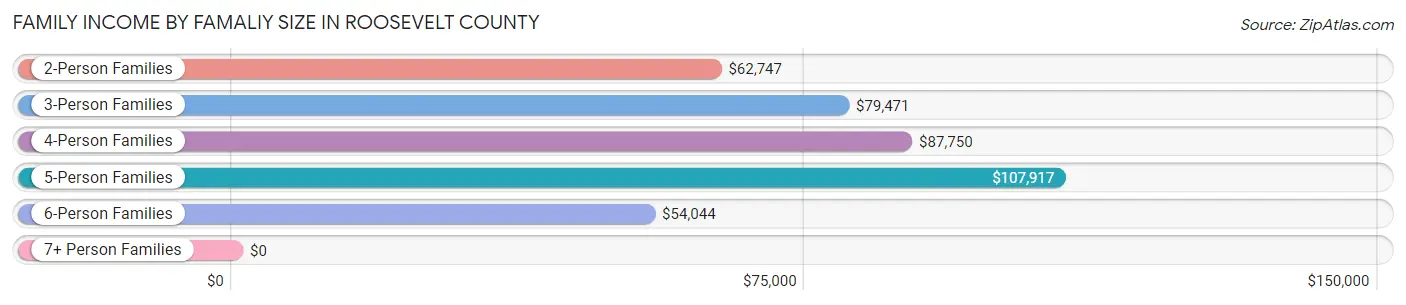
| Income Bracket | # Families | Median Income |
| 2-Person Families | 1,927 (45.7%) | $62,747 |
| 3-Person Families | 738 (17.5%) | $79,471 |
| 4-Person Families | 621 (14.7%) | $87,750 |
| 5-Person Families | 695 (16.5%) | $107,917 |
| 6-Person Families | 91 (2.2%) | $54,044 |
| 7+ Person Families | 147 (3.5%) | $0 |
| Total | 4,219 (100.0%) | $68,717 |
Family Income by Number of Earners in Roosevelt County
The median family income in Roosevelt County is $68,717, with families comprising 3+ earners (514) having the highest median family income of $140,654, while families with no earners (597) have the lowest median family income of $34,429, accounting for 12.2% and 14.1% of families, respectively.
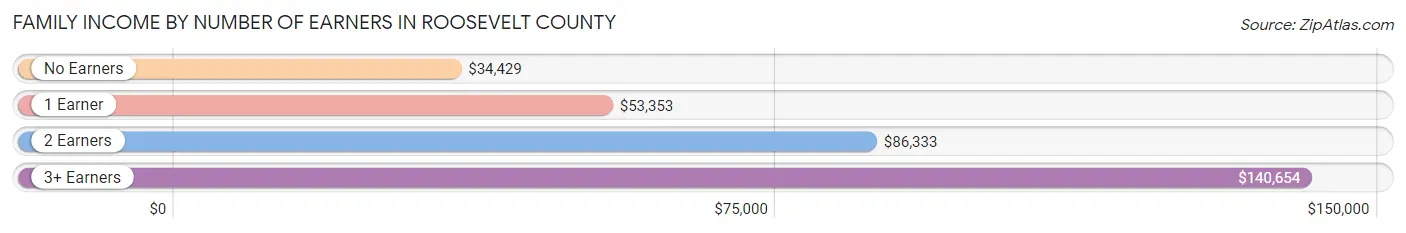
| Number of Earners | # Families | Median Income |
| No Earners | 597 (14.1%) | $34,429 |
| 1 Earner | 1,450 (34.4%) | $53,353 |
| 2 Earners | 1,658 (39.3%) | $86,333 |
| 3+ Earners | 514 (12.2%) | $140,654 |
| Total | 4,219 (100.0%) | $68,717 |
Household Income in Roosevelt County
Household Income Brackets in Roosevelt County
With 1,267 households falling in the category, the $50,000 to $74,999 income range is the most frequent in Roosevelt County, accounting for 18.2% of all households. In contrast, only 125 households (1.8%) fall into the $200,000+ income bracket, making it the least populous group.
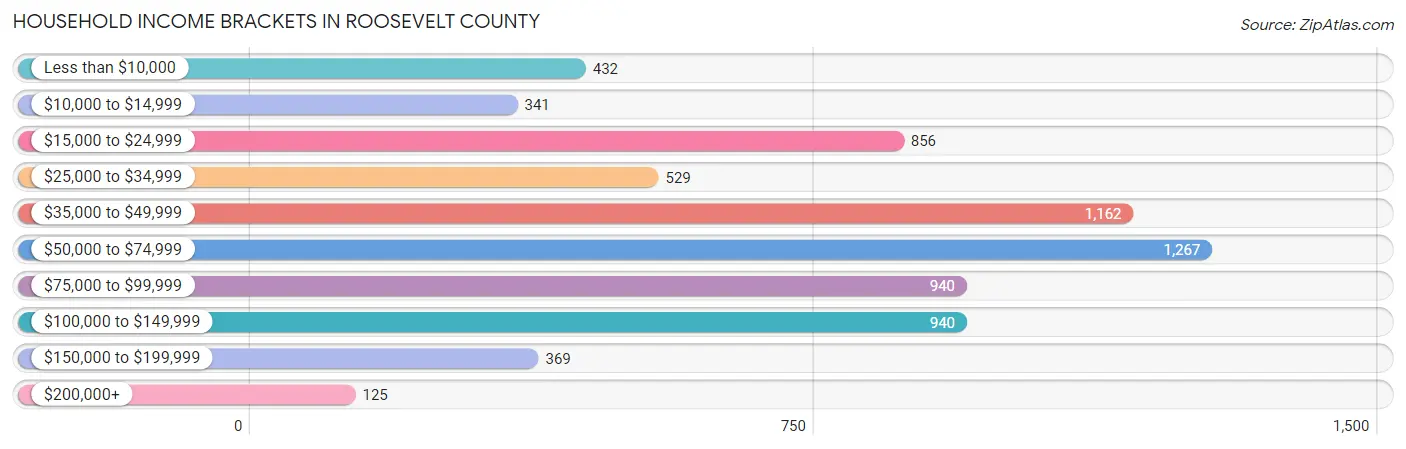
| Income Bracket | # Households | % Households |
| Less than $10,000 | 432 | 6.2% |
| $10,000 to $14,999 | 341 | 4.9% |
| $15,000 to $24,999 | 856 | 12.3% |
| $25,000 to $34,999 | 529 | 7.6% |
| $35,000 to $49,999 | 1,162 | 16.7% |
| $50,000 to $74,999 | 1,267 | 18.2% |
| $75,000 to $99,999 | 940 | 13.5% |
| $100,000 to $149,999 | 940 | 13.5% |
| $150,000 to $199,999 | 369 | 5.3% |
| $200,000+ | 125 | 1.8% |
Household Income by Householder Age in Roosevelt County
The median household income in Roosevelt County is $52,644, with the highest median household income of $64,646 found in the 45 to 64 years age bracket for the primary householder. A total of 2,190 households (31.5%) fall into this category. Meanwhile, the 15 to 24 years age bracket for the primary householder has the lowest median household income of $31,088, with 707 households (10.2%) in this group.
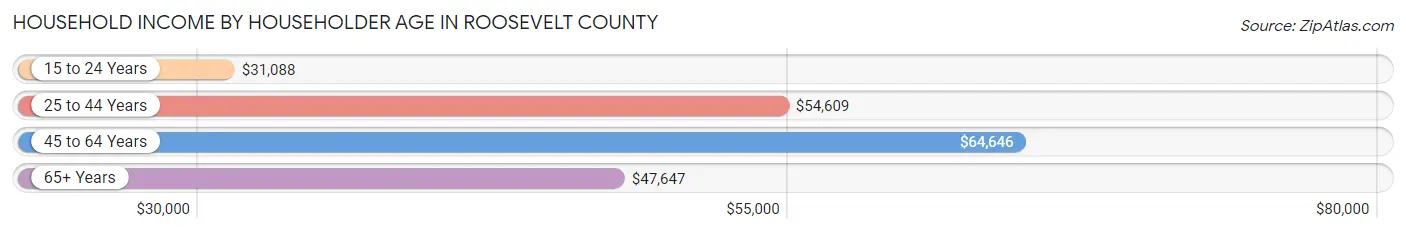
| Income Bracket | # Households | Median Income |
| 15 to 24 Years | 707 (10.2%) | $31,088 |
| 25 to 44 Years | 2,207 (31.7%) | $54,609 |
| 45 to 64 Years | 2,190 (31.5%) | $64,646 |
| 65+ Years | 1,857 (26.7%) | $47,647 |
| Total | 6,961 (100.0%) | $52,644 |
Poverty in Roosevelt County
Income Below Poverty by Sex and Age in Roosevelt County
With 19.9% poverty level for males and 21.2% for females among the residents of Roosevelt County, 5 year old males and 18 to 24 year old females are the most vulnerable to poverty, with 40 males (66.7%) and 468 females (40.8%) in their respective age groups living below the poverty level.
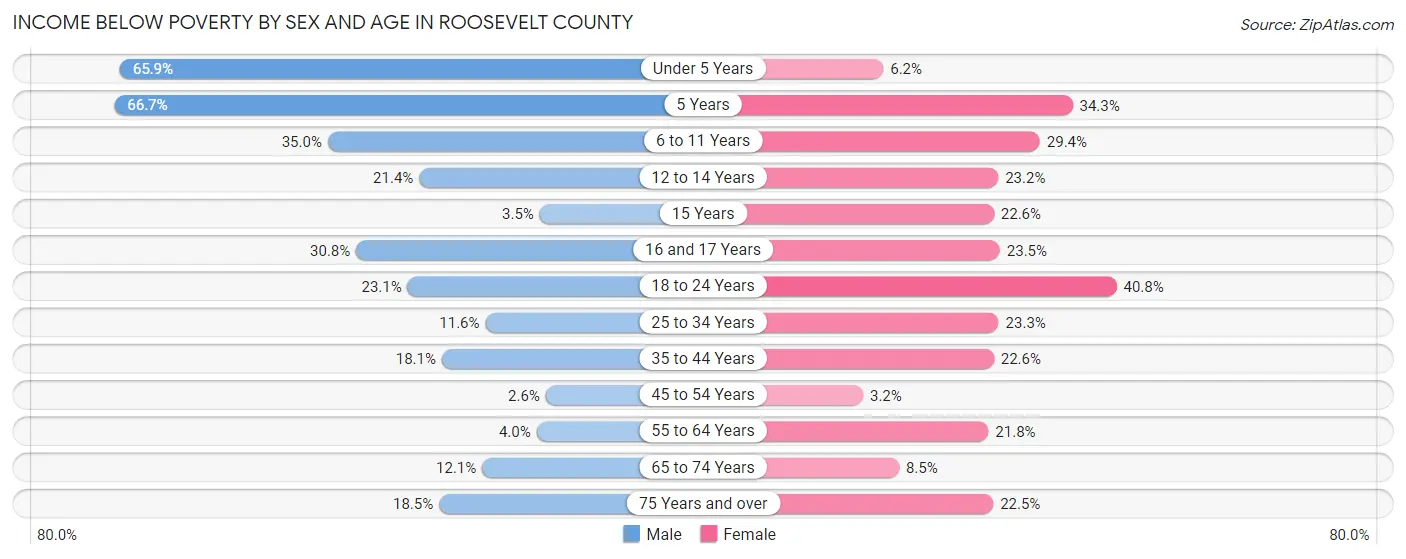
| Age Bracket | Male | Female |
| Under 5 Years | 409 (65.9%) | 34 (6.2%) |
| 5 Years | 40 (66.7%) | 37 (34.3%) |
| 6 to 11 Years | 289 (35.0%) | 215 (29.4%) |
| 12 to 14 Years | 73 (21.4%) | 95 (23.2%) |
| 15 Years | 6 (3.5%) | 56 (22.6%) |
| 16 and 17 Years | 72 (30.8%) | 23 (23.5%) |
| 18 to 24 Years | 320 (23.1%) | 468 (40.8%) |
| 25 to 34 Years | 116 (11.6%) | 276 (23.3%) |
| 35 to 44 Years | 215 (18.0%) | 223 (22.6%) |
| 45 to 54 Years | 25 (2.6%) | 29 (3.2%) |
| 55 to 64 Years | 37 (4.0%) | 238 (21.8%) |
| 65 to 74 Years | 95 (12.1%) | 74 (8.5%) |
| 75 Years and over | 98 (18.5%) | 134 (22.5%) |
| Total | 1,795 (19.9%) | 1,902 (21.2%) |
Income Above Poverty by Sex and Age in Roosevelt County
According to the poverty statistics in Roosevelt County, males aged 45 to 54 years and females aged 45 to 54 years are the age groups that are most secure financially, with 97.4% of males and 96.9% of females in these age groups living above the poverty line.
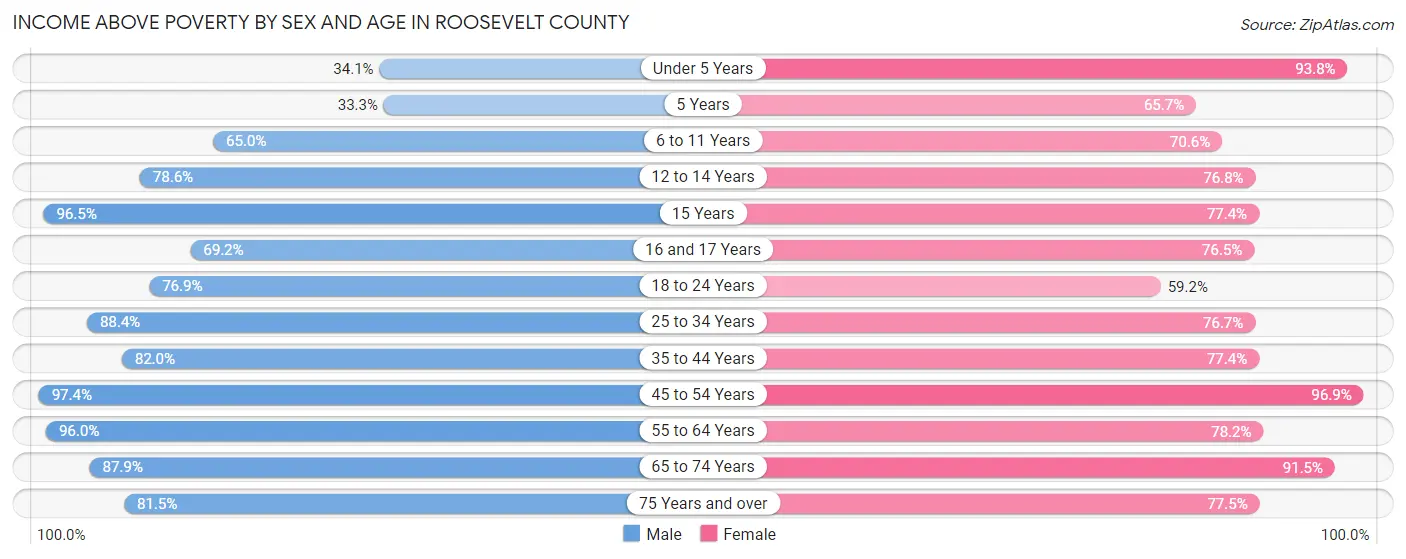
| Age Bracket | Male | Female |
| Under 5 Years | 212 (34.1%) | 518 (93.8%) |
| 5 Years | 20 (33.3%) | 71 (65.7%) |
| 6 to 11 Years | 537 (65.0%) | 516 (70.6%) |
| 12 to 14 Years | 268 (78.6%) | 314 (76.8%) |
| 15 Years | 165 (96.5%) | 192 (77.4%) |
| 16 and 17 Years | 162 (69.2%) | 75 (76.5%) |
| 18 to 24 Years | 1,063 (76.9%) | 679 (59.2%) |
| 25 to 34 Years | 886 (88.4%) | 909 (76.7%) |
| 35 to 44 Years | 976 (82.0%) | 765 (77.4%) |
| 45 to 54 Years | 924 (97.4%) | 893 (96.9%) |
| 55 to 64 Years | 892 (96.0%) | 855 (78.2%) |
| 65 to 74 Years | 693 (87.9%) | 798 (91.5%) |
| 75 Years and over | 433 (81.5%) | 462 (77.5%) |
| Total | 7,231 (80.1%) | 7,047 (78.7%) |
Income Below Poverty Among Married-Couple Families in Roosevelt County
The poverty statistics for married-couple families in Roosevelt County show that 5.0% or 156 of the total 3,111 families live below the poverty line. Families with 5 or more children have the highest poverty rate of 60.0%, comprising of 30 families. On the other hand, families with no children have the lowest poverty rate of 1.4%, which includes 25 families.
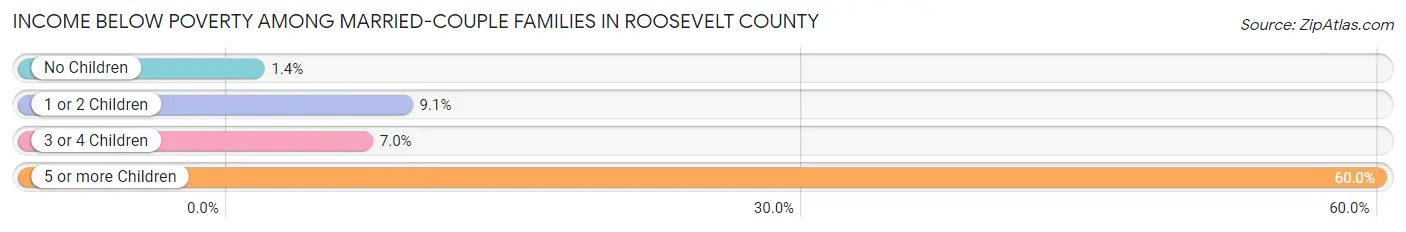
| Children | Above Poverty | Below Poverty |
| No Children | 1,789 (98.6%) | 25 (1.4%) |
| 1 or 2 Children | 578 (90.9%) | 58 (9.1%) |
| 3 or 4 Children | 568 (93.0%) | 43 (7.0%) |
| 5 or more Children | 20 (40.0%) | 30 (60.0%) |
| Total | 2,955 (95.0%) | 156 (5.0%) |
Income Below Poverty Among Single-Parent Households in Roosevelt County
According to the poverty data in Roosevelt County, 30.0% or 109 single-father households and 37.6% or 280 single-mother households are living below the poverty line. Among single-father households, those with 5 or more children have the highest poverty rate, with 46 households (100.0%) experiencing poverty. Likewise, among single-mother households, those with 3 or 4 children have the highest poverty rate, with 93 households (100.0%) falling below the poverty line.
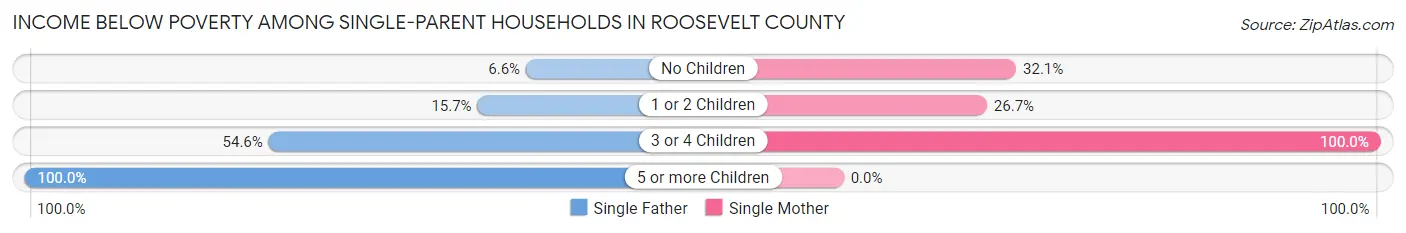
| Children | Single Father | Single Mother |
| No Children | 9 (6.6%) | 88 (32.1%) |
| 1 or 2 Children | 18 (15.7%) | 99 (26.7%) |
| 3 or 4 Children | 36 (54.5%) | 93 (100.0%) |
| 5 or more Children | 46 (100.0%) | 0 (0.0%) |
| Total | 109 (30.0%) | 280 (37.6%) |
Income Below Poverty Among Married-Couple vs Single-Parent Households in Roosevelt County
The poverty data for Roosevelt County shows that 156 of the married-couple family households (5.0%) and 389 of the single-parent households (35.1%) are living below the poverty level. Within the married-couple family households, those with 5 or more children have the highest poverty rate, with 30 households (60.0%) falling below the poverty line. Among the single-parent households, those with 5 or more children have the highest poverty rate, with 46 household (86.8%) living below poverty.
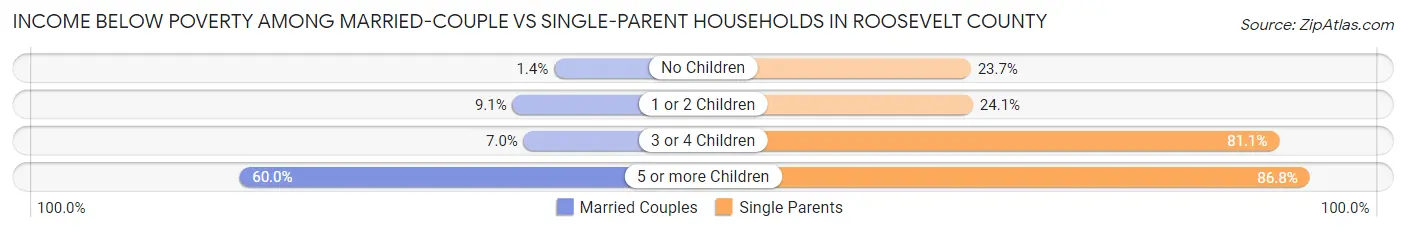
| Children | Married-Couple Families | Single-Parent Households |
| No Children | 25 (1.4%) | 97 (23.7%) |
| 1 or 2 Children | 58 (9.1%) | 117 (24.1%) |
| 3 or 4 Children | 43 (7.0%) | 129 (81.1%) |
| 5 or more Children | 30 (60.0%) | 46 (86.8%) |
| Total | 156 (5.0%) | 389 (35.1%) |
Race in Roosevelt County
The most populous races in Roosevelt County are White / Caucasian (13,580 | 70.9%), Hispanic or Latino (8,432 | 44.1%), and Some other Race (2,435 | 12.7%).
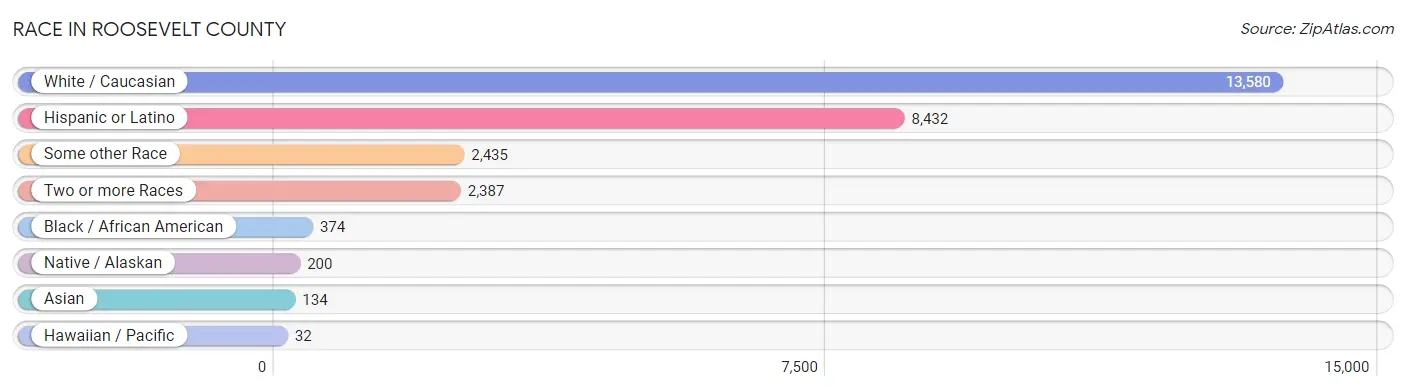
| Race | # Population | % Population |
| Asian | 134 | 0.7% |
| Black / African American | 374 | 1.9% |
| Hawaiian / Pacific | 32 | 0.2% |
| Hispanic or Latino | 8,432 | 44.1% |
| Native / Alaskan | 200 | 1.0% |
| White / Caucasian | 13,580 | 70.9% |
| Two or more Races | 2,387 | 12.5% |
| Some other Race | 2,435 | 12.7% |
| Total | 19,142 | 100.0% |
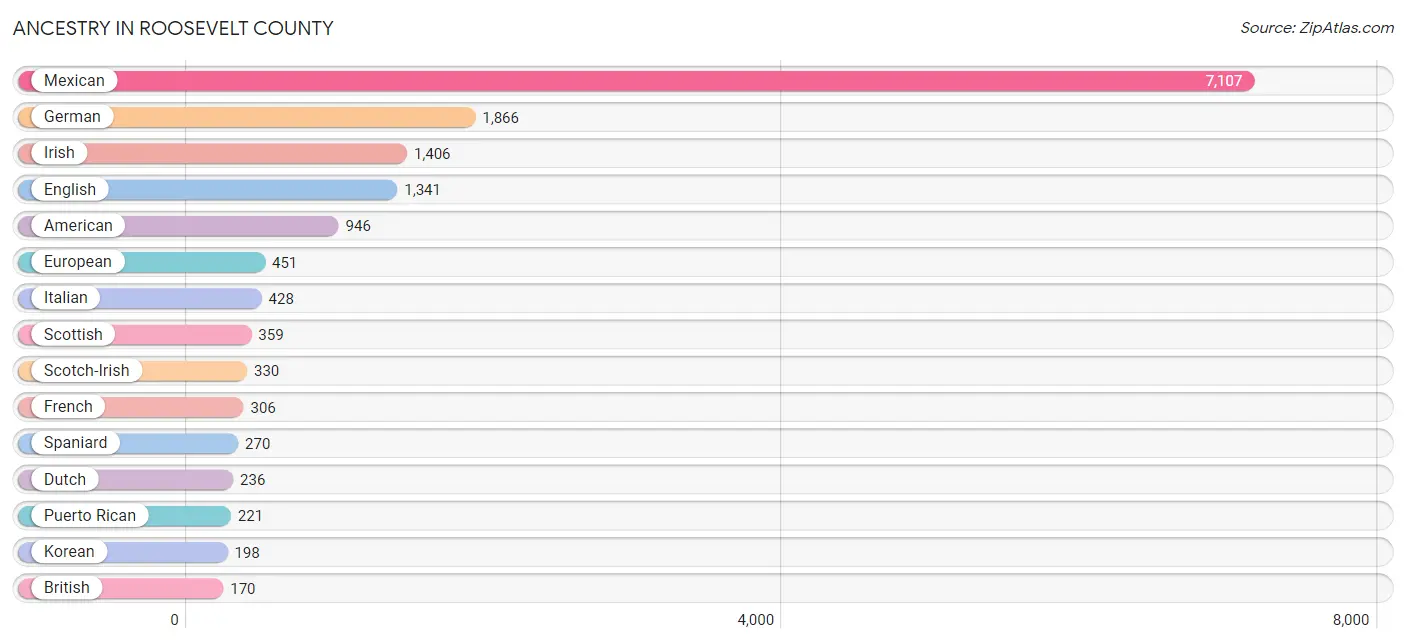
Ancestry in Roosevelt County
The most populous ancestries reported in Roosevelt County are Mexican (7,107 | 37.1%), German (1,866 | 9.8%), Irish (1,406 | 7.3%), English (1,341 | 7.0%), and American (946 | 4.9%), together accounting for 66.2% of all Roosevelt County residents.
| Ancestry | # Population | % Population |
| American | 946 | 4.9% |
| Apache | 2 | 0.0% |
| Basque | 16 | 0.1% |
| Bhutanese | 6 | 0.0% |
| British | 170 | 0.9% |
| Bulgarian | 27 | 0.1% |
| Burmese | 48 | 0.3% |
| Cajun | 32 | 0.2% |
| Central American | 40 | 0.2% |
| Cherokee | 52 | 0.3% |
| Chippewa | 12 | 0.1% |
| Choctaw | 73 | 0.4% |
| Czech | 8 | 0.0% |
| Czechoslovakian | 12 | 0.1% |
| Danish | 2 | 0.0% |
| Dutch | 236 | 1.2% |
| Dutch West Indian | 8 | 0.0% |
| Ecuadorian | 8 | 0.0% |
| English | 1,341 | 7.0% |
| European | 451 | 2.4% |
| Finnish | 12 | 0.1% |
| French | 306 | 1.6% |
| German | 1,866 | 9.8% |
| Guatemalan | 32 | 0.2% |
| Haitian | 17 | 0.1% |
| Honduran | 8 | 0.0% |
| Hungarian | 2 | 0.0% |
| Indian (Asian) | 17 | 0.1% |
| Irish | 1,406 | 7.3% |
| Italian | 428 | 2.2% |
| Korean | 198 | 1.0% |
| Lithuanian | 11 | 0.1% |
| Mexican | 7,107 | 37.1% |
| Native Hawaiian | 32 | 0.2% |
| Navajo | 85 | 0.4% |
| Norwegian | 67 | 0.4% |
| Pakistani | 1 | 0.0% |
| Polish | 35 | 0.2% |
| Portuguese | 42 | 0.2% |
| Potawatomi | 2 | 0.0% |
| Pueblo | 91 | 0.5% |
| Puerto Rican | 221 | 1.1% |
| Samoan | 34 | 0.2% |
| Scandinavian | 17 | 0.1% |
| Scotch-Irish | 330 | 1.7% |
| Scottish | 359 | 1.9% |
| Sioux | 15 | 0.1% |
| South American | 8 | 0.0% |
| Spaniard | 270 | 1.4% |
| Spanish | 135 | 0.7% |
| Spanish American Indian | 26 | 0.1% |
| Sri Lankan | 26 | 0.1% |
| Swedish | 125 | 0.6% |
| Swiss | 2 | 0.0% |
| Thai | 13 | 0.1% |
| Ukrainian | 3 | 0.0% |
| Welsh | 132 | 0.7% | View All 57 Rows |
Immigrants in Roosevelt County
The most numerous immigrant groups reported in Roosevelt County came from Latin America (1,478 | 7.7%), Central America (1,471 | 7.7%), Mexico (1,463 | 7.6%), Asia (124 | 0.6%), and Eastern Asia (65 | 0.3%), together accounting for 24.0% of all Roosevelt County residents.
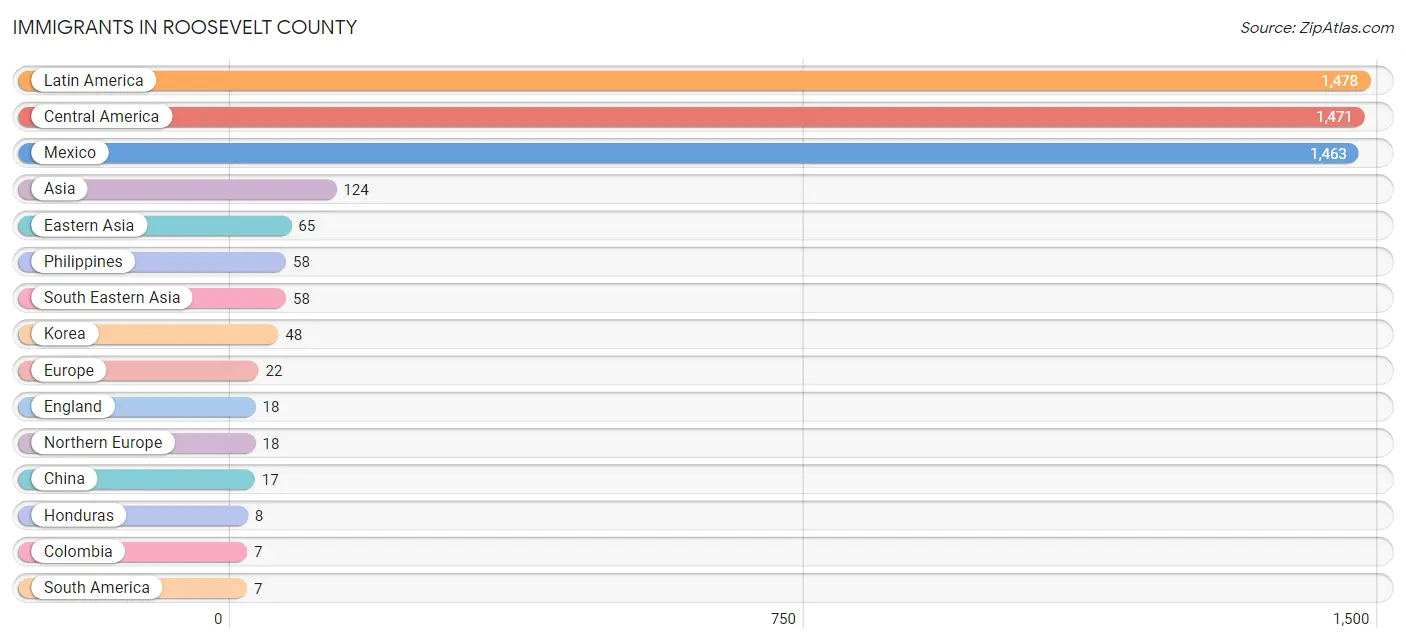
| Immigration Origin | # Population | % Population |
| Asia | 124 | 0.6% |
| Canada | 3 | 0.0% |
| Central America | 1,471 | 7.7% |
| China | 17 | 0.1% |
| Colombia | 7 | 0.0% |
| Eastern Asia | 65 | 0.3% |
| England | 18 | 0.1% |
| Europe | 22 | 0.1% |
| Honduras | 8 | 0.0% |
| India | 1 | 0.0% |
| Korea | 48 | 0.3% |
| Latin America | 1,478 | 7.7% |
| Mexico | 1,463 | 7.6% |
| Netherlands | 4 | 0.0% |
| Northern Europe | 18 | 0.1% |
| Philippines | 58 | 0.3% |
| South America | 7 | 0.0% |
| South Central Asia | 1 | 0.0% |
| South Eastern Asia | 58 | 0.3% |
| Western Europe | 4 | 0.0% | View All 20 Rows |
Sex and Age in Roosevelt County
Sex and Age in Roosevelt County
The most populous age groups in Roosevelt County are 20 to 24 Years (1,235 | 12.9%) for men and 20 to 24 Years (1,214 | 12.7%) for women.
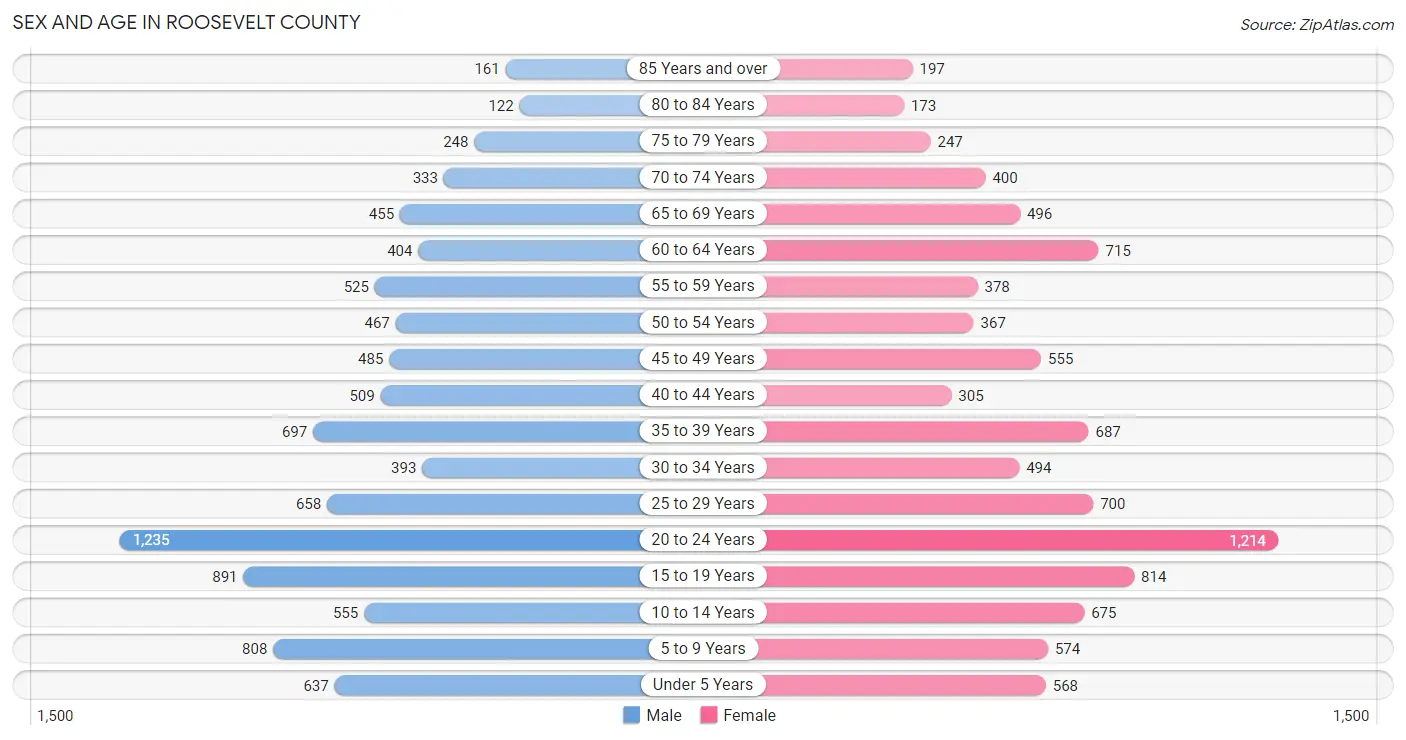
| Age Bracket | Male | Female |
| Under 5 Years | 637 (6.7%) | 568 (5.9%) |
| 5 to 9 Years | 808 (8.4%) | 574 (6.0%) |
| 10 to 14 Years | 555 (5.8%) | 675 (7.1%) |
| 15 to 19 Years | 891 (9.3%) | 814 (8.5%) |
| 20 to 24 Years | 1,235 (12.9%) | 1,214 (12.7%) |
| 25 to 29 Years | 658 (6.9%) | 700 (7.3%) |
| 30 to 34 Years | 393 (4.1%) | 494 (5.2%) |
| 35 to 39 Years | 697 (7.3%) | 687 (7.2%) |
| 40 to 44 Years | 509 (5.3%) | 305 (3.2%) |
| 45 to 49 Years | 485 (5.1%) | 555 (5.8%) |
| 50 to 54 Years | 467 (4.9%) | 367 (3.8%) |
| 55 to 59 Years | 525 (5.5%) | 378 (4.0%) |
| 60 to 64 Years | 404 (4.2%) | 715 (7.5%) |
| 65 to 69 Years | 455 (4.8%) | 496 (5.2%) |
| 70 to 74 Years | 333 (3.5%) | 400 (4.2%) |
| 75 to 79 Years | 248 (2.6%) | 247 (2.6%) |
| 80 to 84 Years | 122 (1.3%) | 173 (1.8%) |
| 85 Years and over | 161 (1.7%) | 197 (2.1%) |
| Total | 9,583 (100.0%) | 9,559 (100.0%) |
Families and Households in Roosevelt County
Median Family Size in Roosevelt County
The median family size in Roosevelt County is 3.30 persons per family, with single male/father families (363 | 8.6%) accounting for the largest median family size of 4.18 persons per family. On the other hand, single female/mother families (745 | 17.7%) represent the smallest median family size with 2.92 persons per family.
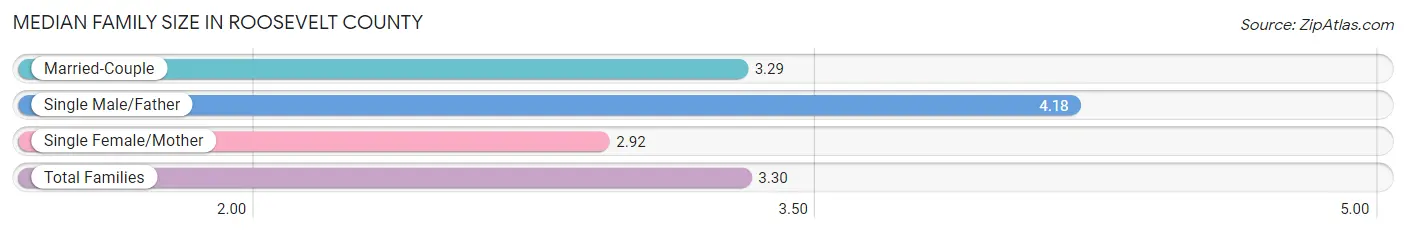
| Family Type | # Families | Family Size |
| Married-Couple | 3,111 (73.7%) | 3.29 |
| Single Male/Father | 363 (8.6%) | 4.18 |
| Single Female/Mother | 745 (17.7%) | 2.92 |
| Total Families | 4,219 (100.0%) | 3.30 |
Median Household Size in Roosevelt County
The median household size in Roosevelt County is 2.59 persons per household, with single male/father households (363 | 5.2%) accounting for the largest median household size of 4.7 persons per household. non-family households (2,742 | 39.4%) represent the smallest median household size with 1.29 persons per household.
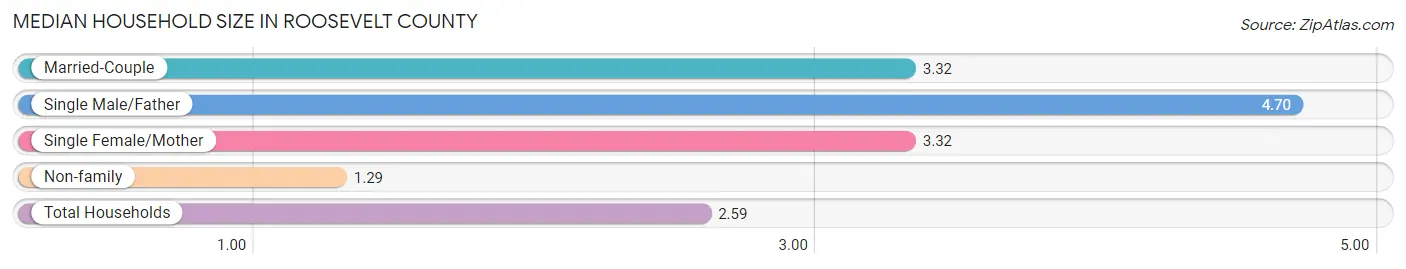
| Household Type | # Households | Household Size |
| Married-Couple | 3,111 (44.7%) | 3.32 |
| Single Male/Father | 363 (5.2%) | 4.70 |
| Single Female/Mother | 745 (10.7%) | 3.32 |
| Non-family | 2,742 (39.4%) | 1.29 |
| Total Households | 6,961 (100.0%) | 2.59 |
Household Size by Marriage Status in Roosevelt County
Out of a total of 6,961 households in Roosevelt County, 4,219 (60.6%) are family households, while 2,742 (39.4%) are nonfamily households. The most numerous type of family households are 2-person households, comprising 1,808, and the most common type of nonfamily households are 1-person households, comprising 2,332.
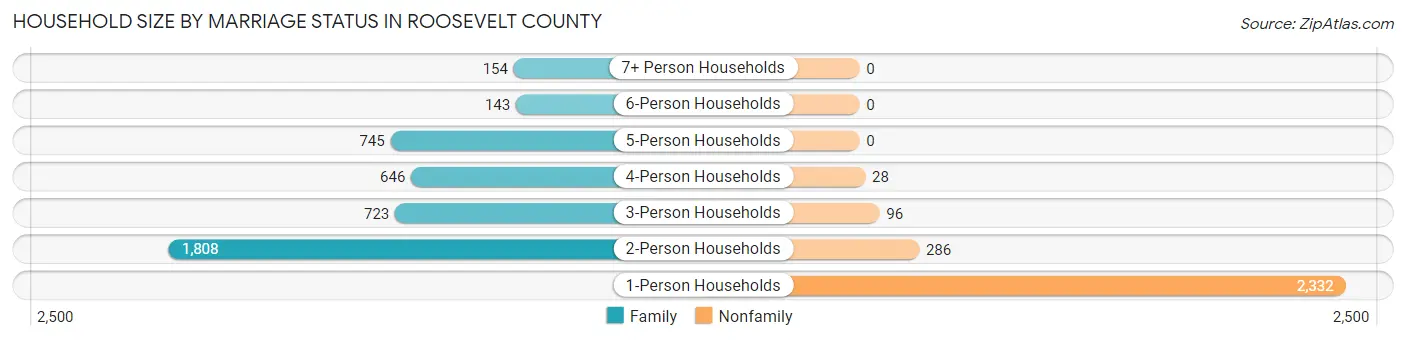
| Household Size | Family Households | Nonfamily Households |
| 1-Person Households | - | 2,332 (33.5%) |
| 2-Person Households | 1,808 (26.0%) | 286 (4.1%) |
| 3-Person Households | 723 (10.4%) | 96 (1.4%) |
| 4-Person Households | 646 (9.3%) | 28 (0.4%) |
| 5-Person Households | 745 (10.7%) | 0 (0.0%) |
| 6-Person Households | 143 (2.1%) | 0 (0.0%) |
| 7+ Person Households | 154 (2.2%) | 0 (0.0%) |
| Total | 4,219 (60.6%) | 2,742 (39.4%) |
Female Fertility in Roosevelt County
Fertility by Age in Roosevelt County
Average fertility rate in Roosevelt County is 56.0 births per 1,000 women. Women in the age bracket of 20 to 34 years have the highest fertility rate with 74.0 births per 1,000 women. Women in the age bracket of 20 to 34 years acount for 66.0% of all women with births.
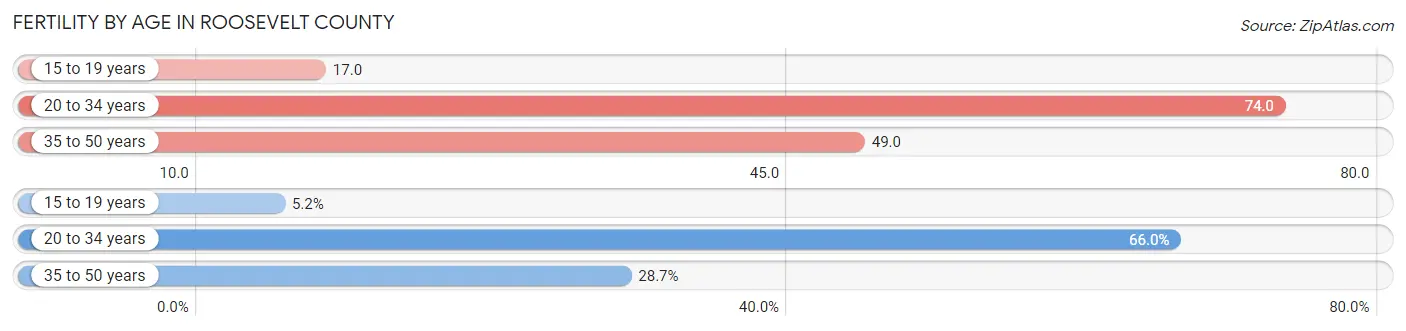
| Age Bracket | Women with Births | Births / 1,000 Women |
| 15 to 19 years | 14 (5.2%) | 17.0 |
| 20 to 34 years | 177 (66.0%) | 74.0 |
| 35 to 50 years | 77 (28.7%) | 49.0 |
| Total | 268 (100.0%) | 56.0 |
Fertility by Age by Marriage Status in Roosevelt County
52.2% of women with births (268) in Roosevelt County are married. The highest percentage of unmarried women with births falls into 15 to 19 years age bracket with 100.0% of them unmarried at the time of birth, while the lowest percentage of unmarried women with births belong to 35 to 50 years age bracket with 39.0% of them unmarried.
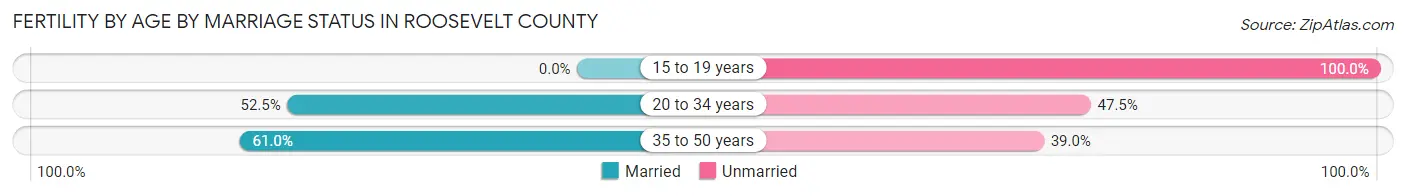
| Age Bracket | Married | Unmarried |
| 15 to 19 years | 0 (0.0%) | 14 (100.0%) |
| 20 to 34 years | 93 (52.5%) | 84 (47.5%) |
| 35 to 50 years | 47 (61.0%) | 30 (39.0%) |
| Total | 140 (52.2%) | 128 (47.8%) |
Fertility by Education in Roosevelt County
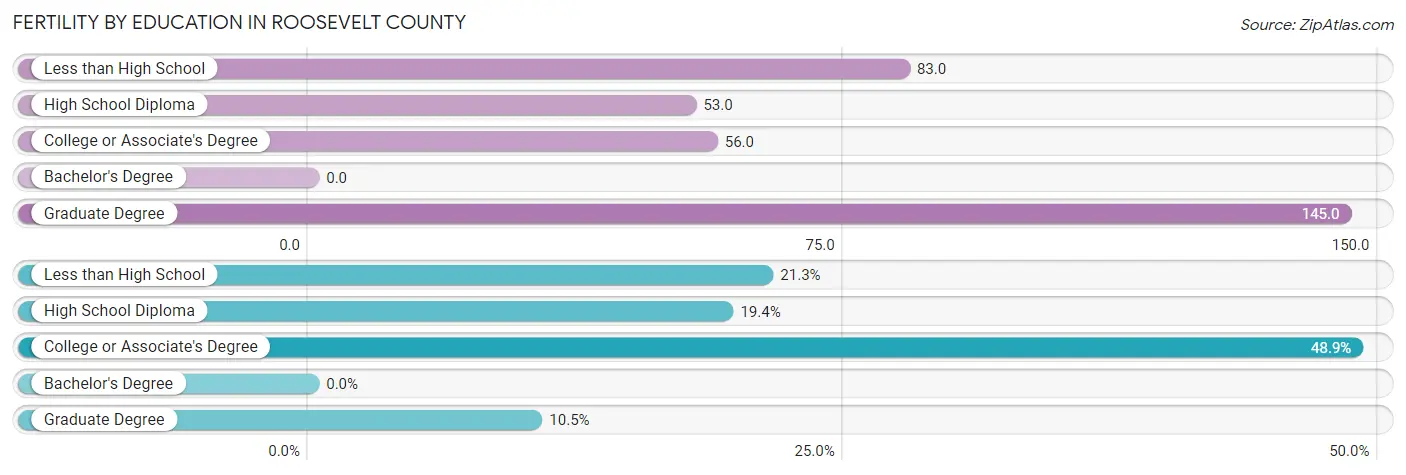
| Educational Attainment | Women with Births | Births / 1,000 Women |
| Less than High School | 57 (21.3%) | 83.0 |
| High School Diploma | 52 (19.4%) | 53.0 |
| College or Associate's Degree | 131 (48.9%) | 56.0 |
| Bachelor's Degree | 0 (0.0%) | 0.0 |
| Graduate Degree | 28 (10.4%) | 145.0 |
| Total | 268 (100.0%) | 56.0 |
Fertility by Education by Marriage Status in Roosevelt County
47.8% of women with births in Roosevelt County are unmarried. Women with the educational attainment of graduate degree are most likely to be married with 100.0% of them married at childbirth, while women with the educational attainment of less than high school are least likely to be married with 100.0% of them unmarried at childbirth.
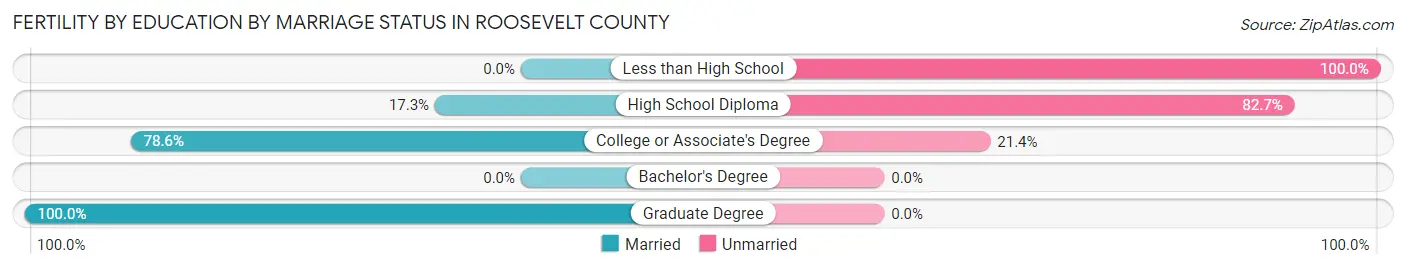
| Educational Attainment | Married | Unmarried |
| Less than High School | 0 (0.0%) | 57 (100.0%) |
| High School Diploma | 9 (17.3%) | 43 (82.7%) |
| College or Associate's Degree | 103 (78.6%) | 28 (21.4%) |
| Bachelor's Degree | 0 (0.0%) | 0 (0.0%) |
| Graduate Degree | 28 (100.0%) | 0 (0.0%) |
| Total | 140 (52.2%) | 128 (47.8%) |
Employment Characteristics in Roosevelt County
Employment by Class of Employer in Roosevelt County
Among the 8,672 employed individuals in Roosevelt County, private company employees (5,335 | 61.5%), state government employees (1,229 | 14.2%), and not-for-profit organizations (703 | 8.1%) make up the most common classes of employment.
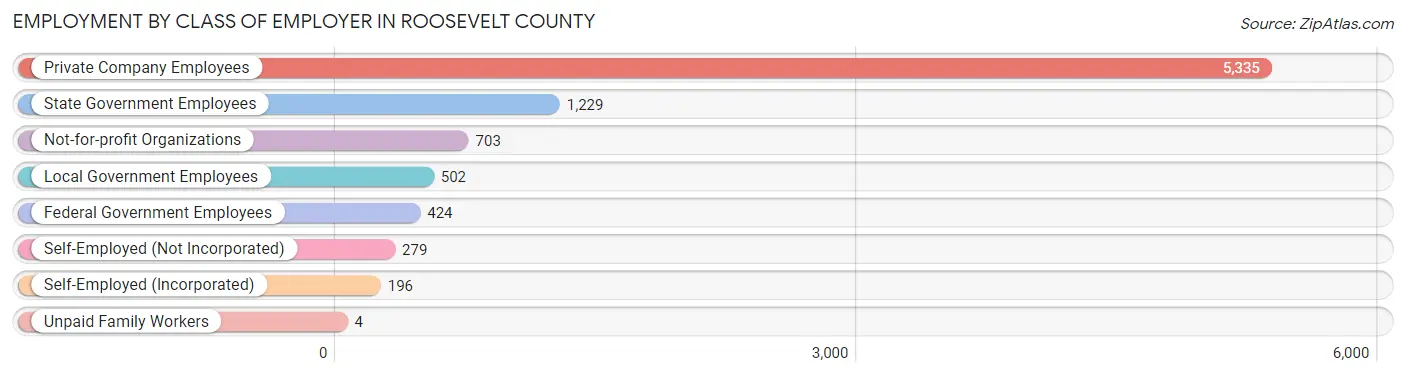
| Employer Class | # Employees | % Employees |
| Private Company Employees | 5,335 | 61.5% |
| Self-Employed (Incorporated) | 196 | 2.3% |
| Self-Employed (Not Incorporated) | 279 | 3.2% |
| Not-for-profit Organizations | 703 | 8.1% |
| Local Government Employees | 502 | 5.8% |
| State Government Employees | 1,229 | 14.2% |
| Federal Government Employees | 424 | 4.9% |
| Unpaid Family Workers | 4 | 0.1% |
| Total | 8,672 | 100.0% |
Employment Status by Age in Roosevelt County
According to the labor force statistics for Roosevelt County, out of the total population over 16 years of age (14,906), 62.6% or 9,331 individuals are in the labor force, with 6.6% or 616 of them unemployed. The age group with the highest labor force participation rate is 35 to 44 years, with 84.6% or 1,860 individuals in the labor force. Within the labor force, the 16 to 19 years age range has the highest percentage of unemployed individuals, with 40.3% or 281 of them being unemployed.
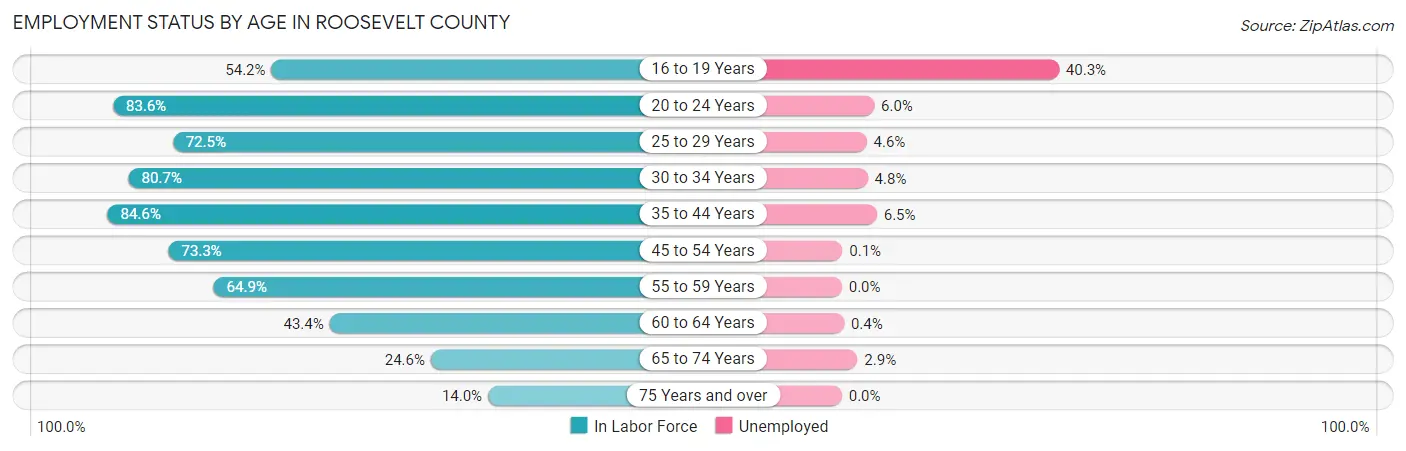
| Age Bracket | In Labor Force | Unemployed |
| 16 to 19 Years | 697 (54.2%) | 281 (40.3%) |
| 20 to 24 Years | 2,047 (83.6%) | 123 (6.0%) |
| 25 to 29 Years | 985 (72.5%) | 45 (4.6%) |
| 30 to 34 Years | 716 (80.7%) | 34 (4.8%) |
| 35 to 44 Years | 1,860 (84.6%) | 121 (6.5%) |
| 45 to 54 Years | 1,374 (73.3%) | 1 (0.1%) |
| 55 to 59 Years | 586 (64.9%) | 0 (0.0%) |
| 60 to 64 Years | 486 (43.4%) | 2 (0.4%) |
| 65 to 74 Years | 414 (24.6%) | 12 (2.9%) |
| 75 Years and over | 161 (14.0%) | 0 (0.0%) |
| Total | 9,331 (62.6%) | 616 (6.6%) |
Employment Status by Educational Attainment in Roosevelt County
According to labor force statistics for Roosevelt County, 72.0% of individuals (6,004) out of the total population between 25 and 64 years of age (8,339) are in the labor force, with 3.4% or 204 of them being unemployed. The group with the highest labor force participation rate are those with the educational attainment of college / associate degree, with 85.3% or 2,335 individuals in the labor force. Within the labor force, individuals with high school diploma education have the highest percentage of unemployment, with 4.3% or 81 of them being unemployed.
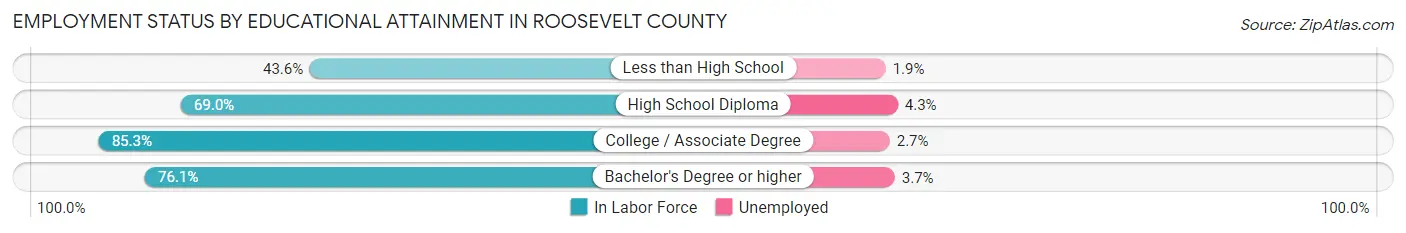
| Educational Attainment | In Labor Force | Unemployed |
| Less than High School | 534 (43.6%) | 23 (1.9%) |
| High School Diploma | 1,878 (69.0%) | 117 (4.3%) |
| College / Associate Degree | 2,335 (85.3%) | 74 (2.7%) |
| Bachelor's Degree or higher | 1,260 (76.1%) | 61 (3.7%) |
| Total | 6,004 (72.0%) | 284 (3.4%) |
Employment Occupations by Sex in Roosevelt County
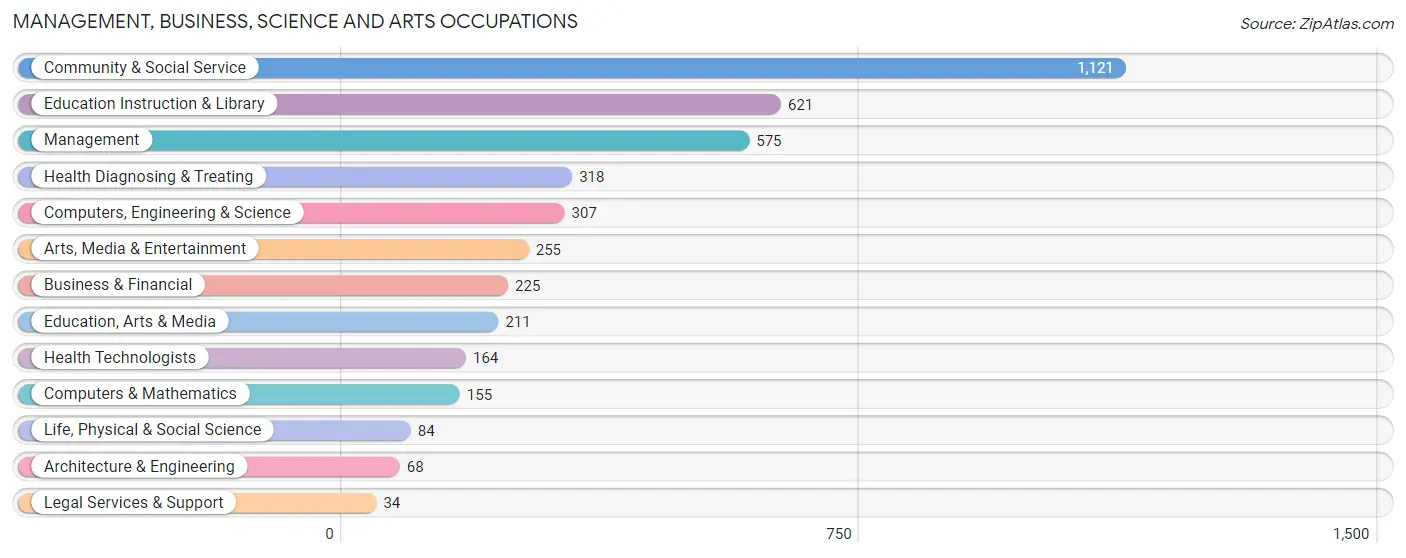
Management, Business, Science and Arts Occupations
The most common Management, Business, Science and Arts occupations in Roosevelt County are Community & Social Service (1,121 | 13.2%), Education Instruction & Library (621 | 7.3%), Management (575 | 6.7%), Health Diagnosing & Treating (318 | 3.7%), and Computers, Engineering & Science (307 | 3.6%).
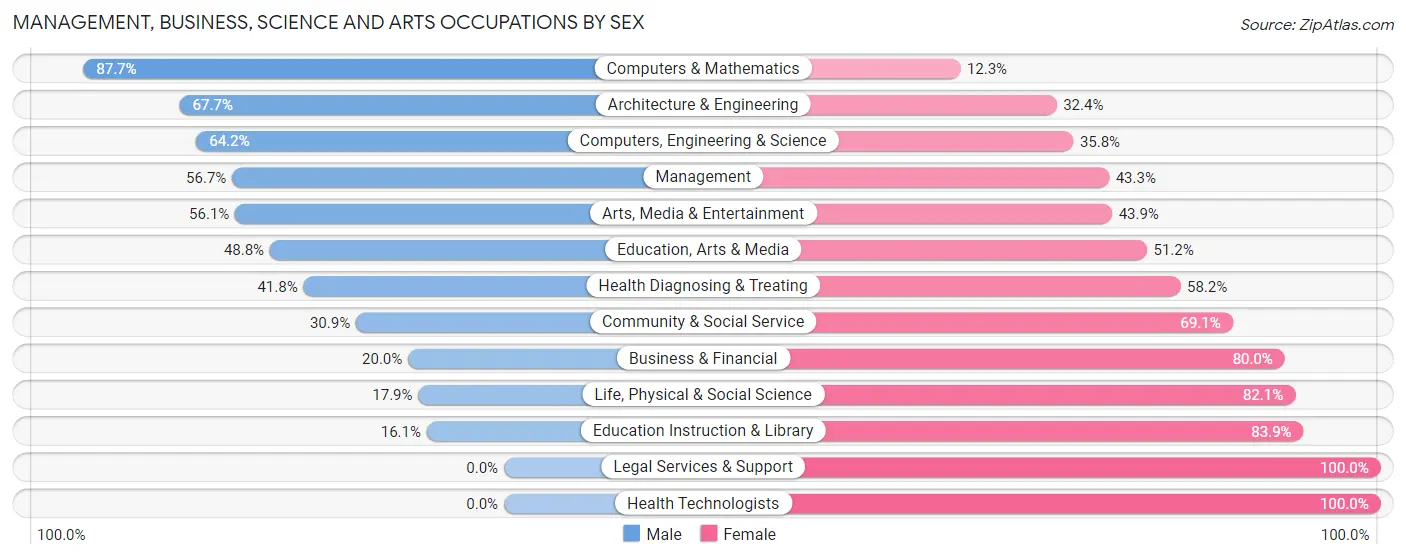
Management, Business, Science and Arts Occupations by Sex
Within the Management, Business, Science and Arts occupations in Roosevelt County, the most male-oriented occupations are Computers & Mathematics (87.7%), Architecture & Engineering (67.6%), and Computers, Engineering & Science (64.2%), while the most female-oriented occupations are Legal Services & Support (100.0%), Health Technologists (100.0%), and Education Instruction & Library (83.9%).
| Occupation | Male | Female |
| Management | 326 (56.7%) | 249 (43.3%) |
| Business & Financial | 45 (20.0%) | 180 (80.0%) |
| Computers, Engineering & Science | 197 (64.2%) | 110 (35.8%) |
| Computers & Mathematics | 136 (87.7%) | 19 (12.3%) |
| Architecture & Engineering | 46 (67.6%) | 22 (32.4%) |
| Life, Physical & Social Science | 15 (17.9%) | 69 (82.1%) |
| Community & Social Service | 346 (30.9%) | 775 (69.1%) |
| Education, Arts & Media | 103 (48.8%) | 108 (51.2%) |
| Legal Services & Support | 0 (0.0%) | 34 (100.0%) |
| Education Instruction & Library | 100 (16.1%) | 521 (83.9%) |
| Arts, Media & Entertainment | 143 (56.1%) | 112 (43.9%) |
| Health Diagnosing & Treating | 133 (41.8%) | 185 (58.2%) |
| Health Technologists | 0 (0.0%) | 164 (100.0%) |
| Total (Category) | 1,047 (41.1%) | 1,499 (58.9%) |
| Total (Overall) | 4,662 (54.7%) | 3,864 (45.3%) |
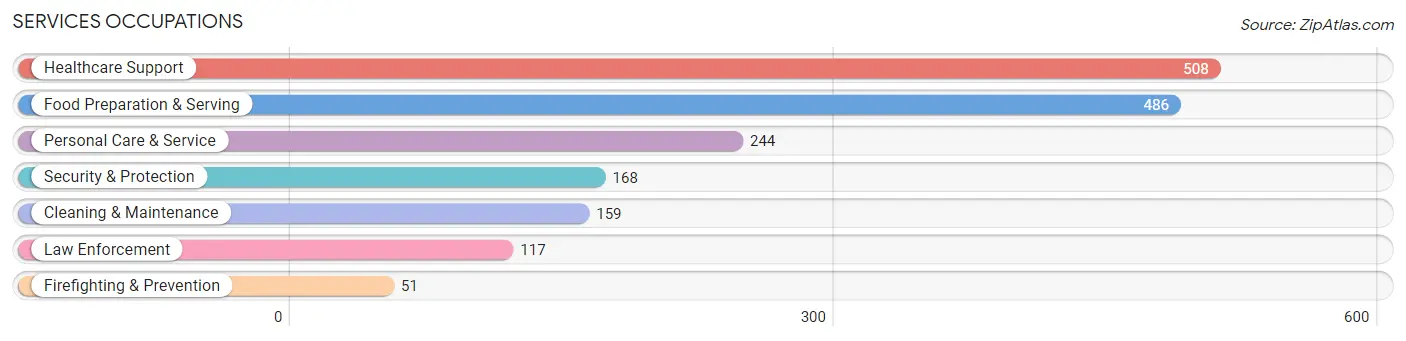
Services Occupations
The most common Services occupations in Roosevelt County are Healthcare Support (508 | 6.0%), Food Preparation & Serving (486 | 5.7%), Personal Care & Service (244 | 2.9%), Security & Protection (168 | 2.0%), and Cleaning & Maintenance (159 | 1.9%).
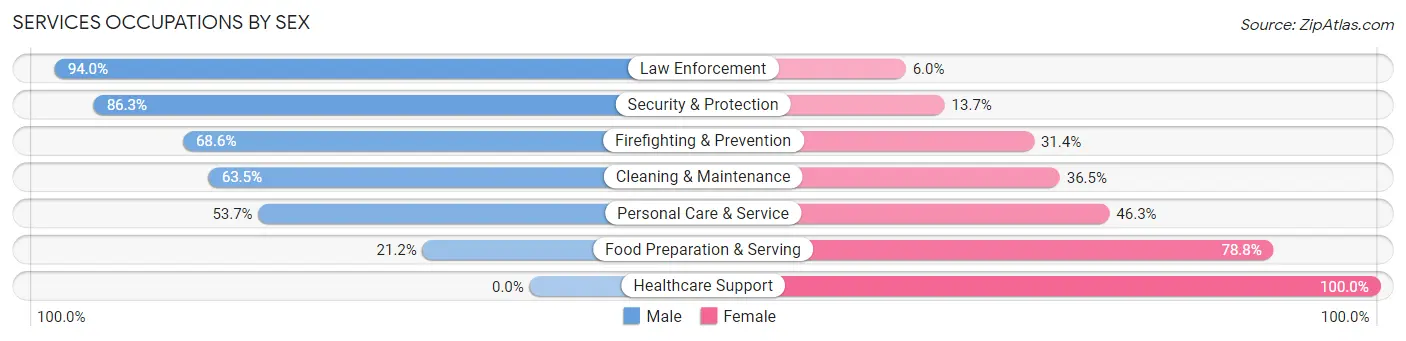
Services Occupations by Sex
Within the Services occupations in Roosevelt County, the most male-oriented occupations are Law Enforcement (94.0%), Security & Protection (86.3%), and Firefighting & Prevention (68.6%), while the most female-oriented occupations are Healthcare Support (100.0%), Food Preparation & Serving (78.8%), and Personal Care & Service (46.3%).
| Occupation | Male | Female |
| Healthcare Support | 0 (0.0%) | 508 (100.0%) |
| Security & Protection | 145 (86.3%) | 23 (13.7%) |
| Firefighting & Prevention | 35 (68.6%) | 16 (31.4%) |
| Law Enforcement | 110 (94.0%) | 7 (6.0%) |
| Food Preparation & Serving | 103 (21.2%) | 383 (78.8%) |
| Cleaning & Maintenance | 101 (63.5%) | 58 (36.5%) |
| Personal Care & Service | 131 (53.7%) | 113 (46.3%) |
| Total (Category) | 480 (30.7%) | 1,085 (69.3%) |
| Total (Overall) | 4,662 (54.7%) | 3,864 (45.3%) |
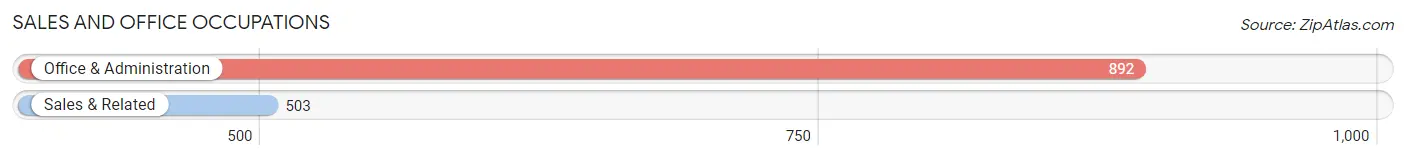
Sales and Office Occupations
The most common Sales and Office occupations in Roosevelt County are Office & Administration (892 | 10.5%), and Sales & Related (503 | 5.9%).
Sales and Office Occupations by Sex
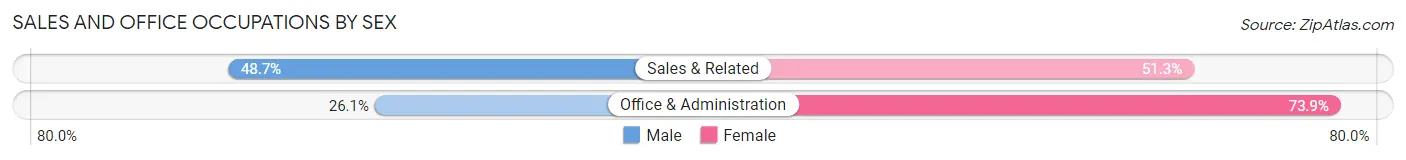
| Occupation | Male | Female |
| Sales & Related | 245 (48.7%) | 258 (51.3%) |
| Office & Administration | 233 (26.1%) | 659 (73.9%) |
| Total (Category) | 478 (34.3%) | 917 (65.7%) |
| Total (Overall) | 4,662 (54.7%) | 3,864 (45.3%) |
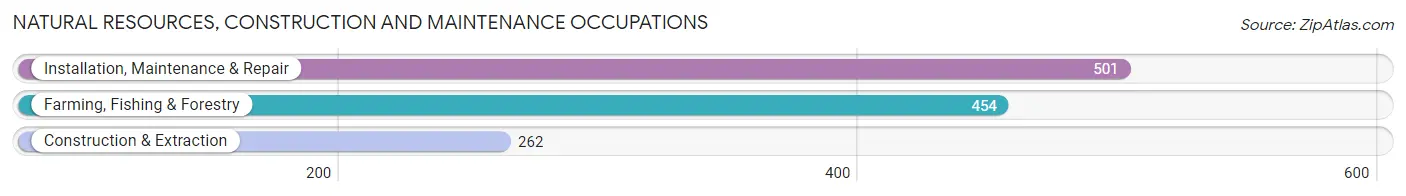
Natural Resources, Construction and Maintenance Occupations
The most common Natural Resources, Construction and Maintenance occupations in Roosevelt County are Installation, Maintenance & Repair (501 | 5.9%), Farming, Fishing & Forestry (454 | 5.3%), and Construction & Extraction (262 | 3.1%).
Natural Resources, Construction and Maintenance Occupations by Sex
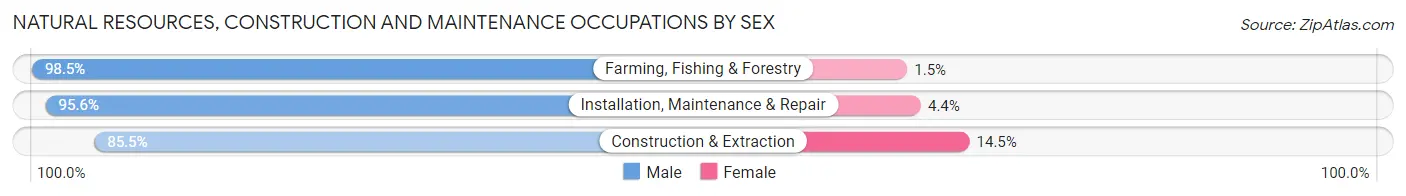
| Occupation | Male | Female |
| Farming, Fishing & Forestry | 447 (98.5%) | 7 (1.5%) |
| Construction & Extraction | 224 (85.5%) | 38 (14.5%) |
| Installation, Maintenance & Repair | 479 (95.6%) | 22 (4.4%) |
| Total (Category) | 1,150 (94.5%) | 67 (5.5%) |
| Total (Overall) | 4,662 (54.7%) | 3,864 (45.3%) |
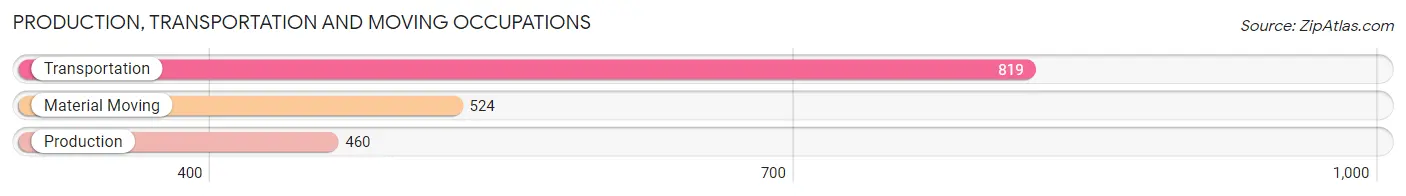
Production, Transportation and Moving Occupations
The most common Production, Transportation and Moving occupations in Roosevelt County are Transportation (819 | 9.6%), Material Moving (524 | 6.1%), and Production (460 | 5.4%).
Production, Transportation and Moving Occupations by Sex
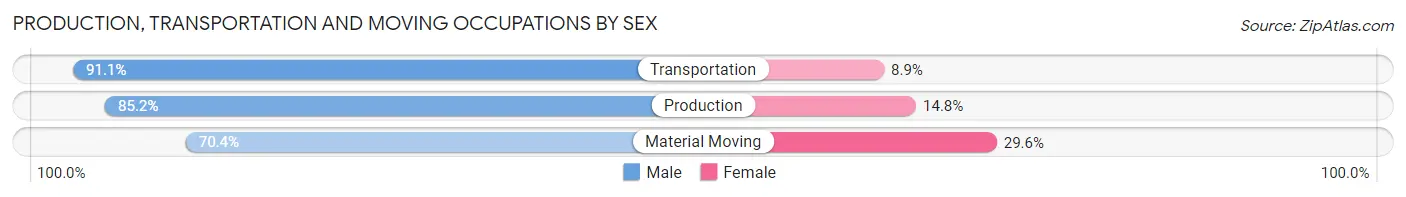
| Occupation | Male | Female |
| Production | 392 (85.2%) | 68 (14.8%) |
| Transportation | 746 (91.1%) | 73 (8.9%) |
| Material Moving | 369 (70.4%) | 155 (29.6%) |
| Total (Category) | 1,507 (83.6%) | 296 (16.4%) |
| Total (Overall) | 4,662 (54.7%) | 3,864 (45.3%) |
Employment Industries by Sex in Roosevelt County
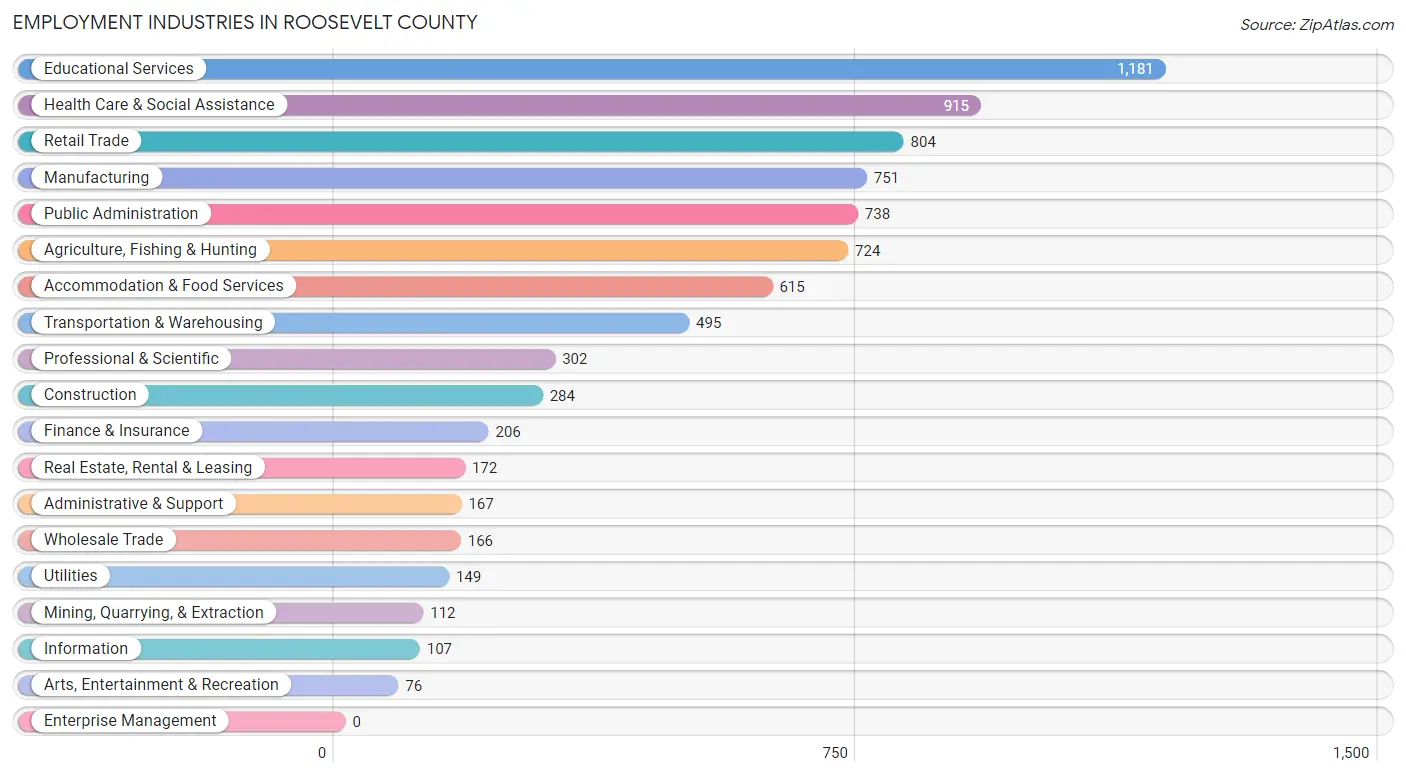
Employment Industries in Roosevelt County
The major employment industries in Roosevelt County include Educational Services (1,181 | 13.9%), Health Care & Social Assistance (915 | 10.7%), Retail Trade (804 | 9.4%), Manufacturing (751 | 8.8%), and Public Administration (738 | 8.7%).
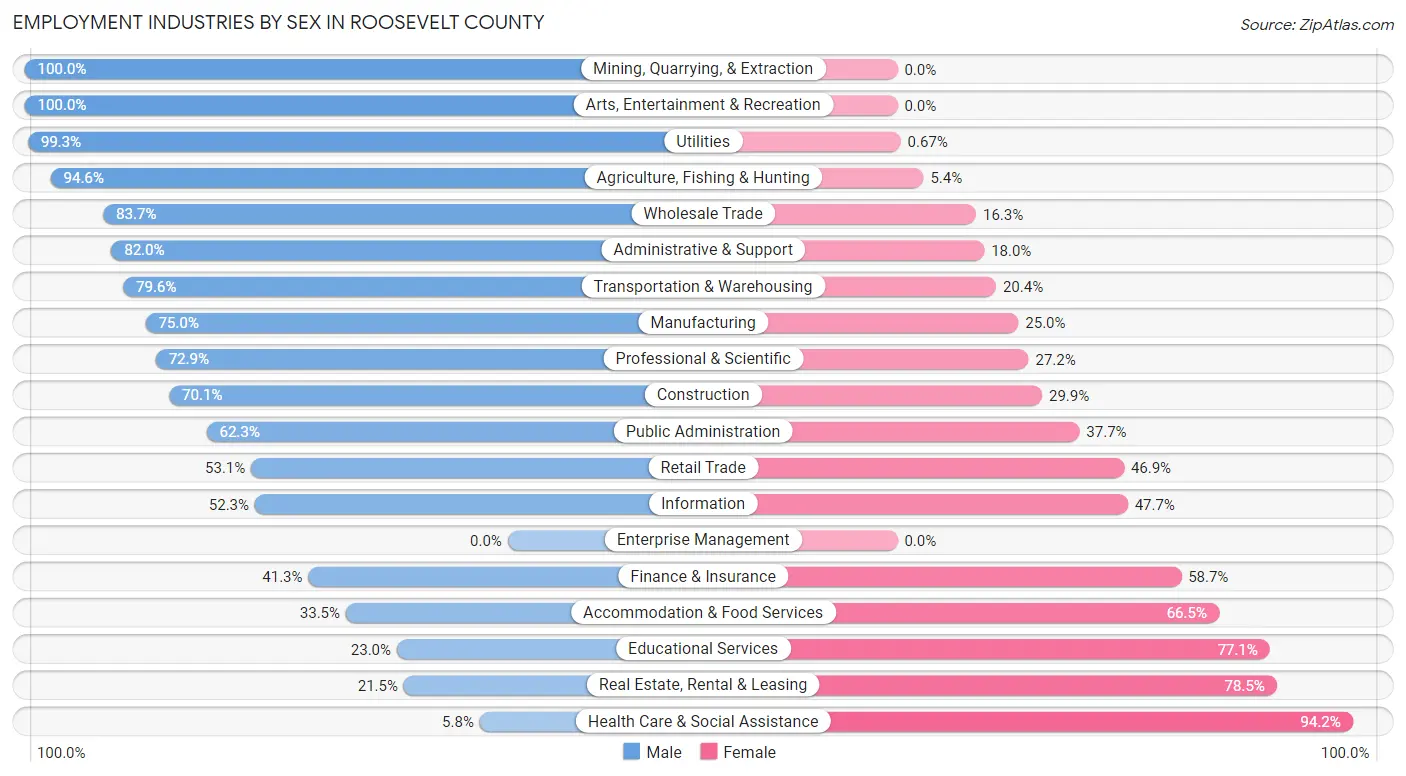
Employment Industries by Sex in Roosevelt County
The Roosevelt County industries that see more men than women are Mining, Quarrying, & Extraction (100.0%), Arts, Entertainment & Recreation (100.0%), and Utilities (99.3%), whereas the industries that tend to have a higher number of women are Health Care & Social Assistance (94.2%), Real Estate, Rental & Leasing (78.5%), and Educational Services (77.0%).
| Industry | Male | Female |
| Agriculture, Fishing & Hunting | 685 (94.6%) | 39 (5.4%) |
| Mining, Quarrying, & Extraction | 112 (100.0%) | 0 (0.0%) |
| Construction | 199 (70.1%) | 85 (29.9%) |
| Manufacturing | 563 (75.0%) | 188 (25.0%) |
| Wholesale Trade | 139 (83.7%) | 27 (16.3%) |
| Retail Trade | 427 (53.1%) | 377 (46.9%) |
| Transportation & Warehousing | 394 (79.6%) | 101 (20.4%) |
| Utilities | 148 (99.3%) | 1 (0.7%) |
| Information | 56 (52.3%) | 51 (47.7%) |
| Finance & Insurance | 85 (41.3%) | 121 (58.7%) |
| Real Estate, Rental & Leasing | 37 (21.5%) | 135 (78.5%) |
| Professional & Scientific | 220 (72.9%) | 82 (27.2%) |
| Enterprise Management | 0 (0.0%) | 0 (0.0%) |
| Administrative & Support | 137 (82.0%) | 30 (18.0%) |
| Educational Services | 271 (23.0%) | 910 (77.0%) |
| Health Care & Social Assistance | 53 (5.8%) | 862 (94.2%) |
| Arts, Entertainment & Recreation | 76 (100.0%) | 0 (0.0%) |
| Accommodation & Food Services | 206 (33.5%) | 409 (66.5%) |
| Public Administration | 460 (62.3%) | 278 (37.7%) |
| Total | 4,662 (54.7%) | 3,864 (45.3%) |
Education in Roosevelt County
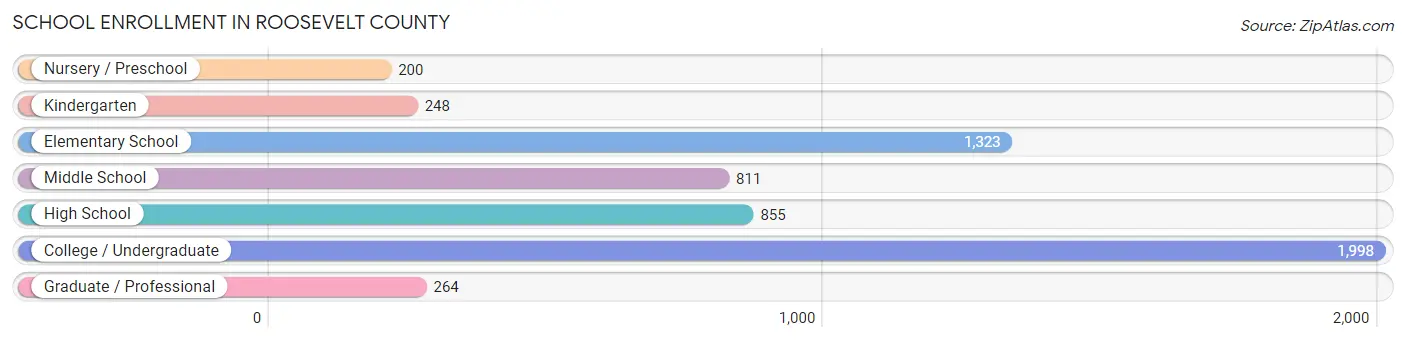
School Enrollment in Roosevelt County
The most common levels of schooling among the 5,699 students in Roosevelt County are college / undergraduate (1,998 | 35.1%), elementary school (1,323 | 23.2%), and high school (855 | 15.0%).
| School Level | # Students | % Students |
| Nursery / Preschool | 200 | 3.5% |
| Kindergarten | 248 | 4.3% |
| Elementary School | 1,323 | 23.2% |
| Middle School | 811 | 14.2% |
| High School | 855 | 15.0% |
| College / Undergraduate | 1,998 | 35.1% |
| Graduate / Professional | 264 | 4.6% |
| Total | 5,699 | 100.0% |
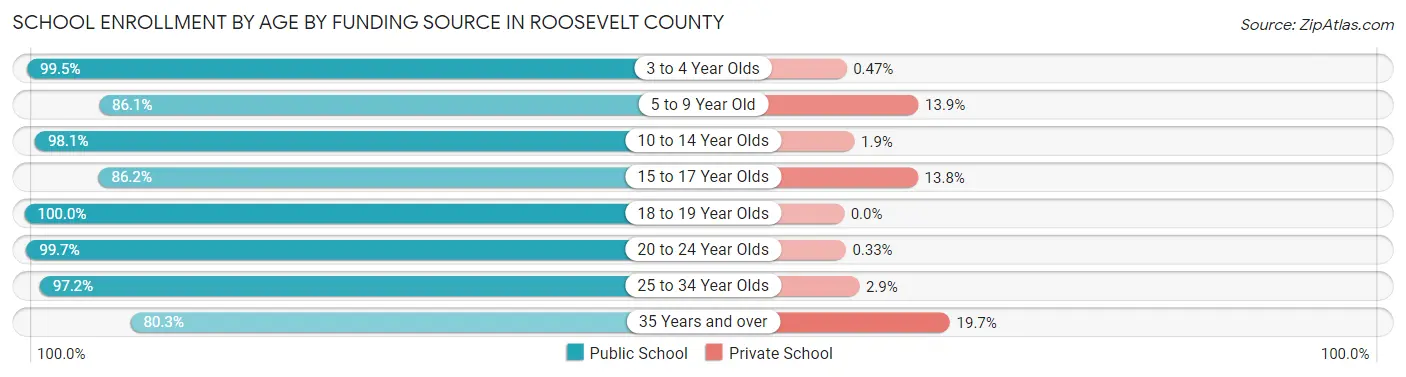
School Enrollment by Age by Funding Source in Roosevelt County
Out of a total of 5,699 students who are enrolled in schools in Roosevelt County, 365 (6.4%) attend a private institution, while the remaining 5,334 (93.6%) are enrolled in public schools. The age group of 35 years and over has the highest likelihood of being enrolled in private schools, with 44 (19.7% in the age bracket) enrolled. Conversely, the age group of 18 to 19 year olds has the lowest likelihood of being enrolled in a private school, with 608 (100.0% in the age bracket) attending a public institution.
| Age Bracket | Public School | Private School |
| 3 to 4 Year Olds | 210 (99.5%) | 1 (0.5%) |
| 5 to 9 Year Old | 1,130 (86.1%) | 182 (13.9%) |
| 10 to 14 Year Olds | 1,110 (98.1%) | 22 (1.9%) |
| 15 to 17 Year Olds | 632 (86.2%) | 101 (13.8%) |
| 18 to 19 Year Olds | 608 (100.0%) | 0 (0.0%) |
| 20 to 24 Year Olds | 1,195 (99.7%) | 4 (0.3%) |
| 25 to 34 Year Olds | 273 (97.2%) | 8 (2.9%) |
| 35 Years and over | 179 (80.3%) | 44 (19.7%) |
| Total | 5,334 (93.6%) | 365 (6.4%) |
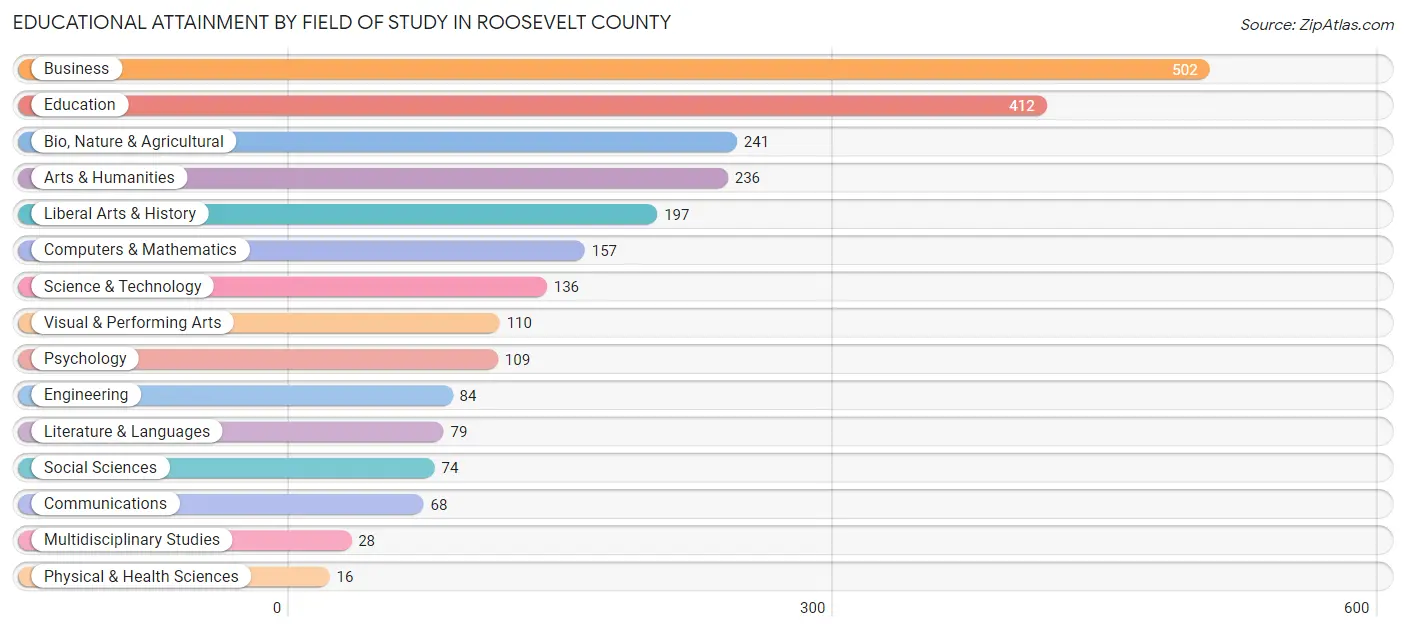
Educational Attainment by Field of Study in Roosevelt County
Business (502 | 20.5%), education (412 | 16.8%), bio, nature & agricultural (241 | 9.8%), arts & humanities (236 | 9.6%), and liberal arts & history (197 | 8.0%) are the most common fields of study among 2,449 individuals in Roosevelt County who have obtained a bachelor's degree or higher.
| Field of Study | # Graduates | % Graduates |
| Computers & Mathematics | 157 | 6.4% |
| Bio, Nature & Agricultural | 241 | 9.8% |
| Physical & Health Sciences | 16 | 0.6% |
| Psychology | 109 | 4.4% |
| Social Sciences | 74 | 3.0% |
| Engineering | 84 | 3.4% |
| Multidisciplinary Studies | 28 | 1.1% |
| Science & Technology | 136 | 5.6% |
| Business | 502 | 20.5% |
| Education | 412 | 16.8% |
| Literature & Languages | 79 | 3.2% |
| Liberal Arts & History | 197 | 8.0% |
| Visual & Performing Arts | 110 | 4.5% |
| Communications | 68 | 2.8% |
| Arts & Humanities | 236 | 9.6% |
| Total | 2,449 | 100.0% |
Transportation & Commute in Roosevelt County
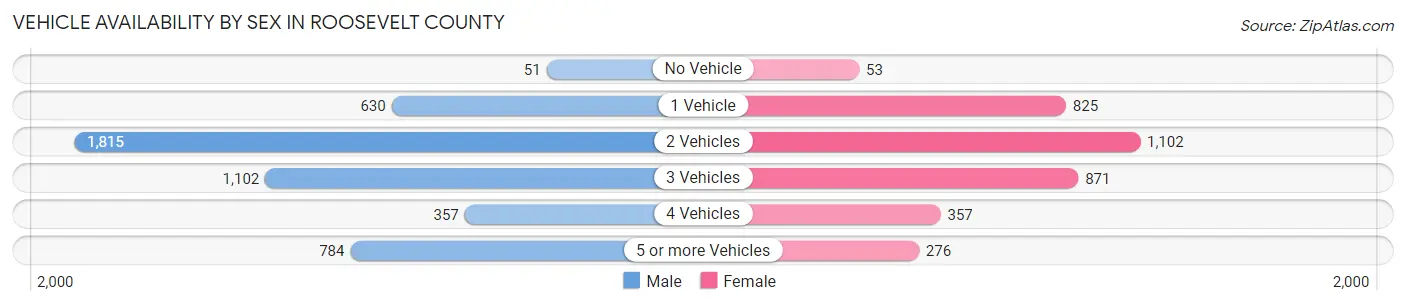
Vehicle Availability by Sex in Roosevelt County
The most prevalent vehicle ownership categories in Roosevelt County are males with 2 vehicles (1,815, accounting for 38.3%) and females with 2 vehicles (1,102, making up 52.1%).
| Vehicles Available | Male | Female |
| No Vehicle | 51 (1.1%) | 53 (1.5%) |
| 1 Vehicle | 630 (13.3%) | 825 (23.7%) |
| 2 Vehicles | 1,815 (38.3%) | 1,102 (31.6%) |
| 3 Vehicles | 1,102 (23.3%) | 871 (25.0%) |
| 4 Vehicles | 357 (7.5%) | 357 (10.2%) |
| 5 or more Vehicles | 784 (16.5%) | 276 (7.9%) |
| Total | 4,739 (100.0%) | 3,484 (100.0%) |
Commute Time in Roosevelt County
The most frequently occuring commute durations in Roosevelt County are 5 to 9 minutes (2,148 commuters, 25.8%), 10 to 14 minutes (1,547 commuters, 18.5%), and less than 5 minutes (1,258 commuters, 15.1%).
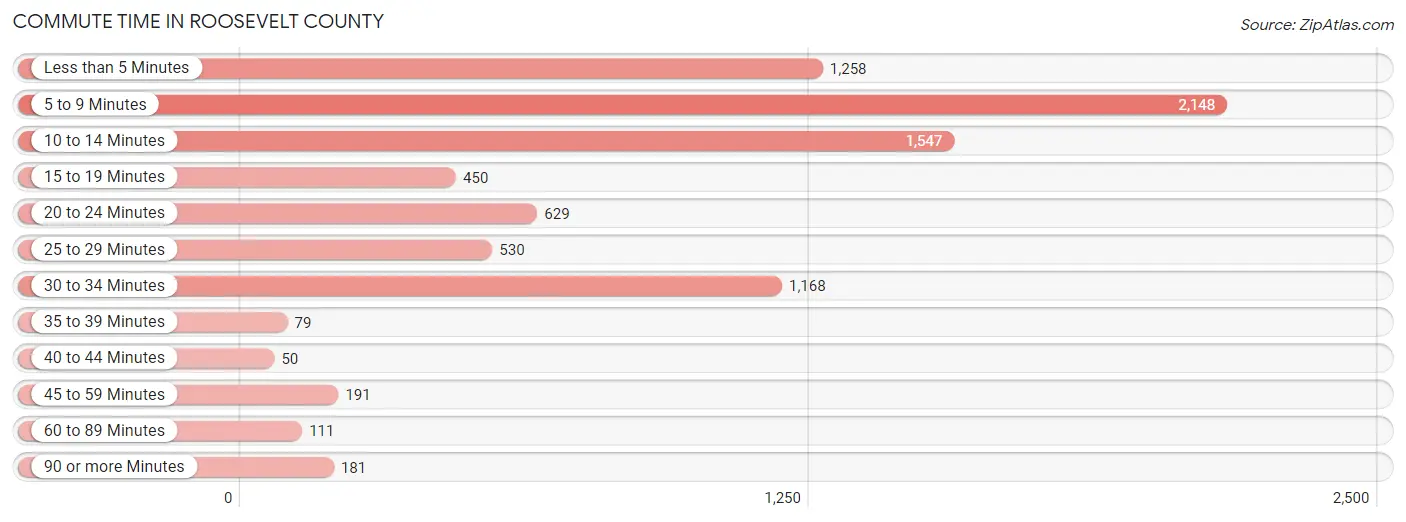
| Commute Time | # Commuters | % Commuters |
| Less than 5 Minutes | 1,258 | 15.1% |
| 5 to 9 Minutes | 2,148 | 25.8% |
| 10 to 14 Minutes | 1,547 | 18.5% |
| 15 to 19 Minutes | 450 | 5.4% |
| 20 to 24 Minutes | 629 | 7.5% |
| 25 to 29 Minutes | 530 | 6.4% |
| 30 to 34 Minutes | 1,168 | 14.0% |
| 35 to 39 Minutes | 79 | 0.9% |
| 40 to 44 Minutes | 50 | 0.6% |
| 45 to 59 Minutes | 191 | 2.3% |
| 60 to 89 Minutes | 111 | 1.3% |
| 90 or more Minutes | 181 | 2.2% |
Commute Time by Sex in Roosevelt County
The most common commute times in Roosevelt County are 5 to 9 minutes (1,214 commuters, 25.7%) for males and 5 to 9 minutes (934 commuters, 25.9%) for females.
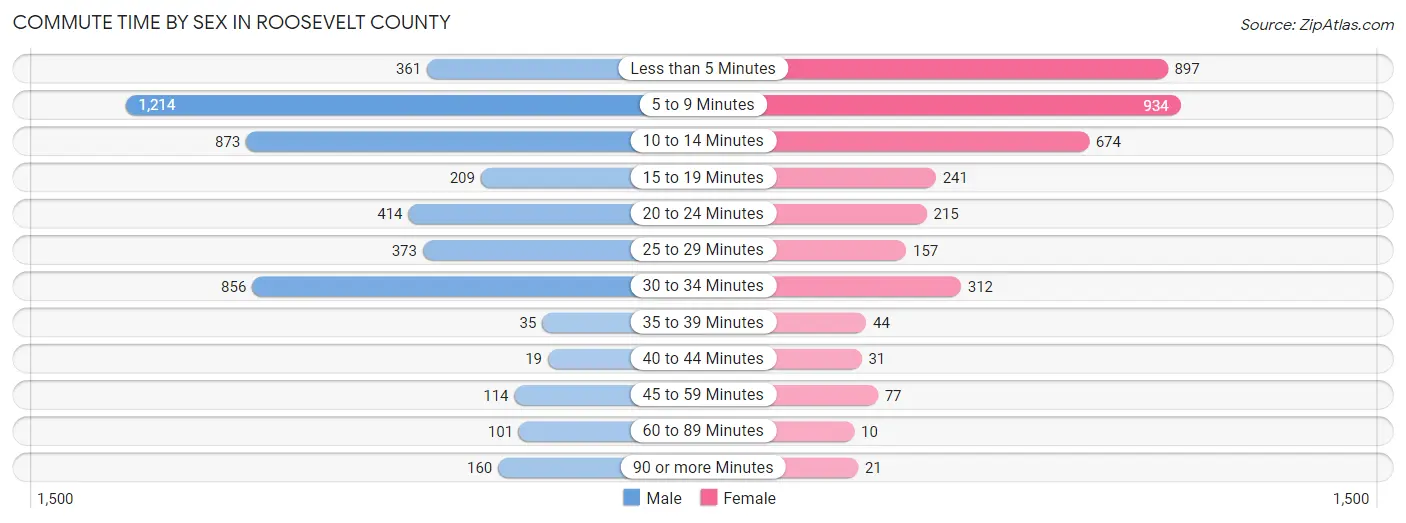
| Commute Time | Male | Female |
| Less than 5 Minutes | 361 (7.6%) | 897 (24.8%) |
| 5 to 9 Minutes | 1,214 (25.7%) | 934 (25.9%) |
| 10 to 14 Minutes | 873 (18.5%) | 674 (18.6%) |
| 15 to 19 Minutes | 209 (4.4%) | 241 (6.7%) |
| 20 to 24 Minutes | 414 (8.7%) | 215 (5.9%) |
| 25 to 29 Minutes | 373 (7.9%) | 157 (4.3%) |
| 30 to 34 Minutes | 856 (18.1%) | 312 (8.6%) |
| 35 to 39 Minutes | 35 (0.7%) | 44 (1.2%) |
| 40 to 44 Minutes | 19 (0.4%) | 31 (0.9%) |
| 45 to 59 Minutes | 114 (2.4%) | 77 (2.1%) |
| 60 to 89 Minutes | 101 (2.1%) | 10 (0.3%) |
| 90 or more Minutes | 160 (3.4%) | 21 (0.6%) |
Time of Departure to Work by Sex in Roosevelt County
The most frequent times of departure to work in Roosevelt County are 6:00 AM to 6:29 AM (724, 15.3%) for males and 7:30 AM to 7:59 AM (847, 23.4%) for females.
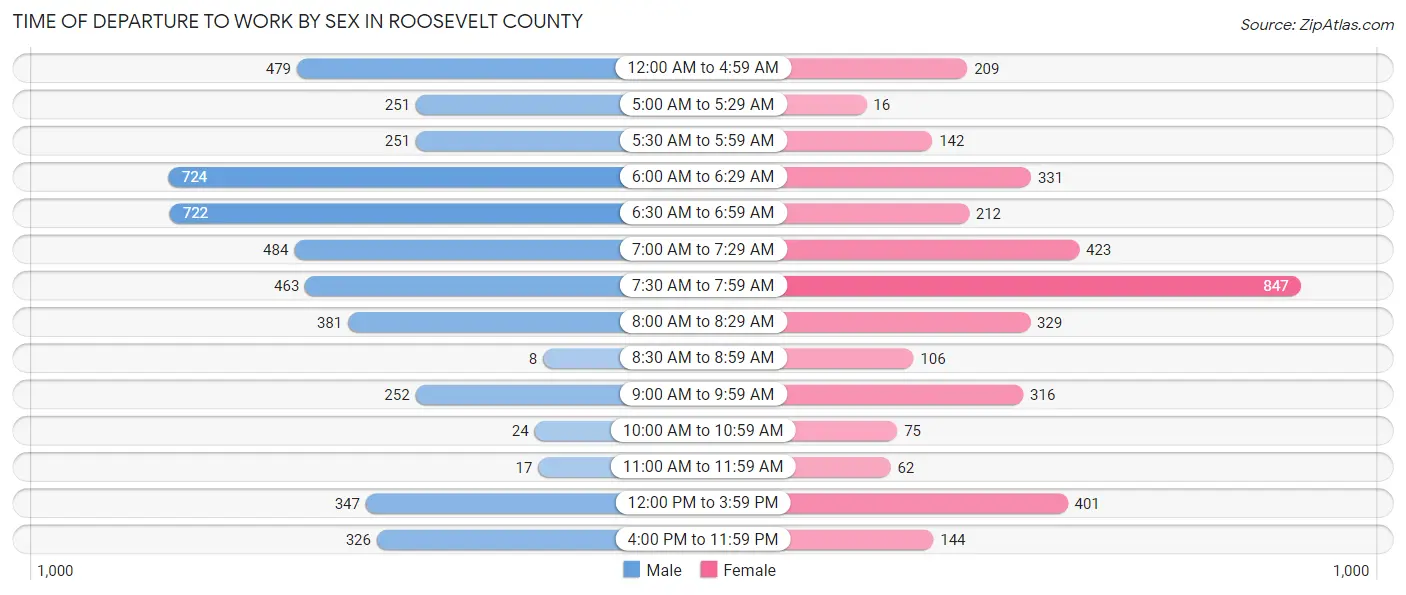
| Time of Departure | Male | Female |
| 12:00 AM to 4:59 AM | 479 (10.1%) | 209 (5.8%) |
| 5:00 AM to 5:29 AM | 251 (5.3%) | 16 (0.4%) |
| 5:30 AM to 5:59 AM | 251 (5.3%) | 142 (3.9%) |
| 6:00 AM to 6:29 AM | 724 (15.3%) | 331 (9.2%) |
| 6:30 AM to 6:59 AM | 722 (15.3%) | 212 (5.9%) |
| 7:00 AM to 7:29 AM | 484 (10.2%) | 423 (11.7%) |
| 7:30 AM to 7:59 AM | 463 (9.8%) | 847 (23.4%) |
| 8:00 AM to 8:29 AM | 381 (8.1%) | 329 (9.1%) |
| 8:30 AM to 8:59 AM | 8 (0.2%) | 106 (2.9%) |
| 9:00 AM to 9:59 AM | 252 (5.3%) | 316 (8.7%) |
| 10:00 AM to 10:59 AM | 24 (0.5%) | 75 (2.1%) |
| 11:00 AM to 11:59 AM | 17 (0.4%) | 62 (1.7%) |
| 12:00 PM to 3:59 PM | 347 (7.3%) | 401 (11.1%) |
| 4:00 PM to 11:59 PM | 326 (6.9%) | 144 (4.0%) |
| Total | 4,729 (100.0%) | 3,613 (100.0%) |
Housing Occupancy in Roosevelt County
Occupancy by Ownership in Roosevelt County
Of the total 6,961 dwellings in Roosevelt County, owner-occupied units account for 4,183 (60.1%), while renter-occupied units make up 2,778 (39.9%).
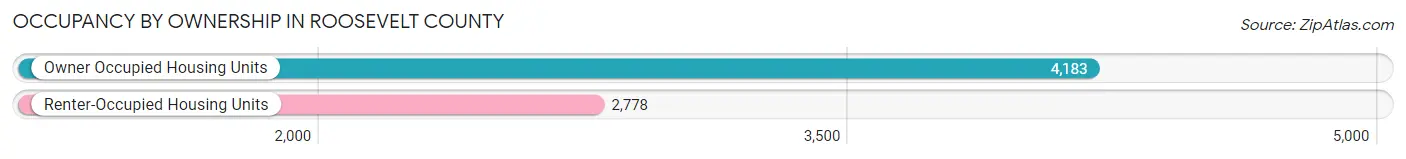
| Occupancy | # Housing Units | % Housing Units |
| Owner Occupied Housing Units | 4,183 | 60.1% |
| Renter-Occupied Housing Units | 2,778 | 39.9% |
| Total Occupied Housing Units | 6,961 | 100.0% |
Occupancy by Household Size in Roosevelt County
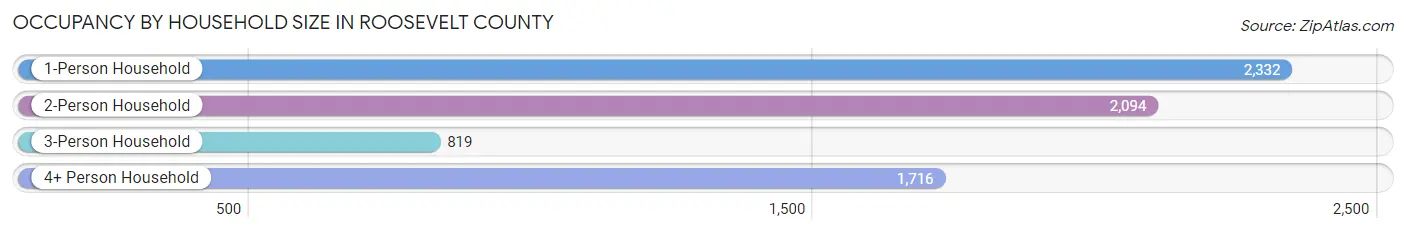
| Household Size | # Housing Units | % Housing Units |
| 1-Person Household | 2,332 | 33.5% |
| 2-Person Household | 2,094 | 30.1% |
| 3-Person Household | 819 | 11.8% |
| 4+ Person Household | 1,716 | 24.6% |
| Total Housing Units | 6,961 | 100.0% |
Occupancy by Ownership by Household Size in Roosevelt County
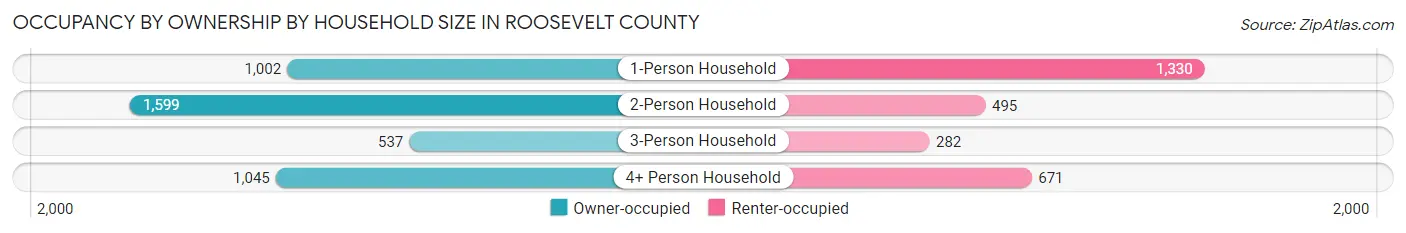
| Household Size | Owner-occupied | Renter-occupied |
| 1-Person Household | 1,002 (43.0%) | 1,330 (57.0%) |
| 2-Person Household | 1,599 (76.4%) | 495 (23.6%) |
| 3-Person Household | 537 (65.6%) | 282 (34.4%) |
| 4+ Person Household | 1,045 (60.9%) | 671 (39.1%) |
| Total Housing Units | 4,183 (60.1%) | 2,778 (39.9%) |
Occupancy by Educational Attainment in Roosevelt County
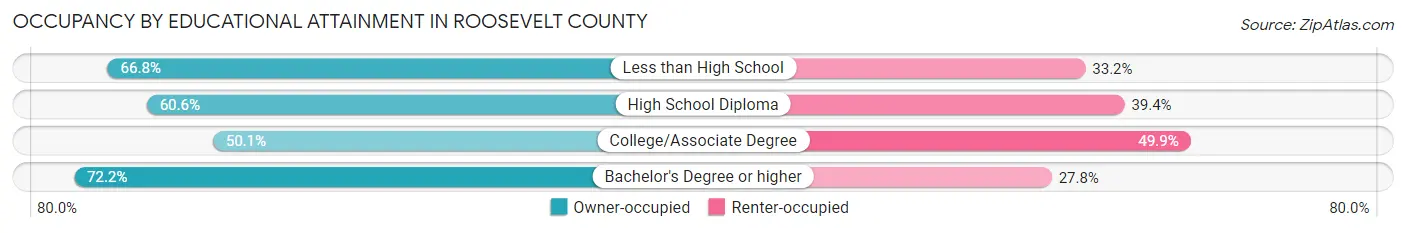
| Household Size | Owner-occupied | Renter-occupied |
| Less than High School | 431 (66.8%) | 214 (33.2%) |
| High School Diploma | 1,321 (60.6%) | 858 (39.4%) |
| College/Associate Degree | 1,262 (50.1%) | 1,255 (49.9%) |
| Bachelor's Degree or higher | 1,169 (72.2%) | 451 (27.8%) |
Occupancy by Age of Householder in Roosevelt County
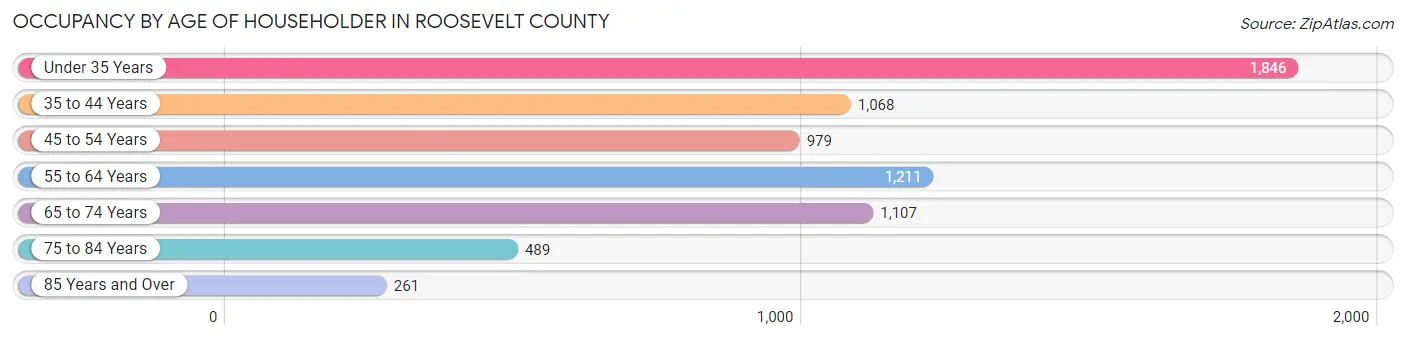
| Age Bracket | # Households | % Households |
| Under 35 Years | 1,846 | 26.5% |
| 35 to 44 Years | 1,068 | 15.3% |
| 45 to 54 Years | 979 | 14.1% |
| 55 to 64 Years | 1,211 | 17.4% |
| 65 to 74 Years | 1,107 | 15.9% |
| 75 to 84 Years | 489 | 7.0% |
| 85 Years and Over | 261 | 3.7% |
| Total | 6,961 | 100.0% |
Housing Finances in Roosevelt County
Median Income by Occupancy in Roosevelt County
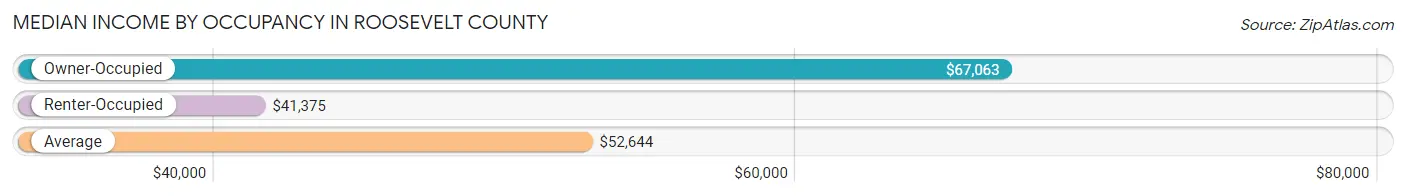
| Occupancy Type | # Households | Median Income |
| Owner-Occupied | 4,183 (60.1%) | $67,063 |
| Renter-Occupied | 2,778 (39.9%) | $41,375 |
| Average | 6,961 (100.0%) | $52,644 |
Occupancy by Householder Income Bracket in Roosevelt County
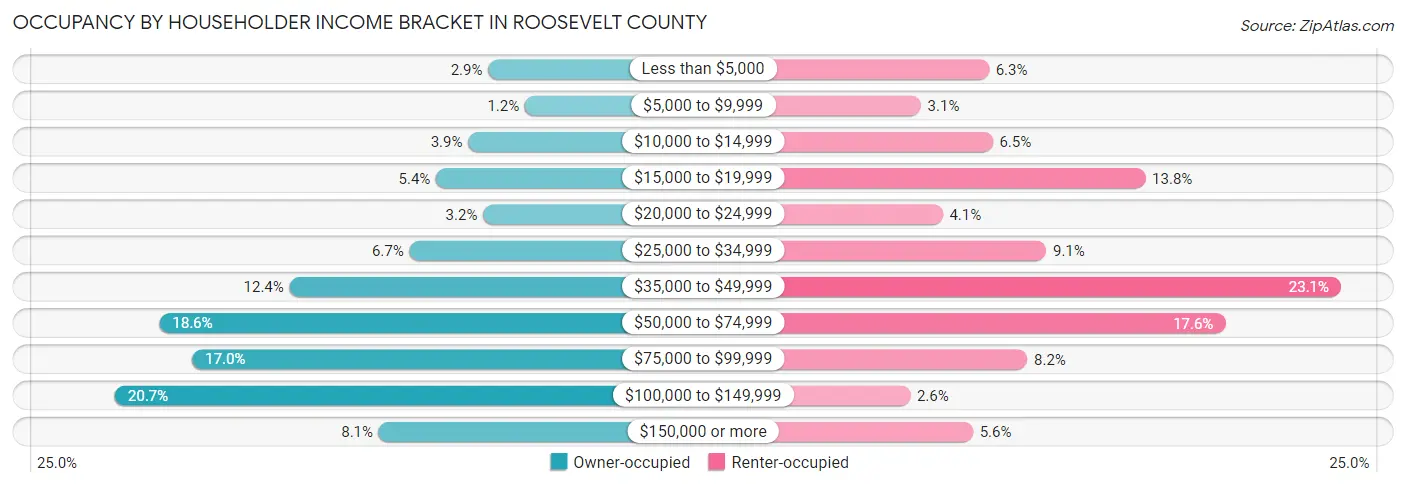
| Income Bracket | Owner-occupied | Renter-occupied |
| Less than $5,000 | 122 (2.9%) | 176 (6.3%) |
| $5,000 to $9,999 | 49 (1.2%) | 86 (3.1%) |
| $10,000 to $14,999 | 162 (3.9%) | 181 (6.5%) |
| $15,000 to $19,999 | 226 (5.4%) | 383 (13.8%) |
| $20,000 to $24,999 | 132 (3.2%) | 115 (4.1%) |
| $25,000 to $34,999 | 279 (6.7%) | 252 (9.1%) |
| $35,000 to $49,999 | 518 (12.4%) | 642 (23.1%) |
| $50,000 to $74,999 | 777 (18.6%) | 489 (17.6%) |
| $75,000 to $99,999 | 712 (17.0%) | 227 (8.2%) |
| $100,000 to $149,999 | 866 (20.7%) | 72 (2.6%) |
| $150,000 or more | 340 (8.1%) | 155 (5.6%) |
| Total | 4,183 (100.0%) | 2,778 (100.0%) |
Monthly Housing Cost Tiers in Roosevelt County
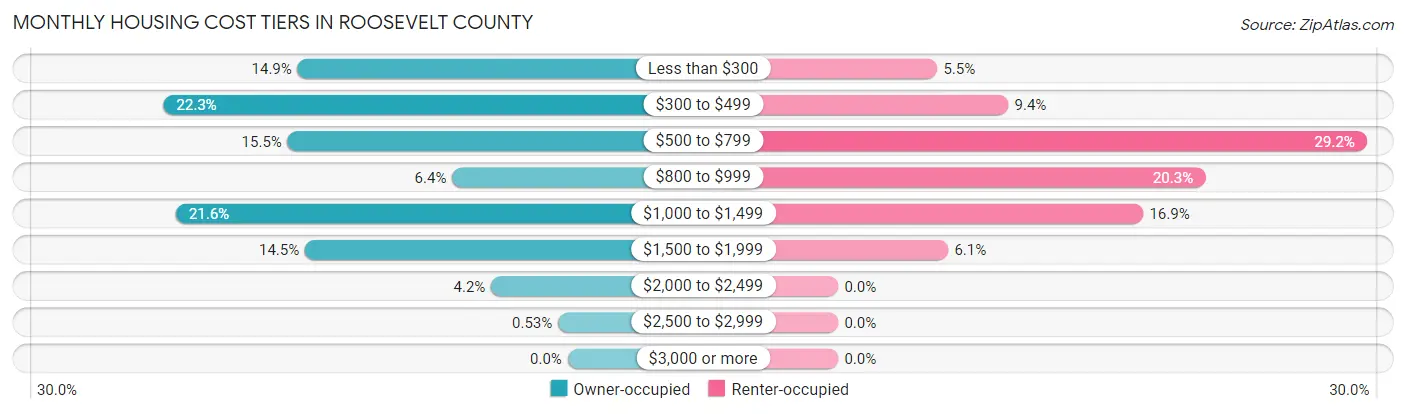
| Monthly Cost | Owner-occupied | Renter-occupied |
| Less than $300 | 624 (14.9%) | 152 (5.5%) |
| $300 to $499 | 934 (22.3%) | 261 (9.4%) |
| $500 to $799 | 647 (15.5%) | 812 (29.2%) |
| $800 to $999 | 267 (6.4%) | 564 (20.3%) |
| $1,000 to $1,499 | 905 (21.6%) | 468 (16.9%) |
| $1,500 to $1,999 | 607 (14.5%) | 169 (6.1%) |
| $2,000 to $2,499 | 177 (4.2%) | 0 (0.0%) |
| $2,500 to $2,999 | 22 (0.5%) | 0 (0.0%) |
| $3,000 or more | 0 (0.0%) | 0 (0.0%) |
| Total | 4,183 (100.0%) | 2,778 (100.0%) |
Physical Housing Characteristics in Roosevelt County
Housing Structures in Roosevelt County
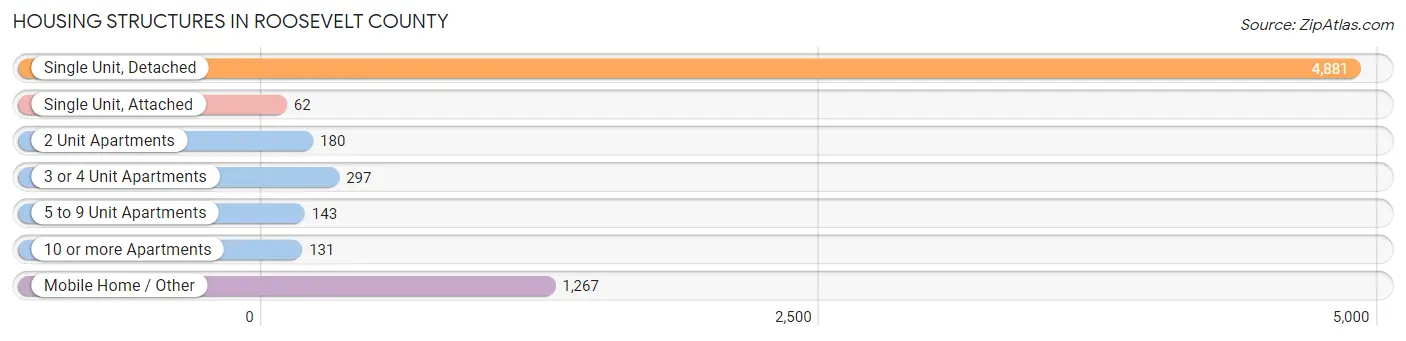
| Structure Type | # Housing Units | % Housing Units |
| Single Unit, Detached | 4,881 | 70.1% |
| Single Unit, Attached | 62 | 0.9% |
| 2 Unit Apartments | 180 | 2.6% |
| 3 or 4 Unit Apartments | 297 | 4.3% |
| 5 to 9 Unit Apartments | 143 | 2.1% |
| 10 or more Apartments | 131 | 1.9% |
| Mobile Home / Other | 1,267 | 18.2% |
| Total | 6,961 | 100.0% |
Housing Structures by Occupancy in Roosevelt County
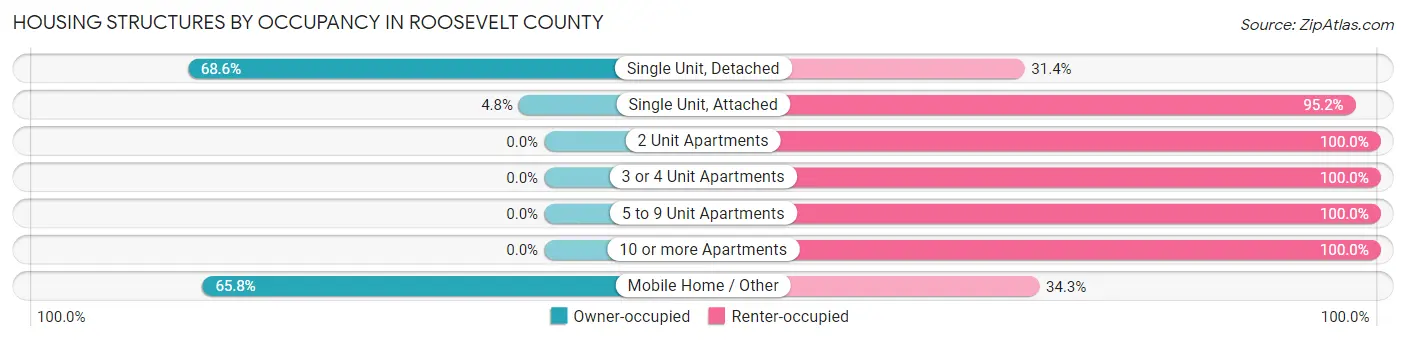
| Structure Type | Owner-occupied | Renter-occupied |
| Single Unit, Detached | 3,347 (68.6%) | 1,534 (31.4%) |
| Single Unit, Attached | 3 (4.8%) | 59 (95.2%) |
| 2 Unit Apartments | 0 (0.0%) | 180 (100.0%) |
| 3 or 4 Unit Apartments | 0 (0.0%) | 297 (100.0%) |
| 5 to 9 Unit Apartments | 0 (0.0%) | 143 (100.0%) |
| 10 or more Apartments | 0 (0.0%) | 131 (100.0%) |
| Mobile Home / Other | 833 (65.7%) | 434 (34.3%) |
| Total | 4,183 (60.1%) | 2,778 (39.9%) |
Housing Structures by Number of Rooms in Roosevelt County
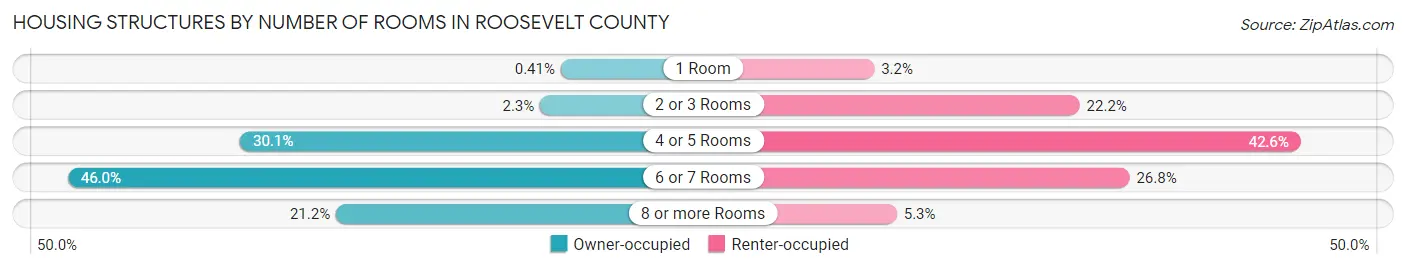
| Number of Rooms | Owner-occupied | Renter-occupied |
| 1 Room | 17 (0.4%) | 88 (3.2%) |
| 2 or 3 Rooms | 97 (2.3%) | 616 (22.2%) |
| 4 or 5 Rooms | 1,258 (30.1%) | 1,184 (42.6%) |
| 6 or 7 Rooms | 1,924 (46.0%) | 744 (26.8%) |
| 8 or more Rooms | 887 (21.2%) | 146 (5.3%) |
| Total | 4,183 (100.0%) | 2,778 (100.0%) |
Housing Structure by Heating Type in Roosevelt County
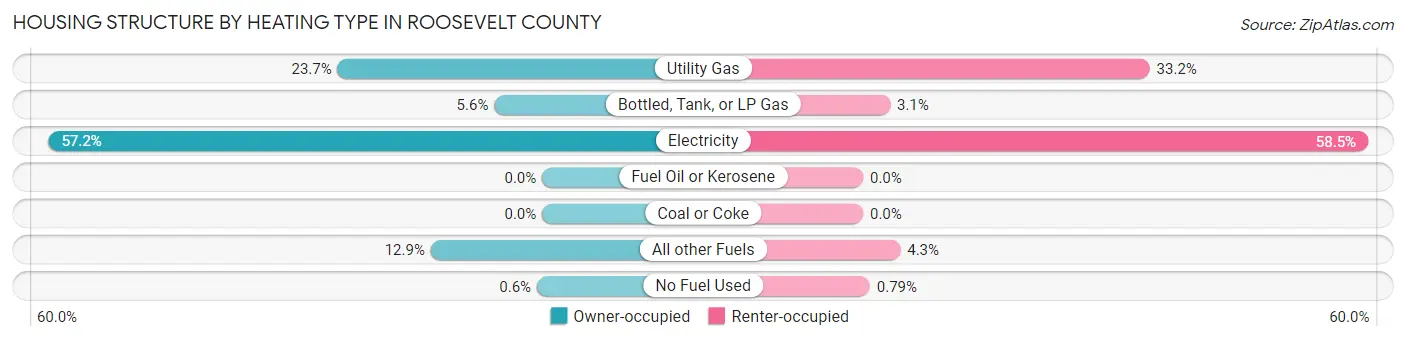
| Heating Type | Owner-occupied | Renter-occupied |
| Utility Gas | 992 (23.7%) | 923 (33.2%) |
| Bottled, Tank, or LP Gas | 232 (5.6%) | 87 (3.1%) |
| Electricity | 2,394 (57.2%) | 1,626 (58.5%) |
| Fuel Oil or Kerosene | 0 (0.0%) | 0 (0.0%) |
| Coal or Coke | 0 (0.0%) | 0 (0.0%) |
| All other Fuels | 540 (12.9%) | 120 (4.3%) |
| No Fuel Used | 25 (0.6%) | 22 (0.8%) |
| Total | 4,183 (100.0%) | 2,778 (100.0%) |
Household Vehicle Usage in Roosevelt County
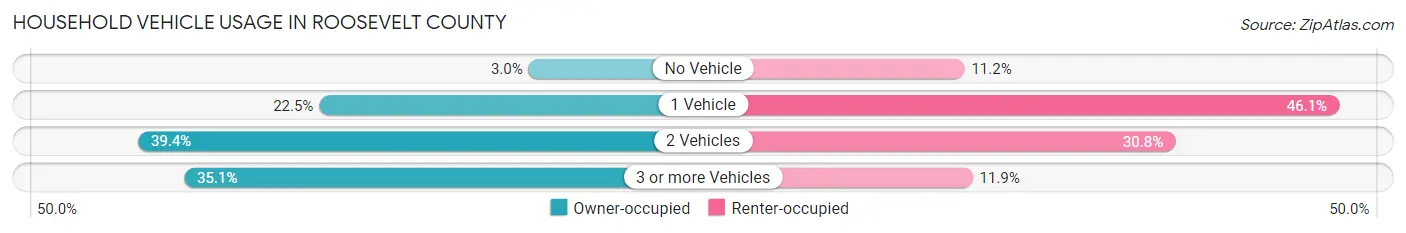
| Vehicles per Household | Owner-occupied | Renter-occupied |
| No Vehicle | 124 (3.0%) | 310 (11.2%) |
| 1 Vehicle | 941 (22.5%) | 1,281 (46.1%) |
| 2 Vehicles | 1,649 (39.4%) | 856 (30.8%) |
| 3 or more Vehicles | 1,469 (35.1%) | 331 (11.9%) |
| Total | 4,183 (100.0%) | 2,778 (100.0%) |
Real Estate & Mortgages in Roosevelt County
Real Estate and Mortgage Overview in Roosevelt County
| Characteristic | Without Mortgage | With Mortgage |
| Housing Units | 2,035 | 2,148 |
| Median Property Value | $83,300 | $173,100 |
| Median Household Income | $56,445 | $255 |
| Monthly Housing Costs | $368 | $0 |
| Real Estate Taxes | $435 | $196 |
Property Value by Mortgage Status in Roosevelt County
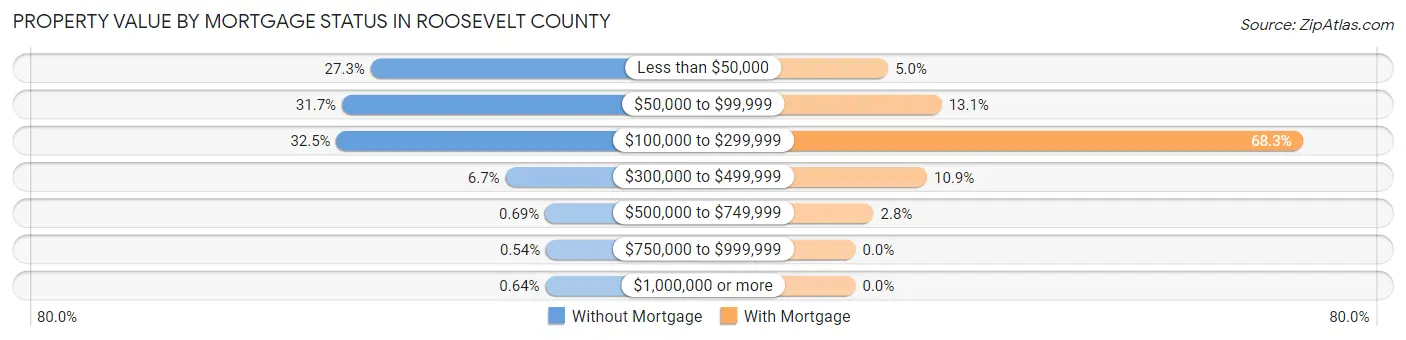
| Property Value | Without Mortgage | With Mortgage |
| Less than $50,000 | 555 (27.3%) | 107 (5.0%) |
| $50,000 to $99,999 | 644 (31.7%) | 282 (13.1%) |
| $100,000 to $299,999 | 661 (32.5%) | 1,466 (68.2%) |
| $300,000 to $499,999 | 137 (6.7%) | 234 (10.9%) |
| $500,000 to $749,999 | 14 (0.7%) | 59 (2.8%) |
| $750,000 to $999,999 | 11 (0.5%) | 0 (0.0%) |
| $1,000,000 or more | 13 (0.6%) | 0 (0.0%) |
| Total | 2,035 (100.0%) | 2,148 (100.0%) |
Household Income by Mortgage Status in Roosevelt County
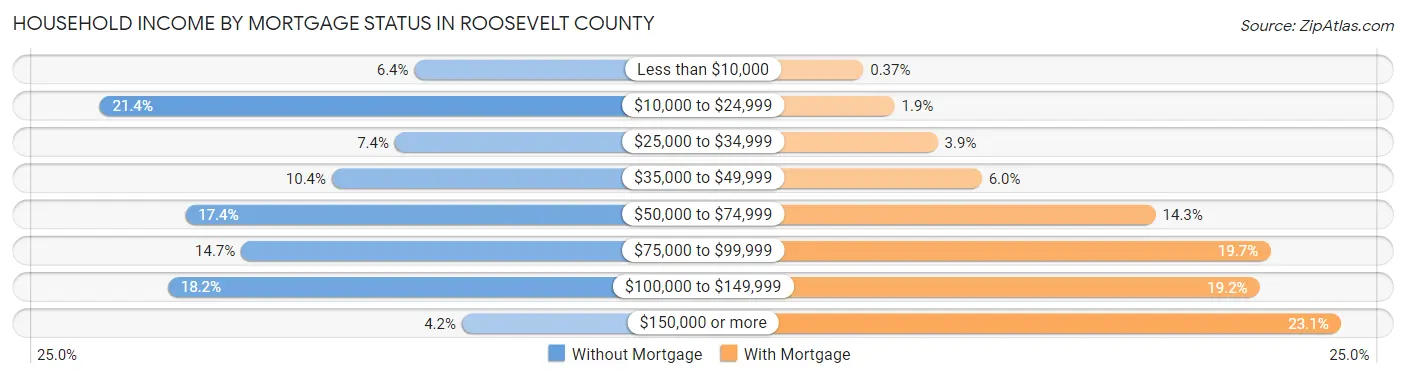
| Household Income | Without Mortgage | With Mortgage |
| Less than $10,000 | 131 (6.4%) | 8 (0.4%) |
| $10,000 to $24,999 | 436 (21.4%) | 40 (1.9%) |
| $25,000 to $34,999 | 150 (7.4%) | 84 (3.9%) |
| $35,000 to $49,999 | 211 (10.4%) | 129 (6.0%) |
| $50,000 to $74,999 | 353 (17.3%) | 307 (14.3%) |
| $75,000 to $99,999 | 299 (14.7%) | 424 (19.7%) |
| $100,000 to $149,999 | 370 (18.2%) | 413 (19.2%) |
| $150,000 or more | 85 (4.2%) | 496 (23.1%) |
| Total | 2,035 (100.0%) | 2,148 (100.0%) |
Property Value to Household Income Ratio in Roosevelt County
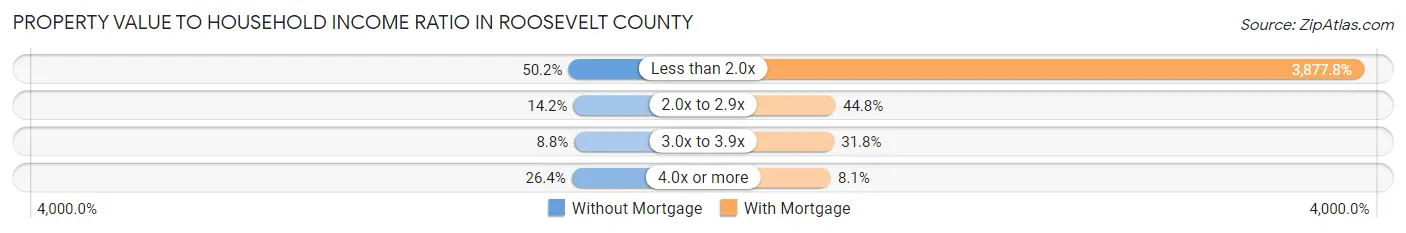
| Value-to-Income Ratio | Without Mortgage | With Mortgage |
| Less than 2.0x | 1,021 (50.2%) | 83,294 (3,877.8%) |
| 2.0x to 2.9x | 289 (14.2%) | 963 (44.8%) |
| 3.0x to 3.9x | 178 (8.7%) | 682 (31.8%) |
| 4.0x or more | 538 (26.4%) | 174 (8.1%) |
| Total | 2,035 (100.0%) | 2,148 (100.0%) |
Real Estate Taxes by Mortgage Status in Roosevelt County
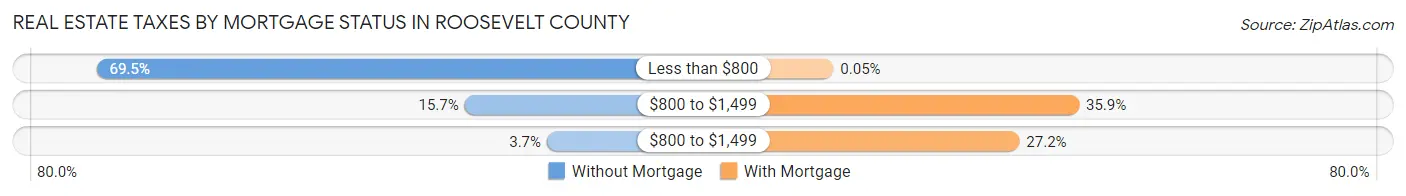
| Property Taxes | Without Mortgage | With Mortgage |
| Less than $800 | 1,414 (69.5%) | 1 (0.1%) |
| $800 to $1,499 | 320 (15.7%) | 772 (35.9%) |
| $800 to $1,499 | 75 (3.7%) | 585 (27.2%) |
| Total | 2,035 (100.0%) | 2,148 (100.0%) |
Health & Disability in Roosevelt County
Health Insurance Coverage by Age in Roosevelt County
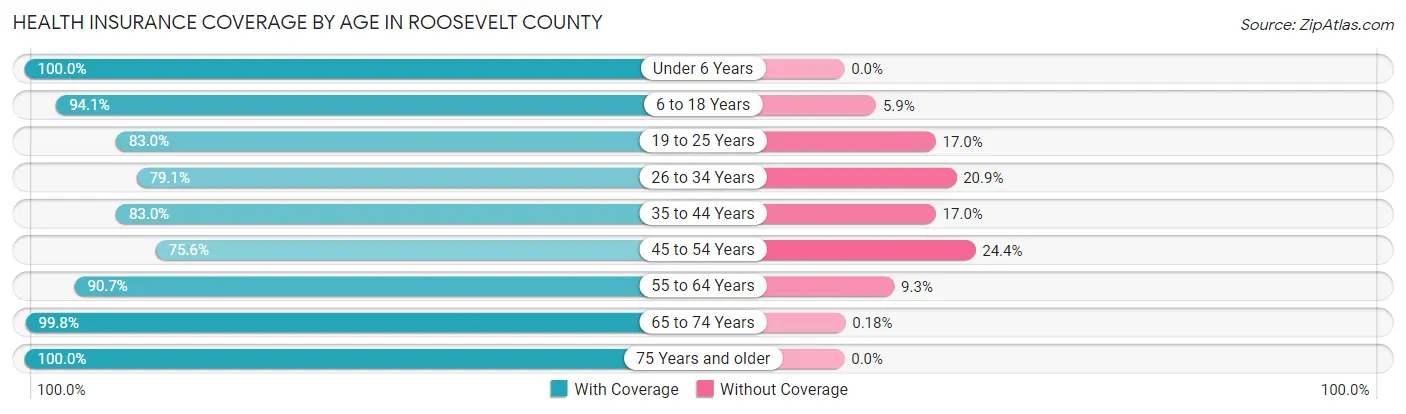
| Age Bracket | With Coverage | Without Coverage |
| Under 6 Years | 1,373 (100.0%) | 0 (0.0%) |
| 6 to 18 Years | 3,297 (94.1%) | 207 (5.9%) |
| 19 to 25 Years | 2,521 (83.0%) | 517 (17.0%) |
| 26 to 34 Years | 1,623 (79.1%) | 428 (20.9%) |
| 35 to 44 Years | 1,757 (83.0%) | 361 (17.0%) |
| 45 to 54 Years | 1,414 (75.6%) | 457 (24.4%) |
| 55 to 64 Years | 1,834 (90.7%) | 188 (9.3%) |
| 65 to 74 Years | 1,657 (99.8%) | 3 (0.2%) |
| 75 Years and older | 1,127 (100.0%) | 0 (0.0%) |
| Total | 16,603 (88.5%) | 2,161 (11.5%) |
Health Insurance Coverage by Citizenship Status in Roosevelt County
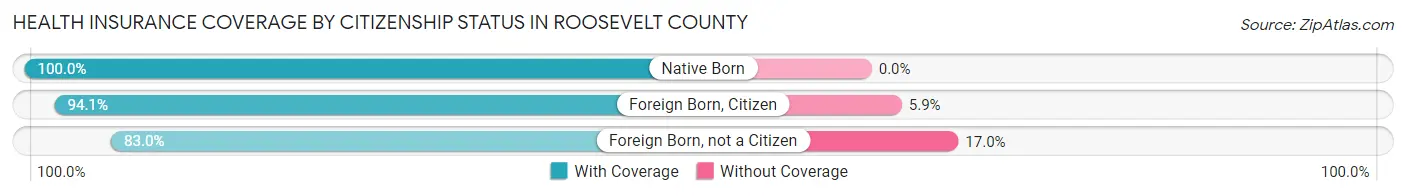
| Citizenship Status | With Coverage | Without Coverage |
| Native Born | 1,373 (100.0%) | 0 (0.0%) |
| Foreign Born, Citizen | 3,297 (94.1%) | 207 (5.9%) |
| Foreign Born, not a Citizen | 2,521 (83.0%) | 517 (17.0%) |
Health Insurance Coverage by Household Income in Roosevelt County
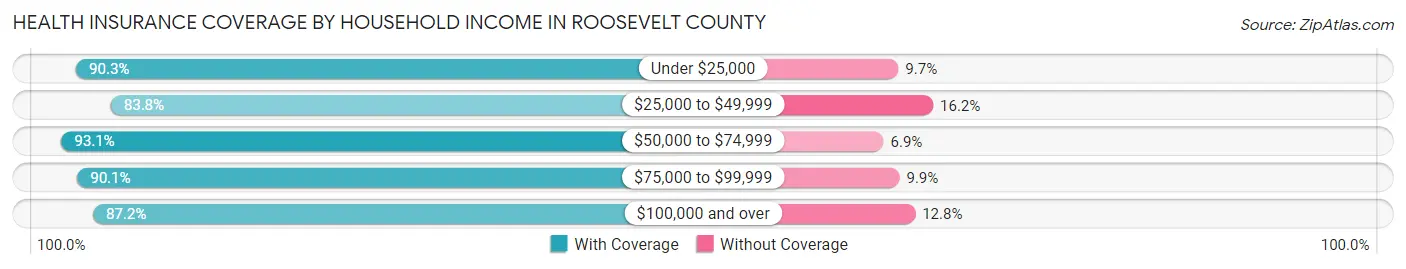
| Household Income | With Coverage | Without Coverage |
| Under $25,000 | 2,589 (90.3%) | 277 (9.7%) |
| $25,000 to $49,999 | 3,692 (83.8%) | 712 (16.2%) |
| $50,000 to $74,999 | 3,237 (93.1%) | 240 (6.9%) |
| $75,000 to $99,999 | 2,199 (90.1%) | 241 (9.9%) |
| $100,000 and over | 4,058 (87.2%) | 597 (12.8%) |
Public vs Private Health Insurance Coverage by Age in Roosevelt County
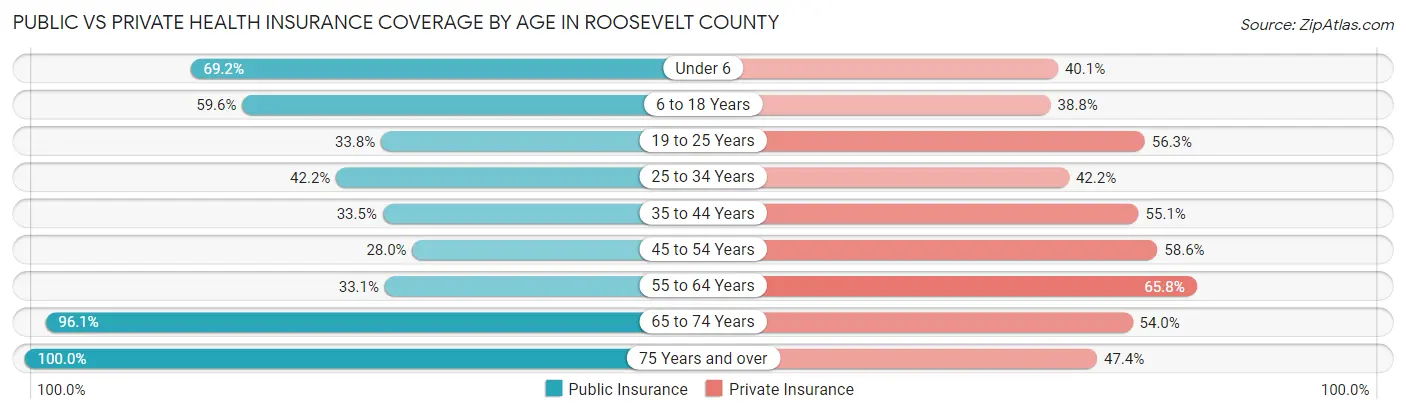
| Age Bracket | Public Insurance | Private Insurance |
| Under 6 | 950 (69.2%) | 551 (40.1%) |
| 6 to 18 Years | 2,088 (59.6%) | 1,358 (38.8%) |
| 19 to 25 Years | 1,028 (33.8%) | 1,709 (56.2%) |
| 25 to 34 Years | 865 (42.2%) | 865 (42.2%) |
| 35 to 44 Years | 710 (33.5%) | 1,167 (55.1%) |
| 45 to 54 Years | 524 (28.0%) | 1,096 (58.6%) |
| 55 to 64 Years | 670 (33.1%) | 1,331 (65.8%) |
| 65 to 74 Years | 1,596 (96.1%) | 896 (54.0%) |
| 75 Years and over | 1,127 (100.0%) | 534 (47.4%) |
| Total | 9,558 (50.9%) | 9,507 (50.7%) |
Disability Status by Sex by Age in Roosevelt County
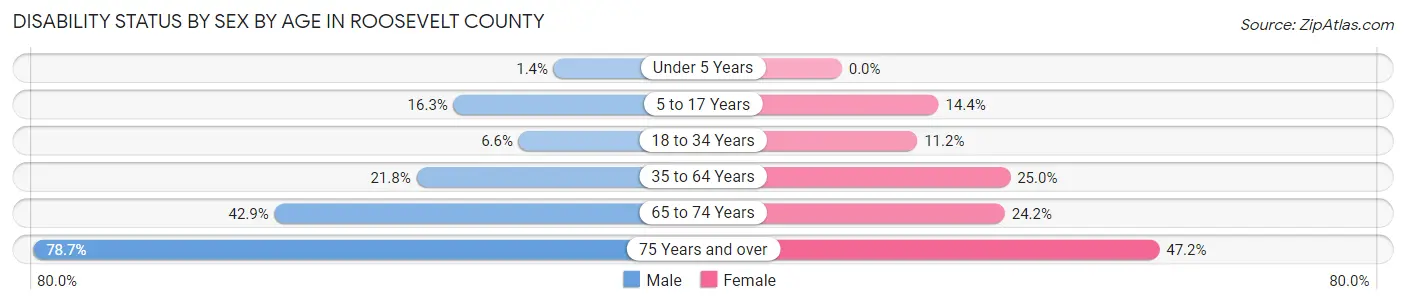
| Age Bracket | Male | Female |
| Under 5 Years | 9 (1.4%) | 0 (0.0%) |
| 5 to 17 Years | 288 (16.3%) | 229 (14.4%) |
| 18 to 34 Years | 169 (6.6%) | 319 (11.2%) |
| 35 to 64 Years | 656 (21.8%) | 751 (25.0%) |
| 65 to 74 Years | 338 (42.9%) | 211 (24.2%) |
| 75 Years and over | 418 (78.7%) | 281 (47.1%) |
Disability Class by Sex by Age in Roosevelt County
Disability Class: Hearing Difficulty
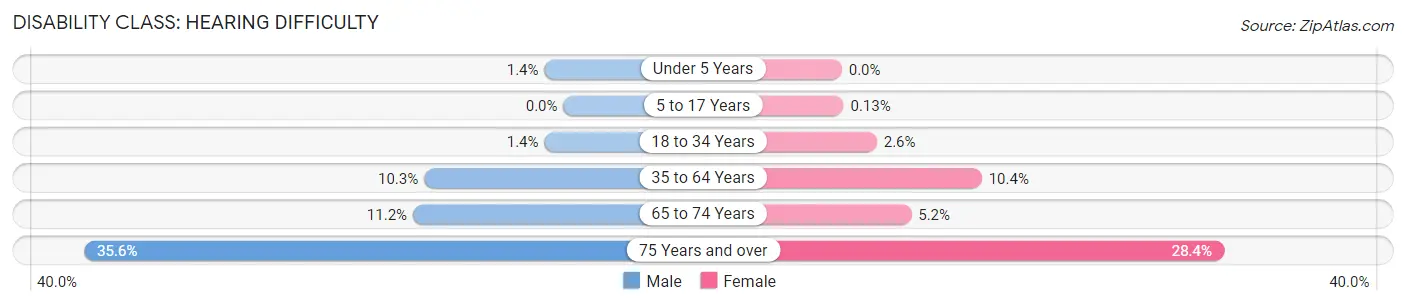
| Age Bracket | Male | Female |
| Under 5 Years | 9 (1.4%) | 0 (0.0%) |
| 5 to 17 Years | 0 (0.0%) | 2 (0.1%) |
| 18 to 34 Years | 36 (1.4%) | 74 (2.6%) |
| 35 to 64 Years | 311 (10.3%) | 312 (10.4%) |
| 65 to 74 Years | 88 (11.2%) | 45 (5.2%) |
| 75 Years and over | 189 (35.6%) | 169 (28.4%) |
Disability Class: Vision Difficulty
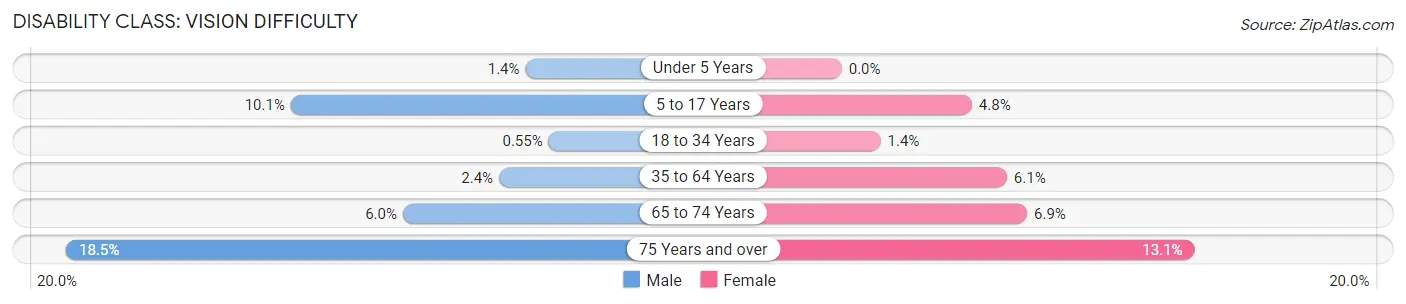
| Age Bracket | Male | Female |
| Under 5 Years | 9 (1.4%) | 0 (0.0%) |
| 5 to 17 Years | 179 (10.1%) | 77 (4.8%) |
| 18 to 34 Years | 14 (0.5%) | 41 (1.4%) |
| 35 to 64 Years | 72 (2.4%) | 184 (6.1%) |
| 65 to 74 Years | 47 (6.0%) | 60 (6.9%) |
| 75 Years and over | 98 (18.5%) | 78 (13.1%) |
Disability Class: Cognitive Difficulty
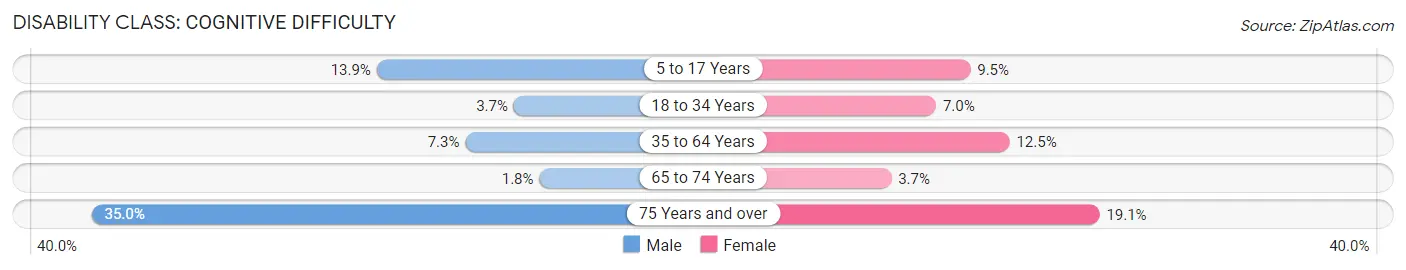
| Age Bracket | Male | Female |
| 5 to 17 Years | 245 (13.9%) | 152 (9.5%) |
| 18 to 34 Years | 94 (3.7%) | 199 (7.0%) |
| 35 to 64 Years | 219 (7.3%) | 374 (12.4%) |
| 65 to 74 Years | 14 (1.8%) | 32 (3.7%) |
| 75 Years and over | 186 (35.0%) | 114 (19.1%) |
Disability Class: Ambulatory Difficulty
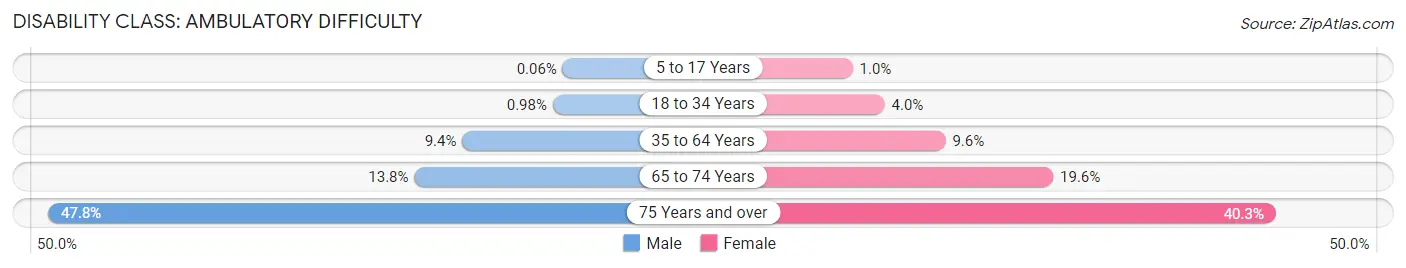
| Age Bracket | Male | Female |
| 5 to 17 Years | 1 (0.1%) | 16 (1.0%) |
| 18 to 34 Years | 25 (1.0%) | 113 (4.0%) |
| 35 to 64 Years | 282 (9.4%) | 289 (9.6%) |
| 65 to 74 Years | 109 (13.8%) | 171 (19.6%) |
| 75 Years and over | 254 (47.8%) | 240 (40.3%) |
Disability Class: Self-Care Difficulty
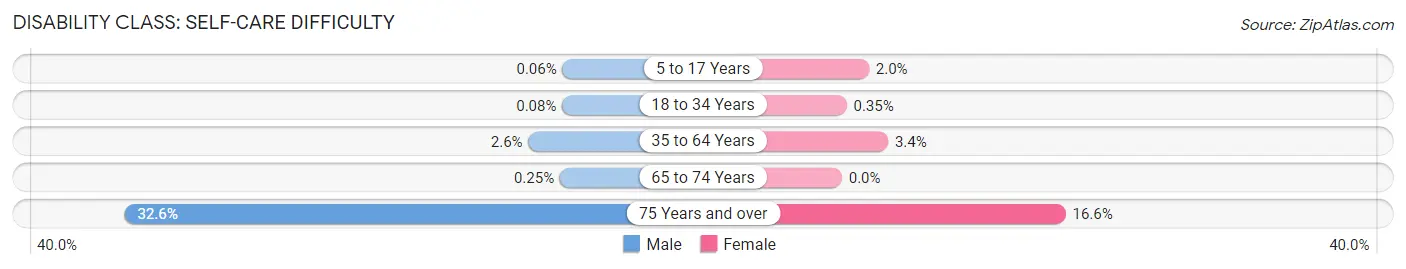
| Age Bracket | Male | Female |
| 5 to 17 Years | 1 (0.1%) | 32 (2.0%) |
| 18 to 34 Years | 2 (0.1%) | 10 (0.4%) |
| 35 to 64 Years | 78 (2.6%) | 103 (3.4%) |
| 65 to 74 Years | 2 (0.3%) | 0 (0.0%) |
| 75 Years and over | 173 (32.6%) | 99 (16.6%) |
Technology Access in Roosevelt County
Computing Device Access in Roosevelt County
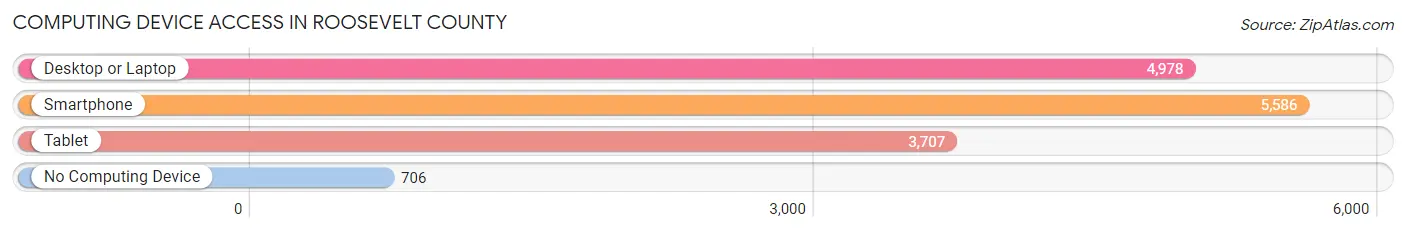
| Device Type | # Households | % Households |
| Desktop or Laptop | 4,978 | 71.5% |
| Smartphone | 5,586 | 80.2% |
| Tablet | 3,707 | 53.2% |
| No Computing Device | 706 | 10.1% |
| Total | 6,961 | 100.0% |
Internet Access in Roosevelt County
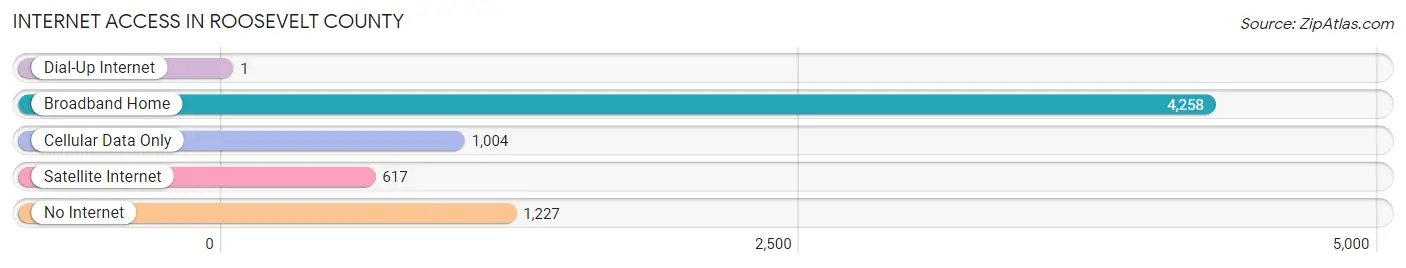
| Internet Type | # Households | % Households |
| Dial-Up Internet | 1 | 0.0% |
| Broadband Home | 4,258 | 61.2% |
| Cellular Data Only | 1,004 | 14.4% |
| Satellite Internet | 617 | 8.9% |
| No Internet | 1,227 | 17.6% |
| Total | 6,961 | 100.0% |
Roosevelt County Summary
Roosevelt County is a county located in the state of New Mexico, in the United States. As of the 2010 census, the population was 19,846. The county seat is Portales. The county was created in 1903 and named for President Theodore Roosevelt.
Geography
Roosevelt County is located in the southeastern corner of New Mexico. It is bordered by Curry County to the north, Chaves County to the east, and De Baca County to the south. The county has an area of 2,945 square miles, of which 2,944 square miles is land and 1.2 square miles (0.04%) is water.
The county is located in the Llano Estacado, a large region of flat land that stretches from the Texas Panhandle to southeastern New Mexico. The county is mostly flat, with some rolling hills in the western part of the county. The eastern part of the county is part of the Pecos River valley. The Pecos River flows through the county from north to south.
The county is home to several state parks, including Ute Lake State Park, Bottomless Lakes State Park, and Oasis State Park.
Demographics
As of the 2010 census, there were 19,846 people, 7,541 households, and 5,072 families residing in the county. The population density was 6.7 people per square mile. There were 8,541 housing units at an average density of 2.9 per square mile. The racial makeup of the county was 73.2% White, 1.2% Black or African American, 1.2% Native American, 0.5% Asian, 0.1% Pacific Islander, 21.2% from other races, and 3.7% from two or more races. 44.2% of the population were Hispanic or Latino of any race.
Economy
The economy of Roosevelt County is largely based on agriculture and ranching. The county is home to several large farms and ranches, including the J.A. Ranch, which is one of the largest cattle ranches in the United States. The county is also home to several large dairies, including the Dairy Farmers of America, which is the largest dairy cooperative in the United States.
The county is also home to several large industries, including the Portales Cotton Oil Mill, which is the largest cottonseed oil mill in the United States. The county is also home to several large food processing plants, including the Frito-Lay plant in Portales.
The county is also home to several large educational institutions, including Eastern New Mexico University, which is the largest university in the state. The university is home to several large research centers, including the Center for Energy Policy and the Center for Rural Economic Development.
Conclusion
Roosevelt County is a county located in the state of New Mexico, in the United States. As of the 2010 census, the population was 19,846. The county is located in the Llano Estacado, a large region of flat land that stretches from the Texas Panhandle to southeastern New Mexico. The county is mostly flat, with some rolling hills in the western part of the county. The economy of Roosevelt County is largely based on agriculture and ranching, and the county is home to several large farms and ranches, dairies, and industries. The county is also home to several large educational institutions, including Eastern New Mexico University.
Common Questions
What is Per Capita Income in Roosevelt County?
Per Capita income in Roosevelt County is $24,954.
What is the Median Family Income in Roosevelt County?
Median Family Income in Roosevelt County is $68,717.
What is the Median Household income in Roosevelt County?
Median Household Income in Roosevelt County is $52,644.
What is Income or Wage Gap in Roosevelt County?
Income or Wage Gap in Roosevelt County is 49.2%.
Women in Roosevelt County earn 50.8 cents for every dollar earned by a man.
What is Family Income Deficit in Roosevelt County?
Family Income Deficit in Roosevelt County is $12,151.
Families that are below poverty line in Roosevelt County earn $12,151 less on average than the poverty threshold level.
What is Inequality or Gini Index in Roosevelt County?
Inequality or Gini Index in Roosevelt County is 0.43.
What is the Total Population of Roosevelt County?
Total Population of Roosevelt County is 19,142.
What is the Total Male Population of Roosevelt County?
Total Male Population of Roosevelt County is 9,583.
What is the Total Female Population of Roosevelt County?
Total Female Population of Roosevelt County is 9,559.
What is the Ratio of Males per 100 Females in Roosevelt County?
There are 100.25 Males per 100 Females in Roosevelt County.
What is the Ratio of Females per 100 Males in Roosevelt County?
There are 99.75 Females per 100 Males in Roosevelt County.
What is the Median Population Age in Roosevelt County?
Median Population Age in Roosevelt County is 31.3 Years.
What is the Average Family Size in Roosevelt County
Average Family Size in Roosevelt County is 3.3 People.
What is the Average Household Size in Roosevelt County
Average Household Size in Roosevelt County is 2.6 People.
How Large is the Labor Force in Roosevelt County?
There are 9,331 People in the Labor Forcein in Roosevelt County.
What is the Percentage of People in the Labor Force in Roosevelt County?
62.6% of People are in the Labor Force in Roosevelt County.
What is the Unemployment Rate in Roosevelt County?
Unemployment Rate in Roosevelt County is 6.6%.