Bernalillo, NM Map & Demographics
Bernalillo Map
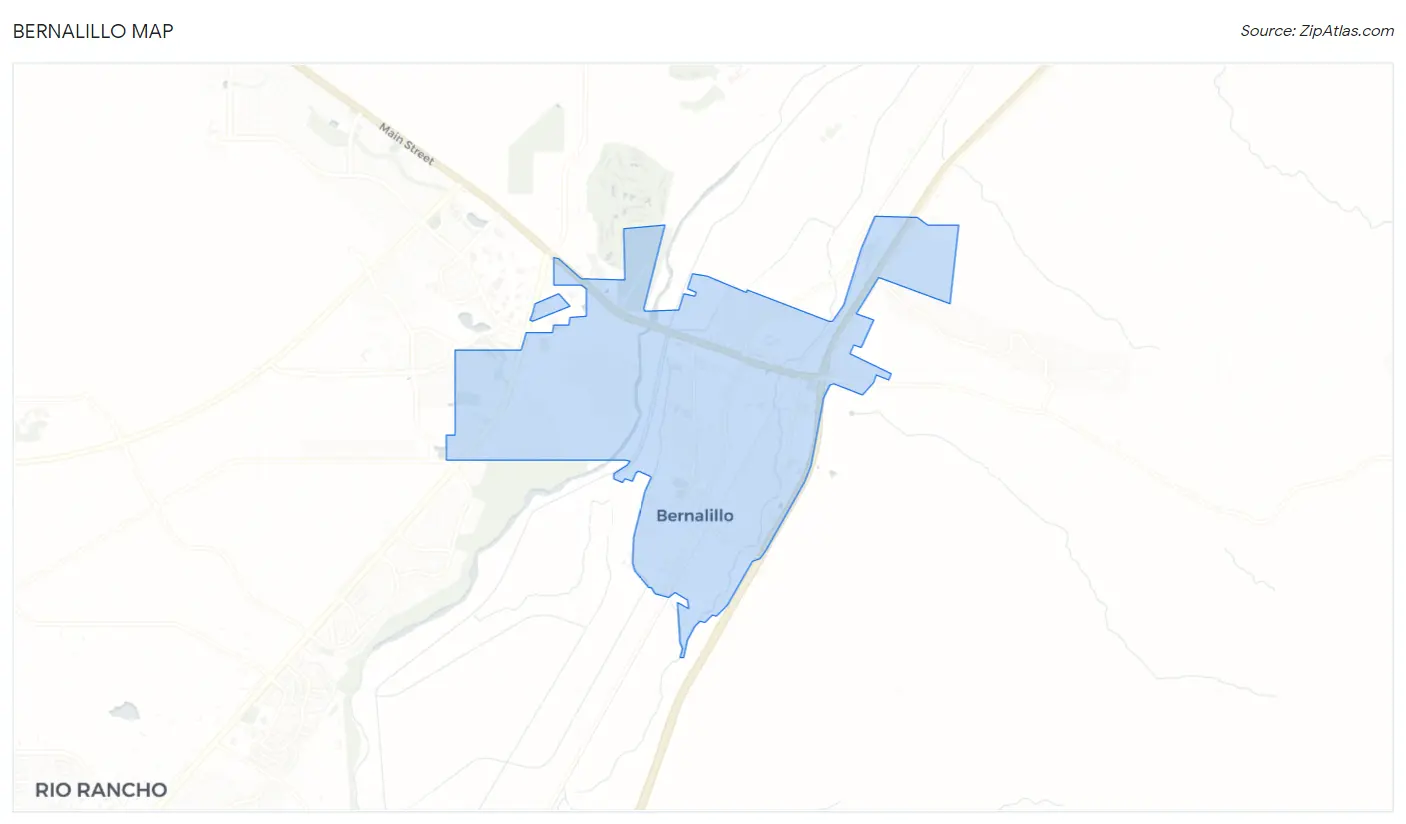
Bernalillo Overview
$30,589
PER CAPITA INCOME
$60,000
AVG FAMILY INCOME
$57,905
AVG HOUSEHOLD INCOME
22.8%
WAGE / INCOME GAP [ % ]
77.2¢/ $1
WAGE / INCOME GAP [ $ ]
$10,818
FAMILY INCOME DEFICIT
0.41
INEQUALITY / GINI INDEX
9,286
TOTAL POPULATION
4,759
MALE POPULATION
4,527
FEMALE POPULATION
105.12
MALES / 100 FEMALES
95.13
FEMALES / 100 MALES
43.2
MEDIAN AGE
2.8
AVG FAMILY SIZE
2.3
AVG HOUSEHOLD SIZE
4,200
LABOR FORCE [ PEOPLE ]
52.4%
PERCENT IN LABOR FORCE
6.2%
UNEMPLOYMENT RATE
Bernalillo Zip Codes
Bernalillo Area Codes
Income in Bernalillo
Income Overview in Bernalillo
Per Capita Income in Bernalillo is $30,589, while median incomes of families and households are $60,000 and $57,905 respectively.
| Characteristic | Number | Measure |
| Per Capita Income | 9,286 | $30,589 |
| Median Family Income | 2,602 | $60,000 |
| Mean Family Income | 2,602 | $79,349 |
| Median Household Income | 3,908 | $57,905 |
| Mean Household Income | 3,908 | $72,435 |
| Income Deficit | 2,602 | $10,818 |
| Wage / Income Gap (%) | 9,286 | 22.80% |
| Wage / Income Gap ($) | 9,286 | 77.20¢ per $1 |
| Gini / Inequality Index | 9,286 | 0.41 |
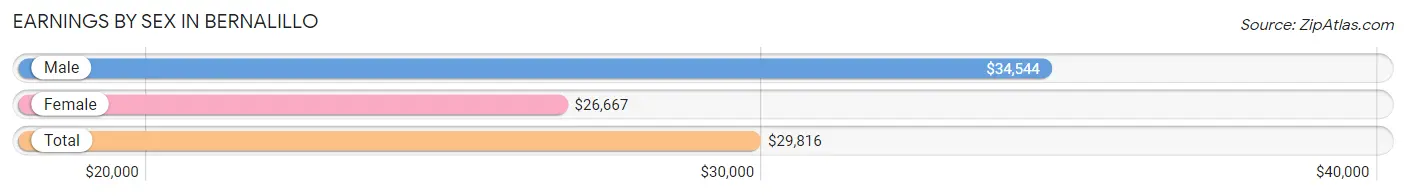
Earnings by Sex in Bernalillo
Average Earnings in Bernalillo are $29,816, $34,544 for men and $26,667 for women, a difference of 22.8%.
| Sex | Number | Average Earnings |
| Male | 2,363 (50.9%) | $34,544 |
| Female | 2,276 (49.1%) | $26,667 |
| Total | 4,639 (100.0%) | $29,816 |
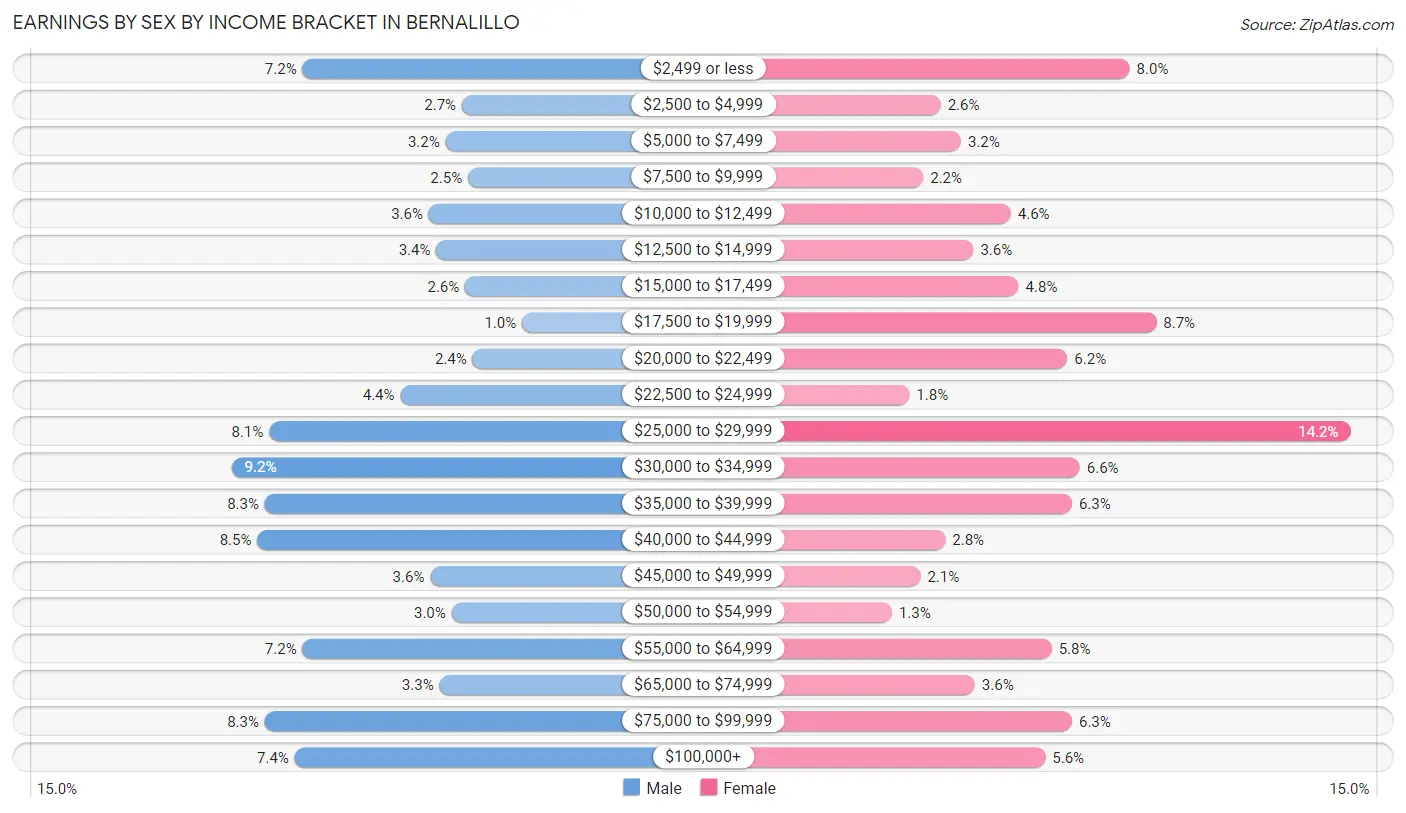
Earnings by Sex by Income Bracket in Bernalillo
The most common earnings brackets in Bernalillo are $30,000 to $34,999 for men (217 | 9.2%) and $25,000 to $29,999 for women (322 | 14.1%).
| Income | Male | Female |
| $2,499 or less | 170 (7.2%) | 181 (8.0%) |
| $2,500 to $4,999 | 64 (2.7%) | 60 (2.6%) |
| $5,000 to $7,499 | 75 (3.2%) | 73 (3.2%) |
| $7,500 to $9,999 | 60 (2.5%) | 49 (2.1%) |
| $10,000 to $12,499 | 86 (3.6%) | 105 (4.6%) |
| $12,500 to $14,999 | 81 (3.4%) | 81 (3.6%) |
| $15,000 to $17,499 | 62 (2.6%) | 110 (4.8%) |
| $17,500 to $19,999 | 24 (1.0%) | 198 (8.7%) |
| $20,000 to $22,499 | 57 (2.4%) | 141 (6.2%) |
| $22,500 to $24,999 | 105 (4.4%) | 40 (1.8%) |
| $25,000 to $29,999 | 192 (8.1%) | 322 (14.1%) |
| $30,000 to $34,999 | 217 (9.2%) | 149 (6.6%) |
| $35,000 to $39,999 | 195 (8.3%) | 144 (6.3%) |
| $40,000 to $44,999 | 200 (8.5%) | 63 (2.8%) |
| $45,000 to $49,999 | 85 (3.6%) | 47 (2.1%) |
| $50,000 to $54,999 | 71 (3.0%) | 29 (1.3%) |
| $55,000 to $64,999 | 170 (7.2%) | 131 (5.8%) |
| $65,000 to $74,999 | 79 (3.3%) | 82 (3.6%) |
| $75,000 to $99,999 | 195 (8.3%) | 144 (6.3%) |
| $100,000+ | 175 (7.4%) | 127 (5.6%) |
| Total | 2,363 (100.0%) | 2,276 (100.0%) |
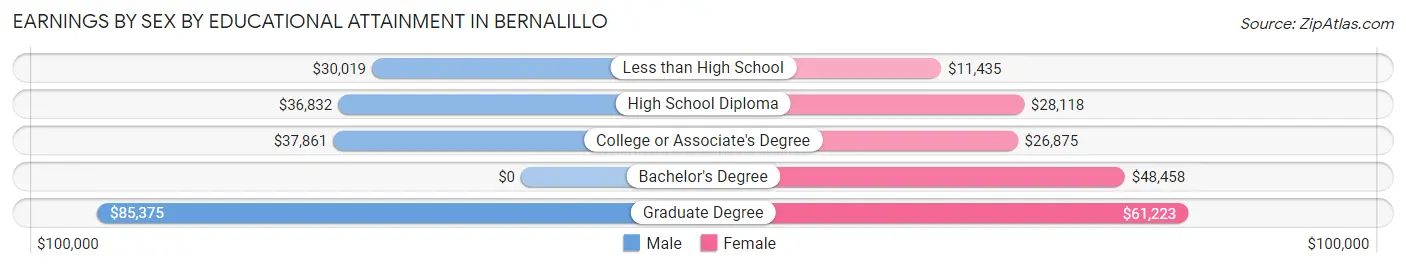
Earnings by Sex by Educational Attainment in Bernalillo
Average earnings in Bernalillo are $37,317 for men and $28,038 for women, a difference of 24.9%. Men with an educational attainment of graduate degree enjoy the highest average annual earnings of $85,375, while those with less than high school education earn the least with $30,019. Women with an educational attainment of graduate degree earn the most with the average annual earnings of $61,223, while those with less than high school education have the smallest earnings of $11,435.
| Educational Attainment | Male Income | Female Income |
| Less than High School | $30,019 | $11,435 |
| High School Diploma | $36,832 | $28,118 |
| College or Associate's Degree | $37,861 | $26,875 |
| Bachelor's Degree | - | - |
| Graduate Degree | $85,375 | $61,223 |
| Total | $37,317 | $28,038 |
Family Income in Bernalillo
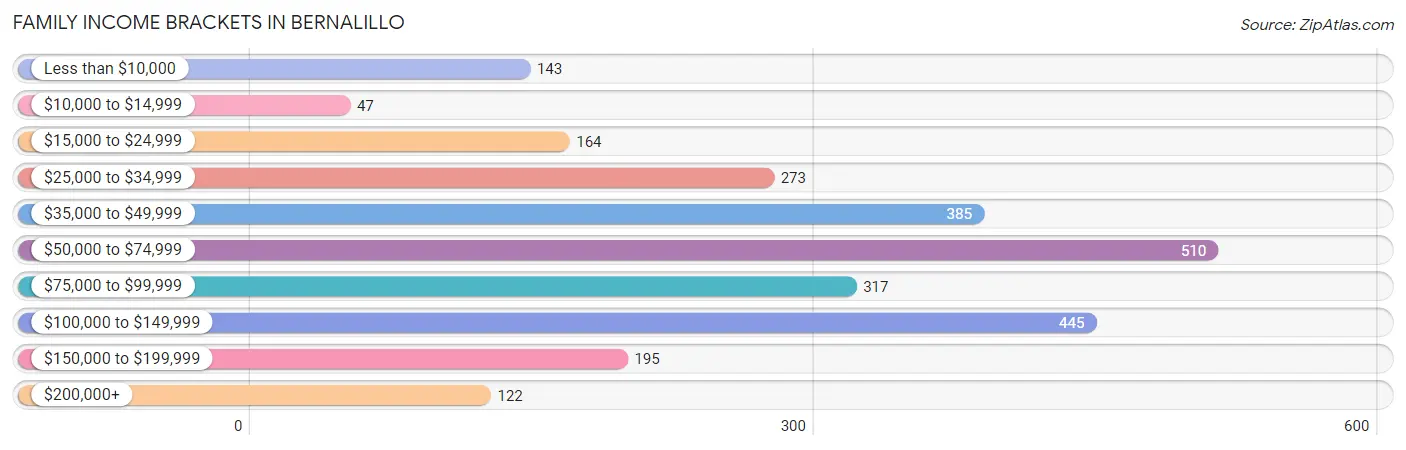
Family Income Brackets in Bernalillo
According to the Bernalillo family income data, there are 510 families falling into the $50,000 to $74,999 income range, which is the most common income bracket and makes up 19.6% of all families. Conversely, the $10,000 to $14,999 income bracket is the least frequent group with only 47 families (1.8%) belonging to this category.
| Income Bracket | # Families | % Families |
| Less than $10,000 | 143 | 5.5% |
| $10,000 to $14,999 | 47 | 1.8% |
| $15,000 to $24,999 | 164 | 6.3% |
| $25,000 to $34,999 | 273 | 10.5% |
| $35,000 to $49,999 | 385 | 14.8% |
| $50,000 to $74,999 | 510 | 19.6% |
| $75,000 to $99,999 | 317 | 12.2% |
| $100,000 to $149,999 | 445 | 17.1% |
| $150,000 to $199,999 | 195 | 7.5% |
| $200,000+ | 122 | 4.7% |
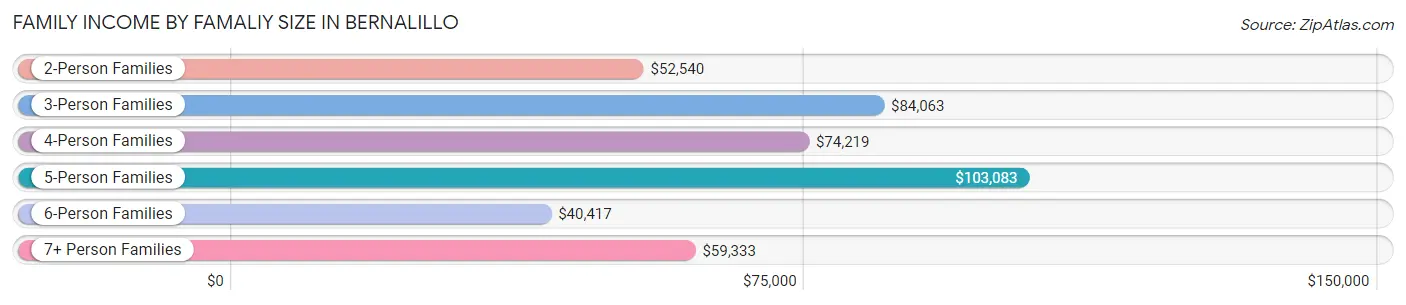
Family Income by Famaliy Size in Bernalillo
5-person families (211 | 8.1%) account for the highest median family income in Bernalillo with $103,083 per family, while 3-person families (501 | 19.3%) have the highest median income of $28,021 per family member.
| Income Bracket | # Families | Median Income |
| 2-Person Families | 1,457 (56.0%) | $52,540 |
| 3-Person Families | 501 (19.3%) | $84,063 |
| 4-Person Families | 390 (15.0%) | $74,219 |
| 5-Person Families | 211 (8.1%) | $103,083 |
| 6-Person Families | 21 (0.8%) | $40,417 |
| 7+ Person Families | 22 (0.9%) | $59,333 |
| Total | 2,602 (100.0%) | $60,000 |
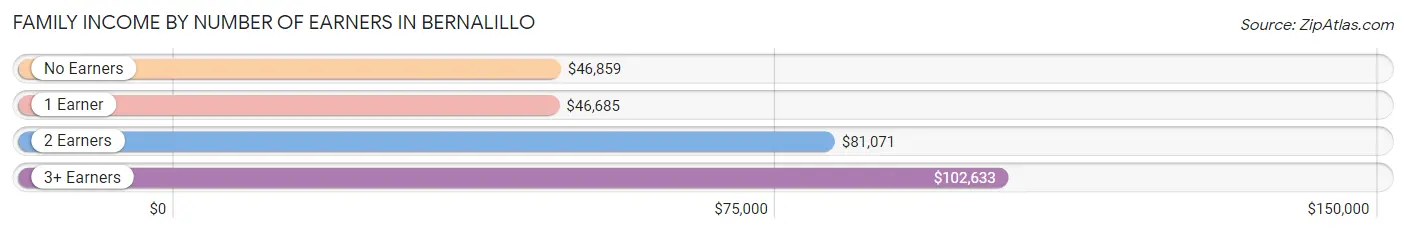
Family Income by Number of Earners in Bernalillo
The median family income in Bernalillo is $60,000, with families comprising 3+ earners (332) having the highest median family income of $102,633, while families with 1 earner (966) have the lowest median family income of $46,685, accounting for 12.8% and 37.1% of families, respectively.
| Number of Earners | # Families | Median Income |
| No Earners | 638 (24.5%) | $46,859 |
| 1 Earner | 966 (37.1%) | $46,685 |
| 2 Earners | 666 (25.6%) | $81,071 |
| 3+ Earners | 332 (12.8%) | $102,633 |
| Total | 2,602 (100.0%) | $60,000 |
Household Income in Bernalillo
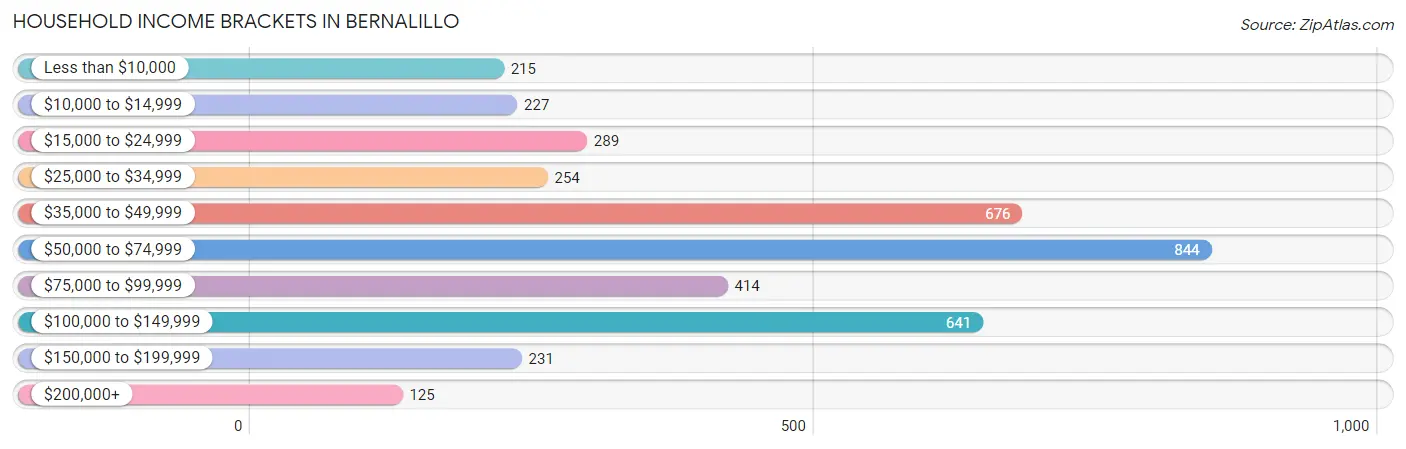
Household Income Brackets in Bernalillo
With 844 households falling in the category, the $50,000 to $74,999 income range is the most frequent in Bernalillo, accounting for 21.6% of all households. In contrast, only 125 households (3.2%) fall into the $200,000+ income bracket, making it the least populous group.
| Income Bracket | # Households | % Households |
| Less than $10,000 | 215 | 5.5% |
| $10,000 to $14,999 | 227 | 5.8% |
| $15,000 to $24,999 | 289 | 7.4% |
| $25,000 to $34,999 | 254 | 6.5% |
| $35,000 to $49,999 | 676 | 17.3% |
| $50,000 to $74,999 | 844 | 21.6% |
| $75,000 to $99,999 | 414 | 10.6% |
| $100,000 to $149,999 | 641 | 16.4% |
| $150,000 to $199,999 | 231 | 5.9% |
| $200,000+ | 125 | 3.2% |
Household Income by Householder Age in Bernalillo
The median household income in Bernalillo is $57,905, with the highest median household income of $60,739 found in the 65+ years age bracket for the primary householder. A total of 1,428 households (36.5%) fall into this category. Meanwhile, the 15 to 24 years age bracket for the primary householder has the lowest median household income of $0, with 106 households (2.7%) in this group.
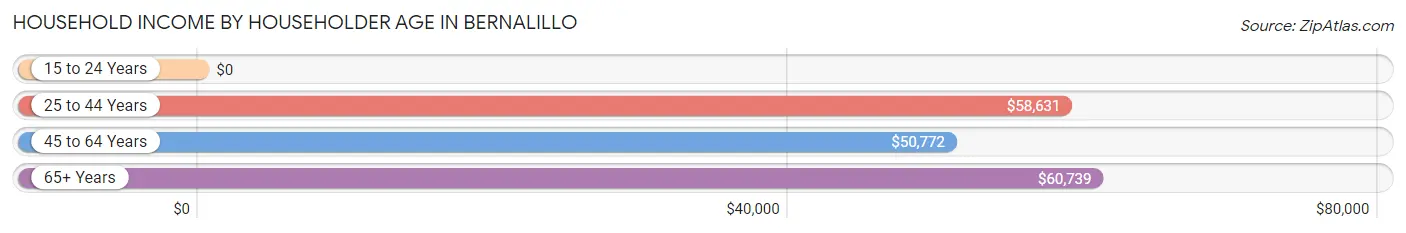
| Income Bracket | # Households | Median Income |
| 15 to 24 Years | 106 (2.7%) | $0 |
| 25 to 44 Years | 1,199 (30.7%) | $58,631 |
| 45 to 64 Years | 1,175 (30.1%) | $50,772 |
| 65+ Years | 1,428 (36.5%) | $60,739 |
| Total | 3,908 (100.0%) | $57,905 |
Poverty in Bernalillo
Income Below Poverty by Sex and Age in Bernalillo
With 15.6% poverty level for males and 16.2% for females among the residents of Bernalillo, 5 year old males and 16 and 17 year old females are the most vulnerable to poverty, with 17 males (40.5%) and 12 females (44.4%) in their respective age groups living below the poverty level.
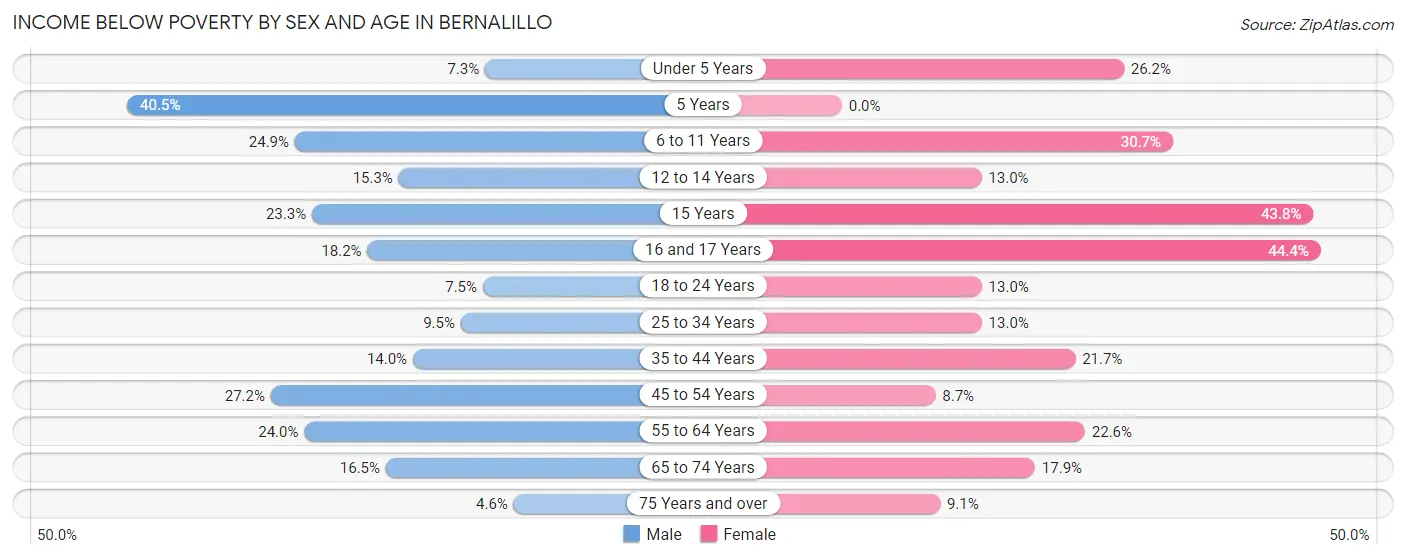
| Age Bracket | Male | Female |
| Under 5 Years | 16 (7.3%) | 28 (26.2%) |
| 5 Years | 17 (40.5%) | 0 (0.0%) |
| 6 to 11 Years | 83 (24.9%) | 47 (30.7%) |
| 12 to 14 Years | 33 (15.3%) | 14 (13.0%) |
| 15 Years | 7 (23.3%) | 7 (43.8%) |
| 16 and 17 Years | 12 (18.2%) | 12 (44.4%) |
| 18 to 24 Years | 28 (7.5%) | 51 (13.0%) |
| 25 to 34 Years | 65 (9.5%) | 101 (13.0%) |
| 35 to 44 Years | 80 (14.0%) | 115 (21.7%) |
| 45 to 54 Years | 120 (27.2%) | 40 (8.7%) |
| 55 to 64 Years | 151 (24.0%) | 120 (22.6%) |
| 65 to 74 Years | 85 (16.5%) | 143 (17.9%) |
| 75 Years and over | 22 (4.6%) | 50 (9.1%) |
| Total | 719 (15.6%) | 728 (16.2%) |
Income Above Poverty by Sex and Age in Bernalillo
According to the poverty statistics in Bernalillo, males aged 75 years and over and females aged 5 years are the age groups that are most secure financially, with 95.4% of males and 100.0% of females in these age groups living above the poverty line.
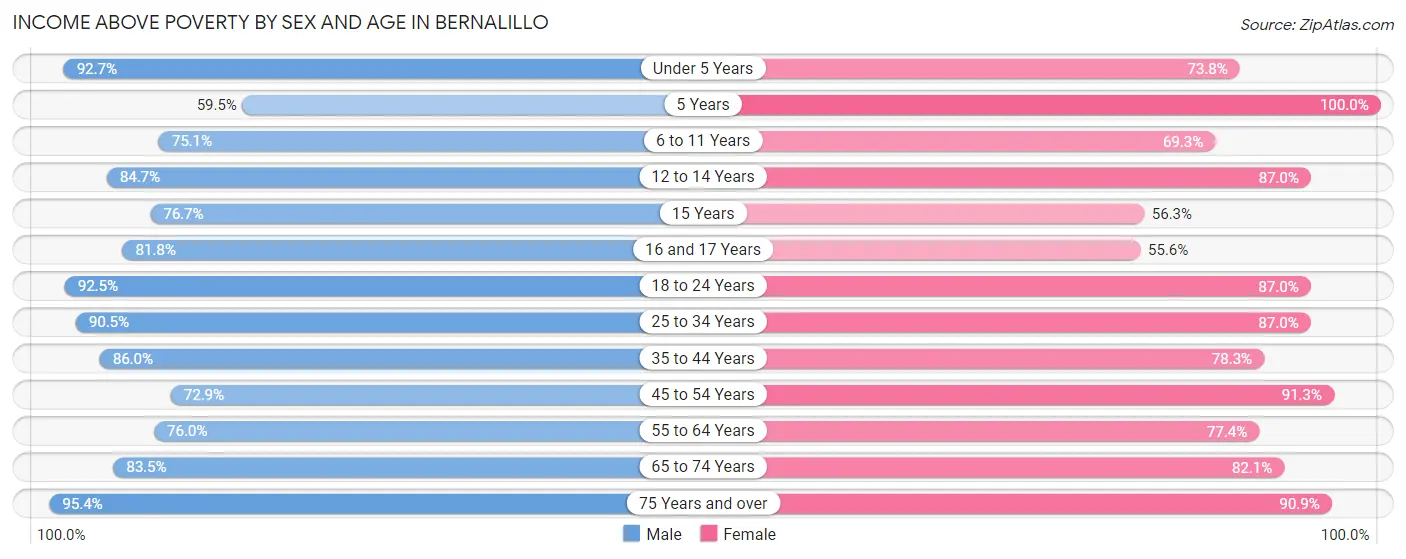
| Age Bracket | Male | Female |
| Under 5 Years | 204 (92.7%) | 79 (73.8%) |
| 5 Years | 25 (59.5%) | 32 (100.0%) |
| 6 to 11 Years | 250 (75.1%) | 106 (69.3%) |
| 12 to 14 Years | 183 (84.7%) | 94 (87.0%) |
| 15 Years | 23 (76.7%) | 9 (56.2%) |
| 16 and 17 Years | 54 (81.8%) | 15 (55.6%) |
| 18 to 24 Years | 347 (92.5%) | 342 (87.0%) |
| 25 to 34 Years | 618 (90.5%) | 677 (87.0%) |
| 35 to 44 Years | 493 (86.0%) | 416 (78.3%) |
| 45 to 54 Years | 322 (72.9%) | 421 (91.3%) |
| 55 to 64 Years | 477 (76.0%) | 412 (77.4%) |
| 65 to 74 Years | 431 (83.5%) | 655 (82.1%) |
| 75 Years and over | 455 (95.4%) | 499 (90.9%) |
| Total | 3,882 (84.4%) | 3,757 (83.8%) |
Income Below Poverty Among Married-Couple Families in Bernalillo
The poverty statistics for married-couple families in Bernalillo show that 8.1% or 136 of the total 1,677 families live below the poverty line. Families with 3 or 4 children have the highest poverty rate of 18.2%, comprising of 12 families. On the other hand, families with 5 or more children have the lowest poverty rate of 0.0%, which includes 0 families.
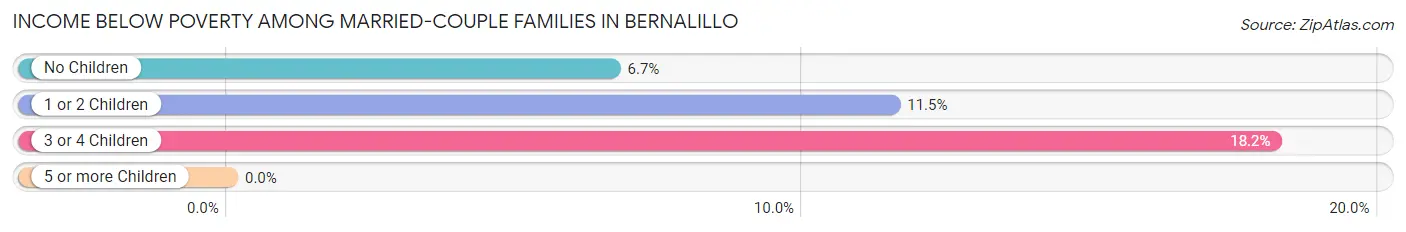
| Children | Above Poverty | Below Poverty |
| No Children | 1,177 (93.3%) | 84 (6.7%) |
| 1 or 2 Children | 307 (88.5%) | 40 (11.5%) |
| 3 or 4 Children | 54 (81.8%) | 12 (18.2%) |
| 5 or more Children | 3 (100.0%) | 0 (0.0%) |
| Total | 1,541 (91.9%) | 136 (8.1%) |
Income Below Poverty Among Single-Parent Households in Bernalillo
According to the poverty data in Bernalillo, 19.9% or 43 single-father households and 22.9% or 162 single-mother households are living below the poverty line. Among single-father households, those with 3 or 4 children have the highest poverty rate, with 23 households (32.9%) experiencing poverty. Likewise, among single-mother households, those with 3 or 4 children have the highest poverty rate, with 11 households (55.0%) falling below the poverty line.
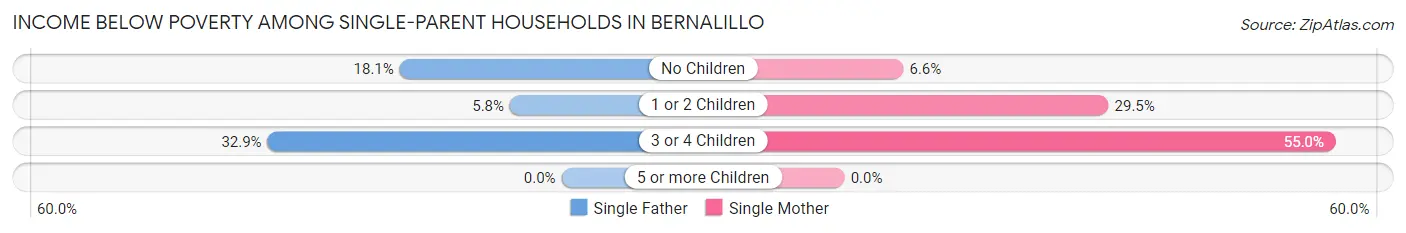
| Children | Single Father | Single Mother |
| No Children | 17 (18.1%) | 15 (6.6%) |
| 1 or 2 Children | 3 (5.8%) | 136 (29.5%) |
| 3 or 4 Children | 23 (32.9%) | 11 (55.0%) |
| 5 or more Children | 0 (0.0%) | 0 (0.0%) |
| Total | 43 (19.9%) | 162 (22.9%) |
Income Below Poverty Among Married-Couple vs Single-Parent Households in Bernalillo
The poverty data for Bernalillo shows that 136 of the married-couple family households (8.1%) and 205 of the single-parent households (22.2%) are living below the poverty level. Within the married-couple family households, those with 3 or 4 children have the highest poverty rate, with 12 households (18.2%) falling below the poverty line. Among the single-parent households, those with 3 or 4 children have the highest poverty rate, with 34 household (37.8%) living below poverty.
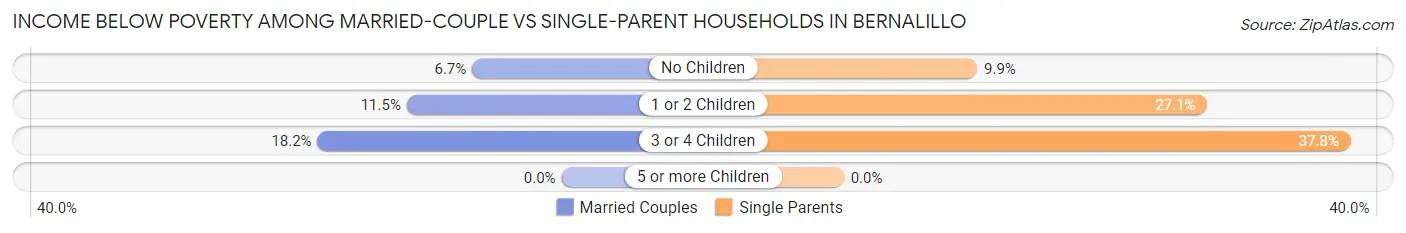
| Children | Married-Couple Families | Single-Parent Households |
| No Children | 84 (6.7%) | 32 (9.9%) |
| 1 or 2 Children | 40 (11.5%) | 139 (27.1%) |
| 3 or 4 Children | 12 (18.2%) | 34 (37.8%) |
| 5 or more Children | 0 (0.0%) | 0 (0.0%) |
| Total | 136 (8.1%) | 205 (22.2%) |
Race in Bernalillo
The most populous races in Bernalillo are Hispanic or Latino (6,257 | 67.4%), White / Caucasian (5,411 | 58.3%), and Two or more Races (1,824 | 19.6%).
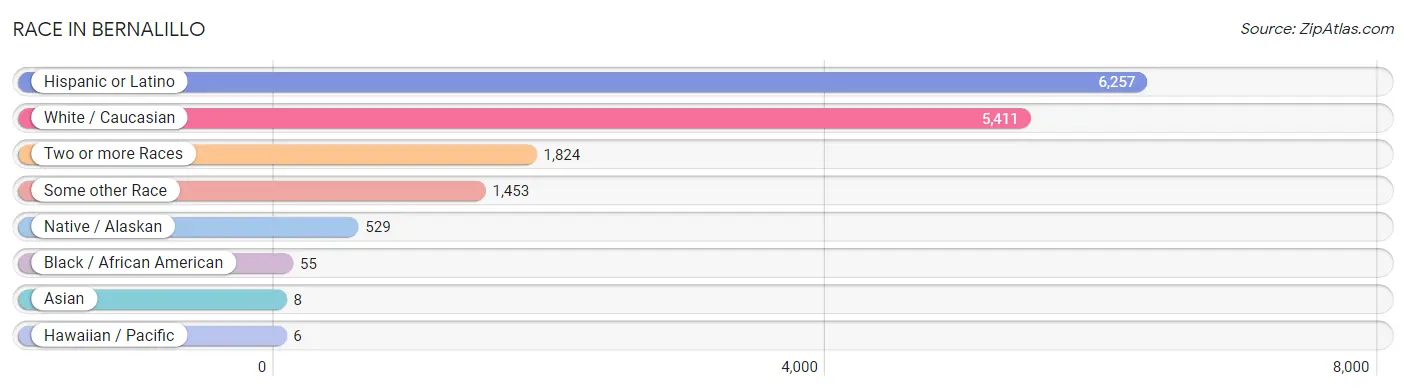
| Race | # Population | % Population |
| Asian | 8 | 0.1% |
| Black / African American | 55 | 0.6% |
| Hawaiian / Pacific | 6 | 0.1% |
| Hispanic or Latino | 6,257 | 67.4% |
| Native / Alaskan | 529 | 5.7% |
| White / Caucasian | 5,411 | 58.3% |
| Two or more Races | 1,824 | 19.6% |
| Some other Race | 1,453 | 15.7% |
| Total | 9,286 | 100.0% |
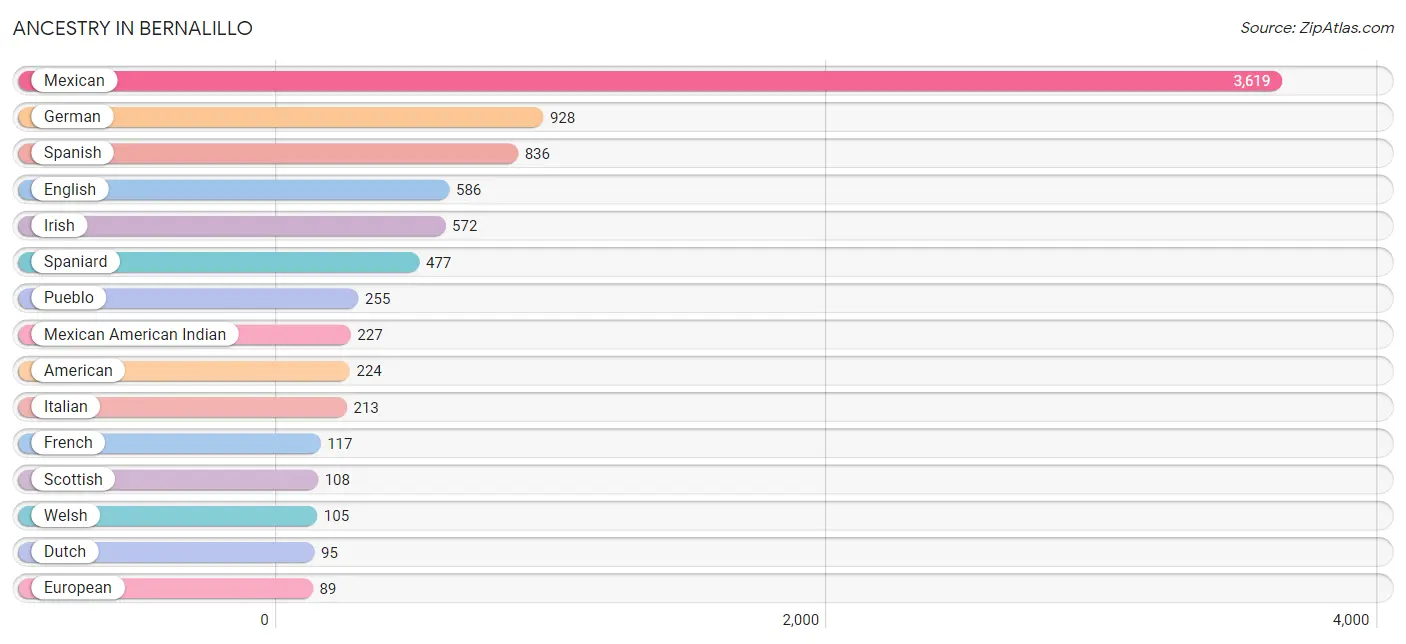
Ancestry in Bernalillo
The most populous ancestries reported in Bernalillo are Mexican (3,619 | 39.0%), German (928 | 10.0%), Spanish (836 | 9.0%), English (586 | 6.3%), and Irish (572 | 6.2%), together accounting for 70.4% of all Bernalillo residents.
| Ancestry | # Population | % Population |
| African | 11 | 0.1% |
| American | 224 | 2.4% |
| Arab | 52 | 0.6% |
| Argentinean | 23 | 0.3% |
| British | 3 | 0.0% |
| Canadian | 20 | 0.2% |
| Central American | 21 | 0.2% |
| Central American Indian | 3 | 0.0% |
| Chilean | 22 | 0.2% |
| Colombian | 5 | 0.1% |
| Cuban | 3 | 0.0% |
| Danish | 22 | 0.2% |
| Dominican | 25 | 0.3% |
| Dutch | 95 | 1.0% |
| Eastern European | 17 | 0.2% |
| Ecuadorian | 3 | 0.0% |
| English | 586 | 6.3% |
| Estonian | 2 | 0.0% |
| European | 89 | 1.0% |
| Finnish | 5 | 0.1% |
| French | 117 | 1.3% |
| French Canadian | 67 | 0.7% |
| German | 928 | 10.0% |
| Greek | 32 | 0.3% |
| Guatemalan | 5 | 0.1% |
| Haitian | 3 | 0.0% |
| Honduran | 4 | 0.0% |
| Hungarian | 69 | 0.7% |
| Irish | 572 | 6.2% |
| Italian | 213 | 2.3% |
| Korean | 8 | 0.1% |
| Lebanese | 52 | 0.6% |
| Lithuanian | 12 | 0.1% |
| Mexican | 3,619 | 39.0% |
| Mexican American Indian | 227 | 2.4% |
| Native Hawaiian | 54 | 0.6% |
| Navajo | 69 | 0.7% |
| Northern European | 32 | 0.3% |
| Norwegian | 26 | 0.3% |
| Pima | 34 | 0.4% |
| Polish | 22 | 0.2% |
| Portuguese | 7 | 0.1% |
| Pueblo | 255 | 2.8% |
| Puerto Rican | 5 | 0.1% |
| Russian | 6 | 0.1% |
| Salvadoran | 12 | 0.1% |
| Scandinavian | 44 | 0.5% |
| Scotch-Irish | 45 | 0.5% |
| Scottish | 108 | 1.2% |
| Somali | 2 | 0.0% |
| South American | 53 | 0.6% |
| Spaniard | 477 | 5.1% |
| Spanish | 836 | 9.0% |
| Spanish American | 59 | 0.6% |
| Subsaharan African | 13 | 0.1% |
| Swedish | 40 | 0.4% |
| Swiss | 13 | 0.1% |
| Ukrainian | 2 | 0.0% |
| Welsh | 105 | 1.1% | View All 59 Rows |
Immigrants in Bernalillo
The most numerous immigrant groups reported in Bernalillo came from Latin America (1,259 | 13.6%), Central America (1,229 | 13.2%), Mexico (1,213 | 13.1%), Canada (47 | 0.5%), and Europe (33 | 0.4%), together accounting for 40.7% of all Bernalillo residents.
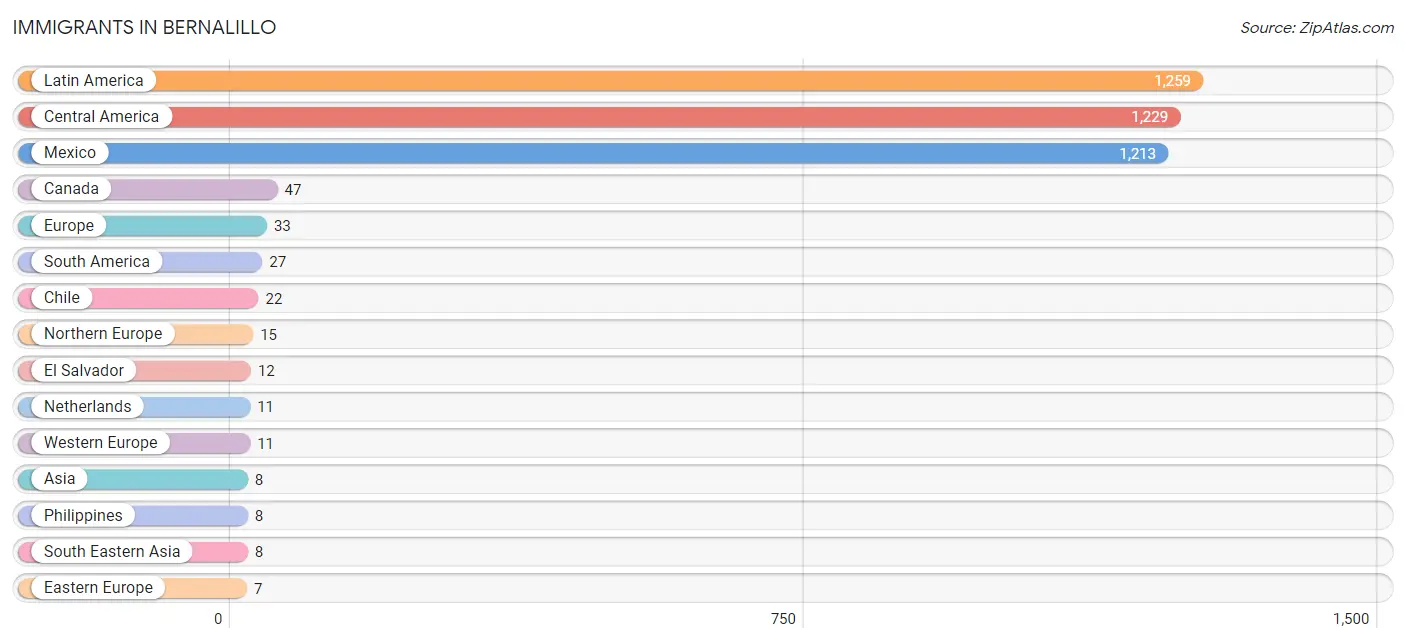
| Immigration Origin | # Population | % Population |
| Asia | 8 | 0.1% |
| Canada | 47 | 0.5% |
| Caribbean | 3 | 0.0% |
| Central America | 1,229 | 13.2% |
| Chile | 22 | 0.2% |
| Colombia | 2 | 0.0% |
| Eastern Europe | 7 | 0.1% |
| Ecuador | 3 | 0.0% |
| El Salvador | 12 | 0.1% |
| Europe | 33 | 0.4% |
| Haiti | 3 | 0.0% |
| Honduras | 4 | 0.0% |
| Hungary | 3 | 0.0% |
| Latin America | 1,259 | 13.6% |
| Mexico | 1,213 | 13.1% |
| Netherlands | 11 | 0.1% |
| Northern Europe | 15 | 0.2% |
| Philippines | 8 | 0.1% |
| Poland | 2 | 0.0% |
| Russia | 2 | 0.0% |
| South America | 27 | 0.3% |
| South Eastern Asia | 8 | 0.1% |
| Western Europe | 11 | 0.1% | View All 23 Rows |
Sex and Age in Bernalillo
Sex and Age in Bernalillo
The most populous age groups in Bernalillo are 25 to 29 Years (476 | 10.0%) for men and 25 to 29 Years (591 | 13.1%) for women.
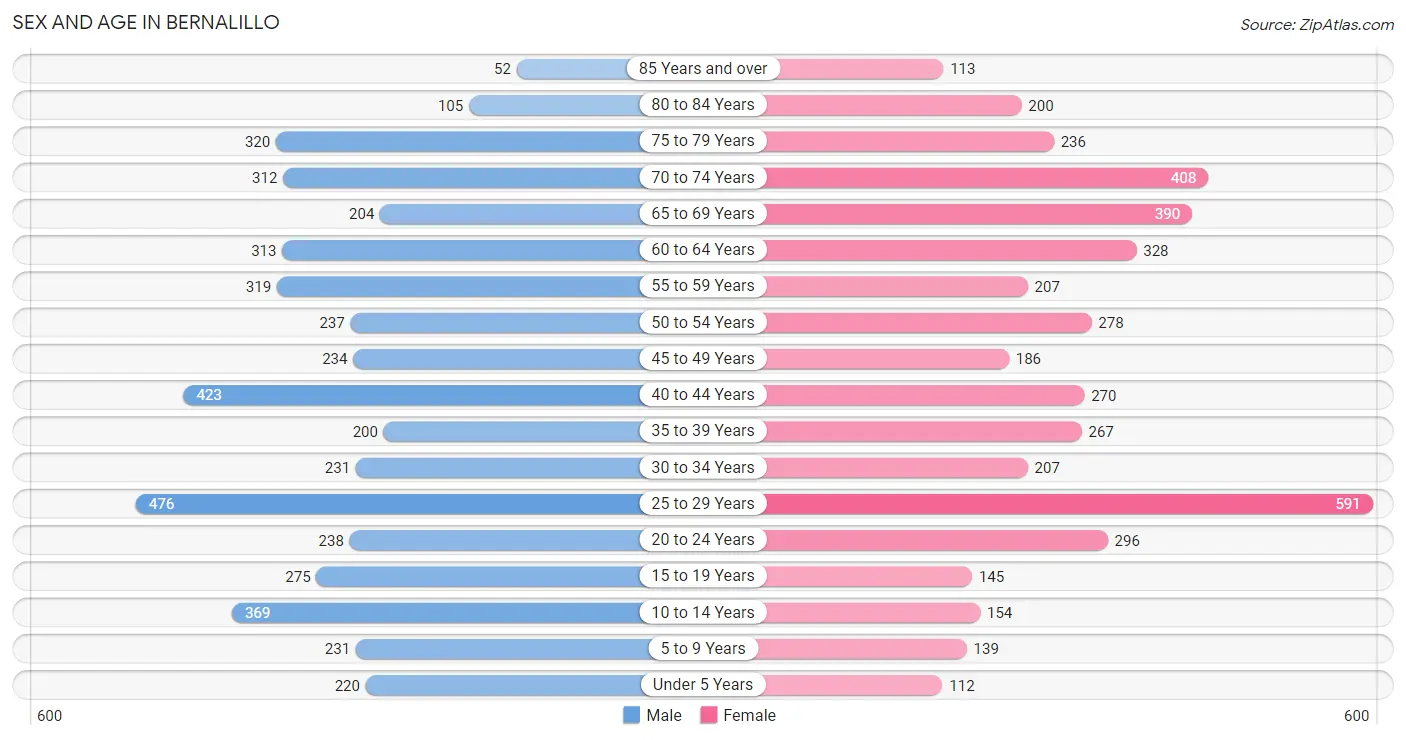
| Age Bracket | Male | Female |
| Under 5 Years | 220 (4.6%) | 112 (2.5%) |
| 5 to 9 Years | 231 (4.9%) | 139 (3.1%) |
| 10 to 14 Years | 369 (7.7%) | 154 (3.4%) |
| 15 to 19 Years | 275 (5.8%) | 145 (3.2%) |
| 20 to 24 Years | 238 (5.0%) | 296 (6.5%) |
| 25 to 29 Years | 476 (10.0%) | 591 (13.1%) |
| 30 to 34 Years | 231 (4.9%) | 207 (4.6%) |
| 35 to 39 Years | 200 (4.2%) | 267 (5.9%) |
| 40 to 44 Years | 423 (8.9%) | 270 (6.0%) |
| 45 to 49 Years | 234 (4.9%) | 186 (4.1%) |
| 50 to 54 Years | 237 (5.0%) | 278 (6.1%) |
| 55 to 59 Years | 319 (6.7%) | 207 (4.6%) |
| 60 to 64 Years | 313 (6.6%) | 328 (7.2%) |
| 65 to 69 Years | 204 (4.3%) | 390 (8.6%) |
| 70 to 74 Years | 312 (6.6%) | 408 (9.0%) |
| 75 to 79 Years | 320 (6.7%) | 236 (5.2%) |
| 80 to 84 Years | 105 (2.2%) | 200 (4.4%) |
| 85 Years and over | 52 (1.1%) | 113 (2.5%) |
| Total | 4,759 (100.0%) | 4,527 (100.0%) |
Families and Households in Bernalillo
Median Family Size in Bernalillo
The median family size in Bernalillo is 2.75 persons per family, with married-couple families (1,677 | 64.4%) accounting for the largest median family size of 2.91 persons per family. On the other hand, single female/mother families (709 | 27.3%) represent the smallest median family size with 2.30 persons per family.
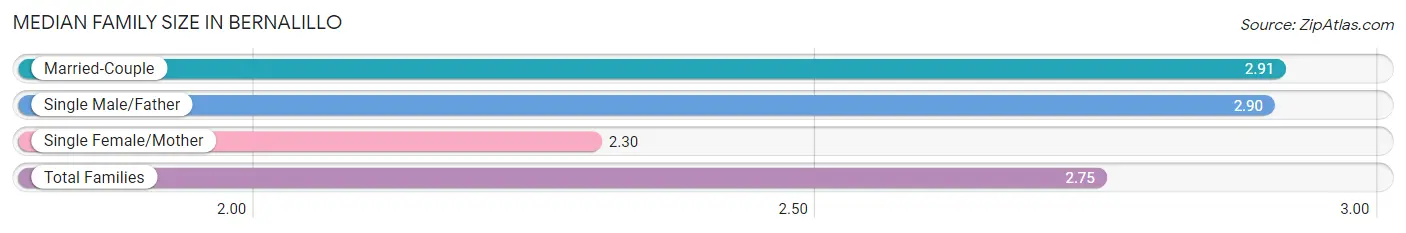
| Family Type | # Families | Family Size |
| Married-Couple | 1,677 (64.4%) | 2.91 |
| Single Male/Father | 216 (8.3%) | 2.90 |
| Single Female/Mother | 709 (27.3%) | 2.30 |
| Total Families | 2,602 (100.0%) | 2.75 |
Median Household Size in Bernalillo
The median household size in Bernalillo is 2.33 persons per household, with single male/father households (216 | 5.5%) accounting for the largest median household size of 3.16 persons per household. non-family households (1,306 | 33.4%) represent the smallest median household size with 1.29 persons per household.
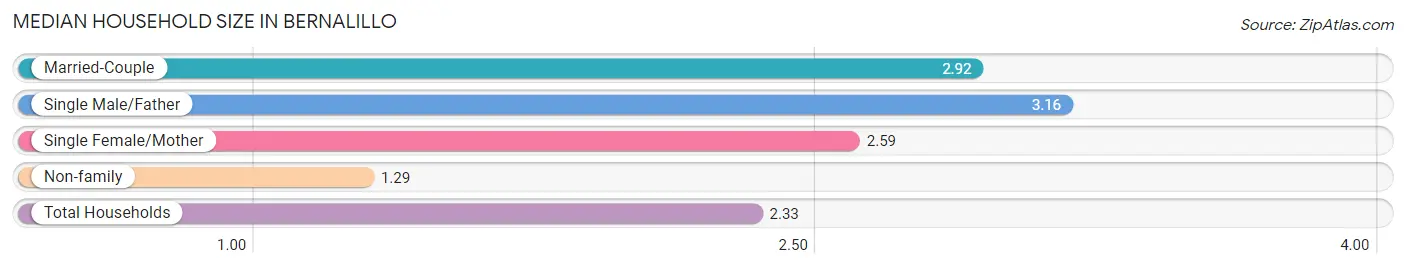
| Household Type | # Households | Household Size |
| Married-Couple | 1,677 (42.9%) | 2.92 |
| Single Male/Father | 216 (5.5%) | 3.16 |
| Single Female/Mother | 709 (18.1%) | 2.59 |
| Non-family | 1,306 (33.4%) | 1.29 |
| Total Households | 3,908 (100.0%) | 2.33 |
Household Size by Marriage Status in Bernalillo
Out of a total of 3,908 households in Bernalillo, 2,602 (66.6%) are family households, while 1,306 (33.4%) are nonfamily households. The most numerous type of family households are 2-person households, comprising 1,279, and the most common type of nonfamily households are 1-person households, comprising 990.
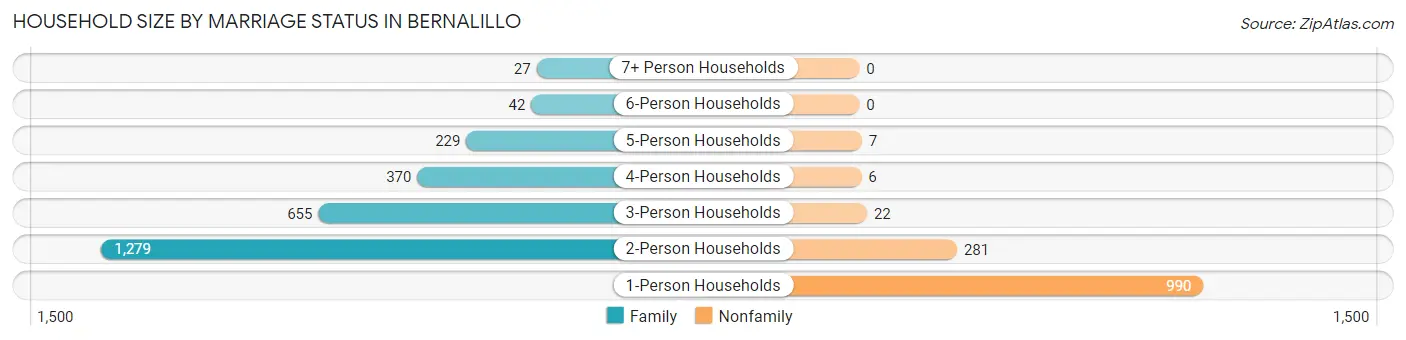
| Household Size | Family Households | Nonfamily Households |
| 1-Person Households | - | 990 (25.3%) |
| 2-Person Households | 1,279 (32.7%) | 281 (7.2%) |
| 3-Person Households | 655 (16.8%) | 22 (0.6%) |
| 4-Person Households | 370 (9.5%) | 6 (0.2%) |
| 5-Person Households | 229 (5.9%) | 7 (0.2%) |
| 6-Person Households | 42 (1.1%) | 0 (0.0%) |
| 7+ Person Households | 27 (0.7%) | 0 (0.0%) |
| Total | 2,602 (66.6%) | 1,306 (33.4%) |
Female Fertility in Bernalillo
Fertility by Age in Bernalillo
Average fertility rate in Bernalillo is 20.0 births per 1,000 women. Women in the age bracket of 20 to 34 years have the highest fertility rate with 29.0 births per 1,000 women. Women in the age bracket of 20 to 34 years acount for 78.0% of all women with births.
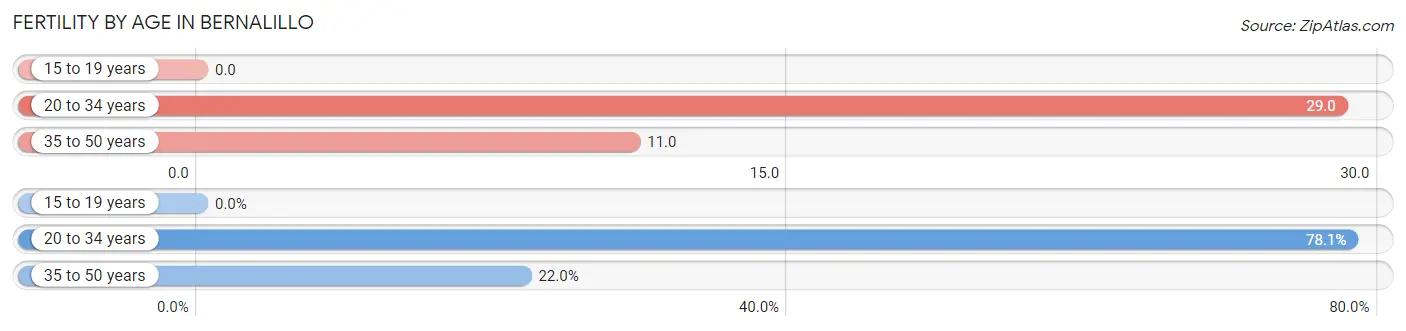
| Age Bracket | Women with Births | Births / 1,000 Women |
| 15 to 19 years | 0 (0.0%) | 0.0 |
| 20 to 34 years | 32 (78.0%) | 29.0 |
| 35 to 50 years | 9 (22.0%) | 11.0 |
| Total | 41 (100.0%) | 20.0 |
Fertility by Age by Marriage Status in Bernalillo
48.8% of women with births (41) in Bernalillo are married. The highest percentage of unmarried women with births falls into 20 to 34 years age bracket with 56.2% of them unmarried at the time of birth, while the lowest percentage of unmarried women with births belong to 35 to 50 years age bracket with 33.3% of them unmarried.
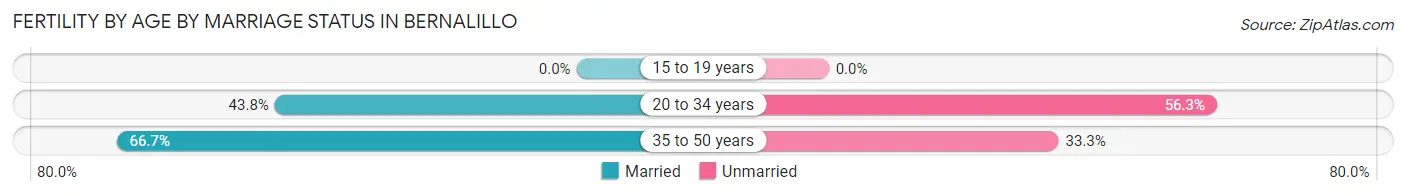
| Age Bracket | Married | Unmarried |
| 15 to 19 years | 0 (0.0%) | 0 (0.0%) |
| 20 to 34 years | 14 (43.8%) | 18 (56.2%) |
| 35 to 50 years | 6 (66.7%) | 3 (33.3%) |
| Total | 20 (48.8%) | 21 (51.2%) |
Fertility by Education in Bernalillo
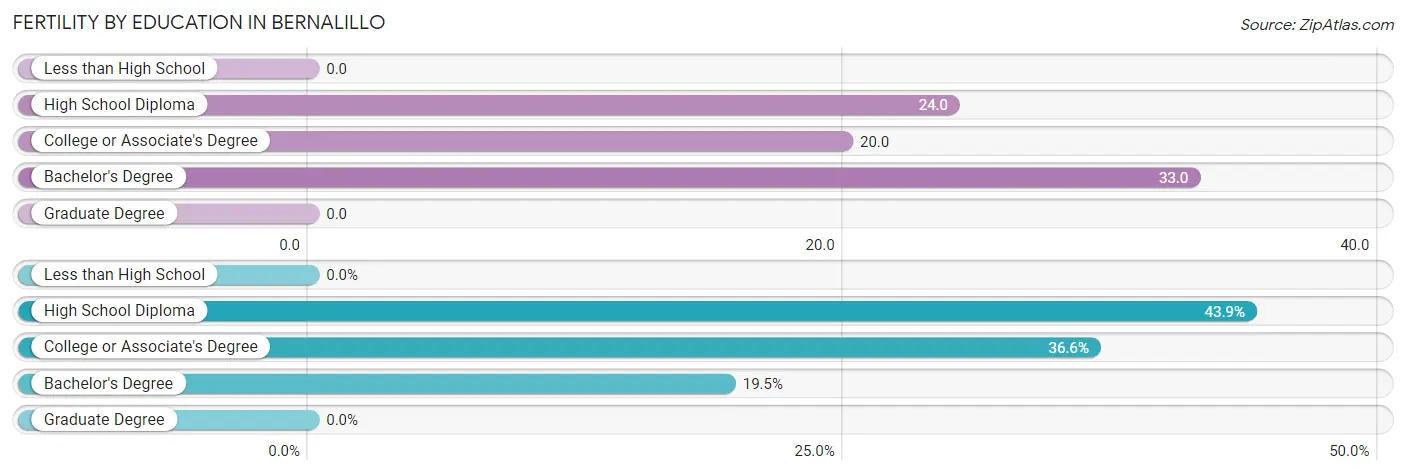
| Educational Attainment | Women with Births | Births / 1,000 Women |
| Less than High School | 0 (0.0%) | 0.0 |
| High School Diploma | 18 (43.9%) | 24.0 |
| College or Associate's Degree | 15 (36.6%) | 20.0 |
| Bachelor's Degree | 8 (19.5%) | 33.0 |
| Graduate Degree | 0 (0.0%) | 0.0 |
| Total | 41 (100.0%) | 20.0 |
Fertility by Education by Marriage Status in Bernalillo
51.2% of women with births in Bernalillo are unmarried. Women with the educational attainment of bachelor's degree are most likely to be married with 100.0% of them married at childbirth, while women with the educational attainment of college or associate's degree are least likely to be married with 80.0% of them unmarried at childbirth.
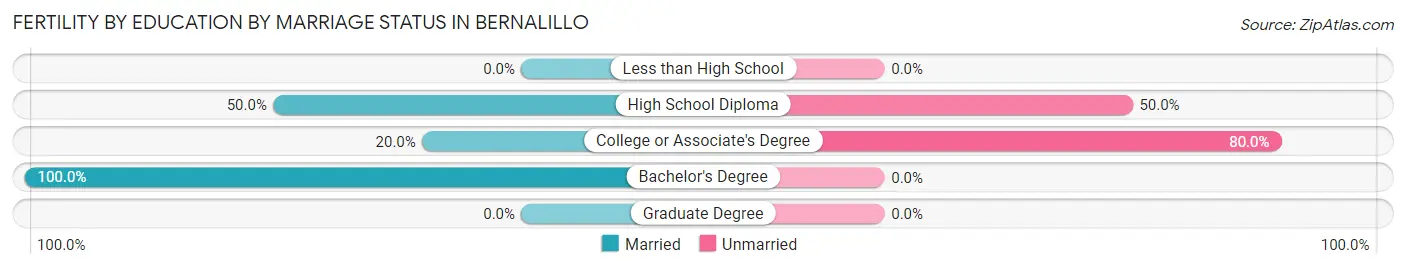
| Educational Attainment | Married | Unmarried |
| Less than High School | 0 (0.0%) | 0 (0.0%) |
| High School Diploma | 9 (50.0%) | 9 (50.0%) |
| College or Associate's Degree | 3 (20.0%) | 12 (80.0%) |
| Bachelor's Degree | 8 (100.0%) | 0 (0.0%) |
| Graduate Degree | 0 (0.0%) | 0 (0.0%) |
| Total | 20 (48.8%) | 21 (51.2%) |
Employment Characteristics in Bernalillo
Employment by Class of Employer in Bernalillo
Among the 3,858 employed individuals in Bernalillo, private company employees (2,642 | 68.5%), local government employees (375 | 9.7%), and self-employed (not incorporated) (244 | 6.3%) make up the most common classes of employment.
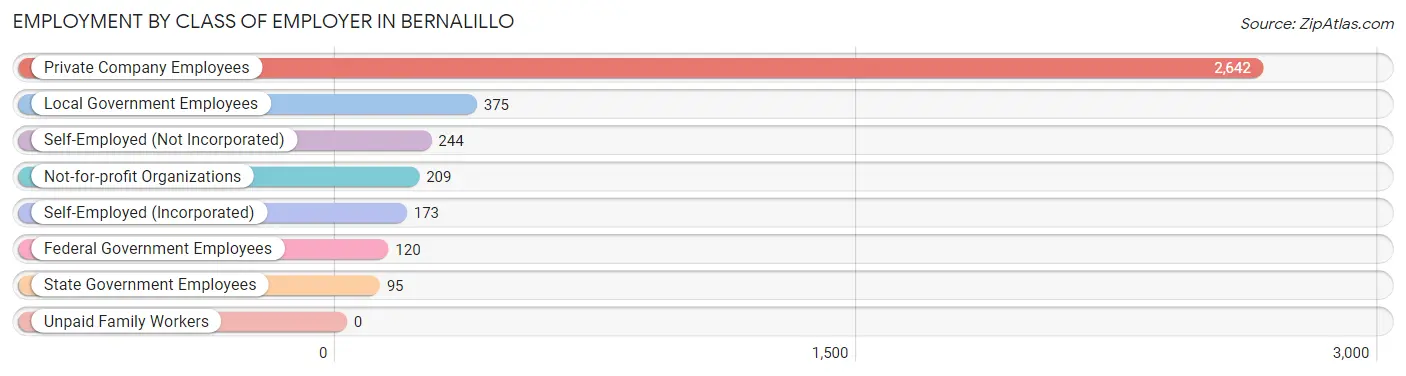
| Employer Class | # Employees | % Employees |
| Private Company Employees | 2,642 | 68.5% |
| Self-Employed (Incorporated) | 173 | 4.5% |
| Self-Employed (Not Incorporated) | 244 | 6.3% |
| Not-for-profit Organizations | 209 | 5.4% |
| Local Government Employees | 375 | 9.7% |
| State Government Employees | 95 | 2.5% |
| Federal Government Employees | 120 | 3.1% |
| Unpaid Family Workers | 0 | 0.0% |
| Total | 3,858 | 100.0% |
Employment Status by Age in Bernalillo
According to the labor force statistics for Bernalillo, out of the total population over 16 years of age (8,015), 52.4% or 4,200 individuals are in the labor force, with 6.2% or 260 of them unemployed. The age group with the highest labor force participation rate is 30 to 34 years, with 82.6% or 362 individuals in the labor force. Within the labor force, the 16 to 19 years age range has the highest percentage of unemployed individuals, with 22.9% or 38 of them being unemployed.
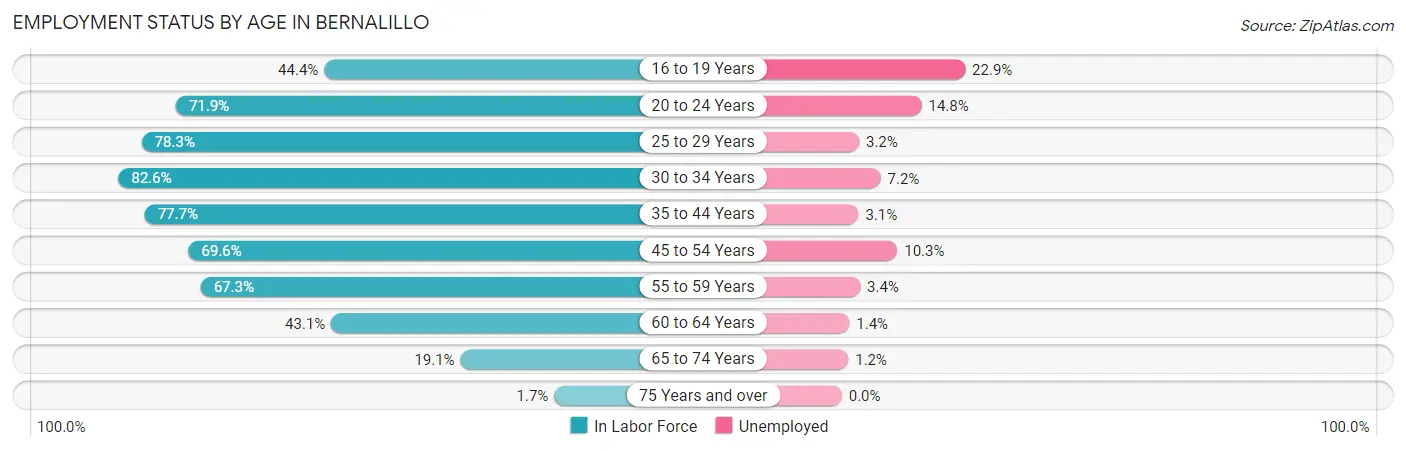
| Age Bracket | In Labor Force | Unemployed |
| 16 to 19 Years | 166 (44.4%) | 38 (22.9%) |
| 20 to 24 Years | 384 (71.9%) | 57 (14.8%) |
| 25 to 29 Years | 835 (78.3%) | 27 (3.2%) |
| 30 to 34 Years | 362 (82.6%) | 26 (7.2%) |
| 35 to 44 Years | 901 (77.7%) | 28 (3.1%) |
| 45 to 54 Years | 651 (69.6%) | 67 (10.3%) |
| 55 to 59 Years | 354 (67.3%) | 12 (3.4%) |
| 60 to 64 Years | 276 (43.1%) | 4 (1.4%) |
| 65 to 74 Years | 251 (19.1%) | 3 (1.2%) |
| 75 Years and over | 17 (1.7%) | 0 (0.0%) |
| Total | 4,200 (52.4%) | 260 (6.2%) |
Employment Status by Educational Attainment in Bernalillo
According to labor force statistics for Bernalillo, 70.9% of individuals (3,380) out of the total population between 25 and 64 years of age (4,767) are in the labor force, with 4.9% or 166 of them being unemployed. The group with the highest labor force participation rate are those with the educational attainment of bachelor's degree or higher, with 89.2% or 600 individuals in the labor force. Within the labor force, individuals with less than high school education have the highest percentage of unemployment, with 12.2% or 59 of them being unemployed.
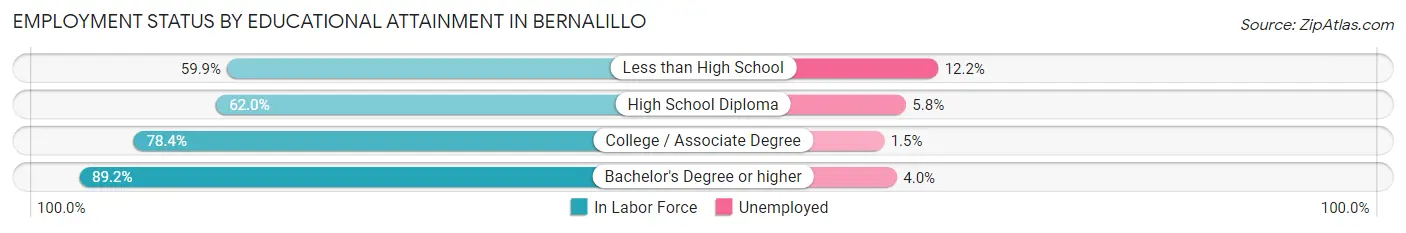
| Educational Attainment | In Labor Force | Unemployed |
| Less than High School | 485 (59.9%) | 99 (12.2%) |
| High School Diploma | 1,061 (62.0%) | 99 (5.8%) |
| College / Associate Degree | 1,232 (78.4%) | 24 (1.5%) |
| Bachelor's Degree or higher | 600 (89.2%) | 27 (4.0%) |
| Total | 3,380 (70.9%) | 234 (4.9%) |
Employment Occupations by Sex in Bernalillo
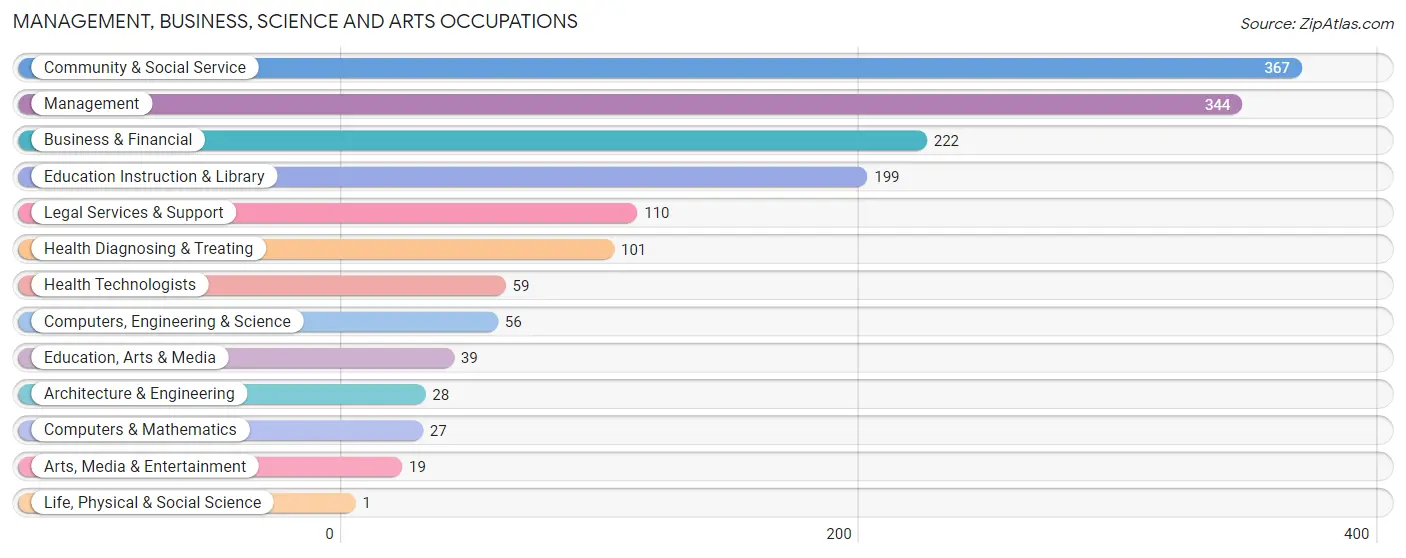
Management, Business, Science and Arts Occupations
The most common Management, Business, Science and Arts occupations in Bernalillo are Community & Social Service (367 | 9.3%), Management (344 | 8.7%), Business & Financial (222 | 5.6%), Education Instruction & Library (199 | 5.1%), and Legal Services & Support (110 | 2.8%).
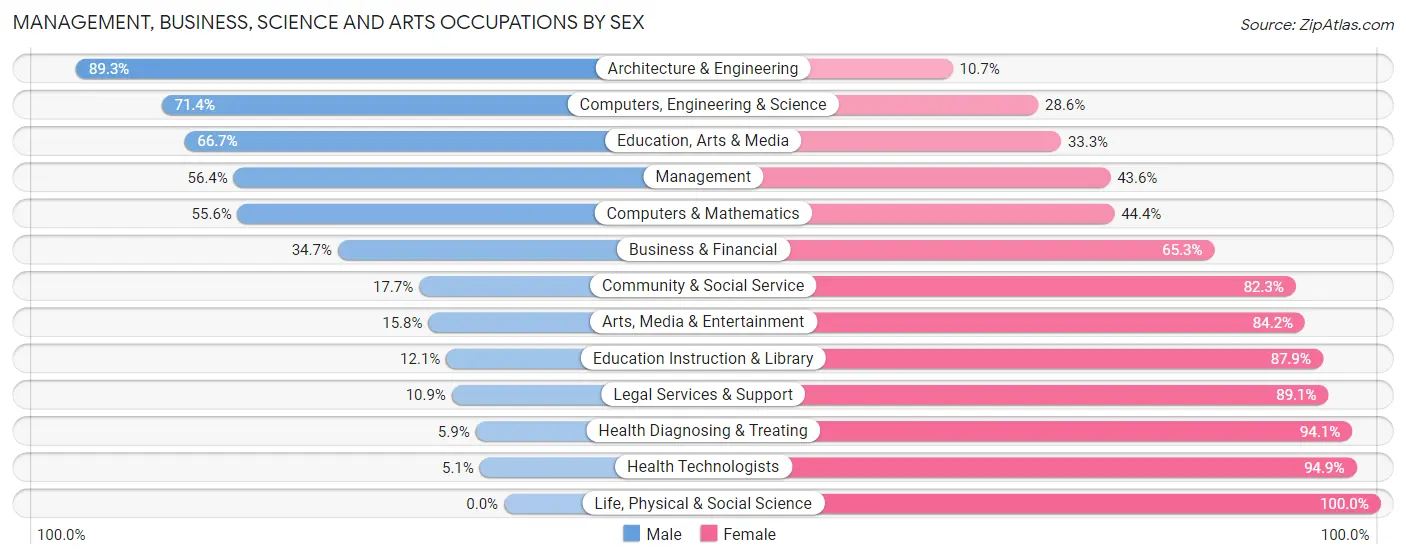
Management, Business, Science and Arts Occupations by Sex
Within the Management, Business, Science and Arts occupations in Bernalillo, the most male-oriented occupations are Architecture & Engineering (89.3%), Computers, Engineering & Science (71.4%), and Education, Arts & Media (66.7%), while the most female-oriented occupations are Life, Physical & Social Science (100.0%), Health Technologists (94.9%), and Health Diagnosing & Treating (94.1%).
| Occupation | Male | Female |
| Management | 194 (56.4%) | 150 (43.6%) |
| Business & Financial | 77 (34.7%) | 145 (65.3%) |
| Computers, Engineering & Science | 40 (71.4%) | 16 (28.6%) |
| Computers & Mathematics | 15 (55.6%) | 12 (44.4%) |
| Architecture & Engineering | 25 (89.3%) | 3 (10.7%) |
| Life, Physical & Social Science | 0 (0.0%) | 1 (100.0%) |
| Community & Social Service | 65 (17.7%) | 302 (82.3%) |
| Education, Arts & Media | 26 (66.7%) | 13 (33.3%) |
| Legal Services & Support | 12 (10.9%) | 98 (89.1%) |
| Education Instruction & Library | 24 (12.1%) | 175 (87.9%) |
| Arts, Media & Entertainment | 3 (15.8%) | 16 (84.2%) |
| Health Diagnosing & Treating | 6 (5.9%) | 95 (94.1%) |
| Health Technologists | 3 (5.1%) | 56 (94.9%) |
| Total (Category) | 382 (35.0%) | 708 (64.9%) |
| Total (Overall) | 2,015 (51.2%) | 1,920 (48.8%) |
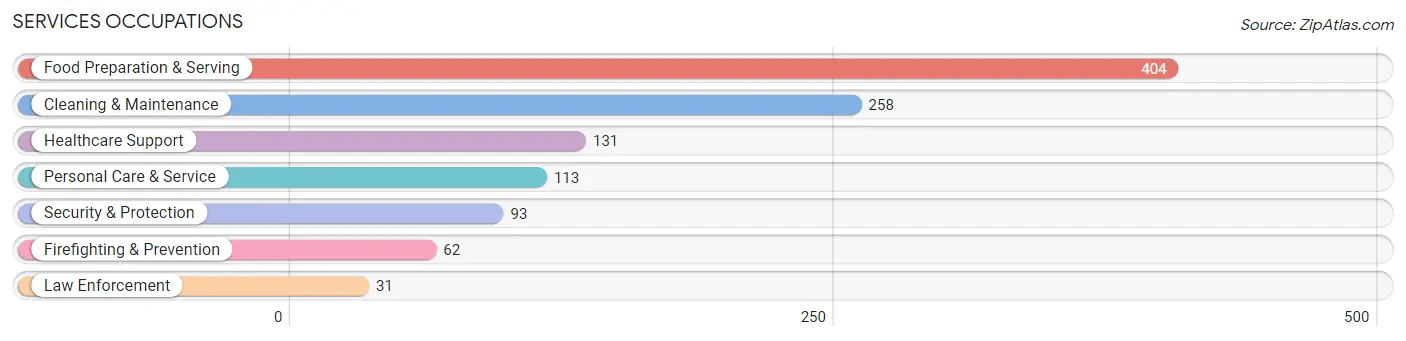
Services Occupations
The most common Services occupations in Bernalillo are Food Preparation & Serving (404 | 10.3%), Cleaning & Maintenance (258 | 6.6%), Healthcare Support (131 | 3.3%), Personal Care & Service (113 | 2.9%), and Security & Protection (93 | 2.4%).
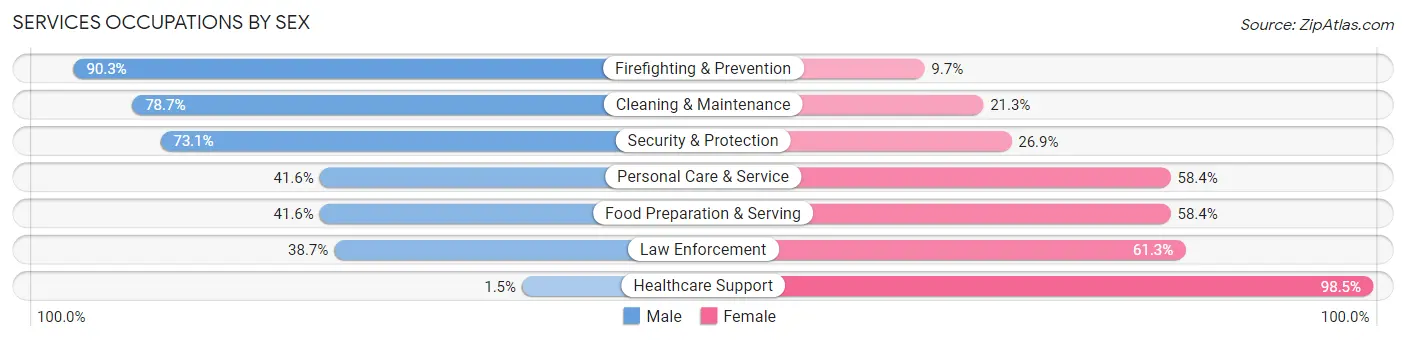
Services Occupations by Sex
Within the Services occupations in Bernalillo, the most male-oriented occupations are Firefighting & Prevention (90.3%), Cleaning & Maintenance (78.7%), and Security & Protection (73.1%), while the most female-oriented occupations are Healthcare Support (98.5%), Law Enforcement (61.3%), and Food Preparation & Serving (58.4%).
| Occupation | Male | Female |
| Healthcare Support | 2 (1.5%) | 129 (98.5%) |
| Security & Protection | 68 (73.1%) | 25 (26.9%) |
| Firefighting & Prevention | 56 (90.3%) | 6 (9.7%) |
| Law Enforcement | 12 (38.7%) | 19 (61.3%) |
| Food Preparation & Serving | 168 (41.6%) | 236 (58.4%) |
| Cleaning & Maintenance | 203 (78.7%) | 55 (21.3%) |
| Personal Care & Service | 47 (41.6%) | 66 (58.4%) |
| Total (Category) | 488 (48.8%) | 511 (51.1%) |
| Total (Overall) | 2,015 (51.2%) | 1,920 (48.8%) |
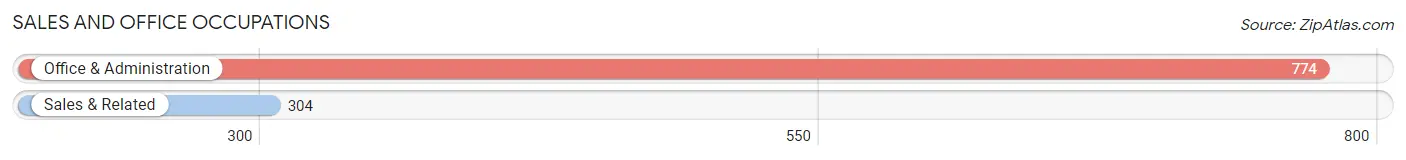
Sales and Office Occupations
The most common Sales and Office occupations in Bernalillo are Office & Administration (774 | 19.7%), and Sales & Related (304 | 7.7%).
Sales and Office Occupations by Sex
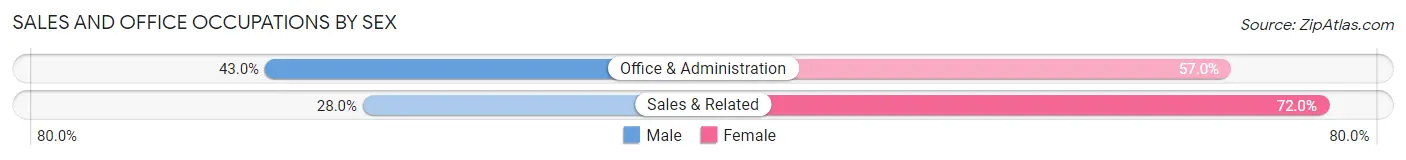
| Occupation | Male | Female |
| Sales & Related | 85 (28.0%) | 219 (72.0%) |
| Office & Administration | 333 (43.0%) | 441 (57.0%) |
| Total (Category) | 418 (38.8%) | 660 (61.2%) |
| Total (Overall) | 2,015 (51.2%) | 1,920 (48.8%) |
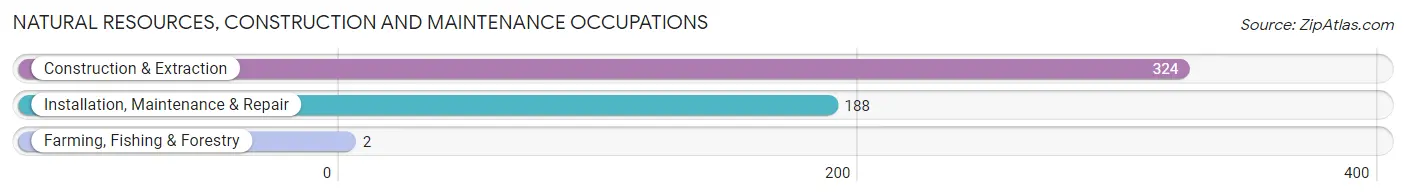
Natural Resources, Construction and Maintenance Occupations
The most common Natural Resources, Construction and Maintenance occupations in Bernalillo are Construction & Extraction (324 | 8.2%), Installation, Maintenance & Repair (188 | 4.8%), and Farming, Fishing & Forestry (2 | 0.1%).
Natural Resources, Construction and Maintenance Occupations by Sex
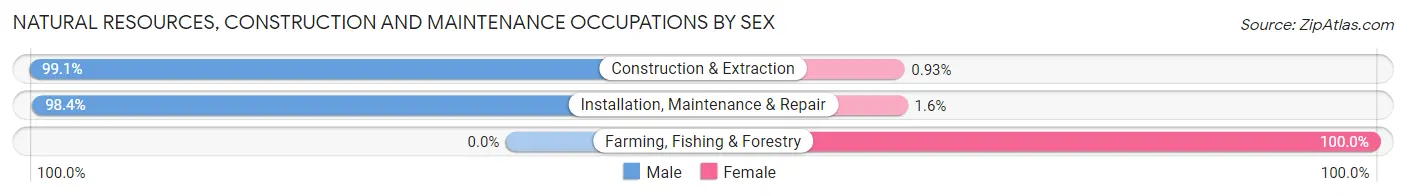
| Occupation | Male | Female |
| Farming, Fishing & Forestry | 0 (0.0%) | 2 (100.0%) |
| Construction & Extraction | 321 (99.1%) | 3 (0.9%) |
| Installation, Maintenance & Repair | 185 (98.4%) | 3 (1.6%) |
| Total (Category) | 506 (98.4%) | 8 (1.6%) |
| Total (Overall) | 2,015 (51.2%) | 1,920 (48.8%) |
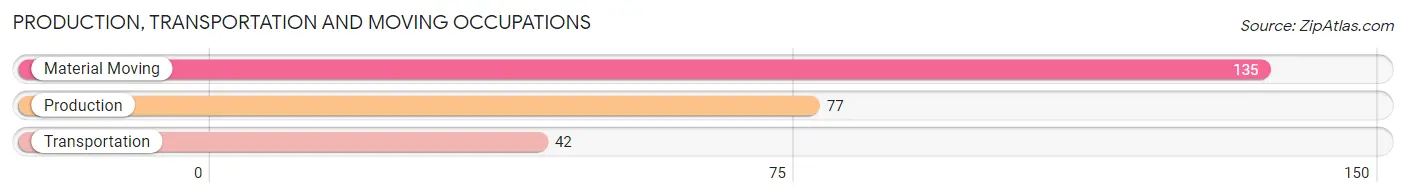
Production, Transportation and Moving Occupations
The most common Production, Transportation and Moving occupations in Bernalillo are Material Moving (135 | 3.4%), Production (77 | 2.0%), and Transportation (42 | 1.1%).
Production, Transportation and Moving Occupations by Sex
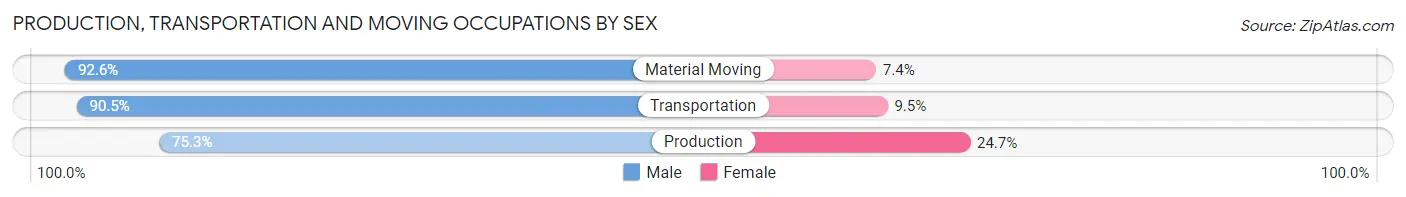
| Occupation | Male | Female |
| Production | 58 (75.3%) | 19 (24.7%) |
| Transportation | 38 (90.5%) | 4 (9.5%) |
| Material Moving | 125 (92.6%) | 10 (7.4%) |
| Total (Category) | 221 (87.0%) | 33 (13.0%) |
| Total (Overall) | 2,015 (51.2%) | 1,920 (48.8%) |
Employment Industries by Sex in Bernalillo
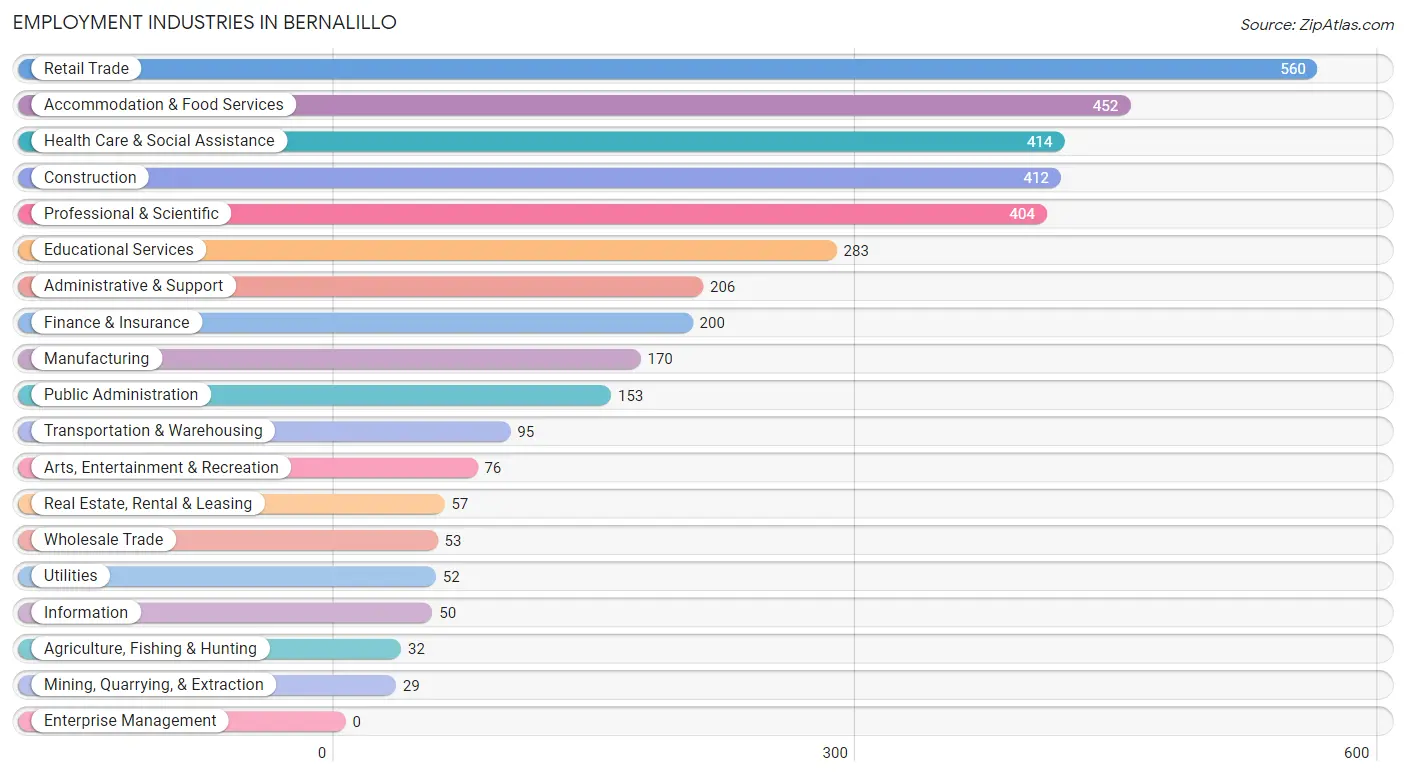
Employment Industries in Bernalillo
The major employment industries in Bernalillo include Retail Trade (560 | 14.2%), Accommodation & Food Services (452 | 11.5%), Health Care & Social Assistance (414 | 10.5%), Construction (412 | 10.5%), and Professional & Scientific (404 | 10.3%).
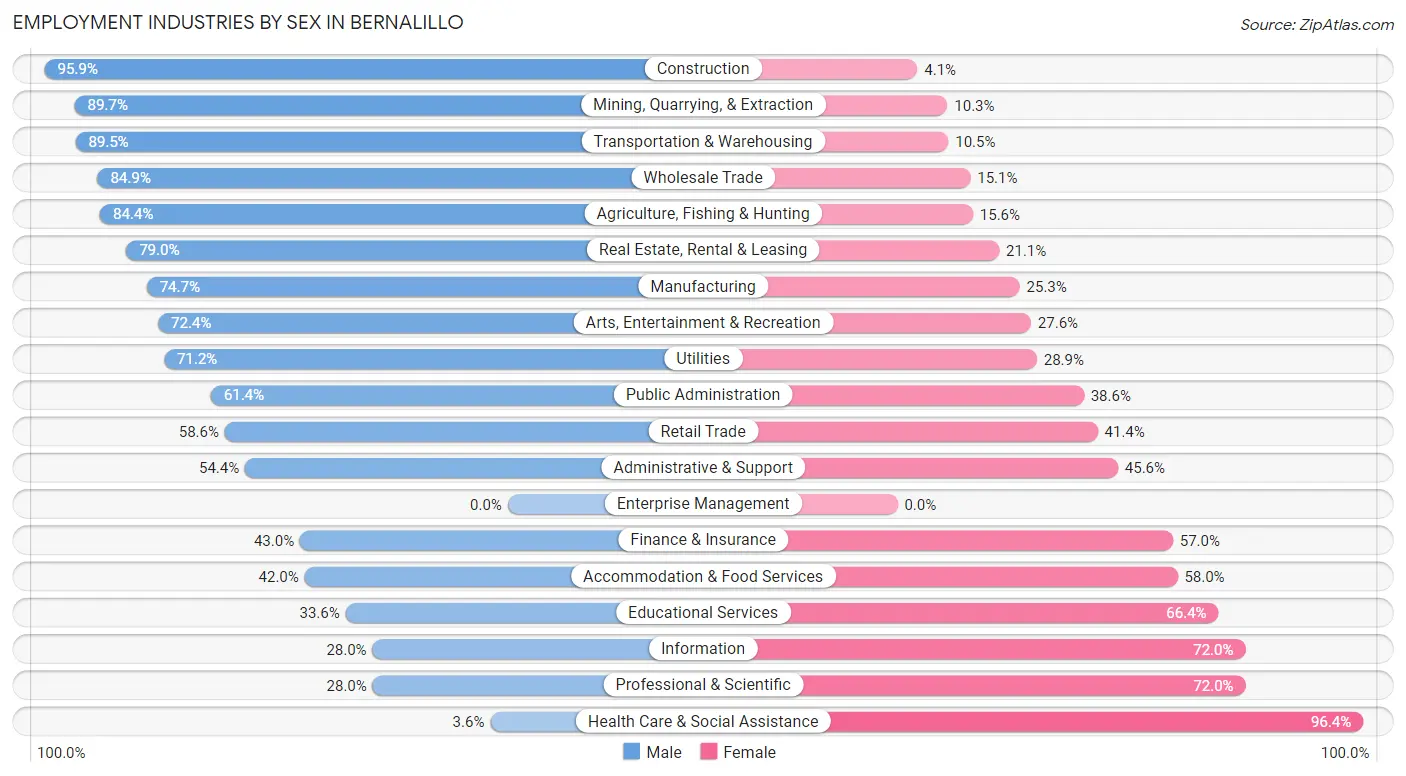
Employment Industries by Sex in Bernalillo
The Bernalillo industries that see more men than women are Construction (95.9%), Mining, Quarrying, & Extraction (89.7%), and Transportation & Warehousing (89.5%), whereas the industries that tend to have a higher number of women are Health Care & Social Assistance (96.4%), Professional & Scientific (72.0%), and Information (72.0%).
| Industry | Male | Female |
| Agriculture, Fishing & Hunting | 27 (84.4%) | 5 (15.6%) |
| Mining, Quarrying, & Extraction | 26 (89.7%) | 3 (10.3%) |
| Construction | 395 (95.9%) | 17 (4.1%) |
| Manufacturing | 127 (74.7%) | 43 (25.3%) |
| Wholesale Trade | 45 (84.9%) | 8 (15.1%) |
| Retail Trade | 328 (58.6%) | 232 (41.4%) |
| Transportation & Warehousing | 85 (89.5%) | 10 (10.5%) |
| Utilities | 37 (71.2%) | 15 (28.8%) |
| Information | 14 (28.0%) | 36 (72.0%) |
| Finance & Insurance | 86 (43.0%) | 114 (57.0%) |
| Real Estate, Rental & Leasing | 45 (78.9%) | 12 (21.0%) |
| Professional & Scientific | 113 (28.0%) | 291 (72.0%) |
| Enterprise Management | 0 (0.0%) | 0 (0.0%) |
| Administrative & Support | 112 (54.4%) | 94 (45.6%) |
| Educational Services | 95 (33.6%) | 188 (66.4%) |
| Health Care & Social Assistance | 15 (3.6%) | 399 (96.4%) |
| Arts, Entertainment & Recreation | 55 (72.4%) | 21 (27.6%) |
| Accommodation & Food Services | 190 (42.0%) | 262 (58.0%) |
| Public Administration | 94 (61.4%) | 59 (38.6%) |
| Total | 2,015 (51.2%) | 1,920 (48.8%) |
Education in Bernalillo
School Enrollment in Bernalillo
The most common levels of schooling among the 1,686 students in Bernalillo are middle school (402 | 23.8%), high school (378 | 22.4%), and college / undergraduate (316 | 18.7%).
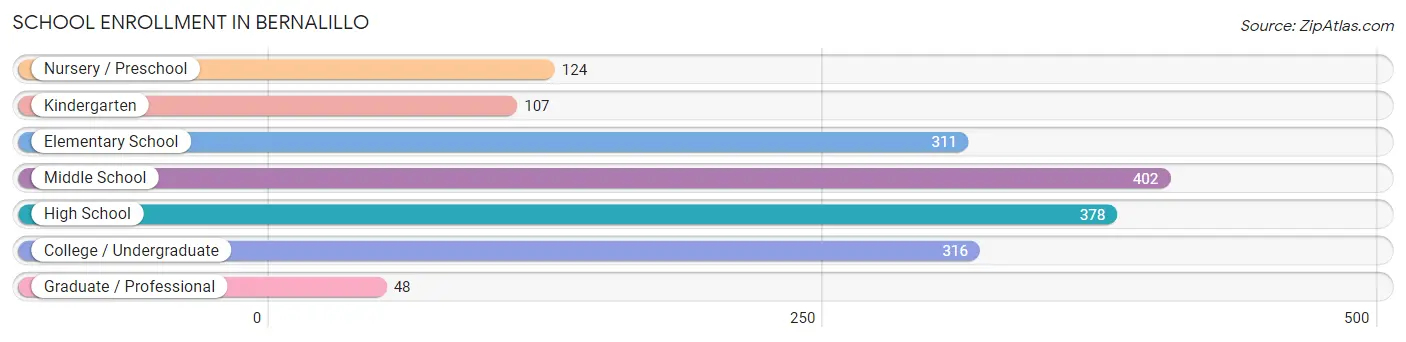
| School Level | # Students | % Students |
| Nursery / Preschool | 124 | 7.3% |
| Kindergarten | 107 | 6.4% |
| Elementary School | 311 | 18.4% |
| Middle School | 402 | 23.8% |
| High School | 378 | 22.4% |
| College / Undergraduate | 316 | 18.7% |
| Graduate / Professional | 48 | 2.9% |
| Total | 1,686 | 100.0% |
School Enrollment by Age by Funding Source in Bernalillo
Out of a total of 1,686 students who are enrolled in schools in Bernalillo, 137 (8.1%) attend a private institution, while the remaining 1,549 (91.9%) are enrolled in public schools. The age group of 25 to 34 year olds has the highest likelihood of being enrolled in private schools, with 42 (23.7% in the age bracket) enrolled. Conversely, the age group of 3 to 4 year olds has the lowest likelihood of being enrolled in a private school, with 117 (100.0% in the age bracket) attending a public institution.
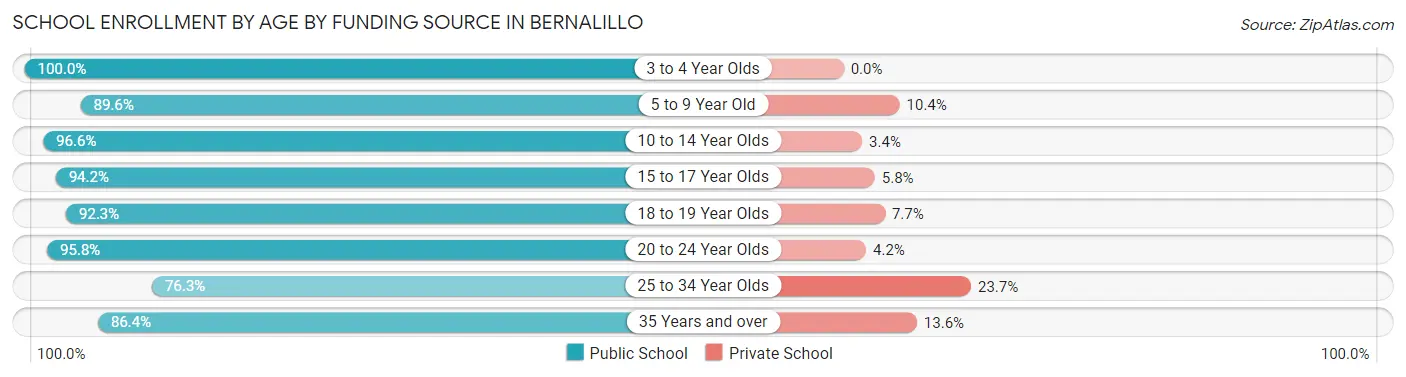
| Age Bracket | Public School | Private School |
| 3 to 4 Year Olds | 117 (100.0%) | 0 (0.0%) |
| 5 to 9 Year Old | 318 (89.6%) | 37 (10.4%) |
| 10 to 14 Year Olds | 477 (96.6%) | 17 (3.4%) |
| 15 to 17 Year Olds | 130 (94.2%) | 8 (5.8%) |
| 18 to 19 Year Olds | 204 (92.3%) | 17 (7.7%) |
| 20 to 24 Year Olds | 92 (95.8%) | 4 (4.2%) |
| 25 to 34 Year Olds | 135 (76.3%) | 42 (23.7%) |
| 35 Years and over | 76 (86.4%) | 12 (13.6%) |
| Total | 1,549 (91.9%) | 137 (8.1%) |
Educational Attainment by Field of Study in Bernalillo
Business (273 | 18.3%), education (246 | 16.5%), science & technology (164 | 11.0%), engineering (142 | 9.5%), and psychology (101 | 6.8%) are the most common fields of study among 1,490 individuals in Bernalillo who have obtained a bachelor's degree or higher.
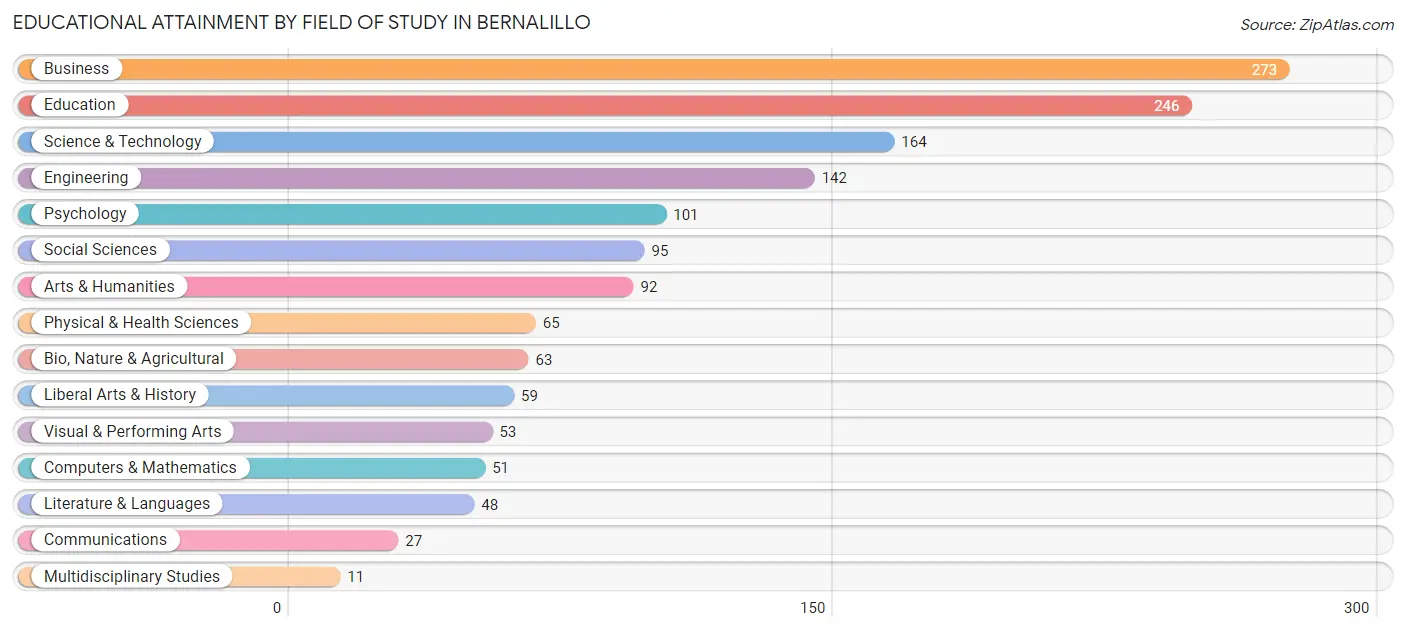
| Field of Study | # Graduates | % Graduates |
| Computers & Mathematics | 51 | 3.4% |
| Bio, Nature & Agricultural | 63 | 4.2% |
| Physical & Health Sciences | 65 | 4.4% |
| Psychology | 101 | 6.8% |
| Social Sciences | 95 | 6.4% |
| Engineering | 142 | 9.5% |
| Multidisciplinary Studies | 11 | 0.7% |
| Science & Technology | 164 | 11.0% |
| Business | 273 | 18.3% |
| Education | 246 | 16.5% |
| Literature & Languages | 48 | 3.2% |
| Liberal Arts & History | 59 | 4.0% |
| Visual & Performing Arts | 53 | 3.6% |
| Communications | 27 | 1.8% |
| Arts & Humanities | 92 | 6.2% |
| Total | 1,490 | 100.0% |
Transportation & Commute in Bernalillo
Vehicle Availability by Sex in Bernalillo
The most prevalent vehicle ownership categories in Bernalillo are males with 2 vehicles (1,039, accounting for 52.0%) and females with 2 vehicles (646, making up 55.9%).
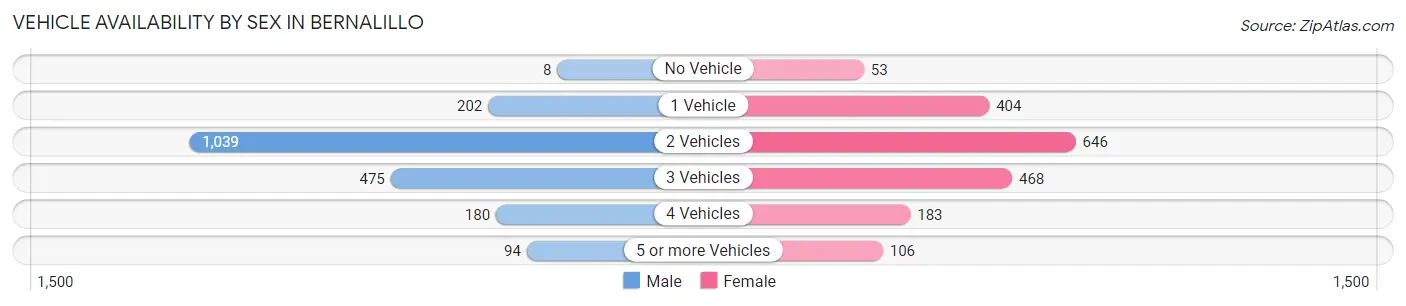
| Vehicles Available | Male | Female |
| No Vehicle | 8 (0.4%) | 53 (2.9%) |
| 1 Vehicle | 202 (10.1%) | 404 (21.7%) |
| 2 Vehicles | 1,039 (52.0%) | 646 (34.7%) |
| 3 Vehicles | 475 (23.8%) | 468 (25.2%) |
| 4 Vehicles | 180 (9.0%) | 183 (9.8%) |
| 5 or more Vehicles | 94 (4.7%) | 106 (5.7%) |
| Total | 1,998 (100.0%) | 1,860 (100.0%) |
Commute Time in Bernalillo
The most frequently occuring commute durations in Bernalillo are 20 to 24 minutes (787 commuters, 24.0%), 30 to 34 minutes (559 commuters, 17.0%), and 15 to 19 minutes (349 commuters, 10.6%).
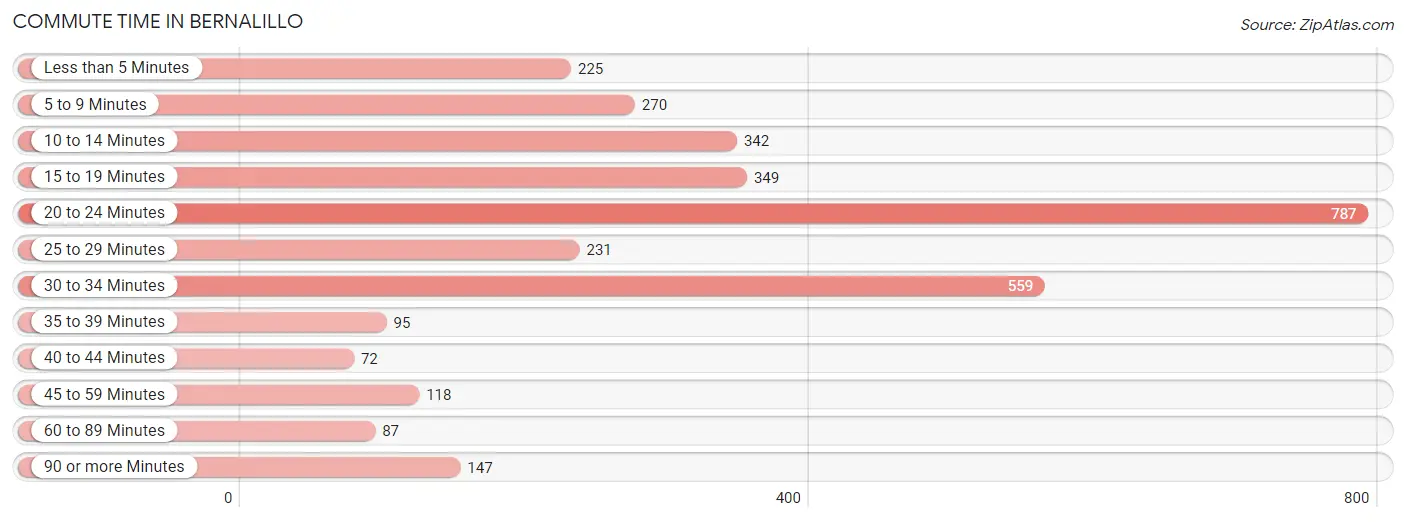
| Commute Time | # Commuters | % Commuters |
| Less than 5 Minutes | 225 | 6.9% |
| 5 to 9 Minutes | 270 | 8.2% |
| 10 to 14 Minutes | 342 | 10.4% |
| 15 to 19 Minutes | 349 | 10.6% |
| 20 to 24 Minutes | 787 | 24.0% |
| 25 to 29 Minutes | 231 | 7.0% |
| 30 to 34 Minutes | 559 | 17.0% |
| 35 to 39 Minutes | 95 | 2.9% |
| 40 to 44 Minutes | 72 | 2.2% |
| 45 to 59 Minutes | 118 | 3.6% |
| 60 to 89 Minutes | 87 | 2.6% |
| 90 or more Minutes | 147 | 4.5% |
Commute Time by Sex in Bernalillo
The most common commute times in Bernalillo are 20 to 24 minutes (431 commuters, 24.5%) for males and 20 to 24 minutes (356 commuters, 23.4%) for females.
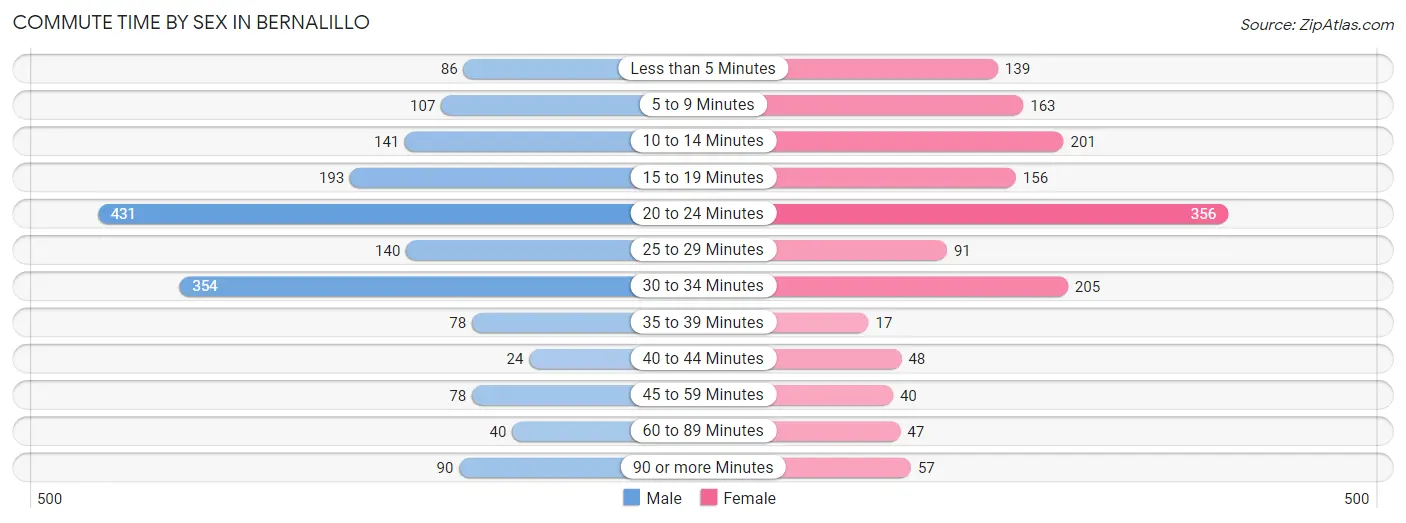
| Commute Time | Male | Female |
| Less than 5 Minutes | 86 (4.9%) | 139 (9.1%) |
| 5 to 9 Minutes | 107 (6.1%) | 163 (10.7%) |
| 10 to 14 Minutes | 141 (8.0%) | 201 (13.2%) |
| 15 to 19 Minutes | 193 (11.0%) | 156 (10.3%) |
| 20 to 24 Minutes | 431 (24.5%) | 356 (23.4%) |
| 25 to 29 Minutes | 140 (8.0%) | 91 (6.0%) |
| 30 to 34 Minutes | 354 (20.1%) | 205 (13.5%) |
| 35 to 39 Minutes | 78 (4.4%) | 17 (1.1%) |
| 40 to 44 Minutes | 24 (1.4%) | 48 (3.2%) |
| 45 to 59 Minutes | 78 (4.4%) | 40 (2.6%) |
| 60 to 89 Minutes | 40 (2.3%) | 47 (3.1%) |
| 90 or more Minutes | 90 (5.1%) | 57 (3.7%) |
Time of Departure to Work by Sex in Bernalillo
The most frequent times of departure to work in Bernalillo are 7:00 AM to 7:29 AM (487, 27.6%) for males and 7:00 AM to 7:29 AM (467, 30.7%) for females.
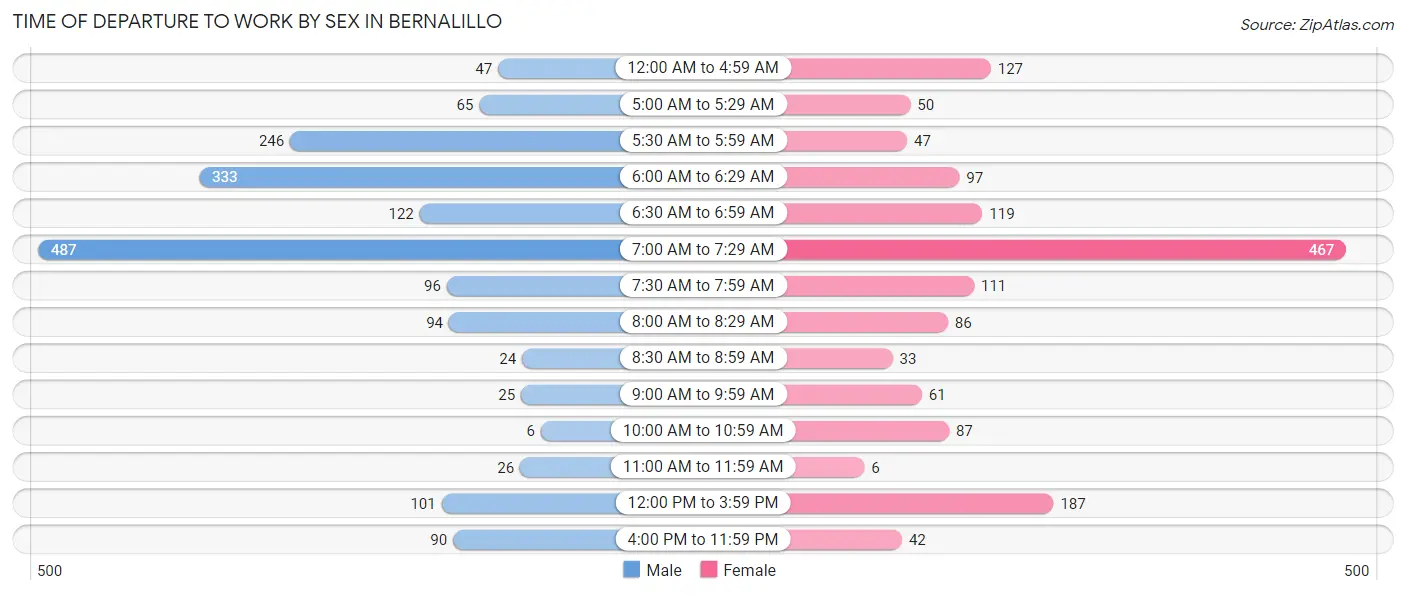
| Time of Departure | Male | Female |
| 12:00 AM to 4:59 AM | 47 (2.7%) | 127 (8.4%) |
| 5:00 AM to 5:29 AM | 65 (3.7%) | 50 (3.3%) |
| 5:30 AM to 5:59 AM | 246 (14.0%) | 47 (3.1%) |
| 6:00 AM to 6:29 AM | 333 (18.9%) | 97 (6.4%) |
| 6:30 AM to 6:59 AM | 122 (6.9%) | 119 (7.8%) |
| 7:00 AM to 7:29 AM | 487 (27.6%) | 467 (30.7%) |
| 7:30 AM to 7:59 AM | 96 (5.4%) | 111 (7.3%) |
| 8:00 AM to 8:29 AM | 94 (5.3%) | 86 (5.7%) |
| 8:30 AM to 8:59 AM | 24 (1.4%) | 33 (2.2%) |
| 9:00 AM to 9:59 AM | 25 (1.4%) | 61 (4.0%) |
| 10:00 AM to 10:59 AM | 6 (0.3%) | 87 (5.7%) |
| 11:00 AM to 11:59 AM | 26 (1.5%) | 6 (0.4%) |
| 12:00 PM to 3:59 PM | 101 (5.7%) | 187 (12.3%) |
| 4:00 PM to 11:59 PM | 90 (5.1%) | 42 (2.8%) |
| Total | 1,762 (100.0%) | 1,520 (100.0%) |
Housing Occupancy in Bernalillo
Occupancy by Ownership in Bernalillo
Of the total 3,908 dwellings in Bernalillo, owner-occupied units account for 3,003 (76.8%), while renter-occupied units make up 905 (23.2%).
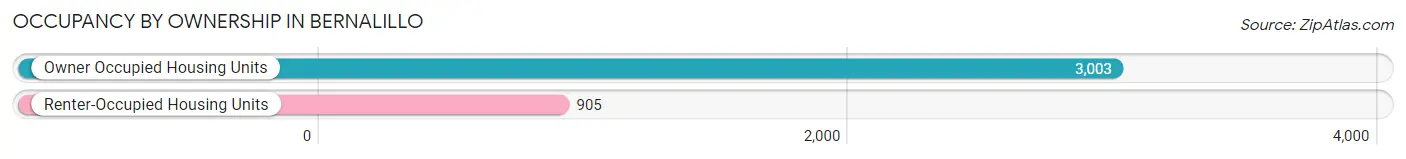
| Occupancy | # Housing Units | % Housing Units |
| Owner Occupied Housing Units | 3,003 | 76.8% |
| Renter-Occupied Housing Units | 905 | 23.2% |
| Total Occupied Housing Units | 3,908 | 100.0% |
Occupancy by Household Size in Bernalillo
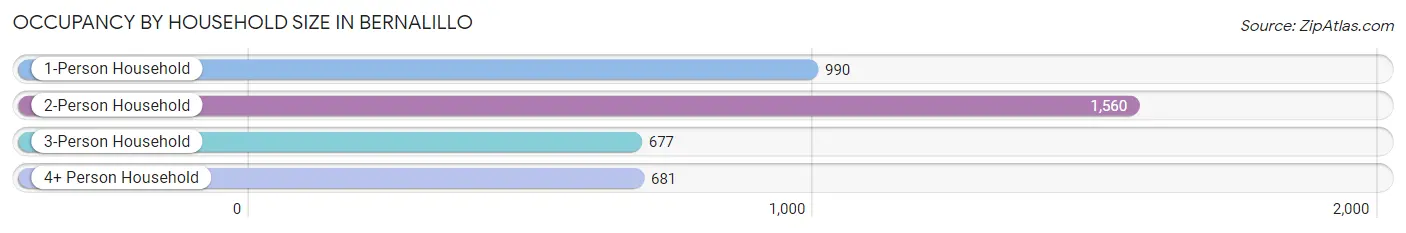
| Household Size | # Housing Units | % Housing Units |
| 1-Person Household | 990 | 25.3% |
| 2-Person Household | 1,560 | 39.9% |
| 3-Person Household | 677 | 17.3% |
| 4+ Person Household | 681 | 17.4% |
| Total Housing Units | 3,908 | 100.0% |
Occupancy by Ownership by Household Size in Bernalillo
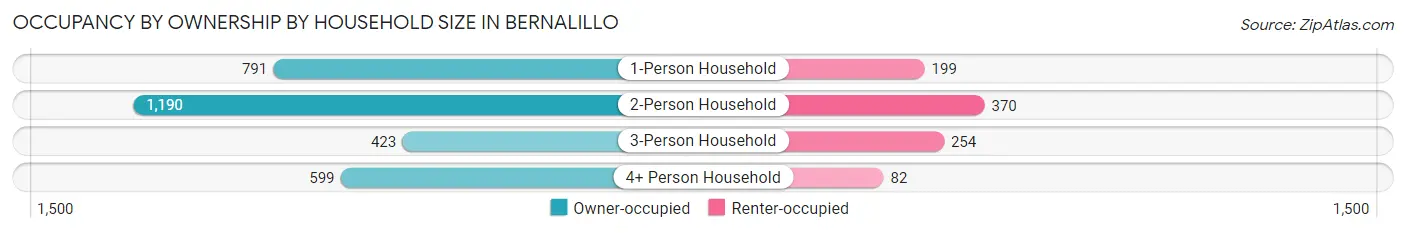
| Household Size | Owner-occupied | Renter-occupied |
| 1-Person Household | 791 (79.9%) | 199 (20.1%) |
| 2-Person Household | 1,190 (76.3%) | 370 (23.7%) |
| 3-Person Household | 423 (62.5%) | 254 (37.5%) |
| 4+ Person Household | 599 (88.0%) | 82 (12.0%) |
| Total Housing Units | 3,003 (76.8%) | 905 (23.2%) |
Occupancy by Educational Attainment in Bernalillo
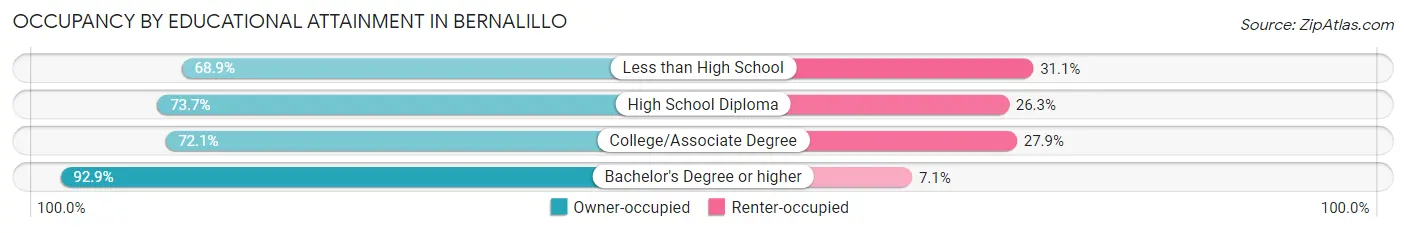
| Household Size | Owner-occupied | Renter-occupied |
| Less than High School | 449 (68.9%) | 203 (31.1%) |
| High School Diploma | 866 (73.7%) | 309 (26.3%) |
| College/Associate Degree | 851 (72.1%) | 329 (27.9%) |
| Bachelor's Degree or higher | 837 (92.9%) | 64 (7.1%) |
Occupancy by Age of Householder in Bernalillo
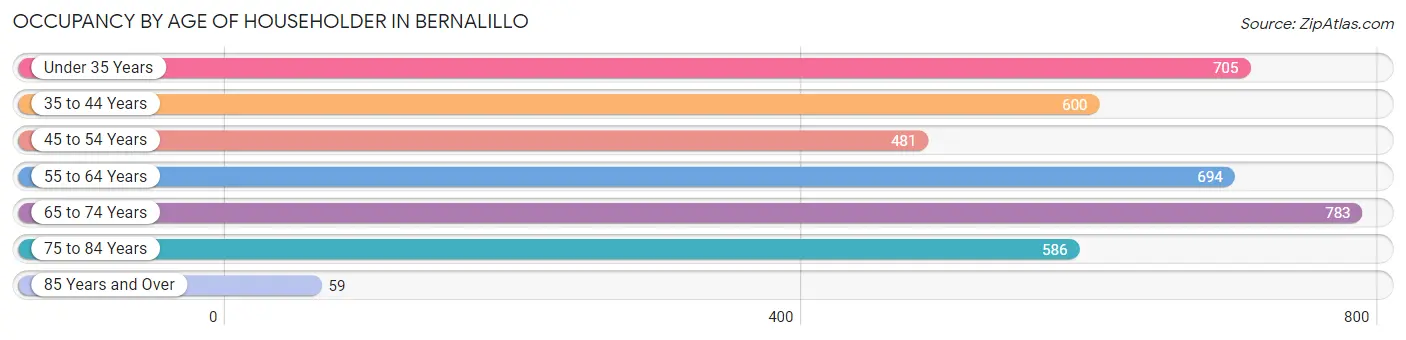
| Age Bracket | # Households | % Households |
| Under 35 Years | 705 | 18.0% |
| 35 to 44 Years | 600 | 15.3% |
| 45 to 54 Years | 481 | 12.3% |
| 55 to 64 Years | 694 | 17.8% |
| 65 to 74 Years | 783 | 20.0% |
| 75 to 84 Years | 586 | 15.0% |
| 85 Years and Over | 59 | 1.5% |
| Total | 3,908 | 100.0% |
Housing Finances in Bernalillo
Median Income by Occupancy in Bernalillo
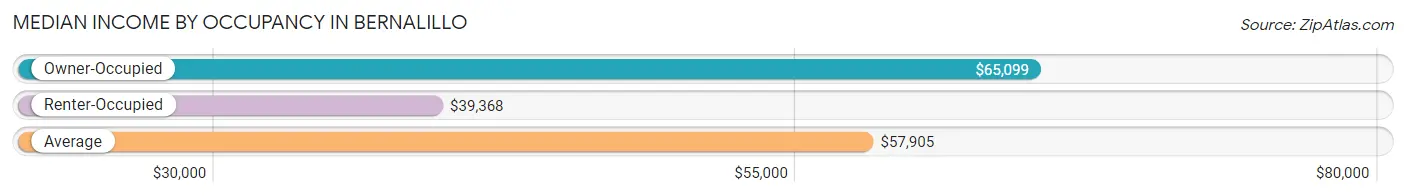
| Occupancy Type | # Households | Median Income |
| Owner-Occupied | 3,003 (76.8%) | $65,099 |
| Renter-Occupied | 905 (23.2%) | $39,368 |
| Average | 3,908 (100.0%) | $57,905 |
Occupancy by Householder Income Bracket in Bernalillo
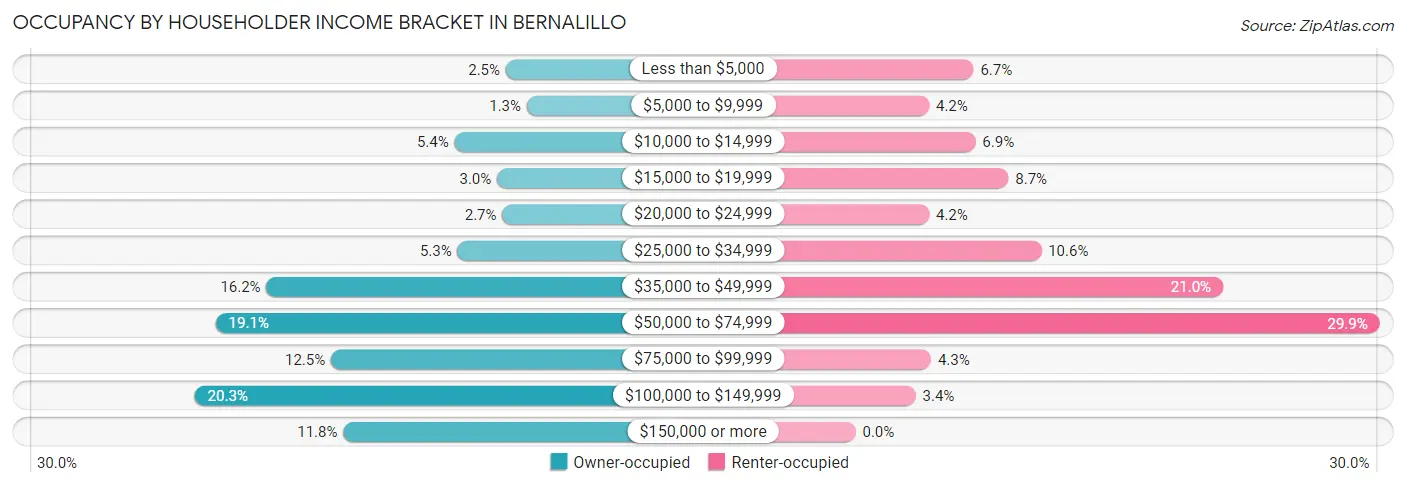
| Income Bracket | Owner-occupied | Renter-occupied |
| Less than $5,000 | 75 (2.5%) | 61 (6.7%) |
| $5,000 to $9,999 | 39 (1.3%) | 38 (4.2%) |
| $10,000 to $14,999 | 163 (5.4%) | 62 (6.9%) |
| $15,000 to $19,999 | 90 (3.0%) | 79 (8.7%) |
| $20,000 to $24,999 | 81 (2.7%) | 38 (4.2%) |
| $25,000 to $34,999 | 158 (5.3%) | 96 (10.6%) |
| $35,000 to $49,999 | 486 (16.2%) | 190 (21.0%) |
| $50,000 to $74,999 | 573 (19.1%) | 271 (29.9%) |
| $75,000 to $99,999 | 375 (12.5%) | 39 (4.3%) |
| $100,000 to $149,999 | 609 (20.3%) | 31 (3.4%) |
| $150,000 or more | 354 (11.8%) | 0 (0.0%) |
| Total | 3,003 (100.0%) | 905 (100.0%) |
Monthly Housing Cost Tiers in Bernalillo
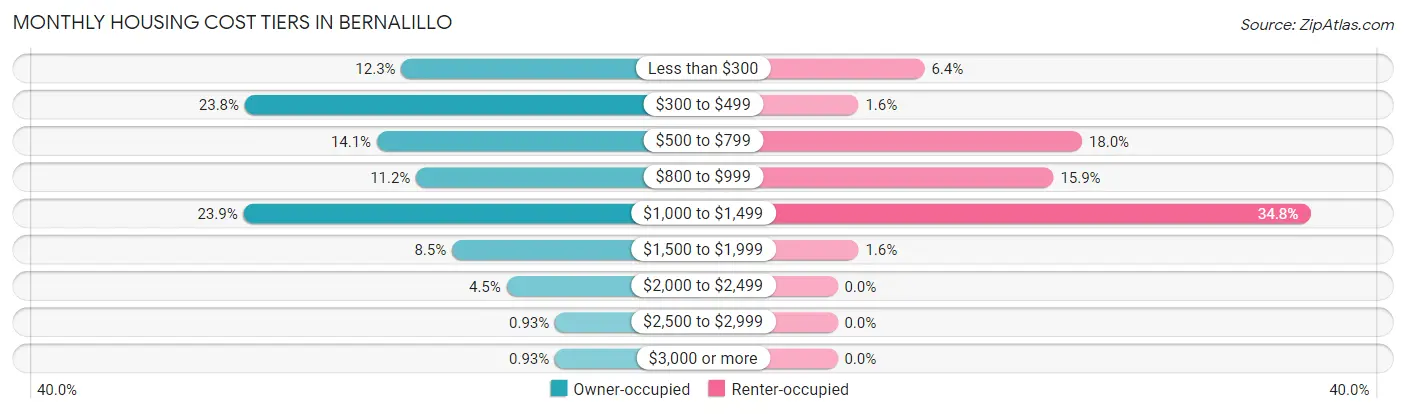
| Monthly Cost | Owner-occupied | Renter-occupied |
| Less than $300 | 368 (12.2%) | 58 (6.4%) |
| $300 to $499 | 714 (23.8%) | 14 (1.5%) |
| $500 to $799 | 422 (14.1%) | 163 (18.0%) |
| $800 to $999 | 335 (11.2%) | 144 (15.9%) |
| $1,000 to $1,499 | 717 (23.9%) | 315 (34.8%) |
| $1,500 to $1,999 | 256 (8.5%) | 14 (1.5%) |
| $2,000 to $2,499 | 135 (4.5%) | 0 (0.0%) |
| $2,500 to $2,999 | 28 (0.9%) | 0 (0.0%) |
| $3,000 or more | 28 (0.9%) | 0 (0.0%) |
| Total | 3,003 (100.0%) | 905 (100.0%) |
Physical Housing Characteristics in Bernalillo
Housing Structures in Bernalillo
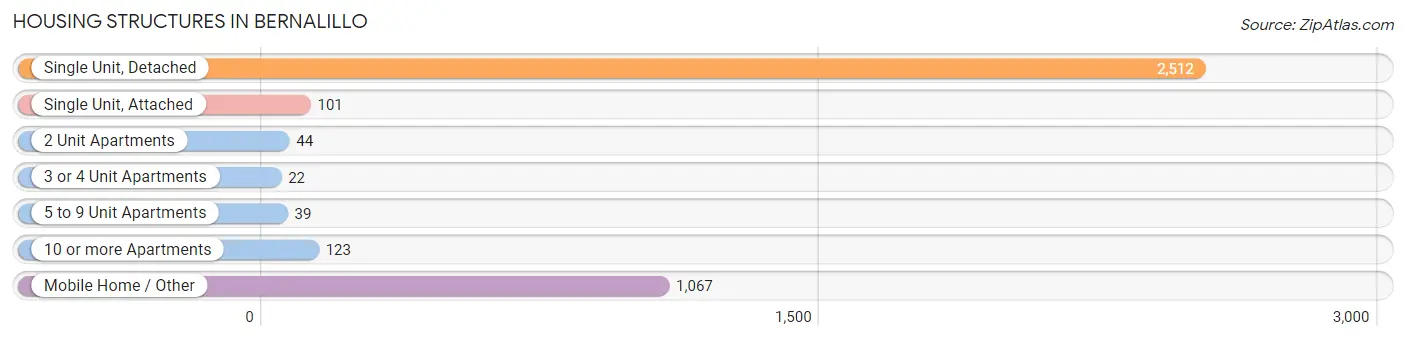
| Structure Type | # Housing Units | % Housing Units |
| Single Unit, Detached | 2,512 | 64.3% |
| Single Unit, Attached | 101 | 2.6% |
| 2 Unit Apartments | 44 | 1.1% |
| 3 or 4 Unit Apartments | 22 | 0.6% |
| 5 to 9 Unit Apartments | 39 | 1.0% |
| 10 or more Apartments | 123 | 3.2% |
| Mobile Home / Other | 1,067 | 27.3% |
| Total | 3,908 | 100.0% |
Housing Structures by Occupancy in Bernalillo
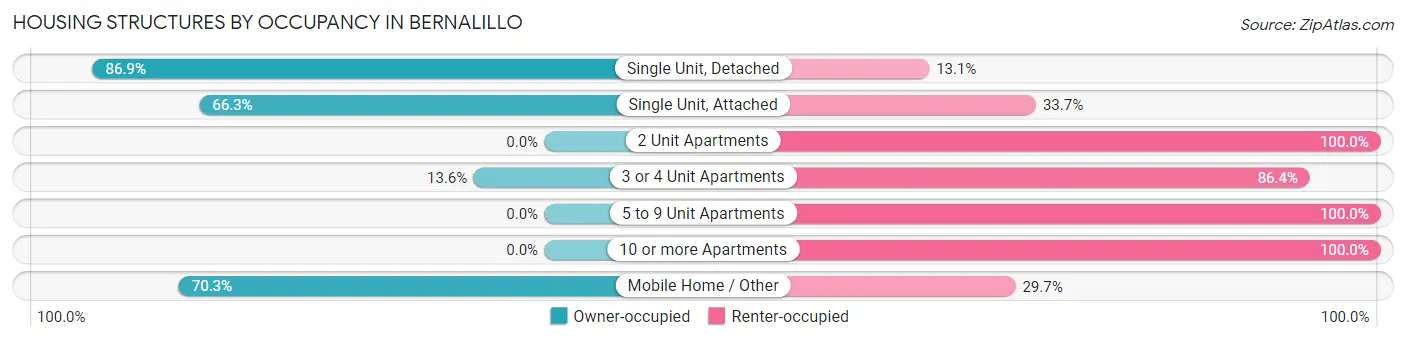
| Structure Type | Owner-occupied | Renter-occupied |
| Single Unit, Detached | 2,183 (86.9%) | 329 (13.1%) |
| Single Unit, Attached | 67 (66.3%) | 34 (33.7%) |
| 2 Unit Apartments | 0 (0.0%) | 44 (100.0%) |
| 3 or 4 Unit Apartments | 3 (13.6%) | 19 (86.4%) |
| 5 to 9 Unit Apartments | 0 (0.0%) | 39 (100.0%) |
| 10 or more Apartments | 0 (0.0%) | 123 (100.0%) |
| Mobile Home / Other | 750 (70.3%) | 317 (29.7%) |
| Total | 3,003 (76.8%) | 905 (23.2%) |
Housing Structures by Number of Rooms in Bernalillo
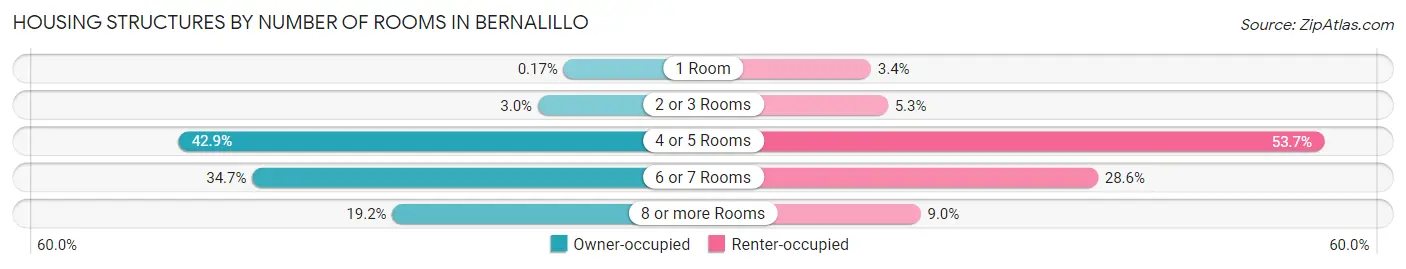
| Number of Rooms | Owner-occupied | Renter-occupied |
| 1 Room | 5 (0.2%) | 31 (3.4%) |
| 2 or 3 Rooms | 91 (3.0%) | 48 (5.3%) |
| 4 or 5 Rooms | 1,288 (42.9%) | 486 (53.7%) |
| 6 or 7 Rooms | 1,043 (34.7%) | 259 (28.6%) |
| 8 or more Rooms | 576 (19.2%) | 81 (8.9%) |
| Total | 3,003 (100.0%) | 905 (100.0%) |
Housing Structure by Heating Type in Bernalillo
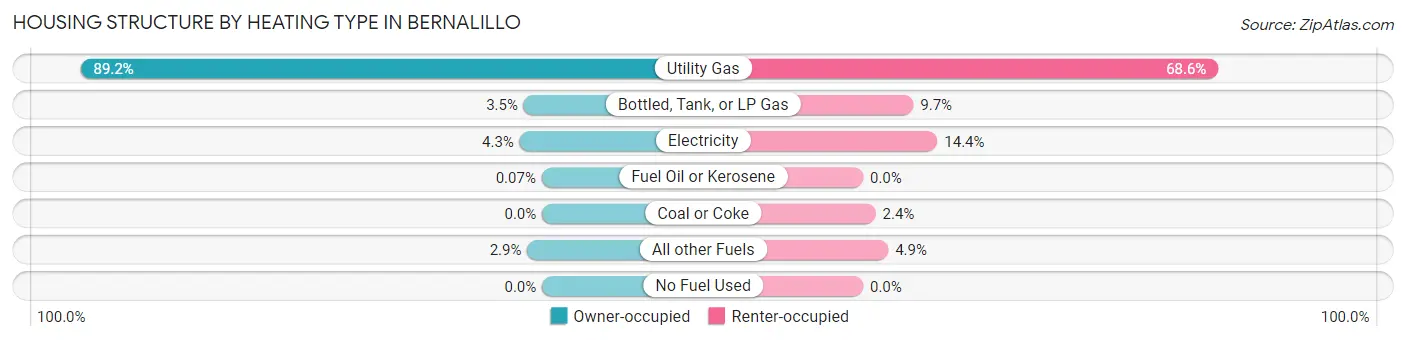
| Heating Type | Owner-occupied | Renter-occupied |
| Utility Gas | 2,679 (89.2%) | 621 (68.6%) |
| Bottled, Tank, or LP Gas | 106 (3.5%) | 88 (9.7%) |
| Electricity | 130 (4.3%) | 130 (14.4%) |
| Fuel Oil or Kerosene | 2 (0.1%) | 0 (0.0%) |
| Coal or Coke | 0 (0.0%) | 22 (2.4%) |
| All other Fuels | 86 (2.9%) | 44 (4.9%) |
| No Fuel Used | 0 (0.0%) | 0 (0.0%) |
| Total | 3,003 (100.0%) | 905 (100.0%) |
Household Vehicle Usage in Bernalillo
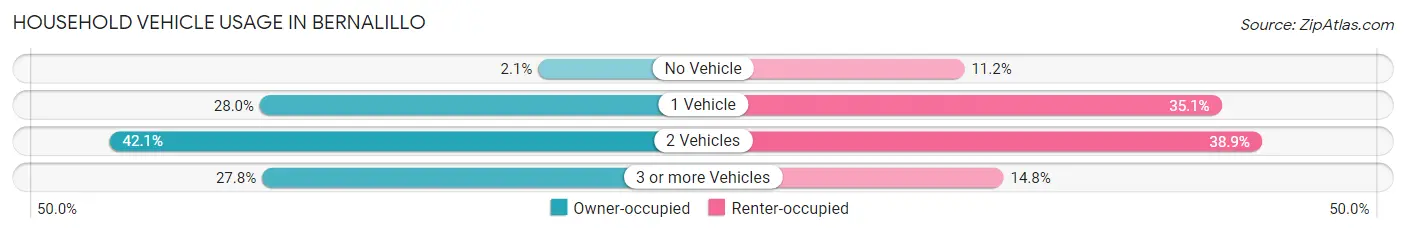
| Vehicles per Household | Owner-occupied | Renter-occupied |
| No Vehicle | 62 (2.1%) | 101 (11.2%) |
| 1 Vehicle | 842 (28.0%) | 318 (35.1%) |
| 2 Vehicles | 1,263 (42.1%) | 352 (38.9%) |
| 3 or more Vehicles | 836 (27.8%) | 134 (14.8%) |
| Total | 3,003 (100.0%) | 905 (100.0%) |
Real Estate & Mortgages in Bernalillo
Real Estate and Mortgage Overview in Bernalillo
| Characteristic | Without Mortgage | With Mortgage |
| Housing Units | 1,617 | 1,386 |
| Median Property Value | $164,500 | $241,100 |
| Median Household Income | $63,348 | $264 |
| Monthly Housing Costs | $428 | $28 |
| Real Estate Taxes | $1,188 | $49 |
Property Value by Mortgage Status in Bernalillo
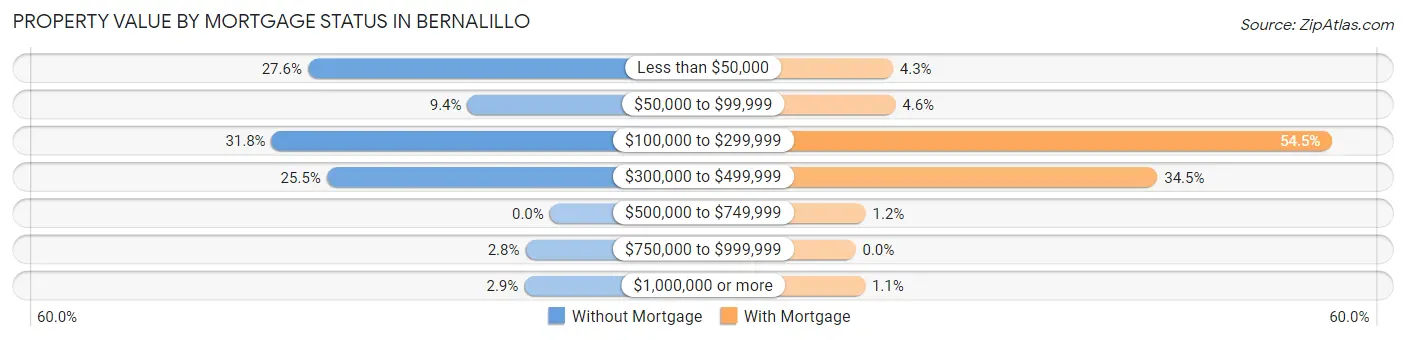
| Property Value | Without Mortgage | With Mortgage |
| Less than $50,000 | 447 (27.6%) | 59 (4.3%) |
| $50,000 to $99,999 | 152 (9.4%) | 63 (4.5%) |
| $100,000 to $299,999 | 514 (31.8%) | 755 (54.5%) |
| $300,000 to $499,999 | 412 (25.5%) | 478 (34.5%) |
| $500,000 to $749,999 | 0 (0.0%) | 16 (1.1%) |
| $750,000 to $999,999 | 45 (2.8%) | 0 (0.0%) |
| $1,000,000 or more | 47 (2.9%) | 15 (1.1%) |
| Total | 1,617 (100.0%) | 1,386 (100.0%) |
Household Income by Mortgage Status in Bernalillo
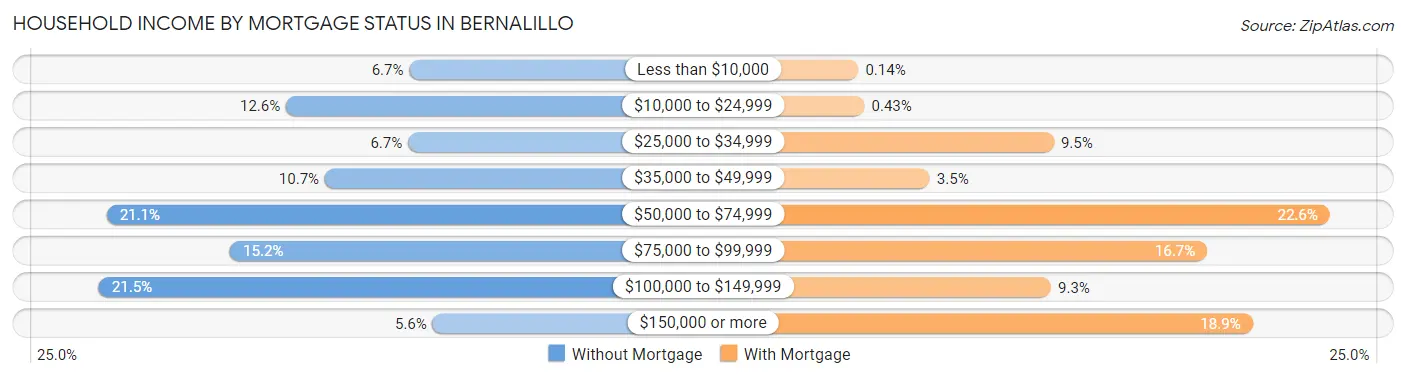
| Household Income | Without Mortgage | With Mortgage |
| Less than $10,000 | 108 (6.7%) | 2 (0.1%) |
| $10,000 to $24,999 | 203 (12.6%) | 6 (0.4%) |
| $25,000 to $34,999 | 109 (6.7%) | 131 (9.5%) |
| $35,000 to $49,999 | 173 (10.7%) | 49 (3.5%) |
| $50,000 to $74,999 | 341 (21.1%) | 313 (22.6%) |
| $75,000 to $99,999 | 246 (15.2%) | 232 (16.7%) |
| $100,000 to $149,999 | 347 (21.5%) | 129 (9.3%) |
| $150,000 or more | 90 (5.6%) | 262 (18.9%) |
| Total | 1,617 (100.0%) | 1,386 (100.0%) |
Property Value to Household Income Ratio in Bernalillo
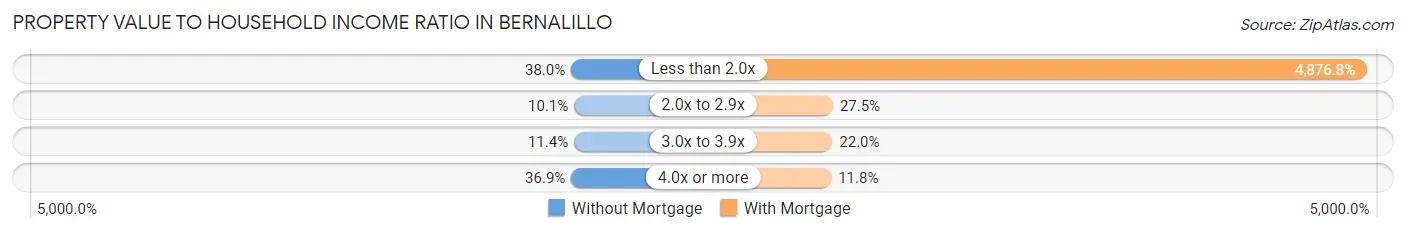
| Value-to-Income Ratio | Without Mortgage | With Mortgage |
| Less than 2.0x | 615 (38.0%) | 67,593 (4,876.8%) |
| 2.0x to 2.9x | 164 (10.1%) | 381 (27.5%) |
| 3.0x to 3.9x | 185 (11.4%) | 305 (22.0%) |
| 4.0x or more | 596 (36.9%) | 163 (11.8%) |
| Total | 1,617 (100.0%) | 1,386 (100.0%) |
Real Estate Taxes by Mortgage Status in Bernalillo
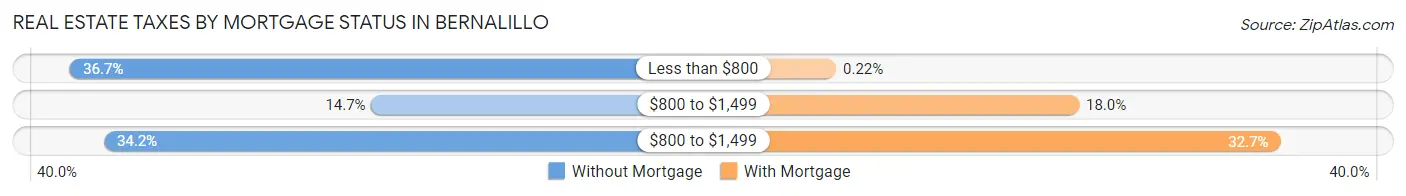
| Property Taxes | Without Mortgage | With Mortgage |
| Less than $800 | 593 (36.7%) | 3 (0.2%) |
| $800 to $1,499 | 237 (14.7%) | 249 (18.0%) |
| $800 to $1,499 | 553 (34.2%) | 453 (32.7%) |
| Total | 1,617 (100.0%) | 1,386 (100.0%) |
Health & Disability in Bernalillo
Health Insurance Coverage by Age in Bernalillo
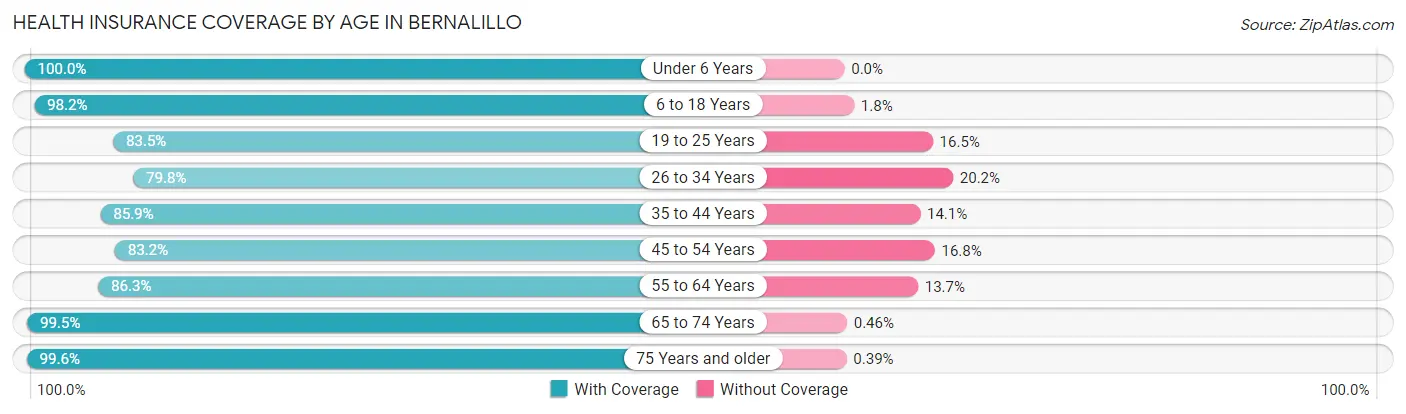
| Age Bracket | With Coverage | Without Coverage |
| Under 6 Years | 406 (100.0%) | 0 (0.0%) |
| 6 to 18 Years | 1,098 (98.2%) | 20 (1.8%) |
| 19 to 25 Years | 816 (83.5%) | 161 (16.5%) |
| 26 to 34 Years | 871 (79.8%) | 221 (20.2%) |
| 35 to 44 Years | 948 (85.9%) | 156 (14.1%) |
| 45 to 54 Years | 751 (83.2%) | 152 (16.8%) |
| 55 to 64 Years | 1,001 (86.3%) | 159 (13.7%) |
| 65 to 74 Years | 1,308 (99.5%) | 6 (0.5%) |
| 75 Years and older | 1,022 (99.6%) | 4 (0.4%) |
| Total | 8,221 (90.3%) | 879 (9.7%) |
Health Insurance Coverage by Citizenship Status in Bernalillo
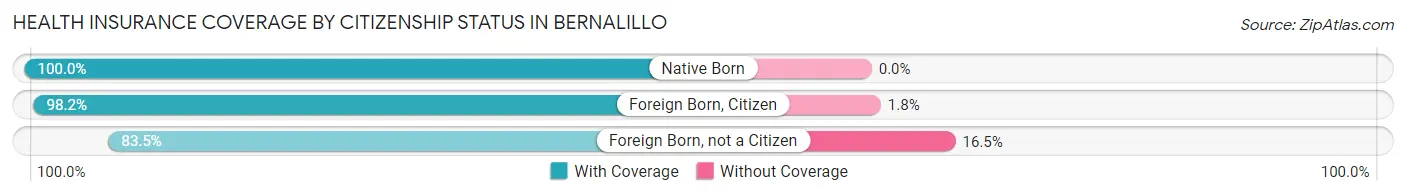
| Citizenship Status | With Coverage | Without Coverage |
| Native Born | 406 (100.0%) | 0 (0.0%) |
| Foreign Born, Citizen | 1,098 (98.2%) | 20 (1.8%) |
| Foreign Born, not a Citizen | 816 (83.5%) | 161 (16.5%) |
Health Insurance Coverage by Household Income in Bernalillo
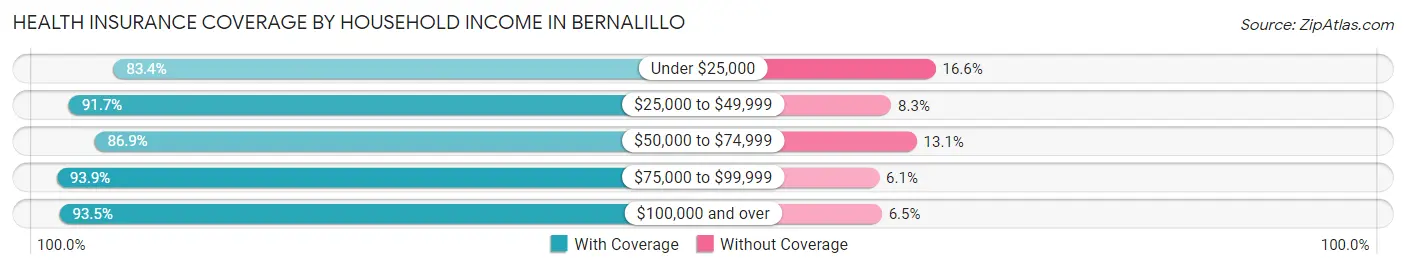
| Household Income | With Coverage | Without Coverage |
| Under $25,000 | 1,008 (83.4%) | 201 (16.6%) |
| $25,000 to $49,999 | 2,008 (91.7%) | 182 (8.3%) |
| $50,000 to $74,999 | 1,713 (86.9%) | 258 (13.1%) |
| $75,000 to $99,999 | 1,148 (93.9%) | 74 (6.1%) |
| $100,000 and over | 2,344 (93.5%) | 164 (6.5%) |
Public vs Private Health Insurance Coverage by Age in Bernalillo
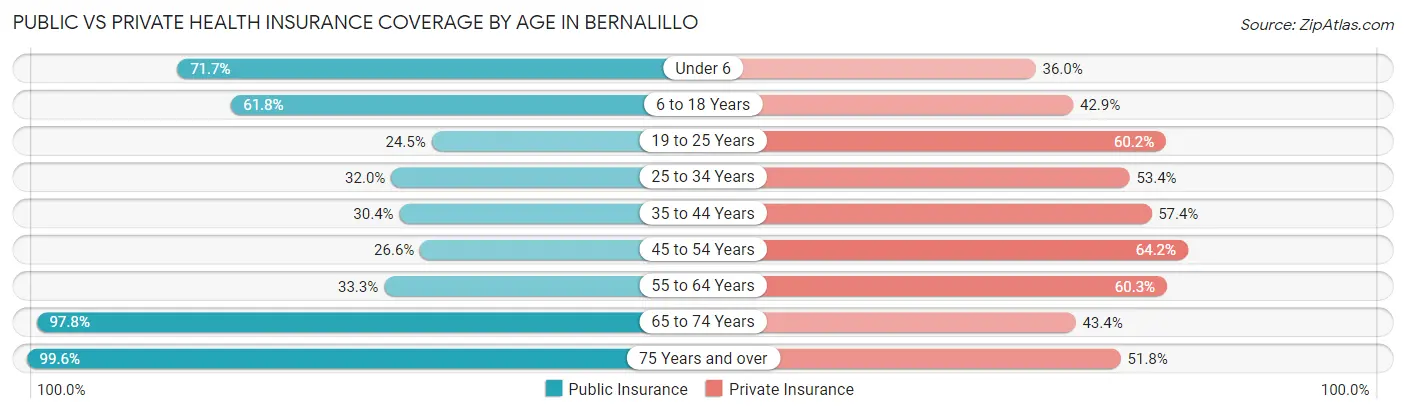
| Age Bracket | Public Insurance | Private Insurance |
| Under 6 | 291 (71.7%) | 146 (36.0%) |
| 6 to 18 Years | 691 (61.8%) | 480 (42.9%) |
| 19 to 25 Years | 239 (24.5%) | 588 (60.2%) |
| 25 to 34 Years | 349 (32.0%) | 583 (53.4%) |
| 35 to 44 Years | 336 (30.4%) | 634 (57.4%) |
| 45 to 54 Years | 240 (26.6%) | 580 (64.2%) |
| 55 to 64 Years | 386 (33.3%) | 700 (60.3%) |
| 65 to 74 Years | 1,285 (97.8%) | 570 (43.4%) |
| 75 Years and over | 1,022 (99.6%) | 531 (51.7%) |
| Total | 4,839 (53.2%) | 4,812 (52.9%) |
Disability Status by Sex by Age in Bernalillo
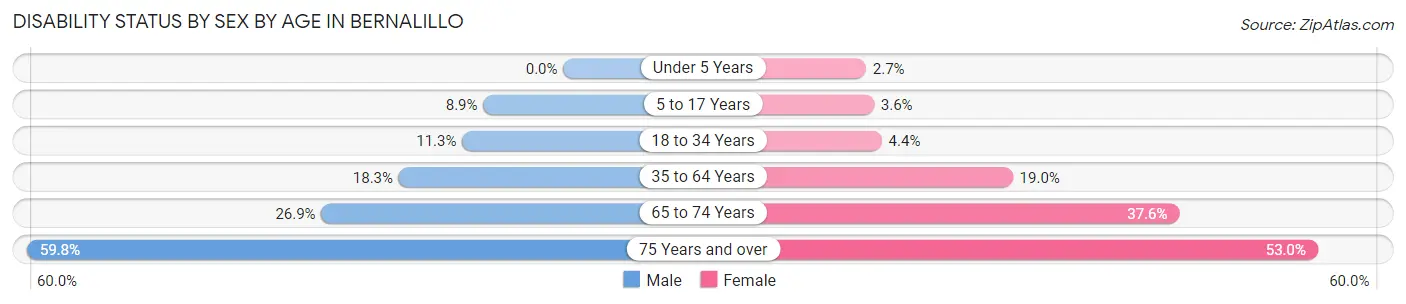
| Age Bracket | Male | Female |
| Under 5 Years | 0 (0.0%) | 3 (2.7%) |
| 5 to 17 Years | 62 (8.9%) | 12 (3.6%) |
| 18 to 34 Years | 119 (11.3%) | 52 (4.4%) |
| 35 to 64 Years | 301 (18.3%) | 290 (19.0%) |
| 65 to 74 Years | 139 (26.9%) | 300 (37.6%) |
| 75 Years and over | 285 (59.8%) | 291 (53.0%) |
Disability Class by Sex by Age in Bernalillo
Disability Class: Hearing Difficulty
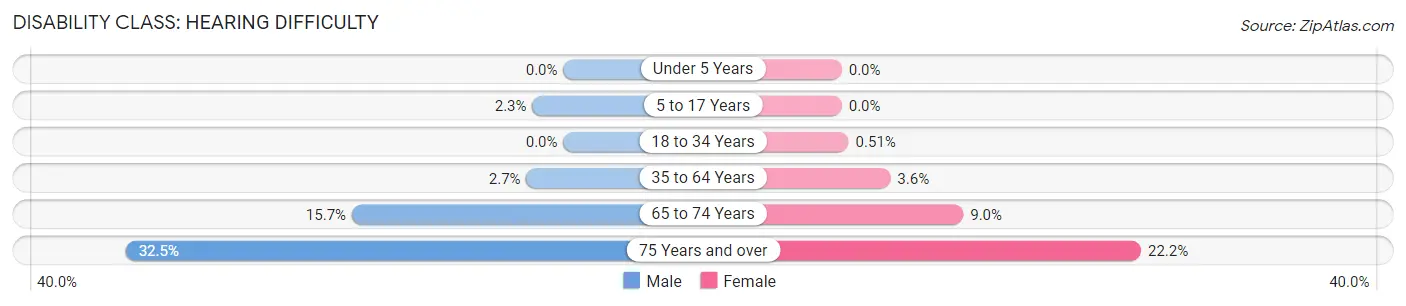
| Age Bracket | Male | Female |
| Under 5 Years | 0 (0.0%) | 0 (0.0%) |
| 5 to 17 Years | 16 (2.3%) | 0 (0.0%) |
| 18 to 34 Years | 0 (0.0%) | 6 (0.5%) |
| 35 to 64 Years | 45 (2.7%) | 55 (3.6%) |
| 65 to 74 Years | 81 (15.7%) | 72 (9.0%) |
| 75 Years and over | 155 (32.5%) | 122 (22.2%) |
Disability Class: Vision Difficulty
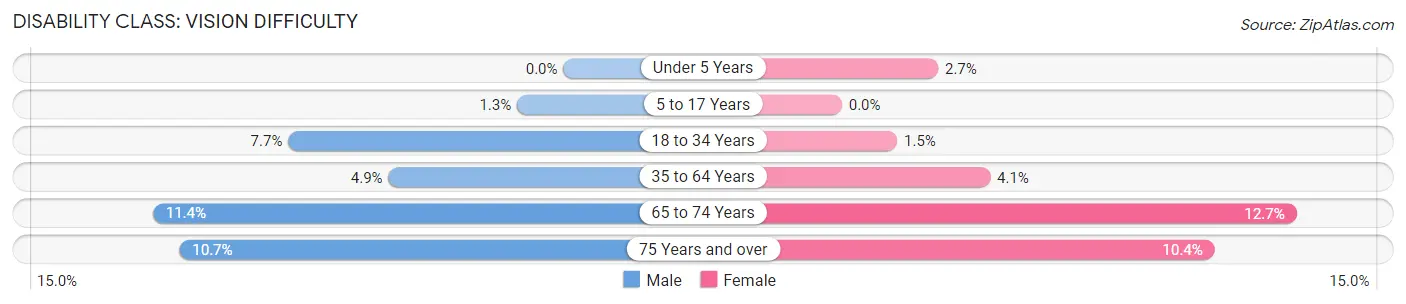
| Age Bracket | Male | Female |
| Under 5 Years | 0 (0.0%) | 3 (2.7%) |
| 5 to 17 Years | 9 (1.3%) | 0 (0.0%) |
| 18 to 34 Years | 81 (7.7%) | 18 (1.5%) |
| 35 to 64 Years | 80 (4.9%) | 63 (4.1%) |
| 65 to 74 Years | 59 (11.4%) | 101 (12.7%) |
| 75 Years and over | 51 (10.7%) | 57 (10.4%) |
Disability Class: Cognitive Difficulty
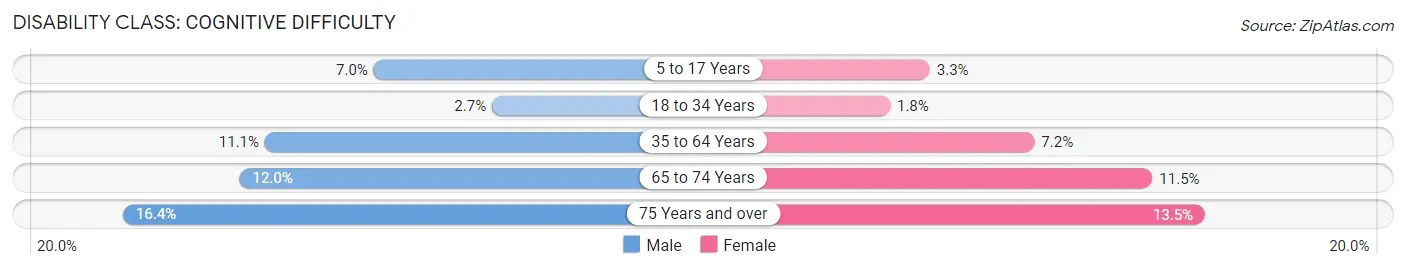
| Age Bracket | Male | Female |
| 5 to 17 Years | 49 (7.0%) | 11 (3.3%) |
| 18 to 34 Years | 28 (2.6%) | 21 (1.8%) |
| 35 to 64 Years | 182 (11.1%) | 109 (7.1%) |
| 65 to 74 Years | 62 (12.0%) | 92 (11.5%) |
| 75 Years and over | 78 (16.4%) | 74 (13.5%) |
Disability Class: Ambulatory Difficulty
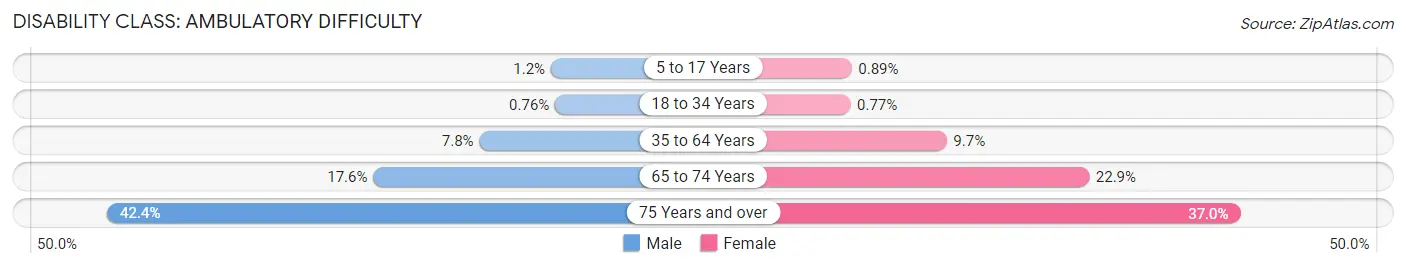
| Age Bracket | Male | Female |
| 5 to 17 Years | 8 (1.1%) | 3 (0.9%) |
| 18 to 34 Years | 8 (0.8%) | 9 (0.8%) |
| 35 to 64 Years | 128 (7.8%) | 148 (9.7%) |
| 65 to 74 Years | 91 (17.6%) | 183 (22.9%) |
| 75 Years and over | 202 (42.3%) | 203 (37.0%) |
Disability Class: Self-Care Difficulty
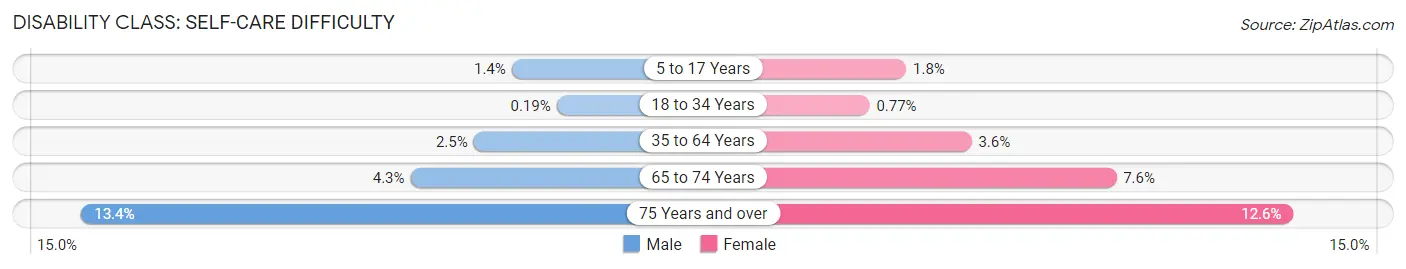
| Age Bracket | Male | Female |
| 5 to 17 Years | 10 (1.4%) | 6 (1.8%) |
| 18 to 34 Years | 2 (0.2%) | 9 (0.8%) |
| 35 to 64 Years | 41 (2.5%) | 55 (3.6%) |
| 65 to 74 Years | 22 (4.3%) | 61 (7.6%) |
| 75 Years and over | 64 (13.4%) | 69 (12.6%) |
Technology Access in Bernalillo
Computing Device Access in Bernalillo
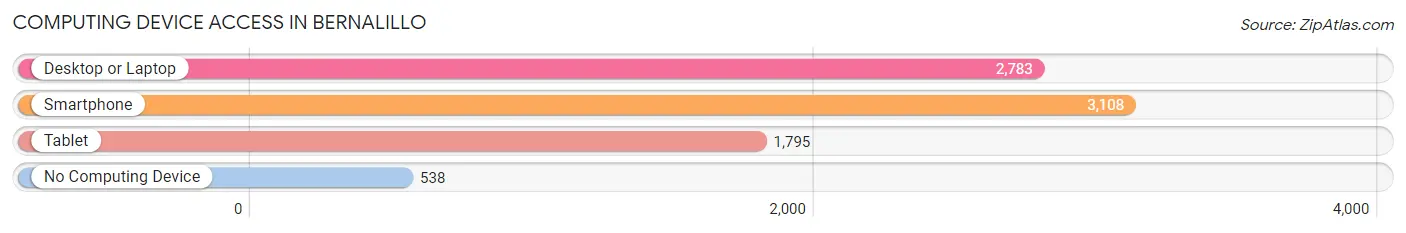
| Device Type | # Households | % Households |
| Desktop or Laptop | 2,783 | 71.2% |
| Smartphone | 3,108 | 79.5% |
| Tablet | 1,795 | 45.9% |
| No Computing Device | 538 | 13.8% |
| Total | 3,908 | 100.0% |
Internet Access in Bernalillo
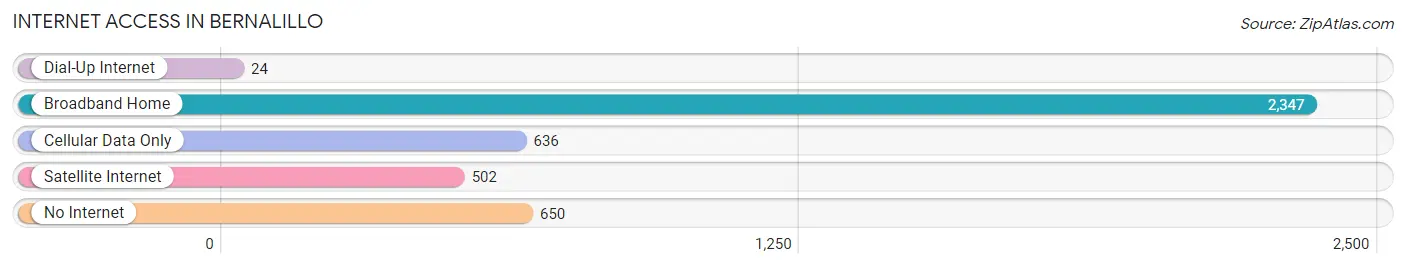
| Internet Type | # Households | % Households |
| Dial-Up Internet | 24 | 0.6% |
| Broadband Home | 2,347 | 60.1% |
| Cellular Data Only | 636 | 16.3% |
| Satellite Internet | 502 | 12.9% |
| No Internet | 650 | 16.6% |
| Total | 3,908 | 100.0% |
Bernalillo Summary
Bernalillo, New Mexico is a small town located in the northern part of the state, just north of Albuquerque. It is the county seat of Sandoval County and is part of the Albuquerque Metropolitan Statistical Area. The town has a population of 8,320 as of the 2010 census, making it the largest town in the county.
History
The area that is now Bernalillo was originally inhabited by the Pueblo Indians. The first European settlers arrived in the area in the late 1600s, and the town was officially founded in 1706. The town was named after Don Francisco Xavier Chávez y Salazar, a Spanish nobleman who was granted the land by the King of Spain.
In the early 1800s, the town was a major trading center for the region, and it was also a stop on the Santa Fe Trail. During the Mexican-American War, the town was occupied by American forces. After the war, the town became part of the United States.
In the late 1800s, the town began to grow and develop. The Atchison, Topeka and Santa Fe Railway built a line through the town in 1881, and the town was incorporated in 1885. The town continued to grow and develop throughout the 20th century, and it is now a thriving community.
Geography
Bernalillo is located in the northern part of New Mexico, just north of Albuquerque. It is situated in the Rio Grande Valley, and the Rio Grande River runs through the town. The town is located at an elevation of 5,000 feet above sea level.
The town covers an area of 8.3 square miles, and it is bordered by the Sandia Mountains to the east and the Jemez Mountains to the west. The climate in the area is semi-arid, with hot summers and mild winters.
Economy
The economy of Bernalillo is largely based on tourism and agriculture. The town is home to several wineries, and it is also a popular destination for outdoor recreation. The town is also home to several manufacturing companies, including a factory that produces solar panels.
The town is also home to several retail stores, restaurants, and other businesses. The town is served by the Sandoval County Airport, which provides air service to the area.
Demographics
As of the 2010 census, the population of Bernalillo was 8,320. The racial makeup of the town was 73.3% White, 0.9% African American, 1.3% Native American, 0.7% Asian, 0.1% Pacific Islander, 20.2% from other races, and 3.5% from two or more races. Hispanic or Latino of any race were 51.2% of the population.
The median household income in the town was $37,917, and the median family income was $41,917. The per capita income in the town was $17,917. About 16.2% of the population was below the poverty line.
Conclusion
Bernalillo, New Mexico is a small town located in the northern part of the state, just north of Albuquerque. It is the county seat of Sandoval County and is part of the Albuquerque Metropolitan Statistical Area. The town has a population of 8,320 as of the 2010 census, making it the largest town in the county. The town has a long history, and it is now a thriving community with a strong economy based on tourism and agriculture. The town is also home to several retail stores, restaurants, and other businesses. The population of the town is diverse, with a majority of the population being Hispanic or Latino.
Common Questions
What is Per Capita Income in Bernalillo?
Per Capita income in Bernalillo is $30,589.
What is the Median Family Income in Bernalillo?
Median Family Income in Bernalillo is $60,000.
What is the Median Household income in Bernalillo?
Median Household Income in Bernalillo is $57,905.
What is Income or Wage Gap in Bernalillo?
Income or Wage Gap in Bernalillo is 22.8%.
Women in Bernalillo earn 77.2 cents for every dollar earned by a man.
What is Family Income Deficit in Bernalillo?
Family Income Deficit in Bernalillo is $10,818.
Families that are below poverty line in Bernalillo earn $10,818 less on average than the poverty threshold level.
What is Inequality or Gini Index in Bernalillo?
Inequality or Gini Index in Bernalillo is 0.41.
What is the Total Population of Bernalillo?
Total Population of Bernalillo is 9,286.
What is the Total Male Population of Bernalillo?
Total Male Population of Bernalillo is 4,759.
What is the Total Female Population of Bernalillo?
Total Female Population of Bernalillo is 4,527.
What is the Ratio of Males per 100 Females in Bernalillo?
There are 105.12 Males per 100 Females in Bernalillo.
What is the Ratio of Females per 100 Males in Bernalillo?
There are 95.13 Females per 100 Males in Bernalillo.
What is the Median Population Age in Bernalillo?
Median Population Age in Bernalillo is 43.2 Years.
What is the Average Family Size in Bernalillo
Average Family Size in Bernalillo is 2.8 People.
What is the Average Household Size in Bernalillo
Average Household Size in Bernalillo is 2.3 People.
How Large is the Labor Force in Bernalillo?
There are 4,200 People in the Labor Forcein in Bernalillo.
What is the Percentage of People in the Labor Force in Bernalillo?
52.4% of People are in the Labor Force in Bernalillo.
What is the Unemployment Rate in Bernalillo?
Unemployment Rate in Bernalillo is 6.2%.