Mora County, NM Map & Demographics
Mora County Map
Mora County Overview
$28,356
PER CAPITA INCOME
$52,223
AVG FAMILY INCOME
$40,231
AVG HOUSEHOLD INCOME
43.3%
WAGE / INCOME GAP [ % ]
56.7¢/ $1
WAGE / INCOME GAP [ $ ]
0.49
INEQUALITY / GINI INDEX
4,208
TOTAL POPULATION
1,872
MALE POPULATION
2,336
FEMALE POPULATION
80.14
MALES / 100 FEMALES
124.79
FEMALES / 100 MALES
59.4
MEDIAN AGE
2.5
AVG FAMILY SIZE
2.0
AVG HOUSEHOLD SIZE
1,417
LABOR FORCE [ PEOPLE ]
38.8%
PERCENT IN LABOR FORCE
7.4%
UNEMPLOYMENT RATE
Income in Mora County
Income Overview in Mora County
Per Capita Income in Mora County is $28,356, while median incomes of families and households are $52,223 and $40,231 respectively.
| Characteristic | Number | Measure |
| Per Capita Income | 4,208 | $28,356 |
| Median Family Income | 1,285 | $52,223 |
| Mean Family Income | 1,285 | $71,060 |
| Median Household Income | 2,091 | $40,231 |
| Mean Household Income | 2,091 | $55,236 |
| Income Deficit | 1,285 | $0 |
| Wage / Income Gap (%) | 4,208 | 43.29% |
| Wage / Income Gap ($) | 4,208 | 56.71¢ per $1 |
| Gini / Inequality Index | 4,208 | 0.49 |
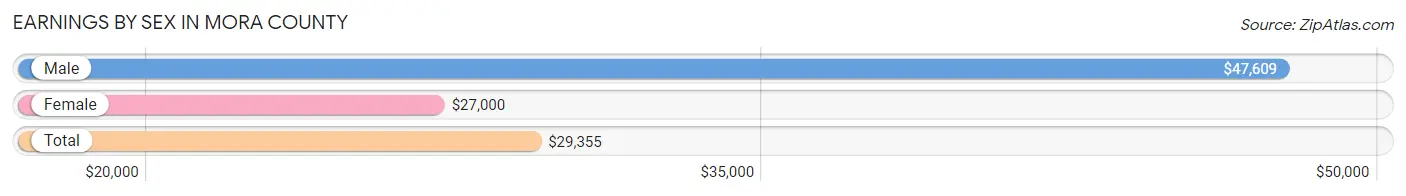
Earnings by Sex in Mora County
Average Earnings in Mora County are $29,355, $47,609 for men and $27,000 for women, a difference of 43.3%.
| Sex | Number | Average Earnings |
| Male | 464 (31.5%) | $47,609 |
| Female | 1,008 (68.5%) | $27,000 |
| Total | 1,472 (100.0%) | $29,355 |
Earnings by Sex by Income Bracket in Mora County
The most common earnings brackets in Mora County are $100,000+ for men (66 | 14.2%) and $50,000 to $54,999 for women (168 | 16.7%).

| Income | Male | Female |
| $2,499 or less | 26 (5.6%) | 7 (0.7%) |
| $2,500 to $4,999 | 38 (8.2%) | 47 (4.7%) |
| $5,000 to $7,499 | 54 (11.6%) | 106 (10.5%) |
| $7,500 to $9,999 | 4 (0.9%) | 0 (0.0%) |
| $10,000 to $12,499 | 9 (1.9%) | 77 (7.6%) |
| $12,500 to $14,999 | 16 (3.5%) | 68 (6.8%) |
| $15,000 to $17,499 | 20 (4.3%) | 92 (9.1%) |
| $17,500 to $19,999 | 0 (0.0%) | 12 (1.2%) |
| $20,000 to $22,499 | 4 (0.9%) | 0 (0.0%) |
| $22,500 to $24,999 | 21 (4.5%) | 63 (6.2%) |
| $25,000 to $29,999 | 15 (3.2%) | 65 (6.5%) |
| $30,000 to $34,999 | 3 (0.6%) | 57 (5.7%) |
| $35,000 to $39,999 | 12 (2.6%) | 64 (6.4%) |
| $40,000 to $44,999 | 9 (1.9%) | 72 (7.1%) |
| $45,000 to $49,999 | 23 (5.0%) | 2 (0.2%) |
| $50,000 to $54,999 | 4 (0.9%) | 168 (16.7%) |
| $55,000 to $64,999 | 31 (6.7%) | 84 (8.3%) |
| $65,000 to $74,999 | 64 (13.8%) | 6 (0.6%) |
| $75,000 to $99,999 | 45 (9.7%) | 18 (1.8%) |
| $100,000+ | 66 (14.2%) | 0 (0.0%) |
| Total | 464 (100.0%) | 1,008 (100.0%) |
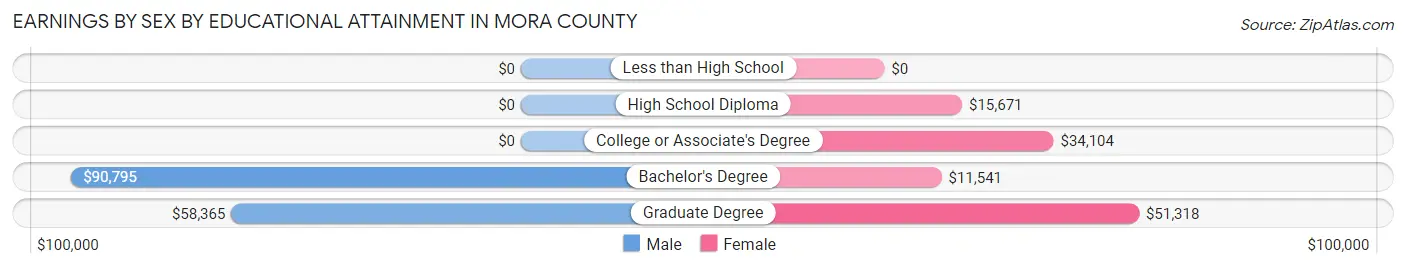
Earnings by Sex by Educational Attainment in Mora County
Average earnings in Mora County are $49,348 for men and $33,679 for women, a difference of 31.8%. Men with an educational attainment of bachelor's degree enjoy the highest average annual earnings of $90,795, while those with graduate degree education earn the least with $58,365. Women with an educational attainment of graduate degree earn the most with the average annual earnings of $51,318, while those with bachelor's degree education have the smallest earnings of $11,541.
| Educational Attainment | Male Income | Female Income |
| Less than High School | - | - |
| High School Diploma | - | - |
| College or Associate's Degree | - | - |
| Bachelor's Degree | $90,795 | $11,541 |
| Graduate Degree | $58,365 | $51,318 |
| Total | $49,348 | $33,679 |
Family Income in Mora County
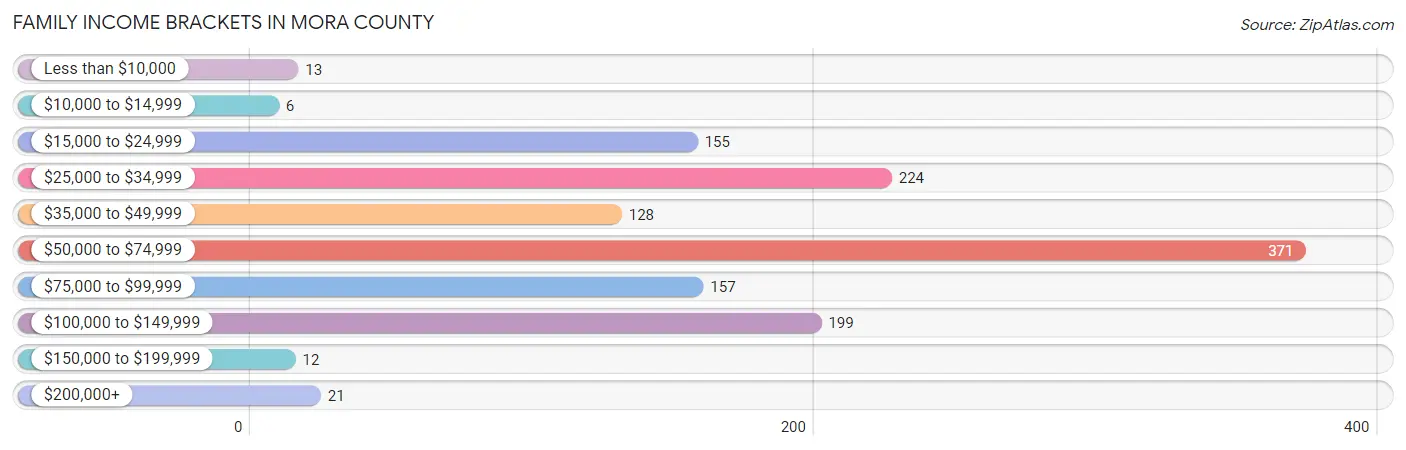
Family Income Brackets in Mora County
According to the Mora County family income data, there are 371 families falling into the $50,000 to $74,999 income range, which is the most common income bracket and makes up 28.9% of all families. Conversely, the $10,000 to $14,999 income bracket is the least frequent group with only 6 families (0.5%) belonging to this category.
| Income Bracket | # Families | % Families |
| Less than $10,000 | 13 | 1.0% |
| $10,000 to $14,999 | 6 | 0.5% |
| $15,000 to $24,999 | 155 | 12.1% |
| $25,000 to $34,999 | 224 | 17.4% |
| $35,000 to $49,999 | 128 | 10.0% |
| $50,000 to $74,999 | 371 | 28.9% |
| $75,000 to $99,999 | 157 | 12.2% |
| $100,000 to $149,999 | 199 | 15.5% |
| $150,000 to $199,999 | 12 | 0.9% |
| $200,000+ | 21 | 1.6% |
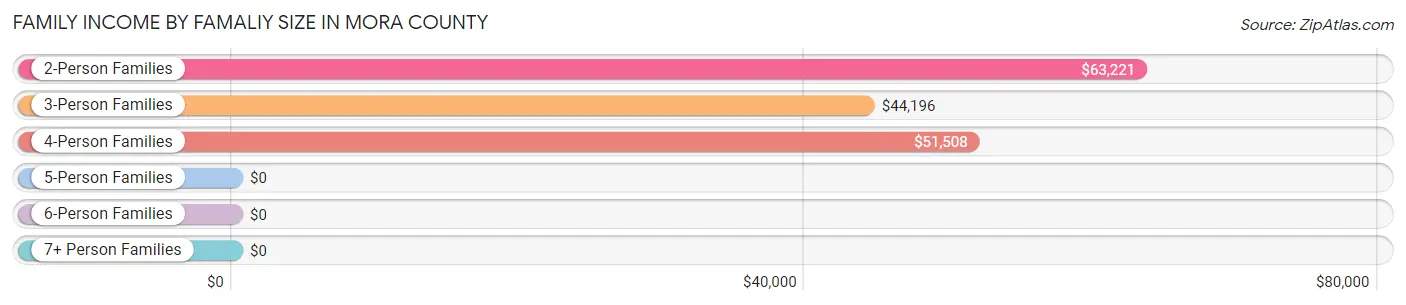
Family Income by Famaliy Size in Mora County
2-person families (905 | 70.4%) account for the highest median family income in Mora County with $63,221 per family, while 2-person families (905 | 70.4%) have the highest median income of $31,610 per family member.
| Income Bracket | # Families | Median Income |
| 2-Person Families | 905 (70.4%) | $63,221 |
| 3-Person Families | 125 (9.7%) | $44,196 |
| 4-Person Families | 252 (19.6%) | $51,508 |
| 5-Person Families | 0 (0.0%) | $0 |
| 6-Person Families | 3 (0.2%) | $0 |
| 7+ Person Families | 0 (0.0%) | $0 |
| Total | 1,285 (100.0%) | $52,223 |
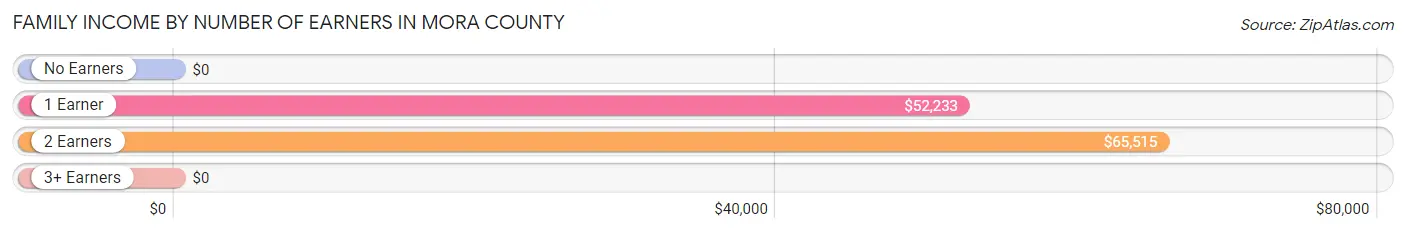
Family Income by Number of Earners in Mora County
| Number of Earners | # Families | Median Income |
| No Earners | 411 (32.0%) | $0 |
| 1 Earner | 704 (54.8%) | $52,233 |
| 2 Earners | 137 (10.7%) | $65,515 |
| 3+ Earners | 33 (2.6%) | $0 |
| Total | 1,285 (100.0%) | $52,223 |
Household Income in Mora County
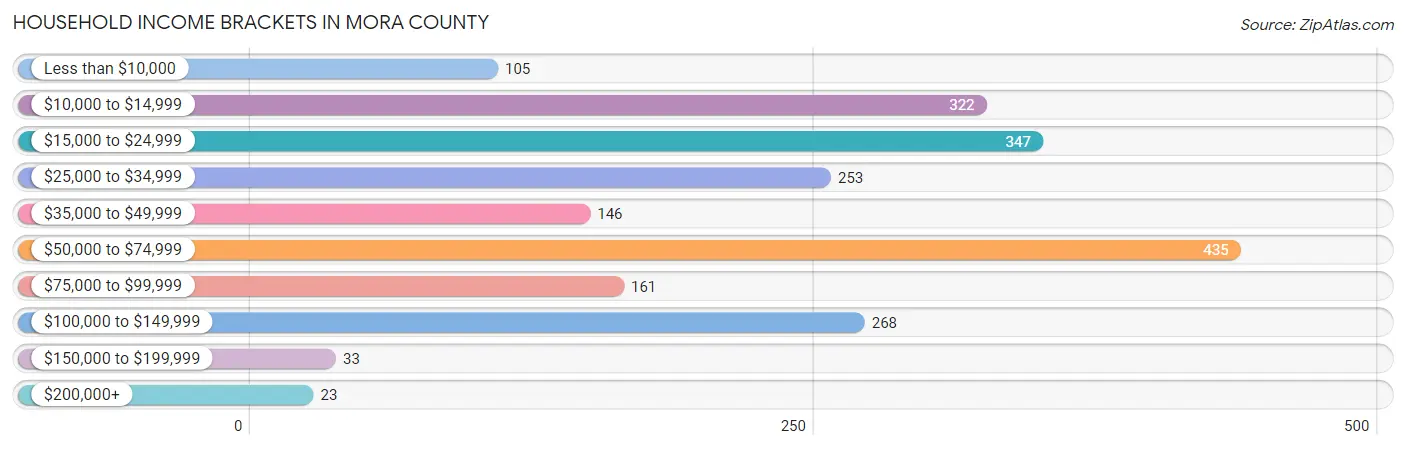
Household Income Brackets in Mora County
With 435 households falling in the category, the $50,000 to $74,999 income range is the most frequent in Mora County, accounting for 20.8% of all households. In contrast, only 23 households (1.1%) fall into the $200,000+ income bracket, making it the least populous group.
| Income Bracket | # Households | % Households |
| Less than $10,000 | 105 | 5.0% |
| $10,000 to $14,999 | 322 | 15.4% |
| $15,000 to $24,999 | 347 | 16.6% |
| $25,000 to $34,999 | 253 | 12.1% |
| $35,000 to $49,999 | 146 | 7.0% |
| $50,000 to $74,999 | 435 | 20.8% |
| $75,000 to $99,999 | 161 | 7.7% |
| $100,000 to $149,999 | 268 | 12.8% |
| $150,000 to $199,999 | 33 | 1.6% |
| $200,000+ | 23 | 1.1% |
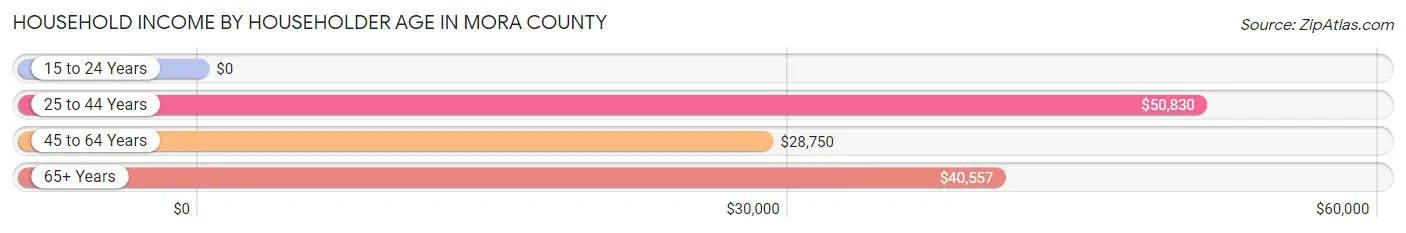
Household Income by Householder Age in Mora County
The median household income in Mora County is $40,231, with the highest median household income of $50,830 found in the 25 to 44 years age bracket for the primary householder. A total of 365 households (17.5%) fall into this category.
| Income Bracket | # Households | Median Income |
| 15 to 24 Years | 0 (0.0%) | $0 |
| 25 to 44 Years | 365 (17.5%) | $50,830 |
| 45 to 64 Years | 839 (40.1%) | $28,750 |
| 65+ Years | 887 (42.4%) | $40,557 |
| Total | 2,091 (100.0%) | $40,231 |
Poverty in Mora County
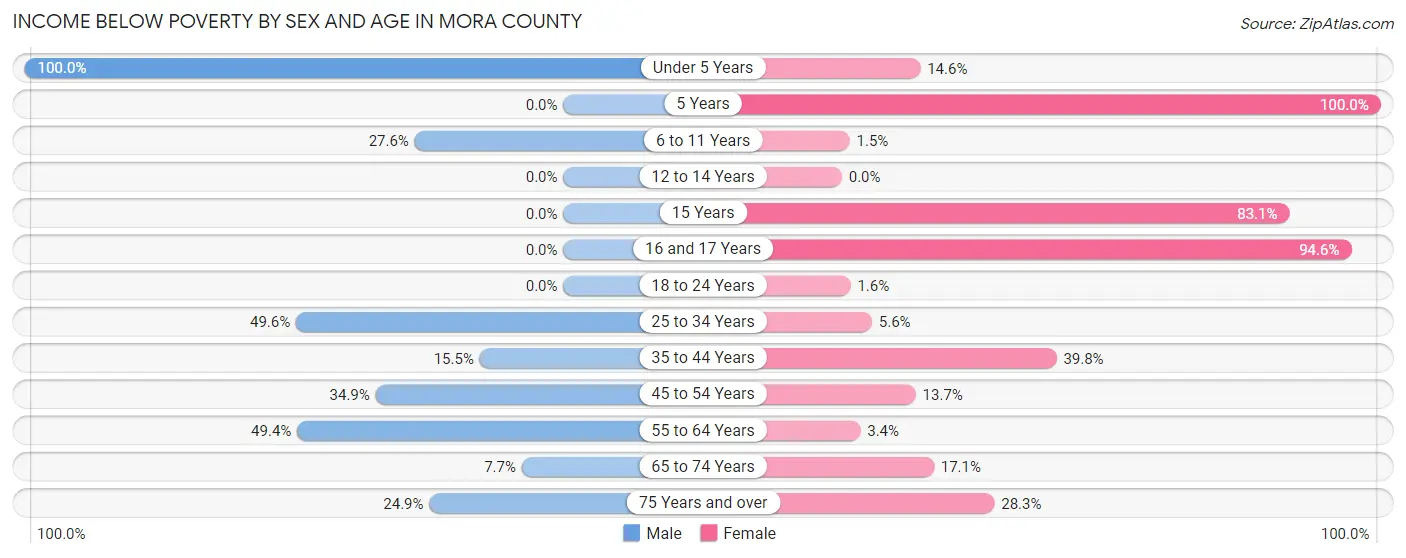
Income Below Poverty by Sex and Age in Mora County
With 28.0% poverty level for males and 16.7% for females among the residents of Mora County, under 5 year old males and 5 year old females are the most vulnerable to poverty, with 15 males (100.0%) and 3 females (100.0%) in their respective age groups living below the poverty level.
| Age Bracket | Male | Female |
| Under 5 Years | 15 (100.0%) | 15 (14.6%) |
| 5 Years | 0 (0.0%) | 3 (100.0%) |
| 6 to 11 Years | 48 (27.6%) | 2 (1.5%) |
| 12 to 14 Years | 0 (0.0%) | 0 (0.0%) |
| 15 Years | 0 (0.0%) | 49 (83.1%) |
| 16 and 17 Years | 0 (0.0%) | 52 (94.6%) |
| 18 to 24 Years | 0 (0.0%) | 2 (1.6%) |
| 25 to 34 Years | 65 (49.6%) | 15 (5.6%) |
| 35 to 44 Years | 18 (15.5%) | 49 (39.8%) |
| 45 to 54 Years | 84 (34.8%) | 27 (13.7%) |
| 55 to 64 Years | 209 (49.4%) | 17 (3.4%) |
| 65 to 74 Years | 35 (7.7%) | 83 (17.1%) |
| 75 Years and over | 48 (24.9%) | 75 (28.3%) |
| Total | 522 (28.0%) | 389 (16.7%) |
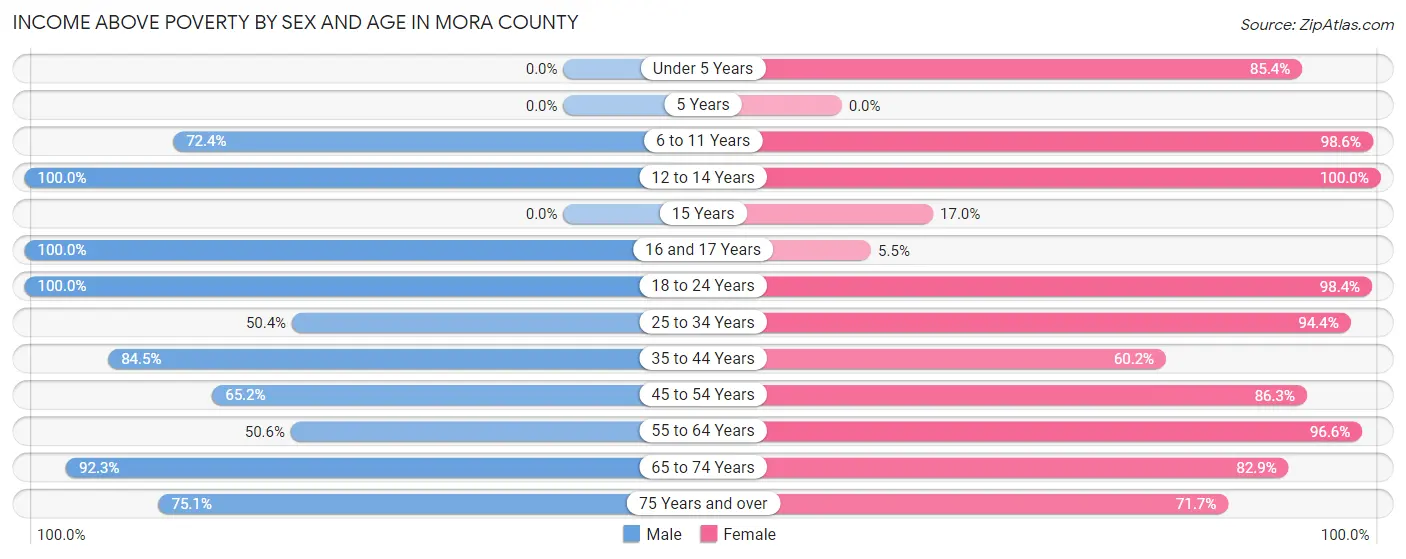
Income Above Poverty by Sex and Age in Mora County
According to the poverty statistics in Mora County, males aged 12 to 14 years and females aged 12 to 14 years are the age groups that are most secure financially, with 100.0% of males and 100.0% of females in these age groups living above the poverty line.
| Age Bracket | Male | Female |
| Under 5 Years | 0 (0.0%) | 88 (85.4%) |
| 5 Years | 0 (0.0%) | 0 (0.0%) |
| 6 to 11 Years | 126 (72.4%) | 136 (98.6%) |
| 12 to 14 Years | 41 (100.0%) | 8 (100.0%) |
| 15 Years | 0 (0.0%) | 10 (17.0%) |
| 16 and 17 Years | 37 (100.0%) | 3 (5.4%) |
| 18 to 24 Years | 42 (100.0%) | 122 (98.4%) |
| 25 to 34 Years | 66 (50.4%) | 254 (94.4%) |
| 35 to 44 Years | 98 (84.5%) | 74 (60.2%) |
| 45 to 54 Years | 157 (65.1%) | 170 (86.3%) |
| 55 to 64 Years | 214 (50.6%) | 479 (96.6%) |
| 65 to 74 Years | 419 (92.3%) | 403 (82.9%) |
| 75 Years and over | 145 (75.1%) | 190 (71.7%) |
| Total | 1,345 (72.0%) | 1,937 (83.3%) |
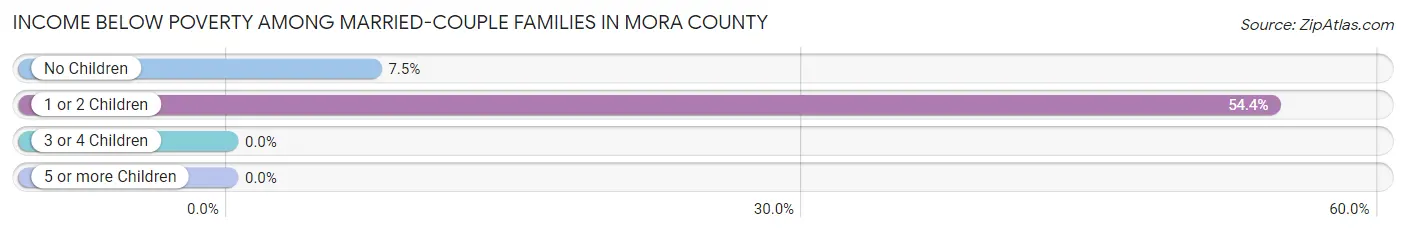
Income Below Poverty Among Married-Couple Families in Mora County
The poverty statistics for married-couple families in Mora County show that 12.4% or 93 of the total 750 families live below the poverty line. Families with 1 or 2 children have the highest poverty rate of 54.4%, comprising of 43 families. On the other hand, families with 3 or 4 children have the lowest poverty rate of 0.0%, which includes 0 families.
| Children | Above Poverty | Below Poverty |
| No Children | 618 (92.5%) | 50 (7.5%) |
| 1 or 2 Children | 36 (45.6%) | 43 (54.4%) |
| 3 or 4 Children | 3 (100.0%) | 0 (0.0%) |
| 5 or more Children | 0 (0.0%) | 0 (0.0%) |
| Total | 657 (87.6%) | 93 (12.4%) |
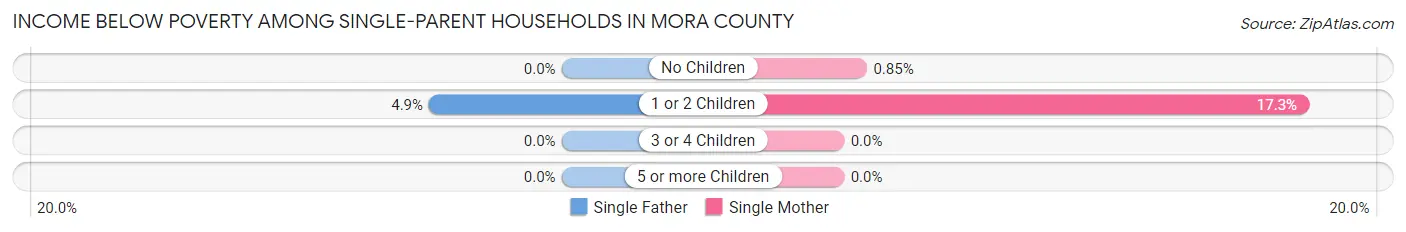
Income Below Poverty Among Single-Parent Households in Mora County
According to the poverty data in Mora County, 2.0% or 4 single-father households and 4.1% or 14 single-mother households are living below the poverty line. Among single-father households, those with 1 or 2 children have the highest poverty rate, with 4 households (4.9%) experiencing poverty. Likewise, among single-mother households, those with 1 or 2 children have the highest poverty rate, with 13 households (17.3%) falling below the poverty line.
| Children | Single Father | Single Mother |
| No Children | 0 (0.0%) | 1 (0.9%) |
| 1 or 2 Children | 4 (4.9%) | 13 (17.3%) |
| 3 or 4 Children | 0 (0.0%) | 0 (0.0%) |
| 5 or more Children | 0 (0.0%) | 0 (0.0%) |
| Total | 4 (2.0%) | 14 (4.1%) |
Income Below Poverty Among Married-Couple vs Single-Parent Households in Mora County
The poverty data for Mora County shows that 93 of the married-couple family households (12.4%) and 18 of the single-parent households (3.4%) are living below the poverty level. Within the married-couple family households, those with 1 or 2 children have the highest poverty rate, with 43 households (54.4%) falling below the poverty line. Among the single-parent households, those with 1 or 2 children have the highest poverty rate, with 17 household (10.9%) living below poverty.
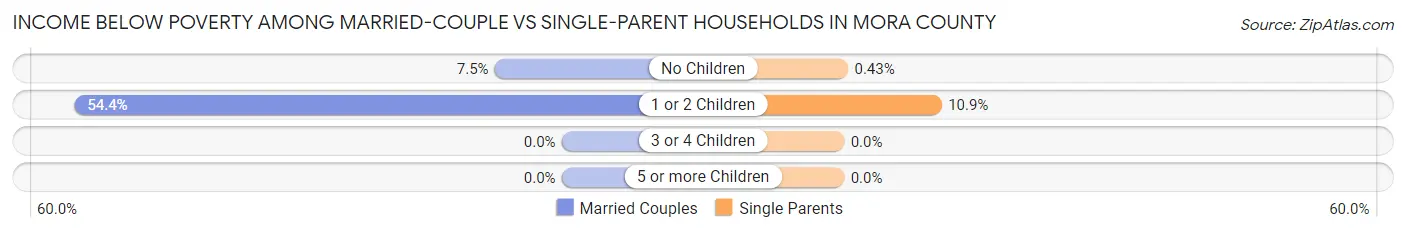
| Children | Married-Couple Families | Single-Parent Households |
| No Children | 50 (7.5%) | 1 (0.4%) |
| 1 or 2 Children | 43 (54.4%) | 17 (10.9%) |
| 3 or 4 Children | 0 (0.0%) | 0 (0.0%) |
| 5 or more Children | 0 (0.0%) | 0 (0.0%) |
| Total | 93 (12.4%) | 18 (3.4%) |
Race in Mora County
The most populous races in Mora County are Hispanic or Latino (3,427 | 81.4%), White / Caucasian (2,213 | 52.6%), and Some other Race (1,144 | 27.2%).
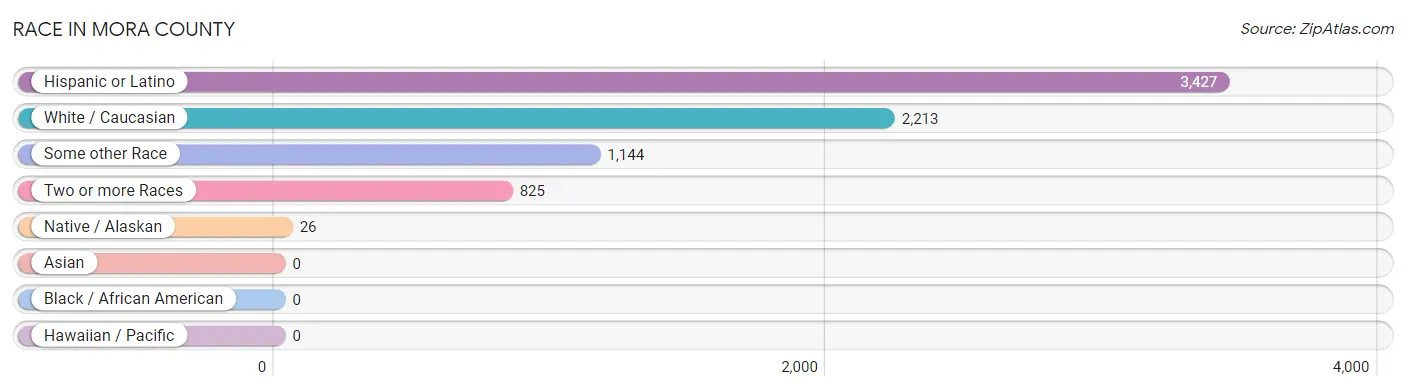
| Race | # Population | % Population |
| Asian | 0 | 0.0% |
| Black / African American | 0 | 0.0% |
| Hawaiian / Pacific | 0 | 0.0% |
| Hispanic or Latino | 3,427 | 81.4% |
| Native / Alaskan | 26 | 0.6% |
| White / Caucasian | 2,213 | 52.6% |
| Two or more Races | 825 | 19.6% |
| Some other Race | 1,144 | 27.2% |
| Total | 4,208 | 100.0% |
Ancestry in Mora County
The most populous ancestries reported in Mora County are Mexican (741 | 17.6%), Spanish (650 | 15.4%), Spaniard (419 | 10.0%), American (266 | 6.3%), and French (247 | 5.9%), together accounting for 55.2% of all Mora County residents.
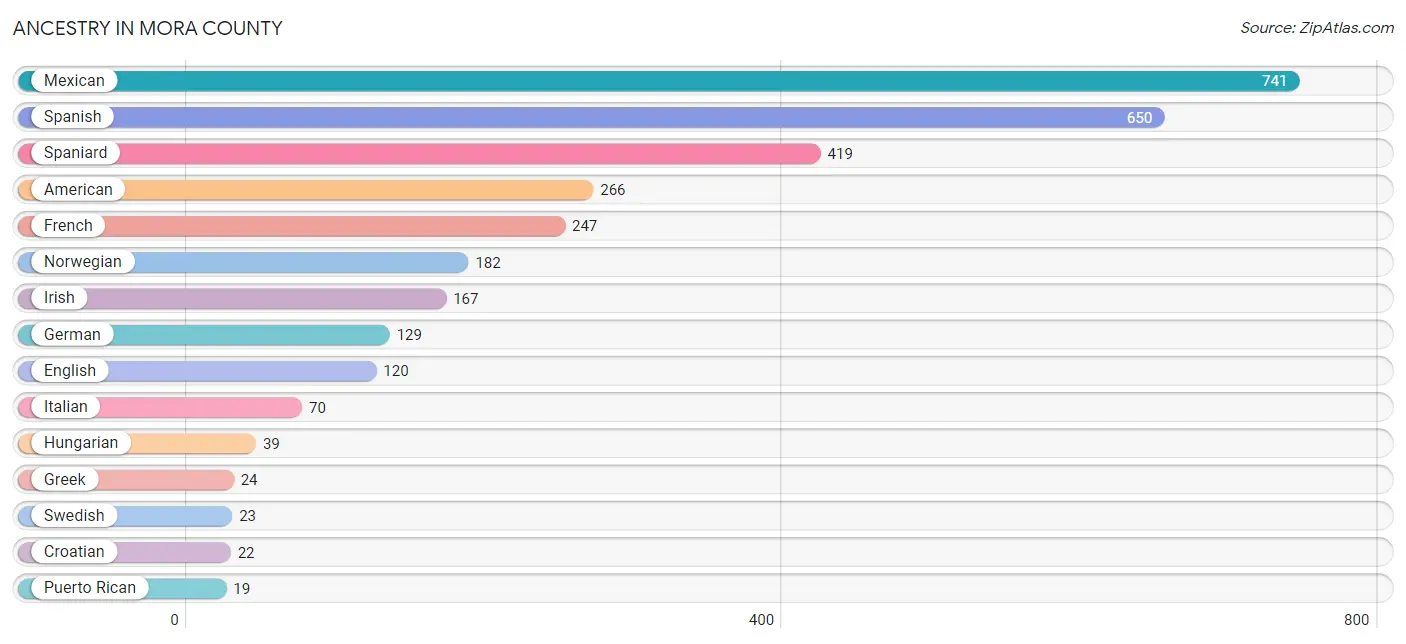
| Ancestry | # Population | % Population |
| American | 266 | 6.3% |
| Apache | 6 | 0.1% |
| Arab | 9 | 0.2% |
| Central American Indian | 2 | 0.1% |
| Comanche | 4 | 0.1% |
| Croatian | 22 | 0.5% |
| Dominican | 11 | 0.3% |
| Egyptian | 9 | 0.2% |
| English | 120 | 2.9% |
| European | 14 | 0.3% |
| French | 247 | 5.9% |
| French Canadian | 5 | 0.1% |
| German | 129 | 3.1% |
| Greek | 24 | 0.6% |
| Hungarian | 39 | 0.9% |
| Irish | 167 | 4.0% |
| Italian | 70 | 1.7% |
| Mexican | 741 | 17.6% |
| Norwegian | 182 | 4.3% |
| Pueblo | 6 | 0.1% |
| Puerto Rican | 19 | 0.4% |
| Scandinavian | 11 | 0.3% |
| Scotch-Irish | 9 | 0.2% |
| Scottish | 4 | 0.1% |
| Spaniard | 419 | 10.0% |
| Spanish | 650 | 15.4% |
| Spanish American | 11 | 0.3% |
| Swedish | 23 | 0.5% |
| West Indian | 2 | 0.1% | View All 29 Rows |
Immigrants in Mora County
The most numerous immigrant groups reported in Mora County came from Latin America (65 | 1.5%), Central America (54 | 1.3%), Mexico (54 | 1.3%), Caribbean (11 | 0.3%), and Dominican Republic (11 | 0.3%), together accounting for 4.6% of all Mora County residents.
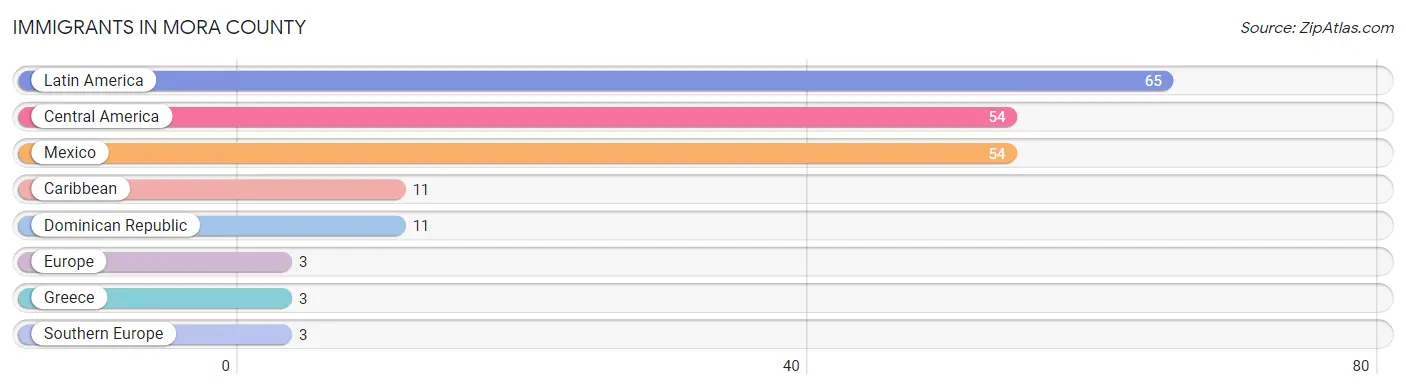
| Immigration Origin | # Population | % Population |
| Caribbean | 11 | 0.3% |
| Central America | 54 | 1.3% |
| Dominican Republic | 11 | 0.3% |
| Europe | 3 | 0.1% |
| Greece | 3 | 0.1% |
| Latin America | 65 | 1.5% |
| Mexico | 54 | 1.3% |
| Southern Europe | 3 | 0.1% | View All 8 Rows |
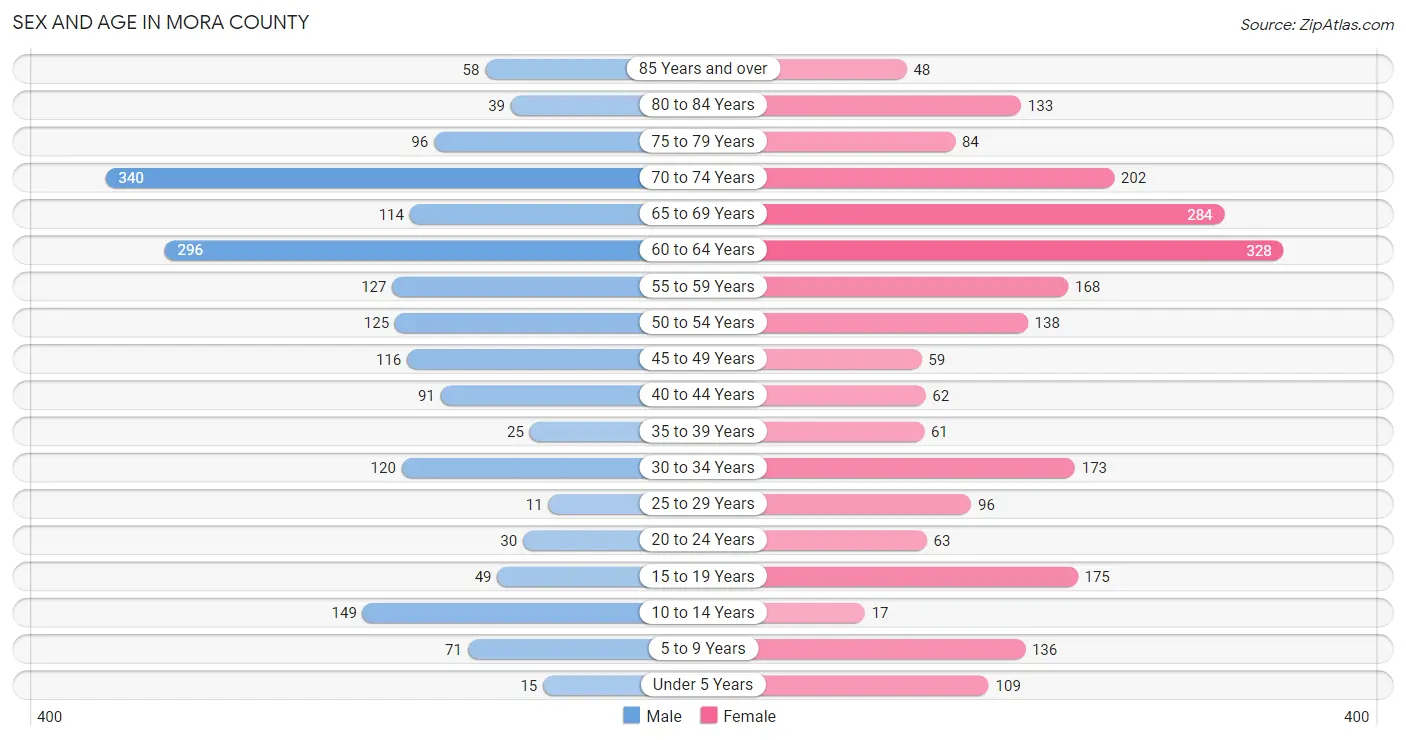
Sex and Age in Mora County
Sex and Age in Mora County
The most populous age groups in Mora County are 70 to 74 Years (340 | 18.2%) for men and 60 to 64 Years (328 | 14.0%) for women.
| Age Bracket | Male | Female |
| Under 5 Years | 15 (0.8%) | 109 (4.7%) |
| 5 to 9 Years | 71 (3.8%) | 136 (5.8%) |
| 10 to 14 Years | 149 (8.0%) | 17 (0.7%) |
| 15 to 19 Years | 49 (2.6%) | 175 (7.5%) |
| 20 to 24 Years | 30 (1.6%) | 63 (2.7%) |
| 25 to 29 Years | 11 (0.6%) | 96 (4.1%) |
| 30 to 34 Years | 120 (6.4%) | 173 (7.4%) |
| 35 to 39 Years | 25 (1.3%) | 61 (2.6%) |
| 40 to 44 Years | 91 (4.9%) | 62 (2.6%) |
| 45 to 49 Years | 116 (6.2%) | 59 (2.5%) |
| 50 to 54 Years | 125 (6.7%) | 138 (5.9%) |
| 55 to 59 Years | 127 (6.8%) | 168 (7.2%) |
| 60 to 64 Years | 296 (15.8%) | 328 (14.0%) |
| 65 to 69 Years | 114 (6.1%) | 284 (12.2%) |
| 70 to 74 Years | 340 (18.2%) | 202 (8.6%) |
| 75 to 79 Years | 96 (5.1%) | 84 (3.6%) |
| 80 to 84 Years | 39 (2.1%) | 133 (5.7%) |
| 85 Years and over | 58 (3.1%) | 48 (2.1%) |
| Total | 1,872 (100.0%) | 2,336 (100.0%) |
Families and Households in Mora County
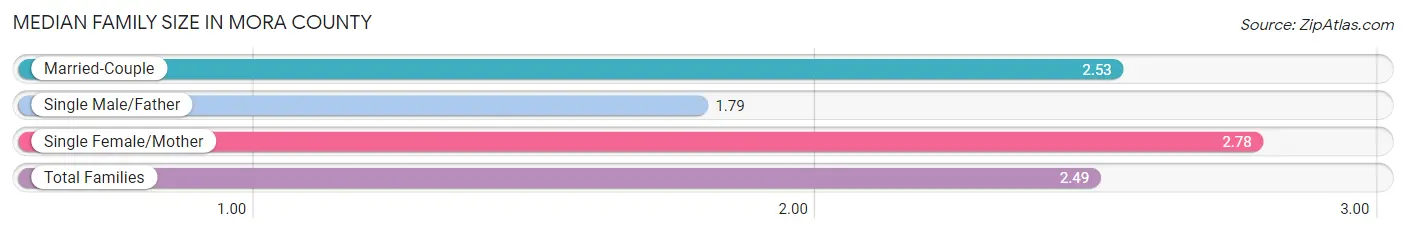
Median Family Size in Mora County
The median family size in Mora County is 2.49 persons per family, with single female/mother families (339 | 26.4%) accounting for the largest median family size of 2.78 persons per family. On the other hand, single male/father families (196 | 15.2%) represent the smallest median family size with 1.79 persons per family.
| Family Type | # Families | Family Size |
| Married-Couple | 750 (58.4%) | 2.53 |
| Single Male/Father | 196 (15.2%) | 1.79 |
| Single Female/Mother | 339 (26.4%) | 2.78 |
| Total Families | 1,285 (100.0%) | 2.49 |
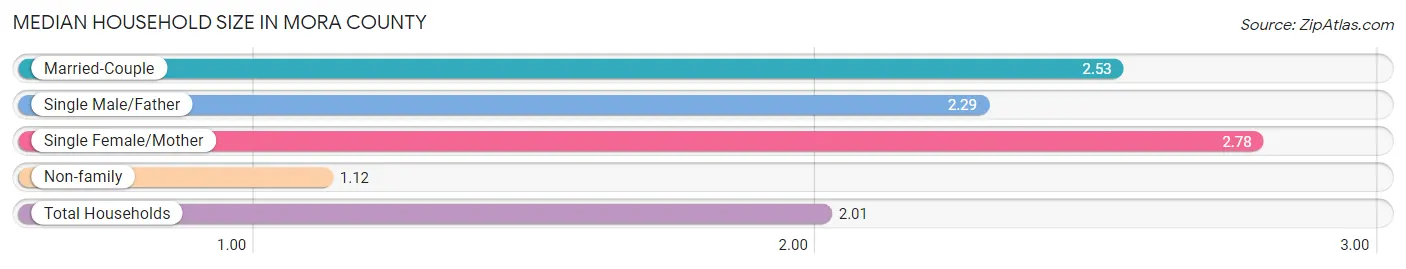
Median Household Size in Mora County
The median household size in Mora County is 2.01 persons per household, with single female/mother households (339 | 16.2%) accounting for the largest median household size of 2.78 persons per household. non-family households (806 | 38.6%) represent the smallest median household size with 1.12 persons per household.
| Household Type | # Households | Household Size |
| Married-Couple | 750 (35.9%) | 2.53 |
| Single Male/Father | 196 (9.4%) | 2.29 |
| Single Female/Mother | 339 (16.2%) | 2.78 |
| Non-family | 806 (38.6%) | 1.12 |
| Total Households | 2,091 (100.0%) | 2.01 |
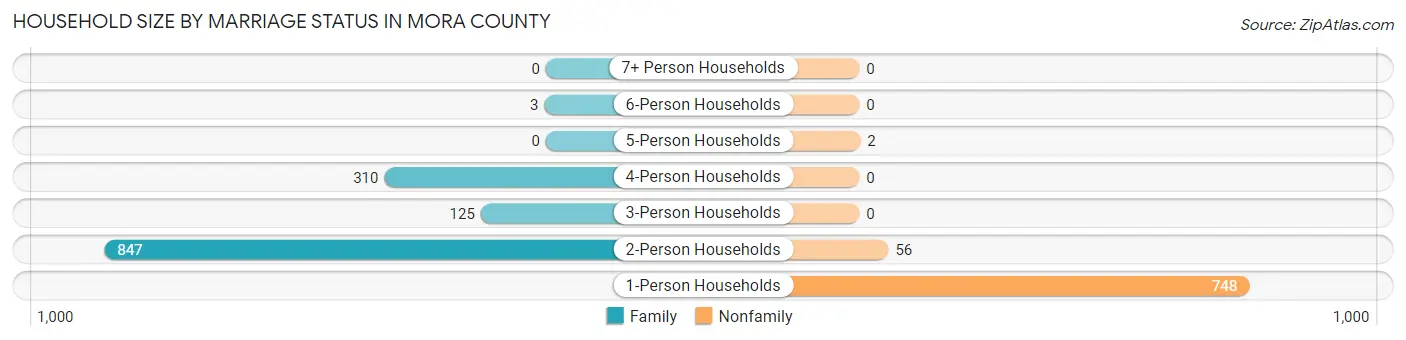
Household Size by Marriage Status in Mora County
Out of a total of 2,091 households in Mora County, 1,285 (61.5%) are family households, while 806 (38.6%) are nonfamily households. The most numerous type of family households are 2-person households, comprising 847, and the most common type of nonfamily households are 1-person households, comprising 748.
| Household Size | Family Households | Nonfamily Households |
| 1-Person Households | - | 748 (35.8%) |
| 2-Person Households | 847 (40.5%) | 56 (2.7%) |
| 3-Person Households | 125 (6.0%) | 0 (0.0%) |
| 4-Person Households | 310 (14.8%) | 0 (0.0%) |
| 5-Person Households | 0 (0.0%) | 2 (0.1%) |
| 6-Person Households | 3 (0.1%) | 0 (0.0%) |
| 7+ Person Households | 0 (0.0%) | 0 (0.0%) |
| Total | 1,285 (61.5%) | 806 (38.6%) |
Female Fertility in Mora County
Fertility by Age in Mora County
| Age Bracket | Women with Births | Births / 1,000 Women |
| 15 to 19 years | 0 (0.0%) | 0.0 |
| 20 to 34 years | 0 (0.0%) | 0.0 |
| 35 to 50 years | 0 (0.0%) | 0.0 |
| Total | 0 (0.0%) | 0.0 |
Fertility by Age by Marriage Status in Mora County
| Age Bracket | Married | Unmarried |
| 15 to 19 years | 0 (0.0%) | 0 (0.0%) |
| 20 to 34 years | 0 (0.0%) | 0 (0.0%) |
| 35 to 50 years | 0 (0.0%) | 0 (0.0%) |
| Total | 0 (0.0%) | 0 (0.0%) |
Fertility by Education in Mora County
| Educational Attainment | Women with Births | Births / 1,000 Women |
| Less than High School | 0 (0.0%) | 0.0 |
| High School Diploma | 0 (0.0%) | 0.0 |
| College or Associate's Degree | 0 (0.0%) | 0.0 |
| Bachelor's Degree | 0 (0.0%) | 0.0 |
| Graduate Degree | 0 (0.0%) | 0.0 |
| Total | 0 (0.0%) | 0.0 |
Fertility by Education by Marriage Status in Mora County
| Educational Attainment | Married | Unmarried |
| Less than High School | 0 (0.0%) | 0 (0.0%) |
| High School Diploma | 0 (0.0%) | 0 (0.0%) |
| College or Associate's Degree | 0 (0.0%) | 0 (0.0%) |
| Bachelor's Degree | 0 (0.0%) | 0 (0.0%) |
| Graduate Degree | 0 (0.0%) | 0 (0.0%) |
| Total | 0 (0.0%) | 0 (0.0%) |
Employment Characteristics in Mora County
Employment by Class of Employer in Mora County
Among the 1,312 employed individuals in Mora County, private company employees (601 | 45.8%), state government employees (407 | 31.0%), and self-employed (not incorporated) (118 | 9.0%) make up the most common classes of employment.
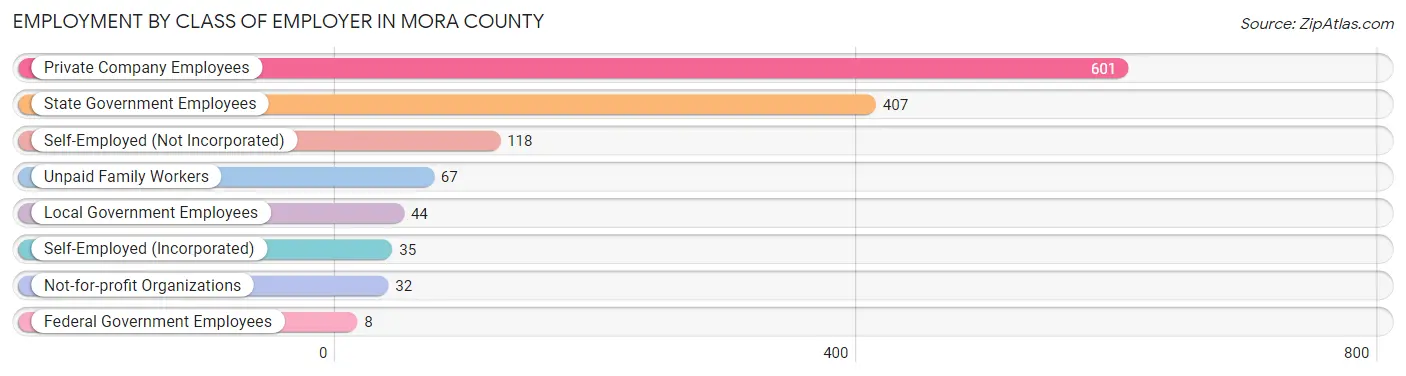
| Employer Class | # Employees | % Employees |
| Private Company Employees | 601 | 45.8% |
| Self-Employed (Incorporated) | 35 | 2.7% |
| Self-Employed (Not Incorporated) | 118 | 9.0% |
| Not-for-profit Organizations | 32 | 2.4% |
| Local Government Employees | 44 | 3.4% |
| State Government Employees | 407 | 31.0% |
| Federal Government Employees | 8 | 0.6% |
| Unpaid Family Workers | 67 | 5.1% |
| Total | 1,312 | 100.0% |
Employment Status by Age in Mora County
According to the labor force statistics for Mora County, out of the total population over 16 years of age (3,652), 38.8% or 1,417 individuals are in the labor force, with 7.4% or 105 of them unemployed. The age group with the highest labor force participation rate is 25 to 29 years, with 87.9% or 94 individuals in the labor force. Within the labor force, the 25 to 29 years age range has the highest percentage of unemployed individuals, with 31.9% or 30 of them being unemployed.
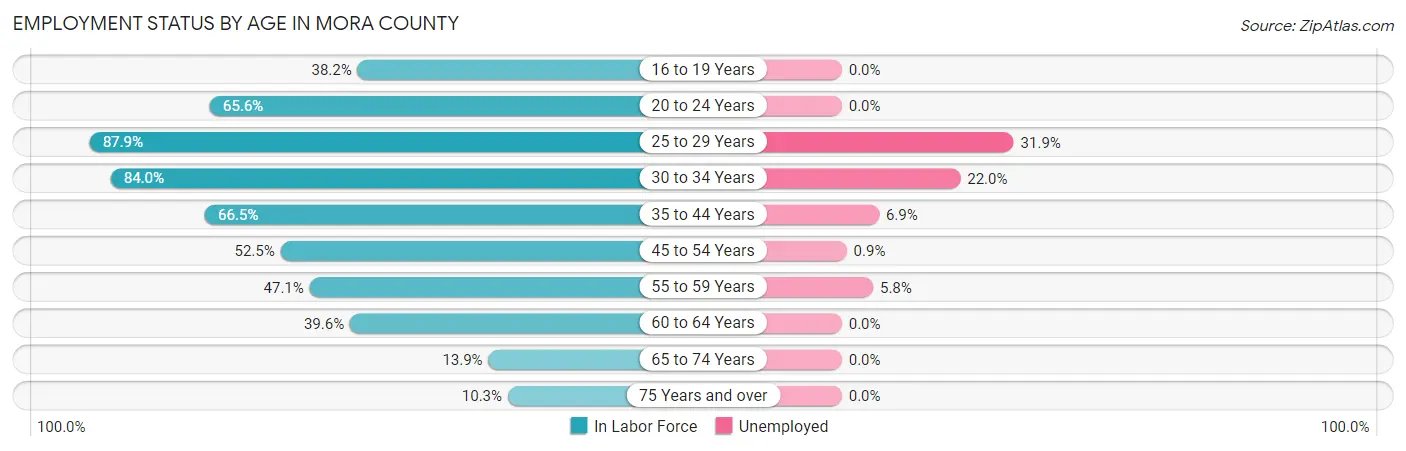
| Age Bracket | In Labor Force | Unemployed |
| 16 to 19 Years | 63 (38.2%) | 0 (0.0%) |
| 20 to 24 Years | 61 (65.6%) | 0 (0.0%) |
| 25 to 29 Years | 94 (87.9%) | 30 (31.9%) |
| 30 to 34 Years | 246 (84.0%) | 54 (22.0%) |
| 35 to 44 Years | 159 (66.5%) | 11 (6.9%) |
| 45 to 54 Years | 230 (52.5%) | 2 (0.9%) |
| 55 to 59 Years | 139 (47.1%) | 8 (5.8%) |
| 60 to 64 Years | 247 (39.6%) | 0 (0.0%) |
| 65 to 74 Years | 131 (13.9%) | 0 (0.0%) |
| 75 Years and over | 47 (10.3%) | 0 (0.0%) |
| Total | 1,417 (38.8%) | 105 (7.4%) |
Employment Status by Educational Attainment in Mora County
According to labor force statistics for Mora County, 55.9% of individuals (1,116) out of the total population between 25 and 64 years of age (1,996) are in the labor force, with 9.4% or 105 of them being unemployed. The group with the highest labor force participation rate are those with the educational attainment of bachelor's degree or higher, with 93.8% or 287 individuals in the labor force. Within the labor force, individuals with high school diploma education have the highest percentage of unemployment, with 22.9% or 92 of them being unemployed.
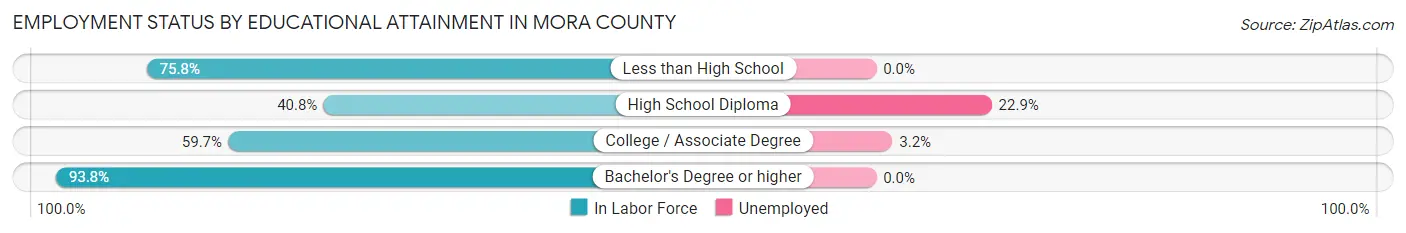
| Educational Attainment | In Labor Force | Unemployed |
| Less than High School | 25 (75.8%) | 0 (0.0%) |
| High School Diploma | 401 (40.8%) | 225 (22.9%) |
| College / Associate Degree | 402 (59.7%) | 22 (3.2%) |
| Bachelor's Degree or higher | 287 (93.8%) | 0 (0.0%) |
| Total | 1,116 (55.9%) | 188 (9.4%) |
Employment Occupations by Sex in Mora County
Management, Business, Science and Arts Occupations
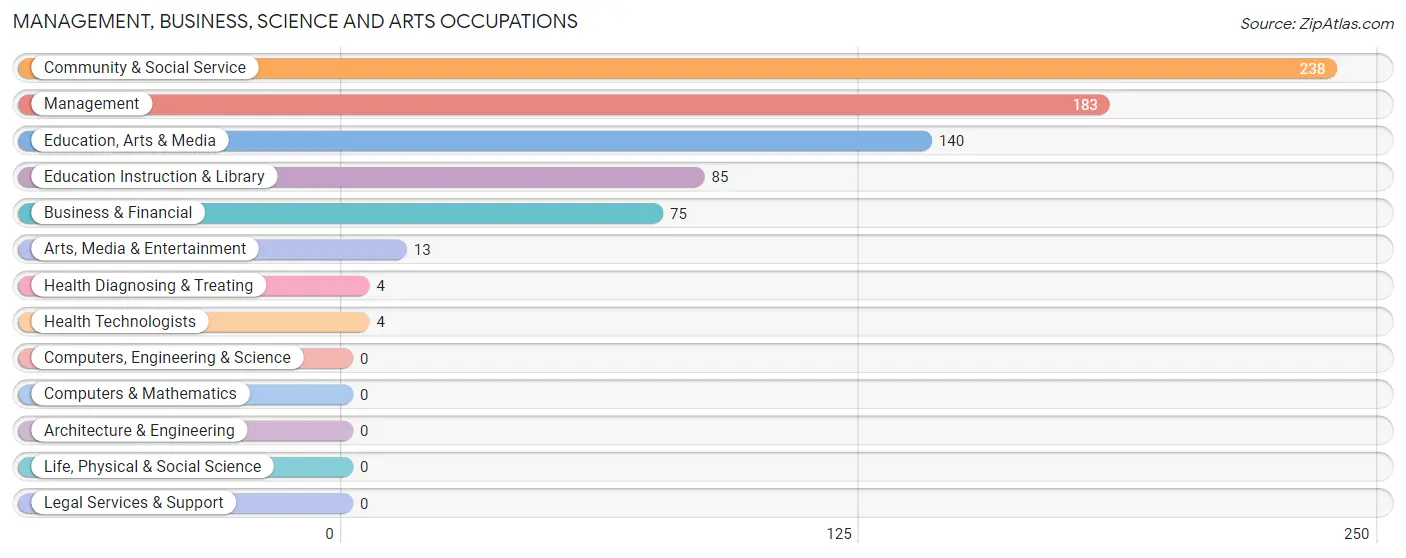
The most common Management, Business, Science and Arts occupations in Mora County are Community & Social Service (238 | 18.1%), Management (183 | 14.0%), Education, Arts & Media (140 | 10.7%), Education Instruction & Library (85 | 6.5%), and Business & Financial (75 | 5.7%).
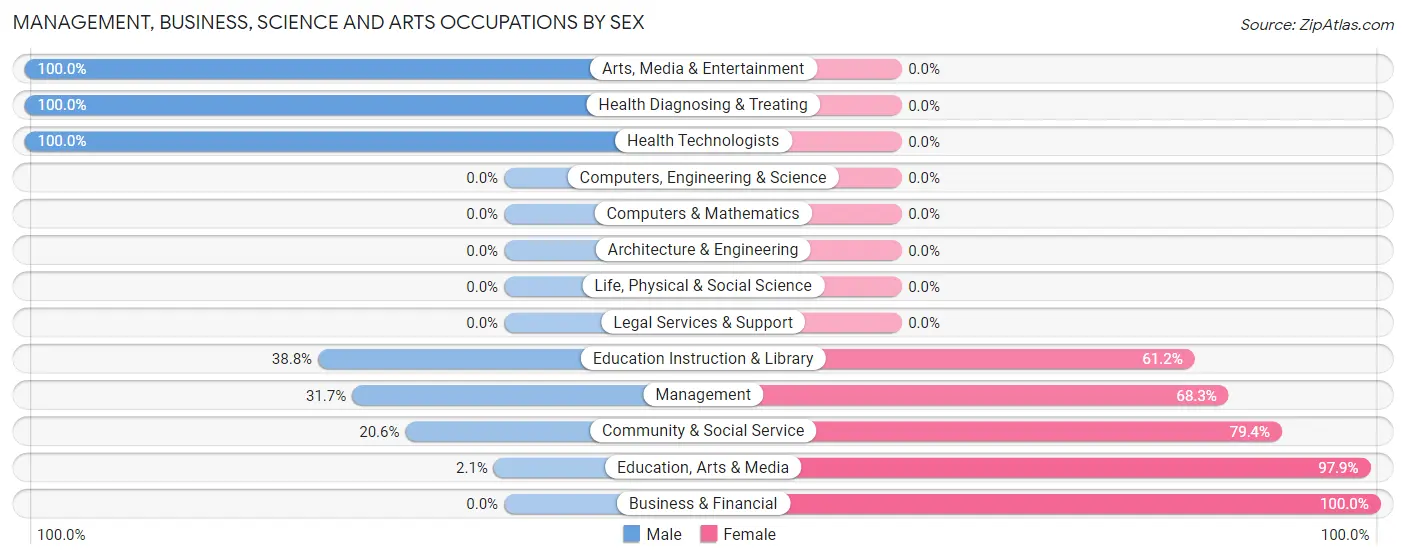
Management, Business, Science and Arts Occupations by Sex
Within the Management, Business, Science and Arts occupations in Mora County, the most male-oriented occupations are Arts, Media & Entertainment (100.0%), Health Diagnosing & Treating (100.0%), and Health Technologists (100.0%), while the most female-oriented occupations are Business & Financial (100.0%), Education, Arts & Media (97.9%), and Community & Social Service (79.4%).
| Occupation | Male | Female |
| Management | 58 (31.7%) | 125 (68.3%) |
| Business & Financial | 0 (0.0%) | 75 (100.0%) |
| Computers, Engineering & Science | 0 (0.0%) | 0 (0.0%) |
| Computers & Mathematics | 0 (0.0%) | 0 (0.0%) |
| Architecture & Engineering | 0 (0.0%) | 0 (0.0%) |
| Life, Physical & Social Science | 0 (0.0%) | 0 (0.0%) |
| Community & Social Service | 49 (20.6%) | 189 (79.4%) |
| Education, Arts & Media | 3 (2.1%) | 137 (97.9%) |
| Legal Services & Support | 0 (0.0%) | 0 (0.0%) |
| Education Instruction & Library | 33 (38.8%) | 52 (61.2%) |
| Arts, Media & Entertainment | 13 (100.0%) | 0 (0.0%) |
| Health Diagnosing & Treating | 4 (100.0%) | 0 (0.0%) |
| Health Technologists | 4 (100.0%) | 0 (0.0%) |
| Total (Category) | 111 (22.2%) | 389 (77.8%) |
| Total (Overall) | 355 (27.1%) | 957 (72.9%) |
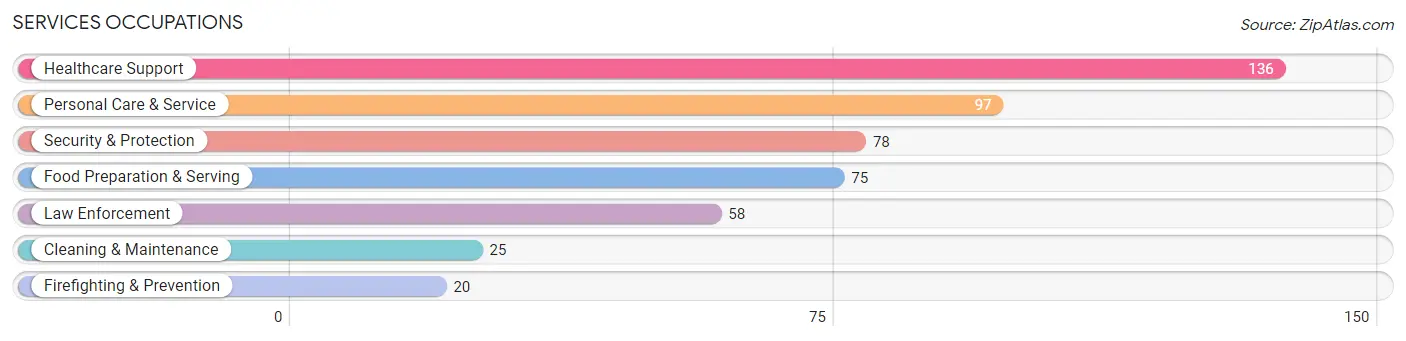
Services Occupations
The most common Services occupations in Mora County are Healthcare Support (136 | 10.4%), Personal Care & Service (97 | 7.4%), Security & Protection (78 | 5.9%), Food Preparation & Serving (75 | 5.7%), and Law Enforcement (58 | 4.4%).
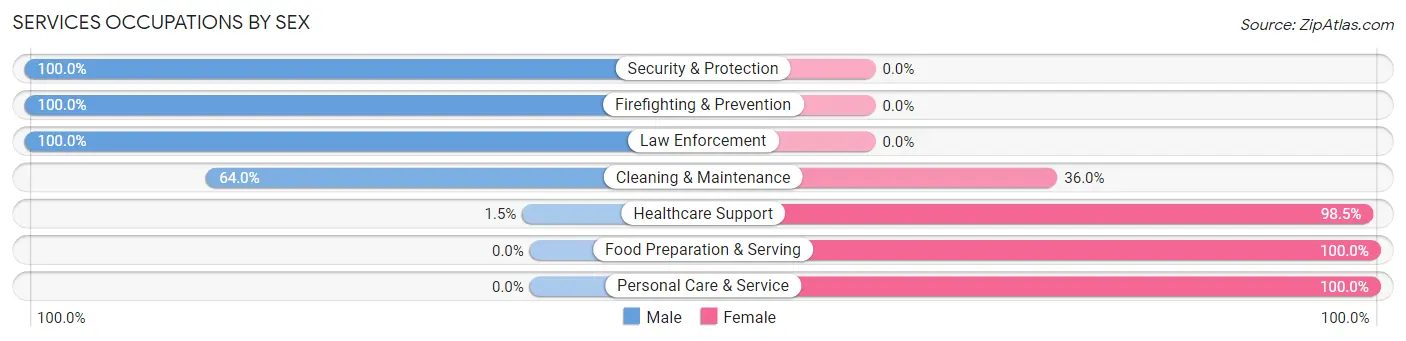
Services Occupations by Sex
Within the Services occupations in Mora County, the most male-oriented occupations are Security & Protection (100.0%), Firefighting & Prevention (100.0%), and Law Enforcement (100.0%), while the most female-oriented occupations are Food Preparation & Serving (100.0%), Personal Care & Service (100.0%), and Healthcare Support (98.5%).
| Occupation | Male | Female |
| Healthcare Support | 2 (1.5%) | 134 (98.5%) |
| Security & Protection | 78 (100.0%) | 0 (0.0%) |
| Firefighting & Prevention | 20 (100.0%) | 0 (0.0%) |
| Law Enforcement | 58 (100.0%) | 0 (0.0%) |
| Food Preparation & Serving | 0 (0.0%) | 75 (100.0%) |
| Cleaning & Maintenance | 16 (64.0%) | 9 (36.0%) |
| Personal Care & Service | 0 (0.0%) | 97 (100.0%) |
| Total (Category) | 96 (23.4%) | 315 (76.6%) |
| Total (Overall) | 355 (27.1%) | 957 (72.9%) |
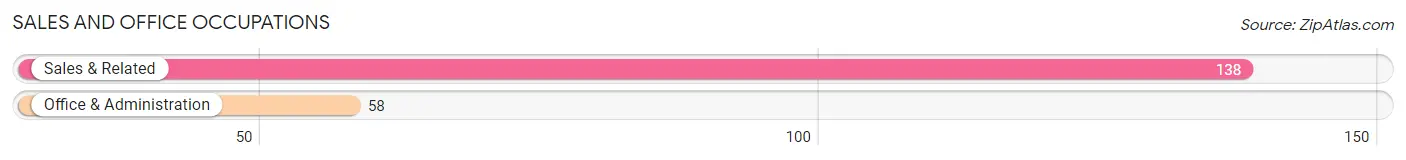
Sales and Office Occupations
The most common Sales and Office occupations in Mora County are Sales & Related (138 | 10.5%), and Office & Administration (58 | 4.4%).
Sales and Office Occupations by Sex

| Occupation | Male | Female |
| Sales & Related | 51 (37.0%) | 87 (63.0%) |
| Office & Administration | 11 (19.0%) | 47 (81.0%) |
| Total (Category) | 62 (31.6%) | 134 (68.4%) |
| Total (Overall) | 355 (27.1%) | 957 (72.9%) |
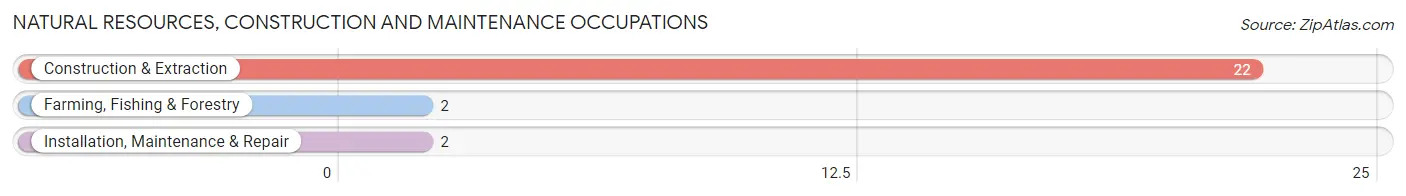
Natural Resources, Construction and Maintenance Occupations
The most common Natural Resources, Construction and Maintenance occupations in Mora County are Construction & Extraction (22 | 1.7%), Farming, Fishing & Forestry (2 | 0.2%), and Installation, Maintenance & Repair (2 | 0.2%).
Natural Resources, Construction and Maintenance Occupations by Sex
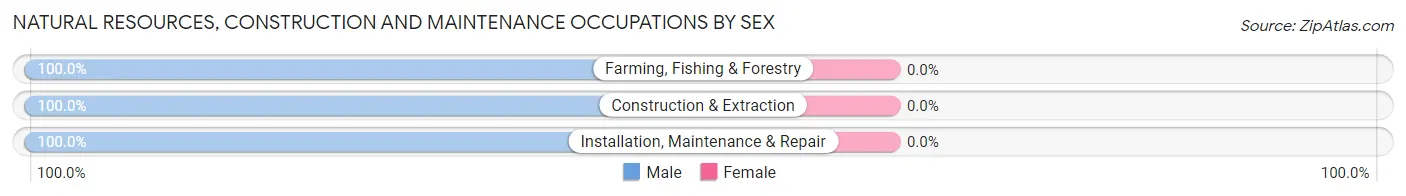
| Occupation | Male | Female |
| Farming, Fishing & Forestry | 2 (100.0%) | 0 (0.0%) |
| Construction & Extraction | 22 (100.0%) | 0 (0.0%) |
| Installation, Maintenance & Repair | 2 (100.0%) | 0 (0.0%) |
| Total (Category) | 26 (100.0%) | 0 (0.0%) |
| Total (Overall) | 355 (27.1%) | 957 (72.9%) |
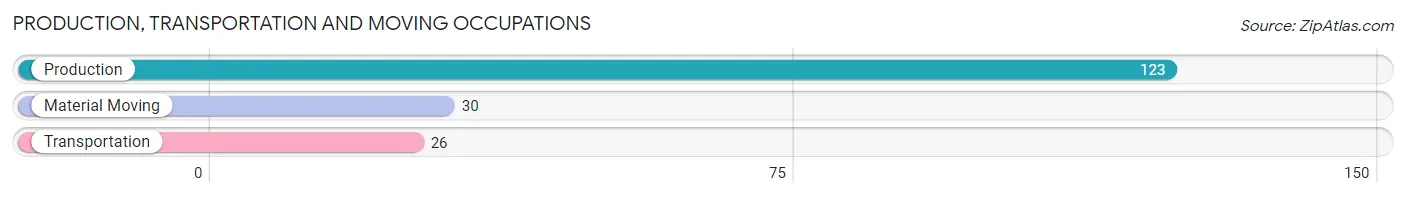
Production, Transportation and Moving Occupations
The most common Production, Transportation and Moving occupations in Mora County are Production (123 | 9.4%), Material Moving (30 | 2.3%), and Transportation (26 | 2.0%).
Production, Transportation and Moving Occupations by Sex
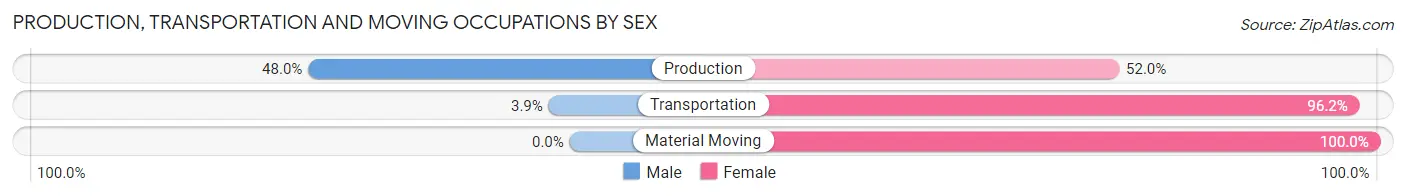
| Occupation | Male | Female |
| Production | 59 (48.0%) | 64 (52.0%) |
| Transportation | 1 (3.8%) | 25 (96.2%) |
| Material Moving | 0 (0.0%) | 30 (100.0%) |
| Total (Category) | 60 (33.5%) | 119 (66.5%) |
| Total (Overall) | 355 (27.1%) | 957 (72.9%) |
Employment Industries by Sex in Mora County
Employment Industries in Mora County
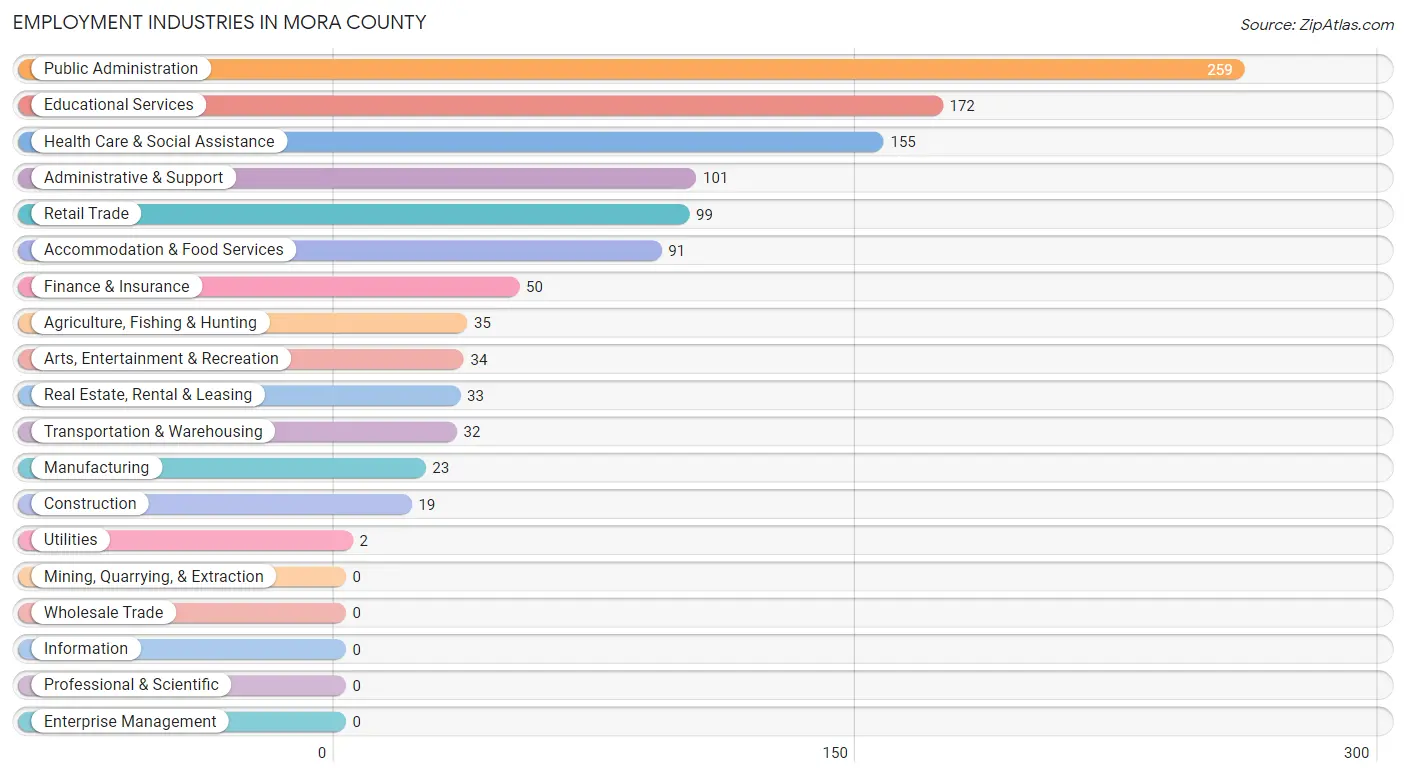
The major employment industries in Mora County include Public Administration (259 | 19.7%), Educational Services (172 | 13.1%), Health Care & Social Assistance (155 | 11.8%), Administrative & Support (101 | 7.7%), and Retail Trade (99 | 7.5%).
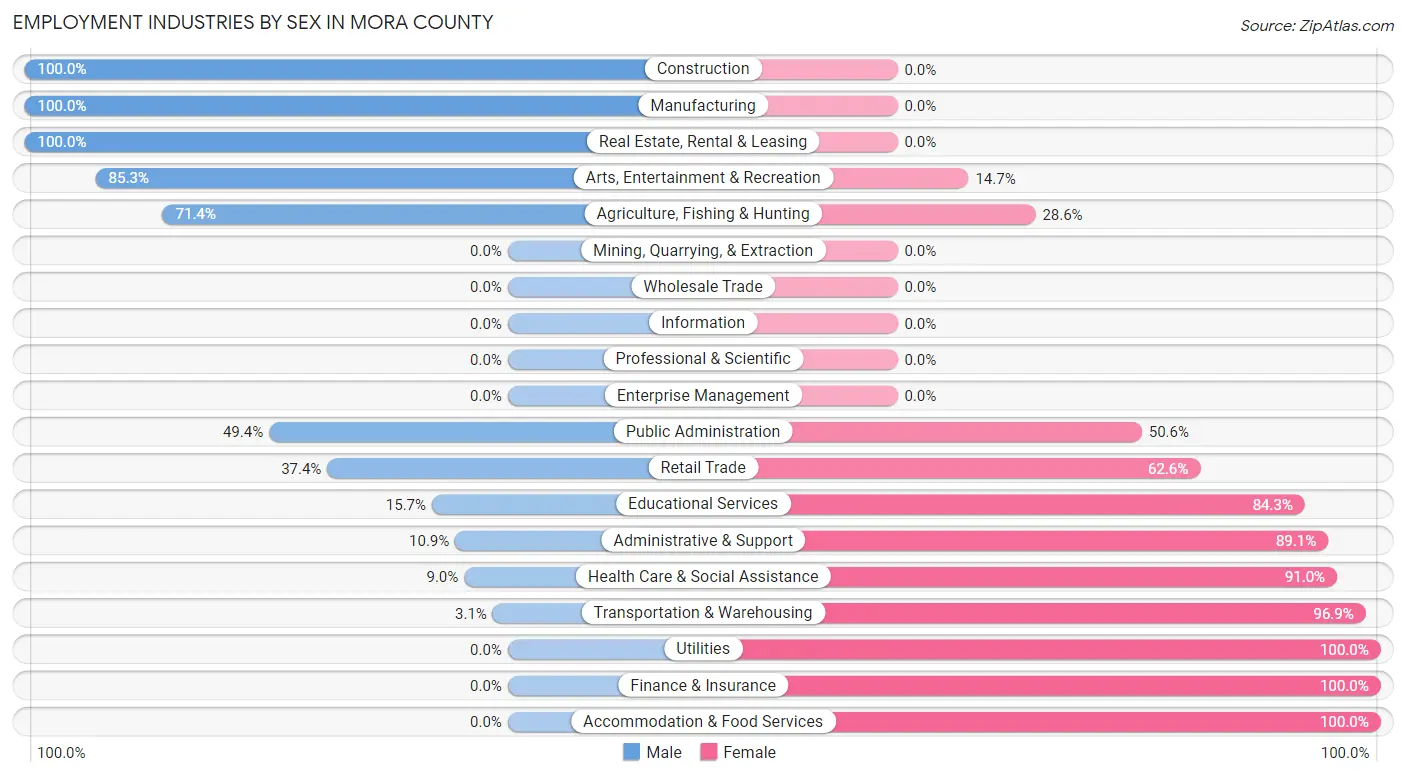
Employment Industries by Sex in Mora County
The Mora County industries that see more men than women are Construction (100.0%), Manufacturing (100.0%), and Real Estate, Rental & Leasing (100.0%), whereas the industries that tend to have a higher number of women are Utilities (100.0%), Finance & Insurance (100.0%), and Accommodation & Food Services (100.0%).
| Industry | Male | Female |
| Agriculture, Fishing & Hunting | 25 (71.4%) | 10 (28.6%) |
| Mining, Quarrying, & Extraction | 0 (0.0%) | 0 (0.0%) |
| Construction | 19 (100.0%) | 0 (0.0%) |
| Manufacturing | 23 (100.0%) | 0 (0.0%) |
| Wholesale Trade | 0 (0.0%) | 0 (0.0%) |
| Retail Trade | 37 (37.4%) | 62 (62.6%) |
| Transportation & Warehousing | 1 (3.1%) | 31 (96.9%) |
| Utilities | 0 (0.0%) | 2 (100.0%) |
| Information | 0 (0.0%) | 0 (0.0%) |
| Finance & Insurance | 0 (0.0%) | 50 (100.0%) |
| Real Estate, Rental & Leasing | 33 (100.0%) | 0 (0.0%) |
| Professional & Scientific | 0 (0.0%) | 0 (0.0%) |
| Enterprise Management | 0 (0.0%) | 0 (0.0%) |
| Administrative & Support | 11 (10.9%) | 90 (89.1%) |
| Educational Services | 27 (15.7%) | 145 (84.3%) |
| Health Care & Social Assistance | 14 (9.0%) | 141 (91.0%) |
| Arts, Entertainment & Recreation | 29 (85.3%) | 5 (14.7%) |
| Accommodation & Food Services | 0 (0.0%) | 91 (100.0%) |
| Public Administration | 128 (49.4%) | 131 (50.6%) |
| Total | 355 (27.1%) | 957 (72.9%) |
Education in Mora County
School Enrollment in Mora County
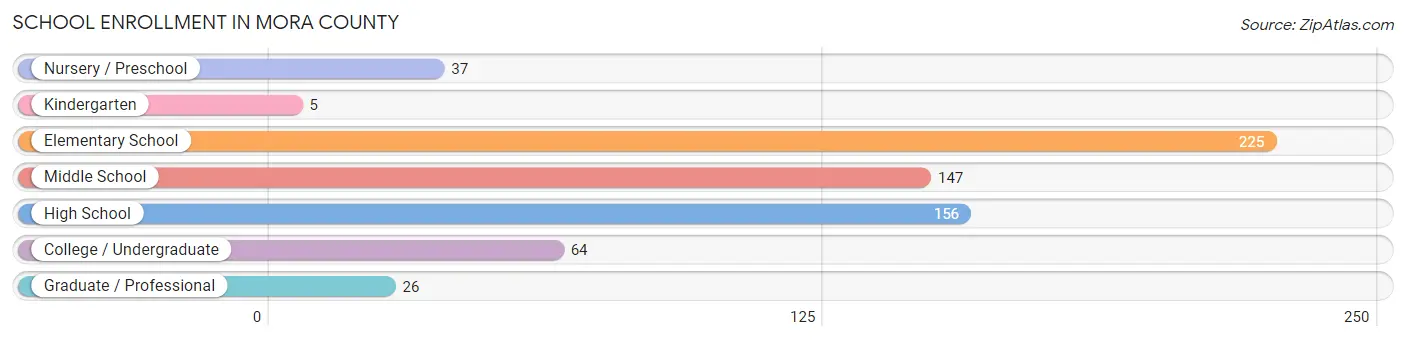
The most common levels of schooling among the 660 students in Mora County are elementary school (225 | 34.1%), high school (156 | 23.6%), and middle school (147 | 22.3%).
| School Level | # Students | % Students |
| Nursery / Preschool | 37 | 5.6% |
| Kindergarten | 5 | 0.8% |
| Elementary School | 225 | 34.1% |
| Middle School | 147 | 22.3% |
| High School | 156 | 23.6% |
| College / Undergraduate | 64 | 9.7% |
| Graduate / Professional | 26 | 3.9% |
| Total | 660 | 100.0% |
School Enrollment by Age by Funding Source in Mora County
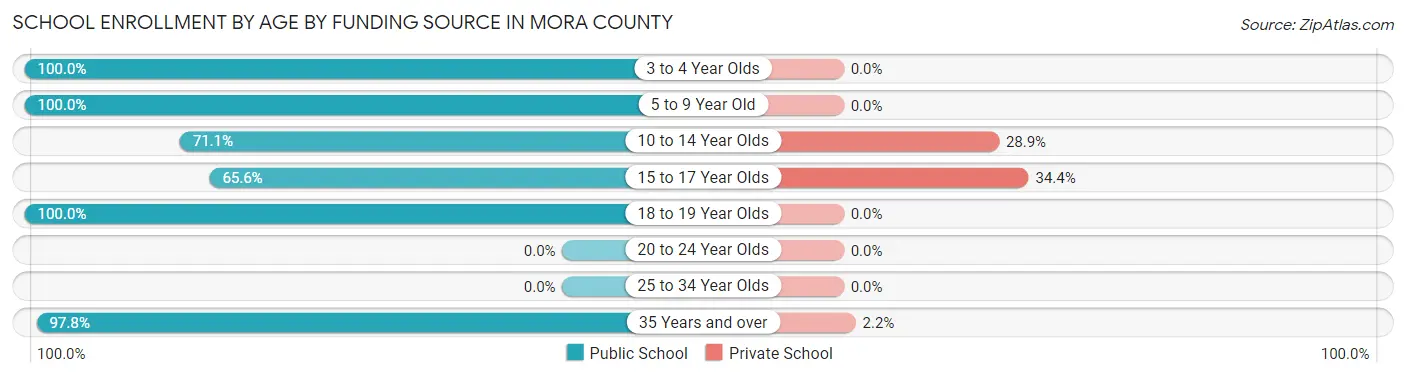
Out of a total of 660 students who are enrolled in schools in Mora County, 102 (15.5%) attend a private institution, while the remaining 558 (84.5%) are enrolled in public schools. The age group of 15 to 17 year olds has the highest likelihood of being enrolled in private schools, with 52 (34.4% in the age bracket) enrolled. Conversely, the age group of 3 to 4 year olds has the lowest likelihood of being enrolled in a private school, with 34 (100.0% in the age bracket) attending a public institution.
| Age Bracket | Public School | Private School |
| 3 to 4 Year Olds | 34 (100.0%) | 0 (0.0%) |
| 5 to 9 Year Old | 207 (100.0%) | 0 (0.0%) |
| 10 to 14 Year Olds | 118 (71.1%) | 48 (28.9%) |
| 15 to 17 Year Olds | 99 (65.6%) | 52 (34.4%) |
| 18 to 19 Year Olds | 12 (100.0%) | 0 (0.0%) |
| 20 to 24 Year Olds | 0 (0.0%) | 0 (0.0%) |
| 25 to 34 Year Olds | 0 (0.0%) | 0 (0.0%) |
| 35 Years and over | 88 (97.8%) | 2 (2.2%) |
| Total | 558 (84.5%) | 102 (15.5%) |
Educational Attainment by Field of Study in Mora County
Education (192 | 27.4%), business (161 | 23.0%), arts & humanities (135 | 19.3%), social sciences (110 | 15.7%), and communications (27 | 3.9%) are the most common fields of study among 700 individuals in Mora County who have obtained a bachelor's degree or higher.
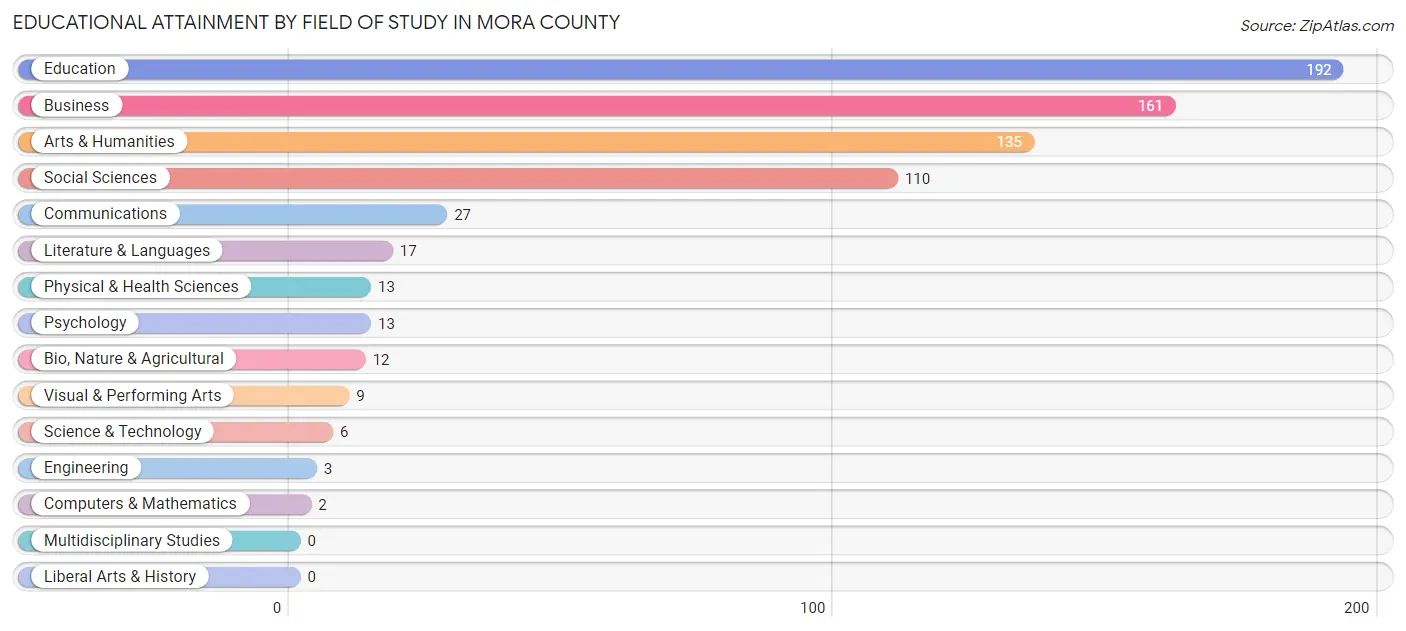
| Field of Study | # Graduates | % Graduates |
| Computers & Mathematics | 2 | 0.3% |
| Bio, Nature & Agricultural | 12 | 1.7% |
| Physical & Health Sciences | 13 | 1.9% |
| Psychology | 13 | 1.9% |
| Social Sciences | 110 | 15.7% |
| Engineering | 3 | 0.4% |
| Multidisciplinary Studies | 0 | 0.0% |
| Science & Technology | 6 | 0.9% |
| Business | 161 | 23.0% |
| Education | 192 | 27.4% |
| Literature & Languages | 17 | 2.4% |
| Liberal Arts & History | 0 | 0.0% |
| Visual & Performing Arts | 9 | 1.3% |
| Communications | 27 | 3.9% |
| Arts & Humanities | 135 | 19.3% |
| Total | 700 | 100.0% |
Transportation & Commute in Mora County
Vehicle Availability by Sex in Mora County
The most prevalent vehicle ownership categories in Mora County are males with 2 vehicles (123, accounting for 34.8%) and females with 2 vehicles (165, making up 12.9%).
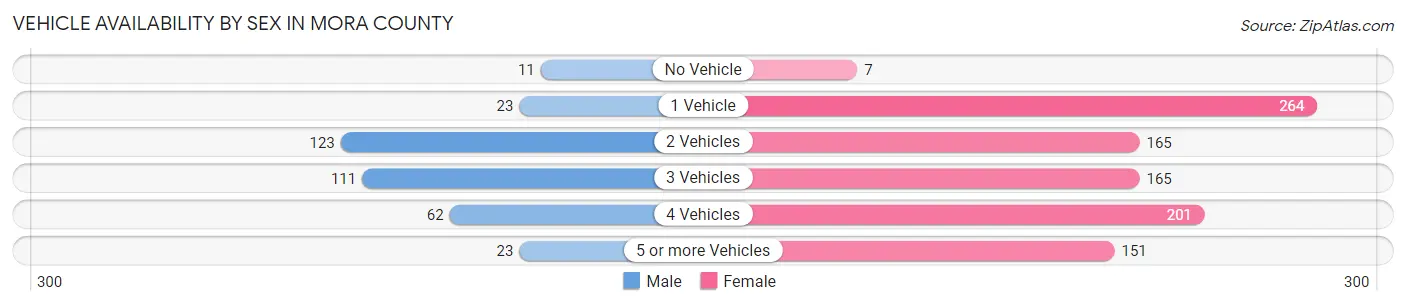
| Vehicles Available | Male | Female |
| No Vehicle | 11 (3.1%) | 7 (0.7%) |
| 1 Vehicle | 23 (6.5%) | 264 (27.7%) |
| 2 Vehicles | 123 (34.8%) | 165 (17.3%) |
| 3 Vehicles | 111 (31.4%) | 165 (17.3%) |
| 4 Vehicles | 62 (17.6%) | 201 (21.1%) |
| 5 or more Vehicles | 23 (6.5%) | 151 (15.8%) |
| Total | 353 (100.0%) | 953 (100.0%) |
Commute Time in Mora County
The most frequently occuring commute durations in Mora County are 90 or more minutes (280 commuters, 24.6%), 45 to 59 minutes (218 commuters, 19.1%), and less than 5 minutes (144 commuters, 12.6%).
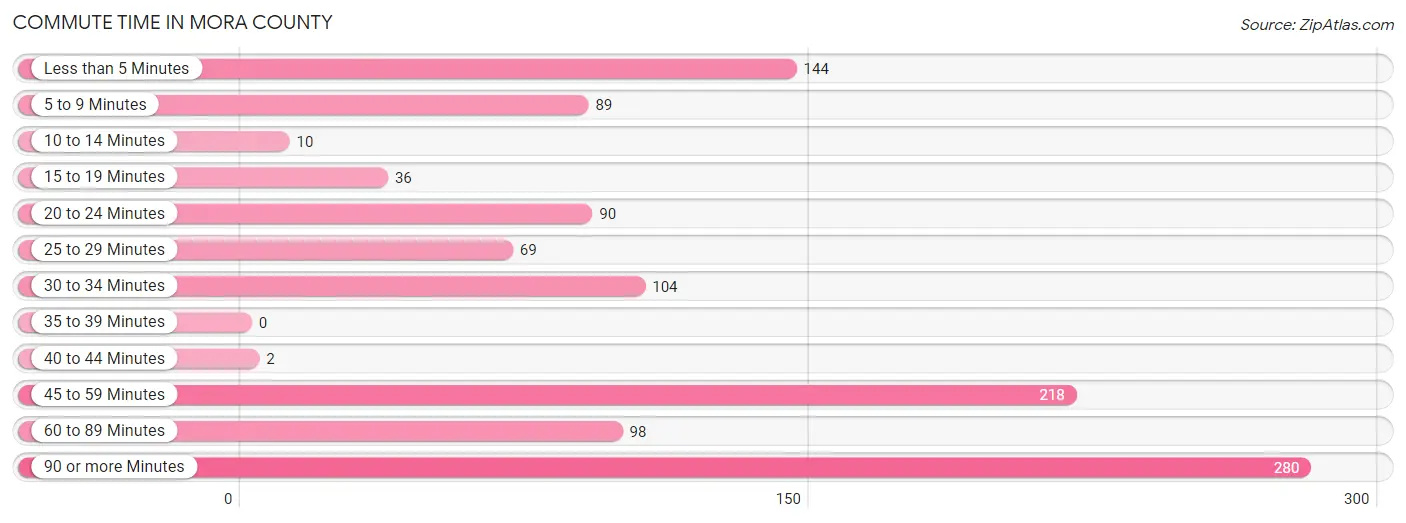
| Commute Time | # Commuters | % Commuters |
| Less than 5 Minutes | 144 | 12.6% |
| 5 to 9 Minutes | 89 | 7.8% |
| 10 to 14 Minutes | 10 | 0.9% |
| 15 to 19 Minutes | 36 | 3.2% |
| 20 to 24 Minutes | 90 | 7.9% |
| 25 to 29 Minutes | 69 | 6.0% |
| 30 to 34 Minutes | 104 | 9.1% |
| 35 to 39 Minutes | 0 | 0.0% |
| 40 to 44 Minutes | 2 | 0.2% |
| 45 to 59 Minutes | 218 | 19.1% |
| 60 to 89 Minutes | 98 | 8.6% |
| 90 or more Minutes | 280 | 24.6% |
Commute Time by Sex in Mora County
The most common commute times in Mora County are 90 or more minutes (105 commuters, 32.9%) for males and 45 to 59 minutes (212 commuters, 25.8%) for females.
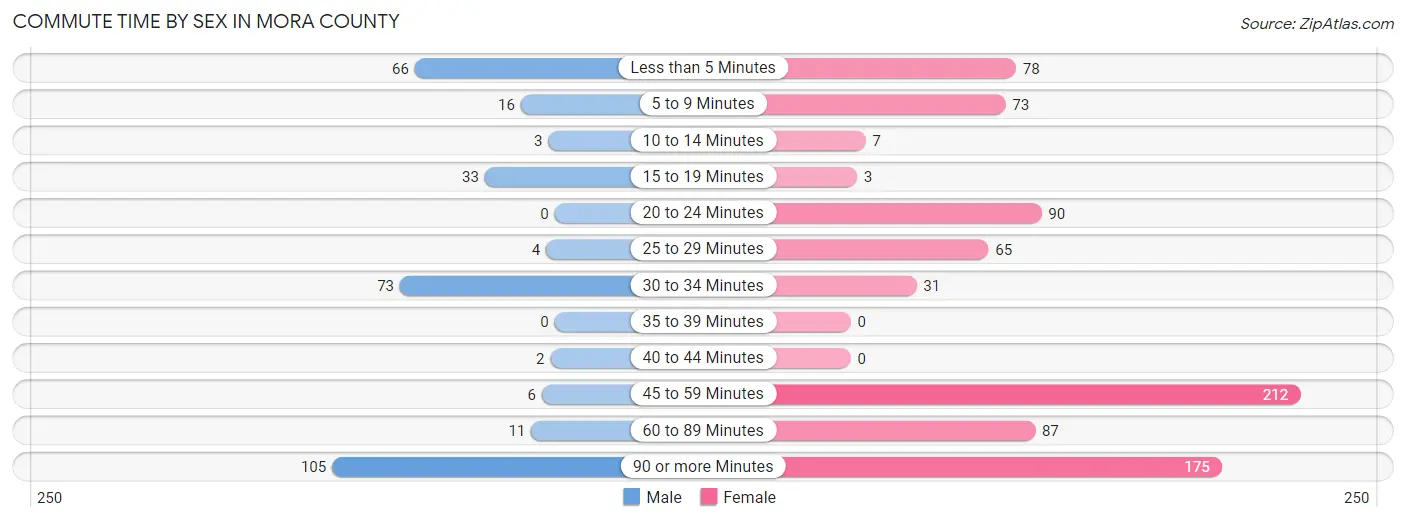
| Commute Time | Male | Female |
| Less than 5 Minutes | 66 (20.7%) | 78 (9.5%) |
| 5 to 9 Minutes | 16 (5.0%) | 73 (8.9%) |
| 10 to 14 Minutes | 3 (0.9%) | 7 (0.9%) |
| 15 to 19 Minutes | 33 (10.3%) | 3 (0.4%) |
| 20 to 24 Minutes | 0 (0.0%) | 90 (11.0%) |
| 25 to 29 Minutes | 4 (1.3%) | 65 (7.9%) |
| 30 to 34 Minutes | 73 (22.9%) | 31 (3.8%) |
| 35 to 39 Minutes | 0 (0.0%) | 0 (0.0%) |
| 40 to 44 Minutes | 2 (0.6%) | 0 (0.0%) |
| 45 to 59 Minutes | 6 (1.9%) | 212 (25.8%) |
| 60 to 89 Minutes | 11 (3.5%) | 87 (10.6%) |
| 90 or more Minutes | 105 (32.9%) | 175 (21.3%) |
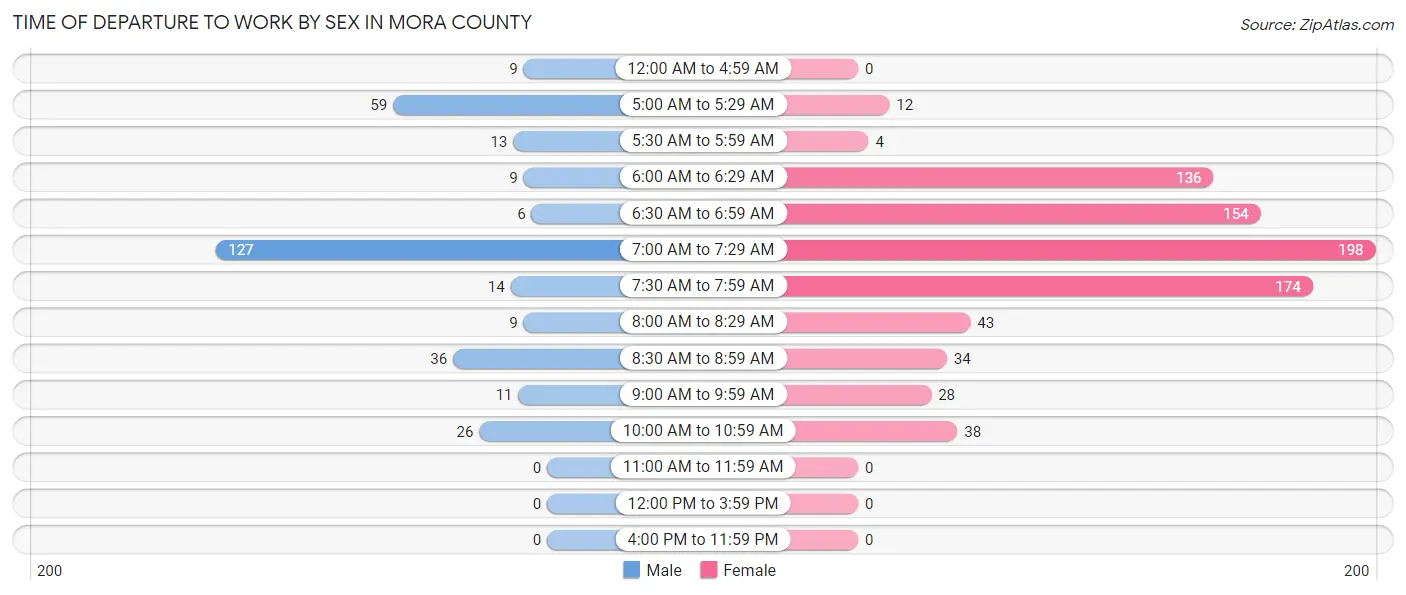
Time of Departure to Work by Sex in Mora County
The most frequent times of departure to work in Mora County are 7:00 AM to 7:29 AM (127, 39.8%) for males and 7:00 AM to 7:29 AM (198, 24.1%) for females.
| Time of Departure | Male | Female |
| 12:00 AM to 4:59 AM | 9 (2.8%) | 0 (0.0%) |
| 5:00 AM to 5:29 AM | 59 (18.5%) | 12 (1.5%) |
| 5:30 AM to 5:59 AM | 13 (4.1%) | 4 (0.5%) |
| 6:00 AM to 6:29 AM | 9 (2.8%) | 136 (16.6%) |
| 6:30 AM to 6:59 AM | 6 (1.9%) | 154 (18.8%) |
| 7:00 AM to 7:29 AM | 127 (39.8%) | 198 (24.1%) |
| 7:30 AM to 7:59 AM | 14 (4.4%) | 174 (21.2%) |
| 8:00 AM to 8:29 AM | 9 (2.8%) | 43 (5.2%) |
| 8:30 AM to 8:59 AM | 36 (11.3%) | 34 (4.1%) |
| 9:00 AM to 9:59 AM | 11 (3.5%) | 28 (3.4%) |
| 10:00 AM to 10:59 AM | 26 (8.2%) | 38 (4.6%) |
| 11:00 AM to 11:59 AM | 0 (0.0%) | 0 (0.0%) |
| 12:00 PM to 3:59 PM | 0 (0.0%) | 0 (0.0%) |
| 4:00 PM to 11:59 PM | 0 (0.0%) | 0 (0.0%) |
| Total | 319 (100.0%) | 821 (100.0%) |
Housing Occupancy in Mora County
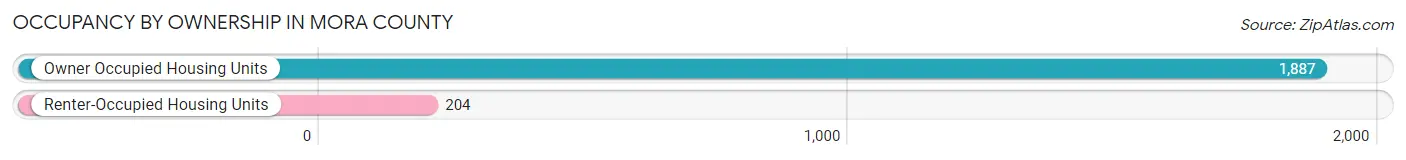
Occupancy by Ownership in Mora County
Of the total 2,091 dwellings in Mora County, owner-occupied units account for 1,887 (90.2%), while renter-occupied units make up 204 (9.8%).
| Occupancy | # Housing Units | % Housing Units |
| Owner Occupied Housing Units | 1,887 | 90.2% |
| Renter-Occupied Housing Units | 204 | 9.8% |
| Total Occupied Housing Units | 2,091 | 100.0% |
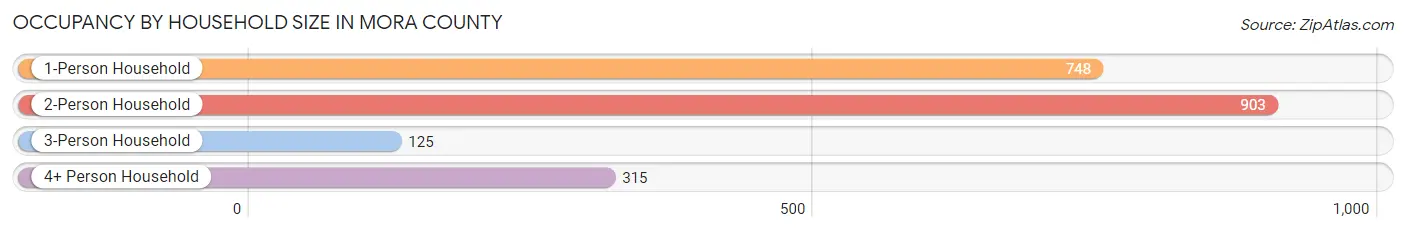
Occupancy by Household Size in Mora County
| Household Size | # Housing Units | % Housing Units |
| 1-Person Household | 748 | 35.8% |
| 2-Person Household | 903 | 43.2% |
| 3-Person Household | 125 | 6.0% |
| 4+ Person Household | 315 | 15.1% |
| Total Housing Units | 2,091 | 100.0% |
Occupancy by Ownership by Household Size in Mora County
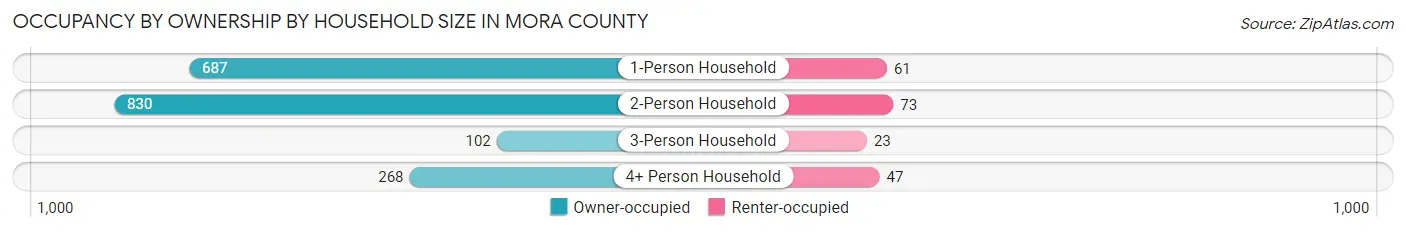
| Household Size | Owner-occupied | Renter-occupied |
| 1-Person Household | 687 (91.8%) | 61 (8.2%) |
| 2-Person Household | 830 (91.9%) | 73 (8.1%) |
| 3-Person Household | 102 (81.6%) | 23 (18.4%) |
| 4+ Person Household | 268 (85.1%) | 47 (14.9%) |
| Total Housing Units | 1,887 (90.2%) | 204 (9.8%) |
Occupancy by Educational Attainment in Mora County
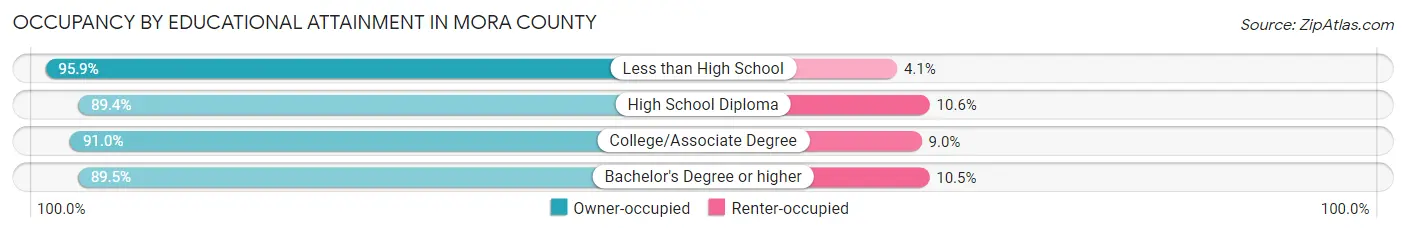
| Household Size | Owner-occupied | Renter-occupied |
| Less than High School | 93 (95.9%) | 4 (4.1%) |
| High School Diploma | 759 (89.4%) | 90 (10.6%) |
| College/Associate Degree | 627 (91.0%) | 62 (9.0%) |
| Bachelor's Degree or higher | 408 (89.5%) | 48 (10.5%) |
Occupancy by Age of Householder in Mora County
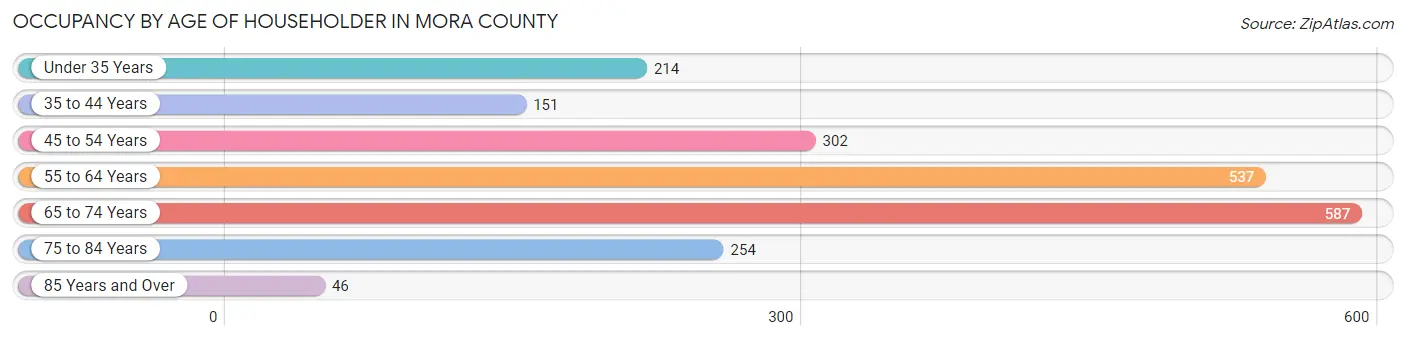
| Age Bracket | # Households | % Households |
| Under 35 Years | 214 | 10.2% |
| 35 to 44 Years | 151 | 7.2% |
| 45 to 54 Years | 302 | 14.4% |
| 55 to 64 Years | 537 | 25.7% |
| 65 to 74 Years | 587 | 28.1% |
| 75 to 84 Years | 254 | 12.1% |
| 85 Years and Over | 46 | 2.2% |
| Total | 2,091 | 100.0% |
Housing Finances in Mora County
Median Income by Occupancy in Mora County
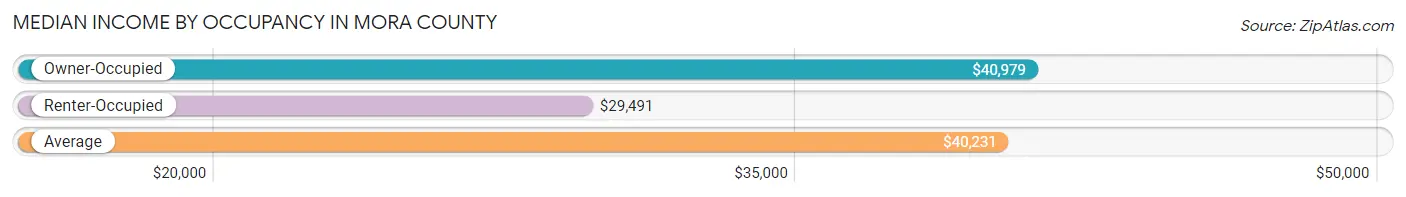
| Occupancy Type | # Households | Median Income |
| Owner-Occupied | 1,887 (90.2%) | $40,979 |
| Renter-Occupied | 204 (9.8%) | $29,491 |
| Average | 2,091 (100.0%) | $40,231 |
Occupancy by Householder Income Bracket in Mora County
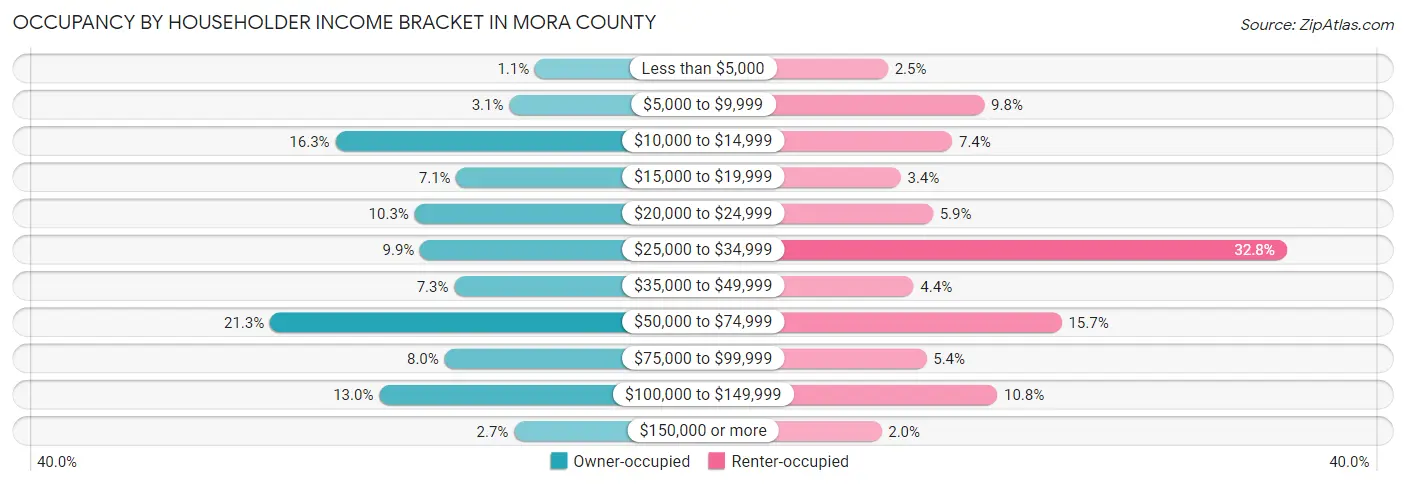
| Income Bracket | Owner-occupied | Renter-occupied |
| Less than $5,000 | 21 (1.1%) | 5 (2.5%) |
| $5,000 to $9,999 | 58 (3.1%) | 20 (9.8%) |
| $10,000 to $14,999 | 308 (16.3%) | 15 (7.3%) |
| $15,000 to $19,999 | 134 (7.1%) | 7 (3.4%) |
| $20,000 to $24,999 | 194 (10.3%) | 12 (5.9%) |
| $25,000 to $34,999 | 186 (9.9%) | 67 (32.8%) |
| $35,000 to $49,999 | 137 (7.3%) | 9 (4.4%) |
| $50,000 to $74,999 | 402 (21.3%) | 32 (15.7%) |
| $75,000 to $99,999 | 151 (8.0%) | 11 (5.4%) |
| $100,000 to $149,999 | 245 (13.0%) | 22 (10.8%) |
| $150,000 or more | 51 (2.7%) | 4 (2.0%) |
| Total | 1,887 (100.0%) | 204 (100.0%) |
Monthly Housing Cost Tiers in Mora County
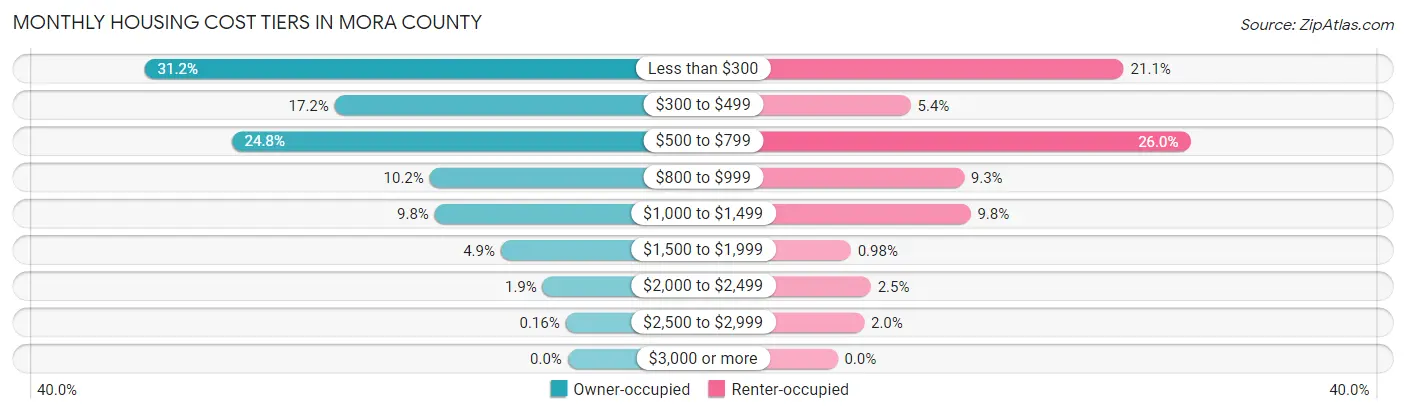
| Monthly Cost | Owner-occupied | Renter-occupied |
| Less than $300 | 588 (31.2%) | 43 (21.1%) |
| $300 to $499 | 324 (17.2%) | 11 (5.4%) |
| $500 to $799 | 467 (24.7%) | 53 (26.0%) |
| $800 to $999 | 192 (10.2%) | 19 (9.3%) |
| $1,000 to $1,499 | 185 (9.8%) | 20 (9.8%) |
| $1,500 to $1,999 | 93 (4.9%) | 2 (1.0%) |
| $2,000 to $2,499 | 35 (1.8%) | 5 (2.5%) |
| $2,500 to $2,999 | 3 (0.2%) | 4 (2.0%) |
| $3,000 or more | 0 (0.0%) | 0 (0.0%) |
| Total | 1,887 (100.0%) | 204 (100.0%) |
Physical Housing Characteristics in Mora County
Housing Structures in Mora County
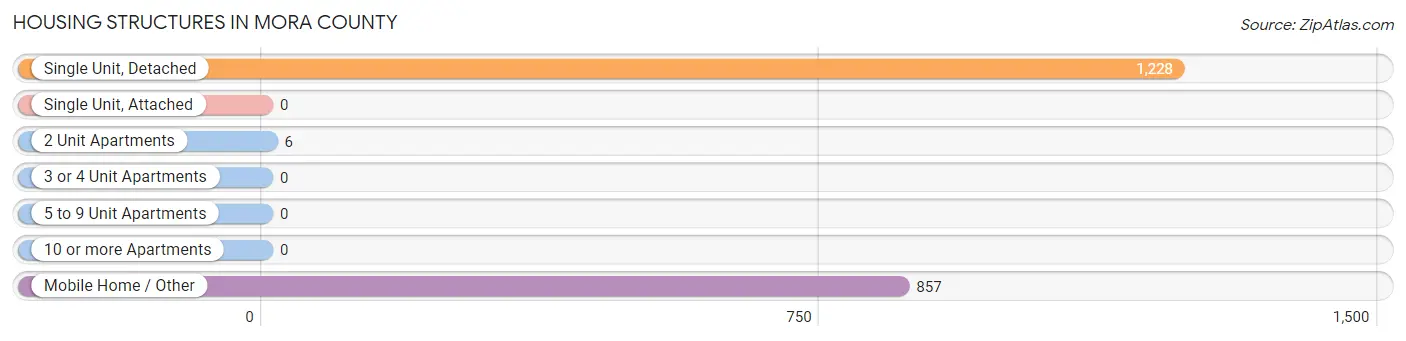
| Structure Type | # Housing Units | % Housing Units |
| Single Unit, Detached | 1,228 | 58.7% |
| Single Unit, Attached | 0 | 0.0% |
| 2 Unit Apartments | 6 | 0.3% |
| 3 or 4 Unit Apartments | 0 | 0.0% |
| 5 to 9 Unit Apartments | 0 | 0.0% |
| 10 or more Apartments | 0 | 0.0% |
| Mobile Home / Other | 857 | 41.0% |
| Total | 2,091 | 100.0% |
Housing Structures by Occupancy in Mora County
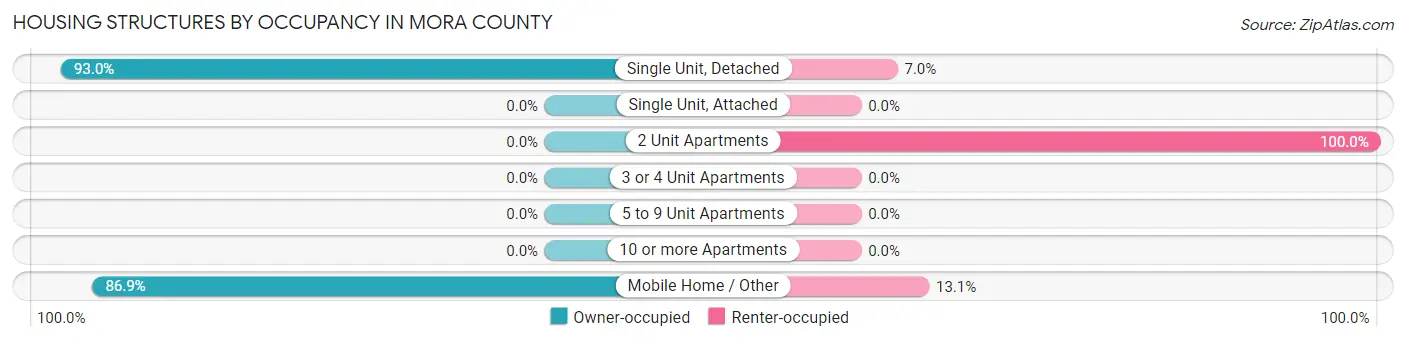
| Structure Type | Owner-occupied | Renter-occupied |
| Single Unit, Detached | 1,142 (93.0%) | 86 (7.0%) |
| Single Unit, Attached | 0 (0.0%) | 0 (0.0%) |
| 2 Unit Apartments | 0 (0.0%) | 6 (100.0%) |
| 3 or 4 Unit Apartments | 0 (0.0%) | 0 (0.0%) |
| 5 to 9 Unit Apartments | 0 (0.0%) | 0 (0.0%) |
| 10 or more Apartments | 0 (0.0%) | 0 (0.0%) |
| Mobile Home / Other | 745 (86.9%) | 112 (13.1%) |
| Total | 1,887 (90.2%) | 204 (9.8%) |
Housing Structures by Number of Rooms in Mora County
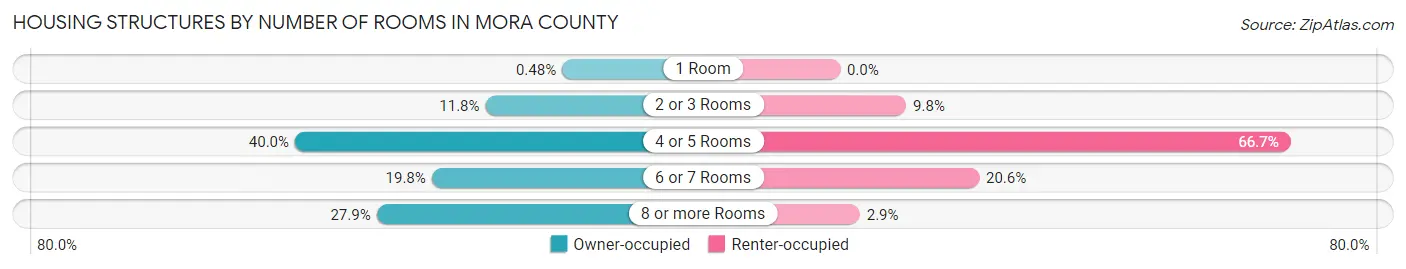
| Number of Rooms | Owner-occupied | Renter-occupied |
| 1 Room | 9 (0.5%) | 0 (0.0%) |
| 2 or 3 Rooms | 223 (11.8%) | 20 (9.8%) |
| 4 or 5 Rooms | 755 (40.0%) | 136 (66.7%) |
| 6 or 7 Rooms | 373 (19.8%) | 42 (20.6%) |
| 8 or more Rooms | 527 (27.9%) | 6 (2.9%) |
| Total | 1,887 (100.0%) | 204 (100.0%) |
Housing Structure by Heating Type in Mora County
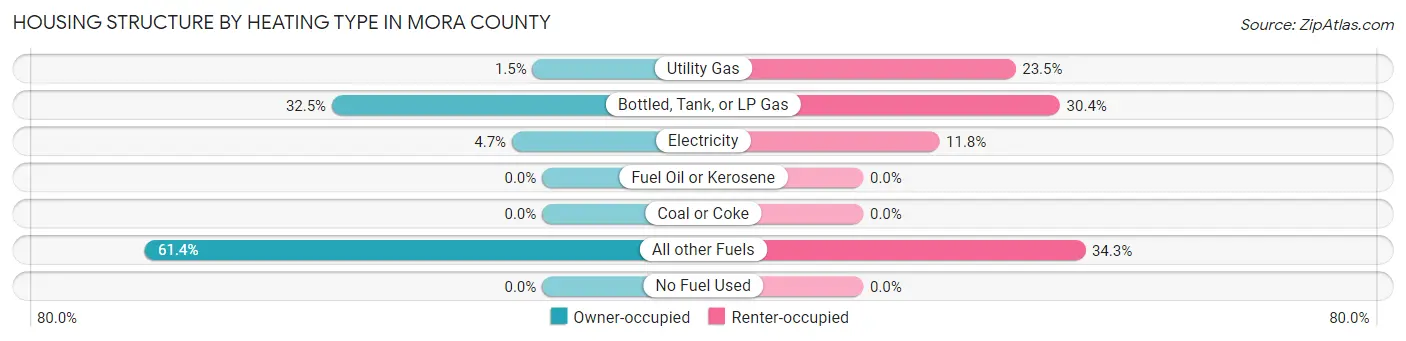
| Heating Type | Owner-occupied | Renter-occupied |
| Utility Gas | 28 (1.5%) | 48 (23.5%) |
| Bottled, Tank, or LP Gas | 613 (32.5%) | 62 (30.4%) |
| Electricity | 88 (4.7%) | 24 (11.8%) |
| Fuel Oil or Kerosene | 0 (0.0%) | 0 (0.0%) |
| Coal or Coke | 0 (0.0%) | 0 (0.0%) |
| All other Fuels | 1,158 (61.4%) | 70 (34.3%) |
| No Fuel Used | 0 (0.0%) | 0 (0.0%) |
| Total | 1,887 (100.0%) | 204 (100.0%) |
Household Vehicle Usage in Mora County
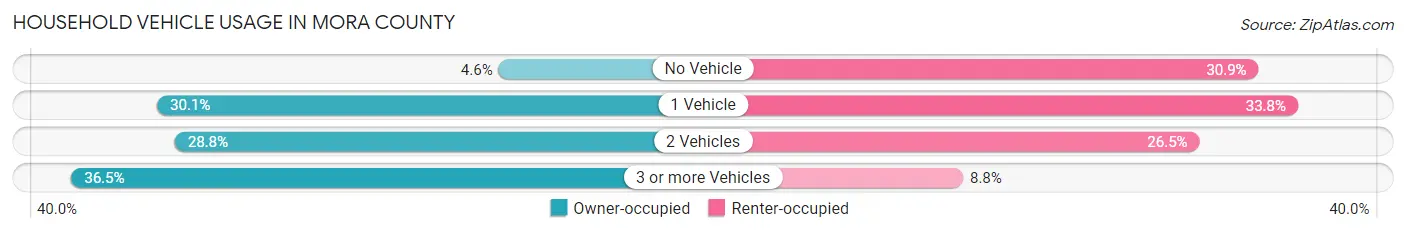
| Vehicles per Household | Owner-occupied | Renter-occupied |
| No Vehicle | 87 (4.6%) | 63 (30.9%) |
| 1 Vehicle | 568 (30.1%) | 69 (33.8%) |
| 2 Vehicles | 543 (28.8%) | 54 (26.5%) |
| 3 or more Vehicles | 689 (36.5%) | 18 (8.8%) |
| Total | 1,887 (100.0%) | 204 (100.0%) |
Real Estate & Mortgages in Mora County
Real Estate and Mortgage Overview in Mora County
| Characteristic | Without Mortgage | With Mortgage |
| Housing Units | 1,480 | 407 |
| Median Property Value | $58,700 | $190,100 |
| Median Household Income | $29,904 | $3 |
| Monthly Housing Costs | $340 | $0 |
| Real Estate Taxes | $462 | $30 |
Property Value by Mortgage Status in Mora County
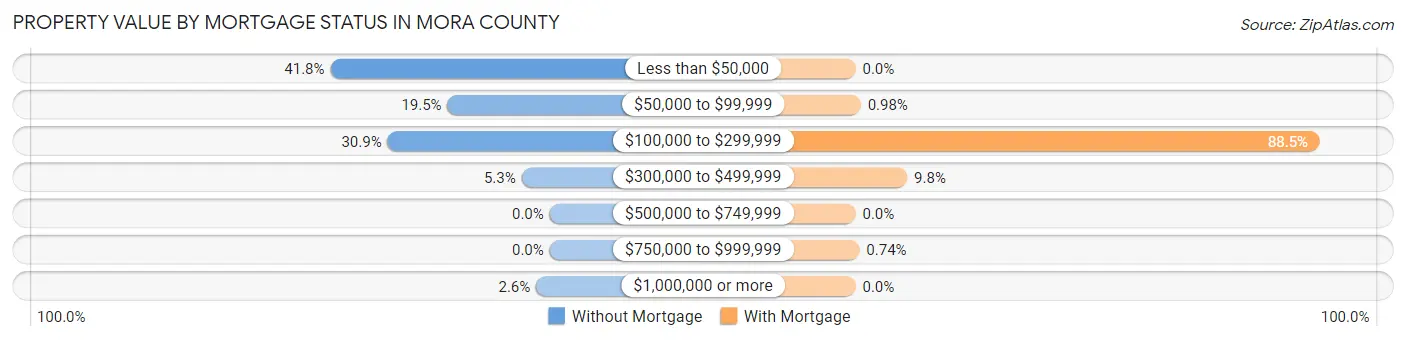
| Property Value | Without Mortgage | With Mortgage |
| Less than $50,000 | 618 (41.8%) | 0 (0.0%) |
| $50,000 to $99,999 | 288 (19.5%) | 4 (1.0%) |
| $100,000 to $299,999 | 457 (30.9%) | 360 (88.4%) |
| $300,000 to $499,999 | 79 (5.3%) | 40 (9.8%) |
| $500,000 to $749,999 | 0 (0.0%) | 0 (0.0%) |
| $750,000 to $999,999 | 0 (0.0%) | 3 (0.7%) |
| $1,000,000 or more | 38 (2.6%) | 0 (0.0%) |
| Total | 1,480 (100.0%) | 407 (100.0%) |
Household Income by Mortgage Status in Mora County
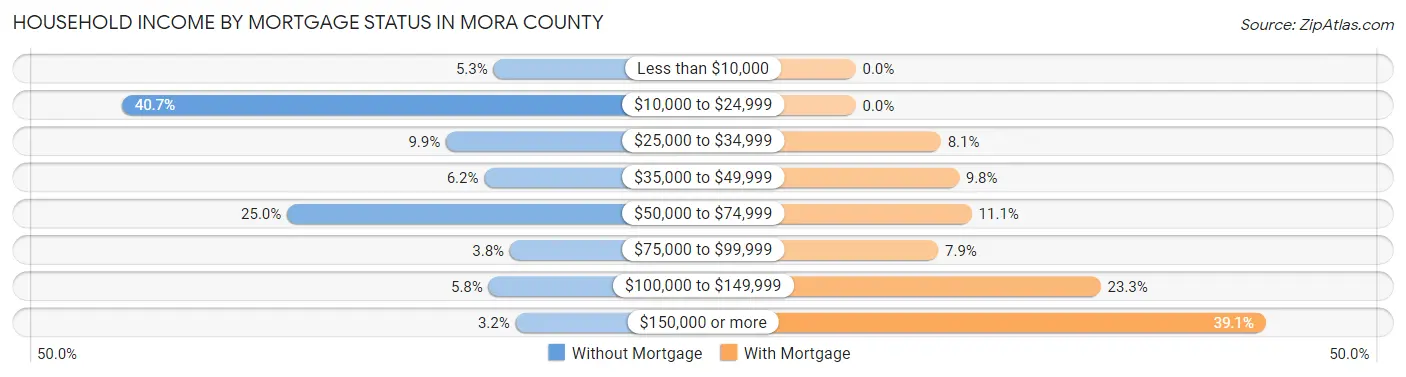
| Household Income | Without Mortgage | With Mortgage |
| Less than $10,000 | 79 (5.3%) | 0 (0.0%) |
| $10,000 to $24,999 | 603 (40.7%) | 0 (0.0%) |
| $25,000 to $34,999 | 146 (9.9%) | 33 (8.1%) |
| $35,000 to $49,999 | 92 (6.2%) | 40 (9.8%) |
| $50,000 to $74,999 | 370 (25.0%) | 45 (11.1%) |
| $75,000 to $99,999 | 56 (3.8%) | 32 (7.9%) |
| $100,000 to $149,999 | 86 (5.8%) | 95 (23.3%) |
| $150,000 or more | 48 (3.2%) | 159 (39.1%) |
| Total | 1,480 (100.0%) | 407 (100.0%) |
Property Value to Household Income Ratio in Mora County
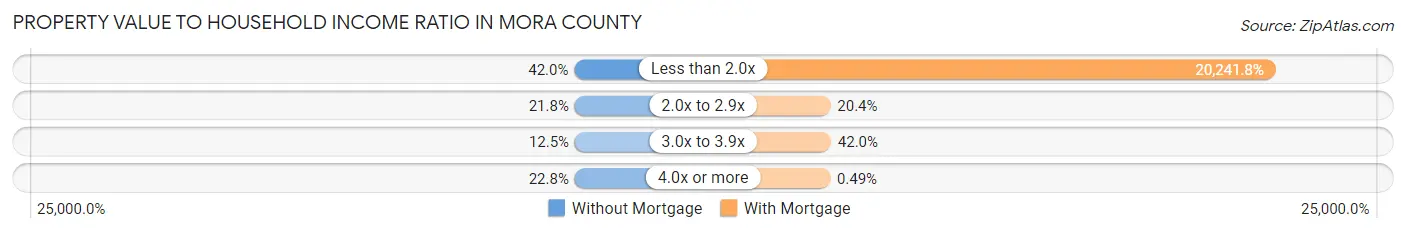
| Value-to-Income Ratio | Without Mortgage | With Mortgage |
| Less than 2.0x | 622 (42.0%) | 82,384 (20,241.8%) |
| 2.0x to 2.9x | 322 (21.8%) | 83 (20.4%) |
| 3.0x to 3.9x | 185 (12.5%) | 171 (42.0%) |
| 4.0x or more | 338 (22.8%) | 2 (0.5%) |
| Total | 1,480 (100.0%) | 407 (100.0%) |
Real Estate Taxes by Mortgage Status in Mora County
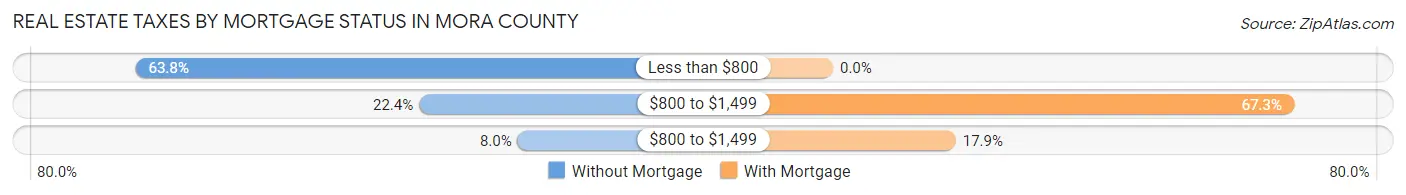
| Property Taxes | Without Mortgage | With Mortgage |
| Less than $800 | 944 (63.8%) | 0 (0.0%) |
| $800 to $1,499 | 331 (22.4%) | 274 (67.3%) |
| $800 to $1,499 | 118 (8.0%) | 73 (17.9%) |
| Total | 1,480 (100.0%) | 407 (100.0%) |
Health & Disability in Mora County
Health Insurance Coverage by Age in Mora County
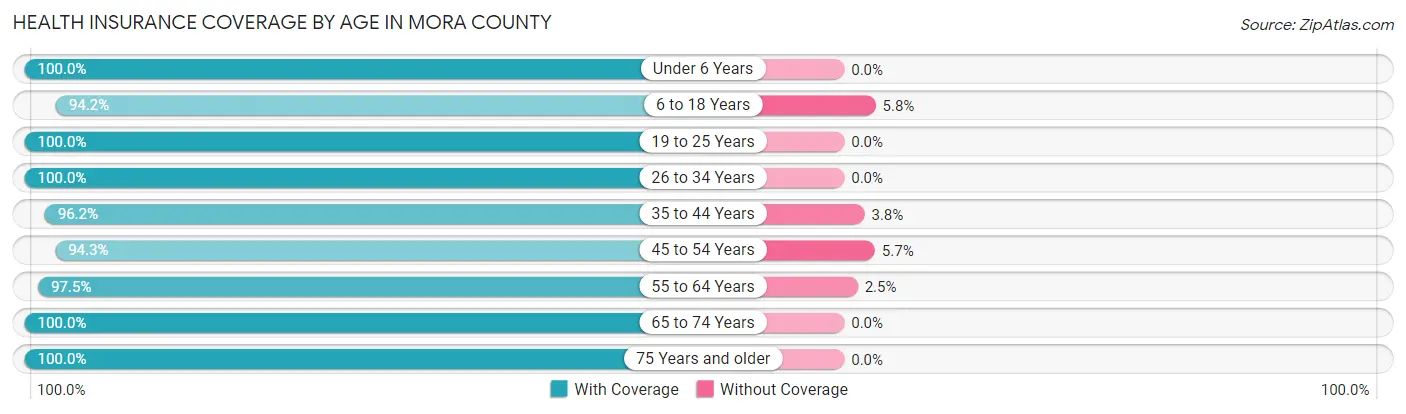
| Age Bracket | With Coverage | Without Coverage |
| Under 6 Years | 127 (100.0%) | 0 (0.0%) |
| 6 to 18 Years | 500 (94.2%) | 31 (5.8%) |
| 19 to 25 Years | 239 (100.0%) | 0 (0.0%) |
| 26 to 34 Years | 317 (100.0%) | 0 (0.0%) |
| 35 to 44 Years | 230 (96.2%) | 9 (3.8%) |
| 45 to 54 Years | 413 (94.3%) | 25 (5.7%) |
| 55 to 64 Years | 896 (97.5%) | 23 (2.5%) |
| 65 to 74 Years | 940 (100.0%) | 0 (0.0%) |
| 75 Years and older | 458 (100.0%) | 0 (0.0%) |
| Total | 4,120 (97.9%) | 88 (2.1%) |
Health Insurance Coverage by Citizenship Status in Mora County
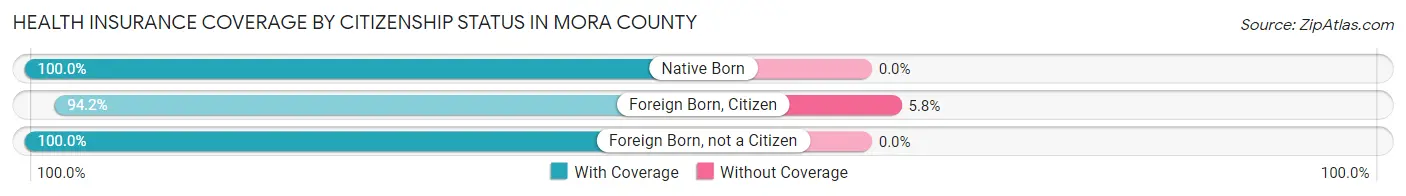
| Citizenship Status | With Coverage | Without Coverage |
| Native Born | 127 (100.0%) | 0 (0.0%) |
| Foreign Born, Citizen | 500 (94.2%) | 31 (5.8%) |
| Foreign Born, not a Citizen | 239 (100.0%) | 0 (0.0%) |
Health Insurance Coverage by Household Income in Mora County
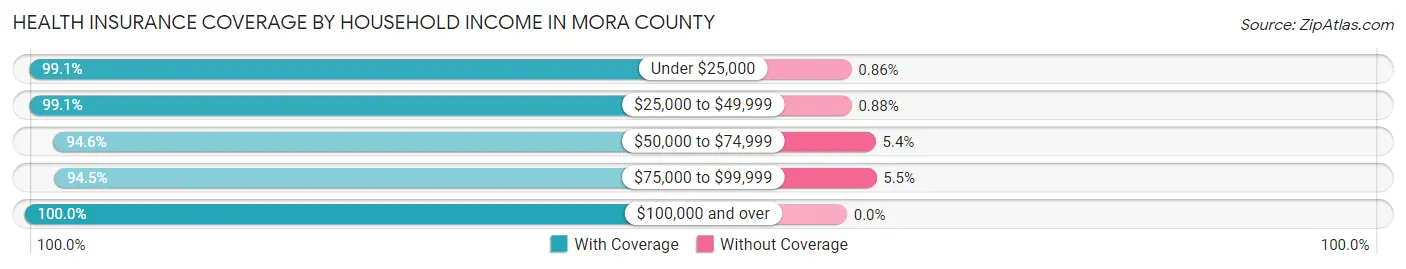
| Household Income | With Coverage | Without Coverage |
| Under $25,000 | 1,039 (99.1%) | 9 (0.9%) |
| $25,000 to $49,999 | 1,014 (99.1%) | 9 (0.9%) |
| $50,000 to $74,999 | 789 (94.6%) | 45 (5.4%) |
| $75,000 to $99,999 | 428 (94.5%) | 25 (5.5%) |
| $100,000 and over | 837 (100.0%) | 0 (0.0%) |
Public vs Private Health Insurance Coverage by Age in Mora County
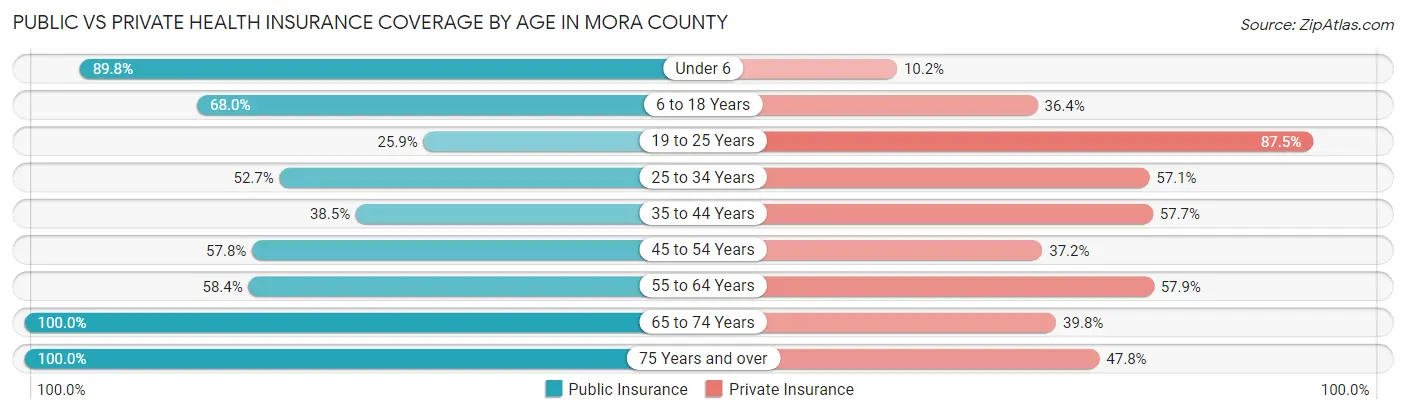
| Age Bracket | Public Insurance | Private Insurance |
| Under 6 | 114 (89.8%) | 13 (10.2%) |
| 6 to 18 Years | 361 (68.0%) | 193 (36.3%) |
| 19 to 25 Years | 62 (25.9%) | 209 (87.5%) |
| 25 to 34 Years | 167 (52.7%) | 181 (57.1%) |
| 35 to 44 Years | 92 (38.5%) | 138 (57.7%) |
| 45 to 54 Years | 253 (57.8%) | 163 (37.2%) |
| 55 to 64 Years | 537 (58.4%) | 532 (57.9%) |
| 65 to 74 Years | 940 (100.0%) | 374 (39.8%) |
| 75 Years and over | 458 (100.0%) | 219 (47.8%) |
| Total | 2,984 (70.9%) | 2,022 (48.0%) |
Disability Status by Sex by Age in Mora County
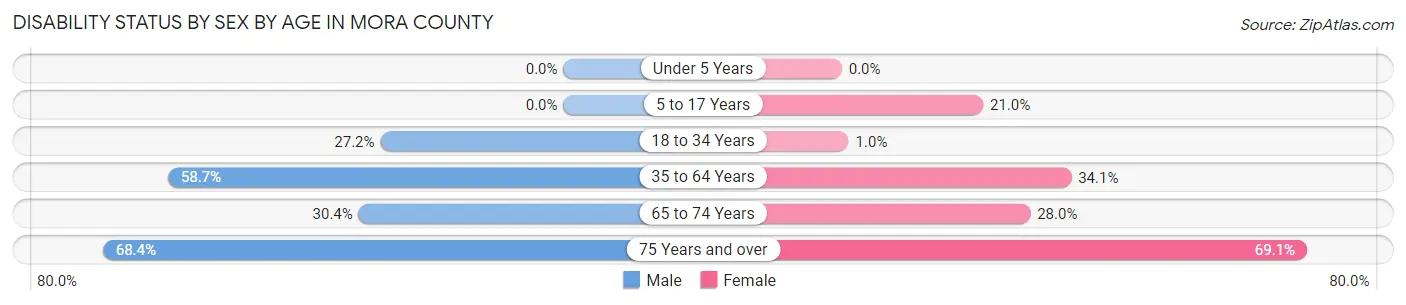
| Age Bracket | Male | Female |
| Under 5 Years | 0 (0.0%) | 0 (0.0%) |
| 5 to 17 Years | 0 (0.0%) | 56 (21.0%) |
| 18 to 34 Years | 47 (27.2%) | 4 (1.0%) |
| 35 to 64 Years | 458 (58.7%) | 278 (34.1%) |
| 65 to 74 Years | 138 (30.4%) | 136 (28.0%) |
| 75 Years and over | 132 (68.4%) | 183 (69.1%) |
Disability Class by Sex by Age in Mora County
Disability Class: Hearing Difficulty
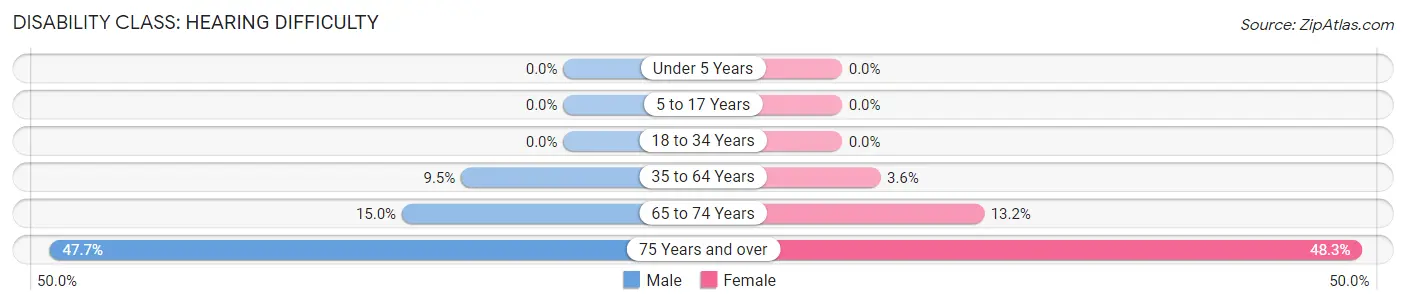
| Age Bracket | Male | Female |
| Under 5 Years | 0 (0.0%) | 0 (0.0%) |
| 5 to 17 Years | 0 (0.0%) | 0 (0.0%) |
| 18 to 34 Years | 0 (0.0%) | 0 (0.0%) |
| 35 to 64 Years | 74 (9.5%) | 29 (3.5%) |
| 65 to 74 Years | 68 (15.0%) | 64 (13.2%) |
| 75 Years and over | 92 (47.7%) | 128 (48.3%) |
Disability Class: Vision Difficulty
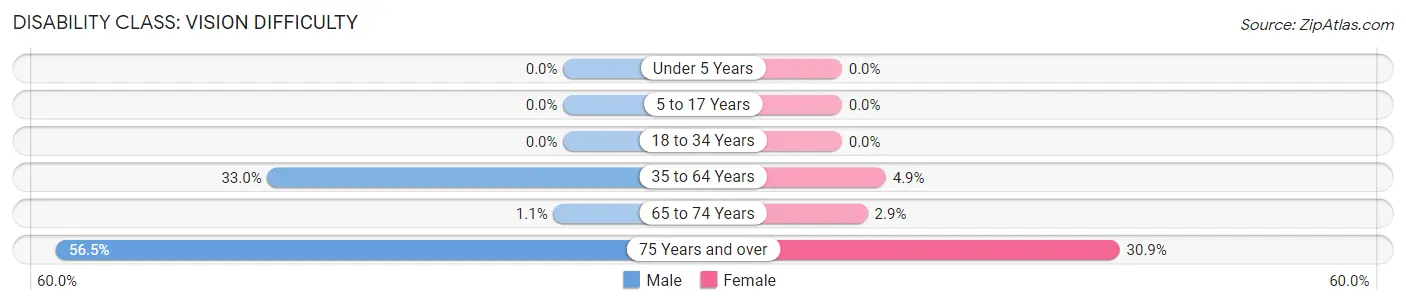
| Age Bracket | Male | Female |
| Under 5 Years | 0 (0.0%) | 0 (0.0%) |
| 5 to 17 Years | 0 (0.0%) | 0 (0.0%) |
| 18 to 34 Years | 0 (0.0%) | 0 (0.0%) |
| 35 to 64 Years | 257 (33.0%) | 40 (4.9%) |
| 65 to 74 Years | 5 (1.1%) | 14 (2.9%) |
| 75 Years and over | 109 (56.5%) | 82 (30.9%) |
Disability Class: Cognitive Difficulty
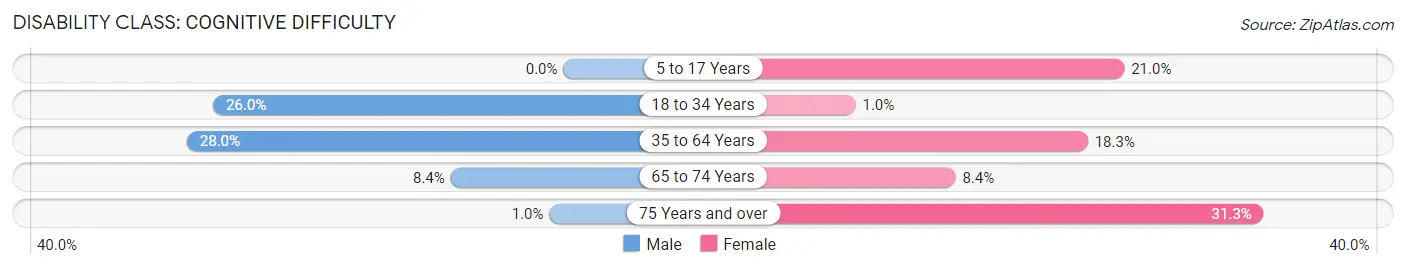
| Age Bracket | Male | Female |
| 5 to 17 Years | 0 (0.0%) | 56 (21.0%) |
| 18 to 34 Years | 45 (26.0%) | 4 (1.0%) |
| 35 to 64 Years | 218 (28.0%) | 149 (18.3%) |
| 65 to 74 Years | 38 (8.4%) | 41 (8.4%) |
| 75 Years and over | 2 (1.0%) | 83 (31.3%) |
Disability Class: Ambulatory Difficulty
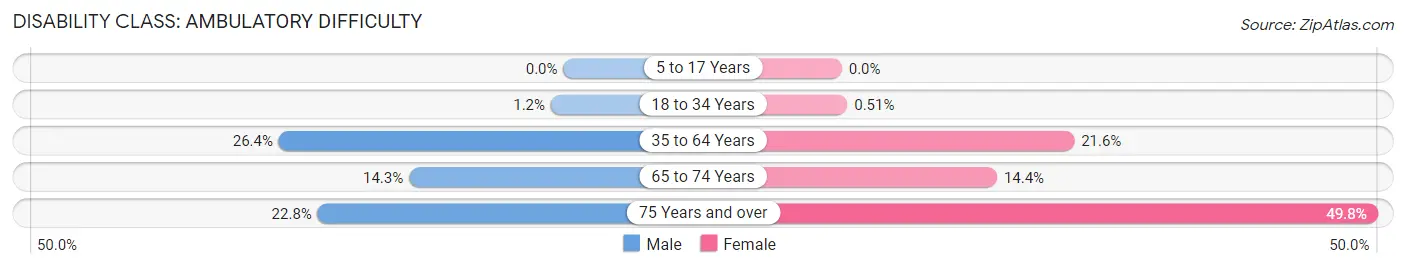
| Age Bracket | Male | Female |
| 5 to 17 Years | 0 (0.0%) | 0 (0.0%) |
| 18 to 34 Years | 2 (1.2%) | 2 (0.5%) |
| 35 to 64 Years | 206 (26.4%) | 176 (21.6%) |
| 65 to 74 Years | 65 (14.3%) | 70 (14.4%) |
| 75 Years and over | 44 (22.8%) | 132 (49.8%) |
Disability Class: Self-Care Difficulty
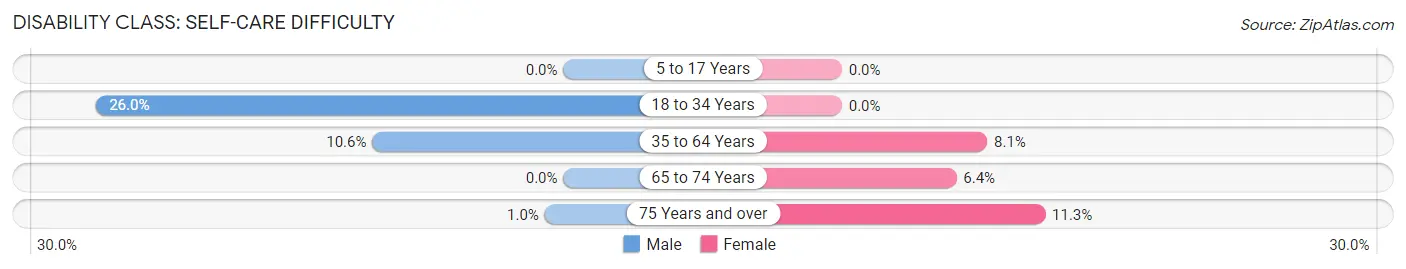
| Age Bracket | Male | Female |
| 5 to 17 Years | 0 (0.0%) | 0 (0.0%) |
| 18 to 34 Years | 45 (26.0%) | 0 (0.0%) |
| 35 to 64 Years | 83 (10.6%) | 66 (8.1%) |
| 65 to 74 Years | 0 (0.0%) | 31 (6.4%) |
| 75 Years and over | 2 (1.0%) | 30 (11.3%) |
Technology Access in Mora County
Computing Device Access in Mora County
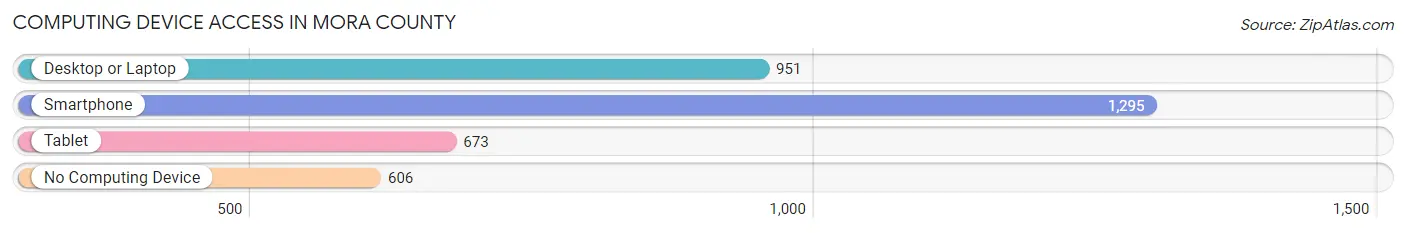
| Device Type | # Households | % Households |
| Desktop or Laptop | 951 | 45.5% |
| Smartphone | 1,295 | 61.9% |
| Tablet | 673 | 32.2% |
| No Computing Device | 606 | 29.0% |
| Total | 2,091 | 100.0% |
Internet Access in Mora County
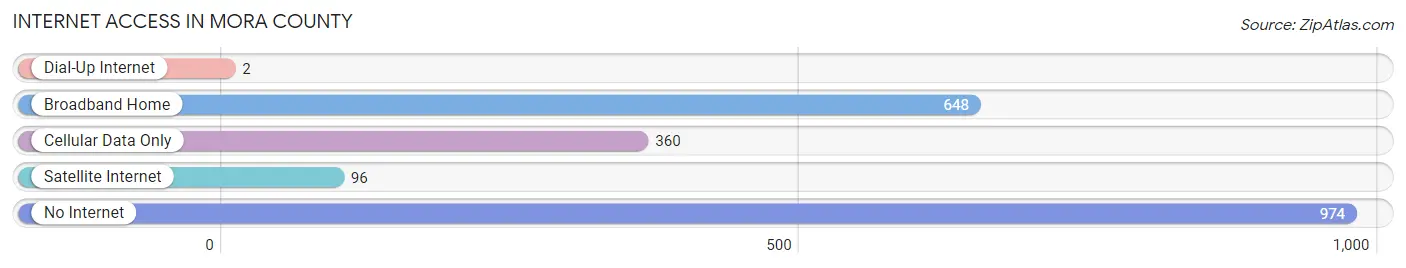
| Internet Type | # Households | % Households |
| Dial-Up Internet | 2 | 0.1% |
| Broadband Home | 648 | 31.0% |
| Cellular Data Only | 360 | 17.2% |
| Satellite Internet | 96 | 4.6% |
| No Internet | 974 | 46.6% |
| Total | 2,091 | 100.0% |
Mora County Summary
Mora County is located in the north-central region of New Mexico, and is bordered by Colfax County to the north, San Miguel County to the east, Taos County to the south, and Rio Arriba County to the west. The county seat is the town of Mora, which is located in the center of the county. The county has a total area of 1,945 square miles, and a population of 4,881 as of the 2010 census.
History
Mora County was established in 1851, and was named after the Mora River, which runs through the county. The county was originally part of Taos County, but was split off in 1851. The county was originally populated by Native American tribes, including the Apache, Navajo, and Ute. The first European settlers arrived in the area in the late 1700s, and the county was officially established in 1851.
The county was largely rural and agricultural until the early 1900s, when the Santa Fe Railroad began to build a line through the county. This brought an influx of new settlers and businesses to the area, and the county began to develop. The county was also home to several mining operations, including coal, copper, and gold.
Geography
Mora County is located in the north-central region of New Mexico, and is bordered by Colfax County to the north, San Miguel County to the east, Taos County to the south, and Rio Arriba County to the west. The county has a total area of 1,945 square miles, and is mostly mountainous, with the Sangre de Cristo Mountains to the east and the San Juan Mountains to the west. The highest point in the county is the summit of Mount Baldy, which has an elevation of 11,841 feet.
The county is home to several rivers and streams, including the Mora River, which runs through the county and is the namesake of the county. The county is also home to several lakes, including Heron Lake, which is located in the northern part of the county.
Economy
Mora County has a largely rural economy, and is largely dependent on agriculture and tourism. The county is home to several farms and ranches, which produce a variety of crops, including hay, corn, wheat, and alfalfa. The county is also home to several tourist attractions, including the Mora Valley Historic District, the Mora National Forest, and the Mora County Museum.
The county is also home to several mining operations, including coal, copper, and gold. The county is also home to several manufacturing companies, including a furniture factory and a wood-products plant.
Demographics
As of the 2010 census, there were 4,881 people, 1,845 households, and 1,323 families living in the county. The population density was 2.5 people per square mile. The racial makeup of the county was 81.3% White, 0.7% African American, 1.2% Native American, 0.3% Asian, 0.1% Pacific Islander, 14.2% from other races, and 2.4% from two or more races. Hispanic or Latino of any race were 44.3% of the population.
The median income for a household in the county was $25,938, and the median income for a family was $30,938. The per capita income for the county was $13,945. About 22.2% of families and 27.2% of the population were below the poverty line, including 36.2% of those under age 18 and 16.2% of those age 65 or over.
Common Questions
What is Per Capita Income in Mora County?
Per Capita income in Mora County is $28,356.
What is the Median Family Income in Mora County?
Median Family Income in Mora County is $52,223.
What is the Median Household income in Mora County?
Median Household Income in Mora County is $40,231.
What is Income or Wage Gap in Mora County?
Income or Wage Gap in Mora County is 43.3%.
Women in Mora County earn 56.7 cents for every dollar earned by a man.
What is Inequality or Gini Index in Mora County?
Inequality or Gini Index in Mora County is 0.49.
What is the Total Population of Mora County?
Total Population of Mora County is 4,208.
What is the Total Male Population of Mora County?
Total Male Population of Mora County is 1,872.
What is the Total Female Population of Mora County?
Total Female Population of Mora County is 2,336.
What is the Ratio of Males per 100 Females in Mora County?
There are 80.14 Males per 100 Females in Mora County.
What is the Ratio of Females per 100 Males in Mora County?
There are 124.79 Females per 100 Males in Mora County.
What is the Median Population Age in Mora County?
Median Population Age in Mora County is 59.4 Years.
What is the Average Family Size in Mora County
Average Family Size in Mora County is 2.5 People.
What is the Average Household Size in Mora County
Average Household Size in Mora County is 2.0 People.
How Large is the Labor Force in Mora County?
There are 1,417 People in the Labor Forcein in Mora County.
What is the Percentage of People in the Labor Force in Mora County?
38.8% of People are in the Labor Force in Mora County.
What is the Unemployment Rate in Mora County?
Unemployment Rate in Mora County is 7.4%.