Chaves County, NM Map & Demographics
Chaves County Map
Chaves County Overview
$26,568
PER CAPITA INCOME
$61,221
AVG FAMILY INCOME
$49,673
AVG HOUSEHOLD INCOME
35.0%
WAGE / INCOME GAP [ % ]
65.0¢/ $1
WAGE / INCOME GAP [ $ ]
$11,501
FAMILY INCOME DEFICIT
0.47
INEQUALITY / GINI INDEX
64,701
TOTAL POPULATION
32,652
MALE POPULATION
32,049
FEMALE POPULATION
101.88
MALES / 100 FEMALES
98.15
FEMALES / 100 MALES
36.2
MEDIAN AGE
3.3
AVG FAMILY SIZE
2.7
AVG HOUSEHOLD SIZE
28,127
LABOR FORCE [ PEOPLE ]
56.1%
PERCENT IN LABOR FORCE
5.3%
UNEMPLOYMENT RATE
Income in Chaves County
Income Overview in Chaves County
Per Capita Income in Chaves County is $26,568, while median incomes of families and households are $61,221 and $49,673 respectively.
| Characteristic | Number | Measure |
| Per Capita Income | 64,701 | $26,568 |
| Median Family Income | 15,507 | $61,221 |
| Mean Family Income | 15,507 | $80,743 |
| Median Household Income | 23,280 | $49,673 |
| Mean Household Income | 23,280 | $70,101 |
| Income Deficit | 15,507 | $11,501 |
| Wage / Income Gap (%) | 64,701 | 35.04% |
| Wage / Income Gap ($) | 64,701 | 64.96¢ per $1 |
| Gini / Inequality Index | 64,701 | 0.47 |
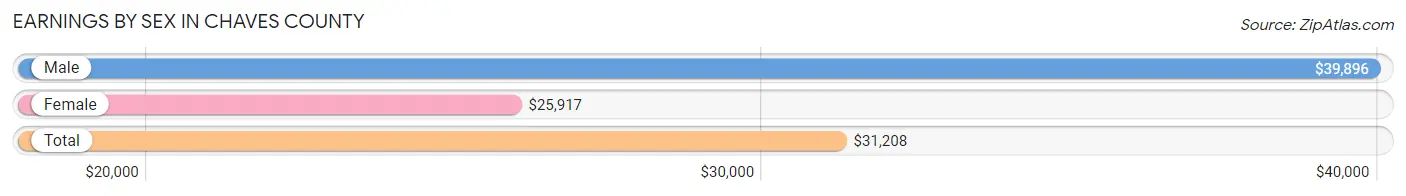
Earnings by Sex in Chaves County
Average Earnings in Chaves County are $31,208, $39,896 for men and $25,917 for women, a difference of 35.0%.
| Sex | Number | Average Earnings |
| Male | 16,153 (53.5%) | $39,896 |
| Female | 14,013 (46.5%) | $25,917 |
| Total | 30,166 (100.0%) | $31,208 |
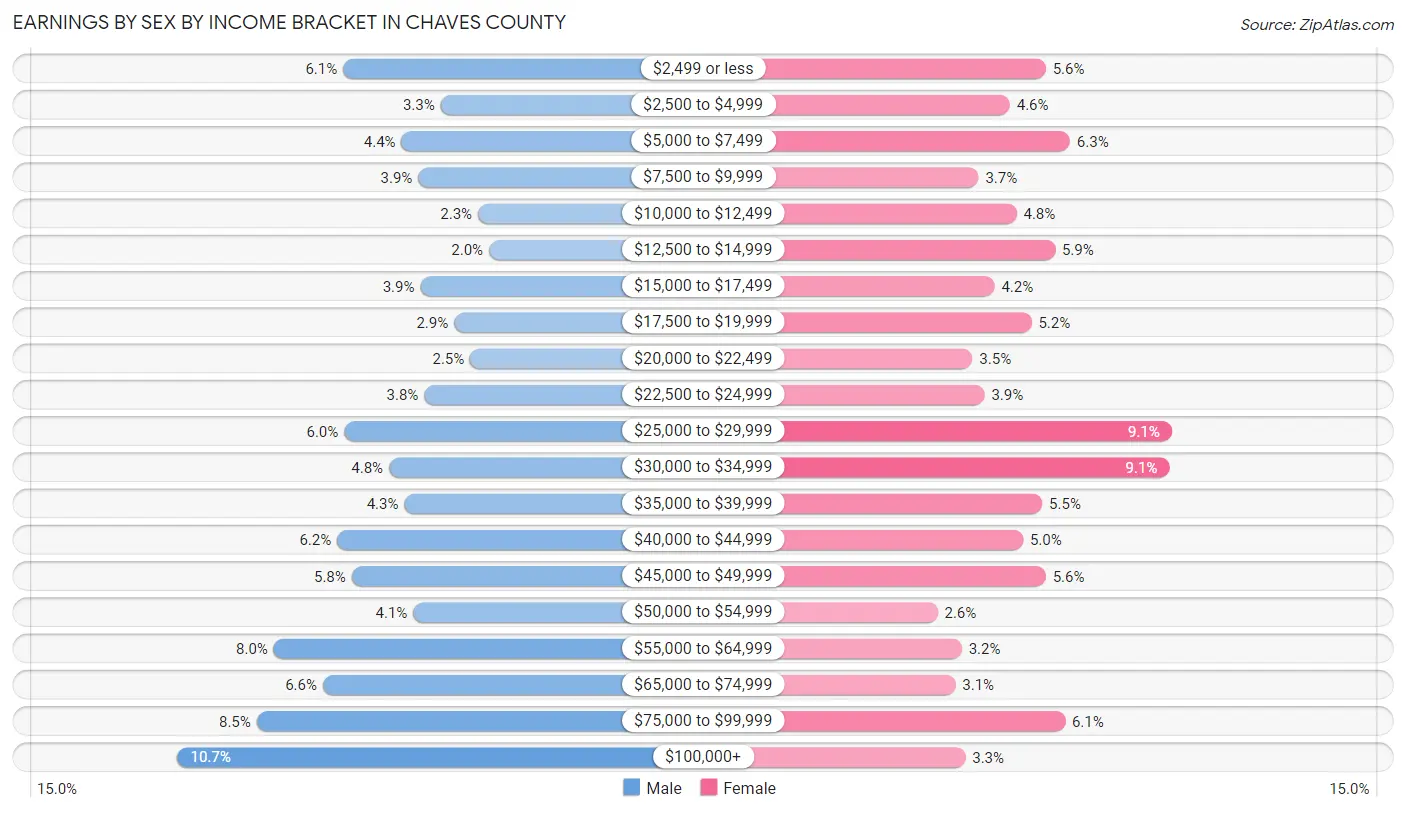
Earnings by Sex by Income Bracket in Chaves County
The most common earnings brackets in Chaves County are $100,000+ for men (1,728 | 10.7%) and $25,000 to $29,999 for women (1,279 | 9.1%).
| Income | Male | Female |
| $2,499 or less | 977 (6.0%) | 784 (5.6%) |
| $2,500 to $4,999 | 534 (3.3%) | 642 (4.6%) |
| $5,000 to $7,499 | 713 (4.4%) | 879 (6.3%) |
| $7,500 to $9,999 | 637 (3.9%) | 519 (3.7%) |
| $10,000 to $12,499 | 365 (2.3%) | 668 (4.8%) |
| $12,500 to $14,999 | 315 (1.9%) | 820 (5.9%) |
| $15,000 to $17,499 | 626 (3.9%) | 581 (4.2%) |
| $17,500 to $19,999 | 473 (2.9%) | 727 (5.2%) |
| $20,000 to $22,499 | 400 (2.5%) | 494 (3.5%) |
| $22,500 to $24,999 | 609 (3.8%) | 542 (3.9%) |
| $25,000 to $29,999 | 973 (6.0%) | 1,279 (9.1%) |
| $30,000 to $34,999 | 769 (4.8%) | 1,269 (9.1%) |
| $35,000 to $39,999 | 700 (4.3%) | 770 (5.5%) |
| $40,000 to $44,999 | 1,005 (6.2%) | 693 (5.0%) |
| $45,000 to $49,999 | 938 (5.8%) | 784 (5.6%) |
| $50,000 to $54,999 | 659 (4.1%) | 357 (2.5%) |
| $55,000 to $64,999 | 1,293 (8.0%) | 452 (3.2%) |
| $65,000 to $74,999 | 1,069 (6.6%) | 427 (3.0%) |
| $75,000 to $99,999 | 1,370 (8.5%) | 859 (6.1%) |
| $100,000+ | 1,728 (10.7%) | 467 (3.3%) |
| Total | 16,153 (100.0%) | 14,013 (100.0%) |
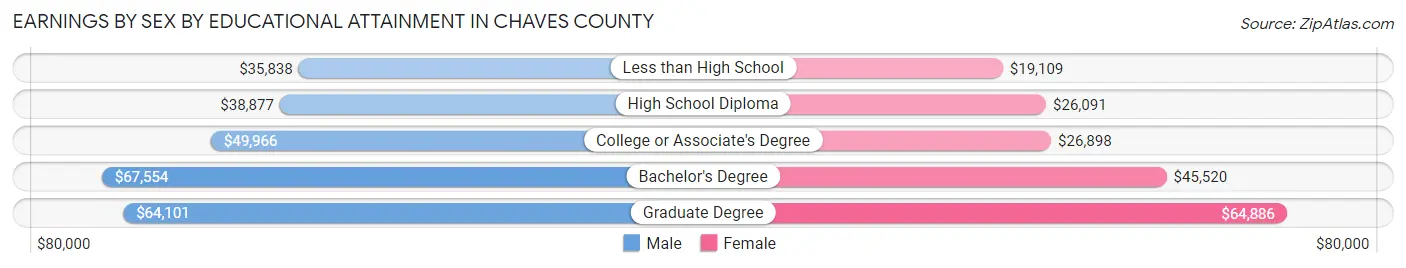
Earnings by Sex by Educational Attainment in Chaves County
Average earnings in Chaves County are $45,343 for men and $29,179 for women, a difference of 35.6%. Men with an educational attainment of bachelor's degree enjoy the highest average annual earnings of $67,554, while those with less than high school education earn the least with $35,838. Women with an educational attainment of graduate degree earn the most with the average annual earnings of $64,886, while those with less than high school education have the smallest earnings of $19,109.
| Educational Attainment | Male Income | Female Income |
| Less than High School | $35,838 | $19,109 |
| High School Diploma | $38,877 | $26,091 |
| College or Associate's Degree | $49,966 | $26,898 |
| Bachelor's Degree | $67,554 | $45,520 |
| Graduate Degree | $64,101 | $64,886 |
| Total | $45,343 | $29,179 |
Family Income in Chaves County
Family Income Brackets in Chaves County
According to the Chaves County family income data, there are 2,605 families falling into the $35,000 to $49,999 income range, which is the most common income bracket and makes up 16.8% of all families. Conversely, the $10,000 to $14,999 income bracket is the least frequent group with only 558 families (3.6%) belonging to this category.
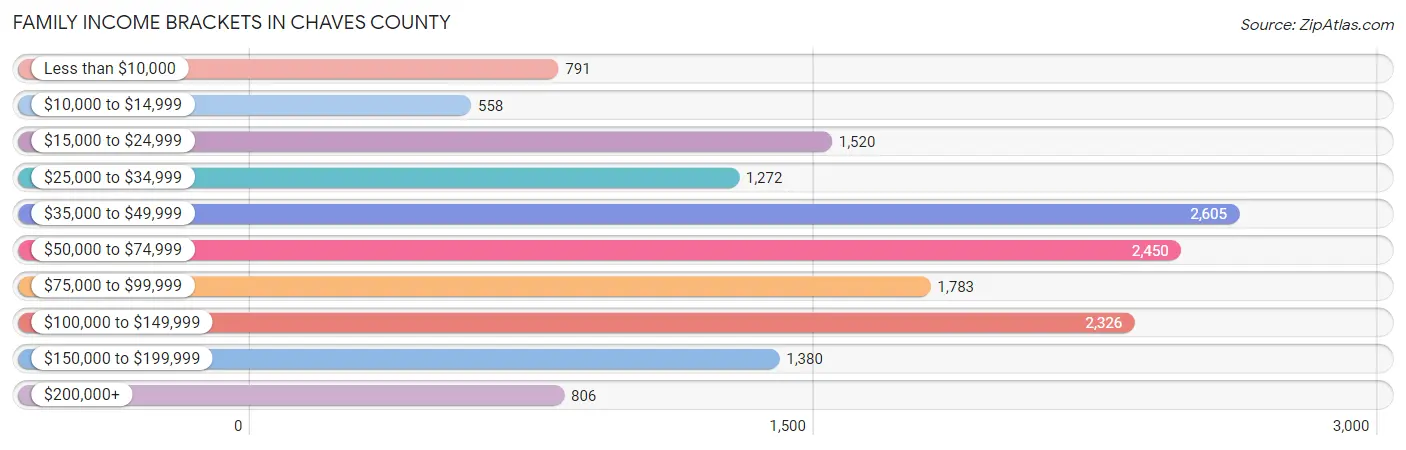
| Income Bracket | # Families | % Families |
| Less than $10,000 | 791 | 5.1% |
| $10,000 to $14,999 | 558 | 3.6% |
| $15,000 to $24,999 | 1,520 | 9.8% |
| $25,000 to $34,999 | 1,272 | 8.2% |
| $35,000 to $49,999 | 2,605 | 16.8% |
| $50,000 to $74,999 | 2,450 | 15.8% |
| $75,000 to $99,999 | 1,783 | 11.5% |
| $100,000 to $149,999 | 2,326 | 15.0% |
| $150,000 to $199,999 | 1,380 | 8.9% |
| $200,000+ | 806 | 5.2% |
Family Income by Famaliy Size in Chaves County
5-person families (1,617 | 10.4%) account for the highest median family income in Chaves County with $73,244 per family, while 2-person families (6,607 | 42.6%) have the highest median income of $27,324 per family member.
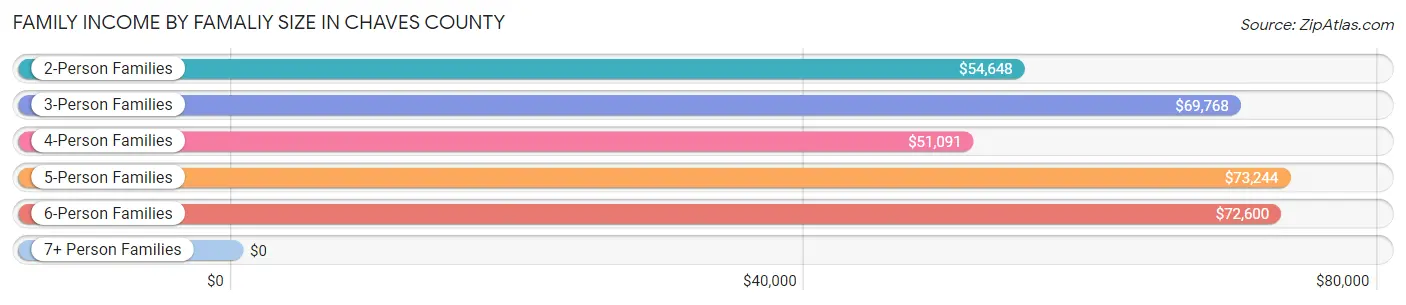
| Income Bracket | # Families | Median Income |
| 2-Person Families | 6,607 (42.6%) | $54,648 |
| 3-Person Families | 3,362 (21.7%) | $69,768 |
| 4-Person Families | 3,088 (19.9%) | $51,091 |
| 5-Person Families | 1,617 (10.4%) | $73,244 |
| 6-Person Families | 576 (3.7%) | $72,600 |
| 7+ Person Families | 257 (1.7%) | $0 |
| Total | 15,507 (100.0%) | $61,221 |
Family Income by Number of Earners in Chaves County
The median family income in Chaves County is $61,221, with families comprising 3+ earners (1,529) having the highest median family income of $112,888, while families with no earners (2,596) have the lowest median family income of $34,712, accounting for 9.9% and 16.7% of families, respectively.
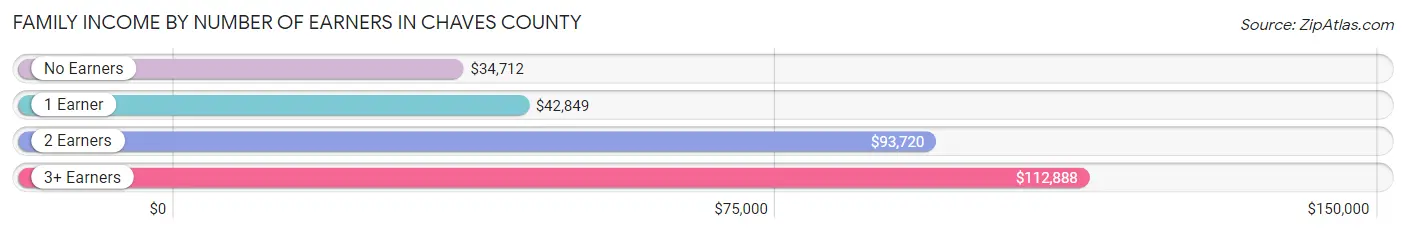
| Number of Earners | # Families | Median Income |
| No Earners | 2,596 (16.7%) | $34,712 |
| 1 Earner | 5,975 (38.5%) | $42,849 |
| 2 Earners | 5,407 (34.9%) | $93,720 |
| 3+ Earners | 1,529 (9.9%) | $112,888 |
| Total | 15,507 (100.0%) | $61,221 |
Household Income in Chaves County
Household Income Brackets in Chaves County
With 3,888 households falling in the category, the $50,000 to $74,999 income range is the most frequent in Chaves County, accounting for 16.7% of all households. In contrast, only 1,024 households (4.4%) fall into the $200,000+ income bracket, making it the least populous group.
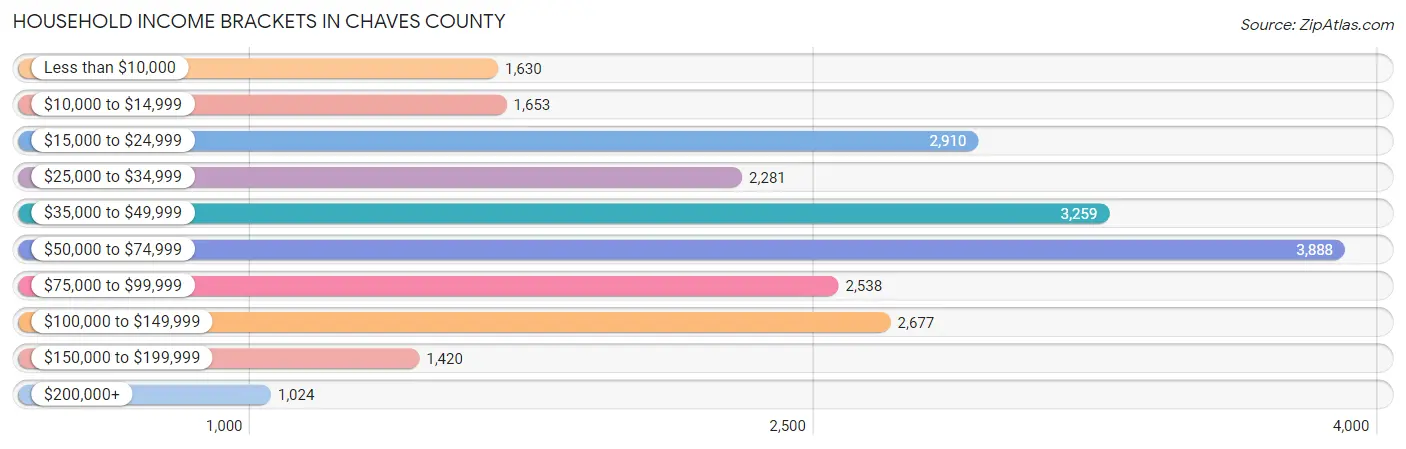
| Income Bracket | # Households | % Households |
| Less than $10,000 | 1,630 | 7.0% |
| $10,000 to $14,999 | 1,653 | 7.1% |
| $15,000 to $24,999 | 2,910 | 12.5% |
| $25,000 to $34,999 | 2,281 | 9.8% |
| $35,000 to $49,999 | 3,259 | 14.0% |
| $50,000 to $74,999 | 3,888 | 16.7% |
| $75,000 to $99,999 | 2,538 | 10.9% |
| $100,000 to $149,999 | 2,677 | 11.5% |
| $150,000 to $199,999 | 1,420 | 6.1% |
| $200,000+ | 1,024 | 4.4% |
Household Income by Householder Age in Chaves County
The median household income in Chaves County is $49,673, with the highest median household income of $57,484 found in the 25 to 44 years age bracket for the primary householder. A total of 7,452 households (32.0%) fall into this category. Meanwhile, the 15 to 24 years age bracket for the primary householder has the lowest median household income of $39,583, with 813 households (3.5%) in this group.
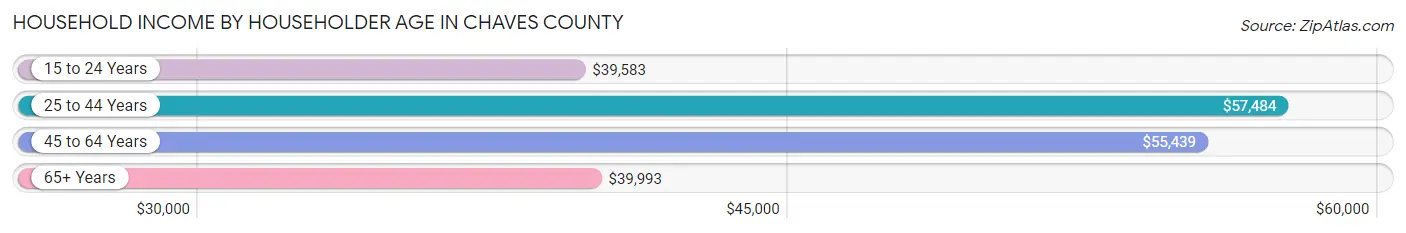
| Income Bracket | # Households | Median Income |
| 15 to 24 Years | 813 (3.5%) | $39,583 |
| 25 to 44 Years | 7,452 (32.0%) | $57,484 |
| 45 to 64 Years | 8,150 (35.0%) | $55,439 |
| 65+ Years | 6,865 (29.5%) | $39,993 |
| Total | 23,280 (100.0%) | $49,673 |
Poverty in Chaves County
Income Below Poverty by Sex and Age in Chaves County
With 18.7% poverty level for males and 24.8% for females among the residents of Chaves County, 5 year old males and 5 year old females are the most vulnerable to poverty, with 207 males (44.2%) and 225 females (44.5%) in their respective age groups living below the poverty level.
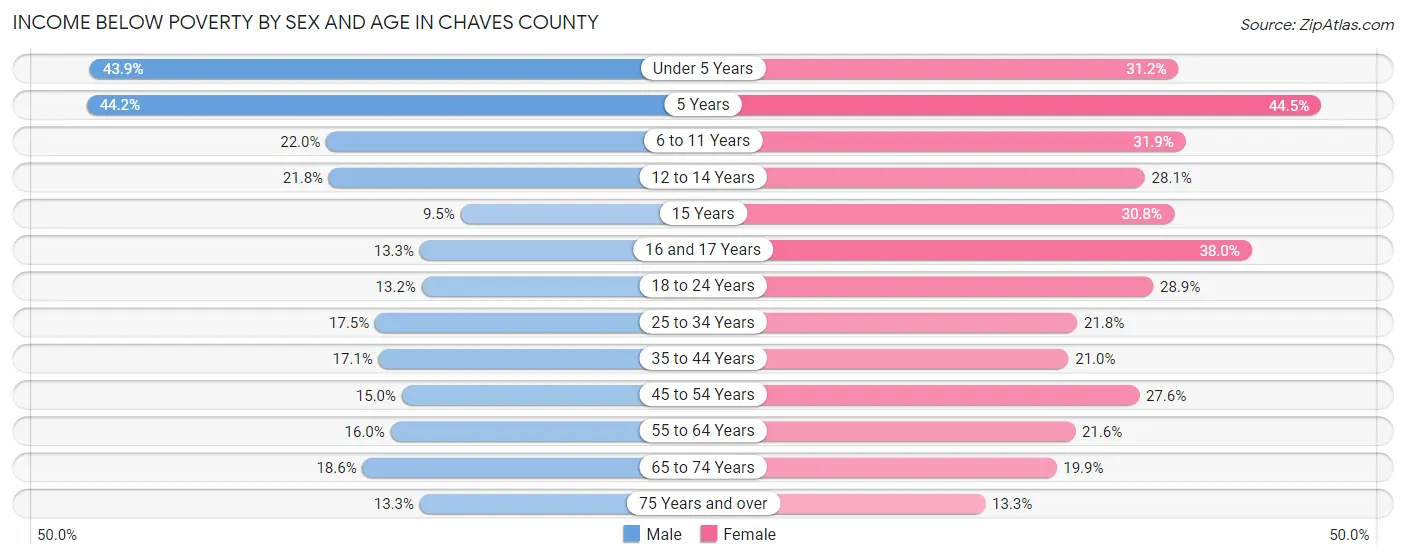
| Age Bracket | Male | Female |
| Under 5 Years | 765 (43.9%) | 618 (31.2%) |
| 5 Years | 207 (44.2%) | 225 (44.5%) |
| 6 to 11 Years | 612 (22.0%) | 859 (31.9%) |
| 12 to 14 Years | 294 (21.8%) | 312 (28.1%) |
| 15 Years | 70 (9.5%) | 167 (30.8%) |
| 16 and 17 Years | 95 (13.3%) | 326 (38.0%) |
| 18 to 24 Years | 394 (13.2%) | 810 (28.9%) |
| 25 to 34 Years | 737 (17.5%) | 877 (21.8%) |
| 35 to 44 Years | 668 (17.1%) | 850 (21.0%) |
| 45 to 54 Years | 506 (15.0%) | 1,011 (27.6%) |
| 55 to 64 Years | 592 (16.0%) | 844 (21.6%) |
| 65 to 74 Years | 539 (18.6%) | 603 (19.9%) |
| 75 Years and over | 234 (13.3%) | 307 (13.3%) |
| Total | 5,713 (18.7%) | 7,809 (24.8%) |
Income Above Poverty by Sex and Age in Chaves County
According to the poverty statistics in Chaves County, males aged 15 years and females aged 75 years and over are the age groups that are most secure financially, with 90.5% of males and 86.7% of females in these age groups living above the poverty line.
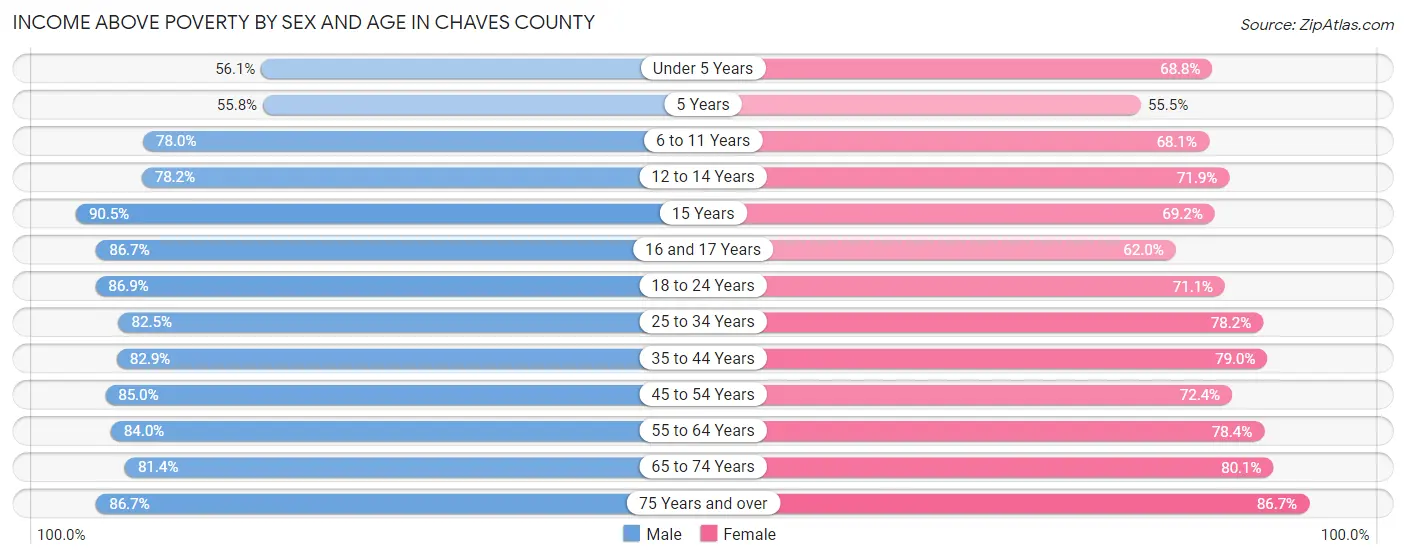
| Age Bracket | Male | Female |
| Under 5 Years | 977 (56.1%) | 1,361 (68.8%) |
| 5 Years | 261 (55.8%) | 281 (55.5%) |
| 6 to 11 Years | 2,170 (78.0%) | 1,834 (68.1%) |
| 12 to 14 Years | 1,057 (78.2%) | 798 (71.9%) |
| 15 Years | 664 (90.5%) | 375 (69.2%) |
| 16 and 17 Years | 618 (86.7%) | 531 (62.0%) |
| 18 to 24 Years | 2,602 (86.9%) | 1,994 (71.1%) |
| 25 to 34 Years | 3,481 (82.5%) | 3,141 (78.2%) |
| 35 to 44 Years | 3,230 (82.9%) | 3,193 (79.0%) |
| 45 to 54 Years | 2,869 (85.0%) | 2,654 (72.4%) |
| 55 to 64 Years | 3,100 (84.0%) | 3,056 (78.4%) |
| 65 to 74 Years | 2,352 (81.4%) | 2,426 (80.1%) |
| 75 Years and over | 1,523 (86.7%) | 2,001 (86.7%) |
| Total | 24,904 (81.3%) | 23,645 (75.2%) |
Income Below Poverty Among Married-Couple Families in Chaves County
The poverty statistics for married-couple families in Chaves County show that 10.4% or 1,062 of the total 10,159 families live below the poverty line. Families with 5 or more children have the highest poverty rate of 60.5%, comprising of 52 families. On the other hand, families with no children have the lowest poverty rate of 6.9%, which includes 385 families.
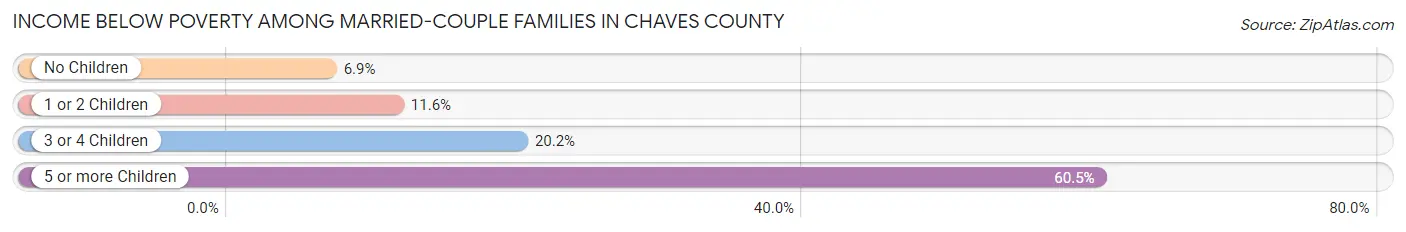
| Children | Above Poverty | Below Poverty |
| No Children | 5,217 (93.1%) | 385 (6.9%) |
| 1 or 2 Children | 2,842 (88.4%) | 371 (11.6%) |
| 3 or 4 Children | 1,004 (79.8%) | 254 (20.2%) |
| 5 or more Children | 34 (39.5%) | 52 (60.5%) |
| Total | 9,097 (89.5%) | 1,062 (10.4%) |
Income Below Poverty Among Single-Parent Households in Chaves County
According to the poverty data in Chaves County, 19.0% or 263 single-father households and 35.4% or 1,402 single-mother households are living below the poverty line. Among single-father households, those with 3 or 4 children have the highest poverty rate, with 68 households (55.3%) experiencing poverty. Likewise, among single-mother households, those with 5 or more children have the highest poverty rate, with 114 households (100.0%) falling below the poverty line.
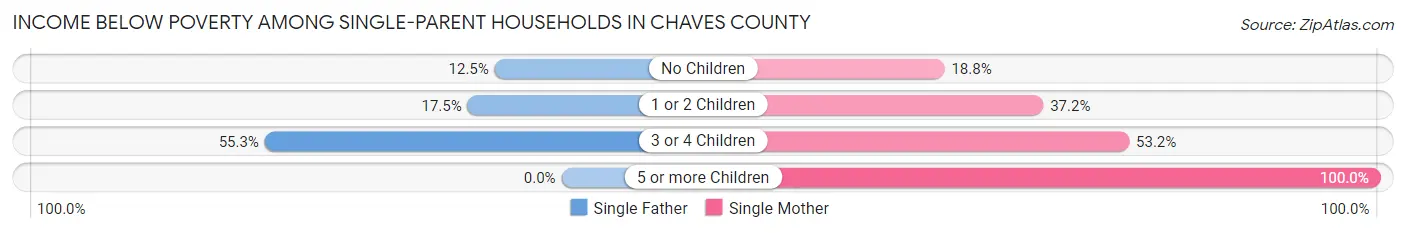
| Children | Single Father | Single Mother |
| No Children | 64 (12.4%) | 269 (18.8%) |
| 1 or 2 Children | 131 (17.5%) | 617 (37.2%) |
| 3 or 4 Children | 68 (55.3%) | 402 (53.2%) |
| 5 or more Children | 0 (0.0%) | 114 (100.0%) |
| Total | 263 (19.0%) | 1,402 (35.4%) |
Income Below Poverty Among Married-Couple vs Single-Parent Households in Chaves County
The poverty data for Chaves County shows that 1,062 of the married-couple family households (10.4%) and 1,665 of the single-parent households (31.1%) are living below the poverty level. Within the married-couple family households, those with 5 or more children have the highest poverty rate, with 52 households (60.5%) falling below the poverty line. Among the single-parent households, those with 5 or more children have the highest poverty rate, with 114 household (100.0%) living below poverty.
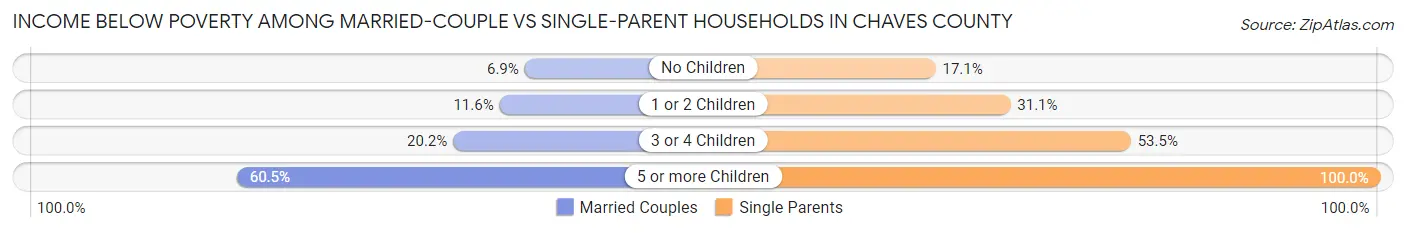
| Children | Married-Couple Families | Single-Parent Households |
| No Children | 385 (6.9%) | 333 (17.1%) |
| 1 or 2 Children | 371 (11.6%) | 748 (31.0%) |
| 3 or 4 Children | 254 (20.2%) | 470 (53.5%) |
| 5 or more Children | 52 (60.5%) | 114 (100.0%) |
| Total | 1,062 (10.4%) | 1,665 (31.1%) |
Race in Chaves County
The most populous races in Chaves County are White / Caucasian (44,897 | 69.4%), Hispanic or Latino (38,206 | 59.1%), and Two or more Races (9,471 | 14.6%).
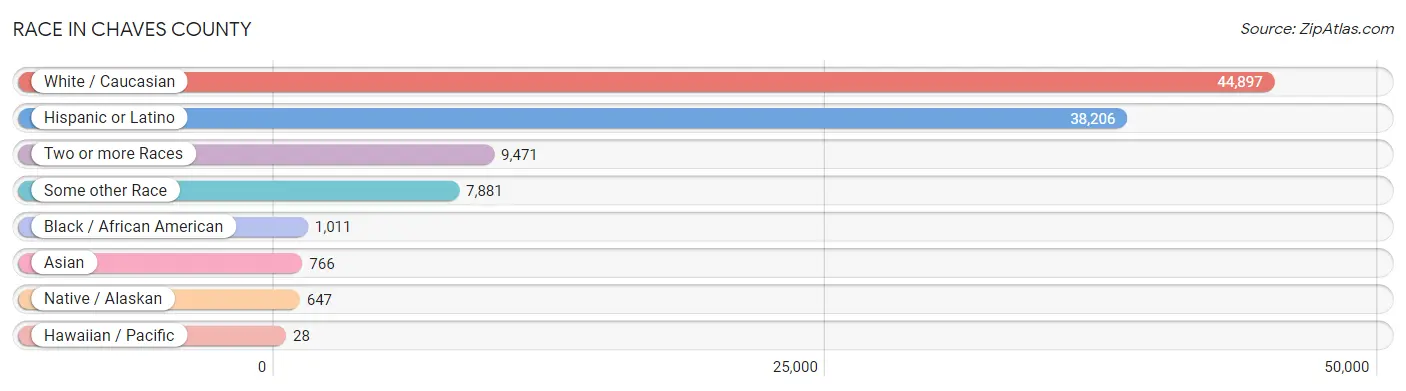
| Race | # Population | % Population |
| Asian | 766 | 1.2% |
| Black / African American | 1,011 | 1.6% |
| Hawaiian / Pacific | 28 | 0.0% |
| Hispanic or Latino | 38,206 | 59.1% |
| Native / Alaskan | 647 | 1.0% |
| White / Caucasian | 44,897 | 69.4% |
| Two or more Races | 9,471 | 14.6% |
| Some other Race | 7,881 | 12.2% |
| Total | 64,701 | 100.0% |
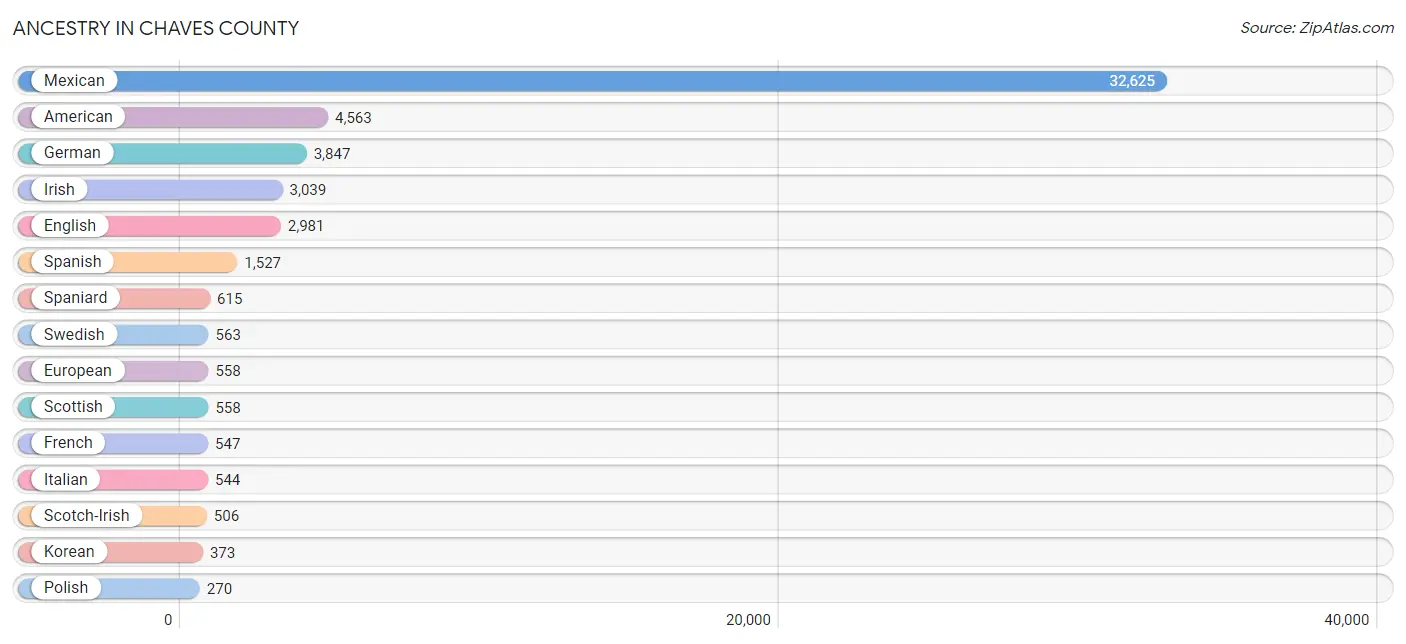
Ancestry in Chaves County
The most populous ancestries reported in Chaves County are Mexican (32,625 | 50.4%), American (4,563 | 7.0%), German (3,847 | 5.9%), Irish (3,039 | 4.7%), and English (2,981 | 4.6%), together accounting for 72.7% of all Chaves County residents.
| Ancestry | # Population | % Population |
| African | 116 | 0.2% |
| Alaska Native | 9 | 0.0% |
| American | 4,563 | 7.0% |
| Apache | 50 | 0.1% |
| Arab | 34 | 0.1% |
| Austrian | 49 | 0.1% |
| Basque | 52 | 0.1% |
| Bhutanese | 57 | 0.1% |
| Blackfeet | 102 | 0.2% |
| British | 125 | 0.2% |
| Burmese | 43 | 0.1% |
| Cajun | 5 | 0.0% |
| Canadian | 7 | 0.0% |
| Celtic | 13 | 0.0% |
| Central American | 83 | 0.1% |
| Central American Indian | 37 | 0.1% |
| Cherokee | 229 | 0.4% |
| Cheyenne | 28 | 0.0% |
| Choctaw | 117 | 0.2% |
| Colombian | 20 | 0.0% |
| Creek | 1 | 0.0% |
| Cuban | 28 | 0.0% |
| Czech | 117 | 0.2% |
| Czechoslovakian | 17 | 0.0% |
| Danish | 220 | 0.3% |
| Dutch | 244 | 0.4% |
| Eastern European | 59 | 0.1% |
| Ecuadorian | 6 | 0.0% |
| Egyptian | 7 | 0.0% |
| English | 2,981 | 4.6% |
| European | 558 | 0.9% |
| Finnish | 16 | 0.0% |
| French | 547 | 0.9% |
| French Canadian | 107 | 0.2% |
| German | 3,847 | 5.9% |
| German Russian | 29 | 0.0% |
| Greek | 51 | 0.1% |
| Guamanian / Chamorro | 22 | 0.0% |
| Guatemalan | 10 | 0.0% |
| Honduran | 34 | 0.1% |
| Hopi | 5 | 0.0% |
| Hungarian | 46 | 0.1% |
| Indian (Asian) | 49 | 0.1% |
| Iranian | 46 | 0.1% |
| Irish | 3,039 | 4.7% |
| Italian | 544 | 0.8% |
| Korean | 373 | 0.6% |
| Laotian | 8 | 0.0% |
| Latvian | 27 | 0.0% |
| Lebanese | 27 | 0.0% |
| Mexican | 32,625 | 50.4% |
| Mexican American Indian | 127 | 0.2% |
| Navajo | 241 | 0.4% |
| Nigerian | 8 | 0.0% |
| Northern European | 94 | 0.2% |
| Norwegian | 260 | 0.4% |
| Pakistani | 32 | 0.1% |
| Panamanian | 30 | 0.1% |
| Polish | 270 | 0.4% |
| Portuguese | 68 | 0.1% |
| Pueblo | 185 | 0.3% |
| Puerto Rican | 210 | 0.3% |
| Russian | 156 | 0.2% |
| Salvadoran | 9 | 0.0% |
| Samoan | 6 | 0.0% |
| Scandinavian | 171 | 0.3% |
| Scotch-Irish | 506 | 0.8% |
| Scottish | 558 | 0.9% |
| Sioux | 29 | 0.0% |
| Slavic | 23 | 0.0% |
| Slovak | 44 | 0.1% |
| South American | 90 | 0.1% |
| Soviet Union | 6 | 0.0% |
| Spaniard | 615 | 0.9% |
| Spanish | 1,527 | 2.4% |
| Spanish American | 156 | 0.2% |
| Spanish American Indian | 58 | 0.1% |
| Sri Lankan | 132 | 0.2% |
| Subsaharan African | 132 | 0.2% |
| Swedish | 563 | 0.9% |
| Swiss | 46 | 0.1% |
| Thai | 86 | 0.1% |
| Tongan | 37 | 0.1% |
| Ute | 12 | 0.0% |
| Venezuelan | 64 | 0.1% |
| Welsh | 248 | 0.4% |
| Yaqui | 38 | 0.1% | View All 87 Rows |
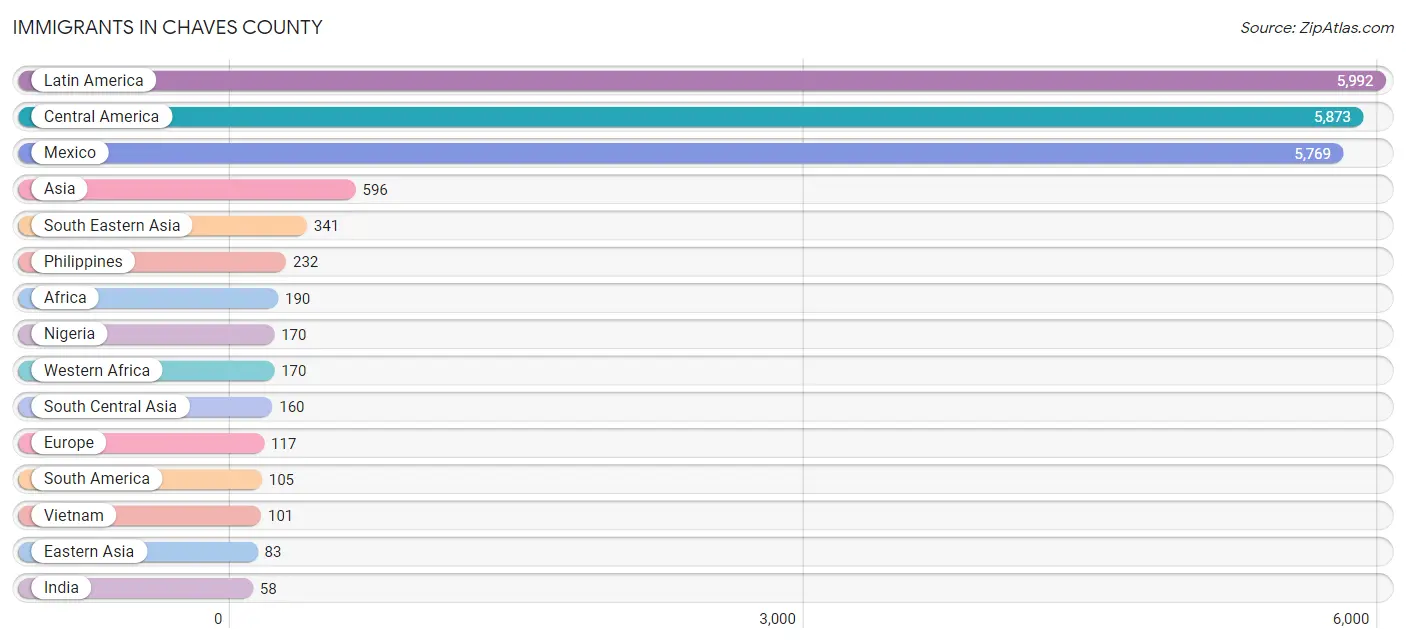
Immigrants in Chaves County
The most numerous immigrant groups reported in Chaves County came from Latin America (5,992 | 9.3%), Central America (5,873 | 9.1%), Mexico (5,769 | 8.9%), Asia (596 | 0.9%), and South Eastern Asia (341 | 0.5%), together accounting for 28.7% of all Chaves County residents.
| Immigration Origin | # Population | % Population |
| Africa | 190 | 0.3% |
| Asia | 596 | 0.9% |
| Canada | 25 | 0.0% |
| Caribbean | 14 | 0.0% |
| Central America | 5,873 | 9.1% |
| China | 26 | 0.0% |
| Colombia | 47 | 0.1% |
| Eastern Africa | 8 | 0.0% |
| Eastern Asia | 83 | 0.1% |
| Eastern Europe | 44 | 0.1% |
| El Salvador | 9 | 0.0% |
| England | 2 | 0.0% |
| Europe | 117 | 0.2% |
| France | 11 | 0.0% |
| Germany | 20 | 0.0% |
| Guatemala | 49 | 0.1% |
| Haiti | 14 | 0.0% |
| Honduras | 34 | 0.1% |
| India | 58 | 0.1% |
| Indonesia | 8 | 0.0% |
| Iran | 46 | 0.1% |
| Japan | 27 | 0.0% |
| Korea | 30 | 0.1% |
| Latin America | 5,992 | 9.3% |
| Lebanon | 12 | 0.0% |
| Mexico | 5,769 | 8.9% |
| Netherlands | 7 | 0.0% |
| Nigeria | 170 | 0.3% |
| Northern Africa | 12 | 0.0% |
| Northern Europe | 2 | 0.0% |
| Pakistan | 39 | 0.1% |
| Panama | 12 | 0.0% |
| Philippines | 232 | 0.4% |
| Poland | 44 | 0.1% |
| South America | 105 | 0.2% |
| South Central Asia | 160 | 0.3% |
| South Eastern Asia | 341 | 0.5% |
| Southern Europe | 33 | 0.1% |
| Spain | 33 | 0.1% |
| Sri Lanka | 17 | 0.0% |
| Venezuela | 58 | 0.1% |
| Vietnam | 101 | 0.2% |
| Western Africa | 170 | 0.3% |
| Western Asia | 12 | 0.0% |
| Western Europe | 38 | 0.1% | View All 45 Rows |
Sex and Age in Chaves County
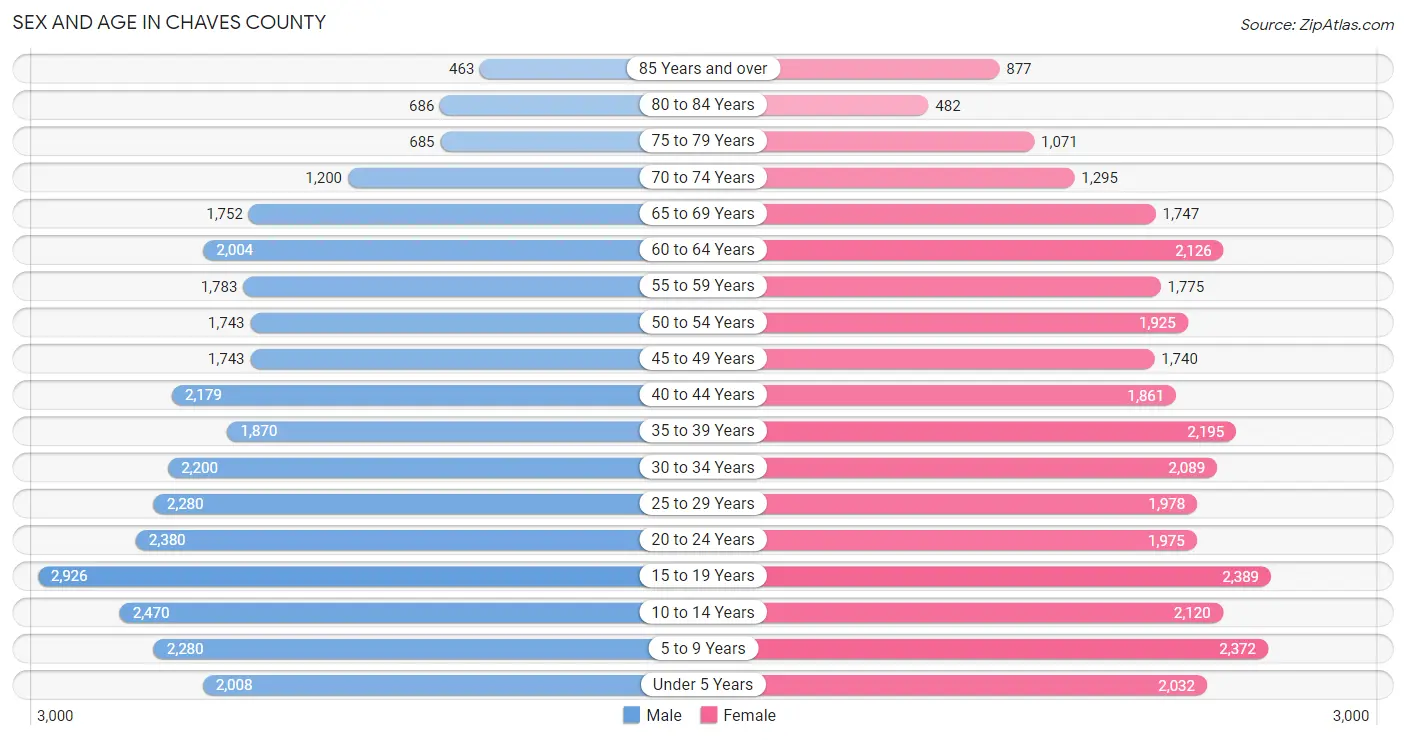
Sex and Age in Chaves County
The most populous age groups in Chaves County are 15 to 19 Years (2,926 | 9.0%) for men and 15 to 19 Years (2,389 | 7.4%) for women.
| Age Bracket | Male | Female |
| Under 5 Years | 2,008 (6.1%) | 2,032 (6.3%) |
| 5 to 9 Years | 2,280 (7.0%) | 2,372 (7.4%) |
| 10 to 14 Years | 2,470 (7.6%) | 2,120 (6.6%) |
| 15 to 19 Years | 2,926 (9.0%) | 2,389 (7.4%) |
| 20 to 24 Years | 2,380 (7.3%) | 1,975 (6.2%) |
| 25 to 29 Years | 2,280 (7.0%) | 1,978 (6.2%) |
| 30 to 34 Years | 2,200 (6.7%) | 2,089 (6.5%) |
| 35 to 39 Years | 1,870 (5.7%) | 2,195 (6.9%) |
| 40 to 44 Years | 2,179 (6.7%) | 1,861 (5.8%) |
| 45 to 49 Years | 1,743 (5.3%) | 1,740 (5.4%) |
| 50 to 54 Years | 1,743 (5.3%) | 1,925 (6.0%) |
| 55 to 59 Years | 1,783 (5.5%) | 1,775 (5.5%) |
| 60 to 64 Years | 2,004 (6.1%) | 2,126 (6.6%) |
| 65 to 69 Years | 1,752 (5.4%) | 1,747 (5.4%) |
| 70 to 74 Years | 1,200 (3.7%) | 1,295 (4.0%) |
| 75 to 79 Years | 685 (2.1%) | 1,071 (3.3%) |
| 80 to 84 Years | 686 (2.1%) | 482 (1.5%) |
| 85 Years and over | 463 (1.4%) | 877 (2.7%) |
| Total | 32,652 (100.0%) | 32,049 (100.0%) |
Families and Households in Chaves County
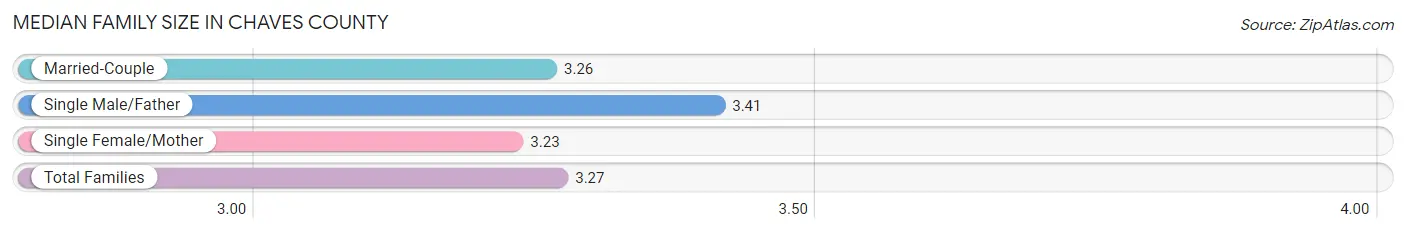
Median Family Size in Chaves County
The median family size in Chaves County is 3.27 persons per family, with single male/father families (1,386 | 8.9%) accounting for the largest median family size of 3.41 persons per family. On the other hand, single female/mother families (3,962 | 25.6%) represent the smallest median family size with 3.23 persons per family.
| Family Type | # Families | Family Size |
| Married-Couple | 10,159 (65.5%) | 3.26 |
| Single Male/Father | 1,386 (8.9%) | 3.41 |
| Single Female/Mother | 3,962 (25.6%) | 3.23 |
| Total Families | 15,507 (100.0%) | 3.27 |
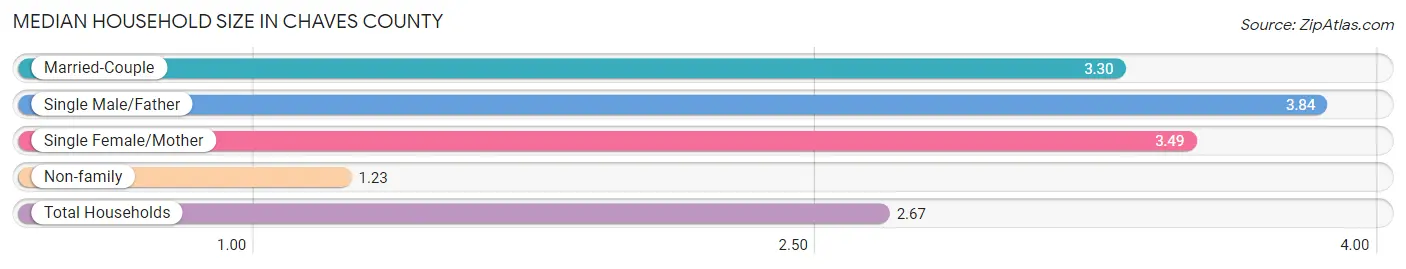
Median Household Size in Chaves County
The median household size in Chaves County is 2.67 persons per household, with single male/father households (1,386 | 5.9%) accounting for the largest median household size of 3.84 persons per household. non-family households (7,773 | 33.4%) represent the smallest median household size with 1.23 persons per household.
| Household Type | # Households | Household Size |
| Married-Couple | 10,159 (43.6%) | 3.30 |
| Single Male/Father | 1,386 (5.9%) | 3.84 |
| Single Female/Mother | 3,962 (17.0%) | 3.49 |
| Non-family | 7,773 (33.4%) | 1.23 |
| Total Households | 23,280 (100.0%) | 2.67 |
Household Size by Marriage Status in Chaves County
Out of a total of 23,280 households in Chaves County, 15,507 (66.6%) are family households, while 7,773 (33.4%) are nonfamily households. The most numerous type of family households are 2-person households, comprising 6,024, and the most common type of nonfamily households are 1-person households, comprising 6,689.
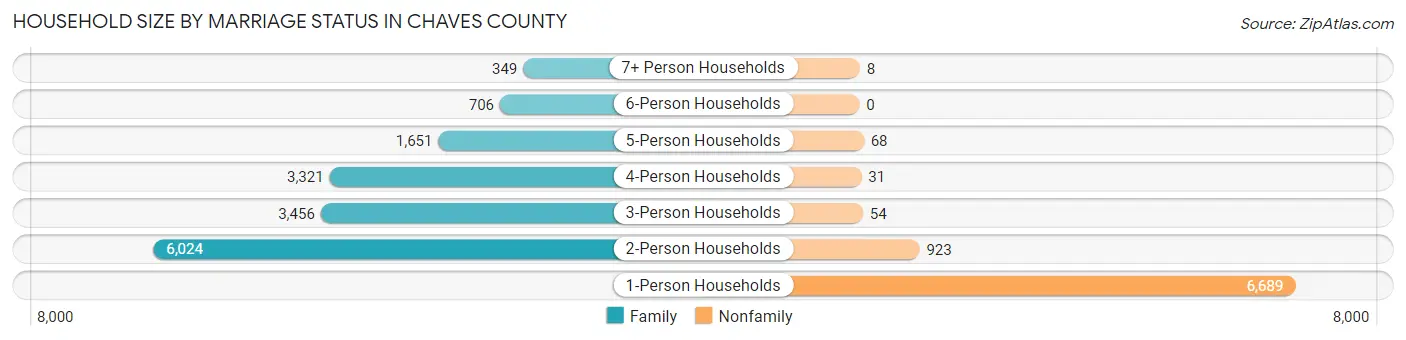
| Household Size | Family Households | Nonfamily Households |
| 1-Person Households | - | 6,689 (28.7%) |
| 2-Person Households | 6,024 (25.9%) | 923 (4.0%) |
| 3-Person Households | 3,456 (14.8%) | 54 (0.2%) |
| 4-Person Households | 3,321 (14.3%) | 31 (0.1%) |
| 5-Person Households | 1,651 (7.1%) | 68 (0.3%) |
| 6-Person Households | 706 (3.0%) | 0 (0.0%) |
| 7+ Person Households | 349 (1.5%) | 8 (0.0%) |
| Total | 15,507 (66.6%) | 7,773 (33.4%) |
Female Fertility in Chaves County
Fertility by Age in Chaves County
Average fertility rate in Chaves County is 71.0 births per 1,000 women. Women in the age bracket of 20 to 34 years have the highest fertility rate with 150.0 births per 1,000 women. Women in the age bracket of 20 to 34 years acount for 87.8% of all women with births.
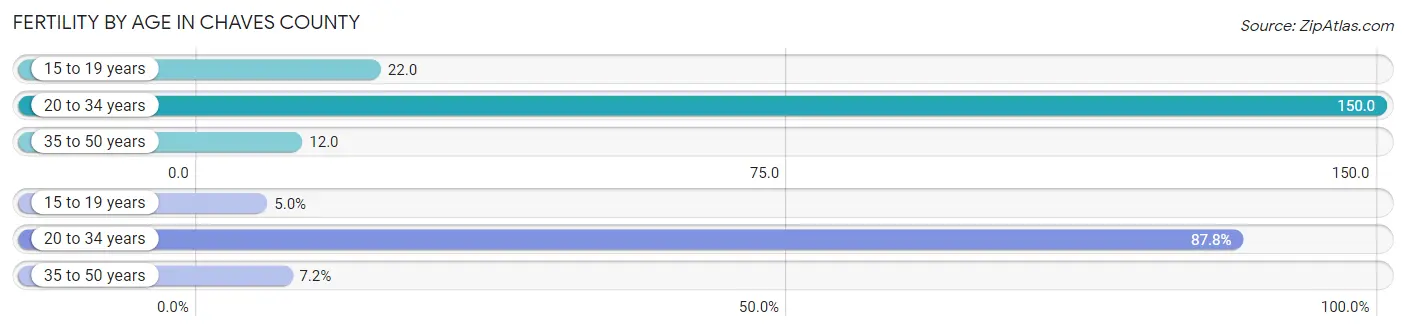
| Age Bracket | Women with Births | Births / 1,000 Women |
| 15 to 19 years | 52 (5.0%) | 22.0 |
| 20 to 34 years | 908 (87.8%) | 150.0 |
| 35 to 50 years | 74 (7.2%) | 12.0 |
| Total | 1,034 (100.0%) | 71.0 |
Fertility by Age by Marriage Status in Chaves County
65.5% of women with births (1,034) in Chaves County are married. The highest percentage of unmarried women with births falls into 15 to 19 years age bracket with 84.6% of them unmarried at the time of birth, while the lowest percentage of unmarried women with births belong to 35 to 50 years age bracket with 16.2% of them unmarried.
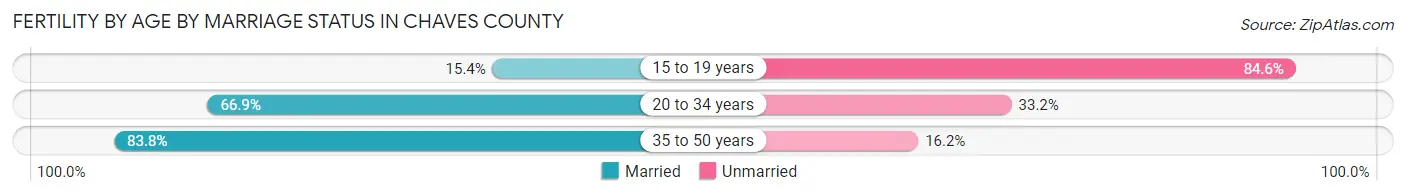
| Age Bracket | Married | Unmarried |
| 15 to 19 years | 8 (15.4%) | 44 (84.6%) |
| 20 to 34 years | 607 (66.8%) | 301 (33.2%) |
| 35 to 50 years | 62 (83.8%) | 12 (16.2%) |
| Total | 677 (65.5%) | 357 (34.5%) |
Fertility by Education in Chaves County
Average fertility rate in Chaves County is 71.0 births per 1,000 women. Women with the education attainment of graduate degree have the highest fertility rate of 167.0 births per 1,000 women, while women with the education attainment of college or associate's degree have the lowest fertility at 54.0 births per 1,000 women. Women with the education attainment of high school diploma represent 30.3% of all women with births.
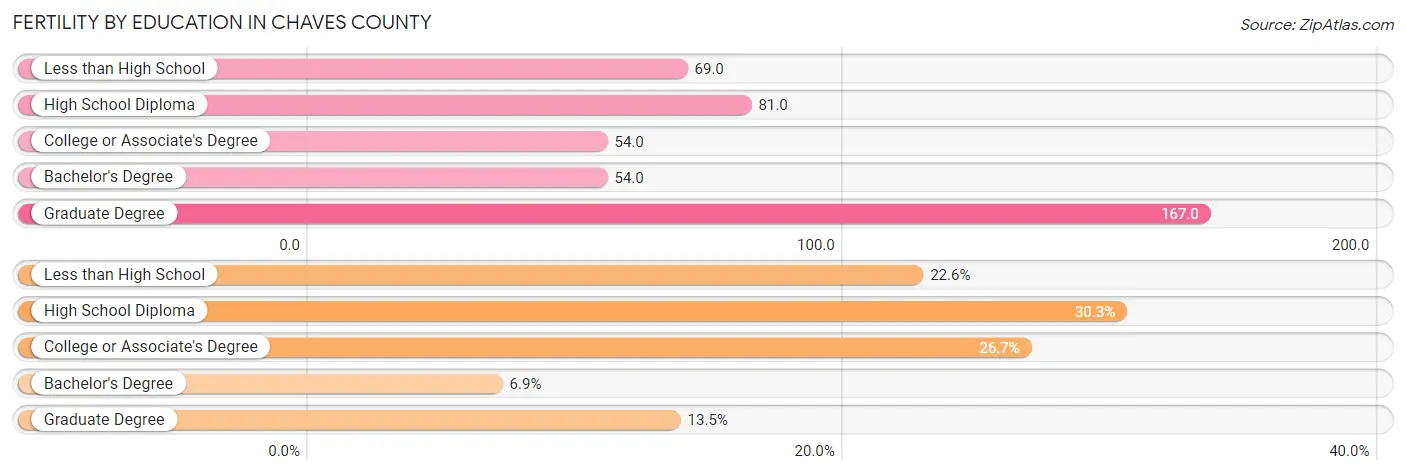
| Educational Attainment | Women with Births | Births / 1,000 Women |
| Less than High School | 234 (22.6%) | 69.0 |
| High School Diploma | 313 (30.3%) | 81.0 |
| College or Associate's Degree | 276 (26.7%) | 54.0 |
| Bachelor's Degree | 71 (6.9%) | 54.0 |
| Graduate Degree | 140 (13.5%) | 167.0 |
| Total | 1,034 (100.0%) | 71.0 |
Fertility by Education by Marriage Status in Chaves County
34.5% of women with births in Chaves County are unmarried. Women with the educational attainment of graduate degree are most likely to be married with 91.4% of them married at childbirth, while women with the educational attainment of less than high school are least likely to be married with 70.9% of them unmarried at childbirth.
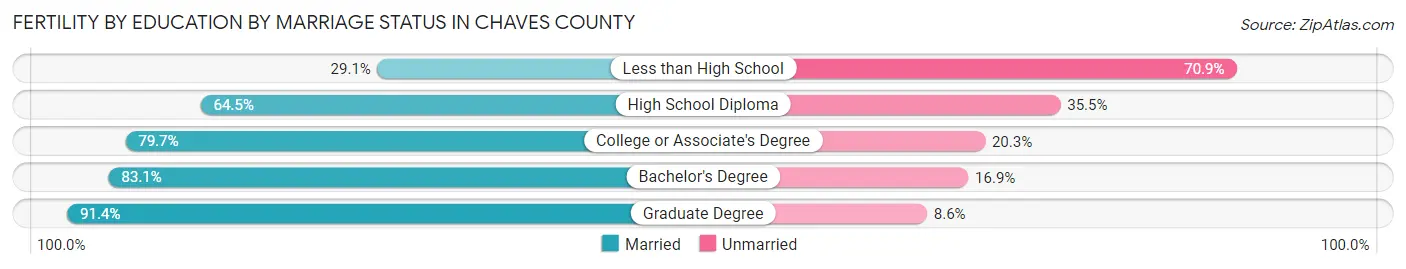
| Educational Attainment | Married | Unmarried |
| Less than High School | 68 (29.1%) | 166 (70.9%) |
| High School Diploma | 202 (64.5%) | 111 (35.5%) |
| College or Associate's Degree | 220 (79.7%) | 56 (20.3%) |
| Bachelor's Degree | 59 (83.1%) | 12 (16.9%) |
| Graduate Degree | 128 (91.4%) | 12 (8.6%) |
| Total | 677 (65.5%) | 357 (34.5%) |
Employment Characteristics in Chaves County
Employment by Class of Employer in Chaves County
Among the 25,977 employed individuals in Chaves County, private company employees (16,888 | 65.0%), local government employees (2,359 | 9.1%), and state government employees (1,778 | 6.8%) make up the most common classes of employment.
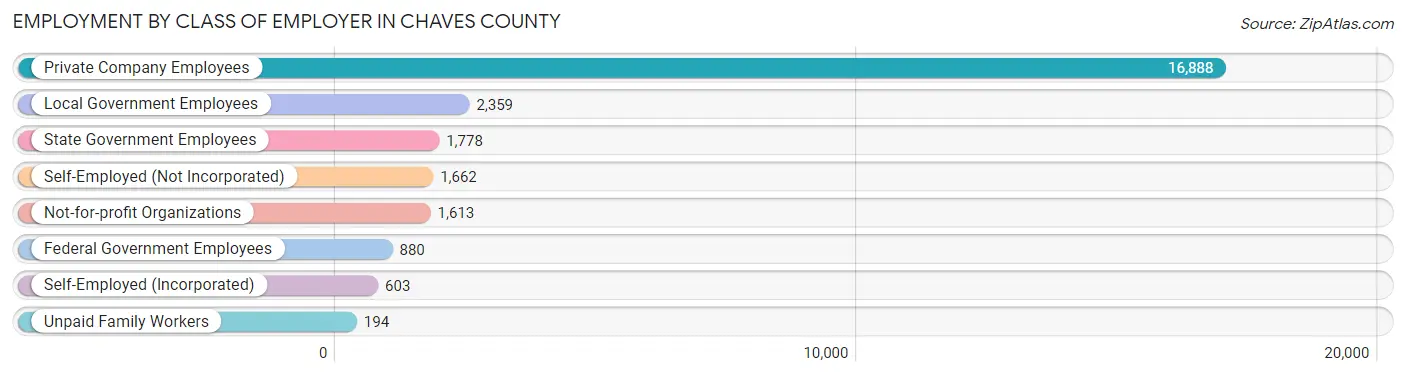
| Employer Class | # Employees | % Employees |
| Private Company Employees | 16,888 | 65.0% |
| Self-Employed (Incorporated) | 603 | 2.3% |
| Self-Employed (Not Incorporated) | 1,662 | 6.4% |
| Not-for-profit Organizations | 1,613 | 6.2% |
| Local Government Employees | 2,359 | 9.1% |
| State Government Employees | 1,778 | 6.8% |
| Federal Government Employees | 880 | 3.4% |
| Unpaid Family Workers | 194 | 0.7% |
| Total | 25,977 | 100.0% |
Employment Status by Age in Chaves County
According to the labor force statistics for Chaves County, out of the total population over 16 years of age (50,138), 56.1% or 28,127 individuals are in the labor force, with 5.3% or 1,491 of them unemployed. The age group with the highest labor force participation rate is 30 to 34 years, with 77.9% or 3,341 individuals in the labor force. Within the labor force, the 16 to 19 years age range has the highest percentage of unemployed individuals, with 11.9% or 167 of them being unemployed.
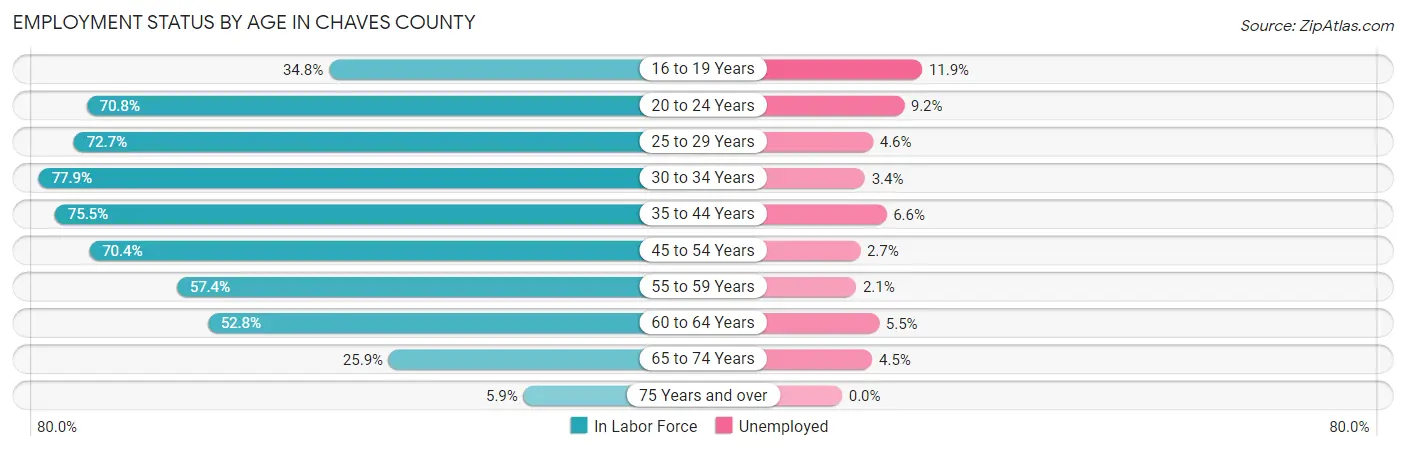
| Age Bracket | In Labor Force | Unemployed |
| 16 to 19 Years | 1,404 (34.8%) | 167 (11.9%) |
| 20 to 24 Years | 3,083 (70.8%) | 284 (9.2%) |
| 25 to 29 Years | 3,096 (72.7%) | 142 (4.6%) |
| 30 to 34 Years | 3,341 (77.9%) | 114 (3.4%) |
| 35 to 44 Years | 6,119 (75.5%) | 404 (6.6%) |
| 45 to 54 Years | 5,034 (70.4%) | 136 (2.7%) |
| 55 to 59 Years | 2,042 (57.4%) | 43 (2.1%) |
| 60 to 64 Years | 2,181 (52.8%) | 120 (5.5%) |
| 65 to 74 Years | 1,552 (25.9%) | 70 (4.5%) |
| 75 Years and over | 252 (5.9%) | 0 (0.0%) |
| Total | 28,127 (56.1%) | 1,491 (5.3%) |
Employment Status by Educational Attainment in Chaves County
According to labor force statistics for Chaves County, 69.3% of individuals (21,823) out of the total population between 25 and 64 years of age (31,491) are in the labor force, with 4.4% or 960 of them being unemployed. The group with the highest labor force participation rate are those with the educational attainment of bachelor's degree or higher, with 85.4% or 4,314 individuals in the labor force. Within the labor force, individuals with less than high school education have the highest percentage of unemployment, with 7.5% or 227 of them being unemployed.
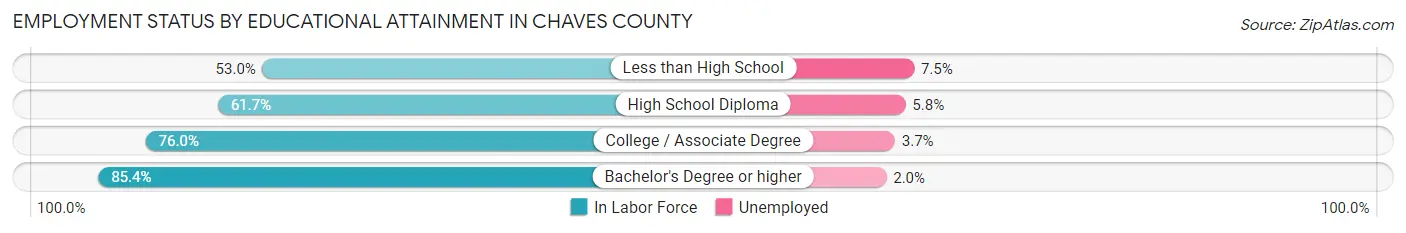
| Educational Attainment | In Labor Force | Unemployed |
| Less than High School | 3,026 (53.0%) | 428 (7.5%) |
| High School Diploma | 5,505 (61.7%) | 518 (5.8%) |
| College / Associate Degree | 8,973 (76.0%) | 437 (3.7%) |
| Bachelor's Degree or higher | 4,314 (85.4%) | 101 (2.0%) |
| Total | 21,823 (69.3%) | 1,386 (4.4%) |
Employment Occupations by Sex in Chaves County
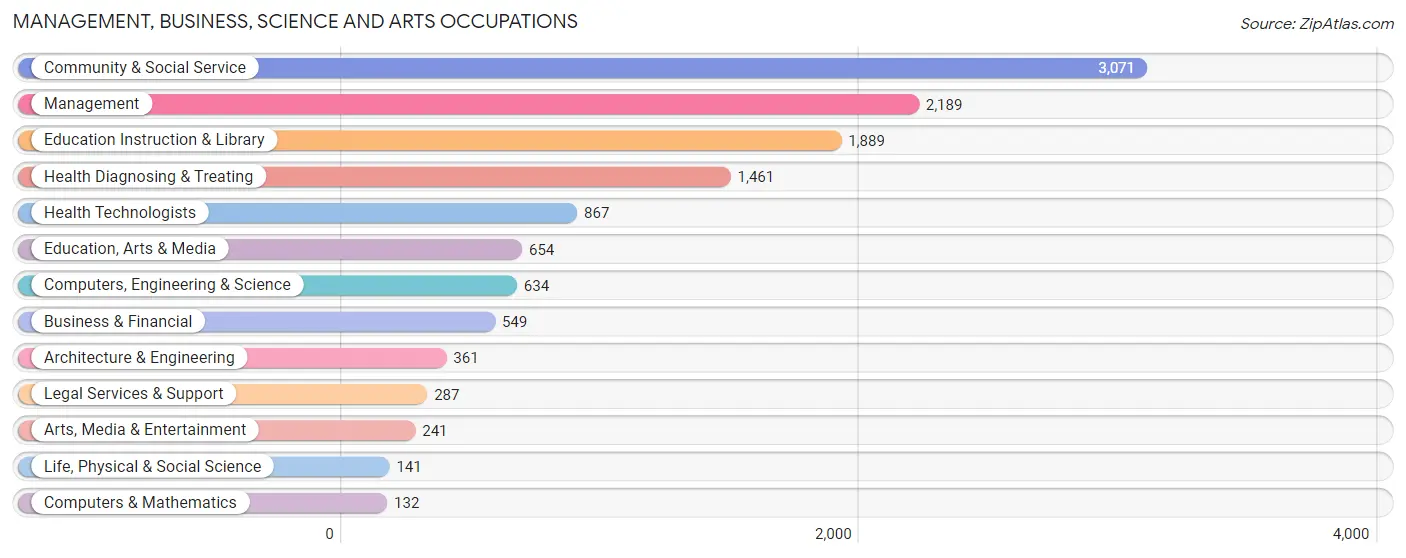
Management, Business, Science and Arts Occupations
The most common Management, Business, Science and Arts occupations in Chaves County are Community & Social Service (3,071 | 11.5%), Management (2,189 | 8.2%), Education Instruction & Library (1,889 | 7.1%), Health Diagnosing & Treating (1,461 | 5.5%), and Health Technologists (867 | 3.3%).
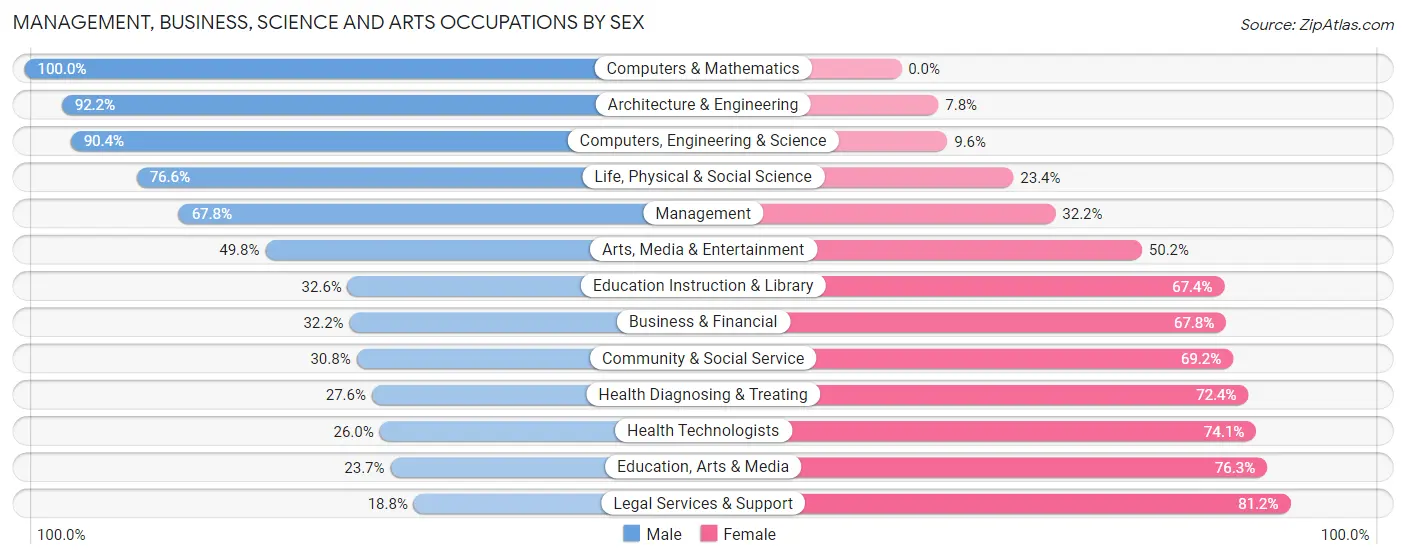
Management, Business, Science and Arts Occupations by Sex
Within the Management, Business, Science and Arts occupations in Chaves County, the most male-oriented occupations are Computers & Mathematics (100.0%), Architecture & Engineering (92.2%), and Computers, Engineering & Science (90.4%), while the most female-oriented occupations are Legal Services & Support (81.2%), Education, Arts & Media (76.3%), and Health Technologists (74.1%).
| Occupation | Male | Female |
| Management | 1,485 (67.8%) | 704 (32.2%) |
| Business & Financial | 177 (32.2%) | 372 (67.8%) |
| Computers, Engineering & Science | 573 (90.4%) | 61 (9.6%) |
| Computers & Mathematics | 132 (100.0%) | 0 (0.0%) |
| Architecture & Engineering | 333 (92.2%) | 28 (7.8%) |
| Life, Physical & Social Science | 108 (76.6%) | 33 (23.4%) |
| Community & Social Service | 945 (30.8%) | 2,126 (69.2%) |
| Education, Arts & Media | 155 (23.7%) | 499 (76.3%) |
| Legal Services & Support | 54 (18.8%) | 233 (81.2%) |
| Education Instruction & Library | 616 (32.6%) | 1,273 (67.4%) |
| Arts, Media & Entertainment | 120 (49.8%) | 121 (50.2%) |
| Health Diagnosing & Treating | 403 (27.6%) | 1,058 (72.4%) |
| Health Technologists | 225 (26.0%) | 642 (74.1%) |
| Total (Category) | 3,583 (45.3%) | 4,321 (54.7%) |
| Total (Overall) | 13,911 (52.3%) | 12,701 (47.7%) |
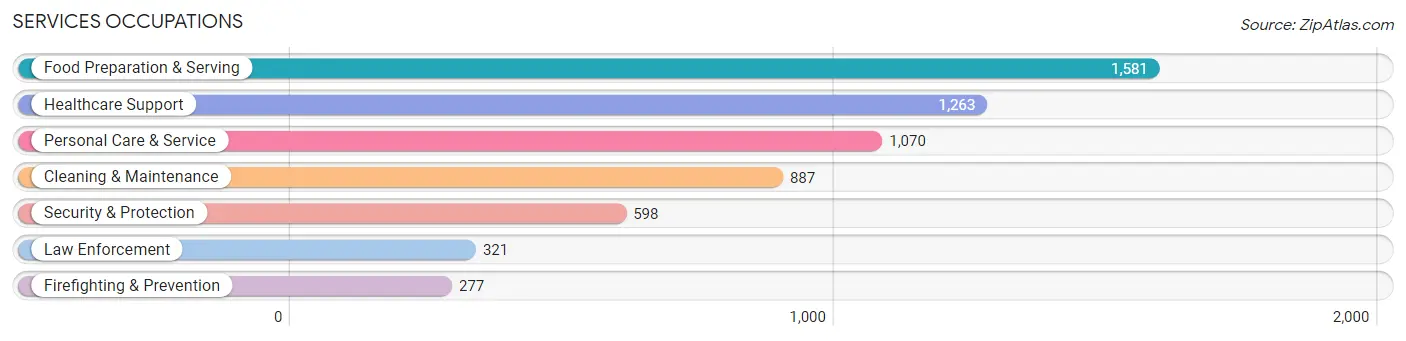
Services Occupations
The most common Services occupations in Chaves County are Food Preparation & Serving (1,581 | 5.9%), Healthcare Support (1,263 | 4.8%), Personal Care & Service (1,070 | 4.0%), Cleaning & Maintenance (887 | 3.3%), and Security & Protection (598 | 2.2%).
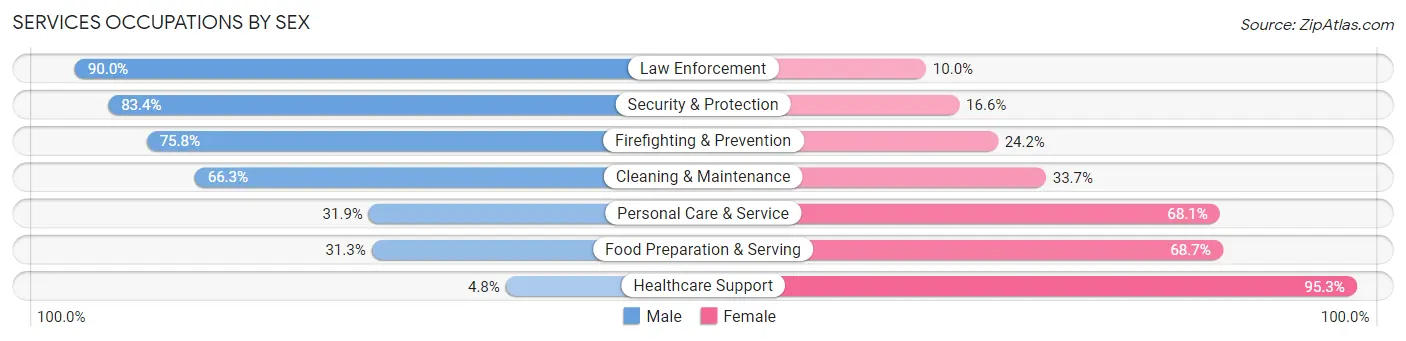
Services Occupations by Sex
Within the Services occupations in Chaves County, the most male-oriented occupations are Law Enforcement (90.0%), Security & Protection (83.4%), and Firefighting & Prevention (75.8%), while the most female-oriented occupations are Healthcare Support (95.3%), Food Preparation & Serving (68.7%), and Personal Care & Service (68.1%).
| Occupation | Male | Female |
| Healthcare Support | 60 (4.8%) | 1,203 (95.3%) |
| Security & Protection | 499 (83.4%) | 99 (16.6%) |
| Firefighting & Prevention | 210 (75.8%) | 67 (24.2%) |
| Law Enforcement | 289 (90.0%) | 32 (10.0%) |
| Food Preparation & Serving | 495 (31.3%) | 1,086 (68.7%) |
| Cleaning & Maintenance | 588 (66.3%) | 299 (33.7%) |
| Personal Care & Service | 341 (31.9%) | 729 (68.1%) |
| Total (Category) | 1,983 (36.7%) | 3,416 (63.3%) |
| Total (Overall) | 13,911 (52.3%) | 12,701 (47.7%) |
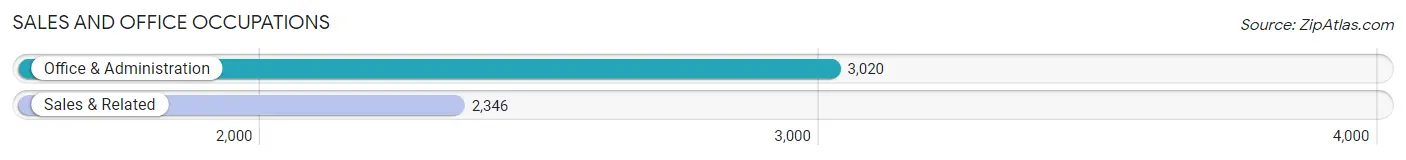
Sales and Office Occupations
The most common Sales and Office occupations in Chaves County are Office & Administration (3,020 | 11.4%), and Sales & Related (2,346 | 8.8%).
Sales and Office Occupations by Sex
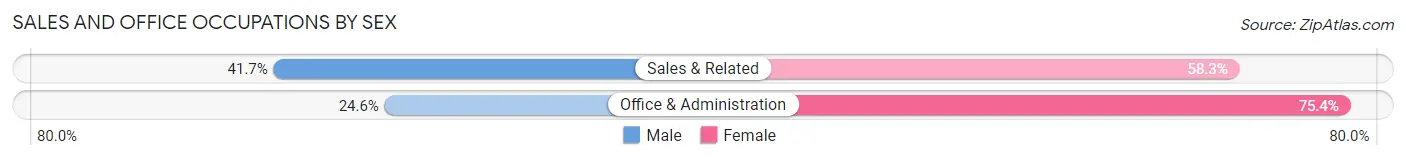
| Occupation | Male | Female |
| Sales & Related | 978 (41.7%) | 1,368 (58.3%) |
| Office & Administration | 743 (24.6%) | 2,277 (75.4%) |
| Total (Category) | 1,721 (32.1%) | 3,645 (67.9%) |
| Total (Overall) | 13,911 (52.3%) | 12,701 (47.7%) |
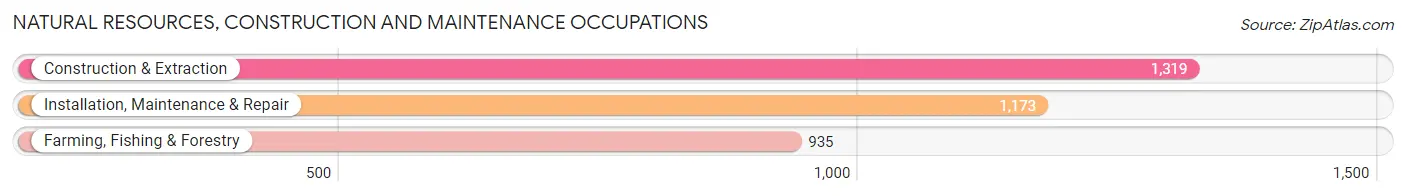
Natural Resources, Construction and Maintenance Occupations
The most common Natural Resources, Construction and Maintenance occupations in Chaves County are Construction & Extraction (1,319 | 5.0%), Installation, Maintenance & Repair (1,173 | 4.4%), and Farming, Fishing & Forestry (935 | 3.5%).
Natural Resources, Construction and Maintenance Occupations by Sex
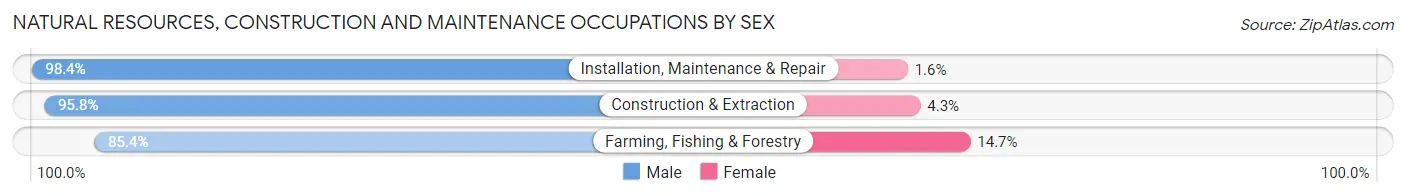
| Occupation | Male | Female |
| Farming, Fishing & Forestry | 798 (85.4%) | 137 (14.6%) |
| Construction & Extraction | 1,263 (95.8%) | 56 (4.3%) |
| Installation, Maintenance & Repair | 1,154 (98.4%) | 19 (1.6%) |
| Total (Category) | 3,215 (93.8%) | 212 (6.2%) |
| Total (Overall) | 13,911 (52.3%) | 12,701 (47.7%) |
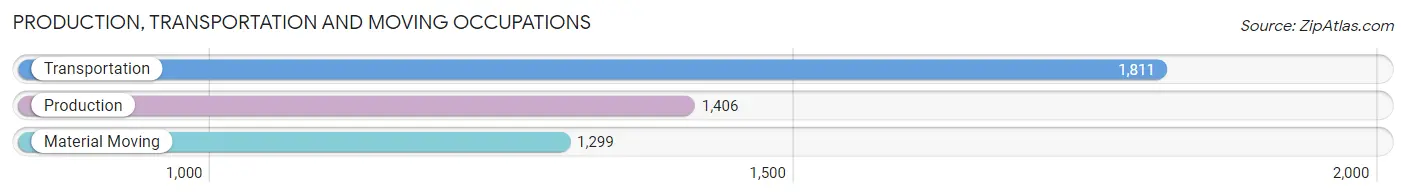
Production, Transportation and Moving Occupations
The most common Production, Transportation and Moving occupations in Chaves County are Transportation (1,811 | 6.8%), Production (1,406 | 5.3%), and Material Moving (1,299 | 4.9%).
Production, Transportation and Moving Occupations by Sex
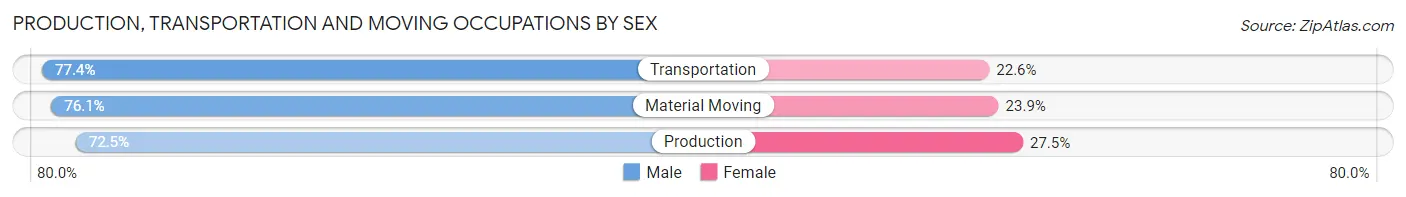
| Occupation | Male | Female |
| Production | 1,019 (72.5%) | 387 (27.5%) |
| Transportation | 1,402 (77.4%) | 409 (22.6%) |
| Material Moving | 988 (76.1%) | 311 (23.9%) |
| Total (Category) | 3,409 (75.5%) | 1,107 (24.5%) |
| Total (Overall) | 13,911 (52.3%) | 12,701 (47.7%) |
Employment Industries by Sex in Chaves County
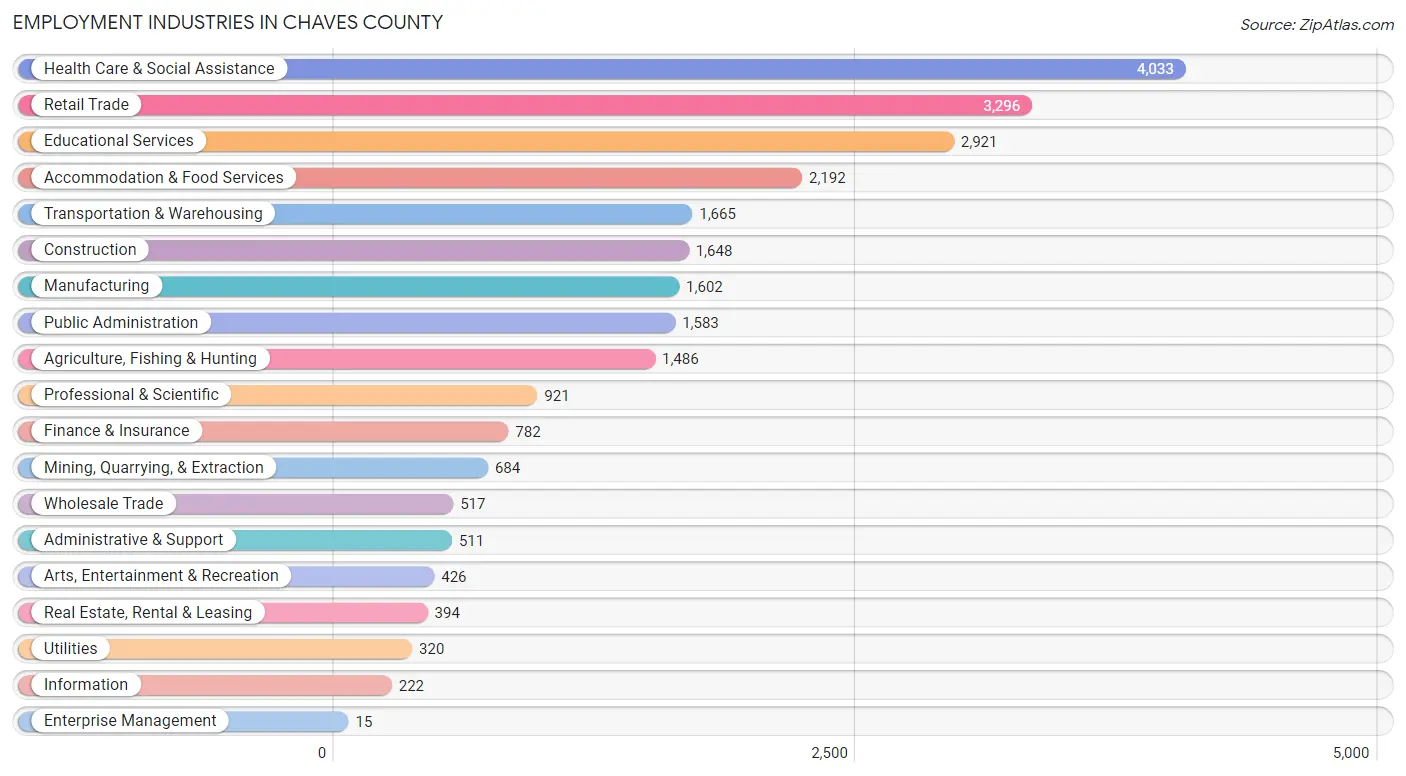
Employment Industries in Chaves County
The major employment industries in Chaves County include Health Care & Social Assistance (4,033 | 15.1%), Retail Trade (3,296 | 12.4%), Educational Services (2,921 | 11.0%), Accommodation & Food Services (2,192 | 8.2%), and Transportation & Warehousing (1,665 | 6.3%).
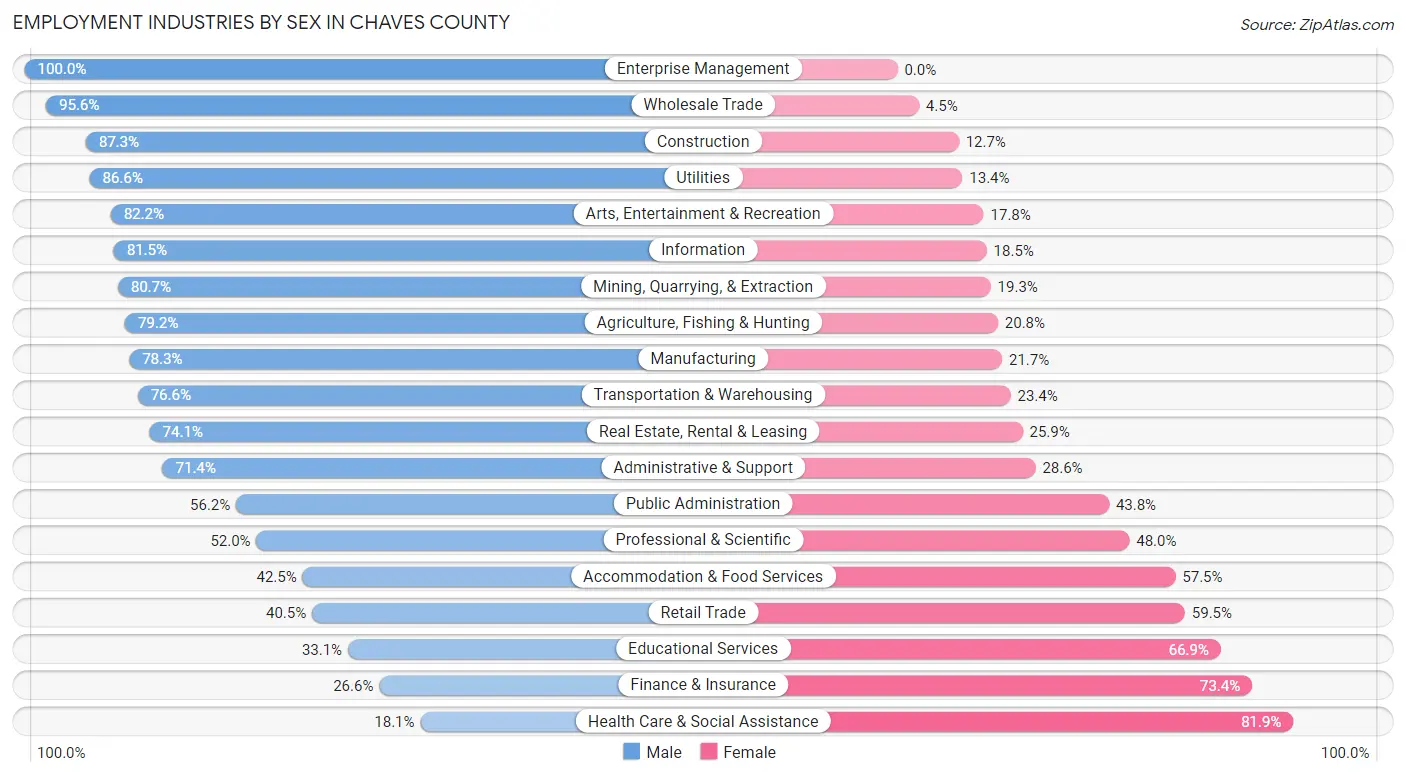
Employment Industries by Sex in Chaves County
The Chaves County industries that see more men than women are Enterprise Management (100.0%), Wholesale Trade (95.6%), and Construction (87.3%), whereas the industries that tend to have a higher number of women are Health Care & Social Assistance (81.9%), Finance & Insurance (73.4%), and Educational Services (66.9%).
| Industry | Male | Female |
| Agriculture, Fishing & Hunting | 1,177 (79.2%) | 309 (20.8%) |
| Mining, Quarrying, & Extraction | 552 (80.7%) | 132 (19.3%) |
| Construction | 1,439 (87.3%) | 209 (12.7%) |
| Manufacturing | 1,255 (78.3%) | 347 (21.7%) |
| Wholesale Trade | 494 (95.6%) | 23 (4.4%) |
| Retail Trade | 1,335 (40.5%) | 1,961 (59.5%) |
| Transportation & Warehousing | 1,275 (76.6%) | 390 (23.4%) |
| Utilities | 277 (86.6%) | 43 (13.4%) |
| Information | 181 (81.5%) | 41 (18.5%) |
| Finance & Insurance | 208 (26.6%) | 574 (73.4%) |
| Real Estate, Rental & Leasing | 292 (74.1%) | 102 (25.9%) |
| Professional & Scientific | 479 (52.0%) | 442 (48.0%) |
| Enterprise Management | 15 (100.0%) | 0 (0.0%) |
| Administrative & Support | 365 (71.4%) | 146 (28.6%) |
| Educational Services | 966 (33.1%) | 1,955 (66.9%) |
| Health Care & Social Assistance | 729 (18.1%) | 3,304 (81.9%) |
| Arts, Entertainment & Recreation | 350 (82.2%) | 76 (17.8%) |
| Accommodation & Food Services | 931 (42.5%) | 1,261 (57.5%) |
| Public Administration | 890 (56.2%) | 693 (43.8%) |
| Total | 13,911 (52.3%) | 12,701 (47.7%) |
Education in Chaves County
School Enrollment in Chaves County
The most common levels of schooling among the 16,563 students in Chaves County are middle school (3,900 | 23.5%), high school (3,654 | 22.1%), and elementary school (3,391 | 20.5%).
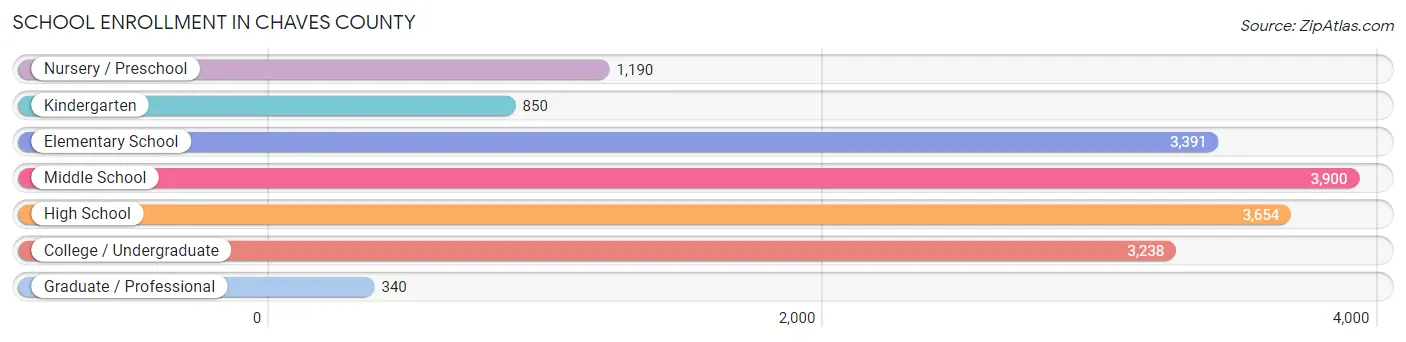
| School Level | # Students | % Students |
| Nursery / Preschool | 1,190 | 7.2% |
| Kindergarten | 850 | 5.1% |
| Elementary School | 3,391 | 20.5% |
| Middle School | 3,900 | 23.5% |
| High School | 3,654 | 22.1% |
| College / Undergraduate | 3,238 | 19.6% |
| Graduate / Professional | 340 | 2.1% |
| Total | 16,563 | 100.0% |
School Enrollment by Age by Funding Source in Chaves County
Out of a total of 16,563 students who are enrolled in schools in Chaves County, 2,219 (13.4%) attend a private institution, while the remaining 14,344 (86.6%) are enrolled in public schools. The age group of 18 to 19 year olds has the highest likelihood of being enrolled in private schools, with 552 (35.9% in the age bracket) enrolled. Conversely, the age group of 5 to 9 year old has the lowest likelihood of being enrolled in a private school, with 4,004 (94.8% in the age bracket) attending a public institution.
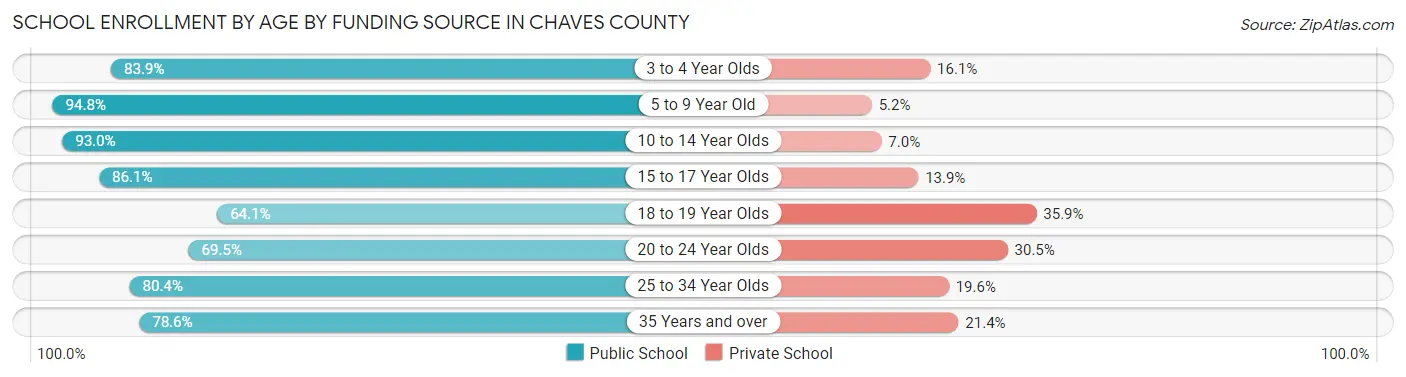
| Age Bracket | Public School | Private School |
| 3 to 4 Year Olds | 729 (83.9%) | 140 (16.1%) |
| 5 to 9 Year Old | 4,004 (94.8%) | 221 (5.2%) |
| 10 to 14 Year Olds | 4,176 (93.0%) | 316 (7.0%) |
| 15 to 17 Year Olds | 2,587 (86.1%) | 417 (13.9%) |
| 18 to 19 Year Olds | 986 (64.1%) | 552 (35.9%) |
| 20 to 24 Year Olds | 546 (69.5%) | 240 (30.5%) |
| 25 to 34 Year Olds | 600 (80.4%) | 146 (19.6%) |
| 35 Years and over | 710 (78.6%) | 193 (21.4%) |
| Total | 14,344 (86.6%) | 2,219 (13.4%) |
Educational Attainment by Field of Study in Chaves County
Education (1,419 | 17.6%), bio, nature & agricultural (1,015 | 12.6%), business (964 | 11.9%), science & technology (917 | 11.4%), and arts & humanities (579 | 7.2%) are the most common fields of study among 8,075 individuals in Chaves County who have obtained a bachelor's degree or higher.
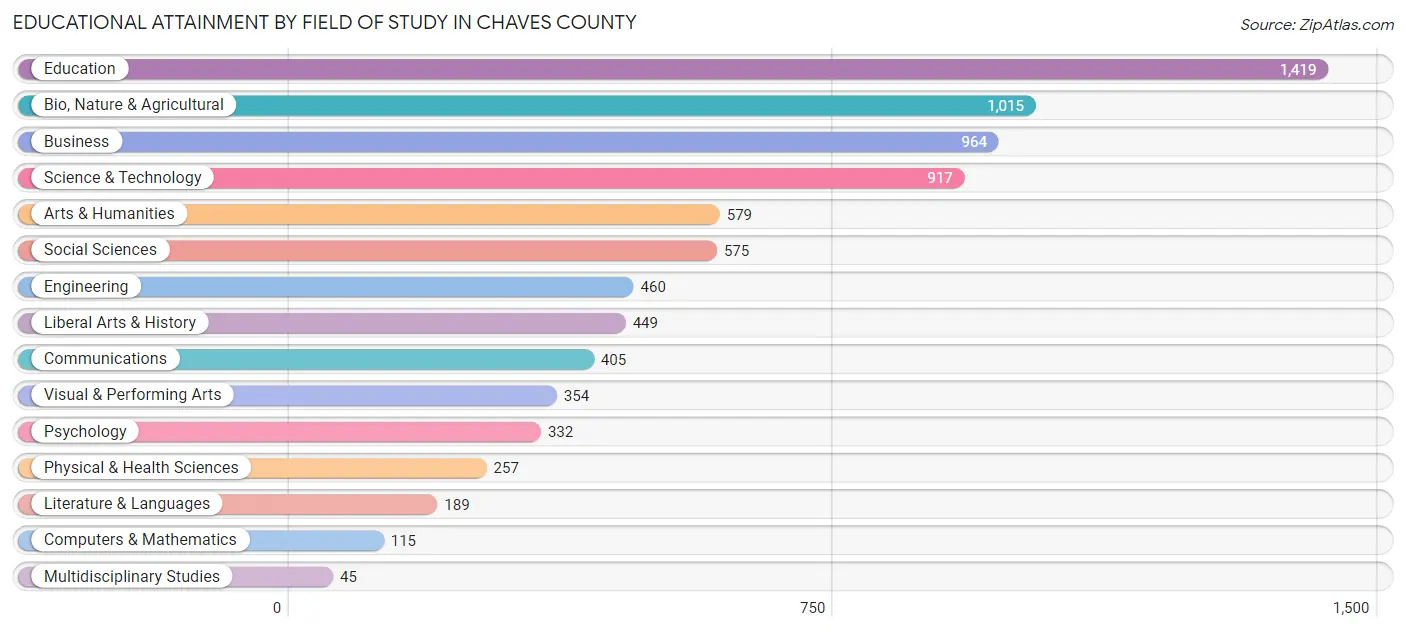
| Field of Study | # Graduates | % Graduates |
| Computers & Mathematics | 115 | 1.4% |
| Bio, Nature & Agricultural | 1,015 | 12.6% |
| Physical & Health Sciences | 257 | 3.2% |
| Psychology | 332 | 4.1% |
| Social Sciences | 575 | 7.1% |
| Engineering | 460 | 5.7% |
| Multidisciplinary Studies | 45 | 0.6% |
| Science & Technology | 917 | 11.4% |
| Business | 964 | 11.9% |
| Education | 1,419 | 17.6% |
| Literature & Languages | 189 | 2.3% |
| Liberal Arts & History | 449 | 5.6% |
| Visual & Performing Arts | 354 | 4.4% |
| Communications | 405 | 5.0% |
| Arts & Humanities | 579 | 7.2% |
| Total | 8,075 | 100.0% |
Transportation & Commute in Chaves County
Vehicle Availability by Sex in Chaves County
The most prevalent vehicle ownership categories in Chaves County are males with 2 vehicles (5,918, accounting for 43.8%) and females with 2 vehicles (5,041, making up 49.0%).
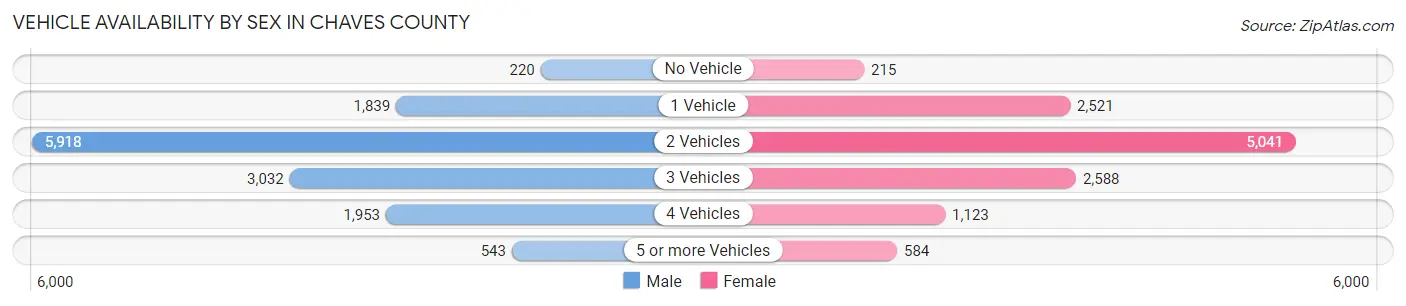
| Vehicles Available | Male | Female |
| No Vehicle | 220 (1.6%) | 215 (1.8%) |
| 1 Vehicle | 1,839 (13.6%) | 2,521 (20.9%) |
| 2 Vehicles | 5,918 (43.8%) | 5,041 (41.8%) |
| 3 Vehicles | 3,032 (22.5%) | 2,588 (21.4%) |
| 4 Vehicles | 1,953 (14.5%) | 1,123 (9.3%) |
| 5 or more Vehicles | 543 (4.0%) | 584 (4.8%) |
| Total | 13,505 (100.0%) | 12,072 (100.0%) |
Commute Time in Chaves County
The most frequently occuring commute durations in Chaves County are 10 to 14 minutes (5,881 commuters, 23.5%), 15 to 19 minutes (5,676 commuters, 22.7%), and 5 to 9 minutes (4,530 commuters, 18.1%).
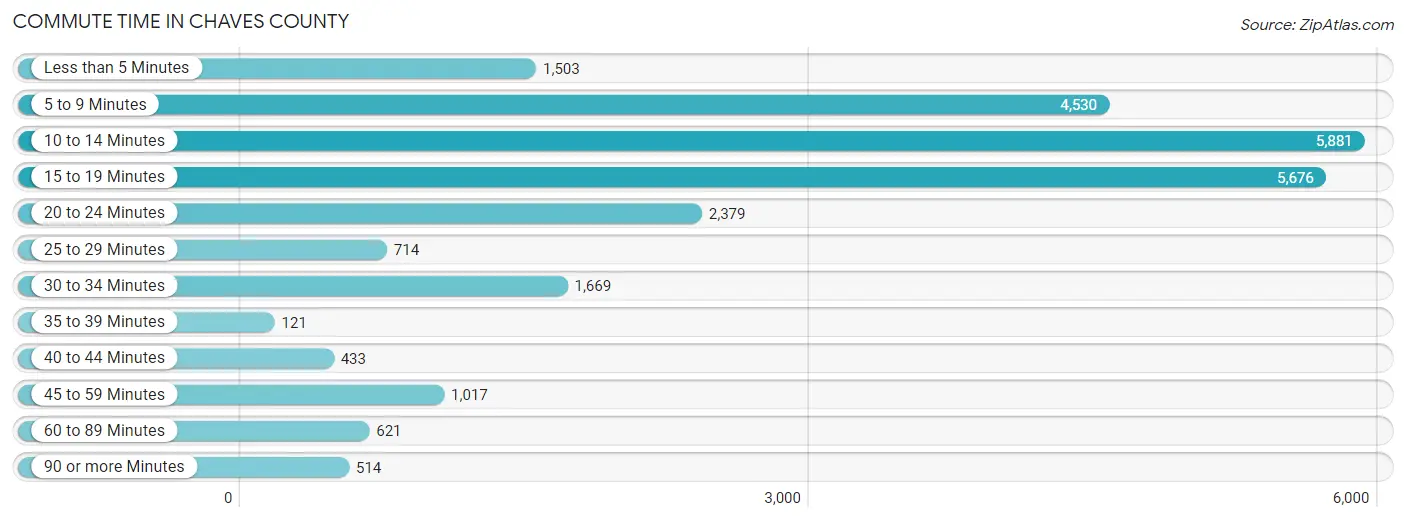
| Commute Time | # Commuters | % Commuters |
| Less than 5 Minutes | 1,503 | 6.0% |
| 5 to 9 Minutes | 4,530 | 18.1% |
| 10 to 14 Minutes | 5,881 | 23.5% |
| 15 to 19 Minutes | 5,676 | 22.7% |
| 20 to 24 Minutes | 2,379 | 9.5% |
| 25 to 29 Minutes | 714 | 2.9% |
| 30 to 34 Minutes | 1,669 | 6.7% |
| 35 to 39 Minutes | 121 | 0.5% |
| 40 to 44 Minutes | 433 | 1.7% |
| 45 to 59 Minutes | 1,017 | 4.1% |
| 60 to 89 Minutes | 621 | 2.5% |
| 90 or more Minutes | 514 | 2.1% |
Commute Time by Sex in Chaves County
The most common commute times in Chaves County are 10 to 14 minutes (2,712 commuters, 20.4%) for males and 10 to 14 minutes (3,169 commuters, 27.0%) for females.
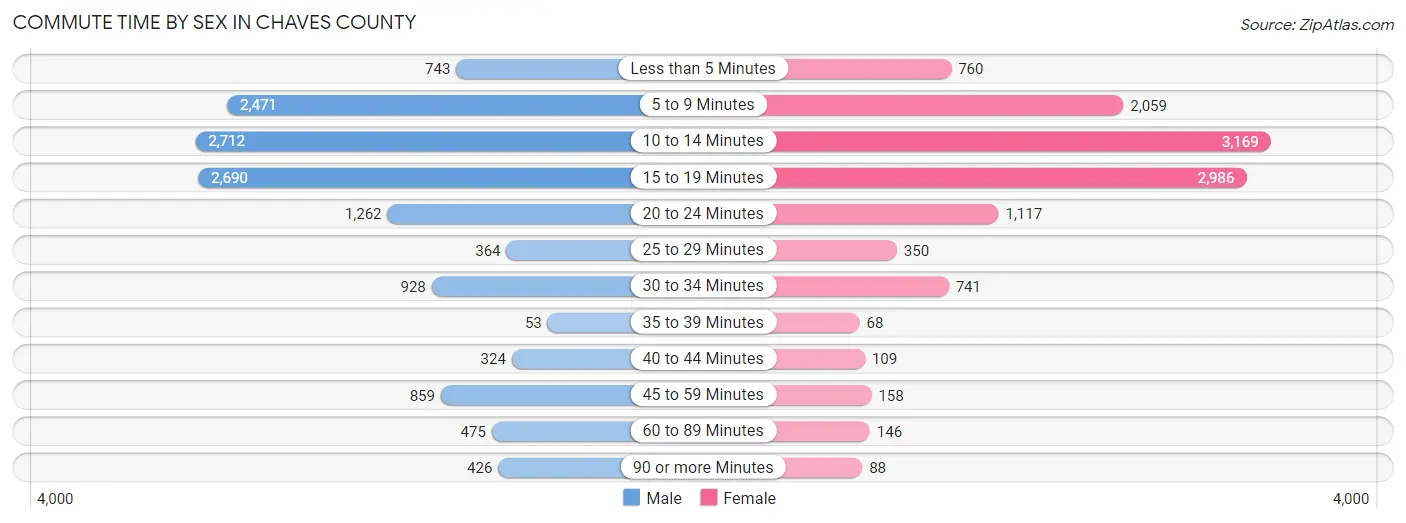
| Commute Time | Male | Female |
| Less than 5 Minutes | 743 (5.6%) | 760 (6.5%) |
| 5 to 9 Minutes | 2,471 (18.6%) | 2,059 (17.5%) |
| 10 to 14 Minutes | 2,712 (20.4%) | 3,169 (27.0%) |
| 15 to 19 Minutes | 2,690 (20.2%) | 2,986 (25.4%) |
| 20 to 24 Minutes | 1,262 (9.5%) | 1,117 (9.5%) |
| 25 to 29 Minutes | 364 (2.7%) | 350 (3.0%) |
| 30 to 34 Minutes | 928 (7.0%) | 741 (6.3%) |
| 35 to 39 Minutes | 53 (0.4%) | 68 (0.6%) |
| 40 to 44 Minutes | 324 (2.4%) | 109 (0.9%) |
| 45 to 59 Minutes | 859 (6.5%) | 158 (1.3%) |
| 60 to 89 Minutes | 475 (3.6%) | 146 (1.2%) |
| 90 or more Minutes | 426 (3.2%) | 88 (0.7%) |
Time of Departure to Work by Sex in Chaves County
The most frequent times of departure to work in Chaves County are 6:00 AM to 6:29 AM (1,779, 13.4%) for males and 7:30 AM to 7:59 AM (2,691, 22.9%) for females.
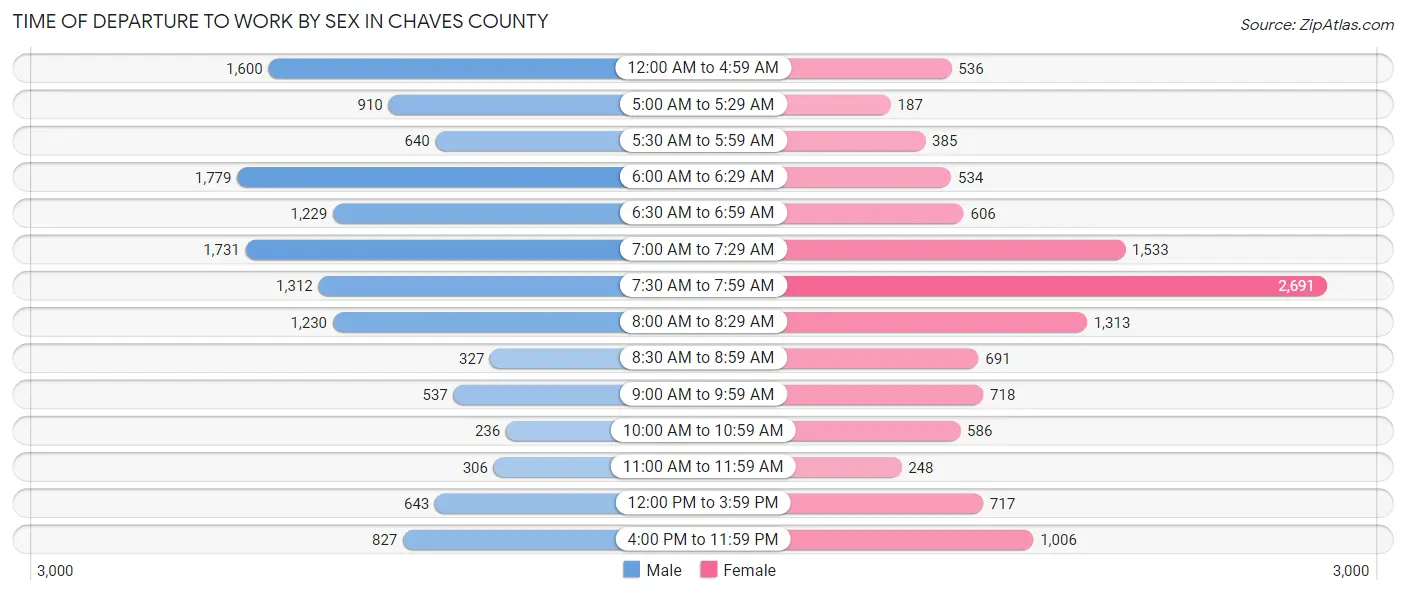
| Time of Departure | Male | Female |
| 12:00 AM to 4:59 AM | 1,600 (12.0%) | 536 (4.6%) |
| 5:00 AM to 5:29 AM | 910 (6.8%) | 187 (1.6%) |
| 5:30 AM to 5:59 AM | 640 (4.8%) | 385 (3.3%) |
| 6:00 AM to 6:29 AM | 1,779 (13.4%) | 534 (4.5%) |
| 6:30 AM to 6:59 AM | 1,229 (9.2%) | 606 (5.2%) |
| 7:00 AM to 7:29 AM | 1,731 (13.0%) | 1,533 (13.1%) |
| 7:30 AM to 7:59 AM | 1,312 (9.9%) | 2,691 (22.9%) |
| 8:00 AM to 8:29 AM | 1,230 (9.2%) | 1,313 (11.2%) |
| 8:30 AM to 8:59 AM | 327 (2.5%) | 691 (5.9%) |
| 9:00 AM to 9:59 AM | 537 (4.0%) | 718 (6.1%) |
| 10:00 AM to 10:59 AM | 236 (1.8%) | 586 (5.0%) |
| 11:00 AM to 11:59 AM | 306 (2.3%) | 248 (2.1%) |
| 12:00 PM to 3:59 PM | 643 (4.8%) | 717 (6.1%) |
| 4:00 PM to 11:59 PM | 827 (6.2%) | 1,006 (8.6%) |
| Total | 13,307 (100.0%) | 11,751 (100.0%) |
Housing Occupancy in Chaves County
Occupancy by Ownership in Chaves County
Of the total 23,280 dwellings in Chaves County, owner-occupied units account for 15,688 (67.4%), while renter-occupied units make up 7,592 (32.6%).
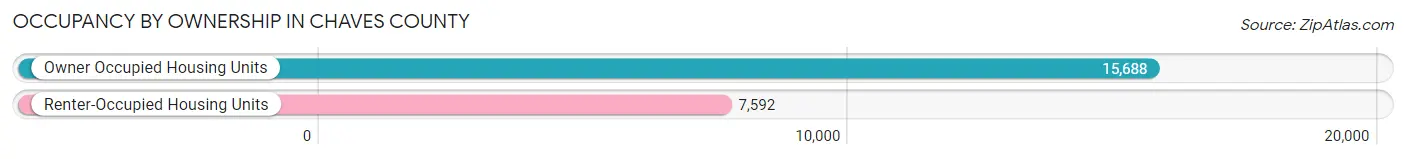
| Occupancy | # Housing Units | % Housing Units |
| Owner Occupied Housing Units | 15,688 | 67.4% |
| Renter-Occupied Housing Units | 7,592 | 32.6% |
| Total Occupied Housing Units | 23,280 | 100.0% |
Occupancy by Household Size in Chaves County
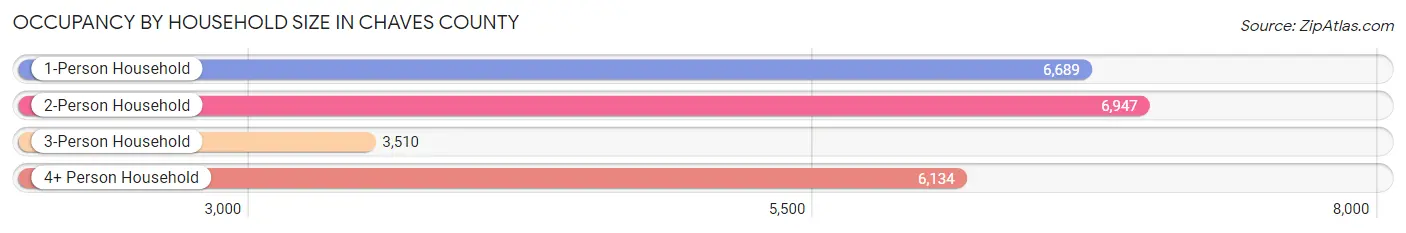
| Household Size | # Housing Units | % Housing Units |
| 1-Person Household | 6,689 | 28.7% |
| 2-Person Household | 6,947 | 29.8% |
| 3-Person Household | 3,510 | 15.1% |
| 4+ Person Household | 6,134 | 26.4% |
| Total Housing Units | 23,280 | 100.0% |
Occupancy by Ownership by Household Size in Chaves County
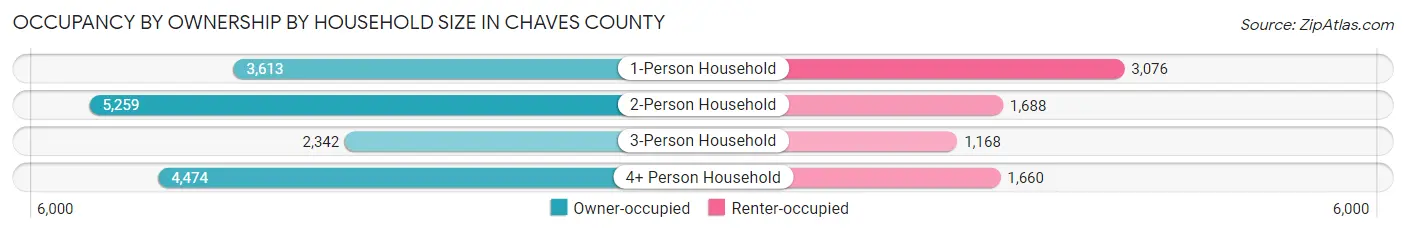
| Household Size | Owner-occupied | Renter-occupied |
| 1-Person Household | 3,613 (54.0%) | 3,076 (46.0%) |
| 2-Person Household | 5,259 (75.7%) | 1,688 (24.3%) |
| 3-Person Household | 2,342 (66.7%) | 1,168 (33.3%) |
| 4+ Person Household | 4,474 (72.9%) | 1,660 (27.1%) |
| Total Housing Units | 15,688 (67.4%) | 7,592 (32.6%) |
Occupancy by Educational Attainment in Chaves County
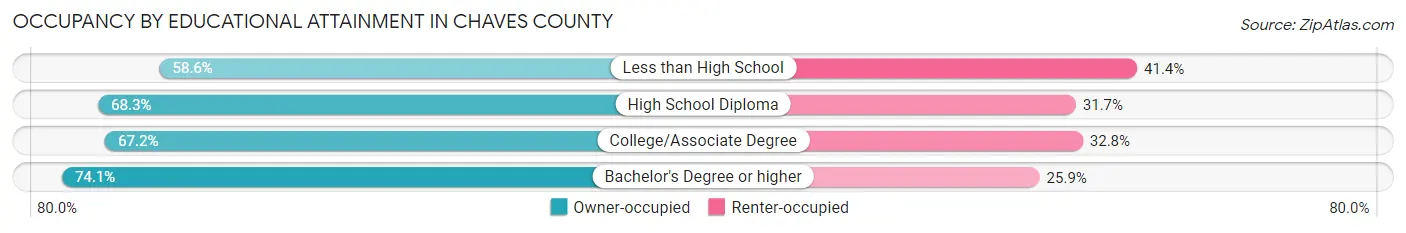
| Household Size | Owner-occupied | Renter-occupied |
| Less than High School | 2,310 (58.6%) | 1,631 (41.4%) |
| High School Diploma | 3,810 (68.3%) | 1,766 (31.7%) |
| College/Associate Degree | 6,149 (67.2%) | 2,998 (32.8%) |
| Bachelor's Degree or higher | 3,419 (74.1%) | 1,197 (25.9%) |
Occupancy by Age of Householder in Chaves County
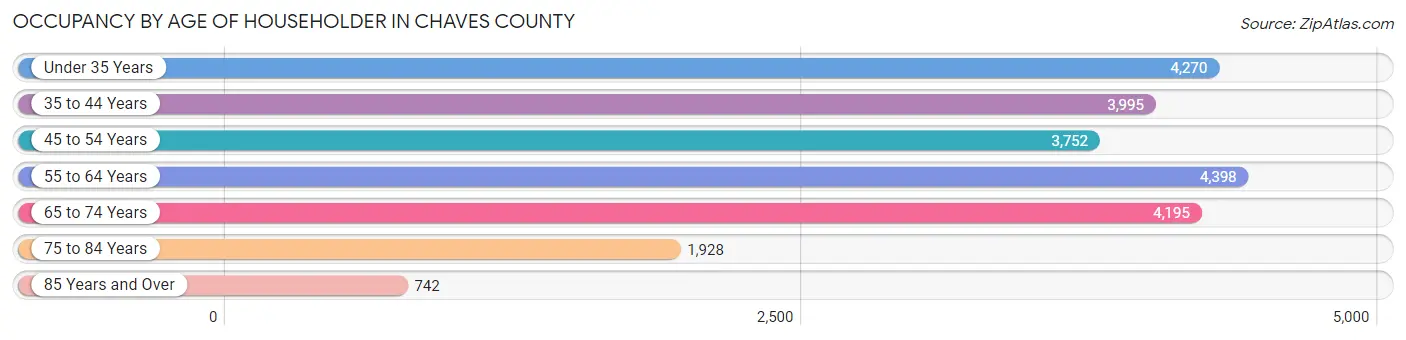
| Age Bracket | # Households | % Households |
| Under 35 Years | 4,270 | 18.3% |
| 35 to 44 Years | 3,995 | 17.2% |
| 45 to 54 Years | 3,752 | 16.1% |
| 55 to 64 Years | 4,398 | 18.9% |
| 65 to 74 Years | 4,195 | 18.0% |
| 75 to 84 Years | 1,928 | 8.3% |
| 85 Years and Over | 742 | 3.2% |
| Total | 23,280 | 100.0% |
Housing Finances in Chaves County
Median Income by Occupancy in Chaves County
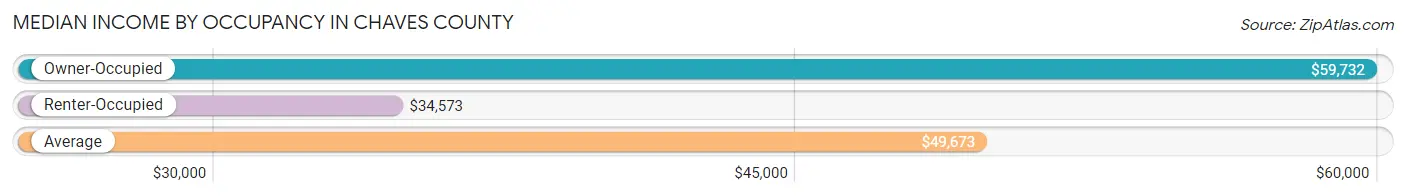
| Occupancy Type | # Households | Median Income |
| Owner-Occupied | 15,688 (67.4%) | $59,732 |
| Renter-Occupied | 7,592 (32.6%) | $34,573 |
| Average | 23,280 (100.0%) | $49,673 |
Occupancy by Householder Income Bracket in Chaves County
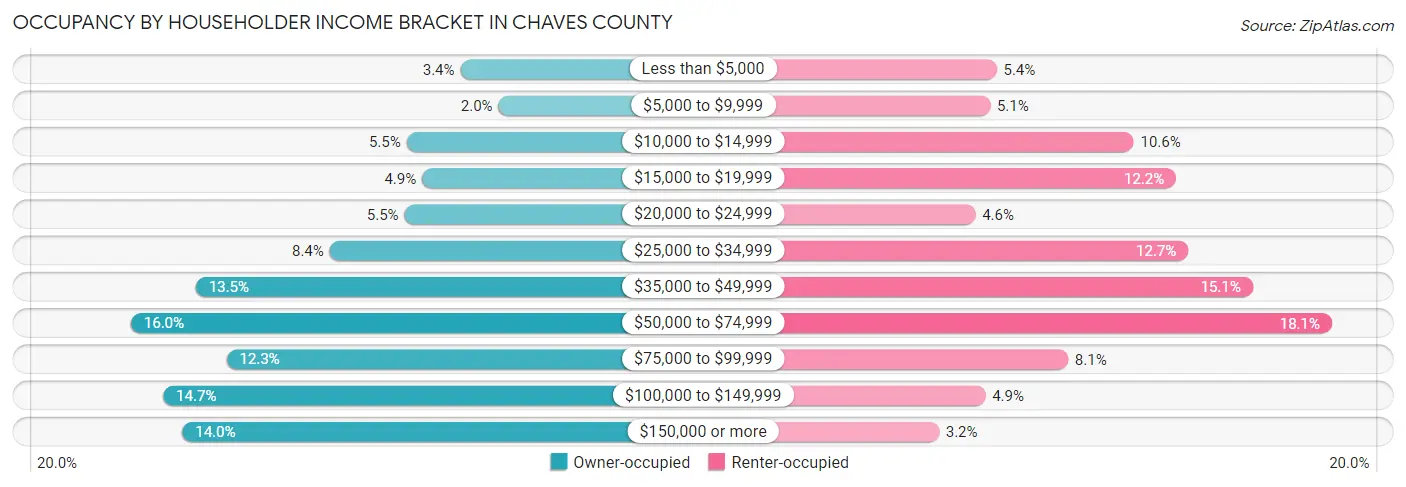
| Income Bracket | Owner-occupied | Renter-occupied |
| Less than $5,000 | 534 (3.4%) | 408 (5.4%) |
| $5,000 to $9,999 | 306 (1.9%) | 389 (5.1%) |
| $10,000 to $14,999 | 855 (5.4%) | 804 (10.6%) |
| $15,000 to $19,999 | 762 (4.9%) | 927 (12.2%) |
| $20,000 to $24,999 | 867 (5.5%) | 346 (4.6%) |
| $25,000 to $34,999 | 1,314 (8.4%) | 962 (12.7%) |
| $35,000 to $49,999 | 2,114 (13.5%) | 1,149 (15.1%) |
| $50,000 to $74,999 | 2,502 (16.0%) | 1,377 (18.1%) |
| $75,000 to $99,999 | 1,931 (12.3%) | 614 (8.1%) |
| $100,000 to $149,999 | 2,309 (14.7%) | 375 (4.9%) |
| $150,000 or more | 2,194 (14.0%) | 241 (3.2%) |
| Total | 15,688 (100.0%) | 7,592 (100.0%) |
Monthly Housing Cost Tiers in Chaves County
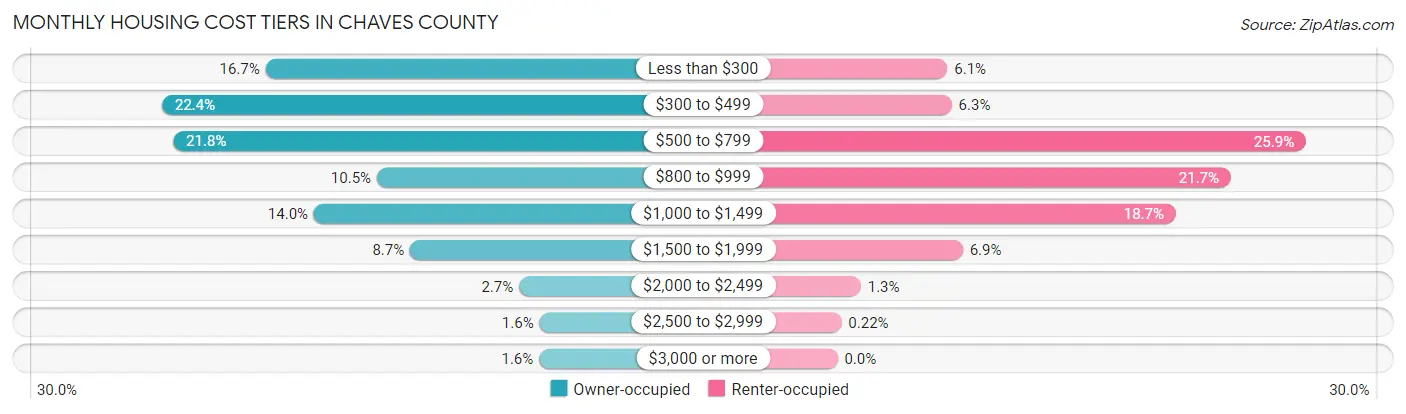
| Monthly Cost | Owner-occupied | Renter-occupied |
| Less than $300 | 2,618 (16.7%) | 461 (6.1%) |
| $300 to $499 | 3,517 (22.4%) | 479 (6.3%) |
| $500 to $799 | 3,420 (21.8%) | 1,965 (25.9%) |
| $800 to $999 | 1,653 (10.5%) | 1,650 (21.7%) |
| $1,000 to $1,499 | 2,199 (14.0%) | 1,419 (18.7%) |
| $1,500 to $1,999 | 1,367 (8.7%) | 525 (6.9%) |
| $2,000 to $2,499 | 422 (2.7%) | 98 (1.3%) |
| $2,500 to $2,999 | 244 (1.6%) | 17 (0.2%) |
| $3,000 or more | 248 (1.6%) | 0 (0.0%) |
| Total | 15,688 (100.0%) | 7,592 (100.0%) |
Physical Housing Characteristics in Chaves County
Housing Structures in Chaves County
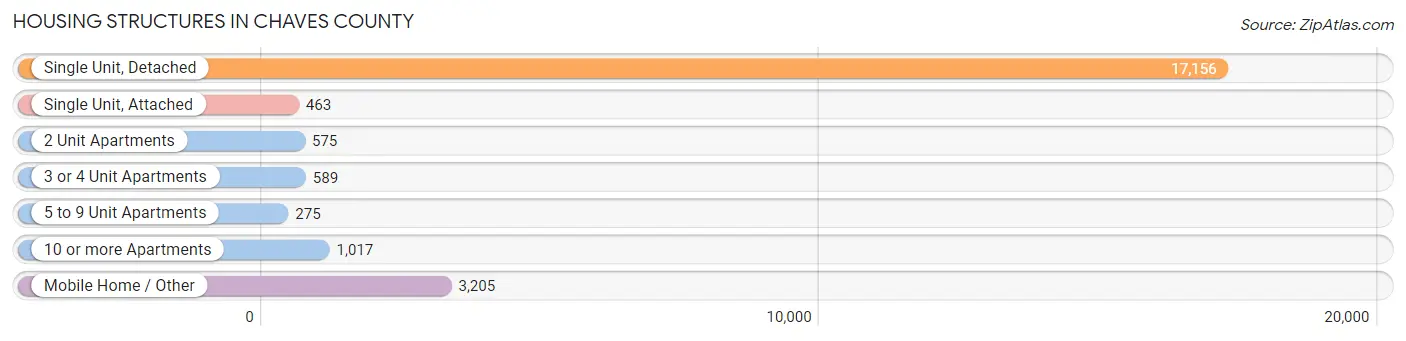
| Structure Type | # Housing Units | % Housing Units |
| Single Unit, Detached | 17,156 | 73.7% |
| Single Unit, Attached | 463 | 2.0% |
| 2 Unit Apartments | 575 | 2.5% |
| 3 or 4 Unit Apartments | 589 | 2.5% |
| 5 to 9 Unit Apartments | 275 | 1.2% |
| 10 or more Apartments | 1,017 | 4.4% |
| Mobile Home / Other | 3,205 | 13.8% |
| Total | 23,280 | 100.0% |
Housing Structures by Occupancy in Chaves County
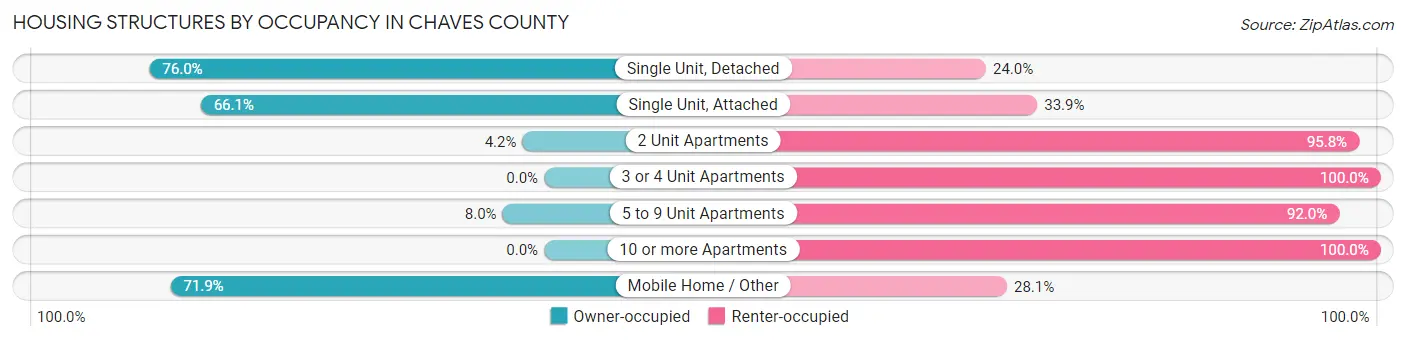
| Structure Type | Owner-occupied | Renter-occupied |
| Single Unit, Detached | 13,031 (76.0%) | 4,125 (24.0%) |
| Single Unit, Attached | 306 (66.1%) | 157 (33.9%) |
| 2 Unit Apartments | 24 (4.2%) | 551 (95.8%) |
| 3 or 4 Unit Apartments | 0 (0.0%) | 589 (100.0%) |
| 5 to 9 Unit Apartments | 22 (8.0%) | 253 (92.0%) |
| 10 or more Apartments | 0 (0.0%) | 1,017 (100.0%) |
| Mobile Home / Other | 2,305 (71.9%) | 900 (28.1%) |
| Total | 15,688 (67.4%) | 7,592 (32.6%) |
Housing Structures by Number of Rooms in Chaves County
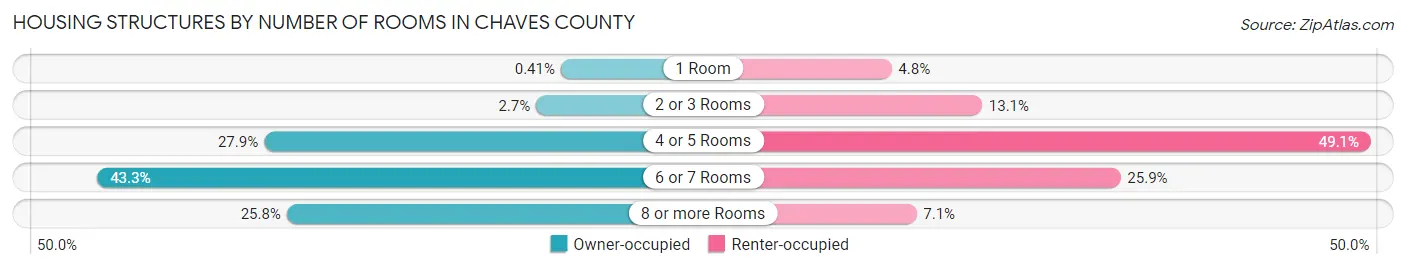
| Number of Rooms | Owner-occupied | Renter-occupied |
| 1 Room | 65 (0.4%) | 361 (4.8%) |
| 2 or 3 Rooms | 423 (2.7%) | 997 (13.1%) |
| 4 or 5 Rooms | 4,370 (27.9%) | 3,728 (49.1%) |
| 6 or 7 Rooms | 6,789 (43.3%) | 1,969 (25.9%) |
| 8 or more Rooms | 4,041 (25.8%) | 537 (7.1%) |
| Total | 15,688 (100.0%) | 7,592 (100.0%) |
Housing Structure by Heating Type in Chaves County
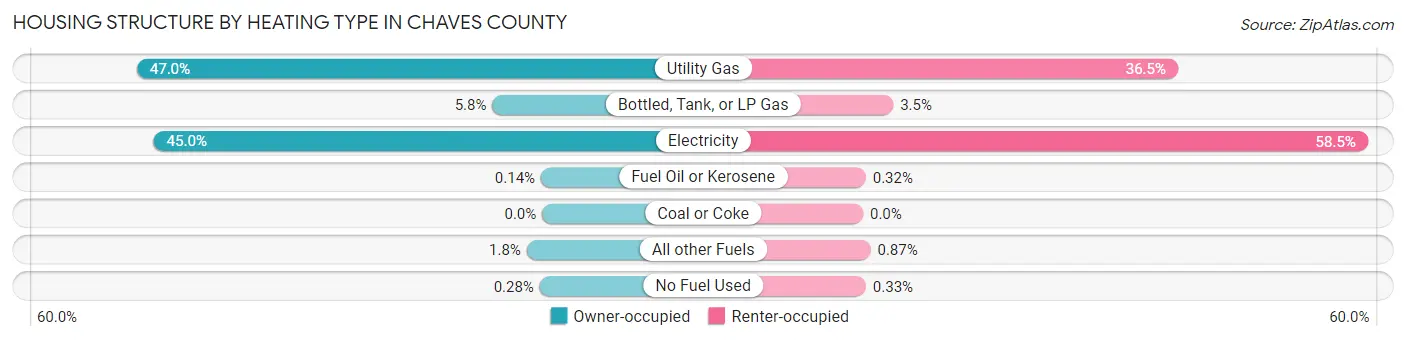
| Heating Type | Owner-occupied | Renter-occupied |
| Utility Gas | 7,371 (47.0%) | 2,770 (36.5%) |
| Bottled, Tank, or LP Gas | 905 (5.8%) | 266 (3.5%) |
| Electricity | 7,065 (45.0%) | 4,441 (58.5%) |
| Fuel Oil or Kerosene | 22 (0.1%) | 24 (0.3%) |
| Coal or Coke | 0 (0.0%) | 0 (0.0%) |
| All other Fuels | 281 (1.8%) | 66 (0.9%) |
| No Fuel Used | 44 (0.3%) | 25 (0.3%) |
| Total | 15,688 (100.0%) | 7,592 (100.0%) |
Household Vehicle Usage in Chaves County
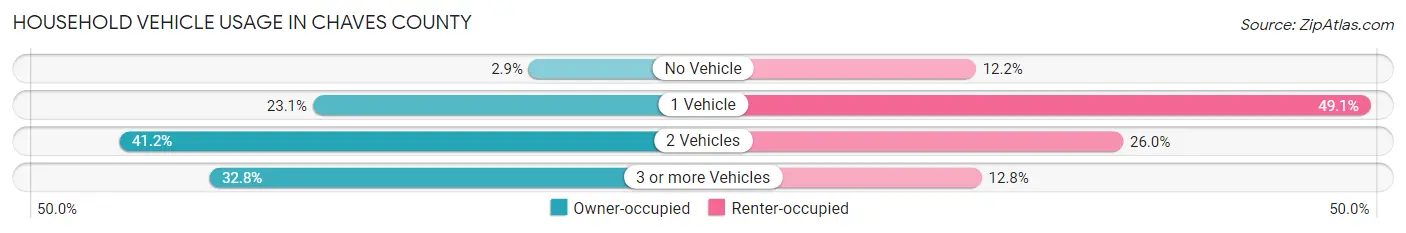
| Vehicles per Household | Owner-occupied | Renter-occupied |
| No Vehicle | 459 (2.9%) | 927 (12.2%) |
| 1 Vehicle | 3,623 (23.1%) | 3,725 (49.1%) |
| 2 Vehicles | 6,462 (41.2%) | 1,971 (26.0%) |
| 3 or more Vehicles | 5,144 (32.8%) | 969 (12.8%) |
| Total | 15,688 (100.0%) | 7,592 (100.0%) |
Real Estate & Mortgages in Chaves County
Real Estate and Mortgage Overview in Chaves County
| Characteristic | Without Mortgage | With Mortgage |
| Housing Units | 8,713 | 6,975 |
| Median Property Value | $113,300 | $160,700 |
| Median Household Income | $47,304 | $1,198 |
| Monthly Housing Costs | $400 | $208 |
| Real Estate Taxes | $620 | $551 |
Property Value by Mortgage Status in Chaves County
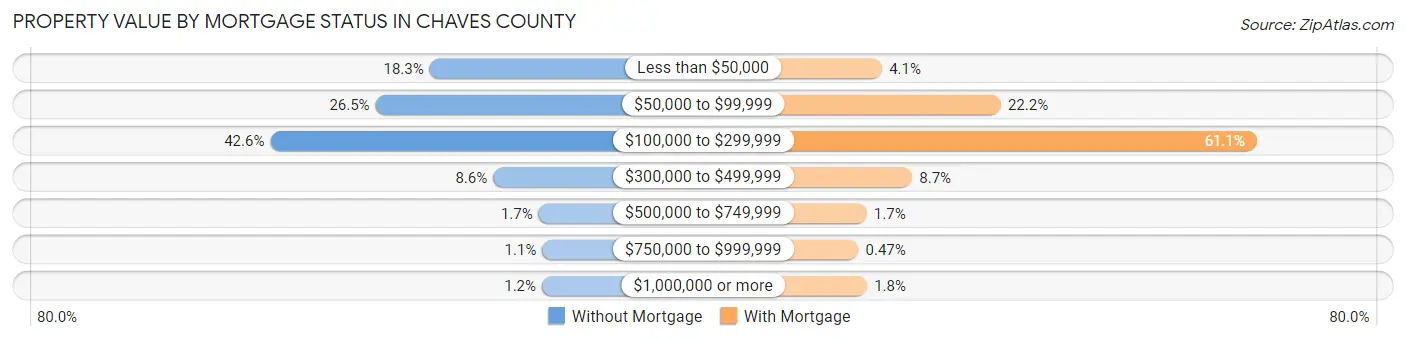
| Property Value | Without Mortgage | With Mortgage |
| Less than $50,000 | 1,594 (18.3%) | 284 (4.1%) |
| $50,000 to $99,999 | 2,312 (26.5%) | 1,546 (22.2%) |
| $100,000 to $299,999 | 3,709 (42.6%) | 4,264 (61.1%) |
| $300,000 to $499,999 | 751 (8.6%) | 603 (8.6%) |
| $500,000 to $749,999 | 146 (1.7%) | 121 (1.7%) |
| $750,000 to $999,999 | 98 (1.1%) | 33 (0.5%) |
| $1,000,000 or more | 103 (1.2%) | 124 (1.8%) |
| Total | 8,713 (100.0%) | 6,975 (100.0%) |
Household Income by Mortgage Status in Chaves County
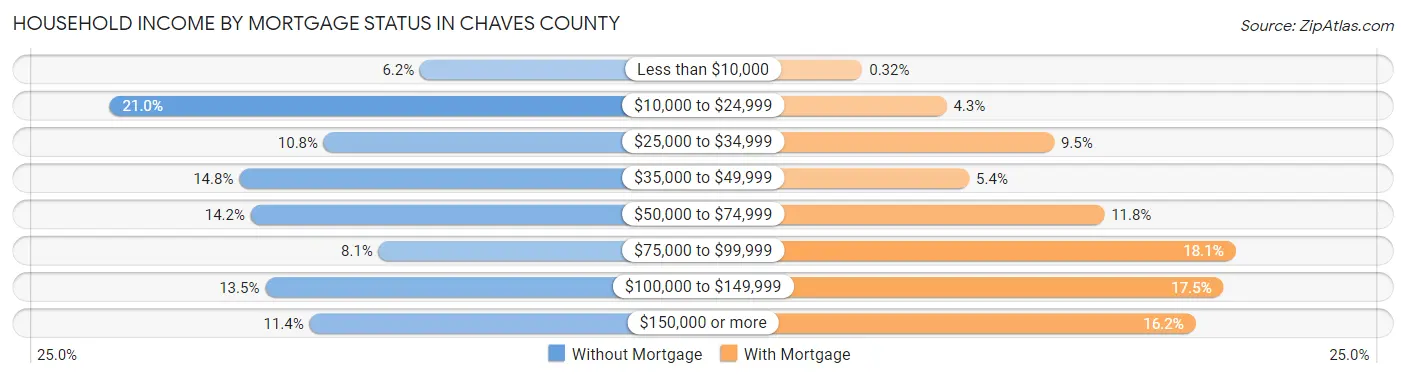
| Household Income | Without Mortgage | With Mortgage |
| Less than $10,000 | 538 (6.2%) | 22 (0.3%) |
| $10,000 to $24,999 | 1,825 (20.9%) | 302 (4.3%) |
| $25,000 to $34,999 | 937 (10.7%) | 659 (9.5%) |
| $35,000 to $49,999 | 1,288 (14.8%) | 377 (5.4%) |
| $50,000 to $74,999 | 1,240 (14.2%) | 826 (11.8%) |
| $75,000 to $99,999 | 709 (8.1%) | 1,262 (18.1%) |
| $100,000 to $149,999 | 1,180 (13.5%) | 1,222 (17.5%) |
| $150,000 or more | 996 (11.4%) | 1,129 (16.2%) |
| Total | 8,713 (100.0%) | 6,975 (100.0%) |
Property Value to Household Income Ratio in Chaves County
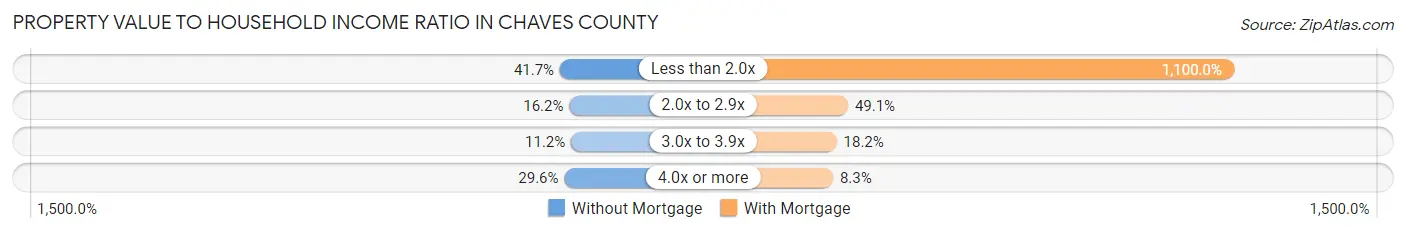
| Value-to-Income Ratio | Without Mortgage | With Mortgage |
| Less than 2.0x | 3,630 (41.7%) | 76,728 (1,100.0%) |
| 2.0x to 2.9x | 1,410 (16.2%) | 3,422 (49.1%) |
| 3.0x to 3.9x | 974 (11.2%) | 1,271 (18.2%) |
| 4.0x or more | 2,580 (29.6%) | 577 (8.3%) |
| Total | 8,713 (100.0%) | 6,975 (100.0%) |
Real Estate Taxes by Mortgage Status in Chaves County
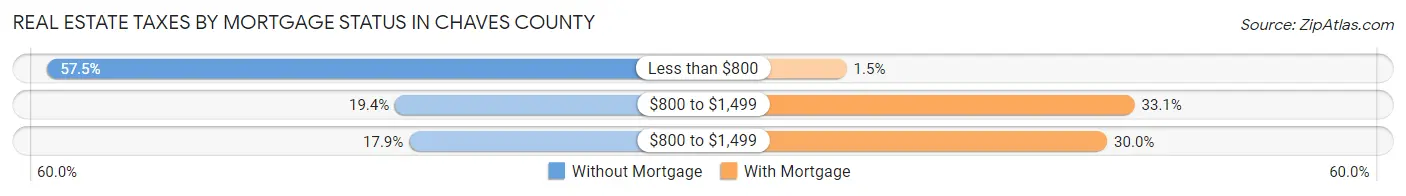
| Property Taxes | Without Mortgage | With Mortgage |
| Less than $800 | 5,011 (57.5%) | 104 (1.5%) |
| $800 to $1,499 | 1,690 (19.4%) | 2,305 (33.1%) |
| $800 to $1,499 | 1,556 (17.9%) | 2,095 (30.0%) |
| Total | 8,713 (100.0%) | 6,975 (100.0%) |
Health & Disability in Chaves County
Health Insurance Coverage by Age in Chaves County
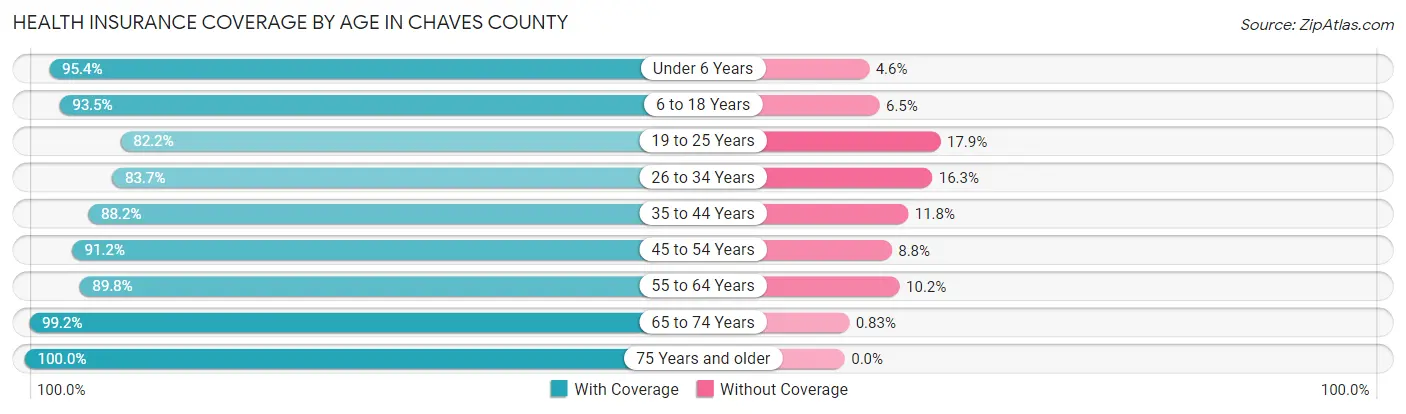
| Age Bracket | With Coverage | Without Coverage |
| Under 6 Years | 4,833 (95.4%) | 231 (4.6%) |
| 6 to 18 Years | 11,471 (93.5%) | 795 (6.5%) |
| 19 to 25 Years | 5,233 (82.2%) | 1,137 (17.8%) |
| 26 to 34 Years | 6,128 (83.7%) | 1,194 (16.3%) |
| 35 to 44 Years | 6,989 (88.2%) | 939 (11.8%) |
| 45 to 54 Years | 6,423 (91.2%) | 617 (8.8%) |
| 55 to 64 Years | 6,816 (89.8%) | 776 (10.2%) |
| 65 to 74 Years | 5,871 (99.2%) | 49 (0.8%) |
| 75 Years and older | 4,065 (100.0%) | 0 (0.0%) |
| Total | 57,829 (91.0%) | 5,738 (9.0%) |
Health Insurance Coverage by Citizenship Status in Chaves County
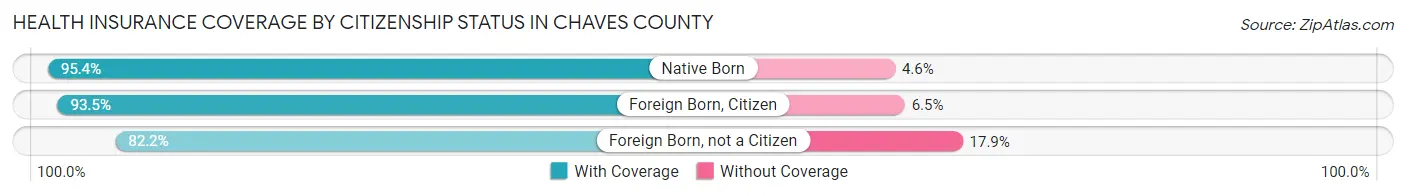
| Citizenship Status | With Coverage | Without Coverage |
| Native Born | 4,833 (95.4%) | 231 (4.6%) |
| Foreign Born, Citizen | 11,471 (93.5%) | 795 (6.5%) |
| Foreign Born, not a Citizen | 5,233 (82.2%) | 1,137 (17.8%) |
Health Insurance Coverage by Household Income in Chaves County
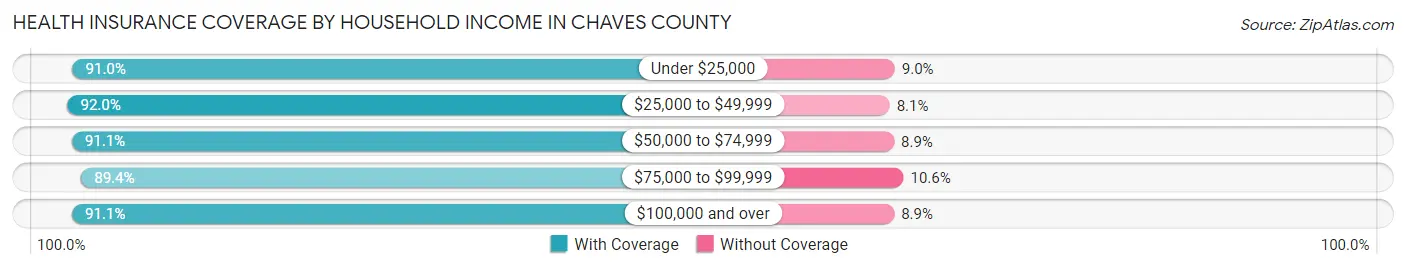
| Household Income | With Coverage | Without Coverage |
| Under $25,000 | 10,898 (91.0%) | 1,078 (9.0%) |
| $25,000 to $49,999 | 13,145 (91.9%) | 1,151 (8.1%) |
| $50,000 to $74,999 | 10,377 (91.1%) | 1,010 (8.9%) |
| $75,000 to $99,999 | 6,875 (89.4%) | 818 (10.6%) |
| $100,000 and over | 15,304 (91.1%) | 1,494 (8.9%) |
Public vs Private Health Insurance Coverage by Age in Chaves County
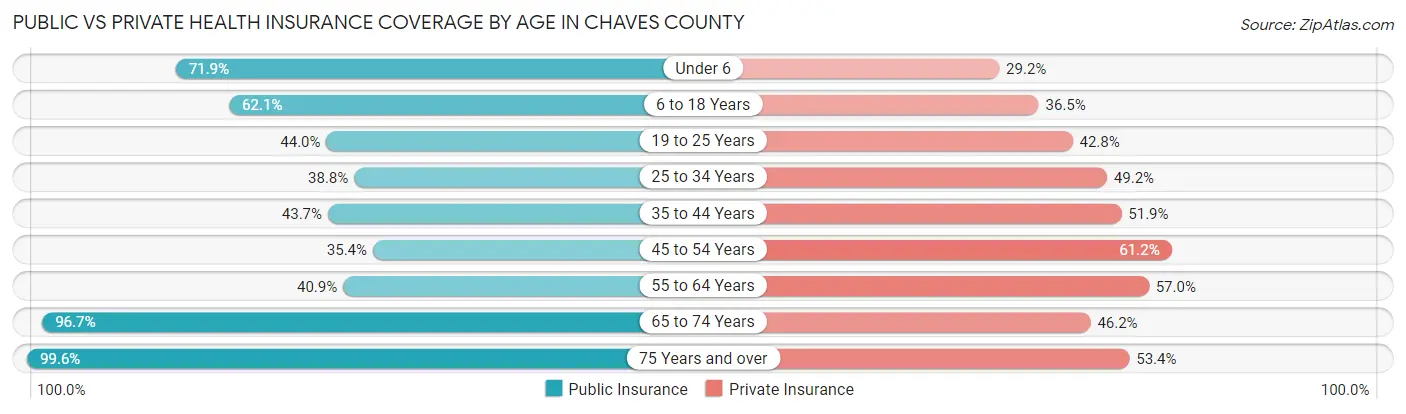
| Age Bracket | Public Insurance | Private Insurance |
| Under 6 | 3,643 (71.9%) | 1,479 (29.2%) |
| 6 to 18 Years | 7,612 (62.1%) | 4,481 (36.5%) |
| 19 to 25 Years | 2,802 (44.0%) | 2,728 (42.8%) |
| 25 to 34 Years | 2,844 (38.8%) | 3,603 (49.2%) |
| 35 to 44 Years | 3,465 (43.7%) | 4,114 (51.9%) |
| 45 to 54 Years | 2,489 (35.4%) | 4,308 (61.2%) |
| 55 to 64 Years | 3,105 (40.9%) | 4,325 (57.0%) |
| 65 to 74 Years | 5,726 (96.7%) | 2,732 (46.2%) |
| 75 Years and over | 4,047 (99.6%) | 2,169 (53.4%) |
| Total | 35,733 (56.2%) | 29,939 (47.1%) |
Disability Status by Sex by Age in Chaves County
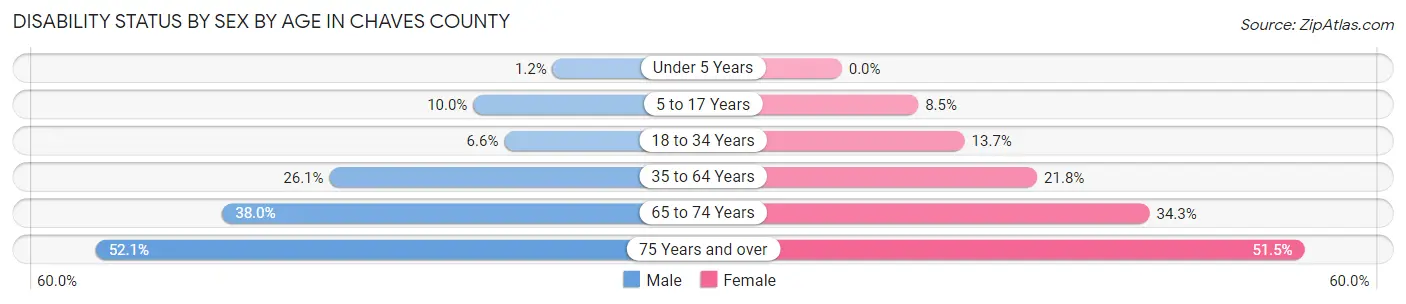
| Age Bracket | Male | Female |
| Under 5 Years | 24 (1.2%) | 0 (0.0%) |
| 5 to 17 Years | 644 (10.0%) | 504 (8.5%) |
| 18 to 34 Years | 509 (6.6%) | 946 (13.7%) |
| 35 to 64 Years | 2,854 (26.1%) | 2,526 (21.8%) |
| 65 to 74 Years | 1,098 (38.0%) | 1,038 (34.3%) |
| 75 Years and over | 915 (52.1%) | 1,189 (51.5%) |
Disability Class by Sex by Age in Chaves County
Disability Class: Hearing Difficulty
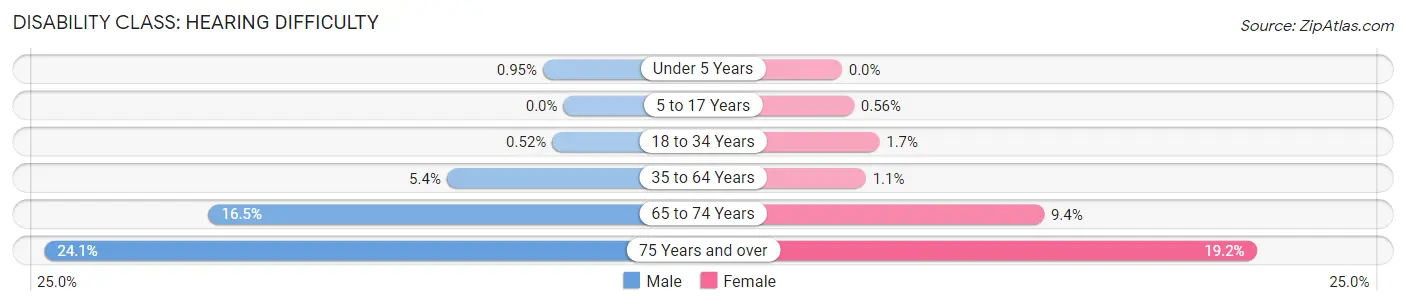
| Age Bracket | Male | Female |
| Under 5 Years | 19 (0.9%) | 0 (0.0%) |
| 5 to 17 Years | 0 (0.0%) | 33 (0.6%) |
| 18 to 34 Years | 40 (0.5%) | 120 (1.7%) |
| 35 to 64 Years | 593 (5.4%) | 129 (1.1%) |
| 65 to 74 Years | 476 (16.5%) | 284 (9.4%) |
| 75 Years and over | 423 (24.1%) | 444 (19.2%) |
Disability Class: Vision Difficulty
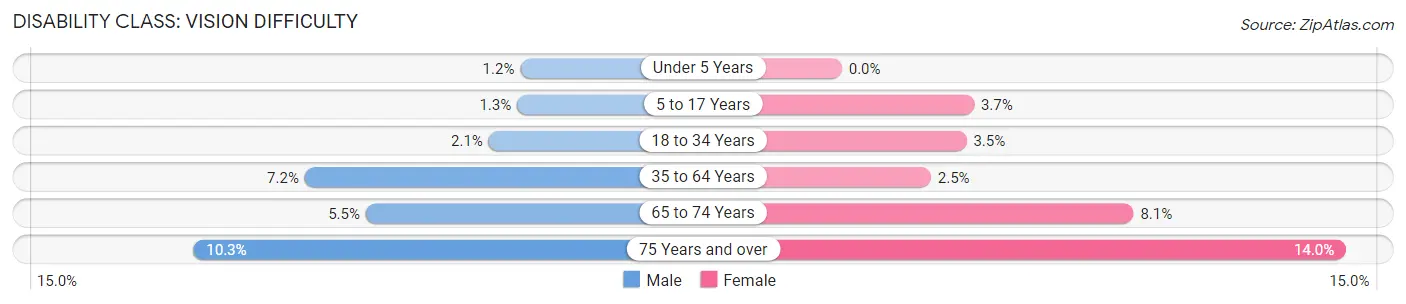
| Age Bracket | Male | Female |
| Under 5 Years | 24 (1.2%) | 0 (0.0%) |
| 5 to 17 Years | 83 (1.3%) | 218 (3.7%) |
| 18 to 34 Years | 161 (2.1%) | 240 (3.5%) |
| 35 to 64 Years | 789 (7.2%) | 288 (2.5%) |
| 65 to 74 Years | 159 (5.5%) | 246 (8.1%) |
| 75 Years and over | 181 (10.3%) | 324 (14.0%) |
Disability Class: Cognitive Difficulty
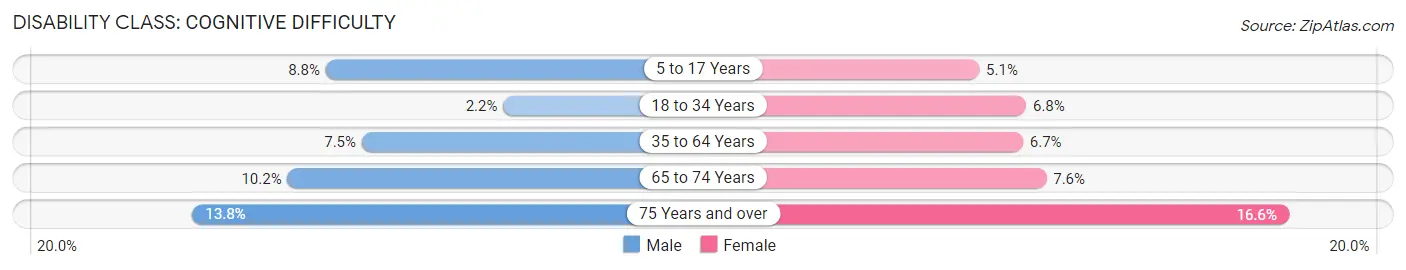
| Age Bracket | Male | Female |
| 5 to 17 Years | 566 (8.8%) | 302 (5.1%) |
| 18 to 34 Years | 172 (2.2%) | 473 (6.8%) |
| 35 to 64 Years | 819 (7.5%) | 780 (6.7%) |
| 65 to 74 Years | 296 (10.2%) | 230 (7.6%) |
| 75 Years and over | 242 (13.8%) | 383 (16.6%) |
Disability Class: Ambulatory Difficulty
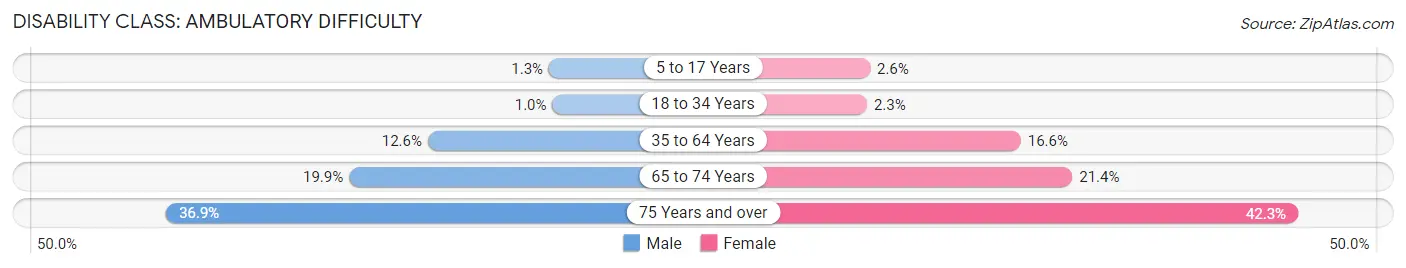
| Age Bracket | Male | Female |
| 5 to 17 Years | 86 (1.3%) | 155 (2.6%) |
| 18 to 34 Years | 79 (1.0%) | 162 (2.3%) |
| 35 to 64 Years | 1,378 (12.6%) | 1,928 (16.6%) |
| 65 to 74 Years | 575 (19.9%) | 648 (21.4%) |
| 75 Years and over | 648 (36.9%) | 977 (42.3%) |
Disability Class: Self-Care Difficulty
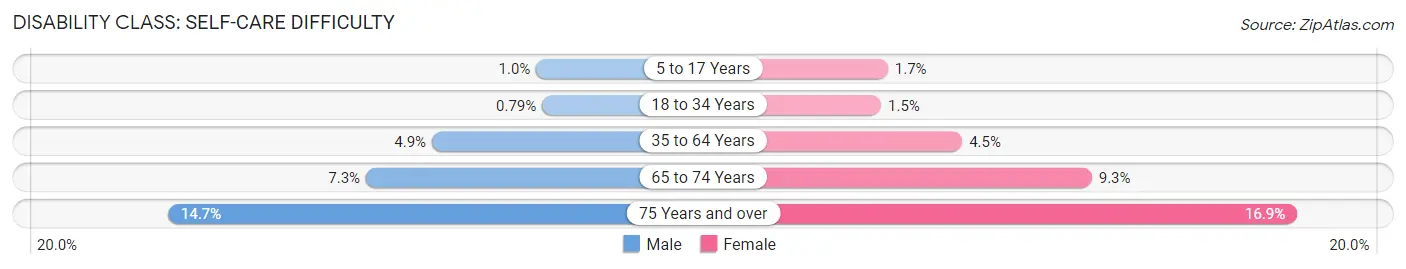
| Age Bracket | Male | Female |
| 5 to 17 Years | 65 (1.0%) | 101 (1.7%) |
| 18 to 34 Years | 61 (0.8%) | 101 (1.5%) |
| 35 to 64 Years | 535 (4.9%) | 519 (4.5%) |
| 65 to 74 Years | 212 (7.3%) | 281 (9.3%) |
| 75 Years and over | 258 (14.7%) | 390 (16.9%) |
Technology Access in Chaves County
Computing Device Access in Chaves County
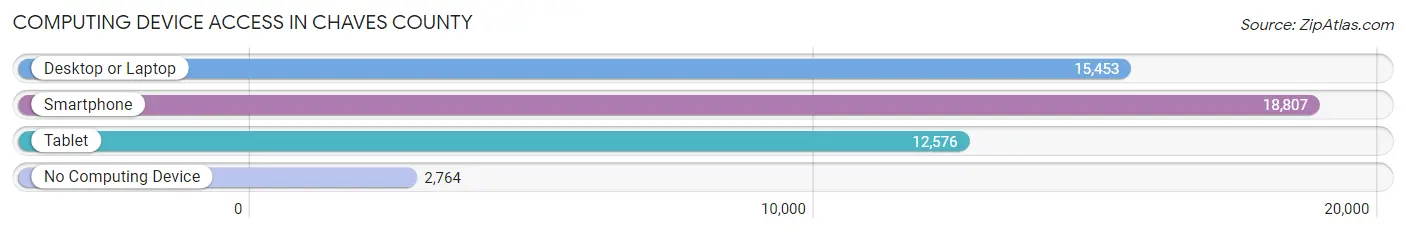
| Device Type | # Households | % Households |
| Desktop or Laptop | 15,453 | 66.4% |
| Smartphone | 18,807 | 80.8% |
| Tablet | 12,576 | 54.0% |
| No Computing Device | 2,764 | 11.9% |
| Total | 23,280 | 100.0% |
Internet Access in Chaves County
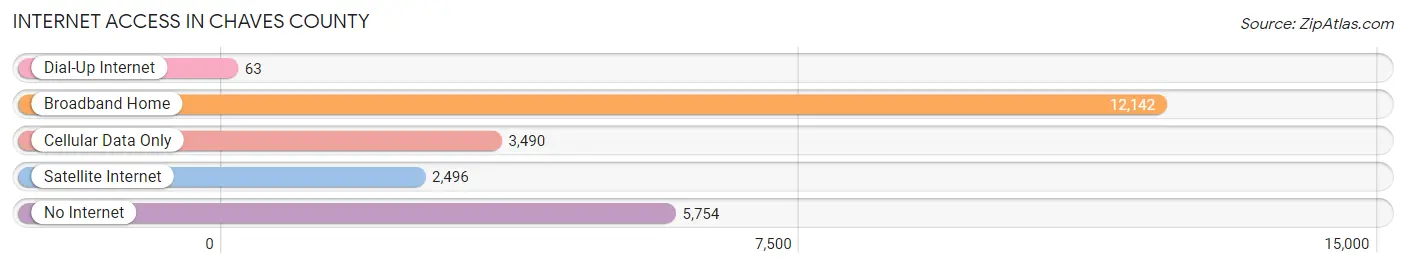
| Internet Type | # Households | % Households |
| Dial-Up Internet | 63 | 0.3% |
| Broadband Home | 12,142 | 52.2% |
| Cellular Data Only | 3,490 | 15.0% |
| Satellite Internet | 2,496 | 10.7% |
| No Internet | 5,754 | 24.7% |
| Total | 23,280 | 100.0% |
Chaves County Summary
Chaves County is located in the southeastern corner of New Mexico, and is bordered by Eddy County to the north, Lincoln County to the east, and Otero County to the south and west. The county seat is Roswell, which is the largest city in the county. Chaves County is part of the Roswell, NM Metropolitan Statistical Area.
History
Chaves County was established in 1889, and was named after Colonel Jose Francisco Chaves, a prominent figure in the history of New Mexico. The county was originally part of Lincoln County, but was split off in 1891. The county was further divided in 1903, when Eddy County was created.
The county has a rich history, and was home to several Native American tribes, including the Mescalero Apache, the Jicarilla Apache, and the Comanche. The first Europeans to settle in the area were Spanish explorers, who arrived in the late 1700s. The area was later settled by American pioneers, who established several small towns and ranches.
Geography
Chaves County covers an area of 5,845 square miles, making it the fourth largest county in New Mexico. The county is located in the southeastern corner of the state, and is bordered by Eddy County to the north, Lincoln County to the east, and Otero County to the south and west. The county is mostly flat, with some rolling hills in the western part of the county. The Pecos River runs through the county, and is a major source of water for the area.
The county is home to several state parks, including Bottomless Lakes State Park, Bitter Lake National Wildlife Refuge, and Sumner Lake State Park. The county also contains several wildlife refuges, including the Bitter Lake National Wildlife Refuge, the Sumner Lake National Wildlife Refuge, and the White Sands National Monument.
Economy
The economy of Chaves County is largely based on agriculture, with the county being one of the top producers of cotton, pecans, and peanuts in the state. The county is also home to several oil and gas fields, and is a major producer of natural gas. The county is also home to several manufacturing companies, including a large dairy processing plant.
The county is home to several military installations, including the Roswell Air Force Base, the White Sands Missile Range, and the Holloman Air Force Base. These installations provide a significant boost to the local economy.
Demographics
As of the 2010 census, the population of Chaves County was 64,645. The population is largely white (77.3%), with a significant Hispanic population (20.2%). The median household income in the county is $41,945, and the median home value is $117,400. The unemployment rate in the county is 6.2%.
Conclusion
Chaves County is a large county located in the southeastern corner of New Mexico. The county has a rich history, and is home to several Native American tribes. The economy of the county is largely based on agriculture, with the county being one of the top producers of cotton, pecans, and peanuts in the state. The county is also home to several military installations, which provide a significant boost to the local economy. The population of the county is largely white, with a significant Hispanic population. The median household income in the county is $41,945, and the median home value is $117,400.
Common Questions
What is Per Capita Income in Chaves County?
Per Capita income in Chaves County is $26,568.
What is the Median Family Income in Chaves County?
Median Family Income in Chaves County is $61,221.
What is the Median Household income in Chaves County?
Median Household Income in Chaves County is $49,673.
What is Income or Wage Gap in Chaves County?
Income or Wage Gap in Chaves County is 35.0%.
Women in Chaves County earn 65.0 cents for every dollar earned by a man.
What is Family Income Deficit in Chaves County?
Family Income Deficit in Chaves County is $11,501.
Families that are below poverty line in Chaves County earn $11,501 less on average than the poverty threshold level.
What is Inequality or Gini Index in Chaves County?
Inequality or Gini Index in Chaves County is 0.47.
What is the Total Population of Chaves County?
Total Population of Chaves County is 64,701.
What is the Total Male Population of Chaves County?
Total Male Population of Chaves County is 32,652.
What is the Total Female Population of Chaves County?
Total Female Population of Chaves County is 32,049.
What is the Ratio of Males per 100 Females in Chaves County?
There are 101.88 Males per 100 Females in Chaves County.
What is the Ratio of Females per 100 Males in Chaves County?
There are 98.15 Females per 100 Males in Chaves County.
What is the Median Population Age in Chaves County?
Median Population Age in Chaves County is 36.2 Years.
What is the Average Family Size in Chaves County
Average Family Size in Chaves County is 3.3 People.
What is the Average Household Size in Chaves County
Average Household Size in Chaves County is 2.7 People.
How Large is the Labor Force in Chaves County?
There are 28,127 People in the Labor Forcein in Chaves County.
What is the Percentage of People in the Labor Force in Chaves County?
56.1% of People are in the Labor Force in Chaves County.
What is the Unemployment Rate in Chaves County?
Unemployment Rate in Chaves County is 5.3%.