Dona Ana County, NM Map & Demographics
Dona Ana County Overview
$26,900
PER CAPITA INCOME
$58,875
AVG FAMILY INCOME
$51,232
AVG HOUSEHOLD INCOME
23.5%
WAGE / INCOME GAP [ % ]
76.5¢/ $1
WAGE / INCOME GAP [ $ ]
$10,474
FAMILY INCOME DEFICIT
0.48
INEQUALITY / GINI INDEX
219,870
TOTAL POPULATION
108,834
MALE POPULATION
111,036
FEMALE POPULATION
98.02
MALES / 100 FEMALES
102.02
FEMALES / 100 MALES
33.2
MEDIAN AGE
3.2
AVG FAMILY SIZE
2.6
AVG HOUSEHOLD SIZE
99,804
LABOR FORCE [ PEOPLE ]
57.4%
PERCENT IN LABOR FORCE
6.8%
UNEMPLOYMENT RATE
Income in Dona Ana County
Income Overview in Dona Ana County
Per Capita Income in Dona Ana County is $26,900, while median incomes of families and households are $58,875 and $51,232 respectively.
| Characteristic | Number | Measure |
| Per Capita Income | 219,870 | $26,900 |
| Median Family Income | 52,351 | $58,875 |
| Mean Family Income | 52,351 | $80,827 |
| Median Household Income | 81,969 | $51,232 |
| Mean Household Income | 81,969 | $70,278 |
| Income Deficit | 52,351 | $10,474 |
| Wage / Income Gap (%) | 219,870 | 23.53% |
| Wage / Income Gap ($) | 219,870 | 76.47¢ per $1 |
| Gini / Inequality Index | 219,870 | 0.48 |
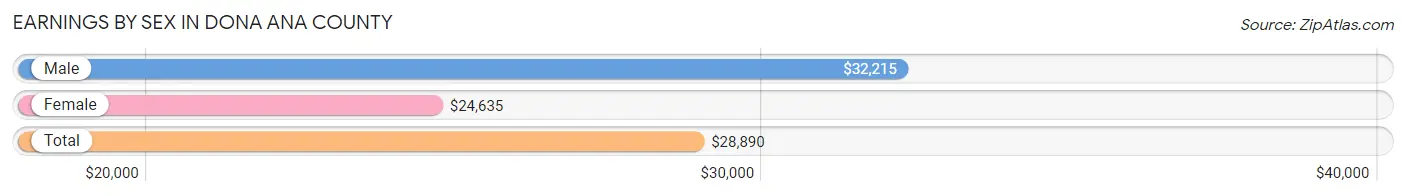
Earnings by Sex in Dona Ana County
Average Earnings in Dona Ana County are $28,890, $32,215 for men and $24,635 for women, a difference of 23.5%.
| Sex | Number | Average Earnings |
| Male | 54,738 (53.2%) | $32,215 |
| Female | 48,067 (46.8%) | $24,635 |
| Total | 102,805 (100.0%) | $28,890 |
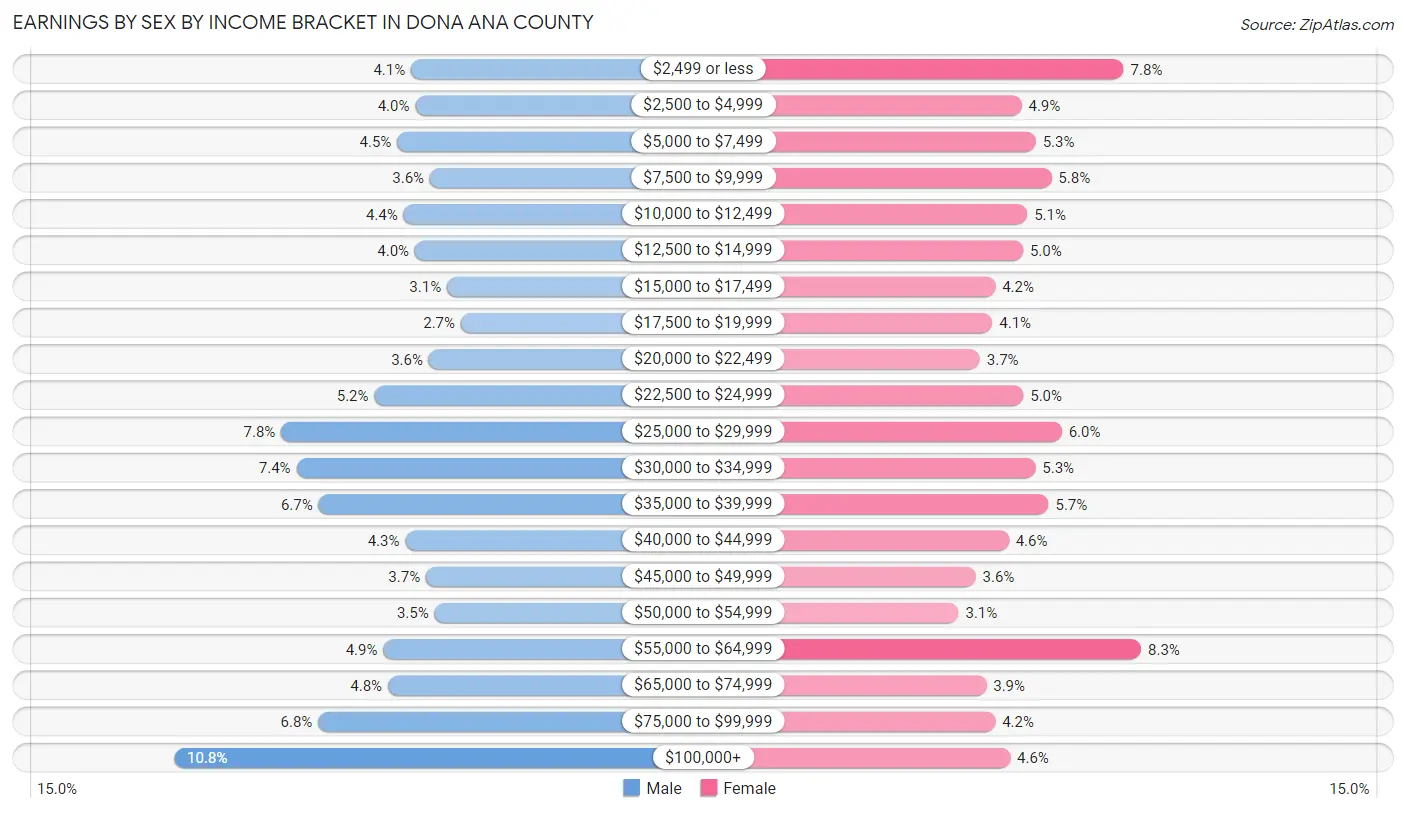
Earnings by Sex by Income Bracket in Dona Ana County
The most common earnings brackets in Dona Ana County are $100,000+ for men (5,910 | 10.8%) and $55,000 to $64,999 for women (3,975 | 8.3%).
| Income | Male | Female |
| $2,499 or less | 2,265 (4.1%) | 3,741 (7.8%) |
| $2,500 to $4,999 | 2,201 (4.0%) | 2,361 (4.9%) |
| $5,000 to $7,499 | 2,479 (4.5%) | 2,554 (5.3%) |
| $7,500 to $9,999 | 1,976 (3.6%) | 2,763 (5.8%) |
| $10,000 to $12,499 | 2,382 (4.3%) | 2,435 (5.1%) |
| $12,500 to $14,999 | 2,205 (4.0%) | 2,377 (5.0%) |
| $15,000 to $17,499 | 1,713 (3.1%) | 2,003 (4.2%) |
| $17,500 to $19,999 | 1,499 (2.7%) | 1,964 (4.1%) |
| $20,000 to $22,499 | 1,991 (3.6%) | 1,800 (3.7%) |
| $22,500 to $24,999 | 2,832 (5.2%) | 2,384 (5.0%) |
| $25,000 to $29,999 | 4,266 (7.8%) | 2,905 (6.0%) |
| $30,000 to $34,999 | 4,026 (7.4%) | 2,548 (5.3%) |
| $35,000 to $39,999 | 3,692 (6.7%) | 2,726 (5.7%) |
| $40,000 to $44,999 | 2,354 (4.3%) | 2,185 (4.5%) |
| $45,000 to $49,999 | 2,035 (3.7%) | 1,742 (3.6%) |
| $50,000 to $54,999 | 1,904 (3.5%) | 1,507 (3.1%) |
| $55,000 to $64,999 | 2,692 (4.9%) | 3,975 (8.3%) |
| $65,000 to $74,999 | 2,620 (4.8%) | 1,885 (3.9%) |
| $75,000 to $99,999 | 3,696 (6.8%) | 2,005 (4.2%) |
| $100,000+ | 5,910 (10.8%) | 2,207 (4.6%) |
| Total | 54,738 (100.0%) | 48,067 (100.0%) |
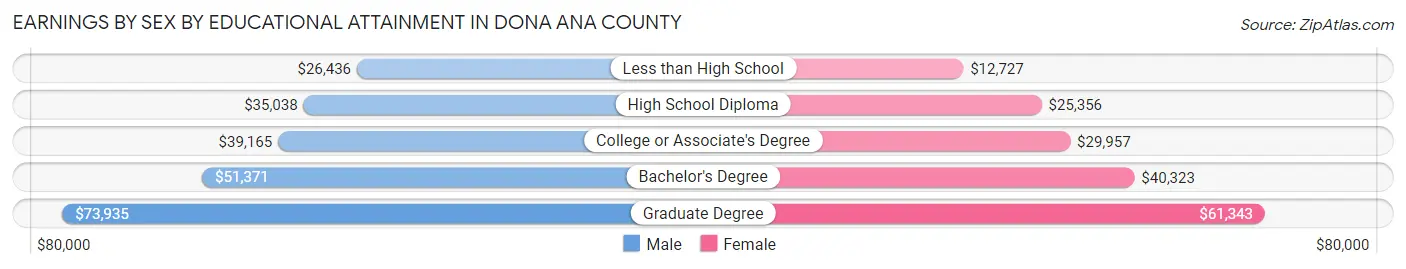
Earnings by Sex by Educational Attainment in Dona Ana County
Average earnings in Dona Ana County are $38,523 for men and $33,559 for women, a difference of 12.9%. Men with an educational attainment of graduate degree enjoy the highest average annual earnings of $73,935, while those with less than high school education earn the least with $26,436. Women with an educational attainment of graduate degree earn the most with the average annual earnings of $61,343, while those with less than high school education have the smallest earnings of $12,727.
| Educational Attainment | Male Income | Female Income |
| Less than High School | $26,436 | $12,727 |
| High School Diploma | $35,038 | $25,356 |
| College or Associate's Degree | $39,165 | $29,957 |
| Bachelor's Degree | $51,371 | $40,323 |
| Graduate Degree | $73,935 | $61,343 |
| Total | $38,523 | $33,559 |
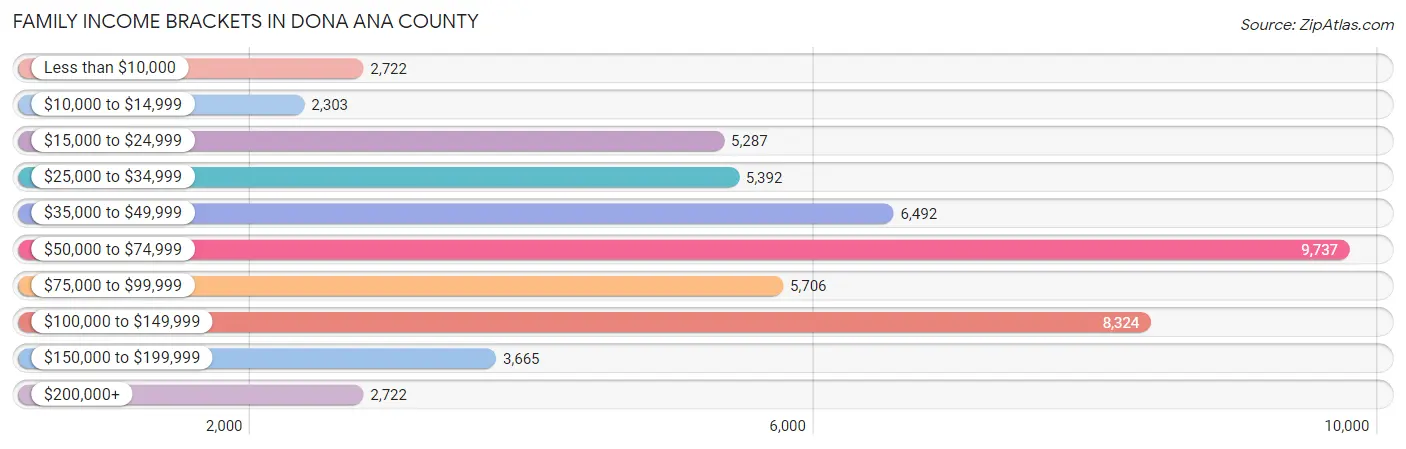
Family Income in Dona Ana County
Family Income Brackets in Dona Ana County
According to the Dona Ana County family income data, there are 9,737 families falling into the $50,000 to $74,999 income range, which is the most common income bracket and makes up 18.6% of all families. Conversely, the $10,000 to $14,999 income bracket is the least frequent group with only 2,303 families (4.4%) belonging to this category.
| Income Bracket | # Families | % Families |
| Less than $10,000 | 2,722 | 5.2% |
| $10,000 to $14,999 | 2,303 | 4.4% |
| $15,000 to $24,999 | 5,287 | 10.1% |
| $25,000 to $34,999 | 5,392 | 10.3% |
| $35,000 to $49,999 | 6,492 | 12.4% |
| $50,000 to $74,999 | 9,737 | 18.6% |
| $75,000 to $99,999 | 5,706 | 10.9% |
| $100,000 to $149,999 | 8,324 | 15.9% |
| $150,000 to $199,999 | 3,665 | 7.0% |
| $200,000+ | 2,722 | 5.2% |
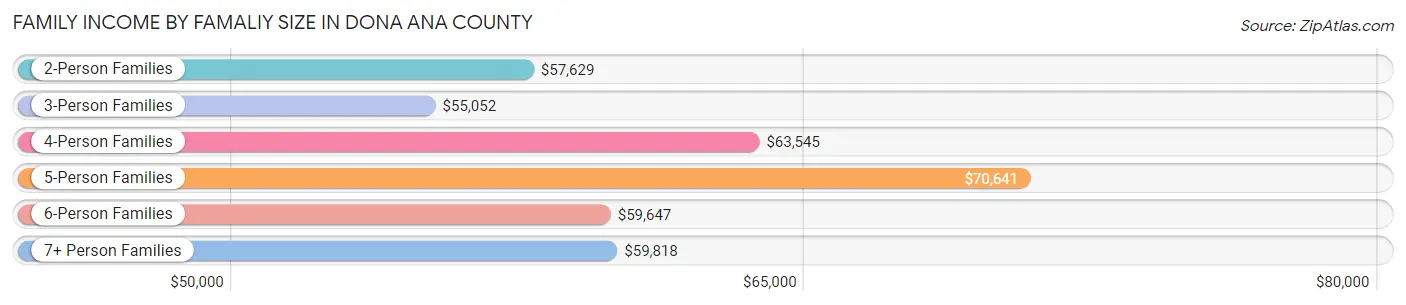
Family Income by Famaliy Size in Dona Ana County
5-person families (4,938 | 9.4%) account for the highest median family income in Dona Ana County with $70,641 per family, while 2-person families (24,028 | 45.9%) have the highest median income of $28,814 per family member.
| Income Bracket | # Families | Median Income |
| 2-Person Families | 24,028 (45.9%) | $57,629 |
| 3-Person Families | 11,835 (22.6%) | $55,052 |
| 4-Person Families | 8,938 (17.1%) | $63,545 |
| 5-Person Families | 4,938 (9.4%) | $70,641 |
| 6-Person Families | 1,582 (3.0%) | $59,647 |
| 7+ Person Families | 1,030 (2.0%) | $59,818 |
| Total | 52,351 (100.0%) | $58,875 |
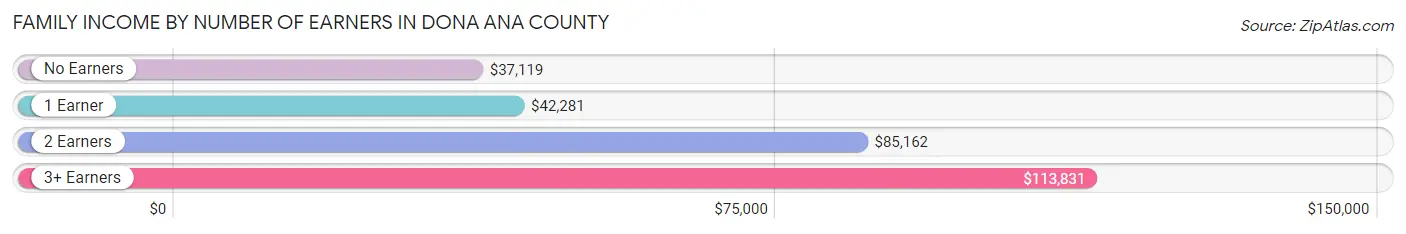
Family Income by Number of Earners in Dona Ana County
The median family income in Dona Ana County is $58,875, with families comprising 3+ earners (4,256) having the highest median family income of $113,831, while families with no earners (10,218) have the lowest median family income of $37,119, accounting for 8.1% and 19.5% of families, respectively.
| Number of Earners | # Families | Median Income |
| No Earners | 10,218 (19.5%) | $37,119 |
| 1 Earner | 20,925 (40.0%) | $42,281 |
| 2 Earners | 16,952 (32.4%) | $85,162 |
| 3+ Earners | 4,256 (8.1%) | $113,831 |
| Total | 52,351 (100.0%) | $58,875 |
Household Income in Dona Ana County
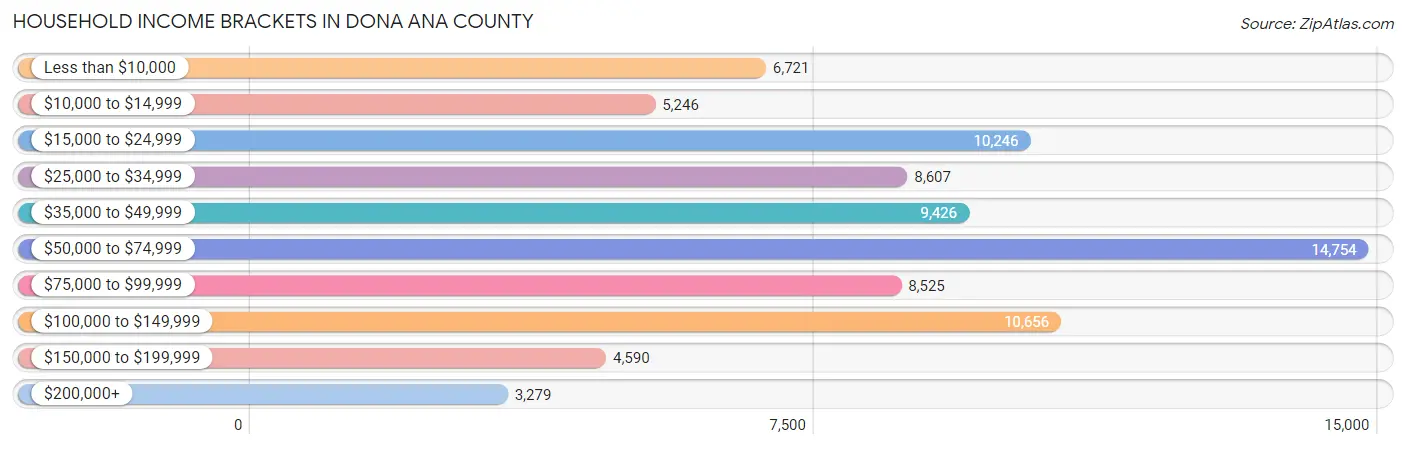
Household Income Brackets in Dona Ana County
With 14,754 households falling in the category, the $50,000 to $74,999 income range is the most frequent in Dona Ana County, accounting for 18.0% of all households. In contrast, only 3,279 households (4.0%) fall into the $200,000+ income bracket, making it the least populous group.
| Income Bracket | # Households | % Households |
| Less than $10,000 | 6,721 | 8.2% |
| $10,000 to $14,999 | 5,246 | 6.4% |
| $15,000 to $24,999 | 10,246 | 12.5% |
| $25,000 to $34,999 | 8,607 | 10.5% |
| $35,000 to $49,999 | 9,426 | 11.5% |
| $50,000 to $74,999 | 14,754 | 18.0% |
| $75,000 to $99,999 | 8,525 | 10.4% |
| $100,000 to $149,999 | 10,656 | 13.0% |
| $150,000 to $199,999 | 4,590 | 5.6% |
| $200,000+ | 3,279 | 4.0% |
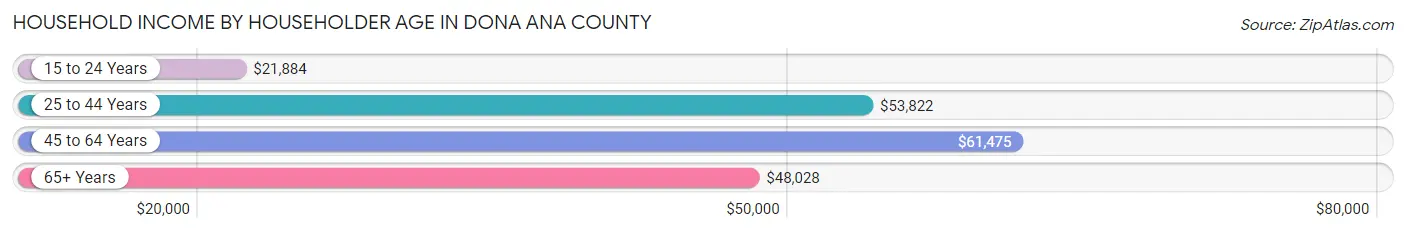
Household Income by Householder Age in Dona Ana County
The median household income in Dona Ana County is $51,232, with the highest median household income of $61,475 found in the 45 to 64 years age bracket for the primary householder. A total of 26,189 households (32.0%) fall into this category. Meanwhile, the 15 to 24 years age bracket for the primary householder has the lowest median household income of $21,884, with 7,385 households (9.0%) in this group.
| Income Bracket | # Households | Median Income |
| 15 to 24 Years | 7,385 (9.0%) | $21,884 |
| 25 to 44 Years | 26,528 (32.4%) | $53,822 |
| 45 to 64 Years | 26,189 (32.0%) | $61,475 |
| 65+ Years | 21,867 (26.7%) | $48,028 |
| Total | 81,969 (100.0%) | $51,232 |
Poverty in Dona Ana County
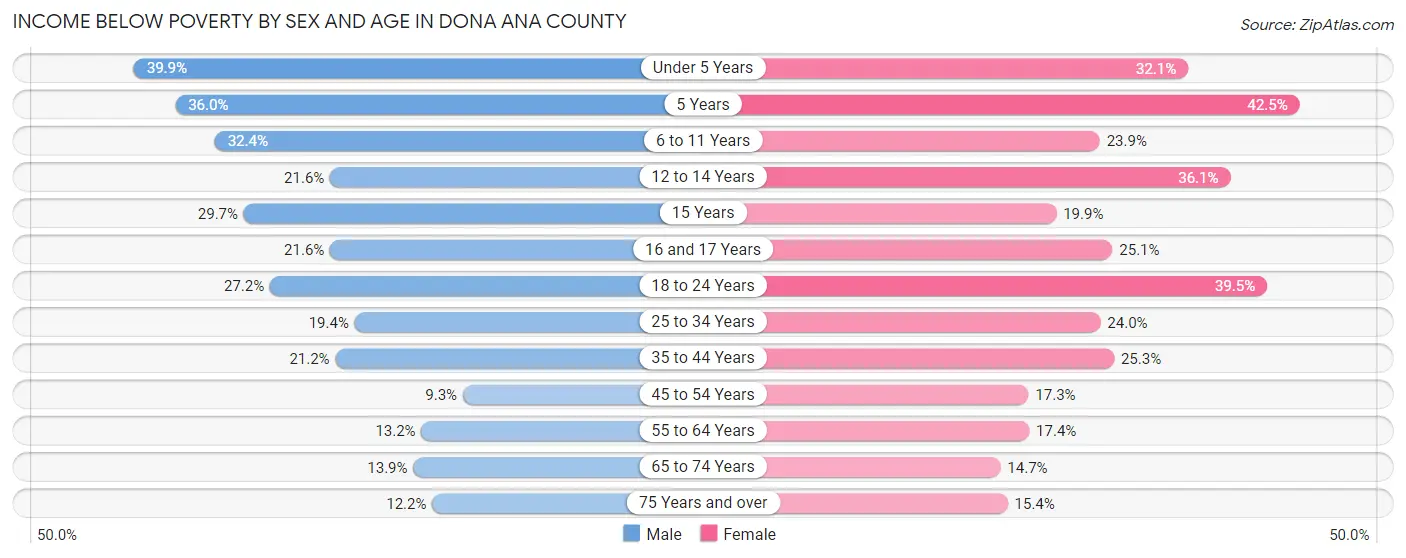
Income Below Poverty by Sex and Age in Dona Ana County
With 21.0% poverty level for males and 24.5% for females among the residents of Dona Ana County, under 5 year old males and 5 year old females are the most vulnerable to poverty, with 2,612 males (39.9%) and 494 females (42.5%) in their respective age groups living below the poverty level.
| Age Bracket | Male | Female |
| Under 5 Years | 2,612 (39.9%) | 2,030 (32.1%) |
| 5 Years | 501 (36.0%) | 494 (42.5%) |
| 6 to 11 Years | 2,800 (32.4%) | 2,094 (23.9%) |
| 12 to 14 Years | 1,079 (21.6%) | 1,679 (36.0%) |
| 15 Years | 475 (29.6%) | 239 (19.9%) |
| 16 and 17 Years | 682 (21.6%) | 812 (25.1%) |
| 18 to 24 Years | 4,046 (27.2%) | 5,997 (39.5%) |
| 25 to 34 Years | 2,764 (19.4%) | 3,268 (24.0%) |
| 35 to 44 Years | 2,562 (21.1%) | 3,069 (25.3%) |
| 45 to 54 Years | 947 (9.3%) | 1,966 (17.3%) |
| 55 to 64 Years | 1,458 (13.2%) | 2,207 (17.4%) |
| 65 to 74 Years | 1,368 (13.9%) | 1,546 (14.7%) |
| 75 Years and over | 804 (12.2%) | 1,233 (15.4%) |
| Total | 22,098 (21.0%) | 26,634 (24.5%) |
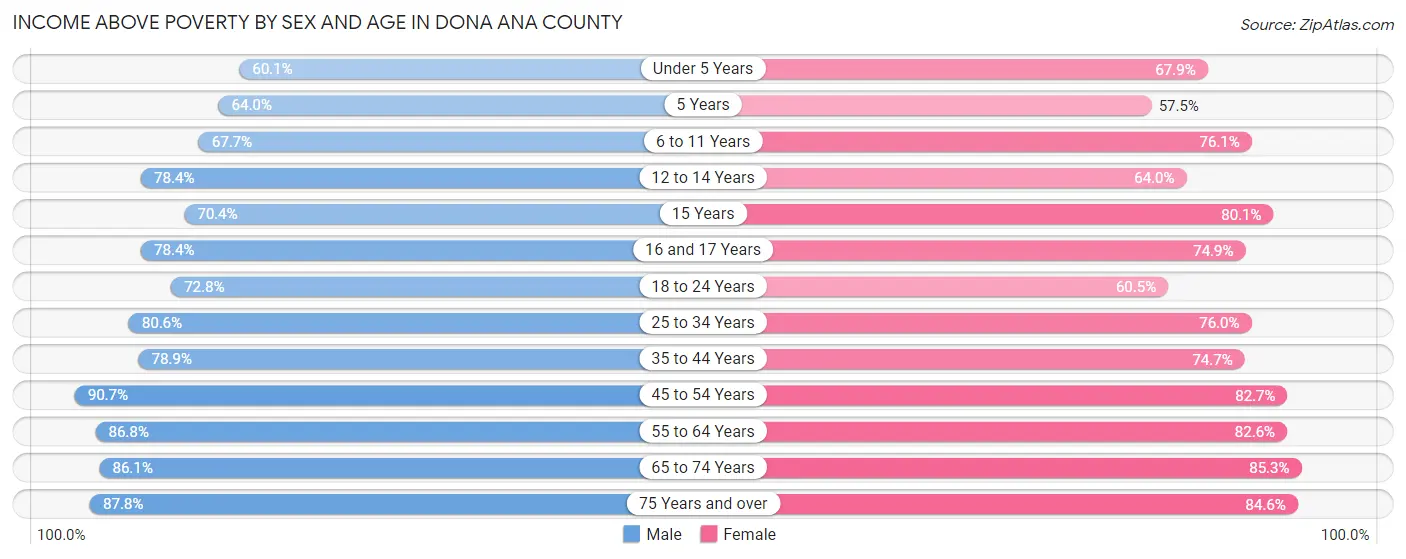
Income Above Poverty by Sex and Age in Dona Ana County
According to the poverty statistics in Dona Ana County, males aged 45 to 54 years and females aged 65 to 74 years are the age groups that are most secure financially, with 90.7% of males and 85.3% of females in these age groups living above the poverty line.
| Age Bracket | Male | Female |
| Under 5 Years | 3,941 (60.1%) | 4,289 (67.9%) |
| 5 Years | 890 (64.0%) | 669 (57.5%) |
| 6 to 11 Years | 5,855 (67.6%) | 6,654 (76.1%) |
| 12 to 14 Years | 3,908 (78.4%) | 2,978 (63.9%) |
| 15 Years | 1,127 (70.4%) | 962 (80.1%) |
| 16 and 17 Years | 2,470 (78.4%) | 2,422 (74.9%) |
| 18 to 24 Years | 10,820 (72.8%) | 9,199 (60.5%) |
| 25 to 34 Years | 11,514 (80.6%) | 10,350 (76.0%) |
| 35 to 44 Years | 9,552 (78.8%) | 9,083 (74.7%) |
| 45 to 54 Years | 9,217 (90.7%) | 9,387 (82.7%) |
| 55 to 64 Years | 9,614 (86.8%) | 10,482 (82.6%) |
| 65 to 74 Years | 8,460 (86.1%) | 8,957 (85.3%) |
| 75 Years and over | 5,806 (87.8%) | 6,778 (84.6%) |
| Total | 83,174 (79.0%) | 82,210 (75.5%) |
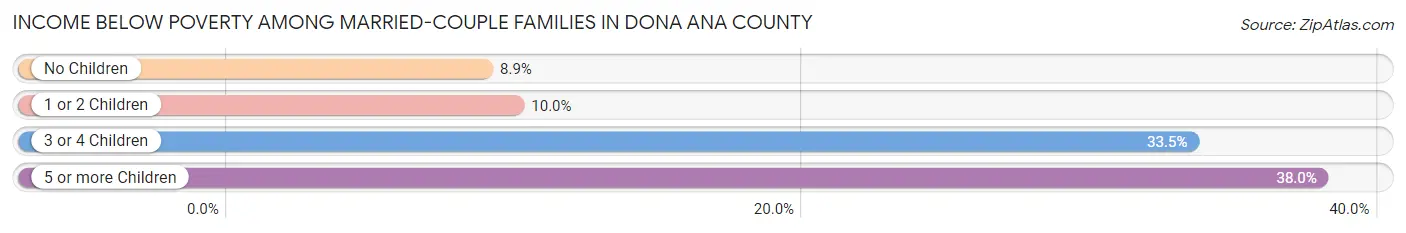
Income Below Poverty Among Married-Couple Families in Dona Ana County
The poverty statistics for married-couple families in Dona Ana County show that 12.1% or 4,157 of the total 34,476 families live below the poverty line. Families with 5 or more children have the highest poverty rate of 38.0%, comprising of 120 families. On the other hand, families with no children have the lowest poverty rate of 8.9%, which includes 1,837 families.
| Children | Above Poverty | Below Poverty |
| No Children | 18,856 (91.1%) | 1,837 (8.9%) |
| 1 or 2 Children | 8,839 (90.0%) | 979 (10.0%) |
| 3 or 4 Children | 2,428 (66.5%) | 1,221 (33.5%) |
| 5 or more Children | 196 (62.0%) | 120 (38.0%) |
| Total | 30,319 (87.9%) | 4,157 (12.1%) |
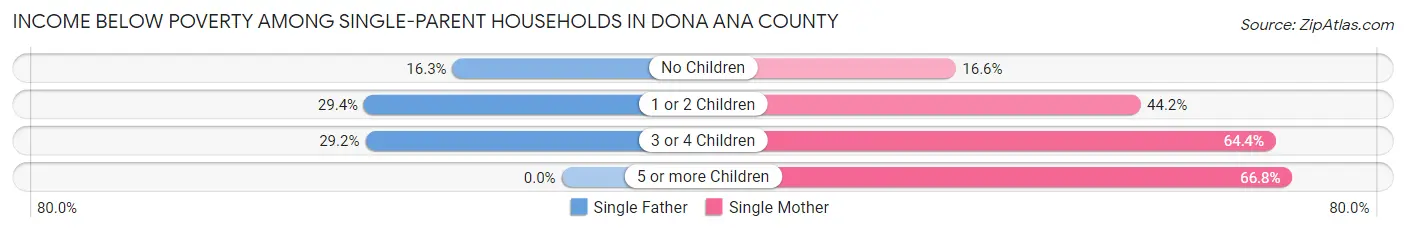
Income Below Poverty Among Single-Parent Households in Dona Ana County
According to the poverty data in Dona Ana County, 24.2% or 1,446 single-father households and 36.8% or 4,380 single-mother households are living below the poverty line. Among single-father households, those with 1 or 2 children have the highest poverty rate, with 862 households (29.4%) experiencing poverty. Likewise, among single-mother households, those with 5 or more children have the highest poverty rate, with 131 households (66.8%) falling below the poverty line.
| Children | Single Father | Single Mother |
| No Children | 379 (16.3%) | 702 (16.6%) |
| 1 or 2 Children | 862 (29.4%) | 2,800 (44.2%) |
| 3 or 4 Children | 205 (29.2%) | 747 (64.4%) |
| 5 or more Children | 0 (0.0%) | 131 (66.8%) |
| Total | 1,446 (24.2%) | 4,380 (36.8%) |
Income Below Poverty Among Married-Couple vs Single-Parent Households in Dona Ana County
The poverty data for Dona Ana County shows that 4,157 of the married-couple family households (12.1%) and 5,826 of the single-parent households (32.6%) are living below the poverty level. Within the married-couple family households, those with 5 or more children have the highest poverty rate, with 120 households (38.0%) falling below the poverty line. Among the single-parent households, those with 5 or more children have the highest poverty rate, with 131 household (66.8%) living below poverty.
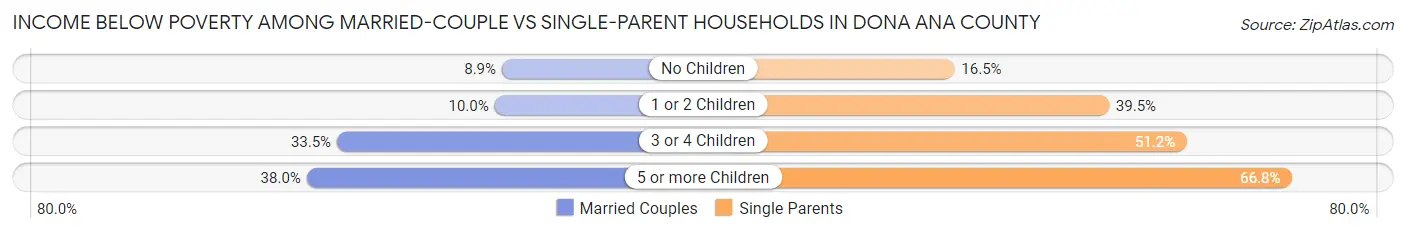
| Children | Married-Couple Families | Single-Parent Households |
| No Children | 1,837 (8.9%) | 1,081 (16.5%) |
| 1 or 2 Children | 979 (10.0%) | 3,662 (39.5%) |
| 3 or 4 Children | 1,221 (33.5%) | 952 (51.2%) |
| 5 or more Children | 120 (38.0%) | 131 (66.8%) |
| Total | 4,157 (12.1%) | 5,826 (32.6%) |
Race in Dona Ana County
The most populous races in Dona Ana County are Hispanic or Latino (151,592 | 69.0%), White / Caucasian (128,908 | 58.6%), and Some other Race (40,723 | 18.5%).
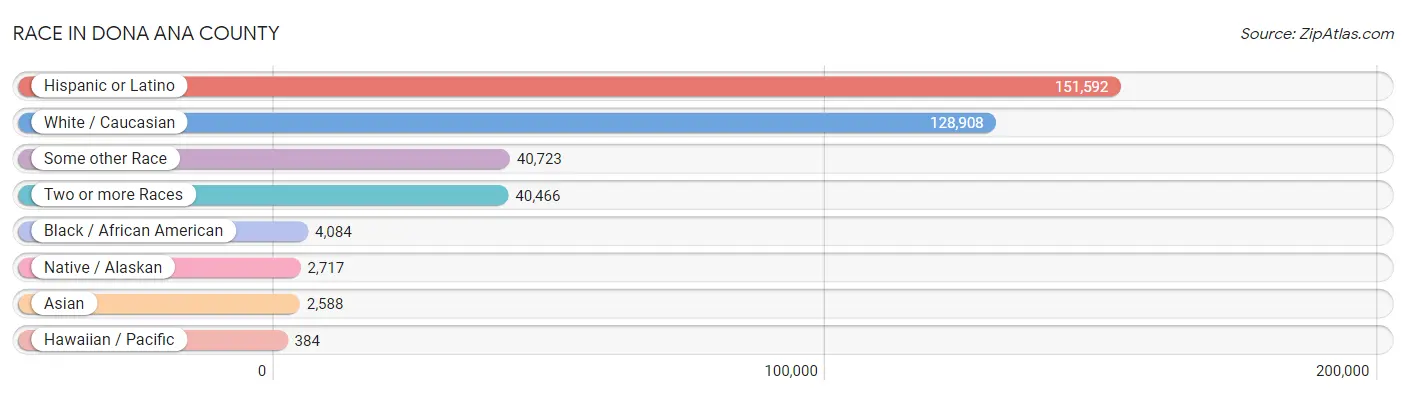
| Race | # Population | % Population |
| Asian | 2,588 | 1.2% |
| Black / African American | 4,084 | 1.9% |
| Hawaiian / Pacific | 384 | 0.2% |
| Hispanic or Latino | 151,592 | 69.0% |
| Native / Alaskan | 2,717 | 1.2% |
| White / Caucasian | 128,908 | 58.6% |
| Two or more Races | 40,466 | 18.4% |
| Some other Race | 40,723 | 18.5% |
| Total | 219,870 | 100.0% |
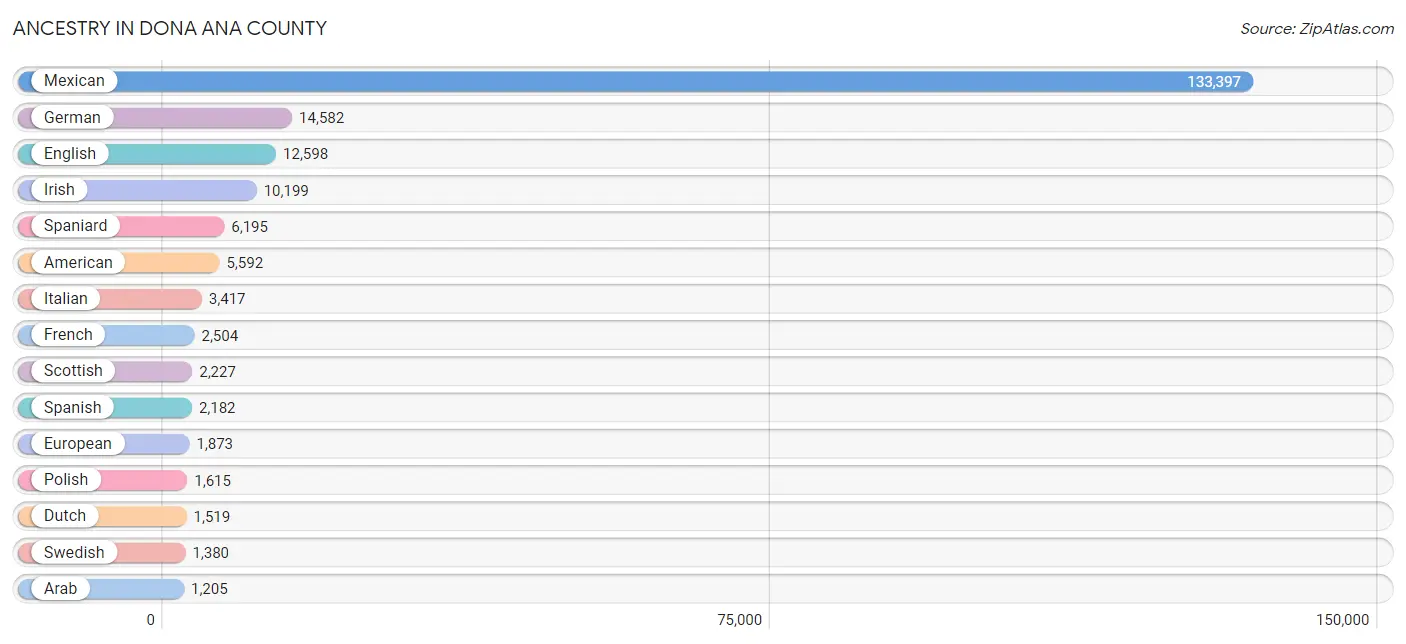
Ancestry in Dona Ana County
The most populous ancestries reported in Dona Ana County are Mexican (133,397 | 60.7%), German (14,582 | 6.6%), English (12,598 | 5.7%), Irish (10,199 | 4.6%), and Spaniard (6,195 | 2.8%), together accounting for 80.5% of all Dona Ana County residents.
| Ancestry | # Population | % Population |
| African | 287 | 0.1% |
| American | 5,592 | 2.5% |
| Apache | 571 | 0.3% |
| Arab | 1,205 | 0.5% |
| Armenian | 165 | 0.1% |
| Australian | 31 | 0.0% |
| Austrian | 186 | 0.1% |
| Barbadian | 17 | 0.0% |
| Basque | 6 | 0.0% |
| Belgian | 202 | 0.1% |
| Belizean | 8 | 0.0% |
| Bhutanese | 660 | 0.3% |
| Blackfeet | 17 | 0.0% |
| British | 586 | 0.3% |
| Burmese | 507 | 0.2% |
| Canadian | 46 | 0.0% |
| Celtic | 39 | 0.0% |
| Central American | 966 | 0.4% |
| Central American Indian | 219 | 0.1% |
| Cherokee | 362 | 0.2% |
| Cheyenne | 75 | 0.0% |
| Chickasaw | 45 | 0.0% |
| Chippewa | 44 | 0.0% |
| Choctaw | 37 | 0.0% |
| Colombian | 187 | 0.1% |
| Comanche | 188 | 0.1% |
| Creek | 37 | 0.0% |
| Croatian | 71 | 0.0% |
| Cuban | 186 | 0.1% |
| Cypriot | 12 | 0.0% |
| Czech | 462 | 0.2% |
| Czechoslovakian | 66 | 0.0% |
| Danish | 425 | 0.2% |
| Dominican | 67 | 0.0% |
| Dutch | 1,519 | 0.7% |
| Eastern European | 300 | 0.1% |
| Ecuadorian | 16 | 0.0% |
| English | 12,598 | 5.7% |
| Estonian | 33 | 0.0% |
| European | 1,873 | 0.9% |
| Finnish | 57 | 0.0% |
| French | 2,504 | 1.1% |
| French Canadian | 315 | 0.1% |
| German | 14,582 | 6.6% |
| Greek | 572 | 0.3% |
| Guamanian / Chamorro | 9 | 0.0% |
| Guatemalan | 206 | 0.1% |
| Honduran | 188 | 0.1% |
| Hopi | 37 | 0.0% |
| Hungarian | 326 | 0.2% |
| Icelander | 7 | 0.0% |
| Indian (Asian) | 685 | 0.3% |
| Indonesian | 4 | 0.0% |
| Iranian | 79 | 0.0% |
| Irish | 10,199 | 4.6% |
| Israeli | 4 | 0.0% |
| Italian | 3,417 | 1.5% |
| Jamaican | 196 | 0.1% |
| Japanese | 9 | 0.0% |
| Jordanian | 6 | 0.0% |
| Kenyan | 1 | 0.0% |
| Kiowa | 8 | 0.0% |
| Korean | 1,058 | 0.5% |
| Latvian | 45 | 0.0% |
| Lebanese | 372 | 0.2% |
| Lithuanian | 189 | 0.1% |
| Mexican | 133,397 | 60.7% |
| Mexican American Indian | 441 | 0.2% |
| Mongolian | 7 | 0.0% |
| Native Hawaiian | 204 | 0.1% |
| Navajo | 977 | 0.4% |
| Nicaraguan | 23 | 0.0% |
| Nigerian | 480 | 0.2% |
| Northern European | 196 | 0.1% |
| Norwegian | 1,162 | 0.5% |
| Pakistani | 161 | 0.1% |
| Panamanian | 210 | 0.1% |
| Paraguayan | 12 | 0.0% |
| Pennsylvania German | 18 | 0.0% |
| Peruvian | 17 | 0.0% |
| Polish | 1,615 | 0.7% |
| Portuguese | 591 | 0.3% |
| Potawatomi | 18 | 0.0% |
| Pueblo | 771 | 0.4% |
| Puerto Rican | 1,005 | 0.5% |
| Romanian | 101 | 0.1% |
| Russian | 491 | 0.2% |
| Salvadoran | 339 | 0.2% |
| Samoan | 181 | 0.1% |
| Scandinavian | 547 | 0.3% |
| Scotch-Irish | 884 | 0.4% |
| Scottish | 2,227 | 1.0% |
| Serbian | 17 | 0.0% |
| Sioux | 2 | 0.0% |
| Slavic | 5 | 0.0% |
| Slovak | 169 | 0.1% |
| Slovene | 45 | 0.0% |
| South American | 276 | 0.1% |
| South American Indian | 35 | 0.0% |
| Spaniard | 6,195 | 2.8% |
| Spanish | 2,182 | 1.0% |
| Spanish American | 163 | 0.1% |
| Spanish American Indian | 18 | 0.0% |
| Sri Lankan | 154 | 0.1% |
| Subsaharan African | 783 | 0.4% |
| Swedish | 1,380 | 0.6% |
| Swiss | 296 | 0.1% |
| Syrian | 146 | 0.1% |
| Thai | 579 | 0.3% |
| Tohono O'Odham | 70 | 0.0% |
| Turkish | 20 | 0.0% |
| U.S. Virgin Islander | 15 | 0.0% |
| Ukrainian | 136 | 0.1% |
| Venezuelan | 44 | 0.0% |
| Vietnamese | 273 | 0.1% |
| Welsh | 558 | 0.3% |
| West Indian | 7 | 0.0% |
| Yaqui | 167 | 0.1% |
| Yugoslavian | 11 | 0.0% | View All 119 Rows |
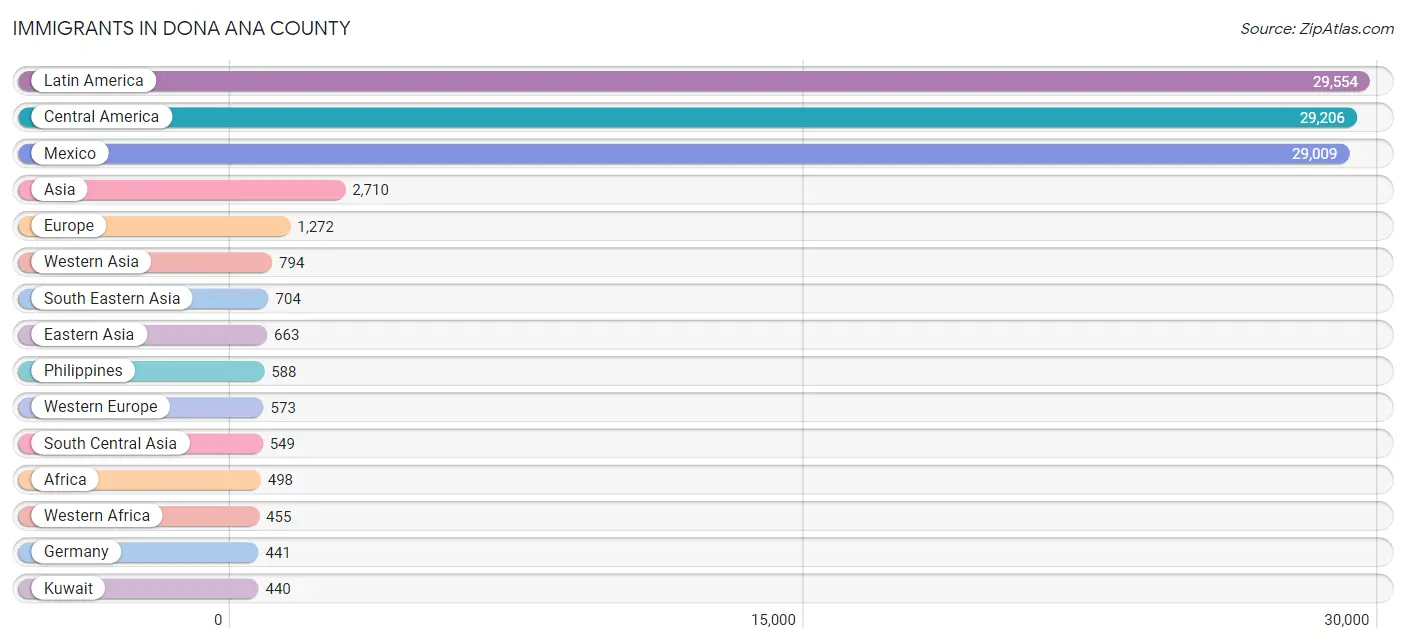
Immigrants in Dona Ana County
The most numerous immigrant groups reported in Dona Ana County came from Latin America (29,554 | 13.4%), Central America (29,206 | 13.3%), Mexico (29,009 | 13.2%), Asia (2,710 | 1.2%), and Europe (1,272 | 0.6%), together accounting for 41.7% of all Dona Ana County residents.
| Immigration Origin | # Population | % Population |
| Africa | 498 | 0.2% |
| Argentina | 70 | 0.0% |
| Asia | 2,710 | 1.2% |
| Australia | 26 | 0.0% |
| Bangladesh | 182 | 0.1% |
| Belgium | 14 | 0.0% |
| Belize | 8 | 0.0% |
| Canada | 138 | 0.1% |
| Caribbean | 158 | 0.1% |
| Central America | 29,206 | 13.3% |
| China | 189 | 0.1% |
| Colombia | 22 | 0.0% |
| Cuba | 47 | 0.0% |
| Czechoslovakia | 23 | 0.0% |
| Eastern Africa | 41 | 0.0% |
| Eastern Asia | 663 | 0.3% |
| Eastern Europe | 303 | 0.1% |
| El Salvador | 123 | 0.1% |
| England | 123 | 0.1% |
| Europe | 1,272 | 0.6% |
| Fiji | 17 | 0.0% |
| France | 45 | 0.0% |
| Germany | 441 | 0.2% |
| Ghana | 66 | 0.0% |
| Greece | 42 | 0.0% |
| Guatemala | 6 | 0.0% |
| Honduras | 33 | 0.0% |
| Hong Kong | 26 | 0.0% |
| Hungary | 68 | 0.0% |
| India | 208 | 0.1% |
| Indonesia | 15 | 0.0% |
| Iran | 89 | 0.0% |
| Israel | 4 | 0.0% |
| Italy | 46 | 0.0% |
| Jamaica | 111 | 0.1% |
| Japan | 126 | 0.1% |
| Jordan | 6 | 0.0% |
| Korea | 348 | 0.2% |
| Kuwait | 440 | 0.2% |
| Latin America | 29,554 | 13.4% |
| Lebanon | 28 | 0.0% |
| Malaysia | 3 | 0.0% |
| Mexico | 29,009 | 13.2% |
| Nepal | 42 | 0.0% |
| Netherlands | 73 | 0.0% |
| Nicaragua | 5 | 0.0% |
| Nigeria | 371 | 0.2% |
| Northern Europe | 209 | 0.1% |
| Norway | 2 | 0.0% |
| Oceania | 63 | 0.0% |
| Panama | 22 | 0.0% |
| Peru | 54 | 0.0% |
| Philippines | 588 | 0.3% |
| Poland | 108 | 0.1% |
| Romania | 65 | 0.0% |
| Russia | 21 | 0.0% |
| Saudi Arabia | 209 | 0.1% |
| South Africa | 2 | 0.0% |
| South America | 190 | 0.1% |
| South Central Asia | 549 | 0.3% |
| South Eastern Asia | 704 | 0.3% |
| Southern Europe | 187 | 0.1% |
| Spain | 99 | 0.1% |
| Sri Lanka | 28 | 0.0% |
| Sweden | 14 | 0.0% |
| Syria | 79 | 0.0% |
| Uganda | 41 | 0.0% |
| Venezuela | 44 | 0.0% |
| Vietnam | 94 | 0.0% |
| Western Africa | 455 | 0.2% |
| Western Asia | 794 | 0.4% |
| Western Europe | 573 | 0.3% | View All 72 Rows |
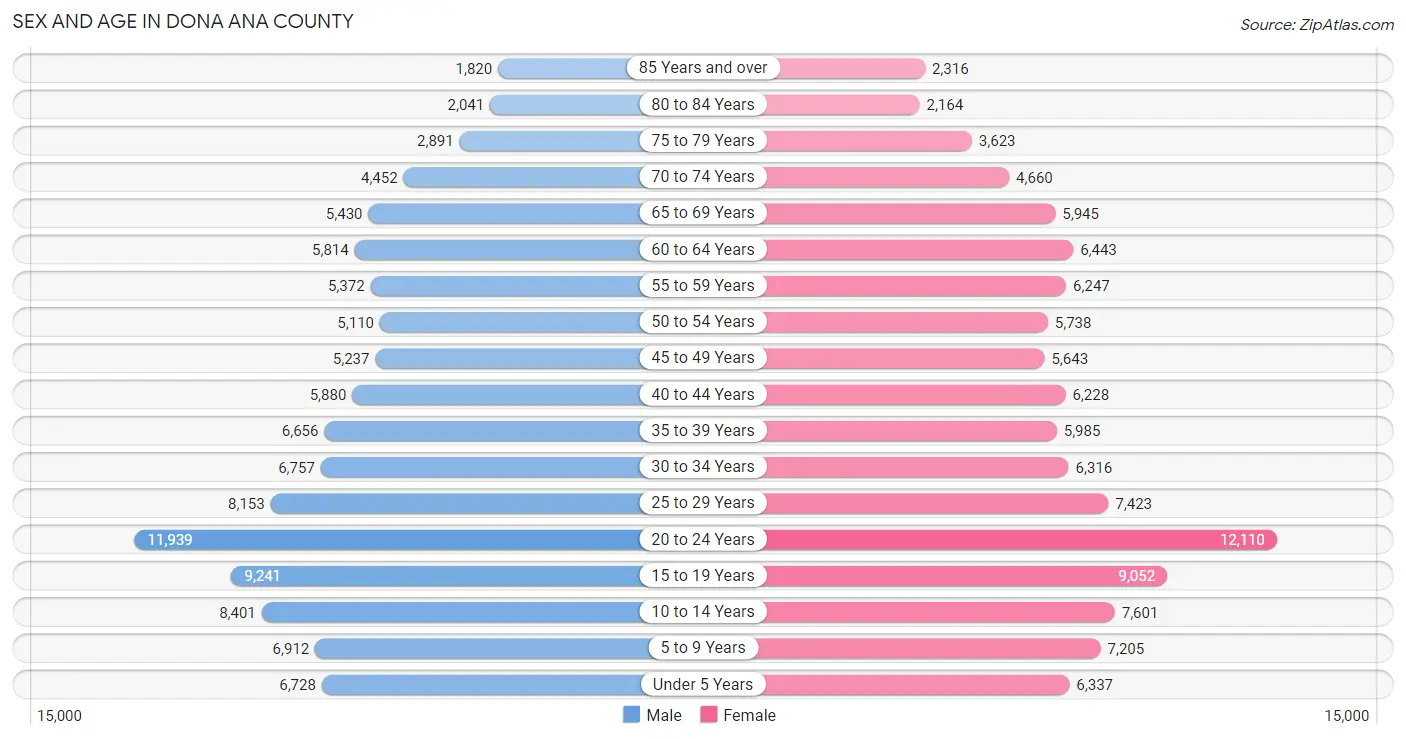
Sex and Age in Dona Ana County
Sex and Age in Dona Ana County
The most populous age groups in Dona Ana County are 20 to 24 Years (11,939 | 11.0%) for men and 20 to 24 Years (12,110 | 10.9%) for women.
| Age Bracket | Male | Female |
| Under 5 Years | 6,728 (6.2%) | 6,337 (5.7%) |
| 5 to 9 Years | 6,912 (6.4%) | 7,205 (6.5%) |
| 10 to 14 Years | 8,401 (7.7%) | 7,601 (6.9%) |
| 15 to 19 Years | 9,241 (8.5%) | 9,052 (8.2%) |
| 20 to 24 Years | 11,939 (11.0%) | 12,110 (10.9%) |
| 25 to 29 Years | 8,153 (7.5%) | 7,423 (6.7%) |
| 30 to 34 Years | 6,757 (6.2%) | 6,316 (5.7%) |
| 35 to 39 Years | 6,656 (6.1%) | 5,985 (5.4%) |
| 40 to 44 Years | 5,880 (5.4%) | 6,228 (5.6%) |
| 45 to 49 Years | 5,237 (4.8%) | 5,643 (5.1%) |
| 50 to 54 Years | 5,110 (4.7%) | 5,738 (5.2%) |
| 55 to 59 Years | 5,372 (4.9%) | 6,247 (5.6%) |
| 60 to 64 Years | 5,814 (5.3%) | 6,443 (5.8%) |
| 65 to 69 Years | 5,430 (5.0%) | 5,945 (5.3%) |
| 70 to 74 Years | 4,452 (4.1%) | 4,660 (4.2%) |
| 75 to 79 Years | 2,891 (2.7%) | 3,623 (3.3%) |
| 80 to 84 Years | 2,041 (1.9%) | 2,164 (1.9%) |
| 85 Years and over | 1,820 (1.7%) | 2,316 (2.1%) |
| Total | 108,834 (100.0%) | 111,036 (100.0%) |
Families and Households in Dona Ana County
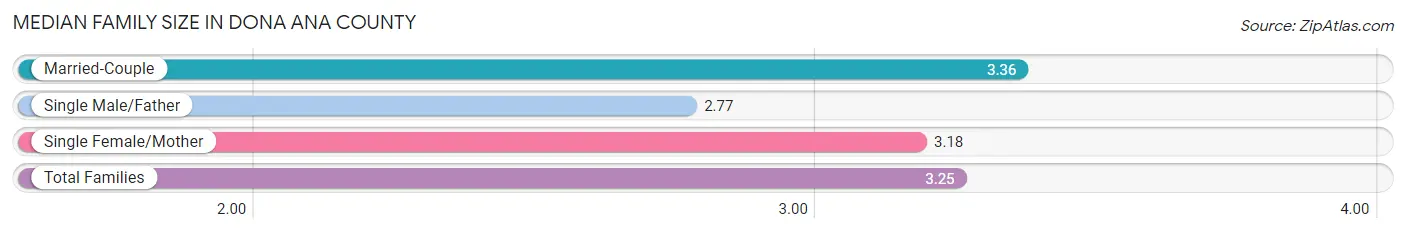
Median Family Size in Dona Ana County
The median family size in Dona Ana County is 3.25 persons per family, with married-couple families (34,476 | 65.9%) accounting for the largest median family size of 3.36 persons per family. On the other hand, single male/father families (5,962 | 11.4%) represent the smallest median family size with 2.77 persons per family.
| Family Type | # Families | Family Size |
| Married-Couple | 34,476 (65.9%) | 3.36 |
| Single Male/Father | 5,962 (11.4%) | 2.77 |
| Single Female/Mother | 11,913 (22.8%) | 3.18 |
| Total Families | 52,351 (100.0%) | 3.25 |
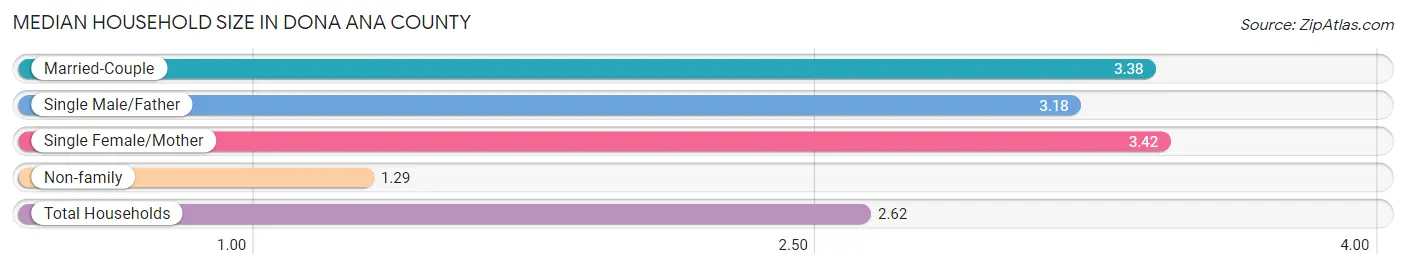
Median Household Size in Dona Ana County
The median household size in Dona Ana County is 2.62 persons per household, with single female/mother households (11,913 | 14.5%) accounting for the largest median household size of 3.42 persons per household. non-family households (29,618 | 36.1%) represent the smallest median household size with 1.29 persons per household.
| Household Type | # Households | Household Size |
| Married-Couple | 34,476 (42.1%) | 3.38 |
| Single Male/Father | 5,962 (7.3%) | 3.18 |
| Single Female/Mother | 11,913 (14.5%) | 3.42 |
| Non-family | 29,618 (36.1%) | 1.29 |
| Total Households | 81,969 (100.0%) | 2.62 |
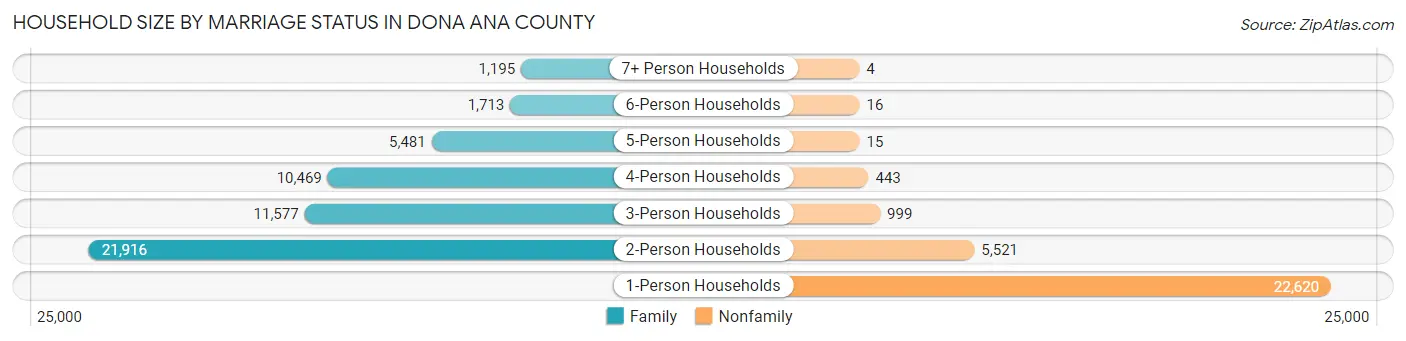
Household Size by Marriage Status in Dona Ana County
Out of a total of 81,969 households in Dona Ana County, 52,351 (63.9%) are family households, while 29,618 (36.1%) are nonfamily households. The most numerous type of family households are 2-person households, comprising 21,916, and the most common type of nonfamily households are 1-person households, comprising 22,620.
| Household Size | Family Households | Nonfamily Households |
| 1-Person Households | - | 22,620 (27.6%) |
| 2-Person Households | 21,916 (26.7%) | 5,521 (6.7%) |
| 3-Person Households | 11,577 (14.1%) | 999 (1.2%) |
| 4-Person Households | 10,469 (12.8%) | 443 (0.5%) |
| 5-Person Households | 5,481 (6.7%) | 15 (0.0%) |
| 6-Person Households | 1,713 (2.1%) | 16 (0.0%) |
| 7+ Person Households | 1,195 (1.5%) | 4 (0.0%) |
| Total | 52,351 (63.9%) | 29,618 (36.1%) |
Female Fertility in Dona Ana County
Fertility by Age in Dona Ana County
Average fertility rate in Dona Ana County is 57.0 births per 1,000 women. Women in the age bracket of 20 to 34 years have the highest fertility rate with 84.0 births per 1,000 women. Women in the age bracket of 20 to 34 years acount for 70.1% of all women with births.
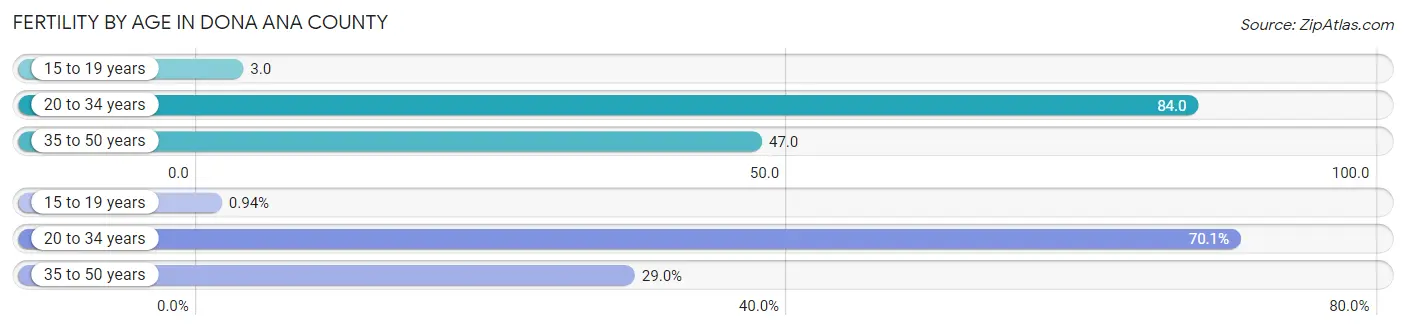
| Age Bracket | Women with Births | Births / 1,000 Women |
| 15 to 19 years | 29 (0.9%) | 3.0 |
| 20 to 34 years | 2,170 (70.1%) | 84.0 |
| 35 to 50 years | 897 (29.0%) | 47.0 |
| Total | 3,096 (100.0%) | 57.0 |
Fertility by Age by Marriage Status in Dona Ana County
52.4% of women with births (3,096) in Dona Ana County are married. The highest percentage of unmarried women with births falls into 15 to 19 years age bracket with 100.0% of them unmarried at the time of birth, while the lowest percentage of unmarried women with births belong to 20 to 34 years age bracket with 45.3% of them unmarried.
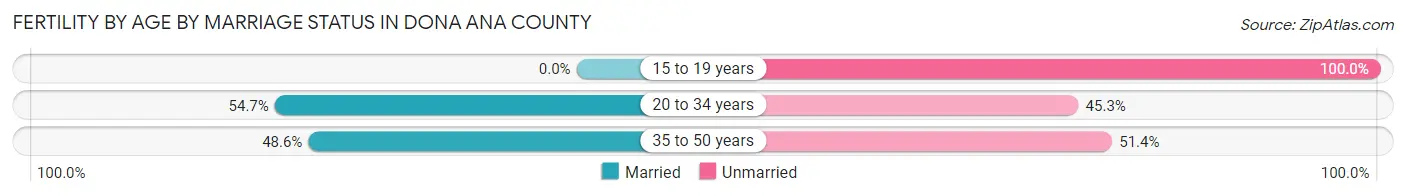
| Age Bracket | Married | Unmarried |
| 15 to 19 years | 0 (0.0%) | 29 (100.0%) |
| 20 to 34 years | 1,187 (54.7%) | 983 (45.3%) |
| 35 to 50 years | 436 (48.6%) | 461 (51.4%) |
| Total | 1,622 (52.4%) | 1,474 (47.6%) |
Fertility by Education in Dona Ana County
Average fertility rate in Dona Ana County is 57.0 births per 1,000 women. Women with the education attainment of college or associate's degree have the highest fertility rate of 79.0 births per 1,000 women, while women with the education attainment of less than high school have the lowest fertility at 26.0 births per 1,000 women. Women with the education attainment of college or associate's degree represent 48.8% of all women with births.
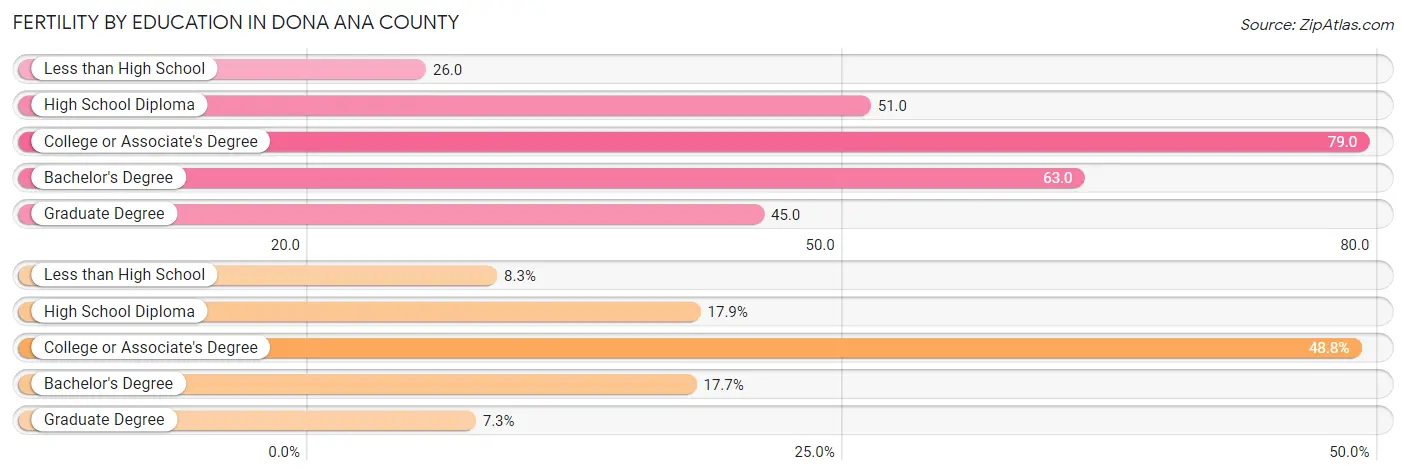
| Educational Attainment | Women with Births | Births / 1,000 Women |
| Less than High School | 258 (8.3%) | 26.0 |
| High School Diploma | 553 (17.9%) | 51.0 |
| College or Associate's Degree | 1,511 (48.8%) | 79.0 |
| Bachelor's Degree | 547 (17.7%) | 63.0 |
| Graduate Degree | 227 (7.3%) | 45.0 |
| Total | 3,096 (100.0%) | 57.0 |
Fertility by Education by Marriage Status in Dona Ana County
47.6% of women with births in Dona Ana County are unmarried. Women with the educational attainment of graduate degree are most likely to be married with 96.9% of them married at childbirth, while women with the educational attainment of less than high school are least likely to be married with 69.8% of them unmarried at childbirth.
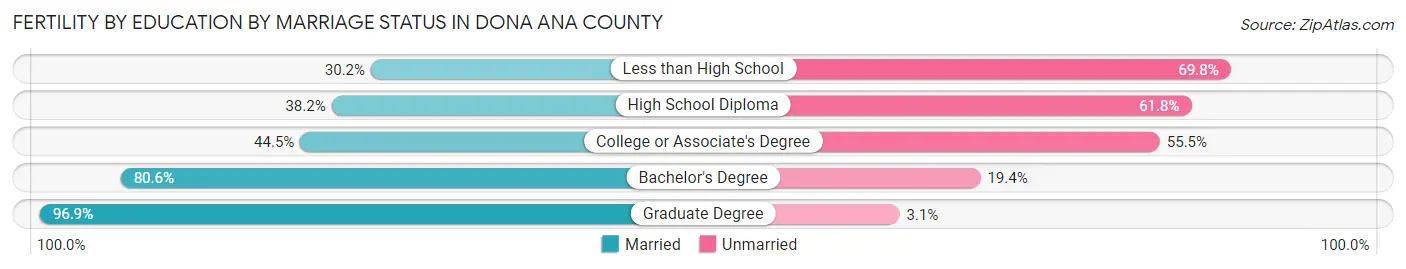
| Educational Attainment | Married | Unmarried |
| Less than High School | 78 (30.2%) | 180 (69.8%) |
| High School Diploma | 211 (38.2%) | 342 (61.8%) |
| College or Associate's Degree | 672 (44.5%) | 839 (55.5%) |
| Bachelor's Degree | 441 (80.6%) | 106 (19.4%) |
| Graduate Degree | 220 (96.9%) | 7 (3.1%) |
| Total | 1,622 (52.4%) | 1,474 (47.6%) |
Employment Characteristics in Dona Ana County
Employment by Class of Employer in Dona Ana County
Among the 91,502 employed individuals in Dona Ana County, private company employees (56,340 | 61.6%), state government employees (8,220 | 9.0%), and local government employees (7,030 | 7.7%) make up the most common classes of employment.
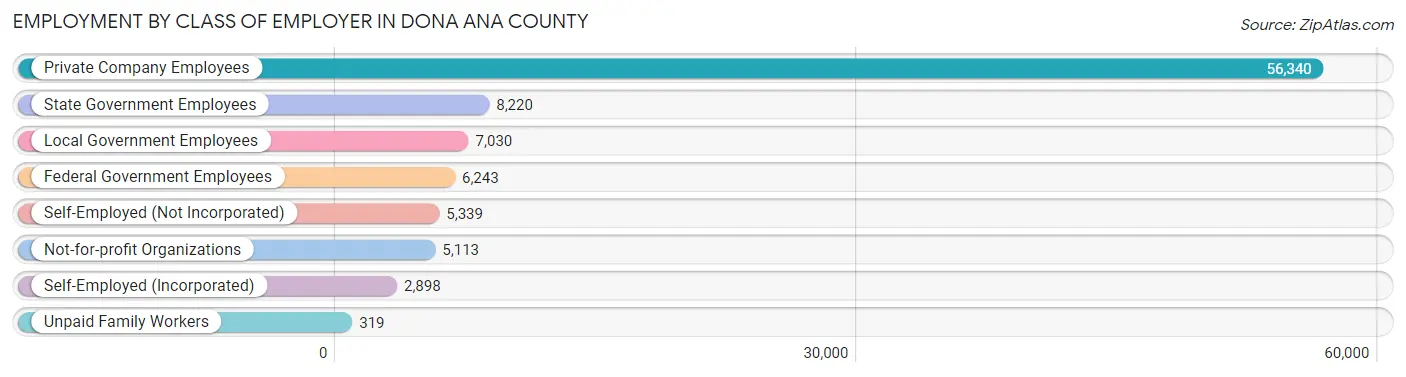
| Employer Class | # Employees | % Employees |
| Private Company Employees | 56,340 | 61.6% |
| Self-Employed (Incorporated) | 2,898 | 3.2% |
| Self-Employed (Not Incorporated) | 5,339 | 5.8% |
| Not-for-profit Organizations | 5,113 | 5.6% |
| Local Government Employees | 7,030 | 7.7% |
| State Government Employees | 8,220 | 9.0% |
| Federal Government Employees | 6,243 | 6.8% |
| Unpaid Family Workers | 319 | 0.4% |
| Total | 91,502 | 100.0% |
Employment Status by Age in Dona Ana County
According to the labor force statistics for Dona Ana County, out of the total population over 16 years of age (173,874), 57.4% or 99,804 individuals are in the labor force, with 6.8% or 6,787 of them unemployed. The age group with the highest labor force participation rate is 30 to 34 years, with 79.4% or 10,380 individuals in the labor force. Within the labor force, the 16 to 19 years age range has the highest percentage of unemployed individuals, with 11.6% or 630 of them being unemployed.
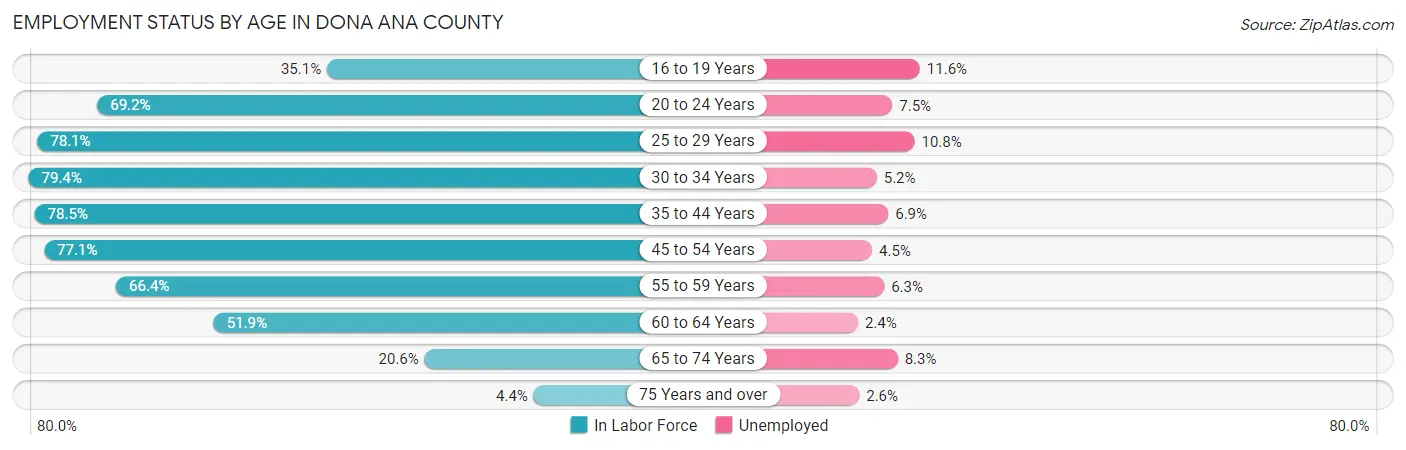
| Age Bracket | In Labor Force | Unemployed |
| 16 to 19 Years | 5,434 (35.1%) | 630 (11.6%) |
| 20 to 24 Years | 16,642 (69.2%) | 1,248 (7.5%) |
| 25 to 29 Years | 12,165 (78.1%) | 1,314 (10.8%) |
| 30 to 34 Years | 10,380 (79.4%) | 540 (5.2%) |
| 35 to 44 Years | 19,428 (78.5%) | 1,341 (6.9%) |
| 45 to 54 Years | 16,752 (77.1%) | 754 (4.5%) |
| 55 to 59 Years | 7,715 (66.4%) | 486 (6.3%) |
| 60 to 64 Years | 6,361 (51.9%) | 153 (2.4%) |
| 65 to 74 Years | 4,220 (20.6%) | 350 (8.3%) |
| 75 Years and over | 654 (4.4%) | 17 (2.6%) |
| Total | 99,804 (57.4%) | 6,787 (6.8%) |
Employment Status by Educational Attainment in Dona Ana County
According to labor force statistics for Dona Ana County, 73.5% of individuals (72,766) out of the total population between 25 and 64 years of age (99,002) are in the labor force, with 6.3% or 4,584 of them being unemployed. The group with the highest labor force participation rate are those with the educational attainment of bachelor's degree or higher, with 82.7% or 25,019 individuals in the labor force. Within the labor force, individuals with less than high school education have the highest percentage of unemployment, with 10.0% or 891 of them being unemployed.
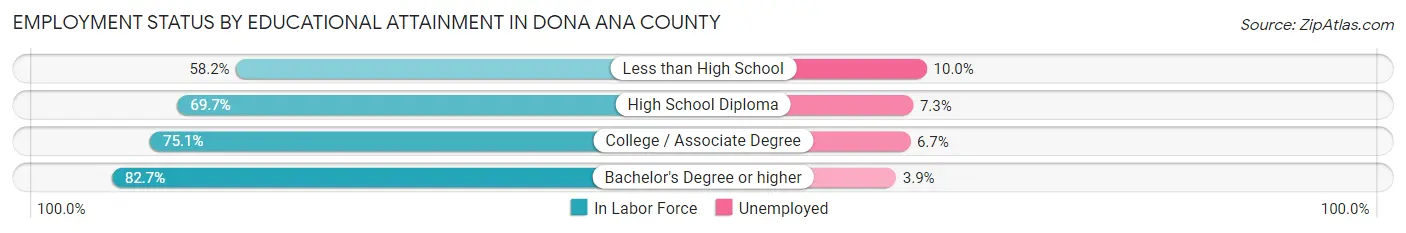
| Educational Attainment | In Labor Force | Unemployed |
| Less than High School | 8,911 (58.2%) | 1,531 (10.0%) |
| High School Diploma | 16,106 (69.7%) | 1,687 (7.3%) |
| College / Associate Degree | 22,778 (75.1%) | 2,032 (6.7%) |
| Bachelor's Degree or higher | 25,019 (82.7%) | 1,180 (3.9%) |
| Total | 72,766 (73.5%) | 6,237 (6.3%) |
Employment Occupations by Sex in Dona Ana County
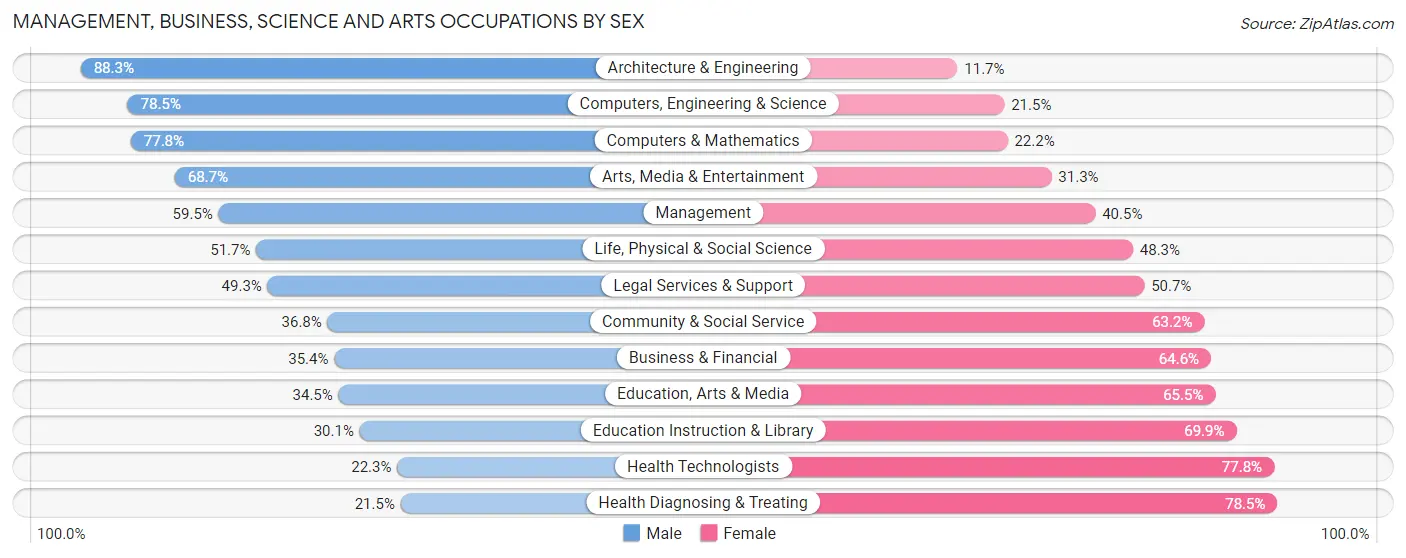
Management, Business, Science and Arts Occupations
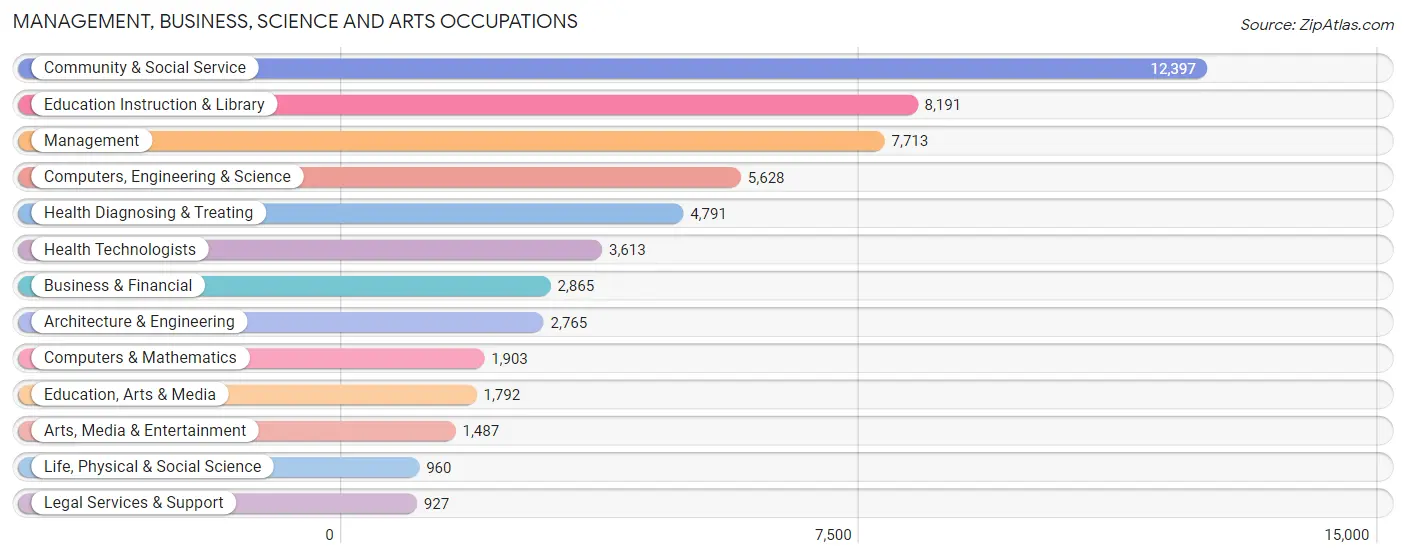
The most common Management, Business, Science and Arts occupations in Dona Ana County are Community & Social Service (12,397 | 13.5%), Education Instruction & Library (8,191 | 8.9%), Management (7,713 | 8.4%), Computers, Engineering & Science (5,628 | 6.1%), and Health Diagnosing & Treating (4,791 | 5.2%).
Management, Business, Science and Arts Occupations by Sex
Within the Management, Business, Science and Arts occupations in Dona Ana County, the most male-oriented occupations are Architecture & Engineering (88.3%), Computers, Engineering & Science (78.5%), and Computers & Mathematics (77.8%), while the most female-oriented occupations are Health Diagnosing & Treating (78.5%), Health Technologists (77.7%), and Education Instruction & Library (69.9%).
| Occupation | Male | Female |
| Management | 4,591 (59.5%) | 3,122 (40.5%) |
| Business & Financial | 1,014 (35.4%) | 1,851 (64.6%) |
| Computers, Engineering & Science | 4,418 (78.5%) | 1,210 (21.5%) |
| Computers & Mathematics | 1,481 (77.8%) | 422 (22.2%) |
| Architecture & Engineering | 2,441 (88.3%) | 324 (11.7%) |
| Life, Physical & Social Science | 496 (51.7%) | 464 (48.3%) |
| Community & Social Service | 4,561 (36.8%) | 7,836 (63.2%) |
| Education, Arts & Media | 618 (34.5%) | 1,174 (65.5%) |
| Legal Services & Support | 457 (49.3%) | 470 (50.7%) |
| Education Instruction & Library | 2,465 (30.1%) | 5,726 (69.9%) |
| Arts, Media & Entertainment | 1,021 (68.7%) | 466 (31.3%) |
| Health Diagnosing & Treating | 1,032 (21.5%) | 3,759 (78.5%) |
| Health Technologists | 804 (22.3%) | 2,809 (77.7%) |
| Total (Category) | 15,616 (46.8%) | 17,778 (53.2%) |
| Total (Overall) | 49,345 (53.6%) | 42,743 (46.4%) |
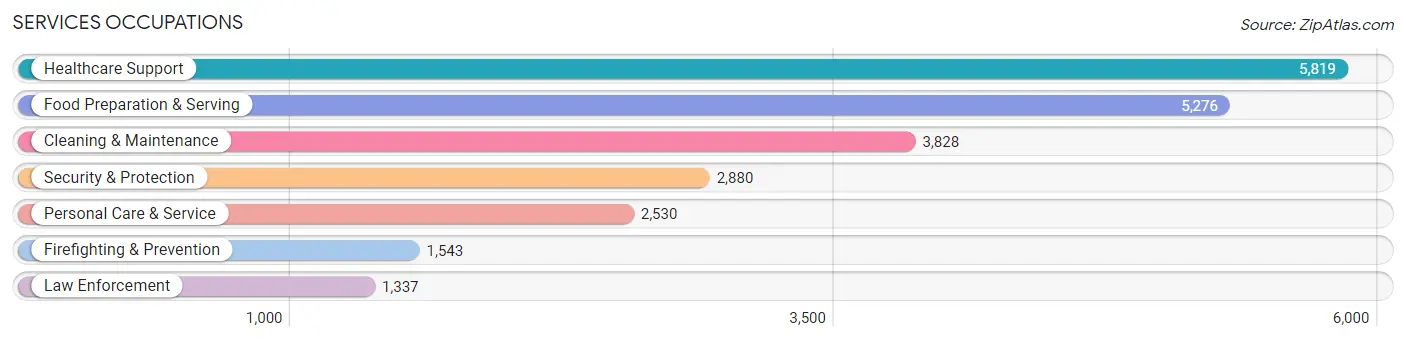
Services Occupations
The most common Services occupations in Dona Ana County are Healthcare Support (5,819 | 6.3%), Food Preparation & Serving (5,276 | 5.7%), Cleaning & Maintenance (3,828 | 4.2%), Security & Protection (2,880 | 3.1%), and Personal Care & Service (2,530 | 2.8%).
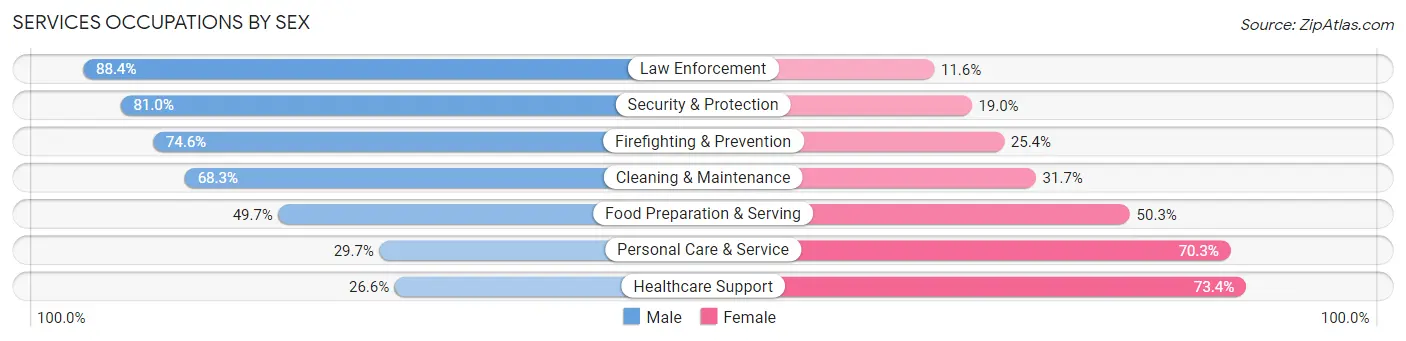
Services Occupations by Sex
Within the Services occupations in Dona Ana County, the most male-oriented occupations are Law Enforcement (88.4%), Security & Protection (81.0%), and Firefighting & Prevention (74.6%), while the most female-oriented occupations are Healthcare Support (73.4%), Personal Care & Service (70.3%), and Food Preparation & Serving (50.3%).
| Occupation | Male | Female |
| Healthcare Support | 1,550 (26.6%) | 4,269 (73.4%) |
| Security & Protection | 2,333 (81.0%) | 547 (19.0%) |
| Firefighting & Prevention | 1,151 (74.6%) | 392 (25.4%) |
| Law Enforcement | 1,182 (88.4%) | 155 (11.6%) |
| Food Preparation & Serving | 2,621 (49.7%) | 2,655 (50.3%) |
| Cleaning & Maintenance | 2,614 (68.3%) | 1,214 (31.7%) |
| Personal Care & Service | 751 (29.7%) | 1,779 (70.3%) |
| Total (Category) | 9,869 (48.5%) | 10,464 (51.5%) |
| Total (Overall) | 49,345 (53.6%) | 42,743 (46.4%) |
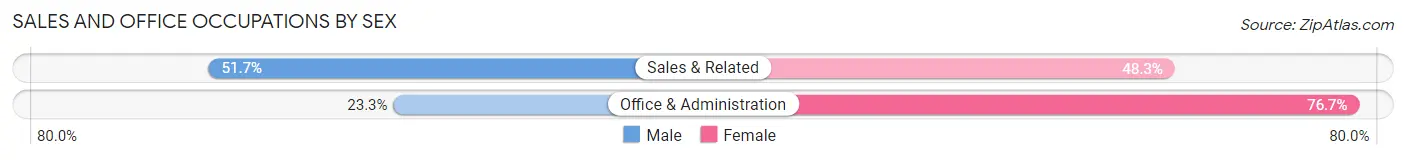
Sales and Office Occupations
The most common Sales and Office occupations in Dona Ana County are Office & Administration (10,350 | 11.2%), and Sales & Related (8,293 | 9.0%).

Sales and Office Occupations by Sex
| Occupation | Male | Female |
| Sales & Related | 4,286 (51.7%) | 4,007 (48.3%) |
| Office & Administration | 2,408 (23.3%) | 7,942 (76.7%) |
| Total (Category) | 6,694 (35.9%) | 11,949 (64.1%) |
| Total (Overall) | 49,345 (53.6%) | 42,743 (46.4%) |
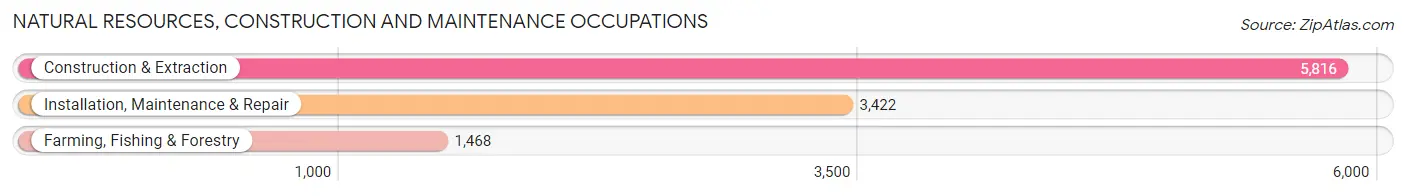
Natural Resources, Construction and Maintenance Occupations
The most common Natural Resources, Construction and Maintenance occupations in Dona Ana County are Construction & Extraction (5,816 | 6.3%), Installation, Maintenance & Repair (3,422 | 3.7%), and Farming, Fishing & Forestry (1,468 | 1.6%).
Natural Resources, Construction and Maintenance Occupations by Sex
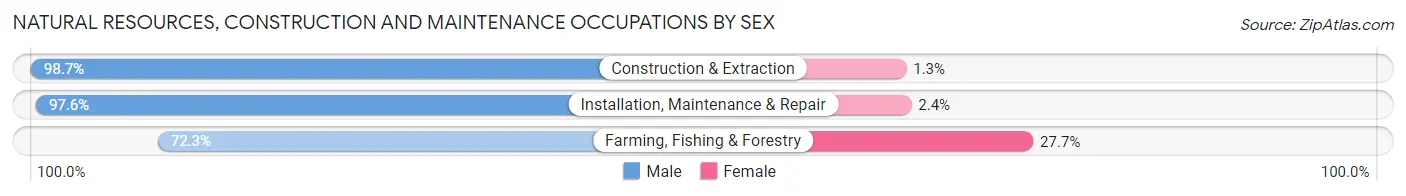
| Occupation | Male | Female |
| Farming, Fishing & Forestry | 1,061 (72.3%) | 407 (27.7%) |
| Construction & Extraction | 5,739 (98.7%) | 77 (1.3%) |
| Installation, Maintenance & Repair | 3,341 (97.6%) | 81 (2.4%) |
| Total (Category) | 10,141 (94.7%) | 565 (5.3%) |
| Total (Overall) | 49,345 (53.6%) | 42,743 (46.4%) |
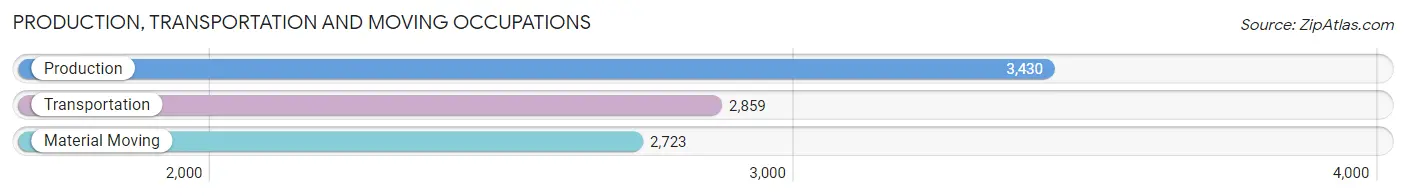
Production, Transportation and Moving Occupations
The most common Production, Transportation and Moving occupations in Dona Ana County are Production (3,430 | 3.7%), Transportation (2,859 | 3.1%), and Material Moving (2,723 | 3.0%).
Production, Transportation and Moving Occupations by Sex
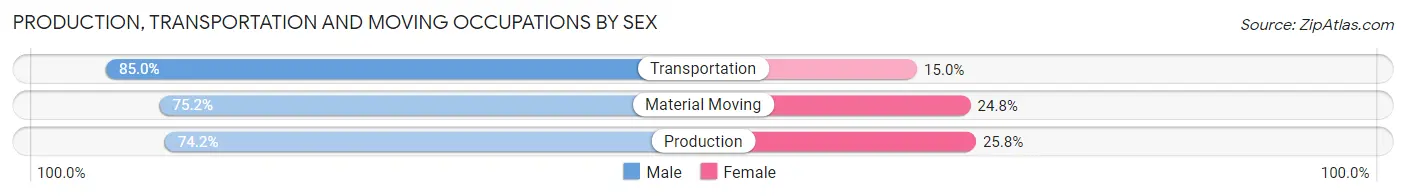
| Occupation | Male | Female |
| Production | 2,546 (74.2%) | 884 (25.8%) |
| Transportation | 2,431 (85.0%) | 428 (15.0%) |
| Material Moving | 2,048 (75.2%) | 675 (24.8%) |
| Total (Category) | 7,025 (77.9%) | 1,987 (22.1%) |
| Total (Overall) | 49,345 (53.6%) | 42,743 (46.4%) |
Employment Industries by Sex in Dona Ana County
Employment Industries in Dona Ana County
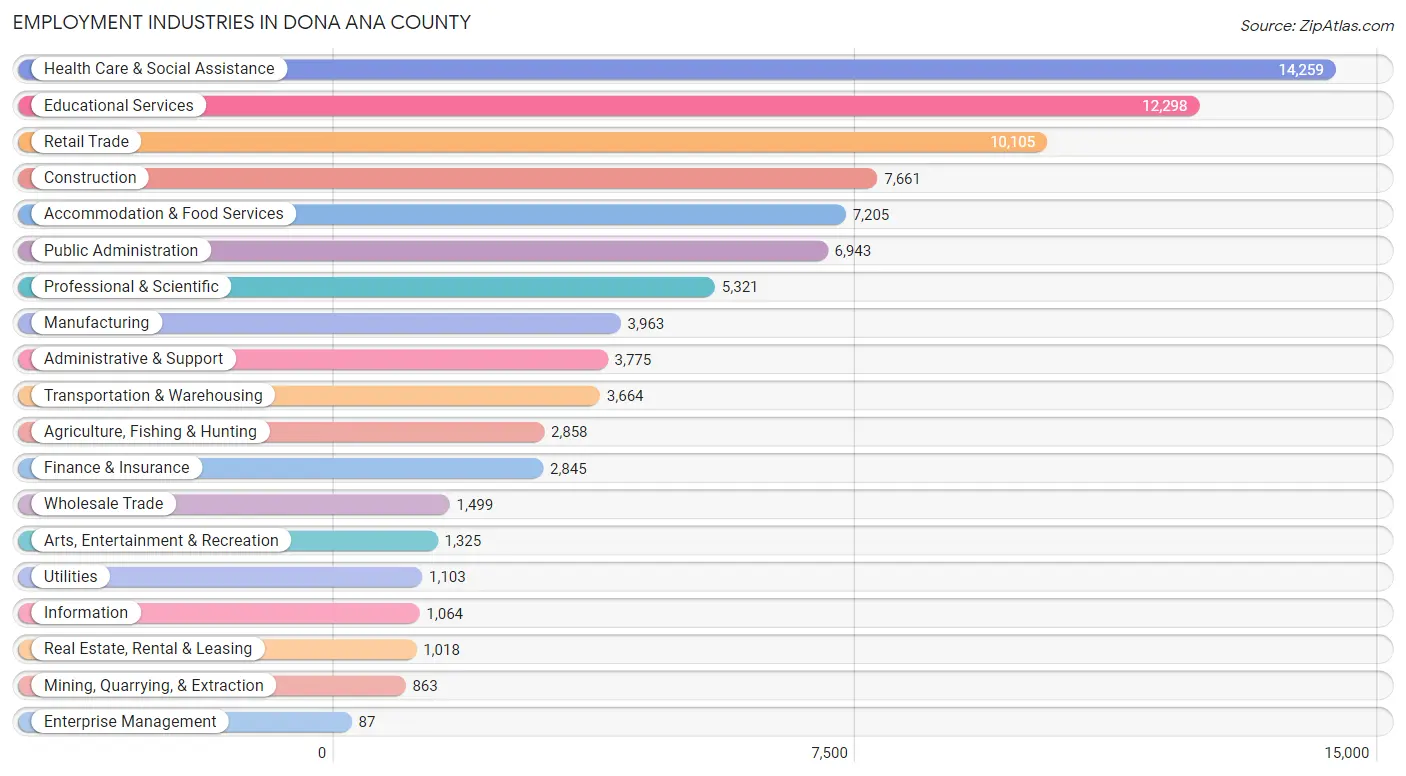
The major employment industries in Dona Ana County include Health Care & Social Assistance (14,259 | 15.5%), Educational Services (12,298 | 13.4%), Retail Trade (10,105 | 11.0%), Construction (7,661 | 8.3%), and Accommodation & Food Services (7,205 | 7.8%).
Employment Industries by Sex in Dona Ana County
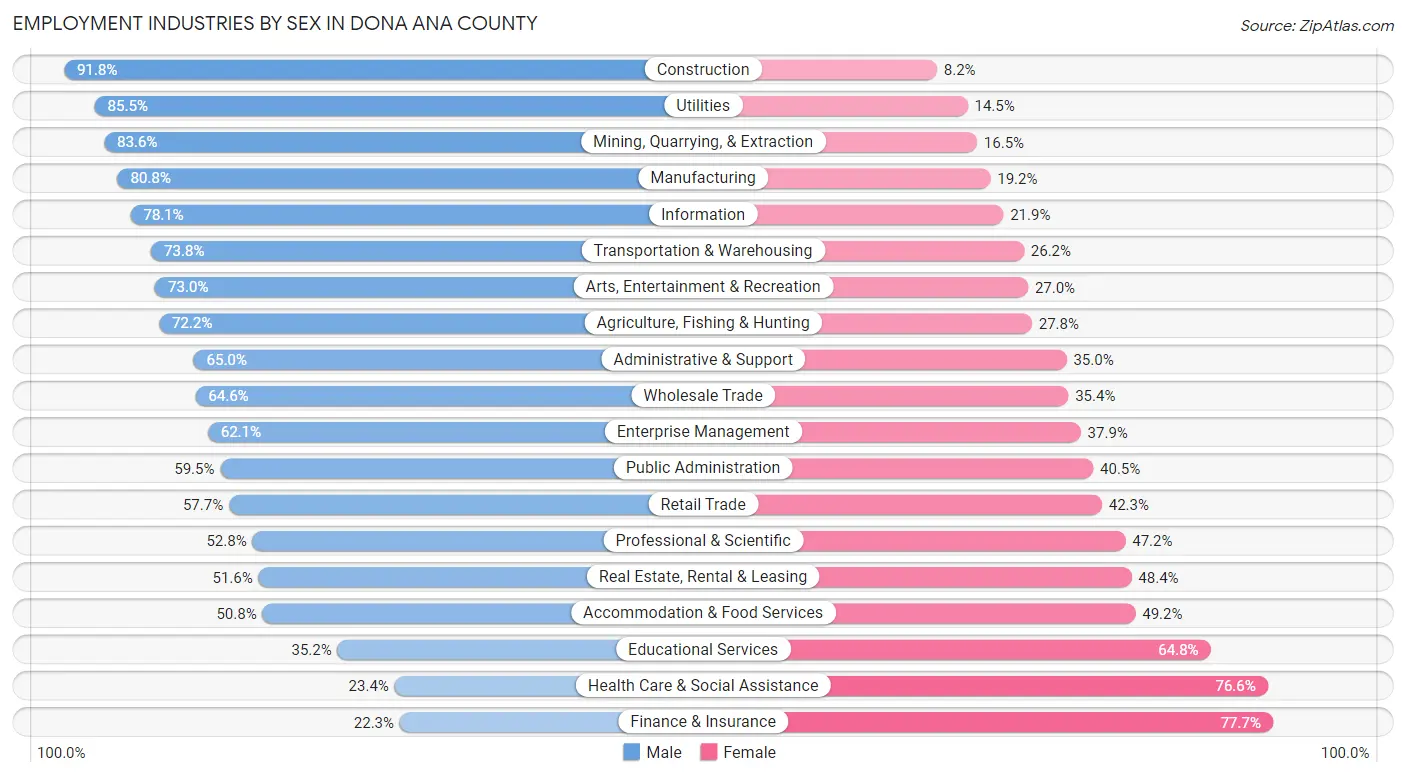
The Dona Ana County industries that see more men than women are Construction (91.8%), Utilities (85.5%), and Mining, Quarrying, & Extraction (83.6%), whereas the industries that tend to have a higher number of women are Finance & Insurance (77.7%), Health Care & Social Assistance (76.6%), and Educational Services (64.8%).
| Industry | Male | Female |
| Agriculture, Fishing & Hunting | 2,063 (72.2%) | 795 (27.8%) |
| Mining, Quarrying, & Extraction | 721 (83.6%) | 142 (16.5%) |
| Construction | 7,036 (91.8%) | 625 (8.2%) |
| Manufacturing | 3,201 (80.8%) | 762 (19.2%) |
| Wholesale Trade | 969 (64.6%) | 530 (35.4%) |
| Retail Trade | 5,830 (57.7%) | 4,275 (42.3%) |
| Transportation & Warehousing | 2,705 (73.8%) | 959 (26.2%) |
| Utilities | 943 (85.5%) | 160 (14.5%) |
| Information | 831 (78.1%) | 233 (21.9%) |
| Finance & Insurance | 635 (22.3%) | 2,210 (77.7%) |
| Real Estate, Rental & Leasing | 525 (51.6%) | 493 (48.4%) |
| Professional & Scientific | 2,811 (52.8%) | 2,510 (47.2%) |
| Enterprise Management | 54 (62.1%) | 33 (37.9%) |
| Administrative & Support | 2,454 (65.0%) | 1,321 (35.0%) |
| Educational Services | 4,331 (35.2%) | 7,967 (64.8%) |
| Health Care & Social Assistance | 3,337 (23.4%) | 10,922 (76.6%) |
| Arts, Entertainment & Recreation | 967 (73.0%) | 358 (27.0%) |
| Accommodation & Food Services | 3,657 (50.8%) | 3,548 (49.2%) |
| Public Administration | 4,131 (59.5%) | 2,812 (40.5%) |
| Total | 49,345 (53.6%) | 42,743 (46.4%) |
Education in Dona Ana County
School Enrollment in Dona Ana County
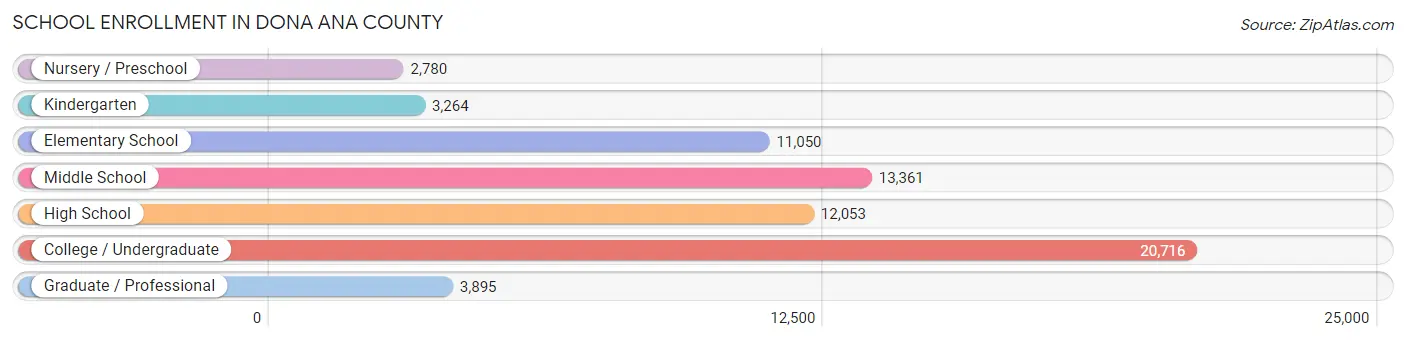
The most common levels of schooling among the 67,119 students in Dona Ana County are college / undergraduate (20,716 | 30.9%), middle school (13,361 | 19.9%), and high school (12,053 | 18.0%).
| School Level | # Students | % Students |
| Nursery / Preschool | 2,780 | 4.1% |
| Kindergarten | 3,264 | 4.9% |
| Elementary School | 11,050 | 16.5% |
| Middle School | 13,361 | 19.9% |
| High School | 12,053 | 18.0% |
| College / Undergraduate | 20,716 | 30.9% |
| Graduate / Professional | 3,895 | 5.8% |
| Total | 67,119 | 100.0% |
School Enrollment by Age by Funding Source in Dona Ana County
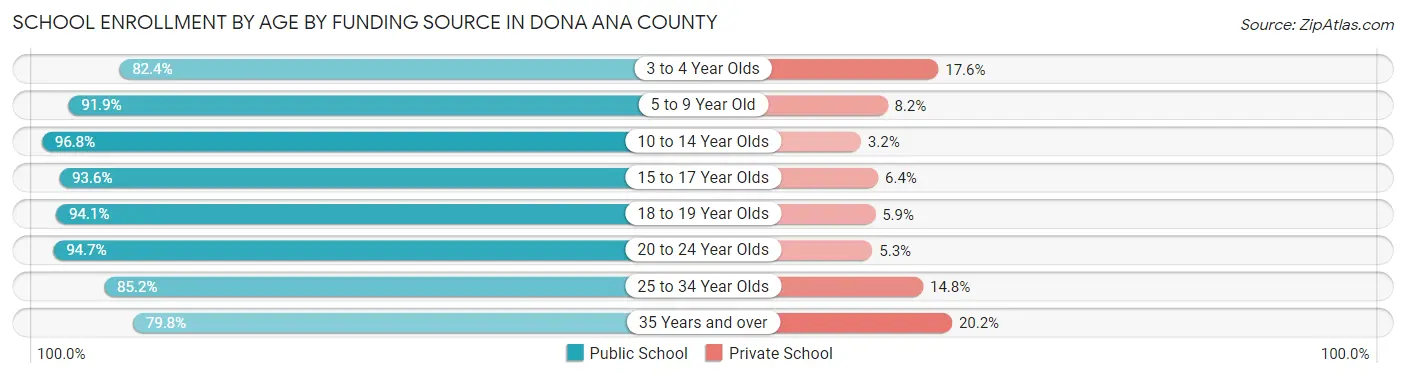
Out of a total of 67,119 students who are enrolled in schools in Dona Ana County, 4,967 (7.4%) attend a private institution, while the remaining 62,152 (92.6%) are enrolled in public schools. The age group of 35 years and over has the highest likelihood of being enrolled in private schools, with 728 (20.2% in the age bracket) enrolled. Conversely, the age group of 10 to 14 year olds has the lowest likelihood of being enrolled in a private school, with 15,246 (96.8% in the age bracket) attending a public institution.
| Age Bracket | Public School | Private School |
| 3 to 4 Year Olds | 1,817 (82.4%) | 389 (17.6%) |
| 5 to 9 Year Old | 12,594 (91.8%) | 1,117 (8.2%) |
| 10 to 14 Year Olds | 15,246 (96.8%) | 505 (3.2%) |
| 15 to 17 Year Olds | 8,441 (93.6%) | 578 (6.4%) |
| 18 to 19 Year Olds | 6,163 (94.1%) | 384 (5.9%) |
| 20 to 24 Year Olds | 11,125 (94.7%) | 627 (5.3%) |
| 25 to 34 Year Olds | 3,855 (85.2%) | 669 (14.8%) |
| 35 Years and over | 2,881 (79.8%) | 728 (20.2%) |
| Total | 62,152 (92.6%) | 4,967 (7.4%) |
Educational Attainment by Field of Study in Dona Ana County
Education (6,924 | 15.8%), business (6,921 | 15.8%), science & technology (3,998 | 9.1%), engineering (3,711 | 8.5%), and bio, nature & agricultural (3,606 | 8.3%) are the most common fields of study among 43,700 individuals in Dona Ana County who have obtained a bachelor's degree or higher.
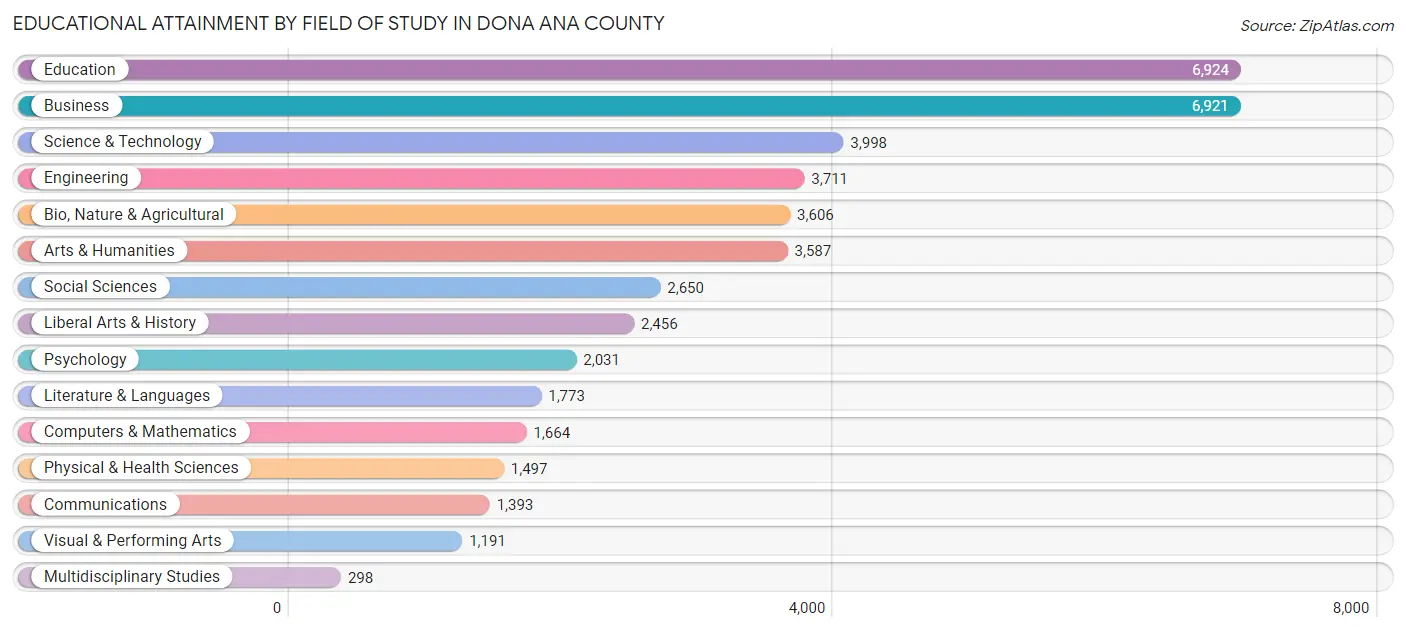
| Field of Study | # Graduates | % Graduates |
| Computers & Mathematics | 1,664 | 3.8% |
| Bio, Nature & Agricultural | 3,606 | 8.3% |
| Physical & Health Sciences | 1,497 | 3.4% |
| Psychology | 2,031 | 4.6% |
| Social Sciences | 2,650 | 6.1% |
| Engineering | 3,711 | 8.5% |
| Multidisciplinary Studies | 298 | 0.7% |
| Science & Technology | 3,998 | 9.1% |
| Business | 6,921 | 15.8% |
| Education | 6,924 | 15.8% |
| Literature & Languages | 1,773 | 4.1% |
| Liberal Arts & History | 2,456 | 5.6% |
| Visual & Performing Arts | 1,191 | 2.7% |
| Communications | 1,393 | 3.2% |
| Arts & Humanities | 3,587 | 8.2% |
| Total | 43,700 | 100.0% |
Transportation & Commute in Dona Ana County
Vehicle Availability by Sex in Dona Ana County
The most prevalent vehicle ownership categories in Dona Ana County are males with 2 vehicles (17,890, accounting for 36.8%) and females with 2 vehicles (14,248, making up 43.1%).
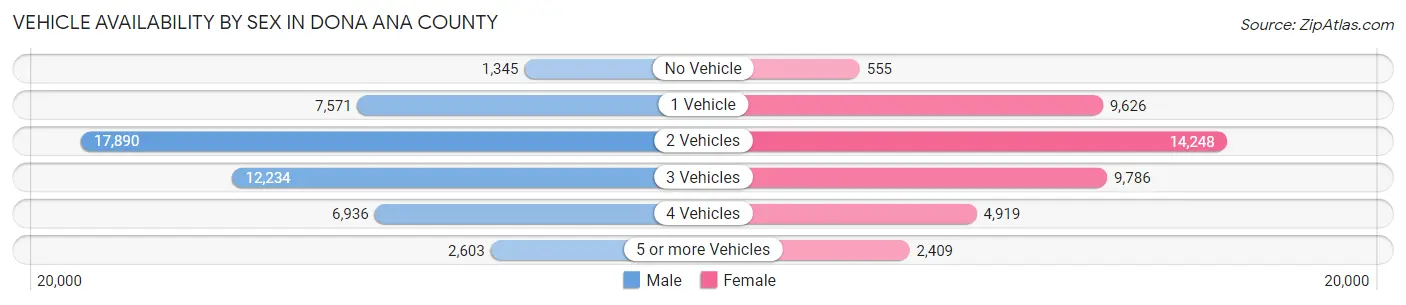
| Vehicles Available | Male | Female |
| No Vehicle | 1,345 (2.8%) | 555 (1.3%) |
| 1 Vehicle | 7,571 (15.6%) | 9,626 (23.2%) |
| 2 Vehicles | 17,890 (36.8%) | 14,248 (34.3%) |
| 3 Vehicles | 12,234 (25.2%) | 9,786 (23.6%) |
| 4 Vehicles | 6,936 (14.3%) | 4,919 (11.8%) |
| 5 or more Vehicles | 2,603 (5.4%) | 2,409 (5.8%) |
| Total | 48,579 (100.0%) | 41,543 (100.0%) |
Commute Time in Dona Ana County
The most frequently occuring commute durations in Dona Ana County are 15 to 19 minutes (18,869 commuters, 22.3%), 10 to 14 minutes (15,407 commuters, 18.2%), and 20 to 24 minutes (11,546 commuters, 13.6%).
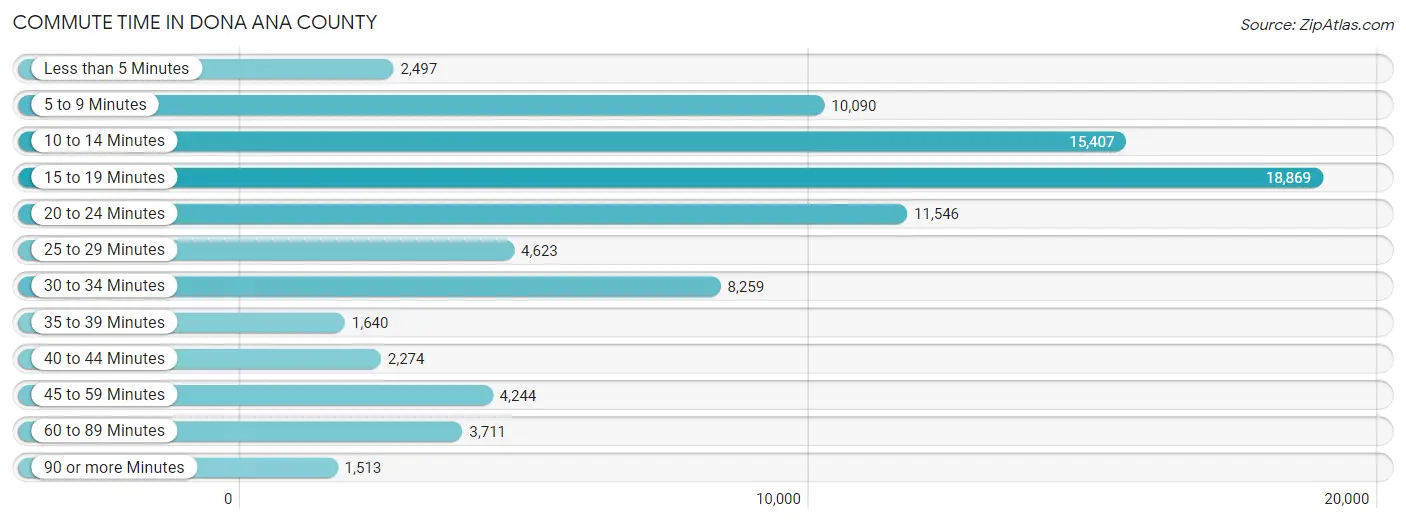
| Commute Time | # Commuters | % Commuters |
| Less than 5 Minutes | 2,497 | 2.9% |
| 5 to 9 Minutes | 10,090 | 11.9% |
| 10 to 14 Minutes | 15,407 | 18.2% |
| 15 to 19 Minutes | 18,869 | 22.3% |
| 20 to 24 Minutes | 11,546 | 13.6% |
| 25 to 29 Minutes | 4,623 | 5.5% |
| 30 to 34 Minutes | 8,259 | 9.8% |
| 35 to 39 Minutes | 1,640 | 1.9% |
| 40 to 44 Minutes | 2,274 | 2.7% |
| 45 to 59 Minutes | 4,244 | 5.0% |
| 60 to 89 Minutes | 3,711 | 4.4% |
| 90 or more Minutes | 1,513 | 1.8% |
Commute Time by Sex in Dona Ana County
The most common commute times in Dona Ana County are 15 to 19 minutes (10,786 commuters, 23.5%) for males and 15 to 19 minutes (8,083 commuters, 20.8%) for females.
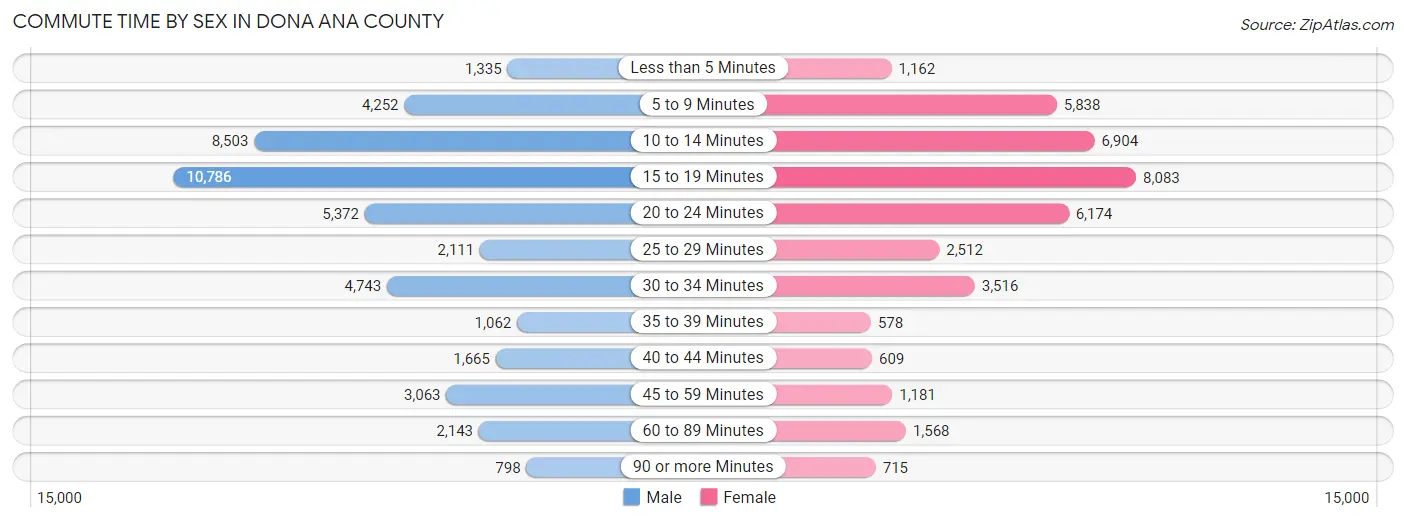
| Commute Time | Male | Female |
| Less than 5 Minutes | 1,335 (2.9%) | 1,162 (3.0%) |
| 5 to 9 Minutes | 4,252 (9.3%) | 5,838 (15.0%) |
| 10 to 14 Minutes | 8,503 (18.5%) | 6,904 (17.8%) |
| 15 to 19 Minutes | 10,786 (23.5%) | 8,083 (20.8%) |
| 20 to 24 Minutes | 5,372 (11.7%) | 6,174 (15.9%) |
| 25 to 29 Minutes | 2,111 (4.6%) | 2,512 (6.5%) |
| 30 to 34 Minutes | 4,743 (10.3%) | 3,516 (9.0%) |
| 35 to 39 Minutes | 1,062 (2.3%) | 578 (1.5%) |
| 40 to 44 Minutes | 1,665 (3.6%) | 609 (1.6%) |
| 45 to 59 Minutes | 3,063 (6.7%) | 1,181 (3.0%) |
| 60 to 89 Minutes | 2,143 (4.7%) | 1,568 (4.0%) |
| 90 or more Minutes | 798 (1.7%) | 715 (1.8%) |
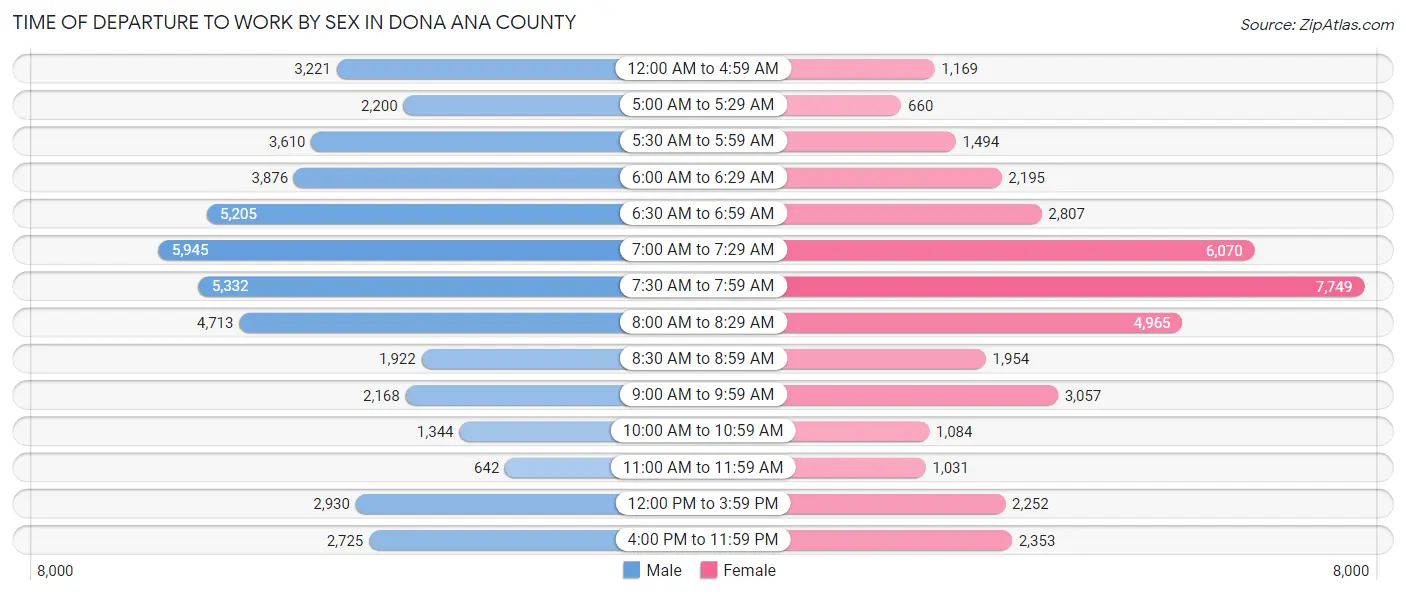
Time of Departure to Work by Sex in Dona Ana County
The most frequent times of departure to work in Dona Ana County are 7:00 AM to 7:29 AM (5,945, 13.0%) for males and 7:30 AM to 7:59 AM (7,749, 20.0%) for females.
| Time of Departure | Male | Female |
| 12:00 AM to 4:59 AM | 3,221 (7.0%) | 1,169 (3.0%) |
| 5:00 AM to 5:29 AM | 2,200 (4.8%) | 660 (1.7%) |
| 5:30 AM to 5:59 AM | 3,610 (7.9%) | 1,494 (3.8%) |
| 6:00 AM to 6:29 AM | 3,876 (8.5%) | 2,195 (5.7%) |
| 6:30 AM to 6:59 AM | 5,205 (11.4%) | 2,807 (7.2%) |
| 7:00 AM to 7:29 AM | 5,945 (13.0%) | 6,070 (15.6%) |
| 7:30 AM to 7:59 AM | 5,332 (11.6%) | 7,749 (20.0%) |
| 8:00 AM to 8:29 AM | 4,713 (10.3%) | 4,965 (12.8%) |
| 8:30 AM to 8:59 AM | 1,922 (4.2%) | 1,954 (5.0%) |
| 9:00 AM to 9:59 AM | 2,168 (4.7%) | 3,057 (7.9%) |
| 10:00 AM to 10:59 AM | 1,344 (2.9%) | 1,084 (2.8%) |
| 11:00 AM to 11:59 AM | 642 (1.4%) | 1,031 (2.6%) |
| 12:00 PM to 3:59 PM | 2,930 (6.4%) | 2,252 (5.8%) |
| 4:00 PM to 11:59 PM | 2,725 (5.9%) | 2,353 (6.1%) |
| Total | 45,833 (100.0%) | 38,840 (100.0%) |
Housing Occupancy in Dona Ana County
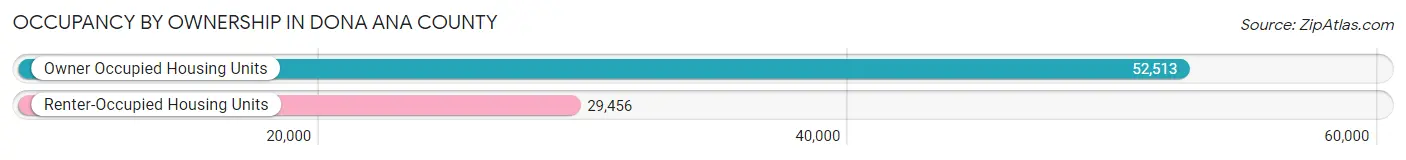
Occupancy by Ownership in Dona Ana County
Of the total 81,969 dwellings in Dona Ana County, owner-occupied units account for 52,513 (64.1%), while renter-occupied units make up 29,456 (35.9%).
| Occupancy | # Housing Units | % Housing Units |
| Owner Occupied Housing Units | 52,513 | 64.1% |
| Renter-Occupied Housing Units | 29,456 | 35.9% |
| Total Occupied Housing Units | 81,969 | 100.0% |
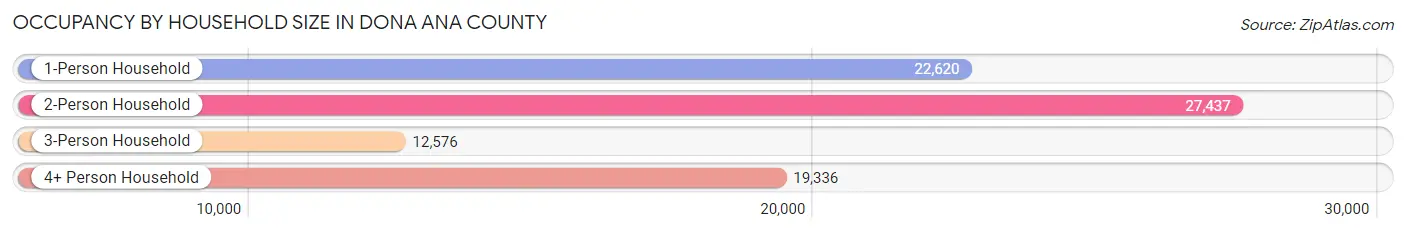
Occupancy by Household Size in Dona Ana County
| Household Size | # Housing Units | % Housing Units |
| 1-Person Household | 22,620 | 27.6% |
| 2-Person Household | 27,437 | 33.5% |
| 3-Person Household | 12,576 | 15.3% |
| 4+ Person Household | 19,336 | 23.6% |
| Total Housing Units | 81,969 | 100.0% |
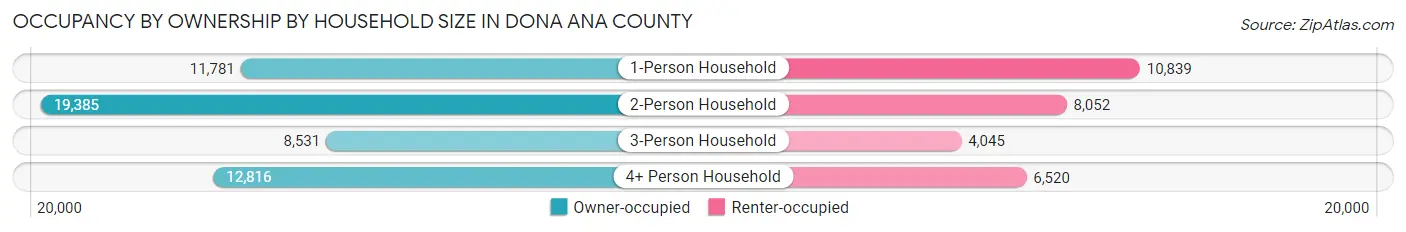
Occupancy by Ownership by Household Size in Dona Ana County
| Household Size | Owner-occupied | Renter-occupied |
| 1-Person Household | 11,781 (52.1%) | 10,839 (47.9%) |
| 2-Person Household | 19,385 (70.7%) | 8,052 (29.3%) |
| 3-Person Household | 8,531 (67.8%) | 4,045 (32.2%) |
| 4+ Person Household | 12,816 (66.3%) | 6,520 (33.7%) |
| Total Housing Units | 52,513 (64.1%) | 29,456 (35.9%) |
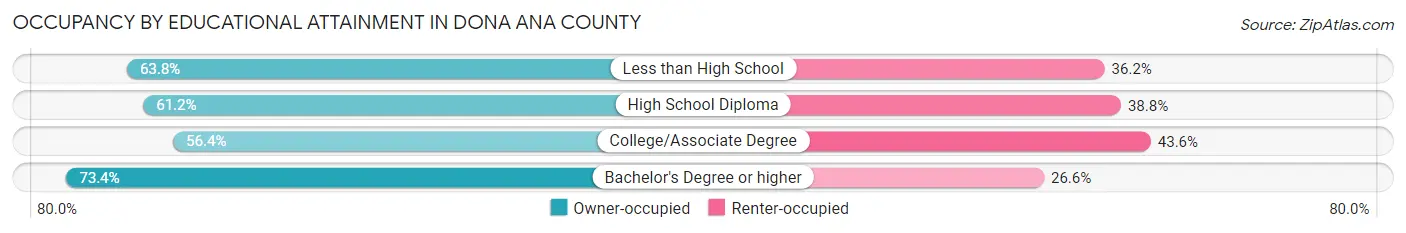
Occupancy by Educational Attainment in Dona Ana County
| Household Size | Owner-occupied | Renter-occupied |
| Less than High School | 8,429 (63.8%) | 4,790 (36.2%) |
| High School Diploma | 10,020 (61.2%) | 6,360 (38.8%) |
| College/Associate Degree | 14,530 (56.4%) | 11,217 (43.6%) |
| Bachelor's Degree or higher | 19,534 (73.4%) | 7,089 (26.6%) |
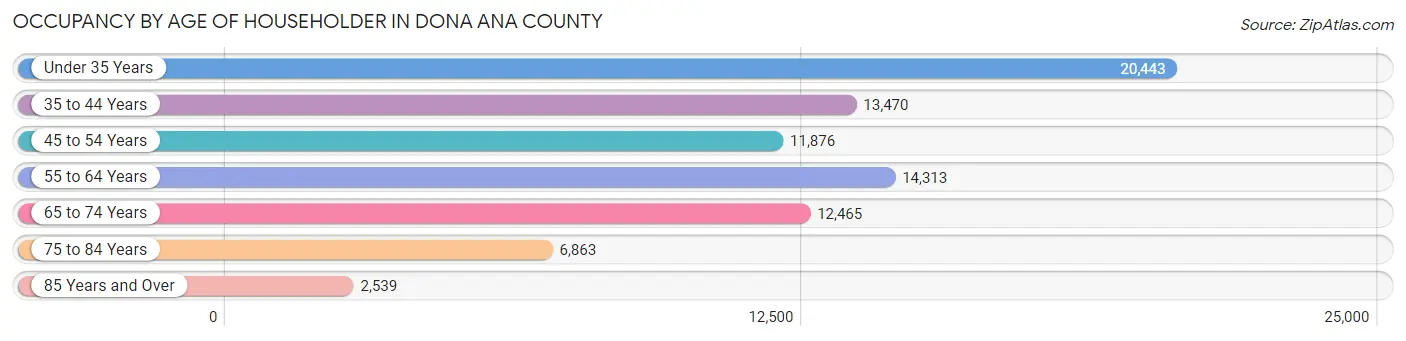
Occupancy by Age of Householder in Dona Ana County
| Age Bracket | # Households | % Households |
| Under 35 Years | 20,443 | 24.9% |
| 35 to 44 Years | 13,470 | 16.4% |
| 45 to 54 Years | 11,876 | 14.5% |
| 55 to 64 Years | 14,313 | 17.5% |
| 65 to 74 Years | 12,465 | 15.2% |
| 75 to 84 Years | 6,863 | 8.4% |
| 85 Years and Over | 2,539 | 3.1% |
| Total | 81,969 | 100.0% |
Housing Finances in Dona Ana County
Median Income by Occupancy in Dona Ana County
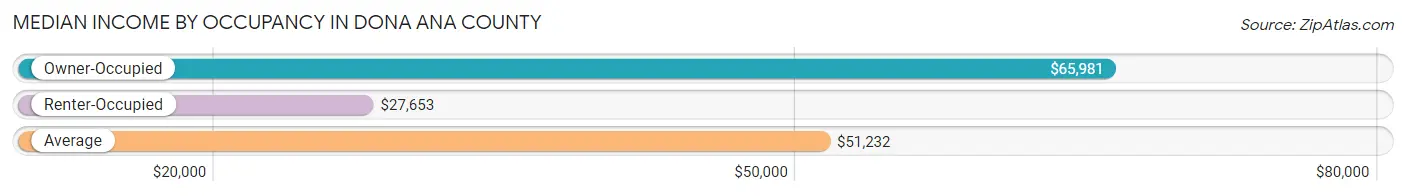
| Occupancy Type | # Households | Median Income |
| Owner-Occupied | 52,513 (64.1%) | $65,981 |
| Renter-Occupied | 29,456 (35.9%) | $27,653 |
| Average | 81,969 (100.0%) | $51,232 |
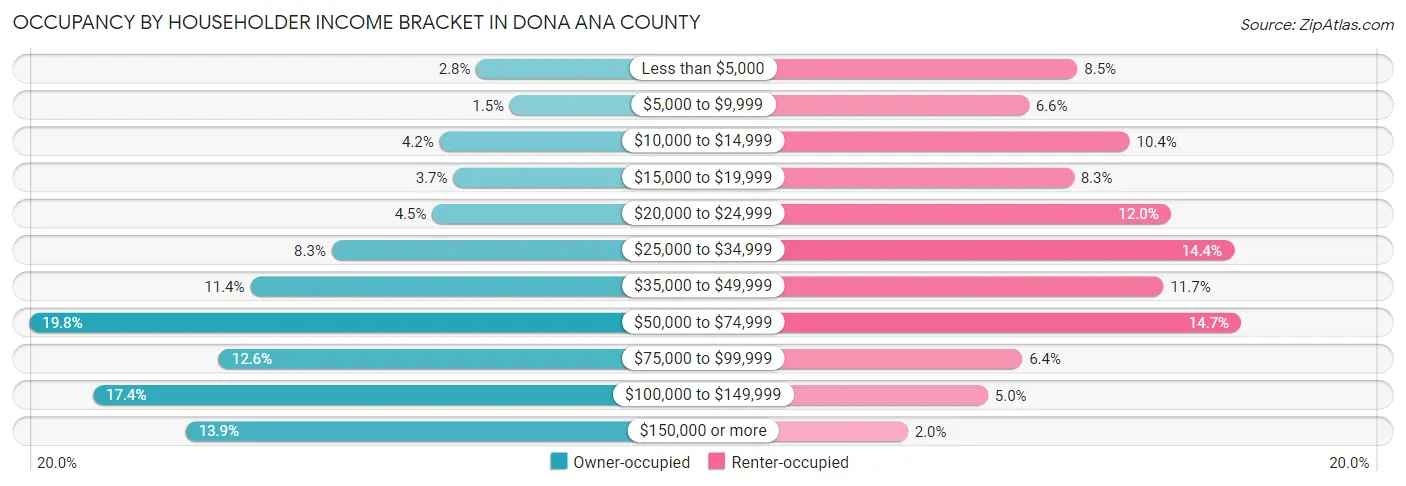
Occupancy by Householder Income Bracket in Dona Ana County
| Income Bracket | Owner-occupied | Renter-occupied |
| Less than $5,000 | 1,463 (2.8%) | 2,489 (8.5%) |
| $5,000 to $9,999 | 793 (1.5%) | 1,944 (6.6%) |
| $10,000 to $14,999 | 2,201 (4.2%) | 3,075 (10.4%) |
| $15,000 to $19,999 | 1,928 (3.7%) | 2,449 (8.3%) |
| $20,000 to $24,999 | 2,345 (4.5%) | 3,536 (12.0%) |
| $25,000 to $34,999 | 4,356 (8.3%) | 4,244 (14.4%) |
| $35,000 to $49,999 | 5,989 (11.4%) | 3,454 (11.7%) |
| $50,000 to $74,999 | 10,410 (19.8%) | 4,323 (14.7%) |
| $75,000 to $99,999 | 6,617 (12.6%) | 1,871 (6.4%) |
| $100,000 to $149,999 | 9,131 (17.4%) | 1,486 (5.0%) |
| $150,000 or more | 7,280 (13.9%) | 585 (2.0%) |
| Total | 52,513 (100.0%) | 29,456 (100.0%) |
Monthly Housing Cost Tiers in Dona Ana County
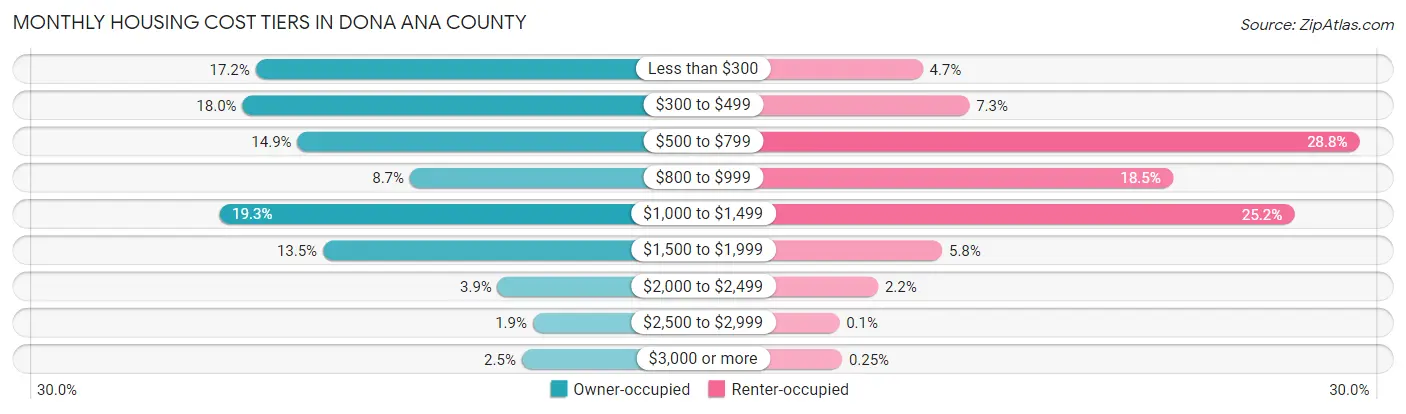
| Monthly Cost | Owner-occupied | Renter-occupied |
| Less than $300 | 9,055 (17.2%) | 1,384 (4.7%) |
| $300 to $499 | 9,438 (18.0%) | 2,143 (7.3%) |
| $500 to $799 | 7,840 (14.9%) | 8,488 (28.8%) |
| $800 to $999 | 4,580 (8.7%) | 5,452 (18.5%) |
| $1,000 to $1,499 | 10,116 (19.3%) | 7,429 (25.2%) |
| $1,500 to $1,999 | 7,100 (13.5%) | 1,704 (5.8%) |
| $2,000 to $2,499 | 2,034 (3.9%) | 660 (2.2%) |
| $2,500 to $2,999 | 1,015 (1.9%) | 28 (0.1%) |
| $3,000 or more | 1,335 (2.5%) | 75 (0.3%) |
| Total | 52,513 (100.0%) | 29,456 (100.0%) |
Physical Housing Characteristics in Dona Ana County
Housing Structures in Dona Ana County
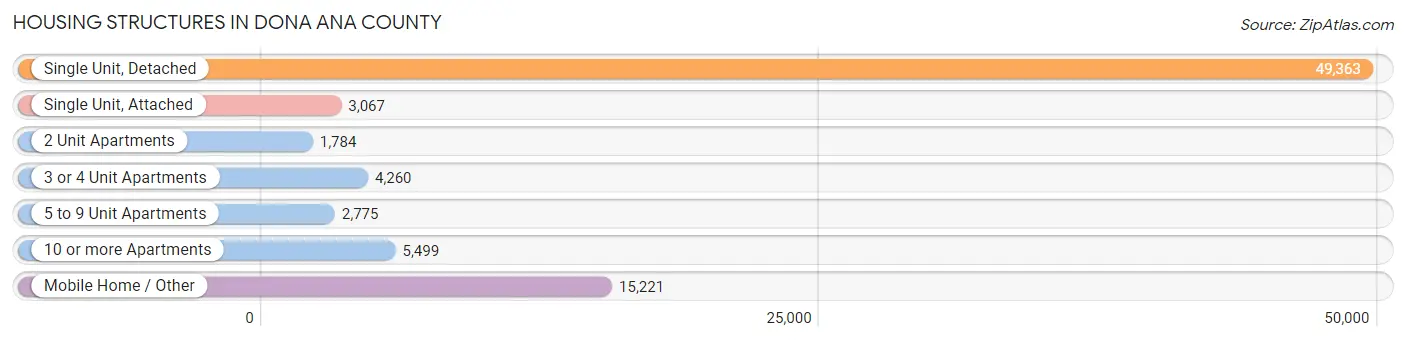
| Structure Type | # Housing Units | % Housing Units |
| Single Unit, Detached | 49,363 | 60.2% |
| Single Unit, Attached | 3,067 | 3.7% |
| 2 Unit Apartments | 1,784 | 2.2% |
| 3 or 4 Unit Apartments | 4,260 | 5.2% |
| 5 to 9 Unit Apartments | 2,775 | 3.4% |
| 10 or more Apartments | 5,499 | 6.7% |
| Mobile Home / Other | 15,221 | 18.6% |
| Total | 81,969 | 100.0% |
Housing Structures by Occupancy in Dona Ana County
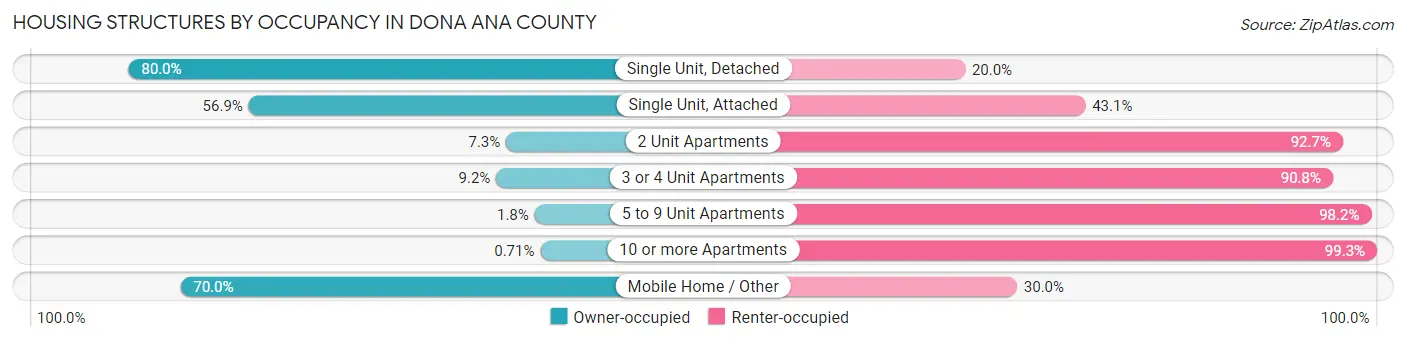
| Structure Type | Owner-occupied | Renter-occupied |
| Single Unit, Detached | 39,501 (80.0%) | 9,862 (20.0%) |
| Single Unit, Attached | 1,744 (56.9%) | 1,323 (43.1%) |
| 2 Unit Apartments | 130 (7.3%) | 1,654 (92.7%) |
| 3 or 4 Unit Apartments | 392 (9.2%) | 3,868 (90.8%) |
| 5 to 9 Unit Apartments | 50 (1.8%) | 2,725 (98.2%) |
| 10 or more Apartments | 39 (0.7%) | 5,460 (99.3%) |
| Mobile Home / Other | 10,657 (70.0%) | 4,564 (30.0%) |
| Total | 52,513 (64.1%) | 29,456 (35.9%) |
Housing Structures by Number of Rooms in Dona Ana County
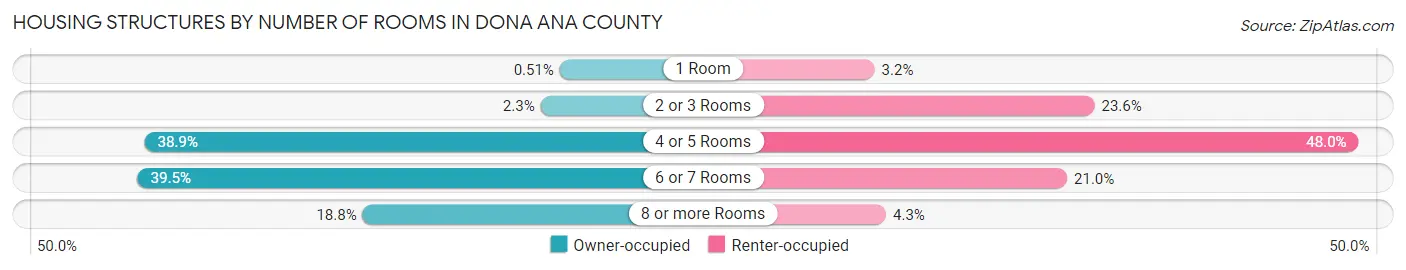
| Number of Rooms | Owner-occupied | Renter-occupied |
| 1 Room | 268 (0.5%) | 946 (3.2%) |
| 2 or 3 Rooms | 1,205 (2.3%) | 6,936 (23.5%) |
| 4 or 5 Rooms | 20,428 (38.9%) | 14,125 (47.9%) |
| 6 or 7 Rooms | 20,765 (39.5%) | 6,190 (21.0%) |
| 8 or more Rooms | 9,847 (18.8%) | 1,259 (4.3%) |
| Total | 52,513 (100.0%) | 29,456 (100.0%) |
Housing Structure by Heating Type in Dona Ana County
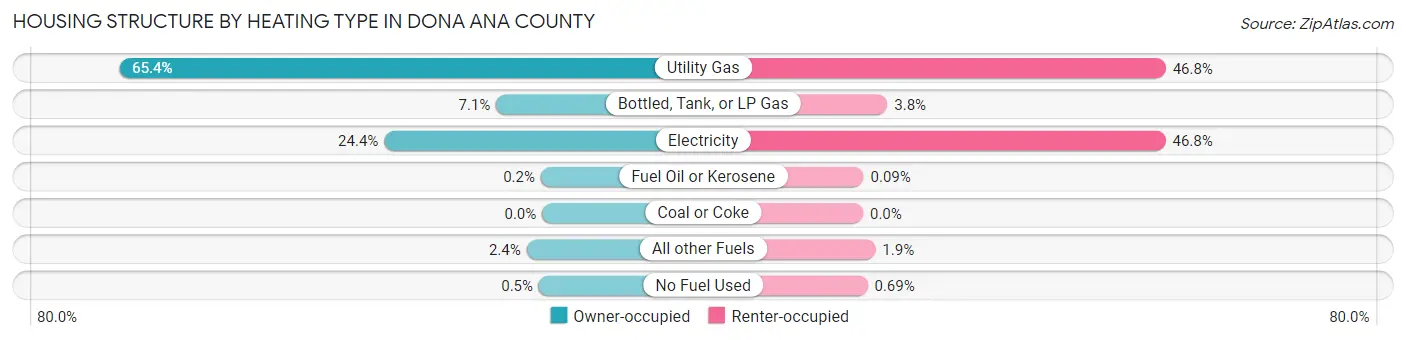
| Heating Type | Owner-occupied | Renter-occupied |
| Utility Gas | 34,335 (65.4%) | 13,781 (46.8%) |
| Bottled, Tank, or LP Gas | 3,727 (7.1%) | 1,106 (3.7%) |
| Electricity | 12,826 (24.4%) | 13,775 (46.8%) |
| Fuel Oil or Kerosene | 105 (0.2%) | 27 (0.1%) |
| Coal or Coke | 0 (0.0%) | 0 (0.0%) |
| All other Fuels | 1,259 (2.4%) | 563 (1.9%) |
| No Fuel Used | 261 (0.5%) | 204 (0.7%) |
| Total | 52,513 (100.0%) | 29,456 (100.0%) |
Household Vehicle Usage in Dona Ana County
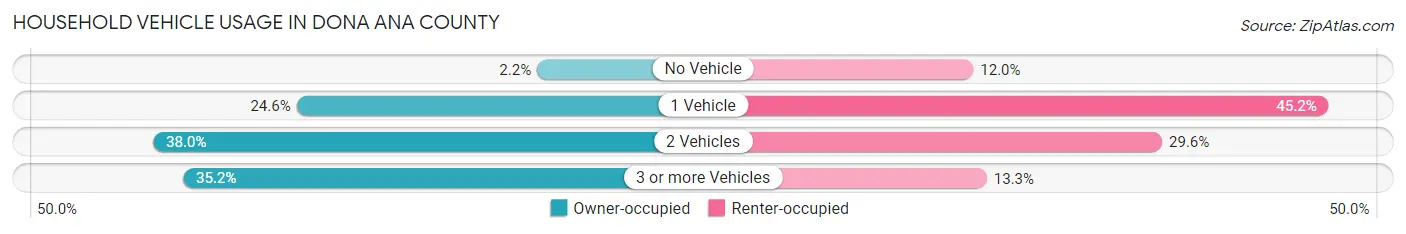
| Vehicles per Household | Owner-occupied | Renter-occupied |
| No Vehicle | 1,139 (2.2%) | 3,531 (12.0%) |
| 1 Vehicle | 12,931 (24.6%) | 13,300 (45.2%) |
| 2 Vehicles | 19,956 (38.0%) | 8,721 (29.6%) |
| 3 or more Vehicles | 18,487 (35.2%) | 3,904 (13.3%) |
| Total | 52,513 (100.0%) | 29,456 (100.0%) |
Real Estate & Mortgages in Dona Ana County
Real Estate and Mortgage Overview in Dona Ana County
| Characteristic | Without Mortgage | With Mortgage |
| Housing Units | 24,686 | 27,827 |
| Median Property Value | $154,500 | $213,900 |
| Median Household Income | $55,127 | $5,088 |
| Monthly Housing Costs | $376 | $1,289 |
| Real Estate Taxes | $1,080 | $1,336 |
Property Value by Mortgage Status in Dona Ana County
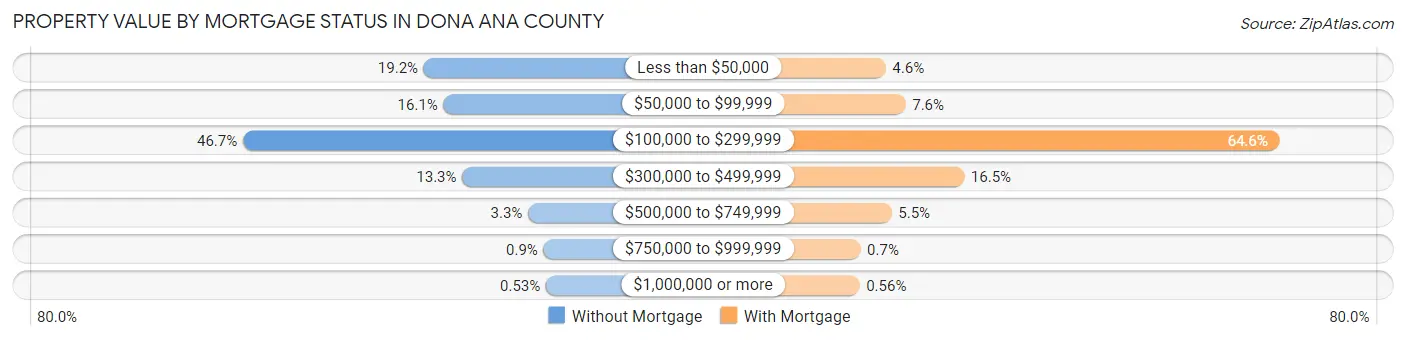
| Property Value | Without Mortgage | With Mortgage |
| Less than $50,000 | 4,728 (19.2%) | 1,267 (4.5%) |
| $50,000 to $99,999 | 3,985 (16.1%) | 2,109 (7.6%) |
| $100,000 to $299,999 | 11,533 (46.7%) | 17,988 (64.6%) |
| $300,000 to $499,999 | 3,281 (13.3%) | 4,594 (16.5%) |
| $500,000 to $749,999 | 805 (3.3%) | 1,516 (5.4%) |
| $750,000 to $999,999 | 223 (0.9%) | 196 (0.7%) |
| $1,000,000 or more | 131 (0.5%) | 157 (0.6%) |
| Total | 24,686 (100.0%) | 27,827 (100.0%) |
Household Income by Mortgage Status in Dona Ana County
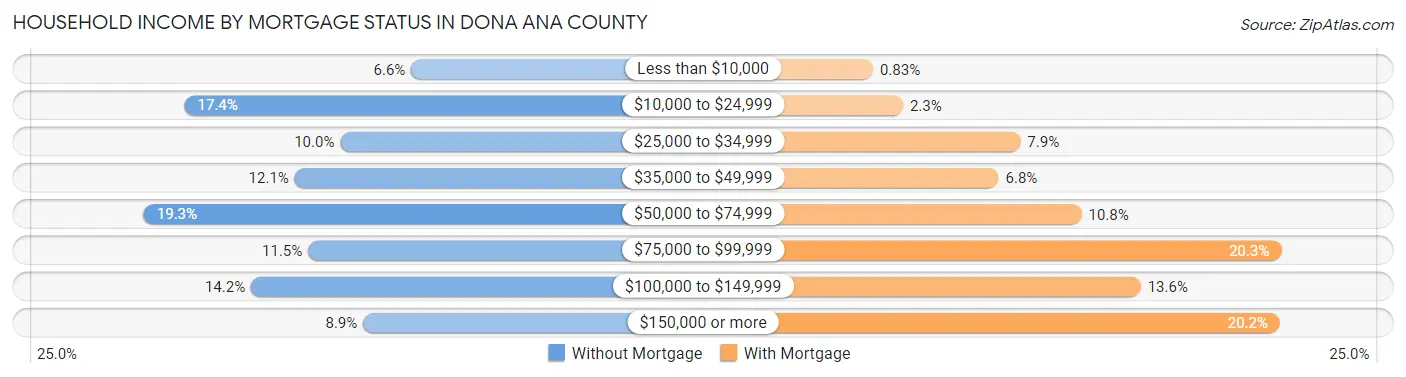
| Household Income | Without Mortgage | With Mortgage |
| Less than $10,000 | 1,628 (6.6%) | 230 (0.8%) |
| $10,000 to $24,999 | 4,290 (17.4%) | 628 (2.3%) |
| $25,000 to $34,999 | 2,462 (10.0%) | 2,184 (7.9%) |
| $35,000 to $49,999 | 2,996 (12.1%) | 1,894 (6.8%) |
| $50,000 to $74,999 | 4,769 (19.3%) | 2,993 (10.8%) |
| $75,000 to $99,999 | 2,839 (11.5%) | 5,641 (20.3%) |
| $100,000 to $149,999 | 3,510 (14.2%) | 3,778 (13.6%) |
| $150,000 or more | 2,192 (8.9%) | 5,621 (20.2%) |
| Total | 24,686 (100.0%) | 27,827 (100.0%) |
Property Value to Household Income Ratio in Dona Ana County
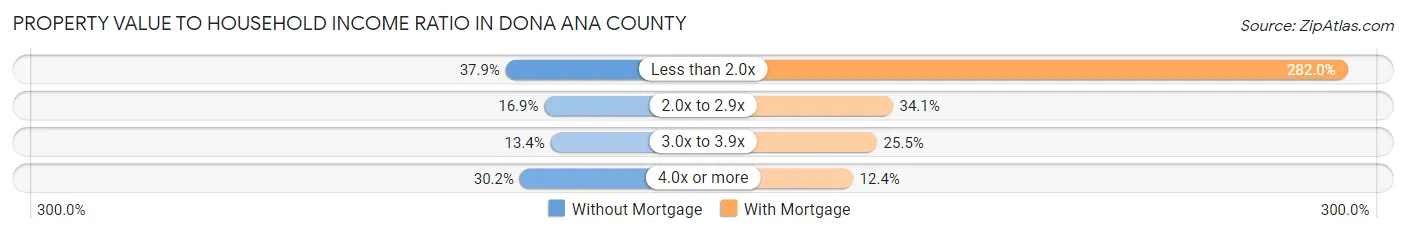
| Value-to-Income Ratio | Without Mortgage | With Mortgage |
| Less than 2.0x | 9,351 (37.9%) | 78,477 (282.0%) |
| 2.0x to 2.9x | 4,164 (16.9%) | 9,494 (34.1%) |
| 3.0x to 3.9x | 3,308 (13.4%) | 7,085 (25.5%) |
| 4.0x or more | 7,454 (30.2%) | 3,449 (12.4%) |
| Total | 24,686 (100.0%) | 27,827 (100.0%) |
Real Estate Taxes by Mortgage Status in Dona Ana County
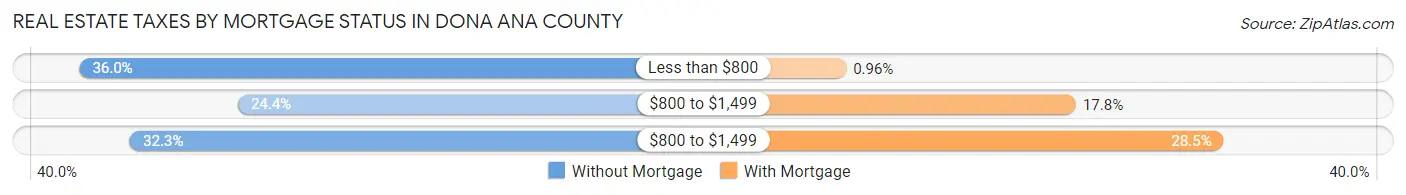
| Property Taxes | Without Mortgage | With Mortgage |
| Less than $800 | 8,884 (36.0%) | 268 (1.0%) |
| $800 to $1,499 | 6,025 (24.4%) | 4,939 (17.7%) |
| $800 to $1,499 | 7,972 (32.3%) | 7,938 (28.5%) |
| Total | 24,686 (100.0%) | 27,827 (100.0%) |
Health & Disability in Dona Ana County
Health Insurance Coverage by Age in Dona Ana County
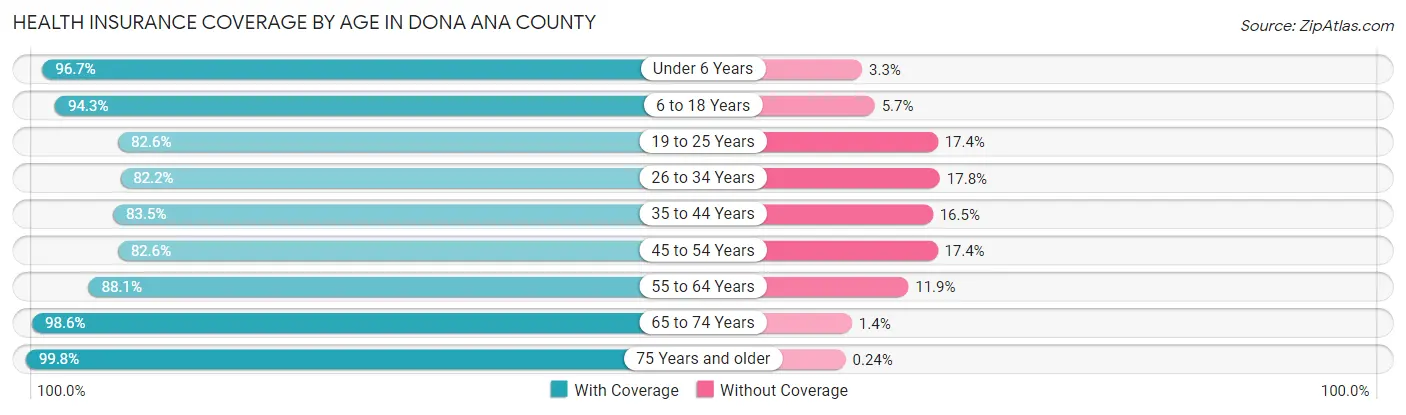
| Age Bracket | With Coverage | Without Coverage |
| Under 6 Years | 15,101 (96.7%) | 518 (3.3%) |
| 6 to 18 Years | 38,797 (94.3%) | 2,336 (5.7%) |
| 19 to 25 Years | 25,441 (82.6%) | 5,365 (17.4%) |
| 26 to 34 Years | 20,490 (82.2%) | 4,446 (17.8%) |
| 35 to 44 Years | 20,134 (83.5%) | 3,975 (16.5%) |
| 45 to 54 Years | 17,780 (82.6%) | 3,737 (17.4%) |
| 55 to 64 Years | 20,926 (88.1%) | 2,835 (11.9%) |
| 65 to 74 Years | 20,042 (98.6%) | 289 (1.4%) |
| 75 Years and older | 14,586 (99.8%) | 35 (0.2%) |
| Total | 193,297 (89.1%) | 23,536 (10.8%) |
Health Insurance Coverage by Citizenship Status in Dona Ana County
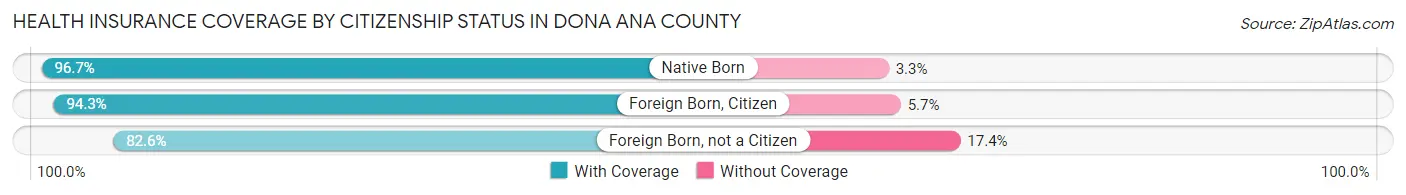
| Citizenship Status | With Coverage | Without Coverage |
| Native Born | 15,101 (96.7%) | 518 (3.3%) |
| Foreign Born, Citizen | 38,797 (94.3%) | 2,336 (5.7%) |
| Foreign Born, not a Citizen | 25,441 (82.6%) | 5,365 (17.4%) |
Health Insurance Coverage by Household Income in Dona Ana County
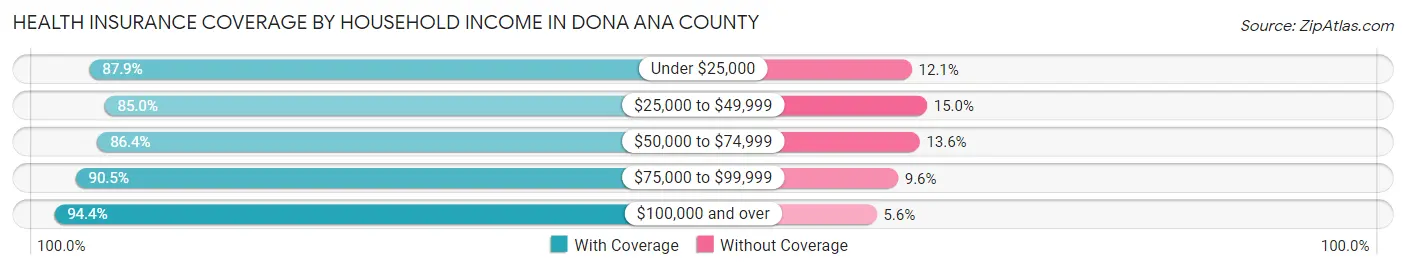
| Household Income | With Coverage | Without Coverage |
| Under $25,000 | 38,230 (87.9%) | 5,284 (12.1%) |
| $25,000 to $49,999 | 38,819 (85.0%) | 6,846 (15.0%) |
| $50,000 to $74,999 | 33,764 (86.4%) | 5,317 (13.6%) |
| $75,000 to $99,999 | 23,794 (90.4%) | 2,512 (9.6%) |
| $100,000 and over | 56,058 (94.4%) | 3,301 (5.6%) |
Public vs Private Health Insurance Coverage by Age in Dona Ana County
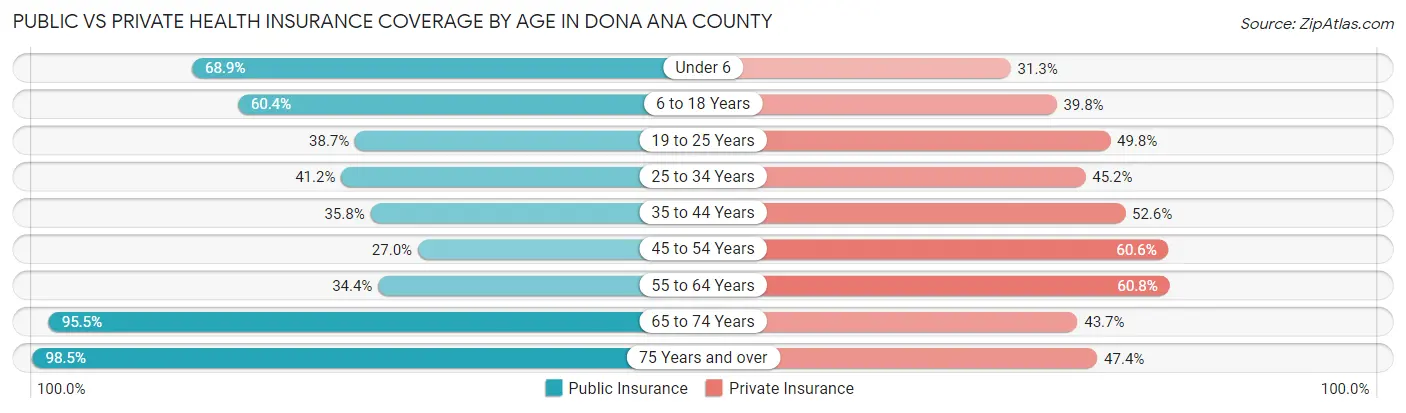
| Age Bracket | Public Insurance | Private Insurance |
| Under 6 | 10,764 (68.9%) | 4,895 (31.3%) |
| 6 to 18 Years | 24,850 (60.4%) | 16,388 (39.8%) |
| 19 to 25 Years | 11,905 (38.7%) | 15,340 (49.8%) |
| 25 to 34 Years | 10,280 (41.2%) | 11,272 (45.2%) |
| 35 to 44 Years | 8,630 (35.8%) | 12,675 (52.6%) |
| 45 to 54 Years | 5,810 (27.0%) | 13,048 (60.6%) |
| 55 to 64 Years | 8,166 (34.4%) | 14,457 (60.8%) |
| 65 to 74 Years | 19,417 (95.5%) | 8,886 (43.7%) |
| 75 Years and over | 14,403 (98.5%) | 6,930 (47.4%) |
| Total | 114,225 (52.7%) | 103,891 (47.9%) |
Disability Status by Sex by Age in Dona Ana County
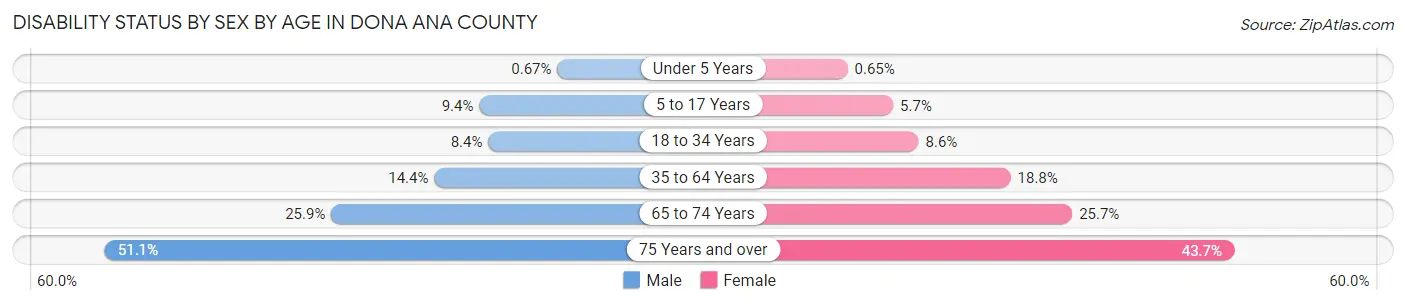
| Age Bracket | Male | Female |
| Under 5 Years | 45 (0.7%) | 41 (0.6%) |
| 5 to 17 Years | 1,880 (9.4%) | 1,102 (5.7%) |
| 18 to 34 Years | 2,500 (8.4%) | 2,581 (8.6%) |
| 35 to 64 Years | 4,781 (14.4%) | 6,791 (18.8%) |
| 65 to 74 Years | 2,541 (25.9%) | 2,695 (25.7%) |
| 75 Years and over | 3,375 (51.1%) | 3,497 (43.6%) |
Disability Class by Sex by Age in Dona Ana County
Disability Class: Hearing Difficulty
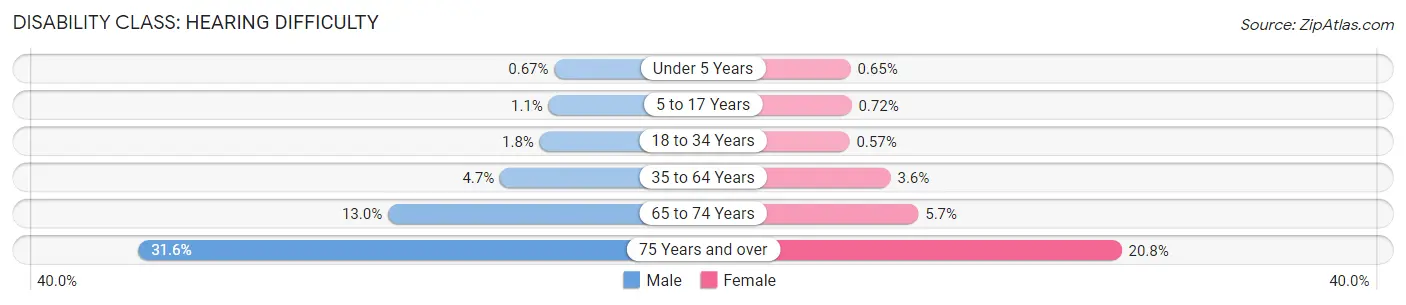
| Age Bracket | Male | Female |
| Under 5 Years | 45 (0.7%) | 41 (0.6%) |
| 5 to 17 Years | 218 (1.1%) | 138 (0.7%) |
| 18 to 34 Years | 528 (1.8%) | 172 (0.6%) |
| 35 to 64 Years | 1,564 (4.7%) | 1,306 (3.6%) |
| 65 to 74 Years | 1,280 (13.0%) | 597 (5.7%) |
| 75 Years and over | 2,086 (31.6%) | 1,664 (20.8%) |
Disability Class: Vision Difficulty
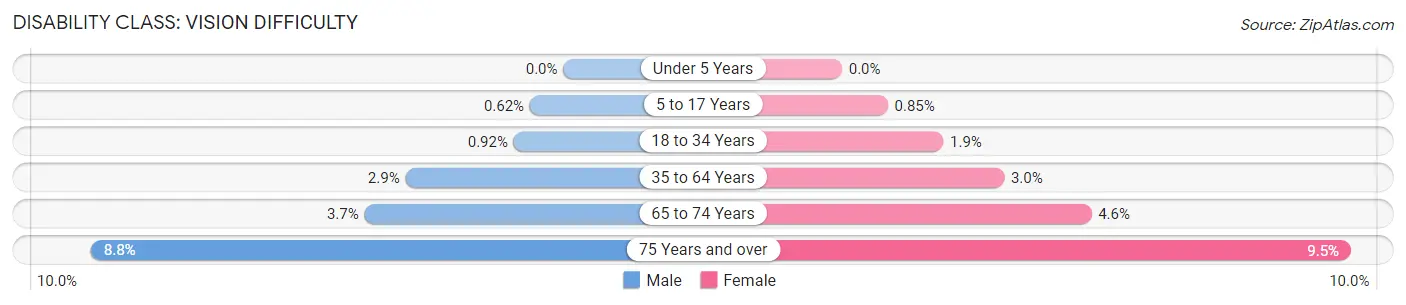
| Age Bracket | Male | Female |
| Under 5 Years | 0 (0.0%) | 0 (0.0%) |
| 5 to 17 Years | 124 (0.6%) | 163 (0.9%) |
| 18 to 34 Years | 275 (0.9%) | 566 (1.9%) |
| 35 to 64 Years | 976 (2.9%) | 1,086 (3.0%) |
| 65 to 74 Years | 363 (3.7%) | 486 (4.6%) |
| 75 Years and over | 580 (8.8%) | 757 (9.5%) |
Disability Class: Cognitive Difficulty
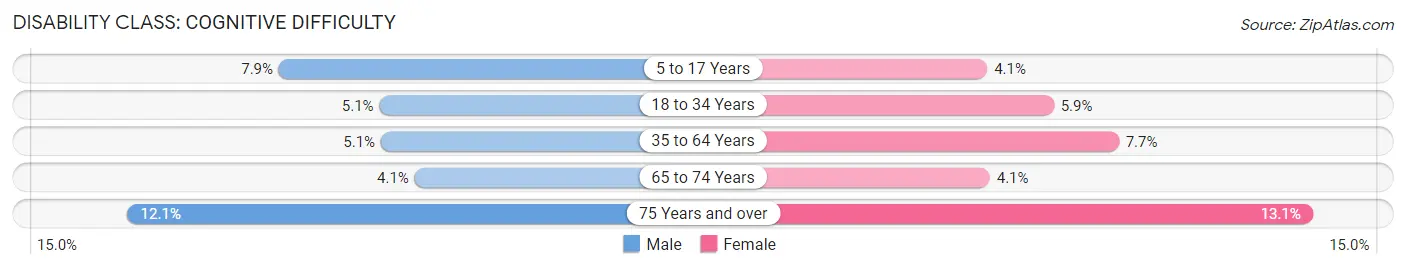
| Age Bracket | Male | Female |
| 5 to 17 Years | 1,591 (7.9%) | 781 (4.1%) |
| 18 to 34 Years | 1,531 (5.1%) | 1,779 (5.9%) |
| 35 to 64 Years | 1,689 (5.1%) | 2,784 (7.7%) |
| 65 to 74 Years | 407 (4.1%) | 433 (4.1%) |
| 75 Years and over | 802 (12.1%) | 1,050 (13.1%) |
Disability Class: Ambulatory Difficulty
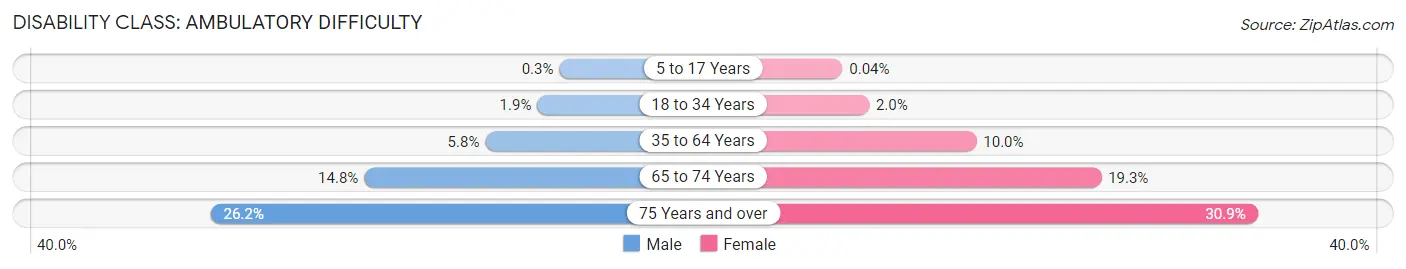
| Age Bracket | Male | Female |
| 5 to 17 Years | 61 (0.3%) | 7 (0.0%) |
| 18 to 34 Years | 579 (1.9%) | 611 (2.0%) |
| 35 to 64 Years | 1,929 (5.8%) | 3,608 (10.0%) |
| 65 to 74 Years | 1,454 (14.8%) | 2,023 (19.3%) |
| 75 Years and over | 1,731 (26.2%) | 2,472 (30.9%) |
Disability Class: Self-Care Difficulty
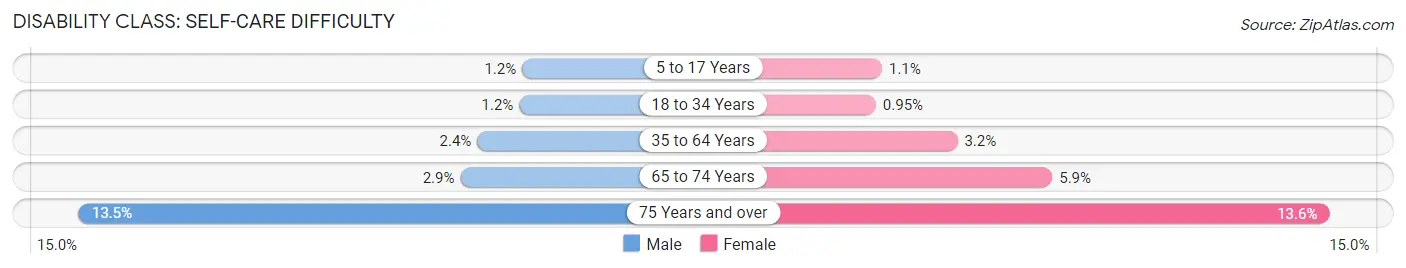
| Age Bracket | Male | Female |
| 5 to 17 Years | 230 (1.1%) | 216 (1.1%) |
| 18 to 34 Years | 369 (1.2%) | 288 (0.9%) |
| 35 to 64 Years | 798 (2.4%) | 1,163 (3.2%) |
| 65 to 74 Years | 282 (2.9%) | 616 (5.9%) |
| 75 Years and over | 892 (13.5%) | 1,087 (13.6%) |
Technology Access in Dona Ana County
Computing Device Access in Dona Ana County
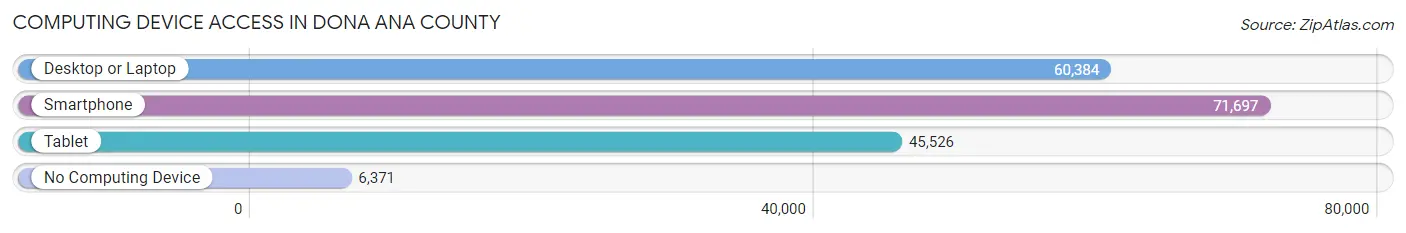
| Device Type | # Households | % Households |
| Desktop or Laptop | 60,384 | 73.7% |
| Smartphone | 71,697 | 87.5% |
| Tablet | 45,526 | 55.5% |
| No Computing Device | 6,371 | 7.8% |
| Total | 81,969 | 100.0% |
Internet Access in Dona Ana County
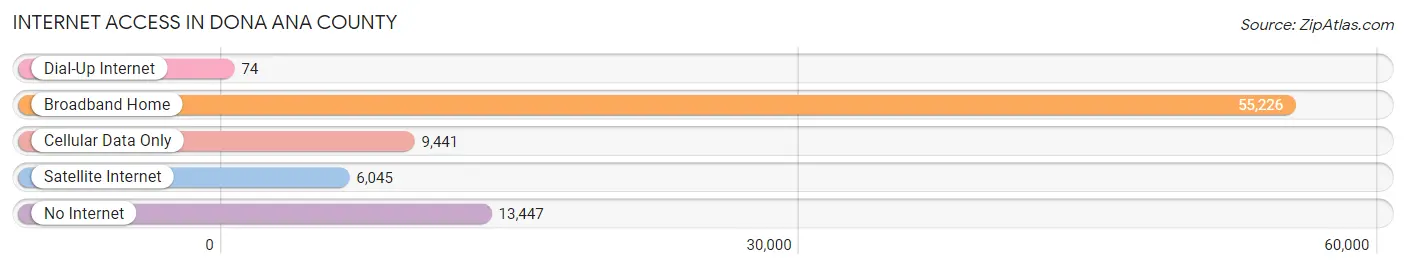
| Internet Type | # Households | % Households |
| Dial-Up Internet | 74 | 0.1% |
| Broadband Home | 55,226 | 67.4% |
| Cellular Data Only | 9,441 | 11.5% |
| Satellite Internet | 6,045 | 7.4% |
| No Internet | 13,447 | 16.4% |
| Total | 81,969 | 100.0% |
Dona Ana County Summary
Dona Ana County is located in the southern part of New Mexico, and is the second most populous county in the state. It is bordered by El Paso County, Texas to the south, and Otero County to the north. The county seat is Las Cruces, and the county is part of the Las Cruces Metropolitan Statistical Area. Dona Ana County covers an area of 3,845 square miles, and has a population of 209,233 as of the 2010 census.
History
Dona Ana County was established in 1852, and was named after the Spanish noblewoman Doña Ana Maria de Aguayo. The county was originally part of the New Mexico Territory, and was part of the Gadsden Purchase in 1853. The county was initially populated by Native American tribes, including the Apache, Comanche, and Navajo. The first settlers in the area were Spanish colonists, who established the towns of Mesilla and Las Cruces.
The county was an important stop on the Butterfield Overland Mail route, which ran from St. Louis, Missouri to San Francisco, California. The route passed through the county, and the town of Mesilla served as a major stop. The county was also an important stop on the Santa Fe Trail, which ran from Missouri to Santa Fe, New Mexico.
During the American Civil War, the county was the site of several battles between Confederate and Union forces. The Battle of Valverde was fought in the county in 1862, and the Battle of Picacho Pass was fought in the county in 1863.
Geography
Dona Ana County is located in the southern part of New Mexico, and is bordered by El Paso County, Texas to the south, and Otero County to the north. The county covers an area of 3,845 square miles, and has a population of 209,233 as of the 2010 census.
The county is located in the Chihuahuan Desert, and is characterized by hot, dry summers and mild winters. The county is home to several mountain ranges, including the Organ Mountains, the San Andres Mountains, and the Franklin Mountains. The Rio Grande flows through the county, and is a major source of water for the region.
Economy
Dona Ana County has a diverse economy, with a mix of agriculture, manufacturing, and services. The county is home to several large employers, including White Sands Missile Range, New Mexico State University, and the Las Cruces Public Schools.
Agriculture is an important part of the county's economy, and the county is home to several large farms and ranches. The county is a major producer of pecans, chile peppers, and onions. The county is also home to several wineries, and is a major producer of wine.
Manufacturing is also an important part of the county's economy, and the county is home to several large factories. The county is home to several large electronics manufacturers, as well as several food processing plants.
Demographics
As of the 2010 census, Dona Ana County had a population of 209,233. The racial makeup of the county was 73.3% White, 2.2% African American, 1.2% Native American, 0.7% Asian, 0.1% Pacific Islander, 19.2% from other races, and 3.5% from two or more races. Hispanic or Latino of any race were 57.2% of the population.
The median household income in the county was $41,945, and the median family income was $48,945. The per capita income in the county was $20,845. About 17.2% of the population was below the poverty line.
Common Questions
What is Per Capita Income in Dona Ana County?
Per Capita income in Dona Ana County is $26,900.
What is the Median Family Income in Dona Ana County?
Median Family Income in Dona Ana County is $58,875.
What is the Median Household income in Dona Ana County?
Median Household Income in Dona Ana County is $51,232.
What is Income or Wage Gap in Dona Ana County?
Income or Wage Gap in Dona Ana County is 23.5%.
Women in Dona Ana County earn 76.5 cents for every dollar earned by a man.
What is Family Income Deficit in Dona Ana County?
Family Income Deficit in Dona Ana County is $10,474.
Families that are below poverty line in Dona Ana County earn $10,474 less on average than the poverty threshold level.
What is Inequality or Gini Index in Dona Ana County?
Inequality or Gini Index in Dona Ana County is 0.48.
What is the Total Population of Dona Ana County?
Total Population of Dona Ana County is 219,870.
What is the Total Male Population of Dona Ana County?
Total Male Population of Dona Ana County is 108,834.
What is the Total Female Population of Dona Ana County?
Total Female Population of Dona Ana County is 111,036.
What is the Ratio of Males per 100 Females in Dona Ana County?
There are 98.02 Males per 100 Females in Dona Ana County.
What is the Ratio of Females per 100 Males in Dona Ana County?
There are 102.02 Females per 100 Males in Dona Ana County.
What is the Median Population Age in Dona Ana County?
Median Population Age in Dona Ana County is 33.2 Years.
What is the Average Family Size in Dona Ana County
Average Family Size in Dona Ana County is 3.2 People.
What is the Average Household Size in Dona Ana County
Average Household Size in Dona Ana County is 2.6 People.
How Large is the Labor Force in Dona Ana County?
There are 99,804 People in the Labor Forcein in Dona Ana County.
What is the Percentage of People in the Labor Force in Dona Ana County?
57.4% of People are in the Labor Force in Dona Ana County.
What is the Unemployment Rate in Dona Ana County?
Unemployment Rate in Dona Ana County is 6.8%.