Area Code 575 Map & Demographics
Area Code 575 Map
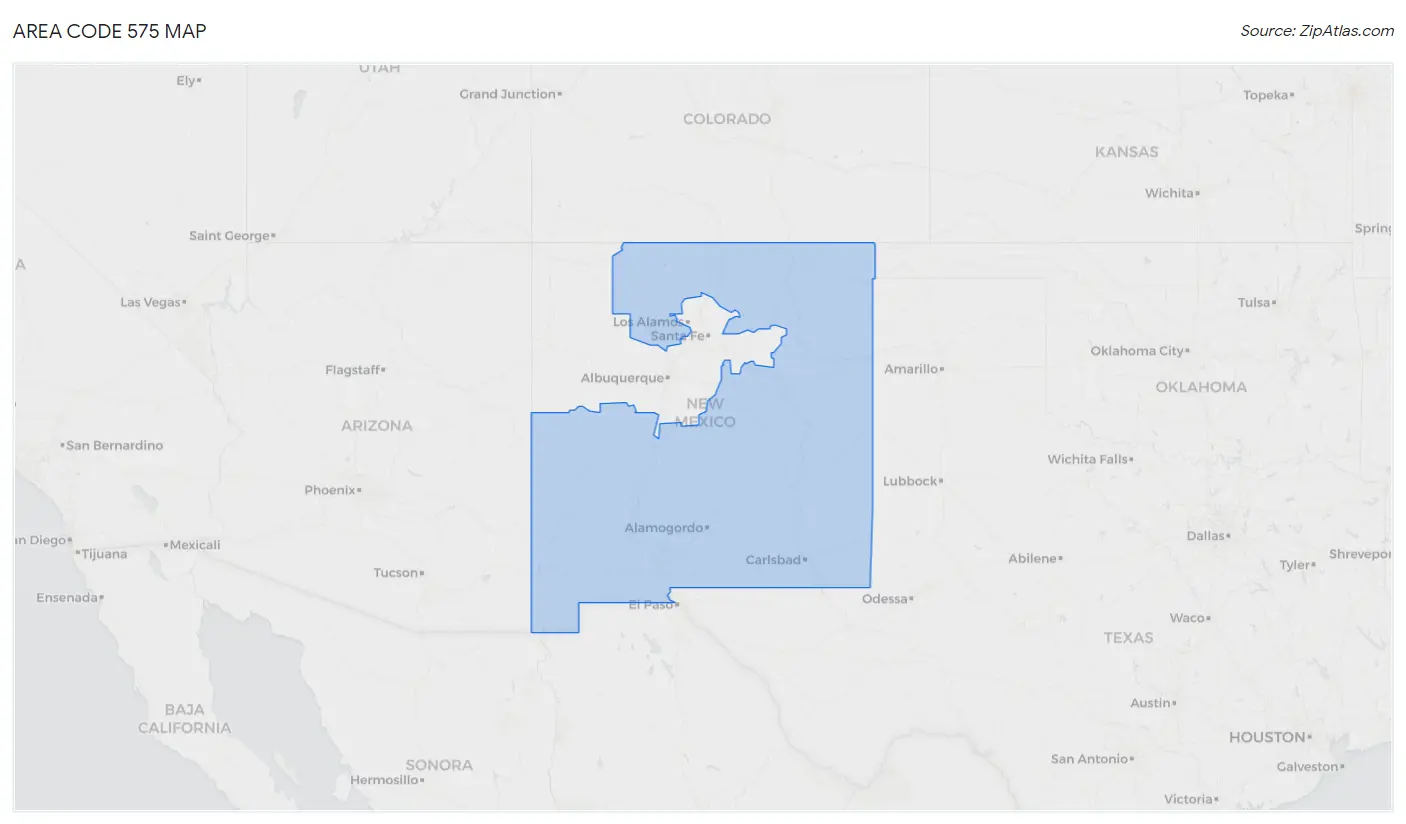
Area Code 575 Overview
$31,861
PER CAPITA INCOME
$67,087
AVG FAMILY INCOME
$53,827
AVG HOUSEHOLD INCOME
34.9%
WAGE / INCOME GAP [ % ]
65.1¢/ $1
WAGE / INCOME GAP [ $ ]
$10,316
FAMILY INCOME DEFICIT
50.41
INEQUALITY / GINI INDEX
663,190
TOTAL POPULATION
335,239
MALE POPULATION
327,951
FEMALE POPULATION
102.22
MALES / 100 FEMALES
97.83
FEMALES / 100 MALES
45.9
MEDIAN AGE
3.3
AVG FAMILY SIZE
2.6
AVG HOUSEHOLD SIZE
264,050
LABOR FORCE [ PEOPLE ]
50.6%
PERCENT IN LABOR FORCE
8.8%
UNEMPLOYMENT RATE
Income in Area Code 575
Income Overview in Area Code 575
Per Capita Income in Area Code 575 is $31,861, while median incomes of families and households are $67,087 and $53,827 respectively.
| Characteristic | Number | Measure |
| Per Capita Income | 663,190 | $31,861 |
| Median Family Income | 154,228 | $67,087 |
| Mean Family Income | 154,228 | $9,270,650 |
| Median Household Income | 247,540 | $53,827 |
| Mean Household Income | 247,540 | $8,523,013 |
| Income Deficit | 154,228 | $10,316 |
| Wage / Income Gap (%) | 663,190 | 34.94% |
| Wage / Income Gap ($) | 663,190 | 65.06¢ per $1 |
| Gini / Inequality Index | 663,190 | 50.41 |
Earnings by Sex in Area Code 575
Average Earnings in Area Code 575 are $36,142, $39,675 for men and $27,264 for women, a difference of 31.3%.
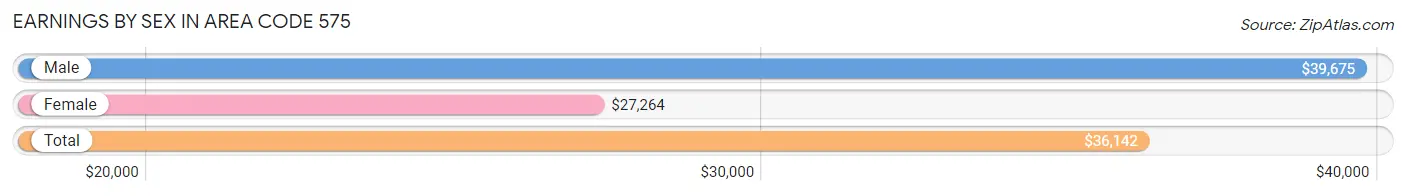
| Sex | Number | Average Earnings |
| Male | 169,677 (54.8%) | $39,675 |
| Female | 139,931 (45.2%) | $27,264 |
| Total | 309,608 (100.0%) | $36,142 |
Earnings by Sex by Income Bracket in Area Code 575
The most common earnings brackets in Area Code 575 are $100,000+ for men (21,022 | 12.4%) and $25,000 to $29,999 for women (10,336 | 7.4%).
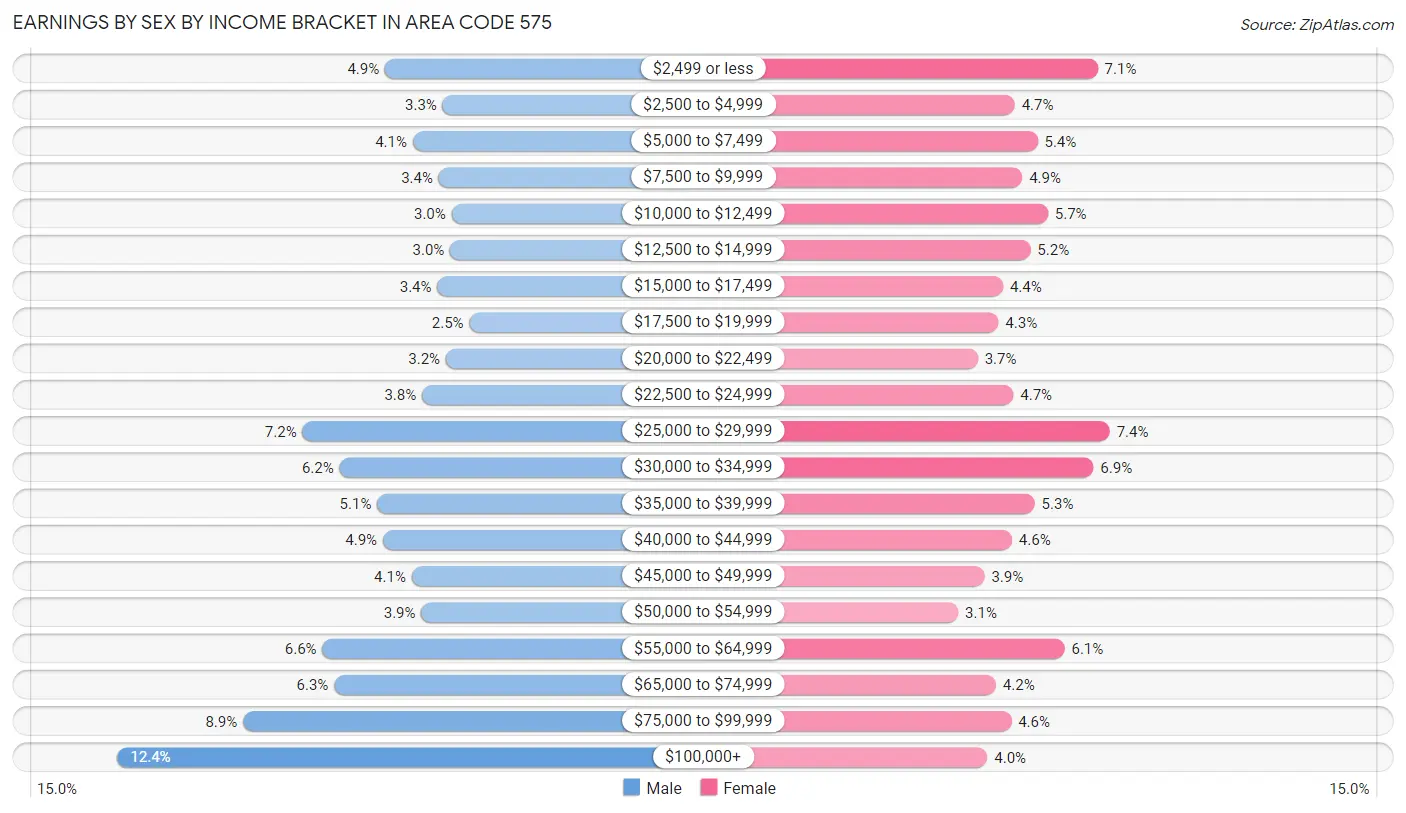
| Income | Male | Female |
| $2,499 or less | 8,262 (4.9%) | 9,868 (7.0%) |
| $2,500 to $4,999 | 5,507 (3.3%) | 6,611 (4.7%) |
| $5,000 to $7,499 | 6,948 (4.1%) | 7,502 (5.4%) |
| $7,500 to $9,999 | 5,707 (3.4%) | 6,905 (4.9%) |
| $10,000 to $12,499 | 5,085 (3.0%) | 7,902 (5.7%) |
| $12,500 to $14,999 | 5,150 (3.0%) | 7,215 (5.2%) |
| $15,000 to $17,499 | 5,772 (3.4%) | 6,137 (4.4%) |
| $17,500 to $19,999 | 4,239 (2.5%) | 5,955 (4.3%) |
| $20,000 to $22,499 | 5,361 (3.2%) | 5,150 (3.7%) |
| $22,500 to $24,999 | 6,507 (3.8%) | 6,551 (4.7%) |
| $25,000 to $29,999 | 12,199 (7.2%) | 10,336 (7.4%) |
| $30,000 to $34,999 | 10,427 (6.1%) | 9,704 (6.9%) |
| $35,000 to $39,999 | 8,632 (5.1%) | 7,386 (5.3%) |
| $40,000 to $44,999 | 8,362 (4.9%) | 6,496 (4.6%) |
| $45,000 to $49,999 | 6,997 (4.1%) | 5,413 (3.9%) |
| $50,000 to $54,999 | 6,527 (3.8%) | 4,378 (3.1%) |
| $55,000 to $64,999 | 11,253 (6.6%) | 8,570 (6.1%) |
| $65,000 to $74,999 | 10,683 (6.3%) | 5,865 (4.2%) |
| $75,000 to $99,999 | 15,037 (8.9%) | 6,464 (4.6%) |
| $100,000+ | 21,022 (12.4%) | 5,523 (4.0%) |
| Total | 169,677 (100.0%) | 139,931 (100.0%) |
Earnings by Sex by Educational Attainment in Area Code 575
Average earnings in Area Code 575 are $3,768,167 for men and $2,800,263 for women, a difference of 25.7%. Men with an educational attainment of bachelor's degree enjoy the highest average annual earnings of $3,252,711, while those with less than high school education earn the least with $1,303,898. Women with an educational attainment of graduate degree earn the most with the average annual earnings of $2,927,423, while those with less than high school education have the smallest earnings of $472,602.
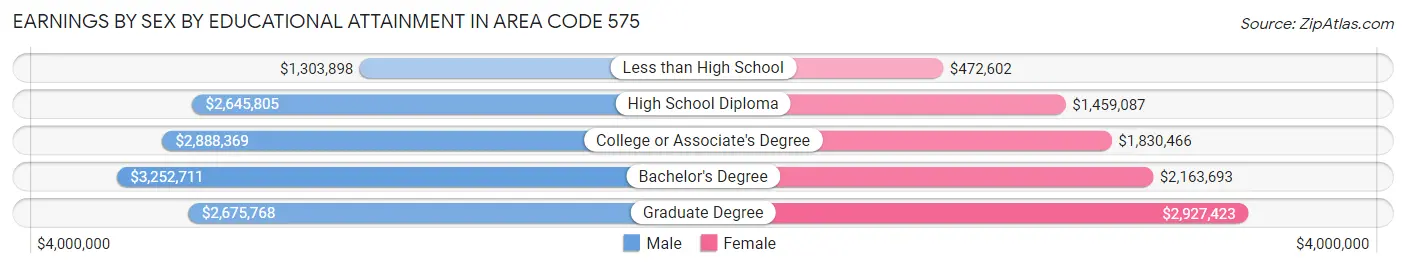
| Educational Attainment | Male Income | Female Income |
| Less than High School | $1,303,898 | $472,602 |
| High School Diploma | $2,645,805 | $1,459,087 |
| College or Associate's Degree | $2,888,369 | $1,830,466 |
| Bachelor's Degree | $3,252,711 | $2,163,693 |
| Graduate Degree | $2,675,768 | $2,927,423 |
| Total | $3,768,167 | $2,800,263 |
Family Income in Area Code 575
Family Income Brackets in Area Code 575
According to the Area Code 575 family income data, there are 3,834,262 families falling into the $50,000 to $74,999 income range, which is the most common income bracket and makes up 2,486.1% of all families. Conversely, the less than $10,000 income bracket is the least frequent group with only 852,727 families (552.9%) belonging to this category.
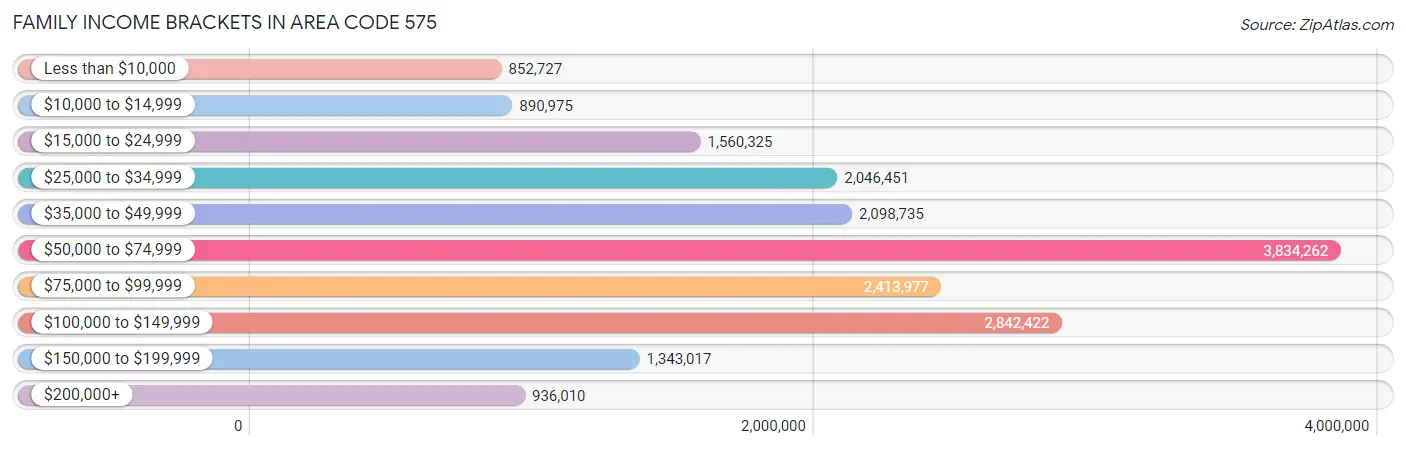
| Income Bracket | # Families | % Families |
| Less than $10,000 | 852,727 | 552.9% |
| $10,000 to $14,999 | 890,975 | 577.7% |
| $15,000 to $24,999 | 1,560,325 | 1,011.7% |
| $25,000 to $34,999 | 2,046,451 | 1,326.9% |
| $35,000 to $49,999 | 2,098,735 | 1,360.8% |
| $50,000 to $74,999 | 3,834,262 | 2,486.1% |
| $75,000 to $99,999 | 2,413,977 | 1,565.2% |
| $100,000 to $149,999 | 2,842,422 | 1,843.0% |
| $150,000 to $199,999 | 1,343,017 | 870.8% |
| $200,000+ | 936,010 | 606.9% |
Family Income by Famaliy Size in Area Code 575
6-person families (4,636 | 3.0%) account for the highest median family income in Area Code 575 with $98,999 per family, while 2-person families (74,574 | 48.3%) have the highest median income of $31,028 per family member.
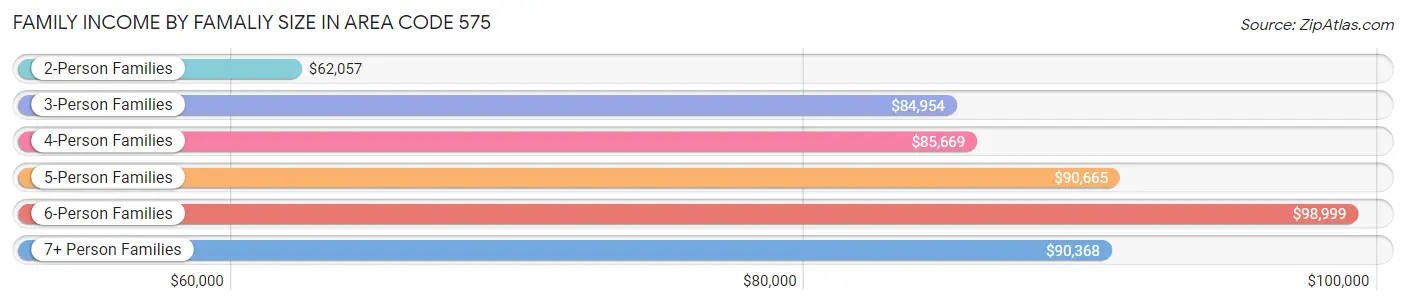
| Income Bracket | # Families | Median Income |
| 2-Person Families | 74,574 (48.3%) | $62,057 |
| 3-Person Families | 32,521 (21.1%) | $84,954 |
| 4-Person Families | 25,022 (16.2%) | $85,669 |
| 5-Person Families | 14,715 (9.5%) | $90,665 |
| 6-Person Families | 4,636 (3.0%) | $98,999 |
| 7+ Person Families | 2,760 (1.8%) | $90,368 |
| Total | 154,228 (100.0%) | $67,087 |
Family Income by Number of Earners in Area Code 575
The median family income in Area Code 575 is $67,087, with families comprising 3+ earners (13,070) having the highest median family income of $129,046, while families with no earners (28,686) have the lowest median family income of $42,619, accounting for 8.5% and 18.6% of families, respectively.
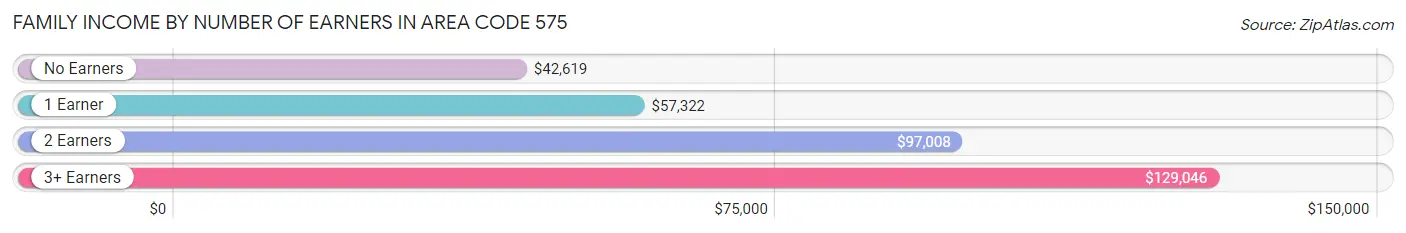
| Number of Earners | # Families | Median Income |
| No Earners | 28,686 (18.6%) | $42,619 |
| 1 Earner | 60,587 (39.3%) | $57,322 |
| 2 Earners | 51,885 (33.6%) | $97,008 |
| 3+ Earners | 13,070 (8.5%) | $129,046 |
| Total | 154,228 (100.0%) | $67,087 |
Household Income in Area Code 575
Household Income Brackets in Area Code 575
With 5,702,827 households falling in the category, the $50,000 to $74,999 income range is the most frequent in Area Code 575, accounting for 2,303.8% of all households. In contrast, only 1,279,287 households (516.8%) fall into the $200,000+ income bracket, making it the least populous group.
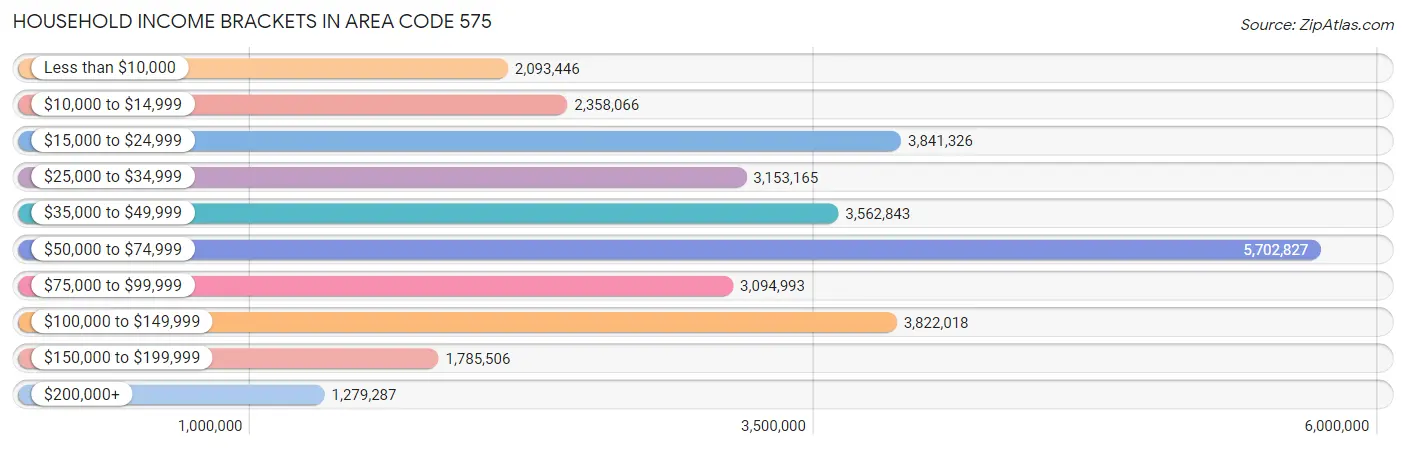
| Income Bracket | # Households | % Households |
| Less than $10,000 | 2,093,446 | 845.7% |
| $10,000 to $14,999 | 2,358,066 | 952.6% |
| $15,000 to $24,999 | 3,841,326 | 1,551.8% |
| $25,000 to $34,999 | 3,153,165 | 1,273.8% |
| $35,000 to $49,999 | 3,562,843 | 1,439.3% |
| $50,000 to $74,999 | 5,702,827 | 2,303.8% |
| $75,000 to $99,999 | 3,094,993 | 1,250.3% |
| $100,000 to $149,999 | 3,822,018 | 1,544.0% |
| $150,000 to $199,999 | 1,785,506 | 721.3% |
| $200,000+ | 1,279,287 | 516.8% |
Household Income by Householder Age in Area Code 575
The median household income in Area Code 575 is $53,827, with the highest median household income of $69,078 found in the 25 to 44 years age bracket for the primary householder. A total of 78,596 households (31.8%) fall into this category. Meanwhile, the 15 to 24 years age bracket for the primary householder has the lowest median household income of $35,360, with 15,359 households (6.2%) in this group.
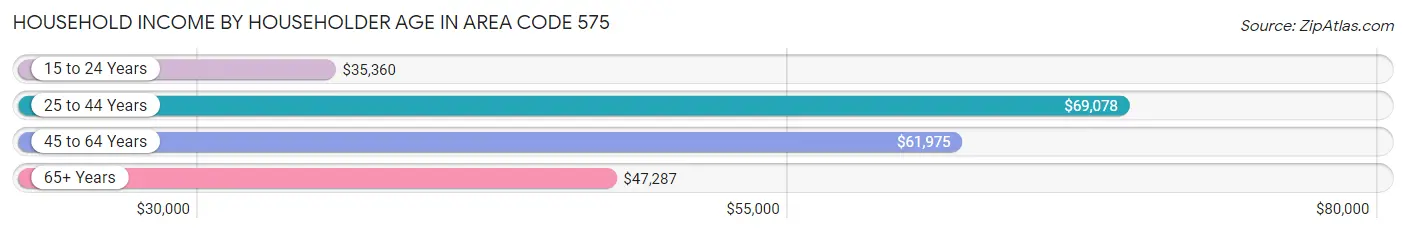
| Income Bracket | # Households | Median Income |
| 15 to 24 Years | 15,359 (6.2%) | $35,360 |
| 25 to 44 Years | 78,596 (31.8%) | $69,078 |
| 45 to 64 Years | 81,111 (32.8%) | $61,975 |
| 65+ Years | 72,474 (29.3%) | $47,287 |
| Total | 247,540 (100.0%) | $53,827 |
Poverty in Area Code 575
Income Below Poverty by Sex and Age in Area Code 575
With 18.3% poverty level for males and 22.5% for females among the residents of Area Code 575, 5 year old males and 5 year old females are the most vulnerable to poverty, with 1,646 males (38.1%) and 1,298 females (34.6%) in their respective age groups living below the poverty level.
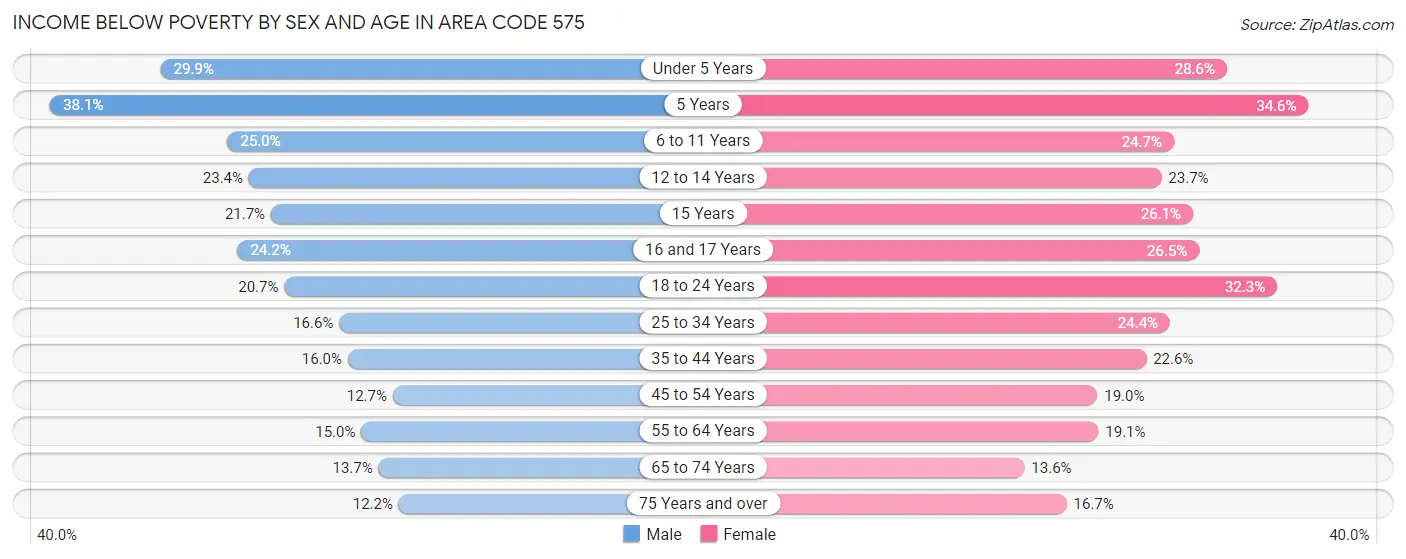
| Age Bracket | Male | Female |
| Under 5 Years | 6,342 (29.9%) | 5,705 (28.6%) |
| 5 Years | 1,646 (38.1%) | 1,298 (34.6%) |
| 6 to 11 Years | 6,662 (24.9%) | 6,716 (24.6%) |
| 12 to 14 Years | 3,398 (23.4%) | 2,889 (23.7%) |
| 15 Years | 989 (21.7%) | 1,066 (26.1%) |
| 16 and 17 Years | 2,089 (24.2%) | 2,400 (26.5%) |
| 18 to 24 Years | 7,548 (20.7%) | 10,714 (32.3%) |
| 25 to 34 Years | 7,299 (16.6%) | 10,144 (24.4%) |
| 35 to 44 Years | 6,376 (16.0%) | 8,634 (22.6%) |
| 45 to 54 Years | 4,165 (12.7%) | 6,399 (19.0%) |
| 55 to 64 Years | 5,486 (15.0%) | 7,633 (19.1%) |
| 65 to 74 Years | 4,505 (13.7%) | 4,557 (13.6%) |
| 75 Years and over | 2,510 (12.2%) | 4,221 (16.7%) |
| Total | 59,015 (18.3%) | 72,376 (22.5%) |
Income Above Poverty by Sex and Age in Area Code 575
According to the poverty statistics in Area Code 575, males aged 75 years and over and females aged 65 to 74 years are the age groups that are most secure financially, with 87.8% of males and 86.4% of females in these age groups living above the poverty line.
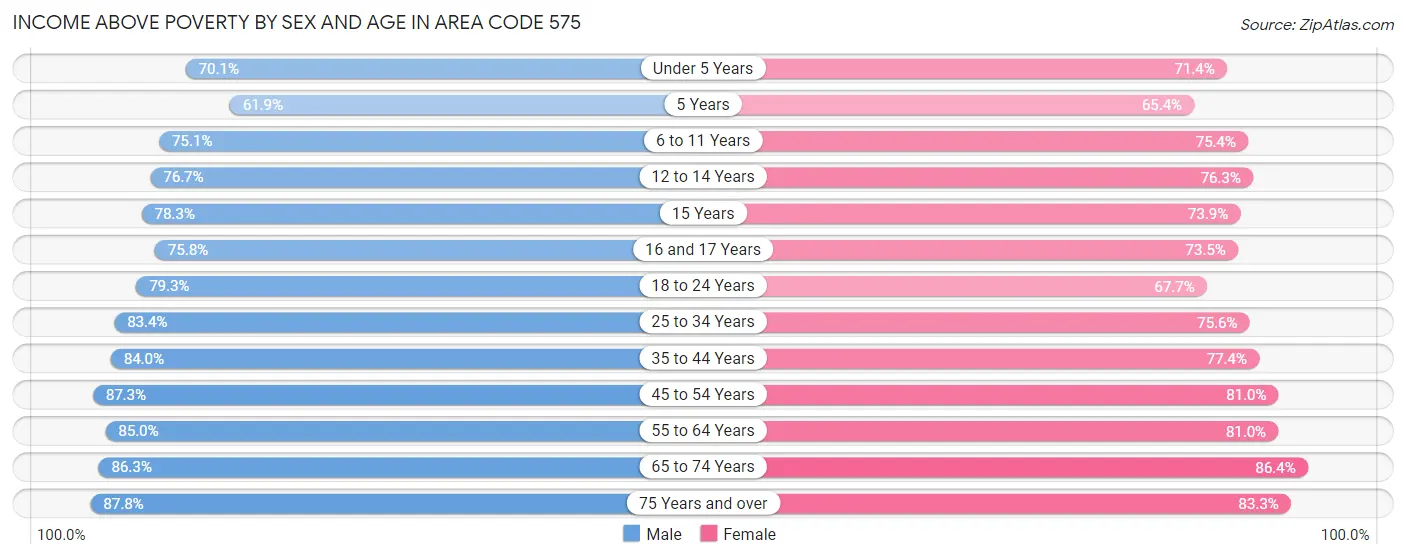
| Age Bracket | Male | Female |
| Under 5 Years | 14,868 (70.1%) | 14,255 (71.4%) |
| 5 Years | 2,674 (61.9%) | 2,449 (65.4%) |
| 6 to 11 Years | 20,042 (75.0%) | 20,534 (75.3%) |
| 12 to 14 Years | 11,157 (76.6%) | 9,286 (76.3%) |
| 15 Years | 3,566 (78.3%) | 3,023 (73.9%) |
| 16 and 17 Years | 6,547 (75.8%) | 6,645 (73.5%) |
| 18 to 24 Years | 28,886 (79.3%) | 22,441 (67.7%) |
| 25 to 34 Years | 36,563 (83.4%) | 31,490 (75.6%) |
| 35 to 44 Years | 33,465 (84.0%) | 29,572 (77.4%) |
| 45 to 54 Years | 28,730 (87.3%) | 27,327 (81.0%) |
| 55 to 64 Years | 31,092 (85.0%) | 32,427 (80.9%) |
| 65 to 74 Years | 28,337 (86.3%) | 29,057 (86.4%) |
| 75 Years and over | 18,022 (87.8%) | 21,067 (83.3%) |
| Total | 263,949 (81.7%) | 249,573 (77.5%) |
Income Below Poverty Among Married-Couple Families in Area Code 575
The poverty statistics for married-couple families in Area Code 575 show that 8.6% or 9,182 of the total 106,384 families live below the poverty line. Families with 5 or more children have the highest poverty rate of 35.8%, comprising of 320 families. On the other hand, families with no children have the lowest poverty rate of 6.6%, which includes 4,234 families.
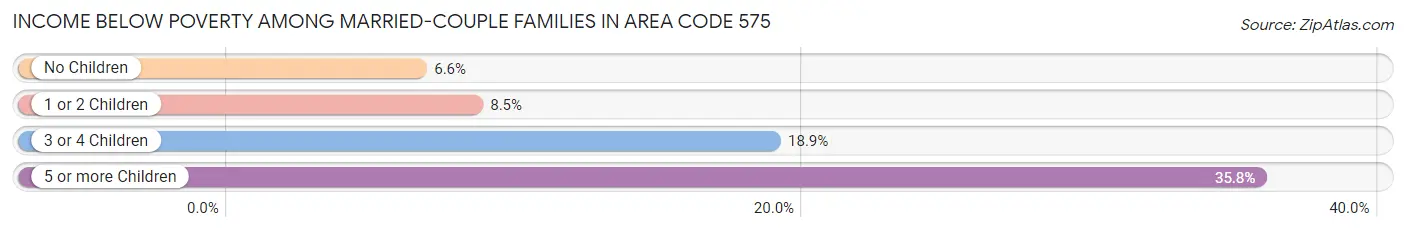
| Children | Above Poverty | Below Poverty |
| No Children | 59,968 (93.4%) | 4,234 (6.6%) |
| 1 or 2 Children | 28,045 (91.5%) | 2,619 (8.5%) |
| 3 or 4 Children | 8,616 (81.1%) | 2,009 (18.9%) |
| 5 or more Children | 573 (64.2%) | 320 (35.8%) |
| Total | 97,202 (91.4%) | 9,182 (8.6%) |
Income Below Poverty Among Single-Parent Households in Area Code 575
According to the poverty data in Area Code 575, 22.2% or 3,511 single-father households and 37.3% or 11,951 single-mother households are living below the poverty line. Among single-father households, those with 5 or more children have the highest poverty rate, with 78 households (40.4%) experiencing poverty. Likewise, among single-mother households, those with 5 or more children have the highest poverty rate, with 545 households (80.0%) falling below the poverty line.
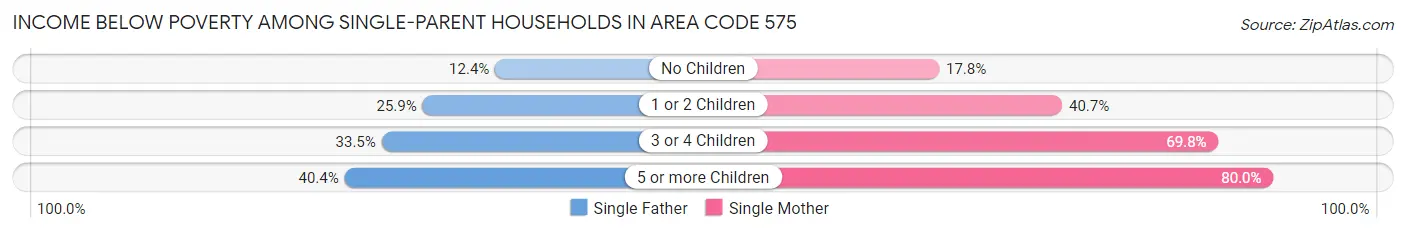
| Children | Single Father | Single Mother |
| No Children | 699 (12.3%) | 1,920 (17.8%) |
| 1 or 2 Children | 2,047 (25.9%) | 6,780 (40.7%) |
| 3 or 4 Children | 687 (33.5%) | 2,706 (69.8%) |
| 5 or more Children | 78 (40.4%) | 545 (80.0%) |
| Total | 3,511 (22.2%) | 11,951 (37.3%) |
Income Below Poverty Among Married-Couple vs Single-Parent Households in Area Code 575
The poverty data for Area Code 575 shows that 9,182 of the married-couple family households (8.6%) and 15,462 of the single-parent households (32.3%) are living below the poverty level. Within the married-couple family households, those with 5 or more children have the highest poverty rate, with 320 households (35.8%) falling below the poverty line. Among the single-parent households, those with 5 or more children have the highest poverty rate, with 623 household (71.3%) living below poverty.
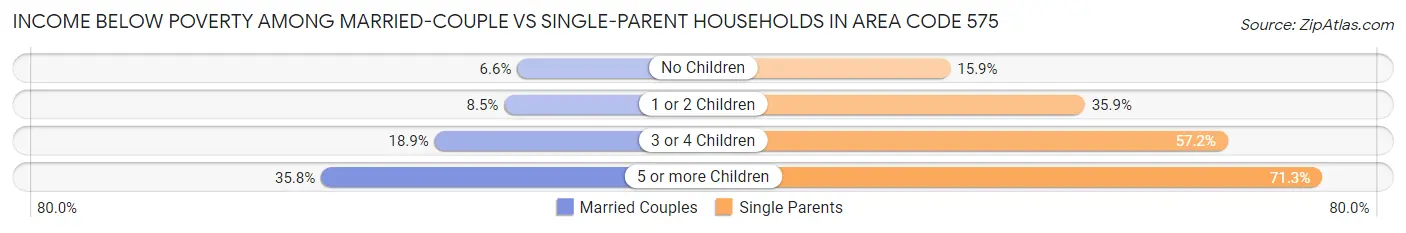
| Children | Married-Couple Families | Single-Parent Households |
| No Children | 4,234 (6.6%) | 2,619 (15.9%) |
| 1 or 2 Children | 2,619 (8.5%) | 8,827 (35.9%) |
| 3 or 4 Children | 2,009 (18.9%) | 3,393 (57.2%) |
| 5 or more Children | 320 (35.8%) | 623 (71.3%) |
| Total | 9,182 (8.6%) | 15,462 (32.3%) |
Race in Area Code 575
The most populous races in Area Code 575 are White / Caucasian (423,331 | 63.8%), Hispanic or Latino (370,358 | 55.8%), and Two or more Races (115,423 | 17.4%).
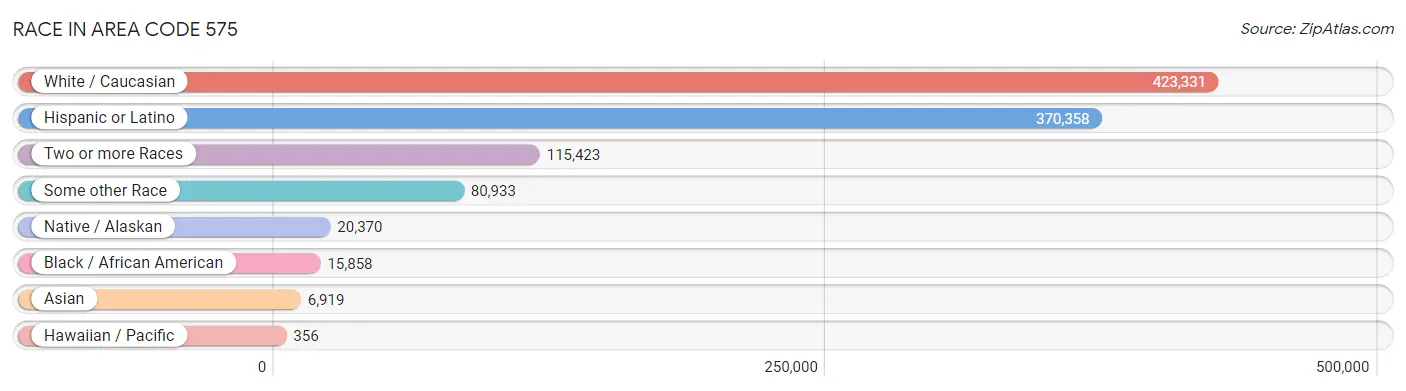
| Race | # Population | % Population |
| Asian | 6,919 | 1.0% |
| Black / African American | 15,858 | 2.4% |
| Hawaiian / Pacific | 356 | 0.1% |
| Hispanic or Latino | 370,358 | 55.8% |
| Native / Alaskan | 20,370 | 3.1% |
| White / Caucasian | 423,331 | 63.8% |
| Two or more Races | 115,423 | 17.4% |
| Some other Race | 80,933 | 12.2% |
| Total | 663,190 | 100.0% |
Ancestry in Area Code 575
The most populous ancestries reported in Area Code 575 are Mexican (301,792 | 45.5%), German (49,405 | 7.4%), English (45,502 | 6.9%), Irish (38,496 | 5.8%), and American (32,700 | 4.9%), together accounting for 70.6% of all Area Code 575 residents.
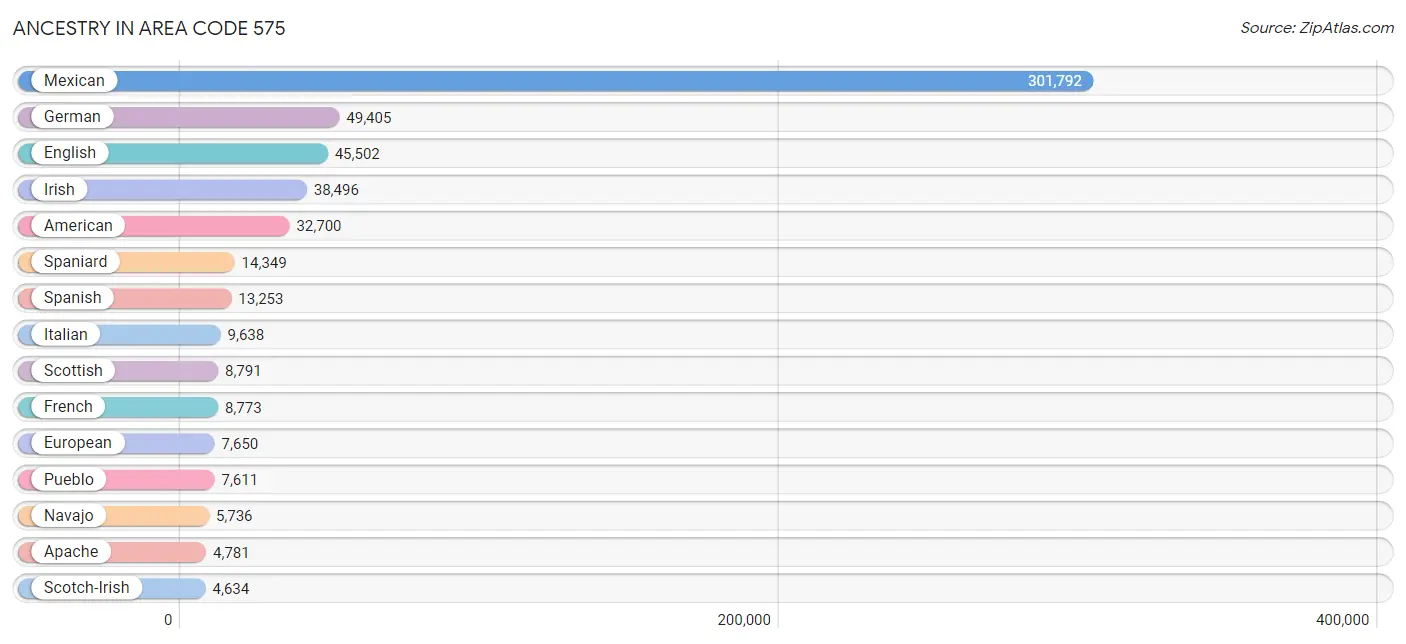
| Ancestry | # Population | % Population |
| African | 1,249 | 0.2% |
| Alaska Native | 24 | 0.0% |
| Alaskan Athabascan | 44 | 0.0% |
| Albanian | 10 | 0.0% |
| Aleut | 1 | 0.0% |
| Alsatian | 23 | 0.0% |
| American | 32,700 | 4.9% |
| Apache | 4,781 | 0.7% |
| Arab | 1,719 | 0.3% |
| Argentinean | 96 | 0.0% |
| Armenian | 167 | 0.0% |
| Australian | 48 | 0.0% |
| Austrian | 634 | 0.1% |
| Bahamian | 16 | 0.0% |
| Bangladeshi | 53 | 0.0% |
| Barbadian | 17 | 0.0% |
| Basque | 106 | 0.0% |
| Belgian | 287 | 0.0% |
| Belizean | 8 | 0.0% |
| Bhutanese | 1,382 | 0.2% |
| Blackfeet | 290 | 0.0% |
| Bolivian | 2 | 0.0% |
| Brazilian | 110 | 0.0% |
| British | 3,181 | 0.5% |
| Bulgarian | 27 | 0.0% |
| Burmese | 1,385 | 0.2% |
| Cajun | 134 | 0.0% |
| Cambodian | 10 | 0.0% |
| Canadian | 280 | 0.0% |
| Celtic | 150 | 0.0% |
| Central American | 2,396 | 0.4% |
| Central American Indian | 379 | 0.1% |
| Cherokee | 2,053 | 0.3% |
| Cheyenne | 249 | 0.0% |
| Chickasaw | 146 | 0.0% |
| Chilean | 4 | 0.0% |
| Chippewa | 85 | 0.0% |
| Choctaw | 561 | 0.1% |
| Colombian | 503 | 0.1% |
| Comanche | 223 | 0.0% |
| Costa Rican | 38 | 0.0% |
| Cree | 60 | 0.0% |
| Creek | 78 | 0.0% |
| Croatian | 210 | 0.0% |
| Crow | 6 | 0.0% |
| Cuban | 1,372 | 0.2% |
| Cypriot | 12 | 0.0% |
| Czech | 1,197 | 0.2% |
| Czechoslovakian | 331 | 0.1% |
| Danish | 1,510 | 0.2% |
| Delaware | 21 | 0.0% |
| Dominican | 141 | 0.0% |
| Dutch | 4,477 | 0.7% |
| Dutch West Indian | 221 | 0.0% |
| Eastern European | 935 | 0.1% |
| Ecuadorian | 41 | 0.0% |
| Egyptian | 20 | 0.0% |
| English | 45,502 | 6.9% |
| Estonian | 42 | 0.0% |
| Ethiopian | 4 | 0.0% |
| European | 7,650 | 1.1% |
| Filipino | 80 | 0.0% |
| Finnish | 642 | 0.1% |
| French | 8,773 | 1.3% |
| French Canadian | 1,297 | 0.2% |
| German | 49,405 | 7.4% |
| German Russian | 29 | 0.0% |
| Ghanaian | 25 | 0.0% |
| Greek | 1,127 | 0.2% |
| Guamanian / Chamorro | 144 | 0.0% |
| Guatemalan | 248 | 0.0% |
| Haitian | 80 | 0.0% |
| Honduran | 776 | 0.1% |
| Hopi | 146 | 0.0% |
| Hungarian | 685 | 0.1% |
| Indian (Asian) | 1,027 | 0.2% |
| Indonesian | 10 | 0.0% |
| Iranian | 353 | 0.1% |
| Iraqi | 18 | 0.0% |
| Irish | 38,496 | 5.8% |
| Iroquois | 19 | 0.0% |
| Israeli | 14 | 0.0% |
| Italian | 9,638 | 1.5% |
| Jamaican | 241 | 0.0% |
| Japanese | 11 | 0.0% |
| Jordanian | 29 | 0.0% |
| Kenyan | 22 | 0.0% |
| Kiowa | 98 | 0.0% |
| Korean | 4,061 | 0.6% |
| Laotian | 57 | 0.0% |
| Latvian | 269 | 0.0% |
| Lebanese | 701 | 0.1% |
| Lithuanian | 345 | 0.1% |
| Lumbee | 4 | 0.0% |
| Luxembourger | 5 | 0.0% |
| Malaysian | 69 | 0.0% |
| Mexican | 301,792 | 45.5% |
| Mexican American Indian | 997 | 0.2% |
| Mongolian | 7 | 0.0% |
| Moroccan | 41 | 0.0% |
| Native Hawaiian | 304 | 0.1% |
| Navajo | 5,736 | 0.9% |
| Nicaraguan | 64 | 0.0% |
| Nigerian | 631 | 0.1% |
| Northern European | 818 | 0.1% |
| Norwegian | 4,120 | 0.6% |
| Osage | 17 | 0.0% |
| Paiute | 10 | 0.0% |
| Pakistani | 257 | 0.0% |
| Palestinian | 47 | 0.0% |
| Panamanian | 385 | 0.1% |
| Paraguayan | 12 | 0.0% |
| Pennsylvania German | 92 | 0.0% |
| Peruvian | 172 | 0.0% |
| Pima | 32 | 0.0% |
| Polish | 4,532 | 0.7% |
| Portuguese | 1,203 | 0.2% |
| Potawatomi | 20 | 0.0% |
| Pueblo | 7,611 | 1.1% |
| Puerto Rican | 2,656 | 0.4% |
| Romanian | 175 | 0.0% |
| Russian | 1,240 | 0.2% |
| Salvadoran | 885 | 0.1% |
| Samoan | 214 | 0.0% |
| Scandinavian | 1,456 | 0.2% |
| Scotch-Irish | 4,634 | 0.7% |
| Scottish | 8,791 | 1.3% |
| Seminole | 43 | 0.0% |
| Serbian | 97 | 0.0% |
| Shoshone | 73 | 0.0% |
| Sioux | 498 | 0.1% |
| Slavic | 54 | 0.0% |
| Slovak | 297 | 0.0% |
| Slovene | 119 | 0.0% |
| South African | 46 | 0.0% |
| South American | 1,064 | 0.2% |
| Soviet Union | 8 | 0.0% |
| Spaniard | 14,349 | 2.2% |
| Spanish | 13,253 | 2.0% |
| Spanish American | 1,506 | 0.2% |
| Spanish American Indian | 102 | 0.0% |
| Sri Lankan | 671 | 0.1% |
| Subsaharan African | 1,997 | 0.3% |
| Swedish | 3,438 | 0.5% |
| Swiss | 545 | 0.1% |
| Syrian | 158 | 0.0% |
| Thai | 1,153 | 0.2% |
| Tlingit-Haida | 58 | 0.0% |
| Tohono O'Odham | 31 | 0.0% |
| Tongan | 37 | 0.0% |
| Turkish | 70 | 0.0% |
| U.S. Virgin Islander | 15 | 0.0% |
| Ukrainian | 187 | 0.0% |
| Uruguayan | 27 | 0.0% |
| Ute | 30 | 0.0% |
| Venezuelan | 186 | 0.0% |
| Vietnamese | 273 | 0.0% |
| Welsh | 2,696 | 0.4% |
| West Indian | 46 | 0.0% |
| Yaqui | 318 | 0.1% |
| Yugoslavian | 73 | 0.0% |
| Yup'ik | 9 | 0.0% | View All 162 Rows |
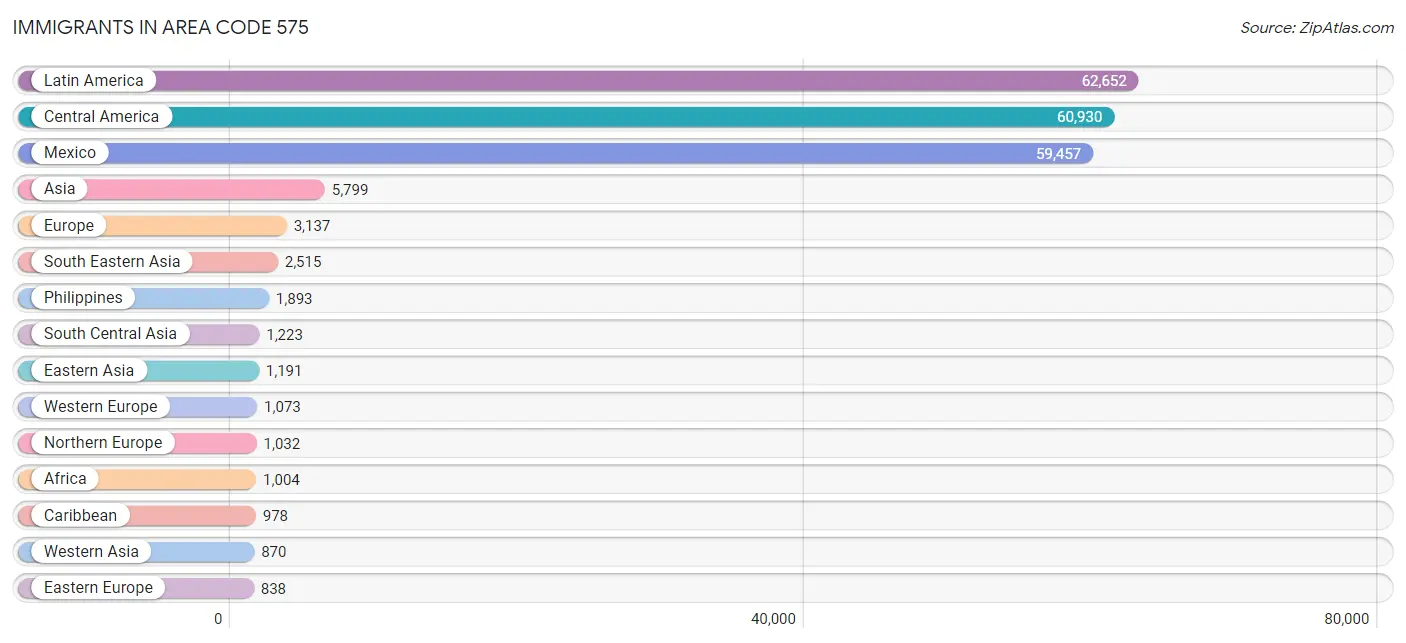
Immigrants in Area Code 575
The most numerous immigrant groups reported in Area Code 575 came from Latin America (62,652 | 9.5%), Central America (60,930 | 9.2%), Mexico (59,457 | 9.0%), Asia (5,799 | 0.9%), and Europe (3,137 | 0.5%), together accounting for 28.9% of all Area Code 575 residents.
| Immigration Origin | # Population | % Population |
| Africa | 1,004 | 0.2% |
| Albania | 10 | 0.0% |
| Argentina | 140 | 0.0% |
| Asia | 5,799 | 0.9% |
| Australia | 45 | 0.0% |
| Bahamas | 11 | 0.0% |
| Bangladesh | 182 | 0.0% |
| Belgium | 33 | 0.0% |
| Belize | 8 | 0.0% |
| Bolivia | 21 | 0.0% |
| Brazil | 96 | 0.0% |
| Cameroon | 1 | 0.0% |
| Canada | 435 | 0.1% |
| Caribbean | 978 | 0.2% |
| Central America | 60,930 | 9.2% |
| Chile | 4 | 0.0% |
| China | 297 | 0.0% |
| Colombia | 225 | 0.0% |
| Congo | 26 | 0.0% |
| Cuba | 791 | 0.1% |
| Czechoslovakia | 76 | 0.0% |
| Denmark | 23 | 0.0% |
| Dominican Republic | 1 | 0.0% |
| Eastern Africa | 138 | 0.0% |
| Eastern Asia | 1,191 | 0.2% |
| Eastern Europe | 838 | 0.1% |
| Ecuador | 24 | 0.0% |
| El Salvador | 295 | 0.0% |
| England | 503 | 0.1% |
| Europe | 3,137 | 0.5% |
| Fiji | 17 | 0.0% |
| France | 116 | 0.0% |
| Germany | 815 | 0.1% |
| Ghana | 91 | 0.0% |
| Guatemala | 270 | 0.0% |
| Haiti | 14 | 0.0% |
| Honduras | 797 | 0.1% |
| Hong Kong | 26 | 0.0% |
| Hungary | 72 | 0.0% |
| India | 555 | 0.1% |
| Indonesia | 33 | 0.0% |
| Iran | 166 | 0.0% |
| Iraq | 18 | 0.0% |
| Ireland | 70 | 0.0% |
| Israel | 15 | 0.0% |
| Italy | 63 | 0.0% |
| Jamaica | 161 | 0.0% |
| Japan | 299 | 0.1% |
| Jordan | 6 | 0.0% |
| Kenya | 33 | 0.0% |
| Korea | 595 | 0.1% |
| Kuwait | 440 | 0.1% |
| Laos | 69 | 0.0% |
| Latin America | 62,652 | 9.5% |
| Latvia | 171 | 0.0% |
| Lebanon | 53 | 0.0% |
| Malaysia | 11 | 0.0% |
| Mexico | 59,457 | 9.0% |
| Micronesia | 4 | 0.0% |
| Middle Africa | 27 | 0.0% |
| Morocco | 11 | 0.0% |
| Nepal | 138 | 0.0% |
| Netherlands | 101 | 0.0% |
| Nicaragua | 38 | 0.0% |
| Nigeria | 633 | 0.1% |
| Northern Africa | 23 | 0.0% |
| Northern Europe | 1,032 | 0.2% |
| Norway | 62 | 0.0% |
| Oceania | 89 | 0.0% |
| Pakistan | 82 | 0.0% |
| Panama | 65 | 0.0% |
| Peru | 84 | 0.0% |
| Philippines | 1,893 | 0.3% |
| Poland | 225 | 0.0% |
| Romania | 94 | 0.0% |
| Russia | 151 | 0.0% |
| Saudi Arabia | 209 | 0.0% |
| Scotland | 70 | 0.0% |
| Serbia | 21 | 0.0% |
| Singapore | 24 | 0.0% |
| South Africa | 3 | 0.0% |
| South America | 744 | 0.1% |
| South Central Asia | 1,223 | 0.2% |
| South Eastern Asia | 2,515 | 0.4% |
| Southern Europe | 194 | 0.0% |
| Spain | 131 | 0.0% |
| Sri Lanka | 93 | 0.0% |
| Sweden | 17 | 0.0% |
| Switzerland | 8 | 0.0% |
| Syria | 47 | 0.0% |
| Taiwan | 26 | 0.0% |
| Thailand | 123 | 0.0% |
| Turkey | 50 | 0.0% |
| Uganda | 41 | 0.0% |
| Uruguay | 9 | 0.0% |
| Uzbekistan | 7 | 0.0% |
| Venezuela | 141 | 0.0% |
| Vietnam | 338 | 0.1% |
| Western Africa | 807 | 0.1% |
| Western Asia | 870 | 0.1% |
| Western Europe | 1,073 | 0.2% |
| Zimbabwe | 52 | 0.0% | View All 102 Rows |
Sex and Age in Area Code 575
Sex and Age in Area Code 575
The most populous age groups in Area Code 575 are 20 to 24 Years (29,106 | 8.7%) for men and 20 to 24 Years (25,711 | 7.8%) for women.
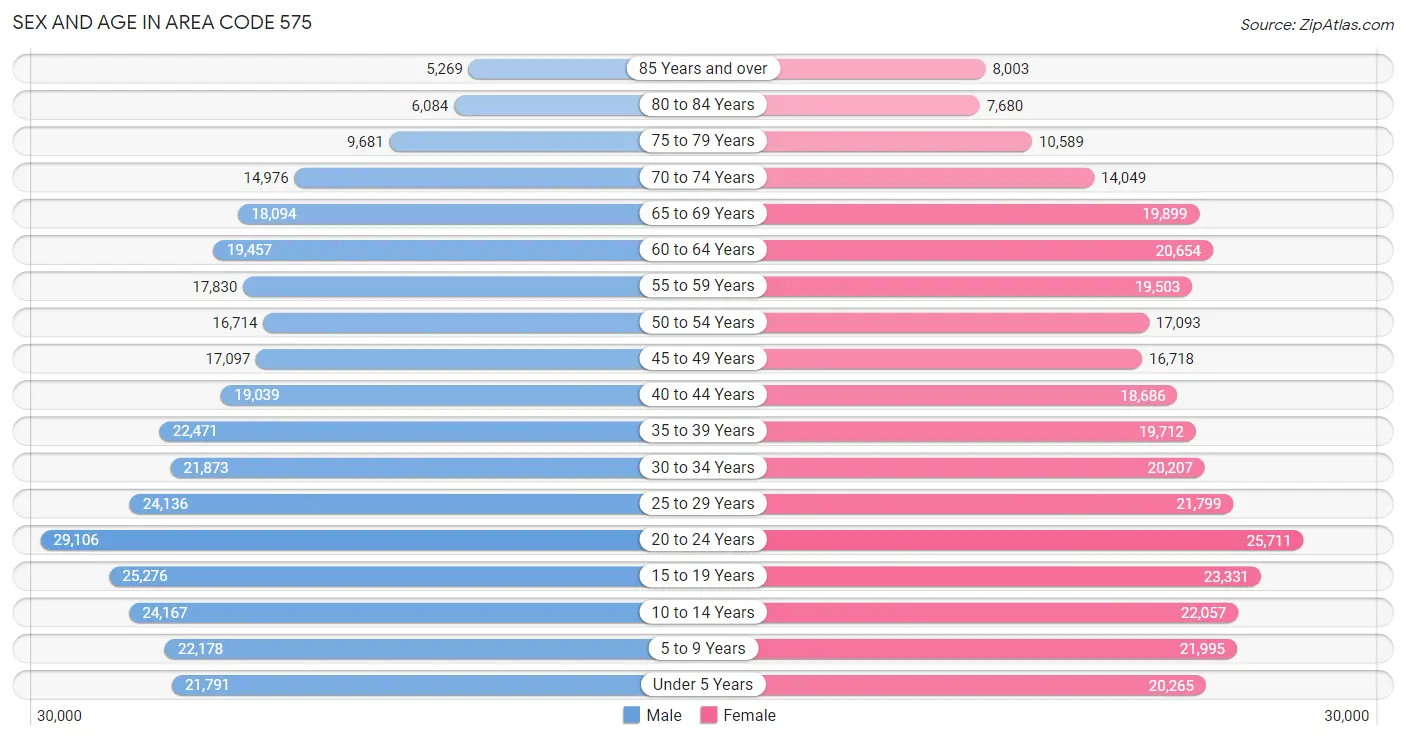
| Age Bracket | Male | Female |
| Under 5 Years | 21,791 (6.5%) | 20,265 (6.2%) |
| 5 to 9 Years | 22,178 (6.6%) | 21,995 (6.7%) |
| 10 to 14 Years | 24,167 (7.2%) | 22,057 (6.7%) |
| 15 to 19 Years | 25,276 (7.5%) | 23,331 (7.1%) |
| 20 to 24 Years | 29,106 (8.7%) | 25,711 (7.8%) |
| 25 to 29 Years | 24,136 (7.2%) | 21,799 (6.7%) |
| 30 to 34 Years | 21,873 (6.5%) | 20,207 (6.2%) |
| 35 to 39 Years | 22,471 (6.7%) | 19,712 (6.0%) |
| 40 to 44 Years | 19,039 (5.7%) | 18,686 (5.7%) |
| 45 to 49 Years | 17,097 (5.1%) | 16,718 (5.1%) |
| 50 to 54 Years | 16,714 (5.0%) | 17,093 (5.2%) |
| 55 to 59 Years | 17,830 (5.3%) | 19,503 (5.9%) |
| 60 to 64 Years | 19,457 (5.8%) | 20,654 (6.3%) |
| 65 to 69 Years | 18,094 (5.4%) | 19,899 (6.1%) |
| 70 to 74 Years | 14,976 (4.5%) | 14,049 (4.3%) |
| 75 to 79 Years | 9,681 (2.9%) | 10,589 (3.2%) |
| 80 to 84 Years | 6,084 (1.8%) | 7,680 (2.3%) |
| 85 Years and over | 5,269 (1.6%) | 8,003 (2.4%) |
| Total | 335,239 (100.0%) | 327,951 (100.0%) |
Families and Households in Area Code 575
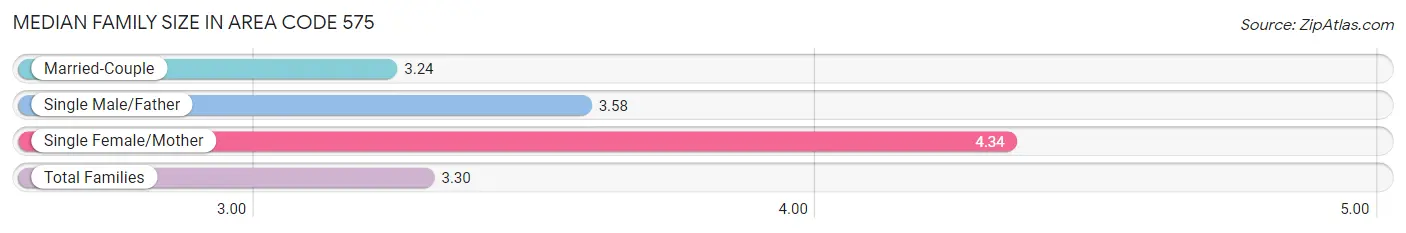
Median Family Size in Area Code 575
The median family size in Area Code 575 is 3.30 persons per family, with single female/mother families (32,031 | 20.8%) accounting for the largest median family size of 4.33947 persons per family. On the other hand, married-couple families (106,384 | 69.0%) represent the smallest median family size with 3.24 persons per family.
| Family Type | # Families | Family Size |
| Married-Couple | 106,384 (69.0%) | 3.24 |
| Single Male/Father | 15,813 (10.2%) | 3.58 |
| Single Female/Mother | 32,031 (20.8%) | 4.34 |
| Total Families | 154,228 (100.0%) | 3.30 |
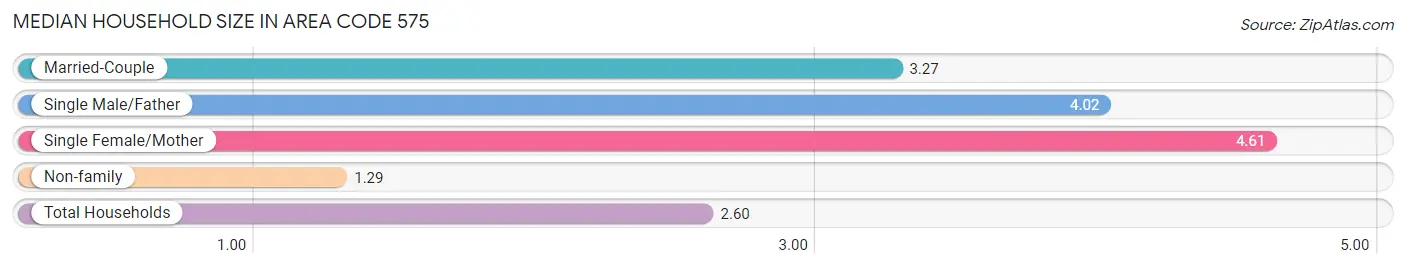
Median Household Size in Area Code 575
The median household size in Area Code 575 is 2.60 persons per household, with single female/mother households (32,031 | 12.9%) accounting for the largest median household size of 4.60884 persons per household. non-family households (93,312 | 37.7%) represent the smallest median household size with 1.29 persons per household.
| Household Type | # Households | Household Size |
| Married-Couple | 106,384 (43.0%) | 3.27 |
| Single Male/Father | 15,813 (6.4%) | 4.02 |
| Single Female/Mother | 32,031 (12.9%) | 4.61 |
| Non-family | 93,312 (37.7%) | 1.29 |
| Total Households | 247,540 (100.0%) | 2.60 |
Household Size by Marriage Status in Area Code 575
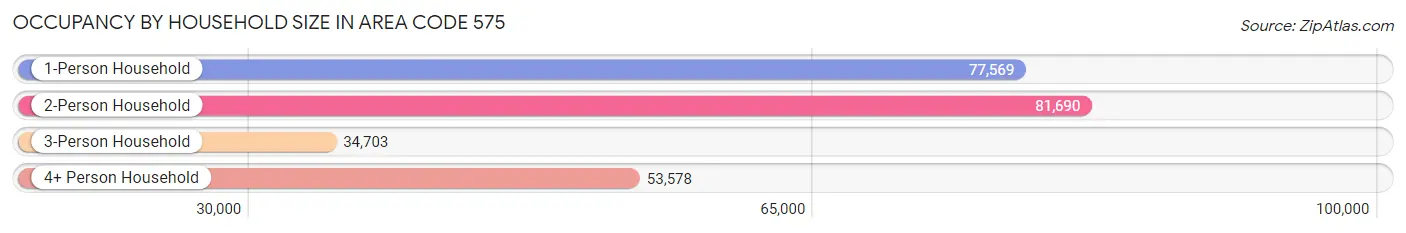
Out of a total of 247,540 households in Area Code 575, 154,228 (62.3%) are family households, while 93,312 (37.7%) are nonfamily households. The most numerous type of family households are 2-person households, comprising 68,557, and the most common type of nonfamily households are 1-person households, comprising 77,569.
| Household Size | Family Households | Nonfamily Households |
| 1-Person Households | - | 77,569 (31.3%) |
| 2-Person Households | 68,557 (27.7%) | 13,133 (5.3%) |
| 3-Person Households | 33,030 (13.3%) | 1,673 (0.7%) |
| 4-Person Households | 27,852 (11.3%) | 791 (0.3%) |
| 5-Person Households | 16,239 (6.6%) | 121 (0.1%) |
| 6-Person Households | 5,057 (2.0%) | 16 (0.0%) |
| 7+ Person Households | 3,493 (1.4%) | 9 (0.0%) |
| Total | 154,228 (62.3%) | 93,312 (37.7%) |
Female Fertility in Area Code 575
Fertility by Age in Area Code 575
Average fertility rate in Area Code 575 is 80.6 births per 1,000 women. Women in the age bracket of 20 to 34 years have the highest fertility rate with 162.1 births per 1,000 women. Women in the age bracket of 20 to 34 years acount for 73.2% of all women with births.
| Age Bracket | Women with Births | Births / 1,000 Women |
| 15 to 19 years | 613 (6.5%) | 67.6 |
| 20 to 34 years | 6,891 (73.2%) | 162.1 |
| 35 to 50 years | 1,909 (20.3%) | 58.3 |
| Total | 9,413 (100.0%) | 80.6 |
Fertility by Age by Marriage Status in Area Code 575
38.4% of women with births (9,413) in Area Code 575 are married. The highest percentage of unmarried women with births falls into 15 to 19 years age bracket with 98.2% of them unmarried at the time of birth, while the lowest percentage of unmarried women with births belong to 35 to 50 years age bracket with 58.4% of them unmarried.
| Age Bracket | Married | Unmarried |
| 15 to 19 years | 11 (1.8%) | 602 (98.2%) |
| 20 to 34 years | 2,524 (36.6%) | 4,367 (63.4%) |
| 35 to 50 years | 794 (41.6%) | 1,115 (58.4%) |
| Total | 3,611 (38.4%) | 5,802 (61.6%) |
Fertility by Education in Area Code 575
Average fertility rate in Area Code 575 is 80.6 births per 1,000 women. Women with the education attainment of graduate degree have the highest fertility rate of 173.4 births per 1,000 women, while women with the education attainment of high school diploma have the lowest fertility at 104.4 births per 1,000 women. Women with the education attainment of college or associate's degree represent 39.1% of all women with births.
| Educational Attainment | Women with Births | Births / 1,000 Women |
| Less than High School | 1,762 (18.7%) | 131.3 |
| High School Diploma | 2,313 (24.6%) | 104.4 |
| College or Associate's Degree | 3,679 (39.1%) | 165.1 |
| Bachelor's Degree | 944 (10.0%) | 146.5 |
| Graduate Degree | 715 (7.6%) | 173.4 |
| Total | 9,413 (100.0%) | 80.6 |
Fertility by Education by Marriage Status in Area Code 575
61.6% of women with births in Area Code 575 are unmarried. Women with the educational attainment of graduate degree are most likely to be married with 46.0% of them married at childbirth, while women with the educational attainment of bachelor's degree are least likely to be married with 88.8% of them unmarried at childbirth.
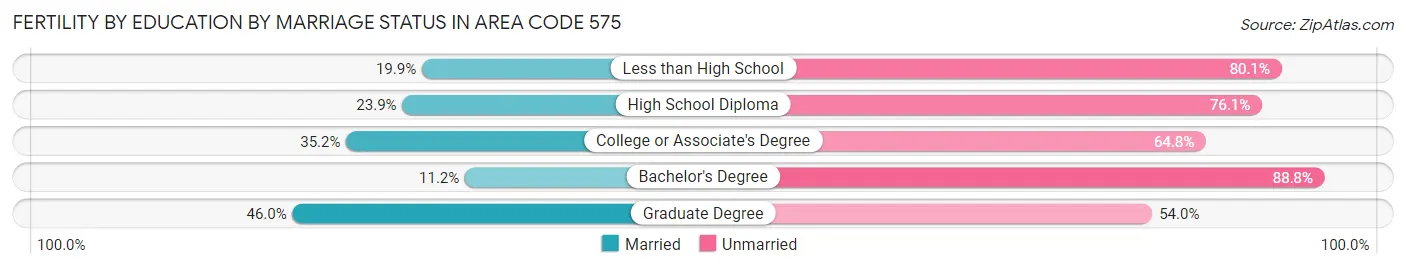
| Educational Attainment | Married | Unmarried |
| Less than High School | 351 (19.9%) | 1,411 (80.1%) |
| High School Diploma | 552 (23.9%) | 1,761 (76.1%) |
| College or Associate's Degree | 1,294 (35.2%) | 2,385 (64.8%) |
| Bachelor's Degree | 106 (11.2%) | 838 (88.8%) |
| Graduate Degree | 329 (46.0%) | 386 (54.0%) |
| Total | 3,611 (38.4%) | 5,802 (61.6%) |
Employment Characteristics in Area Code 575
Employment by Class of Employer in Area Code 575
Among the 270,232 employed individuals in Area Code 575, private company employees (164,021 | 60.7%), federal government employees (21,700 | 8.0%), and local government employees (21,142 | 7.8%) make up the most common classes of employment.
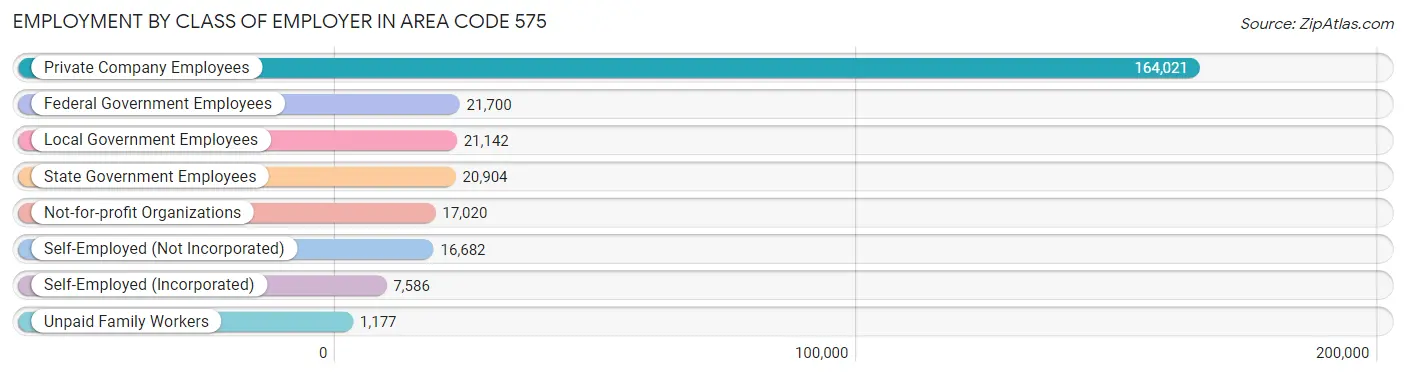
| Employer Class | # Employees | % Employees |
| Private Company Employees | 164,021 | 60.7% |
| Self-Employed (Incorporated) | 7,586 | 2.8% |
| Self-Employed (Not Incorporated) | 16,682 | 6.2% |
| Not-for-profit Organizations | 17,020 | 6.3% |
| Local Government Employees | 21,142 | 7.8% |
| State Government Employees | 20,904 | 7.7% |
| Federal Government Employees | 21,700 | 8.0% |
| Unpaid Family Workers | 1,177 | 0.4% |
| Total | 270,232 | 100.0% |
Employment Status by Age in Area Code 575
According to the labor force statistics for Area Code 575, out of the total population over 16 years of age (522,064), 50.6% or 264,060 individuals are in the labor force, with 8.8% or 23,132 of them unemployed. The age group with the highest labor force participation rate is 35 to 44 years, with 77.6% or 62,017 individuals in the labor force. Within the labor force, the 16 to 19 years age range has the highest percentage of unemployed individuals, with 1,529.4% or 298,967 of them being unemployed.
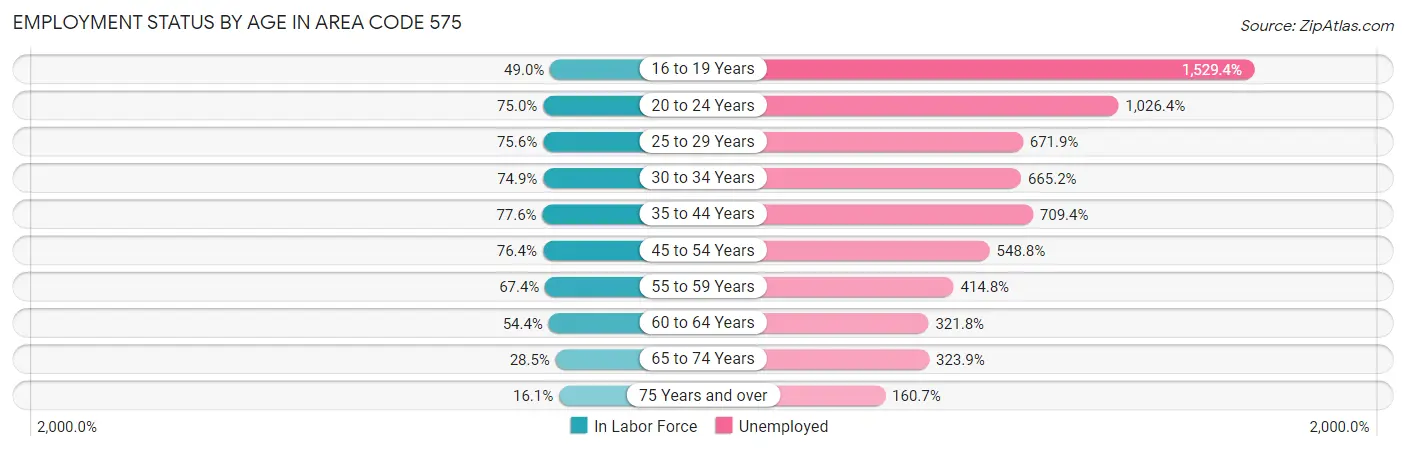
| Age Bracket | In Labor Force | Unemployed |
| 16 to 19 Years | 19,546 (48.9%) | 298,967 (1,529.4%) |
| 20 to 24 Years | 41,105 (75.0%) | 421,922 (1,026.4%) |
| 25 to 29 Years | 34,711 (75.6%) | 233,237 (671.9%) |
| 30 to 34 Years | 31,501 (74.9%) | 209,545 (665.2%) |
| 35 to 44 Years | 62,015 (77.6%) | 439,949 (709.4%) |
| 45 to 54 Years | 51,634 (76.4%) | 283,378 (548.8%) |
| 55 to 59 Years | 25,175 (67.4%) | 104,422 (414.8%) |
| 60 to 64 Years | 21,803 (54.4%) | 70,165 (321.8%) |
| 65 to 74 Years | 19,072 (28.5%) | 61,777 (323.9%) |
| 75 Years and over | 7,597 (16.1%) | 12,208 (160.7%) |
| Total | 264,050 (50.6%) | 23,142 (8.8%) |
Employment Status by Educational Attainment in Area Code 575
According to labor force statistics for Area Code 575, 68.1% of individuals (213,302) out of the total population between 25 and 64 years of age (312,989) are in the labor force, with 585.2% or 1,248,243 of them being unemployed. The group with the highest labor force participation rate are those with the educational attainment of bachelor's degree or higher, with 83.6% or 57,908 individuals in the labor force. Within the labor force, individuals with less than high school education have the highest percentage of unemployment, with 1,036.1% or 298,366 of them being unemployed.
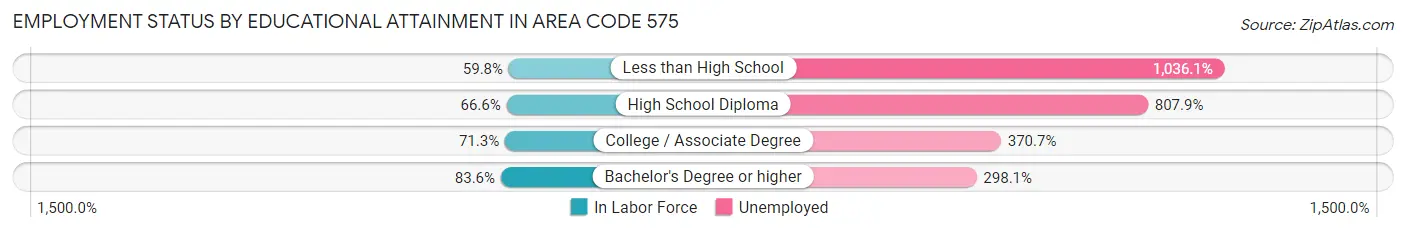
| Educational Attainment | In Labor Force | Unemployed |
| Less than High School | 28,797 (59.8%) | 498,944 (1,036.1%) |
| High School Diploma | 59,875 (66.6%) | 726,019 (807.9%) |
| College / Associate Degree | 75,363 (71.3%) | 391,708 (370.7%) |
| Bachelor's Degree or higher | 57,908 (83.6%) | 206,586 (298.1%) |
| Total | 213,315 (68.1%) | 1,831,612 (585.2%) |
Employment Occupations by Sex in Area Code 575
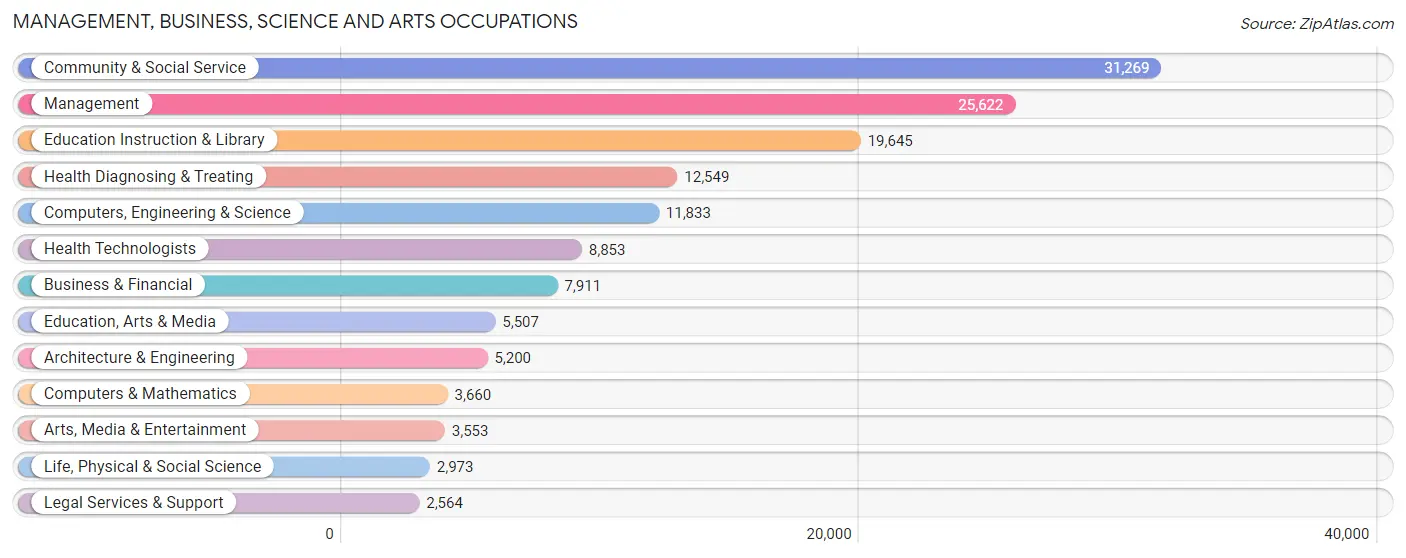
Management, Business, Science and Arts Occupations
The most common Management, Business, Science and Arts occupations in Area Code 575 are Community & Social Service (31,269 | 11.7%), Management (25,622 | 9.6%), Education Instruction & Library (19,645 | 7.4%), Health Diagnosing & Treating (12,549 | 4.7%), and Computers, Engineering & Science (11,833 | 4.4%).
Management, Business, Science and Arts Occupations by Sex
Within the Management, Business, Science and Arts occupations in Area Code 575, the most male-oriented occupations are Architecture & Engineering (84.4%), Computers & Mathematics (78.1%), and Computers, Engineering & Science (77.1%), while the most female-oriented occupations are Health Technologists (76.7%), Health Diagnosing & Treating (75.5%), and Education Instruction & Library (74.2%).
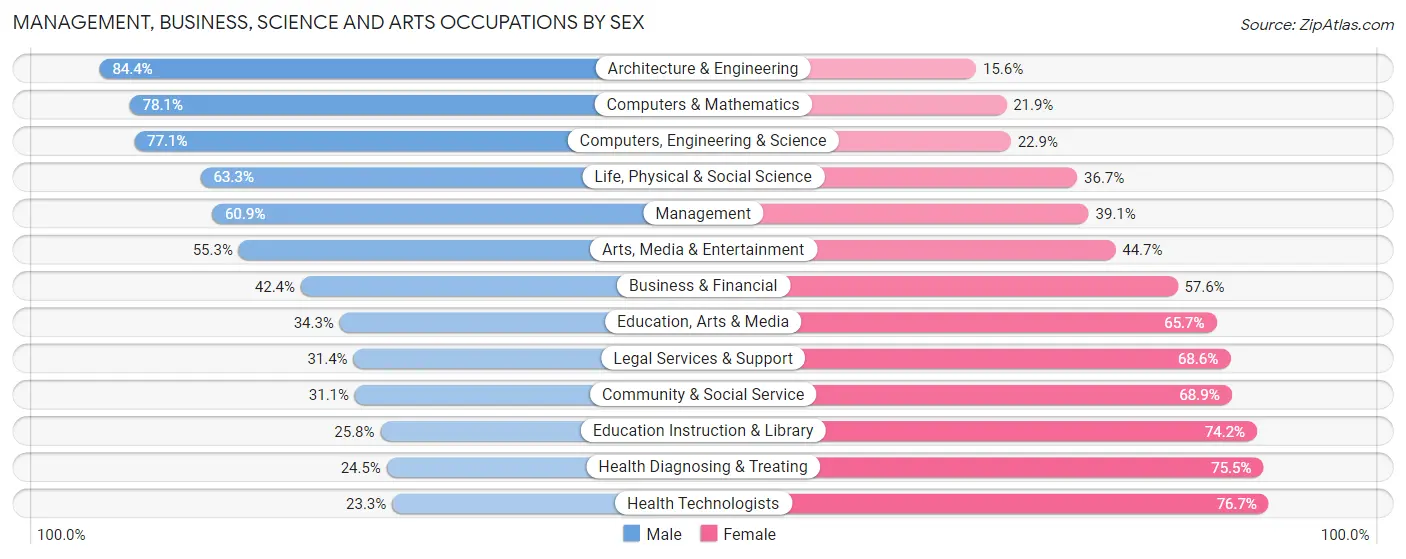
| Occupation | Male | Female |
| Management | 15,605 (60.9%) | 10,017 (39.1%) |
| Business & Financial | 3,352 (42.4%) | 4,559 (57.6%) |
| Computers, Engineering & Science | 9,128 (77.1%) | 2,705 (22.9%) |
| Computers & Mathematics | 2,858 (78.1%) | 802 (21.9%) |
| Architecture & Engineering | 4,388 (84.4%) | 812 (15.6%) |
| Life, Physical & Social Science | 1,882 (63.3%) | 1,091 (36.7%) |
| Community & Social Service | 9,724 (31.1%) | 21,545 (68.9%) |
| Education, Arts & Media | 1,887 (34.3%) | 3,620 (65.7%) |
| Legal Services & Support | 805 (31.4%) | 1,759 (68.6%) |
| Education Instruction & Library | 5,066 (25.8%) | 14,579 (74.2%) |
| Arts, Media & Entertainment | 1,966 (55.3%) | 1,587 (44.7%) |
| Health Diagnosing & Treating | 3,071 (24.5%) | 9,478 (75.5%) |
| Health Technologists | 2,066 (23.3%) | 6,787 (76.7%) |
| Total (Category) | 40,880 (45.8%) | 48,304 (54.2%) |
| Total (Overall) | 144,597 (54.2%) | 122,237 (45.8%) |
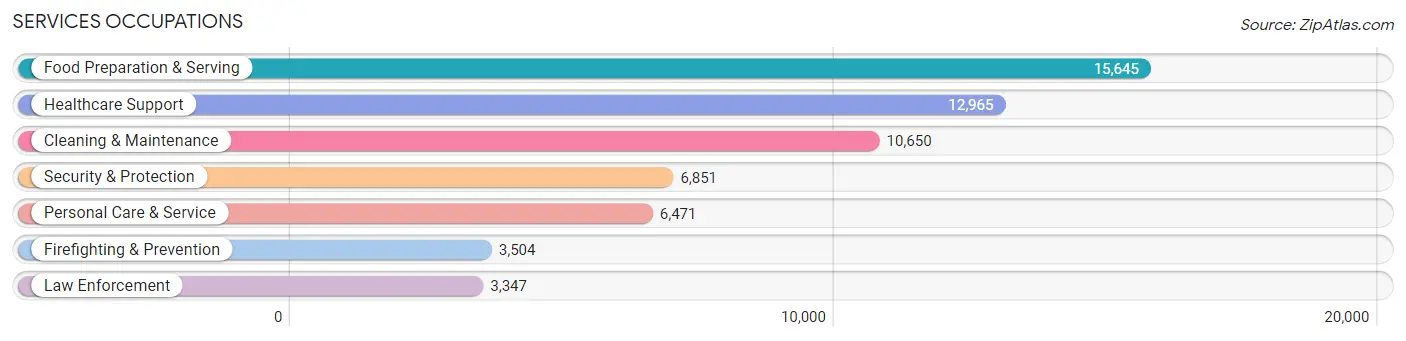
Services Occupations
The most common Services occupations in Area Code 575 are Food Preparation & Serving (15,645 | 5.9%), Healthcare Support (12,965 | 4.9%), Cleaning & Maintenance (10,650 | 4.0%), Security & Protection (6,851 | 2.6%), and Personal Care & Service (6,471 | 2.4%).
Services Occupations by Sex
Within the Services occupations in Area Code 575, the most male-oriented occupations are Law Enforcement (88.0%), Security & Protection (78.6%), and Firefighting & Prevention (69.7%), while the most female-oriented occupations are Healthcare Support (80.6%), Personal Care & Service (67.6%), and Food Preparation & Serving (58.5%).
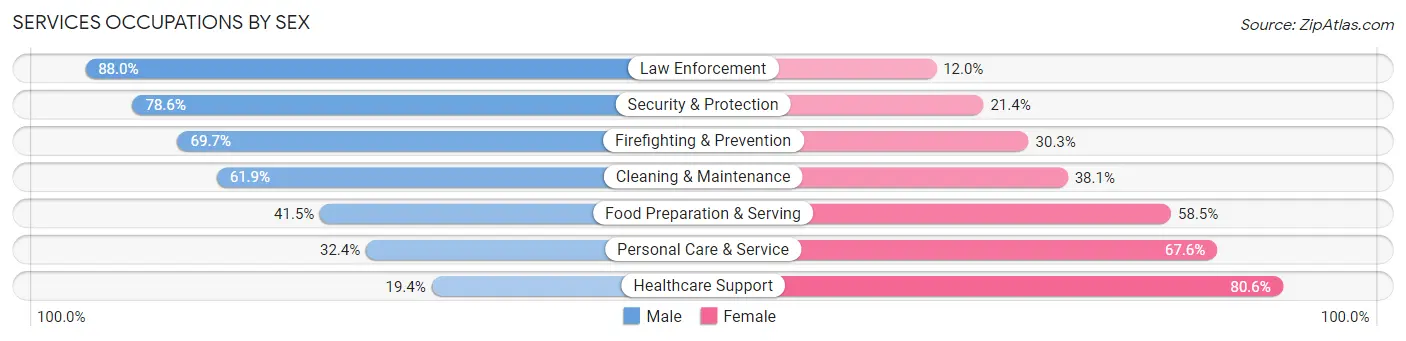
| Occupation | Male | Female |
| Healthcare Support | 2,517 (19.4%) | 10,448 (80.6%) |
| Security & Protection | 5,387 (78.6%) | 1,464 (21.4%) |
| Firefighting & Prevention | 2,442 (69.7%) | 1,062 (30.3%) |
| Law Enforcement | 2,945 (88.0%) | 402 (12.0%) |
| Food Preparation & Serving | 6,488 (41.5%) | 9,157 (58.5%) |
| Cleaning & Maintenance | 6,597 (61.9%) | 4,053 (38.1%) |
| Personal Care & Service | 2,096 (32.4%) | 4,375 (67.6%) |
| Total (Category) | 23,085 (43.9%) | 29,497 (56.1%) |
| Total (Overall) | 144,597 (54.2%) | 122,237 (45.8%) |
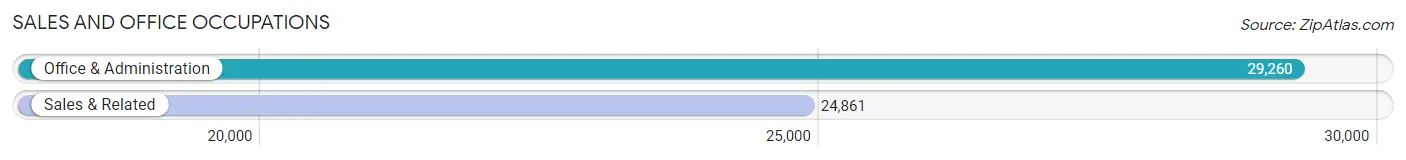
Sales and Office Occupations
The most common Sales and Office occupations in Area Code 575 are Office & Administration (29,260 | 11.0%), and Sales & Related (24,861 | 9.3%).
Sales and Office Occupations by Sex
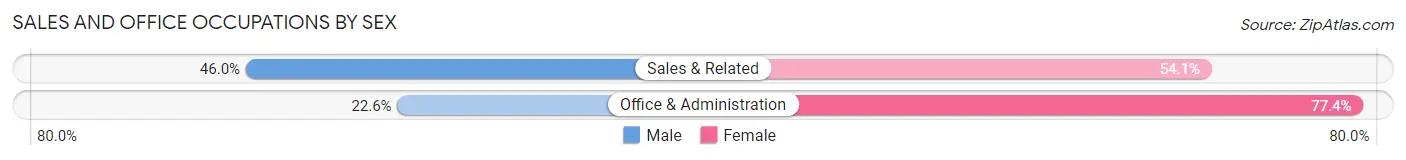
| Occupation | Male | Female |
| Sales & Related | 11,424 (46.0%) | 13,437 (54.0%) |
| Office & Administration | 6,625 (22.6%) | 22,635 (77.4%) |
| Total (Category) | 18,049 (33.4%) | 36,072 (66.6%) |
| Total (Overall) | 144,597 (54.2%) | 122,237 (45.8%) |
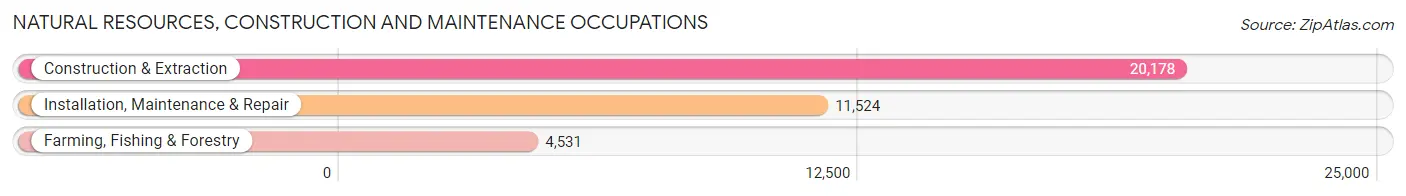
Natural Resources, Construction and Maintenance Occupations
The most common Natural Resources, Construction and Maintenance occupations in Area Code 575 are Construction & Extraction (20,178 | 7.6%), Installation, Maintenance & Repair (11,524 | 4.3%), and Farming, Fishing & Forestry (4,531 | 1.7%).
Natural Resources, Construction and Maintenance Occupations by Sex
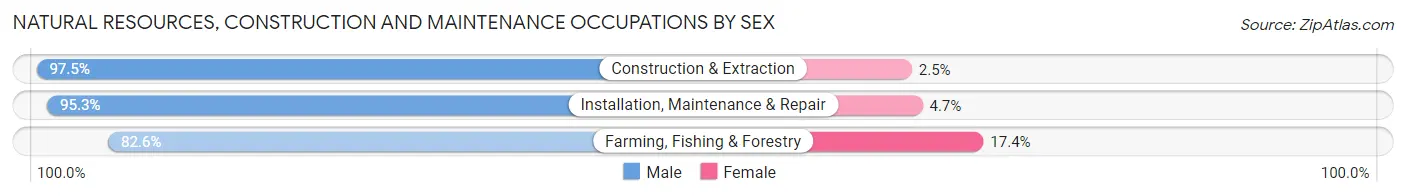
| Occupation | Male | Female |
| Farming, Fishing & Forestry | 3,744 (82.6%) | 787 (17.4%) |
| Construction & Extraction | 19,678 (97.5%) | 500 (2.5%) |
| Installation, Maintenance & Repair | 10,982 (95.3%) | 542 (4.7%) |
| Total (Category) | 34,404 (95.0%) | 1,829 (5.1%) |
| Total (Overall) | 144,597 (54.2%) | 122,237 (45.8%) |
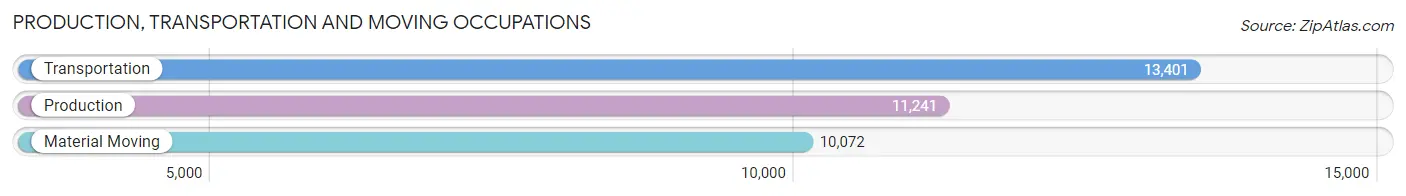
Production, Transportation and Moving Occupations
The most common Production, Transportation and Moving occupations in Area Code 575 are Transportation (13,401 | 5.0%), Production (11,241 | 4.2%), and Material Moving (10,072 | 3.8%).
Production, Transportation and Moving Occupations by Sex
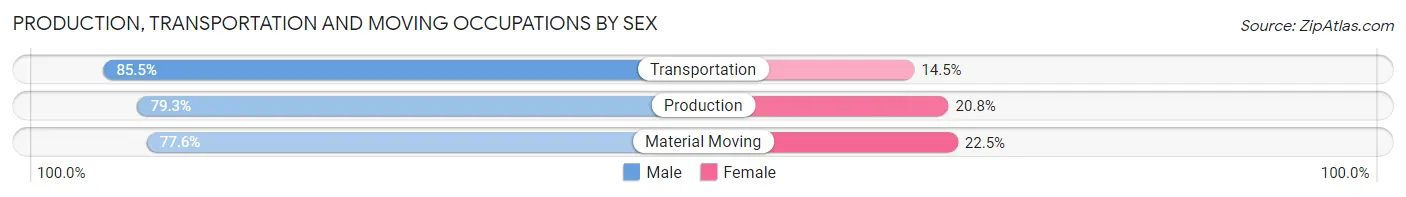
| Occupation | Male | Female |
| Production | 8,908 (79.2%) | 2,333 (20.7%) |
| Transportation | 11,460 (85.5%) | 1,941 (14.5%) |
| Material Moving | 7,811 (77.5%) | 2,261 (22.5%) |
| Total (Category) | 28,179 (81.2%) | 6,535 (18.8%) |
| Total (Overall) | 144,597 (54.2%) | 122,237 (45.8%) |
Employment Industries by Sex in Area Code 575
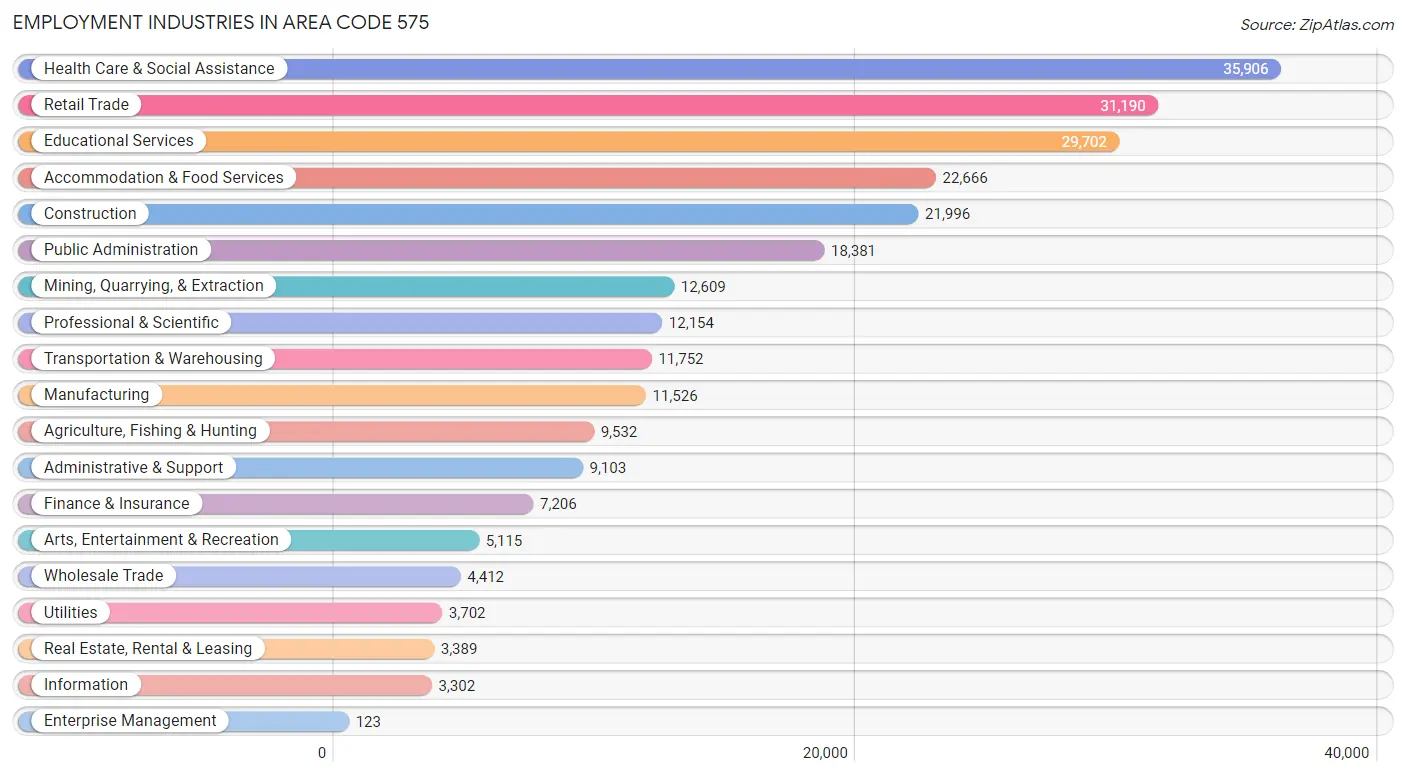
Employment Industries in Area Code 575
The major employment industries in Area Code 575 include Health Care & Social Assistance (35,906 | 13.5%), Retail Trade (31,190 | 11.7%), Educational Services (29,702 | 11.1%), Accommodation & Food Services (22,666 | 8.5%), and Construction (21,996 | 8.2%).
Employment Industries by Sex in Area Code 575
The Area Code 575 industries that see more men than women are Construction (91.3%), Mining, Quarrying, & Extraction (87.5%), and Utilities (85.8%), whereas the industries that tend to have a higher number of women are Health Care & Social Assistance (79.4%), Finance & Insurance (72.1%), and Educational Services (68.8%).
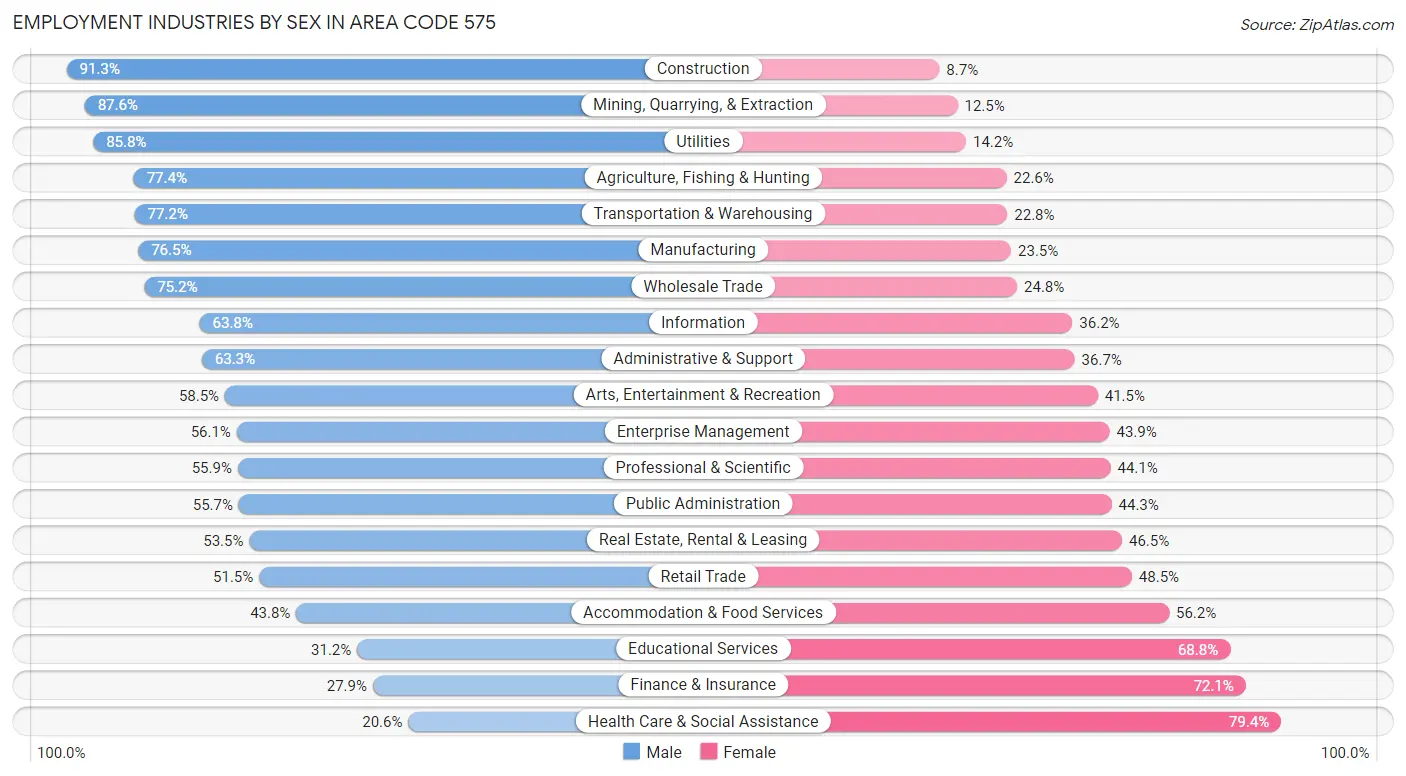
| Industry | Male | Female |
| Agriculture, Fishing & Hunting | 7,378 (77.4%) | 2,154 (22.6%) |
| Mining, Quarrying, & Extraction | 11,039 (87.5%) | 1,570 (12.4%) |
| Construction | 20,085 (91.3%) | 1,911 (8.7%) |
| Manufacturing | 8,814 (76.5%) | 2,712 (23.5%) |
| Wholesale Trade | 3,319 (75.2%) | 1,093 (24.8%) |
| Retail Trade | 16,050 (51.5%) | 15,140 (48.5%) |
| Transportation & Warehousing | 9,077 (77.2%) | 2,675 (22.8%) |
| Utilities | 3,176 (85.8%) | 526 (14.2%) |
| Information | 2,106 (63.8%) | 1,196 (36.2%) |
| Finance & Insurance | 2,012 (27.9%) | 5,194 (72.1%) |
| Real Estate, Rental & Leasing | 1,813 (53.5%) | 1,576 (46.5%) |
| Professional & Scientific | 6,792 (55.9%) | 5,362 (44.1%) |
| Enterprise Management | 69 (56.1%) | 54 (43.9%) |
| Administrative & Support | 5,763 (63.3%) | 3,340 (36.7%) |
| Educational Services | 9,259 (31.2%) | 20,443 (68.8%) |
| Health Care & Social Assistance | 7,391 (20.6%) | 28,515 (79.4%) |
| Arts, Entertainment & Recreation | 2,994 (58.5%) | 2,121 (41.5%) |
| Accommodation & Food Services | 9,923 (43.8%) | 12,743 (56.2%) |
| Public Administration | 10,233 (55.7%) | 8,148 (44.3%) |
| Total | 144,597 (54.2%) | 122,237 (45.8%) |
Education in Area Code 575
School Enrollment in Area Code 575
The most common levels of schooling among the 172,307 students in Area Code 575 are college / undergraduate (39,814 | 23.1%), middle school (37,233 | 21.6%), and elementary school (35,186 | 20.4%).
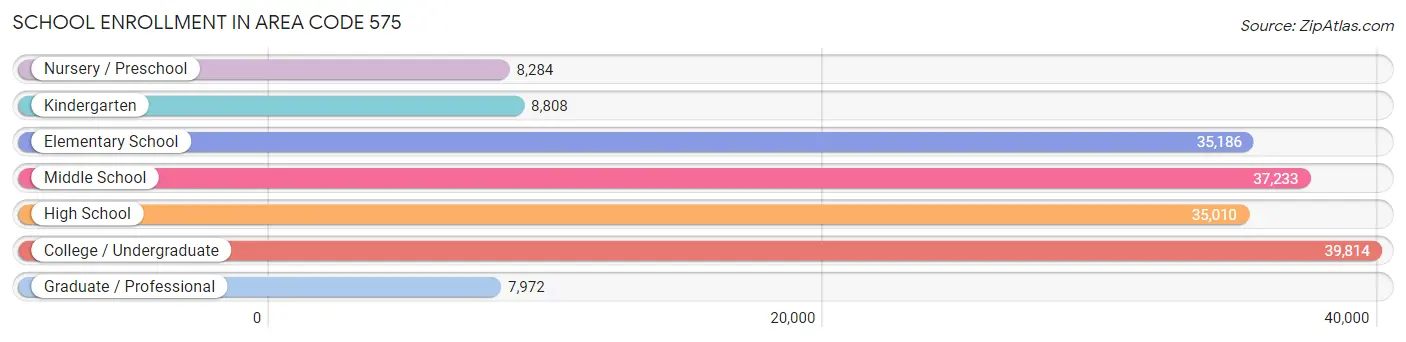
| School Level | # Students | % Students |
| Nursery / Preschool | 8,284 | 4.8% |
| Kindergarten | 8,808 | 5.1% |
| Elementary School | 35,186 | 20.4% |
| Middle School | 37,233 | 21.6% |
| High School | 35,010 | 20.3% |
| College / Undergraduate | 39,814 | 23.1% |
| Graduate / Professional | 7,972 | 4.6% |
| Total | 172,307 | 100.0% |
School Enrollment by Age by Funding Source in Area Code 575
Out of a total of 172,307 students who are enrolled in schools in Area Code 575, 15,675 (9.1%) attend a private institution, while the remaining 156,632 (90.9%) are enrolled in public schools. The age group of 35 years and over has the highest likelihood of being enrolled in private schools, with 1,940 (20.5% in the age bracket) enrolled. Conversely, the age group of 10 to 14 year olds has the lowest likelihood of being enrolled in a private school, with 42,655 (95.0% in the age bracket) attending a public institution.
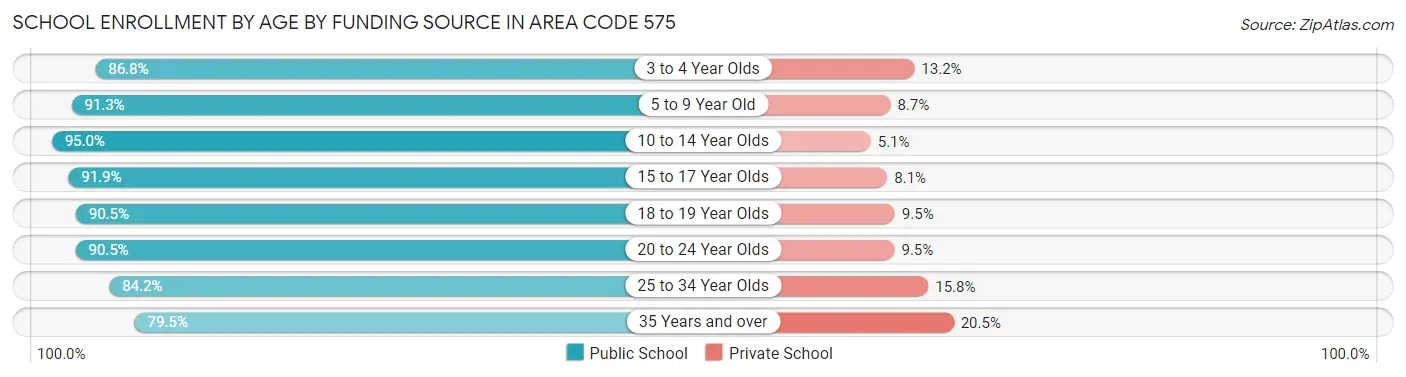
| Age Bracket | Public School | Private School |
| 3 to 4 Year Olds | 5,735 (86.8%) | 871 (13.2%) |
| 5 to 9 Year Old | 37,742 (91.3%) | 3,610 (8.7%) |
| 10 to 14 Year Olds | 42,655 (95.0%) | 2,269 (5.1%) |
| 15 to 17 Year Olds | 23,719 (91.9%) | 2,103 (8.1%) |
| 18 to 19 Year Olds | 12,724 (90.5%) | 1,342 (9.5%) |
| 20 to 24 Year Olds | 17,290 (90.5%) | 1,810 (9.5%) |
| 25 to 34 Year Olds | 9,244 (84.2%) | 1,730 (15.8%) |
| 35 Years and over | 7,523 (79.5%) | 1,940 (20.5%) |
| Total | 156,632 (90.9%) | 15,675 (9.1%) |
Educational Attainment by Field of Study in Area Code 575
Education (19,550 | 18.5%), business (16,074 | 15.2%), bio, nature & agricultural (9,404 | 8.9%), science & technology (9,208 | 8.7%), and arts & humanities (8,313 | 7.9%) are the most common fields of study among 105,479 individuals in Area Code 575 who have obtained a bachelor's degree or higher.
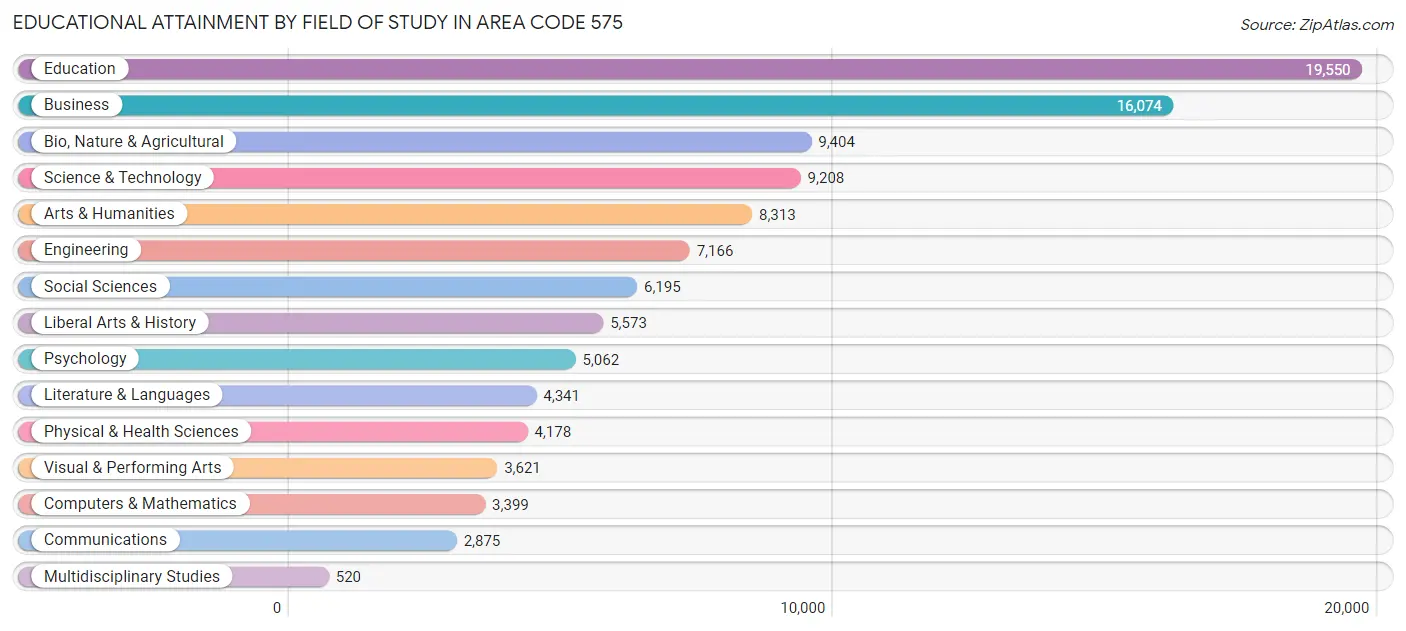
| Field of Study | # Graduates | % Graduates |
| Computers & Mathematics | 3,399 | 3.2% |
| Bio, Nature & Agricultural | 9,404 | 8.9% |
| Physical & Health Sciences | 4,178 | 4.0% |
| Psychology | 5,062 | 4.8% |
| Social Sciences | 6,195 | 5.9% |
| Engineering | 7,166 | 6.8% |
| Multidisciplinary Studies | 520 | 0.5% |
| Science & Technology | 9,208 | 8.7% |
| Business | 16,074 | 15.2% |
| Education | 19,550 | 18.5% |
| Literature & Languages | 4,341 | 4.1% |
| Liberal Arts & History | 5,573 | 5.3% |
| Visual & Performing Arts | 3,621 | 3.4% |
| Communications | 2,875 | 2.7% |
| Arts & Humanities | 8,313 | 7.9% |
| Total | 105,479 | 100.0% |
Transportation & Commute in Area Code 575
Vehicle Availability by Sex in Area Code 575
The most prevalent vehicle ownership categories in Area Code 575 are males with 2 vehicles (58,186, accounting for 39.6%) and females with 2 vehicles (43,141, making up 48.8%).
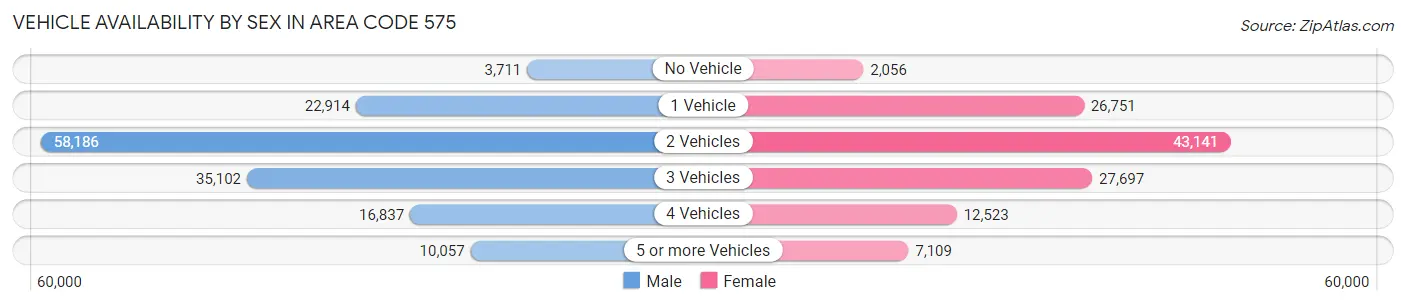
| Vehicles Available | Male | Female |
| No Vehicle | 3,711 (2.5%) | 2,056 (1.7%) |
| 1 Vehicle | 22,914 (15.6%) | 26,751 (22.4%) |
| 2 Vehicles | 58,186 (39.6%) | 43,141 (36.2%) |
| 3 Vehicles | 35,102 (23.9%) | 27,697 (23.2%) |
| 4 Vehicles | 16,837 (11.5%) | 12,523 (10.5%) |
| 5 or more Vehicles | 10,057 (6.9%) | 7,109 (6.0%) |
| Total | 146,807 (100.0%) | 119,277 (100.0%) |
Commute Time in Area Code 575
The most frequently occuring commute durations in Area Code 575 are 10 to 14 minutes (52,407 commuters, 20.7%), 5 to 9 minutes (48,027 commuters, 18.9%), and 15 to 19 minutes (42,954 commuters, 16.9%).
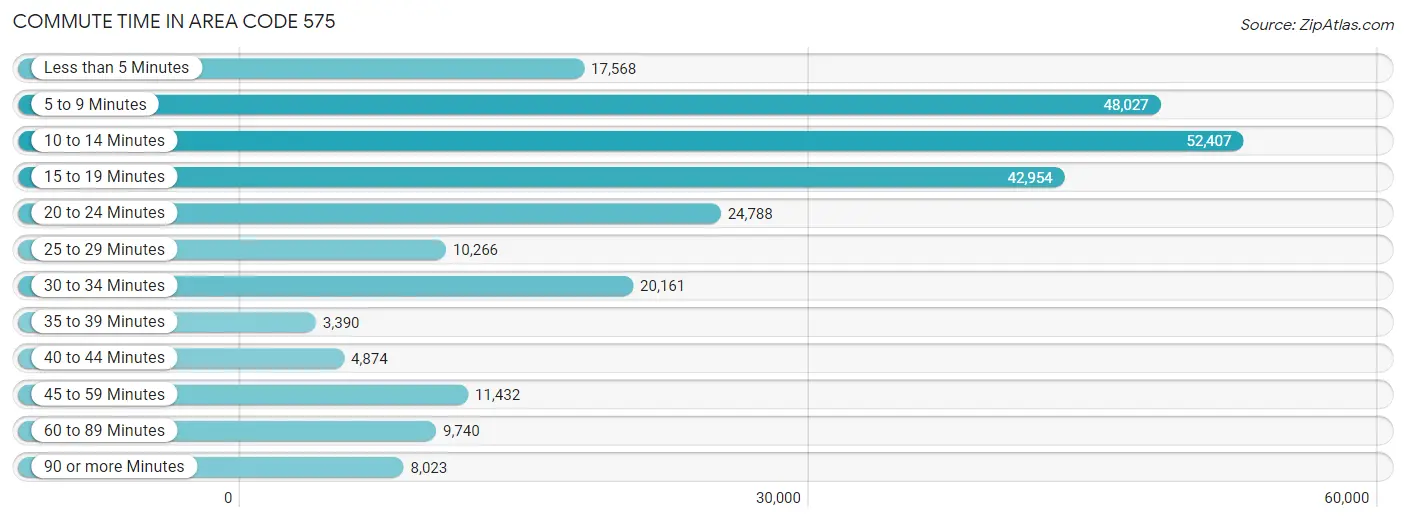
| Commute Time | # Commuters | % Commuters |
| Less than 5 Minutes | 17,568 | 6.9% |
| 5 to 9 Minutes | 48,027 | 18.9% |
| 10 to 14 Minutes | 52,407 | 20.7% |
| 15 to 19 Minutes | 42,954 | 16.9% |
| 20 to 24 Minutes | 24,788 | 9.8% |
| 25 to 29 Minutes | 10,266 | 4.1% |
| 30 to 34 Minutes | 20,161 | 8.0% |
| 35 to 39 Minutes | 3,390 | 1.3% |
| 40 to 44 Minutes | 4,874 | 1.9% |
| 45 to 59 Minutes | 11,432 | 4.5% |
| 60 to 89 Minutes | 9,740 | 3.8% |
| 90 or more Minutes | 8,023 | 3.2% |
Commute Time by Sex in Area Code 575
The most common commute times in Area Code 575 are 10 to 14 minutes (27,045 commuters, 19.1%) for males and 10 to 14 minutes (25,362 commuters, 22.7%) for females.
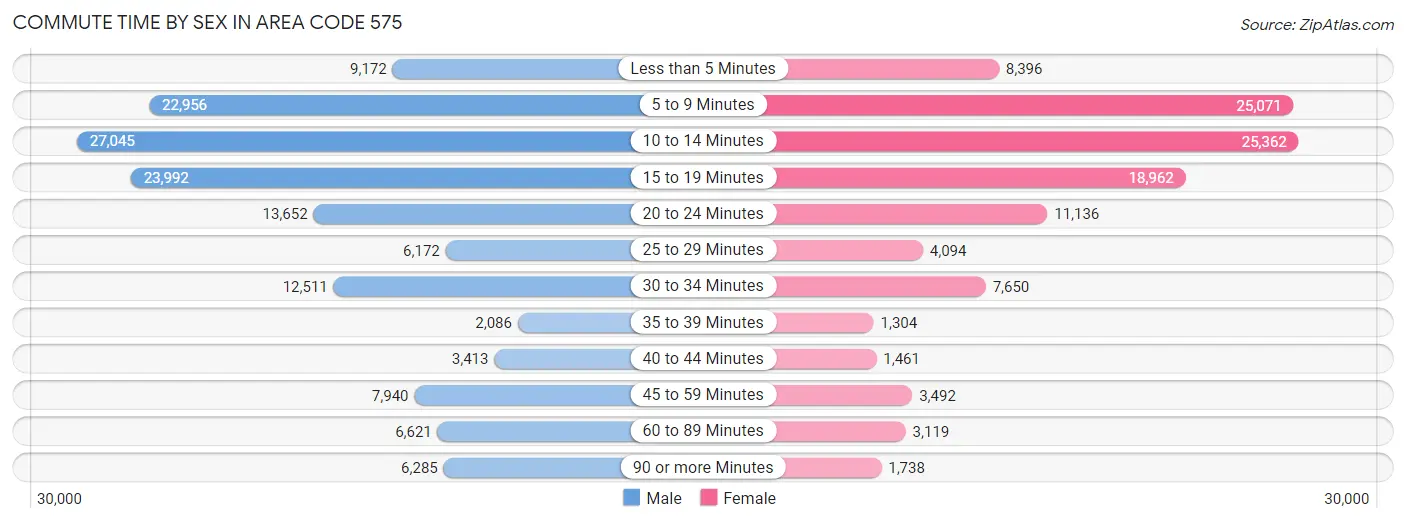
| Commute Time | Male | Female |
| Less than 5 Minutes | 9,172 (6.5%) | 8,396 (7.5%) |
| 5 to 9 Minutes | 22,956 (16.2%) | 25,071 (22.4%) |
| 10 to 14 Minutes | 27,045 (19.1%) | 25,362 (22.7%) |
| 15 to 19 Minutes | 23,992 (16.9%) | 18,962 (17.0%) |
| 20 to 24 Minutes | 13,652 (9.6%) | 11,136 (10.0%) |
| 25 to 29 Minutes | 6,172 (4.3%) | 4,094 (3.7%) |
| 30 to 34 Minutes | 12,511 (8.8%) | 7,650 (6.8%) |
| 35 to 39 Minutes | 2,086 (1.5%) | 1,304 (1.2%) |
| 40 to 44 Minutes | 3,413 (2.4%) | 1,461 (1.3%) |
| 45 to 59 Minutes | 7,940 (5.6%) | 3,492 (3.1%) |
| 60 to 89 Minutes | 6,621 (4.7%) | 3,119 (2.8%) |
| 90 or more Minutes | 6,285 (4.4%) | 1,738 (1.5%) |
Time of Departure to Work by Sex in Area Code 575
The most frequent times of departure to work in Area Code 575 are 7:00 AM to 7:29 AM (18,962, 13.4%) for males and 7:30 AM to 7:59 AM (24,830, 22.2%) for females.
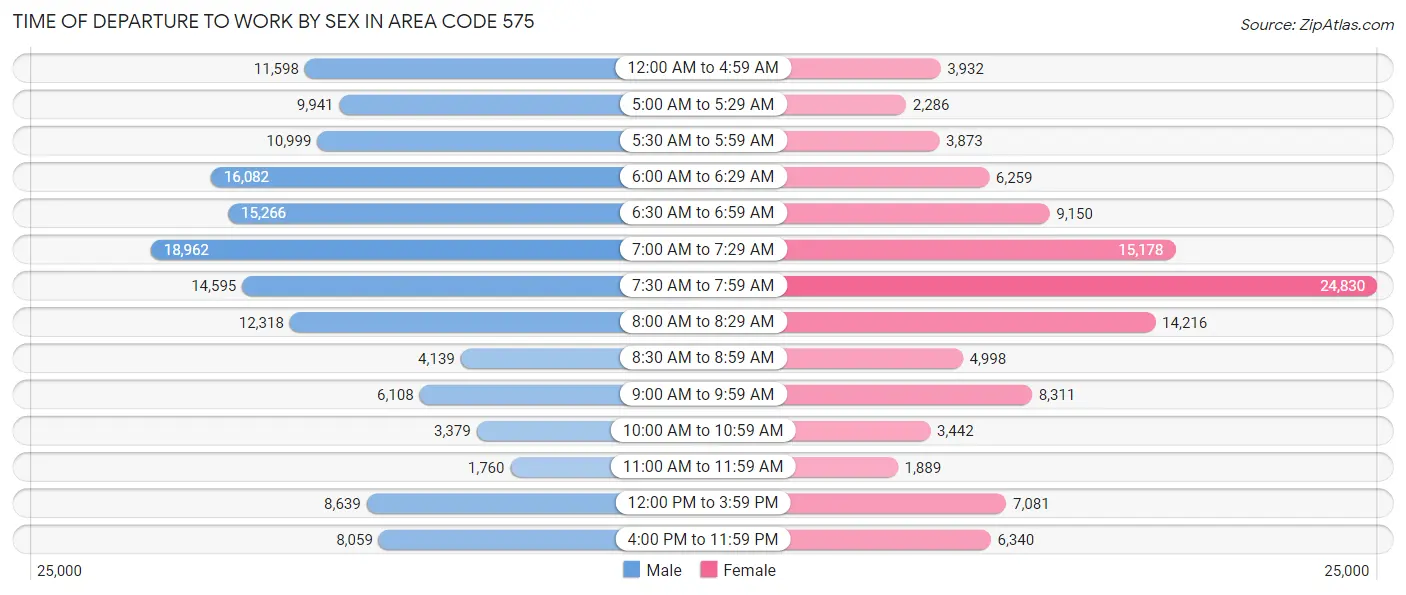
| Time of Departure | Male | Female |
| 12:00 AM to 4:59 AM | 11,598 (8.2%) | 3,932 (3.5%) |
| 5:00 AM to 5:29 AM | 9,941 (7.0%) | 2,286 (2.0%) |
| 5:30 AM to 5:59 AM | 10,999 (7.7%) | 3,873 (3.5%) |
| 6:00 AM to 6:29 AM | 16,082 (11.3%) | 6,259 (5.6%) |
| 6:30 AM to 6:59 AM | 15,266 (10.8%) | 9,150 (8.2%) |
| 7:00 AM to 7:29 AM | 18,962 (13.4%) | 15,178 (13.6%) |
| 7:30 AM to 7:59 AM | 14,595 (10.3%) | 24,830 (22.2%) |
| 8:00 AM to 8:29 AM | 12,318 (8.7%) | 14,216 (12.7%) |
| 8:30 AM to 8:59 AM | 4,139 (2.9%) | 4,998 (4.5%) |
| 9:00 AM to 9:59 AM | 6,108 (4.3%) | 8,311 (7.4%) |
| 10:00 AM to 10:59 AM | 3,379 (2.4%) | 3,442 (3.1%) |
| 11:00 AM to 11:59 AM | 1,760 (1.2%) | 1,889 (1.7%) |
| 12:00 PM to 3:59 PM | 8,639 (6.1%) | 7,081 (6.3%) |
| 4:00 PM to 11:59 PM | 8,059 (5.7%) | 6,340 (5.7%) |
| Total | 141,845 (100.0%) | 111,785 (100.0%) |
Housing Occupancy in Area Code 575
Occupancy by Ownership in Area Code 575
Of the total 247,540 dwellings in Area Code 575, owner-occupied units account for 164,418 (66.4%), while renter-occupied units make up 83,122 (33.6%).
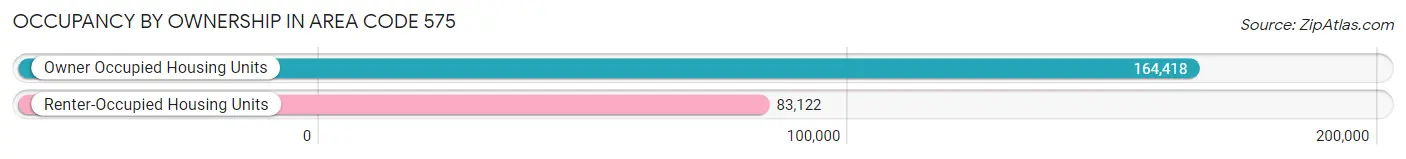
| Occupancy | # Housing Units | % Housing Units |
| Owner Occupied Housing Units | 164,418 | 66.4% |
| Renter-Occupied Housing Units | 83,122 | 33.6% |
| Total Occupied Housing Units | 247,540 | 100.0% |
Occupancy by Household Size in Area Code 575
| Household Size | # Housing Units | % Housing Units |
| 1-Person Household | 77,569 | 31.3% |
| 2-Person Household | 81,690 | 33.0% |
| 3-Person Household | 34,703 | 14.0% |
| 4+ Person Household | 53,578 | 21.6% |
| Total Housing Units | 247,540 | 100.0% |
Occupancy by Ownership by Household Size in Area Code 575
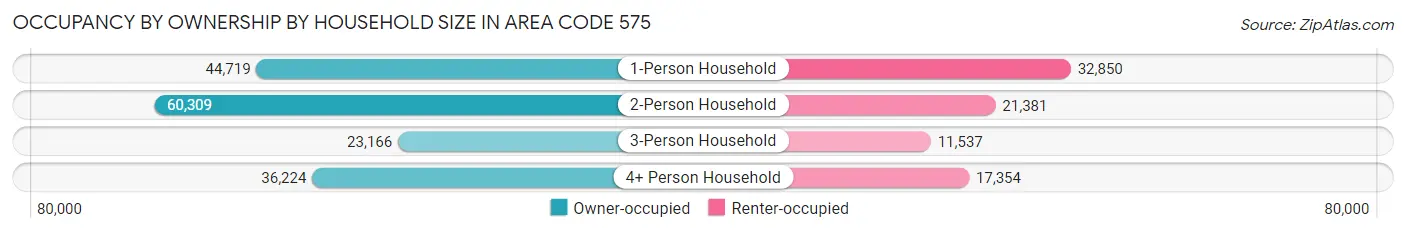
| Household Size | Owner-occupied | Renter-occupied |
| 1-Person Household | 44,719 (57.7%) | 32,850 (42.3%) |
| 2-Person Household | 60,309 (73.8%) | 21,381 (26.2%) |
| 3-Person Household | 23,166 (66.8%) | 11,537 (33.2%) |
| 4+ Person Household | 36,224 (67.6%) | 17,354 (32.4%) |
| Total Housing Units | 164,418 (66.4%) | 83,122 (33.6%) |
Occupancy by Educational Attainment in Area Code 575
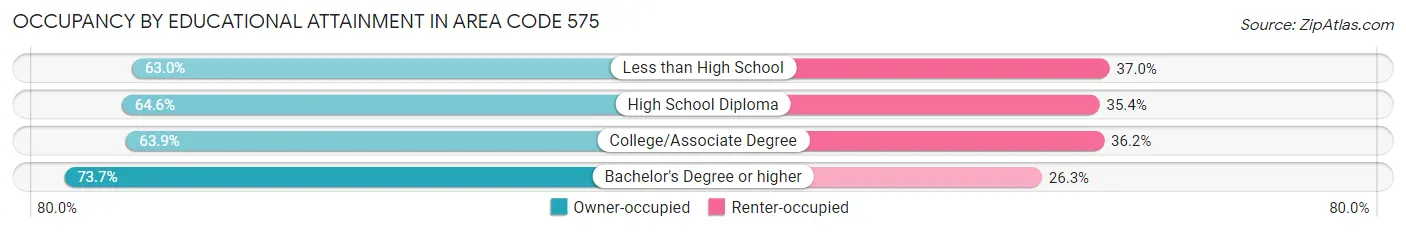
| Household Size | Owner-occupied | Renter-occupied |
| Less than High School | 22,671 (63.0%) | 13,332 (37.0%) |
| High School Diploma | 39,722 (64.6%) | 21,796 (35.4%) |
| College/Associate Degree | 55,414 (63.8%) | 31,373 (36.1%) |
| Bachelor's Degree or higher | 46,611 (73.7%) | 16,621 (26.3%) |
Occupancy by Age of Householder in Area Code 575
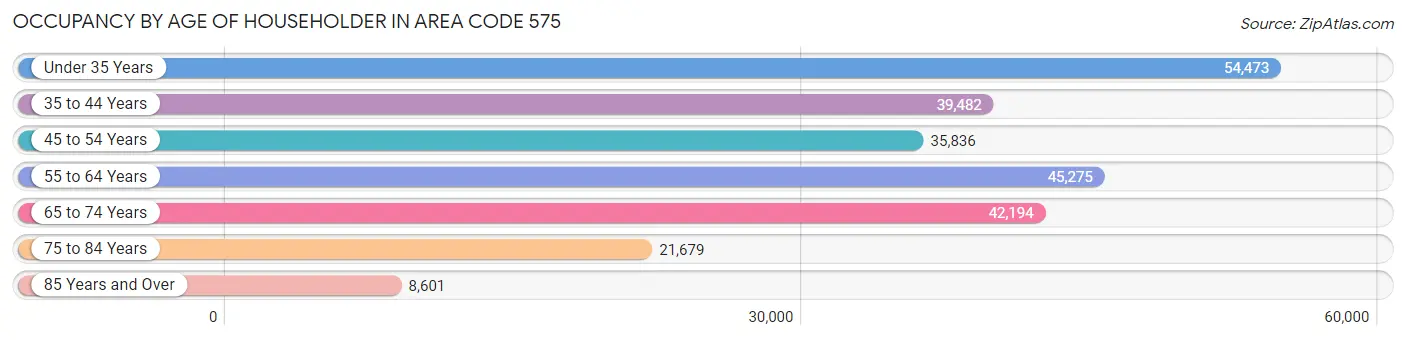
| Age Bracket | # Households | % Households |
| Under 35 Years | 54,473 | 22.0% |
| 35 to 44 Years | 39,482 | 16.0% |
| 45 to 54 Years | 35,836 | 14.5% |
| 55 to 64 Years | 45,275 | 18.3% |
| 65 to 74 Years | 42,194 | 17.1% |
| 75 to 84 Years | 21,679 | 8.8% |
| 85 Years and Over | 8,601 | 3.5% |
| Total | 247,540 | 100.0% |
Housing Finances in Area Code 575
Median Income by Occupancy in Area Code 575
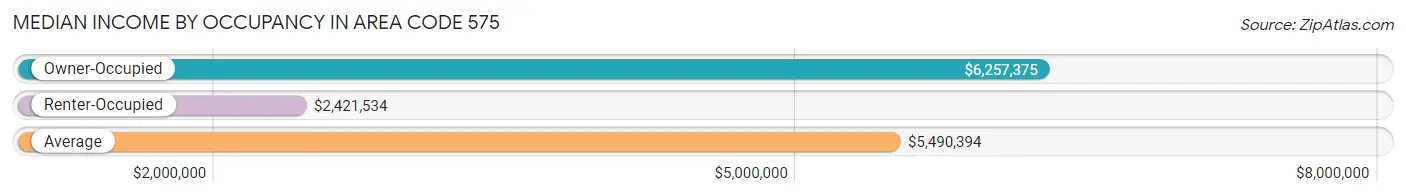
| Occupancy Type | # Households | Median Income |
| Owner-Occupied | 164,418 (66.4%) | $6,257,375 |
| Renter-Occupied | 83,122 (33.6%) | $2,421,534 |
| Average | 247,540 (100.0%) | $5,490,394 |
Occupancy by Householder Income Bracket in Area Code 575
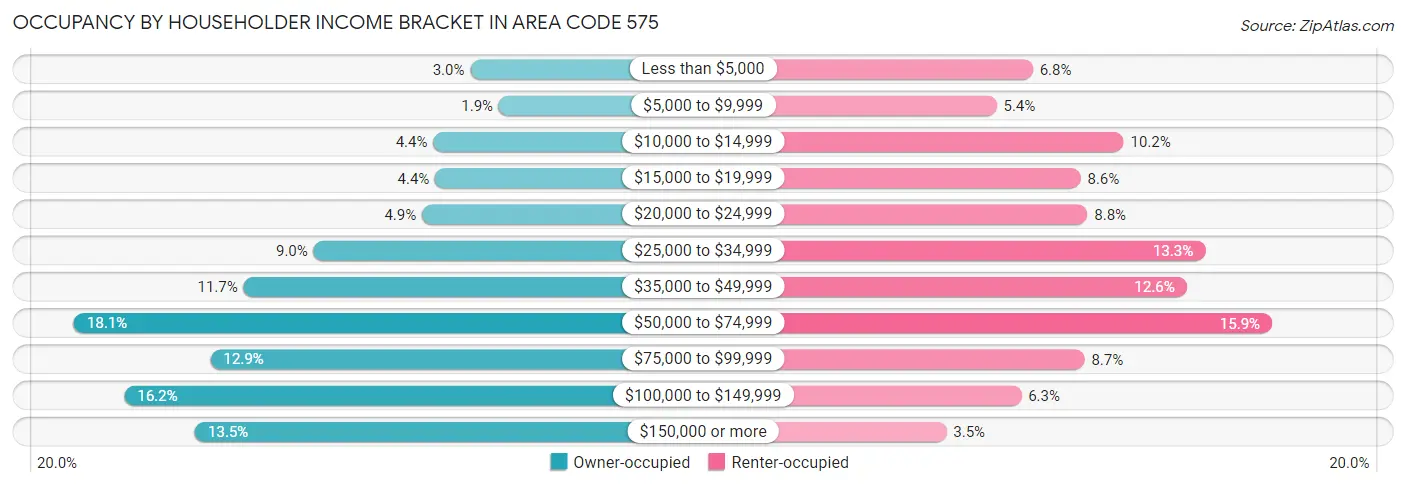
| Income Bracket | Owner-occupied | Renter-occupied |
| Less than $5,000 | 4,971 (3.0%) | 5,612 (6.8%) |
| $5,000 to $9,999 | 3,178 (1.9%) | 4,465 (5.4%) |
| $10,000 to $14,999 | 7,282 (4.4%) | 8,489 (10.2%) |
| $15,000 to $19,999 | 7,170 (4.4%) | 7,120 (8.6%) |
| $20,000 to $24,999 | 7,984 (4.9%) | 7,343 (8.8%) |
| $25,000 to $34,999 | 14,781 (9.0%) | 11,063 (13.3%) |
| $35,000 to $49,999 | 19,166 (11.7%) | 10,484 (12.6%) |
| $50,000 to $74,999 | 29,795 (18.1%) | 13,179 (15.9%) |
| $75,000 to $99,999 | 21,240 (12.9%) | 7,248 (8.7%) |
| $100,000 to $149,999 | 26,638 (16.2%) | 5,241 (6.3%) |
| $150,000 or more | 22,213 (13.5%) | 2,878 (3.5%) |
| Total | 164,418 (100.0%) | 83,122 (100.0%) |
Monthly Housing Cost Tiers in Area Code 575
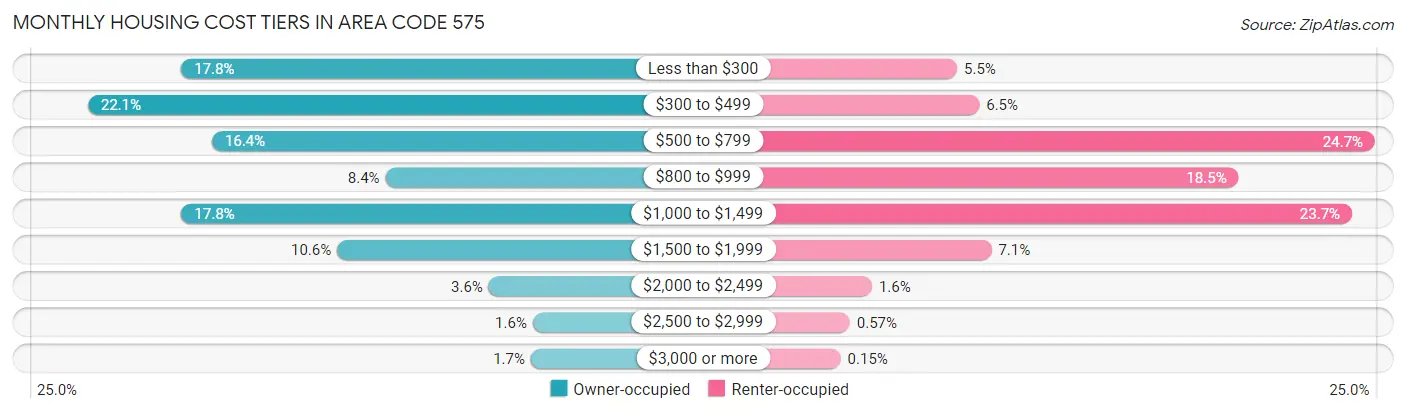
| Monthly Cost | Owner-occupied | Renter-occupied |
| Less than $300 | 29,252 (17.8%) | 4,577 (5.5%) |
| $300 to $499 | 36,317 (22.1%) | 5,424 (6.5%) |
| $500 to $799 | 26,937 (16.4%) | 20,568 (24.7%) |
| $800 to $999 | 13,793 (8.4%) | 15,342 (18.5%) |
| $1,000 to $1,499 | 29,232 (17.8%) | 19,683 (23.7%) |
| $1,500 to $1,999 | 17,458 (10.6%) | 5,893 (7.1%) |
| $2,000 to $2,499 | 5,985 (3.6%) | 1,319 (1.6%) |
| $2,500 to $2,999 | 2,652 (1.6%) | 477 (0.6%) |
| $3,000 or more | 2,792 (1.7%) | 124 (0.2%) |
| Total | 164,418 (100.0%) | 83,122 (100.0%) |
Physical Housing Characteristics in Area Code 575
Housing Structures in Area Code 575
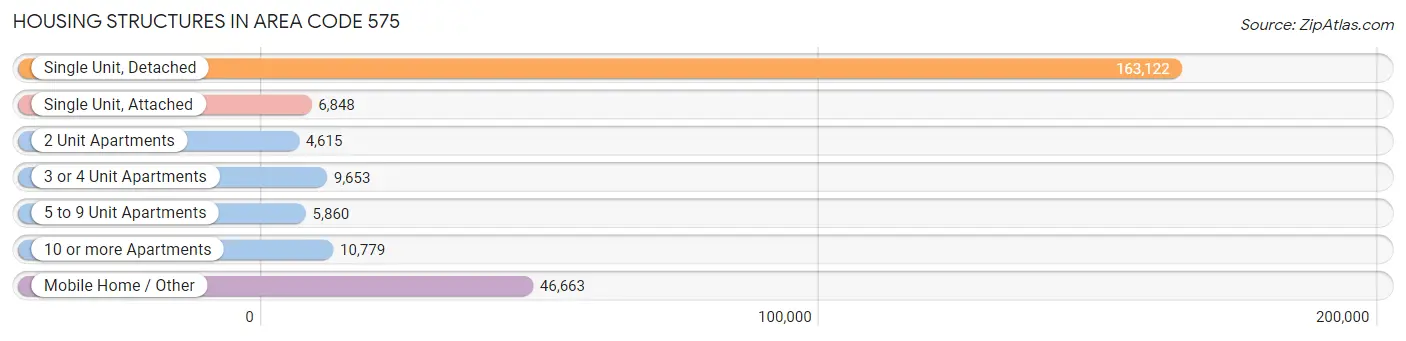
| Structure Type | # Housing Units | % Housing Units |
| Single Unit, Detached | 163,122 | 65.9% |
| Single Unit, Attached | 6,848 | 2.8% |
| 2 Unit Apartments | 4,615 | 1.9% |
| 3 or 4 Unit Apartments | 9,653 | 3.9% |
| 5 to 9 Unit Apartments | 5,860 | 2.4% |
| 10 or more Apartments | 10,779 | 4.3% |
| Mobile Home / Other | 46,663 | 18.9% |
| Total | 247,540 | 100.0% |
Housing Structures by Occupancy in Area Code 575
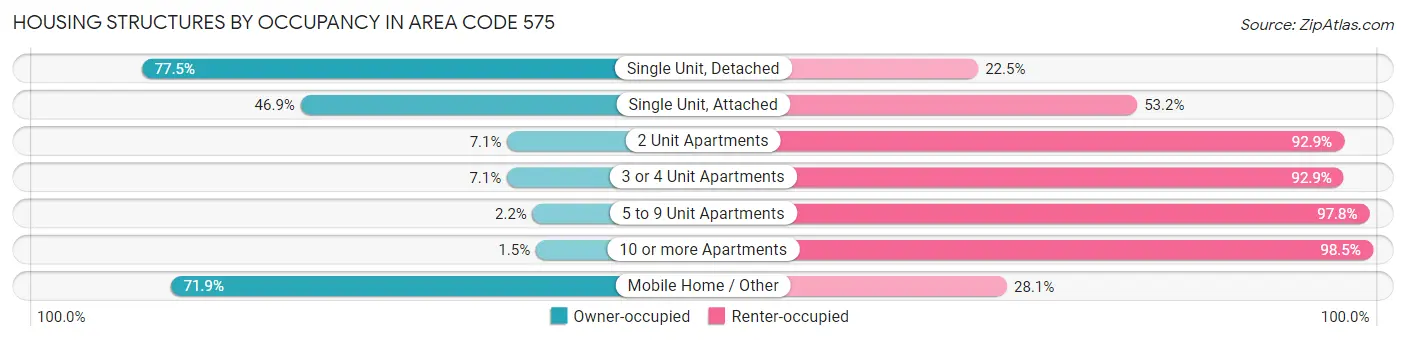
| Structure Type | Owner-occupied | Renter-occupied |
| Single Unit, Detached | 126,353 (77.5%) | 36,769 (22.5%) |
| Single Unit, Attached | 3,208 (46.9%) | 3,640 (53.1%) |
| 2 Unit Apartments | 326 (7.1%) | 4,289 (92.9%) |
| 3 or 4 Unit Apartments | 686 (7.1%) | 8,967 (92.9%) |
| 5 to 9 Unit Apartments | 127 (2.2%) | 5,733 (97.8%) |
| 10 or more Apartments | 166 (1.5%) | 10,613 (98.5%) |
| Mobile Home / Other | 33,552 (71.9%) | 13,111 (28.1%) |
| Total | 164,418 (66.4%) | 83,122 (33.6%) |
Housing Structures by Number of Rooms in Area Code 575
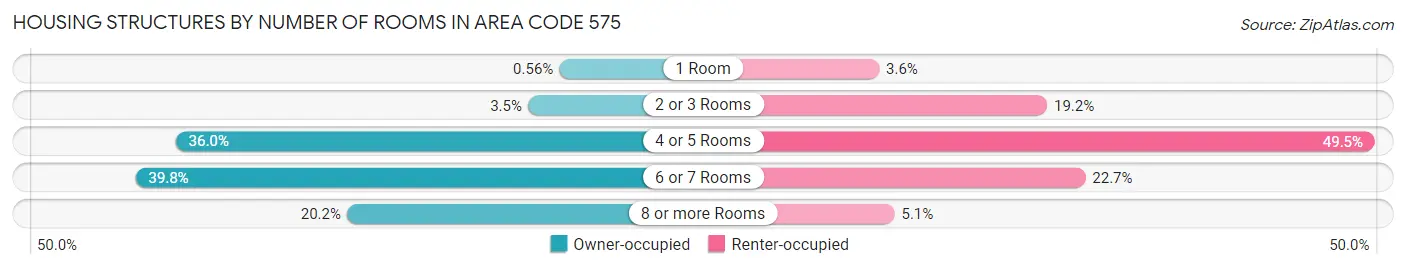
| Number of Rooms | Owner-occupied | Renter-occupied |
| 1 Room | 919 (0.6%) | 3,006 (3.6%) |
| 2 or 3 Rooms | 5,692 (3.5%) | 15,928 (19.2%) |
| 4 or 5 Rooms | 59,245 (36.0%) | 41,120 (49.5%) |
| 6 or 7 Rooms | 65,356 (39.8%) | 18,871 (22.7%) |
| 8 or more Rooms | 33,206 (20.2%) | 4,197 (5.1%) |
| Total | 164,418 (100.0%) | 83,122 (100.0%) |
Housing Structure by Heating Type in Area Code 575
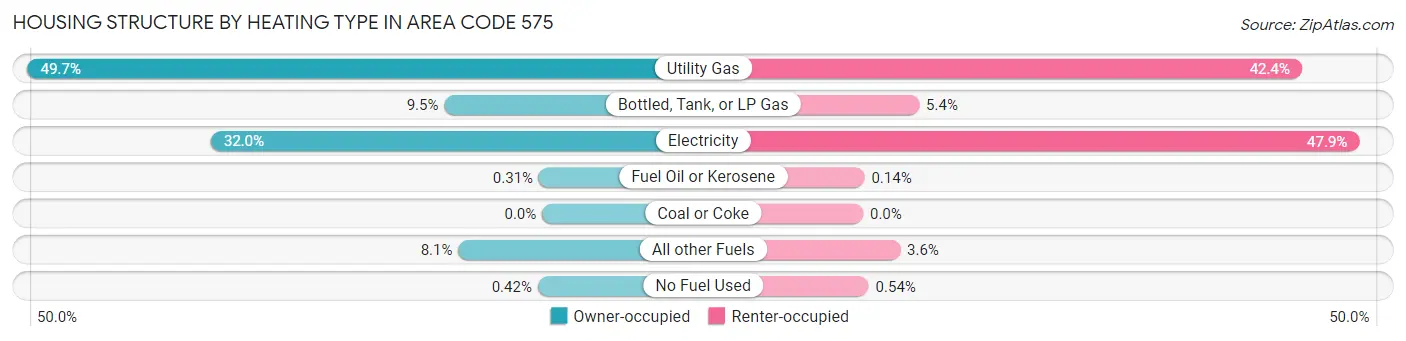
| Heating Type | Owner-occupied | Renter-occupied |
| Utility Gas | 81,729 (49.7%) | 35,229 (42.4%) |
| Bottled, Tank, or LP Gas | 15,536 (9.5%) | 4,509 (5.4%) |
| Electricity | 52,630 (32.0%) | 39,842 (47.9%) |
| Fuel Oil or Kerosene | 508 (0.3%) | 120 (0.1%) |
| Coal or Coke | 0 (0.0%) | 0 (0.0%) |
| All other Fuels | 13,325 (8.1%) | 2,972 (3.6%) |
| No Fuel Used | 690 (0.4%) | 450 (0.5%) |
| Total | 164,418 (100.0%) | 83,122 (100.0%) |
Household Vehicle Usage in Area Code 575
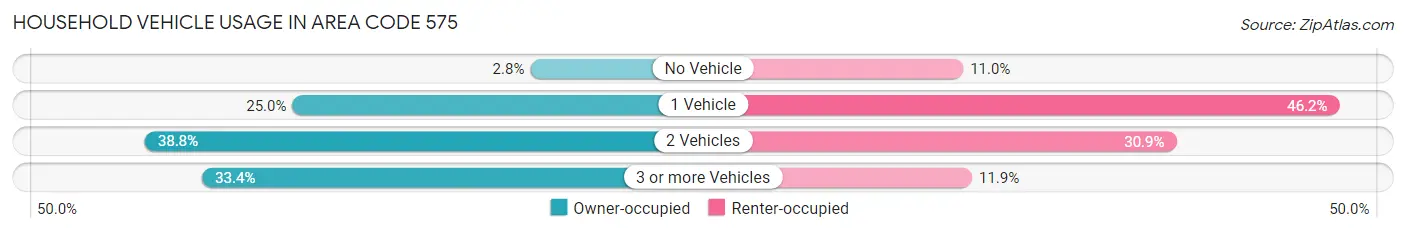
| Vehicles per Household | Owner-occupied | Renter-occupied |
| No Vehicle | 4,599 (2.8%) | 9,180 (11.0%) |
| 1 Vehicle | 41,126 (25.0%) | 38,363 (46.2%) |
| 2 Vehicles | 63,751 (38.8%) | 25,711 (30.9%) |
| 3 or more Vehicles | 54,942 (33.4%) | 9,868 (11.9%) |
| Total | 164,418 (100.0%) | 83,122 (100.0%) |
Real Estate & Mortgages in Area Code 575
Real Estate and Mortgage Overview in Area Code 575
| Characteristic | Without Mortgage | With Mortgage |
| Housing Units | 87,240 | 77,178 |
| Median Property Value | $15,746,600 | $15,246,300 |
| Median Household Income | $5,177,542 | $14,565 |
| Monthly Housing Costs | $42,213 | $2,638 |
| Real Estate Taxes | $77,741 | $3,915 |
Property Value by Mortgage Status in Area Code 575
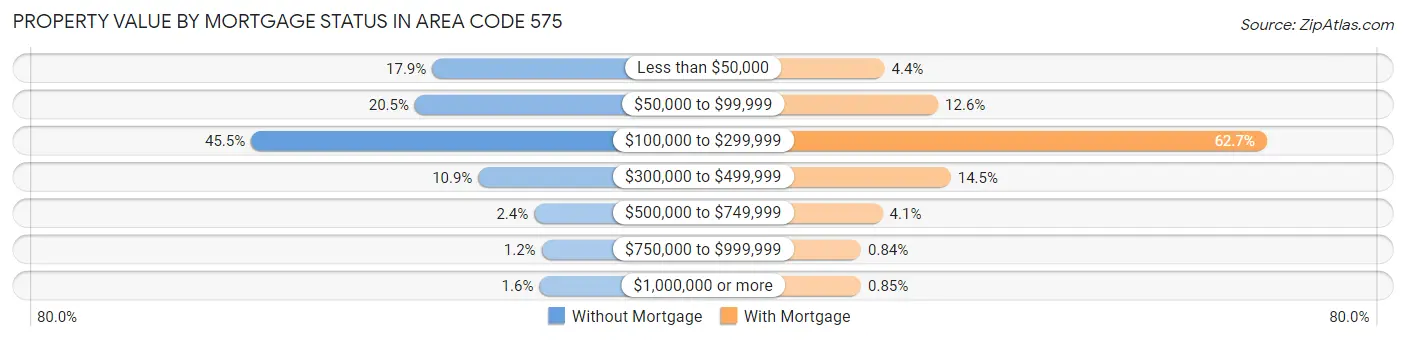
| Property Value | Without Mortgage | With Mortgage |
| Less than $50,000 | 15,614 (17.9%) | 3,420 (4.4%) |
| $50,000 to $99,999 | 17,916 (20.5%) | 9,714 (12.6%) |
| $100,000 to $299,999 | 39,684 (45.5%) | 48,349 (62.6%) |
| $300,000 to $499,999 | 9,491 (10.9%) | 11,198 (14.5%) |
| $500,000 to $749,999 | 2,071 (2.4%) | 3,190 (4.1%) |
| $750,000 to $999,999 | 1,083 (1.2%) | 650 (0.8%) |
| $1,000,000 or more | 1,381 (1.6%) | 657 (0.9%) |
| Total | 87,240 (100.0%) | 77,178 (100.0%) |
Household Income by Mortgage Status in Area Code 575
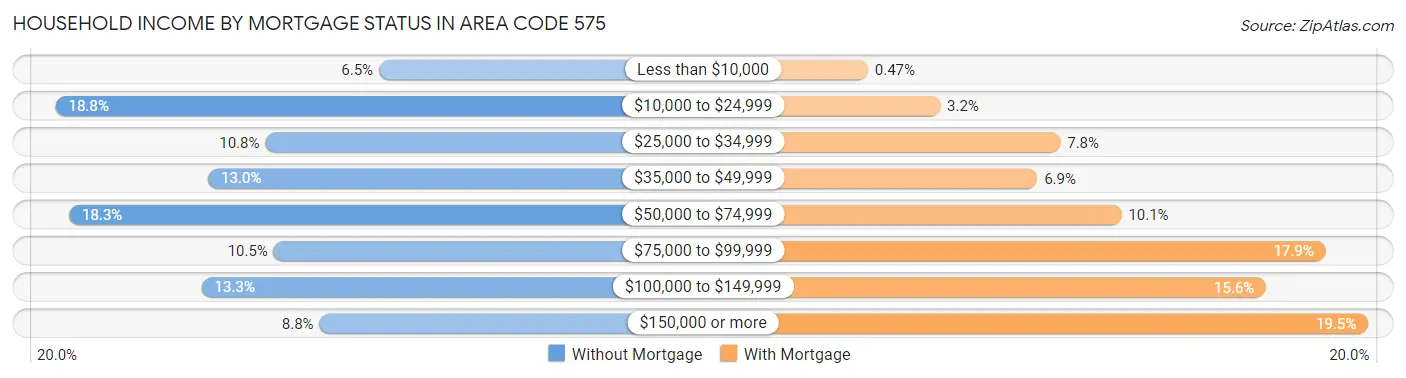
| Household Income | Without Mortgage | With Mortgage |
| Less than $10,000 | 5,667 (6.5%) | 362 (0.5%) |
| $10,000 to $24,999 | 16,419 (18.8%) | 2,482 (3.2%) |
| $25,000 to $34,999 | 9,444 (10.8%) | 6,017 (7.8%) |
| $35,000 to $49,999 | 11,348 (13.0%) | 5,337 (6.9%) |
| $50,000 to $74,999 | 15,976 (18.3%) | 7,818 (10.1%) |
| $75,000 to $99,999 | 9,170 (10.5%) | 13,819 (17.9%) |
| $100,000 to $149,999 | 11,568 (13.3%) | 12,070 (15.6%) |
| $150,000 or more | 7,648 (8.8%) | 15,070 (19.5%) |
| Total | 87,240 (100.0%) | 77,178 (100.0%) |
Property Value to Household Income Ratio in Area Code 575
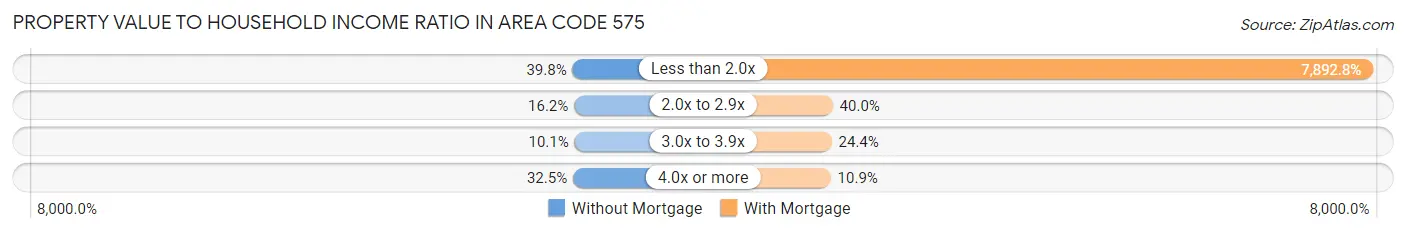
| Value-to-Income Ratio | Without Mortgage | With Mortgage |
| Less than 2.0x | 34,703 (39.8%) | 6,091,498 (7,892.8%) |
| 2.0x to 2.9x | 14,130 (16.2%) | 30,836 (40.0%) |
| 3.0x to 3.9x | 8,821 (10.1%) | 18,843 (24.4%) |
| 4.0x or more | 28,324 (32.5%) | 8,415 (10.9%) |
| Total | 87,240 (100.0%) | 77,178 (100.0%) |
Real Estate Taxes by Mortgage Status in Area Code 575
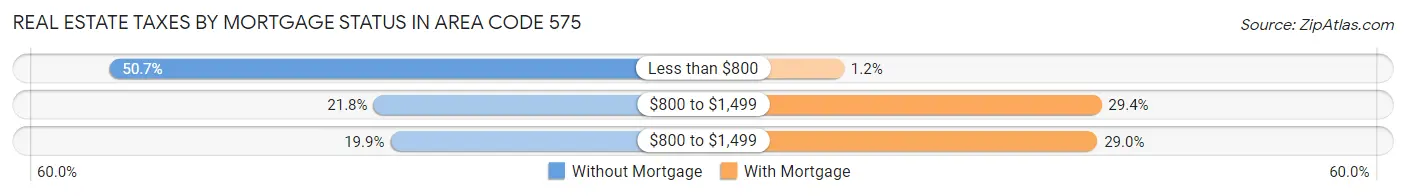
| Property Taxes | Without Mortgage | With Mortgage |
| Less than $800 | 44,241 (50.7%) | 919 (1.2%) |
| $800 to $1,499 | 18,997 (21.8%) | 22,696 (29.4%) |
| $800 to $1,499 | 17,389 (19.9%) | 22,344 (28.9%) |
| Total | 87,240 (100.0%) | 77,178 (100.0%) |
Health & Disability in Area Code 575
Health Insurance Coverage by Age in Area Code 575
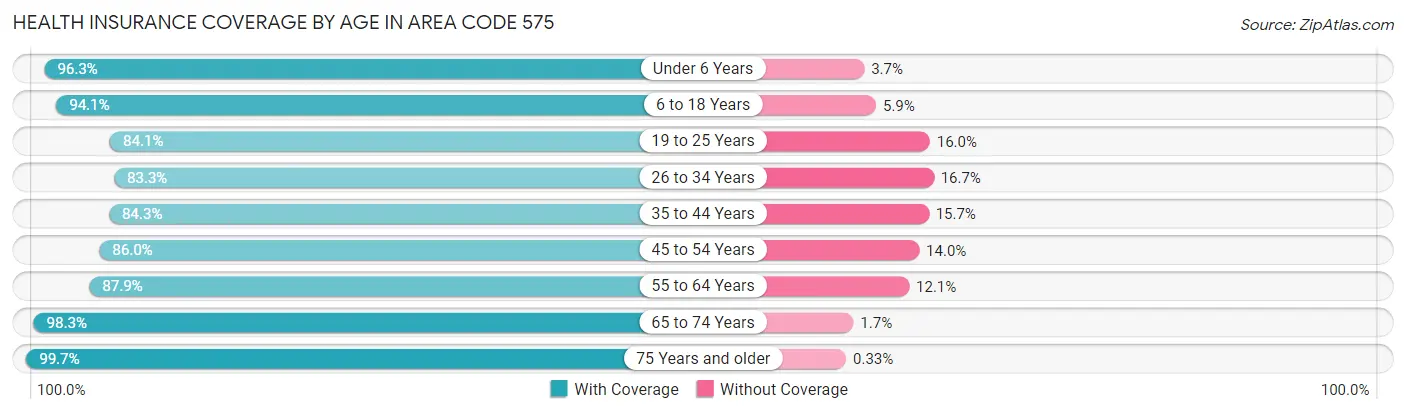
| Age Bracket | With Coverage | Without Coverage |
| Under 6 Years | 48,374 (96.3%) | 1,864 (3.7%) |
| 6 to 18 Years | 112,163 (94.1%) | 7,064 (5.9%) |
| 19 to 25 Years | 59,245 (84.1%) | 11,245 (16.0%) |
| 26 to 34 Years | 61,308 (83.3%) | 12,264 (16.7%) |
| 35 to 44 Years | 64,637 (84.3%) | 12,072 (15.7%) |
| 45 to 54 Years | 57,301 (86.0%) | 9,296 (14.0%) |
| 55 to 64 Years | 67,371 (87.9%) | 9,267 (12.1%) |
| 65 to 74 Years | 65,328 (98.3%) | 1,128 (1.7%) |
| 75 Years and older | 45,671 (99.7%) | 149 (0.3%) |
| Total | 581,398 (90.0%) | 64,349 (10.0%) |
Health Insurance Coverage by Citizenship Status in Area Code 575
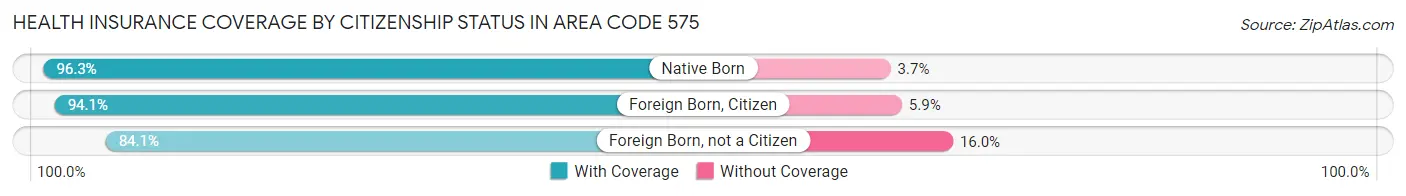
| Citizenship Status | With Coverage | Without Coverage |
| Native Born | 48,374 (96.3%) | 1,864 (3.7%) |
| Foreign Born, Citizen | 112,163 (94.1%) | 7,064 (5.9%) |
| Foreign Born, not a Citizen | 59,245 (84.1%) | 11,245 (16.0%) |
Health Insurance Coverage by Household Income in Area Code 575
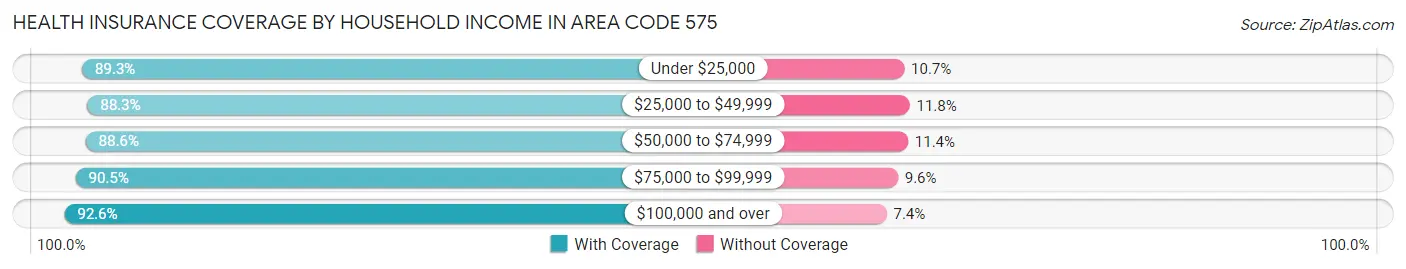
| Household Income | With Coverage | Without Coverage |
| Under $25,000 | 105,248 (89.3%) | 12,662 (10.7%) |
| $25,000 to $49,999 | 118,753 (88.2%) | 15,812 (11.7%) |
| $50,000 to $74,999 | 102,932 (88.6%) | 13,303 (11.4%) |
| $75,000 to $99,999 | 76,183 (90.4%) | 8,042 (9.6%) |
| $100,000 and over | 171,665 (92.6%) | 13,802 (7.4%) |
Public vs Private Health Insurance Coverage by Age in Area Code 575
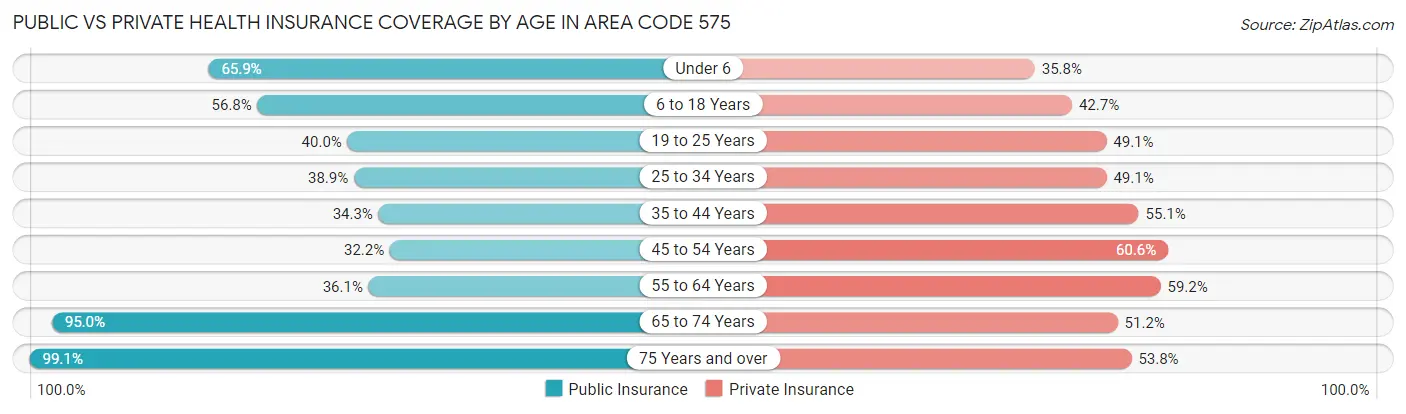
| Age Bracket | Public Insurance | Private Insurance |
| Under 6 | 33,090 (65.9%) | 17,996 (35.8%) |
| 6 to 18 Years | 67,656 (56.8%) | 50,943 (42.7%) |
| 19 to 25 Years | 28,227 (40.0%) | 34,616 (49.1%) |
| 25 to 34 Years | 28,584 (38.9%) | 36,144 (49.1%) |
| 35 to 44 Years | 26,287 (34.3%) | 42,260 (55.1%) |
| 45 to 54 Years | 21,415 (32.2%) | 40,333 (60.6%) |
| 55 to 64 Years | 27,680 (36.1%) | 45,339 (59.2%) |
| 65 to 74 Years | 63,100 (95.0%) | 34,025 (51.2%) |
| 75 Years and over | 45,395 (99.1%) | 24,632 (53.8%) |
| Total | 341,434 (52.9%) | 326,288 (50.5%) |
Disability Status by Sex by Age in Area Code 575
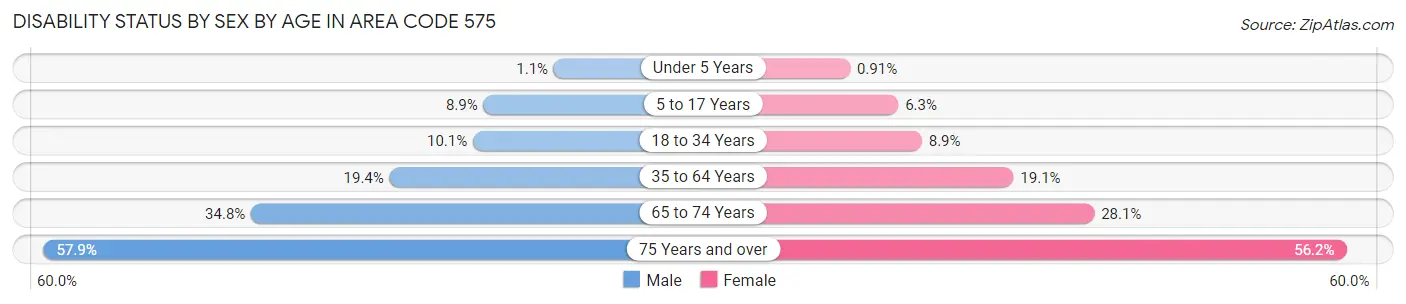
| Age Bracket | Male | Female |
| Under 5 Years | 228 (1.1%) | 184 (0.9%) |
| 5 to 17 Years | 5,312 (8.9%) | 3,597 (6.3%) |
| 18 to 34 Years | 7,855 (10.1%) | 6,808 (8.9%) |
| 35 to 64 Years | 20,937 (19.4%) | 21,360 (19.1%) |
| 65 to 74 Years | 11,418 (34.8%) | 9,450 (28.1%) |
| 75 Years and over | 11,885 (57.9%) | 14,207 (56.2%) |
Disability Class by Sex by Age in Area Code 575
Disability Class: Hearing Difficulty
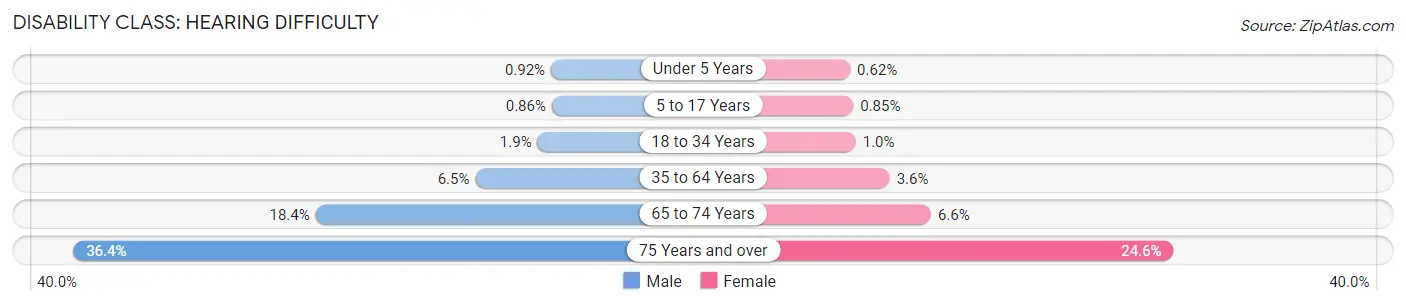
| Age Bracket | Male | Female |
| Under 5 Years | 201 (0.9%) | 125 (0.6%) |
| 5 to 17 Years | 511 (0.9%) | 487 (0.9%) |
| 18 to 34 Years | 1,501 (1.9%) | 798 (1.0%) |
| 35 to 64 Years | 7,077 (6.5%) | 3,983 (3.6%) |
| 65 to 74 Years | 6,044 (18.4%) | 2,226 (6.6%) |
| 75 Years and over | 7,472 (36.4%) | 6,226 (24.6%) |
Disability Class: Vision Difficulty
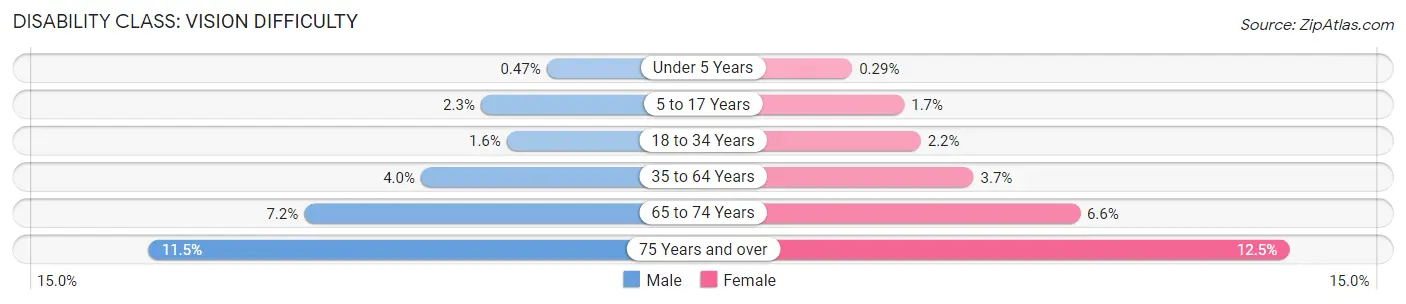
| Age Bracket | Male | Female |
| Under 5 Years | 102 (0.5%) | 59 (0.3%) |
| 5 to 17 Years | 1,372 (2.3%) | 995 (1.7%) |
| 18 to 34 Years | 1,233 (1.6%) | 1,679 (2.2%) |
| 35 to 64 Years | 4,295 (4.0%) | 4,103 (3.7%) |
| 65 to 74 Years | 2,372 (7.2%) | 2,227 (6.6%) |
| 75 Years and over | 2,369 (11.5%) | 3,148 (12.4%) |
Disability Class: Cognitive Difficulty
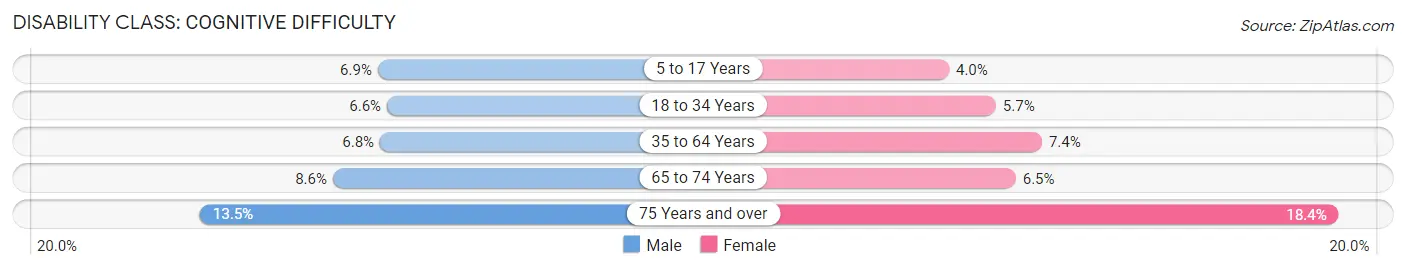
| Age Bracket | Male | Female |
| 5 to 17 Years | 4,120 (6.9%) | 2,278 (4.0%) |
| 18 to 34 Years | 5,115 (6.6%) | 4,374 (5.7%) |
| 35 to 64 Years | 7,371 (6.8%) | 8,298 (7.4%) |
| 65 to 74 Years | 2,811 (8.6%) | 2,172 (6.5%) |
| 75 Years and over | 2,770 (13.5%) | 4,663 (18.4%) |
Disability Class: Ambulatory Difficulty
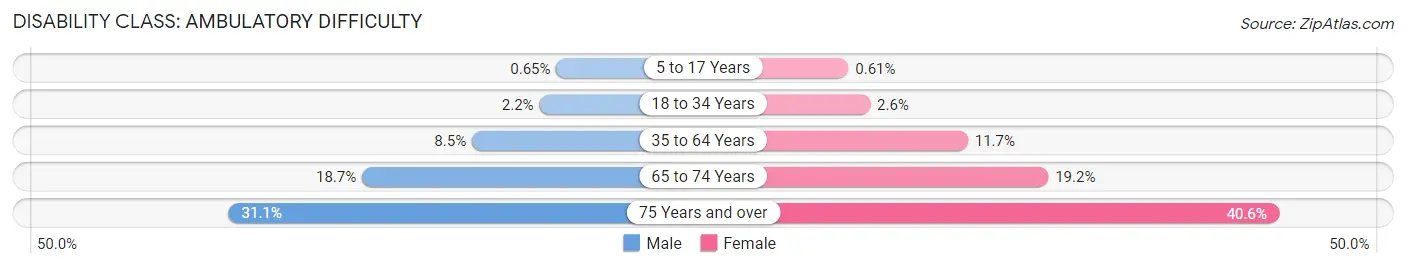
| Age Bracket | Male | Female |
| 5 to 17 Years | 386 (0.6%) | 350 (0.6%) |
| 18 to 34 Years | 1,731 (2.2%) | 2,010 (2.6%) |
| 35 to 64 Years | 9,177 (8.5%) | 13,064 (11.7%) |
| 65 to 74 Years | 6,136 (18.7%) | 6,439 (19.2%) |
| 75 Years and over | 6,377 (31.1%) | 10,254 (40.6%) |
Disability Class: Self-Care Difficulty
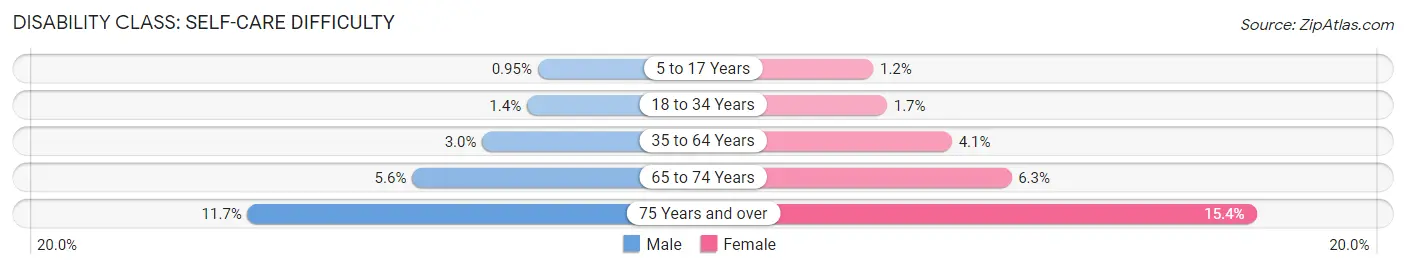
| Age Bracket | Male | Female |
| 5 to 17 Years | 568 (0.9%) | 662 (1.2%) |
| 18 to 34 Years | 1,056 (1.3%) | 1,280 (1.7%) |
| 35 to 64 Years | 3,257 (3.0%) | 4,560 (4.1%) |
| 65 to 74 Years | 1,842 (5.6%) | 2,115 (6.3%) |
| 75 Years and over | 2,406 (11.7%) | 3,892 (15.4%) |
Technology Access in Area Code 575
Computing Device Access in Area Code 575
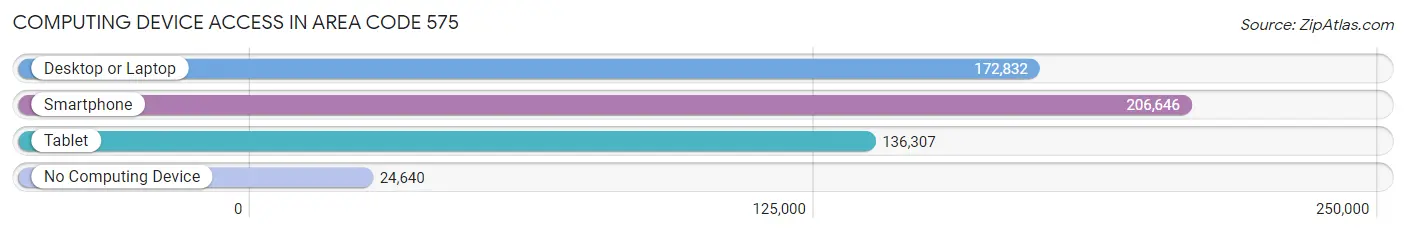
| Device Type | # Households | % Households |
| Desktop or Laptop | 172,832 | 69.8% |
| Smartphone | 206,646 | 83.5% |
| Tablet | 136,307 | 55.1% |
| No Computing Device | 24,640 | 10.0% |
| Total | 247,540 | 100.0% |
Internet Access in Area Code 575
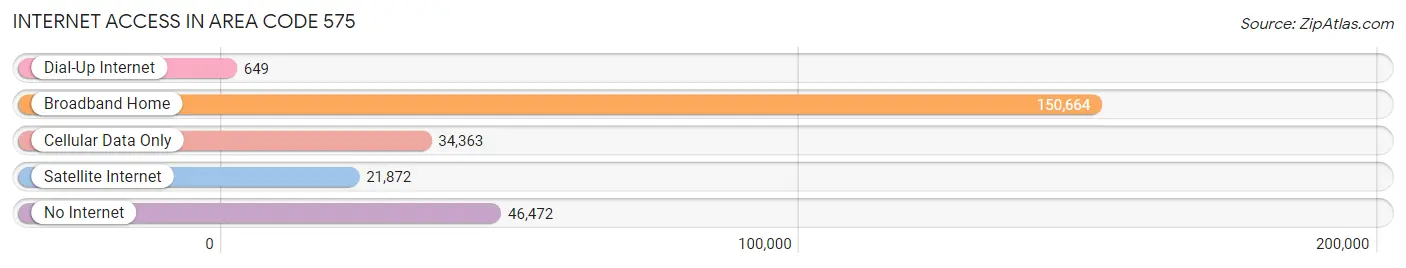
| Internet Type | # Households | % Households |
| Dial-Up Internet | 649 | 0.3% |
| Broadband Home | 150,664 | 60.9% |
| Cellular Data Only | 34,363 | 13.9% |
| Satellite Internet | 21,872 | 8.8% |
| No Internet | 46,472 | 18.8% |
| Total | 247,540 | 100.0% |
Area Code 575 Summary
Geography
Area code 575 is located in the state of New Mexico. It covers the entire state, including the cities of Albuquerque, Las Cruces, and Santa Fe. The area code is bordered by Arizona to the west, Texas to the east, and Mexico to the south.
Social
Area code 575 is home to a diverse population of people from all walks of life. The area is known for its vibrant culture, with a variety of festivals and events throughout the year. The area is also home to a number of Native American tribes, including the Navajo, Apache, and Pueblo.
Economics
Area code 575 is an important economic hub for the state of New Mexico. The area is home to a number of major industries, including oil and gas, agriculture, and tourism. The area is also home to a number of universities and colleges, providing educational opportunities for students.
Demographics
Area code 575 is home to a population of over 1.5 million people. The population is largely Hispanic, with a large percentage of Native Americans. The median household income is around $45,000, and the unemployment rate is around 4.5%.
Common Questions
What is Per Capita Income in Area Code 575?
Per Capita income in Area Code 575 is $31,861.
What is the Median Family Income in Area Code 575?
Median Family Income in Area Code 575 is $67,087.
What is the Median Household income in Area Code 575?
Median Household Income in Area Code 575 is $53,827.
What is Income or Wage Gap in Area Code 575?
Income or Wage Gap in Area Code 575 is 34.9%.
Women in Area Code 575 earn 65.1 cents for every dollar earned by a man.
What is Family Income Deficit in Area Code 575?
Family Income Deficit in Area Code 575 is $10,316.
Families that are below poverty line in Area Code 575 earn $10,316 less on average than the poverty threshold level.
What is Inequality or Gini Index in Area Code 575?
Inequality or Gini Index in Area Code 575 is 50.41.
What is the Total Population of Area Code 575?
Total Population of Area Code 575 is 663,190.
What is the Total Male Population of Area Code 575?
Total Male Population of Area Code 575 is 335,239.
What is the Total Female Population of Area Code 575?
Total Female Population of Area Code 575 is 327,951.
What is the Ratio of Males per 100 Females in Area Code 575?
There are 102.22 Males per 100 Females in Area Code 575.
What is the Ratio of Females per 100 Males in Area Code 575?
There are 97.83 Females per 100 Males in Area Code 575.
What is the Median Population Age in Area Code 575?
Median Population Age in Area Code 575 is 45.9 Years.
What is the Average Family Size in Area Code 575
Average Family Size in Area Code 575 is 3.3 People.
What is the Average Household Size in Area Code 575
Average Household Size in Area Code 575 is 2.6 People.
How Large is the Labor Force in Area Code 575?
There are 264,050 People in the Labor Forcein in Area Code 575.
What is the Percentage of People in the Labor Force in Area Code 575?
50.6% of People are in the Labor Force in Area Code 575.
What is the Unemployment Rate in Area Code 575?
Unemployment Rate in Area Code 575 is 8.8%.