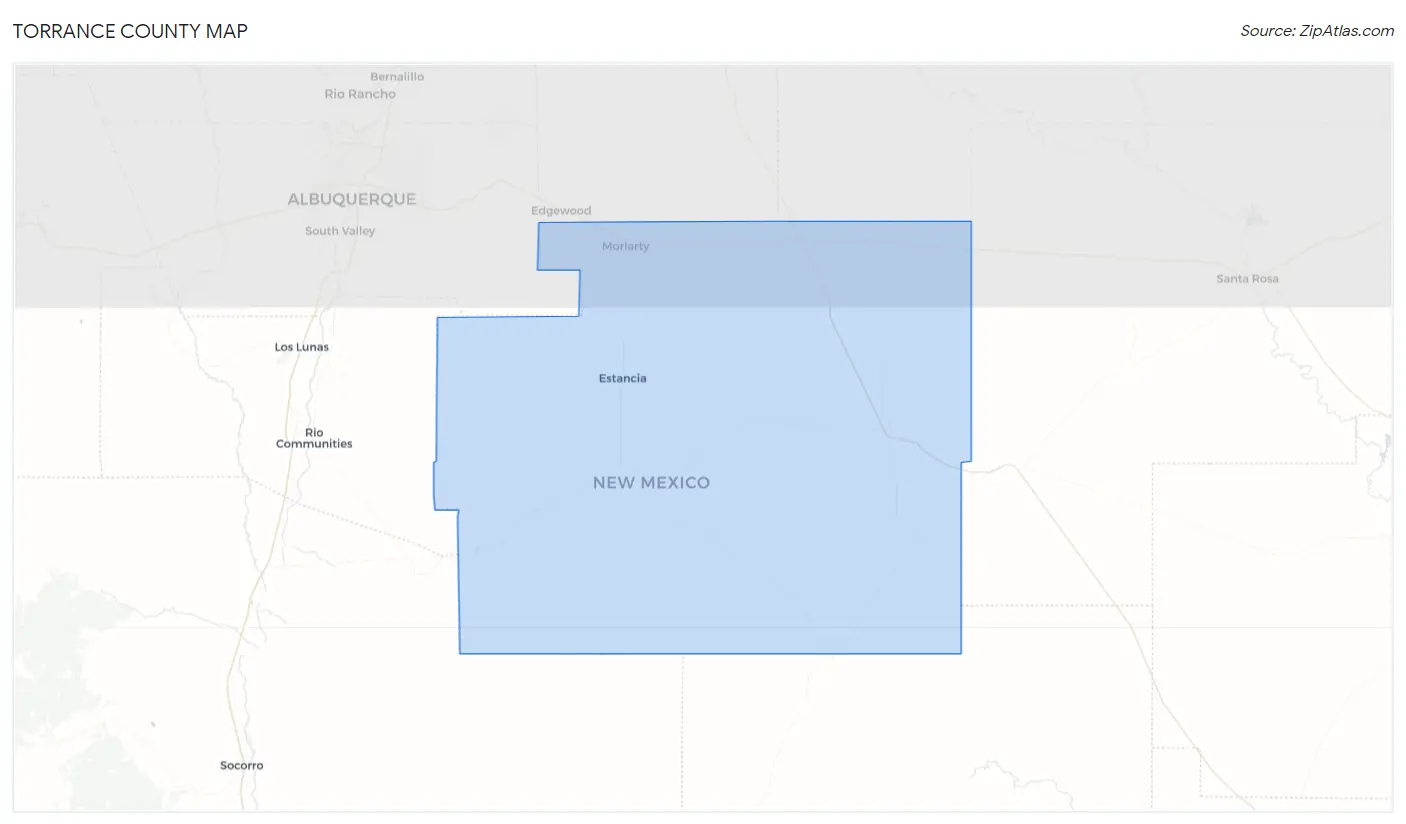
Torrance County, NM Map & Demographics
Torrance County Map
Torrance County Overview
$24,657
PER CAPITA INCOME
$62,591
AVG FAMILY INCOME
$50,727
AVG HOUSEHOLD INCOME
21.0%
WAGE / INCOME GAP [ % ]
79.0¢/ $1
WAGE / INCOME GAP [ $ ]
$9,333
FAMILY INCOME DEFICIT
0.42
INEQUALITY / GINI INDEX
15,203
TOTAL POPULATION
7,805
MALE POPULATION
7,398
FEMALE POPULATION
105.50
MALES / 100 FEMALES
94.79
FEMALES / 100 MALES
43.0
MEDIAN AGE
3.2
AVG FAMILY SIZE
2.7
AVG HOUSEHOLD SIZE
6,217
LABOR FORCE [ PEOPLE ]
49.8%
PERCENT IN LABOR FORCE
10.8%
UNEMPLOYMENT RATE
Income in Torrance County
Income Overview in Torrance County
Per Capita Income in Torrance County is $24,657, while median incomes of families and households are $62,591 and $50,727 respectively.
| Characteristic | Number | Measure |
| Per Capita Income | 15,203 | $24,657 |
| Median Family Income | 3,848 | $62,591 |
| Mean Family Income | 3,848 | $68,461 |
| Median Household Income | 5,599 | $50,727 |
| Mean Household Income | 5,599 | $63,315 |
| Income Deficit | 3,848 | $9,333 |
| Wage / Income Gap (%) | 15,203 | 21.02% |
| Wage / Income Gap ($) | 15,203 | 78.98¢ per $1 |
| Gini / Inequality Index | 15,203 | 0.42 |
Earnings by Sex in Torrance County
Average Earnings in Torrance County are $30,428, $33,349 for men and $26,339 for women, a difference of 21.0%.
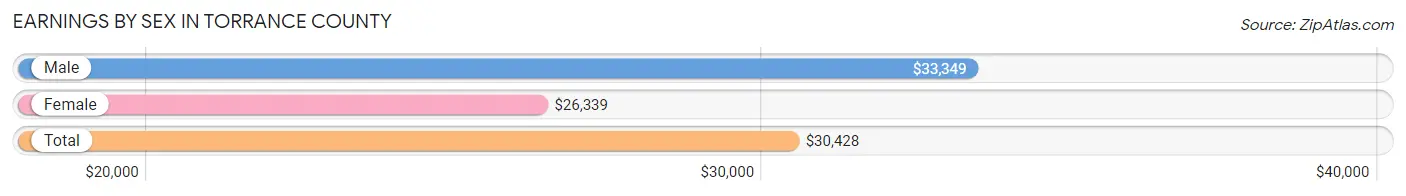
| Sex | Number | Average Earnings |
| Male | 3,755 (58.5%) | $33,349 |
| Female | 2,666 (41.5%) | $26,339 |
| Total | 6,421 (100.0%) | $30,428 |
Earnings by Sex by Income Bracket in Torrance County
The most common earnings brackets in Torrance County are $55,000 to $64,999 for men (355 | 9.5%) and $2,499 or less for women (345 | 12.9%).
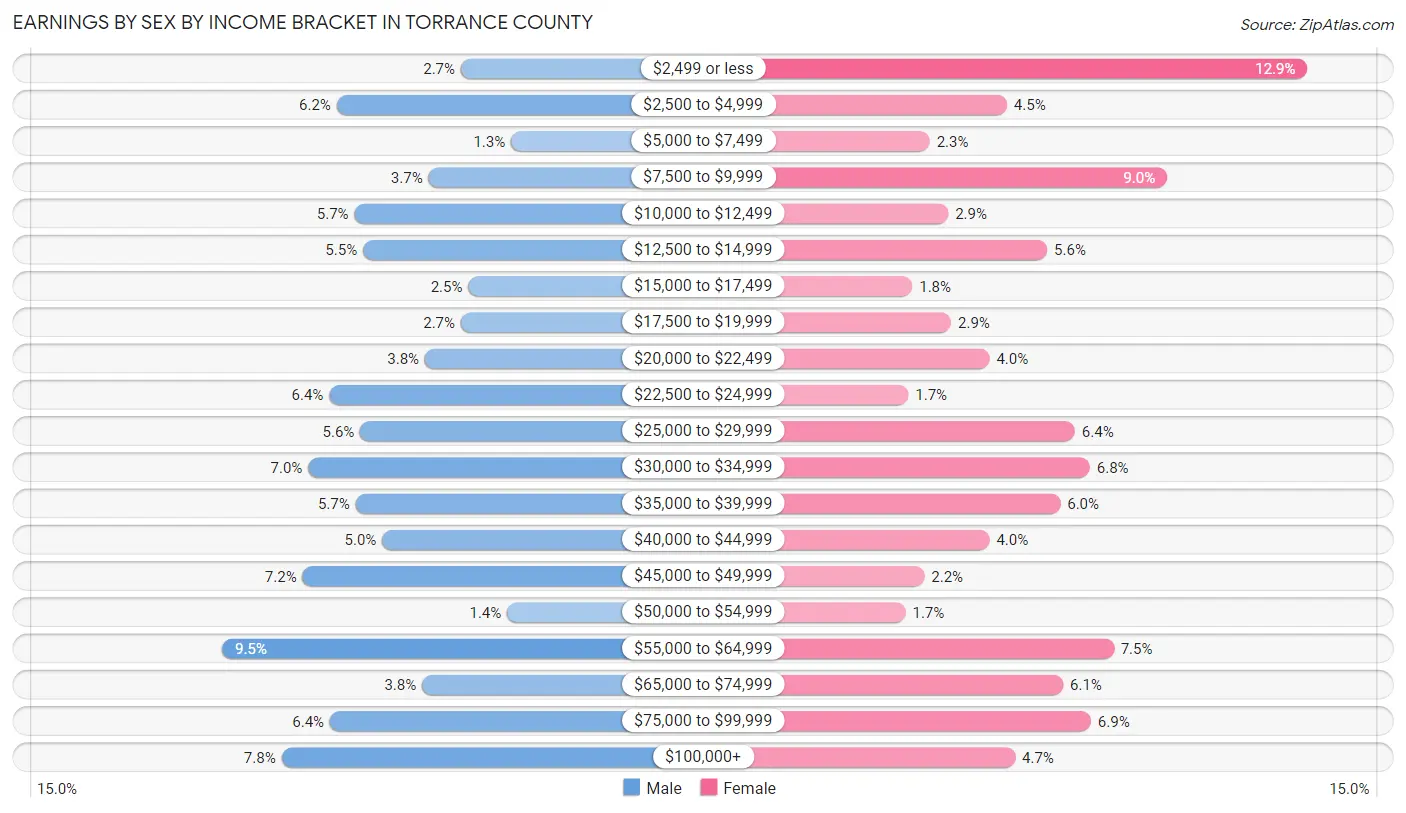
| Income | Male | Female |
| $2,499 or less | 103 (2.7%) | 345 (12.9%) |
| $2,500 to $4,999 | 234 (6.2%) | 120 (4.5%) |
| $5,000 to $7,499 | 50 (1.3%) | 62 (2.3%) |
| $7,500 to $9,999 | 137 (3.6%) | 240 (9.0%) |
| $10,000 to $12,499 | 215 (5.7%) | 76 (2.9%) |
| $12,500 to $14,999 | 206 (5.5%) | 150 (5.6%) |
| $15,000 to $17,499 | 95 (2.5%) | 49 (1.8%) |
| $17,500 to $19,999 | 103 (2.7%) | 78 (2.9%) |
| $20,000 to $22,499 | 141 (3.7%) | 107 (4.0%) |
| $22,500 to $24,999 | 242 (6.4%) | 46 (1.7%) |
| $25,000 to $29,999 | 209 (5.6%) | 171 (6.4%) |
| $30,000 to $34,999 | 264 (7.0%) | 182 (6.8%) |
| $35,000 to $39,999 | 214 (5.7%) | 160 (6.0%) |
| $40,000 to $44,999 | 186 (5.0%) | 107 (4.0%) |
| $45,000 to $49,999 | 270 (7.2%) | 58 (2.2%) |
| $50,000 to $54,999 | 54 (1.4%) | 44 (1.7%) |
| $55,000 to $64,999 | 355 (9.5%) | 200 (7.5%) |
| $65,000 to $74,999 | 144 (3.8%) | 162 (6.1%) |
| $75,000 to $99,999 | 241 (6.4%) | 183 (6.9%) |
| $100,000+ | 292 (7.8%) | 126 (4.7%) |
| Total | 3,755 (100.0%) | 2,666 (100.0%) |
Earnings by Sex by Educational Attainment in Torrance County
Average earnings in Torrance County are $38,750 for men and $32,708 for women, a difference of 15.6%. Men with an educational attainment of graduate degree enjoy the highest average annual earnings of $79,394, while those with less than high school education earn the least with $26,436. Women with an educational attainment of graduate degree earn the most with the average annual earnings of $55,660, while those with high school diploma education have the smallest earnings of $21,103.
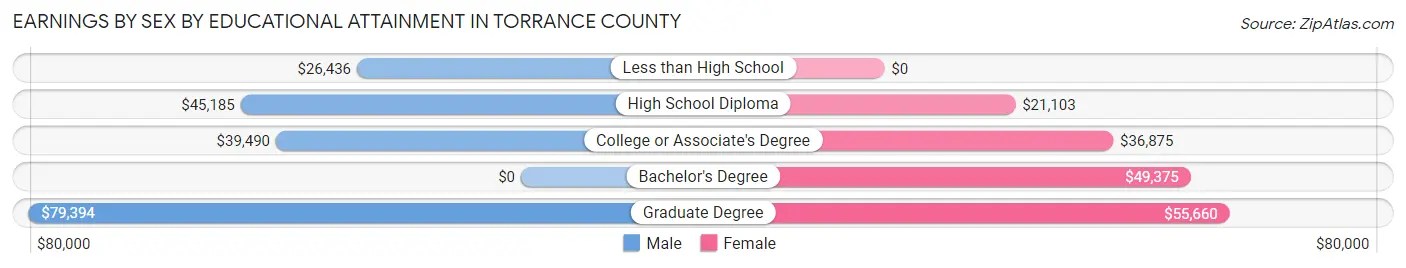
| Educational Attainment | Male Income | Female Income |
| Less than High School | $26,436 | $0 |
| High School Diploma | $45,185 | $21,103 |
| College or Associate's Degree | $39,490 | $36,875 |
| Bachelor's Degree | - | - |
| Graduate Degree | $79,394 | $55,660 |
| Total | $38,750 | $32,708 |
Family Income in Torrance County
Family Income Brackets in Torrance County
According to the Torrance County family income data, there are 854 families falling into the $50,000 to $74,999 income range, which is the most common income bracket and makes up 22.2% of all families. Conversely, the $150,000 to $199,999 income bracket is the least frequent group with only 42 families (1.1%) belonging to this category.
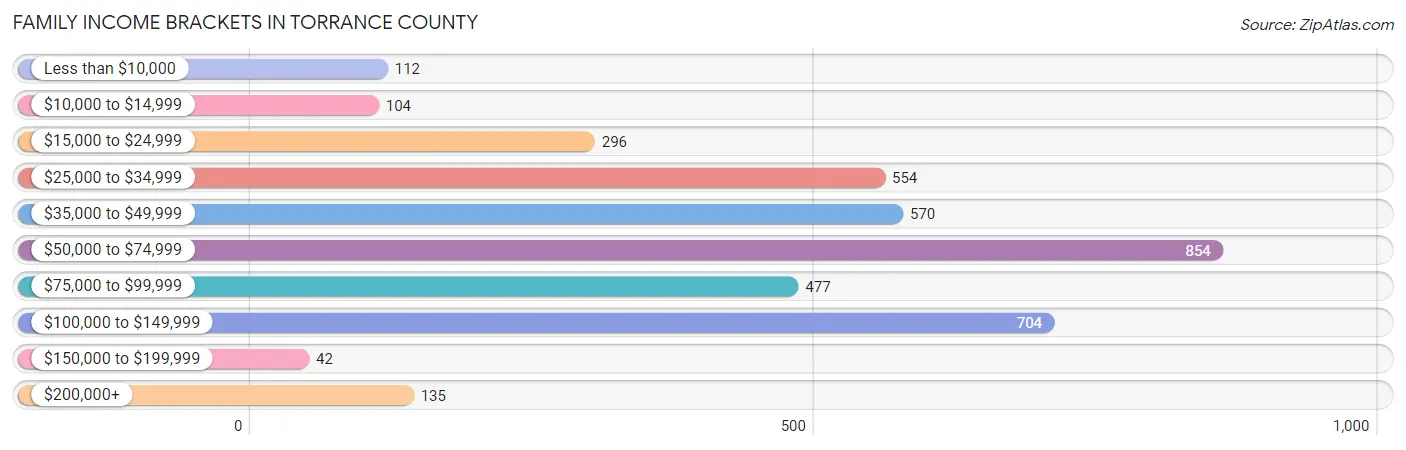
| Income Bracket | # Families | % Families |
| Less than $10,000 | 112 | 2.9% |
| $10,000 to $14,999 | 104 | 2.7% |
| $15,000 to $24,999 | 296 | 7.7% |
| $25,000 to $34,999 | 554 | 14.4% |
| $35,000 to $49,999 | 570 | 14.8% |
| $50,000 to $74,999 | 854 | 22.2% |
| $75,000 to $99,999 | 477 | 12.4% |
| $100,000 to $149,999 | 704 | 18.3% |
| $150,000 to $199,999 | 42 | 1.1% |
| $200,000+ | 135 | 3.5% |
Family Income by Famaliy Size in Torrance County
6-person families (127 | 3.3%) account for the highest median family income in Torrance County with $75,717 per family, while 2-person families (2,146 | 55.8%) have the highest median income of $30,577 per family member.
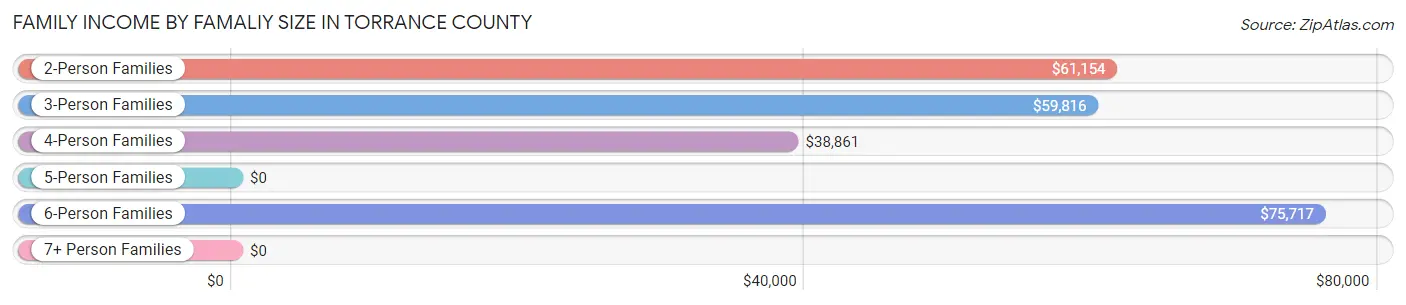
| Income Bracket | # Families | Median Income |
| 2-Person Families | 2,146 (55.8%) | $61,154 |
| 3-Person Families | 1,021 (26.5%) | $59,816 |
| 4-Person Families | 309 (8.0%) | $38,861 |
| 5-Person Families | 163 (4.2%) | $0 |
| 6-Person Families | 127 (3.3%) | $75,717 |
| 7+ Person Families | 82 (2.1%) | $0 |
| Total | 3,848 (100.0%) | $62,591 |
Family Income by Number of Earners in Torrance County
The median family income in Torrance County is $62,591, with families comprising 3+ earners (288) having the highest median family income of $78,520, while families with no earners (979) have the lowest median family income of $39,488, accounting for 7.5% and 25.4% of families, respectively.
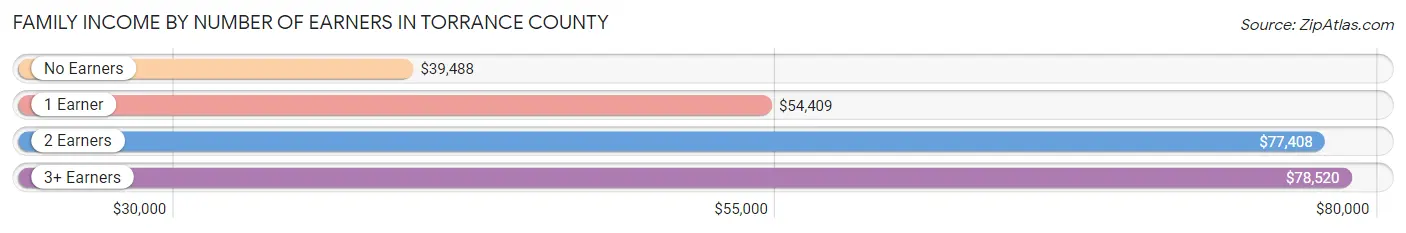
| Number of Earners | # Families | Median Income |
| No Earners | 979 (25.4%) | $39,488 |
| 1 Earner | 1,424 (37.0%) | $54,409 |
| 2 Earners | 1,157 (30.1%) | $77,408 |
| 3+ Earners | 288 (7.5%) | $78,520 |
| Total | 3,848 (100.0%) | $62,591 |
Household Income in Torrance County
Household Income Brackets in Torrance County
With 1,002 households falling in the category, the $50,000 to $74,999 income range is the most frequent in Torrance County, accounting for 17.9% of all households. In contrast, only 45 households (0.8%) fall into the $150,000 to $199,999 income bracket, making it the least populous group.
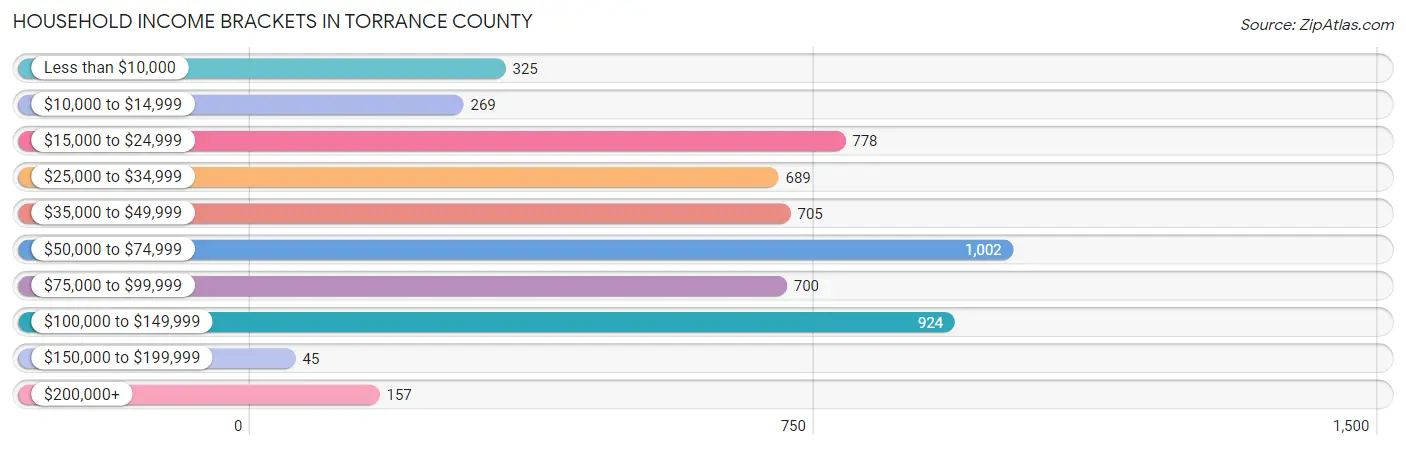
| Income Bracket | # Households | % Households |
| Less than $10,000 | 325 | 5.8% |
| $10,000 to $14,999 | 269 | 4.8% |
| $15,000 to $24,999 | 778 | 13.9% |
| $25,000 to $34,999 | 689 | 12.3% |
| $35,000 to $49,999 | 705 | 12.6% |
| $50,000 to $74,999 | 1,002 | 17.9% |
| $75,000 to $99,999 | 700 | 12.5% |
| $100,000 to $149,999 | 924 | 16.5% |
| $150,000 to $199,999 | 45 | 0.8% |
| $200,000+ | 157 | 2.8% |
Household Income by Householder Age in Torrance County
The median household income in Torrance County is $50,727, with the highest median household income of $65,282 found in the 25 to 44 years age bracket for the primary householder. A total of 1,422 households (25.4%) fall into this category. Meanwhile, the 15 to 24 years age bracket for the primary householder has the lowest median household income of $36,250, with 163 households (2.9%) in this group.
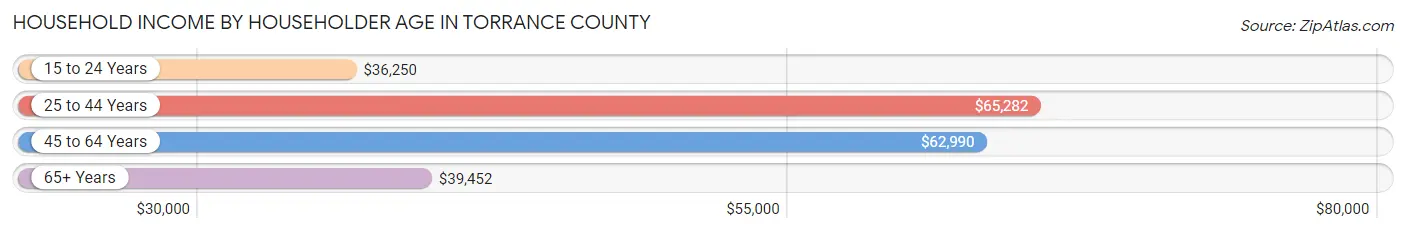
| Income Bracket | # Households | Median Income |
| 15 to 24 Years | 163 (2.9%) | $36,250 |
| 25 to 44 Years | 1,422 (25.4%) | $65,282 |
| 45 to 64 Years | 2,245 (40.1%) | $62,990 |
| 65+ Years | 1,769 (31.6%) | $39,452 |
| Total | 5,599 (100.0%) | $50,727 |
Poverty in Torrance County
Income Below Poverty by Sex and Age in Torrance County
With 19.9% poverty level for males and 22.8% for females among the residents of Torrance County, 16 and 17 year old males and 18 to 24 year old females are the most vulnerable to poverty, with 128 males (48.7%) and 261 females (44.4%) in their respective age groups living below the poverty level.
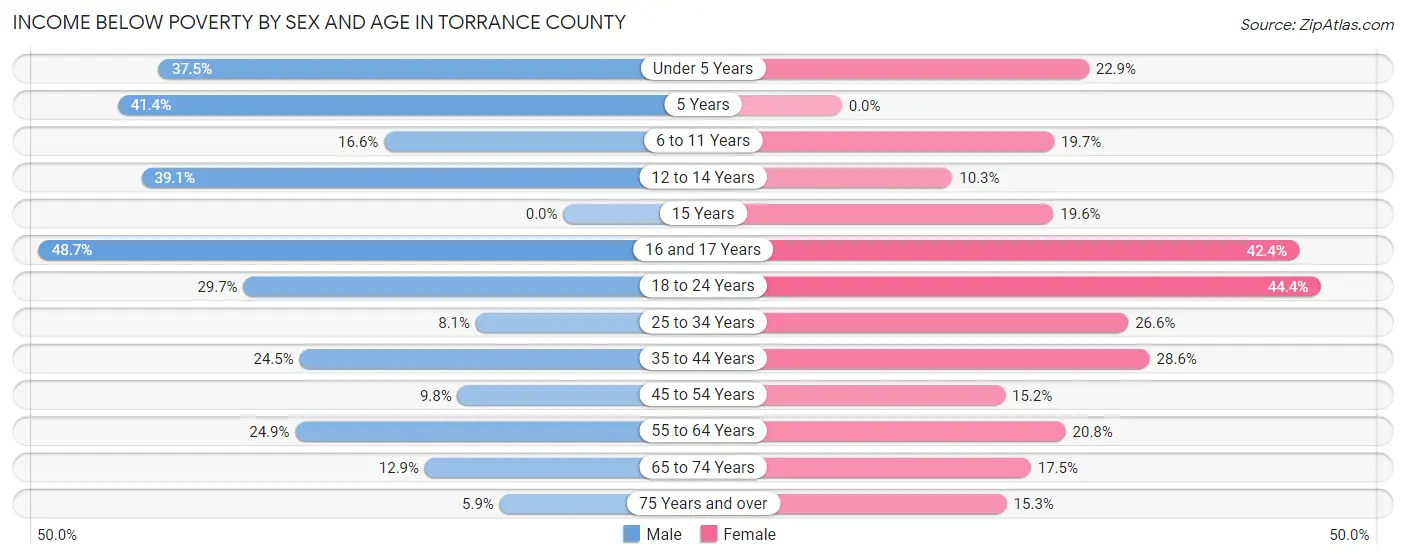
| Age Bracket | Male | Female |
| Under 5 Years | 125 (37.5%) | 91 (22.9%) |
| 5 Years | 43 (41.3%) | 0 (0.0%) |
| 6 to 11 Years | 73 (16.6%) | 91 (19.7%) |
| 12 to 14 Years | 119 (39.1%) | 32 (10.3%) |
| 15 Years | 0 (0.0%) | 22 (19.6%) |
| 16 and 17 Years | 128 (48.7%) | 109 (42.4%) |
| 18 to 24 Years | 223 (29.7%) | 261 (44.4%) |
| 25 to 34 Years | 69 (8.1%) | 185 (26.6%) |
| 35 to 44 Years | 224 (24.5%) | 262 (28.6%) |
| 45 to 54 Years | 92 (9.8%) | 128 (15.1%) |
| 55 to 64 Years | 267 (24.9%) | 232 (20.8%) |
| 65 to 74 Years | 139 (12.9%) | 177 (17.5%) |
| 75 Years and over | 34 (5.9%) | 93 (15.3%) |
| Total | 1,536 (19.9%) | 1,683 (22.8%) |
Income Above Poverty by Sex and Age in Torrance County
According to the poverty statistics in Torrance County, males aged 15 years and females aged 5 years are the age groups that are most secure financially, with 100.0% of males and 100.0% of females in these age groups living above the poverty line.
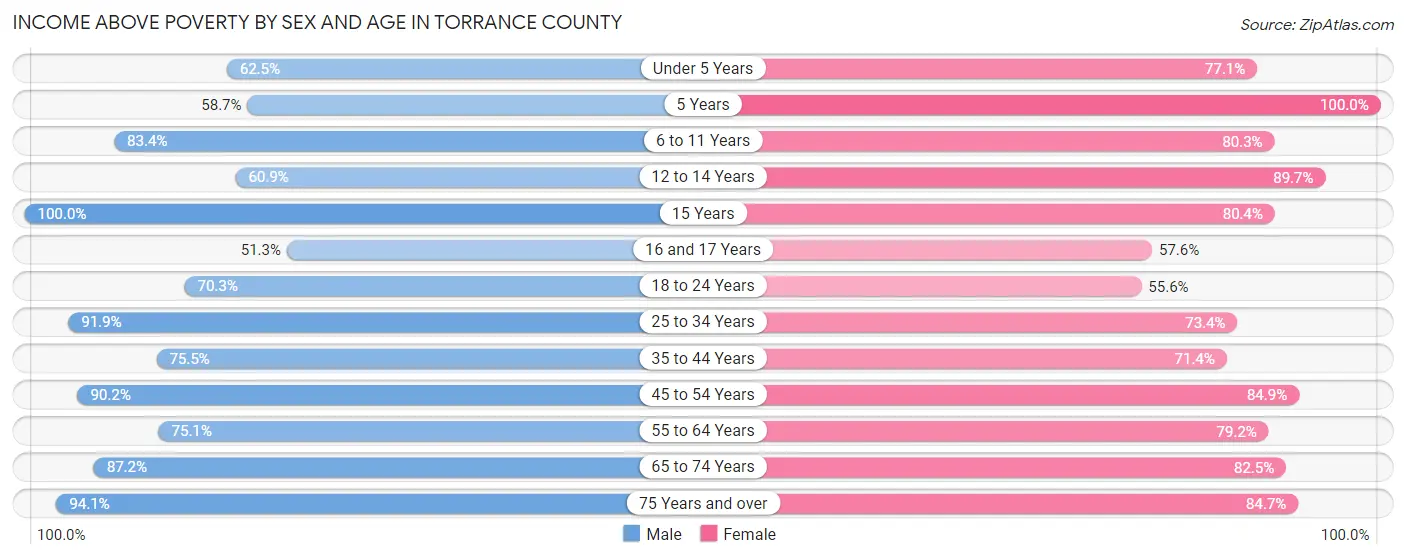
| Age Bracket | Male | Female |
| Under 5 Years | 208 (62.5%) | 306 (77.1%) |
| 5 Years | 61 (58.7%) | 54 (100.0%) |
| 6 to 11 Years | 366 (83.4%) | 371 (80.3%) |
| 12 to 14 Years | 185 (60.9%) | 280 (89.7%) |
| 15 Years | 109 (100.0%) | 90 (80.4%) |
| 16 and 17 Years | 135 (51.3%) | 148 (57.6%) |
| 18 to 24 Years | 528 (70.3%) | 327 (55.6%) |
| 25 to 34 Years | 781 (91.9%) | 511 (73.4%) |
| 35 to 44 Years | 691 (75.5%) | 655 (71.4%) |
| 45 to 54 Years | 845 (90.2%) | 717 (84.9%) |
| 55 to 64 Years | 806 (75.1%) | 885 (79.2%) |
| 65 to 74 Years | 943 (87.2%) | 832 (82.5%) |
| 75 Years and over | 541 (94.1%) | 515 (84.7%) |
| Total | 6,199 (80.1%) | 5,691 (77.2%) |
Income Below Poverty Among Married-Couple Families in Torrance County
The poverty statistics for married-couple families in Torrance County show that 7.2% or 198 of the total 2,733 families live below the poverty line. Families with 5 or more children have the highest poverty rate of 100.0%, comprising of 47 families. On the other hand, families with 3 or 4 children have the lowest poverty rate of 0.0%, which includes 0 families.
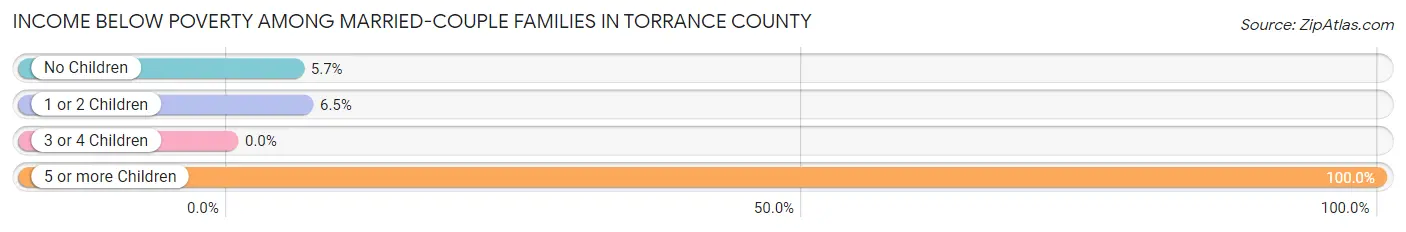
| Children | Above Poverty | Below Poverty |
| No Children | 1,693 (94.3%) | 103 (5.7%) |
| 1 or 2 Children | 687 (93.5%) | 48 (6.5%) |
| 3 or 4 Children | 155 (100.0%) | 0 (0.0%) |
| 5 or more Children | 0 (0.0%) | 47 (100.0%) |
| Total | 2,535 (92.8%) | 198 (7.2%) |
Income Below Poverty Among Single-Parent Households in Torrance County
According to the poverty data in Torrance County, 16.5% or 97 single-father households and 33.2% or 175 single-mother households are living below the poverty line. Among single-father households, those with 3 or 4 children have the highest poverty rate, with 8 households (100.0%) experiencing poverty. Likewise, among single-mother households, those with 1 or 2 children have the highest poverty rate, with 122 households (54.5%) falling below the poverty line.
| Children | Single Father | Single Mother |
| No Children | 76 (45.5%) | 37 (14.0%) |
| 1 or 2 Children | 13 (3.2%) | 122 (54.5%) |
| 3 or 4 Children | 8 (100.0%) | 16 (50.0%) |
| 5 or more Children | 0 (0.0%) | 0 (0.0%) |
| Total | 97 (16.5%) | 175 (33.2%) |
Income Below Poverty Among Married-Couple vs Single-Parent Households in Torrance County
The poverty data for Torrance County shows that 198 of the married-couple family households (7.2%) and 272 of the single-parent households (24.4%) are living below the poverty level. Within the married-couple family households, those with 5 or more children have the highest poverty rate, with 47 households (100.0%) falling below the poverty line. Among the single-parent households, those with 3 or 4 children have the highest poverty rate, with 24 household (60.0%) living below poverty.
| Children | Married-Couple Families | Single-Parent Households |
| No Children | 103 (5.7%) | 113 (26.2%) |
| 1 or 2 Children | 48 (6.5%) | 135 (21.2%) |
| 3 or 4 Children | 0 (0.0%) | 24 (60.0%) |
| 5 or more Children | 47 (100.0%) | 0 (0.0%) |
| Total | 198 (7.2%) | 272 (24.4%) |
Race in Torrance County
The most populous races in Torrance County are White / Caucasian (10,047 | 66.1%), Hispanic or Latino (6,800 | 44.7%), and Some other Race (2,265 | 14.9%).
| Race | # Population | % Population |
| Asian | 115 | 0.8% |
| Black / African American | 340 | 2.2% |
| Hawaiian / Pacific | 0 | 0.0% |
| Hispanic or Latino | 6,800 | 44.7% |
| Native / Alaskan | 357 | 2.4% |
| White / Caucasian | 10,047 | 66.1% |
| Two or more Races | 2,079 | 13.7% |
| Some other Race | 2,265 | 14.9% |
| Total | 15,203 | 100.0% |
Ancestry in Torrance County
The most populous ancestries reported in Torrance County are Mexican (3,989 | 26.2%), English (1,805 | 11.9%), German (1,650 | 10.8%), Irish (1,423 | 9.4%), and American (1,057 | 7.0%), together accounting for 65.3% of all Torrance County residents.
| Ancestry | # Population | % Population |
| American | 1,057 | 7.0% |
| Apache | 13 | 0.1% |
| Arab | 65 | 0.4% |
| British | 25 | 0.2% |
| Burmese | 21 | 0.1% |
| Canadian | 31 | 0.2% |
| Central American | 80 | 0.5% |
| Central American Indian | 80 | 0.5% |
| Cherokee | 83 | 0.5% |
| Cuban | 119 | 0.8% |
| Danish | 87 | 0.6% |
| Dutch | 60 | 0.4% |
| English | 1,805 | 11.9% |
| European | 745 | 4.9% |
| French | 135 | 0.9% |
| French Canadian | 8 | 0.1% |
| German | 1,650 | 10.8% |
| Greek | 18 | 0.1% |
| Hungarian | 63 | 0.4% |
| Icelander | 3 | 0.0% |
| Indian (Asian) | 94 | 0.6% |
| Irish | 1,423 | 9.4% |
| Italian | 277 | 1.8% |
| Lebanese | 65 | 0.4% |
| Mexican | 3,989 | 26.2% |
| Mexican American Indian | 47 | 0.3% |
| Navajo | 118 | 0.8% |
| Norwegian | 49 | 0.3% |
| Peruvian | 53 | 0.4% |
| Polish | 89 | 0.6% |
| Portuguese | 1 | 0.0% |
| Pueblo | 108 | 0.7% |
| Puerto Rican | 70 | 0.5% |
| Russian | 26 | 0.2% |
| Salvadoran | 80 | 0.5% |
| Scandinavian | 25 | 0.2% |
| Scotch-Irish | 269 | 1.8% |
| Scottish | 471 | 3.1% |
| Serbian | 58 | 0.4% |
| Slovak | 15 | 0.1% |
| South American | 53 | 0.4% |
| Spaniard | 214 | 1.4% |
| Spanish | 837 | 5.5% |
| Spanish American | 85 | 0.6% |
| Swedish | 71 | 0.5% |
| Swiss | 24 | 0.2% |
| Welsh | 85 | 0.6% |
| Yugoslavian | 58 | 0.4% | View All 48 Rows |
Immigrants in Torrance County
The most numerous immigrant groups reported in Torrance County came from Latin America (604 | 4.0%), Central America (553 | 3.6%), Mexico (516 | 3.4%), Europe (137 | 0.9%), and Germany (131 | 0.9%), together accounting for 12.8% of all Torrance County residents.
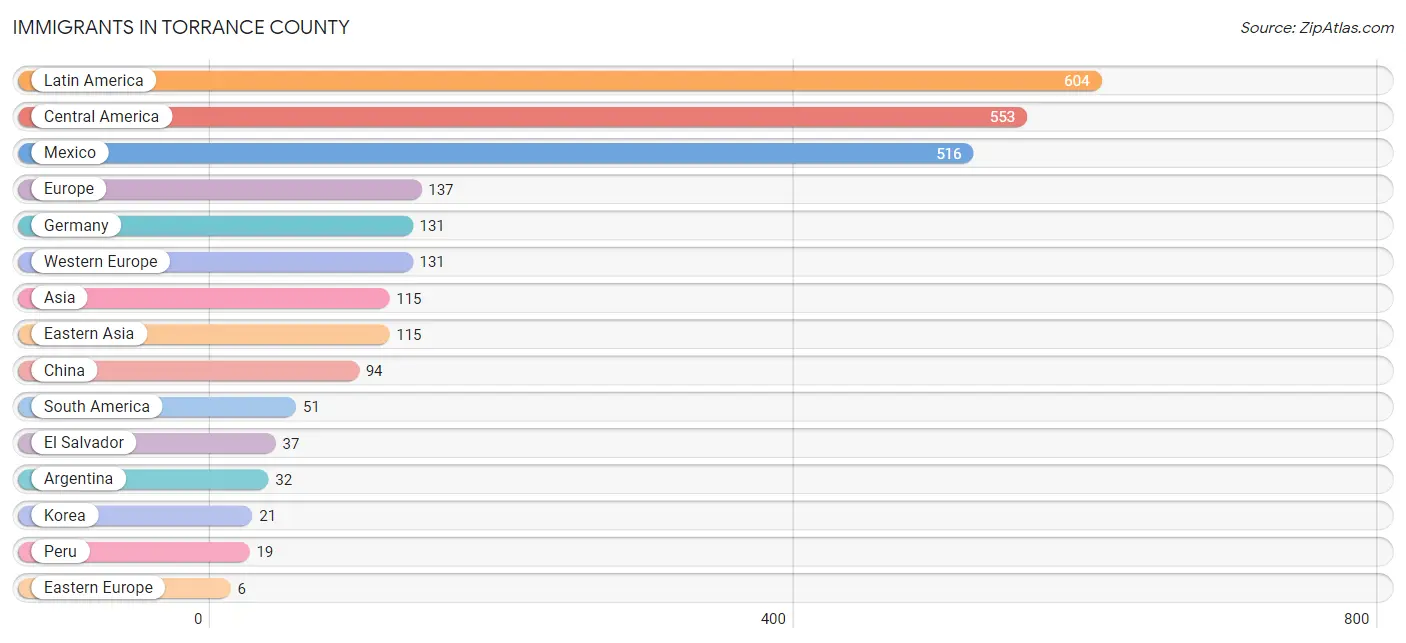
| Immigration Origin | # Population | % Population |
| Argentina | 32 | 0.2% |
| Asia | 115 | 0.8% |
| Central America | 553 | 3.6% |
| China | 94 | 0.6% |
| Eastern Asia | 115 | 0.8% |
| Eastern Europe | 6 | 0.0% |
| El Salvador | 37 | 0.2% |
| Europe | 137 | 0.9% |
| Germany | 131 | 0.9% |
| Korea | 21 | 0.1% |
| Latin America | 604 | 4.0% |
| Latvia | 6 | 0.0% |
| Mexico | 516 | 3.4% |
| Peru | 19 | 0.1% |
| South America | 51 | 0.3% |
| Western Europe | 131 | 0.9% | View All 16 Rows |
Sex and Age in Torrance County
Sex and Age in Torrance County
The most populous age groups in Torrance County are 60 to 64 Years (624 | 8.0%) for men and 55 to 59 Years (655 | 8.8%) for women.
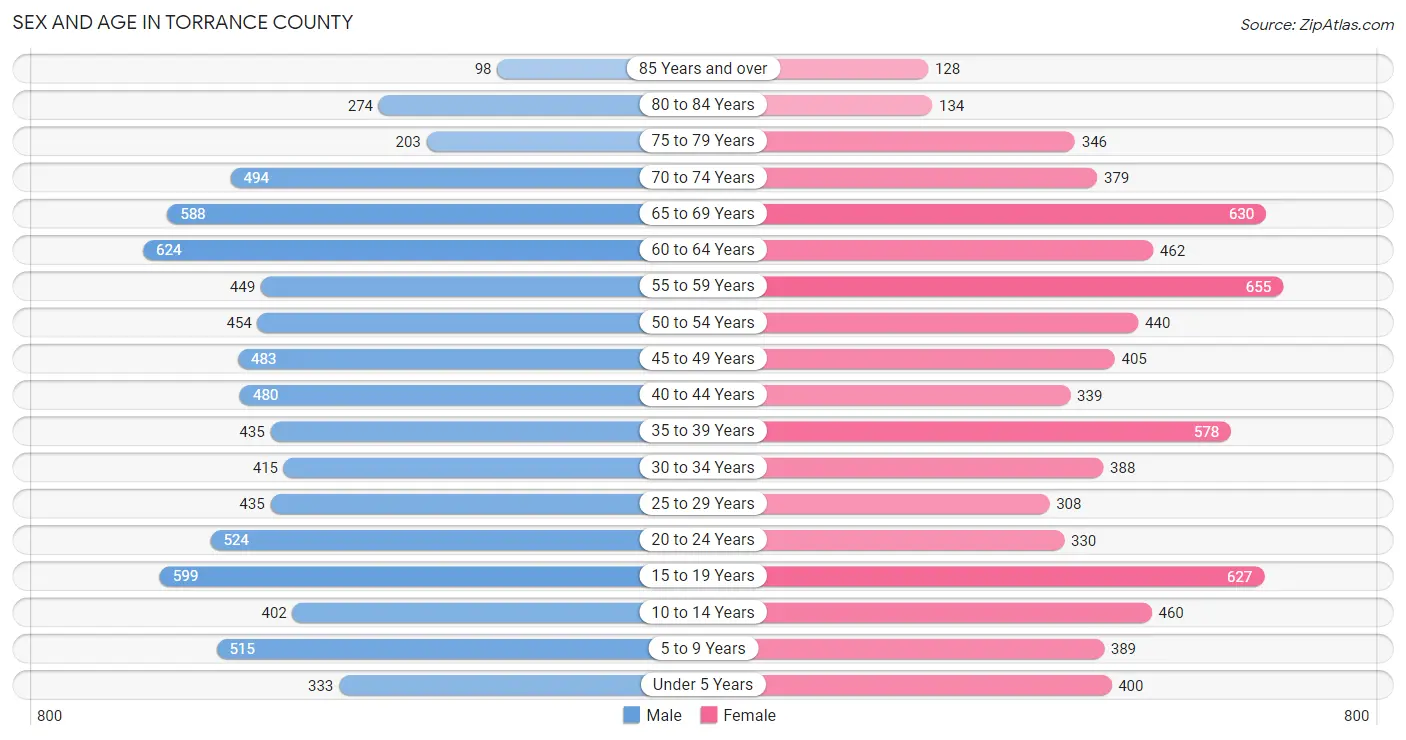
| Age Bracket | Male | Female |
| Under 5 Years | 333 (4.3%) | 400 (5.4%) |
| 5 to 9 Years | 515 (6.6%) | 389 (5.3%) |
| 10 to 14 Years | 402 (5.1%) | 460 (6.2%) |
| 15 to 19 Years | 599 (7.7%) | 627 (8.5%) |
| 20 to 24 Years | 524 (6.7%) | 330 (4.5%) |
| 25 to 29 Years | 435 (5.6%) | 308 (4.2%) |
| 30 to 34 Years | 415 (5.3%) | 388 (5.2%) |
| 35 to 39 Years | 435 (5.6%) | 578 (7.8%) |
| 40 to 44 Years | 480 (6.1%) | 339 (4.6%) |
| 45 to 49 Years | 483 (6.2%) | 405 (5.5%) |
| 50 to 54 Years | 454 (5.8%) | 440 (5.9%) |
| 55 to 59 Years | 449 (5.8%) | 655 (8.8%) |
| 60 to 64 Years | 624 (8.0%) | 462 (6.2%) |
| 65 to 69 Years | 588 (7.5%) | 630 (8.5%) |
| 70 to 74 Years | 494 (6.3%) | 379 (5.1%) |
| 75 to 79 Years | 203 (2.6%) | 346 (4.7%) |
| 80 to 84 Years | 274 (3.5%) | 134 (1.8%) |
| 85 Years and over | 98 (1.3%) | 128 (1.7%) |
| Total | 7,805 (100.0%) | 7,398 (100.0%) |
Families and Households in Torrance County
Median Family Size in Torrance County
The median family size in Torrance County is 3.19 persons per family, with single female/mother families (527 | 13.7%) accounting for the largest median family size of 3.78 persons per family. On the other hand, single male/father families (588 | 15.3%) represent the smallest median family size with 2.59 persons per family.
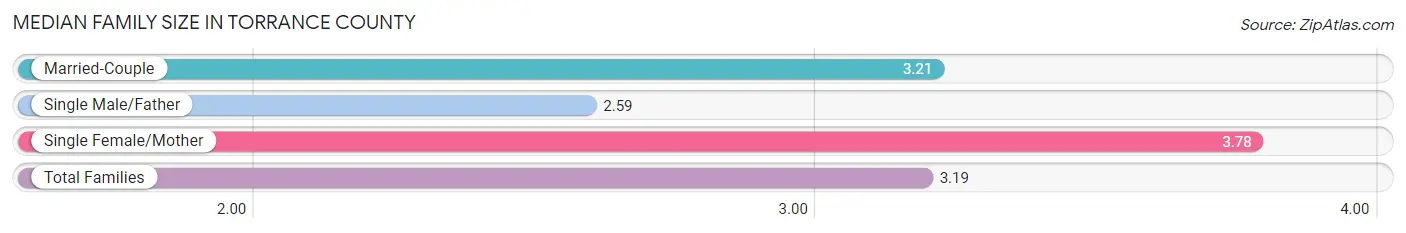
| Family Type | # Families | Family Size |
| Married-Couple | 2,733 (71.0%) | 3.21 |
| Single Male/Father | 588 (15.3%) | 2.59 |
| Single Female/Mother | 527 (13.7%) | 3.78 |
| Total Families | 3,848 (100.0%) | 3.19 |
Median Household Size in Torrance County
The median household size in Torrance County is 2.71 persons per household, with single female/mother households (527 | 9.4%) accounting for the largest median household size of 3.98 persons per household. non-family households (1,751 | 31.3%) represent the smallest median household size with 1.26 persons per household.
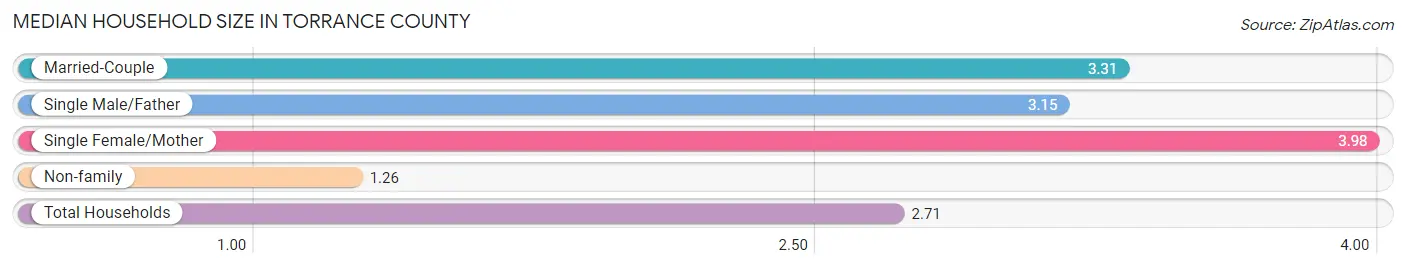
| Household Type | # Households | Household Size |
| Married-Couple | 2,733 (48.8%) | 3.31 |
| Single Male/Father | 588 (10.5%) | 3.15 |
| Single Female/Mother | 527 (9.4%) | 3.98 |
| Non-family | 1,751 (31.3%) | 1.26 |
| Total Households | 5,599 (100.0%) | 2.71 |
Household Size by Marriage Status in Torrance County
Out of a total of 5,599 households in Torrance County, 3,848 (68.7%) are family households, while 1,751 (31.3%) are nonfamily households. The most numerous type of family households are 2-person households, comprising 1,745, and the most common type of nonfamily households are 1-person households, comprising 1,535.
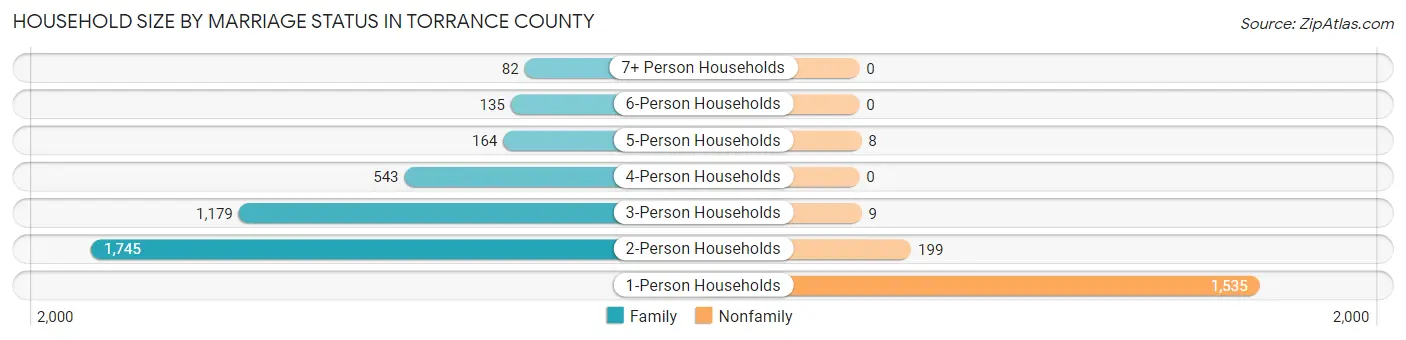
| Household Size | Family Households | Nonfamily Households |
| 1-Person Households | - | 1,535 (27.4%) |
| 2-Person Households | 1,745 (31.2%) | 199 (3.5%) |
| 3-Person Households | 1,179 (21.1%) | 9 (0.2%) |
| 4-Person Households | 543 (9.7%) | 0 (0.0%) |
| 5-Person Households | 164 (2.9%) | 8 (0.1%) |
| 6-Person Households | 135 (2.4%) | 0 (0.0%) |
| 7+ Person Households | 82 (1.5%) | 0 (0.0%) |
| Total | 3,848 (68.7%) | 1,751 (31.3%) |
Female Fertility in Torrance County
Fertility by Age in Torrance County
Average fertility rate in Torrance County is 51.0 births per 1,000 women. Women in the age bracket of 20 to 34 years have the highest fertility rate with 156.0 births per 1,000 women. Women in the age bracket of 20 to 34 years acount for 100.0% of all women with births.
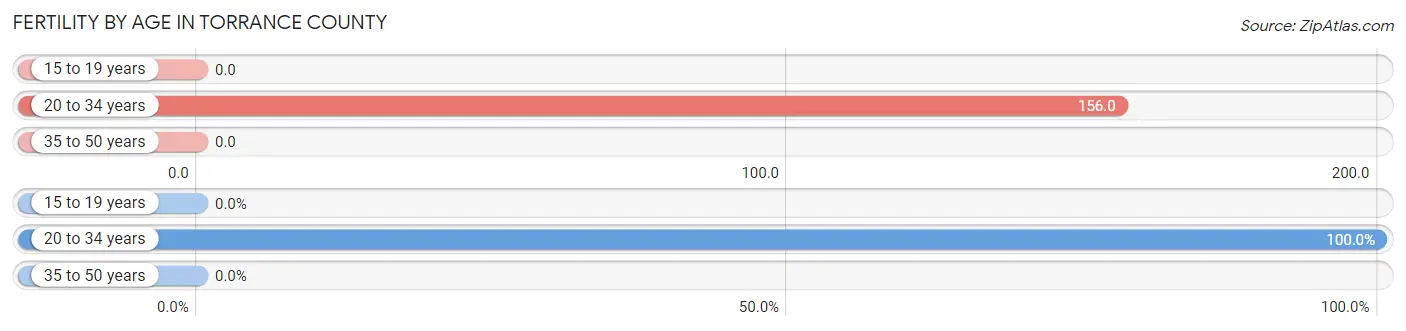
| Age Bracket | Women with Births | Births / 1,000 Women |
| 15 to 19 years | 0 (0.0%) | 0.0 |
| 20 to 34 years | 160 (100.0%) | 156.0 |
| 35 to 50 years | 0 (0.0%) | 0.0 |
| Total | 160 (100.0%) | 51.0 |
Fertility by Age by Marriage Status in Torrance County
36.2% of women with births (160) in Torrance County are married. The highest percentage of unmarried women with births falls into 20 to 34 years age bracket with 63.7% of them unmarried at the time of birth, while the lowest percentage of unmarried women with births belong to 20 to 34 years age bracket with 63.7% of them unmarried.
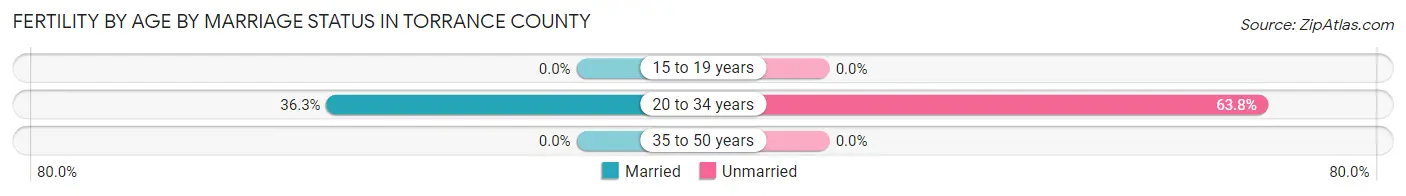
| Age Bracket | Married | Unmarried |
| 15 to 19 years | 0 (0.0%) | 0 (0.0%) |
| 20 to 34 years | 58 (36.2%) | 102 (63.7%) |
| 35 to 50 years | 0 (0.0%) | 0 (0.0%) |
| Total | 58 (36.2%) | 102 (63.7%) |
Fertility by Education in Torrance County
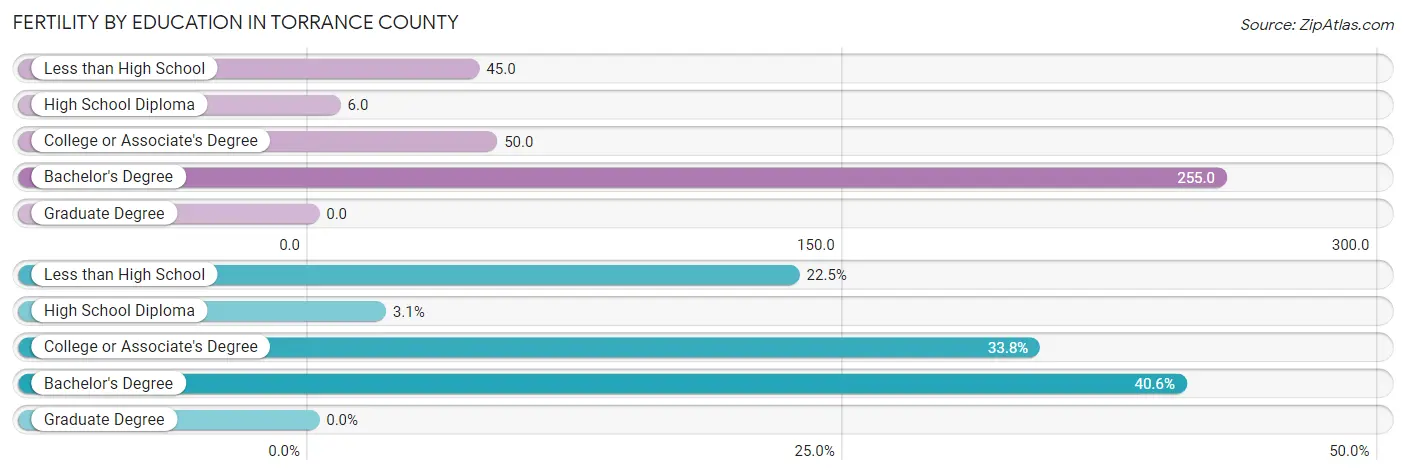
| Educational Attainment | Women with Births | Births / 1,000 Women |
| Less than High School | 36 (22.5%) | 45.0 |
| High School Diploma | 5 (3.1%) | 6.0 |
| College or Associate's Degree | 54 (33.8%) | 50.0 |
| Bachelor's Degree | 65 (40.6%) | 255.0 |
| Graduate Degree | 0 (0.0%) | 0.0 |
| Total | 160 (100.0%) | 51.0 |
Fertility by Education by Marriage Status in Torrance County
63.7% of women with births in Torrance County are unmarried. Women with the educational attainment of college or associate's degree are most likely to be married with 53.7% of them married at childbirth, while women with the educational attainment of less than high school are least likely to be married with 100.0% of them unmarried at childbirth.
| Educational Attainment | Married | Unmarried |
| Less than High School | 0 (0.0%) | 36 (100.0%) |
| High School Diploma | 0 (0.0%) | 5 (100.0%) |
| College or Associate's Degree | 29 (53.7%) | 25 (46.3%) |
| Bachelor's Degree | 29 (44.6%) | 36 (55.4%) |
| Graduate Degree | 0 (0.0%) | 0 (0.0%) |
| Total | 58 (36.2%) | 102 (63.7%) |
Employment Characteristics in Torrance County
Employment by Class of Employer in Torrance County
Among the 5,431 employed individuals in Torrance County, private company employees (3,208 | 59.1%), local government employees (614 | 11.3%), and state government employees (508 | 9.3%) make up the most common classes of employment.
| Employer Class | # Employees | % Employees |
| Private Company Employees | 3,208 | 59.1% |
| Self-Employed (Incorporated) | 63 | 1.2% |
| Self-Employed (Not Incorporated) | 386 | 7.1% |
| Not-for-profit Organizations | 347 | 6.4% |
| Local Government Employees | 614 | 11.3% |
| State Government Employees | 508 | 9.3% |
| Federal Government Employees | 300 | 5.5% |
| Unpaid Family Workers | 5 | 0.1% |
| Total | 5,431 | 100.0% |
Employment Status by Age in Torrance County
According to the labor force statistics for Torrance County, out of the total population over 16 years of age (12,483), 49.8% or 6,217 individuals are in the labor force, with 10.8% or 671 of them unemployed. The age group with the highest labor force participation rate is 25 to 29 years, with 82.0% or 609 individuals in the labor force. Within the labor force, the 60 to 64 years age range has the highest percentage of unemployed individuals, with 28.0% or 123 of them being unemployed.
| Age Bracket | In Labor Force | Unemployed |
| 16 to 19 Years | 331 (32.9%) | 34 (10.3%) |
| 20 to 24 Years | 620 (72.6%) | 47 (7.6%) |
| 25 to 29 Years | 609 (82.0%) | 111 (18.2%) |
| 30 to 34 Years | 643 (80.1%) | 48 (7.5%) |
| 35 to 44 Years | 1,502 (82.0%) | 219 (14.6%) |
| 45 to 54 Years | 1,206 (67.7%) | 24 (2.0%) |
| 55 to 59 Years | 514 (46.6%) | 7 (1.4%) |
| 60 to 64 Years | 439 (40.4%) | 123 (28.0%) |
| 65 to 74 Years | 295 (14.1%) | 54 (18.4%) |
| 75 Years and over | 52 (4.4%) | 0 (0.0%) |
| Total | 6,217 (49.8%) | 671 (10.8%) |
Employment Status by Educational Attainment in Torrance County
According to labor force statistics for Torrance County, 66.9% of individuals (4,917) out of the total population between 25 and 64 years of age (7,350) are in the labor force, with 10.8% or 531 of them being unemployed. The group with the highest labor force participation rate are those with the educational attainment of bachelor's degree or higher, with 78.9% or 879 individuals in the labor force. Within the labor force, individuals with college / associate degree education have the highest percentage of unemployment, with 13.2% or 229 of them being unemployed.
| Educational Attainment | In Labor Force | Unemployed |
| Less than High School | 560 (58.4%) | 96 (10.0%) |
| High School Diploma | 1,736 (66.1%) | 334 (12.7%) |
| College / Associate Degree | 1,738 (65.6%) | 350 (13.2%) |
| Bachelor's Degree or higher | 879 (78.9%) | 35 (3.1%) |
| Total | 4,917 (66.9%) | 794 (10.8%) |
Employment Occupations by Sex in Torrance County
Management, Business, Science and Arts Occupations
The most common Management, Business, Science and Arts occupations in Torrance County are Management (594 | 10.7%), Business & Financial (279 | 5.0%), Computers, Engineering & Science (248 | 4.5%), Community & Social Service (239 | 4.3%), and Computers & Mathematics (221 | 4.0%).
Management, Business, Science and Arts Occupations by Sex
Within the Management, Business, Science and Arts occupations in Torrance County, the most male-oriented occupations are Life, Physical & Social Science (100.0%), Computers & Mathematics (77.8%), and Computers, Engineering & Science (73.4%), while the most female-oriented occupations are Architecture & Engineering (100.0%), Legal Services & Support (100.0%), and Health Diagnosing & Treating (100.0%).
| Occupation | Male | Female |
| Management | 356 (59.9%) | 238 (40.1%) |
| Business & Financial | 98 (35.1%) | 181 (64.9%) |
| Computers, Engineering & Science | 182 (73.4%) | 66 (26.6%) |
| Computers & Mathematics | 172 (77.8%) | 49 (22.2%) |
| Architecture & Engineering | 0 (0.0%) | 17 (100.0%) |
| Life, Physical & Social Science | 10 (100.0%) | 0 (0.0%) |
| Community & Social Service | 46 (19.3%) | 193 (80.7%) |
| Education, Arts & Media | 6 (12.8%) | 41 (87.2%) |
| Legal Services & Support | 0 (0.0%) | 26 (100.0%) |
| Education Instruction & Library | 16 (17.4%) | 76 (82.6%) |
| Arts, Media & Entertainment | 24 (32.4%) | 50 (67.6%) |
| Health Diagnosing & Treating | 0 (0.0%) | 91 (100.0%) |
| Health Technologists | 0 (0.0%) | 68 (100.0%) |
| Total (Category) | 682 (47.0%) | 769 (53.0%) |
| Total (Overall) | 3,271 (59.0%) | 2,273 (41.0%) |
Services Occupations
The most common Services occupations in Torrance County are Security & Protection (457 | 8.2%), Food Preparation & Serving (455 | 8.2%), Law Enforcement (382 | 6.9%), Healthcare Support (321 | 5.8%), and Cleaning & Maintenance (274 | 4.9%).
Services Occupations by Sex
Within the Services occupations in Torrance County, the most male-oriented occupations are Cleaning & Maintenance (83.9%), Law Enforcement (79.1%), and Personal Care & Service (75.9%), while the most female-oriented occupations are Healthcare Support (67.0%), Food Preparation & Serving (54.7%), and Firefighting & Prevention (49.3%).
| Occupation | Male | Female |
| Healthcare Support | 106 (33.0%) | 215 (67.0%) |
| Security & Protection | 340 (74.4%) | 117 (25.6%) |
| Firefighting & Prevention | 38 (50.7%) | 37 (49.3%) |
| Law Enforcement | 302 (79.1%) | 80 (20.9%) |
| Food Preparation & Serving | 206 (45.3%) | 249 (54.7%) |
| Cleaning & Maintenance | 230 (83.9%) | 44 (16.1%) |
| Personal Care & Service | 22 (75.9%) | 7 (24.1%) |
| Total (Category) | 904 (58.9%) | 632 (41.1%) |
| Total (Overall) | 3,271 (59.0%) | 2,273 (41.0%) |
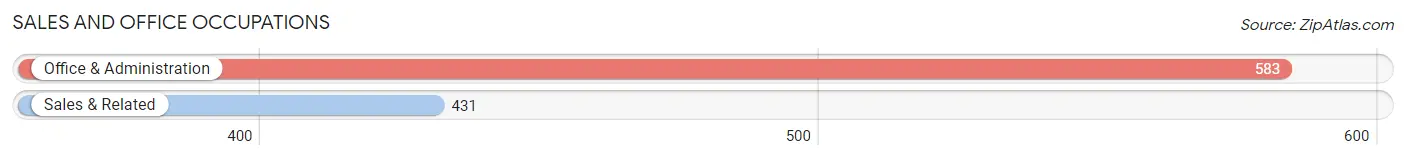
Sales and Office Occupations
The most common Sales and Office occupations in Torrance County are Office & Administration (583 | 10.5%), and Sales & Related (431 | 7.8%).
Sales and Office Occupations by Sex

| Occupation | Male | Female |
| Sales & Related | 204 (47.3%) | 227 (52.7%) |
| Office & Administration | 50 (8.6%) | 533 (91.4%) |
| Total (Category) | 254 (25.1%) | 760 (75.0%) |
| Total (Overall) | 3,271 (59.0%) | 2,273 (41.0%) |
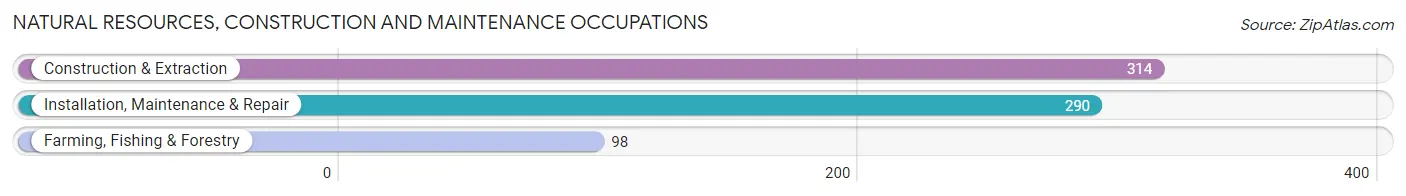
Natural Resources, Construction and Maintenance Occupations
The most common Natural Resources, Construction and Maintenance occupations in Torrance County are Construction & Extraction (314 | 5.7%), Installation, Maintenance & Repair (290 | 5.2%), and Farming, Fishing & Forestry (98 | 1.8%).
Natural Resources, Construction and Maintenance Occupations by Sex
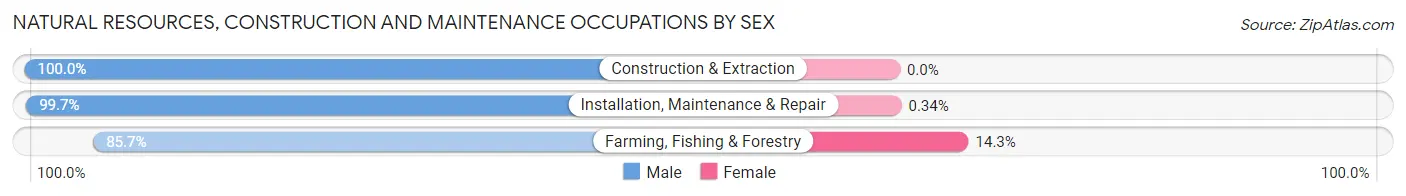
| Occupation | Male | Female |
| Farming, Fishing & Forestry | 84 (85.7%) | 14 (14.3%) |
| Construction & Extraction | 314 (100.0%) | 0 (0.0%) |
| Installation, Maintenance & Repair | 289 (99.7%) | 1 (0.3%) |
| Total (Category) | 687 (97.9%) | 15 (2.1%) |
| Total (Overall) | 3,271 (59.0%) | 2,273 (41.0%) |
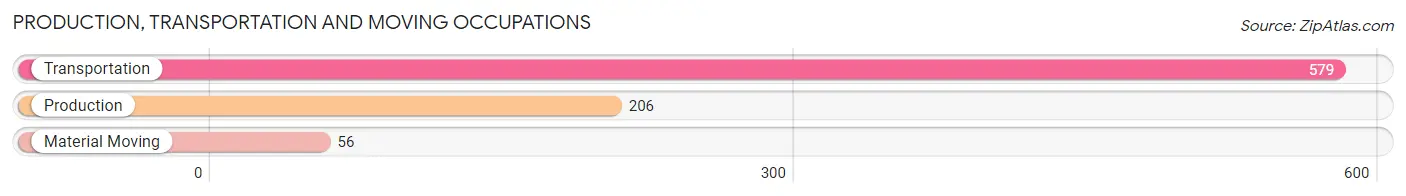
Production, Transportation and Moving Occupations
The most common Production, Transportation and Moving occupations in Torrance County are Transportation (579 | 10.4%), Production (206 | 3.7%), and Material Moving (56 | 1.0%).
Production, Transportation and Moving Occupations by Sex
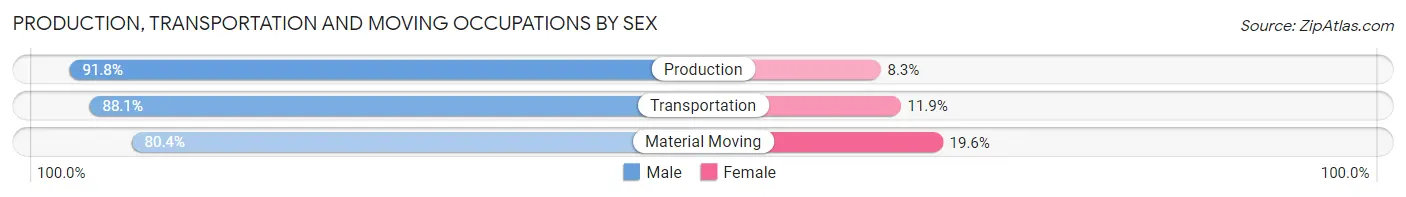
| Occupation | Male | Female |
| Production | 189 (91.7%) | 17 (8.3%) |
| Transportation | 510 (88.1%) | 69 (11.9%) |
| Material Moving | 45 (80.4%) | 11 (19.6%) |
| Total (Category) | 744 (88.5%) | 97 (11.5%) |
| Total (Overall) | 3,271 (59.0%) | 2,273 (41.0%) |
Employment Industries by Sex in Torrance County
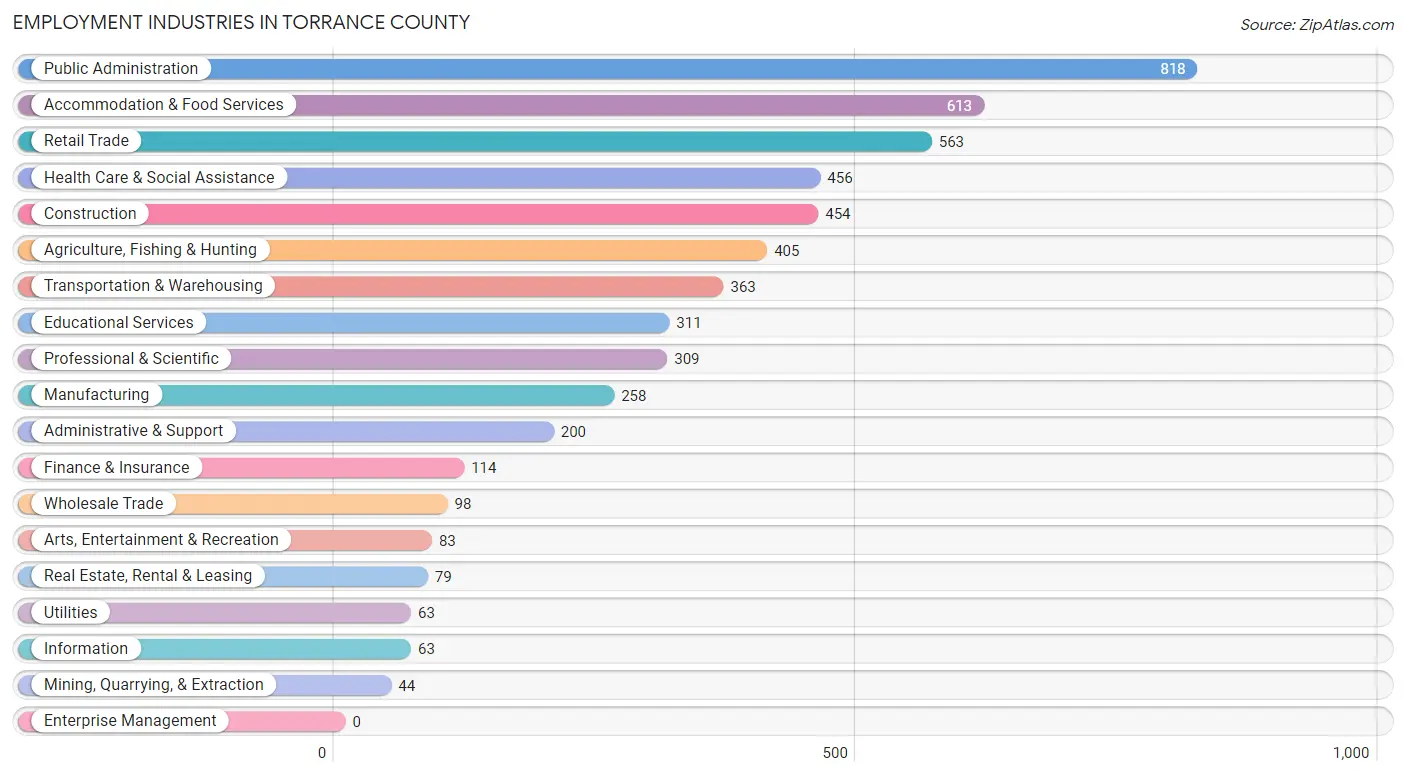
Employment Industries in Torrance County
The major employment industries in Torrance County include Public Administration (818 | 14.7%), Accommodation & Food Services (613 | 11.1%), Retail Trade (563 | 10.2%), Health Care & Social Assistance (456 | 8.2%), and Construction (454 | 8.2%).
Employment Industries by Sex in Torrance County
The Torrance County industries that see more men than women are Wholesale Trade (100.0%), Construction (95.4%), and Manufacturing (83.7%), whereas the industries that tend to have a higher number of women are Health Care & Social Assistance (89.7%), Real Estate, Rental & Leasing (77.2%), and Information (76.2%).
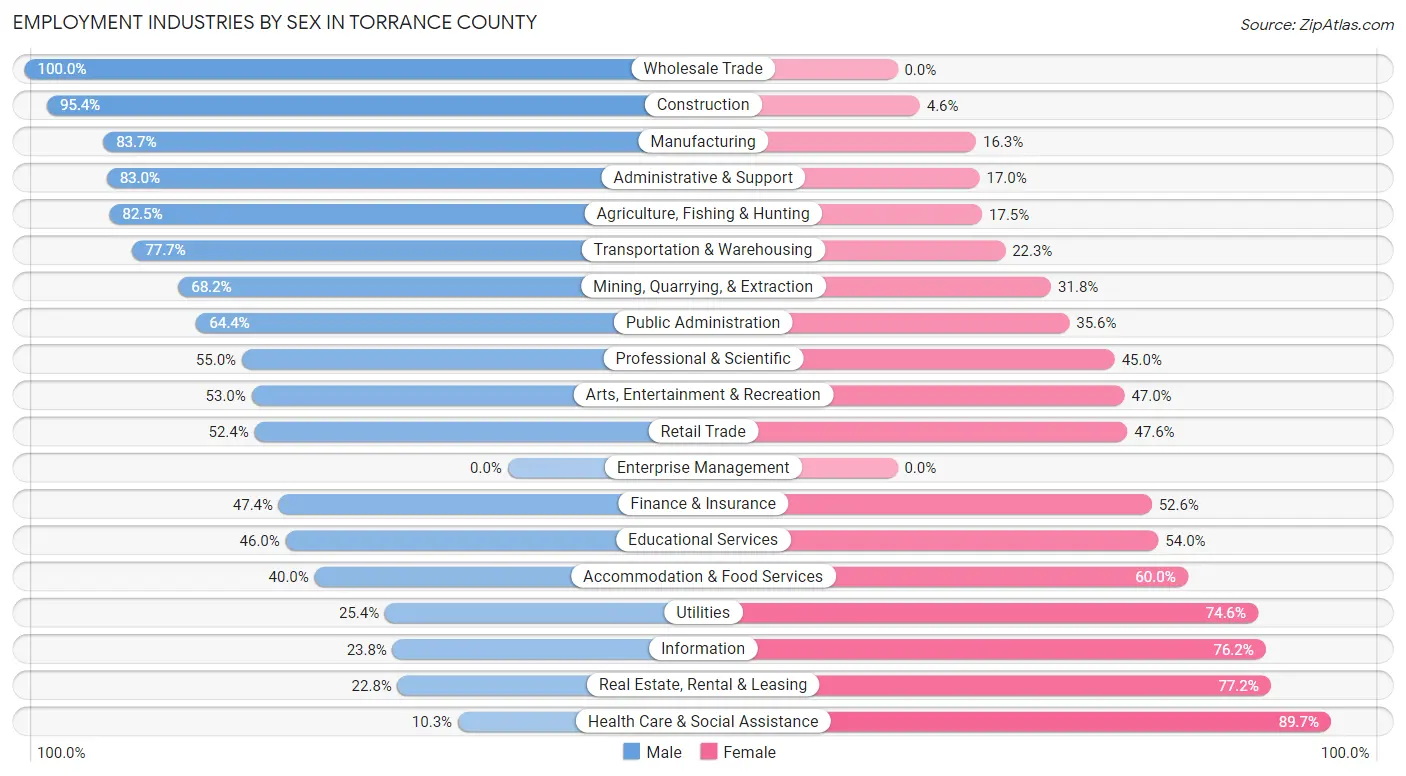
| Industry | Male | Female |
| Agriculture, Fishing & Hunting | 334 (82.5%) | 71 (17.5%) |
| Mining, Quarrying, & Extraction | 30 (68.2%) | 14 (31.8%) |
| Construction | 433 (95.4%) | 21 (4.6%) |
| Manufacturing | 216 (83.7%) | 42 (16.3%) |
| Wholesale Trade | 98 (100.0%) | 0 (0.0%) |
| Retail Trade | 295 (52.4%) | 268 (47.6%) |
| Transportation & Warehousing | 282 (77.7%) | 81 (22.3%) |
| Utilities | 16 (25.4%) | 47 (74.6%) |
| Information | 15 (23.8%) | 48 (76.2%) |
| Finance & Insurance | 54 (47.4%) | 60 (52.6%) |
| Real Estate, Rental & Leasing | 18 (22.8%) | 61 (77.2%) |
| Professional & Scientific | 170 (55.0%) | 139 (45.0%) |
| Enterprise Management | 0 (0.0%) | 0 (0.0%) |
| Administrative & Support | 166 (83.0%) | 34 (17.0%) |
| Educational Services | 143 (46.0%) | 168 (54.0%) |
| Health Care & Social Assistance | 47 (10.3%) | 409 (89.7%) |
| Arts, Entertainment & Recreation | 44 (53.0%) | 39 (47.0%) |
| Accommodation & Food Services | 245 (40.0%) | 368 (60.0%) |
| Public Administration | 527 (64.4%) | 291 (35.6%) |
| Total | 3,271 (59.0%) | 2,273 (41.0%) |
Education in Torrance County
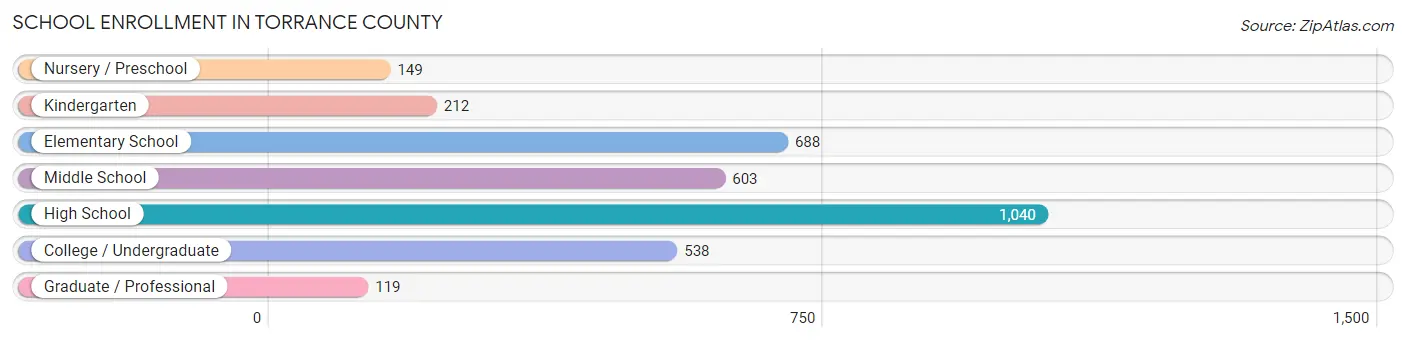
School Enrollment in Torrance County
The most common levels of schooling among the 3,349 students in Torrance County are high school (1,040 | 31.0%), elementary school (688 | 20.5%), and middle school (603 | 18.0%).
| School Level | # Students | % Students |
| Nursery / Preschool | 149 | 4.4% |
| Kindergarten | 212 | 6.3% |
| Elementary School | 688 | 20.5% |
| Middle School | 603 | 18.0% |
| High School | 1,040 | 31.0% |
| College / Undergraduate | 538 | 16.1% |
| Graduate / Professional | 119 | 3.5% |
| Total | 3,349 | 100.0% |
School Enrollment by Age by Funding Source in Torrance County
Out of a total of 3,349 students who are enrolled in schools in Torrance County, 177 (5.3%) attend a private institution, while the remaining 3,172 (94.7%) are enrolled in public schools. The age group of 35 years and over has the highest likelihood of being enrolled in private schools, with 96 (58.5% in the age bracket) enrolled. Conversely, the age group of 15 to 17 year olds has the lowest likelihood of being enrolled in a private school, with 691 (100.0% in the age bracket) attending a public institution.
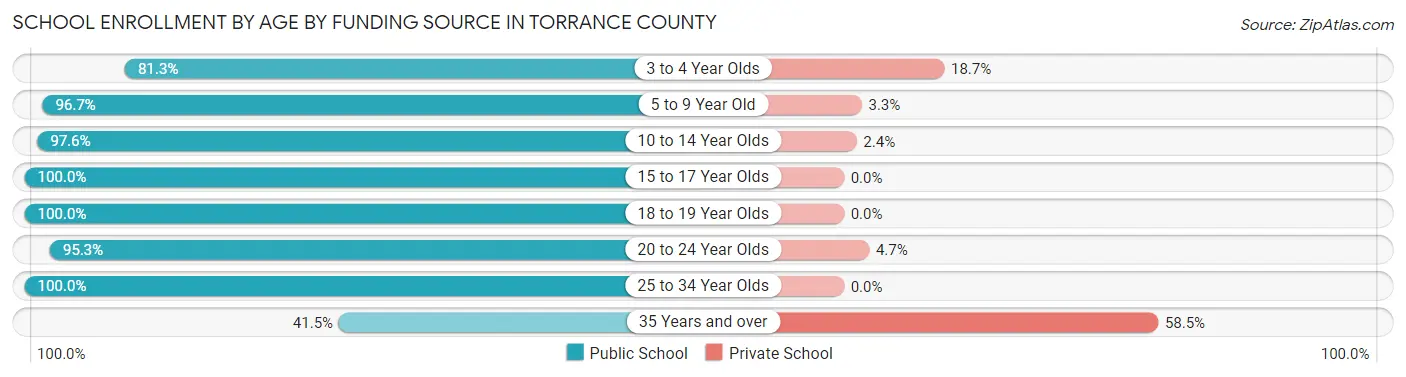
| Age Bracket | Public School | Private School |
| 3 to 4 Year Olds | 100 (81.3%) | 23 (18.7%) |
| 5 to 9 Year Old | 785 (96.7%) | 27 (3.3%) |
| 10 to 14 Year Olds | 824 (97.6%) | 20 (2.4%) |
| 15 to 17 Year Olds | 691 (100.0%) | 0 (0.0%) |
| 18 to 19 Year Olds | 301 (100.0%) | 0 (0.0%) |
| 20 to 24 Year Olds | 243 (95.3%) | 12 (4.7%) |
| 25 to 34 Year Olds | 159 (100.0%) | 0 (0.0%) |
| 35 Years and over | 68 (41.5%) | 96 (58.5%) |
| Total | 3,172 (94.7%) | 177 (5.3%) |
Educational Attainment by Field of Study in Torrance County
Bio, nature & agricultural (311 | 18.8%), education (244 | 14.8%), business (208 | 12.6%), arts & humanities (207 | 12.5%), and science & technology (118 | 7.1%) are the most common fields of study among 1,652 individuals in Torrance County who have obtained a bachelor's degree or higher.
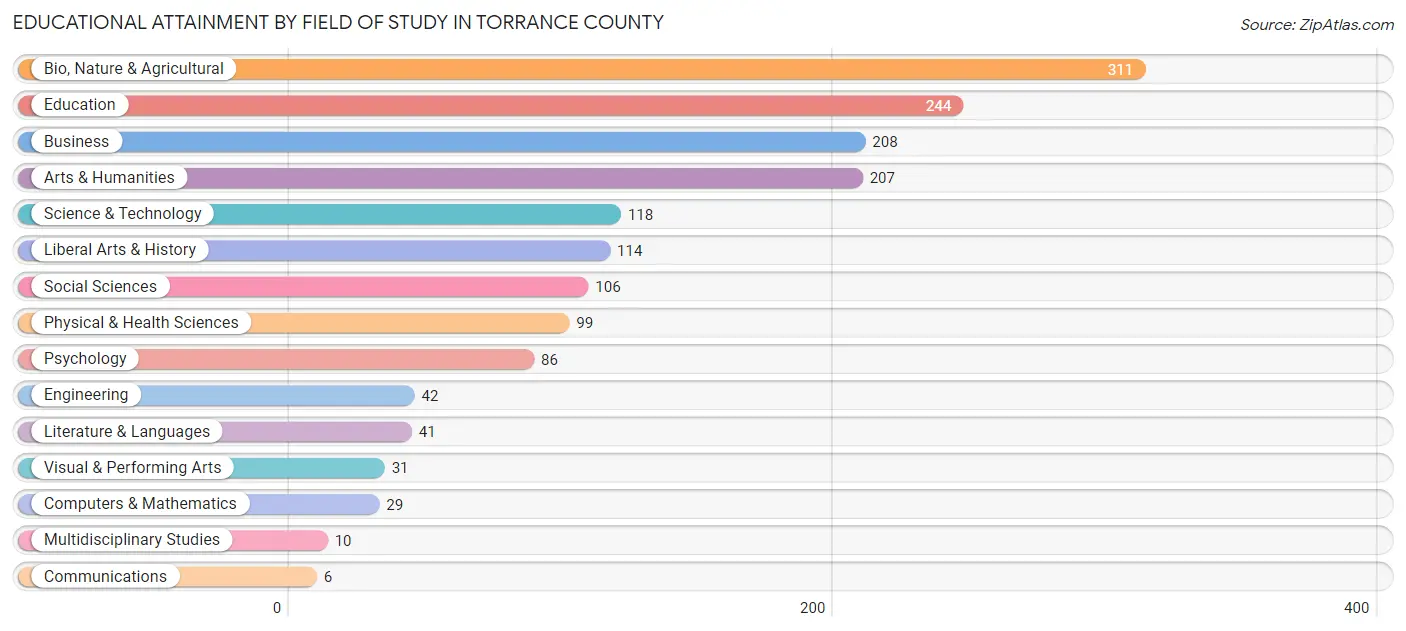
| Field of Study | # Graduates | % Graduates |
| Computers & Mathematics | 29 | 1.8% |
| Bio, Nature & Agricultural | 311 | 18.8% |
| Physical & Health Sciences | 99 | 6.0% |
| Psychology | 86 | 5.2% |
| Social Sciences | 106 | 6.4% |
| Engineering | 42 | 2.5% |
| Multidisciplinary Studies | 10 | 0.6% |
| Science & Technology | 118 | 7.1% |
| Business | 208 | 12.6% |
| Education | 244 | 14.8% |
| Literature & Languages | 41 | 2.5% |
| Liberal Arts & History | 114 | 6.9% |
| Visual & Performing Arts | 31 | 1.9% |
| Communications | 6 | 0.4% |
| Arts & Humanities | 207 | 12.5% |
| Total | 1,652 | 100.0% |
Transportation & Commute in Torrance County
Vehicle Availability by Sex in Torrance County
The most prevalent vehicle ownership categories in Torrance County are males with 2 vehicles (1,001, accounting for 31.2%) and females with 2 vehicles (774, making up 45.2%).
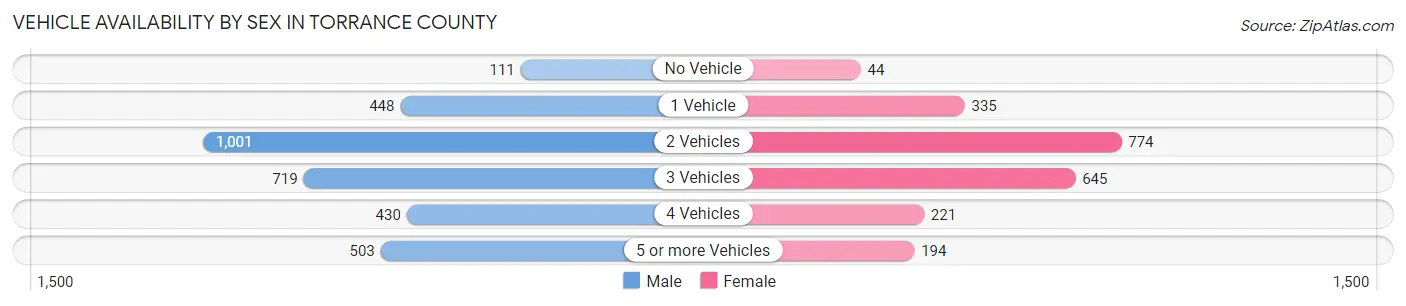
| Vehicles Available | Male | Female |
| No Vehicle | 111 (3.5%) | 44 (2.0%) |
| 1 Vehicle | 448 (14.0%) | 335 (15.1%) |
| 2 Vehicles | 1,001 (31.2%) | 774 (35.0%) |
| 3 Vehicles | 719 (22.4%) | 645 (29.1%) |
| 4 Vehicles | 430 (13.4%) | 221 (10.0%) |
| 5 or more Vehicles | 503 (15.7%) | 194 (8.8%) |
| Total | 3,212 (100.0%) | 2,213 (100.0%) |
Commute Time in Torrance County
The most frequently occuring commute durations in Torrance County are 60 to 89 minutes (780 commuters, 15.9%), 20 to 24 minutes (589 commuters, 12.0%), and 30 to 34 minutes (569 commuters, 11.6%).
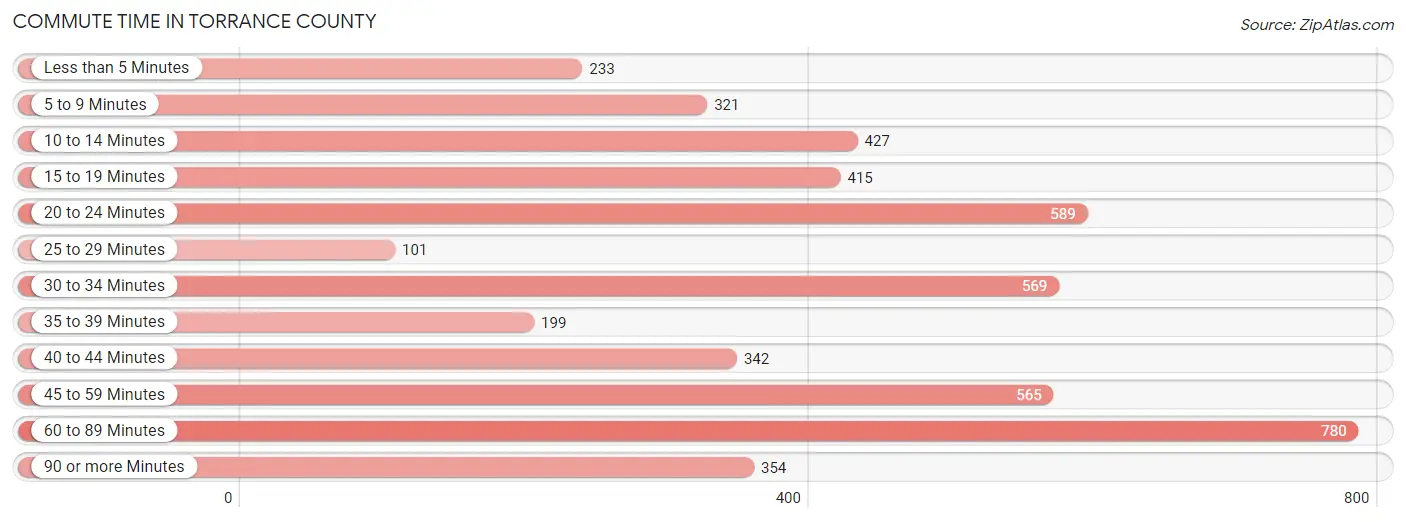
| Commute Time | # Commuters | % Commuters |
| Less than 5 Minutes | 233 | 4.8% |
| 5 to 9 Minutes | 321 | 6.6% |
| 10 to 14 Minutes | 427 | 8.7% |
| 15 to 19 Minutes | 415 | 8.5% |
| 20 to 24 Minutes | 589 | 12.0% |
| 25 to 29 Minutes | 101 | 2.1% |
| 30 to 34 Minutes | 569 | 11.6% |
| 35 to 39 Minutes | 199 | 4.1% |
| 40 to 44 Minutes | 342 | 7.0% |
| 45 to 59 Minutes | 565 | 11.5% |
| 60 to 89 Minutes | 780 | 15.9% |
| 90 or more Minutes | 354 | 7.2% |
Commute Time by Sex in Torrance County
The most common commute times in Torrance County are 60 to 89 minutes (525 commuters, 18.2%) for males and 30 to 34 minutes (307 commuters, 15.3%) for females.
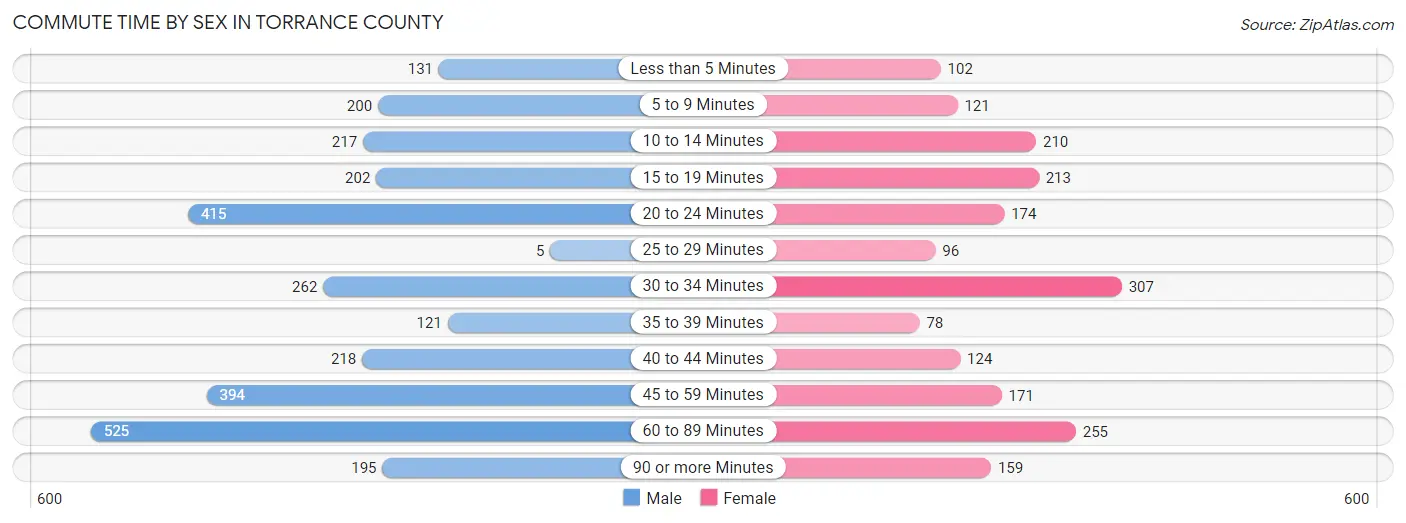
| Commute Time | Male | Female |
| Less than 5 Minutes | 131 (4.5%) | 102 (5.1%) |
| 5 to 9 Minutes | 200 (6.9%) | 121 (6.0%) |
| 10 to 14 Minutes | 217 (7.5%) | 210 (10.4%) |
| 15 to 19 Minutes | 202 (7.0%) | 213 (10.6%) |
| 20 to 24 Minutes | 415 (14.4%) | 174 (8.7%) |
| 25 to 29 Minutes | 5 (0.2%) | 96 (4.8%) |
| 30 to 34 Minutes | 262 (9.1%) | 307 (15.3%) |
| 35 to 39 Minutes | 121 (4.2%) | 78 (3.9%) |
| 40 to 44 Minutes | 218 (7.6%) | 124 (6.2%) |
| 45 to 59 Minutes | 394 (13.7%) | 171 (8.5%) |
| 60 to 89 Minutes | 525 (18.2%) | 255 (12.7%) |
| 90 or more Minutes | 195 (6.8%) | 159 (7.9%) |
Time of Departure to Work by Sex in Torrance County
The most frequent times of departure to work in Torrance County are 6:30 AM to 6:59 AM (534, 18.5%) for males and 7:00 AM to 7:29 AM (599, 29.8%) for females.
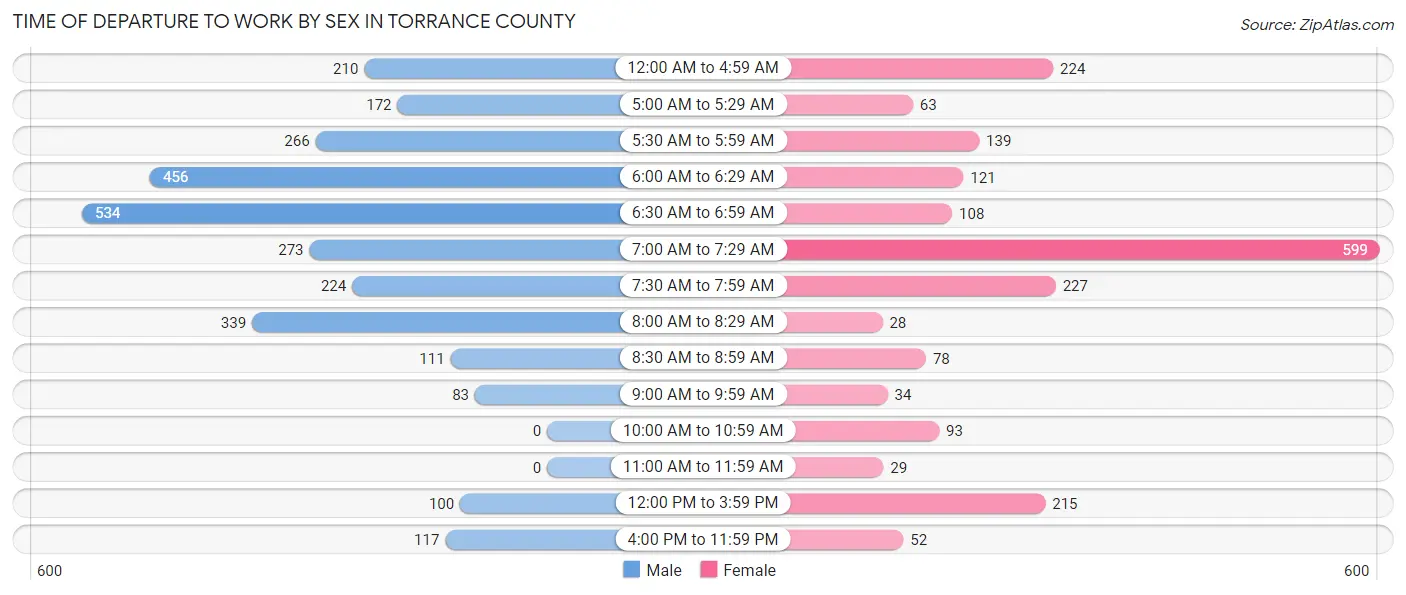
| Time of Departure | Male | Female |
| 12:00 AM to 4:59 AM | 210 (7.3%) | 224 (11.1%) |
| 5:00 AM to 5:29 AM | 172 (6.0%) | 63 (3.1%) |
| 5:30 AM to 5:59 AM | 266 (9.2%) | 139 (6.9%) |
| 6:00 AM to 6:29 AM | 456 (15.8%) | 121 (6.0%) |
| 6:30 AM to 6:59 AM | 534 (18.5%) | 108 (5.4%) |
| 7:00 AM to 7:29 AM | 273 (9.5%) | 599 (29.8%) |
| 7:30 AM to 7:59 AM | 224 (7.8%) | 227 (11.3%) |
| 8:00 AM to 8:29 AM | 339 (11.7%) | 28 (1.4%) |
| 8:30 AM to 8:59 AM | 111 (3.8%) | 78 (3.9%) |
| 9:00 AM to 9:59 AM | 83 (2.9%) | 34 (1.7%) |
| 10:00 AM to 10:59 AM | 0 (0.0%) | 93 (4.6%) |
| 11:00 AM to 11:59 AM | 0 (0.0%) | 29 (1.4%) |
| 12:00 PM to 3:59 PM | 100 (3.5%) | 215 (10.7%) |
| 4:00 PM to 11:59 PM | 117 (4.1%) | 52 (2.6%) |
| Total | 2,885 (100.0%) | 2,010 (100.0%) |
Housing Occupancy in Torrance County
Occupancy by Ownership in Torrance County
Of the total 5,599 dwellings in Torrance County, owner-occupied units account for 4,658 (83.2%), while renter-occupied units make up 941 (16.8%).
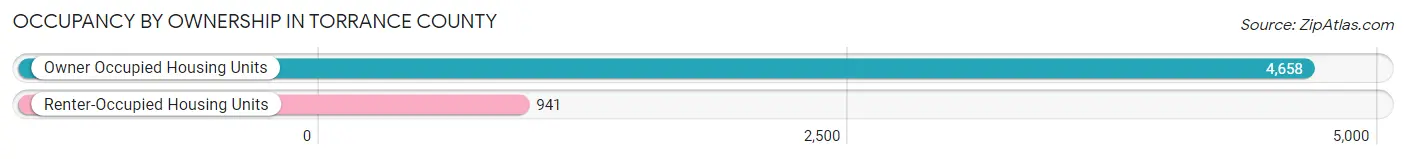
| Occupancy | # Housing Units | % Housing Units |
| Owner Occupied Housing Units | 4,658 | 83.2% |
| Renter-Occupied Housing Units | 941 | 16.8% |
| Total Occupied Housing Units | 5,599 | 100.0% |
Occupancy by Household Size in Torrance County
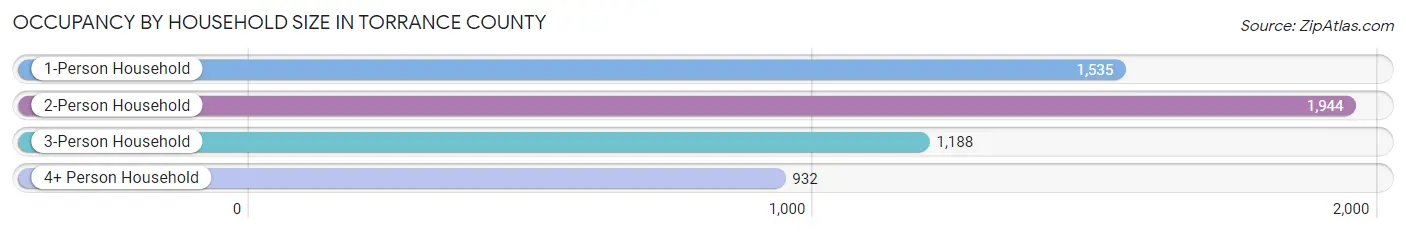
| Household Size | # Housing Units | % Housing Units |
| 1-Person Household | 1,535 | 27.4% |
| 2-Person Household | 1,944 | 34.7% |
| 3-Person Household | 1,188 | 21.2% |
| 4+ Person Household | 932 | 16.7% |
| Total Housing Units | 5,599 | 100.0% |
Occupancy by Ownership by Household Size in Torrance County
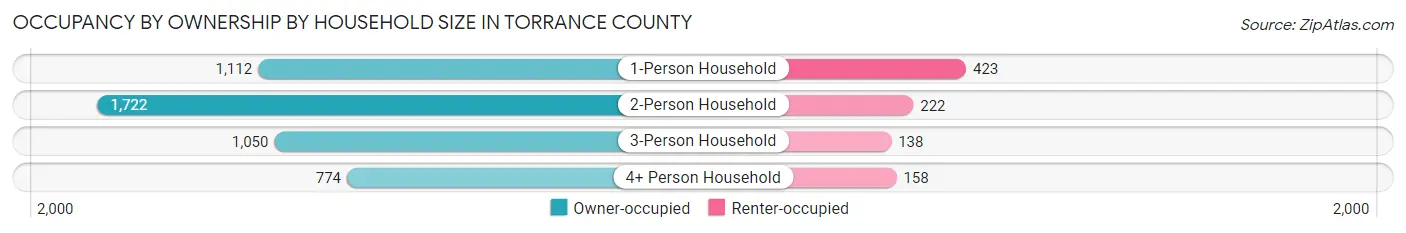
| Household Size | Owner-occupied | Renter-occupied |
| 1-Person Household | 1,112 (72.4%) | 423 (27.6%) |
| 2-Person Household | 1,722 (88.6%) | 222 (11.4%) |
| 3-Person Household | 1,050 (88.4%) | 138 (11.6%) |
| 4+ Person Household | 774 (83.1%) | 158 (17.0%) |
| Total Housing Units | 4,658 (83.2%) | 941 (16.8%) |
Occupancy by Educational Attainment in Torrance County
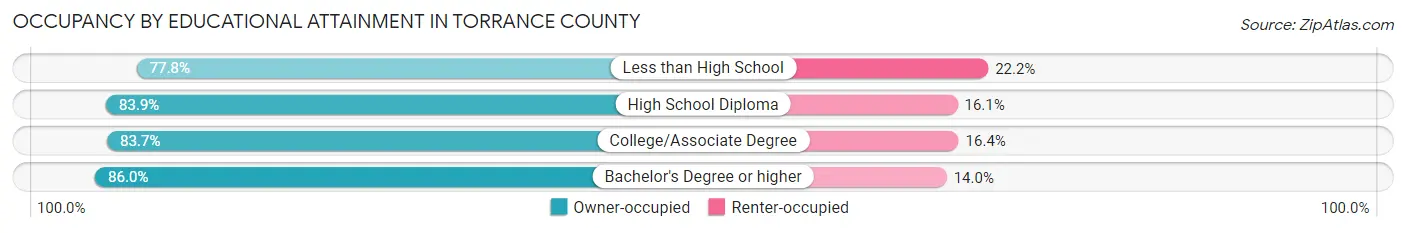
| Household Size | Owner-occupied | Renter-occupied |
| Less than High School | 676 (77.8%) | 193 (22.2%) |
| High School Diploma | 1,487 (83.9%) | 286 (16.1%) |
| College/Associate Degree | 1,714 (83.7%) | 335 (16.4%) |
| Bachelor's Degree or higher | 781 (86.0%) | 127 (14.0%) |
Occupancy by Age of Householder in Torrance County
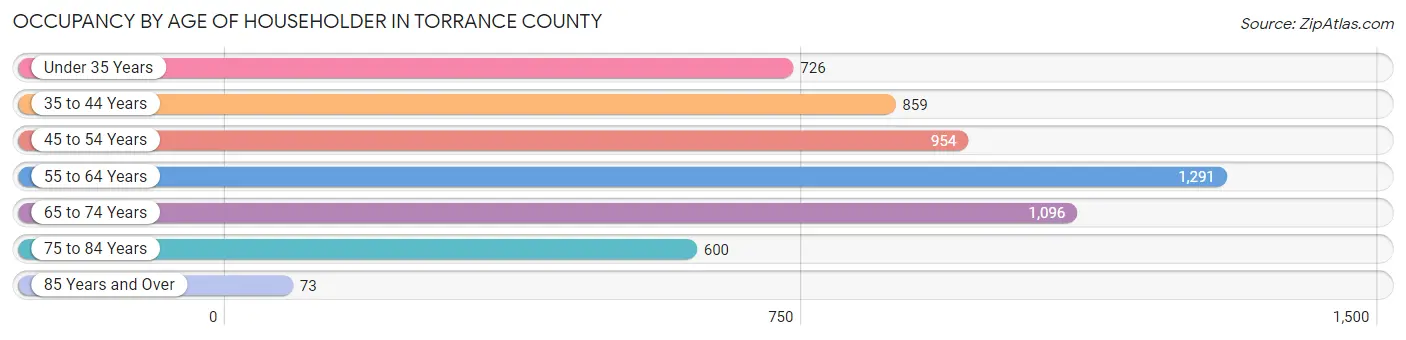
| Age Bracket | # Households | % Households |
| Under 35 Years | 726 | 13.0% |
| 35 to 44 Years | 859 | 15.3% |
| 45 to 54 Years | 954 | 17.0% |
| 55 to 64 Years | 1,291 | 23.1% |
| 65 to 74 Years | 1,096 | 19.6% |
| 75 to 84 Years | 600 | 10.7% |
| 85 Years and Over | 73 | 1.3% |
| Total | 5,599 | 100.0% |
Housing Finances in Torrance County
Median Income by Occupancy in Torrance County
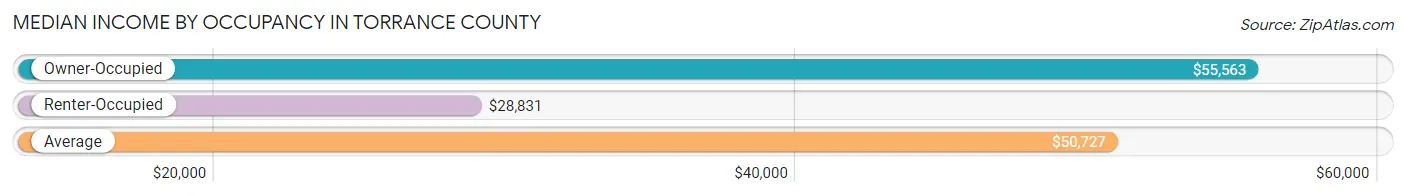
| Occupancy Type | # Households | Median Income |
| Owner-Occupied | 4,658 (83.2%) | $55,563 |
| Renter-Occupied | 941 (16.8%) | $28,831 |
| Average | 5,599 (100.0%) | $50,727 |
Occupancy by Householder Income Bracket in Torrance County
| Income Bracket | Owner-occupied | Renter-occupied |
| Less than $5,000 | 133 (2.9%) | 84 (8.9%) |
| $5,000 to $9,999 | 79 (1.7%) | 29 (3.1%) |
| $10,000 to $14,999 | 215 (4.6%) | 54 (5.7%) |
| $15,000 to $19,999 | 210 (4.5%) | 80 (8.5%) |
| $20,000 to $24,999 | 298 (6.4%) | 191 (20.3%) |
| $25,000 to $34,999 | 589 (12.6%) | 101 (10.7%) |
| $35,000 to $49,999 | 595 (12.8%) | 113 (12.0%) |
| $50,000 to $74,999 | 896 (19.2%) | 107 (11.4%) |
| $75,000 to $99,999 | 573 (12.3%) | 127 (13.5%) |
| $100,000 to $149,999 | 871 (18.7%) | 55 (5.8%) |
| $150,000 or more | 199 (4.3%) | 0 (0.0%) |
| Total | 4,658 (100.0%) | 941 (100.0%) |
Monthly Housing Cost Tiers in Torrance County
| Monthly Cost | Owner-occupied | Renter-occupied |
| Less than $300 | 1,131 (24.3%) | 51 (5.4%) |
| $300 to $499 | 1,047 (22.5%) | 104 (11.1%) |
| $500 to $799 | 710 (15.2%) | 297 (31.6%) |
| $800 to $999 | 311 (6.7%) | 101 (10.7%) |
| $1,000 to $1,499 | 949 (20.4%) | 152 (16.2%) |
| $1,500 to $1,999 | 437 (9.4%) | 29 (3.1%) |
| $2,000 to $2,499 | 38 (0.8%) | 0 (0.0%) |
| $2,500 to $2,999 | 35 (0.7%) | 0 (0.0%) |
| $3,000 or more | 0 (0.0%) | 0 (0.0%) |
| Total | 4,658 (100.0%) | 941 (100.0%) |
Physical Housing Characteristics in Torrance County
Housing Structures in Torrance County
| Structure Type | # Housing Units | % Housing Units |
| Single Unit, Detached | 2,954 | 52.8% |
| Single Unit, Attached | 47 | 0.8% |
| 2 Unit Apartments | 39 | 0.7% |
| 3 or 4 Unit Apartments | 21 | 0.4% |
| 5 to 9 Unit Apartments | 24 | 0.4% |
| 10 or more Apartments | 28 | 0.5% |
| Mobile Home / Other | 2,486 | 44.4% |
| Total | 5,599 | 100.0% |
Housing Structures by Occupancy in Torrance County
| Structure Type | Owner-occupied | Renter-occupied |
| Single Unit, Detached | 2,515 (85.1%) | 439 (14.9%) |
| Single Unit, Attached | 42 (89.4%) | 5 (10.6%) |
| 2 Unit Apartments | 0 (0.0%) | 39 (100.0%) |
| 3 or 4 Unit Apartments | 0 (0.0%) | 21 (100.0%) |
| 5 to 9 Unit Apartments | 0 (0.0%) | 24 (100.0%) |
| 10 or more Apartments | 0 (0.0%) | 28 (100.0%) |
| Mobile Home / Other | 2,101 (84.5%) | 385 (15.5%) |
| Total | 4,658 (83.2%) | 941 (16.8%) |
Housing Structures by Number of Rooms in Torrance County
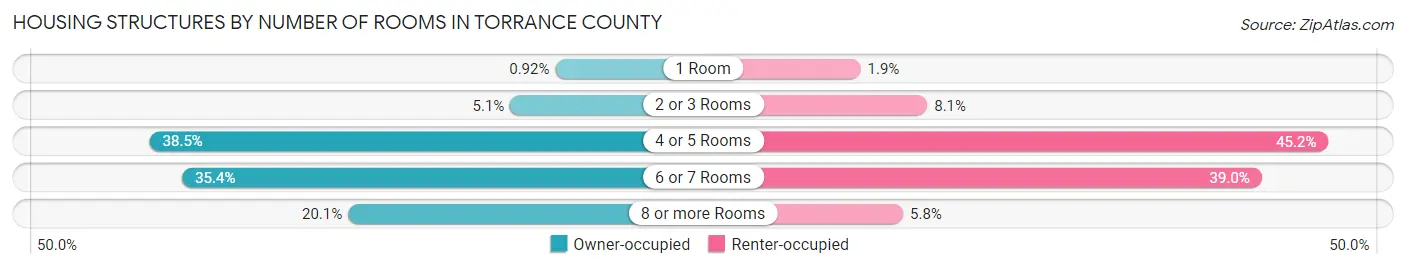
| Number of Rooms | Owner-occupied | Renter-occupied |
| 1 Room | 43 (0.9%) | 18 (1.9%) |
| 2 or 3 Rooms | 237 (5.1%) | 76 (8.1%) |
| 4 or 5 Rooms | 1,791 (38.5%) | 425 (45.2%) |
| 6 or 7 Rooms | 1,651 (35.4%) | 367 (39.0%) |
| 8 or more Rooms | 936 (20.1%) | 55 (5.8%) |
| Total | 4,658 (100.0%) | 941 (100.0%) |
Housing Structure by Heating Type in Torrance County
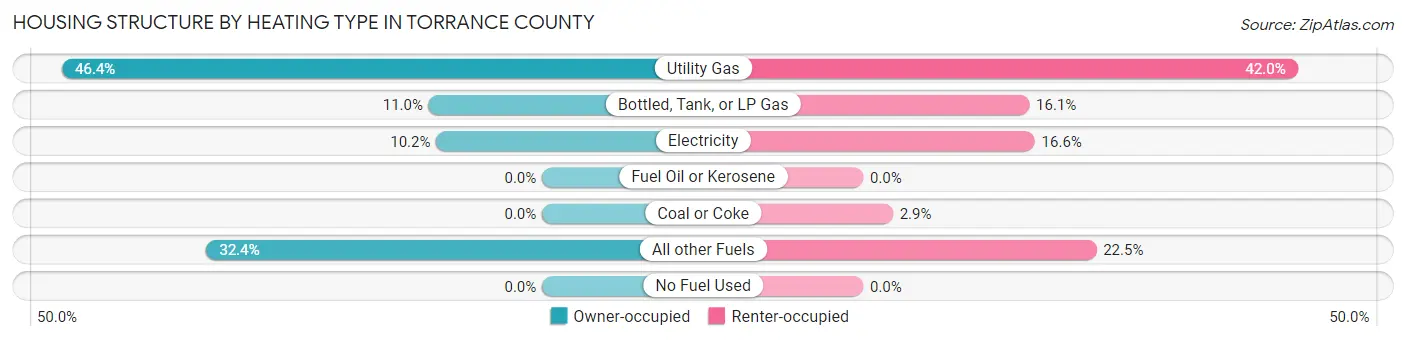
| Heating Type | Owner-occupied | Renter-occupied |
| Utility Gas | 2,161 (46.4%) | 395 (42.0%) |
| Bottled, Tank, or LP Gas | 510 (11.0%) | 151 (16.1%) |
| Electricity | 476 (10.2%) | 156 (16.6%) |
| Fuel Oil or Kerosene | 0 (0.0%) | 0 (0.0%) |
| Coal or Coke | 0 (0.0%) | 27 (2.9%) |
| All other Fuels | 1,511 (32.4%) | 212 (22.5%) |
| No Fuel Used | 0 (0.0%) | 0 (0.0%) |
| Total | 4,658 (100.0%) | 941 (100.0%) |
Household Vehicle Usage in Torrance County
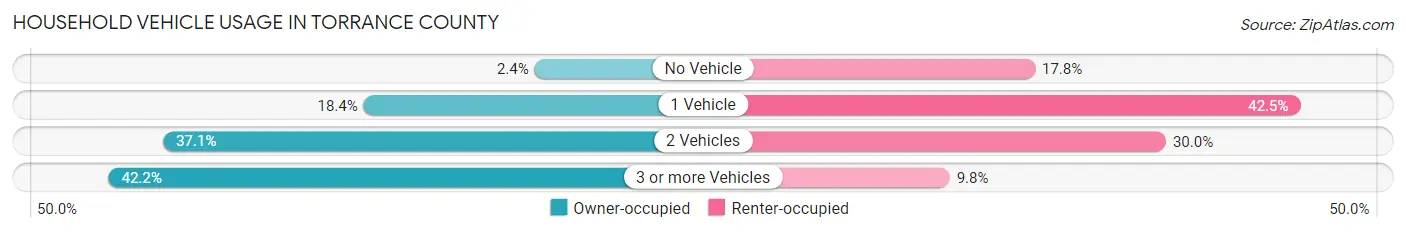
| Vehicles per Household | Owner-occupied | Renter-occupied |
| No Vehicle | 112 (2.4%) | 167 (17.7%) |
| 1 Vehicle | 855 (18.4%) | 400 (42.5%) |
| 2 Vehicles | 1,727 (37.1%) | 282 (30.0%) |
| 3 or more Vehicles | 1,964 (42.2%) | 92 (9.8%) |
| Total | 4,658 (100.0%) | 941 (100.0%) |
Real Estate & Mortgages in Torrance County
Real Estate and Mortgage Overview in Torrance County
| Characteristic | Without Mortgage | With Mortgage |
| Housing Units | 2,624 | 2,034 |
| Median Property Value | $95,200 | $165,900 |
| Median Household Income | $42,227 | $141 |
| Monthly Housing Costs | $340 | $0 |
| Real Estate Taxes | $514 | $57 |
Property Value by Mortgage Status in Torrance County
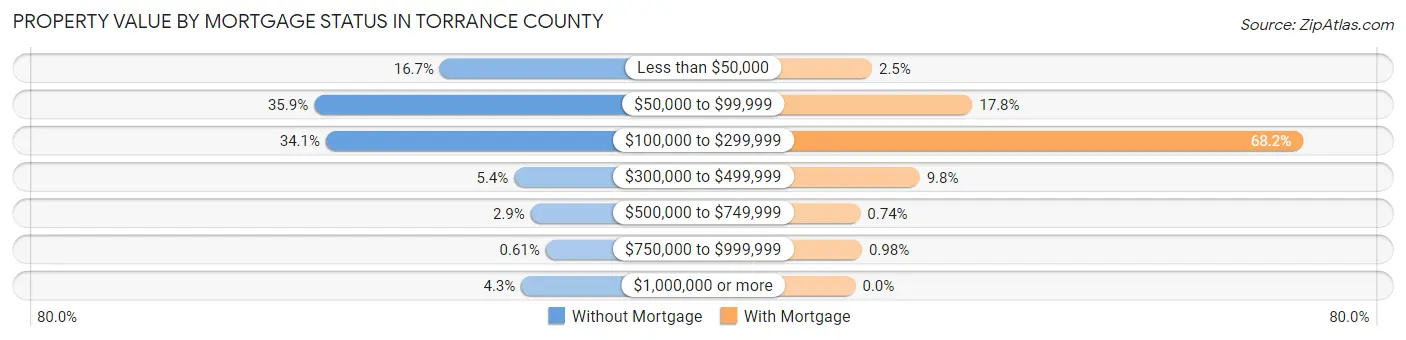
| Property Value | Without Mortgage | With Mortgage |
| Less than $50,000 | 439 (16.7%) | 51 (2.5%) |
| $50,000 to $99,999 | 942 (35.9%) | 362 (17.8%) |
| $100,000 to $299,999 | 895 (34.1%) | 1,387 (68.2%) |
| $300,000 to $499,999 | 142 (5.4%) | 199 (9.8%) |
| $500,000 to $749,999 | 76 (2.9%) | 15 (0.7%) |
| $750,000 to $999,999 | 16 (0.6%) | 20 (1.0%) |
| $1,000,000 or more | 114 (4.3%) | 0 (0.0%) |
| Total | 2,624 (100.0%) | 2,034 (100.0%) |
Household Income by Mortgage Status in Torrance County
| Household Income | Without Mortgage | With Mortgage |
| Less than $10,000 | 133 (5.1%) | 0 (0.0%) |
| $10,000 to $24,999 | 600 (22.9%) | 79 (3.9%) |
| $25,000 to $34,999 | 311 (11.8%) | 123 (6.0%) |
| $35,000 to $49,999 | 393 (15.0%) | 278 (13.7%) |
| $50,000 to $74,999 | 502 (19.1%) | 202 (9.9%) |
| $75,000 to $99,999 | 220 (8.4%) | 394 (19.4%) |
| $100,000 to $149,999 | 407 (15.5%) | 353 (17.3%) |
| $150,000 or more | 58 (2.2%) | 464 (22.8%) |
| Total | 2,624 (100.0%) | 2,034 (100.0%) |
Property Value to Household Income Ratio in Torrance County
| Value-to-Income Ratio | Without Mortgage | With Mortgage |
| Less than 2.0x | 993 (37.8%) | 71,012 (3,491.3%) |
| 2.0x to 2.9x | 440 (16.8%) | 782 (38.5%) |
| 3.0x to 3.9x | 338 (12.9%) | 464 (22.8%) |
| 4.0x or more | 839 (32.0%) | 275 (13.5%) |
| Total | 2,624 (100.0%) | 2,034 (100.0%) |
Real Estate Taxes by Mortgage Status in Torrance County
| Property Taxes | Without Mortgage | With Mortgage |
| Less than $800 | 1,570 (59.8%) | 25 (1.2%) |
| $800 to $1,499 | 504 (19.2%) | 774 (38.1%) |
| $800 to $1,499 | 249 (9.5%) | 576 (28.3%) |
| Total | 2,624 (100.0%) | 2,034 (100.0%) |
Health & Disability in Torrance County
Health Insurance Coverage by Age in Torrance County
| Age Bracket | With Coverage | Without Coverage |
| Under 6 Years | 889 (98.8%) | 11 (1.2%) |
| 6 to 18 Years | 2,350 (94.7%) | 132 (5.3%) |
| 19 to 25 Years | 1,123 (83.1%) | 229 (16.9%) |
| 26 to 34 Years | 1,105 (79.4%) | 286 (20.6%) |
| 35 to 44 Years | 1,653 (90.2%) | 179 (9.8%) |
| 45 to 54 Years | 1,554 (87.2%) | 228 (12.8%) |
| 55 to 64 Years | 1,972 (90.0%) | 218 (10.0%) |
| 65 to 74 Years | 2,080 (99.5%) | 11 (0.5%) |
| 75 Years and older | 1,183 (100.0%) | 0 (0.0%) |
| Total | 13,909 (91.5%) | 1,294 (8.5%) |
Health Insurance Coverage by Citizenship Status in Torrance County
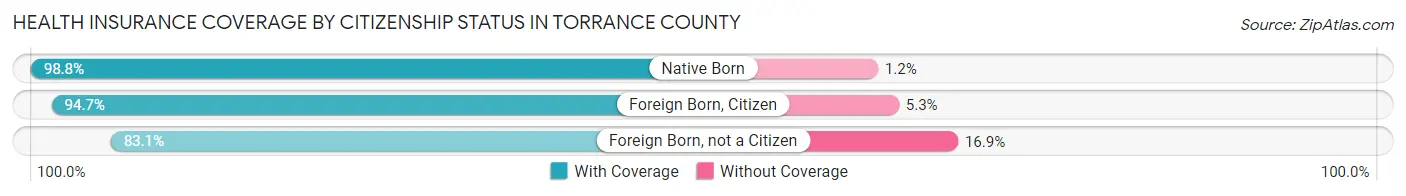
| Citizenship Status | With Coverage | Without Coverage |
| Native Born | 889 (98.8%) | 11 (1.2%) |
| Foreign Born, Citizen | 2,350 (94.7%) | 132 (5.3%) |
| Foreign Born, not a Citizen | 1,123 (83.1%) | 229 (16.9%) |
Health Insurance Coverage by Household Income in Torrance County
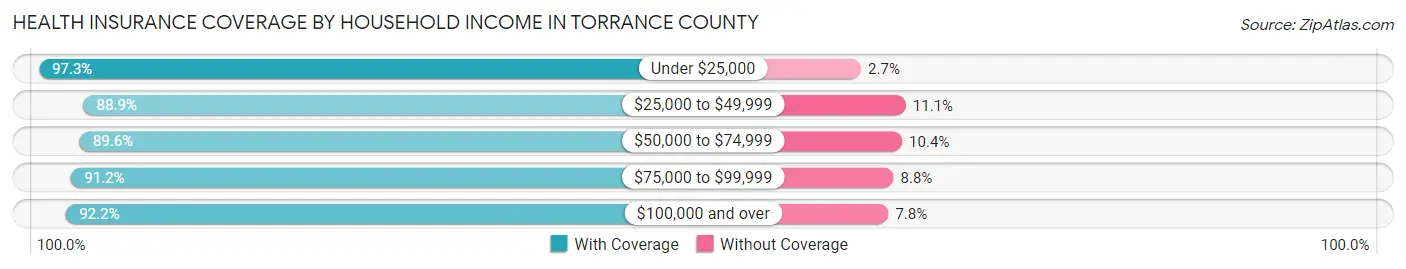
| Household Income | With Coverage | Without Coverage |
| Under $25,000 | 2,427 (97.3%) | 67 (2.7%) |
| $25,000 to $49,999 | 3,550 (88.9%) | 442 (11.1%) |
| $50,000 to $74,999 | 2,680 (89.6%) | 310 (10.4%) |
| $75,000 to $99,999 | 1,924 (91.2%) | 185 (8.8%) |
| $100,000 and over | 3,328 (92.2%) | 282 (7.8%) |
Public vs Private Health Insurance Coverage by Age in Torrance County
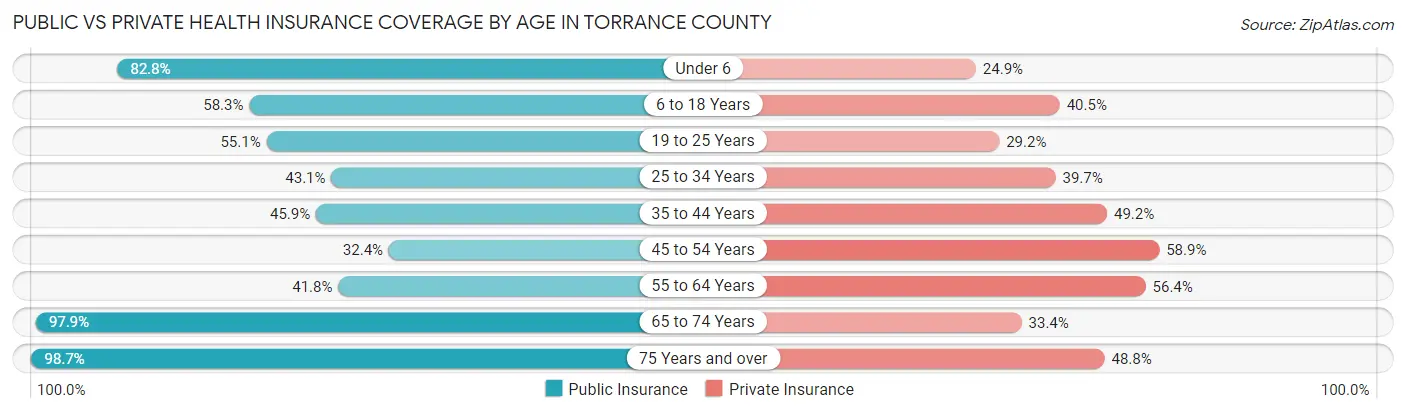
| Age Bracket | Public Insurance | Private Insurance |
| Under 6 | 745 (82.8%) | 224 (24.9%) |
| 6 to 18 Years | 1,447 (58.3%) | 1,004 (40.5%) |
| 19 to 25 Years | 745 (55.1%) | 395 (29.2%) |
| 25 to 34 Years | 599 (43.1%) | 552 (39.7%) |
| 35 to 44 Years | 841 (45.9%) | 902 (49.2%) |
| 45 to 54 Years | 577 (32.4%) | 1,050 (58.9%) |
| 55 to 64 Years | 915 (41.8%) | 1,235 (56.4%) |
| 65 to 74 Years | 2,047 (97.9%) | 698 (33.4%) |
| 75 Years and over | 1,168 (98.7%) | 577 (48.8%) |
| Total | 9,084 (59.8%) | 6,637 (43.7%) |
Disability Status by Sex by Age in Torrance County
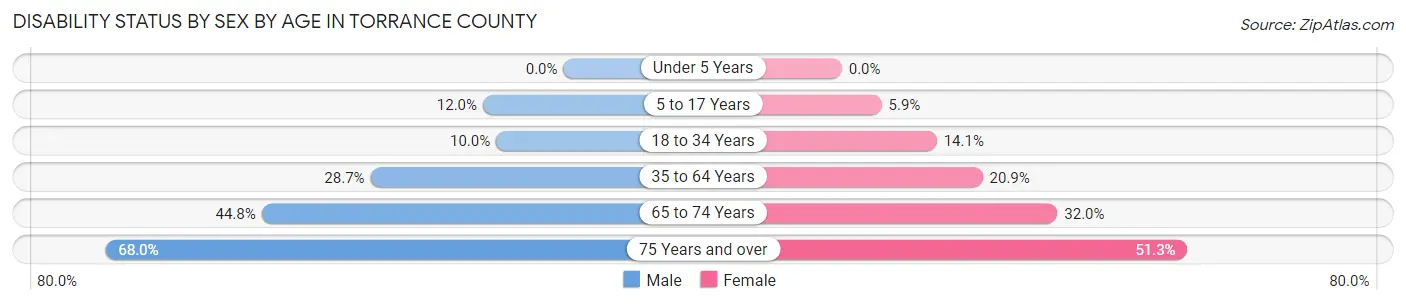
| Age Bracket | Male | Female |
| Under 5 Years | 0 (0.0%) | 0 (0.0%) |
| 5 to 17 Years | 154 (11.9%) | 72 (5.9%) |
| 18 to 34 Years | 160 (10.0%) | 181 (14.1%) |
| 35 to 64 Years | 838 (28.6%) | 602 (20.9%) |
| 65 to 74 Years | 485 (44.8%) | 323 (32.0%) |
| 75 Years and over | 391 (68.0%) | 312 (51.3%) |
Disability Class by Sex by Age in Torrance County
Disability Class: Hearing Difficulty
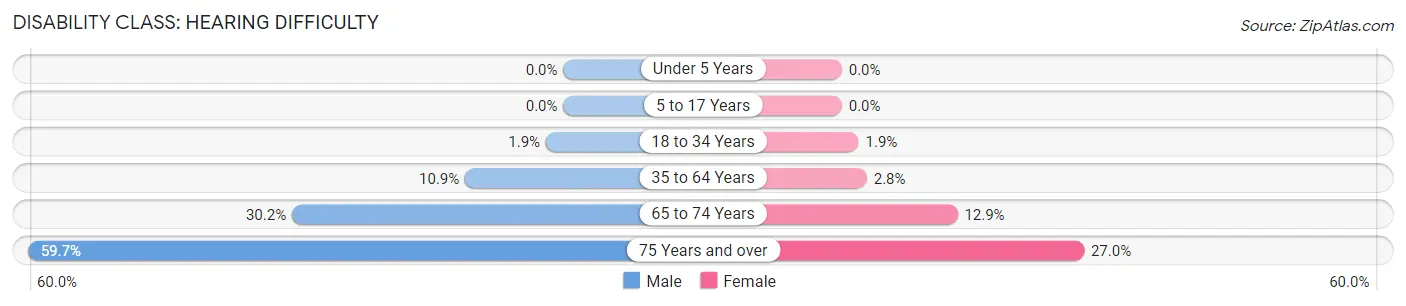
| Age Bracket | Male | Female |
| Under 5 Years | 0 (0.0%) | 0 (0.0%) |
| 5 to 17 Years | 0 (0.0%) | 0 (0.0%) |
| 18 to 34 Years | 31 (1.9%) | 24 (1.9%) |
| 35 to 64 Years | 320 (10.9%) | 80 (2.8%) |
| 65 to 74 Years | 327 (30.2%) | 130 (12.9%) |
| 75 Years and over | 343 (59.7%) | 164 (27.0%) |
Disability Class: Vision Difficulty
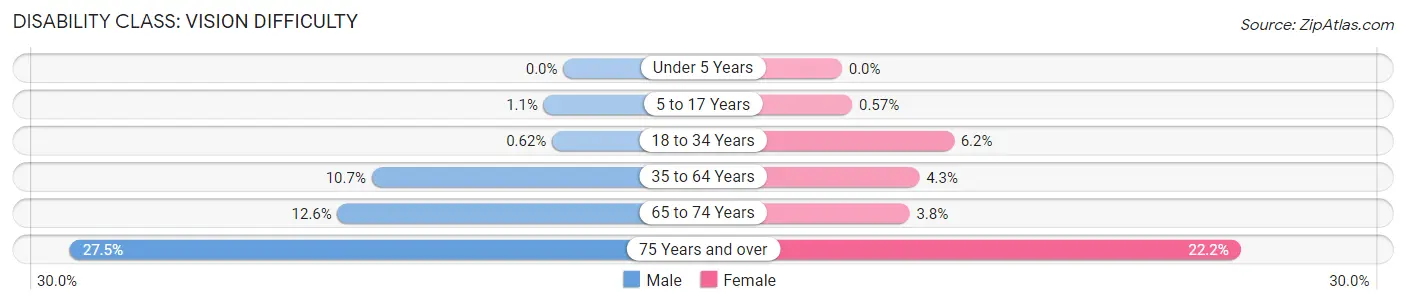
| Age Bracket | Male | Female |
| Under 5 Years | 0 (0.0%) | 0 (0.0%) |
| 5 to 17 Years | 14 (1.1%) | 7 (0.6%) |
| 18 to 34 Years | 10 (0.6%) | 80 (6.2%) |
| 35 to 64 Years | 312 (10.7%) | 124 (4.3%) |
| 65 to 74 Years | 136 (12.6%) | 38 (3.8%) |
| 75 Years and over | 158 (27.5%) | 135 (22.2%) |
Disability Class: Cognitive Difficulty
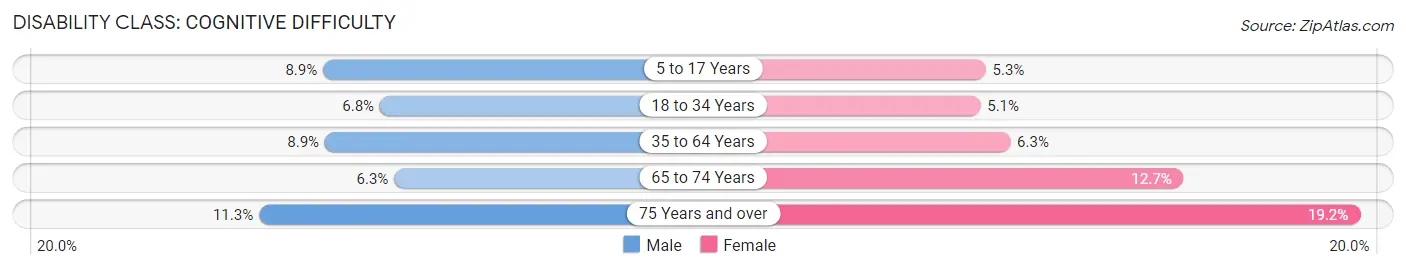
| Age Bracket | Male | Female |
| 5 to 17 Years | 115 (8.9%) | 65 (5.3%) |
| 18 to 34 Years | 109 (6.8%) | 66 (5.1%) |
| 35 to 64 Years | 259 (8.8%) | 180 (6.2%) |
| 65 to 74 Years | 68 (6.3%) | 128 (12.7%) |
| 75 Years and over | 65 (11.3%) | 117 (19.2%) |
Disability Class: Ambulatory Difficulty
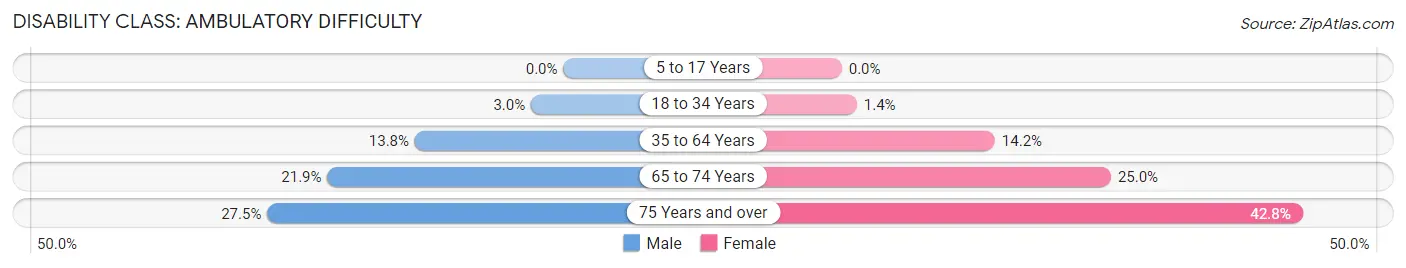
| Age Bracket | Male | Female |
| 5 to 17 Years | 0 (0.0%) | 0 (0.0%) |
| 18 to 34 Years | 48 (3.0%) | 18 (1.4%) |
| 35 to 64 Years | 403 (13.8%) | 409 (14.2%) |
| 65 to 74 Years | 237 (21.9%) | 252 (25.0%) |
| 75 Years and over | 158 (27.5%) | 260 (42.8%) |
Disability Class: Self-Care Difficulty
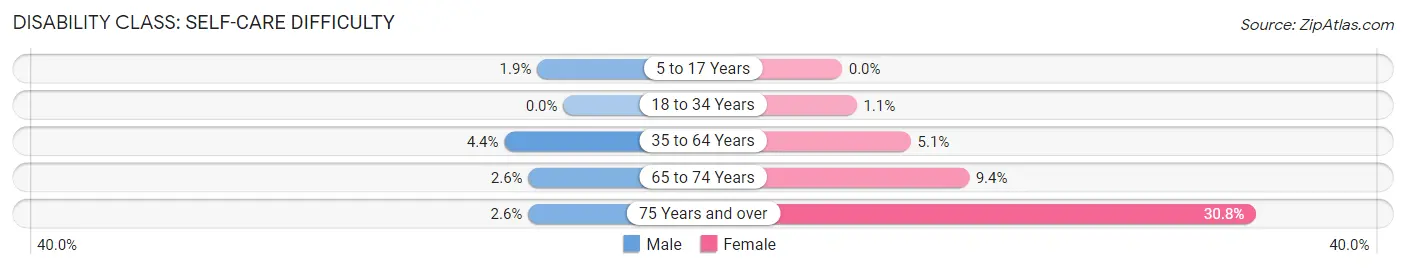
| Age Bracket | Male | Female |
| 5 to 17 Years | 25 (1.9%) | 0 (0.0%) |
| 18 to 34 Years | 0 (0.0%) | 14 (1.1%) |
| 35 to 64 Years | 128 (4.4%) | 147 (5.1%) |
| 65 to 74 Years | 28 (2.6%) | 95 (9.4%) |
| 75 Years and over | 15 (2.6%) | 187 (30.8%) |
Technology Access in Torrance County
Computing Device Access in Torrance County
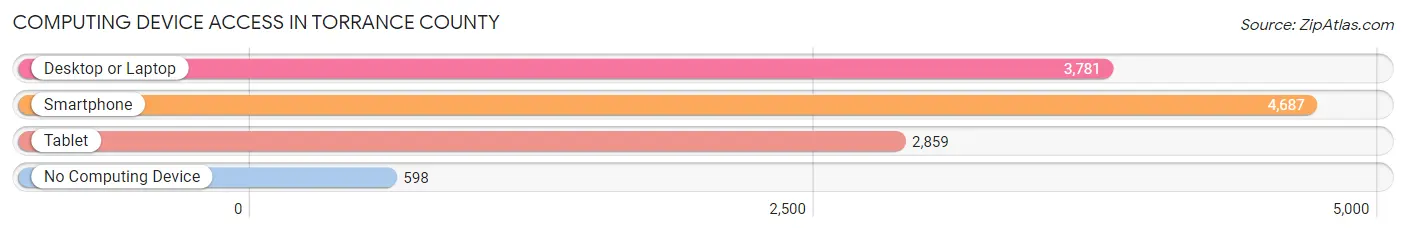
| Device Type | # Households | % Households |
| Desktop or Laptop | 3,781 | 67.5% |
| Smartphone | 4,687 | 83.7% |
| Tablet | 2,859 | 51.1% |
| No Computing Device | 598 | 10.7% |
| Total | 5,599 | 100.0% |
Internet Access in Torrance County
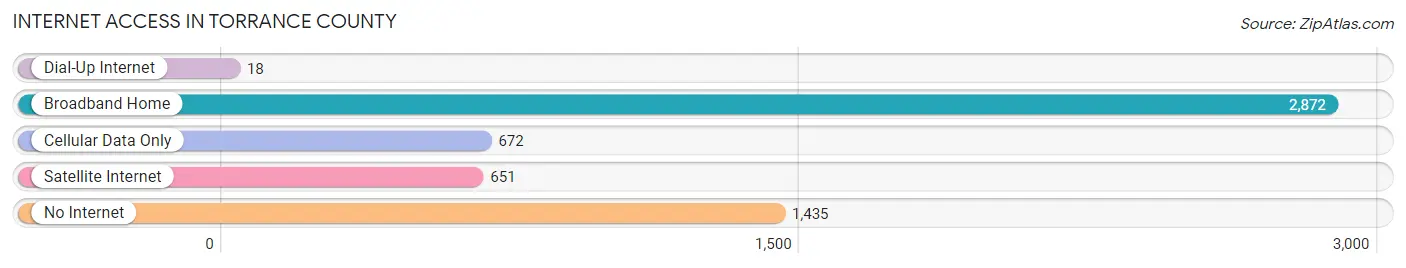
| Internet Type | # Households | % Households |
| Dial-Up Internet | 18 | 0.3% |
| Broadband Home | 2,872 | 51.3% |
| Cellular Data Only | 672 | 12.0% |
| Satellite Internet | 651 | 11.6% |
| No Internet | 1,435 | 25.6% |
| Total | 5,599 | 100.0% |
Torrance County Summary
Torrance County is a county located in the state of New Mexico. It is part of the Albuquerque Metropolitan Statistical Area. As of the 2010 census, the population was 16,383. The county seat is Estancia. The county was created in 1903 from the eastern portion of Valencia County.
Geography
Torrance County is located in the central part of New Mexico. It is bordered by Bernalillo County to the north, Valencia County to the west, and Lincoln County to the south. The eastern border of the county is the state line with Texas. The county has a total area of 2,945 square miles, of which 2,944 square miles is land and 1.2 square miles (0.04%) is water.
The Manzano Mountains are located in the northern part of the county, and the Estancia Valley is located in the southern part. The Manzano Mountains are part of the Cibola National Forest, and the Estancia Valley is part of the Estancia Valley Wildlife Management Area.
Demographics
As of the 2010 census, there were 16,383 people, 5,945 households, and 4,521 families residing in the county. The population density was 5.5 people per square mile. There were 6,845 housing units at an average density of 2.3 per square mile. The racial makeup of the county was 73.2% White, 0.9% Black or African American, 1.2% Native American, 0.4% Asian, 0.1% Pacific Islander, 21.2% from other races, and 3.0% from two or more races. 44.2% of the population were Hispanic or Latino of any race.
Economy
The economy of Torrance County is largely based on agriculture and ranching. The county is home to several large farms and ranches, including the Estancia Valley Dairy, which is the largest dairy in the state. The county is also home to several oil and gas fields, including the Estancia Valley Oil Field.
The county is also home to several small businesses, including a number of restaurants, retail stores, and service providers. The county is also home to a number of tourist attractions, including the Manzano Mountains State Park and the Estancia Valley Wildlife Management Area.
History
Torrance County was created in 1903 from the eastern portion of Valencia County. The county was named for Colonel John Torrance, who was a prominent figure in the early history of New Mexico.
The county was largely rural until the 1950s, when the population began to grow rapidly due to the development of the oil and gas industry. The county has continued to grow since then, and today it is home to a diverse population and economy.
Common Questions
What is Per Capita Income in Torrance County?
Per Capita income in Torrance County is $24,657.
What is the Median Family Income in Torrance County?
Median Family Income in Torrance County is $62,591.
What is the Median Household income in Torrance County?
Median Household Income in Torrance County is $50,727.
What is Income or Wage Gap in Torrance County?
Income or Wage Gap in Torrance County is 21.0%.
Women in Torrance County earn 79.0 cents for every dollar earned by a man.
What is Family Income Deficit in Torrance County?
Family Income Deficit in Torrance County is $9,333.
Families that are below poverty line in Torrance County earn $9,333 less on average than the poverty threshold level.
What is Inequality or Gini Index in Torrance County?
Inequality or Gini Index in Torrance County is 0.42.
What is the Total Population of Torrance County?
Total Population of Torrance County is 15,203.
What is the Total Male Population of Torrance County?
Total Male Population of Torrance County is 7,805.
What is the Total Female Population of Torrance County?
Total Female Population of Torrance County is 7,398.
What is the Ratio of Males per 100 Females in Torrance County?
There are 105.50 Males per 100 Females in Torrance County.
What is the Ratio of Females per 100 Males in Torrance County?
There are 94.79 Females per 100 Males in Torrance County.
What is the Median Population Age in Torrance County?
Median Population Age in Torrance County is 43.0 Years.
What is the Average Family Size in Torrance County
Average Family Size in Torrance County is 3.2 People.
What is the Average Household Size in Torrance County
Average Household Size in Torrance County is 2.7 People.
How Large is the Labor Force in Torrance County?
There are 6,217 People in the Labor Forcein in Torrance County.
What is the Percentage of People in the Labor Force in Torrance County?
49.8% of People are in the Labor Force in Torrance County.
What is the Unemployment Rate in Torrance County?
Unemployment Rate in Torrance County is 10.8%.