Los Lunas, NM Map & Demographics
Los Lunas Map
Los Lunas Overview
$29,534
PER CAPITA INCOME
$79,857
AVG FAMILY INCOME
$68,934
AVG HOUSEHOLD INCOME
20.7%
WAGE / INCOME GAP [ % ]
79.3¢/ $1
WAGE / INCOME GAP [ $ ]
$12,279
FAMILY INCOME DEFICIT
0.40
INEQUALITY / GINI INDEX
17,452
TOTAL POPULATION
8,863
MALE POPULATION
8,589
FEMALE POPULATION
103.19
MALES / 100 FEMALES
96.91
FEMALES / 100 MALES
38.3
MEDIAN AGE
3.5
AVG FAMILY SIZE
2.7
AVG HOUSEHOLD SIZE
6,910
LABOR FORCE [ PEOPLE ]
51.7%
PERCENT IN LABOR FORCE
5.3%
UNEMPLOYMENT RATE
Los Lunas Zip Codes
Los Lunas Area Codes
Income in Los Lunas
Income Overview in Los Lunas
Per Capita Income in Los Lunas is $29,534, while median incomes of families and households are $79,857 and $68,934 respectively.
| Characteristic | Number | Measure |
| Per Capita Income | 17,452 | $29,534 |
| Median Family Income | 3,871 | $79,857 |
| Mean Family Income | 3,871 | $87,175 |
| Median Household Income | 6,316 | $68,934 |
| Mean Household Income | 6,316 | $76,077 |
| Income Deficit | 3,871 | $12,279 |
| Wage / Income Gap (%) | 17,452 | 20.69% |
| Wage / Income Gap ($) | 17,452 | 79.31¢ per $1 |
| Gini / Inequality Index | 17,452 | 0.40 |
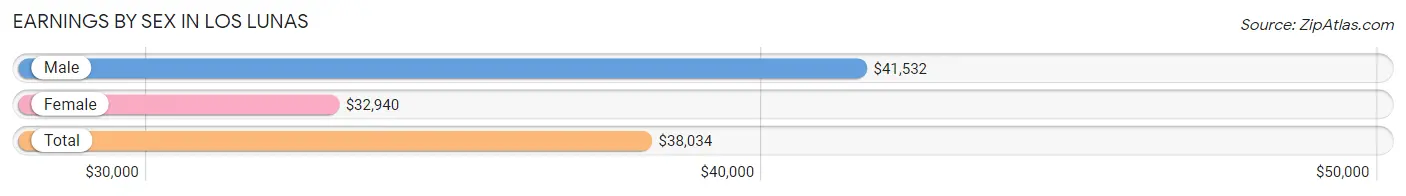
Earnings by Sex in Los Lunas
Average Earnings in Los Lunas are $38,034, $41,532 for men and $32,940 for women, a difference of 20.7%.
| Sex | Number | Average Earnings |
| Male | 3,836 (52.4%) | $41,532 |
| Female | 3,487 (47.6%) | $32,940 |
| Total | 7,323 (100.0%) | $38,034 |
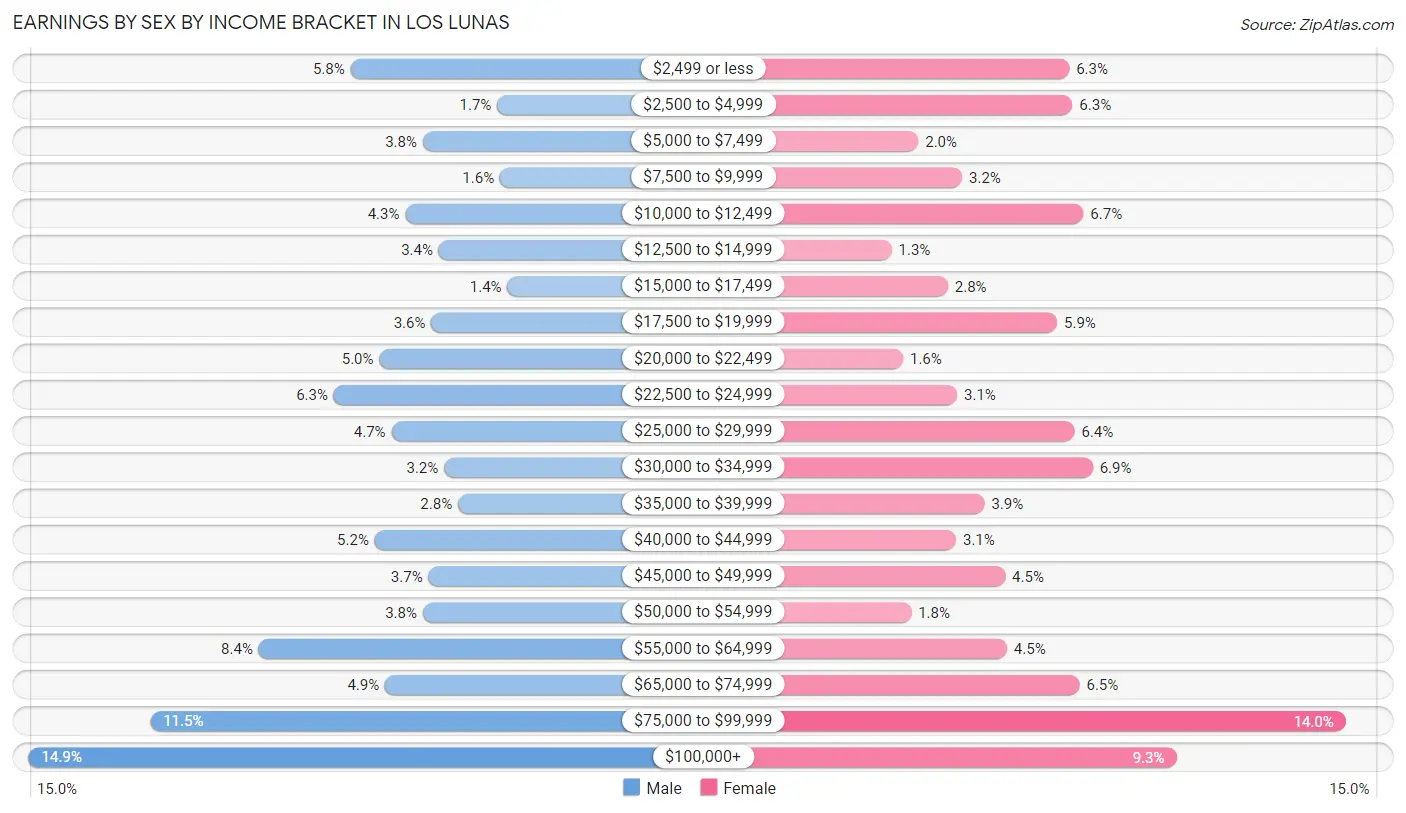
Earnings by Sex by Income Bracket in Los Lunas
The most common earnings brackets in Los Lunas are $100,000+ for men (571 | 14.9%) and $75,000 to $99,999 for women (489 | 14.0%).
| Income | Male | Female |
| $2,499 or less | 224 (5.8%) | 218 (6.2%) |
| $2,500 to $4,999 | 66 (1.7%) | 221 (6.3%) |
| $5,000 to $7,499 | 146 (3.8%) | 70 (2.0%) |
| $7,500 to $9,999 | 63 (1.6%) | 113 (3.2%) |
| $10,000 to $12,499 | 165 (4.3%) | 232 (6.7%) |
| $12,500 to $14,999 | 129 (3.4%) | 44 (1.3%) |
| $15,000 to $17,499 | 55 (1.4%) | 99 (2.8%) |
| $17,500 to $19,999 | 137 (3.6%) | 206 (5.9%) |
| $20,000 to $22,499 | 193 (5.0%) | 55 (1.6%) |
| $22,500 to $24,999 | 242 (6.3%) | 108 (3.1%) |
| $25,000 to $29,999 | 180 (4.7%) | 223 (6.4%) |
| $30,000 to $34,999 | 123 (3.2%) | 241 (6.9%) |
| $35,000 to $39,999 | 108 (2.8%) | 135 (3.9%) |
| $40,000 to $44,999 | 198 (5.2%) | 107 (3.1%) |
| $45,000 to $49,999 | 140 (3.6%) | 155 (4.4%) |
| $50,000 to $54,999 | 146 (3.8%) | 63 (1.8%) |
| $55,000 to $64,999 | 323 (8.4%) | 157 (4.5%) |
| $65,000 to $74,999 | 187 (4.9%) | 228 (6.5%) |
| $75,000 to $99,999 | 440 (11.5%) | 489 (14.0%) |
| $100,000+ | 571 (14.9%) | 323 (9.3%) |
| Total | 3,836 (100.0%) | 3,487 (100.0%) |
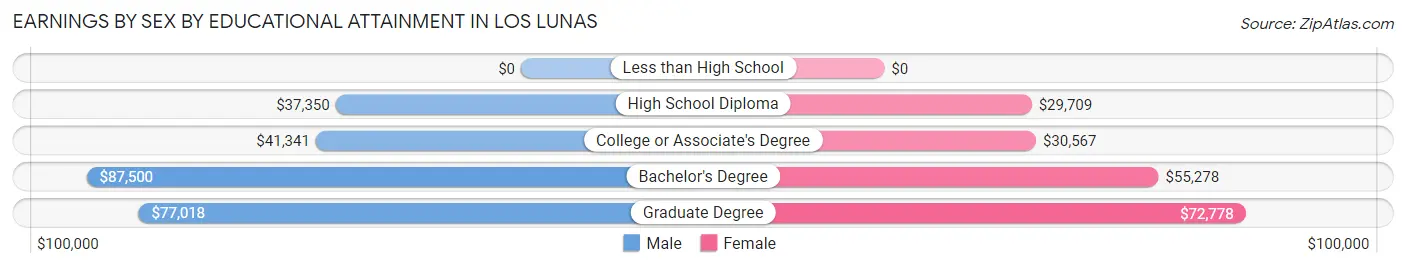
Earnings by Sex by Educational Attainment in Los Lunas
Average earnings in Los Lunas are $51,205 for men and $38,930 for women, a difference of 24.0%. Men with an educational attainment of bachelor's degree enjoy the highest average annual earnings of $87,500, while those with high school diploma education earn the least with $37,350. Women with an educational attainment of graduate degree earn the most with the average annual earnings of $72,778, while those with high school diploma education have the smallest earnings of $29,709.
| Educational Attainment | Male Income | Female Income |
| Less than High School | - | - |
| High School Diploma | $37,350 | $29,709 |
| College or Associate's Degree | $41,341 | $30,567 |
| Bachelor's Degree | $87,500 | $55,278 |
| Graduate Degree | $77,018 | $72,778 |
| Total | $51,205 | $38,930 |
Family Income in Los Lunas
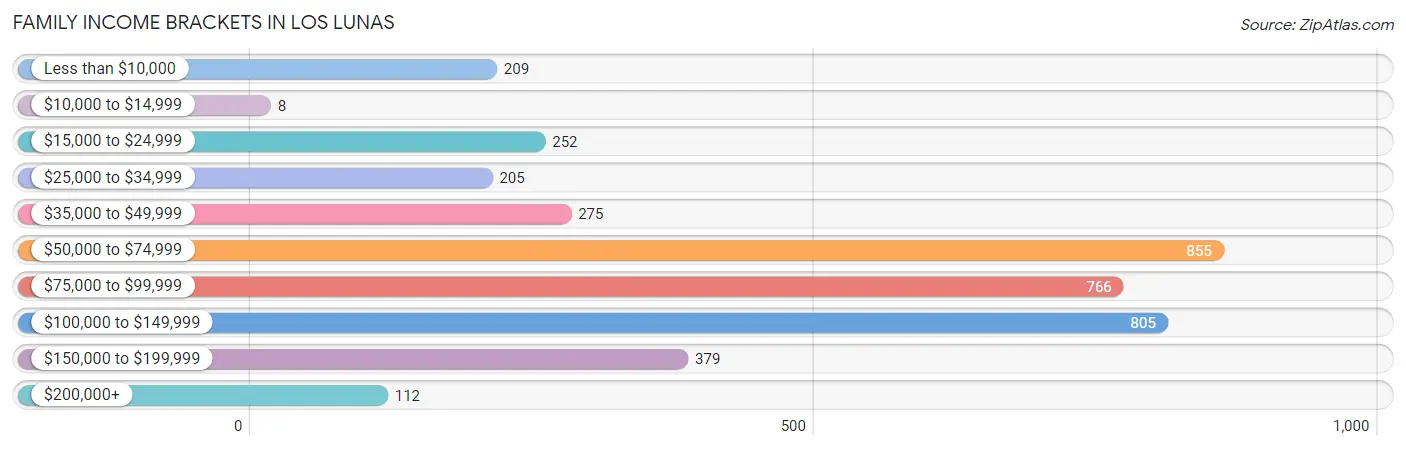
Family Income Brackets in Los Lunas
According to the Los Lunas family income data, there are 855 families falling into the $50,000 to $74,999 income range, which is the most common income bracket and makes up 22.1% of all families. Conversely, the $10,000 to $14,999 income bracket is the least frequent group with only 8 families (0.2%) belonging to this category.
| Income Bracket | # Families | % Families |
| Less than $10,000 | 209 | 5.4% |
| $10,000 to $14,999 | 8 | 0.2% |
| $15,000 to $24,999 | 252 | 6.5% |
| $25,000 to $34,999 | 205 | 5.3% |
| $35,000 to $49,999 | 275 | 7.1% |
| $50,000 to $74,999 | 855 | 22.1% |
| $75,000 to $99,999 | 766 | 19.8% |
| $100,000 to $149,999 | 805 | 20.8% |
| $150,000 to $199,999 | 379 | 9.8% |
| $200,000+ | 112 | 2.9% |
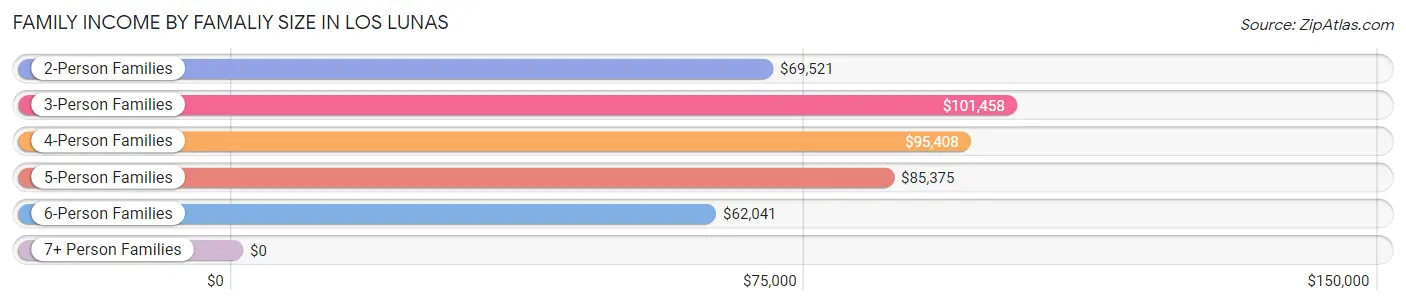
Family Income by Famaliy Size in Los Lunas
3-person families (594 | 15.3%) account for the highest median family income in Los Lunas with $101,458 per family, while 2-person families (1,941 | 50.1%) have the highest median income of $34,760 per family member.
| Income Bracket | # Families | Median Income |
| 2-Person Families | 1,941 (50.1%) | $69,521 |
| 3-Person Families | 594 (15.3%) | $101,458 |
| 4-Person Families | 793 (20.5%) | $95,408 |
| 5-Person Families | 394 (10.2%) | $85,375 |
| 6-Person Families | 106 (2.7%) | $62,041 |
| 7+ Person Families | 43 (1.1%) | $0 |
| Total | 3,871 (100.0%) | $79,857 |
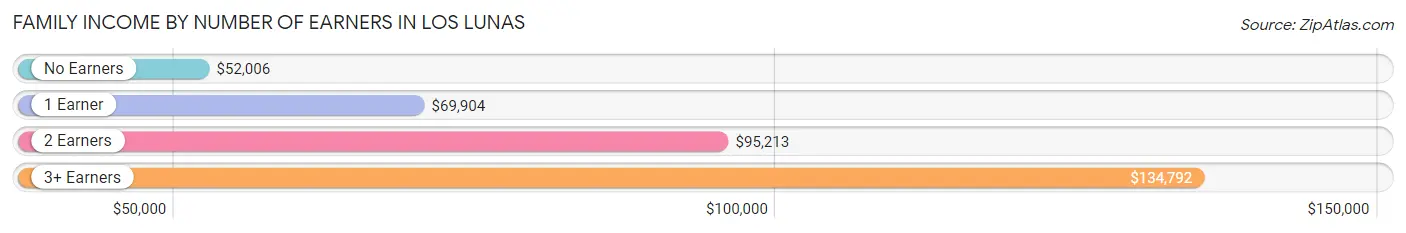
Family Income by Number of Earners in Los Lunas
The median family income in Los Lunas is $79,857, with families comprising 3+ earners (231) having the highest median family income of $134,792, while families with no earners (923) have the lowest median family income of $52,006, accounting for 6.0% and 23.8% of families, respectively.
| Number of Earners | # Families | Median Income |
| No Earners | 923 (23.8%) | $52,006 |
| 1 Earner | 1,493 (38.6%) | $69,904 |
| 2 Earners | 1,224 (31.6%) | $95,213 |
| 3+ Earners | 231 (6.0%) | $134,792 |
| Total | 3,871 (100.0%) | $79,857 |
Household Income in Los Lunas
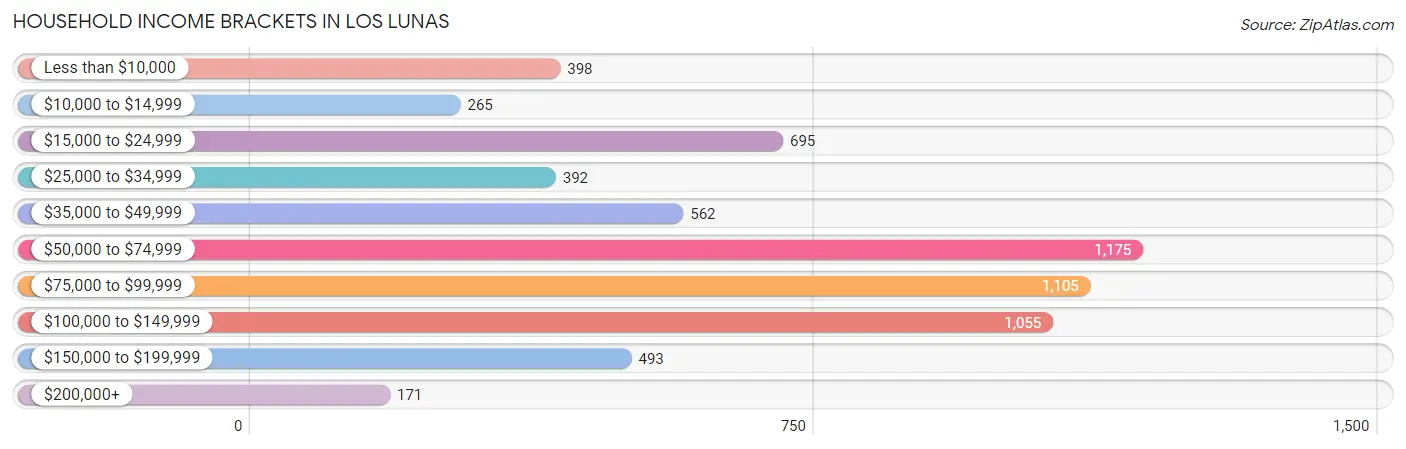
Household Income Brackets in Los Lunas
With 1,175 households falling in the category, the $50,000 to $74,999 income range is the most frequent in Los Lunas, accounting for 18.6% of all households. In contrast, only 171 households (2.7%) fall into the $200,000+ income bracket, making it the least populous group.
| Income Bracket | # Households | % Households |
| Less than $10,000 | 398 | 6.3% |
| $10,000 to $14,999 | 265 | 4.2% |
| $15,000 to $24,999 | 695 | 11.0% |
| $25,000 to $34,999 | 392 | 6.2% |
| $35,000 to $49,999 | 562 | 8.9% |
| $50,000 to $74,999 | 1,175 | 18.6% |
| $75,000 to $99,999 | 1,105 | 17.5% |
| $100,000 to $149,999 | 1,055 | 16.7% |
| $150,000 to $199,999 | 493 | 7.8% |
| $200,000+ | 171 | 2.7% |
Household Income by Householder Age in Los Lunas
The median household income in Los Lunas is $68,934, with the highest median household income of $84,515 found in the 25 to 44 years age bracket for the primary householder. A total of 2,123 households (33.6%) fall into this category. Meanwhile, the 15 to 24 years age bracket for the primary householder has the lowest median household income of $33,804, with 128 households (2.0%) in this group.
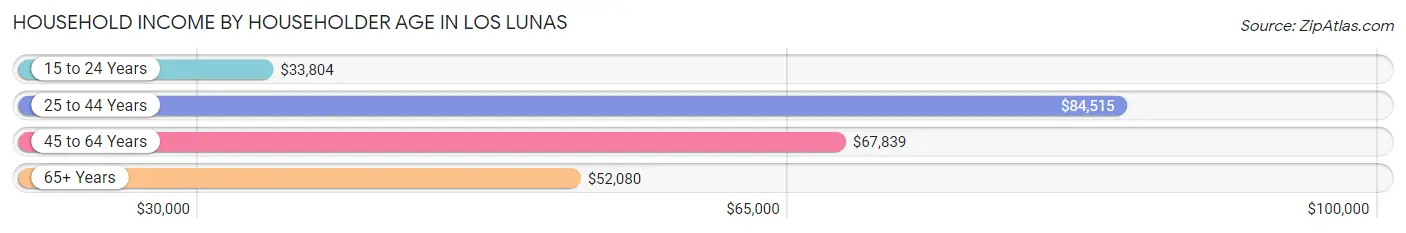
| Income Bracket | # Households | Median Income |
| 15 to 24 Years | 128 (2.0%) | $33,804 |
| 25 to 44 Years | 2,123 (33.6%) | $84,515 |
| 45 to 64 Years | 1,862 (29.5%) | $67,839 |
| 65+ Years | 2,203 (34.9%) | $52,080 |
| Total | 6,316 (100.0%) | $68,934 |
Poverty in Los Lunas
Income Below Poverty by Sex and Age in Los Lunas
With 12.0% poverty level for males and 18.4% for females among the residents of Los Lunas, 15 year old males and 5 year old females are the most vulnerable to poverty, with 32 males (47.8%) and 51 females (29.3%) in their respective age groups living below the poverty level.
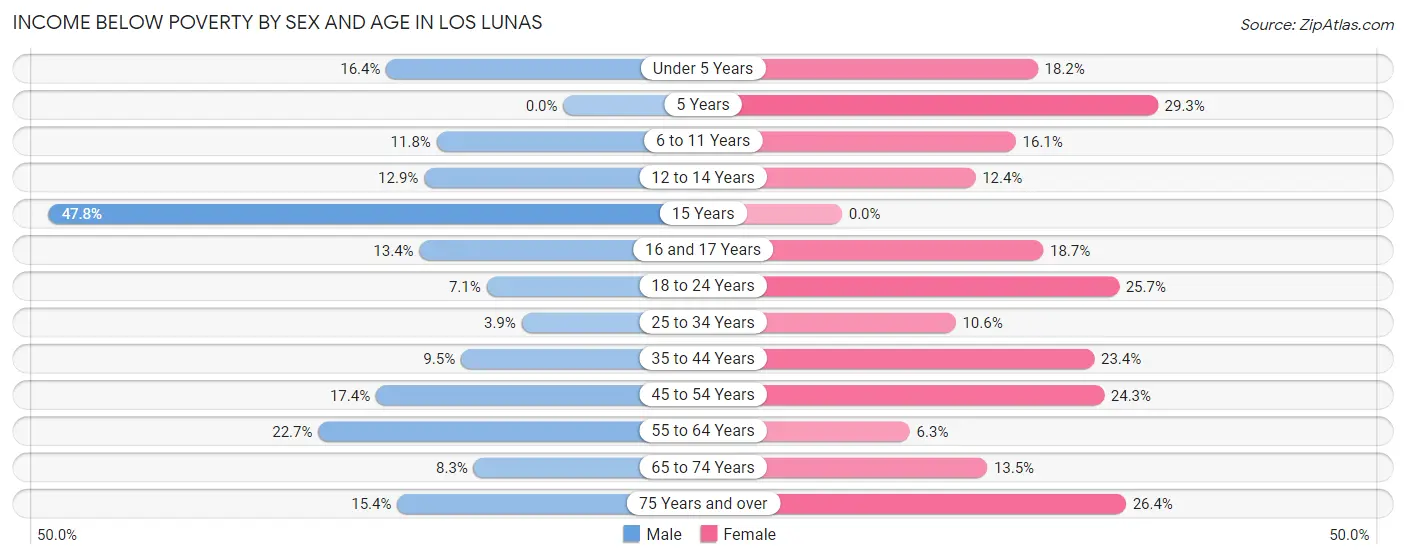
| Age Bracket | Male | Female |
| Under 5 Years | 102 (16.4%) | 107 (18.2%) |
| 5 Years | 0 (0.0%) | 51 (29.3%) |
| 6 to 11 Years | 103 (11.8%) | 75 (16.1%) |
| 12 to 14 Years | 73 (12.9%) | 26 (12.4%) |
| 15 Years | 32 (47.8%) | 0 (0.0%) |
| 16 and 17 Years | 29 (13.4%) | 51 (18.7%) |
| 18 to 24 Years | 51 (7.1%) | 184 (25.7%) |
| 25 to 34 Years | 38 (3.9%) | 90 (10.5%) |
| 35 to 44 Years | 106 (9.5%) | 327 (23.4%) |
| 45 to 54 Years | 161 (17.4%) | 293 (24.3%) |
| 55 to 64 Years | 156 (22.7%) | 41 (6.3%) |
| 65 to 74 Years | 79 (8.3%) | 158 (13.5%) |
| 75 Years and over | 108 (15.4%) | 161 (26.4%) |
| Total | 1,038 (12.0%) | 1,564 (18.4%) |
Income Above Poverty by Sex and Age in Los Lunas
According to the poverty statistics in Los Lunas, males aged 5 years and females aged 15 years are the age groups that are most secure financially, with 100.0% of males and 100.0% of females in these age groups living above the poverty line.
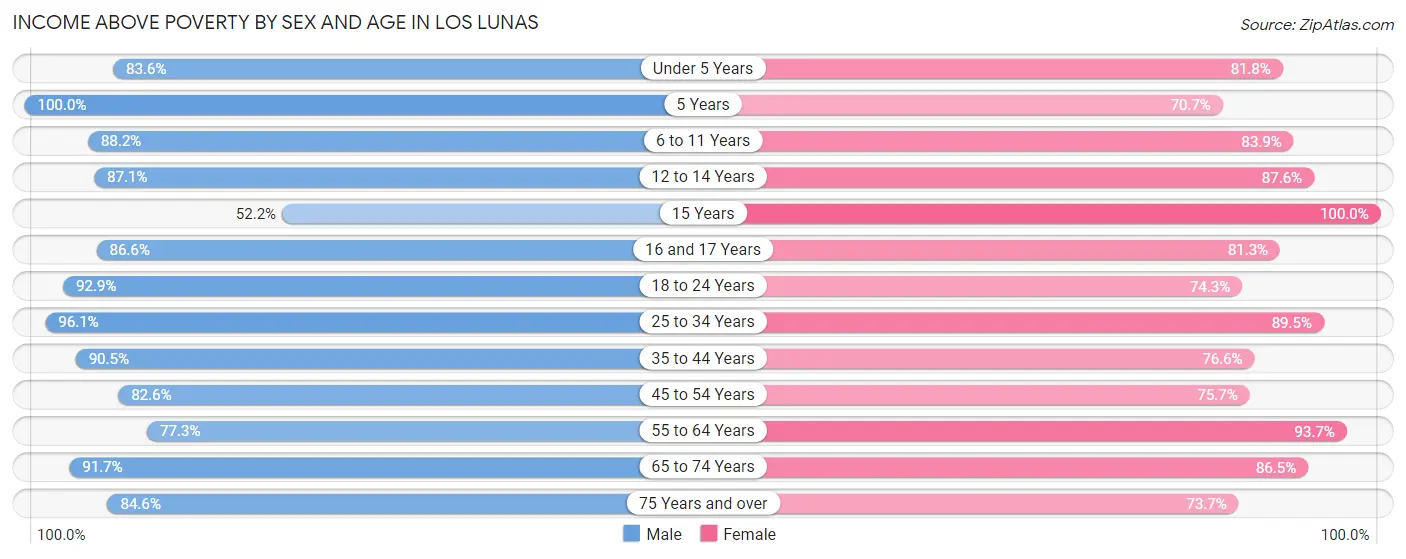
| Age Bracket | Male | Female |
| Under 5 Years | 519 (83.6%) | 482 (81.8%) |
| 5 Years | 232 (100.0%) | 123 (70.7%) |
| 6 to 11 Years | 773 (88.2%) | 390 (83.9%) |
| 12 to 14 Years | 492 (87.1%) | 184 (87.6%) |
| 15 Years | 35 (52.2%) | 195 (100.0%) |
| 16 and 17 Years | 188 (86.6%) | 222 (81.3%) |
| 18 to 24 Years | 664 (92.9%) | 532 (74.3%) |
| 25 to 34 Years | 945 (96.1%) | 763 (89.4%) |
| 35 to 44 Years | 1,010 (90.5%) | 1,070 (76.6%) |
| 45 to 54 Years | 765 (82.6%) | 912 (75.7%) |
| 55 to 64 Years | 530 (77.3%) | 610 (93.7%) |
| 65 to 74 Years | 871 (91.7%) | 1,015 (86.5%) |
| 75 Years and over | 593 (84.6%) | 450 (73.7%) |
| Total | 7,617 (88.0%) | 6,948 (81.6%) |
Income Below Poverty Among Married-Couple Families in Los Lunas
The poverty statistics for married-couple families in Los Lunas show that 6.5% or 170 of the total 2,617 families live below the poverty line. Families with 1 or 2 children have the highest poverty rate of 12.2%, comprising of 104 families. On the other hand, families with no children have the lowest poverty rate of 2.9%, which includes 44 families.
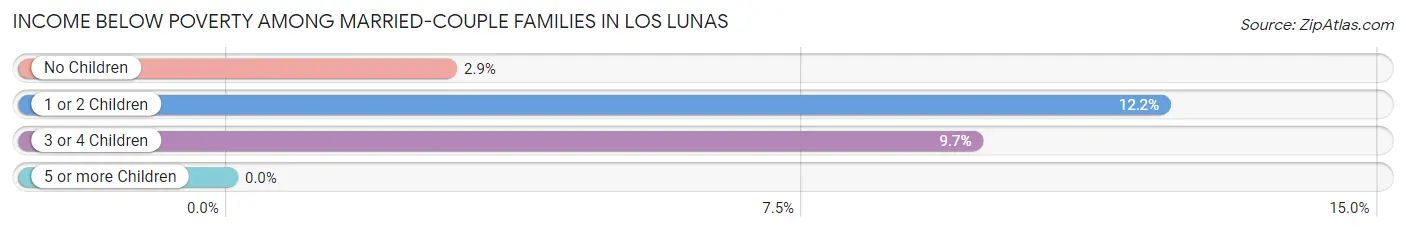
| Children | Above Poverty | Below Poverty |
| No Children | 1,493 (97.1%) | 44 (2.9%) |
| 1 or 2 Children | 750 (87.8%) | 104 (12.2%) |
| 3 or 4 Children | 204 (90.3%) | 22 (9.7%) |
| 5 or more Children | 0 (0.0%) | 0 (0.0%) |
| Total | 2,447 (93.5%) | 170 (6.5%) |
Income Below Poverty Among Single-Parent Households in Los Lunas
According to the poverty data in Los Lunas, 16.0% or 64 single-father households and 18.6% or 159 single-mother households are living below the poverty line. Among single-father households, those with 1 or 2 children have the highest poverty rate, with 45 households (18.3%) experiencing poverty. Likewise, among single-mother households, those with 1 or 2 children have the highest poverty rate, with 73 households (20.4%) falling below the poverty line.
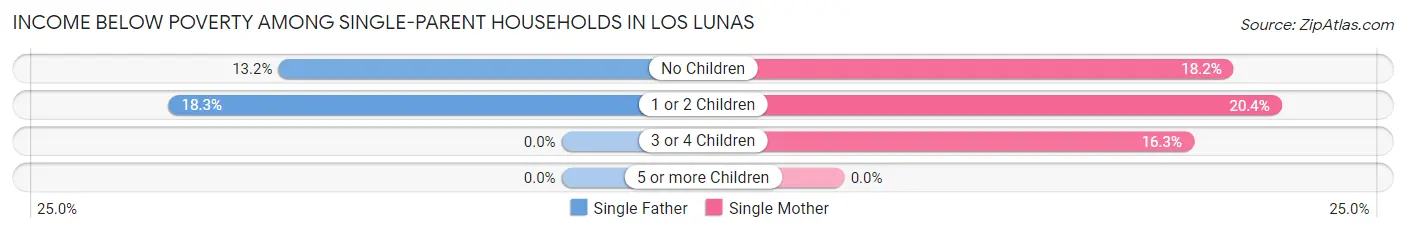
| Children | Single Father | Single Mother |
| No Children | 19 (13.2%) | 49 (18.1%) |
| 1 or 2 Children | 45 (18.3%) | 73 (20.4%) |
| 3 or 4 Children | 0 (0.0%) | 37 (16.3%) |
| 5 or more Children | 0 (0.0%) | 0 (0.0%) |
| Total | 64 (16.0%) | 159 (18.6%) |
Income Below Poverty Among Married-Couple vs Single-Parent Households in Los Lunas
The poverty data for Los Lunas shows that 170 of the married-couple family households (6.5%) and 223 of the single-parent households (17.8%) are living below the poverty level. Within the married-couple family households, those with 1 or 2 children have the highest poverty rate, with 104 households (12.2%) falling below the poverty line. Among the single-parent households, those with 1 or 2 children have the highest poverty rate, with 118 household (19.5%) living below poverty.
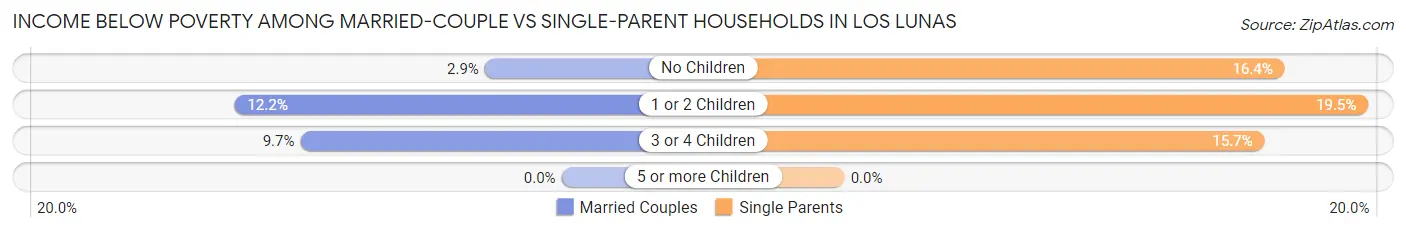
| Children | Married-Couple Families | Single-Parent Households |
| No Children | 44 (2.9%) | 68 (16.4%) |
| 1 or 2 Children | 104 (12.2%) | 118 (19.5%) |
| 3 or 4 Children | 22 (9.7%) | 37 (15.7%) |
| 5 or more Children | 0 (0.0%) | 0 (0.0%) |
| Total | 170 (6.5%) | 223 (17.8%) |
Race in Los Lunas
The most populous races in Los Lunas are White / Caucasian (11,699 | 67.0%), Hispanic or Latino (10,536 | 60.4%), and Two or more Races (3,144 | 18.0%).
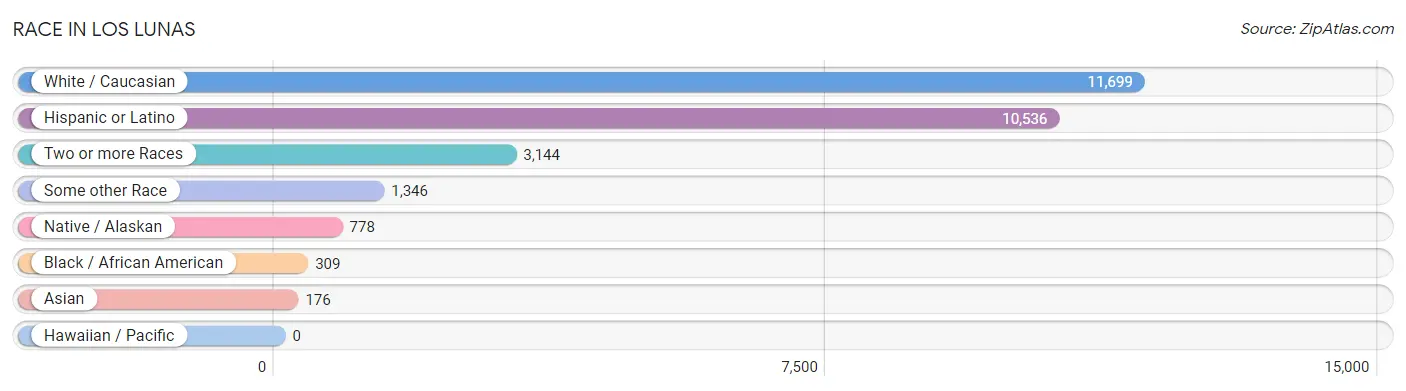
| Race | # Population | % Population |
| Asian | 176 | 1.0% |
| Black / African American | 309 | 1.8% |
| Hawaiian / Pacific | 0 | 0.0% |
| Hispanic or Latino | 10,536 | 60.4% |
| Native / Alaskan | 778 | 4.5% |
| White / Caucasian | 11,699 | 67.0% |
| Two or more Races | 3,144 | 18.0% |
| Some other Race | 1,346 | 7.7% |
| Total | 17,452 | 100.0% |
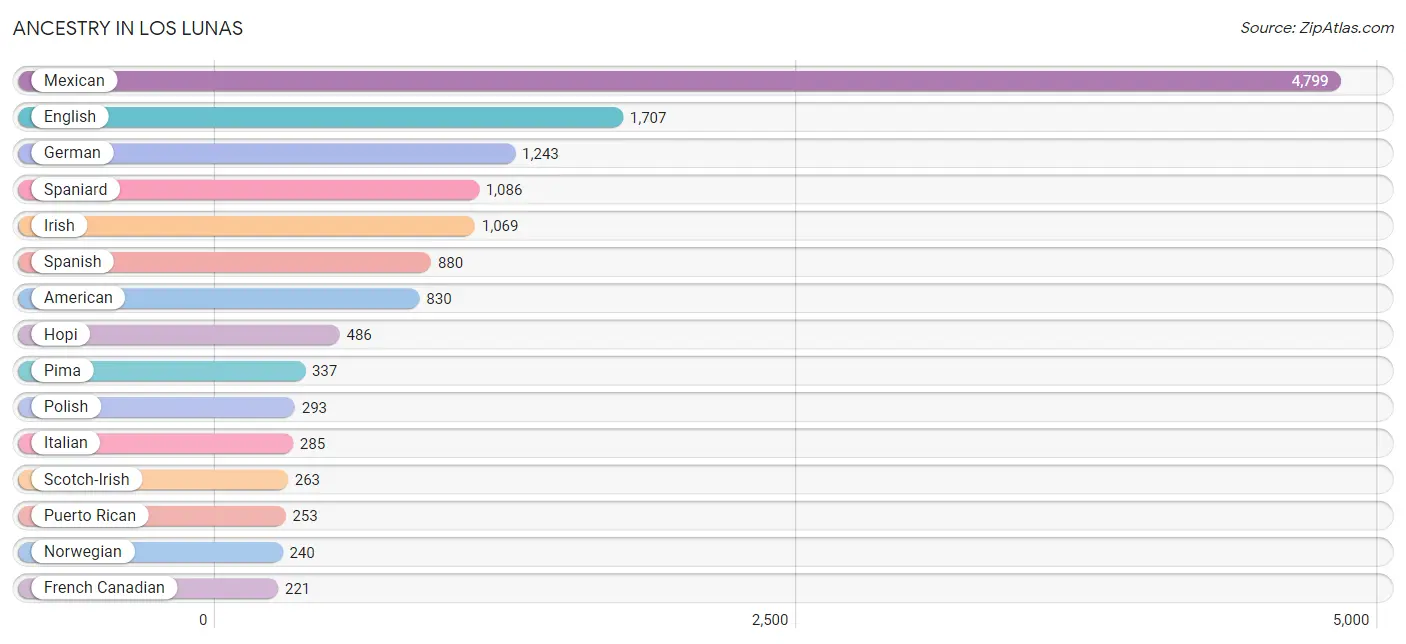
Ancestry in Los Lunas
The most populous ancestries reported in Los Lunas are Mexican (4,799 | 27.5%), English (1,707 | 9.8%), German (1,243 | 7.1%), Spaniard (1,086 | 6.2%), and Irish (1,069 | 6.1%), together accounting for 56.8% of all Los Lunas residents.
| Ancestry | # Population | % Population |
| Afghan | 39 | 0.2% |
| African | 162 | 0.9% |
| American | 830 | 4.8% |
| Austrian | 16 | 0.1% |
| Bhutanese | 80 | 0.5% |
| Bolivian | 68 | 0.4% |
| British | 5 | 0.0% |
| Burmese | 30 | 0.2% |
| Canadian | 7 | 0.0% |
| Celtic | 23 | 0.1% |
| Cherokee | 50 | 0.3% |
| Cheyenne | 1 | 0.0% |
| Chickasaw | 98 | 0.6% |
| Choctaw | 103 | 0.6% |
| Creek | 37 | 0.2% |
| Croatian | 17 | 0.1% |
| Cuban | 95 | 0.5% |
| Danish | 18 | 0.1% |
| Dutch | 56 | 0.3% |
| Eastern European | 21 | 0.1% |
| English | 1,707 | 9.8% |
| European | 96 | 0.5% |
| Finnish | 10 | 0.1% |
| French | 61 | 0.4% |
| French Canadian | 221 | 1.3% |
| German | 1,243 | 7.1% |
| Greek | 22 | 0.1% |
| Hopi | 486 | 2.8% |
| Hungarian | 26 | 0.2% |
| Indian (Asian) | 43 | 0.3% |
| Iranian | 56 | 0.3% |
| Irish | 1,069 | 6.1% |
| Italian | 285 | 1.6% |
| Korean | 38 | 0.2% |
| Lithuanian | 22 | 0.1% |
| Mexican | 4,799 | 27.5% |
| Native Hawaiian | 21 | 0.1% |
| Navajo | 215 | 1.2% |
| Northern European | 13 | 0.1% |
| Norwegian | 240 | 1.4% |
| Pakistani | 12 | 0.1% |
| Peruvian | 46 | 0.3% |
| Pima | 337 | 1.9% |
| Polish | 293 | 1.7% |
| Portuguese | 11 | 0.1% |
| Pueblo | 72 | 0.4% |
| Puerto Rican | 253 | 1.5% |
| Russian | 5 | 0.0% |
| Scotch-Irish | 263 | 1.5% |
| Scottish | 94 | 0.5% |
| South American | 138 | 0.8% |
| Spaniard | 1,086 | 6.2% |
| Spanish | 880 | 5.0% |
| Spanish American | 55 | 0.3% |
| Subsaharan African | 162 | 0.9% |
| Swedish | 167 | 1.0% |
| Ukrainian | 27 | 0.2% |
| Venezuelan | 24 | 0.1% |
| Welsh | 55 | 0.3% | View All 59 Rows |
Immigrants in Los Lunas
The most numerous immigrant groups reported in Los Lunas came from Latin America (450 | 2.6%), Central America (417 | 2.4%), Mexico (417 | 2.4%), Africa (162 | 0.9%), and Asia (136 | 0.8%), together accounting for 9.1% of all Los Lunas residents.
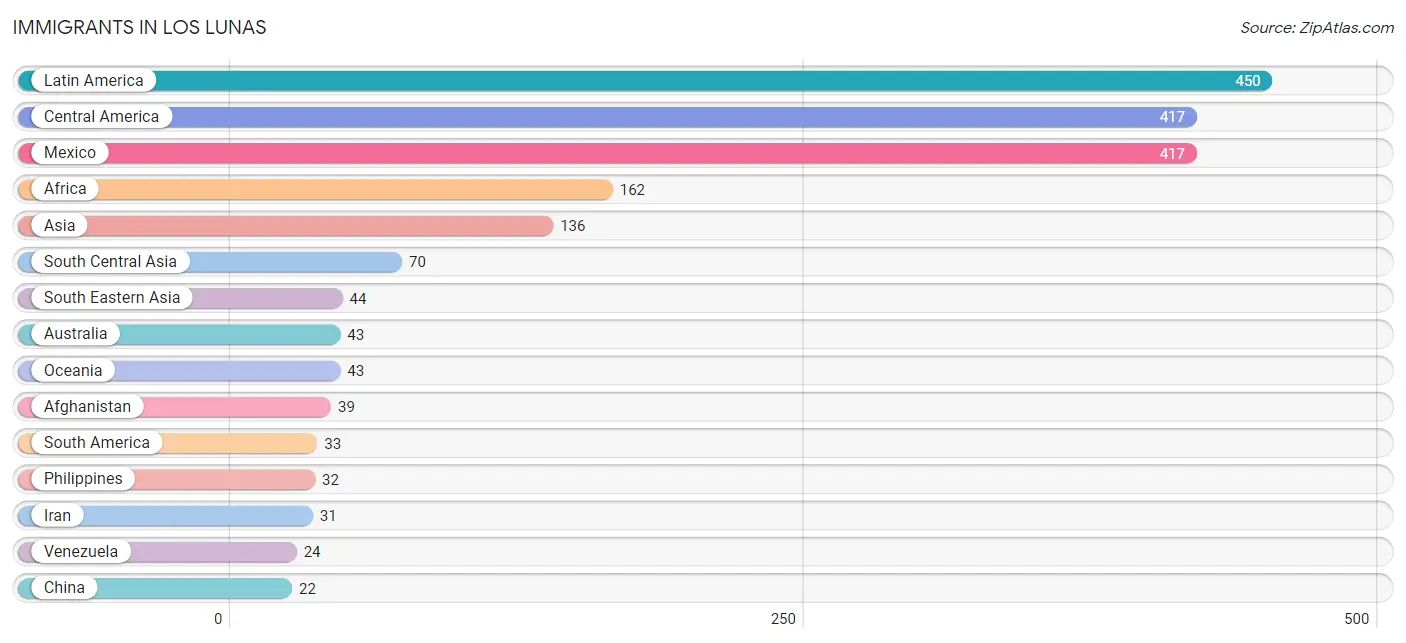
| Immigration Origin | # Population | % Population |
| Afghanistan | 39 | 0.2% |
| Africa | 162 | 0.9% |
| Asia | 136 | 0.8% |
| Australia | 43 | 0.3% |
| Bolivia | 9 | 0.1% |
| Canada | 10 | 0.1% |
| Central America | 417 | 2.4% |
| China | 22 | 0.1% |
| Eastern Asia | 22 | 0.1% |
| Eastern Europe | 5 | 0.0% |
| Europe | 5 | 0.0% |
| Iran | 31 | 0.2% |
| Latin America | 450 | 2.6% |
| Mexico | 417 | 2.4% |
| Oceania | 43 | 0.3% |
| Philippines | 32 | 0.2% |
| Poland | 5 | 0.0% |
| South America | 33 | 0.2% |
| South Central Asia | 70 | 0.4% |
| South Eastern Asia | 44 | 0.3% |
| Thailand | 12 | 0.1% |
| Venezuela | 24 | 0.1% | View All 22 Rows |
Sex and Age in Los Lunas
Sex and Age in Los Lunas
The most populous age groups in Los Lunas are 10 to 14 Years (928 | 10.5%) for men and 35 to 39 Years (784 | 9.1%) for women.
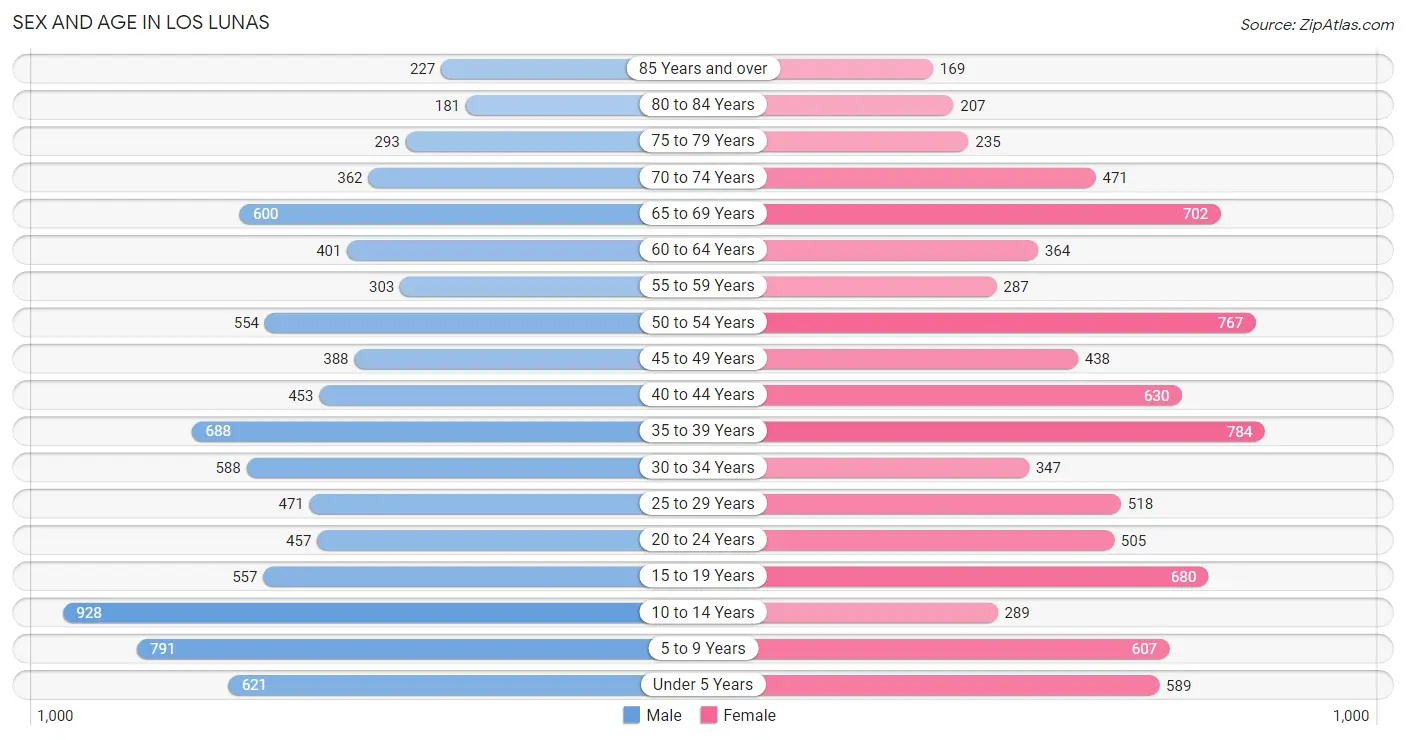
| Age Bracket | Male | Female |
| Under 5 Years | 621 (7.0%) | 589 (6.9%) |
| 5 to 9 Years | 791 (8.9%) | 607 (7.1%) |
| 10 to 14 Years | 928 (10.5%) | 289 (3.4%) |
| 15 to 19 Years | 557 (6.3%) | 680 (7.9%) |
| 20 to 24 Years | 457 (5.2%) | 505 (5.9%) |
| 25 to 29 Years | 471 (5.3%) | 518 (6.0%) |
| 30 to 34 Years | 588 (6.6%) | 347 (4.0%) |
| 35 to 39 Years | 688 (7.8%) | 784 (9.1%) |
| 40 to 44 Years | 453 (5.1%) | 630 (7.3%) |
| 45 to 49 Years | 388 (4.4%) | 438 (5.1%) |
| 50 to 54 Years | 554 (6.2%) | 767 (8.9%) |
| 55 to 59 Years | 303 (3.4%) | 287 (3.3%) |
| 60 to 64 Years | 401 (4.5%) | 364 (4.2%) |
| 65 to 69 Years | 600 (6.8%) | 702 (8.2%) |
| 70 to 74 Years | 362 (4.1%) | 471 (5.5%) |
| 75 to 79 Years | 293 (3.3%) | 235 (2.7%) |
| 80 to 84 Years | 181 (2.0%) | 207 (2.4%) |
| 85 Years and over | 227 (2.6%) | 169 (2.0%) |
| Total | 8,863 (100.0%) | 8,589 (100.0%) |
Families and Households in Los Lunas
Median Family Size in Los Lunas
The median family size in Los Lunas is 3.55 persons per family, with single female/mother families (855 | 22.1%) accounting for the largest median family size of 4.6 persons per family. On the other hand, single male/father families (399 | 10.3%) represent the smallest median family size with 2.90 persons per family.
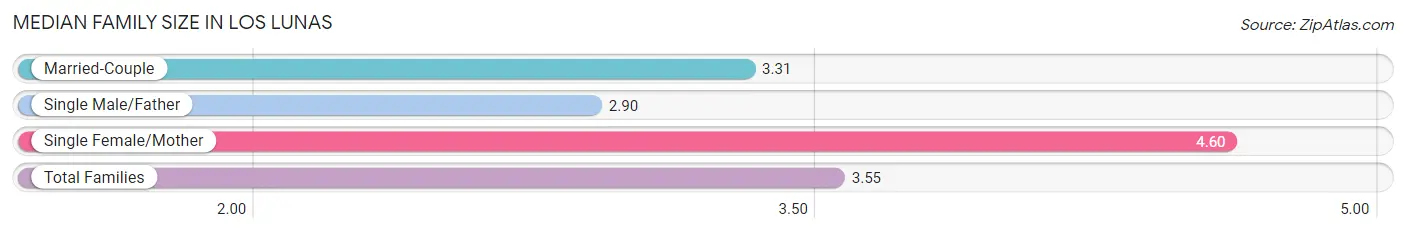
| Family Type | # Families | Family Size |
| Married-Couple | 2,617 (67.6%) | 3.31 |
| Single Male/Father | 399 (10.3%) | 2.90 |
| Single Female/Mother | 855 (22.1%) | 4.60 |
| Total Families | 3,871 (100.0%) | 3.55 |
Median Household Size in Los Lunas
The median household size in Los Lunas is 2.73 persons per household, with single female/mother households (855 | 13.5%) accounting for the largest median household size of 4.85 persons per household. non-family households (2,445 | 38.7%) represent the smallest median household size with 1.16 persons per household.
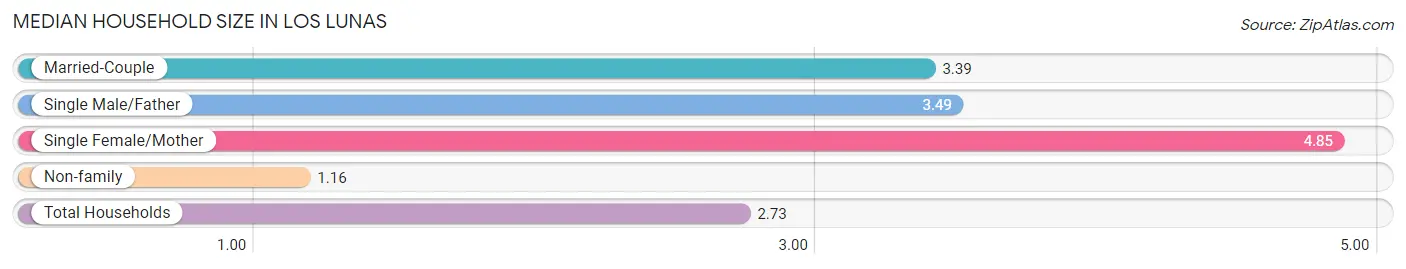
| Household Type | # Households | Household Size |
| Married-Couple | 2,617 (41.4%) | 3.39 |
| Single Male/Father | 399 (6.3%) | 3.49 |
| Single Female/Mother | 855 (13.5%) | 4.85 |
| Non-family | 2,445 (38.7%) | 1.16 |
| Total Households | 6,316 (100.0%) | 2.73 |
Household Size by Marriage Status in Los Lunas
Out of a total of 6,316 households in Los Lunas, 3,871 (61.3%) are family households, while 2,445 (38.7%) are nonfamily households. The most numerous type of family households are 2-person households, comprising 1,693, and the most common type of nonfamily households are 1-person households, comprising 2,180.
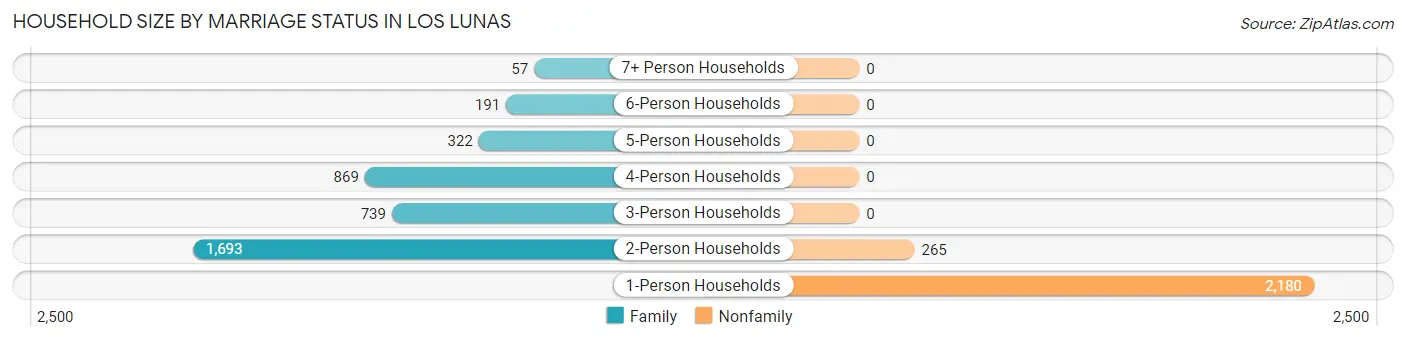
| Household Size | Family Households | Nonfamily Households |
| 1-Person Households | - | 2,180 (34.5%) |
| 2-Person Households | 1,693 (26.8%) | 265 (4.2%) |
| 3-Person Households | 739 (11.7%) | 0 (0.0%) |
| 4-Person Households | 869 (13.8%) | 0 (0.0%) |
| 5-Person Households | 322 (5.1%) | 0 (0.0%) |
| 6-Person Households | 191 (3.0%) | 0 (0.0%) |
| 7+ Person Households | 57 (0.9%) | 0 (0.0%) |
| Total | 3,871 (61.3%) | 2,445 (38.7%) |
Female Fertility in Los Lunas
Fertility by Age in Los Lunas
Average fertility rate in Los Lunas is 90.0 births per 1,000 women. Women in the age bracket of 20 to 34 years have the highest fertility rate with 146.0 births per 1,000 women. Women in the age bracket of 20 to 34 years acount for 53.8% of all women with births.
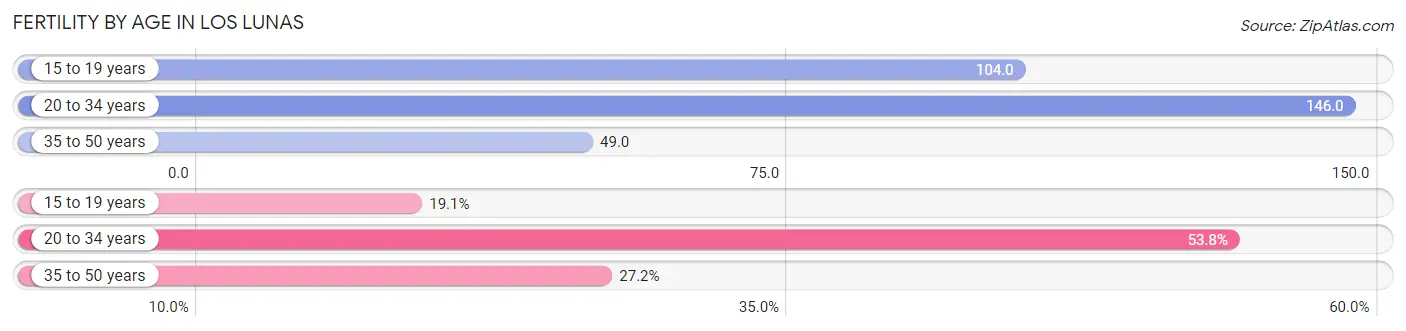
| Age Bracket | Women with Births | Births / 1,000 Women |
| 15 to 19 years | 71 (19.1%) | 104.0 |
| 20 to 34 years | 200 (53.8%) | 146.0 |
| 35 to 50 years | 101 (27.2%) | 49.0 |
| Total | 372 (100.0%) | 90.0 |
Fertility by Age by Marriage Status in Los Lunas
29.6% of women with births (372) in Los Lunas are married. The highest percentage of unmarried women with births falls into 15 to 19 years age bracket with 100.0% of them unmarried at the time of birth, while the lowest percentage of unmarried women with births belong to 35 to 50 years age bracket with 54.5% of them unmarried.
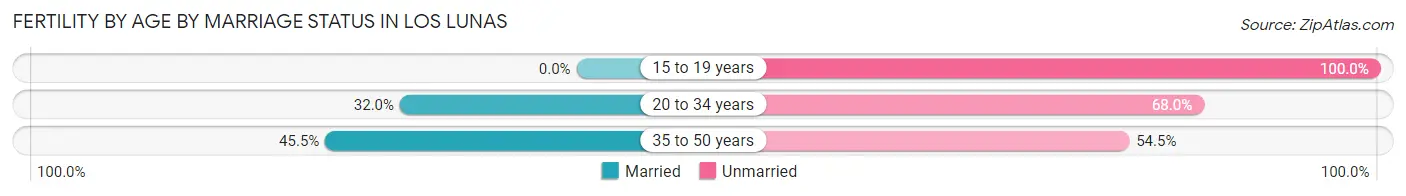
| Age Bracket | Married | Unmarried |
| 15 to 19 years | 0 (0.0%) | 71 (100.0%) |
| 20 to 34 years | 64 (32.0%) | 136 (68.0%) |
| 35 to 50 years | 46 (45.5%) | 55 (54.5%) |
| Total | 110 (29.6%) | 262 (70.4%) |
Fertility by Education in Los Lunas
Average fertility rate in Los Lunas is 90.0 births per 1,000 women. Women with the education attainment of college or associate's degree have the highest fertility rate of 154.0 births per 1,000 women, while women with the education attainment of less than high school have the lowest fertility at 25.0 births per 1,000 women. Women with the education attainment of college or associate's degree represent 68.3% of all women with births.
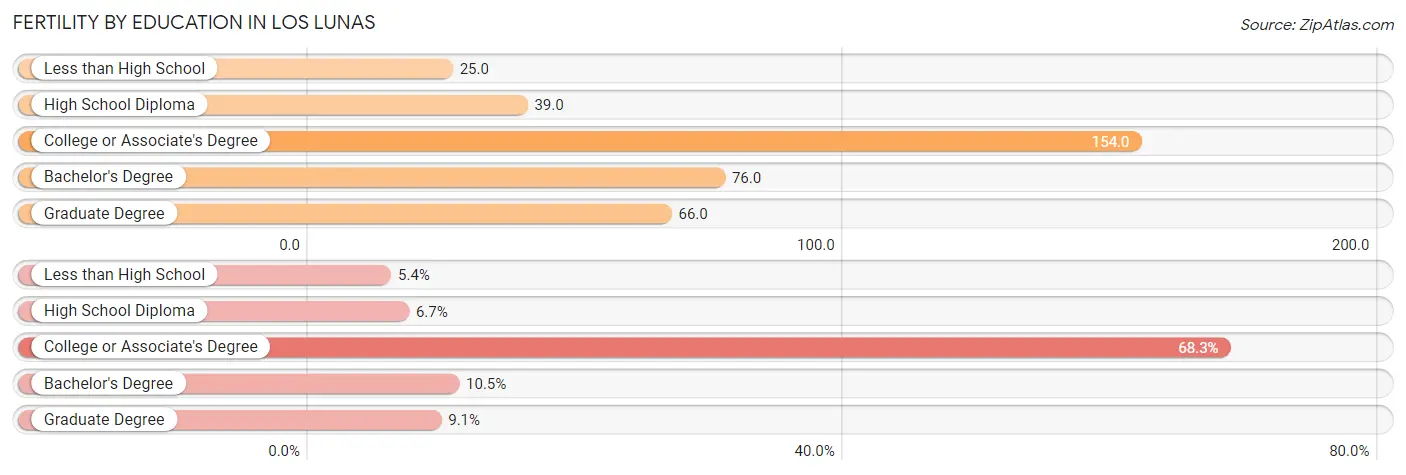
| Educational Attainment | Women with Births | Births / 1,000 Women |
| Less than High School | 20 (5.4%) | 25.0 |
| High School Diploma | 25 (6.7%) | 39.0 |
| College or Associate's Degree | 254 (68.3%) | 154.0 |
| Bachelor's Degree | 39 (10.5%) | 76.0 |
| Graduate Degree | 34 (9.1%) | 66.0 |
| Total | 372 (100.0%) | 90.0 |
Fertility by Education by Marriage Status in Los Lunas
70.4% of women with births in Los Lunas are unmarried. Women with the educational attainment of less than high school are most likely to be married with 100.0% of them married at childbirth, while women with the educational attainment of high school diploma are least likely to be married with 100.0% of them unmarried at childbirth.
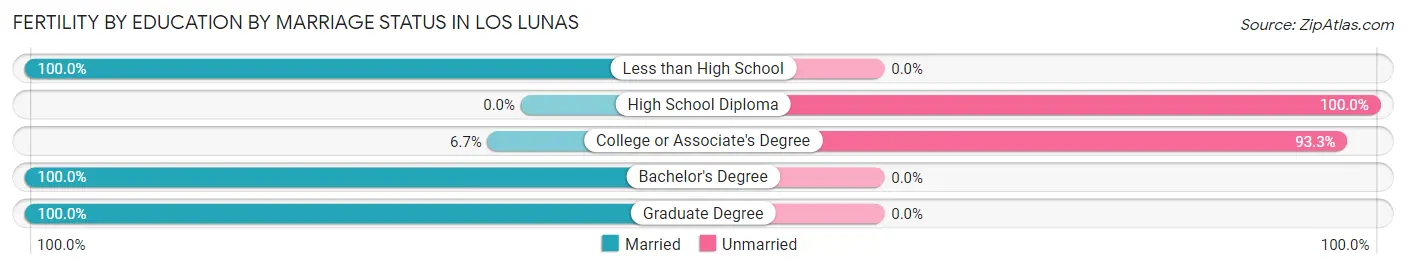
| Educational Attainment | Married | Unmarried |
| Less than High School | 20 (100.0%) | 0 (0.0%) |
| High School Diploma | 0 (0.0%) | 25 (100.0%) |
| College or Associate's Degree | 17 (6.7%) | 237 (93.3%) |
| Bachelor's Degree | 39 (100.0%) | 0 (0.0%) |
| Graduate Degree | 34 (100.0%) | 0 (0.0%) |
| Total | 110 (29.6%) | 262 (70.4%) |
Employment Characteristics in Los Lunas
Employment by Class of Employer in Los Lunas
Among the 6,498 employed individuals in Los Lunas, private company employees (3,833 | 59.0%), local government employees (749 | 11.5%), and state government employees (708 | 10.9%) make up the most common classes of employment.
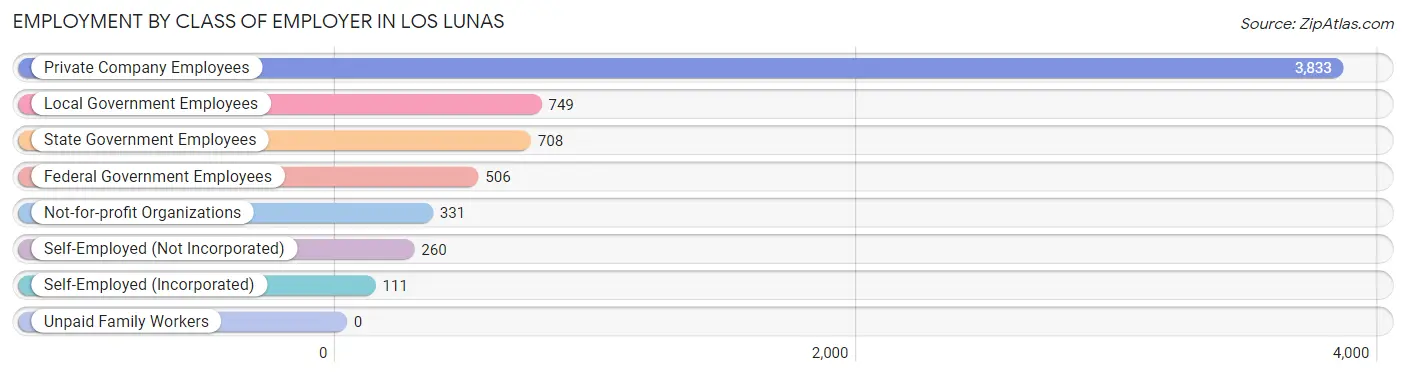
| Employer Class | # Employees | % Employees |
| Private Company Employees | 3,833 | 59.0% |
| Self-Employed (Incorporated) | 111 | 1.7% |
| Self-Employed (Not Incorporated) | 260 | 4.0% |
| Not-for-profit Organizations | 331 | 5.1% |
| Local Government Employees | 749 | 11.5% |
| State Government Employees | 708 | 10.9% |
| Federal Government Employees | 506 | 7.8% |
| Unpaid Family Workers | 0 | 0.0% |
| Total | 6,498 | 100.0% |
Employment Status by Age in Los Lunas
According to the labor force statistics for Los Lunas, out of the total population over 16 years of age (13,365), 51.7% or 6,910 individuals are in the labor force, with 5.3% or 366 of them unemployed. The age group with the highest labor force participation rate is 25 to 29 years, with 82.8% or 819 individuals in the labor force. Within the labor force, the 30 to 34 years age range has the highest percentage of unemployed individuals, with 16.4% or 104 of them being unemployed.
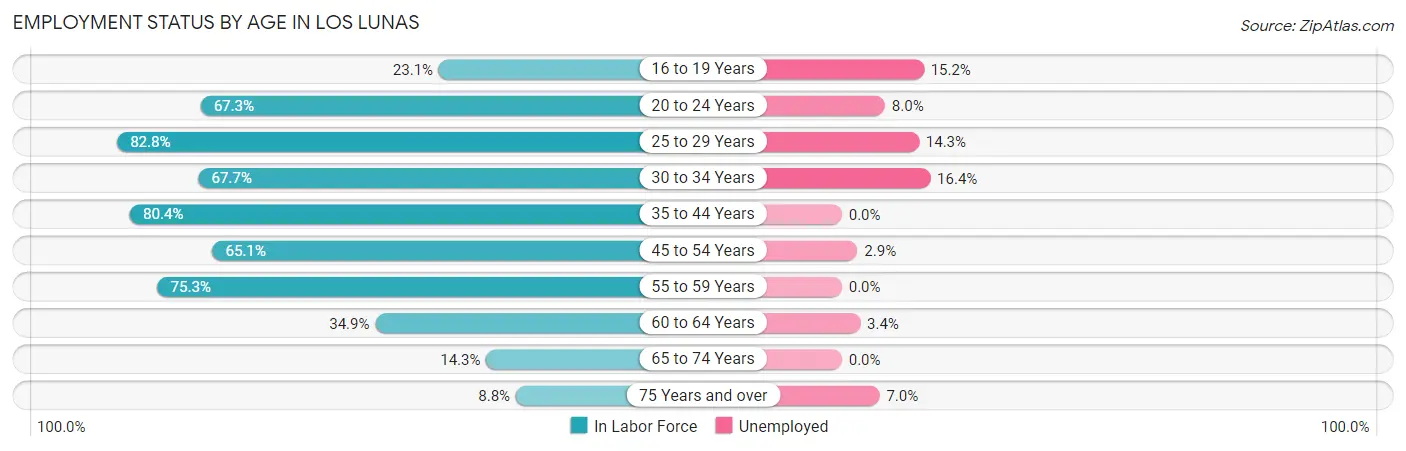
| Age Bracket | In Labor Force | Unemployed |
| 16 to 19 Years | 225 (23.1%) | 34 (15.2%) |
| 20 to 24 Years | 647 (67.3%) | 52 (8.0%) |
| 25 to 29 Years | 819 (82.8%) | 117 (14.3%) |
| 30 to 34 Years | 633 (67.7%) | 104 (16.4%) |
| 35 to 44 Years | 2,054 (80.4%) | 0 (0.0%) |
| 45 to 54 Years | 1,398 (65.1%) | 41 (2.9%) |
| 55 to 59 Years | 444 (75.3%) | 0 (0.0%) |
| 60 to 64 Years | 267 (34.9%) | 9 (3.4%) |
| 65 to 74 Years | 305 (14.3%) | 0 (0.0%) |
| 75 Years and over | 115 (8.8%) | 8 (7.0%) |
| Total | 6,910 (51.7%) | 366 (5.3%) |
Employment Status by Educational Attainment in Los Lunas
According to labor force statistics for Los Lunas, 70.3% of individuals (5,611) out of the total population between 25 and 64 years of age (7,981) are in the labor force, with 4.8% or 269 of them being unemployed. The group with the highest labor force participation rate are those with the educational attainment of bachelor's degree or higher, with 84.0% or 1,809 individuals in the labor force. Within the labor force, individuals with less than high school education have the highest percentage of unemployment, with 18.7% or 83 of them being unemployed.
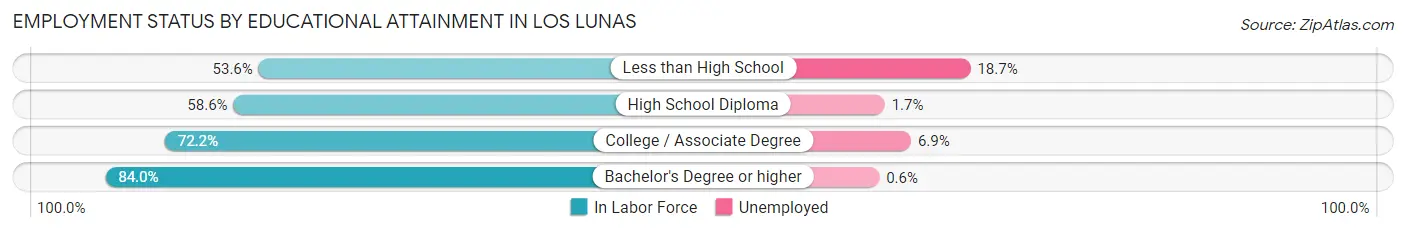
| Educational Attainment | In Labor Force | Unemployed |
| Less than High School | 443 (53.6%) | 155 (18.7%) |
| High School Diploma | 1,062 (58.6%) | 31 (1.7%) |
| College / Associate Degree | 2,302 (72.2%) | 220 (6.9%) |
| Bachelor's Degree or higher | 1,809 (84.0%) | 13 (0.6%) |
| Total | 5,611 (70.3%) | 383 (4.8%) |
Employment Occupations by Sex in Los Lunas
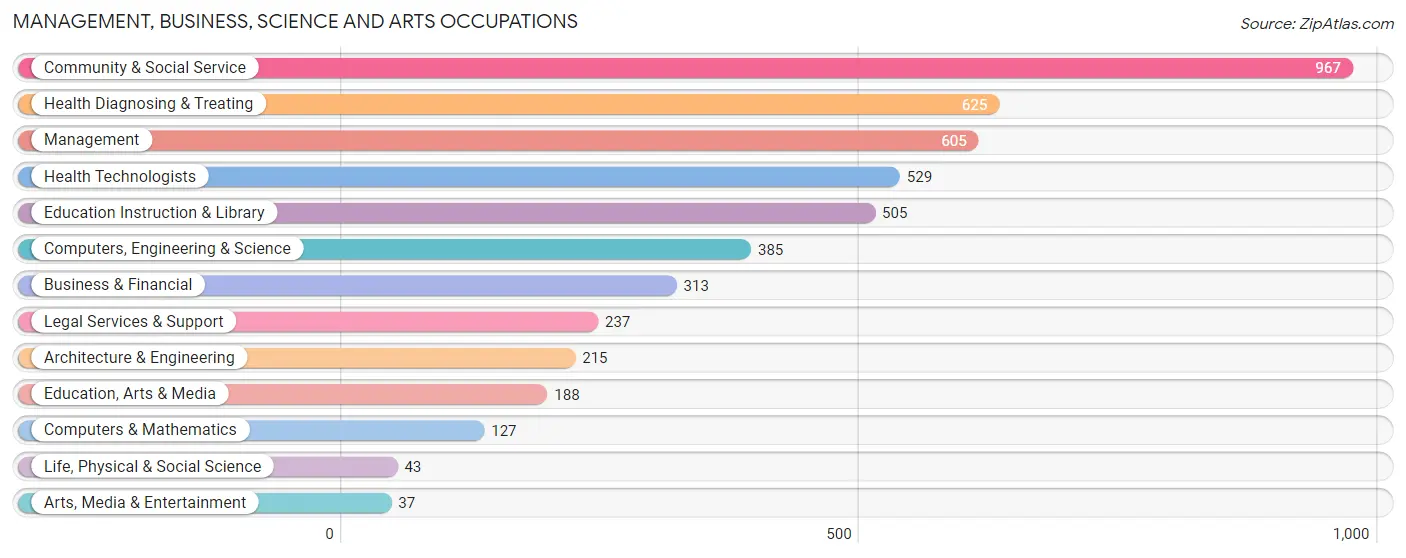
Management, Business, Science and Arts Occupations
The most common Management, Business, Science and Arts occupations in Los Lunas are Community & Social Service (967 | 14.9%), Health Diagnosing & Treating (625 | 9.6%), Management (605 | 9.3%), Health Technologists (529 | 8.1%), and Education Instruction & Library (505 | 7.8%).
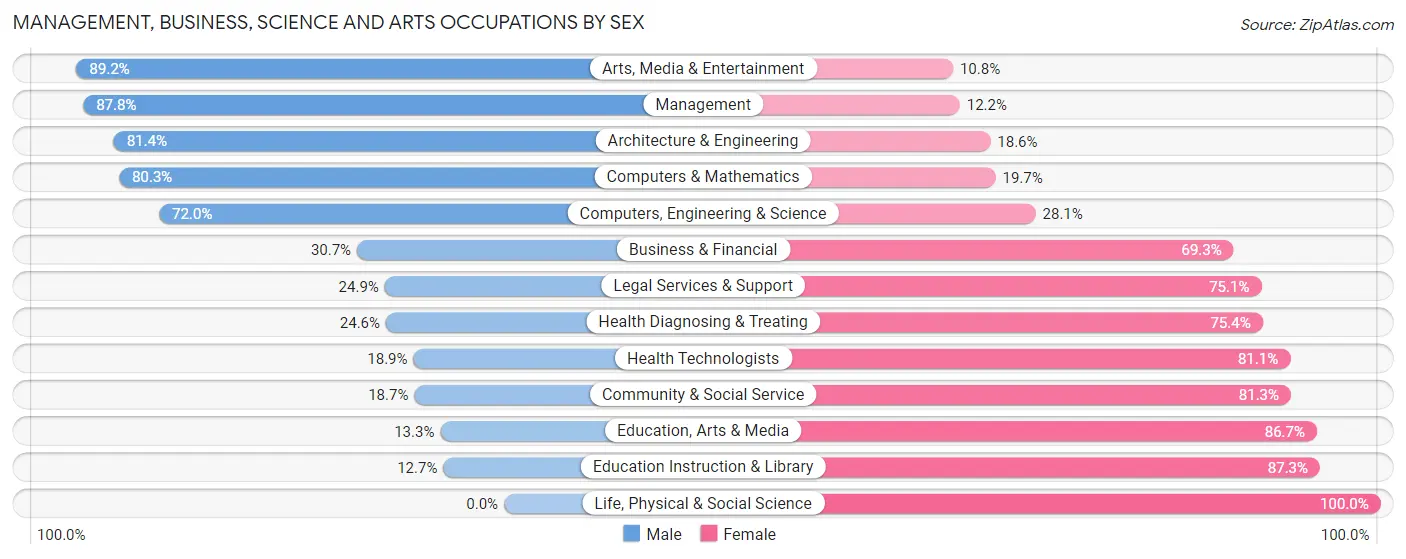
Management, Business, Science and Arts Occupations by Sex
Within the Management, Business, Science and Arts occupations in Los Lunas, the most male-oriented occupations are Arts, Media & Entertainment (89.2%), Management (87.8%), and Architecture & Engineering (81.4%), while the most female-oriented occupations are Life, Physical & Social Science (100.0%), Education Instruction & Library (87.3%), and Education, Arts & Media (86.7%).
| Occupation | Male | Female |
| Management | 531 (87.8%) | 74 (12.2%) |
| Business & Financial | 96 (30.7%) | 217 (69.3%) |
| Computers, Engineering & Science | 277 (72.0%) | 108 (28.1%) |
| Computers & Mathematics | 102 (80.3%) | 25 (19.7%) |
| Architecture & Engineering | 175 (81.4%) | 40 (18.6%) |
| Life, Physical & Social Science | 0 (0.0%) | 43 (100.0%) |
| Community & Social Service | 181 (18.7%) | 786 (81.3%) |
| Education, Arts & Media | 25 (13.3%) | 163 (86.7%) |
| Legal Services & Support | 59 (24.9%) | 178 (75.1%) |
| Education Instruction & Library | 64 (12.7%) | 441 (87.3%) |
| Arts, Media & Entertainment | 33 (89.2%) | 4 (10.8%) |
| Health Diagnosing & Treating | 154 (24.6%) | 471 (75.4%) |
| Health Technologists | 100 (18.9%) | 429 (81.1%) |
| Total (Category) | 1,239 (42.8%) | 1,656 (57.2%) |
| Total (Overall) | 3,375 (51.9%) | 3,123 (48.1%) |
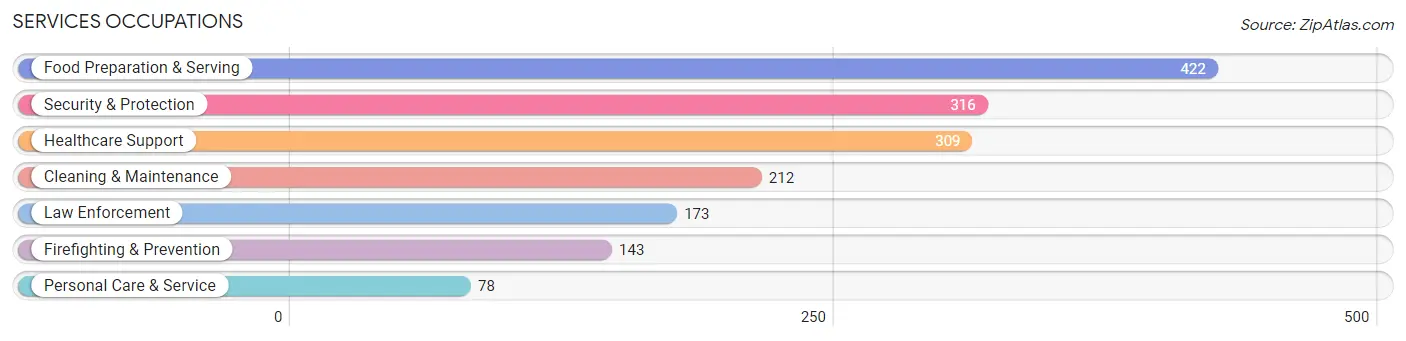
Services Occupations
The most common Services occupations in Los Lunas are Food Preparation & Serving (422 | 6.5%), Security & Protection (316 | 4.9%), Healthcare Support (309 | 4.8%), Cleaning & Maintenance (212 | 3.3%), and Law Enforcement (173 | 2.7%).
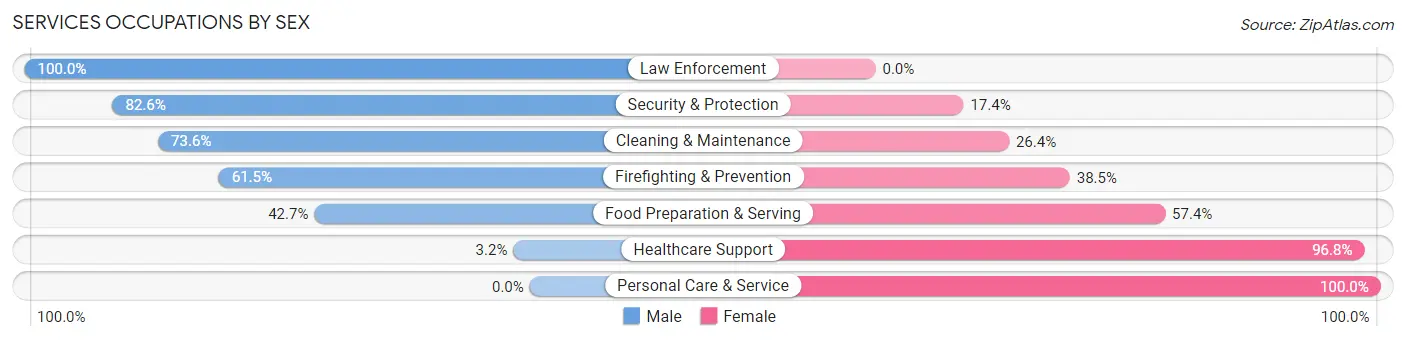
Services Occupations by Sex
Within the Services occupations in Los Lunas, the most male-oriented occupations are Law Enforcement (100.0%), Security & Protection (82.6%), and Cleaning & Maintenance (73.6%), while the most female-oriented occupations are Personal Care & Service (100.0%), Healthcare Support (96.8%), and Food Preparation & Serving (57.4%).
| Occupation | Male | Female |
| Healthcare Support | 10 (3.2%) | 299 (96.8%) |
| Security & Protection | 261 (82.6%) | 55 (17.4%) |
| Firefighting & Prevention | 88 (61.5%) | 55 (38.5%) |
| Law Enforcement | 173 (100.0%) | 0 (0.0%) |
| Food Preparation & Serving | 180 (42.6%) | 242 (57.4%) |
| Cleaning & Maintenance | 156 (73.6%) | 56 (26.4%) |
| Personal Care & Service | 0 (0.0%) | 78 (100.0%) |
| Total (Category) | 607 (45.4%) | 730 (54.6%) |
| Total (Overall) | 3,375 (51.9%) | 3,123 (48.1%) |
Sales and Office Occupations
The most common Sales and Office occupations in Los Lunas are Office & Administration (710 | 10.9%), and Sales & Related (354 | 5.4%).
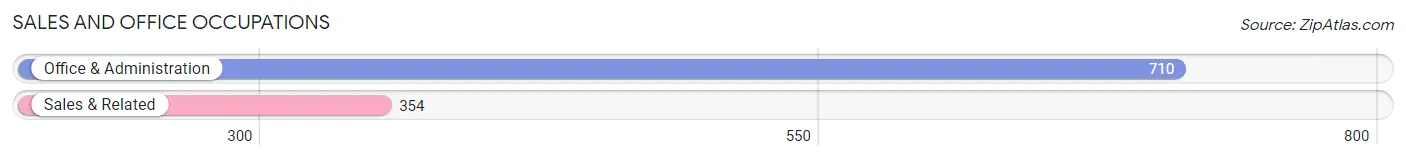
Sales and Office Occupations by Sex

| Occupation | Male | Female |
| Sales & Related | 233 (65.8%) | 121 (34.2%) |
| Office & Administration | 136 (19.2%) | 574 (80.8%) |
| Total (Category) | 369 (34.7%) | 695 (65.3%) |
| Total (Overall) | 3,375 (51.9%) | 3,123 (48.1%) |
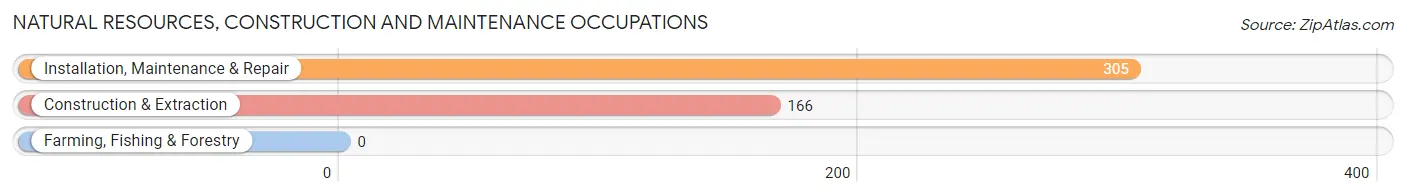
Natural Resources, Construction and Maintenance Occupations
The most common Natural Resources, Construction and Maintenance occupations in Los Lunas are Installation, Maintenance & Repair (305 | 4.7%), and Construction & Extraction (166 | 2.5%).
Natural Resources, Construction and Maintenance Occupations by Sex
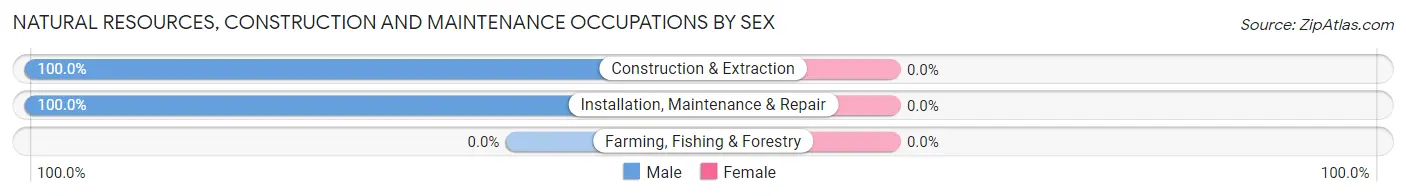
| Occupation | Male | Female |
| Farming, Fishing & Forestry | 0 (0.0%) | 0 (0.0%) |
| Construction & Extraction | 166 (100.0%) | 0 (0.0%) |
| Installation, Maintenance & Repair | 305 (100.0%) | 0 (0.0%) |
| Total (Category) | 471 (100.0%) | 0 (0.0%) |
| Total (Overall) | 3,375 (51.9%) | 3,123 (48.1%) |
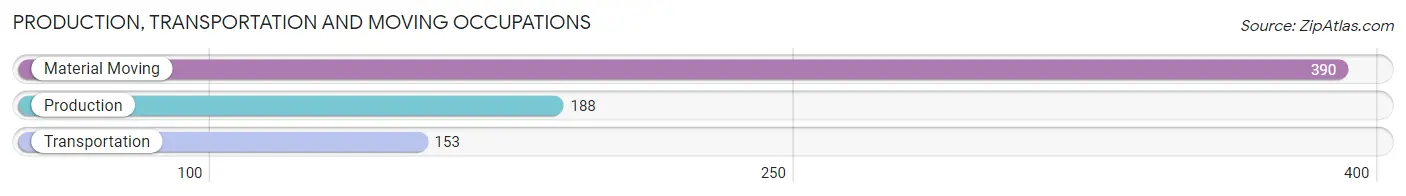
Production, Transportation and Moving Occupations
The most common Production, Transportation and Moving occupations in Los Lunas are Material Moving (390 | 6.0%), Production (188 | 2.9%), and Transportation (153 | 2.4%).
Production, Transportation and Moving Occupations by Sex
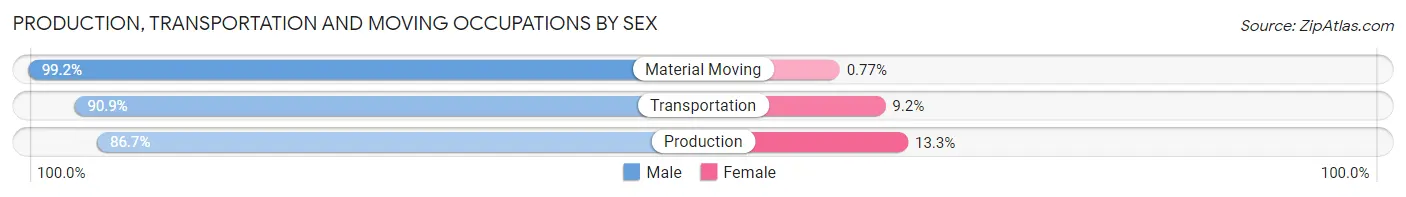
| Occupation | Male | Female |
| Production | 163 (86.7%) | 25 (13.3%) |
| Transportation | 139 (90.8%) | 14 (9.1%) |
| Material Moving | 387 (99.2%) | 3 (0.8%) |
| Total (Category) | 689 (94.3%) | 42 (5.8%) |
| Total (Overall) | 3,375 (51.9%) | 3,123 (48.1%) |
Employment Industries by Sex in Los Lunas
Employment Industries in Los Lunas
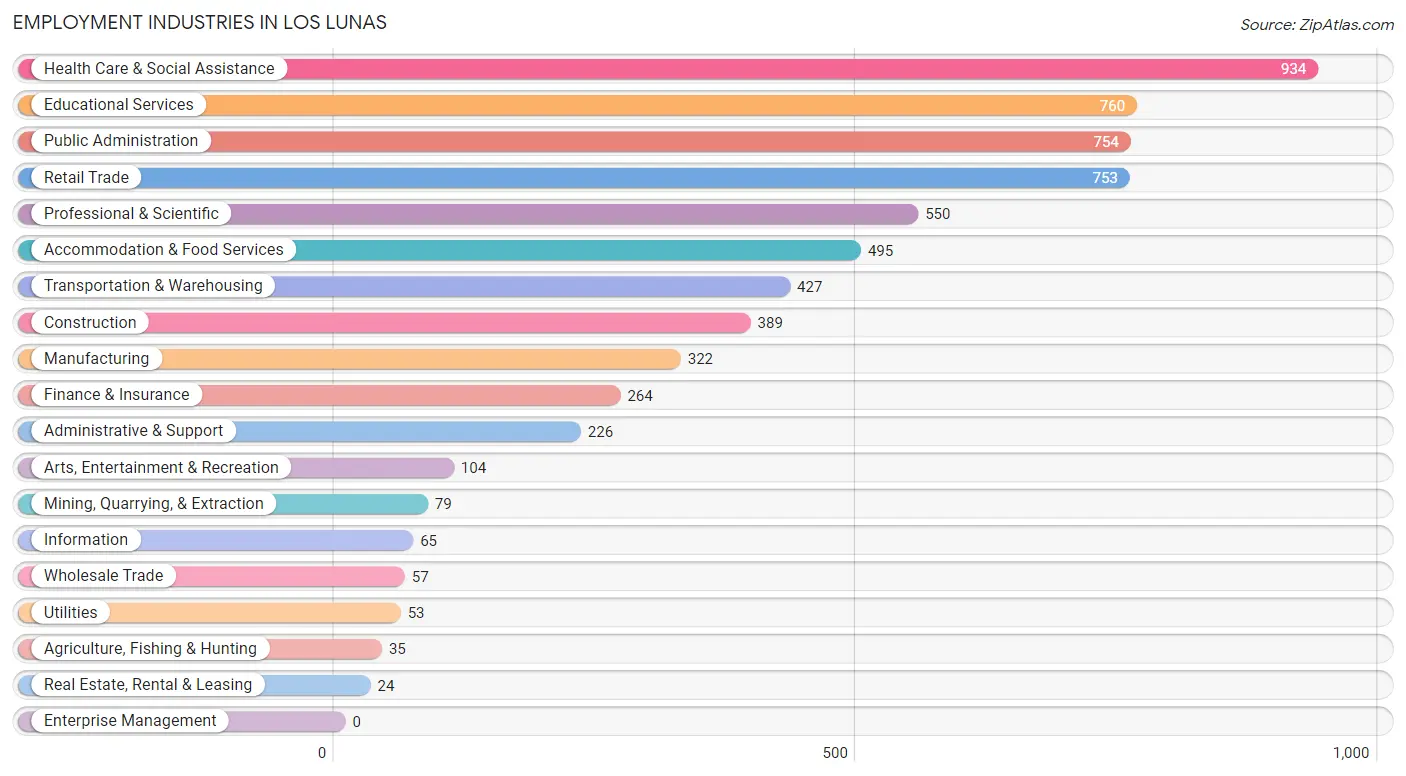
The major employment industries in Los Lunas include Health Care & Social Assistance (934 | 14.4%), Educational Services (760 | 11.7%), Public Administration (754 | 11.6%), Retail Trade (753 | 11.6%), and Professional & Scientific (550 | 8.5%).
Employment Industries by Sex in Los Lunas
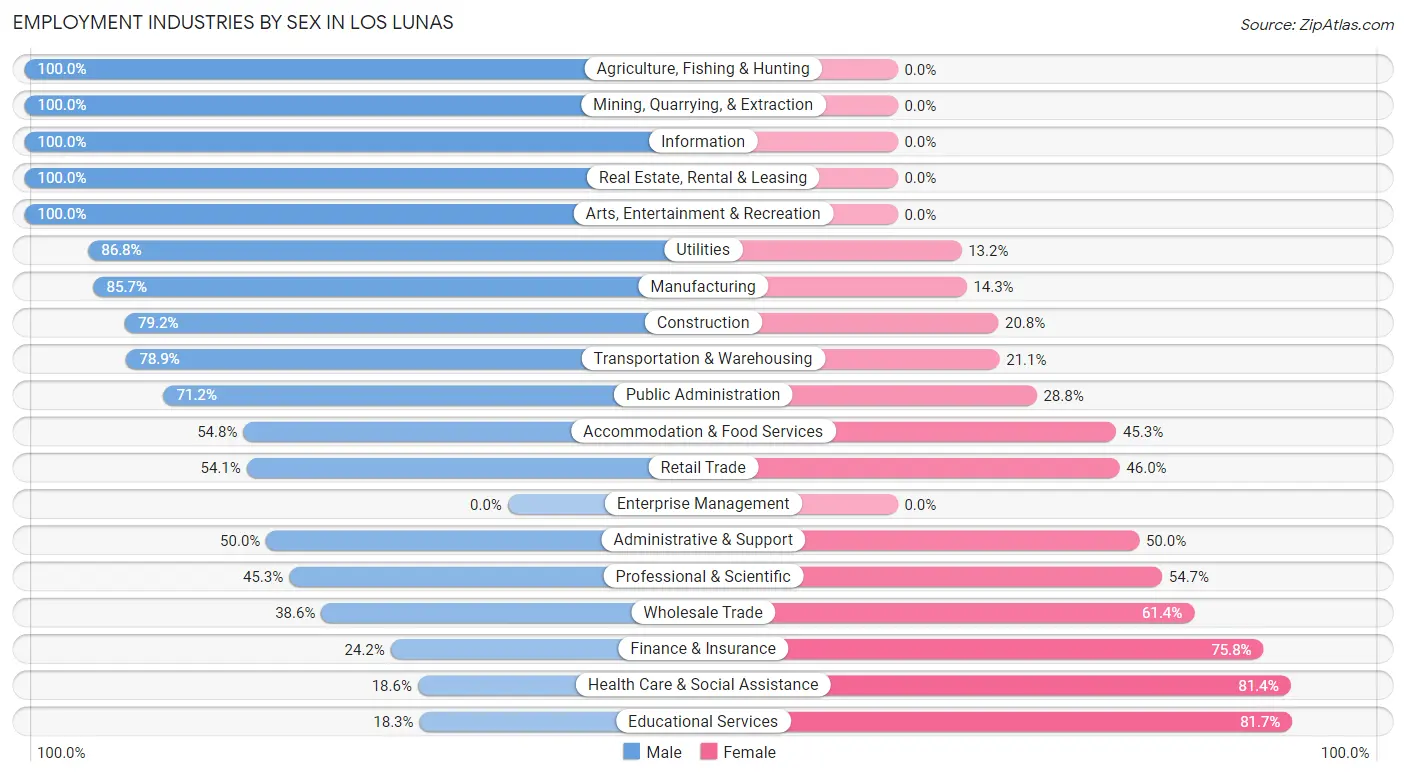
The Los Lunas industries that see more men than women are Agriculture, Fishing & Hunting (100.0%), Mining, Quarrying, & Extraction (100.0%), and Information (100.0%), whereas the industries that tend to have a higher number of women are Educational Services (81.7%), Health Care & Social Assistance (81.4%), and Finance & Insurance (75.8%).
| Industry | Male | Female |
| Agriculture, Fishing & Hunting | 35 (100.0%) | 0 (0.0%) |
| Mining, Quarrying, & Extraction | 79 (100.0%) | 0 (0.0%) |
| Construction | 308 (79.2%) | 81 (20.8%) |
| Manufacturing | 276 (85.7%) | 46 (14.3%) |
| Wholesale Trade | 22 (38.6%) | 35 (61.4%) |
| Retail Trade | 407 (54.0%) | 346 (46.0%) |
| Transportation & Warehousing | 337 (78.9%) | 90 (21.1%) |
| Utilities | 46 (86.8%) | 7 (13.2%) |
| Information | 65 (100.0%) | 0 (0.0%) |
| Finance & Insurance | 64 (24.2%) | 200 (75.8%) |
| Real Estate, Rental & Leasing | 24 (100.0%) | 0 (0.0%) |
| Professional & Scientific | 249 (45.3%) | 301 (54.7%) |
| Enterprise Management | 0 (0.0%) | 0 (0.0%) |
| Administrative & Support | 113 (50.0%) | 113 (50.0%) |
| Educational Services | 139 (18.3%) | 621 (81.7%) |
| Health Care & Social Assistance | 174 (18.6%) | 760 (81.4%) |
| Arts, Entertainment & Recreation | 104 (100.0%) | 0 (0.0%) |
| Accommodation & Food Services | 271 (54.7%) | 224 (45.3%) |
| Public Administration | 537 (71.2%) | 217 (28.8%) |
| Total | 3,375 (51.9%) | 3,123 (48.1%) |
Education in Los Lunas
School Enrollment in Los Lunas
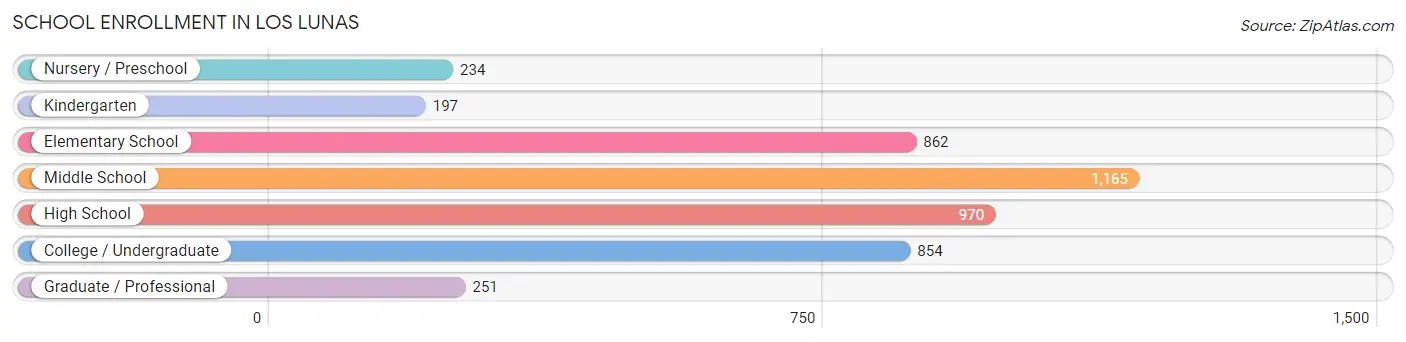
The most common levels of schooling among the 4,533 students in Los Lunas are middle school (1,165 | 25.7%), high school (970 | 21.4%), and elementary school (862 | 19.0%).
| School Level | # Students | % Students |
| Nursery / Preschool | 234 | 5.2% |
| Kindergarten | 197 | 4.3% |
| Elementary School | 862 | 19.0% |
| Middle School | 1,165 | 25.7% |
| High School | 970 | 21.4% |
| College / Undergraduate | 854 | 18.8% |
| Graduate / Professional | 251 | 5.5% |
| Total | 4,533 | 100.0% |
School Enrollment by Age by Funding Source in Los Lunas
Out of a total of 4,533 students who are enrolled in schools in Los Lunas, 743 (16.4%) attend a private institution, while the remaining 3,790 (83.6%) are enrolled in public schools. The age group of 25 to 34 year olds has the highest likelihood of being enrolled in private schools, with 62 (23.5% in the age bracket) enrolled. Conversely, the age group of 18 to 19 year olds has the lowest likelihood of being enrolled in a private school, with 197 (100.0% in the age bracket) attending a public institution.
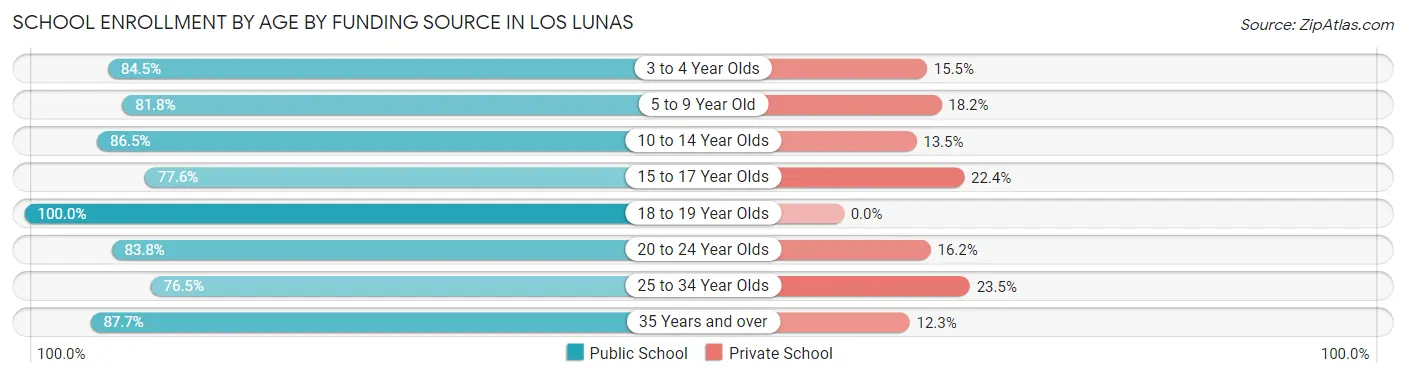
| Age Bracket | Public School | Private School |
| 3 to 4 Year Olds | 109 (84.5%) | 20 (15.5%) |
| 5 to 9 Year Old | 984 (81.8%) | 219 (18.2%) |
| 10 to 14 Year Olds | 1,043 (86.5%) | 163 (13.5%) |
| 15 to 17 Year Olds | 526 (77.6%) | 152 (22.4%) |
| 18 to 19 Year Olds | 197 (100.0%) | 0 (0.0%) |
| 20 to 24 Year Olds | 492 (83.8%) | 95 (16.2%) |
| 25 to 34 Year Olds | 202 (76.5%) | 62 (23.5%) |
| 35 Years and over | 236 (87.7%) | 33 (12.3%) |
| Total | 3,790 (83.6%) | 743 (16.4%) |
Educational Attainment by Field of Study in Los Lunas
Education (582 | 17.3%), business (556 | 16.6%), physical & health sciences (343 | 10.2%), science & technology (309 | 9.2%), and engineering (301 | 9.0%) are the most common fields of study among 3,360 individuals in Los Lunas who have obtained a bachelor's degree or higher.
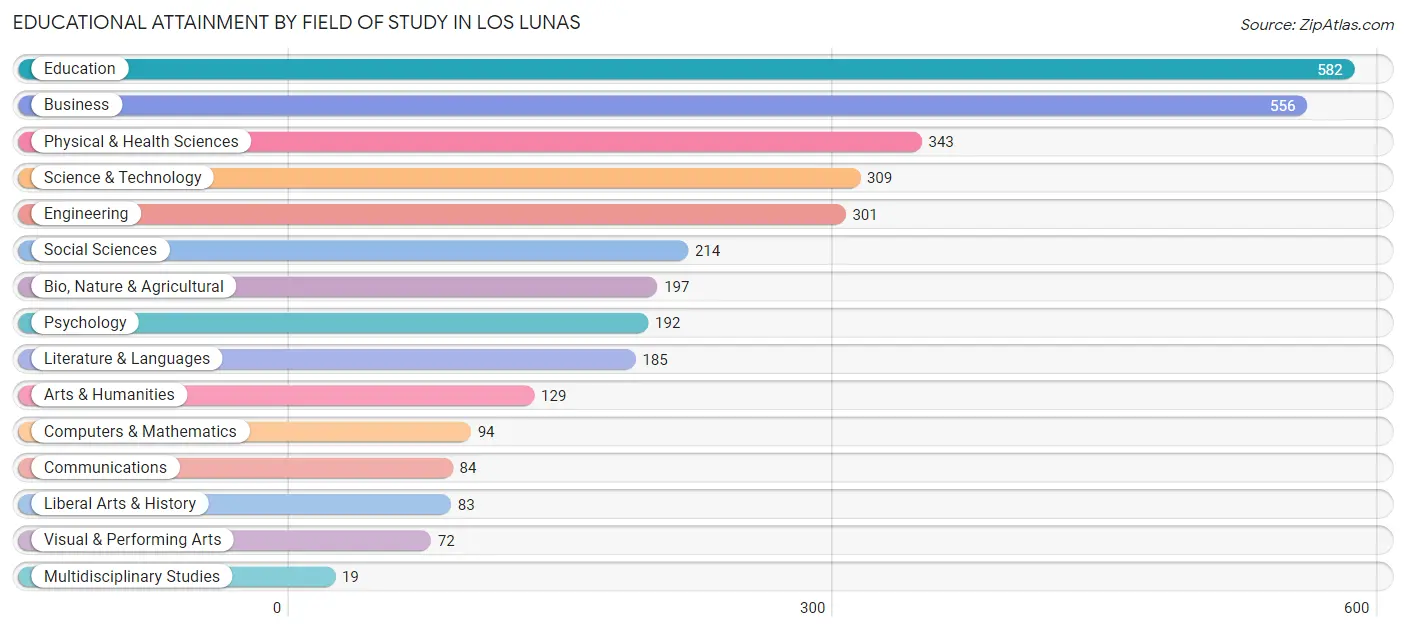
| Field of Study | # Graduates | % Graduates |
| Computers & Mathematics | 94 | 2.8% |
| Bio, Nature & Agricultural | 197 | 5.9% |
| Physical & Health Sciences | 343 | 10.2% |
| Psychology | 192 | 5.7% |
| Social Sciences | 214 | 6.4% |
| Engineering | 301 | 9.0% |
| Multidisciplinary Studies | 19 | 0.6% |
| Science & Technology | 309 | 9.2% |
| Business | 556 | 16.6% |
| Education | 582 | 17.3% |
| Literature & Languages | 185 | 5.5% |
| Liberal Arts & History | 83 | 2.5% |
| Visual & Performing Arts | 72 | 2.1% |
| Communications | 84 | 2.5% |
| Arts & Humanities | 129 | 3.8% |
| Total | 3,360 | 100.0% |
Transportation & Commute in Los Lunas
Vehicle Availability by Sex in Los Lunas
The most prevalent vehicle ownership categories in Los Lunas are males with 2 vehicles (1,667, accounting for 48.8%) and females with 2 vehicles (1,412, making up 54.2%).
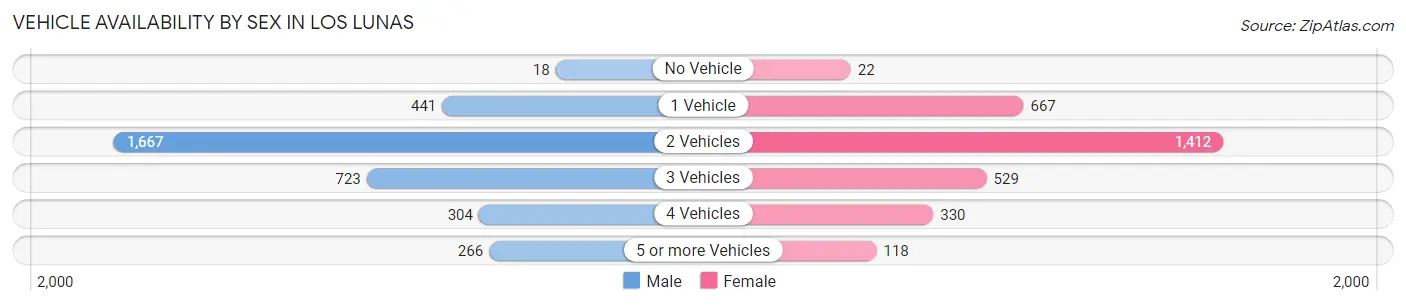
| Vehicles Available | Male | Female |
| No Vehicle | 18 (0.5%) | 22 (0.7%) |
| 1 Vehicle | 441 (12.9%) | 667 (21.7%) |
| 2 Vehicles | 1,667 (48.8%) | 1,412 (45.9%) |
| 3 Vehicles | 723 (21.1%) | 529 (17.2%) |
| 4 Vehicles | 304 (8.9%) | 330 (10.7%) |
| 5 or more Vehicles | 266 (7.8%) | 118 (3.8%) |
| Total | 3,419 (100.0%) | 3,078 (100.0%) |
Commute Time in Los Lunas
The most frequently occuring commute durations in Los Lunas are 30 to 34 minutes (1,106 commuters, 17.9%), 10 to 14 minutes (952 commuters, 15.4%), and 5 to 9 minutes (702 commuters, 11.4%).
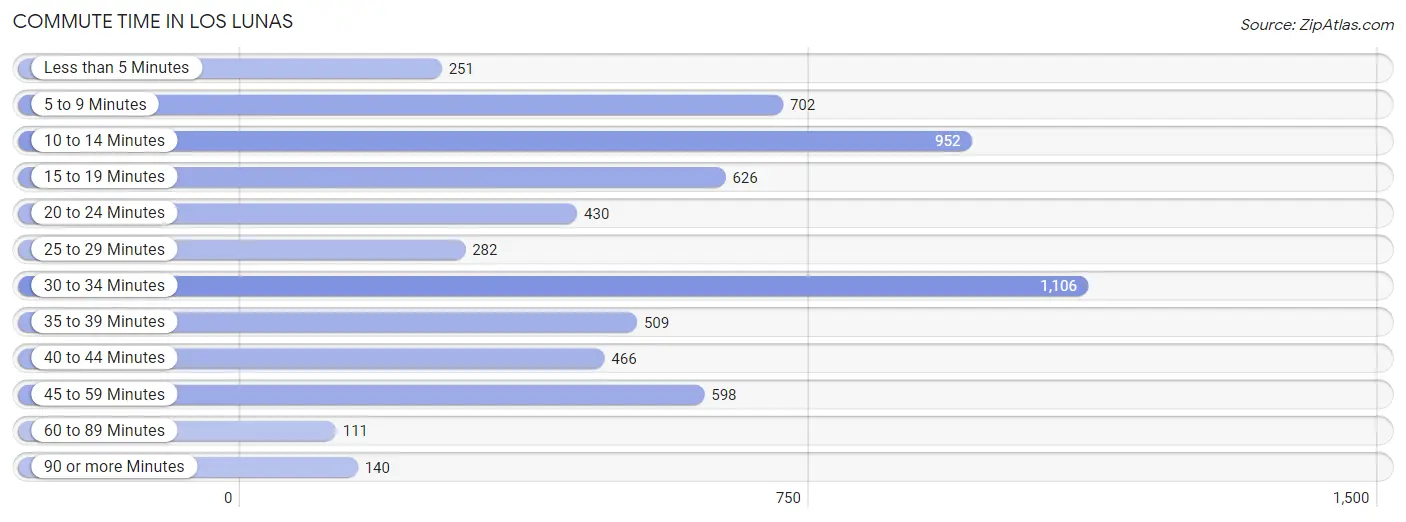
| Commute Time | # Commuters | % Commuters |
| Less than 5 Minutes | 251 | 4.1% |
| 5 to 9 Minutes | 702 | 11.4% |
| 10 to 14 Minutes | 952 | 15.4% |
| 15 to 19 Minutes | 626 | 10.1% |
| 20 to 24 Minutes | 430 | 7.0% |
| 25 to 29 Minutes | 282 | 4.6% |
| 30 to 34 Minutes | 1,106 | 17.9% |
| 35 to 39 Minutes | 509 | 8.3% |
| 40 to 44 Minutes | 466 | 7.5% |
| 45 to 59 Minutes | 598 | 9.7% |
| 60 to 89 Minutes | 111 | 1.8% |
| 90 or more Minutes | 140 | 2.3% |
Commute Time by Sex in Los Lunas
The most common commute times in Los Lunas are 30 to 34 minutes (519 commuters, 15.7%) for males and 30 to 34 minutes (587 commuters, 20.4%) for females.
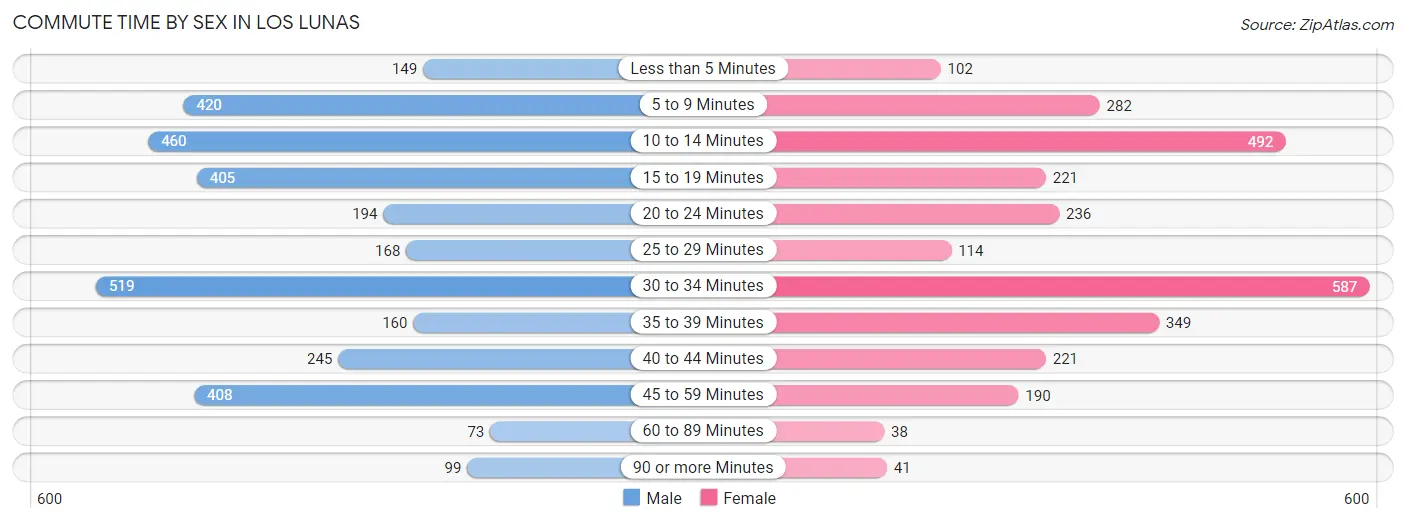
| Commute Time | Male | Female |
| Less than 5 Minutes | 149 (4.5%) | 102 (3.5%) |
| 5 to 9 Minutes | 420 (12.7%) | 282 (9.8%) |
| 10 to 14 Minutes | 460 (13.9%) | 492 (17.1%) |
| 15 to 19 Minutes | 405 (12.3%) | 221 (7.7%) |
| 20 to 24 Minutes | 194 (5.9%) | 236 (8.2%) |
| 25 to 29 Minutes | 168 (5.1%) | 114 (4.0%) |
| 30 to 34 Minutes | 519 (15.7%) | 587 (20.4%) |
| 35 to 39 Minutes | 160 (4.9%) | 349 (12.1%) |
| 40 to 44 Minutes | 245 (7.4%) | 221 (7.7%) |
| 45 to 59 Minutes | 408 (12.4%) | 190 (6.6%) |
| 60 to 89 Minutes | 73 (2.2%) | 38 (1.3%) |
| 90 or more Minutes | 99 (3.0%) | 41 (1.4%) |
Time of Departure to Work by Sex in Los Lunas
The most frequent times of departure to work in Los Lunas are 7:00 AM to 7:29 AM (593, 18.0%) for males and 7:00 AM to 7:29 AM (655, 22.8%) for females.
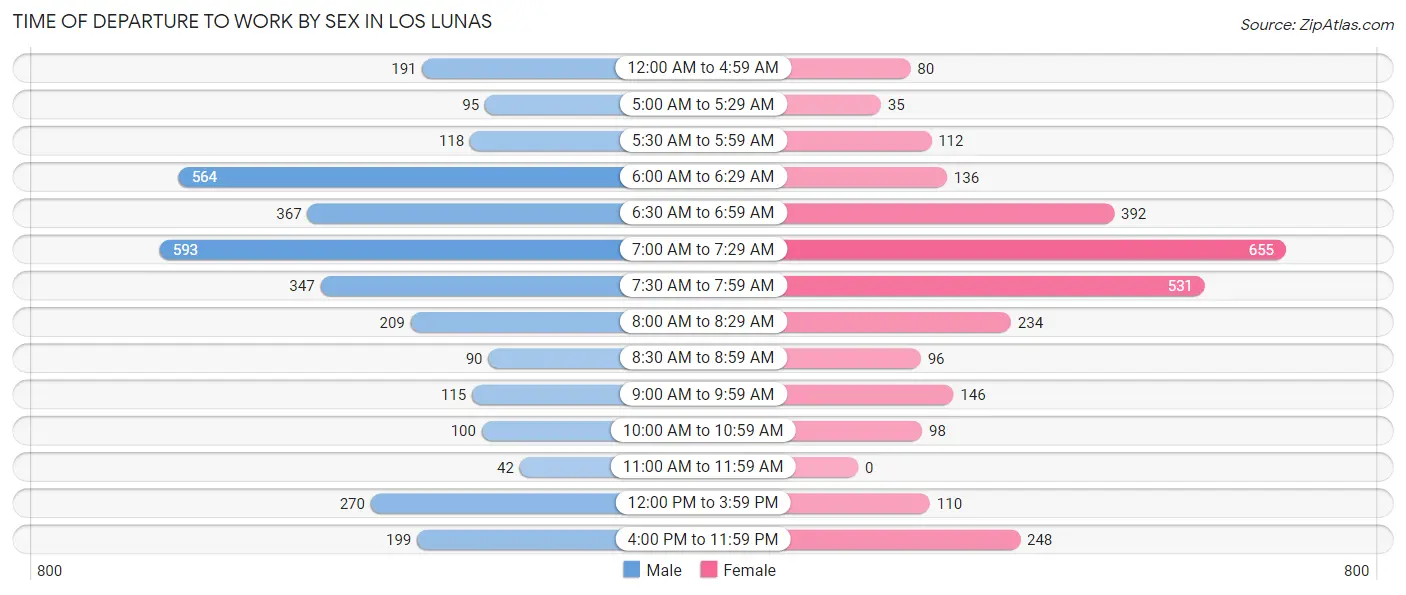
| Time of Departure | Male | Female |
| 12:00 AM to 4:59 AM | 191 (5.8%) | 80 (2.8%) |
| 5:00 AM to 5:29 AM | 95 (2.9%) | 35 (1.2%) |
| 5:30 AM to 5:59 AM | 118 (3.6%) | 112 (3.9%) |
| 6:00 AM to 6:29 AM | 564 (17.1%) | 136 (4.7%) |
| 6:30 AM to 6:59 AM | 367 (11.1%) | 392 (13.6%) |
| 7:00 AM to 7:29 AM | 593 (18.0%) | 655 (22.8%) |
| 7:30 AM to 7:59 AM | 347 (10.5%) | 531 (18.5%) |
| 8:00 AM to 8:29 AM | 209 (6.3%) | 234 (8.1%) |
| 8:30 AM to 8:59 AM | 90 (2.7%) | 96 (3.3%) |
| 9:00 AM to 9:59 AM | 115 (3.5%) | 146 (5.1%) |
| 10:00 AM to 10:59 AM | 100 (3.0%) | 98 (3.4%) |
| 11:00 AM to 11:59 AM | 42 (1.3%) | 0 (0.0%) |
| 12:00 PM to 3:59 PM | 270 (8.2%) | 110 (3.8%) |
| 4:00 PM to 11:59 PM | 199 (6.0%) | 248 (8.6%) |
| Total | 3,300 (100.0%) | 2,873 (100.0%) |
Housing Occupancy in Los Lunas
Occupancy by Ownership in Los Lunas
Of the total 6,316 dwellings in Los Lunas, owner-occupied units account for 4,949 (78.4%), while renter-occupied units make up 1,367 (21.6%).
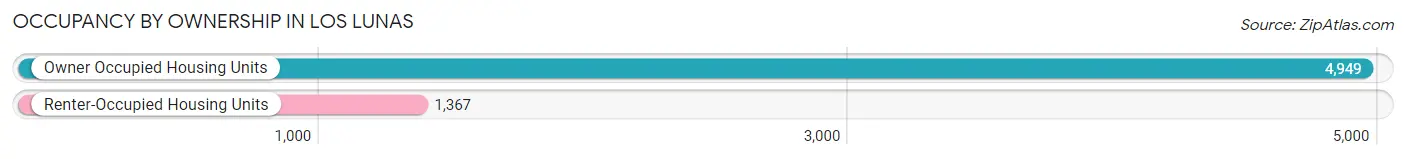
| Occupancy | # Housing Units | % Housing Units |
| Owner Occupied Housing Units | 4,949 | 78.4% |
| Renter-Occupied Housing Units | 1,367 | 21.6% |
| Total Occupied Housing Units | 6,316 | 100.0% |
Occupancy by Household Size in Los Lunas
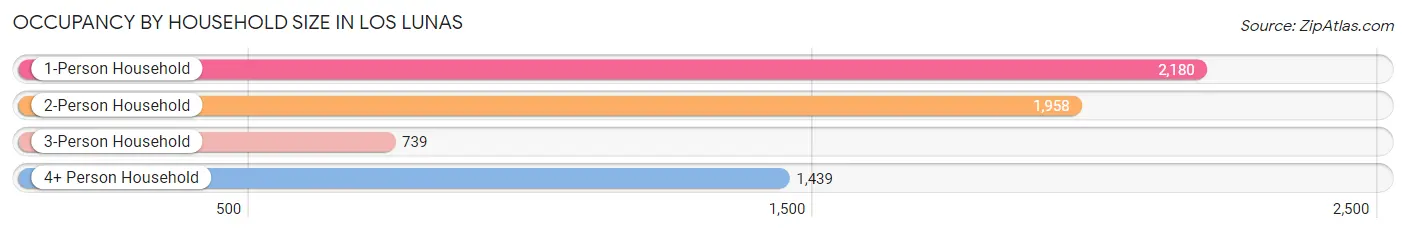
| Household Size | # Housing Units | % Housing Units |
| 1-Person Household | 2,180 | 34.5% |
| 2-Person Household | 1,958 | 31.0% |
| 3-Person Household | 739 | 11.7% |
| 4+ Person Household | 1,439 | 22.8% |
| Total Housing Units | 6,316 | 100.0% |
Occupancy by Ownership by Household Size in Los Lunas
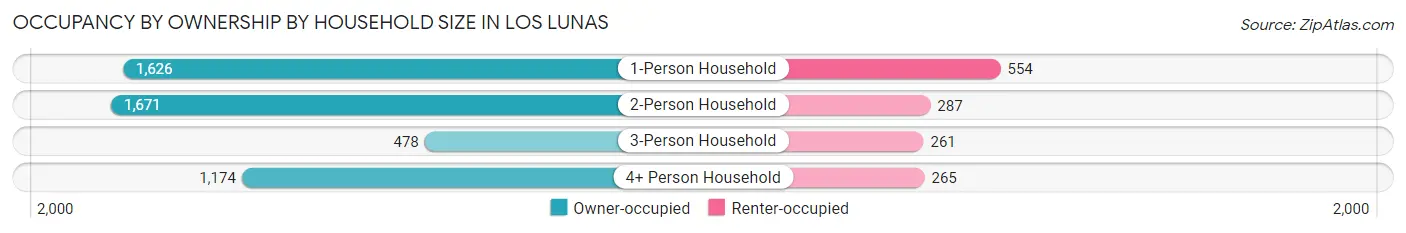
| Household Size | Owner-occupied | Renter-occupied |
| 1-Person Household | 1,626 (74.6%) | 554 (25.4%) |
| 2-Person Household | 1,671 (85.3%) | 287 (14.7%) |
| 3-Person Household | 478 (64.7%) | 261 (35.3%) |
| 4+ Person Household | 1,174 (81.6%) | 265 (18.4%) |
| Total Housing Units | 4,949 (78.4%) | 1,367 (21.6%) |
Occupancy by Educational Attainment in Los Lunas
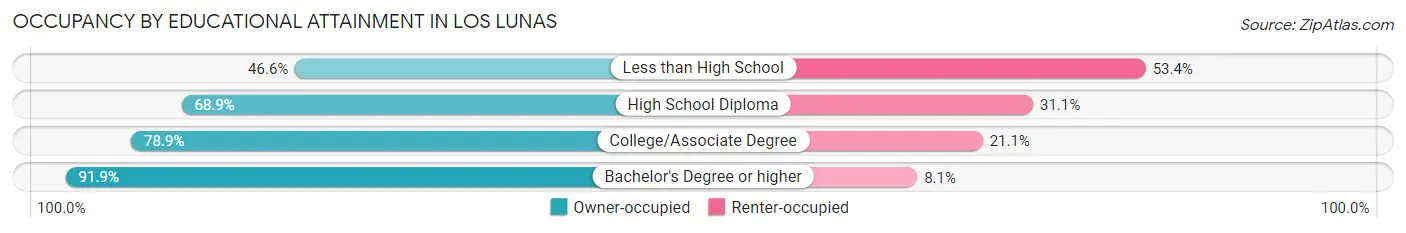
| Household Size | Owner-occupied | Renter-occupied |
| Less than High School | 223 (46.6%) | 256 (53.4%) |
| High School Diploma | 997 (68.9%) | 450 (31.1%) |
| College/Associate Degree | 1,845 (78.9%) | 494 (21.1%) |
| Bachelor's Degree or higher | 1,884 (91.9%) | 167 (8.1%) |
Occupancy by Age of Householder in Los Lunas
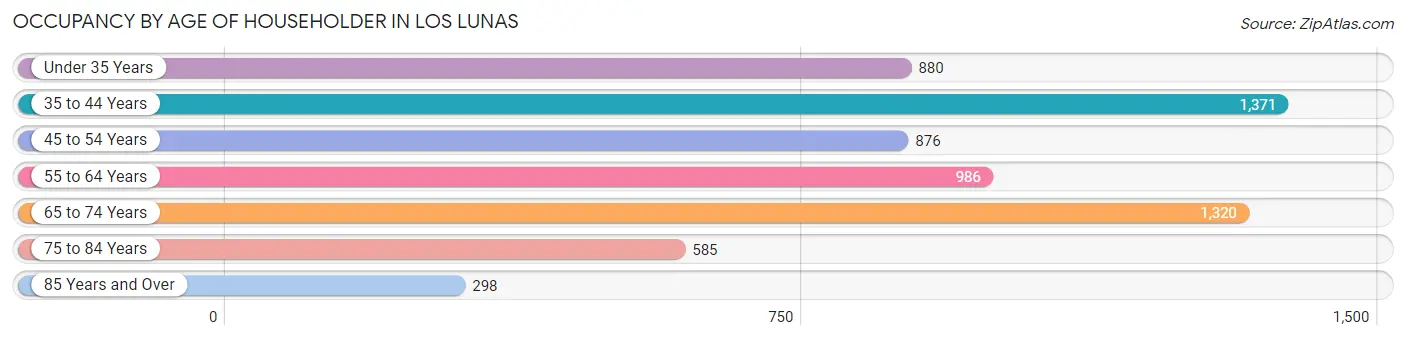
| Age Bracket | # Households | % Households |
| Under 35 Years | 880 | 13.9% |
| 35 to 44 Years | 1,371 | 21.7% |
| 45 to 54 Years | 876 | 13.9% |
| 55 to 64 Years | 986 | 15.6% |
| 65 to 74 Years | 1,320 | 20.9% |
| 75 to 84 Years | 585 | 9.3% |
| 85 Years and Over | 298 | 4.7% |
| Total | 6,316 | 100.0% |
Housing Finances in Los Lunas
Median Income by Occupancy in Los Lunas
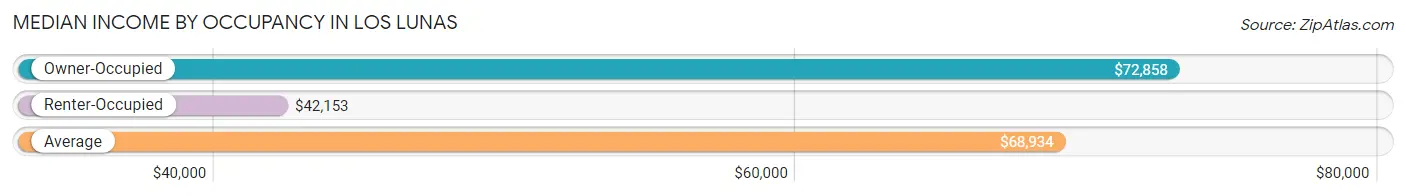
| Occupancy Type | # Households | Median Income |
| Owner-Occupied | 4,949 (78.4%) | $72,858 |
| Renter-Occupied | 1,367 (21.6%) | $42,153 |
| Average | 6,316 (100.0%) | $68,934 |
Occupancy by Householder Income Bracket in Los Lunas
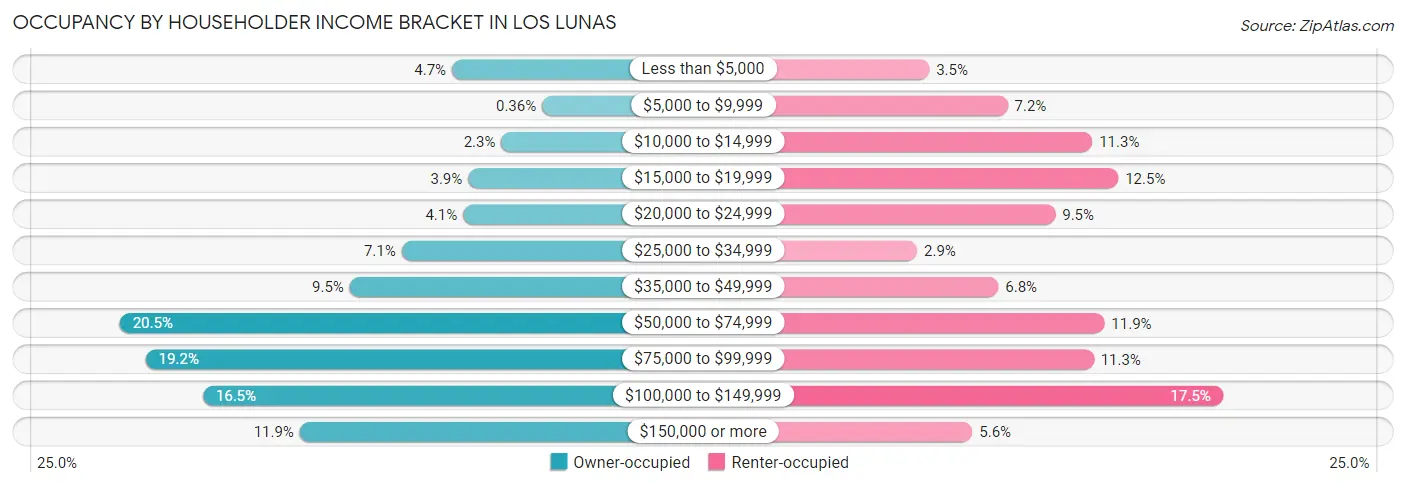
| Income Bracket | Owner-occupied | Renter-occupied |
| Less than $5,000 | 230 (4.6%) | 48 (3.5%) |
| $5,000 to $9,999 | 18 (0.4%) | 99 (7.2%) |
| $10,000 to $14,999 | 114 (2.3%) | 154 (11.3%) |
| $15,000 to $19,999 | 192 (3.9%) | 171 (12.5%) |
| $20,000 to $24,999 | 204 (4.1%) | 130 (9.5%) |
| $25,000 to $34,999 | 349 (7.0%) | 40 (2.9%) |
| $35,000 to $49,999 | 471 (9.5%) | 93 (6.8%) |
| $50,000 to $74,999 | 1,013 (20.5%) | 162 (11.8%) |
| $75,000 to $99,999 | 952 (19.2%) | 155 (11.3%) |
| $100,000 to $149,999 | 817 (16.5%) | 239 (17.5%) |
| $150,000 or more | 589 (11.9%) | 76 (5.6%) |
| Total | 4,949 (100.0%) | 1,367 (100.0%) |
Monthly Housing Cost Tiers in Los Lunas
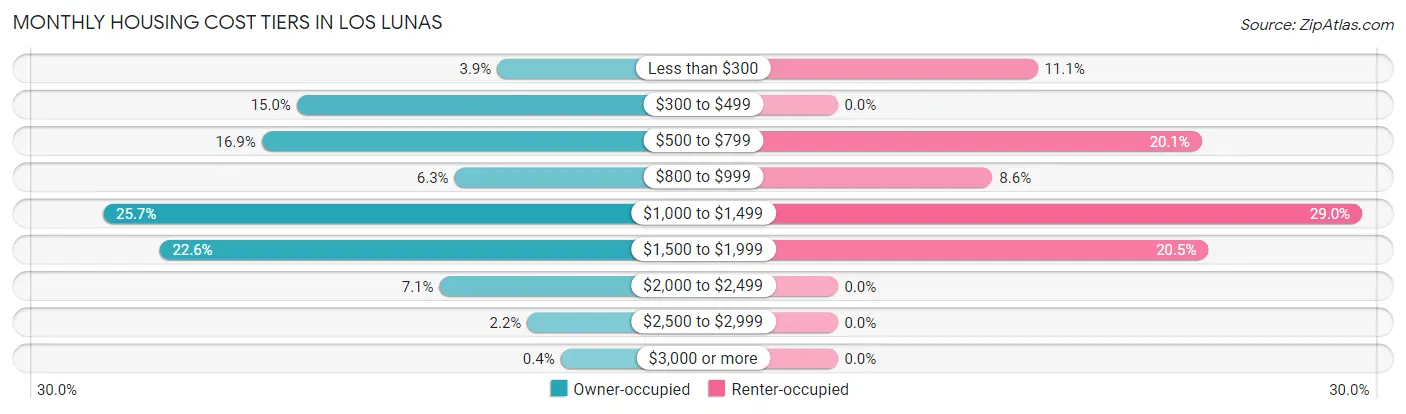
| Monthly Cost | Owner-occupied | Renter-occupied |
| Less than $300 | 193 (3.9%) | 151 (11.1%) |
| $300 to $499 | 741 (15.0%) | 0 (0.0%) |
| $500 to $799 | 837 (16.9%) | 275 (20.1%) |
| $800 to $999 | 310 (6.3%) | 117 (8.6%) |
| $1,000 to $1,499 | 1,270 (25.7%) | 396 (29.0%) |
| $1,500 to $1,999 | 1,116 (22.6%) | 280 (20.5%) |
| $2,000 to $2,499 | 351 (7.1%) | 0 (0.0%) |
| $2,500 to $2,999 | 111 (2.2%) | 0 (0.0%) |
| $3,000 or more | 20 (0.4%) | 0 (0.0%) |
| Total | 4,949 (100.0%) | 1,367 (100.0%) |
Physical Housing Characteristics in Los Lunas
Housing Structures in Los Lunas
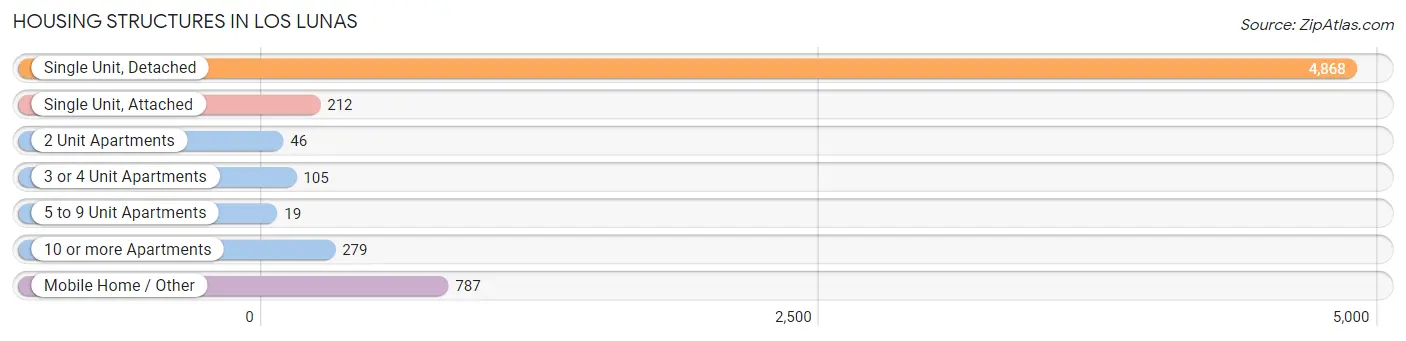
| Structure Type | # Housing Units | % Housing Units |
| Single Unit, Detached | 4,868 | 77.1% |
| Single Unit, Attached | 212 | 3.4% |
| 2 Unit Apartments | 46 | 0.7% |
| 3 or 4 Unit Apartments | 105 | 1.7% |
| 5 to 9 Unit Apartments | 19 | 0.3% |
| 10 or more Apartments | 279 | 4.4% |
| Mobile Home / Other | 787 | 12.5% |
| Total | 6,316 | 100.0% |
Housing Structures by Occupancy in Los Lunas
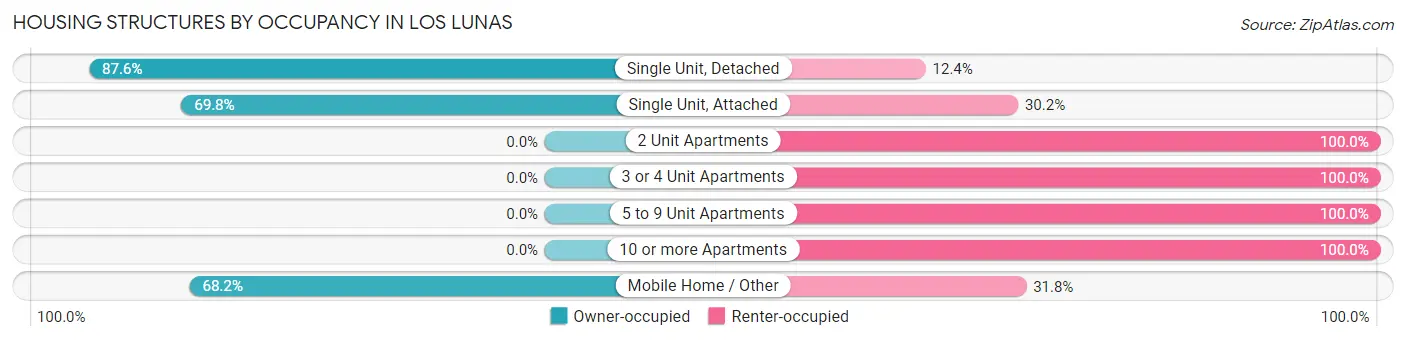
| Structure Type | Owner-occupied | Renter-occupied |
| Single Unit, Detached | 4,264 (87.6%) | 604 (12.4%) |
| Single Unit, Attached | 148 (69.8%) | 64 (30.2%) |
| 2 Unit Apartments | 0 (0.0%) | 46 (100.0%) |
| 3 or 4 Unit Apartments | 0 (0.0%) | 105 (100.0%) |
| 5 to 9 Unit Apartments | 0 (0.0%) | 19 (100.0%) |
| 10 or more Apartments | 0 (0.0%) | 279 (100.0%) |
| Mobile Home / Other | 537 (68.2%) | 250 (31.8%) |
| Total | 4,949 (78.4%) | 1,367 (21.6%) |
Housing Structures by Number of Rooms in Los Lunas
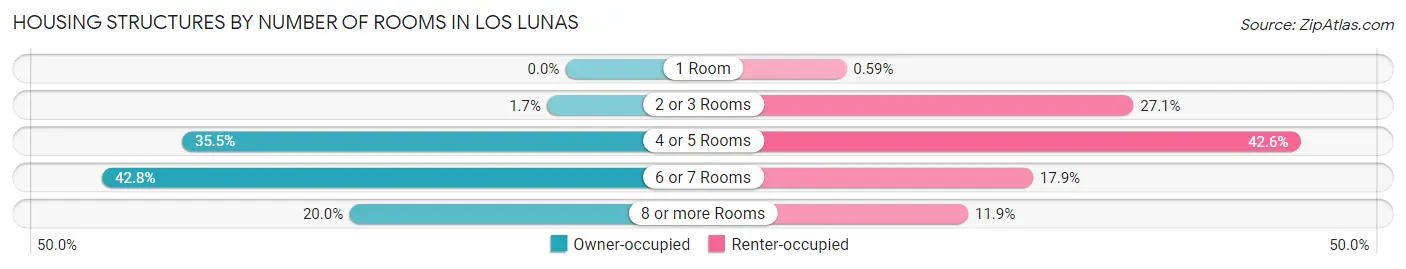
| Number of Rooms | Owner-occupied | Renter-occupied |
| 1 Room | 0 (0.0%) | 8 (0.6%) |
| 2 or 3 Rooms | 84 (1.7%) | 371 (27.1%) |
| 4 or 5 Rooms | 1,755 (35.5%) | 582 (42.6%) |
| 6 or 7 Rooms | 2,120 (42.8%) | 244 (17.8%) |
| 8 or more Rooms | 990 (20.0%) | 162 (11.8%) |
| Total | 4,949 (100.0%) | 1,367 (100.0%) |
Housing Structure by Heating Type in Los Lunas
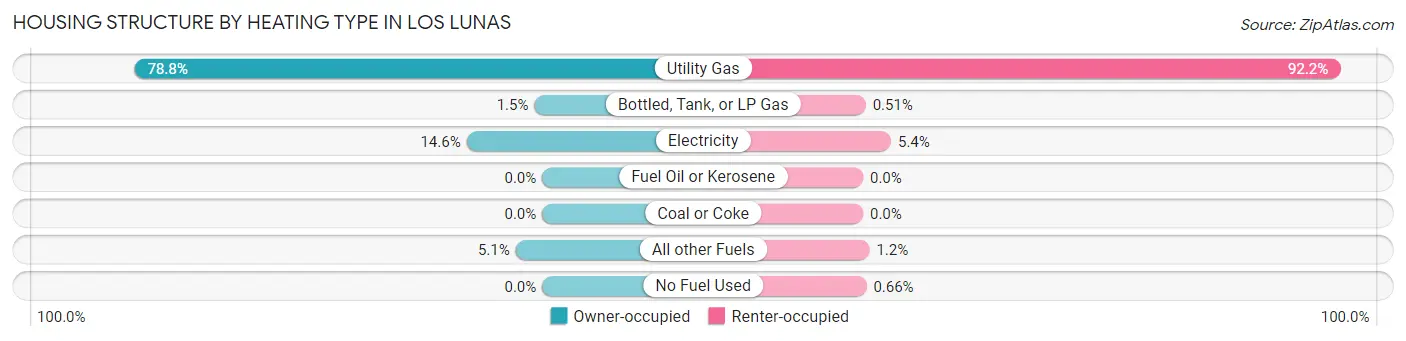
| Heating Type | Owner-occupied | Renter-occupied |
| Utility Gas | 3,898 (78.8%) | 1,260 (92.2%) |
| Bottled, Tank, or LP Gas | 74 (1.5%) | 7 (0.5%) |
| Electricity | 723 (14.6%) | 74 (5.4%) |
| Fuel Oil or Kerosene | 0 (0.0%) | 0 (0.0%) |
| Coal or Coke | 0 (0.0%) | 0 (0.0%) |
| All other Fuels | 254 (5.1%) | 17 (1.2%) |
| No Fuel Used | 0 (0.0%) | 9 (0.7%) |
| Total | 4,949 (100.0%) | 1,367 (100.0%) |
Household Vehicle Usage in Los Lunas
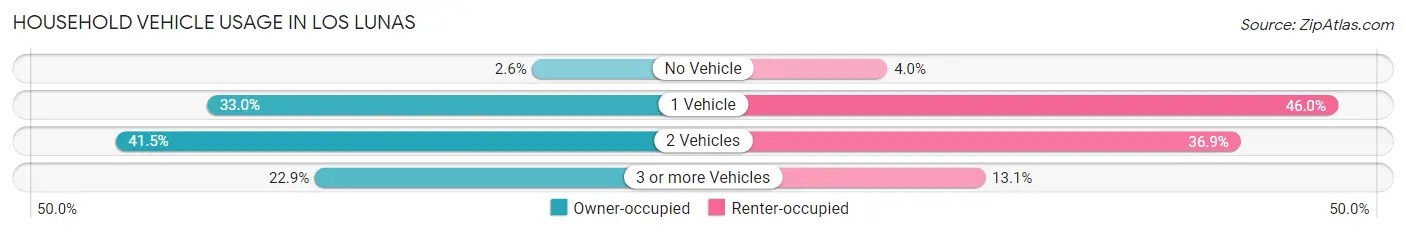
| Vehicles per Household | Owner-occupied | Renter-occupied |
| No Vehicle | 128 (2.6%) | 54 (4.0%) |
| 1 Vehicle | 1,633 (33.0%) | 629 (46.0%) |
| 2 Vehicles | 2,055 (41.5%) | 505 (36.9%) |
| 3 or more Vehicles | 1,133 (22.9%) | 179 (13.1%) |
| Total | 4,949 (100.0%) | 1,367 (100.0%) |
Real Estate & Mortgages in Los Lunas
Real Estate and Mortgage Overview in Los Lunas
| Characteristic | Without Mortgage | With Mortgage |
| Housing Units | 1,641 | 3,308 |
| Median Property Value | $226,000 | $209,100 |
| Median Household Income | $54,939 | $487 |
| Monthly Housing Costs | $481 | $20 |
| Real Estate Taxes | $2,097 | $171 |
Property Value by Mortgage Status in Los Lunas
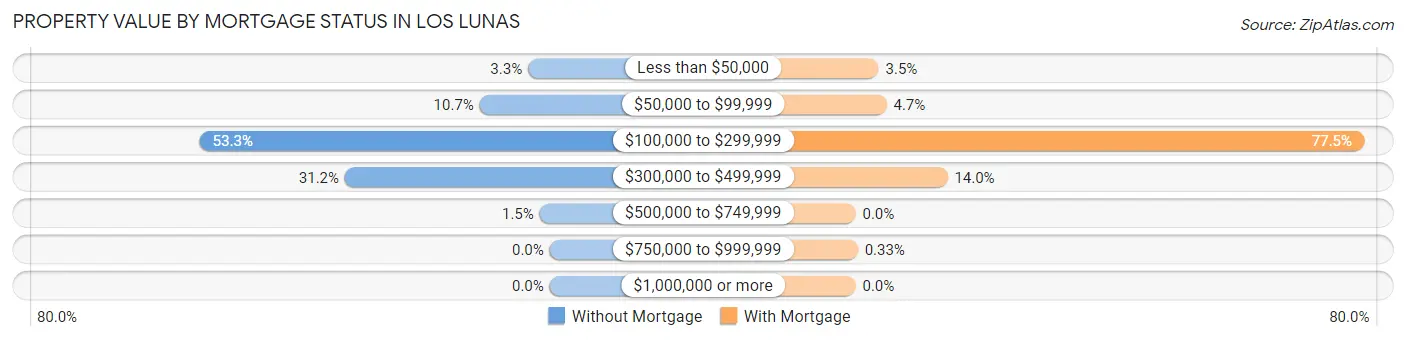
| Property Value | Without Mortgage | With Mortgage |
| Less than $50,000 | 54 (3.3%) | 116 (3.5%) |
| $50,000 to $99,999 | 175 (10.7%) | 156 (4.7%) |
| $100,000 to $299,999 | 875 (53.3%) | 2,562 (77.4%) |
| $300,000 to $499,999 | 512 (31.2%) | 463 (14.0%) |
| $500,000 to $749,999 | 25 (1.5%) | 0 (0.0%) |
| $750,000 to $999,999 | 0 (0.0%) | 11 (0.3%) |
| $1,000,000 or more | 0 (0.0%) | 0 (0.0%) |
| Total | 1,641 (100.0%) | 3,308 (100.0%) |
Household Income by Mortgage Status in Los Lunas
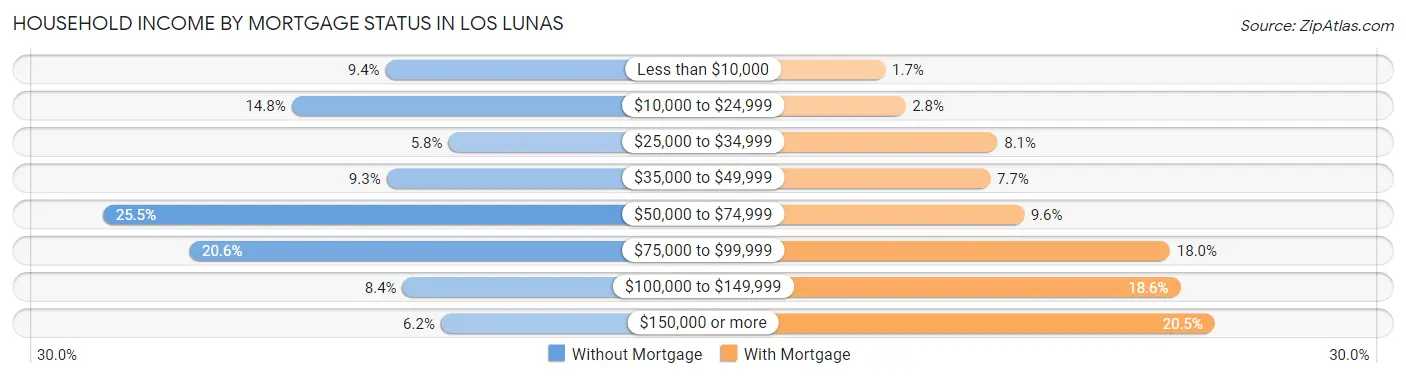
| Household Income | Without Mortgage | With Mortgage |
| Less than $10,000 | 154 (9.4%) | 56 (1.7%) |
| $10,000 to $24,999 | 242 (14.7%) | 94 (2.8%) |
| $25,000 to $34,999 | 95 (5.8%) | 268 (8.1%) |
| $35,000 to $49,999 | 153 (9.3%) | 254 (7.7%) |
| $50,000 to $74,999 | 419 (25.5%) | 318 (9.6%) |
| $75,000 to $99,999 | 338 (20.6%) | 594 (18.0%) |
| $100,000 to $149,999 | 138 (8.4%) | 614 (18.6%) |
| $150,000 or more | 102 (6.2%) | 679 (20.5%) |
| Total | 1,641 (100.0%) | 3,308 (100.0%) |
Property Value to Household Income Ratio in Los Lunas
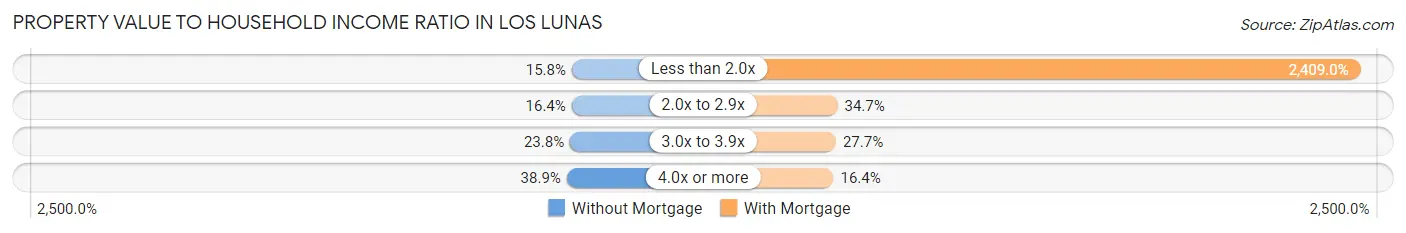
| Value-to-Income Ratio | Without Mortgage | With Mortgage |
| Less than 2.0x | 259 (15.8%) | 79,688 (2,409.0%) |
| 2.0x to 2.9x | 269 (16.4%) | 1,147 (34.7%) |
| 3.0x to 3.9x | 391 (23.8%) | 915 (27.7%) |
| 4.0x or more | 639 (38.9%) | 543 (16.4%) |
| Total | 1,641 (100.0%) | 3,308 (100.0%) |
Real Estate Taxes by Mortgage Status in Los Lunas
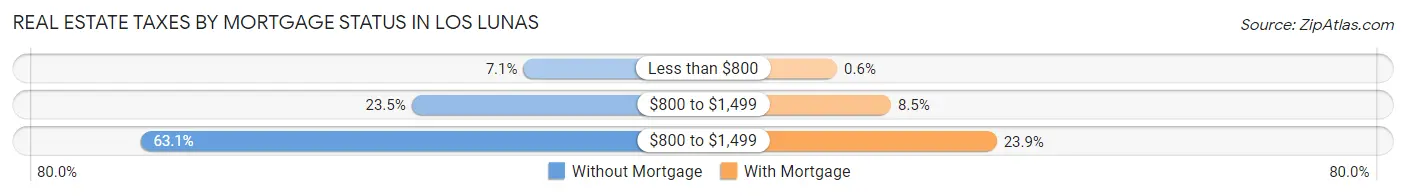
| Property Taxes | Without Mortgage | With Mortgage |
| Less than $800 | 117 (7.1%) | 20 (0.6%) |
| $800 to $1,499 | 385 (23.5%) | 280 (8.5%) |
| $800 to $1,499 | 1,035 (63.1%) | 791 (23.9%) |
| Total | 1,641 (100.0%) | 3,308 (100.0%) |
Health & Disability in Los Lunas
Health Insurance Coverage by Age in Los Lunas
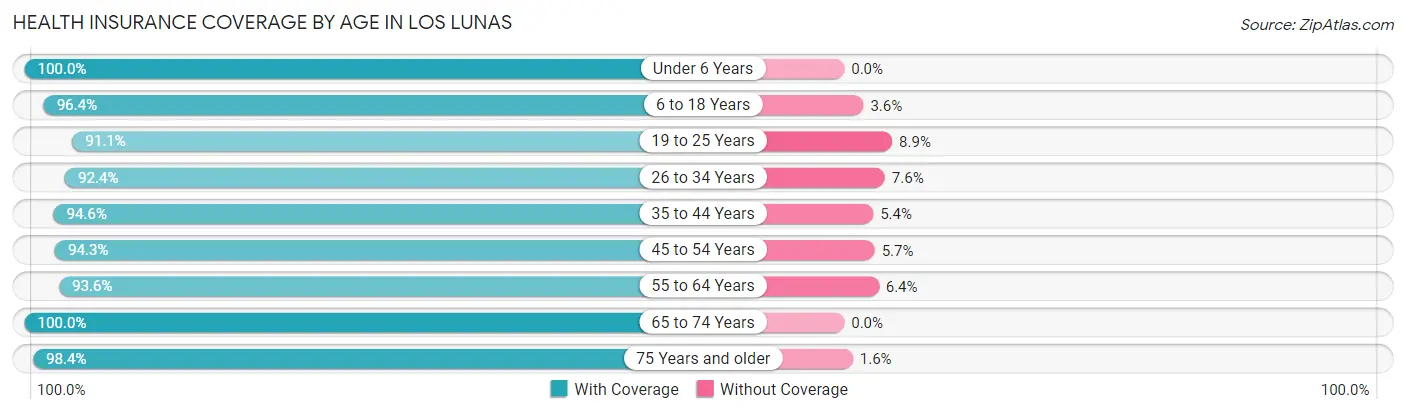
| Age Bracket | With Coverage | Without Coverage |
| Under 6 Years | 1,616 (100.0%) | 0 (0.0%) |
| 6 to 18 Years | 3,121 (96.4%) | 116 (3.6%) |
| 19 to 25 Years | 1,185 (91.1%) | 116 (8.9%) |
| 26 to 34 Years | 1,551 (92.4%) | 127 (7.6%) |
| 35 to 44 Years | 2,346 (94.6%) | 134 (5.4%) |
| 45 to 54 Years | 2,010 (94.3%) | 121 (5.7%) |
| 55 to 64 Years | 1,251 (93.6%) | 86 (6.4%) |
| 65 to 74 Years | 2,123 (100.0%) | 0 (0.0%) |
| 75 Years and older | 1,291 (98.4%) | 21 (1.6%) |
| Total | 16,494 (95.8%) | 721 (4.2%) |
Health Insurance Coverage by Citizenship Status in Los Lunas
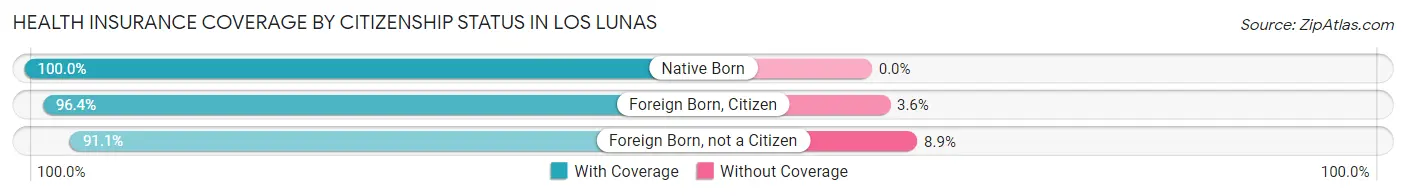
| Citizenship Status | With Coverage | Without Coverage |
| Native Born | 1,616 (100.0%) | 0 (0.0%) |
| Foreign Born, Citizen | 3,121 (96.4%) | 116 (3.6%) |
| Foreign Born, not a Citizen | 1,185 (91.1%) | 116 (8.9%) |
Health Insurance Coverage by Household Income in Los Lunas
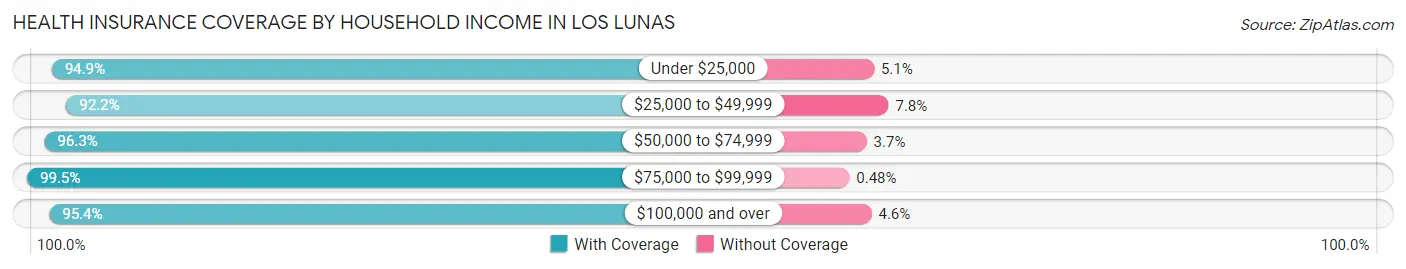
| Household Income | With Coverage | Without Coverage |
| Under $25,000 | 2,646 (94.9%) | 142 (5.1%) |
| $25,000 to $49,999 | 2,063 (92.2%) | 175 (7.8%) |
| $50,000 to $74,999 | 3,102 (96.3%) | 120 (3.7%) |
| $75,000 to $99,999 | 3,118 (99.5%) | 15 (0.5%) |
| $100,000 and over | 5,542 (95.4%) | 269 (4.6%) |
Public vs Private Health Insurance Coverage by Age in Los Lunas
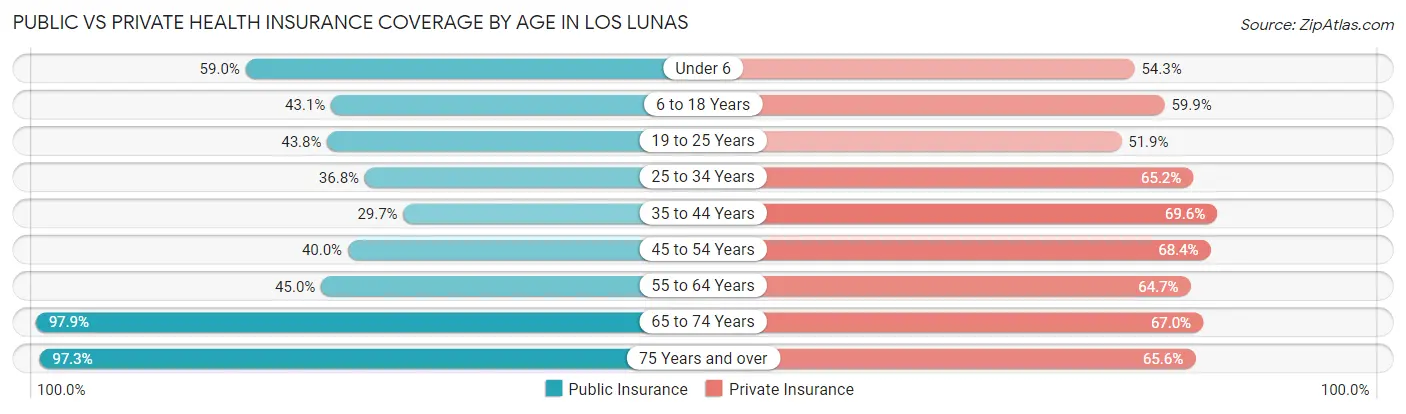
| Age Bracket | Public Insurance | Private Insurance |
| Under 6 | 953 (59.0%) | 878 (54.3%) |
| 6 to 18 Years | 1,395 (43.1%) | 1,939 (59.9%) |
| 19 to 25 Years | 570 (43.8%) | 675 (51.9%) |
| 25 to 34 Years | 618 (36.8%) | 1,094 (65.2%) |
| 35 to 44 Years | 736 (29.7%) | 1,727 (69.6%) |
| 45 to 54 Years | 852 (40.0%) | 1,458 (68.4%) |
| 55 to 64 Years | 601 (45.0%) | 865 (64.7%) |
| 65 to 74 Years | 2,079 (97.9%) | 1,423 (67.0%) |
| 75 Years and over | 1,276 (97.3%) | 860 (65.5%) |
| Total | 9,080 (52.7%) | 10,919 (63.4%) |
Disability Status by Sex by Age in Los Lunas
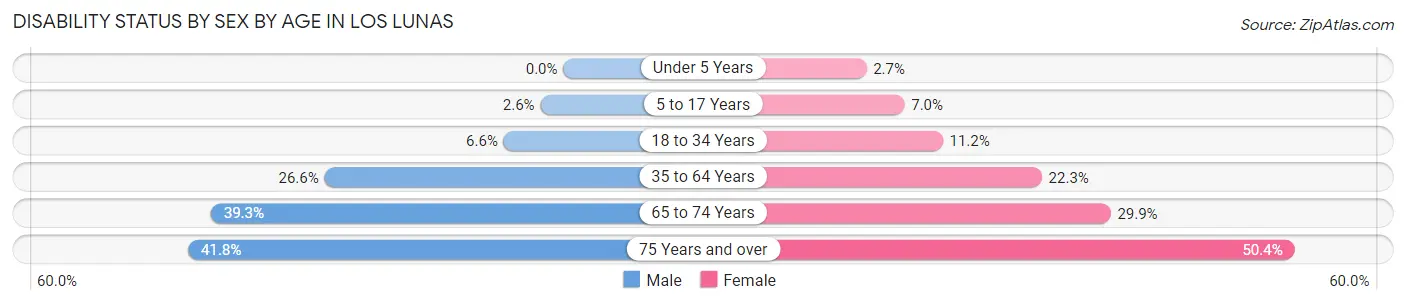
| Age Bracket | Male | Female |
| Under 5 Years | 0 (0.0%) | 16 (2.7%) |
| 5 to 17 Years | 51 (2.5%) | 95 (7.0%) |
| 18 to 34 Years | 112 (6.6%) | 176 (11.2%) |
| 35 to 64 Years | 717 (26.6%) | 724 (22.3%) |
| 65 to 74 Years | 373 (39.3%) | 351 (29.9%) |
| 75 Years and over | 293 (41.8%) | 308 (50.4%) |
Disability Class by Sex by Age in Los Lunas
Disability Class: Hearing Difficulty
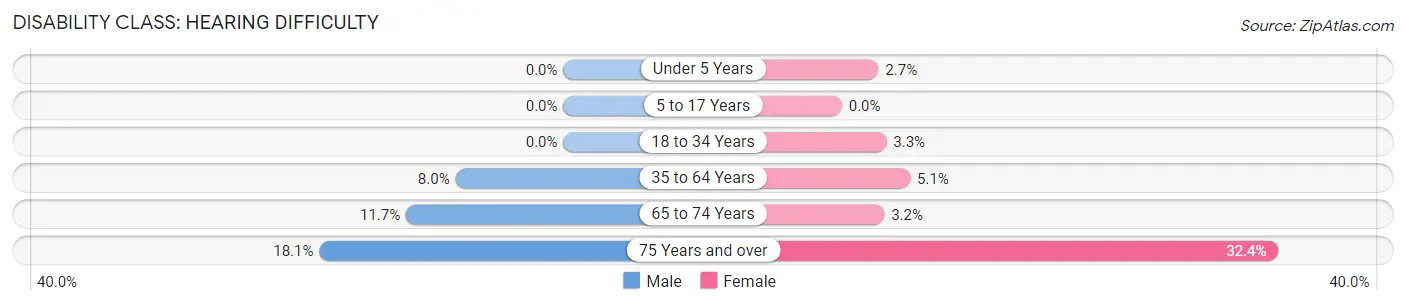
| Age Bracket | Male | Female |
| Under 5 Years | 0 (0.0%) | 16 (2.7%) |
| 5 to 17 Years | 0 (0.0%) | 0 (0.0%) |
| 18 to 34 Years | 0 (0.0%) | 52 (3.3%) |
| 35 to 64 Years | 216 (8.0%) | 165 (5.1%) |
| 65 to 74 Years | 111 (11.7%) | 37 (3.2%) |
| 75 Years and over | 127 (18.1%) | 198 (32.4%) |
Disability Class: Vision Difficulty
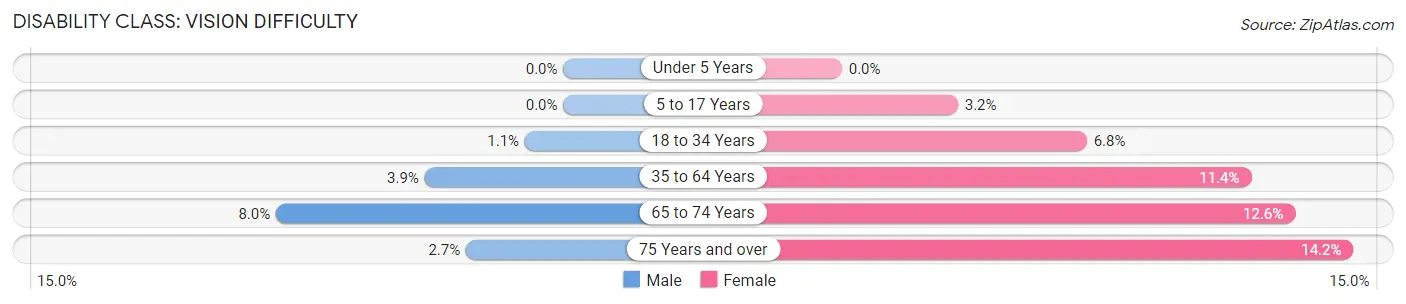
| Age Bracket | Male | Female |
| Under 5 Years | 0 (0.0%) | 0 (0.0%) |
| 5 to 17 Years | 0 (0.0%) | 44 (3.2%) |
| 18 to 34 Years | 18 (1.1%) | 107 (6.8%) |
| 35 to 64 Years | 104 (3.9%) | 371 (11.4%) |
| 65 to 74 Years | 76 (8.0%) | 148 (12.6%) |
| 75 Years and over | 19 (2.7%) | 87 (14.2%) |
Disability Class: Cognitive Difficulty
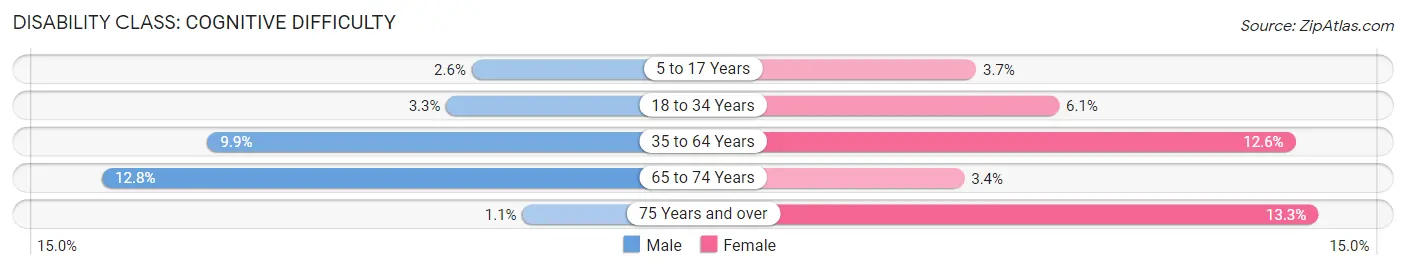
| Age Bracket | Male | Female |
| 5 to 17 Years | 51 (2.5%) | 51 (3.7%) |
| 18 to 34 Years | 55 (3.3%) | 95 (6.0%) |
| 35 to 64 Years | 267 (9.9%) | 411 (12.6%) |
| 65 to 74 Years | 122 (12.8%) | 40 (3.4%) |
| 75 Years and over | 8 (1.1%) | 81 (13.3%) |
Disability Class: Ambulatory Difficulty
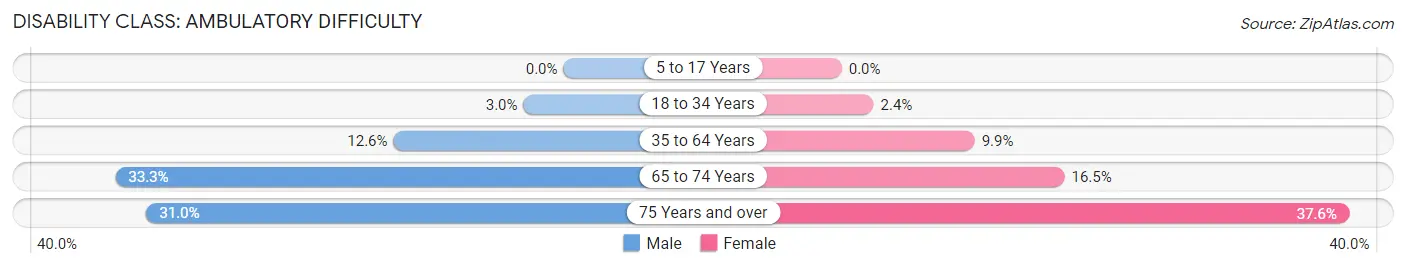
| Age Bracket | Male | Female |
| 5 to 17 Years | 0 (0.0%) | 0 (0.0%) |
| 18 to 34 Years | 50 (3.0%) | 37 (2.4%) |
| 35 to 64 Years | 340 (12.6%) | 321 (9.9%) |
| 65 to 74 Years | 316 (33.3%) | 194 (16.5%) |
| 75 Years and over | 217 (31.0%) | 230 (37.6%) |
Disability Class: Self-Care Difficulty
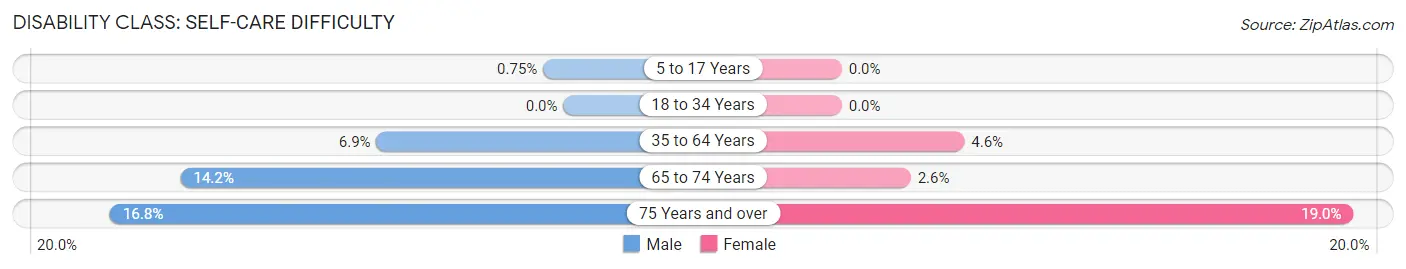
| Age Bracket | Male | Female |
| 5 to 17 Years | 15 (0.7%) | 0 (0.0%) |
| 18 to 34 Years | 0 (0.0%) | 0 (0.0%) |
| 35 to 64 Years | 187 (6.9%) | 148 (4.5%) |
| 65 to 74 Years | 135 (14.2%) | 30 (2.6%) |
| 75 Years and over | 118 (16.8%) | 116 (19.0%) |
Technology Access in Los Lunas
Computing Device Access in Los Lunas
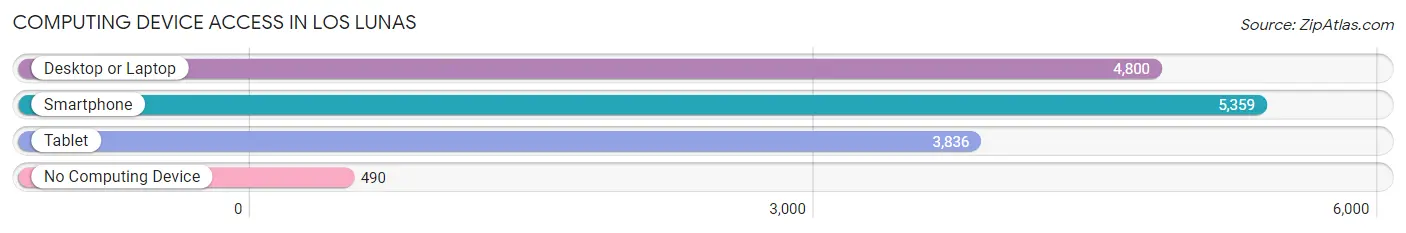
| Device Type | # Households | % Households |
| Desktop or Laptop | 4,800 | 76.0% |
| Smartphone | 5,359 | 84.9% |
| Tablet | 3,836 | 60.7% |
| No Computing Device | 490 | 7.8% |
| Total | 6,316 | 100.0% |
Internet Access in Los Lunas
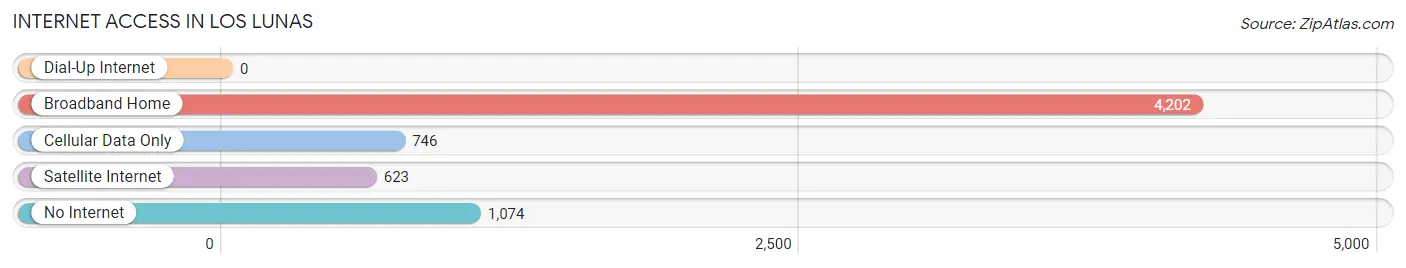
| Internet Type | # Households | % Households |
| Dial-Up Internet | 0 | 0.0% |
| Broadband Home | 4,202 | 66.5% |
| Cellular Data Only | 746 | 11.8% |
| Satellite Internet | 623 | 9.9% |
| No Internet | 1,074 | 17.0% |
| Total | 6,316 | 100.0% |
Los Lunas Summary
Lunas, New Mexico is a small village located in Valencia County, New Mexico. It is situated in the Rio Grande Valley, about 25 miles south of Albuquerque. The village is named after the nearby Luna family, who were among the first settlers in the area. The population of Los Lunas was estimated to be 14,835 in 2019.
Geography
Los Lunas is located in the Rio Grande Valley, which is a large valley that stretches from the Rio Grande River in the south to the Sandia Mountains in the north. The village is situated at an elevation of 4,945 feet above sea level. The climate in Los Lunas is semi-arid, with hot summers and mild winters. The average annual precipitation is about 11 inches.
The village is located along Interstate 25, which is the main highway connecting Albuquerque to Las Cruces. The village is also served by two railroads, the Burlington Northern Santa Fe and the Union Pacific.
History
The area around Los Lunas has been inhabited for thousands of years by Native American tribes, including the Pueblo, Apache, and Navajo. The first European settlers arrived in the area in the late 1700s, and the village was officially founded in 1835.
The village was originally called El Rancho de los Lunas, and was named after the Luna family, who were among the first settlers in the area. The village was incorporated in 1876, and the name was changed to Los Lunas.
Economy
Los Lunas is a small village, and the economy is largely based on agriculture and tourism. The village is home to several small businesses, including restaurants, shops, and art galleries. The village is also home to several industrial parks, which provide jobs in manufacturing and other industries.
The village is also home to several educational institutions, including Los Lunas High School, Los Lunas Middle School, and Los Lunas Elementary School. The village is also home to the University of New Mexico Valencia Campus, which offers a variety of degree programs.
Demographics
As of the 2019 census, the population of Los Lunas was estimated to be 14,835. The racial makeup of the village was 73.3% White, 1.3% African American, 1.2% Native American, 0.7% Asian, 0.1% Pacific Islander, 19.7% from other races, and 3.9% from two or more races. Hispanic or Latino of any race were 44.3% of the population.
The median household income in Los Lunas was $41,945, and the median family income was $50,945. The per capita income was $20,945. About 16.3% of the population was below the poverty line.
Conclusion
Los Lunas is a small village located in Valencia County, New Mexico. It is situated in the Rio Grande Valley, about 25 miles south of Albuquerque. The village is named after the nearby Luna family, who were among the first settlers in the area. The population of Los Lunas was estimated to be 14,835 in 2019. The economy of the village is largely based on agriculture and tourism, and the village is home to several small businesses, industrial parks, and educational institutions. The racial makeup of the village was 73.3% White, 1.3% African American, 1.2% Native American, 0.7% Asian, 0.1% Pacific Islander, 19.7% from other races, and 3.9% from two or more races. The median household income in Los Lunas was $41,945, and the median family income was $50,945. About 16.3% of the population was below the poverty line.
Common Questions
What is Per Capita Income in Los Lunas?
Per Capita income in Los Lunas is $29,534.
What is the Median Family Income in Los Lunas?
Median Family Income in Los Lunas is $79,857.
What is the Median Household income in Los Lunas?
Median Household Income in Los Lunas is $68,934.
What is Income or Wage Gap in Los Lunas?
Income or Wage Gap in Los Lunas is 20.7%.
Women in Los Lunas earn 79.3 cents for every dollar earned by a man.
What is Family Income Deficit in Los Lunas?
Family Income Deficit in Los Lunas is $12,279.
Families that are below poverty line in Los Lunas earn $12,279 less on average than the poverty threshold level.
What is Inequality or Gini Index in Los Lunas?
Inequality or Gini Index in Los Lunas is 0.40.
What is the Total Population of Los Lunas?
Total Population of Los Lunas is 17,452.
What is the Total Male Population of Los Lunas?
Total Male Population of Los Lunas is 8,863.
What is the Total Female Population of Los Lunas?
Total Female Population of Los Lunas is 8,589.
What is the Ratio of Males per 100 Females in Los Lunas?
There are 103.19 Males per 100 Females in Los Lunas.
What is the Ratio of Females per 100 Males in Los Lunas?
There are 96.91 Females per 100 Males in Los Lunas.
What is the Median Population Age in Los Lunas?
Median Population Age in Los Lunas is 38.3 Years.
What is the Average Family Size in Los Lunas
Average Family Size in Los Lunas is 3.5 People.
What is the Average Household Size in Los Lunas
Average Household Size in Los Lunas is 2.7 People.
How Large is the Labor Force in Los Lunas?
There are 6,910 People in the Labor Forcein in Los Lunas.
What is the Percentage of People in the Labor Force in Los Lunas?
51.7% of People are in the Labor Force in Los Lunas.
What is the Unemployment Rate in Los Lunas?
Unemployment Rate in Los Lunas is 5.3%.