San Miguel County, NM Map & Demographics
San Miguel County Map
San Miguel County Overview
$26,314
PER CAPITA INCOME
$53,204
AVG FAMILY INCOME
$43,490
AVG HOUSEHOLD INCOME
18.3%
WAGE / INCOME GAP [ % ]
81.7¢/ $1
WAGE / INCOME GAP [ $ ]
$9,730
FAMILY INCOME DEFICIT
0.47
INEQUALITY / GINI INDEX
27,215
TOTAL POPULATION
13,545
MALE POPULATION
13,670
FEMALE POPULATION
99.09
MALES / 100 FEMALES
100.92
FEMALES / 100 MALES
45.0
MEDIAN AGE
2.9
AVG FAMILY SIZE
2.2
AVG HOUSEHOLD SIZE
11,773
LABOR FORCE [ PEOPLE ]
50.3%
PERCENT IN LABOR FORCE
6.9%
UNEMPLOYMENT RATE
Income in San Miguel County
Income Overview in San Miguel County
Per Capita Income in San Miguel County is $26,314, while median incomes of families and households are $53,204 and $43,490 respectively.
| Characteristic | Number | Measure |
| Per Capita Income | 27,215 | $26,314 |
| Median Family Income | 6,571 | $53,204 |
| Mean Family Income | 6,571 | $72,080 |
| Median Household Income | 11,586 | $43,490 |
| Mean Household Income | 11,586 | $59,418 |
| Income Deficit | 6,571 | $9,730 |
| Wage / Income Gap (%) | 27,215 | 18.32% |
| Wage / Income Gap ($) | 27,215 | 81.68¢ per $1 |
| Gini / Inequality Index | 27,215 | 0.47 |
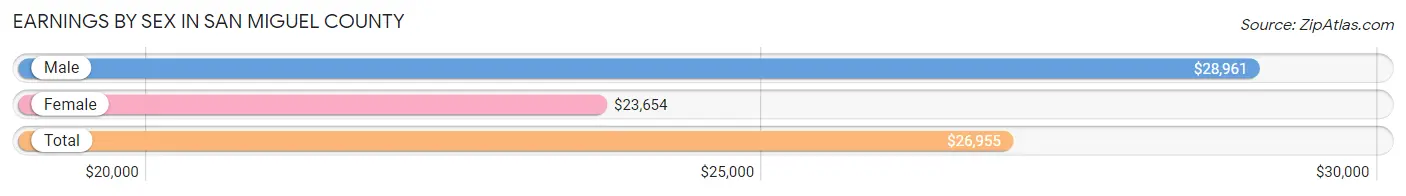
Earnings by Sex in San Miguel County
Average Earnings in San Miguel County are $26,955, $28,961 for men and $23,654 for women, a difference of 18.3%.
| Sex | Number | Average Earnings |
| Male | 6,037 (49.2%) | $28,961 |
| Female | 6,231 (50.8%) | $23,654 |
| Total | 12,268 (100.0%) | $26,955 |
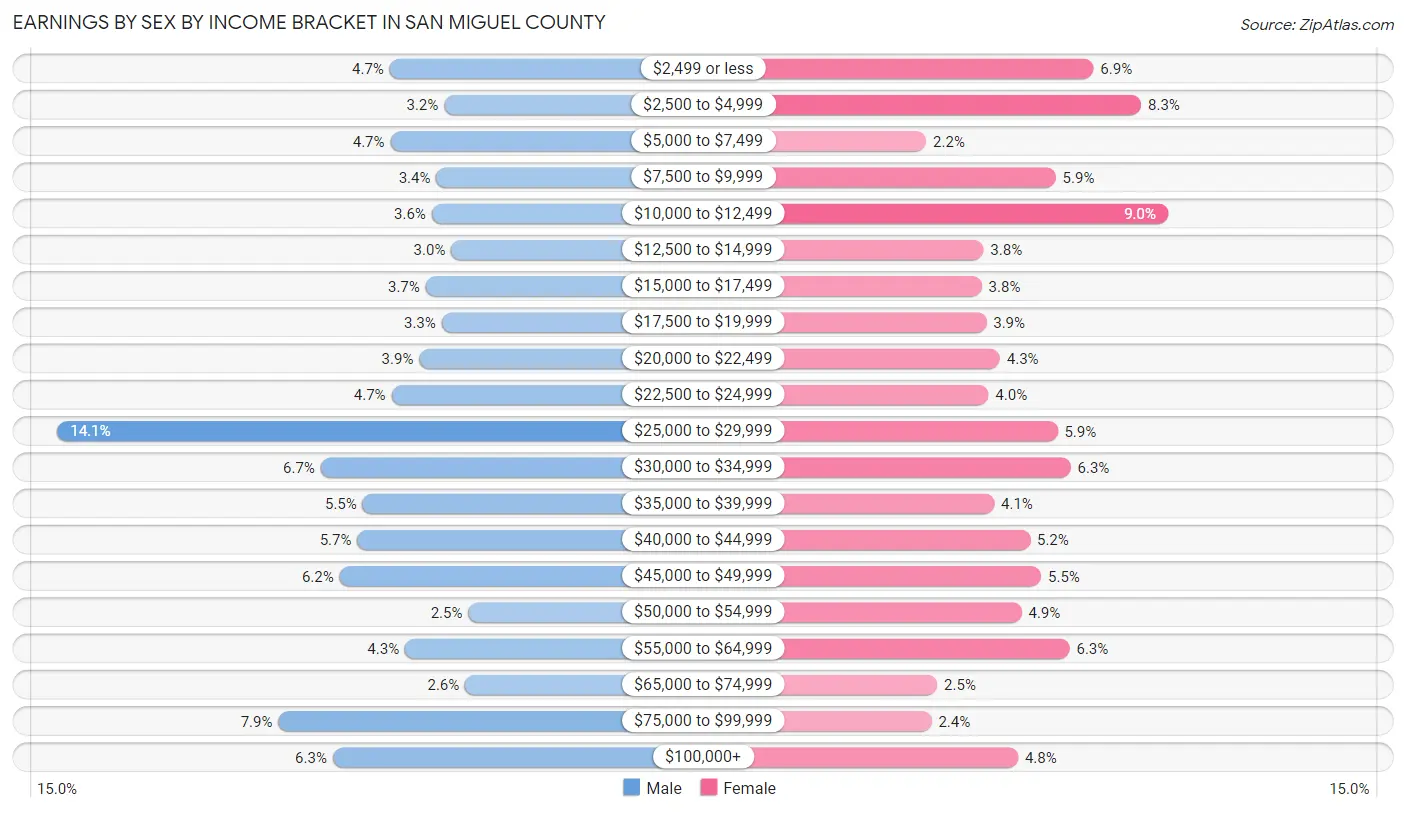
Earnings by Sex by Income Bracket in San Miguel County
The most common earnings brackets in San Miguel County are $25,000 to $29,999 for men (850 | 14.1%) and $10,000 to $12,499 for women (562 | 9.0%).
| Income | Male | Female |
| $2,499 or less | 286 (4.7%) | 432 (6.9%) |
| $2,500 to $4,999 | 194 (3.2%) | 515 (8.3%) |
| $5,000 to $7,499 | 285 (4.7%) | 139 (2.2%) |
| $7,500 to $9,999 | 207 (3.4%) | 366 (5.9%) |
| $10,000 to $12,499 | 215 (3.6%) | 562 (9.0%) |
| $12,500 to $14,999 | 182 (3.0%) | 239 (3.8%) |
| $15,000 to $17,499 | 225 (3.7%) | 236 (3.8%) |
| $17,500 to $19,999 | 198 (3.3%) | 244 (3.9%) |
| $20,000 to $22,499 | 236 (3.9%) | 268 (4.3%) |
| $22,500 to $24,999 | 283 (4.7%) | 248 (4.0%) |
| $25,000 to $29,999 | 850 (14.1%) | 369 (5.9%) |
| $30,000 to $34,999 | 403 (6.7%) | 392 (6.3%) |
| $35,000 to $39,999 | 332 (5.5%) | 258 (4.1%) |
| $40,000 to $44,999 | 341 (5.7%) | 321 (5.1%) |
| $45,000 to $49,999 | 371 (6.1%) | 340 (5.5%) |
| $50,000 to $54,999 | 153 (2.5%) | 306 (4.9%) |
| $55,000 to $64,999 | 260 (4.3%) | 390 (6.3%) |
| $65,000 to $74,999 | 158 (2.6%) | 158 (2.5%) |
| $75,000 to $99,999 | 475 (7.9%) | 148 (2.4%) |
| $100,000+ | 383 (6.3%) | 300 (4.8%) |
| Total | 6,037 (100.0%) | 6,231 (100.0%) |
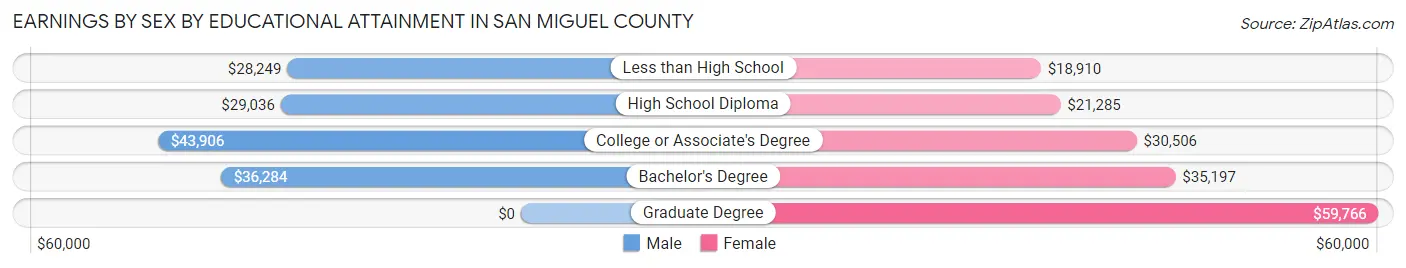
Earnings by Sex by Educational Attainment in San Miguel County
Average earnings in San Miguel County are $33,826 for men and $28,371 for women, a difference of 16.1%. Men with an educational attainment of college or associate's degree enjoy the highest average annual earnings of $43,906, while those with less than high school education earn the least with $28,249. Women with an educational attainment of graduate degree earn the most with the average annual earnings of $59,766, while those with less than high school education have the smallest earnings of $18,910.
| Educational Attainment | Male Income | Female Income |
| Less than High School | $28,249 | $18,910 |
| High School Diploma | $29,036 | $21,285 |
| College or Associate's Degree | $43,906 | $30,506 |
| Bachelor's Degree | $36,284 | $35,197 |
| Graduate Degree | - | - |
| Total | $33,826 | $28,371 |
Family Income in San Miguel County
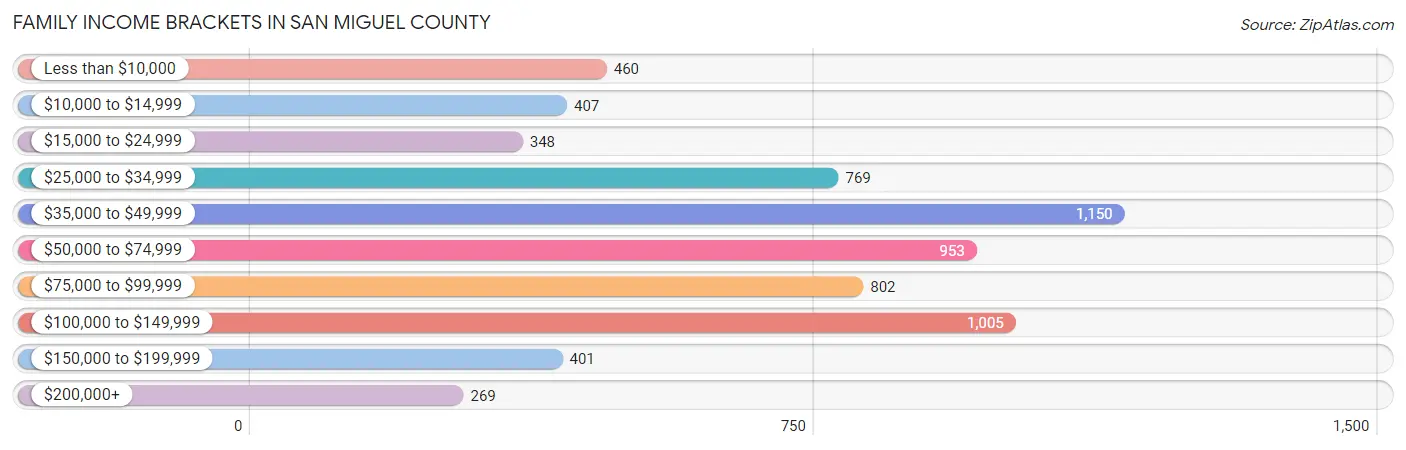
Family Income Brackets in San Miguel County
According to the San Miguel County family income data, there are 1,150 families falling into the $35,000 to $49,999 income range, which is the most common income bracket and makes up 17.5% of all families. Conversely, the $200,000+ income bracket is the least frequent group with only 269 families (4.1%) belonging to this category.
| Income Bracket | # Families | % Families |
| Less than $10,000 | 460 | 7.0% |
| $10,000 to $14,999 | 407 | 6.2% |
| $15,000 to $24,999 | 348 | 5.3% |
| $25,000 to $34,999 | 769 | 11.7% |
| $35,000 to $49,999 | 1,150 | 17.5% |
| $50,000 to $74,999 | 953 | 14.5% |
| $75,000 to $99,999 | 802 | 12.2% |
| $100,000 to $149,999 | 1,005 | 15.3% |
| $150,000 to $199,999 | 401 | 6.1% |
| $200,000+ | 269 | 4.1% |
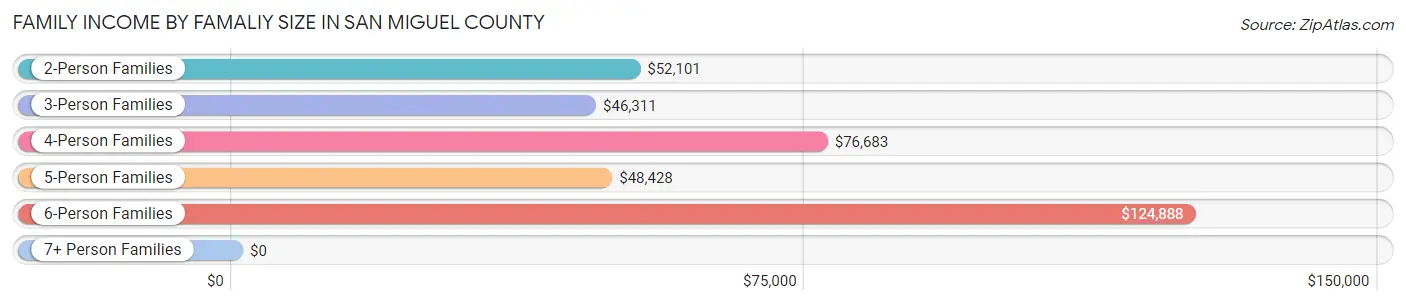
Family Income by Famaliy Size in San Miguel County
6-person families (221 | 3.4%) account for the highest median family income in San Miguel County with $124,888 per family, while 2-person families (3,841 | 58.5%) have the highest median income of $26,050 per family member.
| Income Bracket | # Families | Median Income |
| 2-Person Families | 3,841 (58.5%) | $52,101 |
| 3-Person Families | 1,362 (20.7%) | $46,311 |
| 4-Person Families | 655 (10.0%) | $76,683 |
| 5-Person Families | 375 (5.7%) | $48,428 |
| 6-Person Families | 221 (3.4%) | $124,888 |
| 7+ Person Families | 117 (1.8%) | $0 |
| Total | 6,571 (100.0%) | $53,204 |
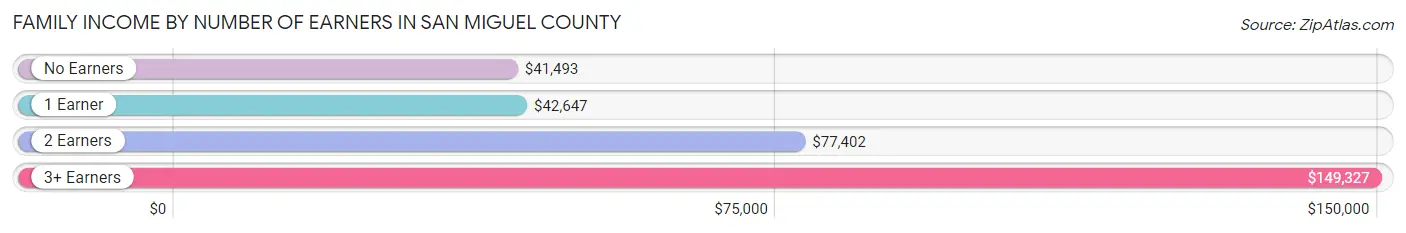
Family Income by Number of Earners in San Miguel County
The median family income in San Miguel County is $53,204, with families comprising 3+ earners (609) having the highest median family income of $149,327, while families with no earners (1,782) have the lowest median family income of $41,493, accounting for 9.3% and 27.1% of families, respectively.
| Number of Earners | # Families | Median Income |
| No Earners | 1,782 (27.1%) | $41,493 |
| 1 Earner | 2,638 (40.2%) | $42,647 |
| 2 Earners | 1,542 (23.5%) | $77,402 |
| 3+ Earners | 609 (9.3%) | $149,327 |
| Total | 6,571 (100.0%) | $53,204 |
Household Income in San Miguel County
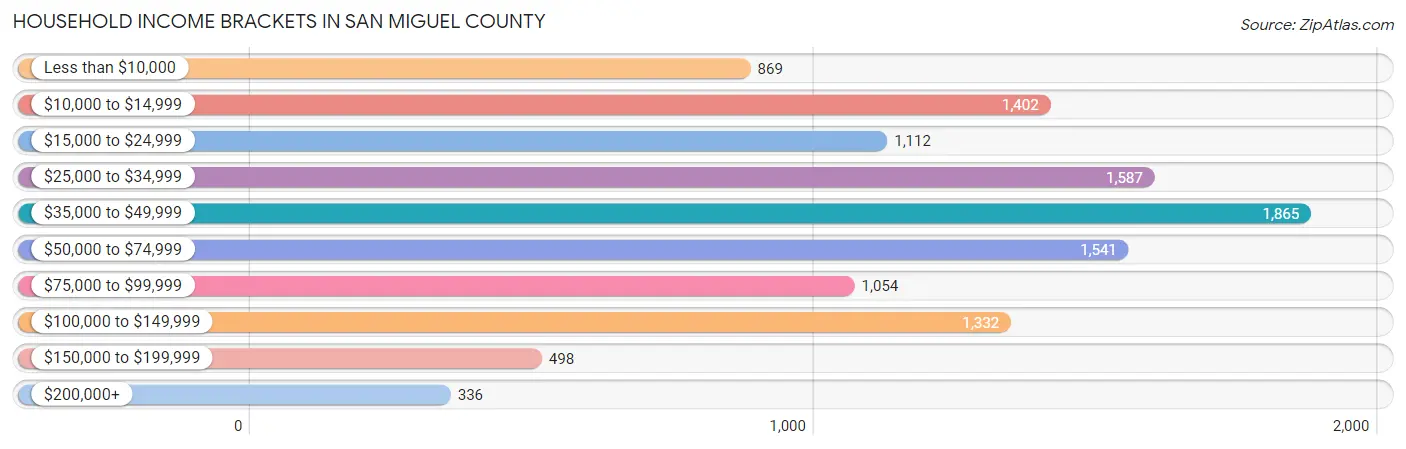
Household Income Brackets in San Miguel County
With 1,865 households falling in the category, the $35,000 to $49,999 income range is the most frequent in San Miguel County, accounting for 16.1% of all households. In contrast, only 336 households (2.9%) fall into the $200,000+ income bracket, making it the least populous group.
| Income Bracket | # Households | % Households |
| Less than $10,000 | 869 | 7.5% |
| $10,000 to $14,999 | 1,402 | 12.1% |
| $15,000 to $24,999 | 1,112 | 9.6% |
| $25,000 to $34,999 | 1,587 | 13.7% |
| $35,000 to $49,999 | 1,865 | 16.1% |
| $50,000 to $74,999 | 1,541 | 13.3% |
| $75,000 to $99,999 | 1,054 | 9.1% |
| $100,000 to $149,999 | 1,332 | 11.5% |
| $150,000 to $199,999 | 498 | 4.3% |
| $200,000+ | 336 | 2.9% |
Household Income by Householder Age in San Miguel County
The median household income in San Miguel County is $43,490, with the highest median household income of $50,305 found in the 45 to 64 years age bracket for the primary householder. A total of 4,293 households (37.0%) fall into this category. Meanwhile, the 15 to 24 years age bracket for the primary householder has the lowest median household income of $0, with 458 households (4.0%) in this group.
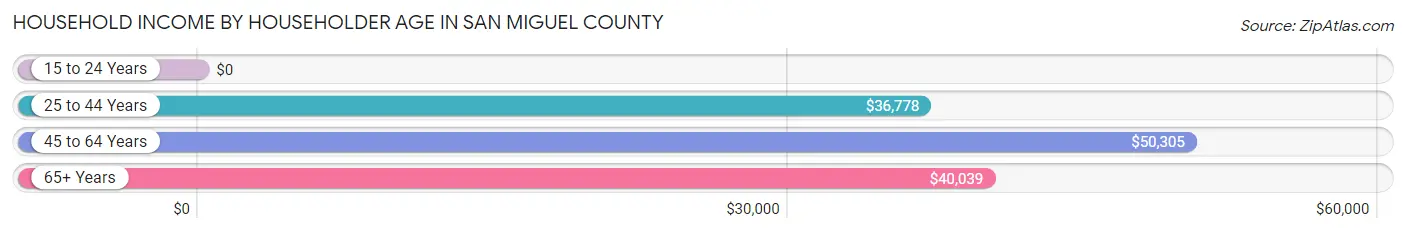
| Income Bracket | # Households | Median Income |
| 15 to 24 Years | 458 (4.0%) | $0 |
| 25 to 44 Years | 2,574 (22.2%) | $36,778 |
| 45 to 64 Years | 4,293 (37.0%) | $50,305 |
| 65+ Years | 4,261 (36.8%) | $40,039 |
| Total | 11,586 (100.0%) | $43,490 |
Poverty in San Miguel County
Income Below Poverty by Sex and Age in San Miguel County
With 22.6% poverty level for males and 24.5% for females among the residents of San Miguel County, 15 year old males and 5 year old females are the most vulnerable to poverty, with 31 males (55.4%) and 90 females (53.6%) in their respective age groups living below the poverty level.
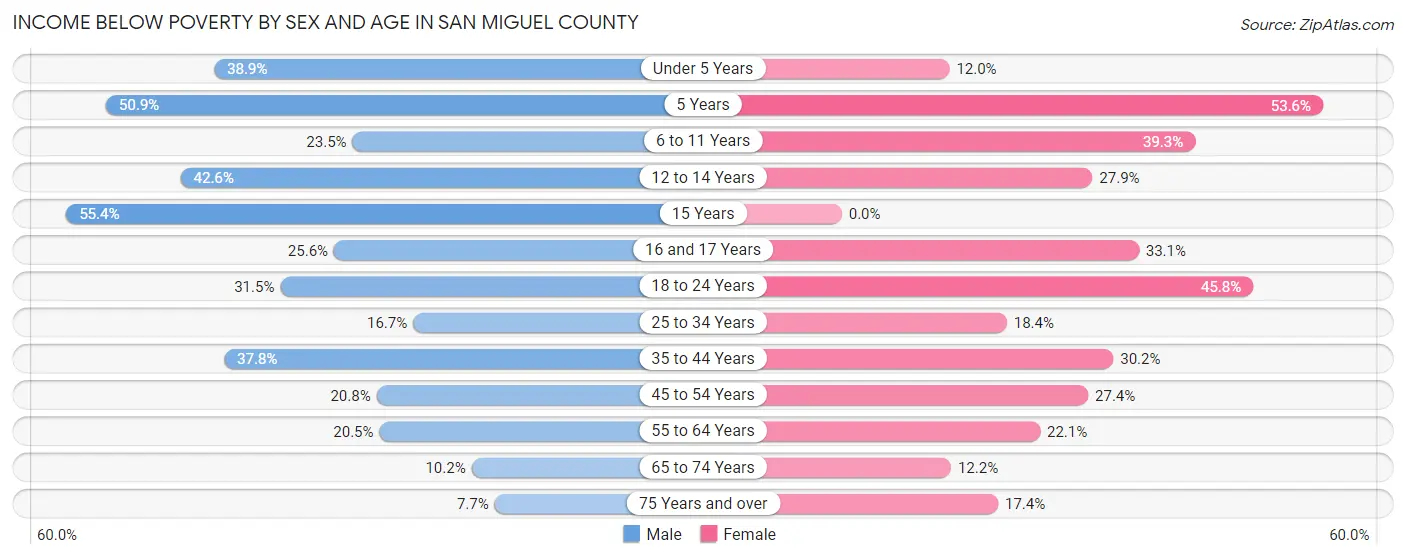
| Age Bracket | Male | Female |
| Under 5 Years | 203 (38.9%) | 70 (12.0%) |
| 5 Years | 27 (50.9%) | 90 (53.6%) |
| 6 to 11 Years | 183 (23.5%) | 273 (39.3%) |
| 12 to 14 Years | 176 (42.6%) | 96 (27.9%) |
| 15 Years | 31 (55.4%) | 0 (0.0%) |
| 16 and 17 Years | 81 (25.6%) | 130 (33.1%) |
| 18 to 24 Years | 355 (31.5%) | 480 (45.8%) |
| 25 to 34 Years | 279 (16.7%) | 243 (18.4%) |
| 35 to 44 Years | 552 (37.8%) | 466 (30.2%) |
| 45 to 54 Years | 322 (20.8%) | 415 (27.4%) |
| 55 to 64 Years | 419 (20.5%) | 473 (22.1%) |
| 65 to 74 Years | 172 (10.2%) | 238 (12.2%) |
| 75 Years and over | 85 (7.7%) | 233 (17.4%) |
| Total | 2,885 (22.6%) | 3,207 (24.5%) |
Income Above Poverty by Sex and Age in San Miguel County
According to the poverty statistics in San Miguel County, males aged 75 years and over and females aged 15 years are the age groups that are most secure financially, with 92.3% of males and 100.0% of females in these age groups living above the poverty line.
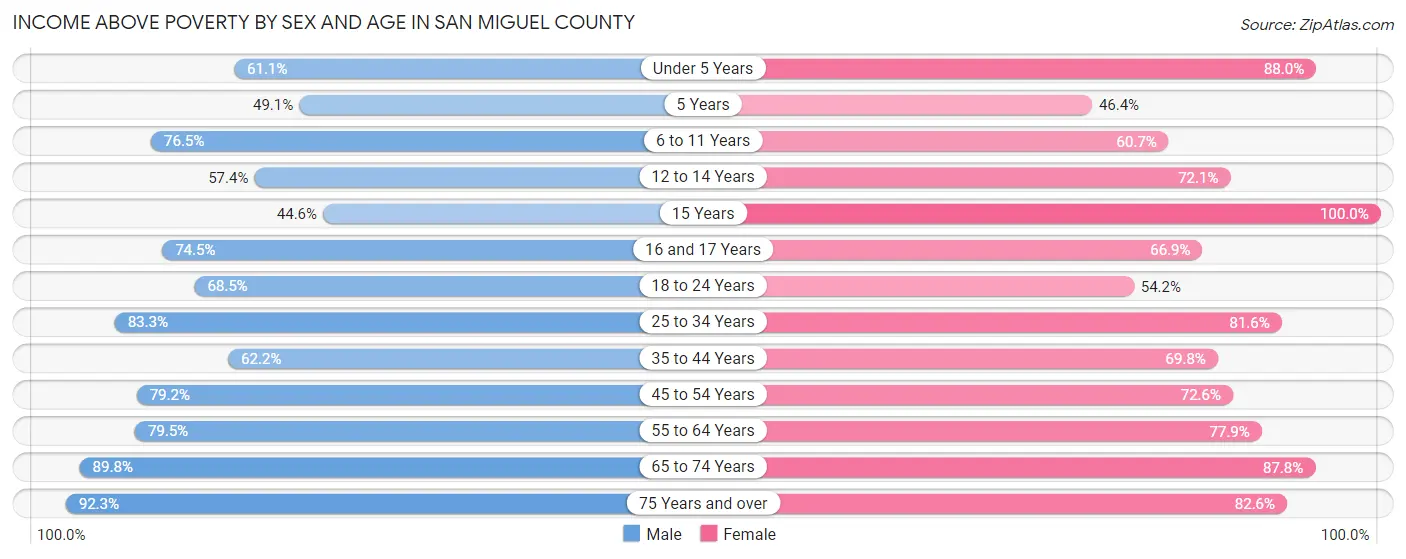
| Age Bracket | Male | Female |
| Under 5 Years | 319 (61.1%) | 514 (88.0%) |
| 5 Years | 26 (49.1%) | 78 (46.4%) |
| 6 to 11 Years | 596 (76.5%) | 421 (60.7%) |
| 12 to 14 Years | 237 (57.4%) | 248 (72.1%) |
| 15 Years | 25 (44.6%) | 55 (100.0%) |
| 16 and 17 Years | 236 (74.5%) | 263 (66.9%) |
| 18 to 24 Years | 771 (68.5%) | 568 (54.2%) |
| 25 to 34 Years | 1,388 (83.3%) | 1,079 (81.6%) |
| 35 to 44 Years | 909 (62.2%) | 1,075 (69.8%) |
| 45 to 54 Years | 1,225 (79.2%) | 1,098 (72.6%) |
| 55 to 64 Years | 1,626 (79.5%) | 1,669 (77.9%) |
| 65 to 74 Years | 1,510 (89.8%) | 1,720 (87.8%) |
| 75 Years and over | 1,025 (92.3%) | 1,106 (82.6%) |
| Total | 9,893 (77.4%) | 9,894 (75.5%) |
Income Below Poverty Among Married-Couple Families in San Miguel County
The poverty statistics for married-couple families in San Miguel County show that 12.2% or 492 of the total 4,019 families live below the poverty line. Families with 3 or 4 children have the highest poverty rate of 52.7%, comprising of 116 families. On the other hand, families with no children have the lowest poverty rate of 8.8%, which includes 259 families.
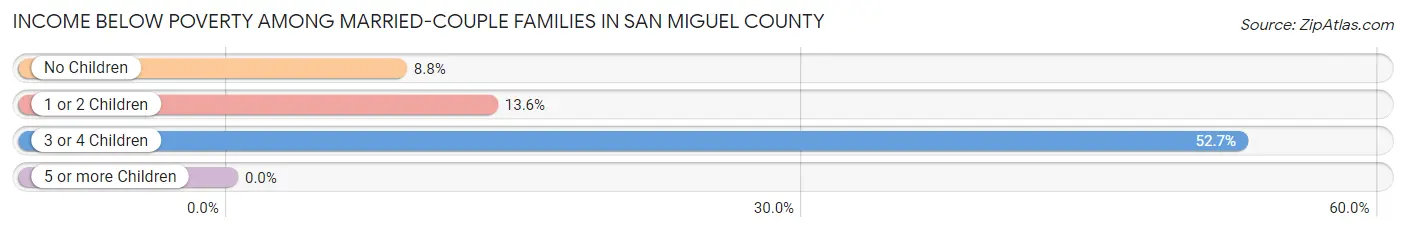
| Children | Above Poverty | Below Poverty |
| No Children | 2,678 (91.2%) | 259 (8.8%) |
| 1 or 2 Children | 745 (86.4%) | 117 (13.6%) |
| 3 or 4 Children | 104 (47.3%) | 116 (52.7%) |
| 5 or more Children | 0 (0.0%) | 0 (0.0%) |
| Total | 3,527 (87.8%) | 492 (12.2%) |
Income Below Poverty Among Single-Parent Households in San Miguel County
According to the poverty data in San Miguel County, 24.1% or 199 single-father households and 30.2% or 522 single-mother households are living below the poverty line. Among single-father households, those with 3 or 4 children have the highest poverty rate, with 18 households (64.3%) experiencing poverty. Likewise, among single-mother households, those with 1 or 2 children have the highest poverty rate, with 339 households (37.9%) falling below the poverty line.
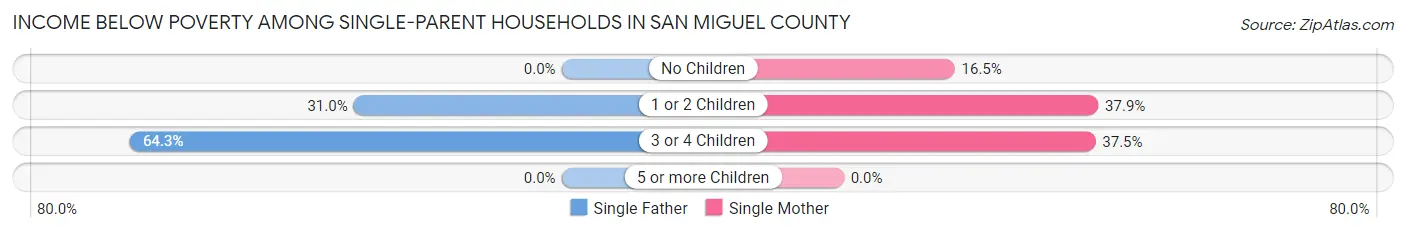
| Children | Single Father | Single Mother |
| No Children | 0 (0.0%) | 102 (16.5%) |
| 1 or 2 Children | 181 (31.0%) | 339 (37.9%) |
| 3 or 4 Children | 18 (64.3%) | 81 (37.5%) |
| 5 or more Children | 0 (0.0%) | 0 (0.0%) |
| Total | 199 (24.1%) | 522 (30.2%) |
Income Below Poverty Among Married-Couple vs Single-Parent Households in San Miguel County
The poverty data for San Miguel County shows that 492 of the married-couple family households (12.2%) and 721 of the single-parent households (28.2%) are living below the poverty level. Within the married-couple family households, those with 3 or 4 children have the highest poverty rate, with 116 households (52.7%) falling below the poverty line. Among the single-parent households, those with 3 or 4 children have the highest poverty rate, with 99 household (40.6%) living below poverty.
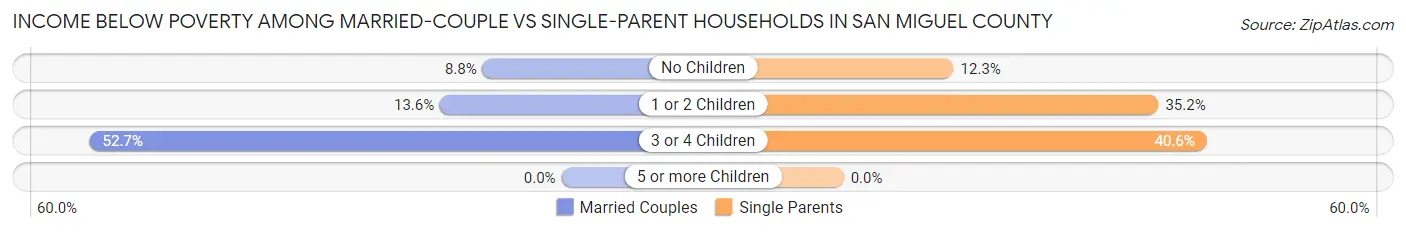
| Children | Married-Couple Families | Single-Parent Households |
| No Children | 259 (8.8%) | 102 (12.3%) |
| 1 or 2 Children | 117 (13.6%) | 520 (35.2%) |
| 3 or 4 Children | 116 (52.7%) | 99 (40.6%) |
| 5 or more Children | 0 (0.0%) | 0 (0.0%) |
| Total | 492 (12.2%) | 721 (28.2%) |
Race in San Miguel County
The most populous races in San Miguel County are Hispanic or Latino (21,232 | 78.0%), White / Caucasian (15,331 | 56.3%), and Some other Race (6,024 | 22.1%).
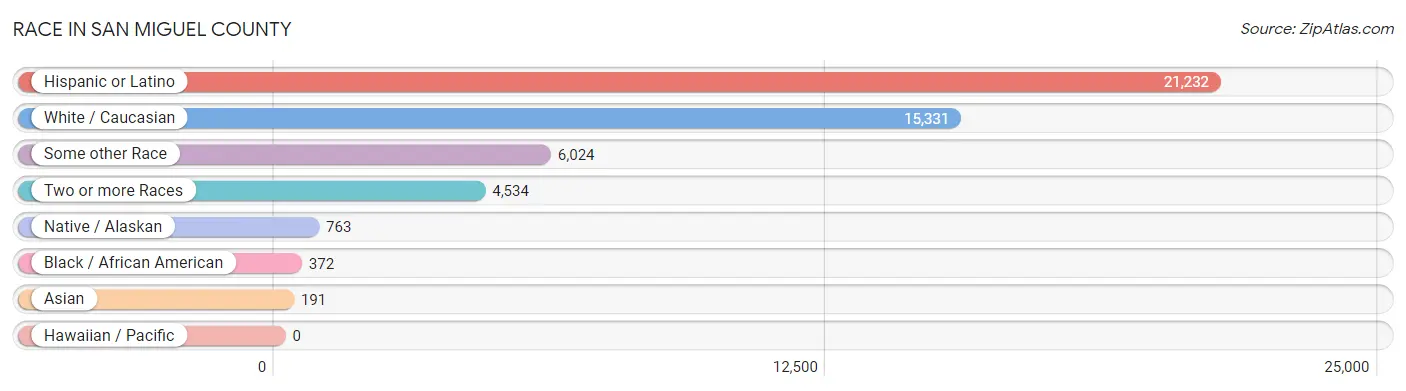
| Race | # Population | % Population |
| Asian | 191 | 0.7% |
| Black / African American | 372 | 1.4% |
| Hawaiian / Pacific | 0 | 0.0% |
| Hispanic or Latino | 21,232 | 78.0% |
| Native / Alaskan | 763 | 2.8% |
| White / Caucasian | 15,331 | 56.3% |
| Two or more Races | 4,534 | 16.7% |
| Some other Race | 6,024 | 22.1% |
| Total | 27,215 | 100.0% |
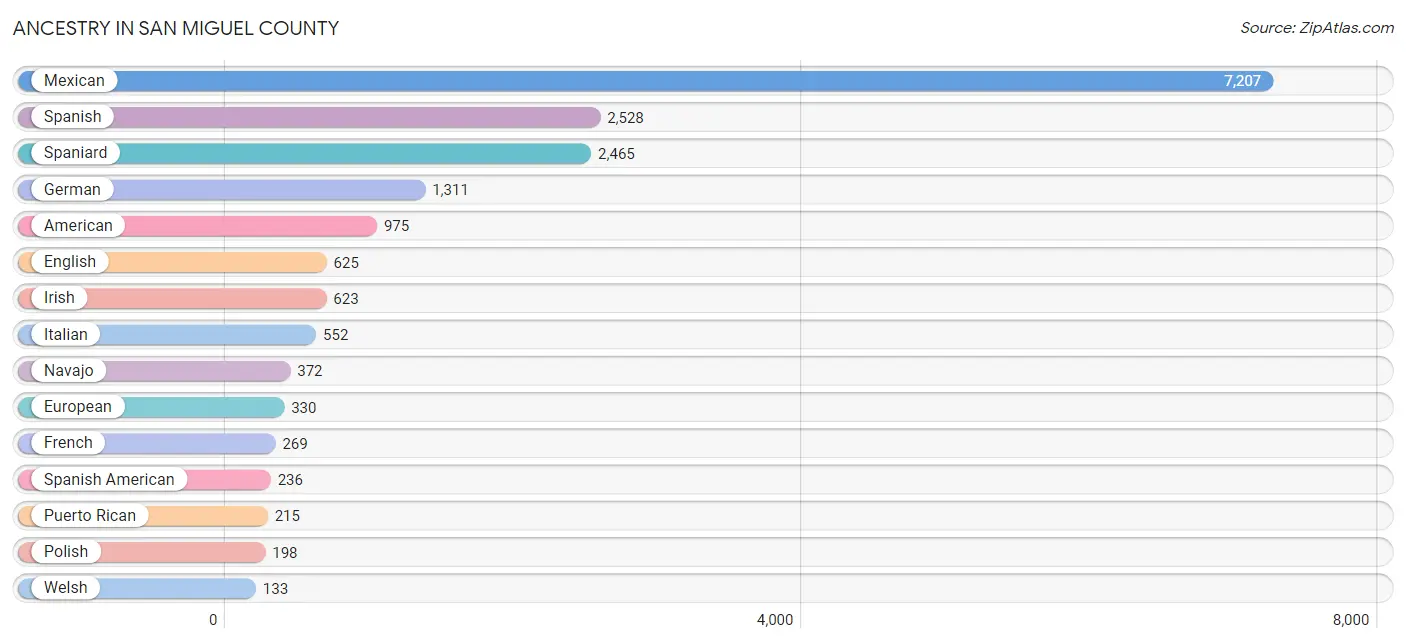
Ancestry in San Miguel County
The most populous ancestries reported in San Miguel County are Mexican (7,207 | 26.5%), Spanish (2,528 | 9.3%), Spaniard (2,465 | 9.1%), German (1,311 | 4.8%), and American (975 | 3.6%), together accounting for 53.2% of all San Miguel County residents.
| Ancestry | # Population | % Population |
| Afghan | 36 | 0.1% |
| African | 9 | 0.0% |
| American | 975 | 3.6% |
| Apache | 118 | 0.4% |
| Arab | 32 | 0.1% |
| Austrian | 20 | 0.1% |
| Belgian | 7 | 0.0% |
| Bhutanese | 68 | 0.3% |
| British | 106 | 0.4% |
| Burmese | 94 | 0.4% |
| Central American | 18 | 0.1% |
| Cherokee | 20 | 0.1% |
| Choctaw | 35 | 0.1% |
| Cuban | 44 | 0.2% |
| Czech | 60 | 0.2% |
| Dutch | 70 | 0.3% |
| Eastern European | 19 | 0.1% |
| English | 625 | 2.3% |
| European | 330 | 1.2% |
| Finnish | 7 | 0.0% |
| French | 269 | 1.0% |
| French Canadian | 22 | 0.1% |
| German | 1,311 | 4.8% |
| Greek | 39 | 0.1% |
| Guatemalan | 7 | 0.0% |
| Hungarian | 7 | 0.0% |
| Indian (Asian) | 8 | 0.0% |
| Irish | 623 | 2.3% |
| Israeli | 4 | 0.0% |
| Italian | 552 | 2.0% |
| Jamaican | 63 | 0.2% |
| Kenyan | 3 | 0.0% |
| Korean | 3 | 0.0% |
| Lebanese | 11 | 0.0% |
| Mexican | 7,207 | 26.5% |
| Mexican American Indian | 39 | 0.1% |
| Navajo | 372 | 1.4% |
| Nigerian | 2 | 0.0% |
| Northern European | 37 | 0.1% |
| Norwegian | 54 | 0.2% |
| Pakistani | 16 | 0.1% |
| Peruvian | 21 | 0.1% |
| Polish | 198 | 0.7% |
| Portuguese | 25 | 0.1% |
| Pueblo | 78 | 0.3% |
| Puerto Rican | 215 | 0.8% |
| Russian | 27 | 0.1% |
| Scandinavian | 27 | 0.1% |
| Scotch-Irish | 76 | 0.3% |
| Scottish | 76 | 0.3% |
| Serbian | 37 | 0.1% |
| Sierra Leonean | 2 | 0.0% |
| Sioux | 11 | 0.0% |
| Slovene | 11 | 0.0% |
| South American | 21 | 0.1% |
| Spaniard | 2,465 | 9.1% |
| Spanish | 2,528 | 9.3% |
| Spanish American | 236 | 0.9% |
| Sri Lankan | 16 | 0.1% |
| Subsaharan African | 16 | 0.1% |
| Swedish | 78 | 0.3% |
| Vietnamese | 3 | 0.0% |
| Welsh | 133 | 0.5% |
| Yugoslavian | 12 | 0.0% | View All 64 Rows |
Immigrants in San Miguel County
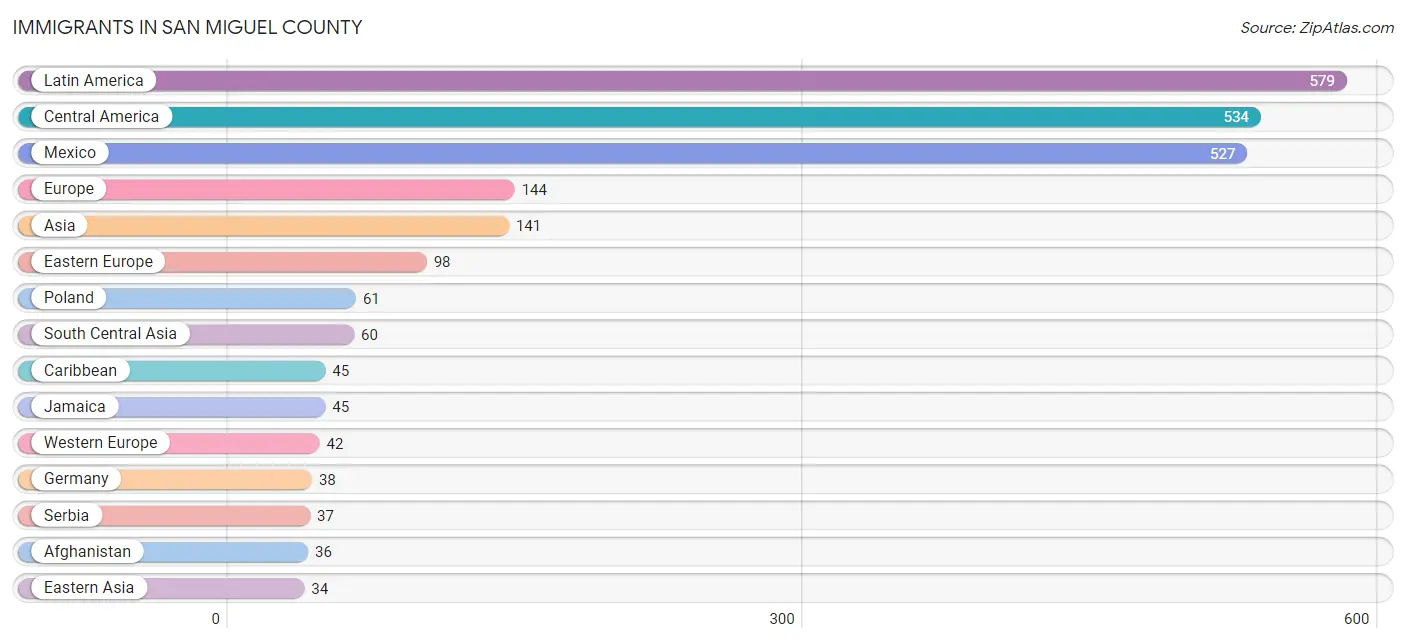
The most numerous immigrant groups reported in San Miguel County came from Latin America (579 | 2.1%), Central America (534 | 2.0%), Mexico (527 | 1.9%), Europe (144 | 0.5%), and Asia (141 | 0.5%), together accounting for 7.1% of all San Miguel County residents.
| Immigration Origin | # Population | % Population |
| Afghanistan | 36 | 0.1% |
| Africa | 5 | 0.0% |
| Asia | 141 | 0.5% |
| Bangladesh | 3 | 0.0% |
| Caribbean | 45 | 0.2% |
| Central America | 534 | 2.0% |
| Eastern Asia | 34 | 0.1% |
| Eastern Europe | 98 | 0.4% |
| Europe | 144 | 0.5% |
| Germany | 38 | 0.1% |
| Guatemala | 7 | 0.0% |
| India | 16 | 0.1% |
| Indonesia | 16 | 0.1% |
| Israel | 4 | 0.0% |
| Jamaica | 45 | 0.2% |
| Japan | 9 | 0.0% |
| Korea | 25 | 0.1% |
| Latin America | 579 | 2.1% |
| Mexico | 527 | 1.9% |
| Nigeria | 2 | 0.0% |
| Northern Europe | 4 | 0.0% |
| Norway | 4 | 0.0% |
| Oceania | 24 | 0.1% |
| Pakistan | 5 | 0.0% |
| Poland | 61 | 0.2% |
| Serbia | 37 | 0.1% |
| Sierra Leone | 2 | 0.0% |
| South Central Asia | 60 | 0.2% |
| South Eastern Asia | 32 | 0.1% |
| Thailand | 16 | 0.1% |
| Western Africa | 4 | 0.0% |
| Western Asia | 4 | 0.0% |
| Western Europe | 42 | 0.2% | View All 33 Rows |
Sex and Age in San Miguel County
Sex and Age in San Miguel County
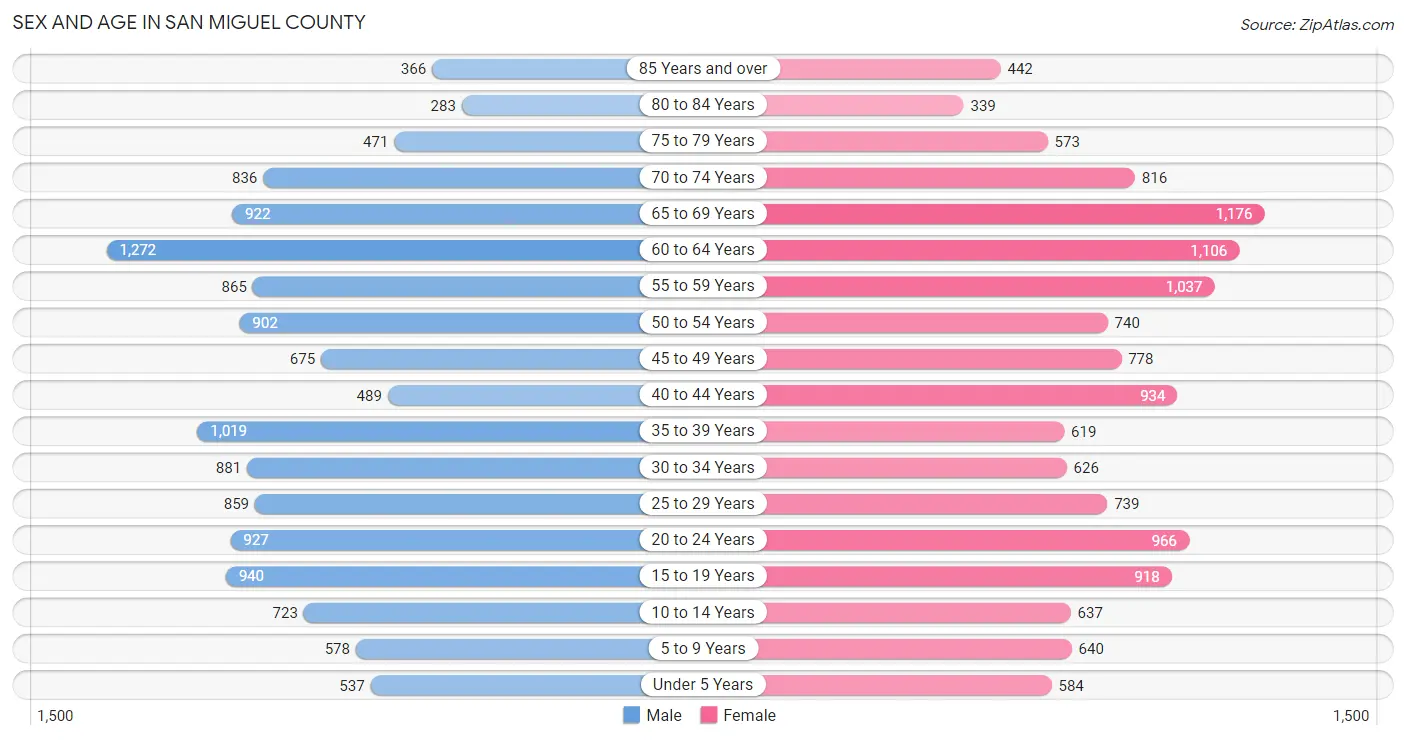
The most populous age groups in San Miguel County are 60 to 64 Years (1,272 | 9.4%) for men and 65 to 69 Years (1,176 | 8.6%) for women.
| Age Bracket | Male | Female |
| Under 5 Years | 537 (4.0%) | 584 (4.3%) |
| 5 to 9 Years | 578 (4.3%) | 640 (4.7%) |
| 10 to 14 Years | 723 (5.3%) | 637 (4.7%) |
| 15 to 19 Years | 940 (6.9%) | 918 (6.7%) |
| 20 to 24 Years | 927 (6.8%) | 966 (7.1%) |
| 25 to 29 Years | 859 (6.3%) | 739 (5.4%) |
| 30 to 34 Years | 881 (6.5%) | 626 (4.6%) |
| 35 to 39 Years | 1,019 (7.5%) | 619 (4.5%) |
| 40 to 44 Years | 489 (3.6%) | 934 (6.8%) |
| 45 to 49 Years | 675 (5.0%) | 778 (5.7%) |
| 50 to 54 Years | 902 (6.7%) | 740 (5.4%) |
| 55 to 59 Years | 865 (6.4%) | 1,037 (7.6%) |
| 60 to 64 Years | 1,272 (9.4%) | 1,106 (8.1%) |
| 65 to 69 Years | 922 (6.8%) | 1,176 (8.6%) |
| 70 to 74 Years | 836 (6.2%) | 816 (6.0%) |
| 75 to 79 Years | 471 (3.5%) | 573 (4.2%) |
| 80 to 84 Years | 283 (2.1%) | 339 (2.5%) |
| 85 Years and over | 366 (2.7%) | 442 (3.2%) |
| Total | 13,545 (100.0%) | 13,670 (100.0%) |
Families and Households in San Miguel County
Median Family Size in San Miguel County
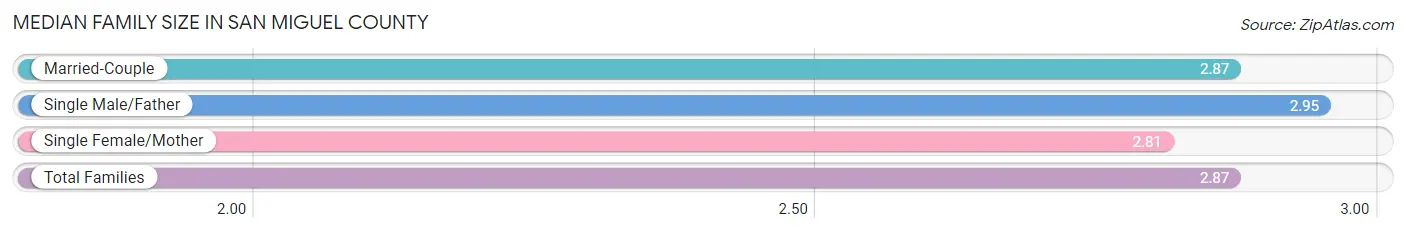
The median family size in San Miguel County is 2.87 persons per family, with single male/father families (825 | 12.6%) accounting for the largest median family size of 2.95 persons per family. On the other hand, single female/mother families (1,727 | 26.3%) represent the smallest median family size with 2.81 persons per family.
| Family Type | # Families | Family Size |
| Married-Couple | 4,019 (61.2%) | 2.87 |
| Single Male/Father | 825 (12.6%) | 2.95 |
| Single Female/Mother | 1,727 (26.3%) | 2.81 |
| Total Families | 6,571 (100.0%) | 2.87 |
Median Household Size in San Miguel County
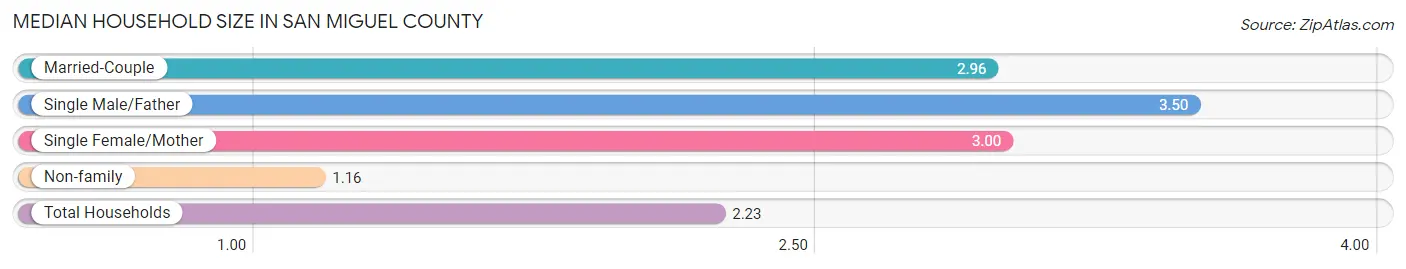
The median household size in San Miguel County is 2.23 persons per household, with single male/father households (825 | 7.1%) accounting for the largest median household size of 3.5 persons per household. non-family households (5,015 | 43.3%) represent the smallest median household size with 1.16 persons per household.
| Household Type | # Households | Household Size |
| Married-Couple | 4,019 (34.7%) | 2.96 |
| Single Male/Father | 825 (7.1%) | 3.50 |
| Single Female/Mother | 1,727 (14.9%) | 3.00 |
| Non-family | 5,015 (43.3%) | 1.16 |
| Total Households | 11,586 (100.0%) | 2.23 |
Household Size by Marriage Status in San Miguel County
Out of a total of 11,586 households in San Miguel County, 6,571 (56.7%) are family households, while 5,015 (43.3%) are nonfamily households. The most numerous type of family households are 2-person households, comprising 3,444, and the most common type of nonfamily households are 1-person households, comprising 4,447.
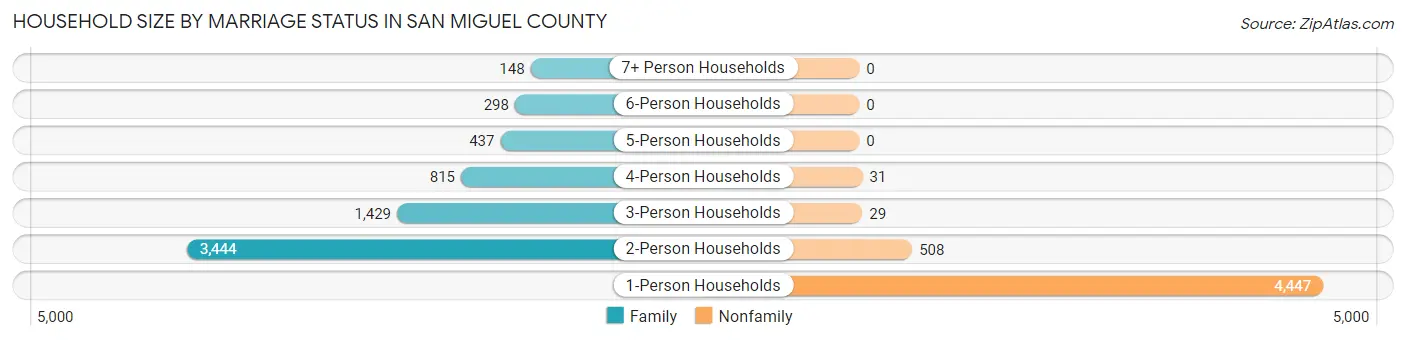
| Household Size | Family Households | Nonfamily Households |
| 1-Person Households | - | 4,447 (38.4%) |
| 2-Person Households | 3,444 (29.7%) | 508 (4.4%) |
| 3-Person Households | 1,429 (12.3%) | 29 (0.3%) |
| 4-Person Households | 815 (7.0%) | 31 (0.3%) |
| 5-Person Households | 437 (3.8%) | 0 (0.0%) |
| 6-Person Households | 298 (2.6%) | 0 (0.0%) |
| 7+ Person Households | 148 (1.3%) | 0 (0.0%) |
| Total | 6,571 (56.7%) | 5,015 (43.3%) |
Female Fertility in San Miguel County
Fertility by Age in San Miguel County
Average fertility rate in San Miguel County is 37.0 births per 1,000 women. Women in the age bracket of 20 to 34 years have the highest fertility rate with 70.0 births per 1,000 women. Women in the age bracket of 20 to 34 years acount for 77.7% of all women with births.
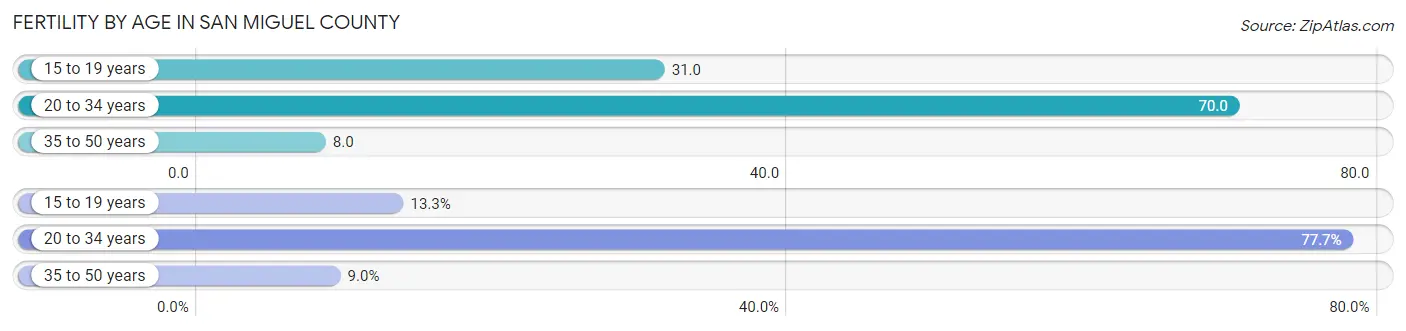
| Age Bracket | Women with Births | Births / 1,000 Women |
| 15 to 19 years | 28 (13.3%) | 31.0 |
| 20 to 34 years | 164 (77.7%) | 70.0 |
| 35 to 50 years | 19 (9.0%) | 8.0 |
| Total | 211 (100.0%) | 37.0 |
Fertility by Age by Marriage Status in San Miguel County
10.9% of women with births (211) in San Miguel County are married. The highest percentage of unmarried women with births falls into 15 to 19 years age bracket with 100.0% of them unmarried at the time of birth, while the lowest percentage of unmarried women with births belong to 35 to 50 years age bracket with 0.0% of them unmarried.
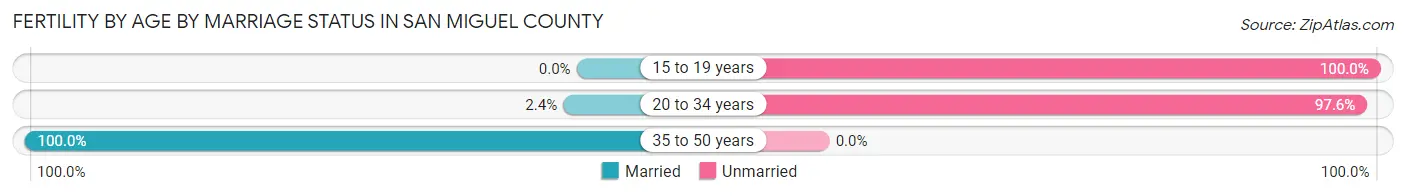
| Age Bracket | Married | Unmarried |
| 15 to 19 years | 0 (0.0%) | 28 (100.0%) |
| 20 to 34 years | 4 (2.4%) | 160 (97.6%) |
| 35 to 50 years | 19 (100.0%) | 0 (0.0%) |
| Total | 23 (10.9%) | 188 (89.1%) |
Fertility by Education in San Miguel County
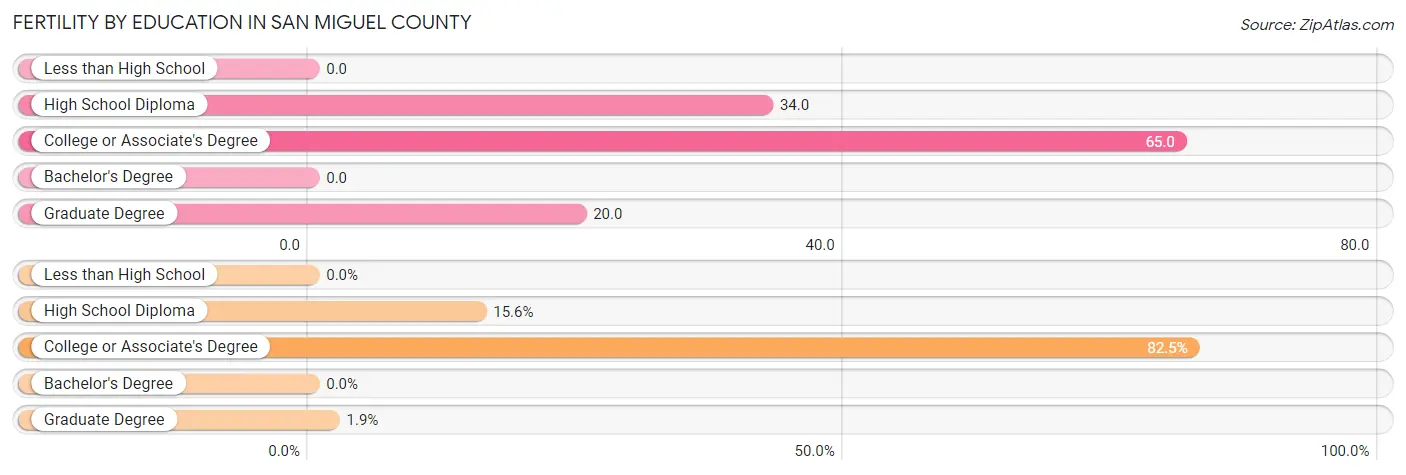
| Educational Attainment | Women with Births | Births / 1,000 Women |
| Less than High School | 0 (0.0%) | 0.0 |
| High School Diploma | 33 (15.6%) | 34.0 |
| College or Associate's Degree | 174 (82.5%) | 65.0 |
| Bachelor's Degree | 0 (0.0%) | 0.0 |
| Graduate Degree | 4 (1.9%) | 20.0 |
| Total | 211 (100.0%) | 37.0 |
Fertility by Education by Marriage Status in San Miguel County
89.1% of women with births in San Miguel County are unmarried. Women with the educational attainment of graduate degree are most likely to be married with 100.0% of them married at childbirth, while women with the educational attainment of college or associate's degree are least likely to be married with 91.9% of them unmarried at childbirth.
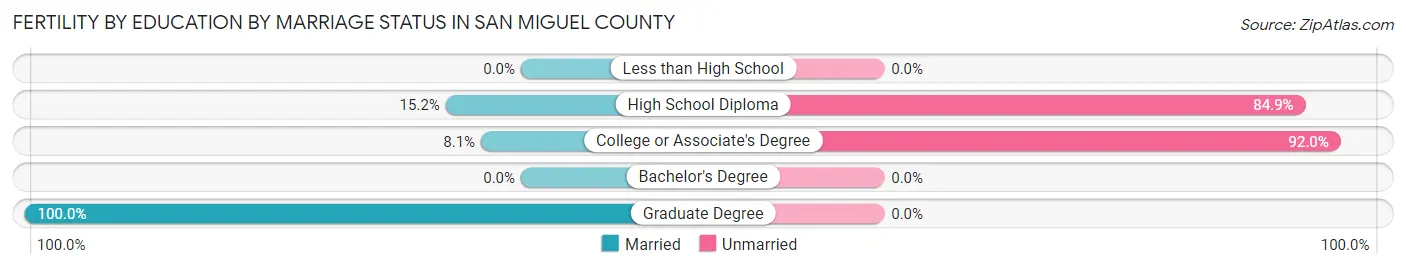
| Educational Attainment | Married | Unmarried |
| Less than High School | 0 (0.0%) | 0 (0.0%) |
| High School Diploma | 5 (15.1%) | 28 (84.9%) |
| College or Associate's Degree | 14 (8.1%) | 160 (91.9%) |
| Bachelor's Degree | 0 (0.0%) | 0 (0.0%) |
| Graduate Degree | 4 (100.0%) | 0 (0.0%) |
| Total | 23 (10.9%) | 188 (89.1%) |
Employment Characteristics in San Miguel County
Employment by Class of Employer in San Miguel County
Among the 10,620 employed individuals in San Miguel County, private company employees (4,685 | 44.1%), state government employees (2,405 | 22.7%), and local government employees (1,172 | 11.0%) make up the most common classes of employment.
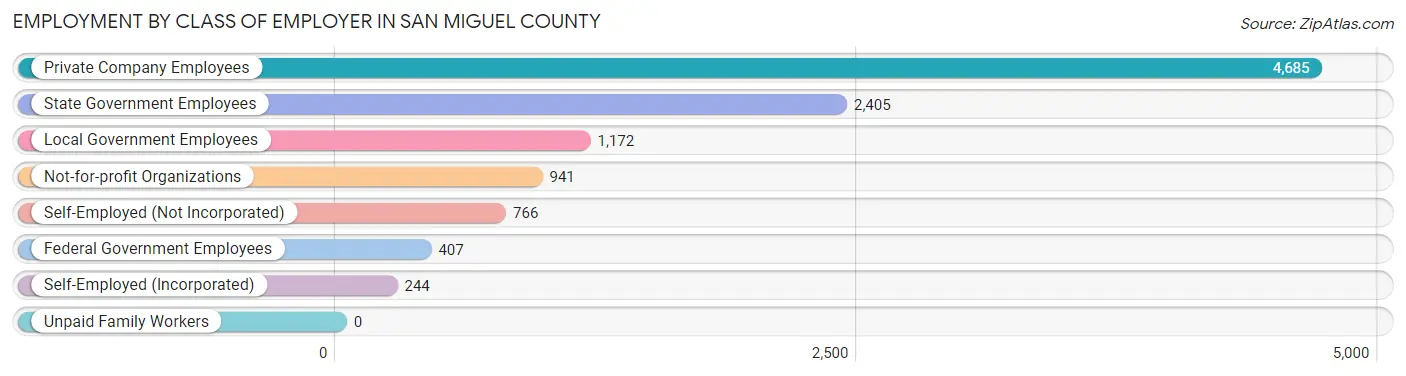
| Employer Class | # Employees | % Employees |
| Private Company Employees | 4,685 | 44.1% |
| Self-Employed (Incorporated) | 244 | 2.3% |
| Self-Employed (Not Incorporated) | 766 | 7.2% |
| Not-for-profit Organizations | 941 | 8.9% |
| Local Government Employees | 1,172 | 11.0% |
| State Government Employees | 2,405 | 22.7% |
| Federal Government Employees | 407 | 3.8% |
| Unpaid Family Workers | 0 | 0.0% |
| Total | 10,620 | 100.0% |
Employment Status by Age in San Miguel County
According to the labor force statistics for San Miguel County, out of the total population over 16 years of age (23,405), 50.3% or 11,773 individuals are in the labor force, with 6.9% or 812 of them unemployed. The age group with the highest labor force participation rate is 35 to 44 years, with 81.1% or 2,482 individuals in the labor force. Within the labor force, the 16 to 19 years age range has the highest percentage of unemployed individuals, with 22.4% or 103 of them being unemployed.
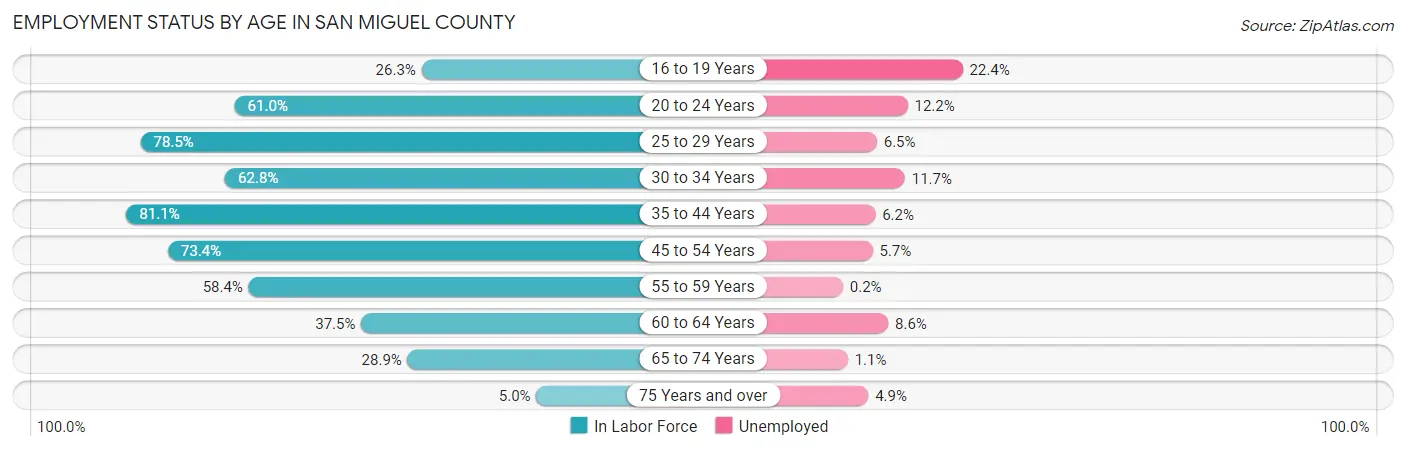
| Age Bracket | In Labor Force | Unemployed |
| 16 to 19 Years | 459 (26.3%) | 103 (22.4%) |
| 20 to 24 Years | 1,155 (61.0%) | 141 (12.2%) |
| 25 to 29 Years | 1,254 (78.5%) | 82 (6.5%) |
| 30 to 34 Years | 946 (62.8%) | 111 (11.7%) |
| 35 to 44 Years | 2,482 (81.1%) | 154 (6.2%) |
| 45 to 54 Years | 2,272 (73.4%) | 130 (5.7%) |
| 55 to 59 Years | 1,111 (58.4%) | 2 (0.2%) |
| 60 to 64 Years | 892 (37.5%) | 77 (8.6%) |
| 65 to 74 Years | 1,084 (28.9%) | 12 (1.1%) |
| 75 Years and over | 124 (5.0%) | 6 (4.9%) |
| Total | 11,773 (50.3%) | 812 (6.9%) |
Employment Status by Educational Attainment in San Miguel County
According to labor force statistics for San Miguel County, 66.1% of individuals (8,951) out of the total population between 25 and 64 years of age (13,541) are in the labor force, with 6.2% or 555 of them being unemployed. The group with the highest labor force participation rate are those with the educational attainment of bachelor's degree or higher, with 75.1% or 2,191 individuals in the labor force. Within the labor force, individuals with college / associate degree education have the highest percentage of unemployment, with 7.0% or 261 of them being unemployed.
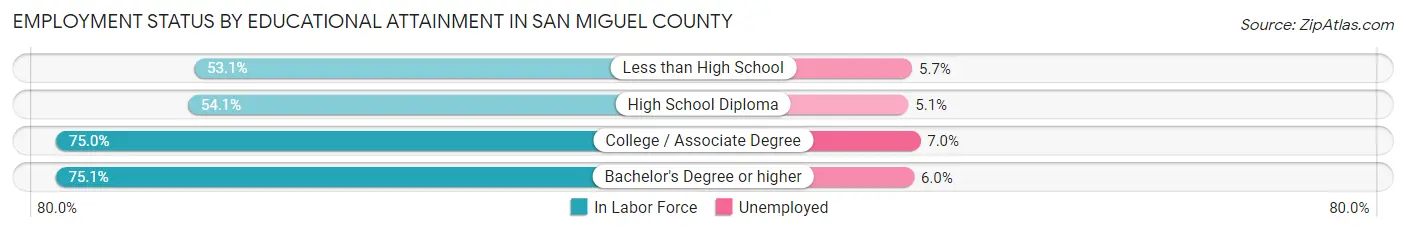
| Educational Attainment | In Labor Force | Unemployed |
| Less than High School | 1,202 (53.1%) | 129 (5.7%) |
| High School Diploma | 1,829 (54.1%) | 172 (5.1%) |
| College / Associate Degree | 3,735 (75.0%) | 349 (7.0%) |
| Bachelor's Degree or higher | 2,191 (75.1%) | 175 (6.0%) |
| Total | 8,951 (66.1%) | 840 (6.2%) |
Employment Occupations by Sex in San Miguel County
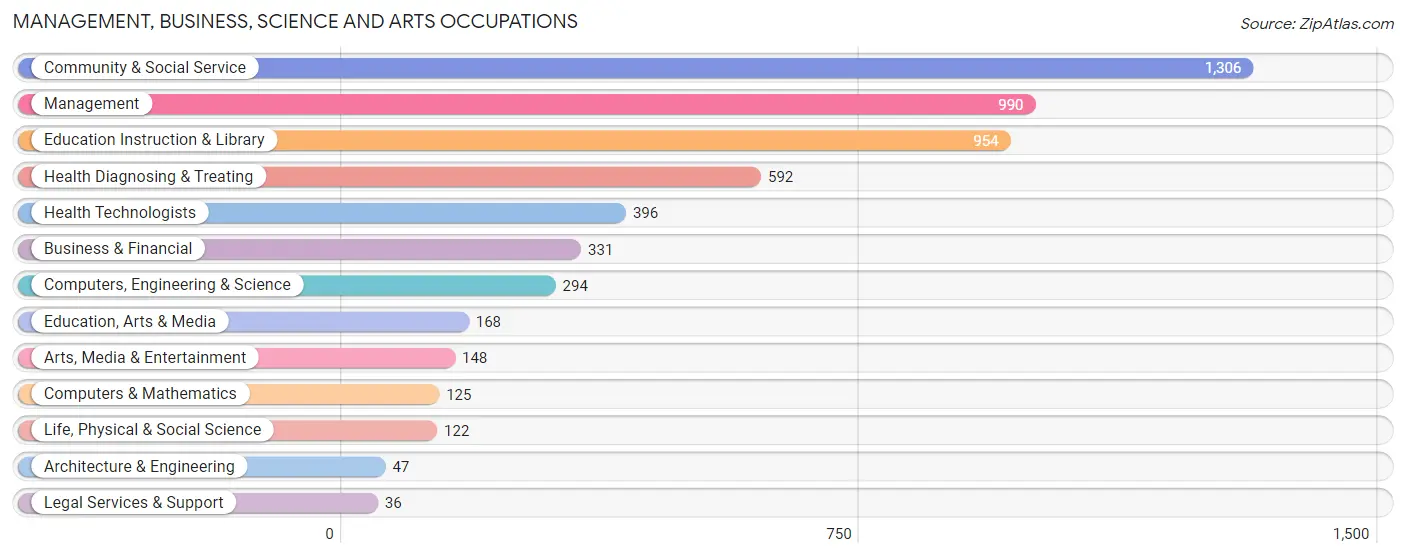
Management, Business, Science and Arts Occupations
The most common Management, Business, Science and Arts occupations in San Miguel County are Community & Social Service (1,306 | 11.9%), Management (990 | 9.0%), Education Instruction & Library (954 | 8.7%), Health Diagnosing & Treating (592 | 5.4%), and Health Technologists (396 | 3.6%).
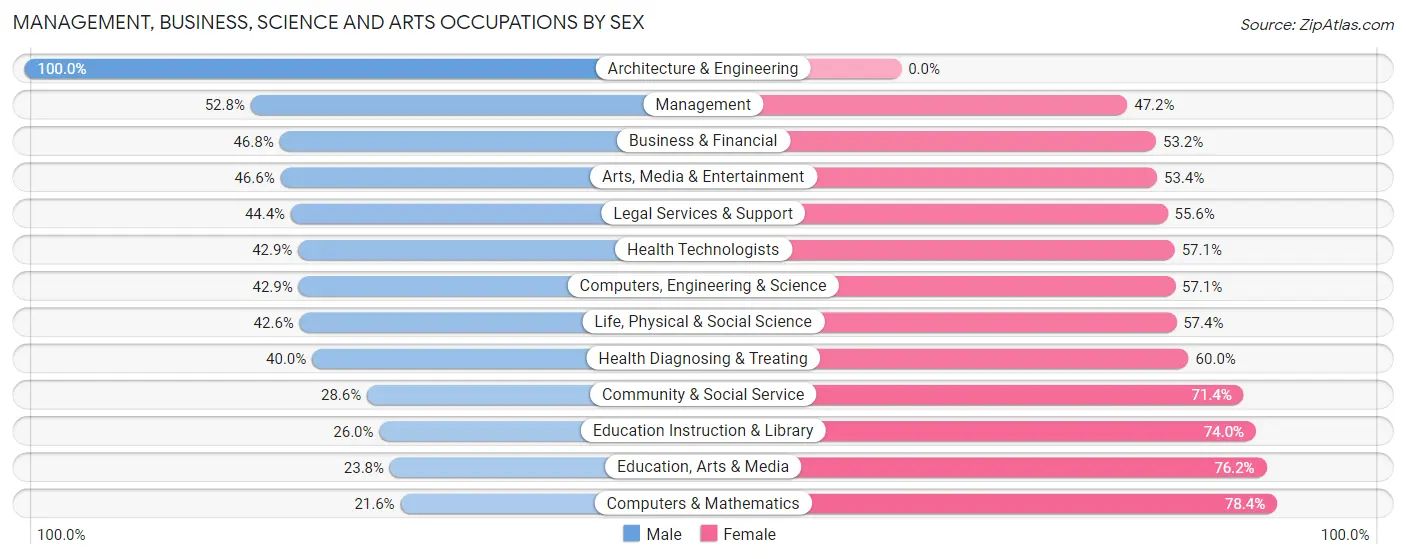
Management, Business, Science and Arts Occupations by Sex
Within the Management, Business, Science and Arts occupations in San Miguel County, the most male-oriented occupations are Architecture & Engineering (100.0%), Management (52.8%), and Business & Financial (46.8%), while the most female-oriented occupations are Computers & Mathematics (78.4%), Education, Arts & Media (76.2%), and Education Instruction & Library (74.0%).
| Occupation | Male | Female |
| Management | 523 (52.8%) | 467 (47.2%) |
| Business & Financial | 155 (46.8%) | 176 (53.2%) |
| Computers, Engineering & Science | 126 (42.9%) | 168 (57.1%) |
| Computers & Mathematics | 27 (21.6%) | 98 (78.4%) |
| Architecture & Engineering | 47 (100.0%) | 0 (0.0%) |
| Life, Physical & Social Science | 52 (42.6%) | 70 (57.4%) |
| Community & Social Service | 373 (28.6%) | 933 (71.4%) |
| Education, Arts & Media | 40 (23.8%) | 128 (76.2%) |
| Legal Services & Support | 16 (44.4%) | 20 (55.6%) |
| Education Instruction & Library | 248 (26.0%) | 706 (74.0%) |
| Arts, Media & Entertainment | 69 (46.6%) | 79 (53.4%) |
| Health Diagnosing & Treating | 237 (40.0%) | 355 (60.0%) |
| Health Technologists | 170 (42.9%) | 226 (57.1%) |
| Total (Category) | 1,414 (40.3%) | 2,099 (59.8%) |
| Total (Overall) | 5,433 (49.6%) | 5,526 (50.4%) |
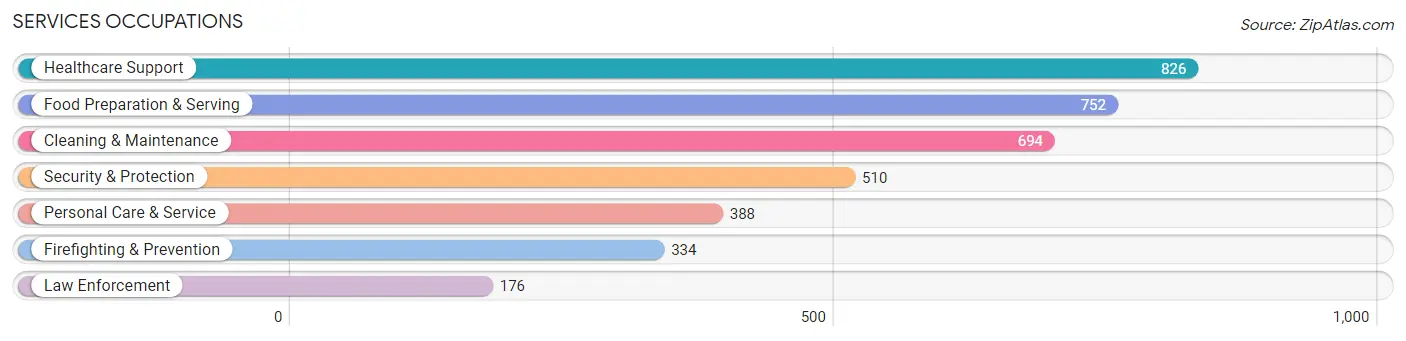
Services Occupations
The most common Services occupations in San Miguel County are Healthcare Support (826 | 7.5%), Food Preparation & Serving (752 | 6.9%), Cleaning & Maintenance (694 | 6.3%), Security & Protection (510 | 4.6%), and Personal Care & Service (388 | 3.5%).
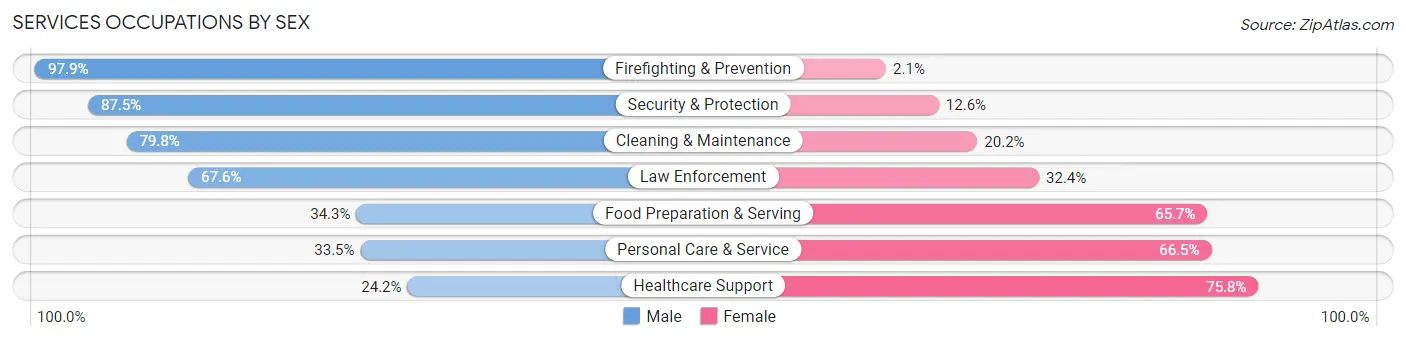
Services Occupations by Sex
Within the Services occupations in San Miguel County, the most male-oriented occupations are Firefighting & Prevention (97.9%), Security & Protection (87.5%), and Cleaning & Maintenance (79.8%), while the most female-oriented occupations are Healthcare Support (75.8%), Personal Care & Service (66.5%), and Food Preparation & Serving (65.7%).
| Occupation | Male | Female |
| Healthcare Support | 200 (24.2%) | 626 (75.8%) |
| Security & Protection | 446 (87.5%) | 64 (12.6%) |
| Firefighting & Prevention | 327 (97.9%) | 7 (2.1%) |
| Law Enforcement | 119 (67.6%) | 57 (32.4%) |
| Food Preparation & Serving | 258 (34.3%) | 494 (65.7%) |
| Cleaning & Maintenance | 554 (79.8%) | 140 (20.2%) |
| Personal Care & Service | 130 (33.5%) | 258 (66.5%) |
| Total (Category) | 1,588 (50.1%) | 1,582 (49.9%) |
| Total (Overall) | 5,433 (49.6%) | 5,526 (50.4%) |
Sales and Office Occupations
The most common Sales and Office occupations in San Miguel County are Office & Administration (1,340 | 12.2%), and Sales & Related (731 | 6.7%).

Sales and Office Occupations by Sex

| Occupation | Male | Female |
| Sales & Related | 203 (27.8%) | 528 (72.2%) |
| Office & Administration | 215 (16.0%) | 1,125 (84.0%) |
| Total (Category) | 418 (20.2%) | 1,653 (79.8%) |
| Total (Overall) | 5,433 (49.6%) | 5,526 (50.4%) |
Natural Resources, Construction and Maintenance Occupations
The most common Natural Resources, Construction and Maintenance occupations in San Miguel County are Construction & Extraction (756 | 6.9%), Installation, Maintenance & Repair (201 | 1.8%), and Farming, Fishing & Forestry (170 | 1.5%).
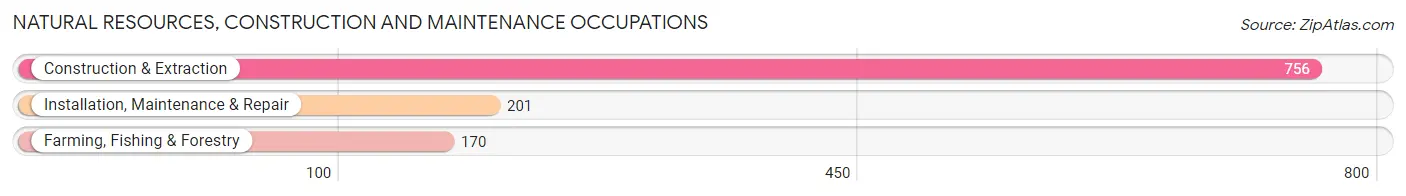
Natural Resources, Construction and Maintenance Occupations by Sex
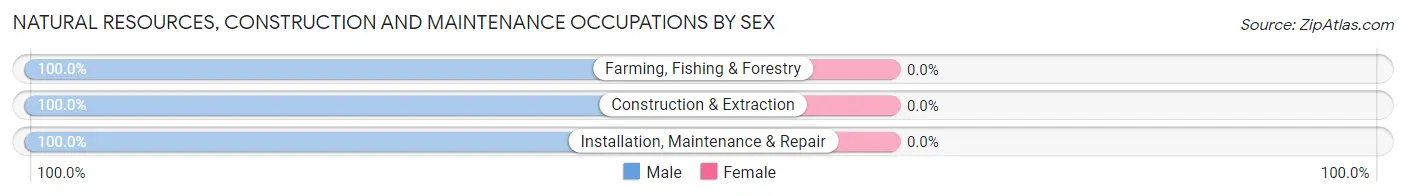
| Occupation | Male | Female |
| Farming, Fishing & Forestry | 170 (100.0%) | 0 (0.0%) |
| Construction & Extraction | 756 (100.0%) | 0 (0.0%) |
| Installation, Maintenance & Repair | 201 (100.0%) | 0 (0.0%) |
| Total (Category) | 1,127 (100.0%) | 0 (0.0%) |
| Total (Overall) | 5,433 (49.6%) | 5,526 (50.4%) |
Production, Transportation and Moving Occupations
The most common Production, Transportation and Moving occupations in San Miguel County are Transportation (510 | 4.6%), Production (327 | 3.0%), and Material Moving (241 | 2.2%).
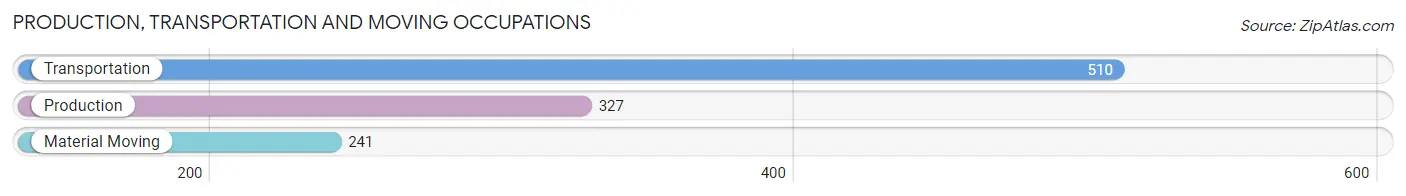
Production, Transportation and Moving Occupations by Sex
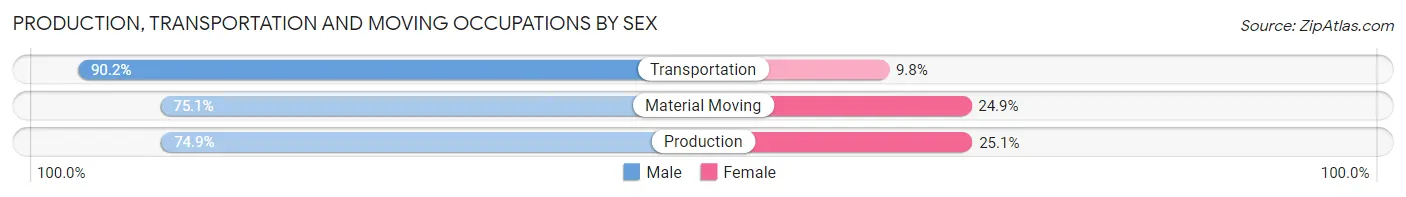
| Occupation | Male | Female |
| Production | 245 (74.9%) | 82 (25.1%) |
| Transportation | 460 (90.2%) | 50 (9.8%) |
| Material Moving | 181 (75.1%) | 60 (24.9%) |
| Total (Category) | 886 (82.2%) | 192 (17.8%) |
| Total (Overall) | 5,433 (49.6%) | 5,526 (50.4%) |
Employment Industries by Sex in San Miguel County
Employment Industries in San Miguel County
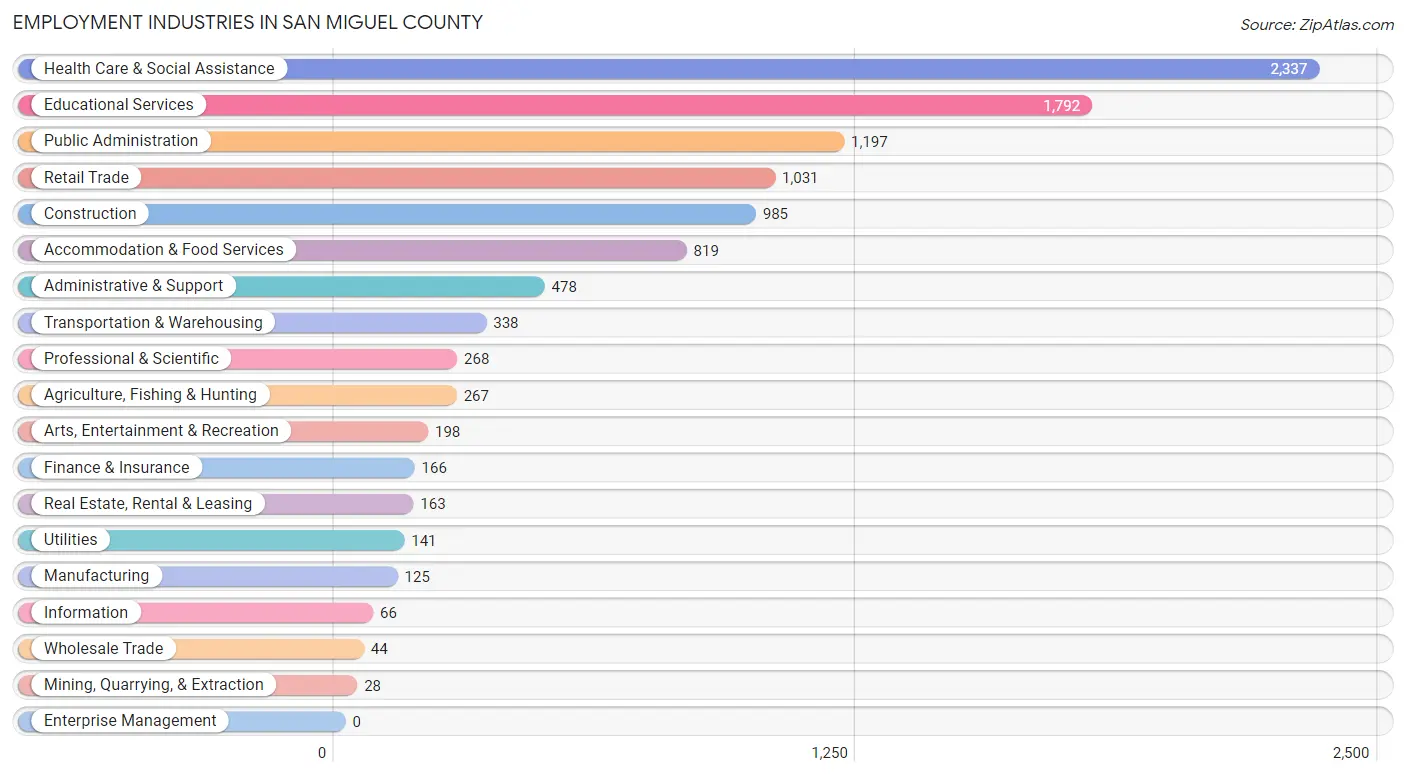
The major employment industries in San Miguel County include Health Care & Social Assistance (2,337 | 21.3%), Educational Services (1,792 | 16.4%), Public Administration (1,197 | 10.9%), Retail Trade (1,031 | 9.4%), and Construction (985 | 9.0%).
Employment Industries by Sex in San Miguel County
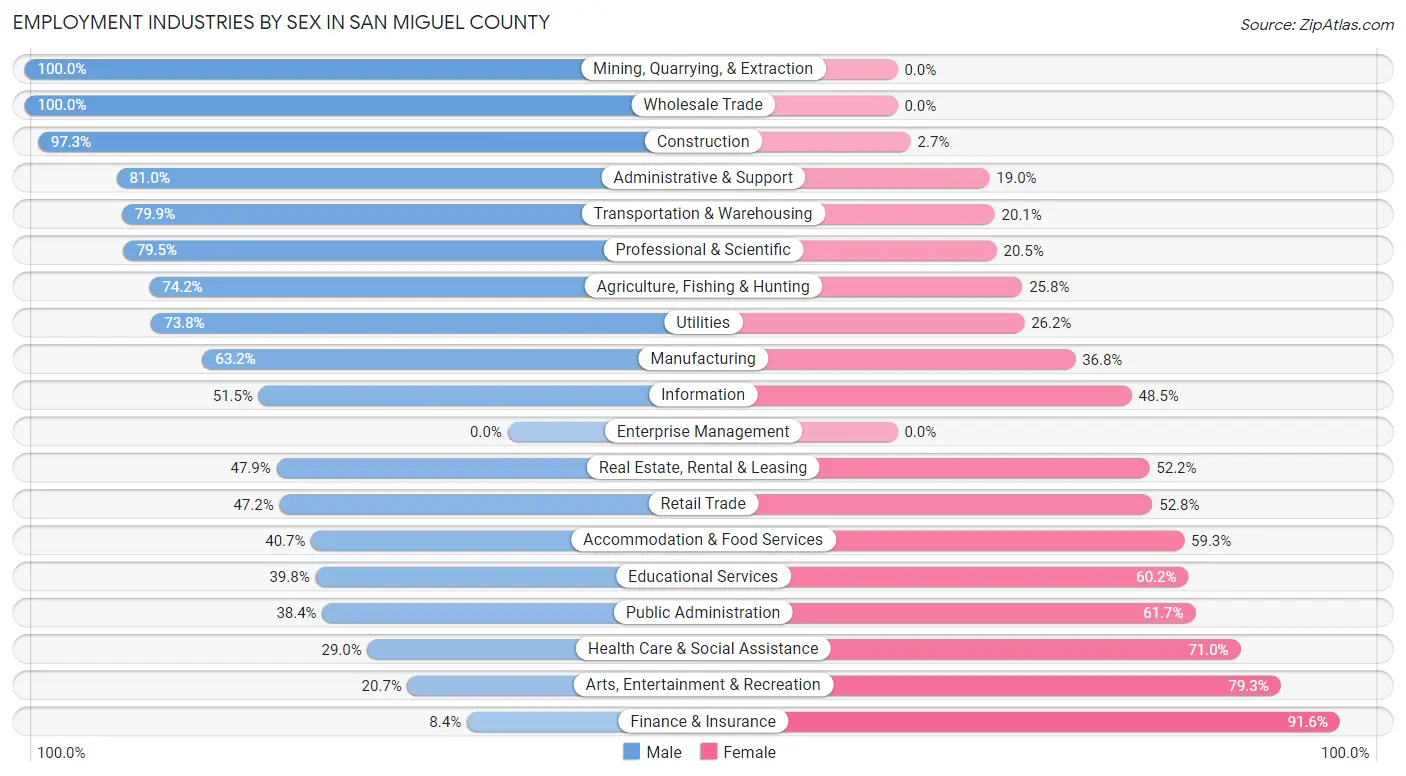
The San Miguel County industries that see more men than women are Mining, Quarrying, & Extraction (100.0%), Wholesale Trade (100.0%), and Construction (97.3%), whereas the industries that tend to have a higher number of women are Finance & Insurance (91.6%), Arts, Entertainment & Recreation (79.3%), and Health Care & Social Assistance (71.0%).
| Industry | Male | Female |
| Agriculture, Fishing & Hunting | 198 (74.2%) | 69 (25.8%) |
| Mining, Quarrying, & Extraction | 28 (100.0%) | 0 (0.0%) |
| Construction | 958 (97.3%) | 27 (2.7%) |
| Manufacturing | 79 (63.2%) | 46 (36.8%) |
| Wholesale Trade | 44 (100.0%) | 0 (0.0%) |
| Retail Trade | 487 (47.2%) | 544 (52.8%) |
| Transportation & Warehousing | 270 (79.9%) | 68 (20.1%) |
| Utilities | 104 (73.8%) | 37 (26.2%) |
| Information | 34 (51.5%) | 32 (48.5%) |
| Finance & Insurance | 14 (8.4%) | 152 (91.6%) |
| Real Estate, Rental & Leasing | 78 (47.8%) | 85 (52.1%) |
| Professional & Scientific | 213 (79.5%) | 55 (20.5%) |
| Enterprise Management | 0 (0.0%) | 0 (0.0%) |
| Administrative & Support | 387 (81.0%) | 91 (19.0%) |
| Educational Services | 713 (39.8%) | 1,079 (60.2%) |
| Health Care & Social Assistance | 678 (29.0%) | 1,659 (71.0%) |
| Arts, Entertainment & Recreation | 41 (20.7%) | 157 (79.3%) |
| Accommodation & Food Services | 333 (40.7%) | 486 (59.3%) |
| Public Administration | 459 (38.4%) | 738 (61.7%) |
| Total | 5,433 (49.6%) | 5,526 (50.4%) |
Education in San Miguel County
School Enrollment in San Miguel County
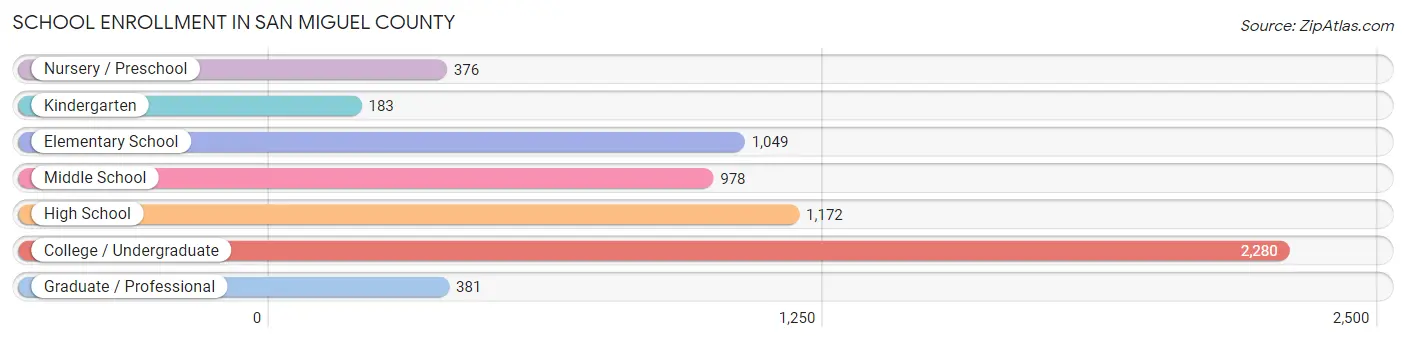
The most common levels of schooling among the 6,419 students in San Miguel County are college / undergraduate (2,280 | 35.5%), high school (1,172 | 18.3%), and elementary school (1,049 | 16.3%).
| School Level | # Students | % Students |
| Nursery / Preschool | 376 | 5.9% |
| Kindergarten | 183 | 2.9% |
| Elementary School | 1,049 | 16.3% |
| Middle School | 978 | 15.2% |
| High School | 1,172 | 18.3% |
| College / Undergraduate | 2,280 | 35.5% |
| Graduate / Professional | 381 | 5.9% |
| Total | 6,419 | 100.0% |
School Enrollment by Age by Funding Source in San Miguel County
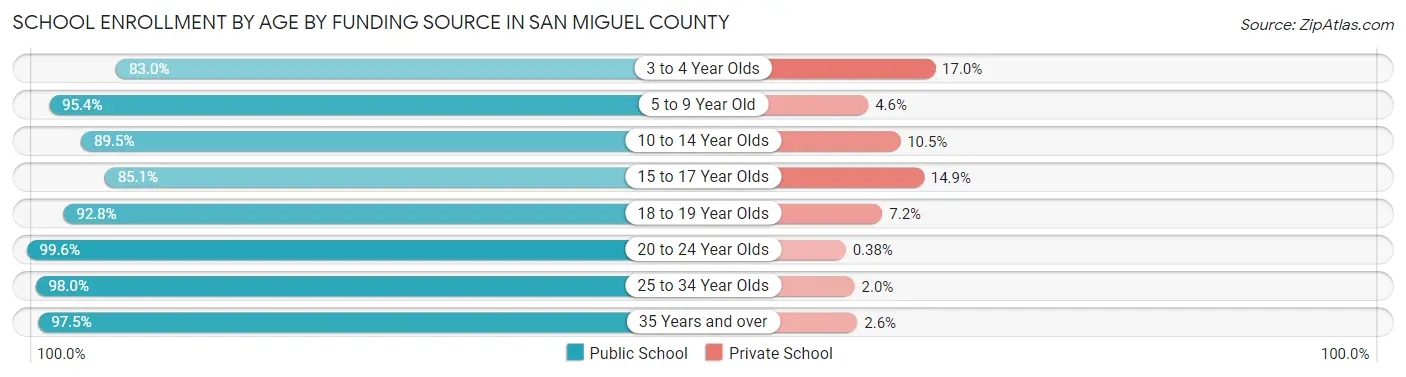
Out of a total of 6,419 students who are enrolled in schools in San Miguel County, 456 (7.1%) attend a private institution, while the remaining 5,963 (92.9%) are enrolled in public schools. The age group of 3 to 4 year olds has the highest likelihood of being enrolled in private schools, with 55 (17.0% in the age bracket) enrolled. Conversely, the age group of 20 to 24 year olds has the lowest likelihood of being enrolled in a private school, with 1,060 (99.6% in the age bracket) attending a public institution.
| Age Bracket | Public School | Private School |
| 3 to 4 Year Olds | 268 (83.0%) | 55 (17.0%) |
| 5 to 9 Year Old | 1,023 (95.4%) | 49 (4.6%) |
| 10 to 14 Year Olds | 1,198 (89.5%) | 141 (10.5%) |
| 15 to 17 Year Olds | 741 (85.1%) | 130 (14.9%) |
| 18 to 19 Year Olds | 695 (92.8%) | 54 (7.2%) |
| 20 to 24 Year Olds | 1,060 (99.6%) | 4 (0.4%) |
| 25 to 34 Year Olds | 290 (98.0%) | 6 (2.0%) |
| 35 Years and over | 687 (97.5%) | 18 (2.5%) |
| Total | 5,963 (92.9%) | 456 (7.1%) |
Educational Attainment by Field of Study in San Miguel County
Business (946 | 18.5%), education (910 | 17.8%), bio, nature & agricultural (529 | 10.3%), social sciences (473 | 9.2%), and science & technology (382 | 7.5%) are the most common fields of study among 5,123 individuals in San Miguel County who have obtained a bachelor's degree or higher.
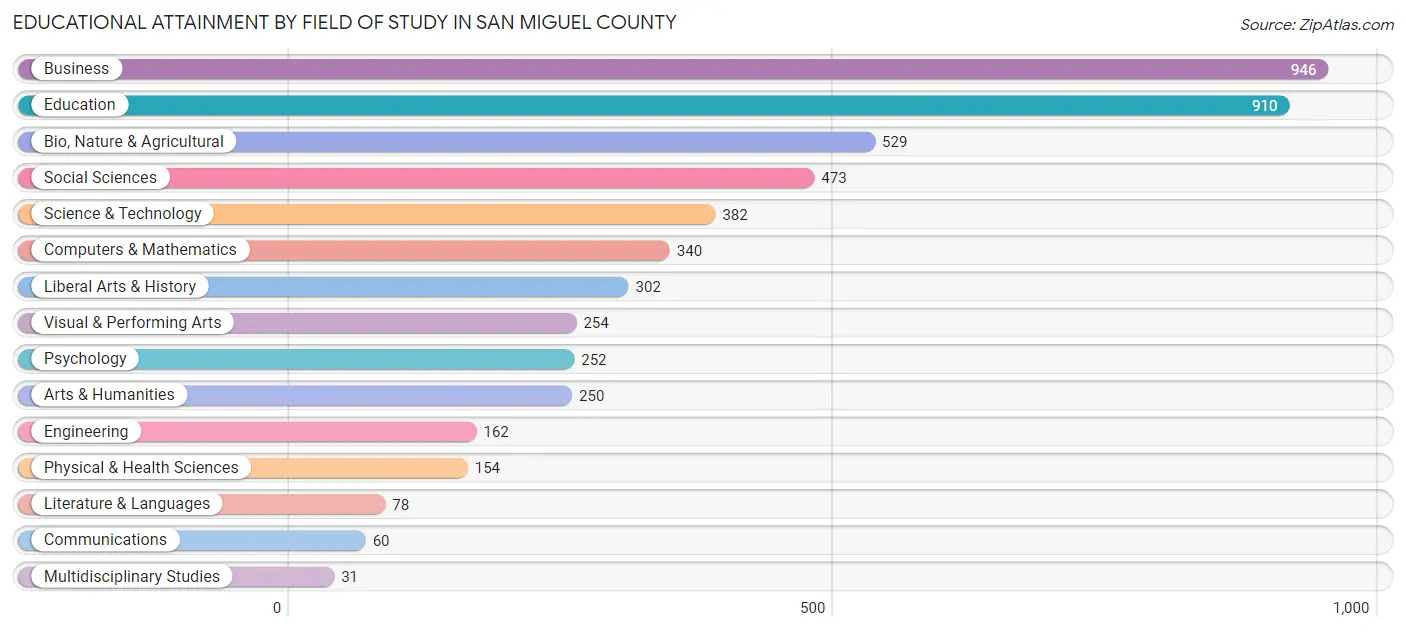
| Field of Study | # Graduates | % Graduates |
| Computers & Mathematics | 340 | 6.6% |
| Bio, Nature & Agricultural | 529 | 10.3% |
| Physical & Health Sciences | 154 | 3.0% |
| Psychology | 252 | 4.9% |
| Social Sciences | 473 | 9.2% |
| Engineering | 162 | 3.2% |
| Multidisciplinary Studies | 31 | 0.6% |
| Science & Technology | 382 | 7.5% |
| Business | 946 | 18.5% |
| Education | 910 | 17.8% |
| Literature & Languages | 78 | 1.5% |
| Liberal Arts & History | 302 | 5.9% |
| Visual & Performing Arts | 254 | 5.0% |
| Communications | 60 | 1.2% |
| Arts & Humanities | 250 | 4.9% |
| Total | 5,123 | 100.0% |
Transportation & Commute in San Miguel County
Vehicle Availability by Sex in San Miguel County
The most prevalent vehicle ownership categories in San Miguel County are males with 2 vehicles (1,828, accounting for 35.7%) and females with 2 vehicles (1,790, making up 35.1%).
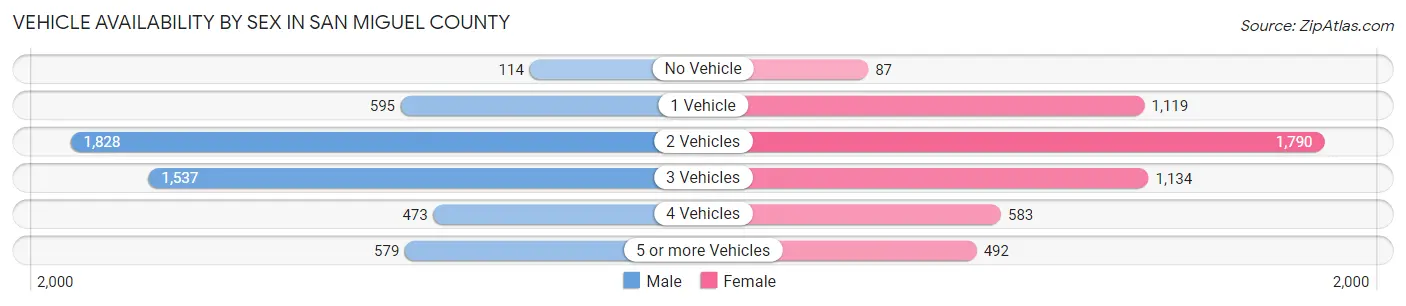
| Vehicles Available | Male | Female |
| No Vehicle | 114 (2.2%) | 87 (1.7%) |
| 1 Vehicle | 595 (11.6%) | 1,119 (21.5%) |
| 2 Vehicles | 1,828 (35.7%) | 1,790 (34.4%) |
| 3 Vehicles | 1,537 (30.0%) | 1,134 (21.8%) |
| 4 Vehicles | 473 (9.2%) | 583 (11.2%) |
| 5 or more Vehicles | 579 (11.3%) | 492 (9.5%) |
| Total | 5,126 (100.0%) | 5,205 (100.0%) |
Commute Time in San Miguel County
The most frequently occuring commute durations in San Miguel County are 5 to 9 minutes (2,639 commuters, 28.1%), 10 to 14 minutes (1,522 commuters, 16.2%), and 15 to 19 minutes (1,284 commuters, 13.7%).
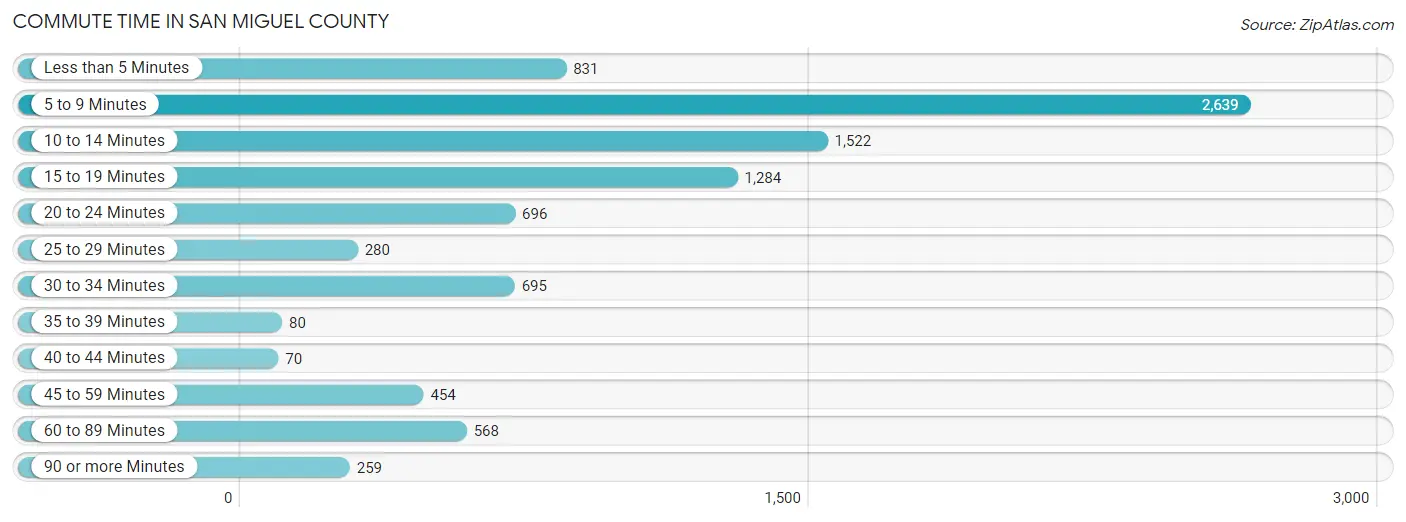
| Commute Time | # Commuters | % Commuters |
| Less than 5 Minutes | 831 | 8.9% |
| 5 to 9 Minutes | 2,639 | 28.1% |
| 10 to 14 Minutes | 1,522 | 16.2% |
| 15 to 19 Minutes | 1,284 | 13.7% |
| 20 to 24 Minutes | 696 | 7.4% |
| 25 to 29 Minutes | 280 | 3.0% |
| 30 to 34 Minutes | 695 | 7.4% |
| 35 to 39 Minutes | 80 | 0.9% |
| 40 to 44 Minutes | 70 | 0.7% |
| 45 to 59 Minutes | 454 | 4.8% |
| 60 to 89 Minutes | 568 | 6.1% |
| 90 or more Minutes | 259 | 2.8% |
Commute Time by Sex in San Miguel County
The most common commute times in San Miguel County are 5 to 9 minutes (1,030 commuters, 22.1%) for males and 5 to 9 minutes (1,609 commuters, 34.1%) for females.
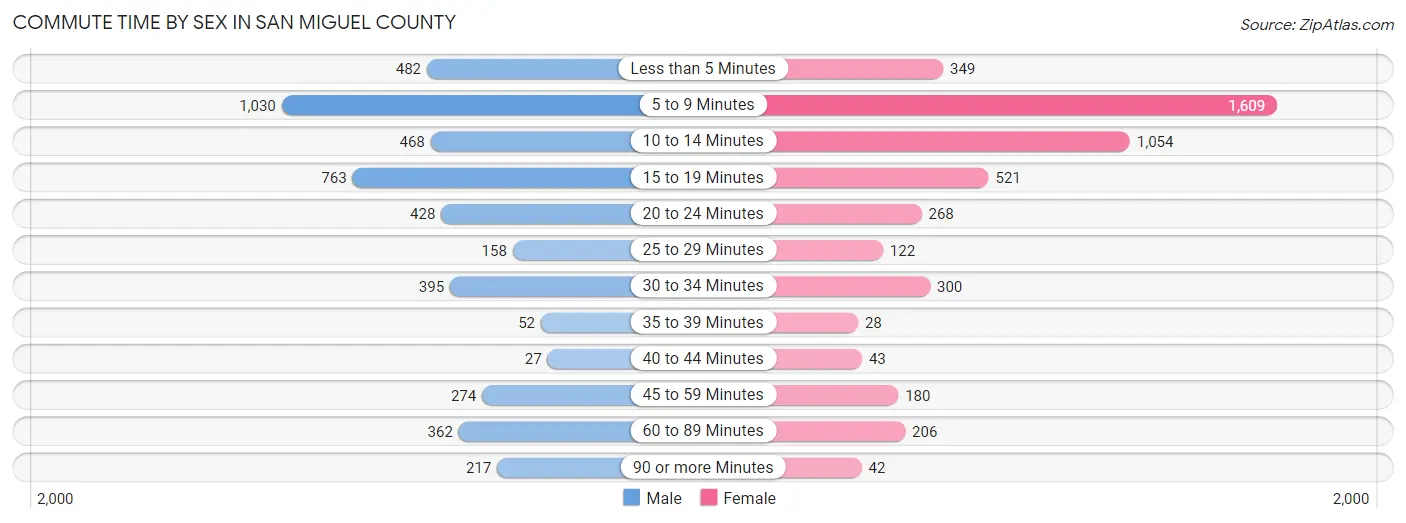
| Commute Time | Male | Female |
| Less than 5 Minutes | 482 (10.3%) | 349 (7.4%) |
| 5 to 9 Minutes | 1,030 (22.1%) | 1,609 (34.1%) |
| 10 to 14 Minutes | 468 (10.1%) | 1,054 (22.3%) |
| 15 to 19 Minutes | 763 (16.4%) | 521 (11.0%) |
| 20 to 24 Minutes | 428 (9.2%) | 268 (5.7%) |
| 25 to 29 Minutes | 158 (3.4%) | 122 (2.6%) |
| 30 to 34 Minutes | 395 (8.5%) | 300 (6.4%) |
| 35 to 39 Minutes | 52 (1.1%) | 28 (0.6%) |
| 40 to 44 Minutes | 27 (0.6%) | 43 (0.9%) |
| 45 to 59 Minutes | 274 (5.9%) | 180 (3.8%) |
| 60 to 89 Minutes | 362 (7.8%) | 206 (4.4%) |
| 90 or more Minutes | 217 (4.7%) | 42 (0.9%) |
Time of Departure to Work by Sex in San Miguel County
The most frequent times of departure to work in San Miguel County are 7:30 AM to 7:59 AM (936, 20.1%) for males and 7:30 AM to 7:59 AM (1,613, 34.2%) for females.
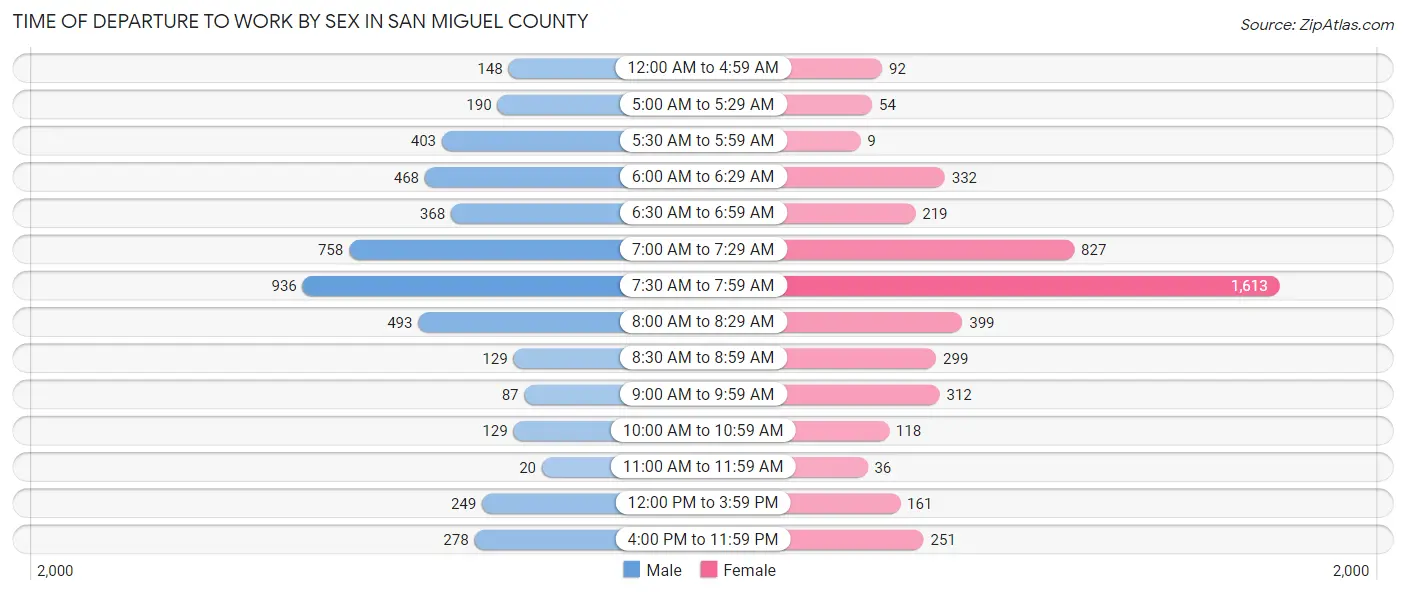
| Time of Departure | Male | Female |
| 12:00 AM to 4:59 AM | 148 (3.2%) | 92 (1.9%) |
| 5:00 AM to 5:29 AM | 190 (4.1%) | 54 (1.1%) |
| 5:30 AM to 5:59 AM | 403 (8.7%) | 9 (0.2%) |
| 6:00 AM to 6:29 AM | 468 (10.1%) | 332 (7.0%) |
| 6:30 AM to 6:59 AM | 368 (7.9%) | 219 (4.6%) |
| 7:00 AM to 7:29 AM | 758 (16.3%) | 827 (17.5%) |
| 7:30 AM to 7:59 AM | 936 (20.1%) | 1,613 (34.2%) |
| 8:00 AM to 8:29 AM | 493 (10.6%) | 399 (8.5%) |
| 8:30 AM to 8:59 AM | 129 (2.8%) | 299 (6.3%) |
| 9:00 AM to 9:59 AM | 87 (1.9%) | 312 (6.6%) |
| 10:00 AM to 10:59 AM | 129 (2.8%) | 118 (2.5%) |
| 11:00 AM to 11:59 AM | 20 (0.4%) | 36 (0.8%) |
| 12:00 PM to 3:59 PM | 249 (5.3%) | 161 (3.4%) |
| 4:00 PM to 11:59 PM | 278 (6.0%) | 251 (5.3%) |
| Total | 4,656 (100.0%) | 4,722 (100.0%) |
Housing Occupancy in San Miguel County
Occupancy by Ownership in San Miguel County
Of the total 11,586 dwellings in San Miguel County, owner-occupied units account for 8,297 (71.6%), while renter-occupied units make up 3,289 (28.4%).
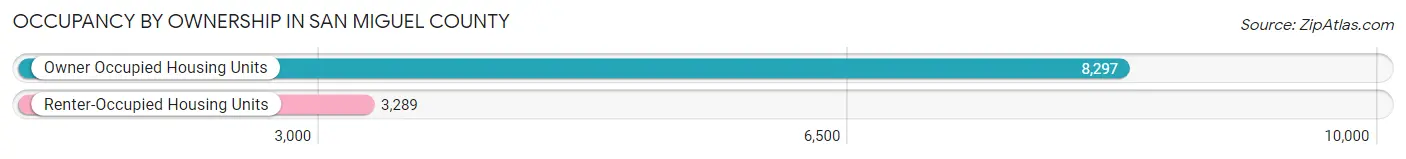
| Occupancy | # Housing Units | % Housing Units |
| Owner Occupied Housing Units | 8,297 | 71.6% |
| Renter-Occupied Housing Units | 3,289 | 28.4% |
| Total Occupied Housing Units | 11,586 | 100.0% |
Occupancy by Household Size in San Miguel County
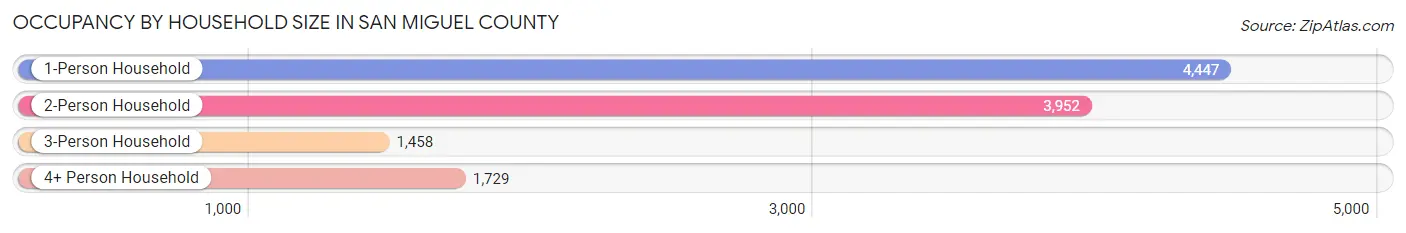
| Household Size | # Housing Units | % Housing Units |
| 1-Person Household | 4,447 | 38.4% |
| 2-Person Household | 3,952 | 34.1% |
| 3-Person Household | 1,458 | 12.6% |
| 4+ Person Household | 1,729 | 14.9% |
| Total Housing Units | 11,586 | 100.0% |
Occupancy by Ownership by Household Size in San Miguel County
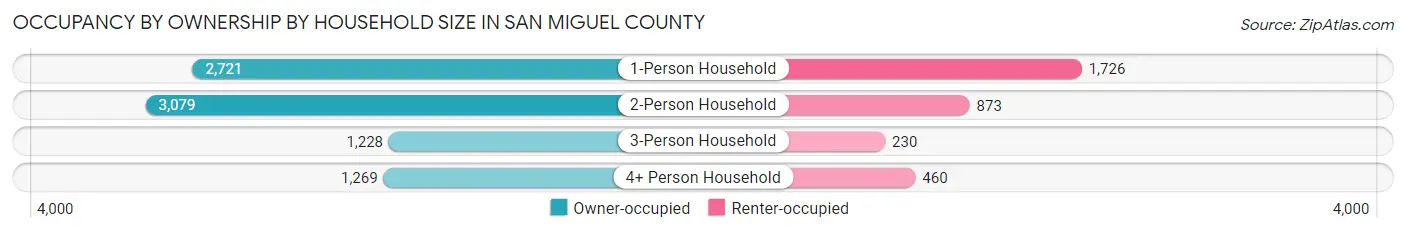
| Household Size | Owner-occupied | Renter-occupied |
| 1-Person Household | 2,721 (61.2%) | 1,726 (38.8%) |
| 2-Person Household | 3,079 (77.9%) | 873 (22.1%) |
| 3-Person Household | 1,228 (84.2%) | 230 (15.8%) |
| 4+ Person Household | 1,269 (73.4%) | 460 (26.6%) |
| Total Housing Units | 8,297 (71.6%) | 3,289 (28.4%) |
Occupancy by Educational Attainment in San Miguel County
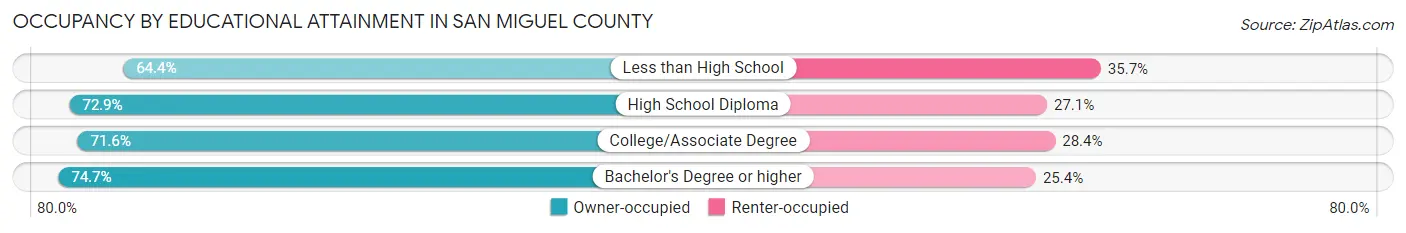
| Household Size | Owner-occupied | Renter-occupied |
| Less than High School | 1,083 (64.3%) | 600 (35.6%) |
| High School Diploma | 1,940 (72.9%) | 721 (27.1%) |
| College/Associate Degree | 3,095 (71.6%) | 1,228 (28.4%) |
| Bachelor's Degree or higher | 2,179 (74.7%) | 740 (25.4%) |
Occupancy by Age of Householder in San Miguel County
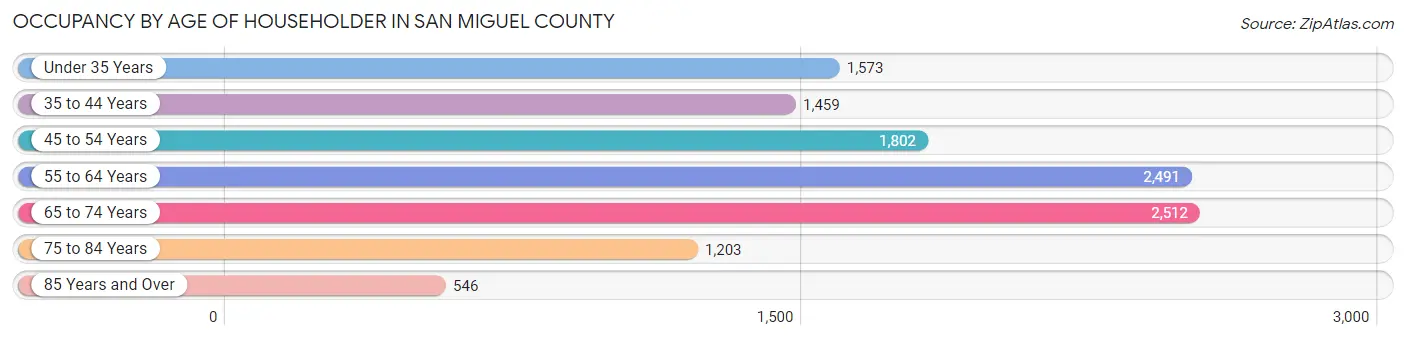
| Age Bracket | # Households | % Households |
| Under 35 Years | 1,573 | 13.6% |
| 35 to 44 Years | 1,459 | 12.6% |
| 45 to 54 Years | 1,802 | 15.5% |
| 55 to 64 Years | 2,491 | 21.5% |
| 65 to 74 Years | 2,512 | 21.7% |
| 75 to 84 Years | 1,203 | 10.4% |
| 85 Years and Over | 546 | 4.7% |
| Total | 11,586 | 100.0% |
Housing Finances in San Miguel County
Median Income by Occupancy in San Miguel County
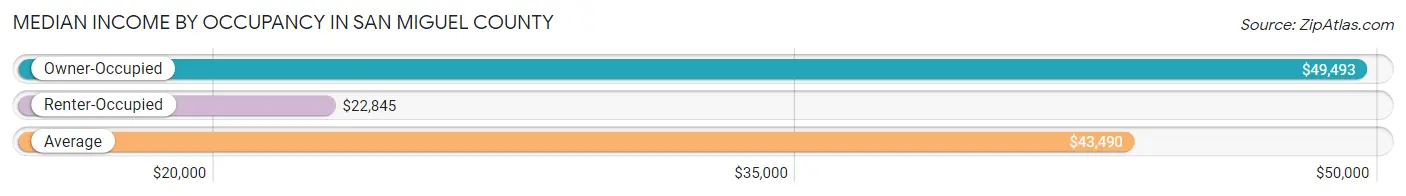
| Occupancy Type | # Households | Median Income |
| Owner-Occupied | 8,297 (71.6%) | $49,493 |
| Renter-Occupied | 3,289 (28.4%) | $22,845 |
| Average | 11,586 (100.0%) | $43,490 |
Occupancy by Householder Income Bracket in San Miguel County
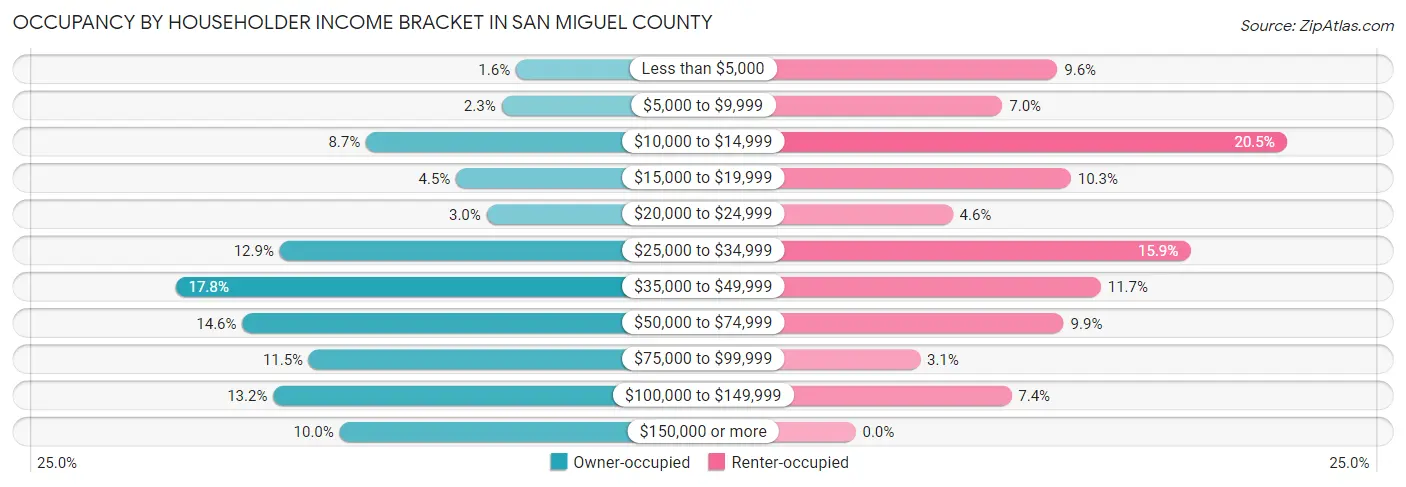
| Income Bracket | Owner-occupied | Renter-occupied |
| Less than $5,000 | 133 (1.6%) | 316 (9.6%) |
| $5,000 to $9,999 | 190 (2.3%) | 230 (7.0%) |
| $10,000 to $14,999 | 725 (8.7%) | 675 (20.5%) |
| $15,000 to $19,999 | 369 (4.4%) | 337 (10.2%) |
| $20,000 to $24,999 | 249 (3.0%) | 152 (4.6%) |
| $25,000 to $34,999 | 1,066 (12.9%) | 524 (15.9%) |
| $35,000 to $49,999 | 1,478 (17.8%) | 384 (11.7%) |
| $50,000 to $74,999 | 1,214 (14.6%) | 326 (9.9%) |
| $75,000 to $99,999 | 951 (11.5%) | 101 (3.1%) |
| $100,000 to $149,999 | 1,092 (13.2%) | 244 (7.4%) |
| $150,000 or more | 830 (10.0%) | 0 (0.0%) |
| Total | 8,297 (100.0%) | 3,289 (100.0%) |
Monthly Housing Cost Tiers in San Miguel County
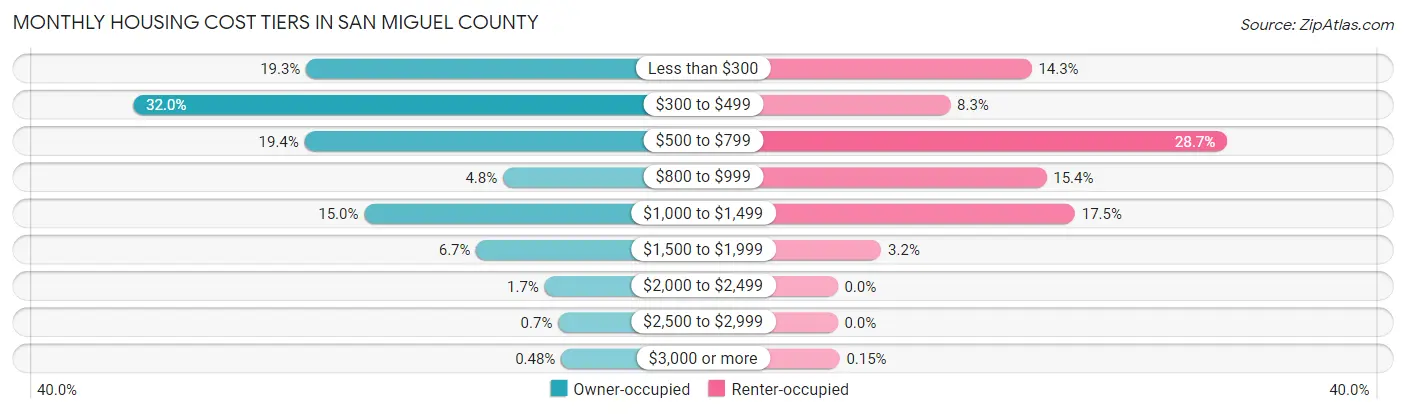
| Monthly Cost | Owner-occupied | Renter-occupied |
| Less than $300 | 1,598 (19.3%) | 470 (14.3%) |
| $300 to $499 | 2,656 (32.0%) | 273 (8.3%) |
| $500 to $799 | 1,608 (19.4%) | 944 (28.7%) |
| $800 to $999 | 395 (4.8%) | 506 (15.4%) |
| $1,000 to $1,499 | 1,243 (15.0%) | 575 (17.5%) |
| $1,500 to $1,999 | 558 (6.7%) | 106 (3.2%) |
| $2,000 to $2,499 | 141 (1.7%) | 0 (0.0%) |
| $2,500 to $2,999 | 58 (0.7%) | 0 (0.0%) |
| $3,000 or more | 40 (0.5%) | 5 (0.2%) |
| Total | 8,297 (100.0%) | 3,289 (100.0%) |
Physical Housing Characteristics in San Miguel County
Housing Structures in San Miguel County
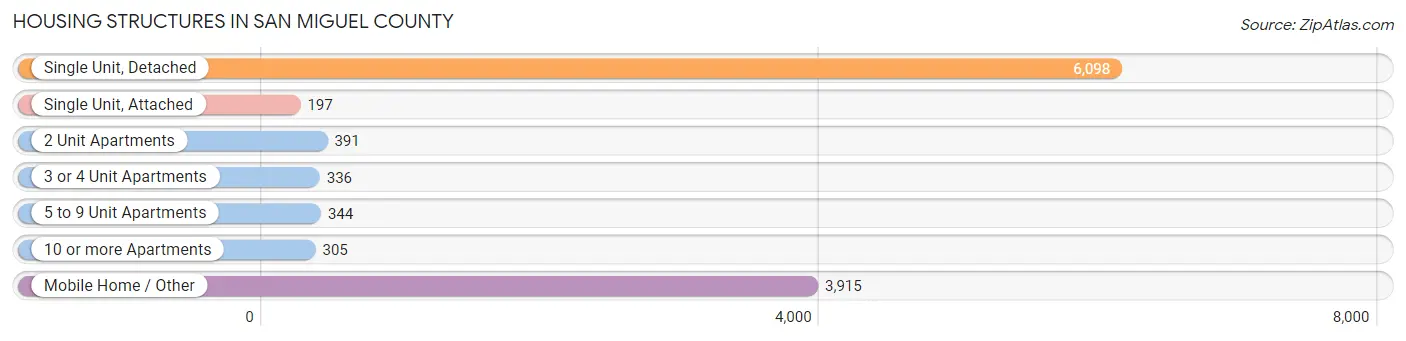
| Structure Type | # Housing Units | % Housing Units |
| Single Unit, Detached | 6,098 | 52.6% |
| Single Unit, Attached | 197 | 1.7% |
| 2 Unit Apartments | 391 | 3.4% |
| 3 or 4 Unit Apartments | 336 | 2.9% |
| 5 to 9 Unit Apartments | 344 | 3.0% |
| 10 or more Apartments | 305 | 2.6% |
| Mobile Home / Other | 3,915 | 33.8% |
| Total | 11,586 | 100.0% |
Housing Structures by Occupancy in San Miguel County

| Structure Type | Owner-occupied | Renter-occupied |
| Single Unit, Detached | 4,872 (79.9%) | 1,226 (20.1%) |
| Single Unit, Attached | 146 (74.1%) | 51 (25.9%) |
| 2 Unit Apartments | 0 (0.0%) | 391 (100.0%) |
| 3 or 4 Unit Apartments | 23 (6.9%) | 313 (93.1%) |
| 5 to 9 Unit Apartments | 0 (0.0%) | 344 (100.0%) |
| 10 or more Apartments | 0 (0.0%) | 305 (100.0%) |
| Mobile Home / Other | 3,256 (83.2%) | 659 (16.8%) |
| Total | 8,297 (71.6%) | 3,289 (28.4%) |
Housing Structures by Number of Rooms in San Miguel County
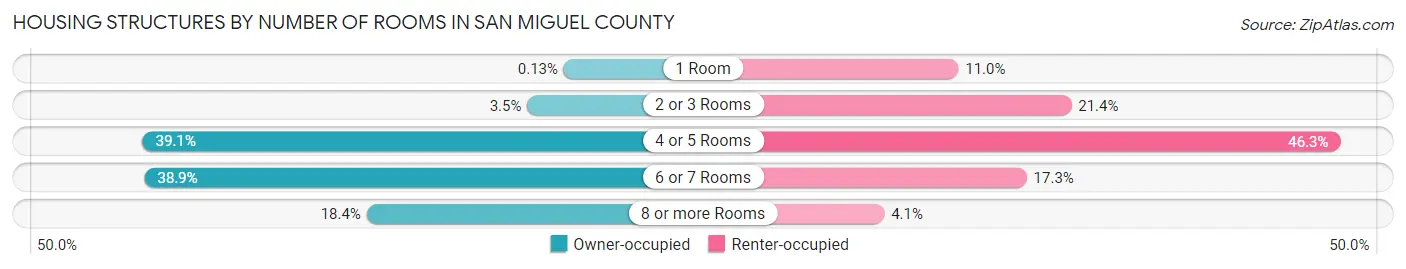
| Number of Rooms | Owner-occupied | Renter-occupied |
| 1 Room | 11 (0.1%) | 360 (11.0%) |
| 2 or 3 Rooms | 291 (3.5%) | 704 (21.4%) |
| 4 or 5 Rooms | 3,243 (39.1%) | 1,522 (46.3%) |
| 6 or 7 Rooms | 3,229 (38.9%) | 568 (17.3%) |
| 8 or more Rooms | 1,523 (18.4%) | 135 (4.1%) |
| Total | 8,297 (100.0%) | 3,289 (100.0%) |
Housing Structure by Heating Type in San Miguel County
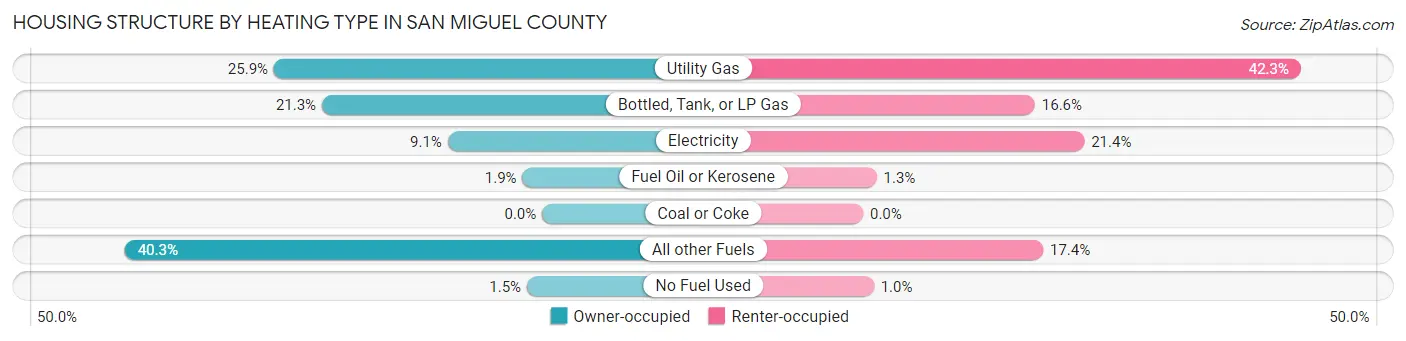
| Heating Type | Owner-occupied | Renter-occupied |
| Utility Gas | 2,150 (25.9%) | 1,391 (42.3%) |
| Bottled, Tank, or LP Gas | 1,765 (21.3%) | 546 (16.6%) |
| Electricity | 757 (9.1%) | 703 (21.4%) |
| Fuel Oil or Kerosene | 158 (1.9%) | 43 (1.3%) |
| Coal or Coke | 0 (0.0%) | 0 (0.0%) |
| All other Fuels | 3,345 (40.3%) | 572 (17.4%) |
| No Fuel Used | 122 (1.5%) | 34 (1.0%) |
| Total | 8,297 (100.0%) | 3,289 (100.0%) |
Household Vehicle Usage in San Miguel County
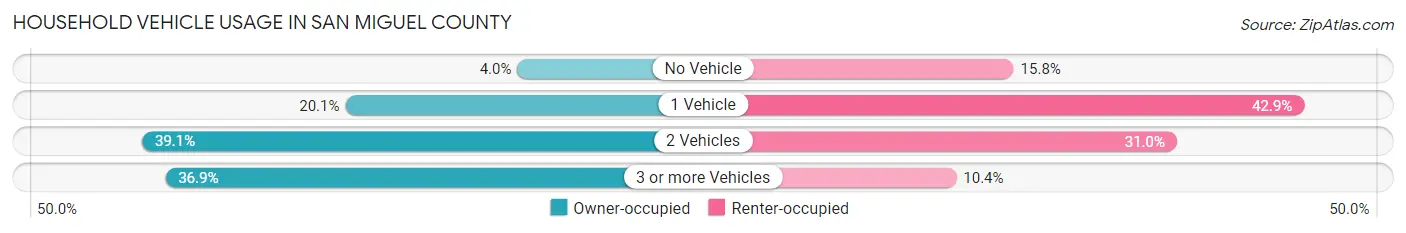
| Vehicles per Household | Owner-occupied | Renter-occupied |
| No Vehicle | 333 (4.0%) | 518 (15.8%) |
| 1 Vehicle | 1,664 (20.1%) | 1,410 (42.9%) |
| 2 Vehicles | 3,241 (39.1%) | 1,019 (31.0%) |
| 3 or more Vehicles | 3,059 (36.9%) | 342 (10.4%) |
| Total | 8,297 (100.0%) | 3,289 (100.0%) |
Real Estate & Mortgages in San Miguel County
Real Estate and Mortgage Overview in San Miguel County
| Characteristic | Without Mortgage | With Mortgage |
| Housing Units | 5,929 | 2,368 |
| Median Property Value | $126,500 | $162,100 |
| Median Household Income | $45,996 | $329 |
| Monthly Housing Costs | $395 | $40 |
| Real Estate Taxes | $817 | $143 |
Property Value by Mortgage Status in San Miguel County
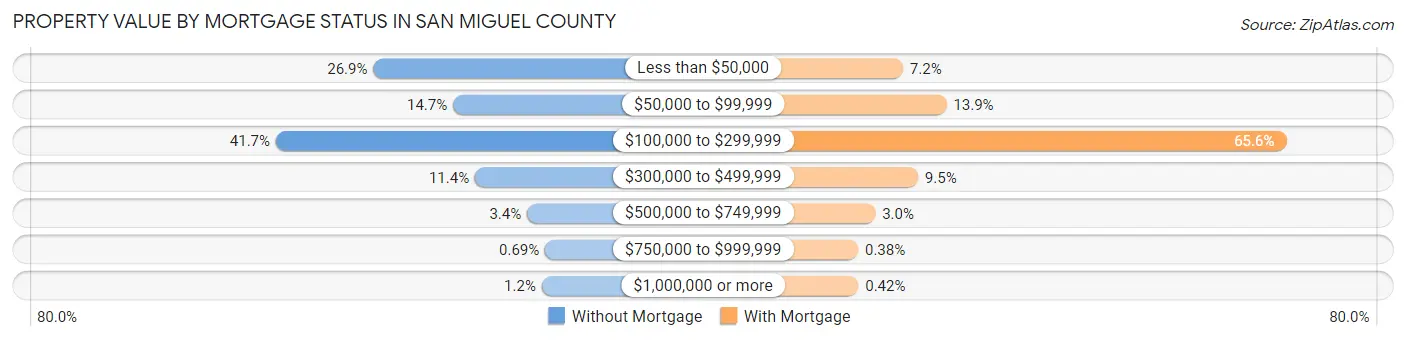
| Property Value | Without Mortgage | With Mortgage |
| Less than $50,000 | 1,593 (26.9%) | 171 (7.2%) |
| $50,000 to $99,999 | 873 (14.7%) | 328 (13.9%) |
| $100,000 to $299,999 | 2,473 (41.7%) | 1,554 (65.6%) |
| $300,000 to $499,999 | 674 (11.4%) | 225 (9.5%) |
| $500,000 to $749,999 | 204 (3.4%) | 71 (3.0%) |
| $750,000 to $999,999 | 41 (0.7%) | 9 (0.4%) |
| $1,000,000 or more | 71 (1.2%) | 10 (0.4%) |
| Total | 5,929 (100.0%) | 2,368 (100.0%) |
Household Income by Mortgage Status in San Miguel County
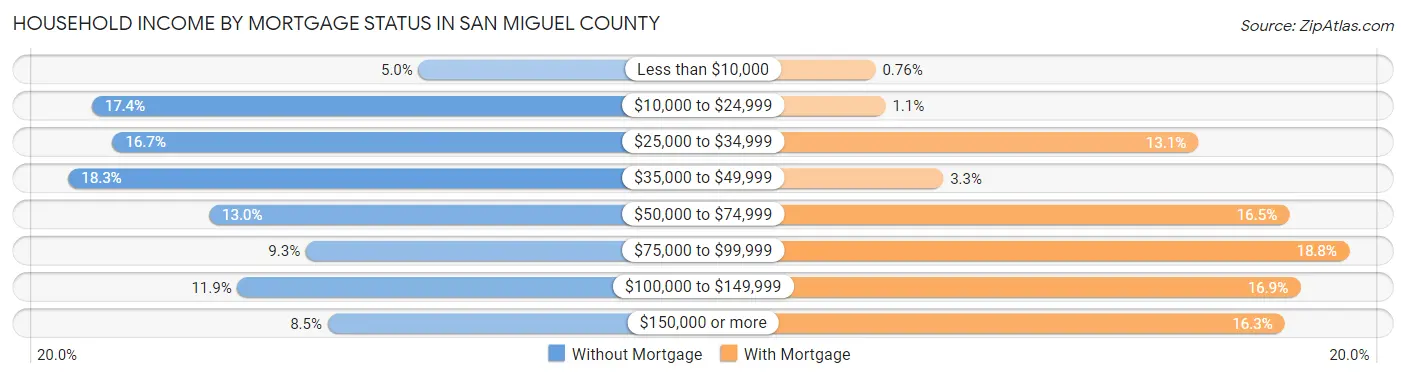
| Household Income | Without Mortgage | With Mortgage |
| Less than $10,000 | 296 (5.0%) | 18 (0.8%) |
| $10,000 to $24,999 | 1,034 (17.4%) | 27 (1.1%) |
| $25,000 to $34,999 | 987 (16.7%) | 309 (13.1%) |
| $35,000 to $49,999 | 1,087 (18.3%) | 79 (3.3%) |
| $50,000 to $74,999 | 769 (13.0%) | 391 (16.5%) |
| $75,000 to $99,999 | 550 (9.3%) | 445 (18.8%) |
| $100,000 to $149,999 | 705 (11.9%) | 401 (16.9%) |
| $150,000 or more | 501 (8.5%) | 387 (16.3%) |
| Total | 5,929 (100.0%) | 2,368 (100.0%) |
Property Value to Household Income Ratio in San Miguel County
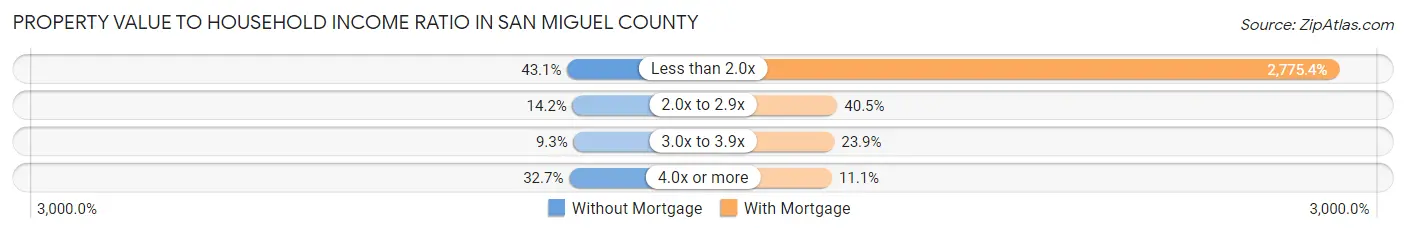
| Value-to-Income Ratio | Without Mortgage | With Mortgage |
| Less than 2.0x | 2,558 (43.1%) | 65,721 (2,775.4%) |
| 2.0x to 2.9x | 839 (14.1%) | 960 (40.5%) |
| 3.0x to 3.9x | 552 (9.3%) | 566 (23.9%) |
| 4.0x or more | 1,941 (32.7%) | 262 (11.1%) |
| Total | 5,929 (100.0%) | 2,368 (100.0%) |
Real Estate Taxes by Mortgage Status in San Miguel County
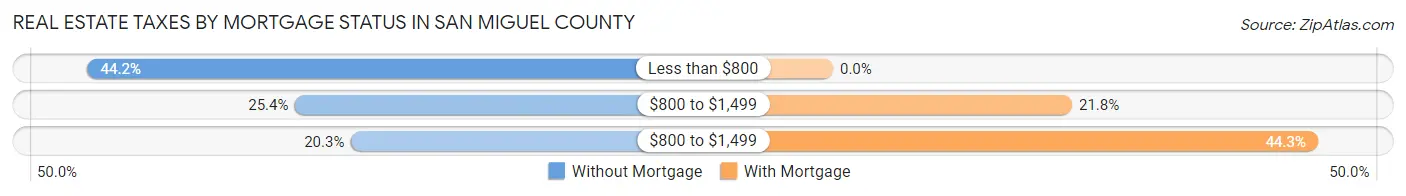
| Property Taxes | Without Mortgage | With Mortgage |
| Less than $800 | 2,623 (44.2%) | 0 (0.0%) |
| $800 to $1,499 | 1,504 (25.4%) | 517 (21.8%) |
| $800 to $1,499 | 1,201 (20.3%) | 1,048 (44.3%) |
| Total | 5,929 (100.0%) | 2,368 (100.0%) |
Health & Disability in San Miguel County
Health Insurance Coverage by Age in San Miguel County
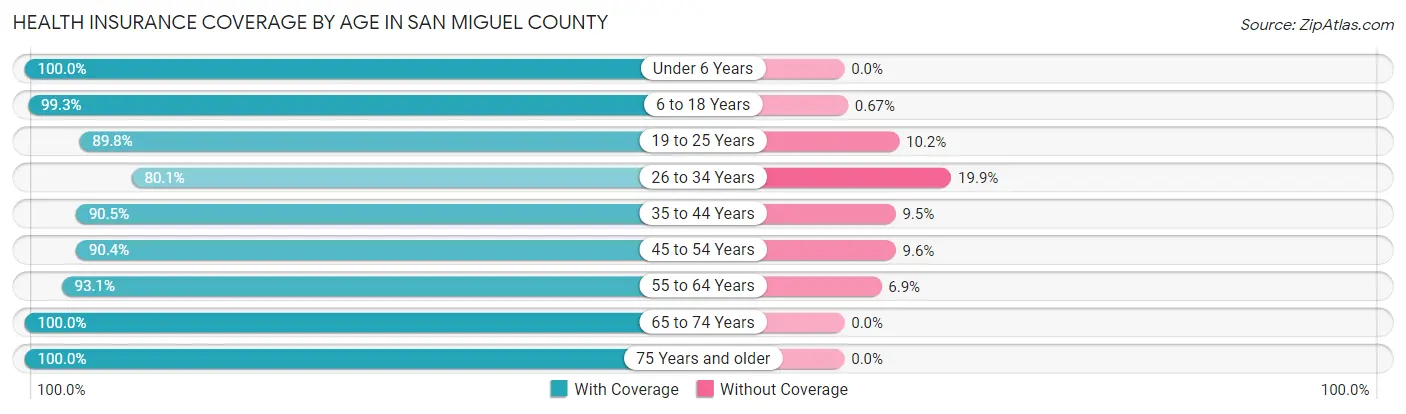
| Age Bracket | With Coverage | Without Coverage |
| Under 6 Years | 1,342 (100.0%) | 0 (0.0%) |
| 6 to 18 Years | 3,707 (99.3%) | 25 (0.7%) |
| 19 to 25 Years | 2,310 (89.8%) | 263 (10.2%) |
| 26 to 34 Years | 2,230 (80.1%) | 555 (19.9%) |
| 35 to 44 Years | 2,731 (90.5%) | 288 (9.5%) |
| 45 to 54 Years | 2,768 (90.4%) | 293 (9.6%) |
| 55 to 64 Years | 3,908 (93.1%) | 290 (6.9%) |
| 65 to 74 Years | 3,640 (100.0%) | 0 (0.0%) |
| 75 Years and older | 2,449 (100.0%) | 0 (0.0%) |
| Total | 25,085 (93.6%) | 1,714 (6.4%) |
Health Insurance Coverage by Citizenship Status in San Miguel County
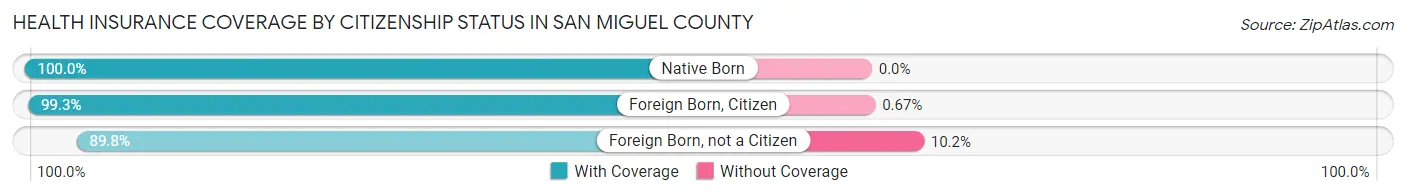
| Citizenship Status | With Coverage | Without Coverage |
| Native Born | 1,342 (100.0%) | 0 (0.0%) |
| Foreign Born, Citizen | 3,707 (99.3%) | 25 (0.7%) |
| Foreign Born, not a Citizen | 2,310 (89.8%) | 263 (10.2%) |
Health Insurance Coverage by Household Income in San Miguel County
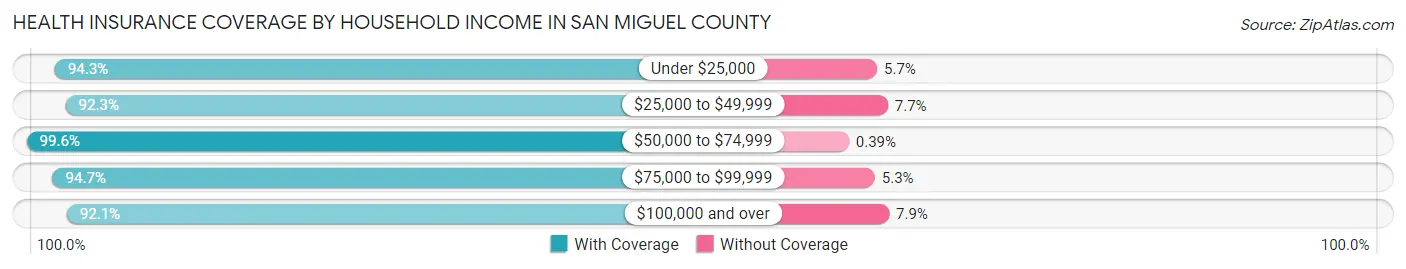
| Household Income | With Coverage | Without Coverage |
| Under $25,000 | 5,067 (94.3%) | 305 (5.7%) |
| $25,000 to $49,999 | 6,677 (92.3%) | 556 (7.7%) |
| $50,000 to $74,999 | 3,028 (99.6%) | 12 (0.4%) |
| $75,000 to $99,999 | 2,650 (94.7%) | 147 (5.3%) |
| $100,000 and over | 6,770 (92.1%) | 583 (7.9%) |
Public vs Private Health Insurance Coverage by Age in San Miguel County
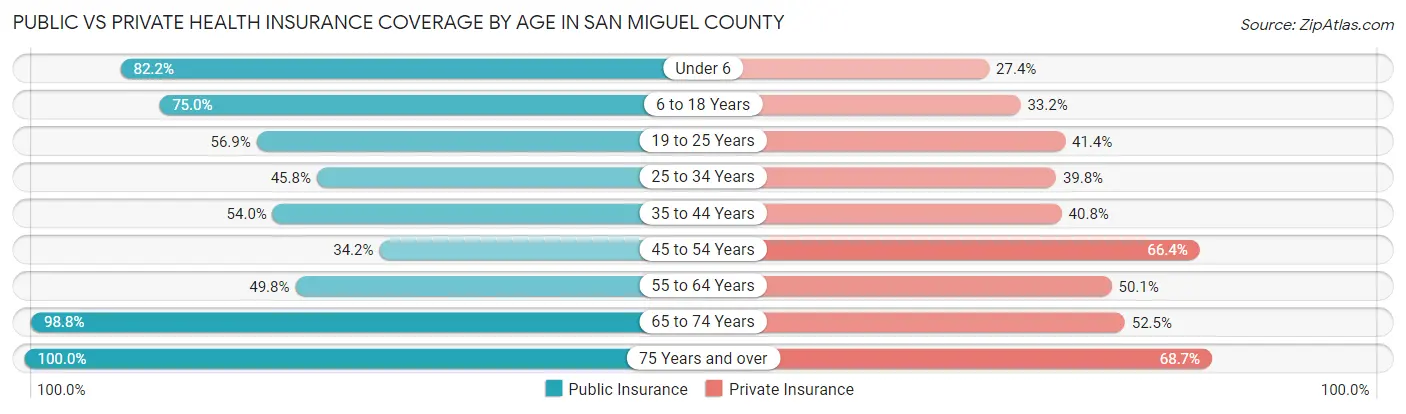
| Age Bracket | Public Insurance | Private Insurance |
| Under 6 | 1,103 (82.2%) | 367 (27.4%) |
| 6 to 18 Years | 2,799 (75.0%) | 1,238 (33.2%) |
| 19 to 25 Years | 1,465 (56.9%) | 1,066 (41.4%) |
| 25 to 34 Years | 1,275 (45.8%) | 1,107 (39.8%) |
| 35 to 44 Years | 1,629 (54.0%) | 1,232 (40.8%) |
| 45 to 54 Years | 1,046 (34.2%) | 2,033 (66.4%) |
| 55 to 64 Years | 2,089 (49.8%) | 2,102 (50.1%) |
| 65 to 74 Years | 3,596 (98.8%) | 1,912 (52.5%) |
| 75 Years and over | 2,449 (100.0%) | 1,682 (68.7%) |
| Total | 17,451 (65.1%) | 12,739 (47.5%) |
Disability Status by Sex by Age in San Miguel County
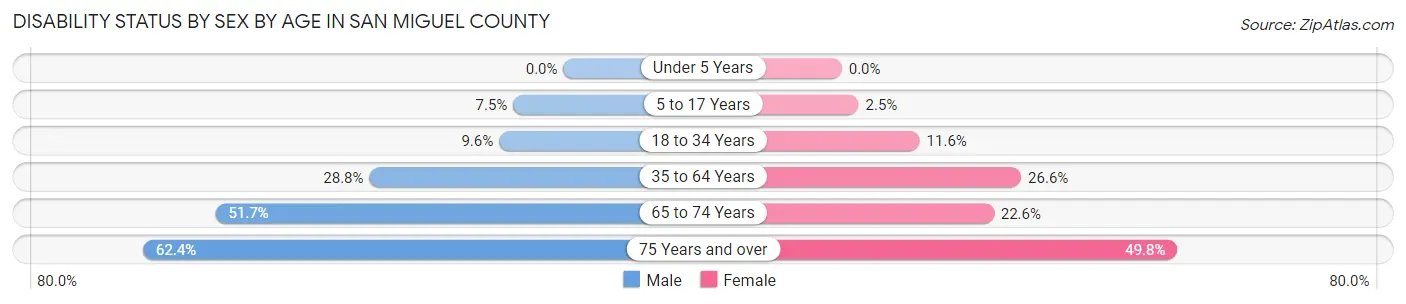
| Age Bracket | Male | Female |
| Under 5 Years | 0 (0.0%) | 0 (0.0%) |
| 5 to 17 Years | 128 (7.4%) | 44 (2.5%) |
| 18 to 34 Years | 294 (9.6%) | 318 (11.6%) |
| 35 to 64 Years | 1,464 (28.8%) | 1,384 (26.6%) |
| 65 to 74 Years | 869 (51.7%) | 442 (22.6%) |
| 75 Years and over | 693 (62.4%) | 667 (49.8%) |
Disability Class by Sex by Age in San Miguel County
Disability Class: Hearing Difficulty
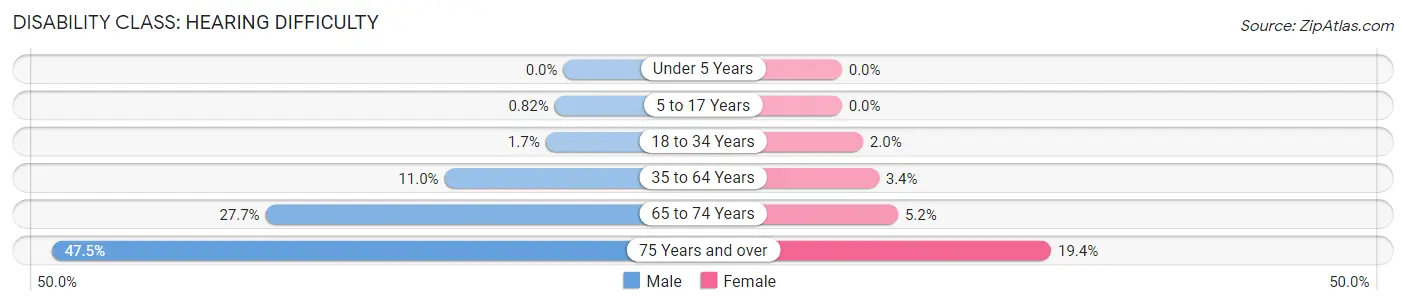
| Age Bracket | Male | Female |
| Under 5 Years | 0 (0.0%) | 0 (0.0%) |
| 5 to 17 Years | 14 (0.8%) | 0 (0.0%) |
| 18 to 34 Years | 51 (1.7%) | 54 (2.0%) |
| 35 to 64 Years | 561 (11.0%) | 178 (3.4%) |
| 65 to 74 Years | 465 (27.7%) | 102 (5.2%) |
| 75 Years and over | 527 (47.5%) | 260 (19.4%) |
Disability Class: Vision Difficulty
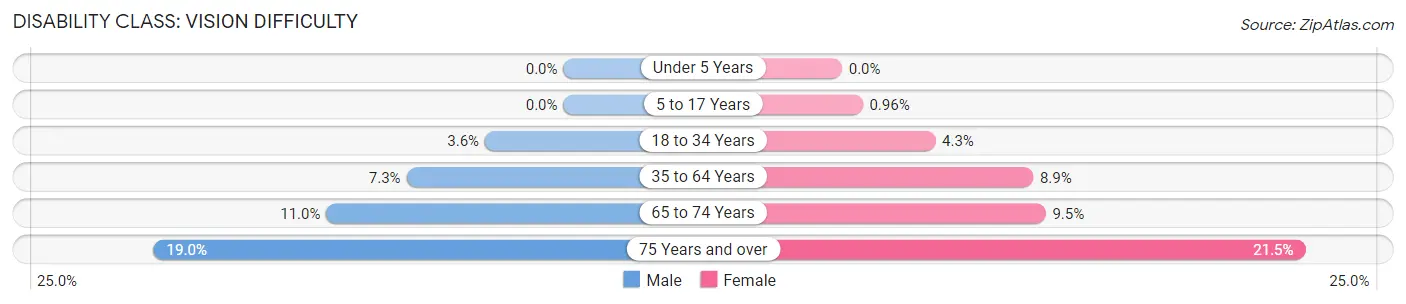
| Age Bracket | Male | Female |
| Under 5 Years | 0 (0.0%) | 0 (0.0%) |
| 5 to 17 Years | 0 (0.0%) | 17 (1.0%) |
| 18 to 34 Years | 112 (3.6%) | 119 (4.3%) |
| 35 to 64 Years | 370 (7.3%) | 461 (8.9%) |
| 65 to 74 Years | 185 (11.0%) | 185 (9.5%) |
| 75 Years and over | 211 (19.0%) | 288 (21.5%) |
Disability Class: Cognitive Difficulty
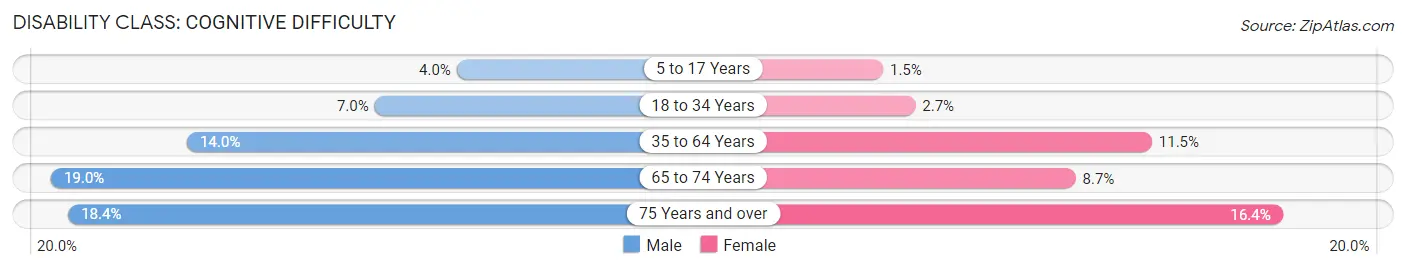
| Age Bracket | Male | Female |
| 5 to 17 Years | 68 (4.0%) | 27 (1.5%) |
| 18 to 34 Years | 216 (7.0%) | 75 (2.7%) |
| 35 to 64 Years | 710 (14.0%) | 598 (11.5%) |
| 65 to 74 Years | 320 (19.0%) | 170 (8.7%) |
| 75 Years and over | 204 (18.4%) | 219 (16.4%) |
Disability Class: Ambulatory Difficulty
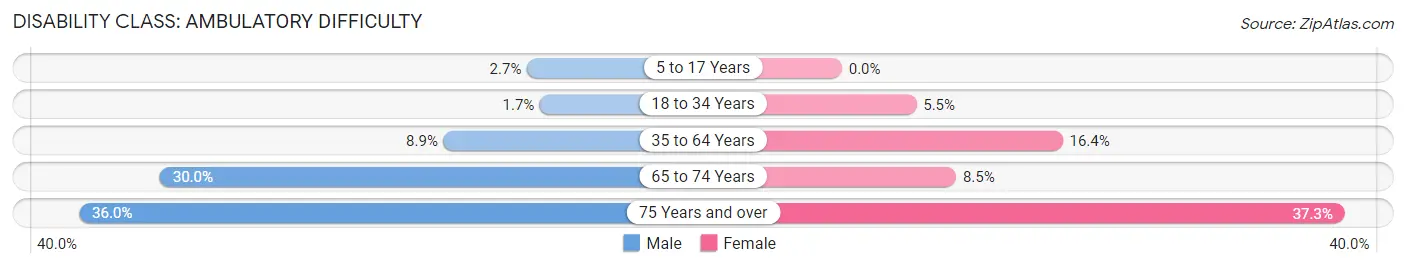
| Age Bracket | Male | Female |
| 5 to 17 Years | 46 (2.7%) | 0 (0.0%) |
| 18 to 34 Years | 53 (1.7%) | 152 (5.5%) |
| 35 to 64 Years | 451 (8.9%) | 852 (16.4%) |
| 65 to 74 Years | 504 (30.0%) | 166 (8.5%) |
| 75 Years and over | 399 (35.9%) | 500 (37.3%) |
Disability Class: Self-Care Difficulty
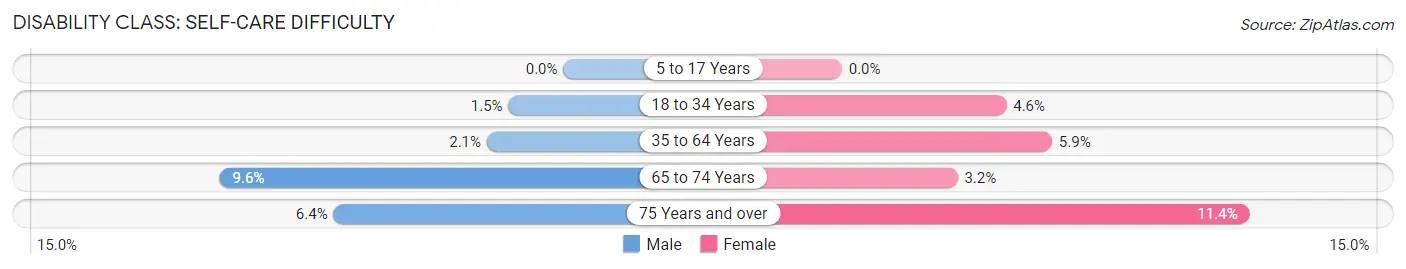
| Age Bracket | Male | Female |
| 5 to 17 Years | 0 (0.0%) | 0 (0.0%) |
| 18 to 34 Years | 47 (1.5%) | 126 (4.6%) |
| 35 to 64 Years | 108 (2.1%) | 304 (5.9%) |
| 65 to 74 Years | 161 (9.6%) | 63 (3.2%) |
| 75 Years and over | 71 (6.4%) | 152 (11.4%) |
Technology Access in San Miguel County
Computing Device Access in San Miguel County
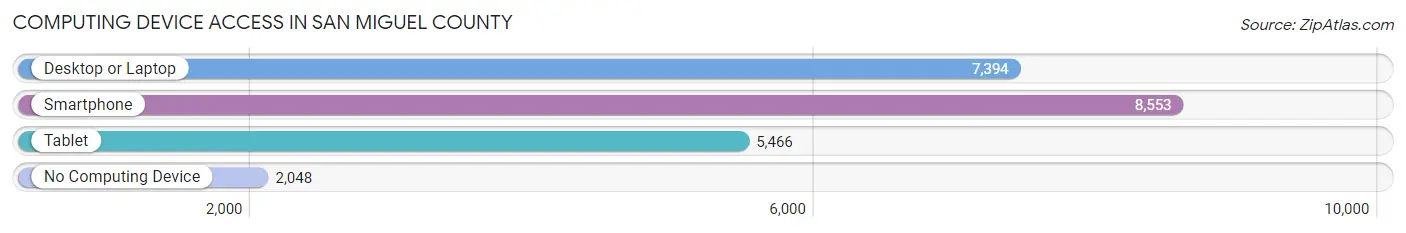
| Device Type | # Households | % Households |
| Desktop or Laptop | 7,394 | 63.8% |
| Smartphone | 8,553 | 73.8% |
| Tablet | 5,466 | 47.2% |
| No Computing Device | 2,048 | 17.7% |
| Total | 11,586 | 100.0% |
Internet Access in San Miguel County
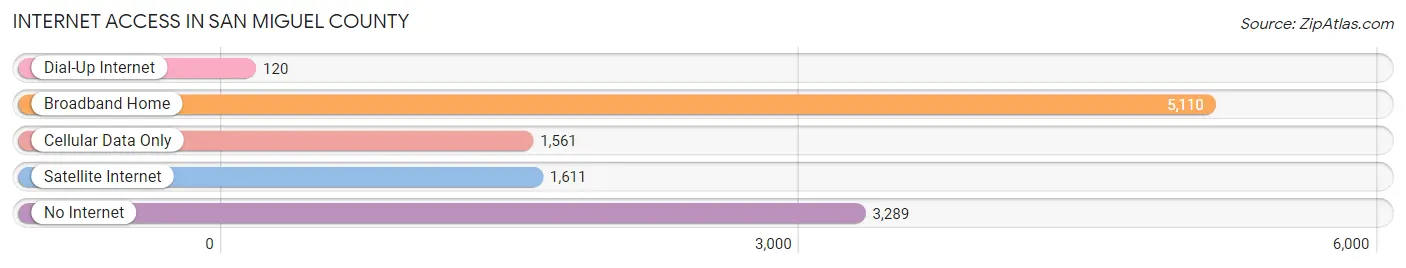
| Internet Type | # Households | % Households |
| Dial-Up Internet | 120 | 1.0% |
| Broadband Home | 5,110 | 44.1% |
| Cellular Data Only | 1,561 | 13.5% |
| Satellite Internet | 1,611 | 13.9% |
| No Internet | 3,289 | 28.4% |
| Total | 11,586 | 100.0% |
San Miguel County Summary
Introduction
Located in the northern part of New Mexico, San Miguel County is a rural county with a population of 29,393 as of the 2019 census. It is the fifth-largest county in the state and is bordered by Mora County to the north, Santa Fe County to the east, Guadalupe County to the south, and Harding County to the west. The county seat is Las Vegas, which is also the largest city in the county. San Miguel County is known for its rich history, diverse geography, and vibrant economy.
History
San Miguel County was established in 1852 and was named after the San Miguel Mission, which was founded in 1625. The mission was the first Spanish mission in the area and was established by Franciscan friars. The mission was abandoned in 1680 due to Apache raids, but the area remained under Spanish control until 1821 when Mexico gained independence from Spain. After the Mexican-American War, the area became part of the United States in 1848.
The county was initially populated by Native American tribes, including the Apache, Navajo, and Ute. The first settlers in the area were Spanish colonists, who established ranches and farms in the area. The county was also home to several mining towns, including Madrid, which was established in 1835. The town was a major producer of coal and was home to several saloons and brothels.
Geography
San Miguel County is located in the northern part of New Mexico and covers an area of 2,945 square miles. The county is bordered by Mora County to the north, Santa Fe County to the east, Guadalupe County to the south, and Harding County to the west. The county is located in the Great Plains region of the United States and is characterized by rolling hills and wide open spaces. The highest point in the county is the summit of Mount Baldy, which has an elevation of 8,945 feet.
The county is home to several rivers, including the Pecos River, which flows through the county from north to south. The county is also home to several lakes, including Eagle Nest Lake, which is located in the northern part of the county. The county is also home to several national forests, including the Carson National Forest, which covers an area of 1.5 million acres.
Economy
San Miguel County has a diverse economy that is driven by agriculture, tourism, and mining. Agriculture is the largest sector of the economy, with the county producing a variety of crops, including alfalfa, hay, and wheat. The county is also home to several cattle ranches, which produce beef and dairy products.
Tourism is also an important part of the economy, with the county being home to several national parks and monuments, including the Pecos National Historical Park and the Santa Fe National Historic Trail. The county is also home to several ski resorts, including the Angel Fire Resort, which is located in the northern part of the county.
Mining is also an important part of the economy, with the county being home to several coal mines. The county is also home to several oil and gas fields, which produce natural gas and crude oil.
Demographics
As of the 2019 census, San Miguel County had a population of 29,393. The population is predominantly Hispanic, with the majority of the population being of Mexican descent. The county also has a significant Native American population, with the Navajo, Apache, and Ute tribes being the largest. The county also has a small population of African Americans, Asians, and other races.
The median household income in the county is $41,945, and the median home value is $133,400. The poverty rate in the county is 18.3%, which is higher than the national average.
Conclusion
San Miguel County is a rural county located in the northern part of New Mexico. The county is known for its rich history, diverse geography, and vibrant economy. The county is predominantly Hispanic, with the majority of the population being of Mexican descent. Agriculture, tourism, and mining are the main drivers of the economy, and the county is home to several national parks and monuments. The median household income in the county is $41,945, and the poverty rate is 18.3%.
Common Questions
What is Per Capita Income in San Miguel County?
Per Capita income in San Miguel County is $26,314.
What is the Median Family Income in San Miguel County?
Median Family Income in San Miguel County is $53,204.
What is the Median Household income in San Miguel County?
Median Household Income in San Miguel County is $43,490.
What is Income or Wage Gap in San Miguel County?
Income or Wage Gap in San Miguel County is 18.3%.
Women in San Miguel County earn 81.7 cents for every dollar earned by a man.
What is Family Income Deficit in San Miguel County?
Family Income Deficit in San Miguel County is $9,730.
Families that are below poverty line in San Miguel County earn $9,730 less on average than the poverty threshold level.
What is Inequality or Gini Index in San Miguel County?
Inequality or Gini Index in San Miguel County is 0.47.
What is the Total Population of San Miguel County?
Total Population of San Miguel County is 27,215.
What is the Total Male Population of San Miguel County?
Total Male Population of San Miguel County is 13,545.
What is the Total Female Population of San Miguel County?
Total Female Population of San Miguel County is 13,670.
What is the Ratio of Males per 100 Females in San Miguel County?
There are 99.09 Males per 100 Females in San Miguel County.
What is the Ratio of Females per 100 Males in San Miguel County?
There are 100.92 Females per 100 Males in San Miguel County.
What is the Median Population Age in San Miguel County?
Median Population Age in San Miguel County is 45.0 Years.
What is the Average Family Size in San Miguel County
Average Family Size in San Miguel County is 2.9 People.
What is the Average Household Size in San Miguel County
Average Household Size in San Miguel County is 2.2 People.
How Large is the Labor Force in San Miguel County?
There are 11,773 People in the Labor Forcein in San Miguel County.
What is the Percentage of People in the Labor Force in San Miguel County?
50.3% of People are in the Labor Force in San Miguel County.
What is the Unemployment Rate in San Miguel County?
Unemployment Rate in San Miguel County is 6.9%.