Sandoval County, NM Map & Demographics
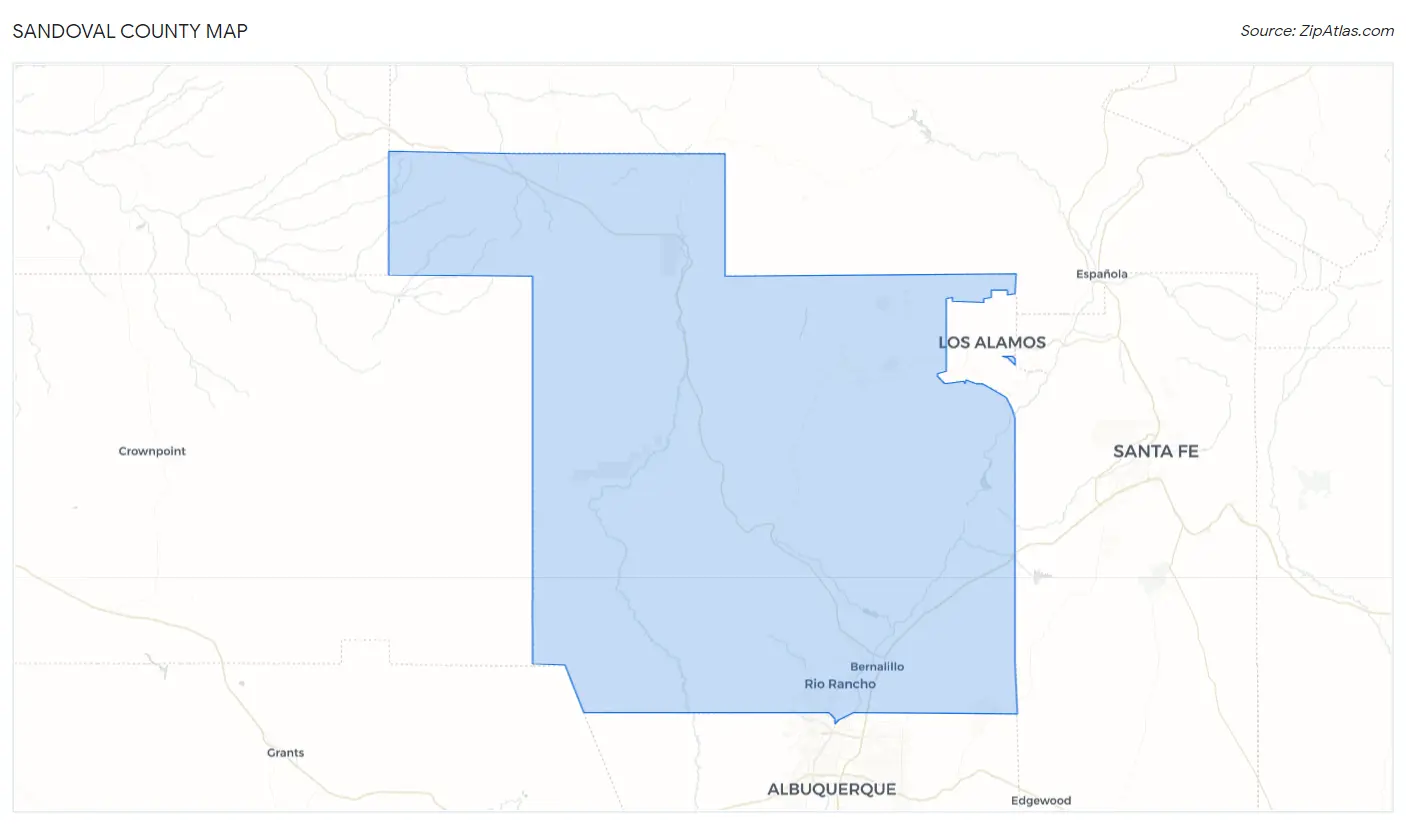
Sandoval County Map
Sandoval County Overview
$36,603
PER CAPITA INCOME
$86,062
AVG FAMILY INCOME
$76,424
AVG HOUSEHOLD INCOME
27.4%
WAGE / INCOME GAP [ % ]
72.6¢/ $1
WAGE / INCOME GAP [ $ ]
$11,112
FAMILY INCOME DEFICIT
0.42
INEQUALITY / GINI INDEX
149,460
TOTAL POPULATION
74,086
MALE POPULATION
75,374
FEMALE POPULATION
98.29
MALES / 100 FEMALES
101.74
FEMALES / 100 MALES
40.8
MEDIAN AGE
3.2
AVG FAMILY SIZE
2.7
AVG HOUSEHOLD SIZE
71,355
LABOR FORCE [ PEOPLE ]
59.4%
PERCENT IN LABOR FORCE
5.9%
UNEMPLOYMENT RATE
Income in Sandoval County
Income Overview in Sandoval County
Per Capita Income in Sandoval County is $36,603, while median incomes of families and households are $86,062 and $76,424 respectively.
| Characteristic | Number | Measure |
| Per Capita Income | 149,460 | $36,603 |
| Median Family Income | 39,850 | $86,062 |
| Mean Family Income | 39,850 | $108,005 |
| Median Household Income | 54,911 | $76,424 |
| Mean Household Income | 54,911 | $96,937 |
| Income Deficit | 39,850 | $11,112 |
| Wage / Income Gap (%) | 149,460 | 27.37% |
| Wage / Income Gap ($) | 149,460 | 72.63¢ per $1 |
| Gini / Inequality Index | 149,460 | 0.42 |
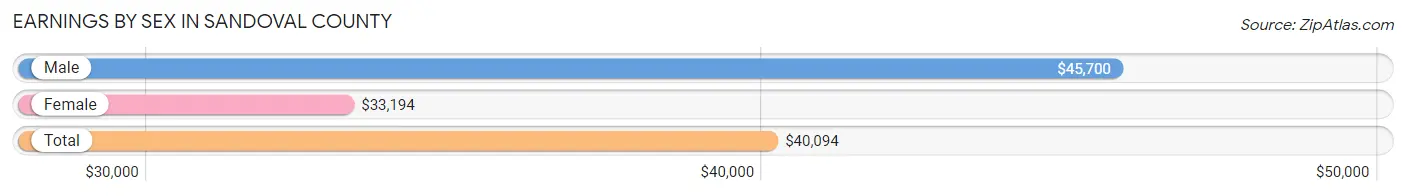
Earnings by Sex in Sandoval County
Average Earnings in Sandoval County are $40,094, $45,700 for men and $33,194 for women, a difference of 27.4%.
| Sex | Number | Average Earnings |
| Male | 39,213 (53.1%) | $45,700 |
| Female | 34,634 (46.9%) | $33,194 |
| Total | 73,847 (100.0%) | $40,094 |
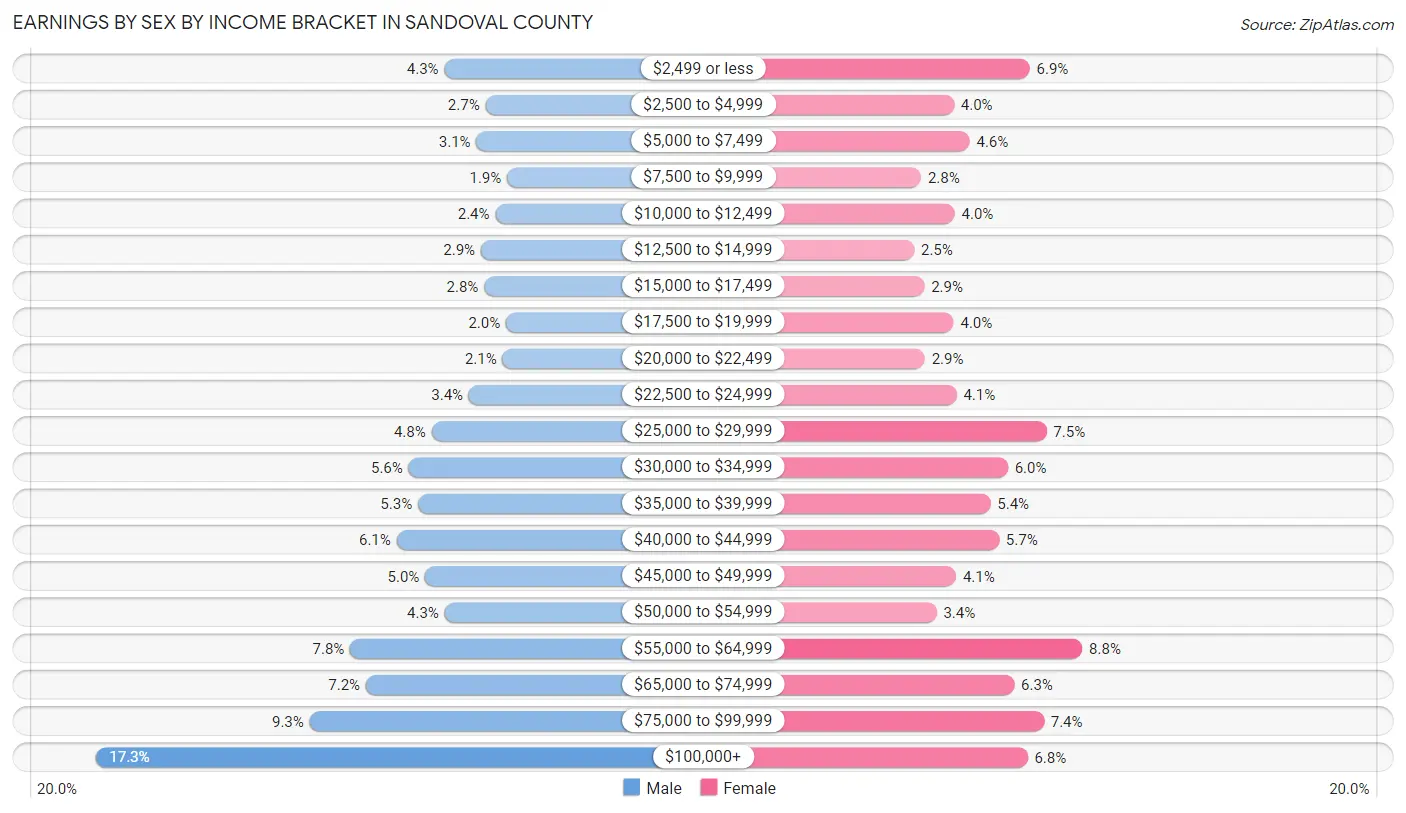
Earnings by Sex by Income Bracket in Sandoval County
The most common earnings brackets in Sandoval County are $100,000+ for men (6,787 | 17.3%) and $55,000 to $64,999 for women (3,054 | 8.8%).
| Income | Male | Female |
| $2,499 or less | 1,676 (4.3%) | 2,373 (6.9%) |
| $2,500 to $4,999 | 1,070 (2.7%) | 1,388 (4.0%) |
| $5,000 to $7,499 | 1,203 (3.1%) | 1,594 (4.6%) |
| $7,500 to $9,999 | 751 (1.9%) | 962 (2.8%) |
| $10,000 to $12,499 | 924 (2.4%) | 1,399 (4.0%) |
| $12,500 to $14,999 | 1,136 (2.9%) | 874 (2.5%) |
| $15,000 to $17,499 | 1,090 (2.8%) | 1,005 (2.9%) |
| $17,500 to $19,999 | 769 (2.0%) | 1,386 (4.0%) |
| $20,000 to $22,499 | 820 (2.1%) | 1,010 (2.9%) |
| $22,500 to $24,999 | 1,315 (3.4%) | 1,423 (4.1%) |
| $25,000 to $29,999 | 1,864 (4.8%) | 2,592 (7.5%) |
| $30,000 to $34,999 | 2,199 (5.6%) | 2,089 (6.0%) |
| $35,000 to $39,999 | 2,062 (5.3%) | 1,864 (5.4%) |
| $40,000 to $44,999 | 2,376 (6.1%) | 1,974 (5.7%) |
| $45,000 to $49,999 | 1,957 (5.0%) | 1,415 (4.1%) |
| $50,000 to $54,999 | 1,671 (4.3%) | 1,163 (3.4%) |
| $55,000 to $64,999 | 3,059 (7.8%) | 3,054 (8.8%) |
| $65,000 to $74,999 | 2,828 (7.2%) | 2,170 (6.3%) |
| $75,000 to $99,999 | 3,656 (9.3%) | 2,556 (7.4%) |
| $100,000+ | 6,787 (17.3%) | 2,343 (6.8%) |
| Total | 39,213 (100.0%) | 34,634 (100.0%) |
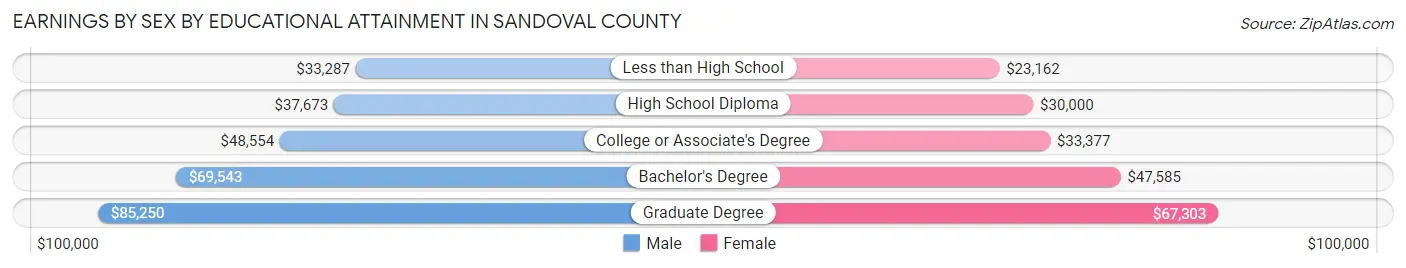
Earnings by Sex by Educational Attainment in Sandoval County
Average earnings in Sandoval County are $50,836 for men and $38,834 for women, a difference of 23.6%. Men with an educational attainment of graduate degree enjoy the highest average annual earnings of $85,250, while those with less than high school education earn the least with $33,287. Women with an educational attainment of graduate degree earn the most with the average annual earnings of $67,303, while those with less than high school education have the smallest earnings of $23,162.
| Educational Attainment | Male Income | Female Income |
| Less than High School | $33,287 | $23,162 |
| High School Diploma | $37,673 | $30,000 |
| College or Associate's Degree | $48,554 | $33,377 |
| Bachelor's Degree | $69,543 | $47,585 |
| Graduate Degree | $85,250 | $67,303 |
| Total | $50,836 | $38,834 |
Family Income in Sandoval County
Family Income Brackets in Sandoval County
According to the Sandoval County family income data, there are 8,408 families falling into the $100,000 to $149,999 income range, which is the most common income bracket and makes up 21.1% of all families. Conversely, the $10,000 to $14,999 income bracket is the least frequent group with only 677 families (1.7%) belonging to this category.
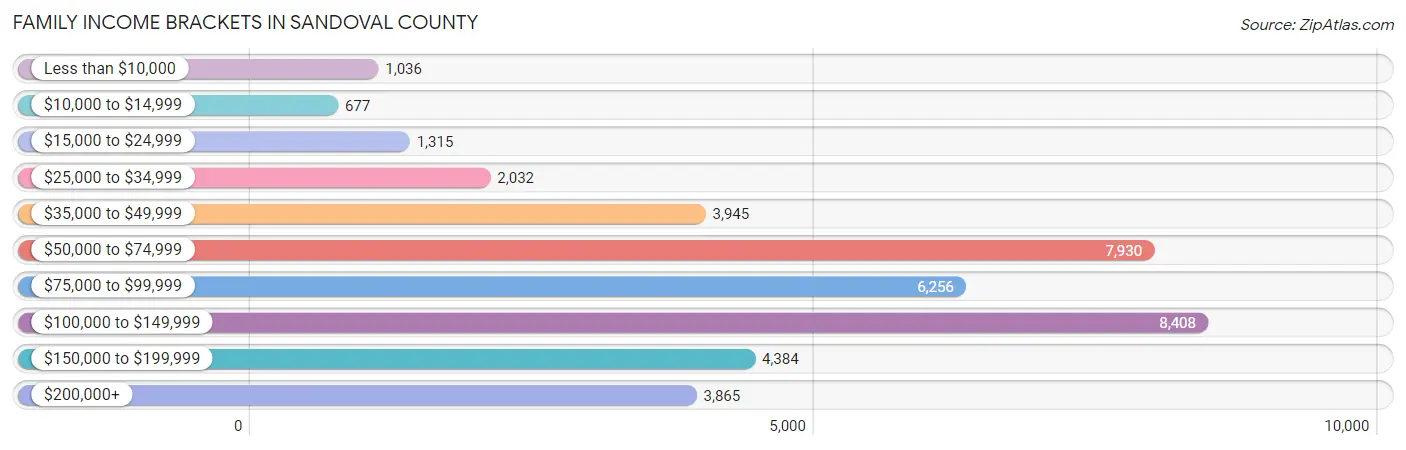
| Income Bracket | # Families | % Families |
| Less than $10,000 | 1,036 | 2.6% |
| $10,000 to $14,999 | 677 | 1.7% |
| $15,000 to $24,999 | 1,315 | 3.3% |
| $25,000 to $34,999 | 2,032 | 5.1% |
| $35,000 to $49,999 | 3,945 | 9.9% |
| $50,000 to $74,999 | 7,930 | 19.9% |
| $75,000 to $99,999 | 6,256 | 15.7% |
| $100,000 to $149,999 | 8,408 | 21.1% |
| $150,000 to $199,999 | 4,384 | 11.0% |
| $200,000+ | 3,865 | 9.7% |
Family Income by Famaliy Size in Sandoval County
7+ person families (1,110 | 2.8%) account for the highest median family income in Sandoval County with $125,769 per family, while 2-person families (20,256 | 50.8%) have the highest median income of $36,840 per family member.
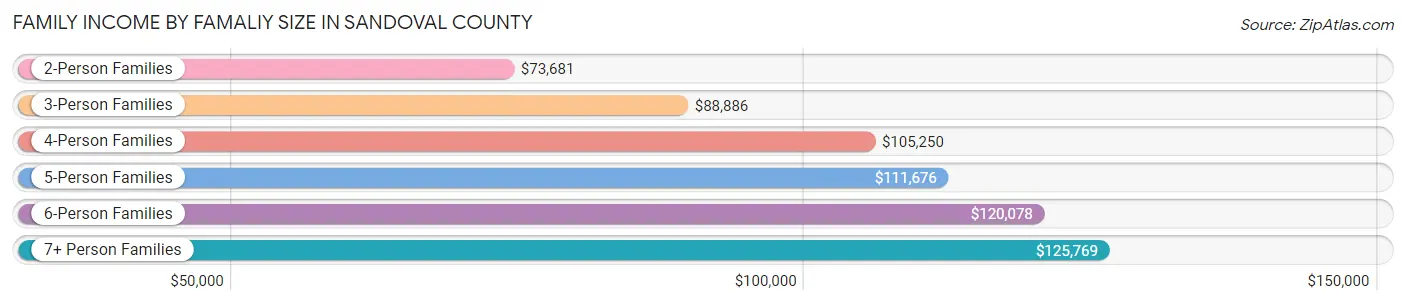
| Income Bracket | # Families | Median Income |
| 2-Person Families | 20,256 (50.8%) | $73,681 |
| 3-Person Families | 7,805 (19.6%) | $88,886 |
| 4-Person Families | 6,671 (16.7%) | $105,250 |
| 5-Person Families | 2,819 (7.1%) | $111,676 |
| 6-Person Families | 1,189 (3.0%) | $120,078 |
| 7+ Person Families | 1,110 (2.8%) | $125,769 |
| Total | 39,850 (100.0%) | $86,062 |
Family Income by Number of Earners in Sandoval County
The median family income in Sandoval County is $86,062, with families comprising 3+ earners (4,284) having the highest median family income of $133,433, while families with no earners (7,792) have the lowest median family income of $58,467, accounting for 10.7% and 19.6% of families, respectively.
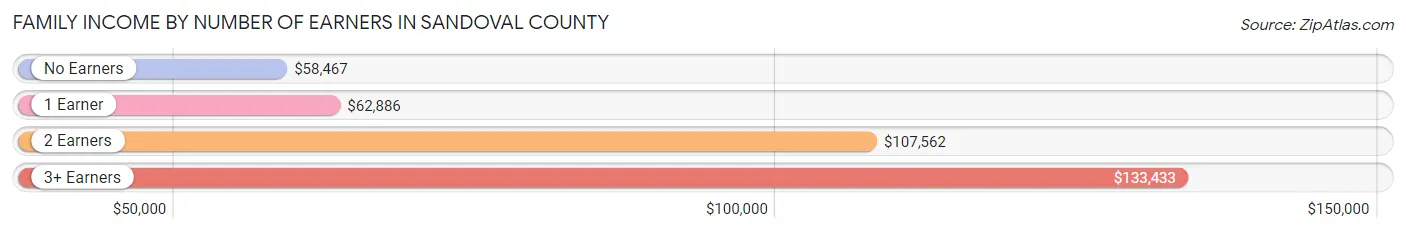
| Number of Earners | # Families | Median Income |
| No Earners | 7,792 (19.6%) | $58,467 |
| 1 Earner | 13,255 (33.3%) | $62,886 |
| 2 Earners | 14,519 (36.4%) | $107,562 |
| 3+ Earners | 4,284 (10.7%) | $133,433 |
| Total | 39,850 (100.0%) | $86,062 |
Household Income in Sandoval County
Household Income Brackets in Sandoval County
With 10,872 households falling in the category, the $50,000 to $74,999 income range is the most frequent in Sandoval County, accounting for 19.8% of all households. In contrast, only 1,538 households (2.8%) fall into the $10,000 to $14,999 income bracket, making it the least populous group.
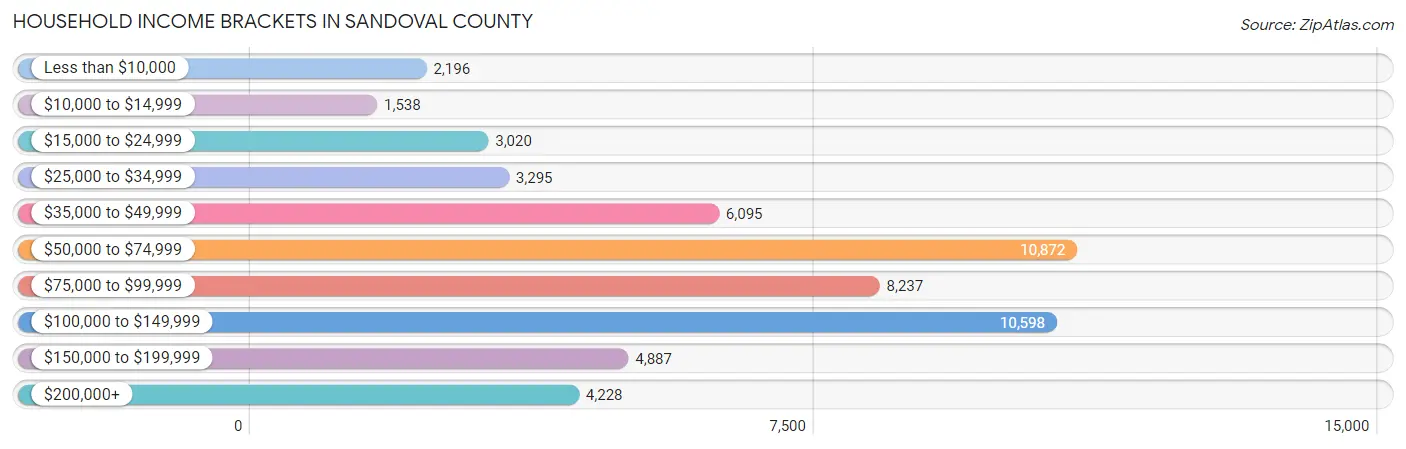
| Income Bracket | # Households | % Households |
| Less than $10,000 | 2,196 | 4.0% |
| $10,000 to $14,999 | 1,538 | 2.8% |
| $15,000 to $24,999 | 3,020 | 5.5% |
| $25,000 to $34,999 | 3,295 | 6.0% |
| $35,000 to $49,999 | 6,095 | 11.1% |
| $50,000 to $74,999 | 10,872 | 19.8% |
| $75,000 to $99,999 | 8,237 | 15.0% |
| $100,000 to $149,999 | 10,598 | 19.3% |
| $150,000 to $199,999 | 4,887 | 8.9% |
| $200,000+ | 4,228 | 7.7% |
Household Income by Householder Age in Sandoval County
The median household income in Sandoval County is $76,424, with the highest median household income of $91,276 found in the 45 to 64 years age bracket for the primary householder. A total of 20,915 households (38.1%) fall into this category. Meanwhile, the 15 to 24 years age bracket for the primary householder has the lowest median household income of $58,568, with 1,005 households (1.8%) in this group.
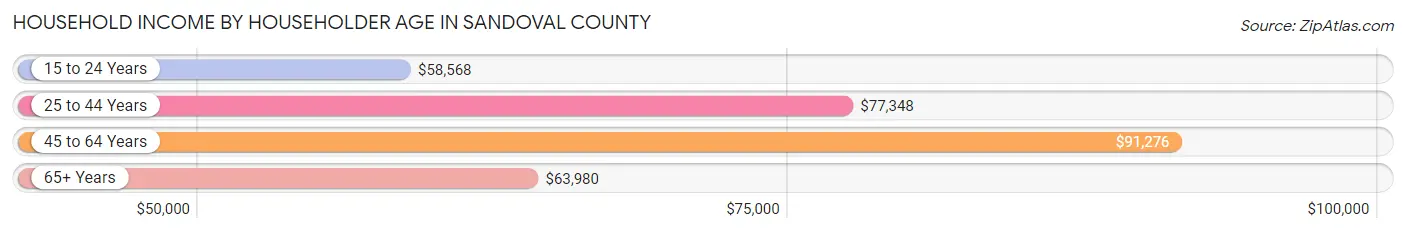
| Income Bracket | # Households | Median Income |
| 15 to 24 Years | 1,005 (1.8%) | $58,568 |
| 25 to 44 Years | 16,000 (29.1%) | $77,348 |
| 45 to 64 Years | 20,915 (38.1%) | $91,276 |
| 65+ Years | 16,991 (30.9%) | $63,980 |
| Total | 54,911 (100.0%) | $76,424 |
Poverty in Sandoval County
Income Below Poverty by Sex and Age in Sandoval County
With 8.7% poverty level for males and 11.5% for females among the residents of Sandoval County, 6 to 11 year old males and 5 year old females are the most vulnerable to poverty, with 758 males (12.8%) and 139 females (17.3%) in their respective age groups living below the poverty level.
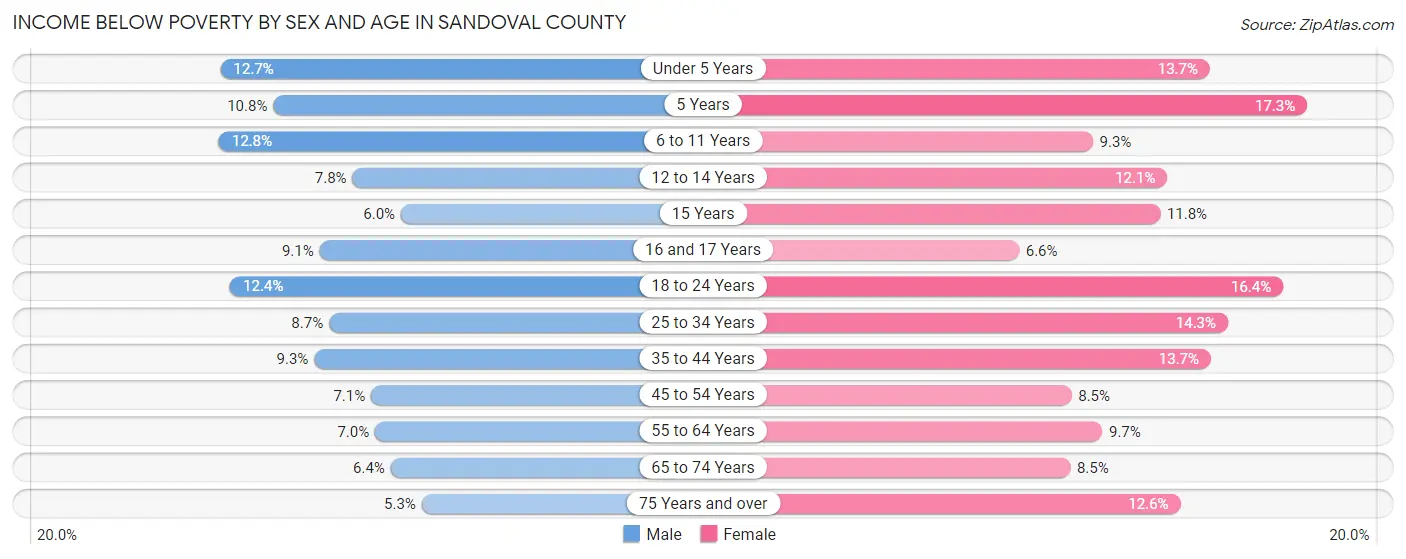
| Age Bracket | Male | Female |
| Under 5 Years | 479 (12.7%) | 468 (13.7%) |
| 5 Years | 73 (10.8%) | 139 (17.3%) |
| 6 to 11 Years | 758 (12.8%) | 470 (9.3%) |
| 12 to 14 Years | 269 (7.8%) | 416 (12.1%) |
| 15 Years | 78 (6.0%) | 99 (11.8%) |
| 16 and 17 Years | 188 (9.0%) | 145 (6.6%) |
| 18 to 24 Years | 759 (12.4%) | 934 (16.4%) |
| 25 to 34 Years | 794 (8.7%) | 1,280 (14.3%) |
| 35 to 44 Years | 903 (9.2%) | 1,338 (13.7%) |
| 45 to 54 Years | 643 (7.1%) | 776 (8.5%) |
| 55 to 64 Years | 671 (7.0%) | 997 (9.7%) |
| 65 to 74 Years | 525 (6.4%) | 791 (8.5%) |
| 75 Years and over | 241 (5.3%) | 731 (12.6%) |
| Total | 6,381 (8.7%) | 8,584 (11.5%) |
Income Above Poverty by Sex and Age in Sandoval County
According to the poverty statistics in Sandoval County, males aged 75 years and over and females aged 16 and 17 years are the age groups that are most secure financially, with 94.7% of males and 93.4% of females in these age groups living above the poverty line.
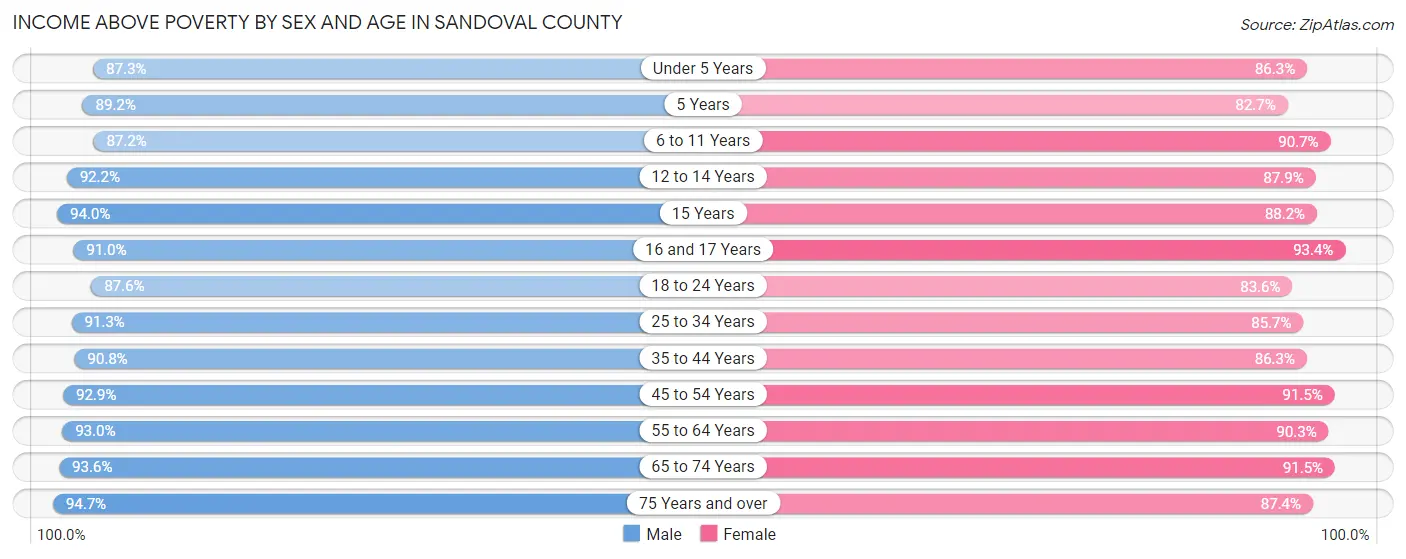
| Age Bracket | Male | Female |
| Under 5 Years | 3,283 (87.3%) | 2,957 (86.3%) |
| 5 Years | 605 (89.2%) | 666 (82.7%) |
| 6 to 11 Years | 5,167 (87.2%) | 4,576 (90.7%) |
| 12 to 14 Years | 3,165 (92.2%) | 3,029 (87.9%) |
| 15 Years | 1,215 (94.0%) | 739 (88.2%) |
| 16 and 17 Years | 1,890 (90.9%) | 2,062 (93.4%) |
| 18 to 24 Years | 5,377 (87.6%) | 4,767 (83.6%) |
| 25 to 34 Years | 8,333 (91.3%) | 7,654 (85.7%) |
| 35 to 44 Years | 8,857 (90.7%) | 8,428 (86.3%) |
| 45 to 54 Years | 8,367 (92.9%) | 8,335 (91.5%) |
| 55 to 64 Years | 8,925 (93.0%) | 9,321 (90.3%) |
| 65 to 74 Years | 7,667 (93.6%) | 8,548 (91.5%) |
| 75 Years and over | 4,341 (94.7%) | 5,083 (87.4%) |
| Total | 67,192 (91.3%) | 66,165 (88.5%) |
Income Below Poverty Among Married-Couple Families in Sandoval County
The poverty statistics for married-couple families in Sandoval County show that 4.0% or 1,188 of the total 29,889 families live below the poverty line. Families with 5 or more children have the highest poverty rate of 24.3%, comprising of 81 families. On the other hand, families with no children have the lowest poverty rate of 3.2%, which includes 596 families.
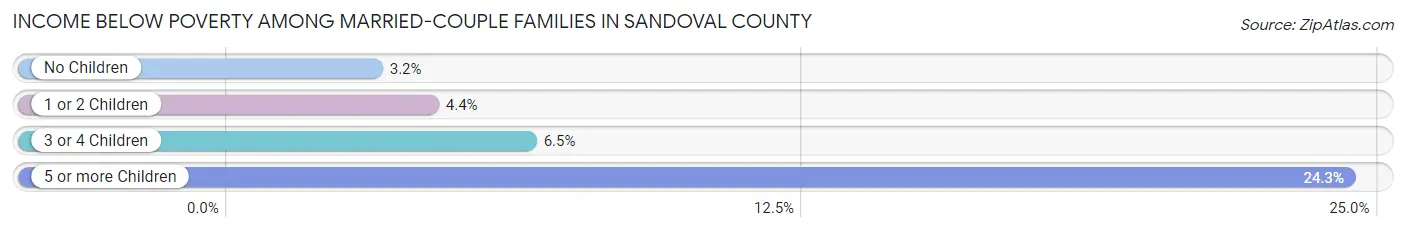
| Children | Above Poverty | Below Poverty |
| No Children | 18,330 (96.9%) | 596 (3.2%) |
| 1 or 2 Children | 8,075 (95.6%) | 369 (4.4%) |
| 3 or 4 Children | 2,044 (93.5%) | 142 (6.5%) |
| 5 or more Children | 252 (75.7%) | 81 (24.3%) |
| Total | 28,701 (96.0%) | 1,188 (4.0%) |
Income Below Poverty Among Single-Parent Households in Sandoval County
According to the poverty data in Sandoval County, 12.1% or 358 single-father households and 19.4% or 1,360 single-mother households are living below the poverty line. Among single-father households, those with 3 or 4 children have the highest poverty rate, with 69 households (22.5%) experiencing poverty. Likewise, among single-mother households, those with 5 or more children have the highest poverty rate, with 11 households (57.9%) falling below the poverty line.
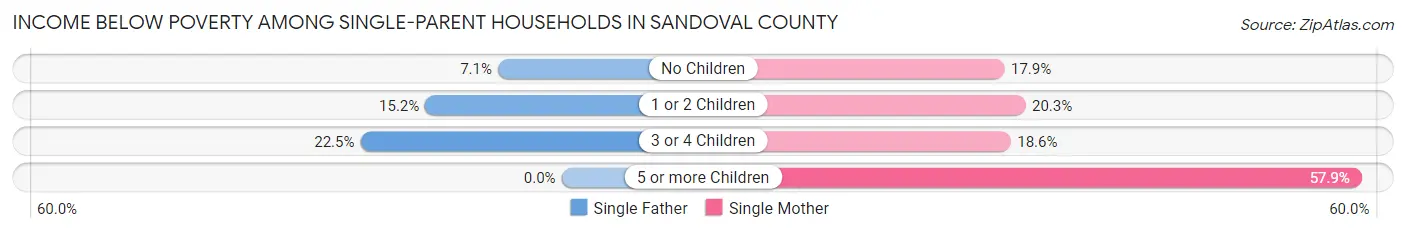
| Children | Single Father | Single Mother |
| No Children | 99 (7.1%) | 451 (17.9%) |
| 1 or 2 Children | 190 (15.2%) | 793 (20.3%) |
| 3 or 4 Children | 69 (22.5%) | 105 (18.6%) |
| 5 or more Children | 0 (0.0%) | 11 (57.9%) |
| Total | 358 (12.1%) | 1,360 (19.4%) |
Income Below Poverty Among Married-Couple vs Single-Parent Households in Sandoval County
The poverty data for Sandoval County shows that 1,188 of the married-couple family households (4.0%) and 1,718 of the single-parent households (17.2%) are living below the poverty level. Within the married-couple family households, those with 5 or more children have the highest poverty rate, with 81 households (24.3%) falling below the poverty line. Among the single-parent households, those with 5 or more children have the highest poverty rate, with 11 household (50.0%) living below poverty.
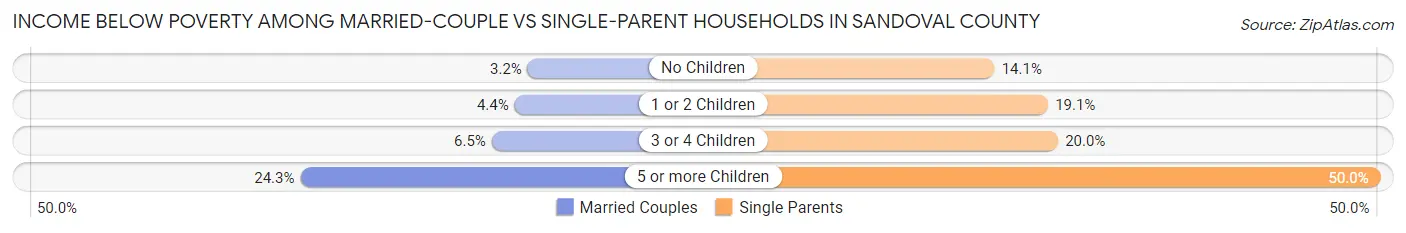
| Children | Married-Couple Families | Single-Parent Households |
| No Children | 596 (3.2%) | 550 (14.1%) |
| 1 or 2 Children | 369 (4.4%) | 983 (19.1%) |
| 3 or 4 Children | 142 (6.5%) | 174 (20.0%) |
| 5 or more Children | 81 (24.3%) | 11 (50.0%) |
| Total | 1,188 (4.0%) | 1,718 (17.2%) |
Race in Sandoval County
The most populous races in Sandoval County are White / Caucasian (90,123 | 60.3%), Hispanic or Latino (60,690 | 40.6%), and Two or more Races (24,176 | 16.2%).
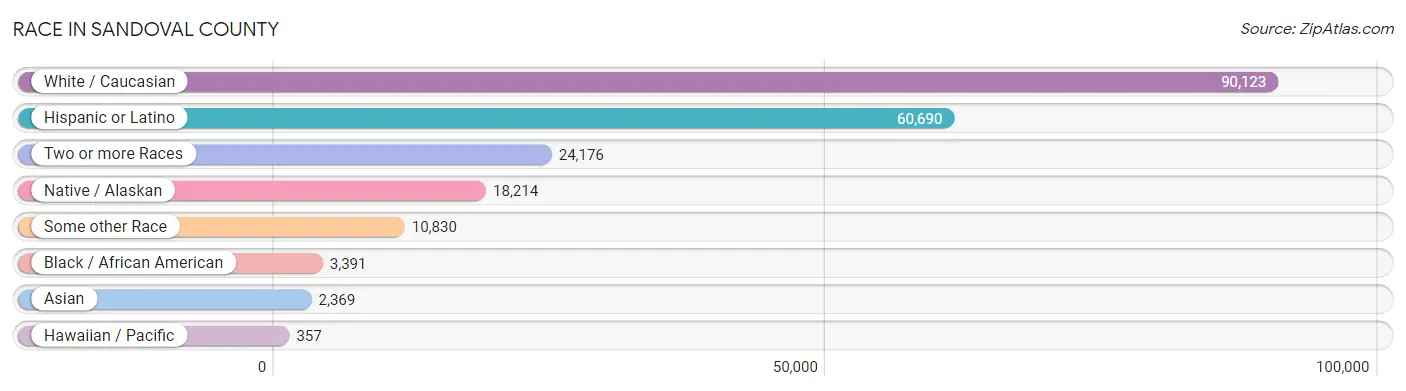
| Race | # Population | % Population |
| Asian | 2,369 | 1.6% |
| Black / African American | 3,391 | 2.3% |
| Hawaiian / Pacific | 357 | 0.2% |
| Hispanic or Latino | 60,690 | 40.6% |
| Native / Alaskan | 18,214 | 12.2% |
| White / Caucasian | 90,123 | 60.3% |
| Two or more Races | 24,176 | 16.2% |
| Some other Race | 10,830 | 7.2% |
| Total | 149,460 | 100.0% |
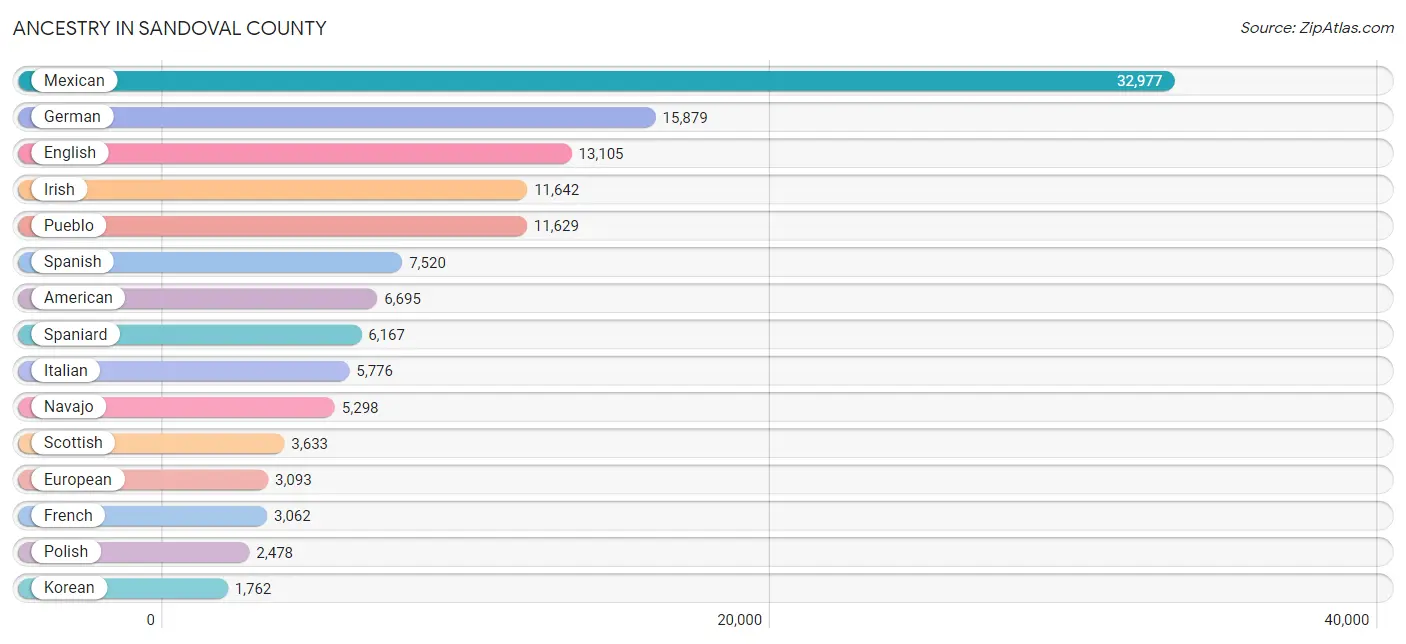
Ancestry in Sandoval County
The most populous ancestries reported in Sandoval County are Mexican (32,977 | 22.1%), German (15,879 | 10.6%), English (13,105 | 8.8%), Irish (11,642 | 7.8%), and Pueblo (11,629 | 7.8%), together accounting for 57.0% of all Sandoval County residents.
| Ancestry | # Population | % Population |
| Afghan | 79 | 0.1% |
| African | 209 | 0.1% |
| Alsatian | 10 | 0.0% |
| American | 6,695 | 4.5% |
| Apache | 236 | 0.2% |
| Arab | 659 | 0.4% |
| Argentinean | 39 | 0.0% |
| Armenian | 53 | 0.0% |
| Australian | 37 | 0.0% |
| Austrian | 174 | 0.1% |
| Bangladeshi | 44 | 0.0% |
| Basque | 10 | 0.0% |
| Belgian | 116 | 0.1% |
| Belizean | 7 | 0.0% |
| Bhutanese | 497 | 0.3% |
| Blackfeet | 285 | 0.2% |
| Brazilian | 9 | 0.0% |
| British | 1,181 | 0.8% |
| Bulgarian | 10 | 0.0% |
| Burmese | 375 | 0.3% |
| Cajun | 5 | 0.0% |
| Cambodian | 31 | 0.0% |
| Canadian | 835 | 0.6% |
| Celtic | 218 | 0.2% |
| Central American | 858 | 0.6% |
| Central American Indian | 133 | 0.1% |
| Cherokee | 500 | 0.3% |
| Chickasaw | 12 | 0.0% |
| Chilean | 233 | 0.2% |
| Chippewa | 266 | 0.2% |
| Choctaw | 149 | 0.1% |
| Colombian | 121 | 0.1% |
| Comanche | 14 | 0.0% |
| Costa Rican | 61 | 0.0% |
| Creek | 78 | 0.1% |
| Croatian | 158 | 0.1% |
| Crow | 17 | 0.0% |
| Cuban | 386 | 0.3% |
| Czech | 218 | 0.2% |
| Czechoslovakian | 47 | 0.0% |
| Danish | 691 | 0.5% |
| Dominican | 981 | 0.7% |
| Dutch | 1,018 | 0.7% |
| Eastern European | 237 | 0.2% |
| Ecuadorian | 3 | 0.0% |
| Egyptian | 44 | 0.0% |
| English | 13,105 | 8.8% |
| Estonian | 2 | 0.0% |
| European | 3,093 | 2.1% |
| Filipino | 13 | 0.0% |
| Finnish | 236 | 0.2% |
| French | 3,062 | 2.1% |
| French Canadian | 883 | 0.6% |
| German | 15,879 | 10.6% |
| Greek | 420 | 0.3% |
| Guamanian / Chamorro | 270 | 0.2% |
| Guatemalan | 187 | 0.1% |
| Haitian | 81 | 0.1% |
| Honduran | 83 | 0.1% |
| Hopi | 44 | 0.0% |
| Hungarian | 335 | 0.2% |
| Icelander | 1 | 0.0% |
| Indian (Asian) | 535 | 0.4% |
| Indonesian | 16 | 0.0% |
| Iranian | 27 | 0.0% |
| Iraqi | 47 | 0.0% |
| Irish | 11,642 | 7.8% |
| Iroquois | 12 | 0.0% |
| Italian | 5,776 | 3.9% |
| Jamaican | 76 | 0.1% |
| Kiowa | 8 | 0.0% |
| Korean | 1,762 | 1.2% |
| Laotian | 31 | 0.0% |
| Latvian | 13 | 0.0% |
| Lebanese | 323 | 0.2% |
| Lithuanian | 188 | 0.1% |
| Luxembourger | 12 | 0.0% |
| Menominee | 29 | 0.0% |
| Mexican | 32,977 | 22.1% |
| Mexican American Indian | 611 | 0.4% |
| Mongolian | 23 | 0.0% |
| Moroccan | 7 | 0.0% |
| Native Hawaiian | 312 | 0.2% |
| Navajo | 5,298 | 3.5% |
| New Zealander | 1 | 0.0% |
| Nicaraguan | 270 | 0.2% |
| Nigerian | 217 | 0.2% |
| Northern European | 287 | 0.2% |
| Norwegian | 1,393 | 0.9% |
| Osage | 7 | 0.0% |
| Paiute | 7 | 0.0% |
| Pakistani | 103 | 0.1% |
| Panamanian | 40 | 0.0% |
| Pennsylvania German | 32 | 0.0% |
| Peruvian | 274 | 0.2% |
| Pima | 34 | 0.0% |
| Polish | 2,478 | 1.7% |
| Portuguese | 368 | 0.3% |
| Potawatomi | 1 | 0.0% |
| Pueblo | 11,629 | 7.8% |
| Puerto Rican | 1,279 | 0.9% |
| Romanian | 26 | 0.0% |
| Russian | 480 | 0.3% |
| Salvadoran | 217 | 0.2% |
| Samoan | 6 | 0.0% |
| Scandinavian | 694 | 0.5% |
| Scotch-Irish | 1,708 | 1.1% |
| Scottish | 3,633 | 2.4% |
| Seminole | 10 | 0.0% |
| Serbian | 16 | 0.0% |
| Sierra Leonean | 43 | 0.0% |
| Sioux | 135 | 0.1% |
| Slavic | 141 | 0.1% |
| Slovak | 110 | 0.1% |
| Slovene | 23 | 0.0% |
| Somali | 2 | 0.0% |
| South American | 719 | 0.5% |
| Spaniard | 6,167 | 4.1% |
| Spanish | 7,520 | 5.0% |
| Spanish American | 593 | 0.4% |
| Sri Lankan | 539 | 0.4% |
| Subsaharan African | 696 | 0.5% |
| Swedish | 1,284 | 0.9% |
| Swiss | 340 | 0.2% |
| Syrian | 207 | 0.1% |
| Thai | 250 | 0.2% |
| Trinidadian and Tobagonian | 34 | 0.0% |
| Turkish | 94 | 0.1% |
| Ukrainian | 382 | 0.3% |
| Ute | 9 | 0.0% |
| Venezuelan | 49 | 0.0% |
| Welsh | 941 | 0.6% |
| Yugoslavian | 42 | 0.0% |
| Zimbabwean | 68 | 0.1% | View All 134 Rows |
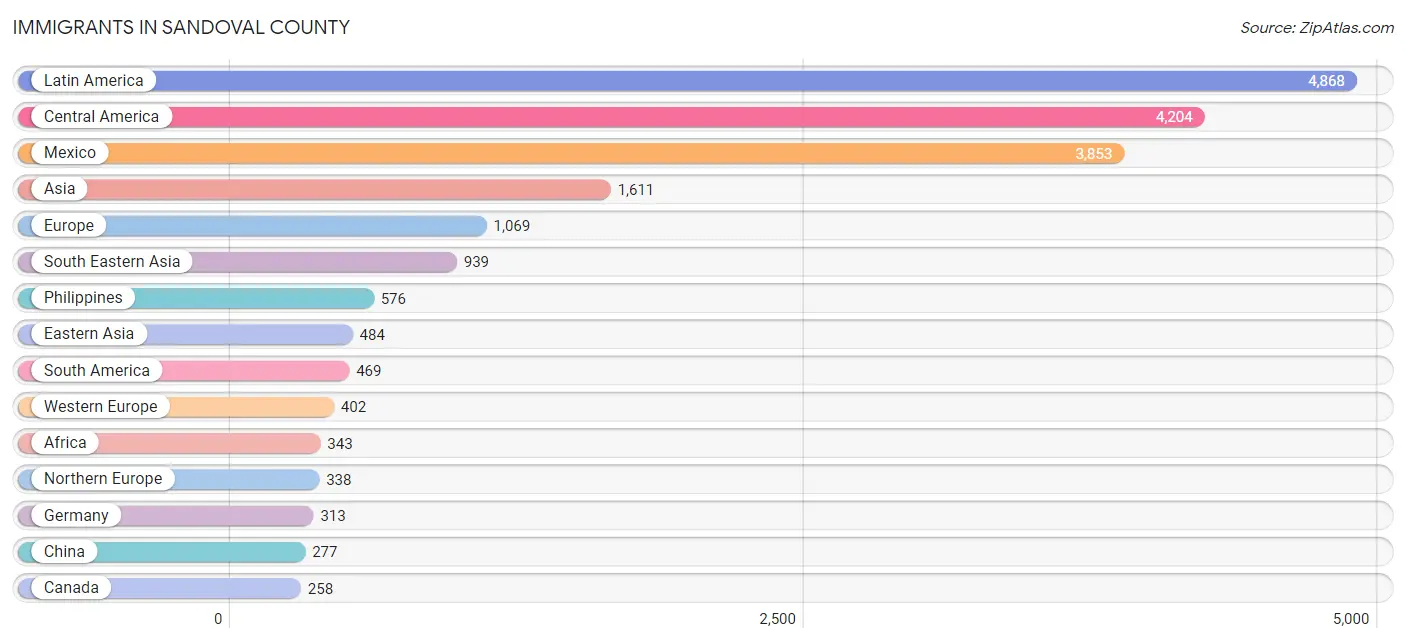
Immigrants in Sandoval County
The most numerous immigrant groups reported in Sandoval County came from Latin America (4,868 | 3.3%), Central America (4,204 | 2.8%), Mexico (3,853 | 2.6%), Asia (1,611 | 1.1%), and Europe (1,069 | 0.7%), together accounting for 10.4% of all Sandoval County residents.
| Immigration Origin | # Population | % Population |
| Afghanistan | 4 | 0.0% |
| Africa | 343 | 0.2% |
| Argentina | 16 | 0.0% |
| Asia | 1,611 | 1.1% |
| Australia | 44 | 0.0% |
| Austria | 15 | 0.0% |
| Belgium | 19 | 0.0% |
| Belize | 7 | 0.0% |
| Bolivia | 50 | 0.0% |
| Brazil | 9 | 0.0% |
| Bulgaria | 10 | 0.0% |
| Cameroon | 80 | 0.1% |
| Canada | 258 | 0.2% |
| Caribbean | 195 | 0.1% |
| Central America | 4,204 | 2.8% |
| Chile | 158 | 0.1% |
| China | 277 | 0.2% |
| Colombia | 61 | 0.0% |
| Costa Rica | 17 | 0.0% |
| Cuba | 61 | 0.0% |
| Denmark | 21 | 0.0% |
| Dominican Republic | 62 | 0.0% |
| Eastern Africa | 110 | 0.1% |
| Eastern Asia | 484 | 0.3% |
| Eastern Europe | 97 | 0.1% |
| Ecuador | 3 | 0.0% |
| Egypt | 9 | 0.0% |
| El Salvador | 43 | 0.0% |
| England | 163 | 0.1% |
| Europe | 1,069 | 0.7% |
| France | 2 | 0.0% |
| Germany | 313 | 0.2% |
| Greece | 153 | 0.1% |
| Guatemala | 38 | 0.0% |
| Haiti | 34 | 0.0% |
| Honduras | 4 | 0.0% |
| Hungary | 11 | 0.0% |
| India | 70 | 0.1% |
| Indonesia | 13 | 0.0% |
| Ireland | 39 | 0.0% |
| Italy | 24 | 0.0% |
| Jamaica | 12 | 0.0% |
| Japan | 150 | 0.1% |
| Jordan | 21 | 0.0% |
| Kenya | 38 | 0.0% |
| Korea | 57 | 0.0% |
| Kuwait | 1 | 0.0% |
| Laos | 10 | 0.0% |
| Latin America | 4,868 | 3.3% |
| Lebanon | 23 | 0.0% |
| Malaysia | 23 | 0.0% |
| Mexico | 3,853 | 2.6% |
| Middle Africa | 80 | 0.1% |
| Morocco | 14 | 0.0% |
| Netherlands | 49 | 0.0% |
| Nicaragua | 208 | 0.1% |
| Nigeria | 79 | 0.1% |
| Northern Africa | 23 | 0.0% |
| Northern Europe | 338 | 0.2% |
| Oceania | 56 | 0.0% |
| Pakistan | 3 | 0.0% |
| Panama | 34 | 0.0% |
| Peru | 143 | 0.1% |
| Philippines | 576 | 0.4% |
| Poland | 32 | 0.0% |
| Romania | 8 | 0.0% |
| Russia | 4 | 0.0% |
| Sierra Leone | 21 | 0.0% |
| South Africa | 19 | 0.0% |
| South America | 469 | 0.3% |
| South Central Asia | 91 | 0.1% |
| South Eastern Asia | 939 | 0.6% |
| Southern Europe | 222 | 0.2% |
| Spain | 45 | 0.0% |
| Sri Lanka | 14 | 0.0% |
| Sweden | 39 | 0.0% |
| Switzerland | 4 | 0.0% |
| Taiwan | 11 | 0.0% |
| Thailand | 73 | 0.1% |
| Trinidad and Tobago | 26 | 0.0% |
| Turkey | 52 | 0.0% |
| Ukraine | 13 | 0.0% |
| Venezuela | 29 | 0.0% |
| Vietnam | 244 | 0.2% |
| Western Africa | 111 | 0.1% |
| Western Asia | 97 | 0.1% |
| Western Europe | 402 | 0.3% |
| Zimbabwe | 68 | 0.1% | View All 88 Rows |
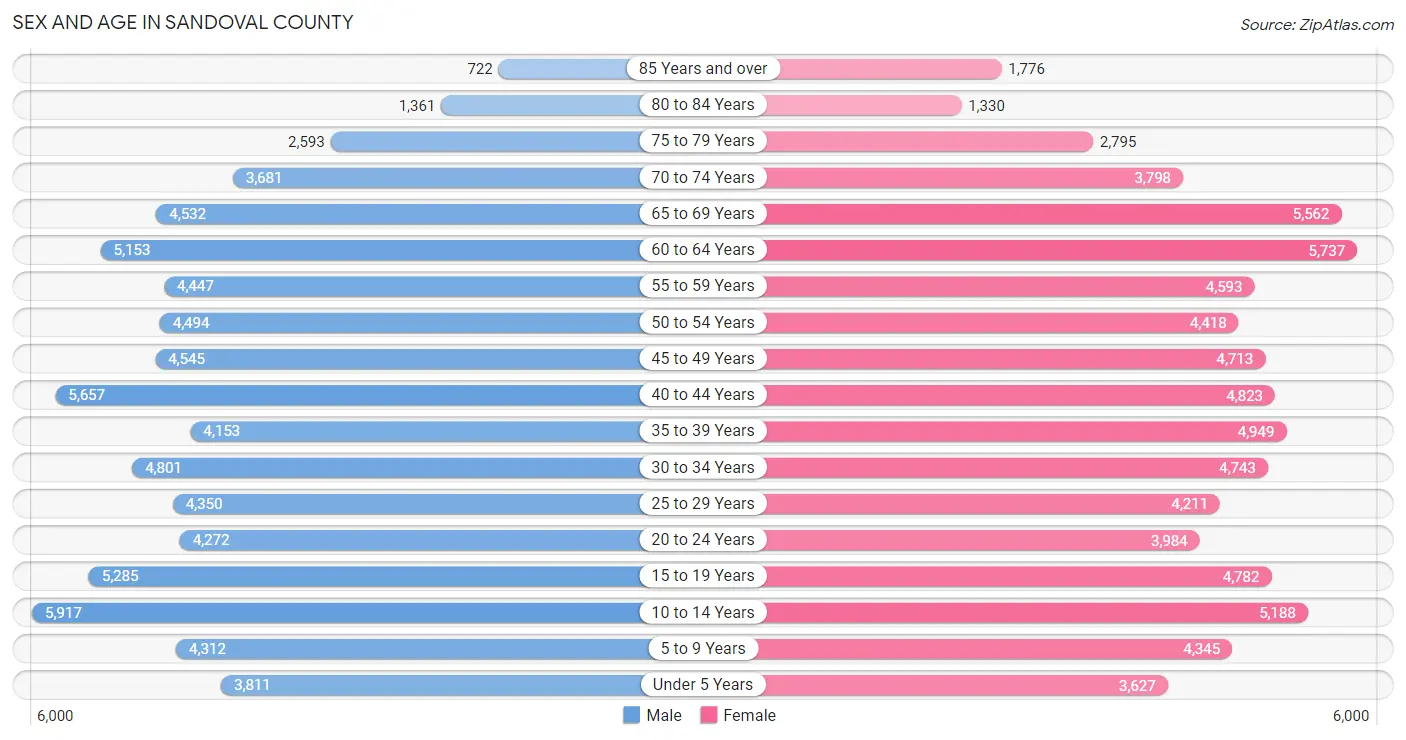
Sex and Age in Sandoval County
Sex and Age in Sandoval County
The most populous age groups in Sandoval County are 10 to 14 Years (5,917 | 8.0%) for men and 60 to 64 Years (5,737 | 7.6%) for women.
| Age Bracket | Male | Female |
| Under 5 Years | 3,811 (5.1%) | 3,627 (4.8%) |
| 5 to 9 Years | 4,312 (5.8%) | 4,345 (5.8%) |
| 10 to 14 Years | 5,917 (8.0%) | 5,188 (6.9%) |
| 15 to 19 Years | 5,285 (7.1%) | 4,782 (6.3%) |
| 20 to 24 Years | 4,272 (5.8%) | 3,984 (5.3%) |
| 25 to 29 Years | 4,350 (5.9%) | 4,211 (5.6%) |
| 30 to 34 Years | 4,801 (6.5%) | 4,743 (6.3%) |
| 35 to 39 Years | 4,153 (5.6%) | 4,949 (6.6%) |
| 40 to 44 Years | 5,657 (7.6%) | 4,823 (6.4%) |
| 45 to 49 Years | 4,545 (6.1%) | 4,713 (6.2%) |
| 50 to 54 Years | 4,494 (6.1%) | 4,418 (5.9%) |
| 55 to 59 Years | 4,447 (6.0%) | 4,593 (6.1%) |
| 60 to 64 Years | 5,153 (7.0%) | 5,737 (7.6%) |
| 65 to 69 Years | 4,532 (6.1%) | 5,562 (7.4%) |
| 70 to 74 Years | 3,681 (5.0%) | 3,798 (5.0%) |
| 75 to 79 Years | 2,593 (3.5%) | 2,795 (3.7%) |
| 80 to 84 Years | 1,361 (1.8%) | 1,330 (1.8%) |
| 85 Years and over | 722 (1.0%) | 1,776 (2.4%) |
| Total | 74,086 (100.0%) | 75,374 (100.0%) |
Families and Households in Sandoval County
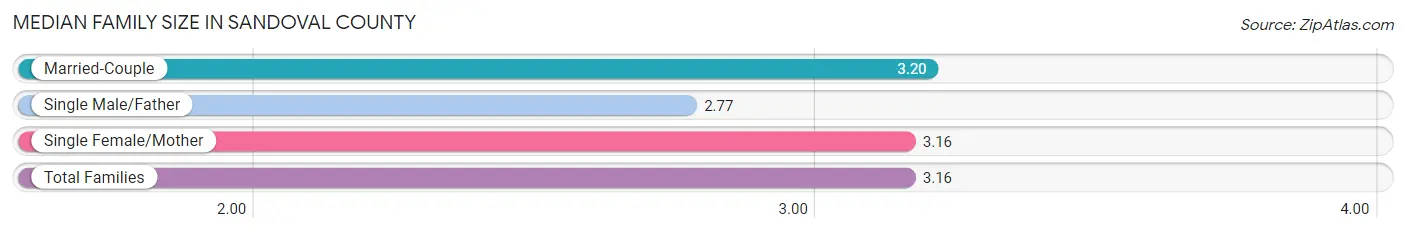
Median Family Size in Sandoval County
The median family size in Sandoval County is 3.16 persons per family, with married-couple families (29,889 | 75.0%) accounting for the largest median family size of 3.2 persons per family. On the other hand, single male/father families (2,948 | 7.4%) represent the smallest median family size with 2.77 persons per family.
| Family Type | # Families | Family Size |
| Married-Couple | 29,889 (75.0%) | 3.20 |
| Single Male/Father | 2,948 (7.4%) | 2.77 |
| Single Female/Mother | 7,013 (17.6%) | 3.16 |
| Total Families | 39,850 (100.0%) | 3.16 |
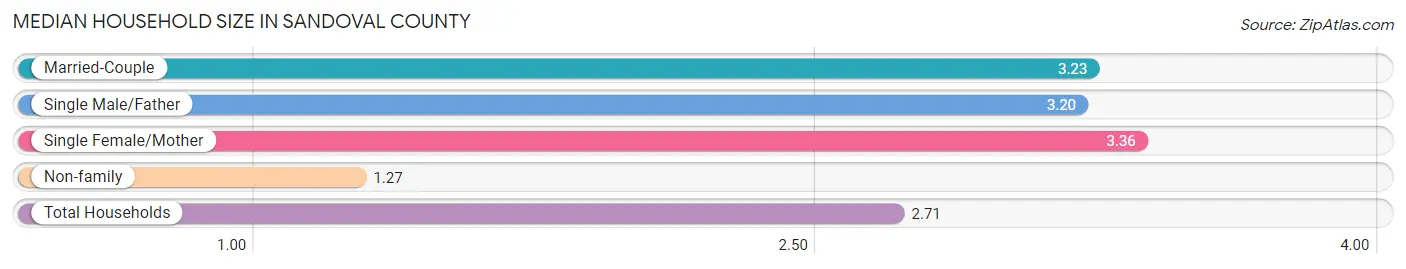
Median Household Size in Sandoval County
The median household size in Sandoval County is 2.71 persons per household, with single female/mother households (7,013 | 12.8%) accounting for the largest median household size of 3.36 persons per household. non-family households (15,061 | 27.4%) represent the smallest median household size with 1.27 persons per household.
| Household Type | # Households | Household Size |
| Married-Couple | 29,889 (54.4%) | 3.23 |
| Single Male/Father | 2,948 (5.4%) | 3.20 |
| Single Female/Mother | 7,013 (12.8%) | 3.36 |
| Non-family | 15,061 (27.4%) | 1.27 |
| Total Households | 54,911 (100.0%) | 2.71 |
Household Size by Marriage Status in Sandoval County
Out of a total of 54,911 households in Sandoval County, 39,850 (72.6%) are family households, while 15,061 (27.4%) are nonfamily households. The most numerous type of family households are 2-person households, comprising 18,900, and the most common type of nonfamily households are 1-person households, comprising 11,410.
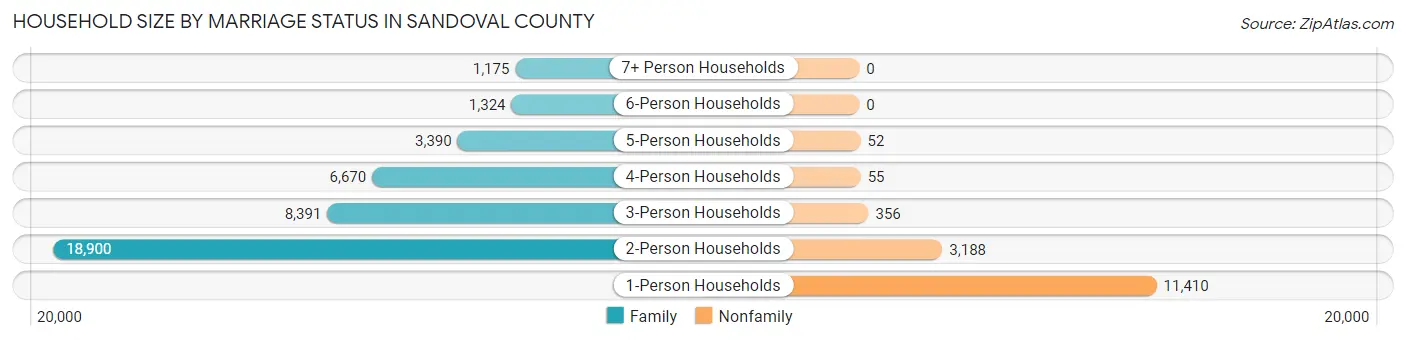
| Household Size | Family Households | Nonfamily Households |
| 1-Person Households | - | 11,410 (20.8%) |
| 2-Person Households | 18,900 (34.4%) | 3,188 (5.8%) |
| 3-Person Households | 8,391 (15.3%) | 356 (0.6%) |
| 4-Person Households | 6,670 (12.1%) | 55 (0.1%) |
| 5-Person Households | 3,390 (6.2%) | 52 (0.1%) |
| 6-Person Households | 1,324 (2.4%) | 0 (0.0%) |
| 7+ Person Households | 1,175 (2.1%) | 0 (0.0%) |
| Total | 39,850 (72.6%) | 15,061 (27.4%) |
Female Fertility in Sandoval County
Fertility by Age in Sandoval County
Average fertility rate in Sandoval County is 44.0 births per 1,000 women. Women in the age bracket of 20 to 34 years have the highest fertility rate with 76.0 births per 1,000 women. Women in the age bracket of 20 to 34 years acount for 67.7% of all women with births.
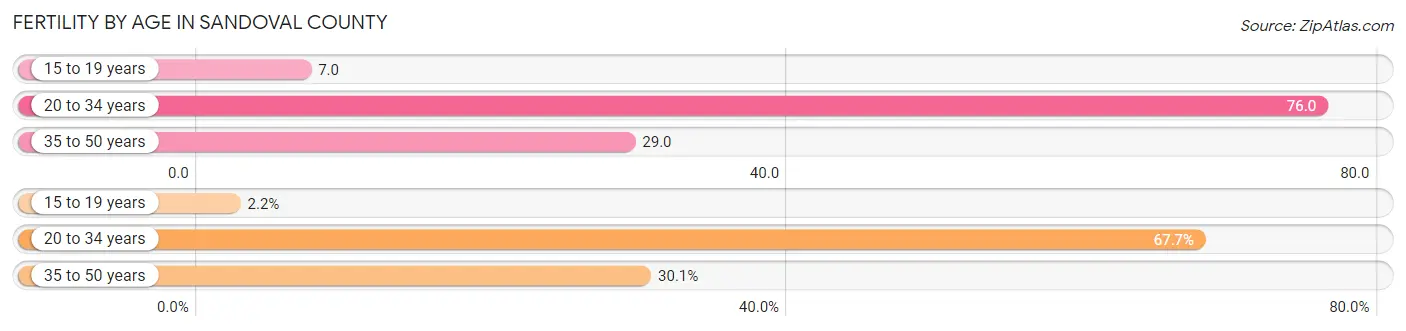
| Age Bracket | Women with Births | Births / 1,000 Women |
| 15 to 19 years | 32 (2.2%) | 7.0 |
| 20 to 34 years | 982 (67.7%) | 76.0 |
| 35 to 50 years | 436 (30.1%) | 29.0 |
| Total | 1,450 (100.0%) | 44.0 |
Fertility by Age by Marriage Status in Sandoval County
62.3% of women with births (1,450) in Sandoval County are married. The highest percentage of unmarried women with births falls into 15 to 19 years age bracket with 100.0% of them unmarried at the time of birth, while the lowest percentage of unmarried women with births belong to 20 to 34 years age bracket with 32.9% of them unmarried.
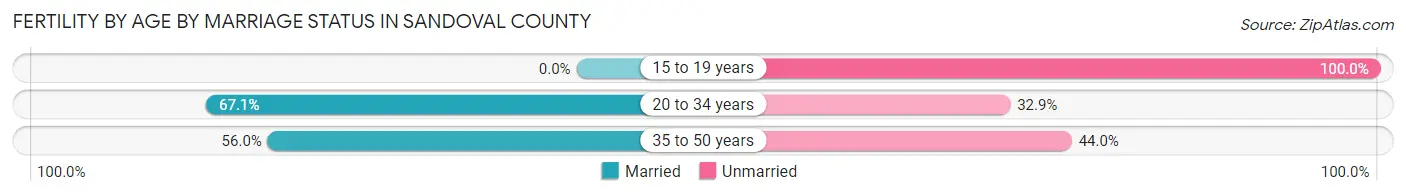
| Age Bracket | Married | Unmarried |
| 15 to 19 years | 0 (0.0%) | 32 (100.0%) |
| 20 to 34 years | 659 (67.1%) | 323 (32.9%) |
| 35 to 50 years | 244 (56.0%) | 192 (44.0%) |
| Total | 903 (62.3%) | 547 (37.7%) |
Fertility by Education in Sandoval County
Average fertility rate in Sandoval County is 44.0 births per 1,000 women. Women with the education attainment of graduate degree have the highest fertility rate of 64.0 births per 1,000 women, while women with the education attainment of less than high school have the lowest fertility at 18.0 births per 1,000 women. Women with the education attainment of college or associate's degree represent 38.1% of all women with births.
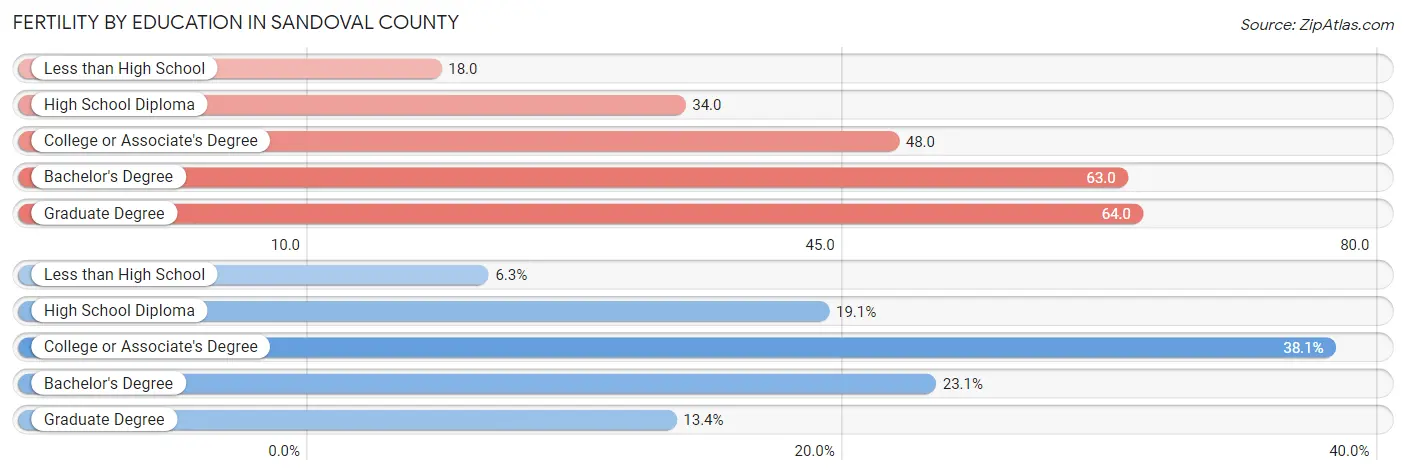
| Educational Attainment | Women with Births | Births / 1,000 Women |
| Less than High School | 92 (6.3%) | 18.0 |
| High School Diploma | 277 (19.1%) | 34.0 |
| College or Associate's Degree | 552 (38.1%) | 48.0 |
| Bachelor's Degree | 335 (23.1%) | 63.0 |
| Graduate Degree | 194 (13.4%) | 64.0 |
| Total | 1,450 (100.0%) | 44.0 |
Fertility by Education by Marriage Status in Sandoval County
37.7% of women with births in Sandoval County are unmarried. Women with the educational attainment of bachelor's degree are most likely to be married with 93.7% of them married at childbirth, while women with the educational attainment of high school diploma are least likely to be married with 87.0% of them unmarried at childbirth.
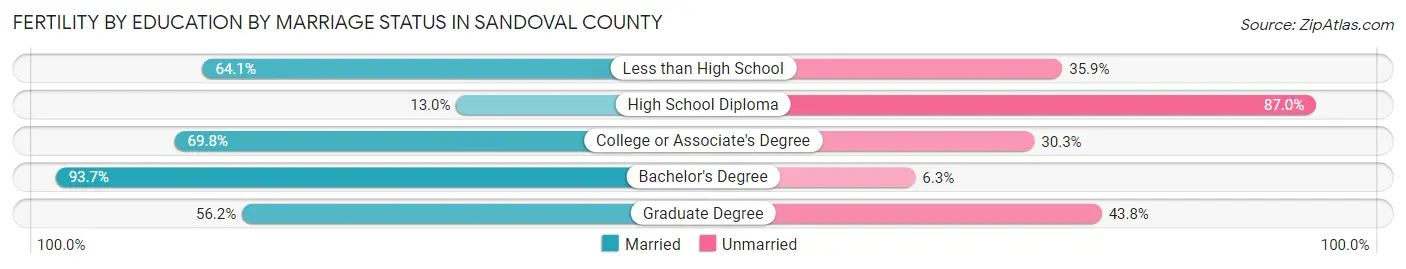
| Educational Attainment | Married | Unmarried |
| Less than High School | 59 (64.1%) | 33 (35.9%) |
| High School Diploma | 36 (13.0%) | 241 (87.0%) |
| College or Associate's Degree | 385 (69.8%) | 167 (30.2%) |
| Bachelor's Degree | 314 (93.7%) | 21 (6.3%) |
| Graduate Degree | 109 (56.2%) | 85 (43.8%) |
| Total | 903 (62.3%) | 547 (37.7%) |
Employment Characteristics in Sandoval County
Employment by Class of Employer in Sandoval County
Among the 66,313 employed individuals in Sandoval County, private company employees (40,368 | 60.9%), local government employees (6,028 | 9.1%), and not-for-profit organizations (5,006 | 7.5%) make up the most common classes of employment.
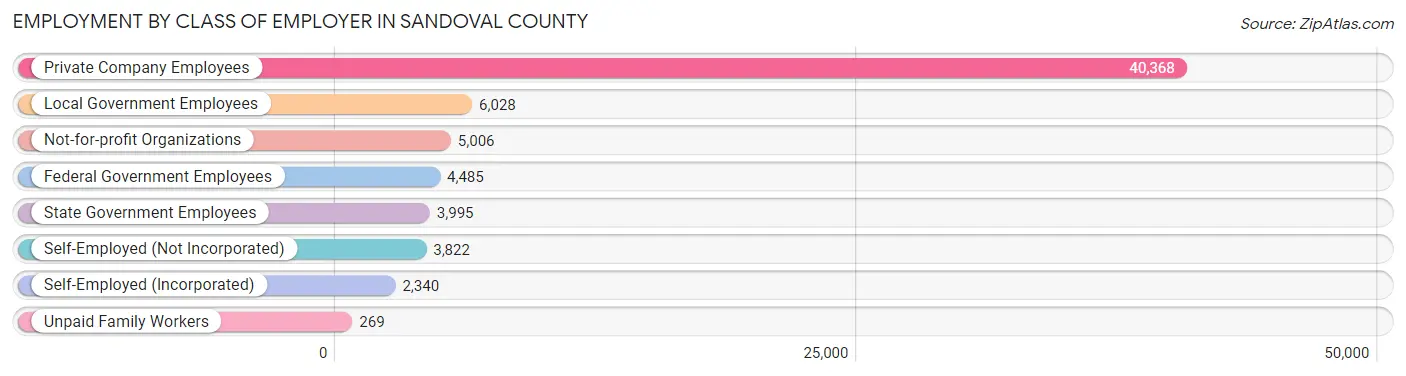
| Employer Class | # Employees | % Employees |
| Private Company Employees | 40,368 | 60.9% |
| Self-Employed (Incorporated) | 2,340 | 3.5% |
| Self-Employed (Not Incorporated) | 3,822 | 5.8% |
| Not-for-profit Organizations | 5,006 | 7.5% |
| Local Government Employees | 6,028 | 9.1% |
| State Government Employees | 3,995 | 6.0% |
| Federal Government Employees | 4,485 | 6.8% |
| Unpaid Family Workers | 269 | 0.4% |
| Total | 66,313 | 100.0% |
Employment Status by Age in Sandoval County
According to the labor force statistics for Sandoval County, out of the total population over 16 years of age (120,127), 59.4% or 71,355 individuals are in the labor force, with 5.9% or 4,210 of them unemployed. The age group with the highest labor force participation rate is 35 to 44 years, with 81.8% or 16,018 individuals in the labor force. Within the labor force, the 16 to 19 years age range has the highest percentage of unemployed individuals, with 15.3% or 488 of them being unemployed.
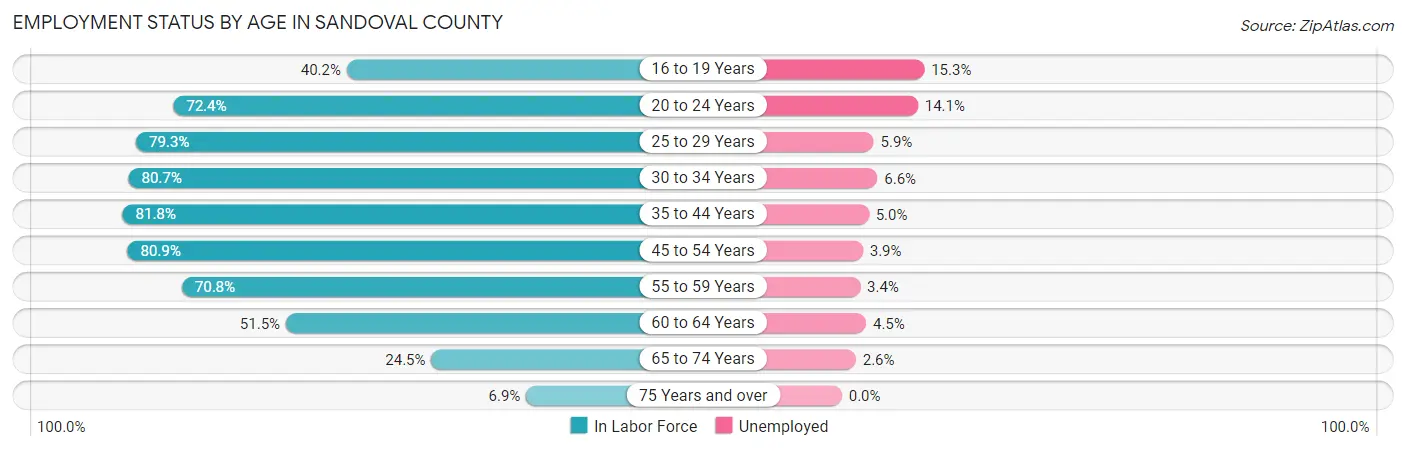
| Age Bracket | In Labor Force | Unemployed |
| 16 to 19 Years | 3,189 (40.2%) | 488 (15.3%) |
| 20 to 24 Years | 5,977 (72.4%) | 843 (14.1%) |
| 25 to 29 Years | 6,789 (79.3%) | 401 (5.9%) |
| 30 to 34 Years | 7,702 (80.7%) | 508 (6.6%) |
| 35 to 44 Years | 16,018 (81.8%) | 801 (5.0%) |
| 45 to 54 Years | 14,700 (80.9%) | 573 (3.9%) |
| 55 to 59 Years | 6,400 (70.8%) | 218 (3.4%) |
| 60 to 64 Years | 5,608 (51.5%) | 252 (4.5%) |
| 65 to 74 Years | 4,305 (24.5%) | 112 (2.6%) |
| 75 Years and over | 730 (6.9%) | 0 (0.0%) |
| Total | 71,355 (59.4%) | 4,210 (5.9%) |
Employment Status by Educational Attainment in Sandoval County
According to labor force statistics for Sandoval County, 75.5% of individuals (57,219) out of the total population between 25 and 64 years of age (75,787) are in the labor force, with 4.8% or 2,747 of them being unemployed. The group with the highest labor force participation rate are those with the educational attainment of bachelor's degree or higher, with 82.1% or 19,148 individuals in the labor force. Within the labor force, individuals with less than high school education have the highest percentage of unemployment, with 10.1% or 333 of them being unemployed.
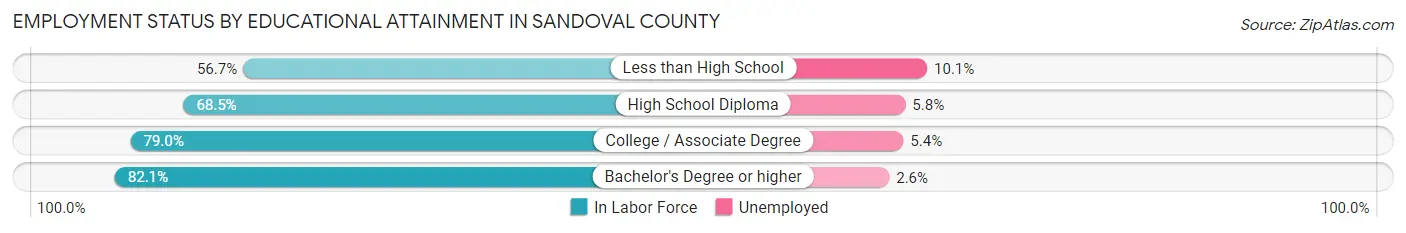
| Educational Attainment | In Labor Force | Unemployed |
| Less than High School | 3,301 (56.7%) | 588 (10.1%) |
| High School Diploma | 13,529 (68.5%) | 1,146 (5.8%) |
| College / Associate Degree | 21,245 (79.0%) | 1,452 (5.4%) |
| Bachelor's Degree or higher | 19,148 (82.1%) | 606 (2.6%) |
| Total | 57,219 (75.5%) | 3,638 (4.8%) |
Employment Occupations by Sex in Sandoval County
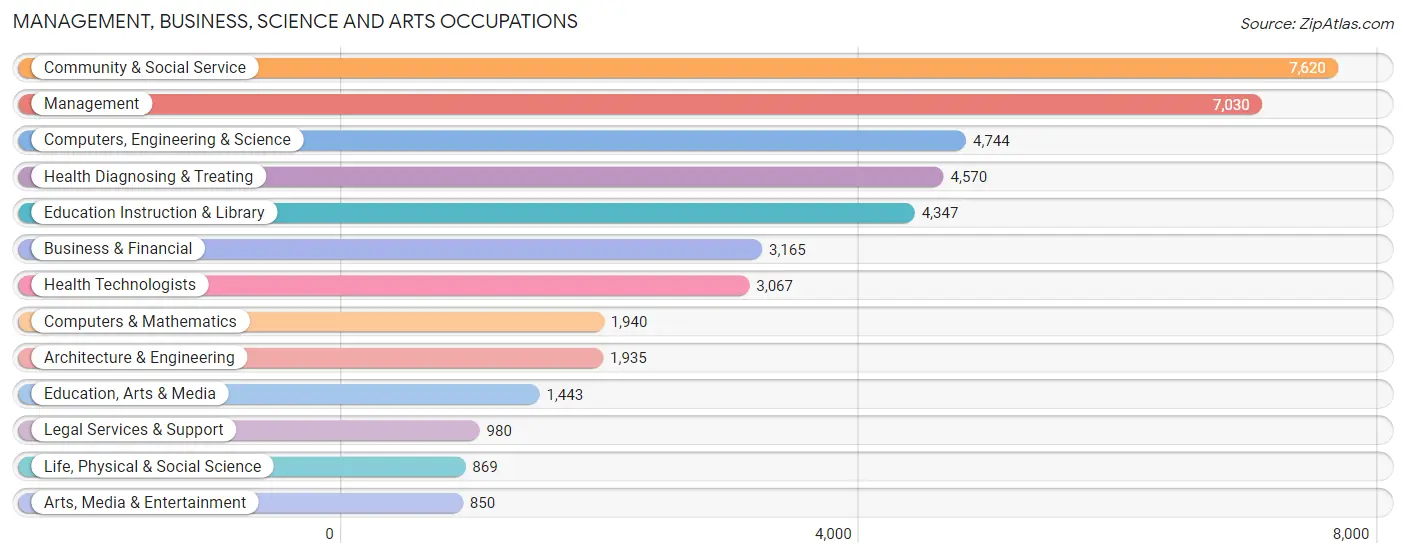
Management, Business, Science and Arts Occupations
The most common Management, Business, Science and Arts occupations in Sandoval County are Community & Social Service (7,620 | 11.4%), Management (7,030 | 10.5%), Computers, Engineering & Science (4,744 | 7.1%), Health Diagnosing & Treating (4,570 | 6.8%), and Education Instruction & Library (4,347 | 6.5%).
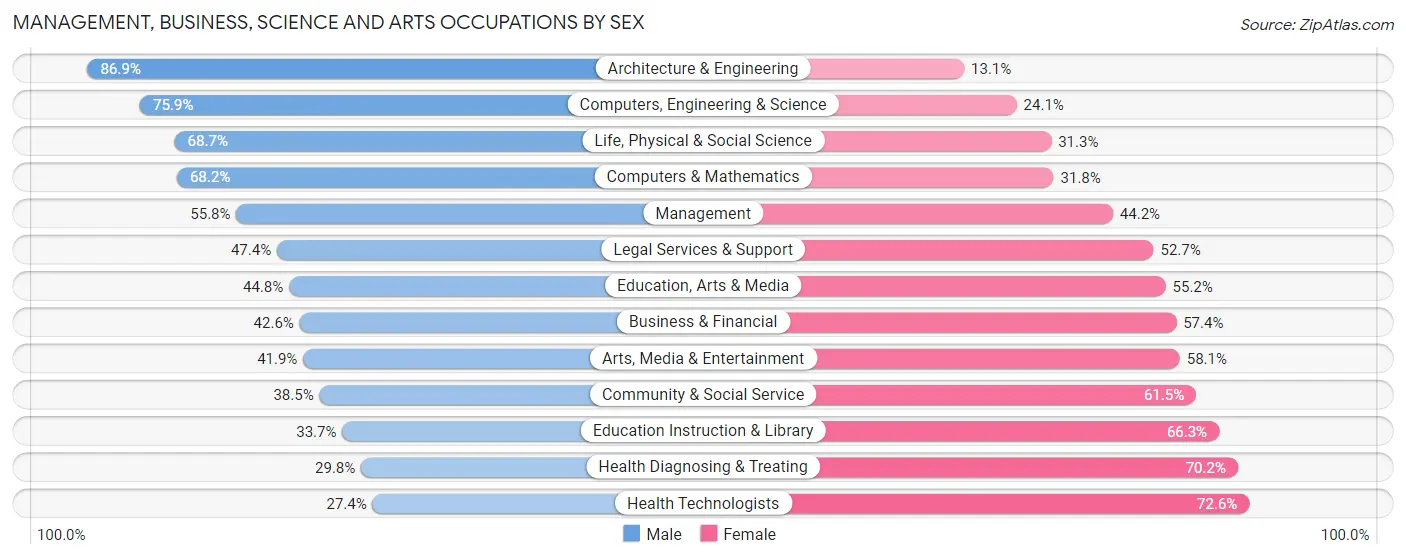
Management, Business, Science and Arts Occupations by Sex
Within the Management, Business, Science and Arts occupations in Sandoval County, the most male-oriented occupations are Architecture & Engineering (86.9%), Computers, Engineering & Science (75.9%), and Life, Physical & Social Science (68.7%), while the most female-oriented occupations are Health Technologists (72.6%), Health Diagnosing & Treating (70.2%), and Education Instruction & Library (66.3%).
| Occupation | Male | Female |
| Management | 3,925 (55.8%) | 3,105 (44.2%) |
| Business & Financial | 1,349 (42.6%) | 1,816 (57.4%) |
| Computers, Engineering & Science | 3,601 (75.9%) | 1,143 (24.1%) |
| Computers & Mathematics | 1,323 (68.2%) | 617 (31.8%) |
| Architecture & Engineering | 1,681 (86.9%) | 254 (13.1%) |
| Life, Physical & Social Science | 597 (68.7%) | 272 (31.3%) |
| Community & Social Service | 2,933 (38.5%) | 4,687 (61.5%) |
| Education, Arts & Media | 647 (44.8%) | 796 (55.2%) |
| Legal Services & Support | 464 (47.3%) | 516 (52.6%) |
| Education Instruction & Library | 1,466 (33.7%) | 2,881 (66.3%) |
| Arts, Media & Entertainment | 356 (41.9%) | 494 (58.1%) |
| Health Diagnosing & Treating | 1,362 (29.8%) | 3,208 (70.2%) |
| Health Technologists | 841 (27.4%) | 2,226 (72.6%) |
| Total (Category) | 13,170 (48.5%) | 13,959 (51.4%) |
| Total (Overall) | 35,612 (53.2%) | 31,338 (46.8%) |
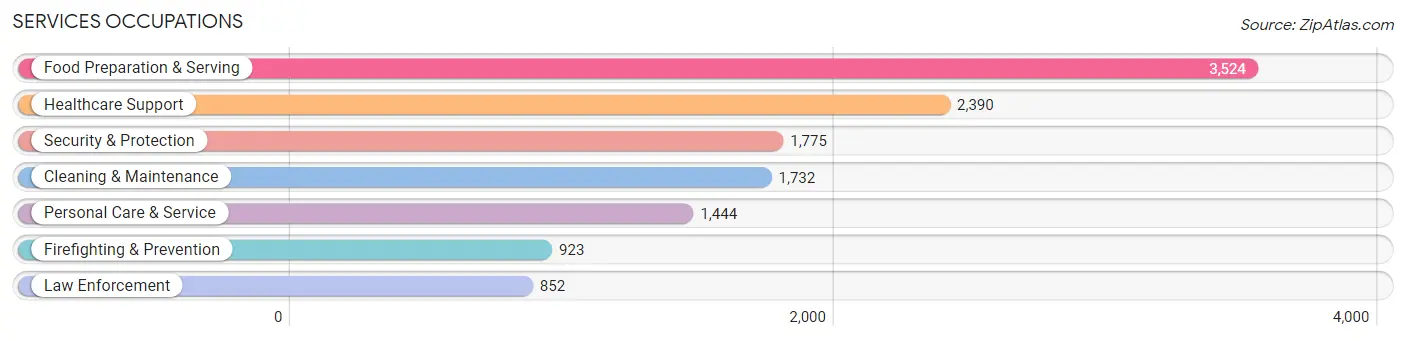
Services Occupations
The most common Services occupations in Sandoval County are Food Preparation & Serving (3,524 | 5.3%), Healthcare Support (2,390 | 3.6%), Security & Protection (1,775 | 2.6%), Cleaning & Maintenance (1,732 | 2.6%), and Personal Care & Service (1,444 | 2.2%).
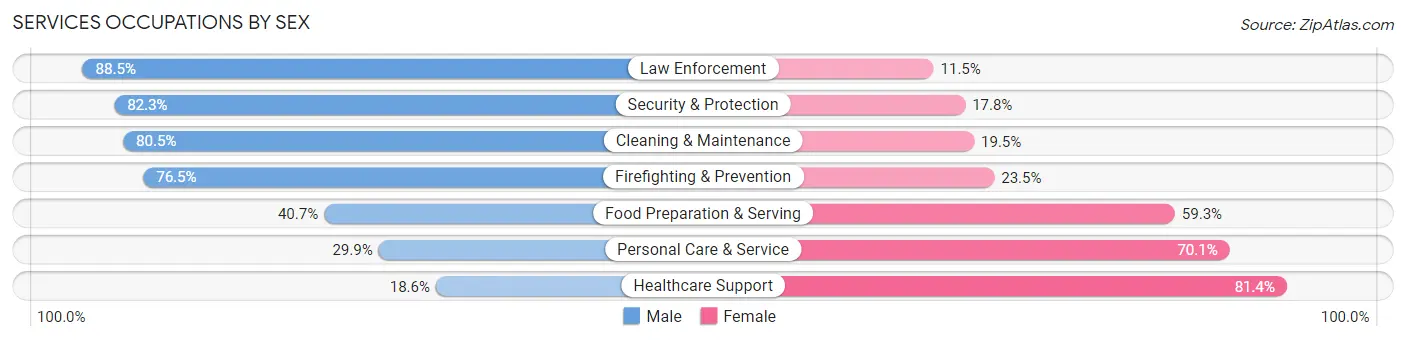
Services Occupations by Sex
Within the Services occupations in Sandoval County, the most male-oriented occupations are Law Enforcement (88.5%), Security & Protection (82.3%), and Cleaning & Maintenance (80.5%), while the most female-oriented occupations are Healthcare Support (81.4%), Personal Care & Service (70.1%), and Food Preparation & Serving (59.3%).
| Occupation | Male | Female |
| Healthcare Support | 444 (18.6%) | 1,946 (81.4%) |
| Security & Protection | 1,460 (82.3%) | 315 (17.7%) |
| Firefighting & Prevention | 706 (76.5%) | 217 (23.5%) |
| Law Enforcement | 754 (88.5%) | 98 (11.5%) |
| Food Preparation & Serving | 1,435 (40.7%) | 2,089 (59.3%) |
| Cleaning & Maintenance | 1,394 (80.5%) | 338 (19.5%) |
| Personal Care & Service | 432 (29.9%) | 1,012 (70.1%) |
| Total (Category) | 5,165 (47.5%) | 5,700 (52.5%) |
| Total (Overall) | 35,612 (53.2%) | 31,338 (46.8%) |
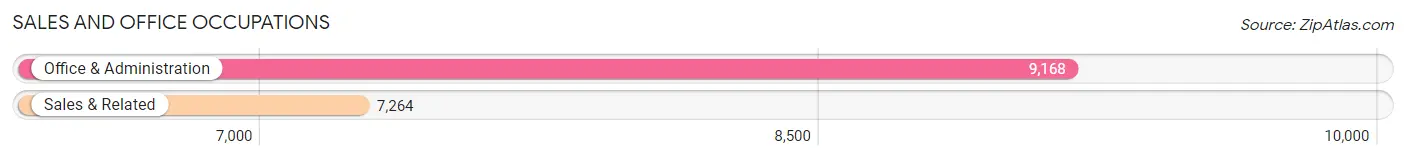
Sales and Office Occupations
The most common Sales and Office occupations in Sandoval County are Office & Administration (9,168 | 13.7%), and Sales & Related (7,264 | 10.8%).
Sales and Office Occupations by Sex
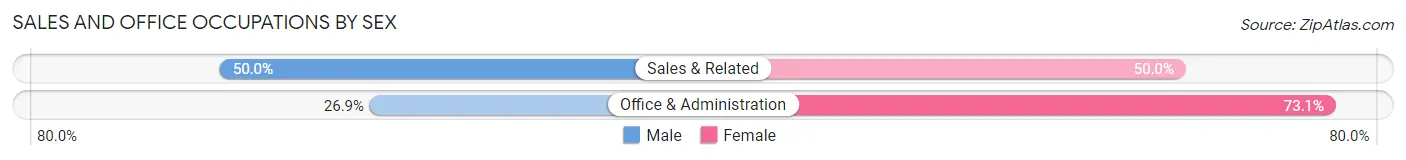
| Occupation | Male | Female |
| Sales & Related | 3,629 (50.0%) | 3,635 (50.0%) |
| Office & Administration | 2,464 (26.9%) | 6,704 (73.1%) |
| Total (Category) | 6,093 (37.1%) | 10,339 (62.9%) |
| Total (Overall) | 35,612 (53.2%) | 31,338 (46.8%) |
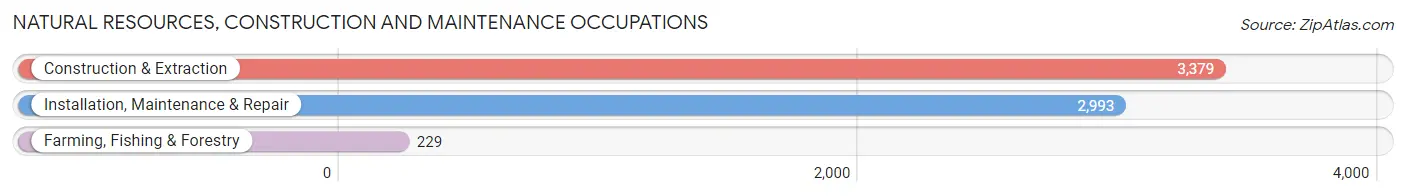
Natural Resources, Construction and Maintenance Occupations
The most common Natural Resources, Construction and Maintenance occupations in Sandoval County are Construction & Extraction (3,379 | 5.1%), Installation, Maintenance & Repair (2,993 | 4.5%), and Farming, Fishing & Forestry (229 | 0.3%).
Natural Resources, Construction and Maintenance Occupations by Sex
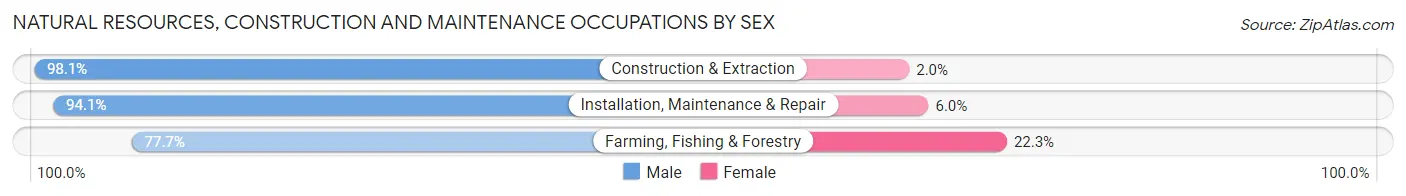
| Occupation | Male | Female |
| Farming, Fishing & Forestry | 178 (77.7%) | 51 (22.3%) |
| Construction & Extraction | 3,313 (98.1%) | 66 (1.9%) |
| Installation, Maintenance & Repair | 2,815 (94.1%) | 178 (5.9%) |
| Total (Category) | 6,306 (95.5%) | 295 (4.5%) |
| Total (Overall) | 35,612 (53.2%) | 31,338 (46.8%) |
Production, Transportation and Moving Occupations
The most common Production, Transportation and Moving occupations in Sandoval County are Transportation (2,080 | 3.1%), Production (2,020 | 3.0%), and Material Moving (1,823 | 2.7%).
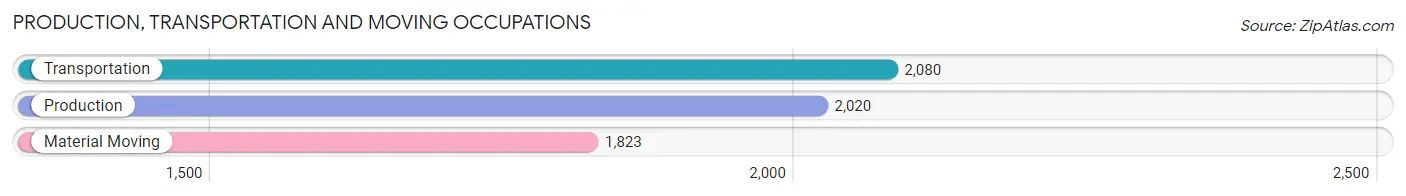
Production, Transportation and Moving Occupations by Sex
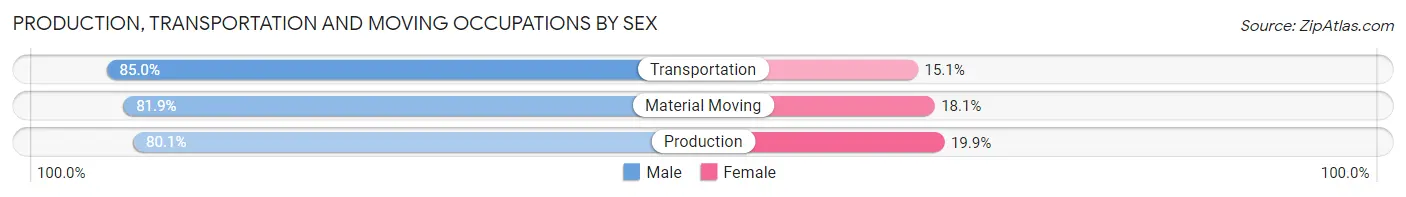
| Occupation | Male | Female |
| Production | 1,618 (80.1%) | 402 (19.9%) |
| Transportation | 1,767 (85.0%) | 313 (15.0%) |
| Material Moving | 1,493 (81.9%) | 330 (18.1%) |
| Total (Category) | 4,878 (82.4%) | 1,045 (17.6%) |
| Total (Overall) | 35,612 (53.2%) | 31,338 (46.8%) |
Employment Industries by Sex in Sandoval County
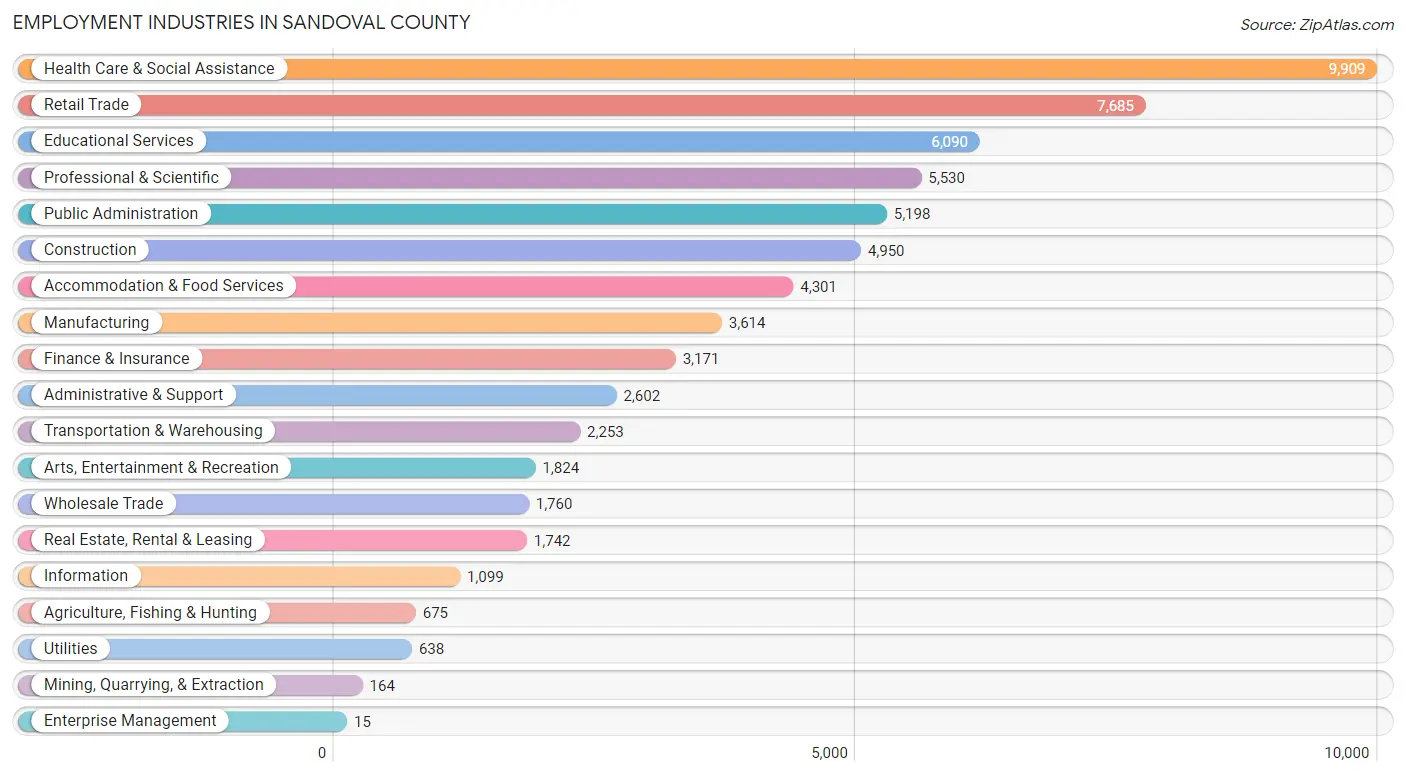
Employment Industries in Sandoval County
The major employment industries in Sandoval County include Health Care & Social Assistance (9,909 | 14.8%), Retail Trade (7,685 | 11.5%), Educational Services (6,090 | 9.1%), Professional & Scientific (5,530 | 8.3%), and Public Administration (5,198 | 7.8%).
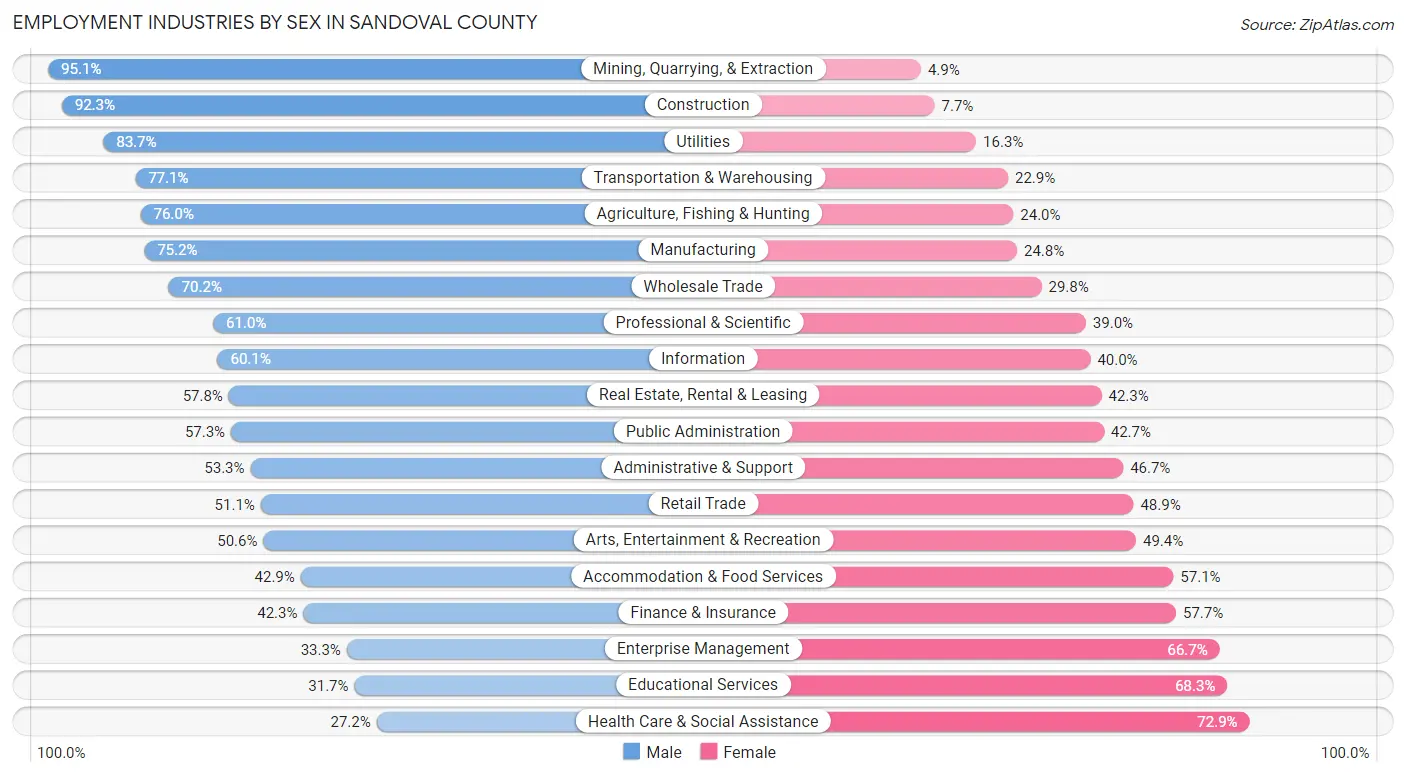
Employment Industries by Sex in Sandoval County
The Sandoval County industries that see more men than women are Mining, Quarrying, & Extraction (95.1%), Construction (92.3%), and Utilities (83.7%), whereas the industries that tend to have a higher number of women are Health Care & Social Assistance (72.9%), Educational Services (68.3%), and Enterprise Management (66.7%).
| Industry | Male | Female |
| Agriculture, Fishing & Hunting | 513 (76.0%) | 162 (24.0%) |
| Mining, Quarrying, & Extraction | 156 (95.1%) | 8 (4.9%) |
| Construction | 4,569 (92.3%) | 381 (7.7%) |
| Manufacturing | 2,719 (75.2%) | 895 (24.8%) |
| Wholesale Trade | 1,235 (70.2%) | 525 (29.8%) |
| Retail Trade | 3,930 (51.1%) | 3,755 (48.9%) |
| Transportation & Warehousing | 1,737 (77.1%) | 516 (22.9%) |
| Utilities | 534 (83.7%) | 104 (16.3%) |
| Information | 660 (60.1%) | 439 (40.0%) |
| Finance & Insurance | 1,342 (42.3%) | 1,829 (57.7%) |
| Real Estate, Rental & Leasing | 1,006 (57.8%) | 736 (42.2%) |
| Professional & Scientific | 3,372 (61.0%) | 2,158 (39.0%) |
| Enterprise Management | 5 (33.3%) | 10 (66.7%) |
| Administrative & Support | 1,386 (53.3%) | 1,216 (46.7%) |
| Educational Services | 1,933 (31.7%) | 4,157 (68.3%) |
| Health Care & Social Assistance | 2,690 (27.2%) | 7,219 (72.9%) |
| Arts, Entertainment & Recreation | 923 (50.6%) | 901 (49.4%) |
| Accommodation & Food Services | 1,844 (42.9%) | 2,457 (57.1%) |
| Public Administration | 2,978 (57.3%) | 2,220 (42.7%) |
| Total | 35,612 (53.2%) | 31,338 (46.8%) |
Education in Sandoval County
School Enrollment in Sandoval County
The most common levels of schooling among the 36,798 students in Sandoval County are high school (8,905 | 24.2%), middle school (8,664 | 23.5%), and college / undergraduate (7,429 | 20.2%).
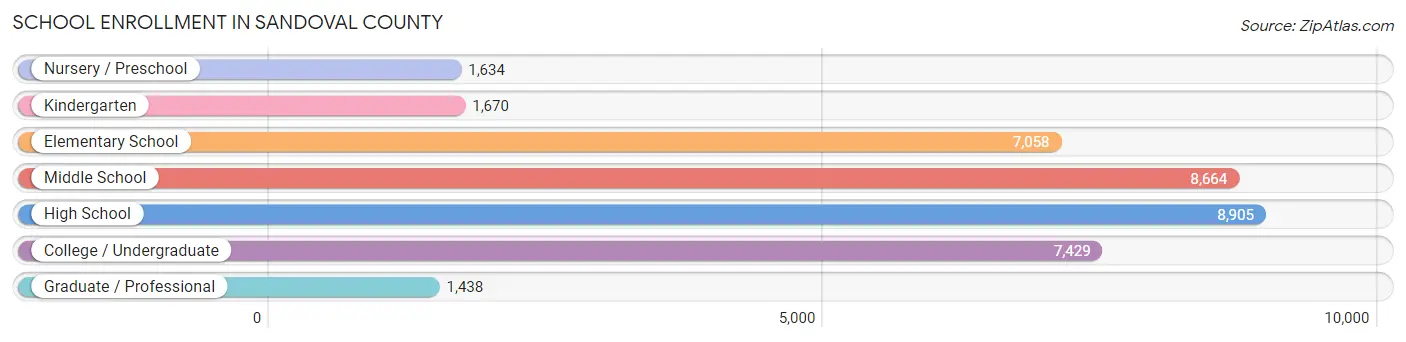
| School Level | # Students | % Students |
| Nursery / Preschool | 1,634 | 4.4% |
| Kindergarten | 1,670 | 4.5% |
| Elementary School | 7,058 | 19.2% |
| Middle School | 8,664 | 23.5% |
| High School | 8,905 | 24.2% |
| College / Undergraduate | 7,429 | 20.2% |
| Graduate / Professional | 1,438 | 3.9% |
| Total | 36,798 | 100.0% |
School Enrollment by Age by Funding Source in Sandoval County
Out of a total of 36,798 students who are enrolled in schools in Sandoval County, 4,710 (12.8%) attend a private institution, while the remaining 32,088 (87.2%) are enrolled in public schools. The age group of 3 to 4 year olds has the highest likelihood of being enrolled in private schools, with 479 (37.8% in the age bracket) enrolled. Conversely, the age group of 18 to 19 year olds has the lowest likelihood of being enrolled in a private school, with 2,184 (94.0% in the age bracket) attending a public institution.
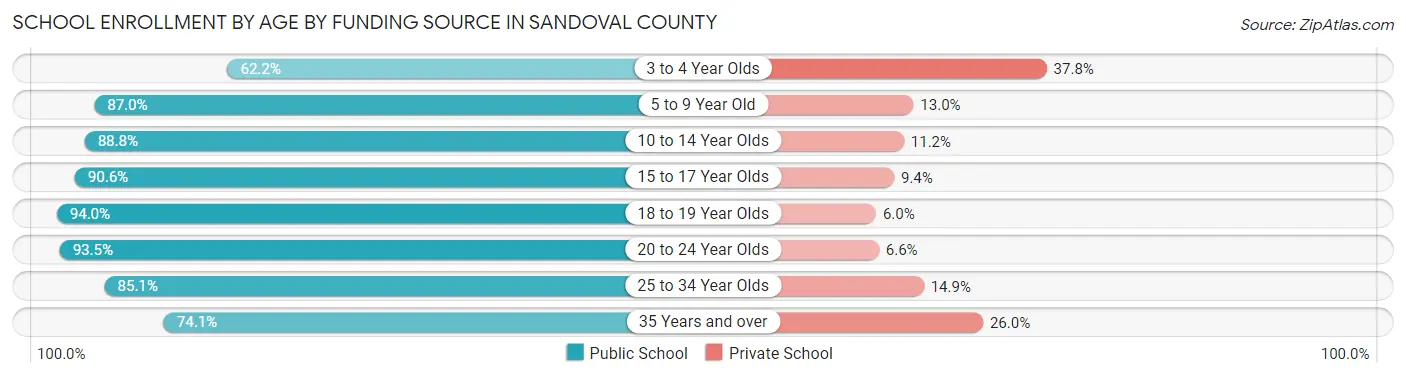
| Age Bracket | Public School | Private School |
| 3 to 4 Year Olds | 788 (62.2%) | 479 (37.8%) |
| 5 to 9 Year Old | 7,084 (87.0%) | 1,058 (13.0%) |
| 10 to 14 Year Olds | 9,694 (88.8%) | 1,224 (11.2%) |
| 15 to 17 Year Olds | 5,692 (90.6%) | 589 (9.4%) |
| 18 to 19 Year Olds | 2,184 (94.0%) | 140 (6.0%) |
| 20 to 24 Year Olds | 2,955 (93.4%) | 207 (6.6%) |
| 25 to 34 Year Olds | 1,524 (85.1%) | 267 (14.9%) |
| 35 Years and over | 2,157 (74.1%) | 756 (26.0%) |
| Total | 32,088 (87.2%) | 4,710 (12.8%) |
Educational Attainment by Field of Study in Sandoval County
Business (7,026 | 19.2%), education (4,555 | 12.4%), science & technology (3,680 | 10.1%), social sciences (3,136 | 8.6%), and engineering (2,657 | 7.3%) are the most common fields of study among 36,599 individuals in Sandoval County who have obtained a bachelor's degree or higher.
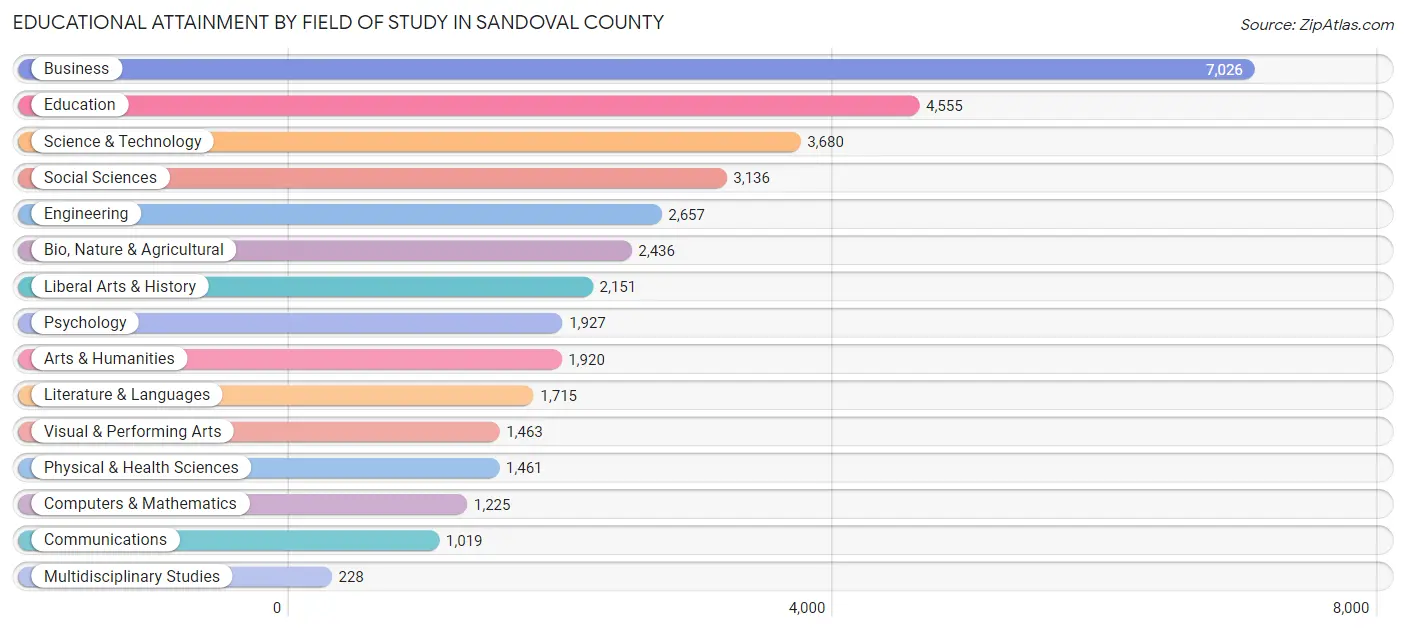
| Field of Study | # Graduates | % Graduates |
| Computers & Mathematics | 1,225 | 3.4% |
| Bio, Nature & Agricultural | 2,436 | 6.7% |
| Physical & Health Sciences | 1,461 | 4.0% |
| Psychology | 1,927 | 5.3% |
| Social Sciences | 3,136 | 8.6% |
| Engineering | 2,657 | 7.3% |
| Multidisciplinary Studies | 228 | 0.6% |
| Science & Technology | 3,680 | 10.1% |
| Business | 7,026 | 19.2% |
| Education | 4,555 | 12.4% |
| Literature & Languages | 1,715 | 4.7% |
| Liberal Arts & History | 2,151 | 5.9% |
| Visual & Performing Arts | 1,463 | 4.0% |
| Communications | 1,019 | 2.8% |
| Arts & Humanities | 1,920 | 5.2% |
| Total | 36,599 | 100.0% |
Transportation & Commute in Sandoval County
Vehicle Availability by Sex in Sandoval County
The most prevalent vehicle ownership categories in Sandoval County are males with 2 vehicles (14,552, accounting for 41.3%) and females with 2 vehicles (11,992, making up 46.9%).
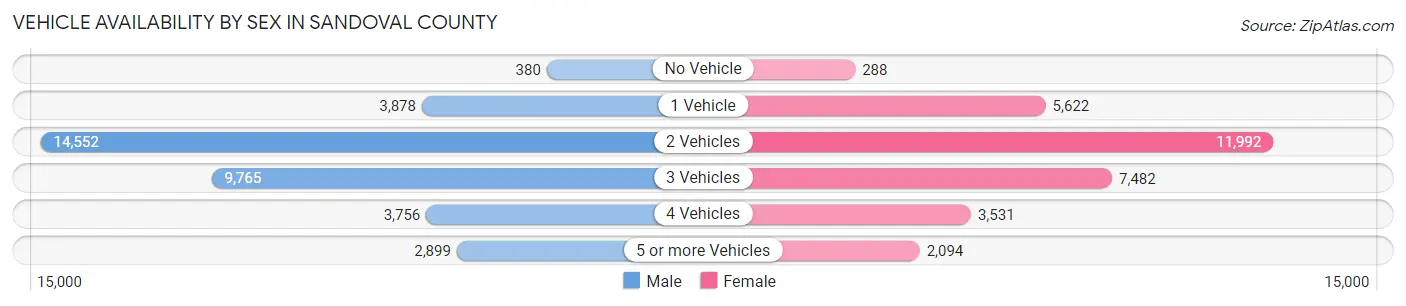
| Vehicles Available | Male | Female |
| No Vehicle | 380 (1.1%) | 288 (0.9%) |
| 1 Vehicle | 3,878 (11.0%) | 5,622 (18.1%) |
| 2 Vehicles | 14,552 (41.3%) | 11,992 (38.7%) |
| 3 Vehicles | 9,765 (27.7%) | 7,482 (24.1%) |
| 4 Vehicles | 3,756 (10.7%) | 3,531 (11.4%) |
| 5 or more Vehicles | 2,899 (8.2%) | 2,094 (6.8%) |
| Total | 35,230 (100.0%) | 31,009 (100.0%) |
Commute Time in Sandoval County
The most frequently occuring commute durations in Sandoval County are 30 to 34 minutes (10,032 commuters, 17.3%), 20 to 24 minutes (7,819 commuters, 13.5%), and 45 to 59 minutes (6,432 commuters, 11.1%).
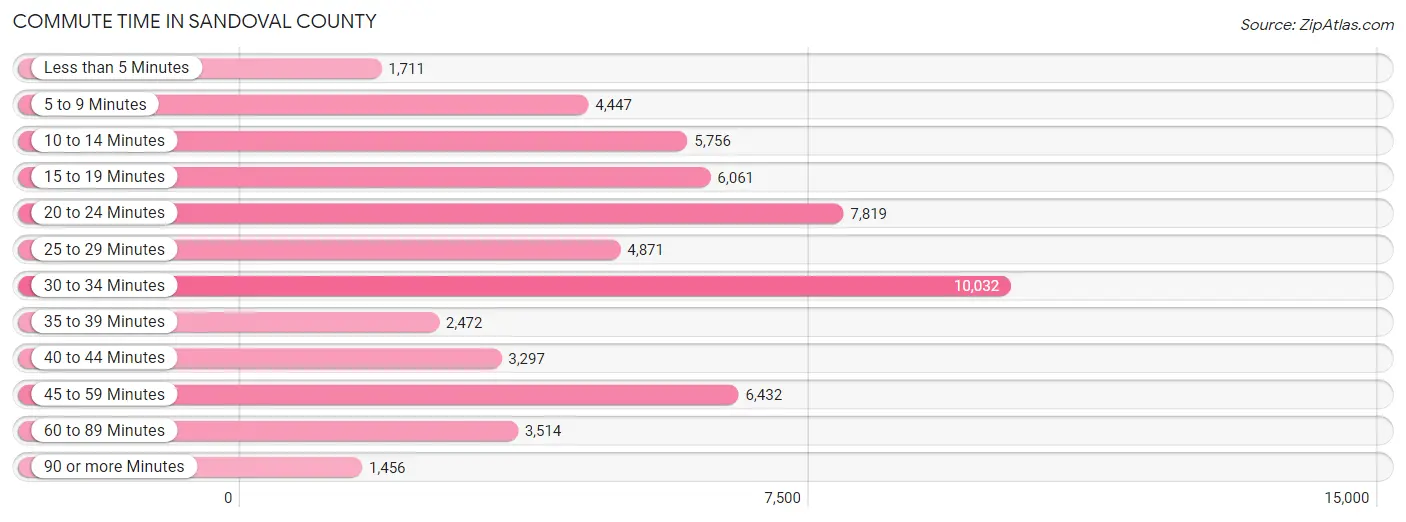
| Commute Time | # Commuters | % Commuters |
| Less than 5 Minutes | 1,711 | 3.0% |
| 5 to 9 Minutes | 4,447 | 7.7% |
| 10 to 14 Minutes | 5,756 | 10.0% |
| 15 to 19 Minutes | 6,061 | 10.5% |
| 20 to 24 Minutes | 7,819 | 13.5% |
| 25 to 29 Minutes | 4,871 | 8.4% |
| 30 to 34 Minutes | 10,032 | 17.3% |
| 35 to 39 Minutes | 2,472 | 4.3% |
| 40 to 44 Minutes | 3,297 | 5.7% |
| 45 to 59 Minutes | 6,432 | 11.1% |
| 60 to 89 Minutes | 3,514 | 6.1% |
| 90 or more Minutes | 1,456 | 2.5% |
Commute Time by Sex in Sandoval County
The most common commute times in Sandoval County are 30 to 34 minutes (5,645 commuters, 17.8%) for males and 30 to 34 minutes (4,387 commuters, 16.7%) for females.
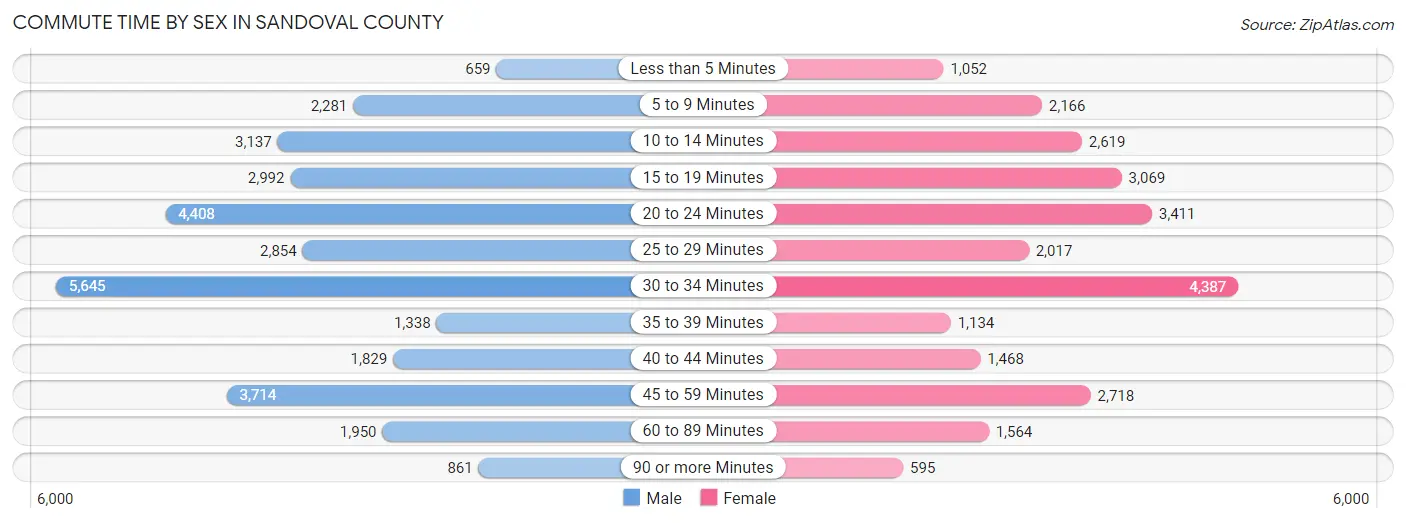
| Commute Time | Male | Female |
| Less than 5 Minutes | 659 (2.1%) | 1,052 (4.0%) |
| 5 to 9 Minutes | 2,281 (7.2%) | 2,166 (8.3%) |
| 10 to 14 Minutes | 3,137 (9.9%) | 2,619 (10.0%) |
| 15 to 19 Minutes | 2,992 (9.5%) | 3,069 (11.7%) |
| 20 to 24 Minutes | 4,408 (13.9%) | 3,411 (13.0%) |
| 25 to 29 Minutes | 2,854 (9.0%) | 2,017 (7.7%) |
| 30 to 34 Minutes | 5,645 (17.8%) | 4,387 (16.7%) |
| 35 to 39 Minutes | 1,338 (4.2%) | 1,134 (4.3%) |
| 40 to 44 Minutes | 1,829 (5.8%) | 1,468 (5.6%) |
| 45 to 59 Minutes | 3,714 (11.7%) | 2,718 (10.4%) |
| 60 to 89 Minutes | 1,950 (6.2%) | 1,564 (6.0%) |
| 90 or more Minutes | 861 (2.7%) | 595 (2.3%) |
Time of Departure to Work by Sex in Sandoval County
The most frequent times of departure to work in Sandoval County are 7:00 AM to 7:29 AM (4,636, 14.6%) for males and 7:00 AM to 7:29 AM (4,601, 17.6%) for females.
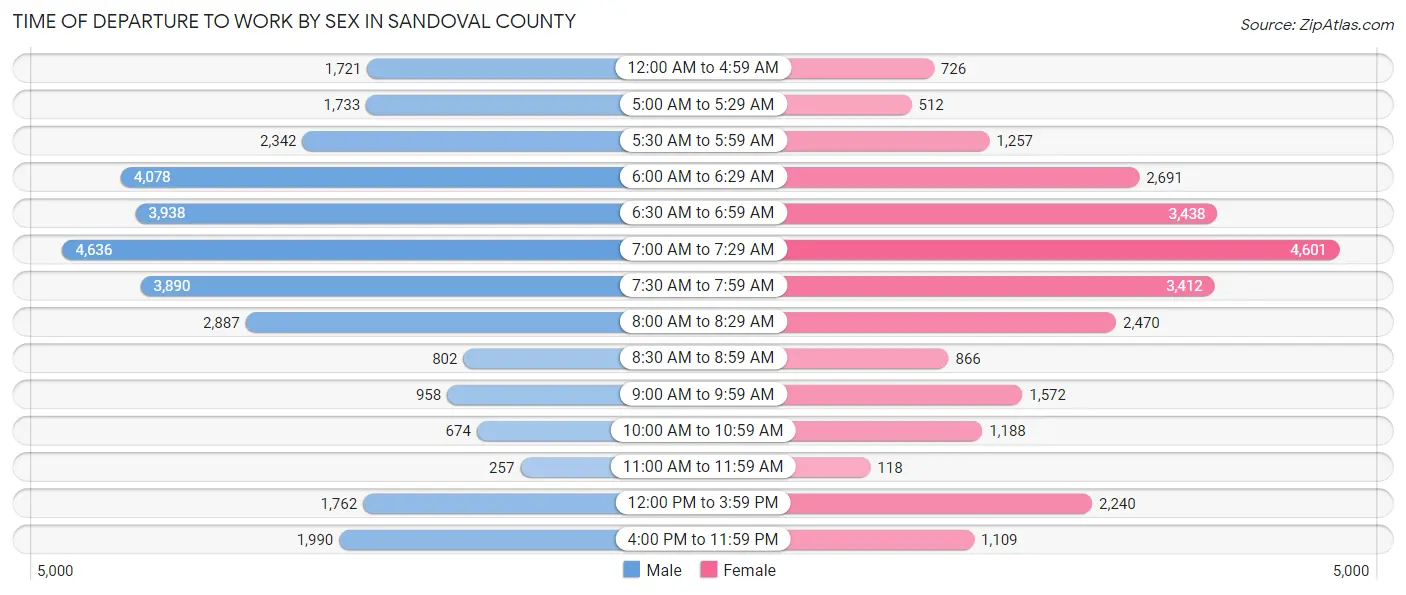
| Time of Departure | Male | Female |
| 12:00 AM to 4:59 AM | 1,721 (5.4%) | 726 (2.8%) |
| 5:00 AM to 5:29 AM | 1,733 (5.5%) | 512 (1.9%) |
| 5:30 AM to 5:59 AM | 2,342 (7.4%) | 1,257 (4.8%) |
| 6:00 AM to 6:29 AM | 4,078 (12.9%) | 2,691 (10.3%) |
| 6:30 AM to 6:59 AM | 3,938 (12.4%) | 3,438 (13.1%) |
| 7:00 AM to 7:29 AM | 4,636 (14.6%) | 4,601 (17.6%) |
| 7:30 AM to 7:59 AM | 3,890 (12.3%) | 3,412 (13.0%) |
| 8:00 AM to 8:29 AM | 2,887 (9.1%) | 2,470 (9.4%) |
| 8:30 AM to 8:59 AM | 802 (2.5%) | 866 (3.3%) |
| 9:00 AM to 9:59 AM | 958 (3.0%) | 1,572 (6.0%) |
| 10:00 AM to 10:59 AM | 674 (2.1%) | 1,188 (4.5%) |
| 11:00 AM to 11:59 AM | 257 (0.8%) | 118 (0.4%) |
| 12:00 PM to 3:59 PM | 1,762 (5.6%) | 2,240 (8.6%) |
| 4:00 PM to 11:59 PM | 1,990 (6.3%) | 1,109 (4.2%) |
| Total | 31,668 (100.0%) | 26,200 (100.0%) |
Housing Occupancy in Sandoval County
Occupancy by Ownership in Sandoval County
Of the total 54,911 dwellings in Sandoval County, owner-occupied units account for 44,502 (81.0%), while renter-occupied units make up 10,409 (19.0%).
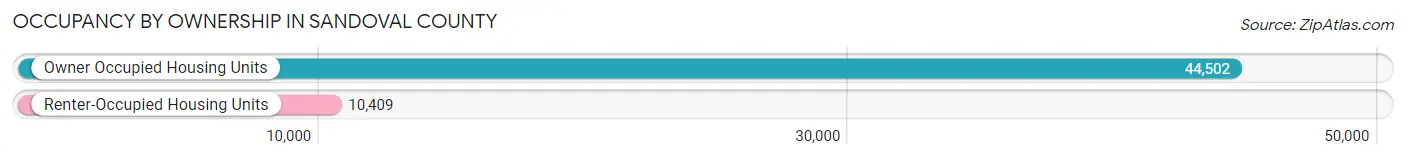
| Occupancy | # Housing Units | % Housing Units |
| Owner Occupied Housing Units | 44,502 | 81.0% |
| Renter-Occupied Housing Units | 10,409 | 19.0% |
| Total Occupied Housing Units | 54,911 | 100.0% |
Occupancy by Household Size in Sandoval County
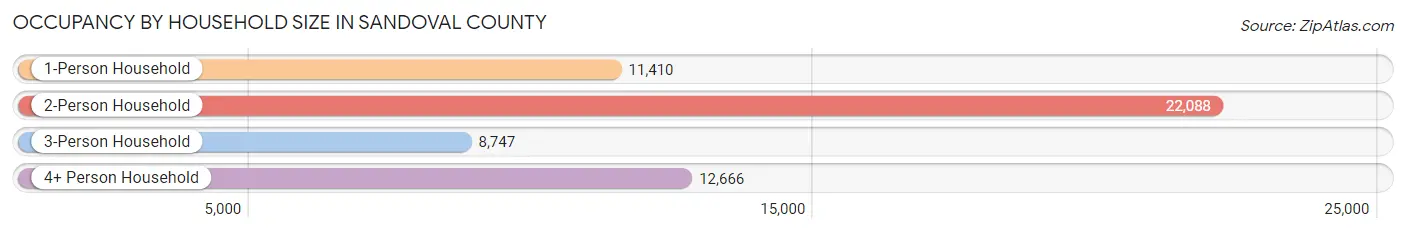
| Household Size | # Housing Units | % Housing Units |
| 1-Person Household | 11,410 | 20.8% |
| 2-Person Household | 22,088 | 40.2% |
| 3-Person Household | 8,747 | 15.9% |
| 4+ Person Household | 12,666 | 23.1% |
| Total Housing Units | 54,911 | 100.0% |
Occupancy by Ownership by Household Size in Sandoval County
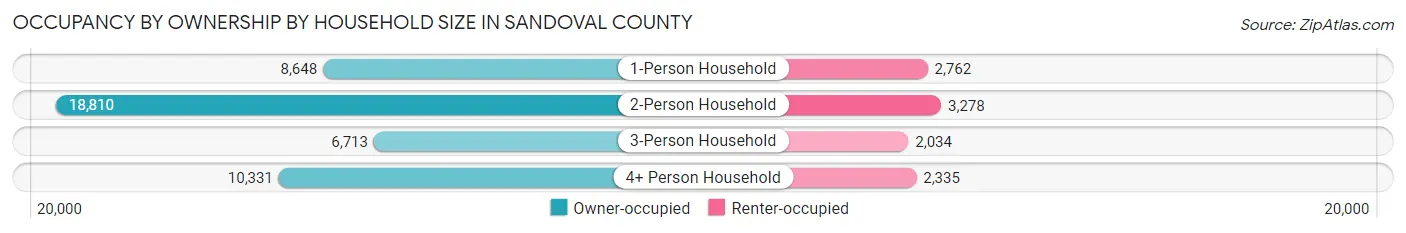
| Household Size | Owner-occupied | Renter-occupied |
| 1-Person Household | 8,648 (75.8%) | 2,762 (24.2%) |
| 2-Person Household | 18,810 (85.2%) | 3,278 (14.8%) |
| 3-Person Household | 6,713 (76.7%) | 2,034 (23.3%) |
| 4+ Person Household | 10,331 (81.6%) | 2,335 (18.4%) |
| Total Housing Units | 44,502 (81.0%) | 10,409 (19.0%) |
Occupancy by Educational Attainment in Sandoval County
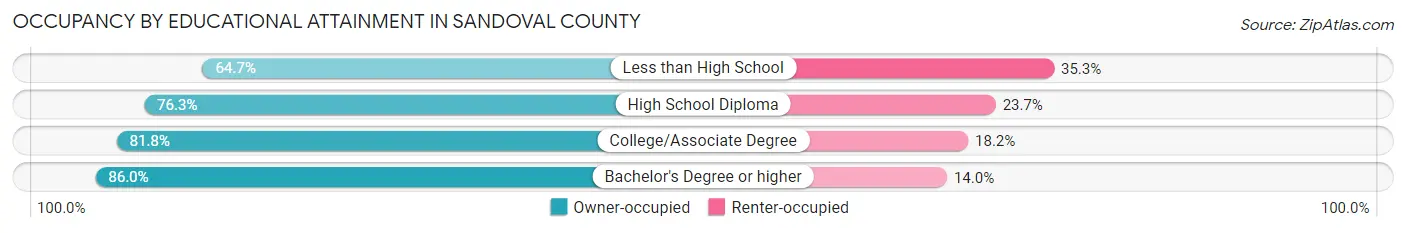
| Household Size | Owner-occupied | Renter-occupied |
| Less than High School | 2,437 (64.7%) | 1,328 (35.3%) |
| High School Diploma | 8,818 (76.3%) | 2,739 (23.7%) |
| College/Associate Degree | 15,295 (81.8%) | 3,410 (18.2%) |
| Bachelor's Degree or higher | 17,952 (86.0%) | 2,932 (14.0%) |
Occupancy by Age of Householder in Sandoval County
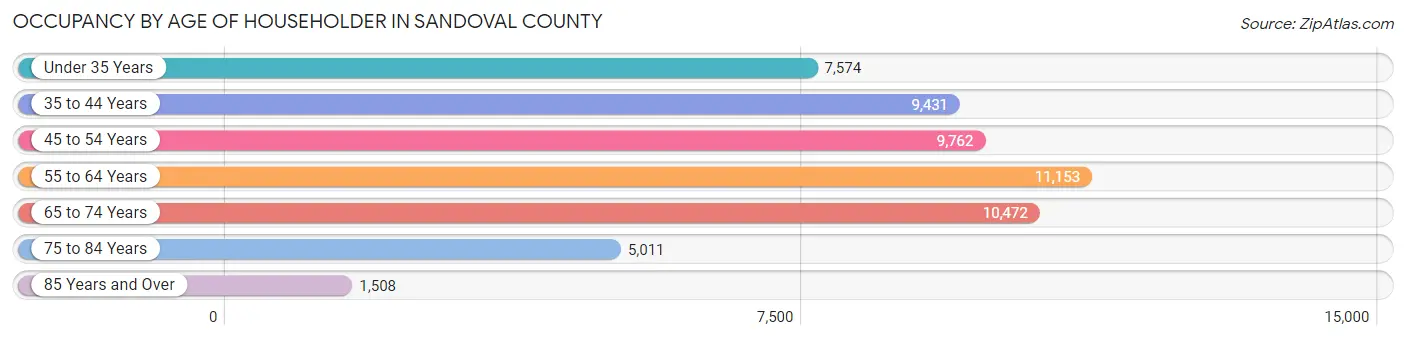
| Age Bracket | # Households | % Households |
| Under 35 Years | 7,574 | 13.8% |
| 35 to 44 Years | 9,431 | 17.2% |
| 45 to 54 Years | 9,762 | 17.8% |
| 55 to 64 Years | 11,153 | 20.3% |
| 65 to 74 Years | 10,472 | 19.1% |
| 75 to 84 Years | 5,011 | 9.1% |
| 85 Years and Over | 1,508 | 2.8% |
| Total | 54,911 | 100.0% |
Housing Finances in Sandoval County
Median Income by Occupancy in Sandoval County
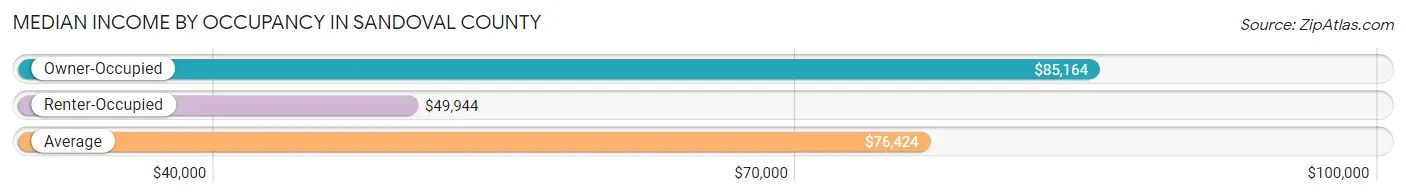
| Occupancy Type | # Households | Median Income |
| Owner-Occupied | 44,502 (81.0%) | $85,164 |
| Renter-Occupied | 10,409 (19.0%) | $49,944 |
| Average | 54,911 (100.0%) | $76,424 |
Occupancy by Householder Income Bracket in Sandoval County
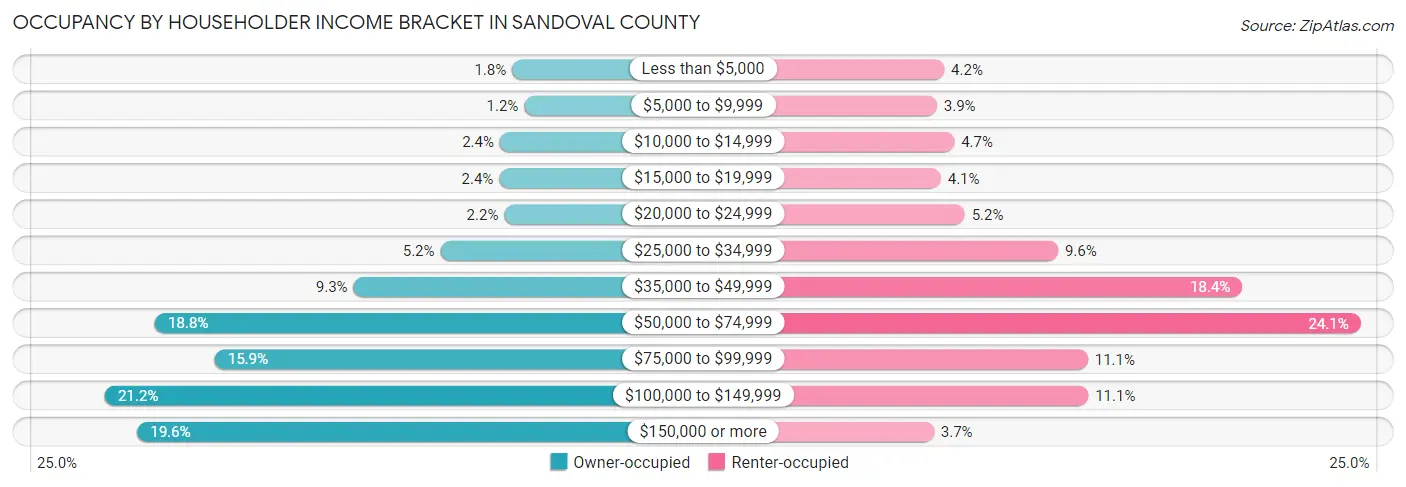
| Income Bracket | Owner-occupied | Renter-occupied |
| Less than $5,000 | 797 (1.8%) | 439 (4.2%) |
| $5,000 to $9,999 | 537 (1.2%) | 403 (3.9%) |
| $10,000 to $14,999 | 1,056 (2.4%) | 489 (4.7%) |
| $15,000 to $19,999 | 1,069 (2.4%) | 423 (4.1%) |
| $20,000 to $24,999 | 961 (2.2%) | 541 (5.2%) |
| $25,000 to $34,999 | 2,314 (5.2%) | 1,003 (9.6%) |
| $35,000 to $49,999 | 4,157 (9.3%) | 1,916 (18.4%) |
| $50,000 to $74,999 | 8,360 (18.8%) | 2,503 (24.0%) |
| $75,000 to $99,999 | 7,095 (15.9%) | 1,151 (11.1%) |
| $100,000 to $149,999 | 9,419 (21.2%) | 1,153 (11.1%) |
| $150,000 or more | 8,737 (19.6%) | 388 (3.7%) |
| Total | 44,502 (100.0%) | 10,409 (100.0%) |
Monthly Housing Cost Tiers in Sandoval County
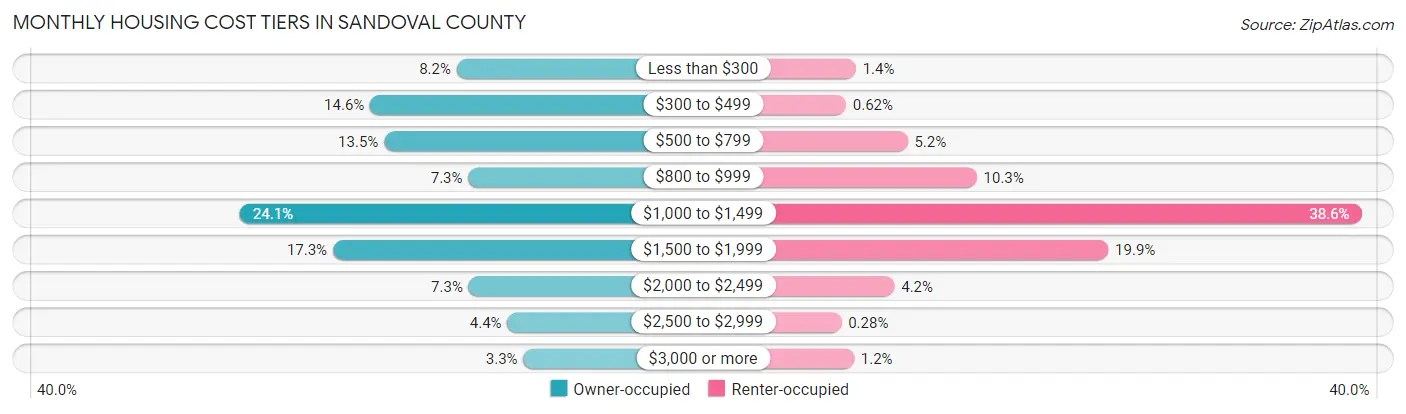
| Monthly Cost | Owner-occupied | Renter-occupied |
| Less than $300 | 3,638 (8.2%) | 141 (1.3%) |
| $300 to $499 | 6,476 (14.5%) | 65 (0.6%) |
| $500 to $799 | 6,016 (13.5%) | 537 (5.2%) |
| $800 to $999 | 3,258 (7.3%) | 1,067 (10.2%) |
| $1,000 to $1,499 | 10,745 (24.1%) | 4,017 (38.6%) |
| $1,500 to $1,999 | 7,694 (17.3%) | 2,076 (19.9%) |
| $2,000 to $2,499 | 3,246 (7.3%) | 436 (4.2%) |
| $2,500 to $2,999 | 1,977 (4.4%) | 29 (0.3%) |
| $3,000 or more | 1,452 (3.3%) | 126 (1.2%) |
| Total | 44,502 (100.0%) | 10,409 (100.0%) |
Physical Housing Characteristics in Sandoval County
Housing Structures in Sandoval County
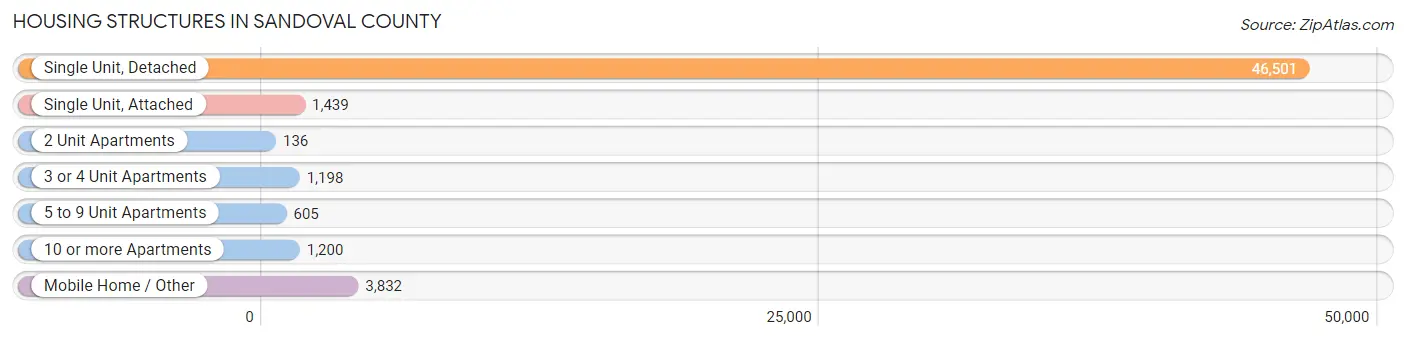
| Structure Type | # Housing Units | % Housing Units |
| Single Unit, Detached | 46,501 | 84.7% |
| Single Unit, Attached | 1,439 | 2.6% |
| 2 Unit Apartments | 136 | 0.3% |
| 3 or 4 Unit Apartments | 1,198 | 2.2% |
| 5 to 9 Unit Apartments | 605 | 1.1% |
| 10 or more Apartments | 1,200 | 2.2% |
| Mobile Home / Other | 3,832 | 7.0% |
| Total | 54,911 | 100.0% |
Housing Structures by Occupancy in Sandoval County
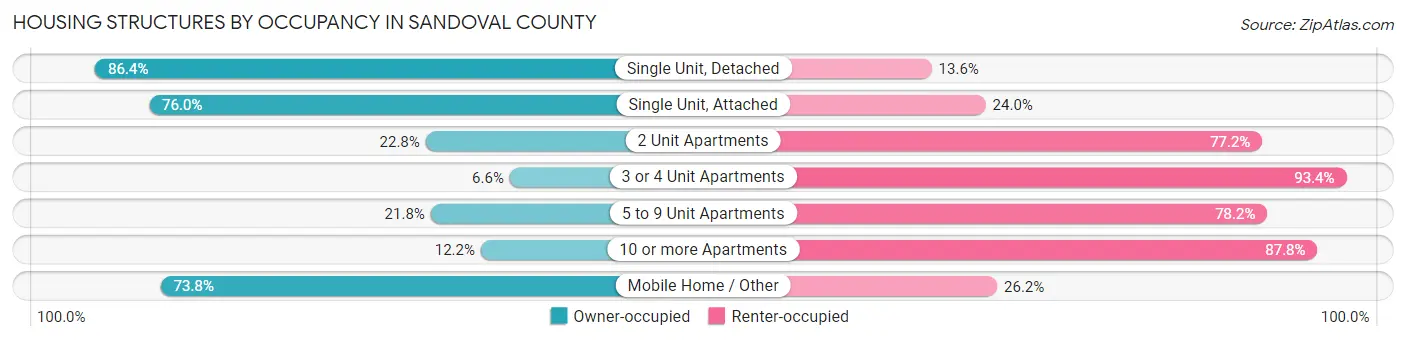
| Structure Type | Owner-occupied | Renter-occupied |
| Single Unit, Detached | 40,191 (86.4%) | 6,310 (13.6%) |
| Single Unit, Attached | 1,094 (76.0%) | 345 (24.0%) |
| 2 Unit Apartments | 31 (22.8%) | 105 (77.2%) |
| 3 or 4 Unit Apartments | 79 (6.6%) | 1,119 (93.4%) |
| 5 to 9 Unit Apartments | 132 (21.8%) | 473 (78.2%) |
| 10 or more Apartments | 146 (12.2%) | 1,054 (87.8%) |
| Mobile Home / Other | 2,829 (73.8%) | 1,003 (26.2%) |
| Total | 44,502 (81.0%) | 10,409 (19.0%) |
Housing Structures by Number of Rooms in Sandoval County
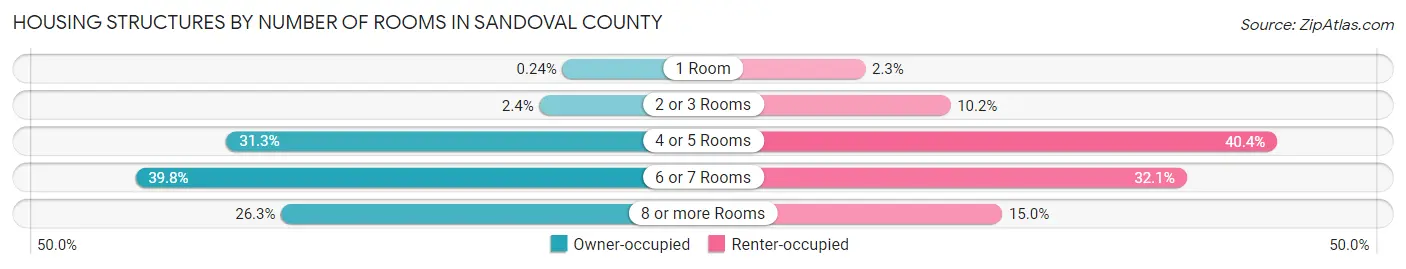
| Number of Rooms | Owner-occupied | Renter-occupied |
| 1 Room | 108 (0.2%) | 242 (2.3%) |
| 2 or 3 Rooms | 1,060 (2.4%) | 1,062 (10.2%) |
| 4 or 5 Rooms | 13,949 (31.3%) | 4,209 (40.4%) |
| 6 or 7 Rooms | 17,699 (39.8%) | 3,336 (32.1%) |
| 8 or more Rooms | 11,686 (26.3%) | 1,560 (15.0%) |
| Total | 44,502 (100.0%) | 10,409 (100.0%) |
Housing Structure by Heating Type in Sandoval County
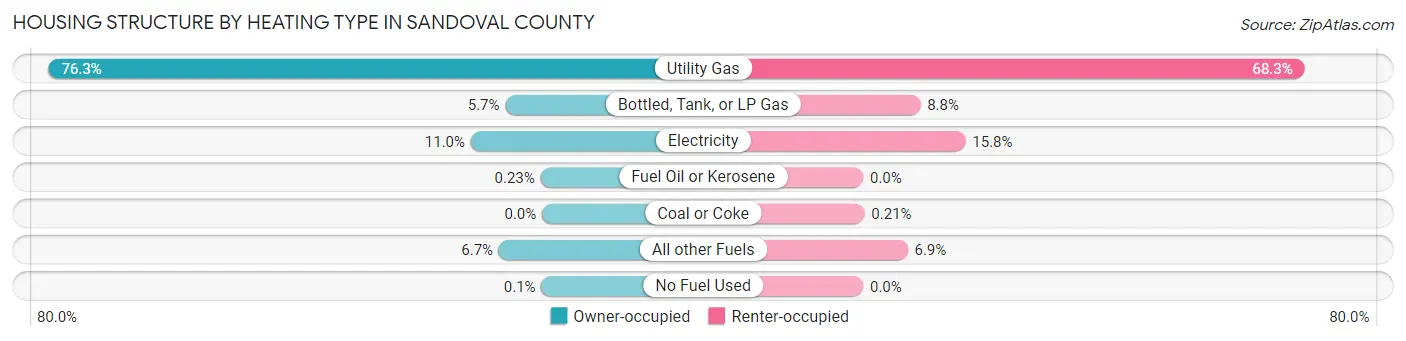
| Heating Type | Owner-occupied | Renter-occupied |
| Utility Gas | 33,958 (76.3%) | 7,104 (68.2%) |
| Bottled, Tank, or LP Gas | 2,527 (5.7%) | 920 (8.8%) |
| Electricity | 4,899 (11.0%) | 1,647 (15.8%) |
| Fuel Oil or Kerosene | 103 (0.2%) | 0 (0.0%) |
| Coal or Coke | 0 (0.0%) | 22 (0.2%) |
| All other Fuels | 2,970 (6.7%) | 716 (6.9%) |
| No Fuel Used | 45 (0.1%) | 0 (0.0%) |
| Total | 44,502 (100.0%) | 10,409 (100.0%) |
Household Vehicle Usage in Sandoval County
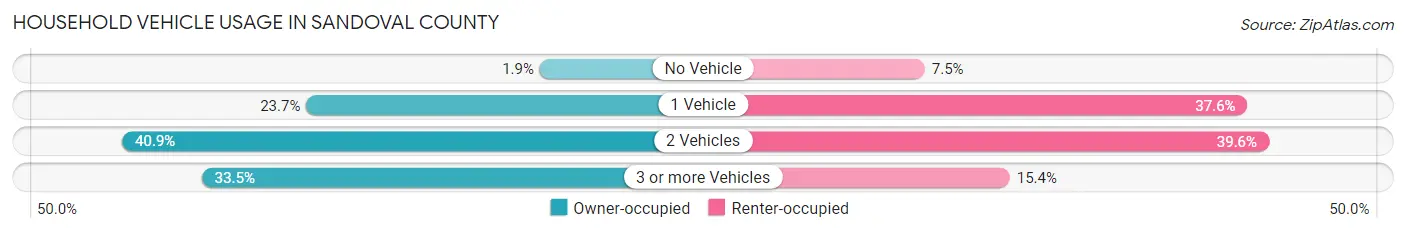
| Vehicles per Household | Owner-occupied | Renter-occupied |
| No Vehicle | 852 (1.9%) | 777 (7.5%) |
| 1 Vehicle | 10,550 (23.7%) | 3,911 (37.6%) |
| 2 Vehicles | 18,207 (40.9%) | 4,119 (39.6%) |
| 3 or more Vehicles | 14,893 (33.5%) | 1,602 (15.4%) |
| Total | 44,502 (100.0%) | 10,409 (100.0%) |
Real Estate & Mortgages in Sandoval County
Real Estate and Mortgage Overview in Sandoval County
| Characteristic | Without Mortgage | With Mortgage |
| Housing Units | 16,617 | 27,885 |
| Median Property Value | $245,500 | $264,200 |
| Median Household Income | $68,036 | $6,171 |
| Monthly Housing Costs | $460 | $1,428 |
| Real Estate Taxes | $1,926 | $1,323 |
Property Value by Mortgage Status in Sandoval County
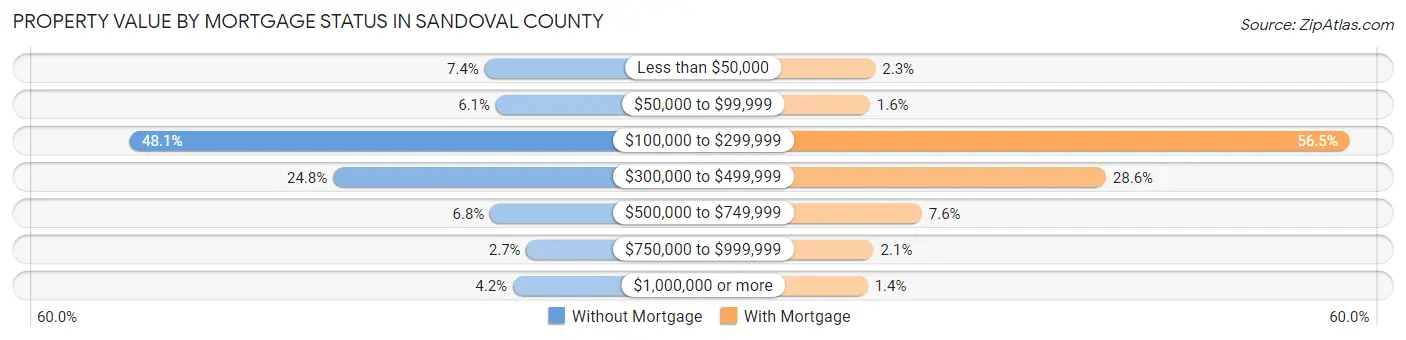
| Property Value | Without Mortgage | With Mortgage |
| Less than $50,000 | 1,233 (7.4%) | 630 (2.3%) |
| $50,000 to $99,999 | 1,021 (6.1%) | 454 (1.6%) |
| $100,000 to $299,999 | 7,985 (48.0%) | 15,744 (56.5%) |
| $300,000 to $499,999 | 4,112 (24.7%) | 7,978 (28.6%) |
| $500,000 to $749,999 | 1,129 (6.8%) | 2,115 (7.6%) |
| $750,000 to $999,999 | 441 (2.6%) | 577 (2.1%) |
| $1,000,000 or more | 696 (4.2%) | 387 (1.4%) |
| Total | 16,617 (100.0%) | 27,885 (100.0%) |
Household Income by Mortgage Status in Sandoval County
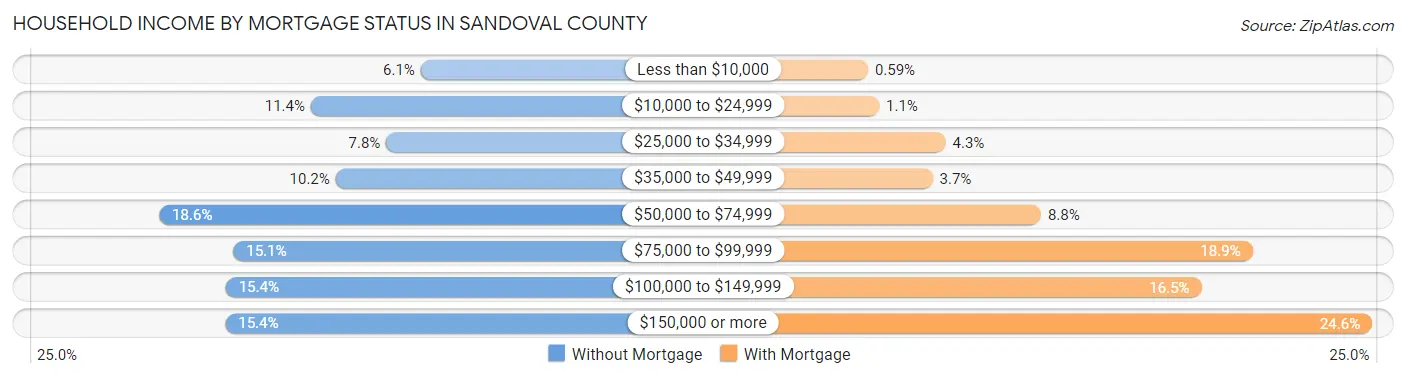
| Household Income | Without Mortgage | With Mortgage |
| Less than $10,000 | 1,021 (6.1%) | 165 (0.6%) |
| $10,000 to $24,999 | 1,889 (11.4%) | 313 (1.1%) |
| $25,000 to $34,999 | 1,292 (7.8%) | 1,197 (4.3%) |
| $35,000 to $49,999 | 1,694 (10.2%) | 1,022 (3.7%) |
| $50,000 to $74,999 | 3,090 (18.6%) | 2,463 (8.8%) |
| $75,000 to $99,999 | 2,503 (15.1%) | 5,270 (18.9%) |
| $100,000 to $149,999 | 2,562 (15.4%) | 4,592 (16.5%) |
| $150,000 or more | 2,566 (15.4%) | 6,857 (24.6%) |
| Total | 16,617 (100.0%) | 27,885 (100.0%) |
Property Value to Household Income Ratio in Sandoval County
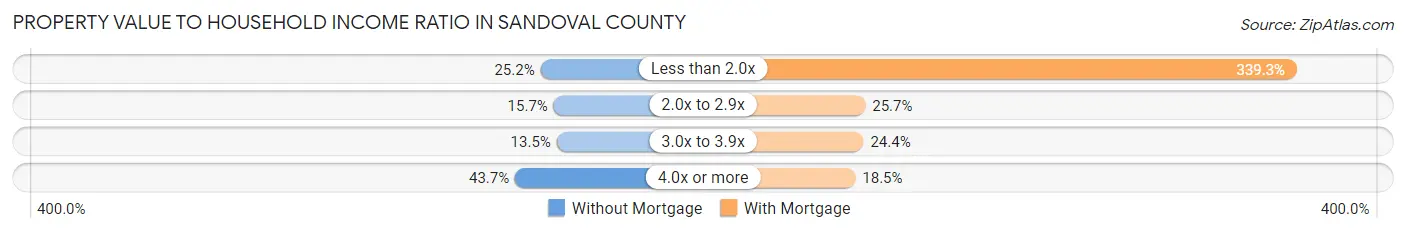
| Value-to-Income Ratio | Without Mortgage | With Mortgage |
| Less than 2.0x | 4,192 (25.2%) | 94,600 (339.3%) |
| 2.0x to 2.9x | 2,602 (15.7%) | 7,163 (25.7%) |
| 3.0x to 3.9x | 2,241 (13.5%) | 6,805 (24.4%) |
| 4.0x or more | 7,264 (43.7%) | 5,157 (18.5%) |
| Total | 16,617 (100.0%) | 27,885 (100.0%) |
Real Estate Taxes by Mortgage Status in Sandoval County
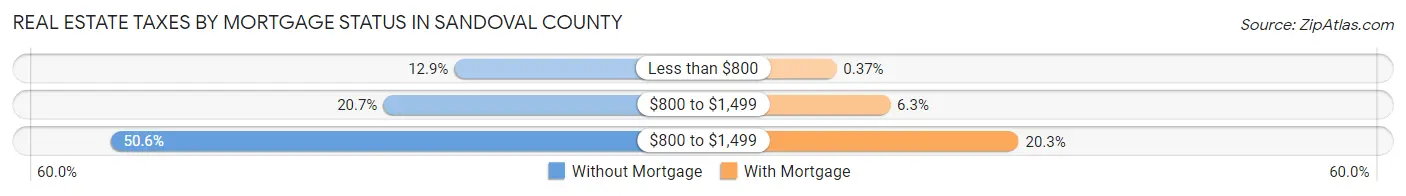
| Property Taxes | Without Mortgage | With Mortgage |
| Less than $800 | 2,147 (12.9%) | 104 (0.4%) |
| $800 to $1,499 | 3,439 (20.7%) | 1,746 (6.3%) |
| $800 to $1,499 | 8,404 (50.6%) | 5,669 (20.3%) |
| Total | 16,617 (100.0%) | 27,885 (100.0%) |
Health & Disability in Sandoval County
Health Insurance Coverage by Age in Sandoval County
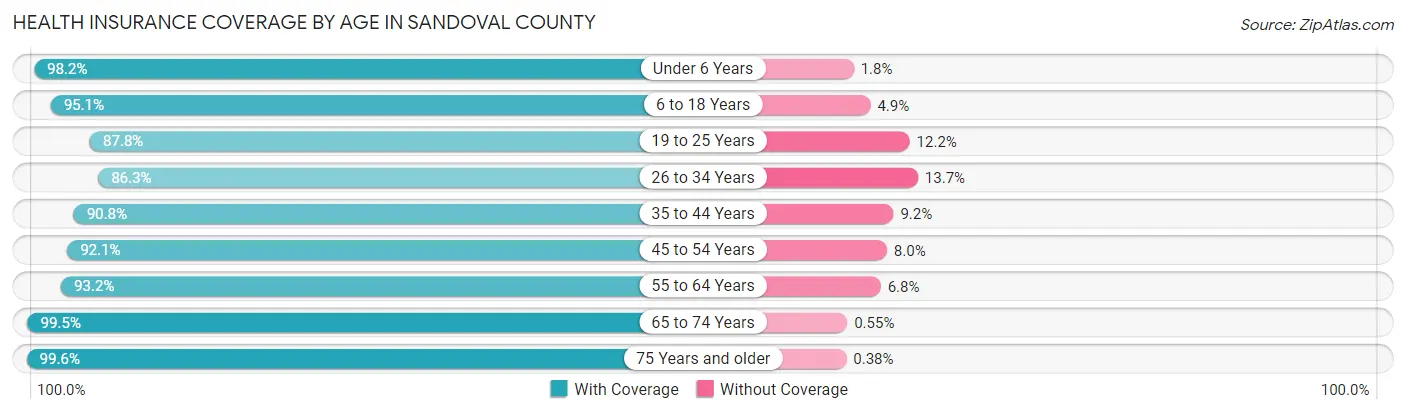
| Age Bracket | With Coverage | Without Coverage |
| Under 6 Years | 8,825 (98.2%) | 158 (1.8%) |
| 6 to 18 Years | 24,888 (95.1%) | 1,278 (4.9%) |
| 19 to 25 Years | 10,380 (87.8%) | 1,441 (12.2%) |
| 26 to 34 Years | 14,080 (86.3%) | 2,241 (13.7%) |
| 35 to 44 Years | 17,720 (90.8%) | 1,789 (9.2%) |
| 45 to 54 Years | 16,667 (92.0%) | 1,440 (8.0%) |
| 55 to 64 Years | 18,557 (93.2%) | 1,352 (6.8%) |
| 65 to 74 Years | 17,434 (99.5%) | 97 (0.5%) |
| 75 Years and older | 10,356 (99.6%) | 40 (0.4%) |
| Total | 138,907 (93.4%) | 9,836 (6.6%) |
Health Insurance Coverage by Citizenship Status in Sandoval County
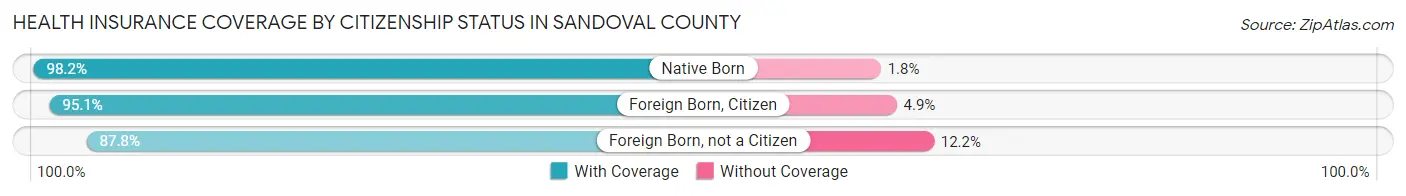
| Citizenship Status | With Coverage | Without Coverage |
| Native Born | 8,825 (98.2%) | 158 (1.8%) |
| Foreign Born, Citizen | 24,888 (95.1%) | 1,278 (4.9%) |
| Foreign Born, not a Citizen | 10,380 (87.8%) | 1,441 (12.2%) |
Health Insurance Coverage by Household Income in Sandoval County
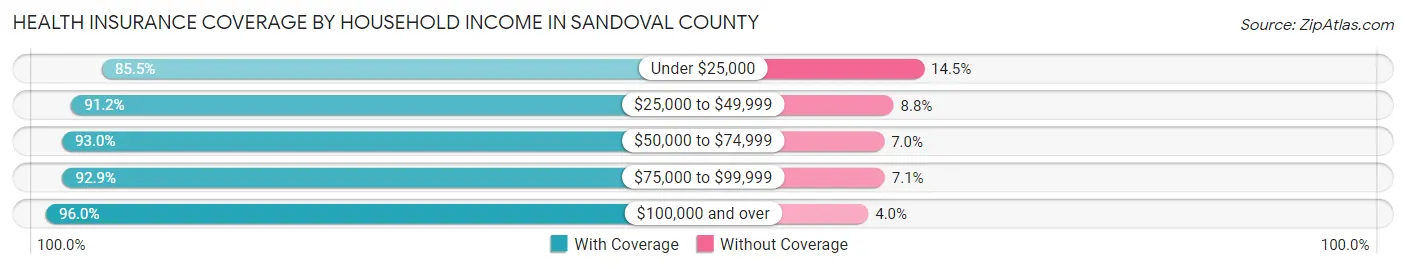
| Household Income | With Coverage | Without Coverage |
| Under $25,000 | 10,909 (85.5%) | 1,849 (14.5%) |
| $25,000 to $49,999 | 19,785 (91.2%) | 1,902 (8.8%) |
| $50,000 to $74,999 | 23,494 (93.0%) | 1,770 (7.0%) |
| $75,000 to $99,999 | 21,788 (92.9%) | 1,673 (7.1%) |
| $100,000 and over | 62,562 (96.0%) | 2,625 (4.0%) |
Public vs Private Health Insurance Coverage by Age in Sandoval County
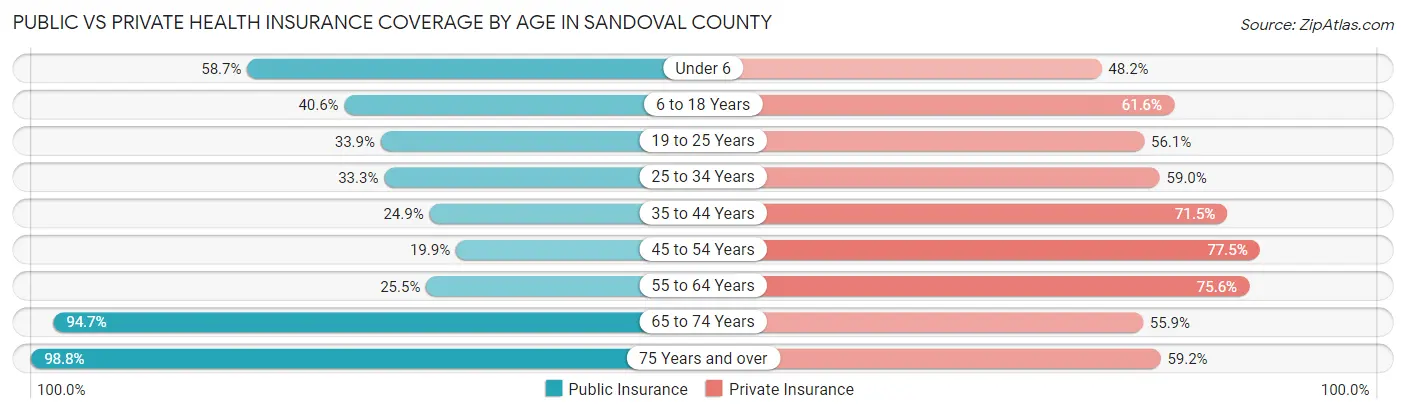
| Age Bracket | Public Insurance | Private Insurance |
| Under 6 | 5,269 (58.7%) | 4,329 (48.2%) |
| 6 to 18 Years | 10,631 (40.6%) | 16,125 (61.6%) |
| 19 to 25 Years | 4,006 (33.9%) | 6,632 (56.1%) |
| 25 to 34 Years | 5,426 (33.3%) | 9,628 (59.0%) |
| 35 to 44 Years | 4,848 (24.8%) | 13,953 (71.5%) |
| 45 to 54 Years | 3,609 (19.9%) | 14,038 (77.5%) |
| 55 to 64 Years | 5,066 (25.5%) | 15,043 (75.6%) |
| 65 to 74 Years | 16,597 (94.7%) | 9,796 (55.9%) |
| 75 Years and over | 10,268 (98.8%) | 6,149 (59.2%) |
| Total | 65,720 (44.2%) | 95,693 (64.3%) |
Disability Status by Sex by Age in Sandoval County
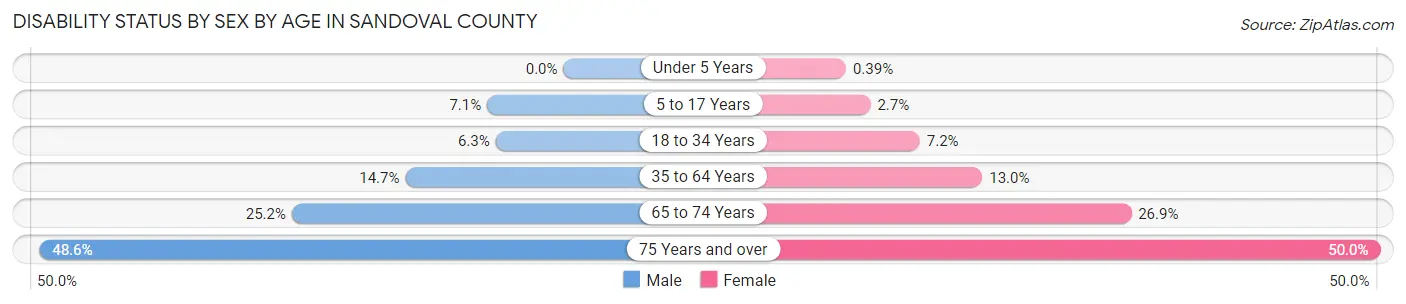
| Age Bracket | Male | Female |
| Under 5 Years | 0 (0.0%) | 14 (0.4%) |
| 5 to 17 Years | 963 (7.1%) | 334 (2.7%) |
| 18 to 34 Years | 951 (6.3%) | 1,053 (7.2%) |
| 35 to 64 Years | 4,157 (14.7%) | 3,807 (13.0%) |
| 65 to 74 Years | 2,064 (25.2%) | 2,508 (26.9%) |
| 75 Years and over | 2,228 (48.6%) | 2,905 (50.0%) |
Disability Class by Sex by Age in Sandoval County
Disability Class: Hearing Difficulty
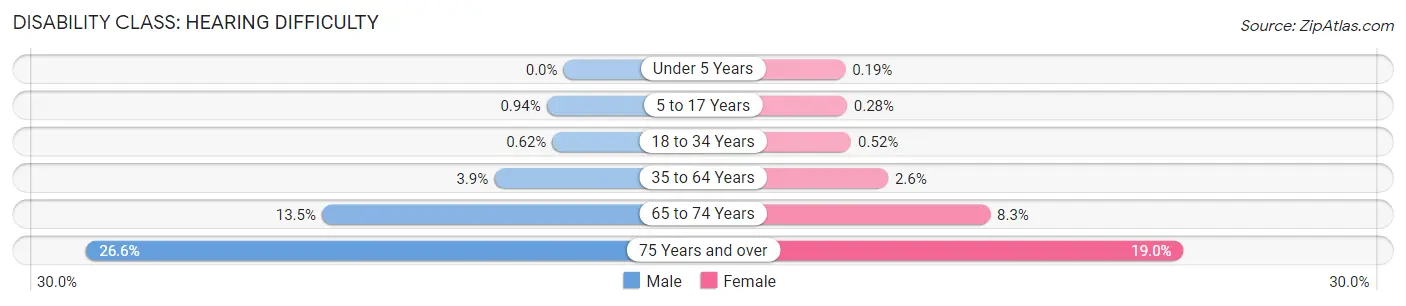
| Age Bracket | Male | Female |
| Under 5 Years | 0 (0.0%) | 7 (0.2%) |
| 5 to 17 Years | 128 (0.9%) | 35 (0.3%) |
| 18 to 34 Years | 94 (0.6%) | 76 (0.5%) |
| 35 to 64 Years | 1,093 (3.9%) | 749 (2.6%) |
| 65 to 74 Years | 1,102 (13.5%) | 771 (8.3%) |
| 75 Years and over | 1,217 (26.6%) | 1,106 (19.0%) |
Disability Class: Vision Difficulty
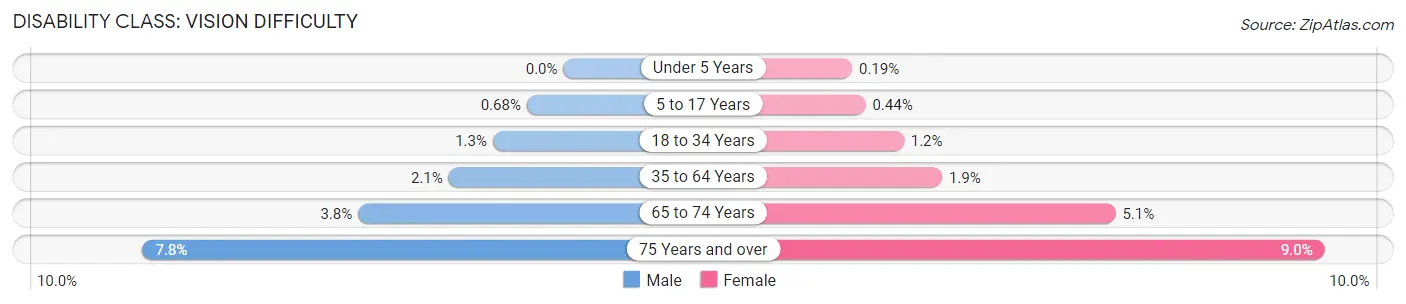
| Age Bracket | Male | Female |
| Under 5 Years | 0 (0.0%) | 7 (0.2%) |
| 5 to 17 Years | 93 (0.7%) | 55 (0.4%) |
| 18 to 34 Years | 198 (1.3%) | 167 (1.1%) |
| 35 to 64 Years | 604 (2.1%) | 544 (1.9%) |
| 65 to 74 Years | 312 (3.8%) | 474 (5.1%) |
| 75 Years and over | 358 (7.8%) | 521 (9.0%) |
Disability Class: Cognitive Difficulty
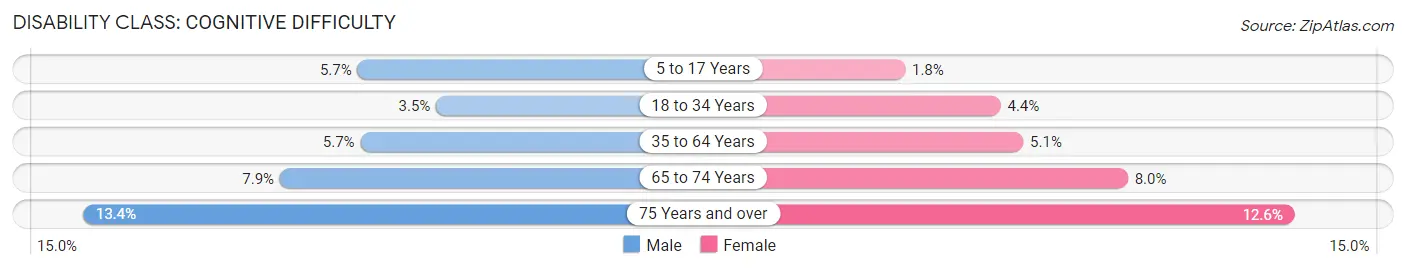
| Age Bracket | Male | Female |
| 5 to 17 Years | 779 (5.7%) | 221 (1.8%) |
| 18 to 34 Years | 535 (3.5%) | 643 (4.4%) |
| 35 to 64 Years | 1,601 (5.7%) | 1,474 (5.1%) |
| 65 to 74 Years | 646 (7.9%) | 743 (8.0%) |
| 75 Years and over | 613 (13.4%) | 733 (12.6%) |
Disability Class: Ambulatory Difficulty
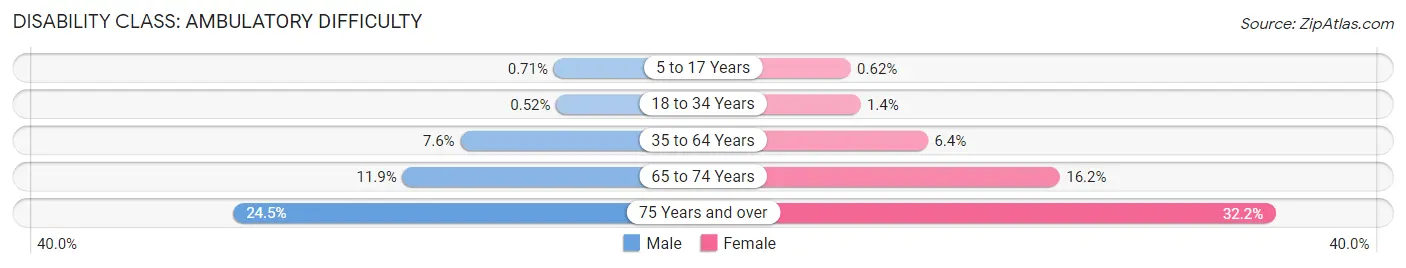
| Age Bracket | Male | Female |
| 5 to 17 Years | 97 (0.7%) | 78 (0.6%) |
| 18 to 34 Years | 78 (0.5%) | 197 (1.3%) |
| 35 to 64 Years | 2,165 (7.6%) | 1,858 (6.4%) |
| 65 to 74 Years | 978 (11.9%) | 1,508 (16.2%) |
| 75 Years and over | 1,123 (24.5%) | 1,870 (32.2%) |
Disability Class: Self-Care Difficulty
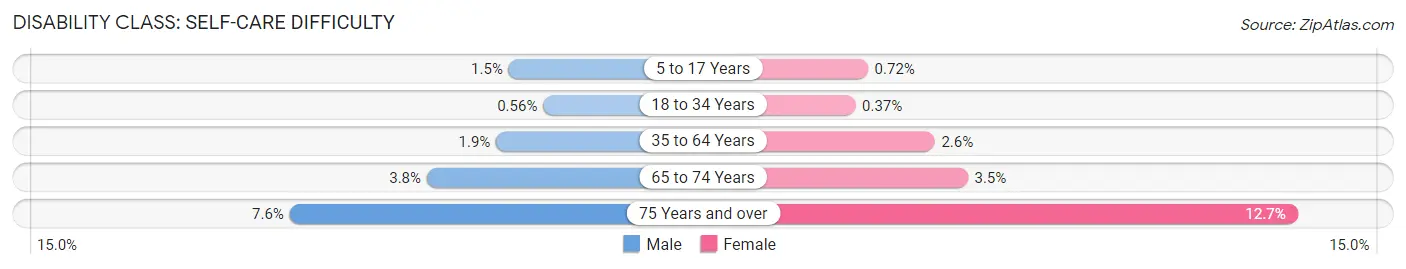
| Age Bracket | Male | Female |
| 5 to 17 Years | 207 (1.5%) | 90 (0.7%) |
| 18 to 34 Years | 84 (0.6%) | 54 (0.4%) |
| 35 to 64 Years | 530 (1.9%) | 754 (2.6%) |
| 65 to 74 Years | 311 (3.8%) | 327 (3.5%) |
| 75 Years and over | 349 (7.6%) | 738 (12.7%) |
Technology Access in Sandoval County
Computing Device Access in Sandoval County
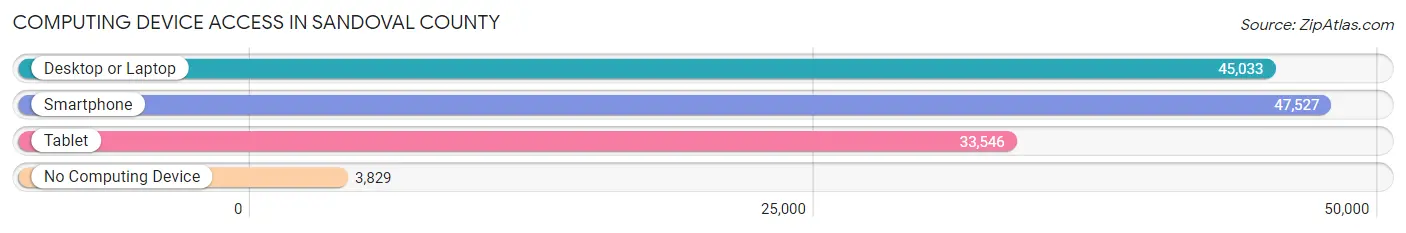
| Device Type | # Households | % Households |
| Desktop or Laptop | 45,033 | 82.0% |
| Smartphone | 47,527 | 86.6% |
| Tablet | 33,546 | 61.1% |
| No Computing Device | 3,829 | 7.0% |
| Total | 54,911 | 100.0% |
Internet Access in Sandoval County
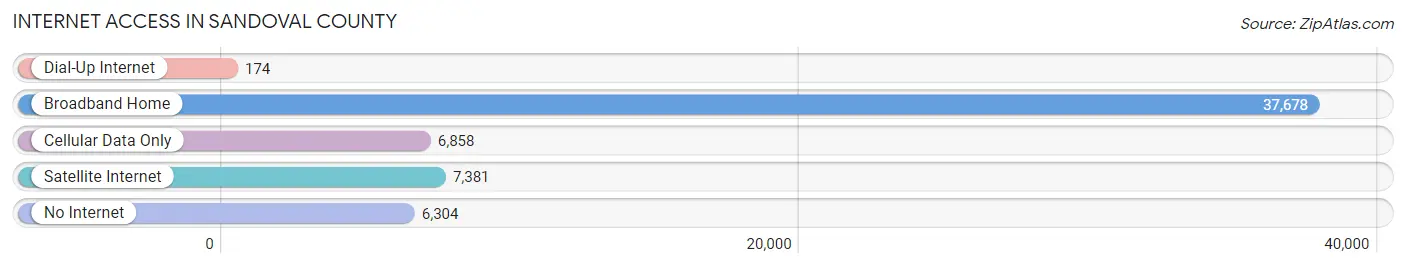
| Internet Type | # Households | % Households |
| Dial-Up Internet | 174 | 0.3% |
| Broadband Home | 37,678 | 68.6% |
| Cellular Data Only | 6,858 | 12.5% |
| Satellite Internet | 7,381 | 13.4% |
| No Internet | 6,304 | 11.5% |
| Total | 54,911 | 100.0% |
Sandoval County Summary
Sandoval County, located in the north-central part of New Mexico, is the third most populous county in the state. It is bordered by Rio Arriba County to the north, Santa Fe County to the east, Bernalillo County to the south, and Cibola and McKinley counties to the west. The county seat is Bernalillo, and the largest city is Rio Rancho.
Geography
Sandoval County covers an area of 3,716 square miles, making it the largest county in New Mexico. The county is located in the Rio Grande Valley, and is home to the Sandia Mountains, the Jemez Mountains, and the Manzano Mountains. The Rio Grande River runs through the county, and there are several lakes, including Caballo Lake, Heron Lake, and El Vado Lake. The county is mostly desert, with some grasslands and forests.
Demographics
As of the 2010 census, Sandoval County had a population of 131,561. The population was 54.3% Hispanic or Latino, 33.2% non-Hispanic White, 8.2% Native American, 2.2% Asian, and 1.9% African American. The median household income was $50,945, and the median family income was $58,837.
Economy
Sandoval County is home to several major industries, including oil and gas, agriculture, and tourism. The county is home to the San Juan Basin, which is one of the largest oil and gas fields in the United States. Agriculture is also an important part of the economy, with the county producing a variety of crops, including alfalfa, corn, and wheat. Tourism is also a major industry, with the county being home to several national parks and monuments, including the Petroglyph National Monument and the Valles Caldera National Preserve.
History
Sandoval County was established in 1903, and was named after Don Diego de Vargas, who was the governor of New Mexico from 1692 to 1697. The county was originally part of Bernalillo County, but was split off in 1903. The county seat was originally located in Bernalillo, but was moved to Rio Rancho in 1981.
Sandoval County has a long history of Native American settlement, with the Pueblo Indians living in the area for centuries. The county was also home to several Spanish settlements, including the towns of Bernalillo and Alameda. The county was also home to several military forts, including Fort Marcy and Fort Craig.
Today, Sandoval County is a rapidly growing county, with a diverse population and economy. The county is home to several major industries, including oil and gas, agriculture, and tourism. The county is also home to several national parks and monuments, making it a popular destination for tourists.
Common Questions
What is Per Capita Income in Sandoval County?
Per Capita income in Sandoval County is $36,603.
What is the Median Family Income in Sandoval County?
Median Family Income in Sandoval County is $86,062.
What is the Median Household income in Sandoval County?
Median Household Income in Sandoval County is $76,424.
What is Income or Wage Gap in Sandoval County?
Income or Wage Gap in Sandoval County is 27.4%.
Women in Sandoval County earn 72.6 cents for every dollar earned by a man.
What is Family Income Deficit in Sandoval County?
Family Income Deficit in Sandoval County is $11,112.
Families that are below poverty line in Sandoval County earn $11,112 less on average than the poverty threshold level.
What is Inequality or Gini Index in Sandoval County?
Inequality or Gini Index in Sandoval County is 0.42.
What is the Total Population of Sandoval County?
Total Population of Sandoval County is 149,460.
What is the Total Male Population of Sandoval County?
Total Male Population of Sandoval County is 74,086.
What is the Total Female Population of Sandoval County?
Total Female Population of Sandoval County is 75,374.
What is the Ratio of Males per 100 Females in Sandoval County?
There are 98.29 Males per 100 Females in Sandoval County.
What is the Ratio of Females per 100 Males in Sandoval County?
There are 101.74 Females per 100 Males in Sandoval County.
What is the Median Population Age in Sandoval County?
Median Population Age in Sandoval County is 40.8 Years.
What is the Average Family Size in Sandoval County
Average Family Size in Sandoval County is 3.2 People.
What is the Average Household Size in Sandoval County
Average Household Size in Sandoval County is 2.7 People.
How Large is the Labor Force in Sandoval County?
There are 71,355 People in the Labor Forcein in Sandoval County.
What is the Percentage of People in the Labor Force in Sandoval County?
59.4% of People are in the Labor Force in Sandoval County.
What is the Unemployment Rate in Sandoval County?
Unemployment Rate in Sandoval County is 5.9%.