Bernalillo County, NM Map & Demographics
Bernalillo County Map
Bernalillo County Overview
$36,996
PER CAPITA INCOME
$79,674
AVG FAMILY INCOME
$62,220
AVG HOUSEHOLD INCOME
19.8%
WAGE / INCOME GAP [ % ]
80.2¢/ $1
WAGE / INCOME GAP [ $ ]
$10,823
FAMILY INCOME DEFICIT
0.48
INEQUALITY / GINI INDEX
674,692
TOTAL POPULATION
332,549
MALE POPULATION
342,143
FEMALE POPULATION
97.20
MALES / 100 FEMALES
102.88
FEMALES / 100 MALES
38.6
MEDIAN AGE
3.1
AVG FAMILY SIZE
2.4
AVG HOUSEHOLD SIZE
344,181
LABOR FORCE [ PEOPLE ]
62.6%
PERCENT IN LABOR FORCE
5.4%
UNEMPLOYMENT RATE
Bernalillo County Area Codes
Income in Bernalillo County
Income Overview in Bernalillo County
Per Capita Income in Bernalillo County is $36,996, while median incomes of families and households are $79,674 and $62,220 respectively.
| Characteristic | Number | Measure |
| Per Capita Income | 674,692 | $36,996 |
| Median Family Income | 161,858 | $79,674 |
| Mean Family Income | 161,858 | $103,148 |
| Median Household Income | 281,095 | $62,220 |
| Mean Household Income | 281,095 | $85,783 |
| Income Deficit | 161,858 | $10,823 |
| Wage / Income Gap (%) | 674,692 | 19.79% |
| Wage / Income Gap ($) | 674,692 | 80.21¢ per $1 |
| Gini / Inequality Index | 674,692 | 0.48 |
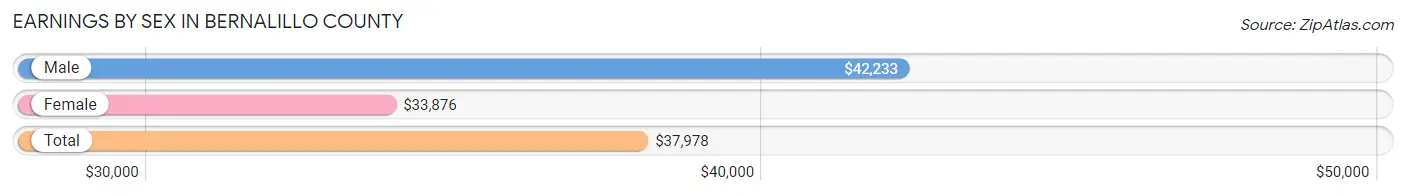
Earnings by Sex in Bernalillo County
Average Earnings in Bernalillo County are $37,978, $42,233 for men and $33,876 for women, a difference of 19.8%.
| Sex | Number | Average Earnings |
| Male | 185,292 (51.9%) | $42,233 |
| Female | 171,851 (48.1%) | $33,876 |
| Total | 357,143 (100.0%) | $37,978 |
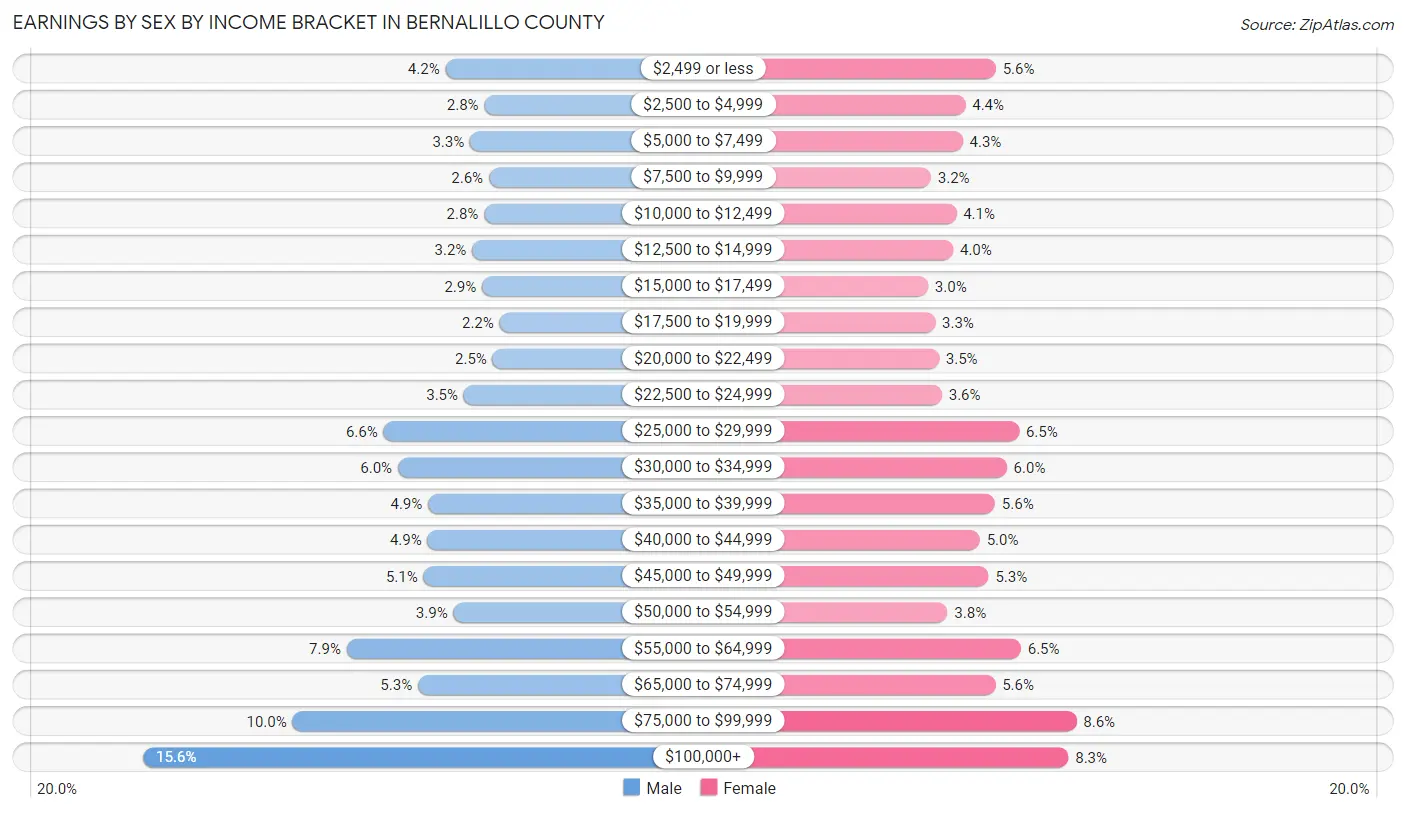
Earnings by Sex by Income Bracket in Bernalillo County
The most common earnings brackets in Bernalillo County are $100,000+ for men (28,826 | 15.6%) and $75,000 to $99,999 for women (14,787 | 8.6%).
| Income | Male | Female |
| $2,499 or less | 7,847 (4.2%) | 9,583 (5.6%) |
| $2,500 to $4,999 | 5,133 (2.8%) | 7,638 (4.4%) |
| $5,000 to $7,499 | 6,124 (3.3%) | 7,464 (4.3%) |
| $7,500 to $9,999 | 4,823 (2.6%) | 5,415 (3.2%) |
| $10,000 to $12,499 | 5,153 (2.8%) | 7,051 (4.1%) |
| $12,500 to $14,999 | 5,976 (3.2%) | 6,840 (4.0%) |
| $15,000 to $17,499 | 5,296 (2.9%) | 5,227 (3.0%) |
| $17,500 to $19,999 | 4,074 (2.2%) | 5,688 (3.3%) |
| $20,000 to $22,499 | 4,562 (2.5%) | 5,933 (3.5%) |
| $22,500 to $24,999 | 6,568 (3.5%) | 6,110 (3.6%) |
| $25,000 to $29,999 | 12,132 (6.6%) | 11,088 (6.5%) |
| $30,000 to $34,999 | 11,137 (6.0%) | 10,297 (6.0%) |
| $35,000 to $39,999 | 9,038 (4.9%) | 9,537 (5.6%) |
| $40,000 to $44,999 | 9,071 (4.9%) | 8,553 (5.0%) |
| $45,000 to $49,999 | 9,357 (5.1%) | 9,126 (5.3%) |
| $50,000 to $54,999 | 7,283 (3.9%) | 6,485 (3.8%) |
| $55,000 to $64,999 | 14,697 (7.9%) | 11,205 (6.5%) |
| $65,000 to $74,999 | 9,738 (5.3%) | 9,552 (5.6%) |
| $75,000 to $99,999 | 18,457 (10.0%) | 14,787 (8.6%) |
| $100,000+ | 28,826 (15.6%) | 14,272 (8.3%) |
| Total | 185,292 (100.0%) | 171,851 (100.0%) |
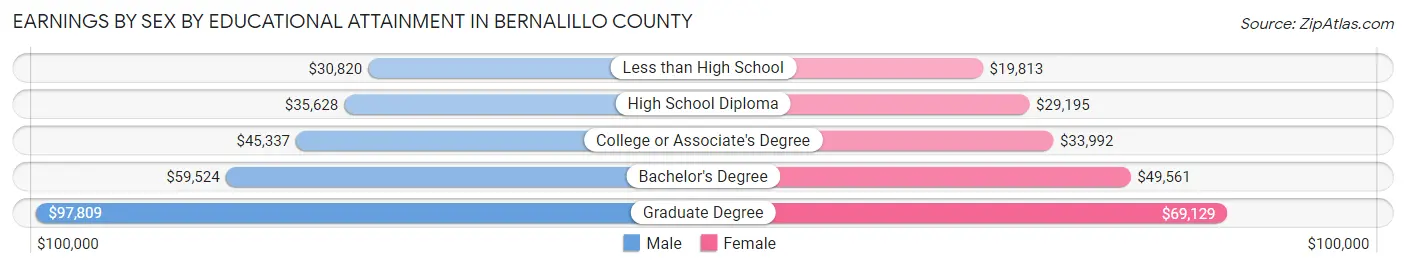
Earnings by Sex by Educational Attainment in Bernalillo County
Average earnings in Bernalillo County are $48,245 for men and $40,009 for women, a difference of 17.1%. Men with an educational attainment of graduate degree enjoy the highest average annual earnings of $97,809, while those with less than high school education earn the least with $30,820. Women with an educational attainment of graduate degree earn the most with the average annual earnings of $69,129, while those with less than high school education have the smallest earnings of $19,813.
| Educational Attainment | Male Income | Female Income |
| Less than High School | $30,820 | $19,813 |
| High School Diploma | $35,628 | $29,195 |
| College or Associate's Degree | $45,337 | $33,992 |
| Bachelor's Degree | $59,524 | $49,561 |
| Graduate Degree | $97,809 | $69,129 |
| Total | $48,245 | $40,009 |
Family Income in Bernalillo County
Family Income Brackets in Bernalillo County
According to the Bernalillo County family income data, there are 30,753 families falling into the $100,000 to $149,999 income range, which is the most common income bracket and makes up 19.0% of all families. Conversely, the $10,000 to $14,999 income bracket is the least frequent group with only 4,532 families (2.8%) belonging to this category.
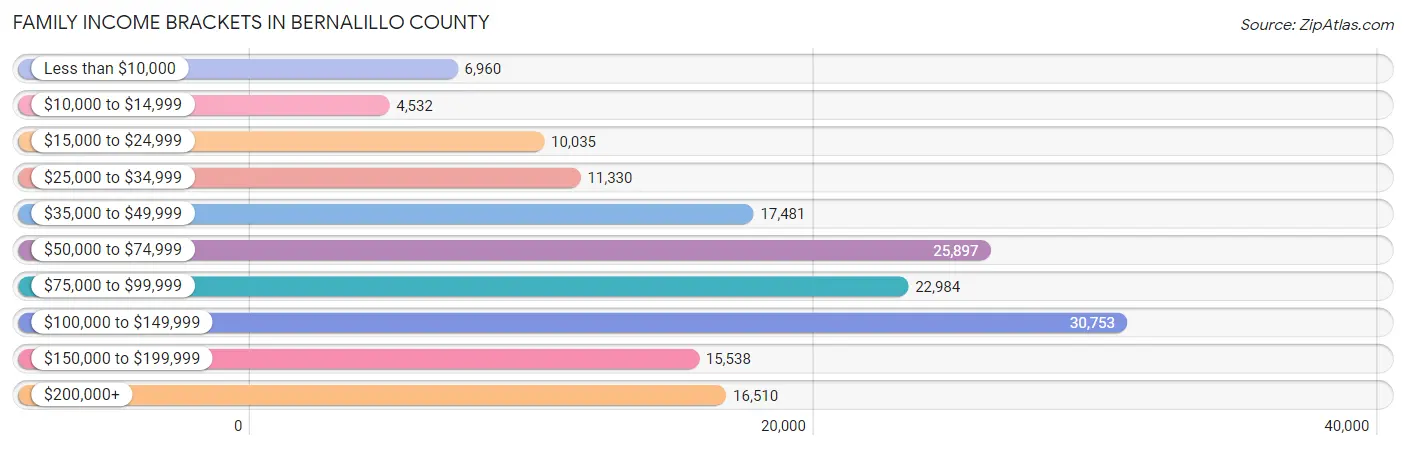
| Income Bracket | # Families | % Families |
| Less than $10,000 | 6,960 | 4.3% |
| $10,000 to $14,999 | 4,532 | 2.8% |
| $15,000 to $24,999 | 10,035 | 6.2% |
| $25,000 to $34,999 | 11,330 | 7.0% |
| $35,000 to $49,999 | 17,481 | 10.8% |
| $50,000 to $74,999 | 25,897 | 16.0% |
| $75,000 to $99,999 | 22,984 | 14.2% |
| $100,000 to $149,999 | 30,753 | 19.0% |
| $150,000 to $199,999 | 15,538 | 9.6% |
| $200,000+ | 16,510 | 10.2% |
Family Income by Famaliy Size in Bernalillo County
4-person families (26,112 | 16.1%) account for the highest median family income in Bernalillo County with $100,006 per family, while 2-person families (82,248 | 50.8%) have the highest median income of $36,994 per family member.
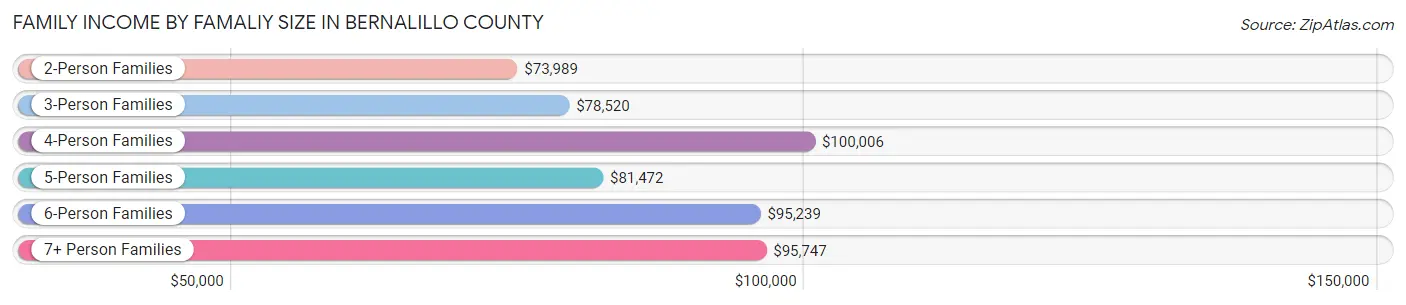
| Income Bracket | # Families | Median Income |
| 2-Person Families | 82,248 (50.8%) | $73,989 |
| 3-Person Families | 35,411 (21.9%) | $78,520 |
| 4-Person Families | 26,112 (16.1%) | $100,006 |
| 5-Person Families | 12,928 (8.0%) | $81,472 |
| 6-Person Families | 3,351 (2.1%) | $95,239 |
| 7+ Person Families | 1,808 (1.1%) | $95,747 |
| Total | 161,858 (100.0%) | $79,674 |
Family Income by Number of Earners in Bernalillo County
The median family income in Bernalillo County is $79,674, with families comprising 3+ earners (14,043) having the highest median family income of $125,380, while families with no earners (26,283) have the lowest median family income of $48,682, accounting for 8.7% and 16.2% of families, respectively.
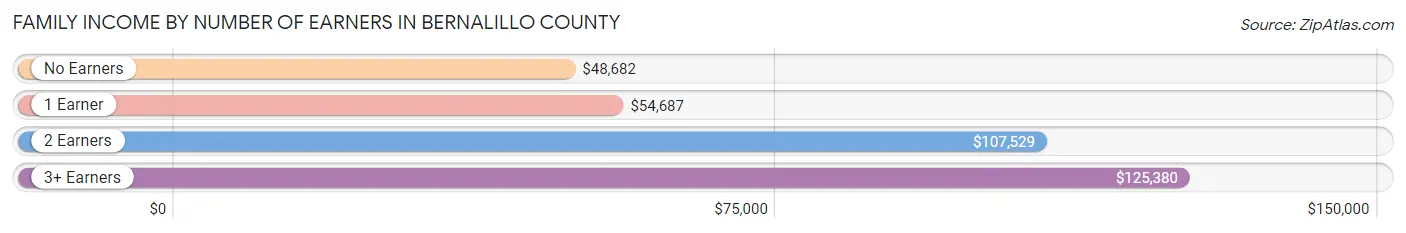
| Number of Earners | # Families | Median Income |
| No Earners | 26,283 (16.2%) | $48,682 |
| 1 Earner | 58,176 (35.9%) | $54,687 |
| 2 Earners | 63,356 (39.1%) | $107,529 |
| 3+ Earners | 14,043 (8.7%) | $125,380 |
| Total | 161,858 (100.0%) | $79,674 |
Household Income in Bernalillo County
Household Income Brackets in Bernalillo County
With 47,786 households falling in the category, the $50,000 to $74,999 income range is the most frequent in Bernalillo County, accounting for 17.0% of all households. In contrast, only 13,774 households (4.9%) fall into the $10,000 to $14,999 income bracket, making it the least populous group.
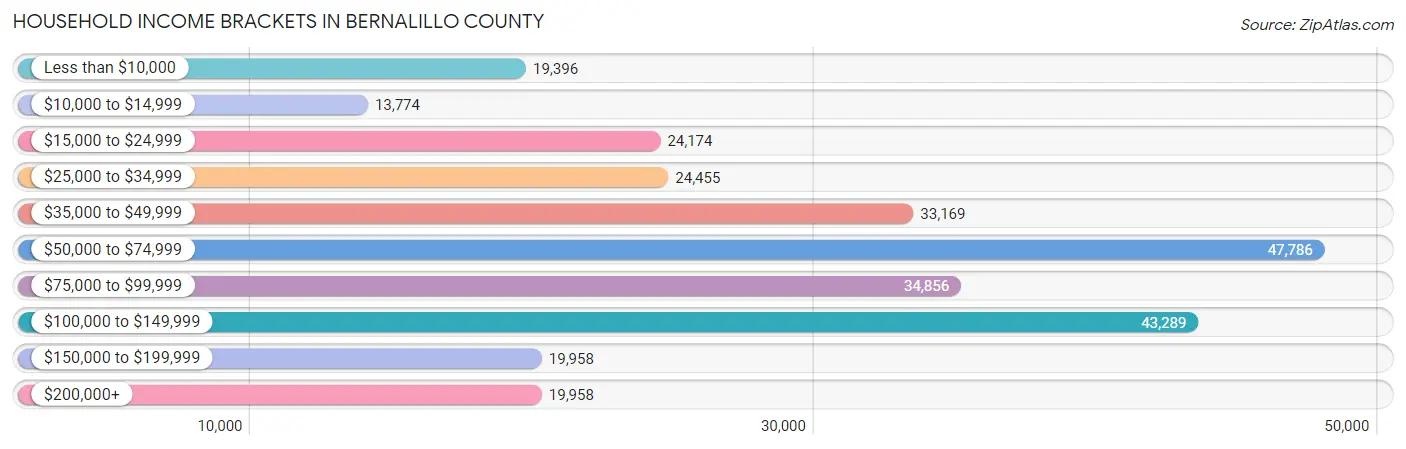
| Income Bracket | # Households | % Households |
| Less than $10,000 | 19,396 | 6.9% |
| $10,000 to $14,999 | 13,774 | 4.9% |
| $15,000 to $24,999 | 24,174 | 8.6% |
| $25,000 to $34,999 | 24,455 | 8.7% |
| $35,000 to $49,999 | 33,169 | 11.8% |
| $50,000 to $74,999 | 47,786 | 17.0% |
| $75,000 to $99,999 | 34,856 | 12.4% |
| $100,000 to $149,999 | 43,289 | 15.4% |
| $150,000 to $199,999 | 19,958 | 7.1% |
| $200,000+ | 19,958 | 7.1% |
Household Income by Householder Age in Bernalillo County
The median household income in Bernalillo County is $62,220, with the highest median household income of $72,437 found in the 45 to 64 years age bracket for the primary householder. A total of 99,062 households (35.2%) fall into this category. Meanwhile, the 15 to 24 years age bracket for the primary householder has the lowest median household income of $33,600, with 12,906 households (4.6%) in this group.
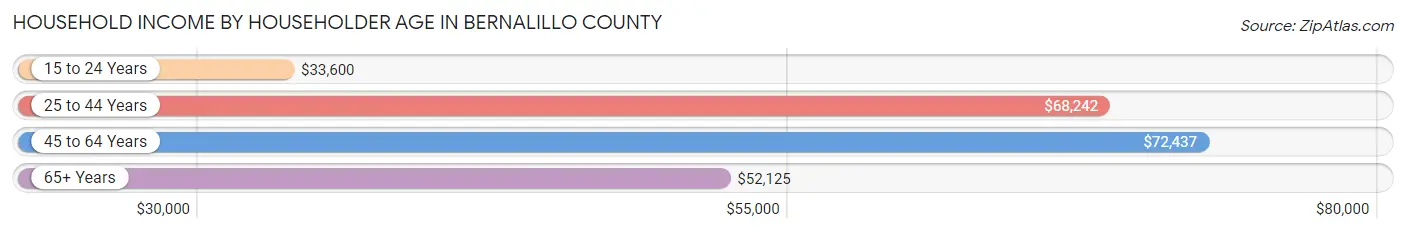
| Income Bracket | # Households | Median Income |
| 15 to 24 Years | 12,906 (4.6%) | $33,600 |
| 25 to 44 Years | 93,880 (33.4%) | $68,242 |
| 45 to 64 Years | 99,062 (35.2%) | $72,437 |
| 65+ Years | 75,247 (26.8%) | $52,125 |
| Total | 281,095 (100.0%) | $62,220 |
Poverty in Bernalillo County
Income Below Poverty by Sex and Age in Bernalillo County
With 15.5% poverty level for males and 17.3% for females among the residents of Bernalillo County, 5 year old males and under 5 year old females are the most vulnerable to poverty, with 1,002 males (26.3%) and 4,628 females (27.6%) in their respective age groups living below the poverty level.
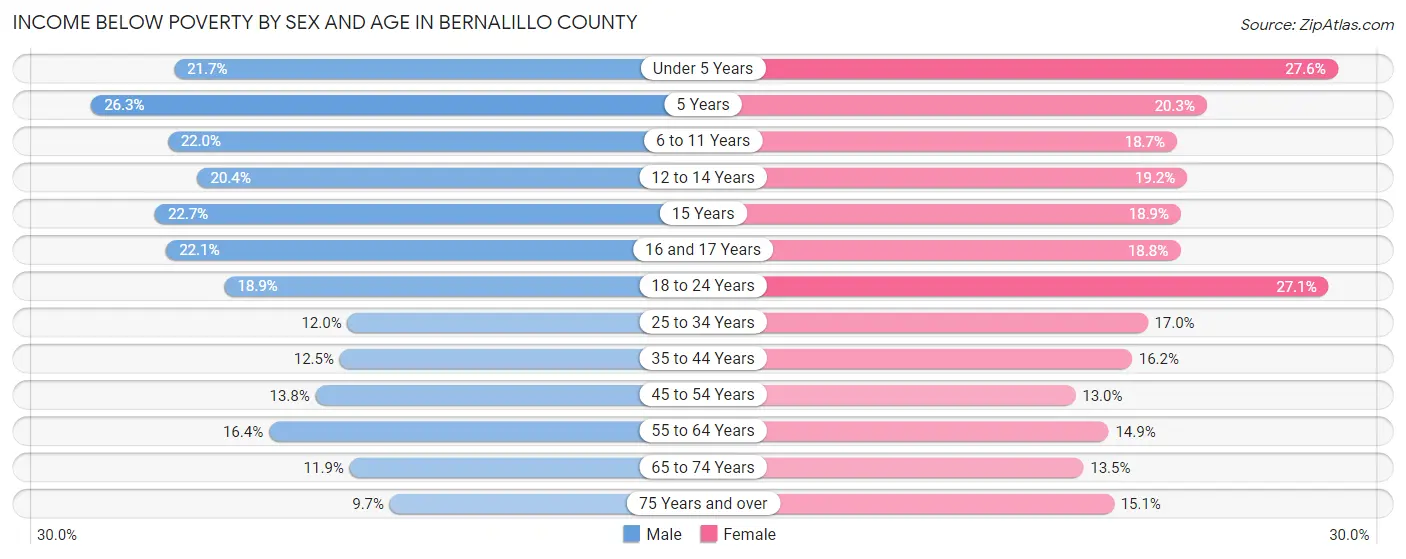
| Age Bracket | Male | Female |
| Under 5 Years | 3,805 (21.7%) | 4,628 (27.6%) |
| 5 Years | 1,002 (26.3%) | 629 (20.3%) |
| 6 to 11 Years | 5,253 (22.0%) | 4,406 (18.6%) |
| 12 to 14 Years | 2,702 (20.4%) | 2,353 (19.2%) |
| 15 Years | 987 (22.7%) | 833 (18.9%) |
| 16 and 17 Years | 1,911 (22.1%) | 1,565 (18.8%) |
| 18 to 24 Years | 5,742 (18.9%) | 8,040 (27.1%) |
| 25 to 34 Years | 5,905 (12.0%) | 8,165 (17.0%) |
| 35 to 44 Years | 5,656 (12.4%) | 7,191 (16.2%) |
| 45 to 54 Years | 5,406 (13.8%) | 5,181 (13.0%) |
| 55 to 64 Years | 6,758 (16.4%) | 6,637 (14.8%) |
| 65 to 74 Years | 3,784 (11.9%) | 4,996 (13.5%) |
| 75 Years and over | 1,815 (9.7%) | 4,003 (15.1%) |
| Total | 50,726 (15.5%) | 58,627 (17.3%) |
Income Above Poverty by Sex and Age in Bernalillo County
According to the poverty statistics in Bernalillo County, males aged 75 years and over and females aged 45 to 54 years are the age groups that are most secure financially, with 90.3% of males and 87.0% of females in these age groups living above the poverty line.
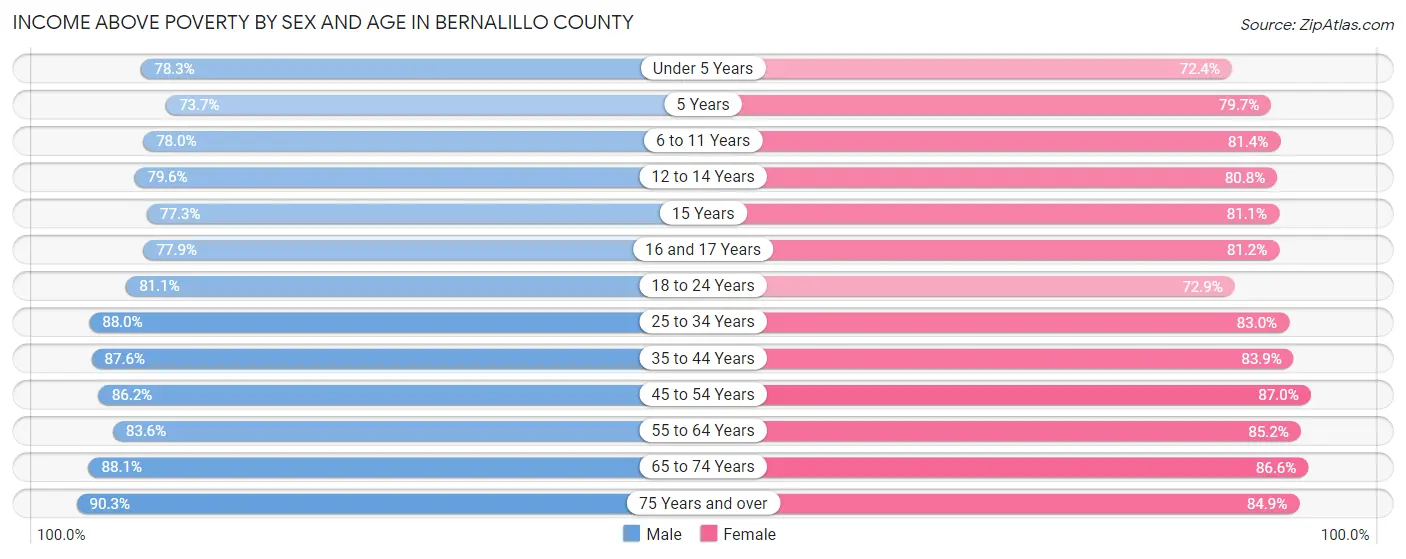
| Age Bracket | Male | Female |
| Under 5 Years | 13,754 (78.3%) | 12,138 (72.4%) |
| 5 Years | 2,809 (73.7%) | 2,466 (79.7%) |
| 6 to 11 Years | 18,596 (78.0%) | 19,219 (81.4%) |
| 12 to 14 Years | 10,564 (79.6%) | 9,886 (80.8%) |
| 15 Years | 3,353 (77.3%) | 3,580 (81.1%) |
| 16 and 17 Years | 6,734 (77.9%) | 6,745 (81.2%) |
| 18 to 24 Years | 24,688 (81.1%) | 21,633 (72.9%) |
| 25 to 34 Years | 43,234 (88.0%) | 39,802 (83.0%) |
| 35 to 44 Years | 39,757 (87.5%) | 37,333 (83.9%) |
| 45 to 54 Years | 33,771 (86.2%) | 34,662 (87.0%) |
| 55 to 64 Years | 34,479 (83.6%) | 38,063 (85.2%) |
| 65 to 74 Years | 28,011 (88.1%) | 32,143 (86.6%) |
| 75 Years and over | 16,971 (90.3%) | 22,442 (84.9%) |
| Total | 276,721 (84.5%) | 280,112 (82.7%) |
Income Below Poverty Among Married-Couple Families in Bernalillo County
The poverty statistics for married-couple families in Bernalillo County show that 6.7% or 7,141 of the total 106,245 families live below the poverty line. Families with 5 or more children have the highest poverty rate of 21.7%, comprising of 137 families. On the other hand, families with no children have the lowest poverty rate of 5.4%, which includes 3,542 families.
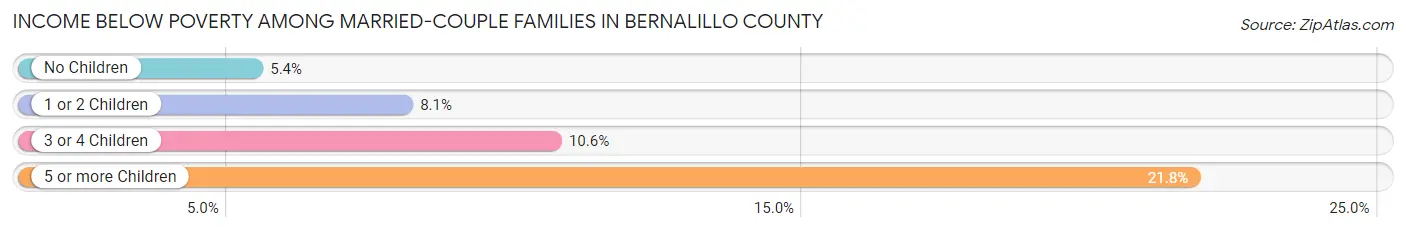
| Children | Above Poverty | Below Poverty |
| No Children | 61,542 (94.6%) | 3,542 (5.4%) |
| 1 or 2 Children | 30,226 (91.9%) | 2,647 (8.1%) |
| 3 or 4 Children | 6,843 (89.4%) | 815 (10.6%) |
| 5 or more Children | 493 (78.2%) | 137 (21.7%) |
| Total | 99,104 (93.3%) | 7,141 (6.7%) |
Income Below Poverty Among Single-Parent Households in Bernalillo County
According to the poverty data in Bernalillo County, 16.8% or 2,787 single-father households and 24.6% or 9,592 single-mother households are living below the poverty line. Among single-father households, those with 5 or more children have the highest poverty rate, with 15 households (100.0%) experiencing poverty. Likewise, among single-mother households, those with 5 or more children have the highest poverty rate, with 182 households (55.7%) falling below the poverty line.
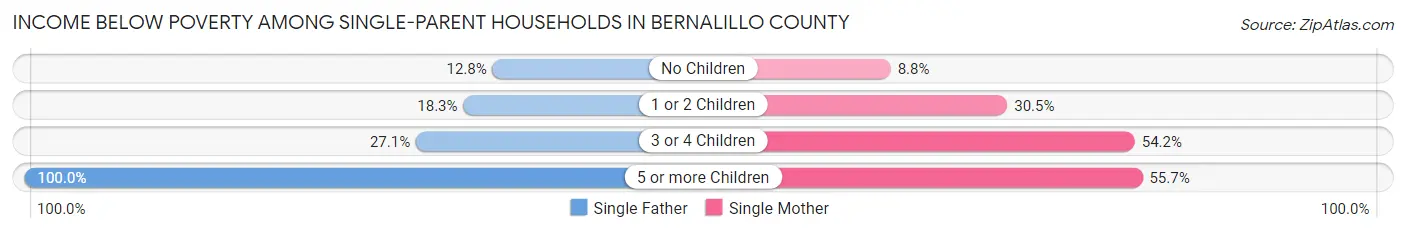
| Children | Single Father | Single Mother |
| No Children | 889 (12.8%) | 1,277 (8.8%) |
| 1 or 2 Children | 1,547 (18.3%) | 6,320 (30.5%) |
| 3 or 4 Children | 336 (27.1%) | 1,813 (54.2%) |
| 5 or more Children | 15 (100.0%) | 182 (55.7%) |
| Total | 2,787 (16.8%) | 9,592 (24.6%) |
Income Below Poverty Among Married-Couple vs Single-Parent Households in Bernalillo County
The poverty data for Bernalillo County shows that 7,141 of the married-couple family households (6.7%) and 12,379 of the single-parent households (22.3%) are living below the poverty level. Within the married-couple family households, those with 5 or more children have the highest poverty rate, with 137 households (21.7%) falling below the poverty line. Among the single-parent households, those with 5 or more children have the highest poverty rate, with 197 household (57.6%) living below poverty.
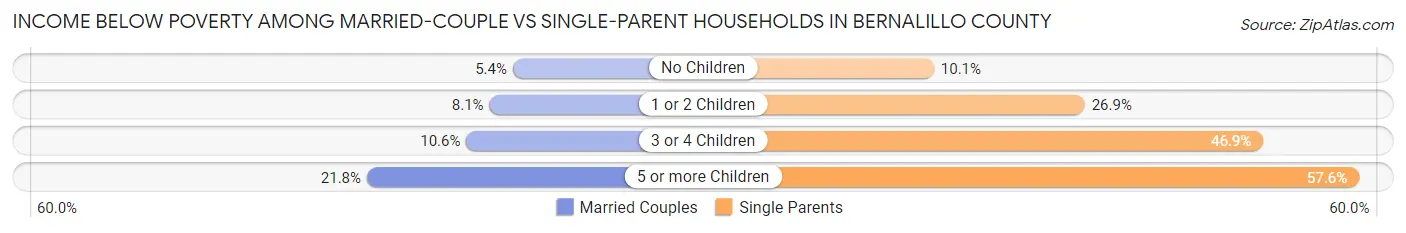
| Children | Married-Couple Families | Single-Parent Households |
| No Children | 3,542 (5.4%) | 2,166 (10.1%) |
| 1 or 2 Children | 2,647 (8.1%) | 7,867 (26.9%) |
| 3 or 4 Children | 815 (10.6%) | 2,149 (46.9%) |
| 5 or more Children | 137 (21.7%) | 197 (57.6%) |
| Total | 7,141 (6.7%) | 12,379 (22.3%) |
Race in Bernalillo County
The most populous races in Bernalillo County are White / Caucasian (406,649 | 60.3%), Hispanic or Latino (342,361 | 50.7%), and Two or more Races (125,424 | 18.6%).
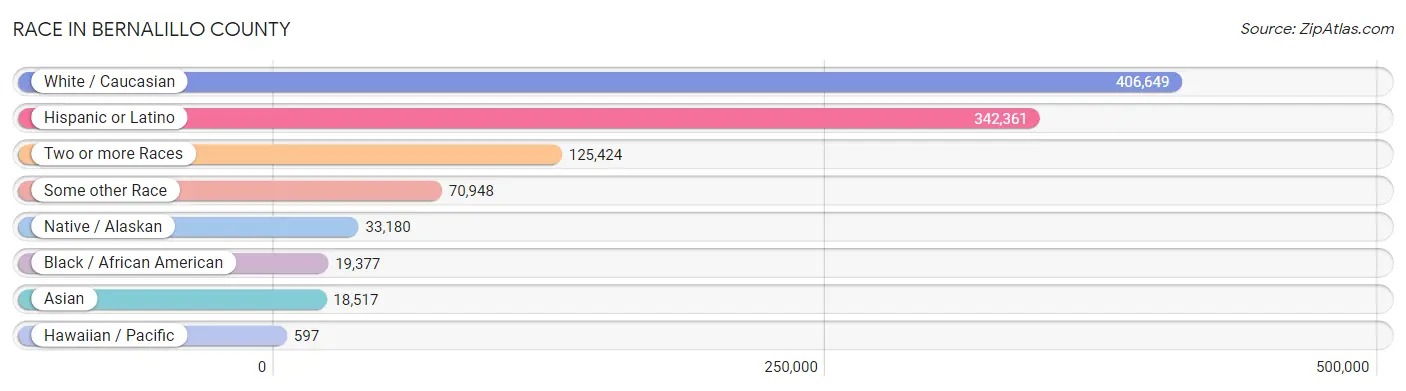
| Race | # Population | % Population |
| Asian | 18,517 | 2.7% |
| Black / African American | 19,377 | 2.9% |
| Hawaiian / Pacific | 597 | 0.1% |
| Hispanic or Latino | 342,361 | 50.7% |
| Native / Alaskan | 33,180 | 4.9% |
| White / Caucasian | 406,649 | 60.3% |
| Two or more Races | 125,424 | 18.6% |
| Some other Race | 70,948 | 10.5% |
| Total | 674,692 | 100.0% |
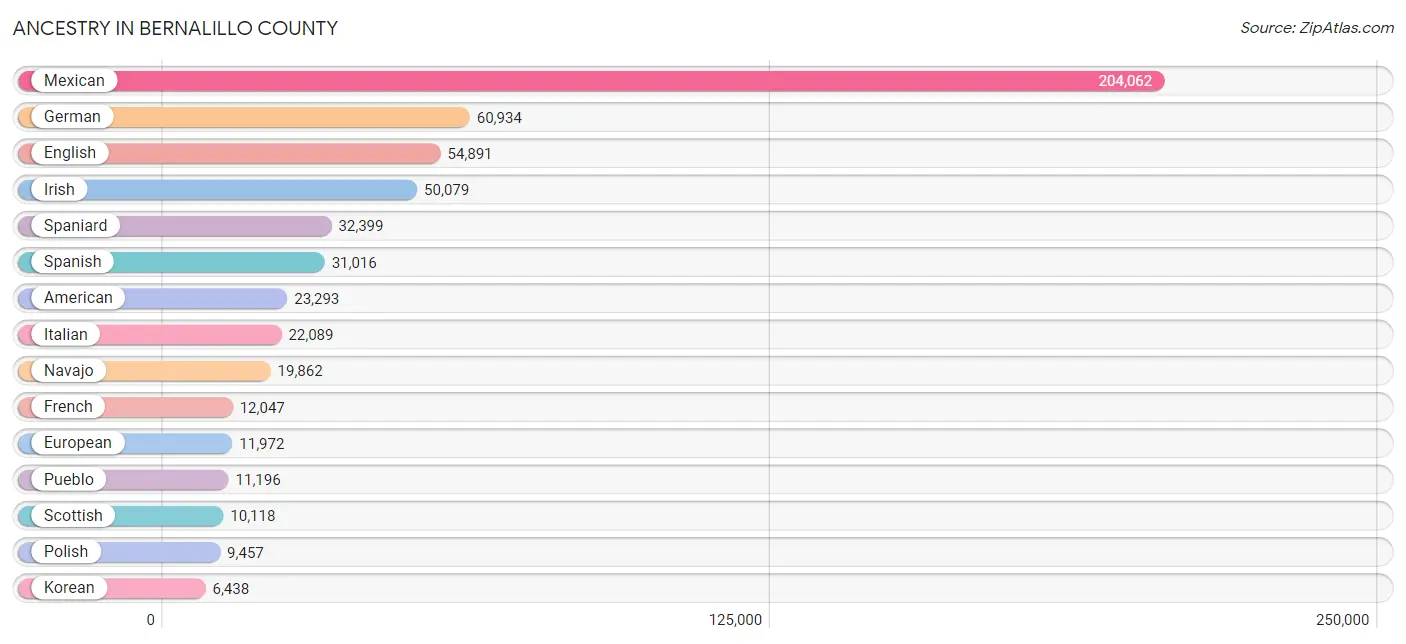
Ancestry in Bernalillo County
The most populous ancestries reported in Bernalillo County are Mexican (204,062 | 30.2%), German (60,934 | 9.0%), English (54,891 | 8.1%), Irish (50,079 | 7.4%), and Spaniard (32,399 | 4.8%), together accounting for 59.6% of all Bernalillo County residents.
| Ancestry | # Population | % Population |
| Afghan | 227 | 0.0% |
| African | 1,926 | 0.3% |
| Alaska Native | 8 | 0.0% |
| Alaskan Athabascan | 210 | 0.0% |
| Albanian | 15 | 0.0% |
| American | 23,293 | 3.5% |
| Apache | 1,901 | 0.3% |
| Arab | 3,280 | 0.5% |
| Argentinean | 334 | 0.1% |
| Armenian | 208 | 0.0% |
| Australian | 99 | 0.0% |
| Austrian | 1,056 | 0.2% |
| Basque | 392 | 0.1% |
| Belgian | 621 | 0.1% |
| Belizean | 43 | 0.0% |
| Bhutanese | 2,734 | 0.4% |
| Blackfeet | 144 | 0.0% |
| Bolivian | 380 | 0.1% |
| Brazilian | 288 | 0.0% |
| British | 4,688 | 0.7% |
| British West Indian | 54 | 0.0% |
| Bulgarian | 128 | 0.0% |
| Burmese | 2,075 | 0.3% |
| Cajun | 139 | 0.0% |
| Cambodian | 54 | 0.0% |
| Canadian | 796 | 0.1% |
| Celtic | 239 | 0.0% |
| Central American | 2,920 | 0.4% |
| Central American Indian | 746 | 0.1% |
| Cherokee | 1,880 | 0.3% |
| Cheyenne | 120 | 0.0% |
| Chickasaw | 227 | 0.0% |
| Chilean | 435 | 0.1% |
| Chinese | 6 | 0.0% |
| Chippewa | 271 | 0.0% |
| Choctaw | 490 | 0.1% |
| Colombian | 1,884 | 0.3% |
| Comanche | 487 | 0.1% |
| Costa Rican | 197 | 0.0% |
| Cree | 19 | 0.0% |
| Creek | 114 | 0.0% |
| Croatian | 358 | 0.1% |
| Crow | 23 | 0.0% |
| Cuban | 2,962 | 0.4% |
| Cypriot | 11 | 0.0% |
| Czech | 1,636 | 0.2% |
| Czechoslovakian | 366 | 0.1% |
| Danish | 2,583 | 0.4% |
| Delaware | 8 | 0.0% |
| Dominican | 845 | 0.1% |
| Dutch | 5,746 | 0.9% |
| Dutch West Indian | 36 | 0.0% |
| Eastern European | 1,484 | 0.2% |
| Ecuadorian | 732 | 0.1% |
| Egyptian | 99 | 0.0% |
| English | 54,891 | 8.1% |
| Estonian | 24 | 0.0% |
| Ethiopian | 263 | 0.0% |
| European | 11,972 | 1.8% |
| Filipino | 207 | 0.0% |
| Finnish | 657 | 0.1% |
| French | 12,047 | 1.8% |
| French Canadian | 1,672 | 0.3% |
| German | 60,934 | 9.0% |
| German Russian | 20 | 0.0% |
| Ghanaian | 82 | 0.0% |
| Greek | 1,959 | 0.3% |
| Guamanian / Chamorro | 188 | 0.0% |
| Guatemalan | 779 | 0.1% |
| Guyanese | 122 | 0.0% |
| Haitian | 170 | 0.0% |
| Honduran | 218 | 0.0% |
| Hopi | 230 | 0.0% |
| Houma | 4 | 0.0% |
| Hungarian | 1,439 | 0.2% |
| Icelander | 46 | 0.0% |
| Indian (Asian) | 4,645 | 0.7% |
| Inupiat | 91 | 0.0% |
| Iranian | 843 | 0.1% |
| Iraqi | 394 | 0.1% |
| Irish | 50,079 | 7.4% |
| Iroquois | 174 | 0.0% |
| Israeli | 111 | 0.0% |
| Italian | 22,089 | 3.3% |
| Jamaican | 376 | 0.1% |
| Japanese | 158 | 0.0% |
| Jordanian | 124 | 0.0% |
| Kenyan | 54 | 0.0% |
| Kiowa | 259 | 0.0% |
| Korean | 6,438 | 0.9% |
| Laotian | 202 | 0.0% |
| Latvian | 101 | 0.0% |
| Lebanese | 1,050 | 0.2% |
| Liberian | 129 | 0.0% |
| Lithuanian | 709 | 0.1% |
| Lumbee | 22 | 0.0% |
| Luxembourger | 55 | 0.0% |
| Malaysian | 259 | 0.0% |
| Maltese | 37 | 0.0% |
| Menominee | 7 | 0.0% |
| Mexican | 204,062 | 30.2% |
| Mexican American Indian | 2,186 | 0.3% |
| Mongolian | 4 | 0.0% |
| Moroccan | 101 | 0.0% |
| Native Hawaiian | 1,372 | 0.2% |
| Navajo | 19,862 | 2.9% |
| New Zealander | 99 | 0.0% |
| Nicaraguan | 366 | 0.1% |
| Nigerian | 619 | 0.1% |
| Northern European | 2,711 | 0.4% |
| Norwegian | 5,176 | 0.8% |
| Osage | 160 | 0.0% |
| Paiute | 12 | 0.0% |
| Pakistani | 613 | 0.1% |
| Palestinian | 376 | 0.1% |
| Panamanian | 170 | 0.0% |
| Pennsylvania German | 145 | 0.0% |
| Peruvian | 725 | 0.1% |
| Pima | 211 | 0.0% |
| Polish | 9,457 | 1.4% |
| Portuguese | 2,041 | 0.3% |
| Potawatomi | 213 | 0.0% |
| Pueblo | 11,196 | 1.7% |
| Puerto Rican | 4,555 | 0.7% |
| Romanian | 516 | 0.1% |
| Russian | 3,645 | 0.5% |
| Salvadoran | 1,059 | 0.2% |
| Samoan | 181 | 0.0% |
| Scandinavian | 2,903 | 0.4% |
| Scotch-Irish | 6,184 | 0.9% |
| Scottish | 10,118 | 1.5% |
| Seminole | 22 | 0.0% |
| Serbian | 171 | 0.0% |
| Shoshone | 10 | 0.0% |
| Sioux | 376 | 0.1% |
| Slavic | 251 | 0.0% |
| Slovak | 625 | 0.1% |
| Slovene | 230 | 0.0% |
| South African | 86 | 0.0% |
| South American | 4,986 | 0.7% |
| South American Indian | 160 | 0.0% |
| Spaniard | 32,399 | 4.8% |
| Spanish | 31,016 | 4.6% |
| Spanish American | 2,595 | 0.4% |
| Spanish American Indian | 154 | 0.0% |
| Sri Lankan | 4,621 | 0.7% |
| Subsaharan African | 4,306 | 0.6% |
| Sudanese | 29 | 0.0% |
| Swedish | 6,247 | 0.9% |
| Swiss | 1,330 | 0.2% |
| Syrian | 136 | 0.0% |
| Thai | 3,834 | 0.6% |
| Tlingit-Haida | 58 | 0.0% |
| Tohono O'Odham | 60 | 0.0% |
| Trinidadian and Tobagonian | 16 | 0.0% |
| Tsimshian | 30 | 0.0% |
| Turkish | 333 | 0.1% |
| U.S. Virgin Islander | 16 | 0.0% |
| Ugandan | 31 | 0.0% |
| Ukrainian | 1,473 | 0.2% |
| Ute | 36 | 0.0% |
| Venezuelan | 451 | 0.1% |
| Vietnamese | 581 | 0.1% |
| Welsh | 3,582 | 0.5% |
| West Indian | 196 | 0.0% |
| Yaqui | 98 | 0.0% |
| Yugoslavian | 189 | 0.0% |
| Yuman | 4 | 0.0% |
| Zimbabwean | 75 | 0.0% | View All 169 Rows |
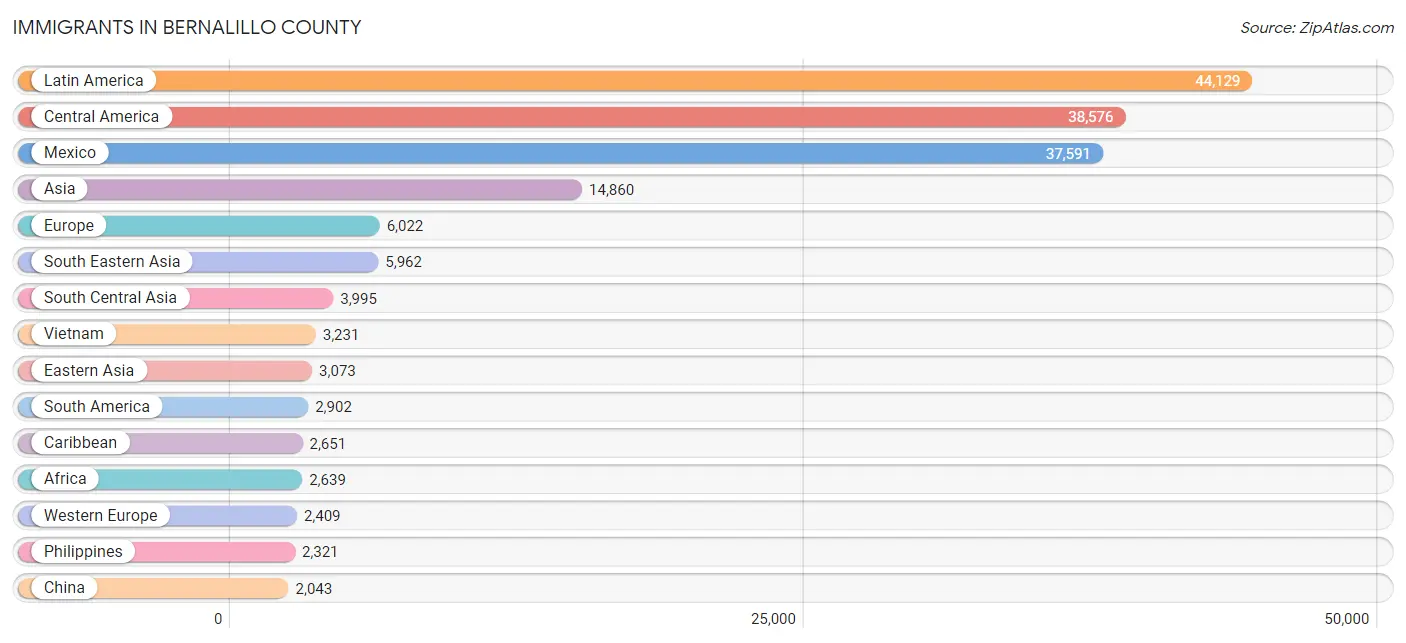
Immigrants in Bernalillo County
The most numerous immigrant groups reported in Bernalillo County came from Latin America (44,129 | 6.5%), Central America (38,576 | 5.7%), Mexico (37,591 | 5.6%), Asia (14,860 | 2.2%), and Europe (6,022 | 0.9%), together accounting for 20.9% of all Bernalillo County residents.
| Immigration Origin | # Population | % Population |
| Afghanistan | 299 | 0.0% |
| Africa | 2,639 | 0.4% |
| Argentina | 187 | 0.0% |
| Armenia | 26 | 0.0% |
| Asia | 14,860 | 2.2% |
| Australia | 163 | 0.0% |
| Austria | 72 | 0.0% |
| Bangladesh | 247 | 0.0% |
| Belarus | 2 | 0.0% |
| Belgium | 79 | 0.0% |
| Bolivia | 196 | 0.0% |
| Bosnia and Herzegovina | 11 | 0.0% |
| Brazil | 243 | 0.0% |
| Bulgaria | 82 | 0.0% |
| Cambodia | 33 | 0.0% |
| Cameroon | 106 | 0.0% |
| Canada | 794 | 0.1% |
| Caribbean | 2,651 | 0.4% |
| Central America | 38,576 | 5.7% |
| Chile | 73 | 0.0% |
| China | 2,043 | 0.3% |
| Colombia | 879 | 0.1% |
| Congo | 51 | 0.0% |
| Costa Rica | 41 | 0.0% |
| Cuba | 1,967 | 0.3% |
| Czechoslovakia | 49 | 0.0% |
| Denmark | 5 | 0.0% |
| Dominica | 40 | 0.0% |
| Dominican Republic | 281 | 0.0% |
| Eastern Africa | 889 | 0.1% |
| Eastern Asia | 3,073 | 0.5% |
| Eastern Europe | 1,296 | 0.2% |
| Ecuador | 408 | 0.1% |
| Egypt | 52 | 0.0% |
| El Salvador | 281 | 0.0% |
| England | 532 | 0.1% |
| Eritrea | 15 | 0.0% |
| Ethiopia | 147 | 0.0% |
| Europe | 6,022 | 0.9% |
| Fiji | 14 | 0.0% |
| France | 390 | 0.1% |
| Germany | 1,696 | 0.3% |
| Ghana | 78 | 0.0% |
| Greece | 307 | 0.1% |
| Guatemala | 389 | 0.1% |
| Guyana | 114 | 0.0% |
| Haiti | 56 | 0.0% |
| Honduras | 104 | 0.0% |
| Hong Kong | 102 | 0.0% |
| Hungary | 30 | 0.0% |
| India | 1,805 | 0.3% |
| Indonesia | 78 | 0.0% |
| Iran | 683 | 0.1% |
| Iraq | 539 | 0.1% |
| Ireland | 49 | 0.0% |
| Israel | 210 | 0.0% |
| Italy | 233 | 0.0% |
| Jamaica | 75 | 0.0% |
| Japan | 447 | 0.1% |
| Jordan | 319 | 0.1% |
| Kazakhstan | 48 | 0.0% |
| Kenya | 153 | 0.0% |
| Korea | 583 | 0.1% |
| Kuwait | 22 | 0.0% |
| Laos | 68 | 0.0% |
| Latin America | 44,129 | 6.5% |
| Lebanon | 196 | 0.0% |
| Liberia | 110 | 0.0% |
| Malaysia | 53 | 0.0% |
| Mexico | 37,591 | 5.6% |
| Micronesia | 141 | 0.0% |
| Middle Africa | 636 | 0.1% |
| Moldova | 22 | 0.0% |
| Morocco | 101 | 0.0% |
| Nepal | 313 | 0.1% |
| Netherlands | 90 | 0.0% |
| Nicaragua | 92 | 0.0% |
| Nigeria | 533 | 0.1% |
| Northern Africa | 207 | 0.0% |
| Northern Europe | 1,424 | 0.2% |
| Norway | 28 | 0.0% |
| Oceania | 432 | 0.1% |
| Pakistan | 389 | 0.1% |
| Panama | 72 | 0.0% |
| Peru | 517 | 0.1% |
| Philippines | 2,321 | 0.3% |
| Poland | 60 | 0.0% |
| Portugal | 32 | 0.0% |
| Romania | 240 | 0.0% |
| Russia | 446 | 0.1% |
| Saudi Arabia | 67 | 0.0% |
| Scotland | 79 | 0.0% |
| Serbia | 13 | 0.0% |
| Singapore | 4 | 0.0% |
| South Africa | 162 | 0.0% |
| South America | 2,902 | 0.4% |
| South Central Asia | 3,995 | 0.6% |
| South Eastern Asia | 5,962 | 0.9% |
| Southern Europe | 893 | 0.1% |
| Spain | 321 | 0.1% |
| Sri Lanka | 39 | 0.0% |
| St. Vincent and the Grenadines | 9 | 0.0% |
| Sudan | 29 | 0.0% |
| Sweden | 51 | 0.0% |
| Switzerland | 62 | 0.0% |
| Syria | 122 | 0.0% |
| Taiwan | 391 | 0.1% |
| Thailand | 174 | 0.0% |
| Trinidad and Tobago | 52 | 0.0% |
| Turkey | 219 | 0.0% |
| Uganda | 23 | 0.0% |
| Ukraine | 287 | 0.0% |
| Uruguay | 8 | 0.0% |
| Uzbekistan | 121 | 0.0% |
| Venezuela | 263 | 0.0% |
| Vietnam | 3,231 | 0.5% |
| West Indies | 100 | 0.0% |
| Western Africa | 737 | 0.1% |
| Western Asia | 1,743 | 0.3% |
| Western Europe | 2,409 | 0.4% |
| Zaire | 459 | 0.1% |
| Zimbabwe | 35 | 0.0% | View All 122 Rows |
Sex and Age in Bernalillo County
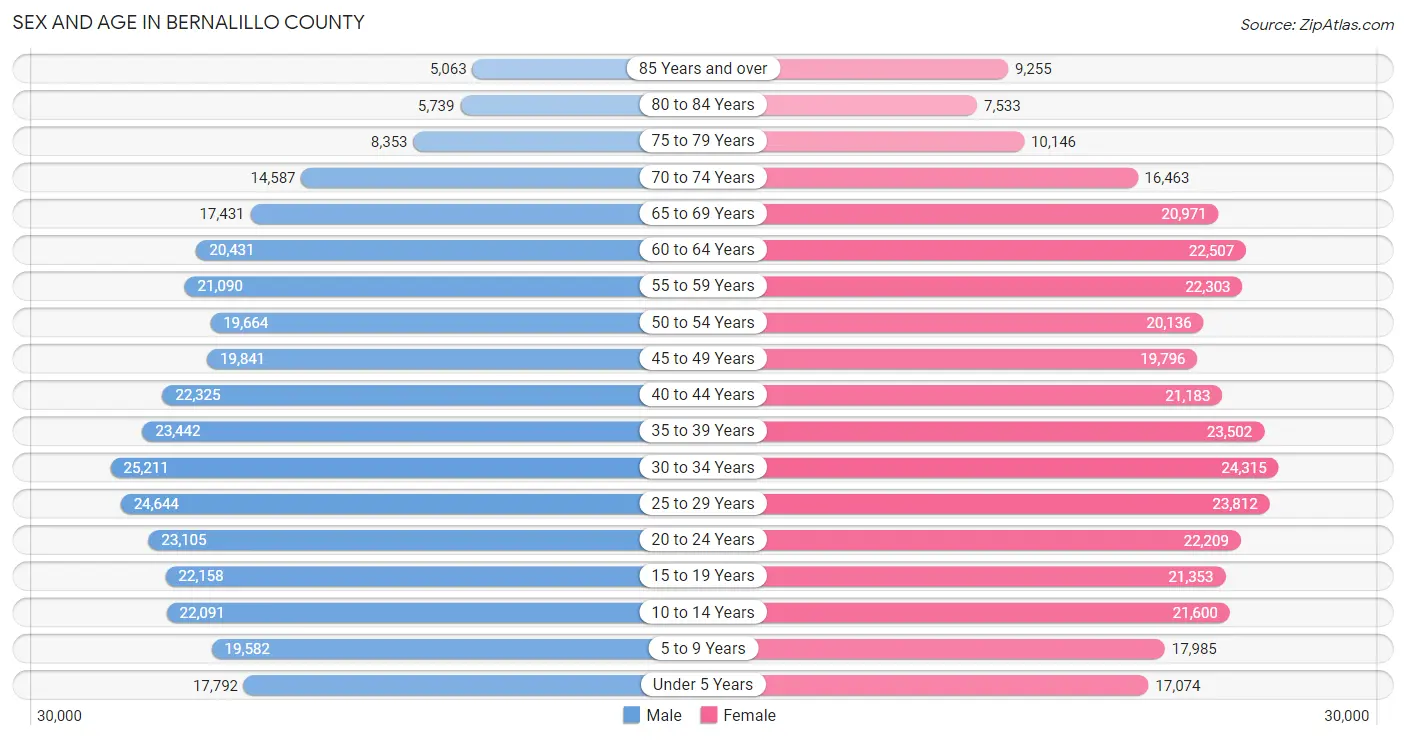
Sex and Age in Bernalillo County
The most populous age groups in Bernalillo County are 30 to 34 Years (25,211 | 7.6%) for men and 30 to 34 Years (24,315 | 7.1%) for women.
| Age Bracket | Male | Female |
| Under 5 Years | 17,792 (5.3%) | 17,074 (5.0%) |
| 5 to 9 Years | 19,582 (5.9%) | 17,985 (5.3%) |
| 10 to 14 Years | 22,091 (6.6%) | 21,600 (6.3%) |
| 15 to 19 Years | 22,158 (6.7%) | 21,353 (6.2%) |
| 20 to 24 Years | 23,105 (7.0%) | 22,209 (6.5%) |
| 25 to 29 Years | 24,644 (7.4%) | 23,812 (7.0%) |
| 30 to 34 Years | 25,211 (7.6%) | 24,315 (7.1%) |
| 35 to 39 Years | 23,442 (7.0%) | 23,502 (6.9%) |
| 40 to 44 Years | 22,325 (6.7%) | 21,183 (6.2%) |
| 45 to 49 Years | 19,841 (6.0%) | 19,796 (5.8%) |
| 50 to 54 Years | 19,664 (5.9%) | 20,136 (5.9%) |
| 55 to 59 Years | 21,090 (6.3%) | 22,303 (6.5%) |
| 60 to 64 Years | 20,431 (6.1%) | 22,507 (6.6%) |
| 65 to 69 Years | 17,431 (5.2%) | 20,971 (6.1%) |
| 70 to 74 Years | 14,587 (4.4%) | 16,463 (4.8%) |
| 75 to 79 Years | 8,353 (2.5%) | 10,146 (3.0%) |
| 80 to 84 Years | 5,739 (1.7%) | 7,533 (2.2%) |
| 85 Years and over | 5,063 (1.5%) | 9,255 (2.7%) |
| Total | 332,549 (100.0%) | 342,143 (100.0%) |
Families and Households in Bernalillo County
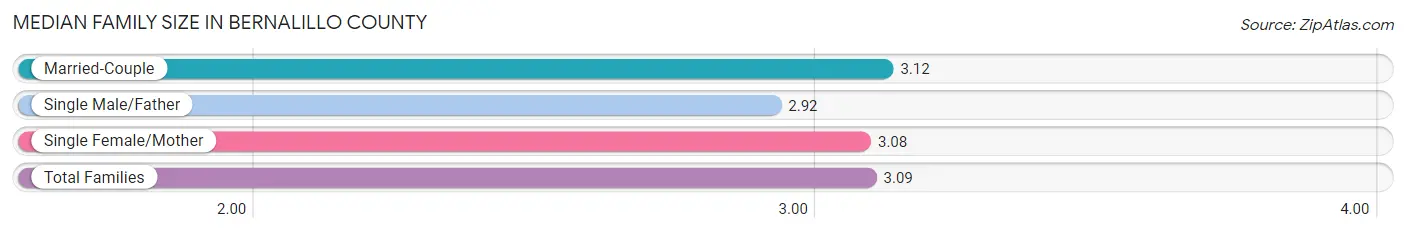
Median Family Size in Bernalillo County
The median family size in Bernalillo County is 3.09 persons per family, with married-couple families (106,245 | 65.6%) accounting for the largest median family size of 3.12 persons per family. On the other hand, single male/father families (16,642 | 10.3%) represent the smallest median family size with 2.92 persons per family.
| Family Type | # Families | Family Size |
| Married-Couple | 106,245 (65.6%) | 3.12 |
| Single Male/Father | 16,642 (10.3%) | 2.92 |
| Single Female/Mother | 38,971 (24.1%) | 3.08 |
| Total Families | 161,858 (100.0%) | 3.09 |
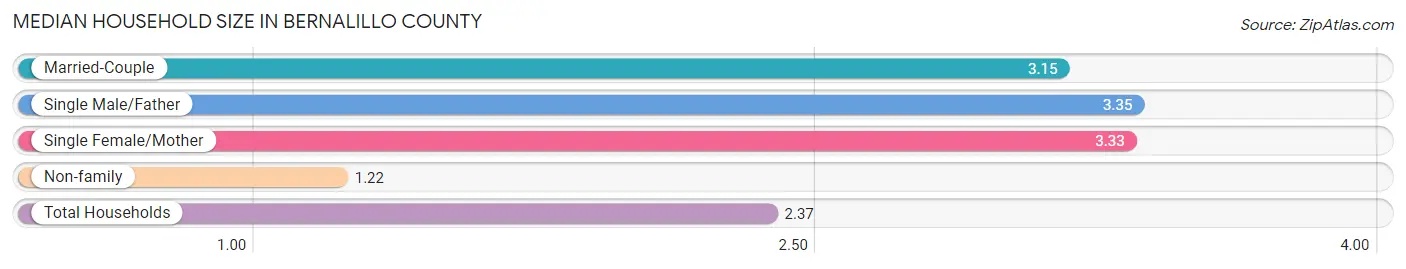
Median Household Size in Bernalillo County
The median household size in Bernalillo County is 2.37 persons per household, with single male/father households (16,642 | 5.9%) accounting for the largest median household size of 3.35 persons per household. non-family households (119,237 | 42.4%) represent the smallest median household size with 1.22 persons per household.
| Household Type | # Households | Household Size |
| Married-Couple | 106,245 (37.8%) | 3.15 |
| Single Male/Father | 16,642 (5.9%) | 3.35 |
| Single Female/Mother | 38,971 (13.9%) | 3.33 |
| Non-family | 119,237 (42.4%) | 1.22 |
| Total Households | 281,095 (100.0%) | 2.37 |
Household Size by Marriage Status in Bernalillo County
Out of a total of 281,095 households in Bernalillo County, 161,858 (57.6%) are family households, while 119,237 (42.4%) are nonfamily households. The most numerous type of family households are 2-person households, comprising 74,878, and the most common type of nonfamily households are 1-person households, comprising 98,980.
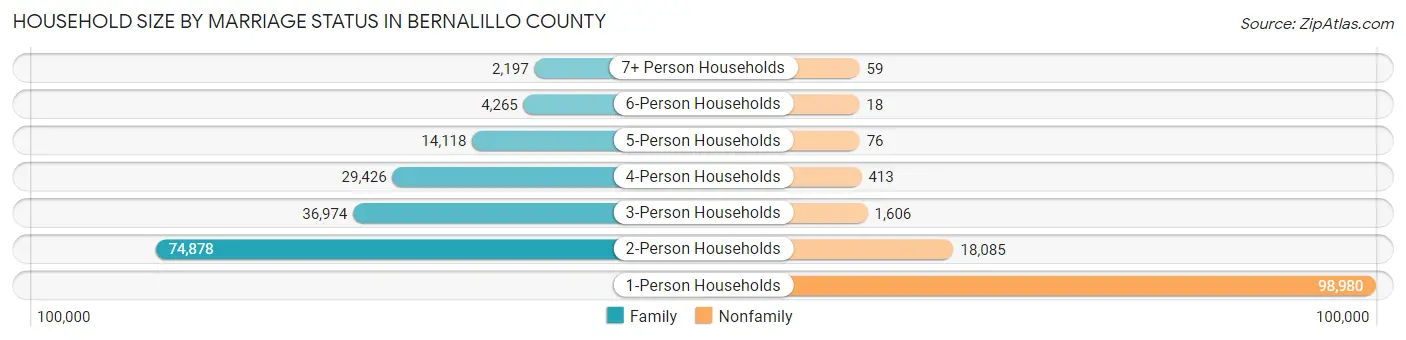
| Household Size | Family Households | Nonfamily Households |
| 1-Person Households | - | 98,980 (35.2%) |
| 2-Person Households | 74,878 (26.6%) | 18,085 (6.4%) |
| 3-Person Households | 36,974 (13.2%) | 1,606 (0.6%) |
| 4-Person Households | 29,426 (10.5%) | 413 (0.2%) |
| 5-Person Households | 14,118 (5.0%) | 76 (0.0%) |
| 6-Person Households | 4,265 (1.5%) | 18 (0.0%) |
| 7+ Person Households | 2,197 (0.8%) | 59 (0.0%) |
| Total | 161,858 (57.6%) | 119,237 (42.4%) |
Female Fertility in Bernalillo County
Fertility by Age in Bernalillo County
Average fertility rate in Bernalillo County is 53.0 births per 1,000 women. Women in the age bracket of 20 to 34 years have the highest fertility rate with 85.0 births per 1,000 women. Women in the age bracket of 20 to 34 years acount for 70.2% of all women with births.
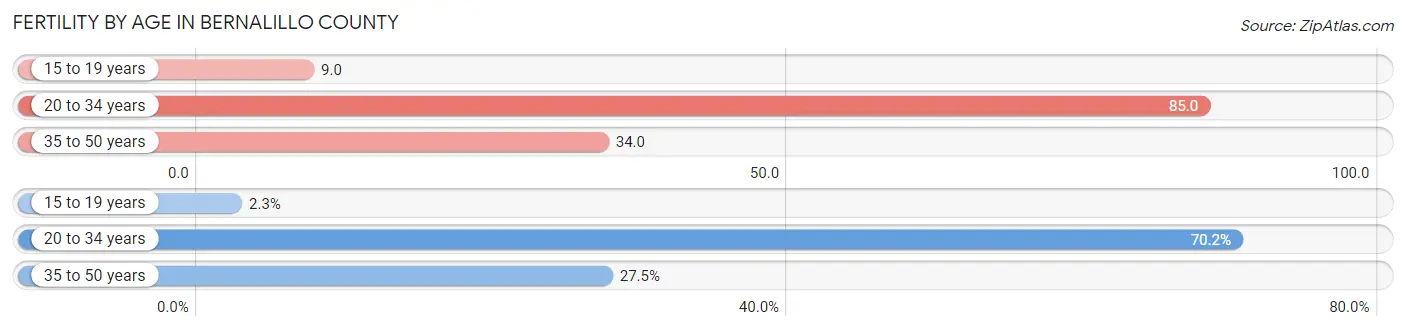
| Age Bracket | Women with Births | Births / 1,000 Women |
| 15 to 19 years | 196 (2.3%) | 9.0 |
| 20 to 34 years | 5,962 (70.2%) | 85.0 |
| 35 to 50 years | 2,332 (27.5%) | 34.0 |
| Total | 8,490 (100.0%) | 53.0 |
Fertility by Age by Marriage Status in Bernalillo County
57.0% of women with births (8,490) in Bernalillo County are married. The highest percentage of unmarried women with births falls into 15 to 19 years age bracket with 68.9% of them unmarried at the time of birth, while the lowest percentage of unmarried women with births belong to 35 to 50 years age bracket with 26.4% of them unmarried.
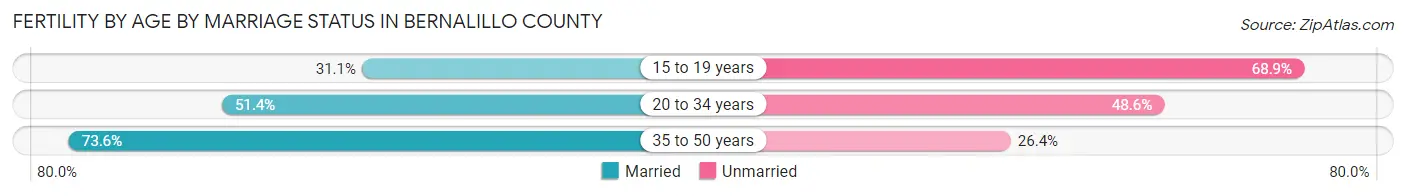
| Age Bracket | Married | Unmarried |
| 15 to 19 years | 61 (31.1%) | 135 (68.9%) |
| 20 to 34 years | 3,064 (51.4%) | 2,898 (48.6%) |
| 35 to 50 years | 1,716 (73.6%) | 616 (26.4%) |
| Total | 4,839 (57.0%) | 3,651 (43.0%) |
Fertility by Education in Bernalillo County
Average fertility rate in Bernalillo County is 53.0 births per 1,000 women. Women with the education attainment of bachelor's degree have the highest fertility rate of 67.0 births per 1,000 women, while women with the education attainment of less than high school have the lowest fertility at 38.0 births per 1,000 women. Women with the education attainment of college or associate's degree represent 31.1% of all women with births.
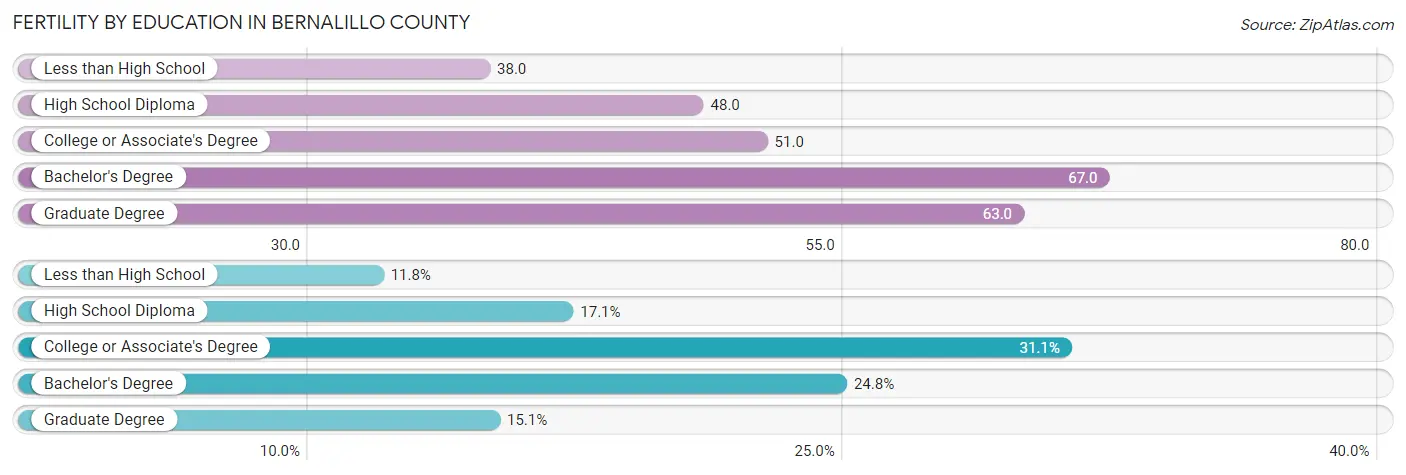
| Educational Attainment | Women with Births | Births / 1,000 Women |
| Less than High School | 1,003 (11.8%) | 38.0 |
| High School Diploma | 1,455 (17.1%) | 48.0 |
| College or Associate's Degree | 2,644 (31.1%) | 51.0 |
| Bachelor's Degree | 2,108 (24.8%) | 67.0 |
| Graduate Degree | 1,280 (15.1%) | 63.0 |
| Total | 8,490 (100.0%) | 53.0 |
Fertility by Education by Marriage Status in Bernalillo County
43.0% of women with births in Bernalillo County are unmarried. Women with the educational attainment of graduate degree are most likely to be married with 98.8% of them married at childbirth, while women with the educational attainment of less than high school are least likely to be married with 67.1% of them unmarried at childbirth.
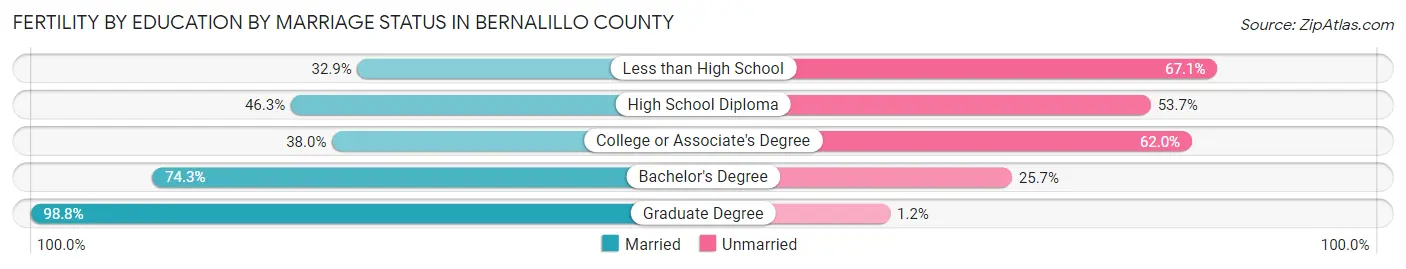
| Educational Attainment | Married | Unmarried |
| Less than High School | 330 (32.9%) | 673 (67.1%) |
| High School Diploma | 674 (46.3%) | 781 (53.7%) |
| College or Associate's Degree | 1,005 (38.0%) | 1,639 (62.0%) |
| Bachelor's Degree | 1,566 (74.3%) | 542 (25.7%) |
| Graduate Degree | 1,265 (98.8%) | 15 (1.2%) |
| Total | 4,839 (57.0%) | 3,651 (43.0%) |
Employment Characteristics in Bernalillo County
Employment by Class of Employer in Bernalillo County
Among the 320,828 employed individuals in Bernalillo County, private company employees (188,990 | 58.9%), not-for-profit organizations (30,076 | 9.4%), and federal government employees (25,858 | 8.1%) make up the most common classes of employment.
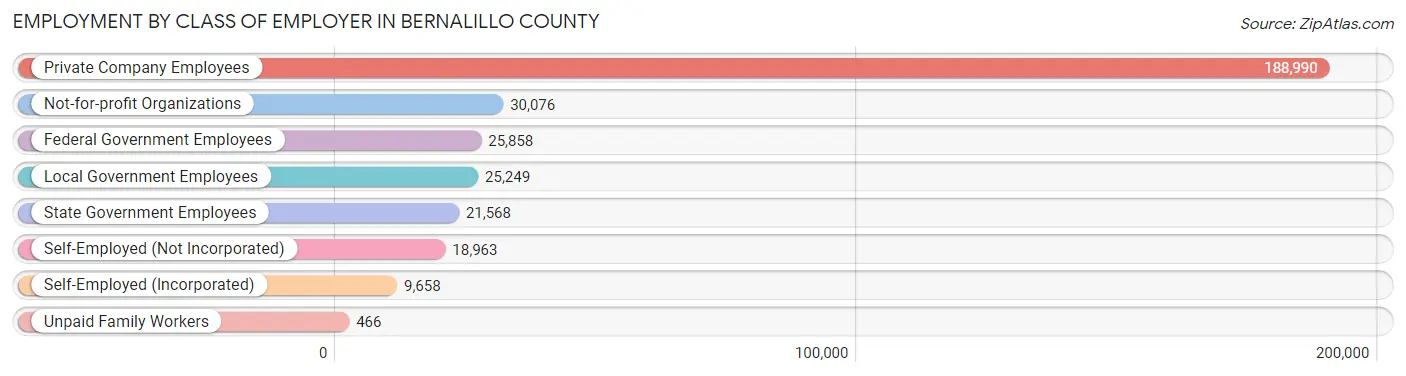
| Employer Class | # Employees | % Employees |
| Private Company Employees | 188,990 | 58.9% |
| Self-Employed (Incorporated) | 9,658 | 3.0% |
| Self-Employed (Not Incorporated) | 18,963 | 5.9% |
| Not-for-profit Organizations | 30,076 | 9.4% |
| Local Government Employees | 25,249 | 7.9% |
| State Government Employees | 21,568 | 6.7% |
| Federal Government Employees | 25,858 | 8.1% |
| Unpaid Family Workers | 466 | 0.2% |
| Total | 320,828 | 100.0% |
Employment Status by Age in Bernalillo County
According to the labor force statistics for Bernalillo County, out of the total population over 16 years of age (549,810), 62.6% or 344,181 individuals are in the labor force, with 5.4% or 18,586 of them unemployed. The age group with the highest labor force participation rate is 30 to 34 years, with 85.1% or 42,147 individuals in the labor force. Within the labor force, the 16 to 19 years age range has the highest percentage of unemployed individuals, with 12.6% or 1,835 of them being unemployed.
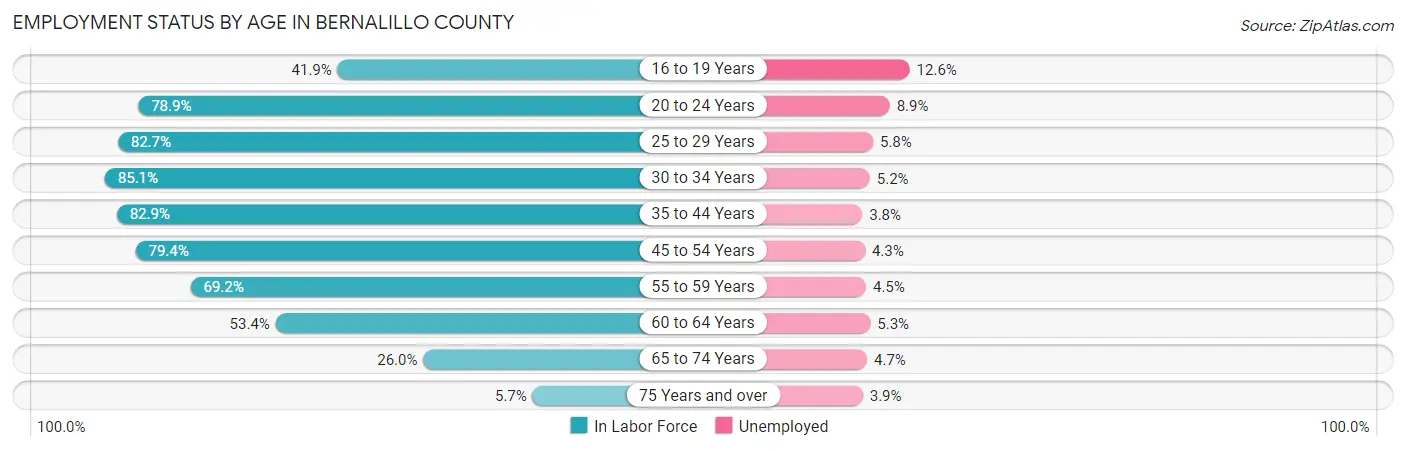
| Age Bracket | In Labor Force | Unemployed |
| 16 to 19 Years | 14,562 (41.9%) | 1,835 (12.6%) |
| 20 to 24 Years | 35,753 (78.9%) | 3,182 (8.9%) |
| 25 to 29 Years | 40,073 (82.7%) | 2,324 (5.8%) |
| 30 to 34 Years | 42,147 (85.1%) | 2,192 (5.2%) |
| 35 to 44 Years | 74,985 (82.9%) | 2,849 (3.8%) |
| 45 to 54 Years | 63,073 (79.4%) | 2,712 (4.3%) |
| 55 to 59 Years | 30,028 (69.2%) | 1,351 (4.5%) |
| 60 to 64 Years | 22,929 (53.4%) | 1,215 (5.3%) |
| 65 to 74 Years | 18,058 (26.0%) | 849 (4.7%) |
| 75 Years and over | 2,627 (5.7%) | 102 (3.9%) |
| Total | 344,181 (62.6%) | 18,586 (5.4%) |
Employment Status by Educational Attainment in Bernalillo County
According to labor force statistics for Bernalillo County, 77.2% of individuals (273,444) out of the total population between 25 and 64 years of age (354,202) are in the labor force, with 4.6% or 12,578 of them being unemployed. The group with the highest labor force participation rate are those with the educational attainment of bachelor's degree or higher, with 86.1% or 110,606 individuals in the labor force. Within the labor force, individuals with less than high school education have the highest percentage of unemployment, with 7.6% or 1,555 of them being unemployed.
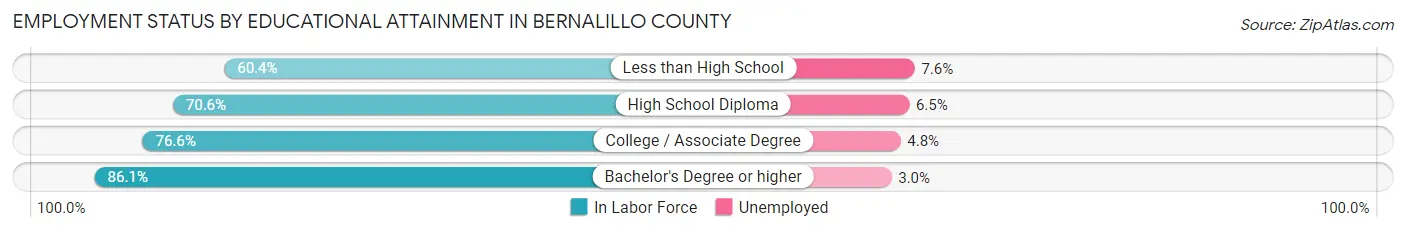
| Educational Attainment | In Labor Force | Unemployed |
| Less than High School | 20,464 (60.4%) | 2,575 (7.6%) |
| High School Diploma | 55,650 (70.6%) | 5,124 (6.5%) |
| College / Associate Degree | 86,586 (76.6%) | 5,426 (4.8%) |
| Bachelor's Degree or higher | 110,606 (86.1%) | 3,854 (3.0%) |
| Total | 273,444 (77.2%) | 16,293 (4.6%) |
Employment Occupations by Sex in Bernalillo County
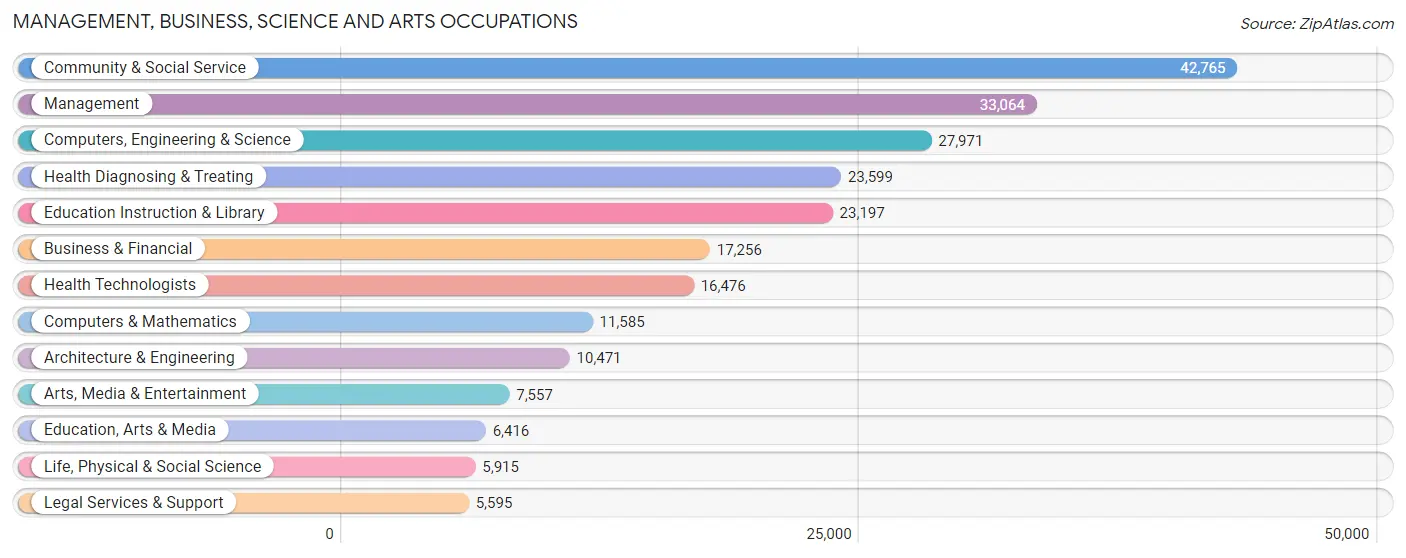
Management, Business, Science and Arts Occupations
The most common Management, Business, Science and Arts occupations in Bernalillo County are Community & Social Service (42,765 | 13.3%), Management (33,064 | 10.3%), Computers, Engineering & Science (27,971 | 8.7%), Health Diagnosing & Treating (23,599 | 7.3%), and Education Instruction & Library (23,197 | 7.2%).
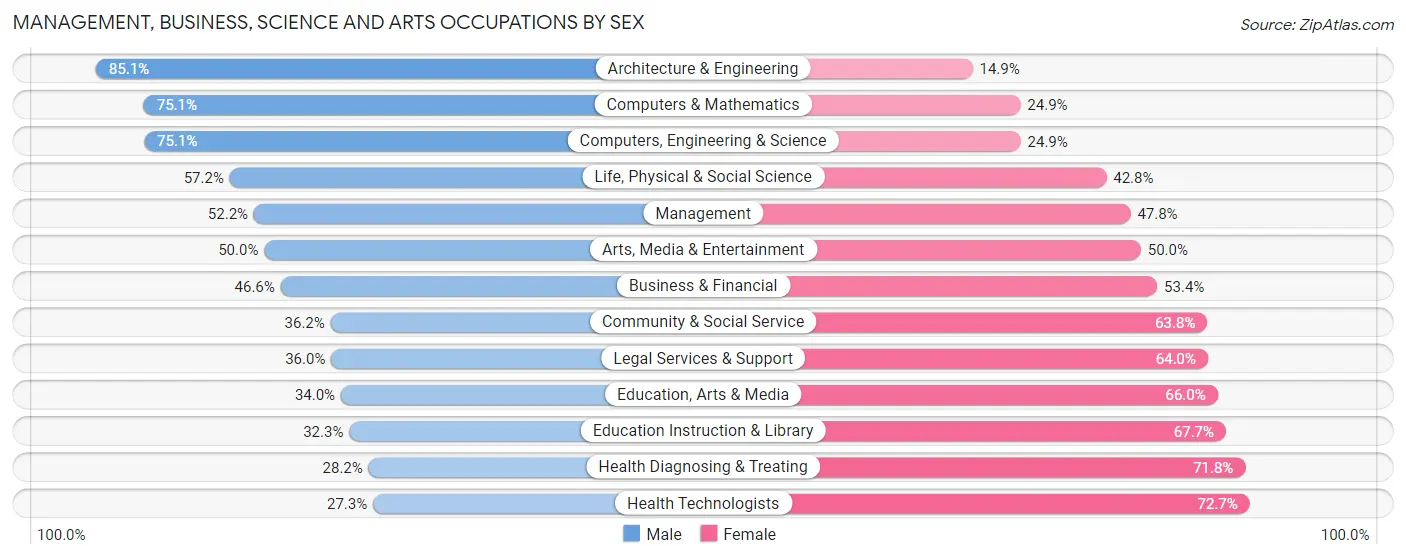
Management, Business, Science and Arts Occupations by Sex
Within the Management, Business, Science and Arts occupations in Bernalillo County, the most male-oriented occupations are Architecture & Engineering (85.1%), Computers & Mathematics (75.1%), and Computers, Engineering & Science (75.1%), while the most female-oriented occupations are Health Technologists (72.7%), Health Diagnosing & Treating (71.8%), and Education Instruction & Library (67.7%).
| Occupation | Male | Female |
| Management | 17,249 (52.2%) | 15,815 (47.8%) |
| Business & Financial | 8,041 (46.6%) | 9,215 (53.4%) |
| Computers, Engineering & Science | 21,001 (75.1%) | 6,970 (24.9%) |
| Computers & Mathematics | 8,704 (75.1%) | 2,881 (24.9%) |
| Architecture & Engineering | 8,913 (85.1%) | 1,558 (14.9%) |
| Life, Physical & Social Science | 3,384 (57.2%) | 2,531 (42.8%) |
| Community & Social Service | 15,464 (36.2%) | 27,301 (63.8%) |
| Education, Arts & Media | 2,182 (34.0%) | 4,234 (66.0%) |
| Legal Services & Support | 2,016 (36.0%) | 3,579 (64.0%) |
| Education Instruction & Library | 7,487 (32.3%) | 15,710 (67.7%) |
| Arts, Media & Entertainment | 3,779 (50.0%) | 3,778 (50.0%) |
| Health Diagnosing & Treating | 6,664 (28.2%) | 16,935 (71.8%) |
| Health Technologists | 4,501 (27.3%) | 11,975 (72.7%) |
| Total (Category) | 68,419 (47.3%) | 76,236 (52.7%) |
| Total (Overall) | 166,810 (51.8%) | 155,135 (48.2%) |
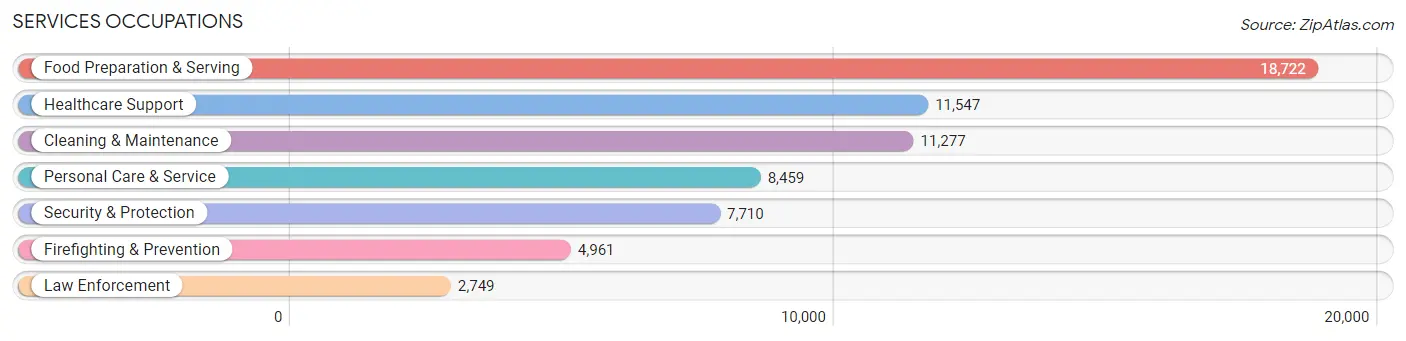
Services Occupations
The most common Services occupations in Bernalillo County are Food Preparation & Serving (18,722 | 5.8%), Healthcare Support (11,547 | 3.6%), Cleaning & Maintenance (11,277 | 3.5%), Personal Care & Service (8,459 | 2.6%), and Security & Protection (7,710 | 2.4%).
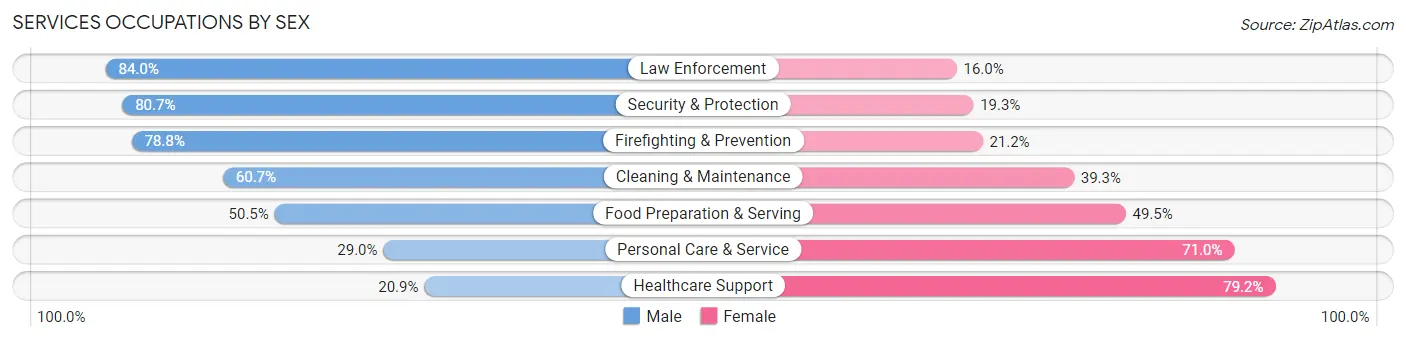
Services Occupations by Sex
Within the Services occupations in Bernalillo County, the most male-oriented occupations are Law Enforcement (84.0%), Security & Protection (80.7%), and Firefighting & Prevention (78.8%), while the most female-oriented occupations are Healthcare Support (79.1%), Personal Care & Service (71.0%), and Food Preparation & Serving (49.5%).
| Occupation | Male | Female |
| Healthcare Support | 2,408 (20.8%) | 9,139 (79.1%) |
| Security & Protection | 6,219 (80.7%) | 1,491 (19.3%) |
| Firefighting & Prevention | 3,911 (78.8%) | 1,050 (21.2%) |
| Law Enforcement | 2,308 (84.0%) | 441 (16.0%) |
| Food Preparation & Serving | 9,452 (50.5%) | 9,270 (49.5%) |
| Cleaning & Maintenance | 6,850 (60.7%) | 4,427 (39.3%) |
| Personal Care & Service | 2,450 (29.0%) | 6,009 (71.0%) |
| Total (Category) | 27,379 (47.4%) | 30,336 (52.6%) |
| Total (Overall) | 166,810 (51.8%) | 155,135 (48.2%) |
Sales and Office Occupations
The most common Sales and Office occupations in Bernalillo County are Office & Administration (35,807 | 11.1%), and Sales & Related (29,704 | 9.2%).

Sales and Office Occupations by Sex
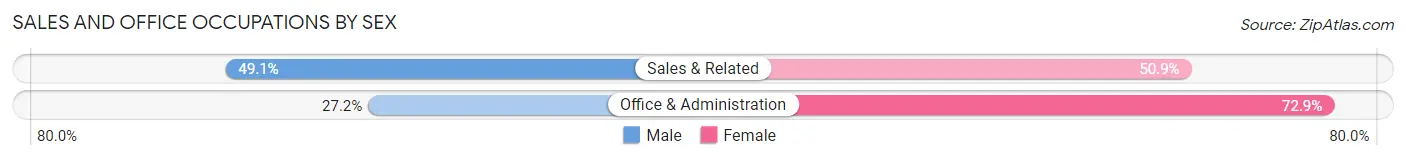
| Occupation | Male | Female |
| Sales & Related | 14,585 (49.1%) | 15,119 (50.9%) |
| Office & Administration | 9,721 (27.2%) | 26,086 (72.9%) |
| Total (Category) | 24,306 (37.1%) | 41,205 (62.9%) |
| Total (Overall) | 166,810 (51.8%) | 155,135 (48.2%) |
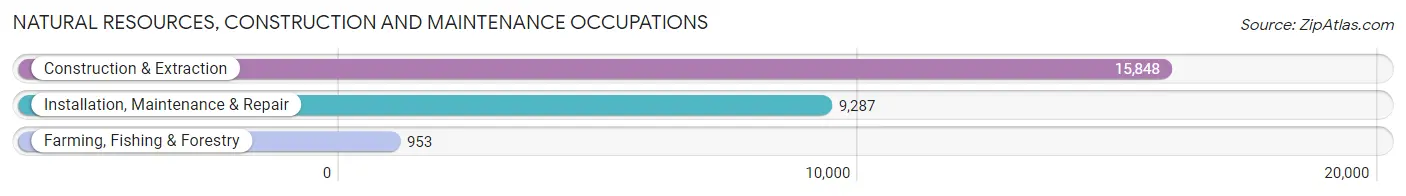
Natural Resources, Construction and Maintenance Occupations
The most common Natural Resources, Construction and Maintenance occupations in Bernalillo County are Construction & Extraction (15,848 | 4.9%), Installation, Maintenance & Repair (9,287 | 2.9%), and Farming, Fishing & Forestry (953 | 0.3%).
Natural Resources, Construction and Maintenance Occupations by Sex
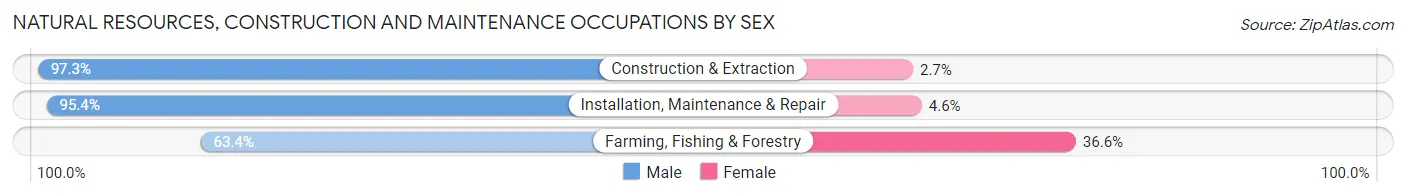
| Occupation | Male | Female |
| Farming, Fishing & Forestry | 604 (63.4%) | 349 (36.6%) |
| Construction & Extraction | 15,416 (97.3%) | 432 (2.7%) |
| Installation, Maintenance & Repair | 8,863 (95.4%) | 424 (4.6%) |
| Total (Category) | 24,883 (95.4%) | 1,205 (4.6%) |
| Total (Overall) | 166,810 (51.8%) | 155,135 (48.2%) |
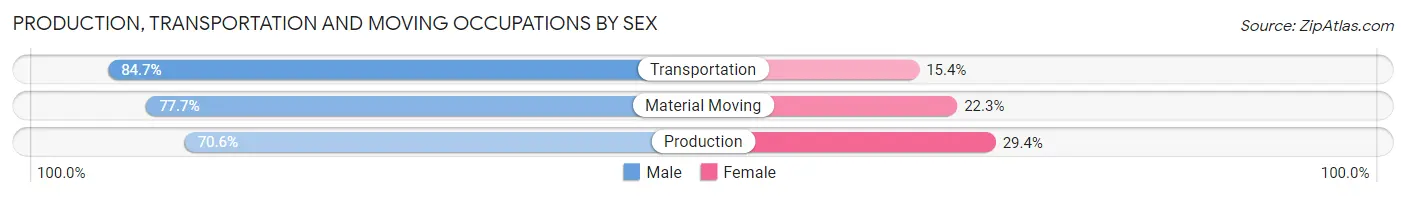
Production, Transportation and Moving Occupations
The most common Production, Transportation and Moving occupations in Bernalillo County are Transportation (10,115 | 3.1%), Material Moving (9,197 | 2.9%), and Production (8,664 | 2.7%).
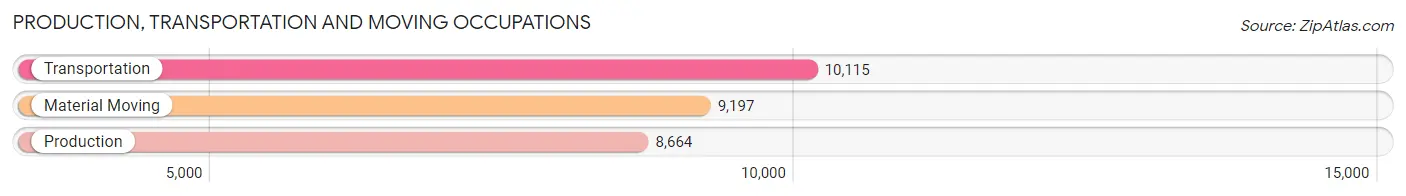
Production, Transportation and Moving Occupations by Sex
| Occupation | Male | Female |
| Production | 6,118 (70.6%) | 2,546 (29.4%) |
| Transportation | 8,562 (84.7%) | 1,553 (15.3%) |
| Material Moving | 7,143 (77.7%) | 2,054 (22.3%) |
| Total (Category) | 21,823 (78.0%) | 6,153 (22.0%) |
| Total (Overall) | 166,810 (51.8%) | 155,135 (48.2%) |
Employment Industries by Sex in Bernalillo County
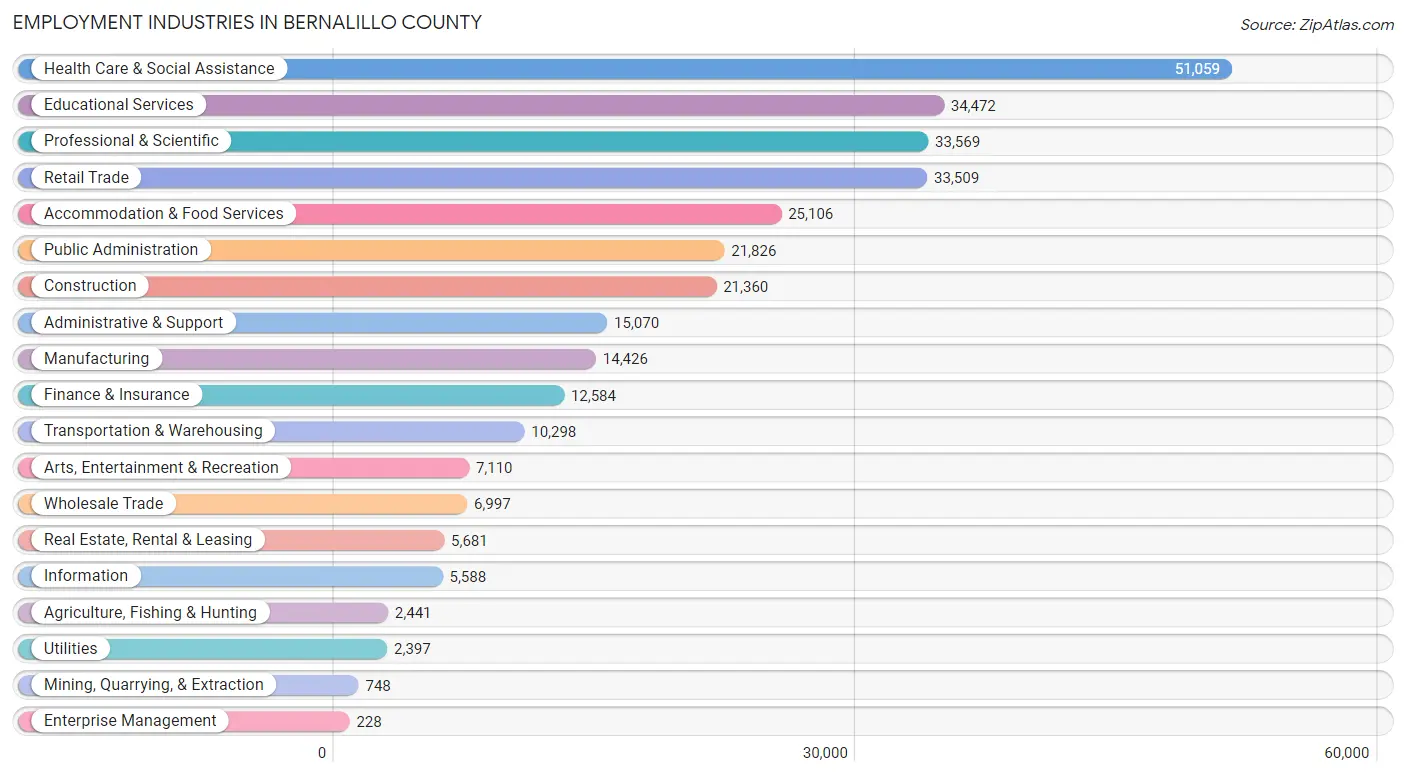
Employment Industries in Bernalillo County
The major employment industries in Bernalillo County include Health Care & Social Assistance (51,059 | 15.9%), Educational Services (34,472 | 10.7%), Professional & Scientific (33,569 | 10.4%), Retail Trade (33,509 | 10.4%), and Accommodation & Food Services (25,106 | 7.8%).
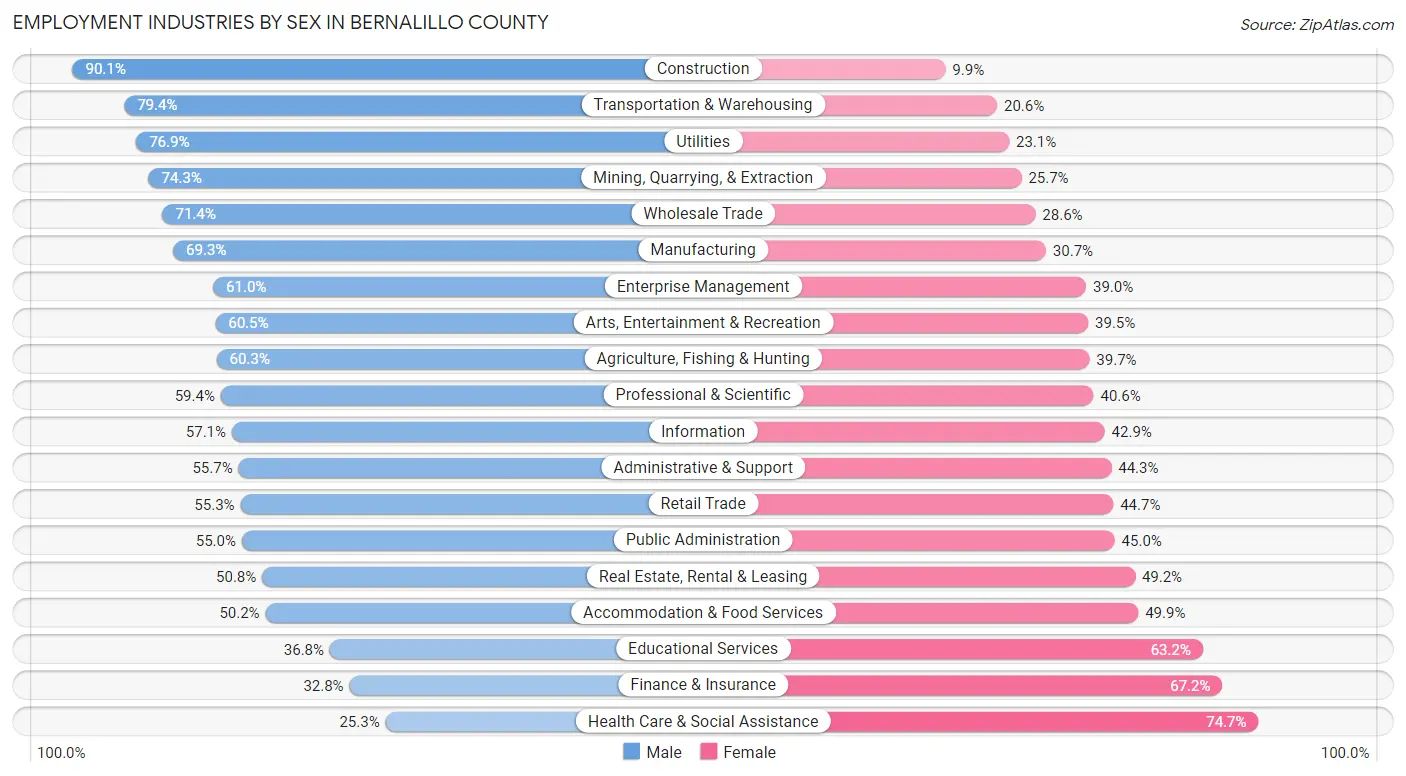
Employment Industries by Sex in Bernalillo County
The Bernalillo County industries that see more men than women are Construction (90.1%), Transportation & Warehousing (79.4%), and Utilities (76.9%), whereas the industries that tend to have a higher number of women are Health Care & Social Assistance (74.7%), Finance & Insurance (67.2%), and Educational Services (63.2%).
| Industry | Male | Female |
| Agriculture, Fishing & Hunting | 1,471 (60.3%) | 970 (39.7%) |
| Mining, Quarrying, & Extraction | 556 (74.3%) | 192 (25.7%) |
| Construction | 19,239 (90.1%) | 2,121 (9.9%) |
| Manufacturing | 9,991 (69.3%) | 4,435 (30.7%) |
| Wholesale Trade | 4,999 (71.4%) | 1,998 (28.6%) |
| Retail Trade | 18,542 (55.3%) | 14,967 (44.7%) |
| Transportation & Warehousing | 8,175 (79.4%) | 2,123 (20.6%) |
| Utilities | 1,843 (76.9%) | 554 (23.1%) |
| Information | 3,191 (57.1%) | 2,397 (42.9%) |
| Finance & Insurance | 4,122 (32.8%) | 8,462 (67.2%) |
| Real Estate, Rental & Leasing | 2,888 (50.8%) | 2,793 (49.2%) |
| Professional & Scientific | 19,940 (59.4%) | 13,629 (40.6%) |
| Enterprise Management | 139 (61.0%) | 89 (39.0%) |
| Administrative & Support | 8,398 (55.7%) | 6,672 (44.3%) |
| Educational Services | 12,688 (36.8%) | 21,784 (63.2%) |
| Health Care & Social Assistance | 12,920 (25.3%) | 38,139 (74.7%) |
| Arts, Entertainment & Recreation | 4,304 (60.5%) | 2,806 (39.5%) |
| Accommodation & Food Services | 12,591 (50.1%) | 12,515 (49.8%) |
| Public Administration | 12,012 (55.0%) | 9,814 (45.0%) |
| Total | 166,810 (51.8%) | 155,135 (48.2%) |
Education in Bernalillo County
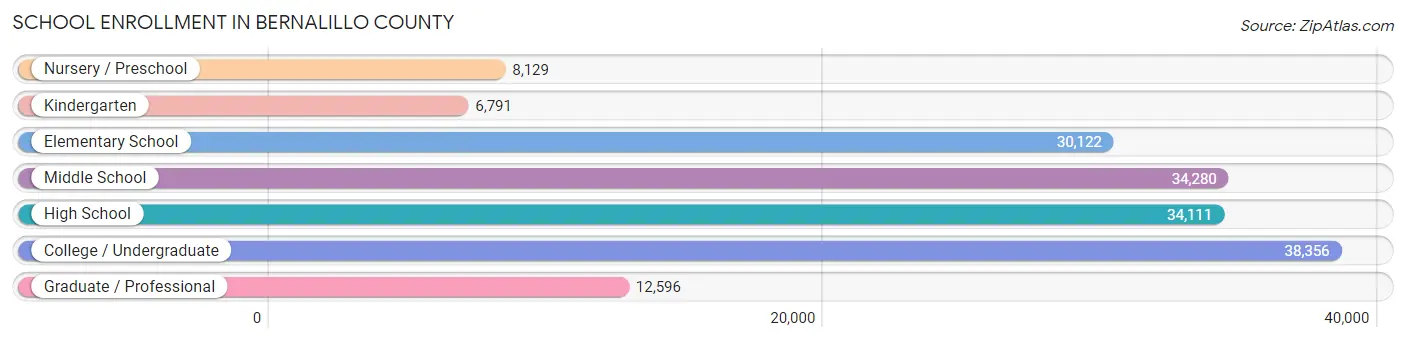
School Enrollment in Bernalillo County
The most common levels of schooling among the 164,385 students in Bernalillo County are college / undergraduate (38,356 | 23.3%), middle school (34,280 | 20.8%), and high school (34,111 | 20.7%).
| School Level | # Students | % Students |
| Nursery / Preschool | 8,129 | 5.0% |
| Kindergarten | 6,791 | 4.1% |
| Elementary School | 30,122 | 18.3% |
| Middle School | 34,280 | 20.8% |
| High School | 34,111 | 20.7% |
| College / Undergraduate | 38,356 | 23.3% |
| Graduate / Professional | 12,596 | 7.7% |
| Total | 164,385 | 100.0% |
School Enrollment by Age by Funding Source in Bernalillo County
Out of a total of 164,385 students who are enrolled in schools in Bernalillo County, 22,850 (13.9%) attend a private institution, while the remaining 141,535 (86.1%) are enrolled in public schools. The age group of 3 to 4 year olds has the highest likelihood of being enrolled in private schools, with 2,835 (46.3% in the age bracket) enrolled. Conversely, the age group of 20 to 24 year olds has the lowest likelihood of being enrolled in a private school, with 14,244 (92.3% in the age bracket) attending a public institution.
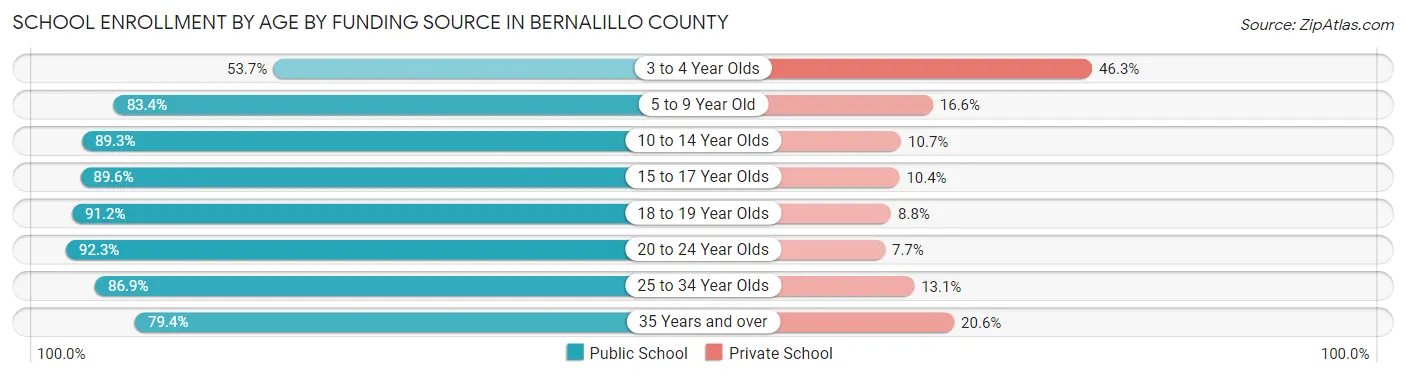
| Age Bracket | Public School | Private School |
| 3 to 4 Year Olds | 3,291 (53.7%) | 2,835 (46.3%) |
| 5 to 9 Year Old | 29,093 (83.4%) | 5,796 (16.6%) |
| 10 to 14 Year Olds | 37,628 (89.3%) | 4,512 (10.7%) |
| 15 to 17 Year Olds | 21,812 (89.6%) | 2,530 (10.4%) |
| 18 to 19 Year Olds | 11,597 (91.2%) | 1,124 (8.8%) |
| 20 to 24 Year Olds | 14,244 (92.3%) | 1,188 (7.7%) |
| 25 to 34 Year Olds | 13,052 (86.9%) | 1,974 (13.1%) |
| 35 Years and over | 10,888 (79.4%) | 2,821 (20.6%) |
| Total | 141,535 (86.1%) | 22,850 (13.9%) |
Educational Attainment by Field of Study in Bernalillo County
Business (29,101 | 15.3%), education (21,510 | 11.3%), science & technology (18,297 | 9.6%), social sciences (16,726 | 8.8%), and engineering (15,909 | 8.4%) are the most common fields of study among 190,094 individuals in Bernalillo County who have obtained a bachelor's degree or higher.
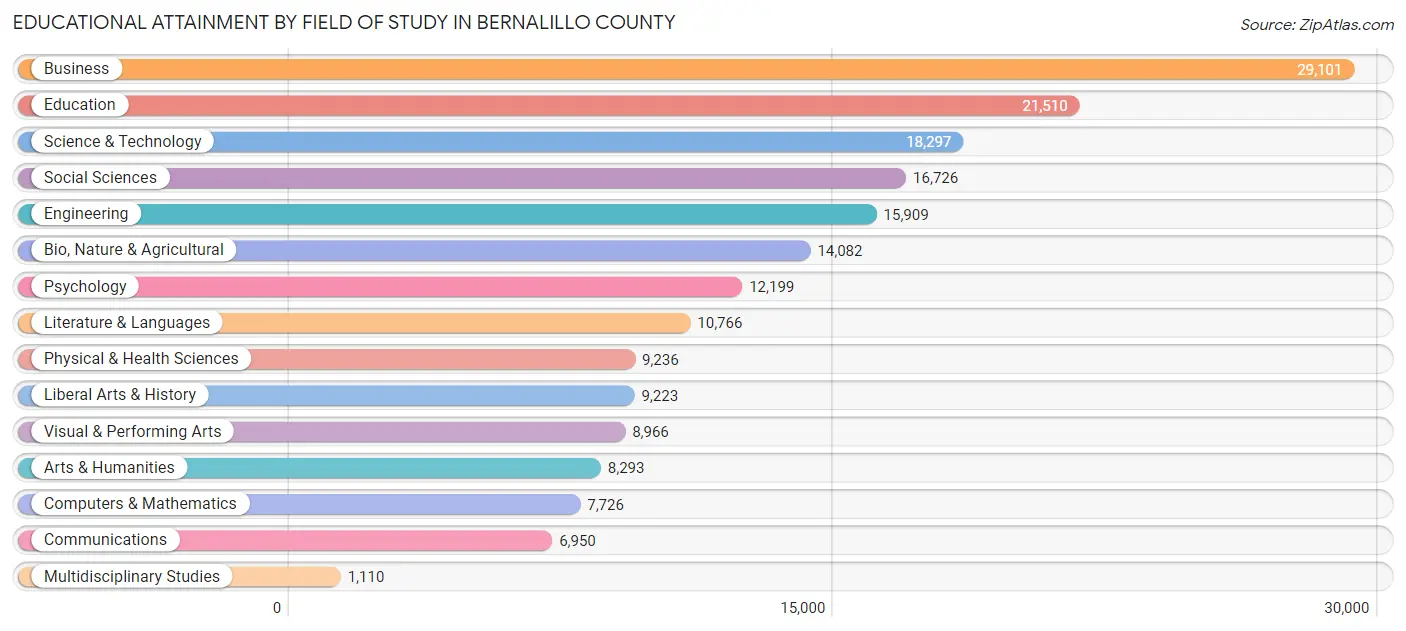
| Field of Study | # Graduates | % Graduates |
| Computers & Mathematics | 7,726 | 4.1% |
| Bio, Nature & Agricultural | 14,082 | 7.4% |
| Physical & Health Sciences | 9,236 | 4.9% |
| Psychology | 12,199 | 6.4% |
| Social Sciences | 16,726 | 8.8% |
| Engineering | 15,909 | 8.4% |
| Multidisciplinary Studies | 1,110 | 0.6% |
| Science & Technology | 18,297 | 9.6% |
| Business | 29,101 | 15.3% |
| Education | 21,510 | 11.3% |
| Literature & Languages | 10,766 | 5.7% |
| Liberal Arts & History | 9,223 | 4.9% |
| Visual & Performing Arts | 8,966 | 4.7% |
| Communications | 6,950 | 3.7% |
| Arts & Humanities | 8,293 | 4.4% |
| Total | 190,094 | 100.0% |
Transportation & Commute in Bernalillo County
Vehicle Availability by Sex in Bernalillo County
The most prevalent vehicle ownership categories in Bernalillo County are males with 2 vehicles (68,632, accounting for 41.3%) and females with 2 vehicles (61,399, making up 45.1%).
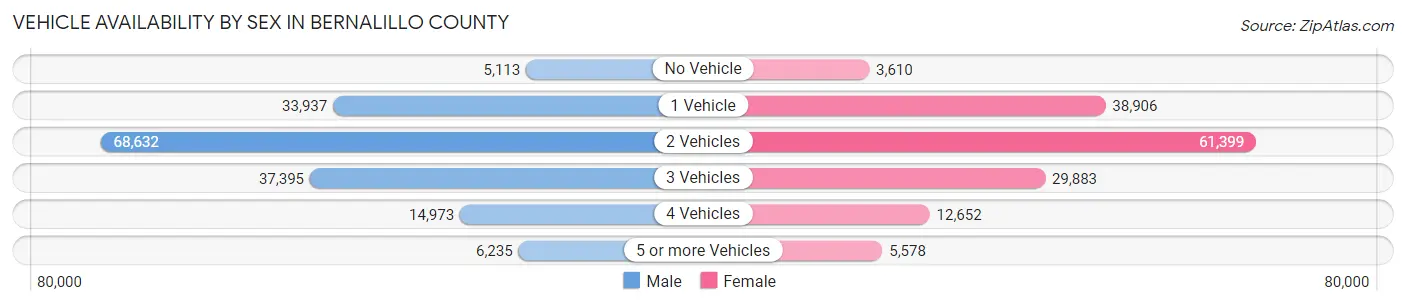
| Vehicles Available | Male | Female |
| No Vehicle | 5,113 (3.1%) | 3,610 (2.4%) |
| 1 Vehicle | 33,937 (20.4%) | 38,906 (25.6%) |
| 2 Vehicles | 68,632 (41.3%) | 61,399 (40.4%) |
| 3 Vehicles | 37,395 (22.5%) | 29,883 (19.7%) |
| 4 Vehicles | 14,973 (9.0%) | 12,652 (8.3%) |
| 5 or more Vehicles | 6,235 (3.7%) | 5,578 (3.7%) |
| Total | 166,285 (100.0%) | 152,028 (100.0%) |
Commute Time in Bernalillo County
The most frequently occuring commute durations in Bernalillo County are 15 to 19 minutes (58,151 commuters, 20.4%), 20 to 24 minutes (56,980 commuters, 20.0%), and 30 to 34 minutes (40,683 commuters, 14.3%).
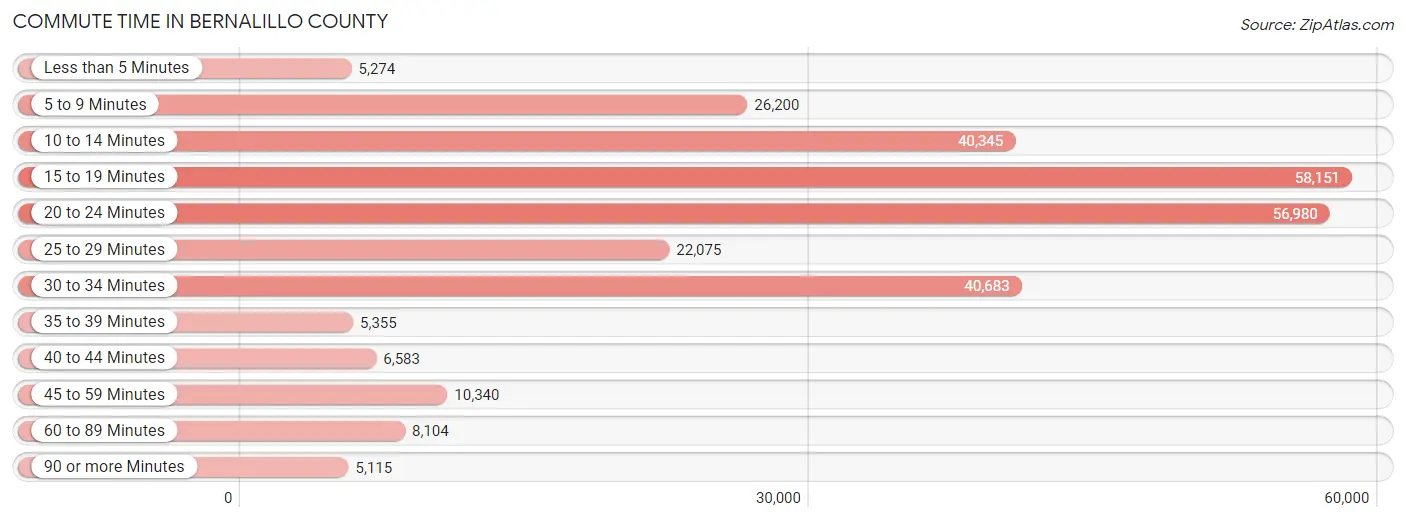
| Commute Time | # Commuters | % Commuters |
| Less than 5 Minutes | 5,274 | 1.8% |
| 5 to 9 Minutes | 26,200 | 9.2% |
| 10 to 14 Minutes | 40,345 | 14.1% |
| 15 to 19 Minutes | 58,151 | 20.4% |
| 20 to 24 Minutes | 56,980 | 20.0% |
| 25 to 29 Minutes | 22,075 | 7.7% |
| 30 to 34 Minutes | 40,683 | 14.3% |
| 35 to 39 Minutes | 5,355 | 1.9% |
| 40 to 44 Minutes | 6,583 | 2.3% |
| 45 to 59 Minutes | 10,340 | 3.6% |
| 60 to 89 Minutes | 8,104 | 2.8% |
| 90 or more Minutes | 5,115 | 1.8% |
Commute Time by Sex in Bernalillo County
The most common commute times in Bernalillo County are 15 to 19 minutes (30,967 commuters, 20.4%) for males and 20 to 24 minutes (27,199 commuters, 20.3%) for females.
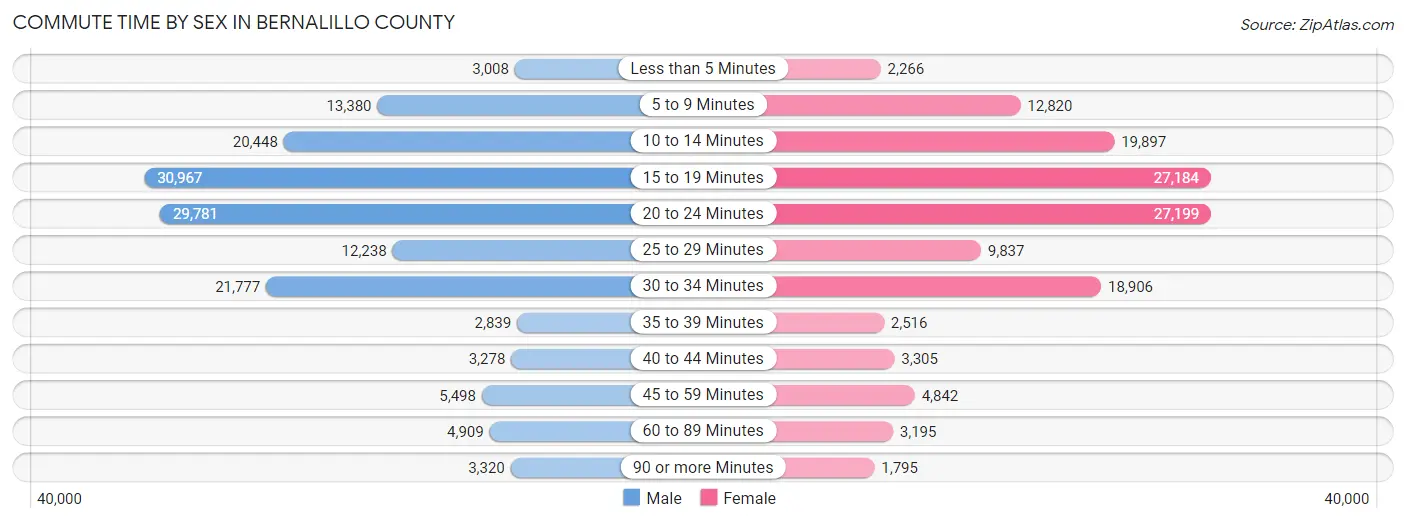
| Commute Time | Male | Female |
| Less than 5 Minutes | 3,008 (2.0%) | 2,266 (1.7%) |
| 5 to 9 Minutes | 13,380 (8.8%) | 12,820 (9.6%) |
| 10 to 14 Minutes | 20,448 (13.5%) | 19,897 (14.9%) |
| 15 to 19 Minutes | 30,967 (20.4%) | 27,184 (20.3%) |
| 20 to 24 Minutes | 29,781 (19.7%) | 27,199 (20.3%) |
| 25 to 29 Minutes | 12,238 (8.1%) | 9,837 (7.3%) |
| 30 to 34 Minutes | 21,777 (14.4%) | 18,906 (14.1%) |
| 35 to 39 Minutes | 2,839 (1.9%) | 2,516 (1.9%) |
| 40 to 44 Minutes | 3,278 (2.2%) | 3,305 (2.5%) |
| 45 to 59 Minutes | 5,498 (3.6%) | 4,842 (3.6%) |
| 60 to 89 Minutes | 4,909 (3.2%) | 3,195 (2.4%) |
| 90 or more Minutes | 3,320 (2.2%) | 1,795 (1.3%) |
Time of Departure to Work by Sex in Bernalillo County
The most frequent times of departure to work in Bernalillo County are 7:00 AM to 7:29 AM (23,871, 15.8%) for males and 7:00 AM to 7:29 AM (22,260, 16.6%) for females.
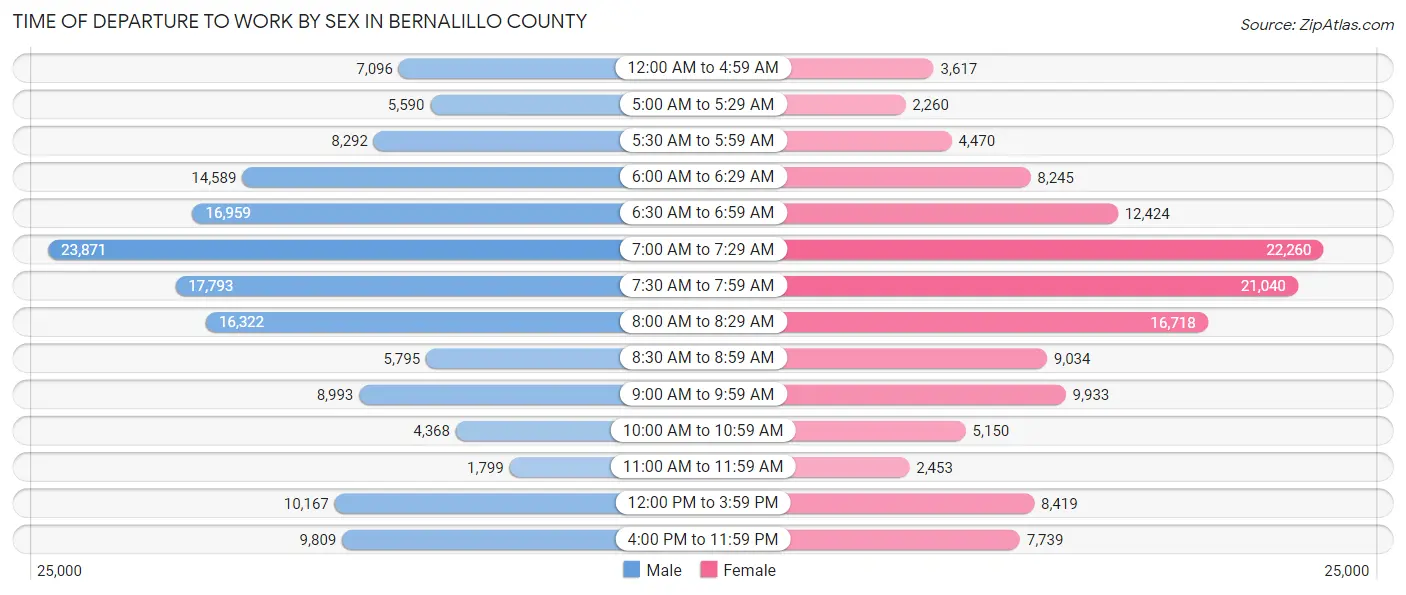
| Time of Departure | Male | Female |
| 12:00 AM to 4:59 AM | 7,096 (4.7%) | 3,617 (2.7%) |
| 5:00 AM to 5:29 AM | 5,590 (3.7%) | 2,260 (1.7%) |
| 5:30 AM to 5:59 AM | 8,292 (5.5%) | 4,470 (3.3%) |
| 6:00 AM to 6:29 AM | 14,589 (9.6%) | 8,245 (6.2%) |
| 6:30 AM to 6:59 AM | 16,959 (11.2%) | 12,424 (9.3%) |
| 7:00 AM to 7:29 AM | 23,871 (15.8%) | 22,260 (16.6%) |
| 7:30 AM to 7:59 AM | 17,793 (11.7%) | 21,040 (15.7%) |
| 8:00 AM to 8:29 AM | 16,322 (10.8%) | 16,718 (12.5%) |
| 8:30 AM to 8:59 AM | 5,795 (3.8%) | 9,034 (6.8%) |
| 9:00 AM to 9:59 AM | 8,993 (5.9%) | 9,933 (7.4%) |
| 10:00 AM to 10:59 AM | 4,368 (2.9%) | 5,150 (3.8%) |
| 11:00 AM to 11:59 AM | 1,799 (1.2%) | 2,453 (1.8%) |
| 12:00 PM to 3:59 PM | 10,167 (6.7%) | 8,419 (6.3%) |
| 4:00 PM to 11:59 PM | 9,809 (6.5%) | 7,739 (5.8%) |
| Total | 151,443 (100.0%) | 133,762 (100.0%) |
Housing Occupancy in Bernalillo County
Occupancy by Ownership in Bernalillo County
Of the total 281,095 dwellings in Bernalillo County, owner-occupied units account for 178,141 (63.4%), while renter-occupied units make up 102,954 (36.6%).
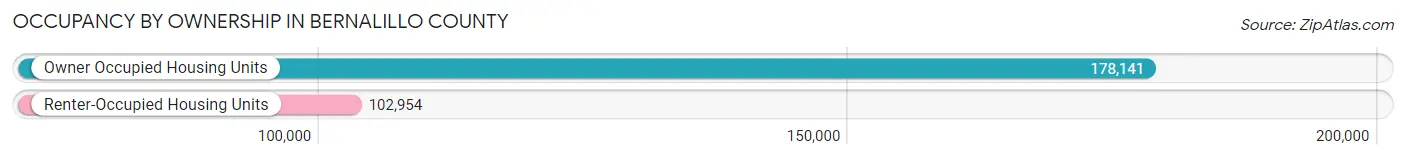
| Occupancy | # Housing Units | % Housing Units |
| Owner Occupied Housing Units | 178,141 | 63.4% |
| Renter-Occupied Housing Units | 102,954 | 36.6% |
| Total Occupied Housing Units | 281,095 | 100.0% |
Occupancy by Household Size in Bernalillo County
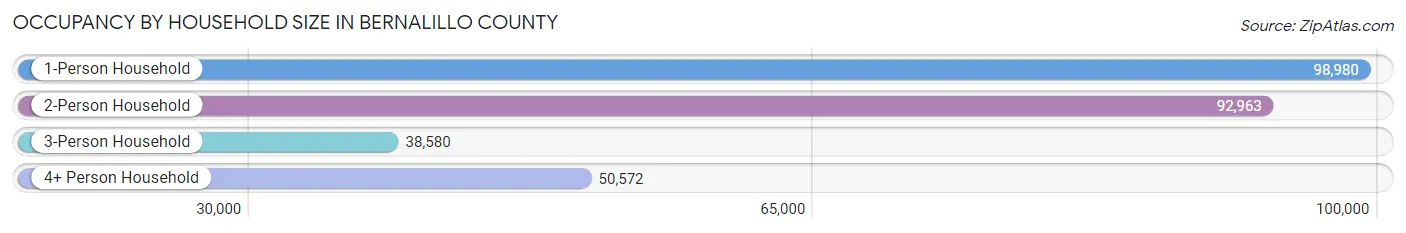
| Household Size | # Housing Units | % Housing Units |
| 1-Person Household | 98,980 | 35.2% |
| 2-Person Household | 92,963 | 33.1% |
| 3-Person Household | 38,580 | 13.7% |
| 4+ Person Household | 50,572 | 18.0% |
| Total Housing Units | 281,095 | 100.0% |
Occupancy by Ownership by Household Size in Bernalillo County
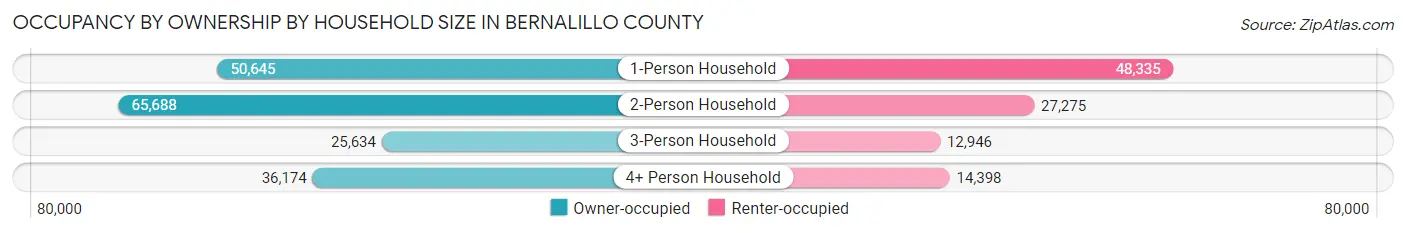
| Household Size | Owner-occupied | Renter-occupied |
| 1-Person Household | 50,645 (51.2%) | 48,335 (48.8%) |
| 2-Person Household | 65,688 (70.7%) | 27,275 (29.3%) |
| 3-Person Household | 25,634 (66.4%) | 12,946 (33.6%) |
| 4+ Person Household | 36,174 (71.5%) | 14,398 (28.5%) |
| Total Housing Units | 178,141 (63.4%) | 102,954 (36.6%) |
Occupancy by Educational Attainment in Bernalillo County
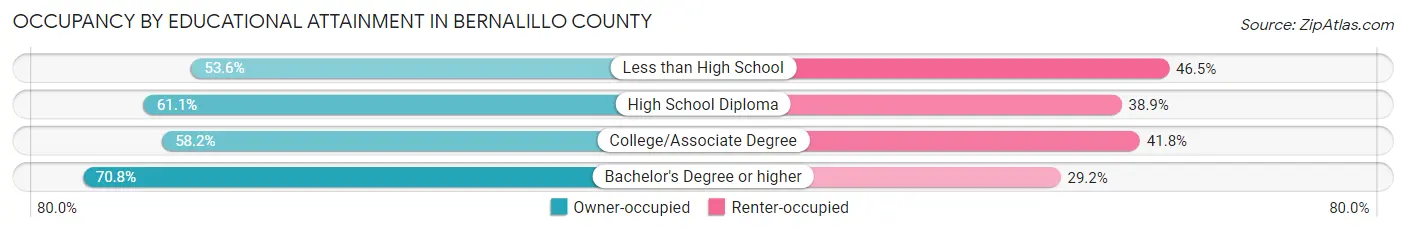
| Household Size | Owner-occupied | Renter-occupied |
| Less than High School | 12,406 (53.5%) | 10,761 (46.5%) |
| High School Diploma | 32,922 (61.1%) | 20,987 (38.9%) |
| College/Associate Degree | 53,336 (58.2%) | 38,356 (41.8%) |
| Bachelor's Degree or higher | 79,477 (70.8%) | 32,850 (29.2%) |
Occupancy by Age of Householder in Bernalillo County
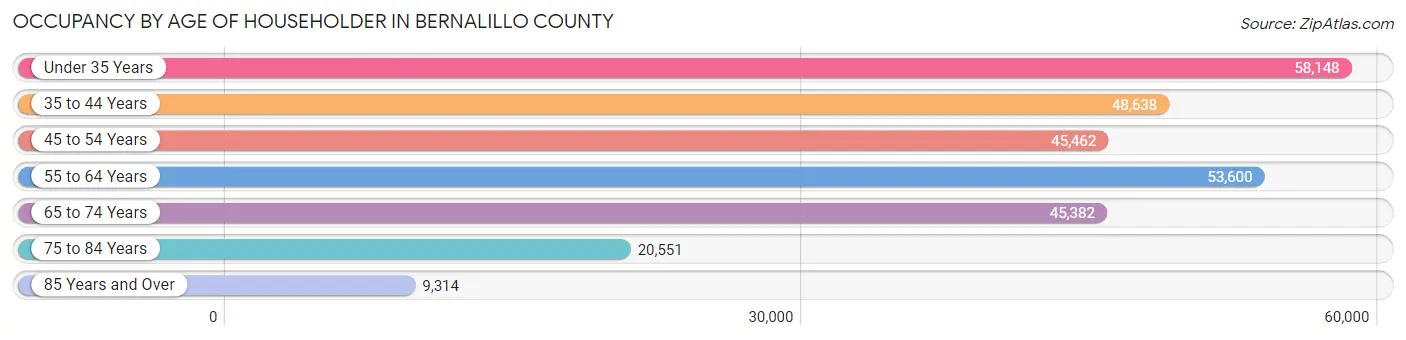
| Age Bracket | # Households | % Households |
| Under 35 Years | 58,148 | 20.7% |
| 35 to 44 Years | 48,638 | 17.3% |
| 45 to 54 Years | 45,462 | 16.2% |
| 55 to 64 Years | 53,600 | 19.1% |
| 65 to 74 Years | 45,382 | 16.1% |
| 75 to 84 Years | 20,551 | 7.3% |
| 85 Years and Over | 9,314 | 3.3% |
| Total | 281,095 | 100.0% |
Housing Finances in Bernalillo County
Median Income by Occupancy in Bernalillo County
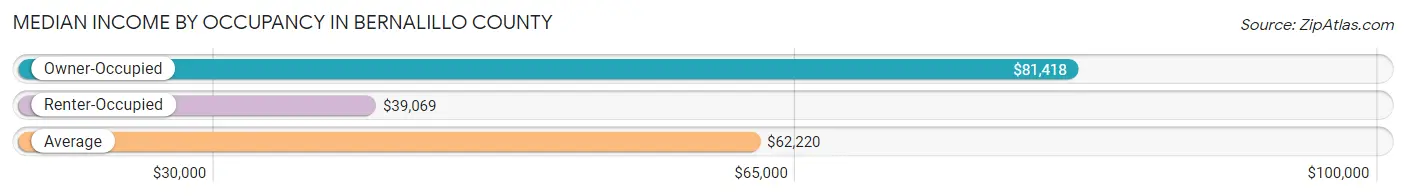
| Occupancy Type | # Households | Median Income |
| Owner-Occupied | 178,141 (63.4%) | $81,418 |
| Renter-Occupied | 102,954 (36.6%) | $39,069 |
| Average | 281,095 (100.0%) | $62,220 |
Occupancy by Householder Income Bracket in Bernalillo County
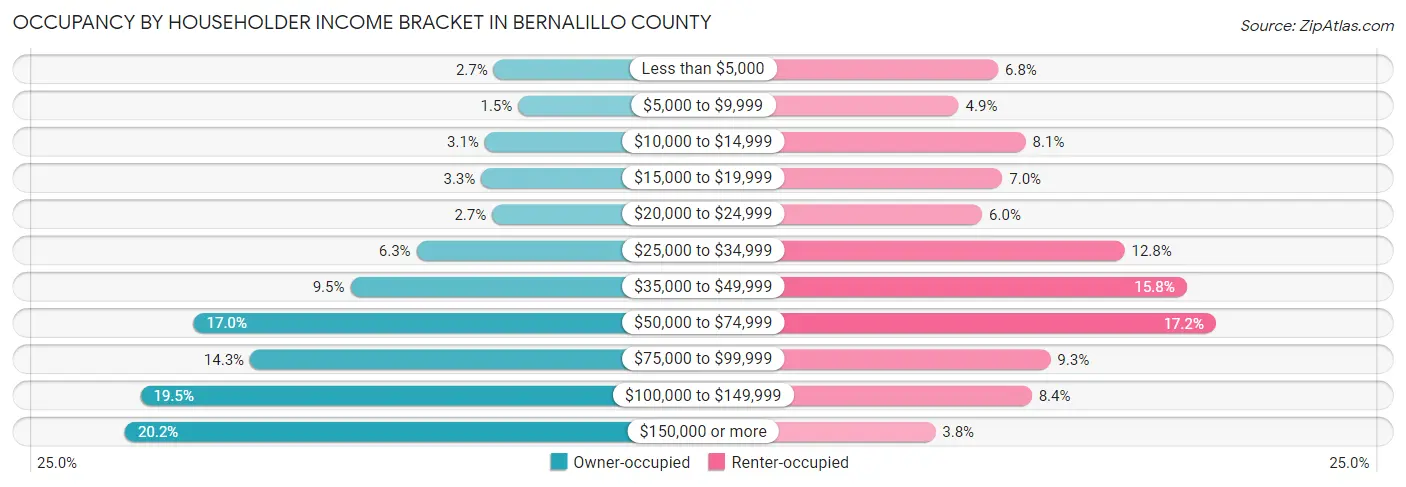
| Income Bracket | Owner-occupied | Renter-occupied |
| Less than $5,000 | 4,752 (2.7%) | 6,993 (6.8%) |
| $5,000 to $9,999 | 2,672 (1.5%) | 5,050 (4.9%) |
| $10,000 to $14,999 | 5,506 (3.1%) | 8,338 (8.1%) |
| $15,000 to $19,999 | 5,811 (3.3%) | 7,194 (7.0%) |
| $20,000 to $24,999 | 4,873 (2.7%) | 6,205 (6.0%) |
| $25,000 to $34,999 | 11,296 (6.3%) | 13,187 (12.8%) |
| $35,000 to $49,999 | 16,898 (9.5%) | 16,227 (15.8%) |
| $50,000 to $74,999 | 30,201 (17.0%) | 17,657 (17.2%) |
| $75,000 to $99,999 | 25,414 (14.3%) | 9,556 (9.3%) |
| $100,000 to $149,999 | 34,696 (19.5%) | 8,634 (8.4%) |
| $150,000 or more | 36,022 (20.2%) | 3,913 (3.8%) |
| Total | 178,141 (100.0%) | 102,954 (100.0%) |
Monthly Housing Cost Tiers in Bernalillo County
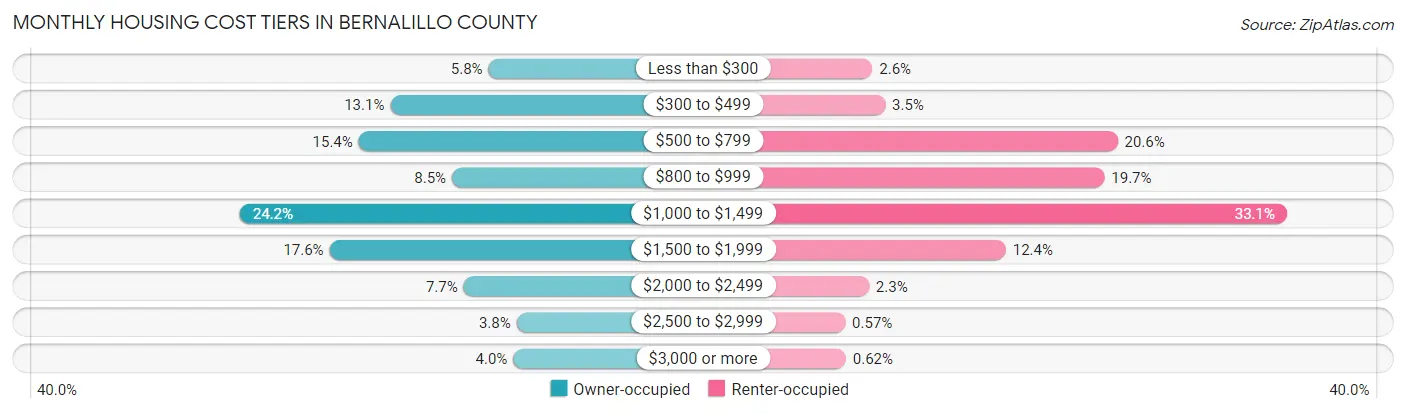
| Monthly Cost | Owner-occupied | Renter-occupied |
| Less than $300 | 10,411 (5.8%) | 2,645 (2.6%) |
| $300 to $499 | 23,283 (13.1%) | 3,610 (3.5%) |
| $500 to $799 | 27,439 (15.4%) | 21,242 (20.6%) |
| $800 to $999 | 15,190 (8.5%) | 20,238 (19.7%) |
| $1,000 to $1,499 | 43,014 (24.1%) | 34,072 (33.1%) |
| $1,500 to $1,999 | 31,269 (17.5%) | 12,768 (12.4%) |
| $2,000 to $2,499 | 13,663 (7.7%) | 2,393 (2.3%) |
| $2,500 to $2,999 | 6,715 (3.8%) | 584 (0.6%) |
| $3,000 or more | 7,157 (4.0%) | 635 (0.6%) |
| Total | 178,141 (100.0%) | 102,954 (100.0%) |
Physical Housing Characteristics in Bernalillo County
Housing Structures in Bernalillo County
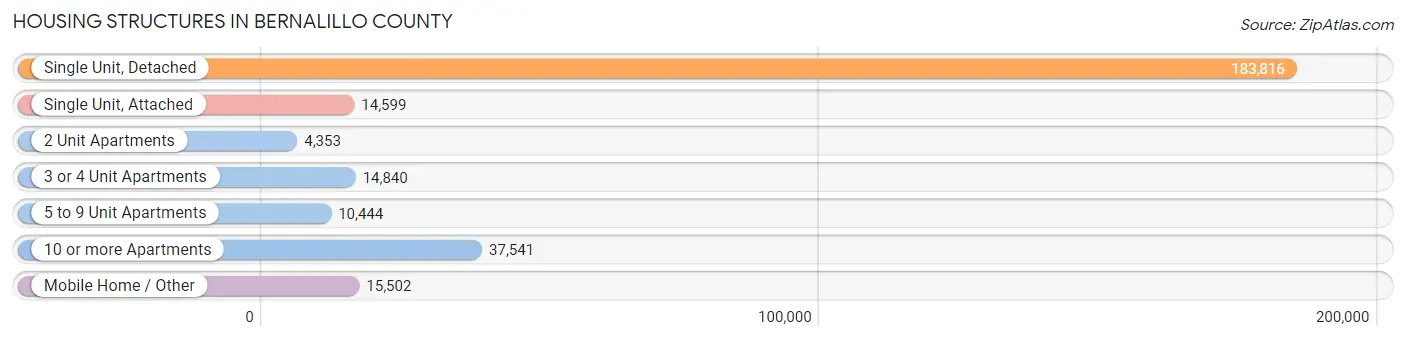
| Structure Type | # Housing Units | % Housing Units |
| Single Unit, Detached | 183,816 | 65.4% |
| Single Unit, Attached | 14,599 | 5.2% |
| 2 Unit Apartments | 4,353 | 1.5% |
| 3 or 4 Unit Apartments | 14,840 | 5.3% |
| 5 to 9 Unit Apartments | 10,444 | 3.7% |
| 10 or more Apartments | 37,541 | 13.4% |
| Mobile Home / Other | 15,502 | 5.5% |
| Total | 281,095 | 100.0% |
Housing Structures by Occupancy in Bernalillo County
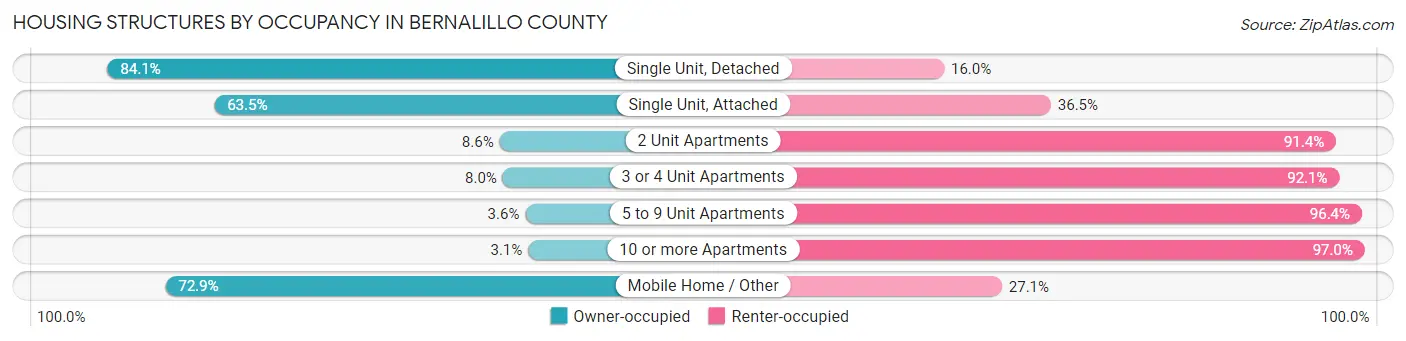
| Structure Type | Owner-occupied | Renter-occupied |
| Single Unit, Detached | 154,497 (84.1%) | 29,319 (16.0%) |
| Single Unit, Attached | 9,267 (63.5%) | 5,332 (36.5%) |
| 2 Unit Apartments | 373 (8.6%) | 3,980 (91.4%) |
| 3 or 4 Unit Apartments | 1,180 (8.0%) | 13,660 (92.0%) |
| 5 to 9 Unit Apartments | 377 (3.6%) | 10,067 (96.4%) |
| 10 or more Apartments | 1,144 (3.0%) | 36,397 (97.0%) |
| Mobile Home / Other | 11,303 (72.9%) | 4,199 (27.1%) |
| Total | 178,141 (63.4%) | 102,954 (36.6%) |
Housing Structures by Number of Rooms in Bernalillo County
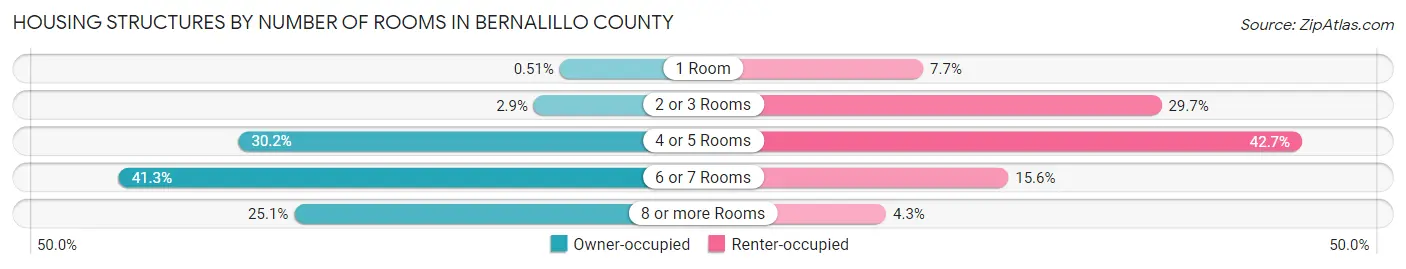
| Number of Rooms | Owner-occupied | Renter-occupied |
| 1 Room | 904 (0.5%) | 7,929 (7.7%) |
| 2 or 3 Rooms | 5,190 (2.9%) | 30,622 (29.7%) |
| 4 or 5 Rooms | 53,828 (30.2%) | 43,981 (42.7%) |
| 6 or 7 Rooms | 73,558 (41.3%) | 16,029 (15.6%) |
| 8 or more Rooms | 44,661 (25.1%) | 4,393 (4.3%) |
| Total | 178,141 (100.0%) | 102,954 (100.0%) |
Housing Structure by Heating Type in Bernalillo County
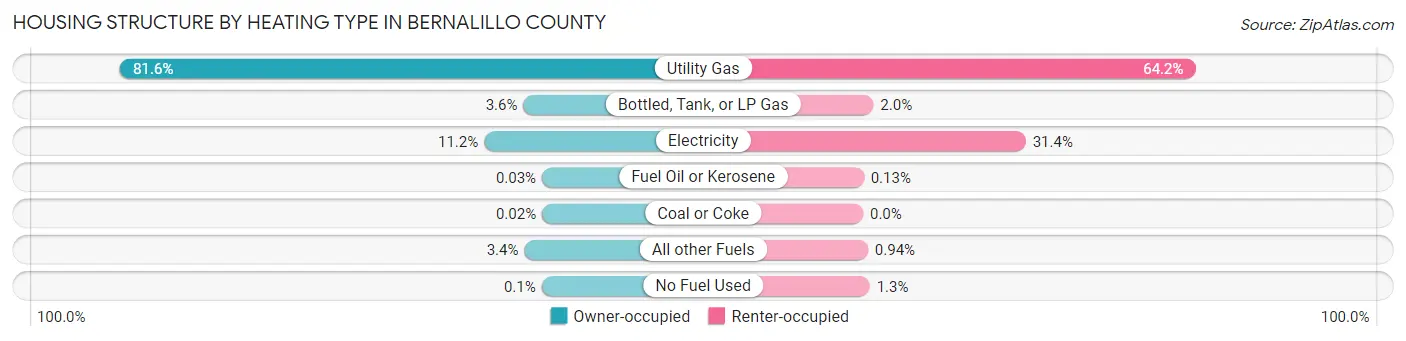
| Heating Type | Owner-occupied | Renter-occupied |
| Utility Gas | 145,291 (81.6%) | 66,094 (64.2%) |
| Bottled, Tank, or LP Gas | 6,462 (3.6%) | 2,060 (2.0%) |
| Electricity | 19,976 (11.2%) | 32,370 (31.4%) |
| Fuel Oil or Kerosene | 58 (0.0%) | 132 (0.1%) |
| Coal or Coke | 41 (0.0%) | 0 (0.0%) |
| All other Fuels | 6,126 (3.4%) | 970 (0.9%) |
| No Fuel Used | 187 (0.1%) | 1,328 (1.3%) |
| Total | 178,141 (100.0%) | 102,954 (100.0%) |
Household Vehicle Usage in Bernalillo County
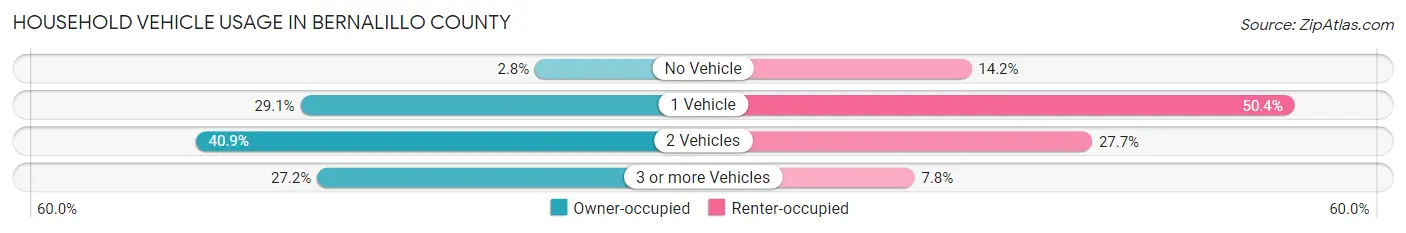
| Vehicles per Household | Owner-occupied | Renter-occupied |
| No Vehicle | 5,008 (2.8%) | 14,583 (14.2%) |
| 1 Vehicle | 51,844 (29.1%) | 51,847 (50.4%) |
| 2 Vehicles | 72,766 (40.8%) | 28,492 (27.7%) |
| 3 or more Vehicles | 48,523 (27.2%) | 8,032 (7.8%) |
| Total | 178,141 (100.0%) | 102,954 (100.0%) |
Real Estate & Mortgages in Bernalillo County
Real Estate and Mortgage Overview in Bernalillo County
| Characteristic | Without Mortgage | With Mortgage |
| Housing Units | 64,611 | 113,530 |
| Median Property Value | $237,700 | $252,100 |
| Median Household Income | $62,088 | $25,854 |
| Monthly Housing Costs | $497 | $7,077 |
| Real Estate Taxes | $2,353 | $4,090 |
Property Value by Mortgage Status in Bernalillo County
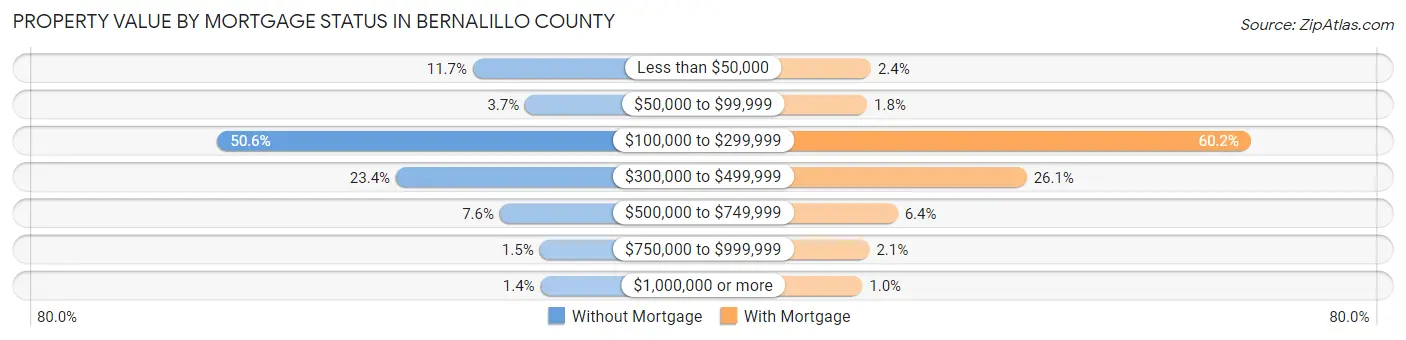
| Property Value | Without Mortgage | With Mortgage |
| Less than $50,000 | 7,557 (11.7%) | 2,663 (2.4%) |
| $50,000 to $99,999 | 2,418 (3.7%) | 2,014 (1.8%) |
| $100,000 to $299,999 | 32,706 (50.6%) | 68,373 (60.2%) |
| $300,000 to $499,999 | 15,132 (23.4%) | 29,614 (26.1%) |
| $500,000 to $749,999 | 4,901 (7.6%) | 7,287 (6.4%) |
| $750,000 to $999,999 | 994 (1.5%) | 2,408 (2.1%) |
| $1,000,000 or more | 903 (1.4%) | 1,171 (1.0%) |
| Total | 64,611 (100.0%) | 113,530 (100.0%) |
Household Income by Mortgage Status in Bernalillo County
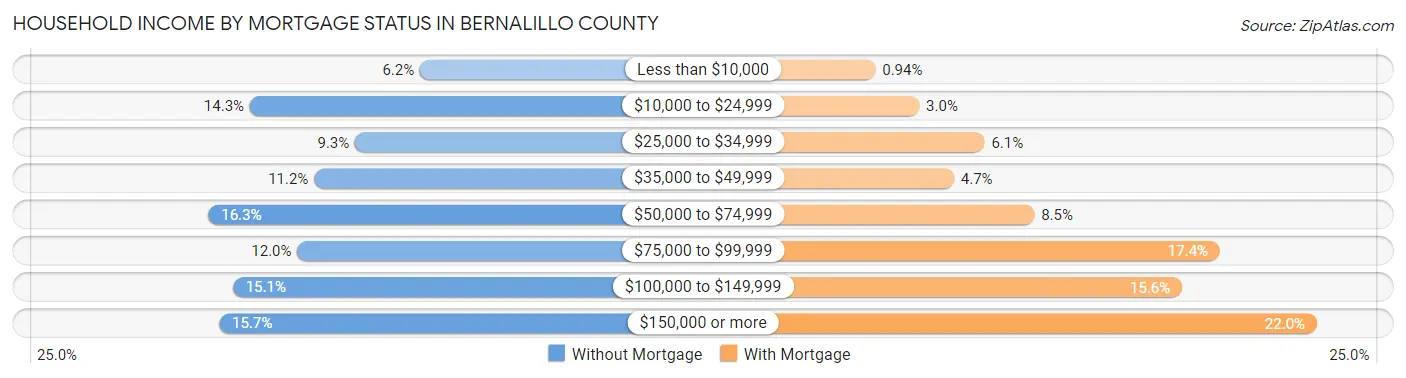
| Household Income | Without Mortgage | With Mortgage |
| Less than $10,000 | 3,985 (6.2%) | 1,068 (0.9%) |
| $10,000 to $24,999 | 9,223 (14.3%) | 3,439 (3.0%) |
| $25,000 to $34,999 | 5,983 (9.3%) | 6,967 (6.1%) |
| $35,000 to $49,999 | 7,241 (11.2%) | 5,313 (4.7%) |
| $50,000 to $74,999 | 10,499 (16.3%) | 9,657 (8.5%) |
| $75,000 to $99,999 | 7,759 (12.0%) | 19,702 (17.3%) |
| $100,000 to $149,999 | 9,753 (15.1%) | 17,655 (15.5%) |
| $150,000 or more | 10,168 (15.7%) | 24,943 (22.0%) |
| Total | 64,611 (100.0%) | 113,530 (100.0%) |
Property Value to Household Income Ratio in Bernalillo County
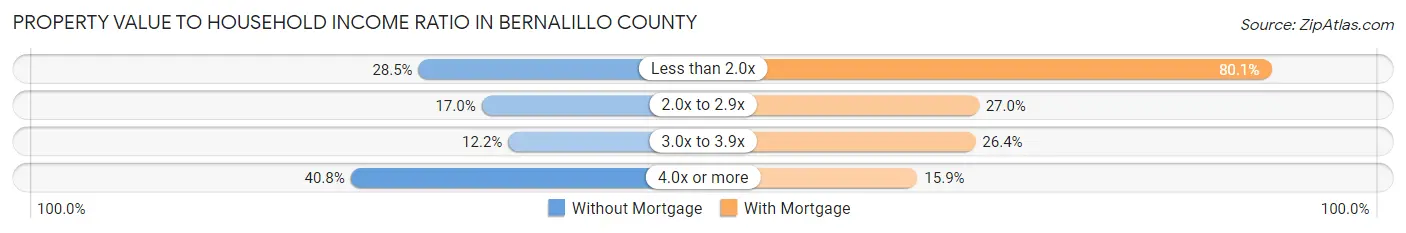
| Value-to-Income Ratio | Without Mortgage | With Mortgage |
| Less than 2.0x | 18,392 (28.5%) | 90,978 (80.1%) |
| 2.0x to 2.9x | 10,996 (17.0%) | 30,679 (27.0%) |
| 3.0x to 3.9x | 7,867 (12.2%) | 29,998 (26.4%) |
| 4.0x or more | 26,364 (40.8%) | 18,045 (15.9%) |
| Total | 64,611 (100.0%) | 113,530 (100.0%) |
Real Estate Taxes by Mortgage Status in Bernalillo County
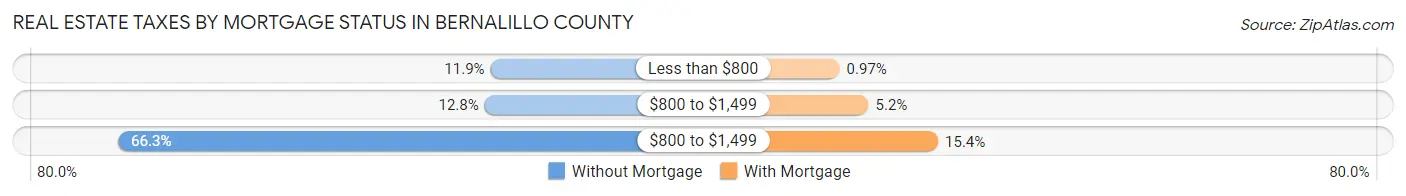
| Property Taxes | Without Mortgage | With Mortgage |
| Less than $800 | 7,715 (11.9%) | 1,098 (1.0%) |
| $800 to $1,499 | 8,266 (12.8%) | 5,890 (5.2%) |
| $800 to $1,499 | 42,858 (66.3%) | 17,426 (15.3%) |
| Total | 64,611 (100.0%) | 113,530 (100.0%) |
Health & Disability in Bernalillo County
Health Insurance Coverage by Age in Bernalillo County
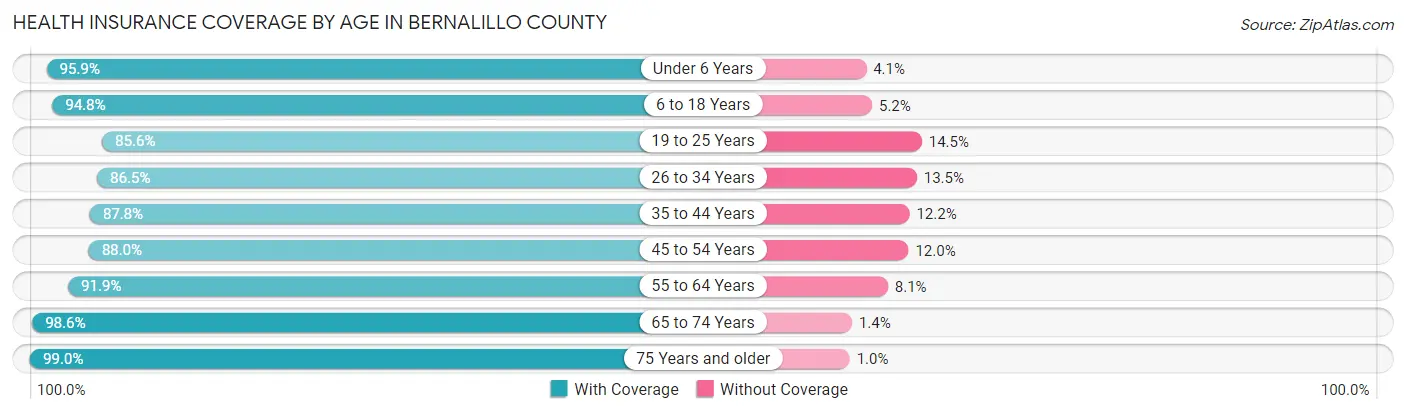
| Age Bracket | With Coverage | Without Coverage |
| Under 6 Years | 40,232 (95.9%) | 1,716 (4.1%) |
| 6 to 18 Years | 103,478 (94.8%) | 5,641 (5.2%) |
| 19 to 25 Years | 52,365 (85.6%) | 8,845 (14.4%) |
| 26 to 34 Years | 74,827 (86.5%) | 11,699 (13.5%) |
| 35 to 44 Years | 78,305 (87.8%) | 10,837 (12.2%) |
| 45 to 54 Years | 69,335 (88.0%) | 9,430 (12.0%) |
| 55 to 64 Years | 78,956 (91.9%) | 6,975 (8.1%) |
| 65 to 74 Years | 67,947 (98.6%) | 987 (1.4%) |
| 75 Years and older | 44,774 (99.0%) | 457 (1.0%) |
| Total | 610,219 (91.5%) | 56,587 (8.5%) |
Health Insurance Coverage by Citizenship Status in Bernalillo County
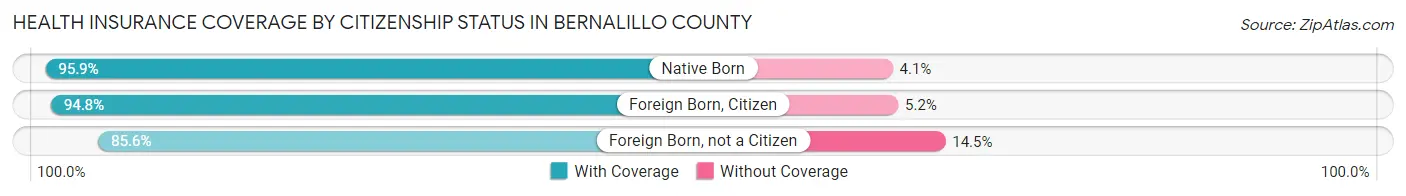
| Citizenship Status | With Coverage | Without Coverage |
| Native Born | 40,232 (95.9%) | 1,716 (4.1%) |
| Foreign Born, Citizen | 103,478 (94.8%) | 5,641 (5.2%) |
| Foreign Born, not a Citizen | 52,365 (85.6%) | 8,845 (14.4%) |
Health Insurance Coverage by Household Income in Bernalillo County
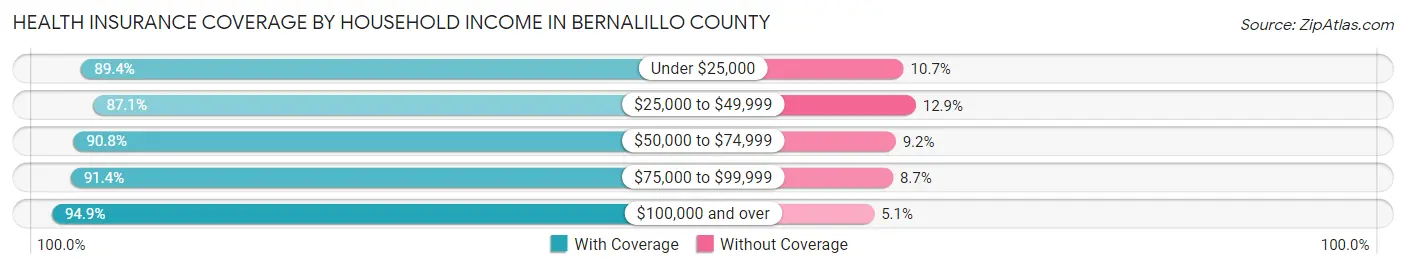
| Household Income | With Coverage | Without Coverage |
| Under $25,000 | 89,483 (89.3%) | 10,667 (10.6%) |
| $25,000 to $49,999 | 103,653 (87.1%) | 15,392 (12.9%) |
| $50,000 to $74,999 | 99,357 (90.8%) | 10,025 (9.2%) |
| $75,000 to $99,999 | 83,959 (91.3%) | 7,948 (8.6%) |
| $100,000 and over | 229,024 (94.9%) | 12,399 (5.1%) |
Public vs Private Health Insurance Coverage by Age in Bernalillo County
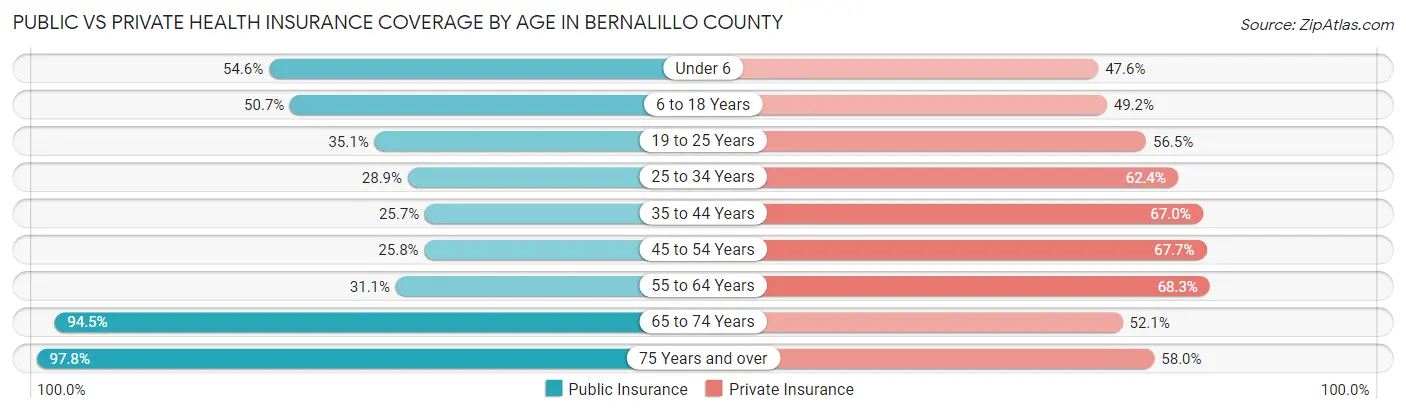
| Age Bracket | Public Insurance | Private Insurance |
| Under 6 | 22,910 (54.6%) | 19,969 (47.6%) |
| 6 to 18 Years | 55,329 (50.7%) | 53,676 (49.2%) |
| 19 to 25 Years | 21,459 (35.1%) | 34,566 (56.5%) |
| 25 to 34 Years | 24,973 (28.9%) | 53,955 (62.4%) |
| 35 to 44 Years | 22,876 (25.7%) | 59,701 (67.0%) |
| 45 to 54 Years | 20,311 (25.8%) | 53,293 (67.7%) |
| 55 to 64 Years | 26,719 (31.1%) | 58,673 (68.3%) |
| 65 to 74 Years | 65,119 (94.5%) | 35,919 (52.1%) |
| 75 Years and over | 44,229 (97.8%) | 26,244 (58.0%) |
| Total | 303,925 (45.6%) | 395,996 (59.4%) |
Disability Status by Sex by Age in Bernalillo County
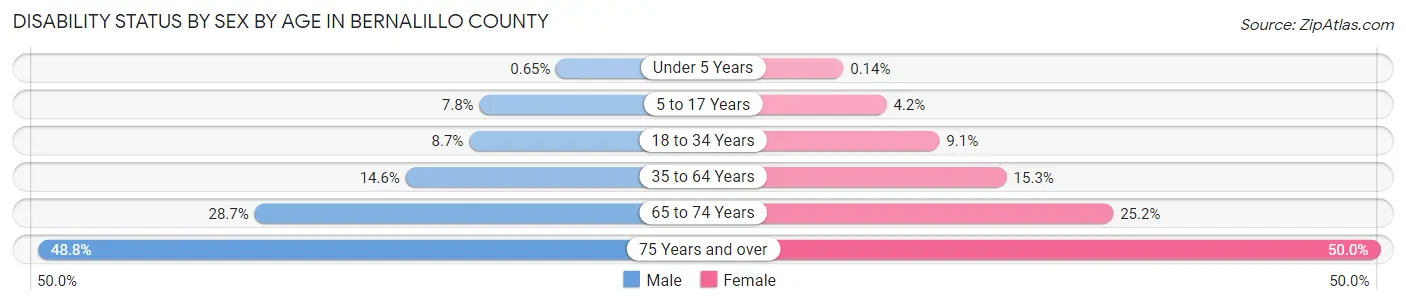
| Age Bracket | Male | Female |
| Under 5 Years | 116 (0.6%) | 24 (0.1%) |
| 5 to 17 Years | 4,254 (7.8%) | 2,172 (4.2%) |
| 18 to 34 Years | 6,890 (8.7%) | 7,081 (9.1%) |
| 35 to 64 Years | 18,298 (14.6%) | 19,709 (15.3%) |
| 65 to 74 Years | 9,114 (28.7%) | 9,357 (25.2%) |
| 75 Years and over | 9,159 (48.7%) | 13,213 (50.0%) |
Disability Class by Sex by Age in Bernalillo County
Disability Class: Hearing Difficulty
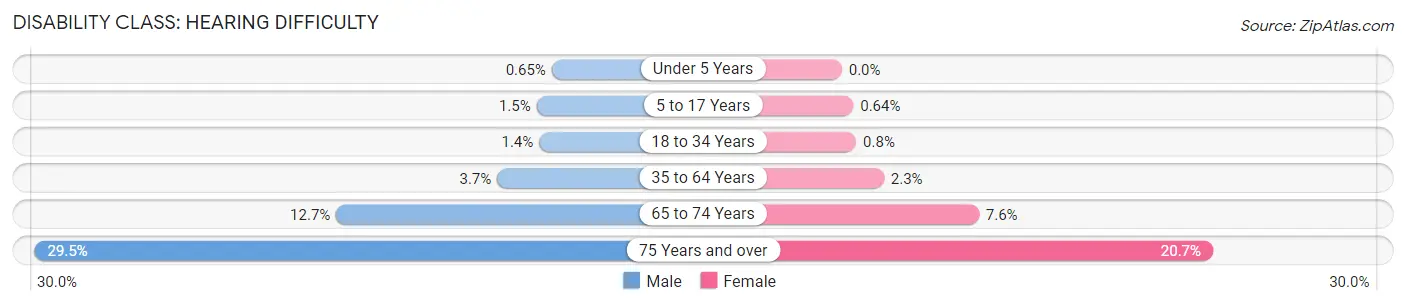
| Age Bracket | Male | Female |
| Under 5 Years | 116 (0.6%) | 0 (0.0%) |
| 5 to 17 Years | 816 (1.5%) | 337 (0.6%) |
| 18 to 34 Years | 1,065 (1.3%) | 625 (0.8%) |
| 35 to 64 Years | 4,613 (3.7%) | 3,011 (2.3%) |
| 65 to 74 Years | 4,023 (12.7%) | 2,833 (7.6%) |
| 75 Years and over | 5,533 (29.4%) | 5,463 (20.7%) |
Disability Class: Vision Difficulty
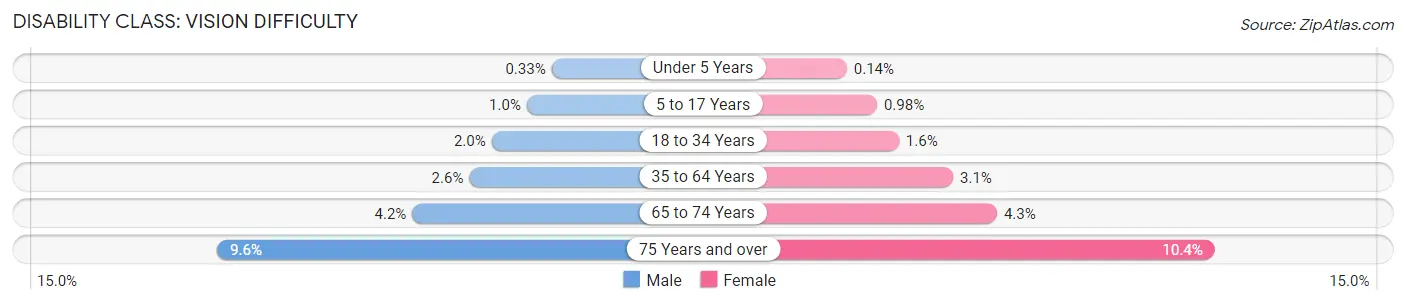
| Age Bracket | Male | Female |
| Under 5 Years | 58 (0.3%) | 24 (0.1%) |
| 5 to 17 Years | 559 (1.0%) | 511 (1.0%) |
| 18 to 34 Years | 1,579 (2.0%) | 1,246 (1.6%) |
| 35 to 64 Years | 3,270 (2.6%) | 3,993 (3.1%) |
| 65 to 74 Years | 1,340 (4.2%) | 1,603 (4.3%) |
| 75 Years and over | 1,811 (9.6%) | 2,745 (10.4%) |
Disability Class: Cognitive Difficulty
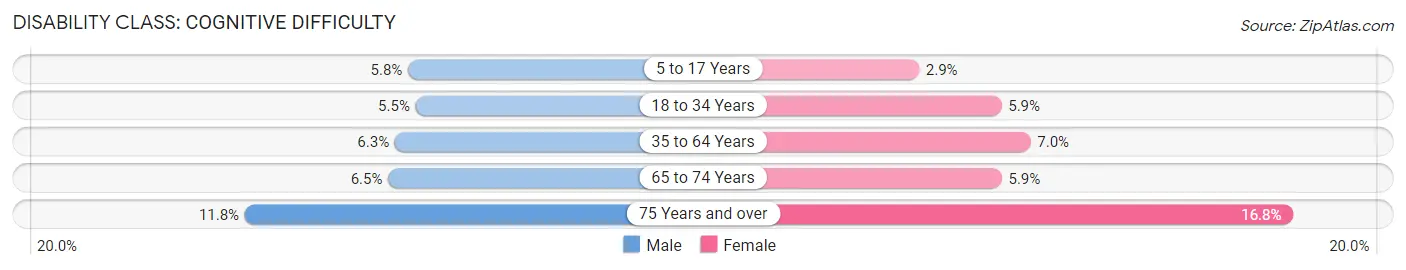
| Age Bracket | Male | Female |
| 5 to 17 Years | 3,148 (5.8%) | 1,498 (2.9%) |
| 18 to 34 Years | 4,322 (5.5%) | 4,626 (5.9%) |
| 35 to 64 Years | 7,810 (6.2%) | 9,013 (7.0%) |
| 65 to 74 Years | 2,068 (6.5%) | 2,203 (5.9%) |
| 75 Years and over | 2,221 (11.8%) | 4,431 (16.8%) |
Disability Class: Ambulatory Difficulty
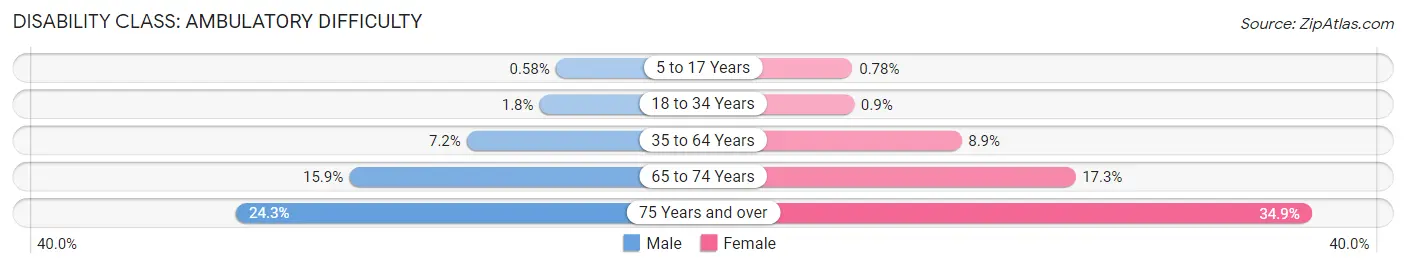
| Age Bracket | Male | Female |
| 5 to 17 Years | 319 (0.6%) | 406 (0.8%) |
| 18 to 34 Years | 1,406 (1.8%) | 705 (0.9%) |
| 35 to 64 Years | 8,976 (7.2%) | 11,424 (8.9%) |
| 65 to 74 Years | 5,058 (15.9%) | 6,436 (17.3%) |
| 75 Years and over | 4,563 (24.3%) | 9,222 (34.9%) |
Disability Class: Self-Care Difficulty
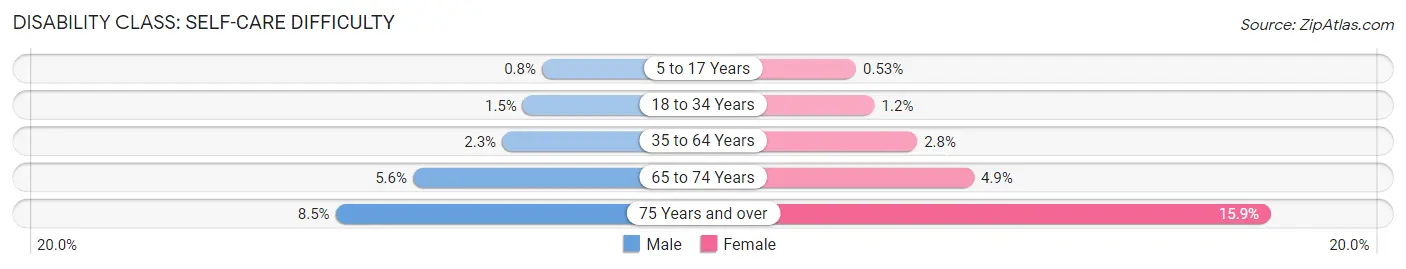
| Age Bracket | Male | Female |
| 5 to 17 Years | 435 (0.8%) | 279 (0.5%) |
| 18 to 34 Years | 1,190 (1.5%) | 950 (1.2%) |
| 35 to 64 Years | 2,849 (2.3%) | 3,610 (2.8%) |
| 65 to 74 Years | 1,777 (5.6%) | 1,825 (4.9%) |
| 75 Years and over | 1,590 (8.5%) | 4,212 (15.9%) |
Technology Access in Bernalillo County
Computing Device Access in Bernalillo County
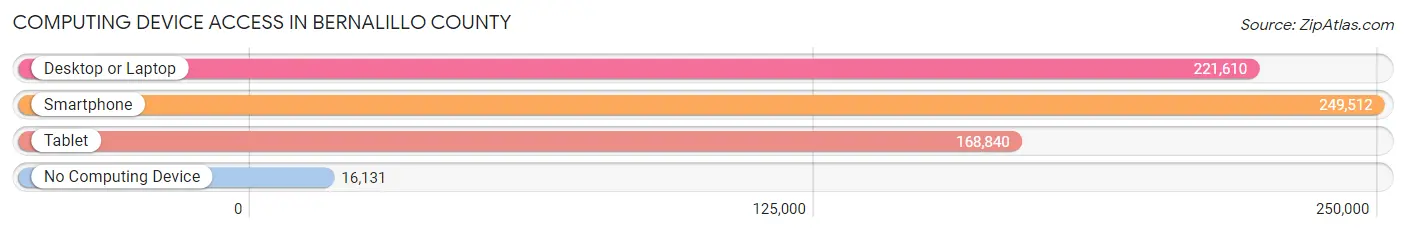
| Device Type | # Households | % Households |
| Desktop or Laptop | 221,610 | 78.8% |
| Smartphone | 249,512 | 88.8% |
| Tablet | 168,840 | 60.1% |
| No Computing Device | 16,131 | 5.7% |
| Total | 281,095 | 100.0% |
Internet Access in Bernalillo County
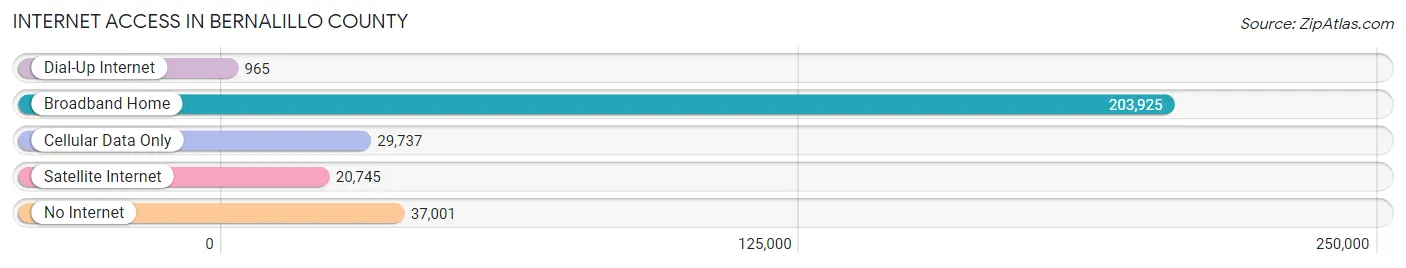
| Internet Type | # Households | % Households |
| Dial-Up Internet | 965 | 0.3% |
| Broadband Home | 203,925 | 72.6% |
| Cellular Data Only | 29,737 | 10.6% |
| Satellite Internet | 20,745 | 7.4% |
| No Internet | 37,001 | 13.2% |
| Total | 281,095 | 100.0% |
Bernalillo County Summary
Bernalillo County, New Mexico is located in the central part of the state and is the most populous county in the state. It is bordered by Sandoval County to the north, Santa Fe County to the east, Torrance County to the south, and Valencia County to the west. The county seat is Albuquerque, the largest city in the state.
History
The area that is now Bernalillo County was originally inhabited by Native American tribes, including the Pueblo, Apache, and Navajo. The first Europeans to explore the area were Spanish conquistadors in the 16th century. The area was part of the Spanish province of Santa Fe de Nuevo Mexico until 1821, when Mexico gained independence from Spain. In 1848, the area became part of the United States after the Mexican-American War.
In 1852, Bernalillo County was established as one of the original nine counties of the New Mexico Territory. The county was named after the Spanish town of Bernalillo, which was located in the area. The county seat was originally located in Bernalillo, but was moved to Albuquerque in 1880.
Geography
Bernalillo County covers an area of 1,167 square miles and is located in the central part of the state. The county is bordered by Sandoval County to the north, Santa Fe County to the east, Torrance County to the south, and Valencia County to the west. The county is located in the Rio Grande Valley and is home to the Sandia Mountains, the Manzano Mountains, and the Petroglyph National Monument.
The county has a semi-arid climate, with hot summers and mild winters. The average annual precipitation is 12.5 inches.
Economy
The economy of Bernalillo County is largely based on government, education, healthcare, and tourism. The county is home to the University of New Mexico, Sandia National Laboratories, and Kirtland Air Force Base. The county is also home to several major corporations, including Intel, Honeywell, and Bank of America.
The county is also a major tourist destination, with attractions such as the Sandia Mountains, the Petroglyph National Monument, and the Albuquerque International Balloon Fiesta.
Demographics
As of the 2010 census, Bernalillo County had a population of 662,564. The population was 53.3% Hispanic or Latino, 40.2% non-Hispanic White, 2.7% Native American, 2.3% Asian, 0.2% Pacific Islander, and 1.5% from two or more races. The median household income was $45,715 and the median family income was $51,817. The per capita income was $22,845.
Conclusion
Bernalillo County, New Mexico is the most populous county in the state and is located in the central part of the state. The county was established in 1852 and is home to the University of New Mexico, Sandia National Laboratories, and Kirtland Air Force Base. The economy of the county is largely based on government, education, healthcare, and tourism. The population of the county is largely Hispanic or Latino, with a median household income of $45,715. The county is a major tourist destination, with attractions such as the Sandia Mountains, the Petroglyph National Monument, and the Albuquerque International Balloon Fiesta.
Common Questions
What is Per Capita Income in Bernalillo County?
Per Capita income in Bernalillo County is $36,996.
What is the Median Family Income in Bernalillo County?
Median Family Income in Bernalillo County is $79,674.
What is the Median Household income in Bernalillo County?
Median Household Income in Bernalillo County is $62,220.
What is Income or Wage Gap in Bernalillo County?
Income or Wage Gap in Bernalillo County is 19.8%.
Women in Bernalillo County earn 80.2 cents for every dollar earned by a man.
What is Family Income Deficit in Bernalillo County?
Family Income Deficit in Bernalillo County is $10,823.
Families that are below poverty line in Bernalillo County earn $10,823 less on average than the poverty threshold level.
What is Inequality or Gini Index in Bernalillo County?
Inequality or Gini Index in Bernalillo County is 0.48.
What is the Total Population of Bernalillo County?
Total Population of Bernalillo County is 674,692.
What is the Total Male Population of Bernalillo County?
Total Male Population of Bernalillo County is 332,549.
What is the Total Female Population of Bernalillo County?
Total Female Population of Bernalillo County is 342,143.
What is the Ratio of Males per 100 Females in Bernalillo County?
There are 97.20 Males per 100 Females in Bernalillo County.
What is the Ratio of Females per 100 Males in Bernalillo County?
There are 102.88 Females per 100 Males in Bernalillo County.
What is the Median Population Age in Bernalillo County?
Median Population Age in Bernalillo County is 38.6 Years.
What is the Average Family Size in Bernalillo County
Average Family Size in Bernalillo County is 3.1 People.
What is the Average Household Size in Bernalillo County
Average Household Size in Bernalillo County is 2.4 People.
How Large is the Labor Force in Bernalillo County?
There are 344,181 People in the Labor Forcein in Bernalillo County.
What is the Percentage of People in the Labor Force in Bernalillo County?
62.6% of People are in the Labor Force in Bernalillo County.
What is the Unemployment Rate in Bernalillo County?
Unemployment Rate in Bernalillo County is 5.4%.