Deming, NM Map & Demographics
Deming Map
Deming Overview
$19,657
PER CAPITA INCOME
$52,097
AVG FAMILY INCOME
$33,548
AVG HOUSEHOLD INCOME
38.2%
WAGE / INCOME GAP [ % ]
61.8¢/ $1
WAGE / INCOME GAP [ $ ]
$8,314
FAMILY INCOME DEFICIT
0.45
INEQUALITY / GINI INDEX
14,756
TOTAL POPULATION
7,253
MALE POPULATION
7,503
FEMALE POPULATION
96.67
MALES / 100 FEMALES
103.45
FEMALES / 100 MALES
36.1
MEDIAN AGE
3.8
AVG FAMILY SIZE
2.7
AVG HOUSEHOLD SIZE
5,070
LABOR FORCE [ PEOPLE ]
45.4%
PERCENT IN LABOR FORCE
7.5%
UNEMPLOYMENT RATE
Deming Zip Codes
Income in Deming
Income Overview in Deming
Per Capita Income in Deming is $19,657, while median incomes of families and households are $52,097 and $33,548 respectively.
| Characteristic | Number | Measure |
| Per Capita Income | 14,756 | $19,657 |
| Median Family Income | 2,920 | $52,097 |
| Mean Family Income | 2,920 | $62,720 |
| Median Household Income | 5,392 | $33,548 |
| Mean Household Income | 5,392 | $46,741 |
| Income Deficit | 2,920 | $8,314 |
| Wage / Income Gap (%) | 14,756 | 38.22% |
| Wage / Income Gap ($) | 14,756 | 61.78¢ per $1 |
| Gini / Inequality Index | 14,756 | 0.45 |
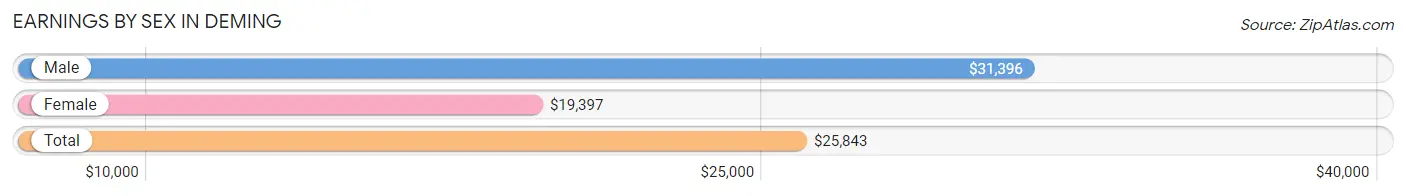
Earnings by Sex in Deming
Average Earnings in Deming are $25,843, $31,396 for men and $19,397 for women, a difference of 38.2%.
| Sex | Number | Average Earnings |
| Male | 3,019 (54.6%) | $31,396 |
| Female | 2,514 (45.4%) | $19,397 |
| Total | 5,533 (100.0%) | $25,843 |
Earnings by Sex by Income Bracket in Deming
The most common earnings brackets in Deming are $100,000+ for men (341 | 11.3%) and $2,499 or less for women (306 | 12.2%).
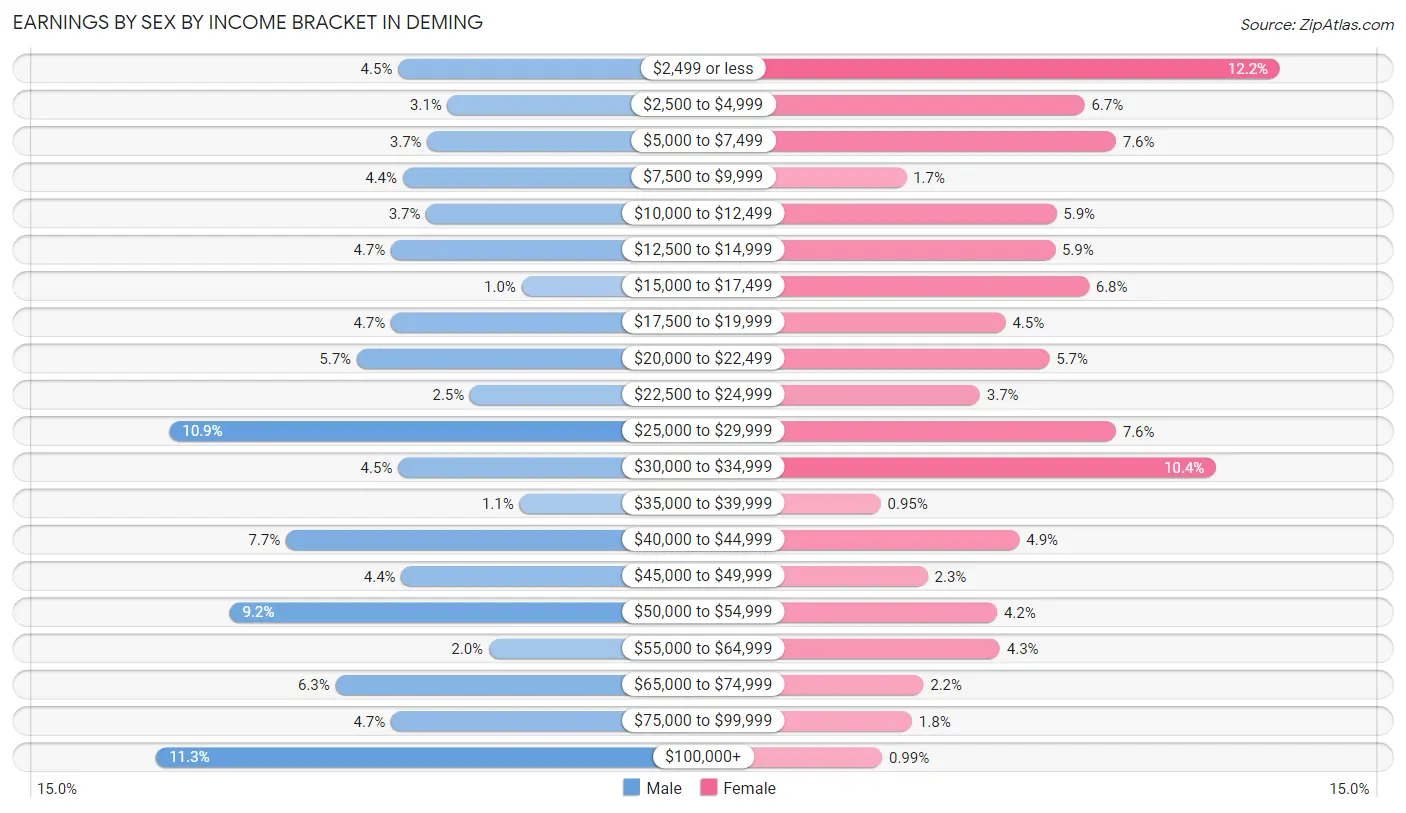
| Income | Male | Female |
| $2,499 or less | 136 (4.5%) | 306 (12.2%) |
| $2,500 to $4,999 | 94 (3.1%) | 168 (6.7%) |
| $5,000 to $7,499 | 111 (3.7%) | 190 (7.6%) |
| $7,500 to $9,999 | 132 (4.4%) | 42 (1.7%) |
| $10,000 to $12,499 | 112 (3.7%) | 148 (5.9%) |
| $12,500 to $14,999 | 142 (4.7%) | 147 (5.9%) |
| $15,000 to $17,499 | 31 (1.0%) | 171 (6.8%) |
| $17,500 to $19,999 | 142 (4.7%) | 112 (4.5%) |
| $20,000 to $22,499 | 171 (5.7%) | 143 (5.7%) |
| $22,500 to $24,999 | 75 (2.5%) | 94 (3.7%) |
| $25,000 to $29,999 | 330 (10.9%) | 190 (7.6%) |
| $30,000 to $34,999 | 136 (4.5%) | 261 (10.4%) |
| $35,000 to $39,999 | 33 (1.1%) | 24 (0.9%) |
| $40,000 to $44,999 | 231 (7.6%) | 122 (4.9%) |
| $45,000 to $49,999 | 133 (4.4%) | 57 (2.3%) |
| $50,000 to $54,999 | 279 (9.2%) | 106 (4.2%) |
| $55,000 to $64,999 | 59 (1.9%) | 108 (4.3%) |
| $65,000 to $74,999 | 189 (6.3%) | 54 (2.1%) |
| $75,000 to $99,999 | 142 (4.7%) | 46 (1.8%) |
| $100,000+ | 341 (11.3%) | 25 (1.0%) |
| Total | 3,019 (100.0%) | 2,514 (100.0%) |
Earnings by Sex by Educational Attainment in Deming
Average earnings in Deming are $40,563 for men and $24,056 for women, a difference of 40.7%. Men with an educational attainment of bachelor's degree enjoy the highest average annual earnings of $79,643, while those with high school diploma education earn the least with $34,315. Women with an educational attainment of graduate degree earn the most with the average annual earnings of $58,421, while those with less than high school education have the smallest earnings of $14,533.
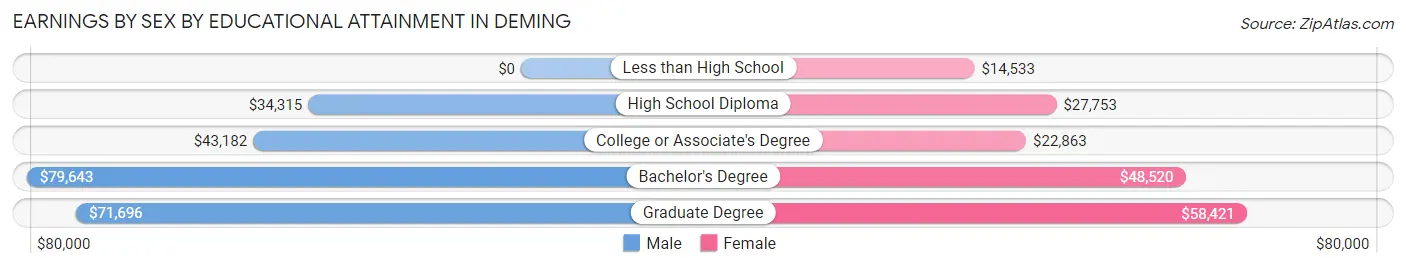
| Educational Attainment | Male Income | Female Income |
| Less than High School | - | - |
| High School Diploma | $34,315 | $27,753 |
| College or Associate's Degree | $43,182 | $22,863 |
| Bachelor's Degree | $79,643 | $48,520 |
| Graduate Degree | $71,696 | $58,421 |
| Total | $40,563 | $24,056 |
Family Income in Deming
Family Income Brackets in Deming
According to the Deming family income data, there are 742 families falling into the $50,000 to $74,999 income range, which is the most common income bracket and makes up 25.4% of all families. Conversely, the $150,000 to $199,999 income bracket is the least frequent group with only 29 families (1.0%) belonging to this category.
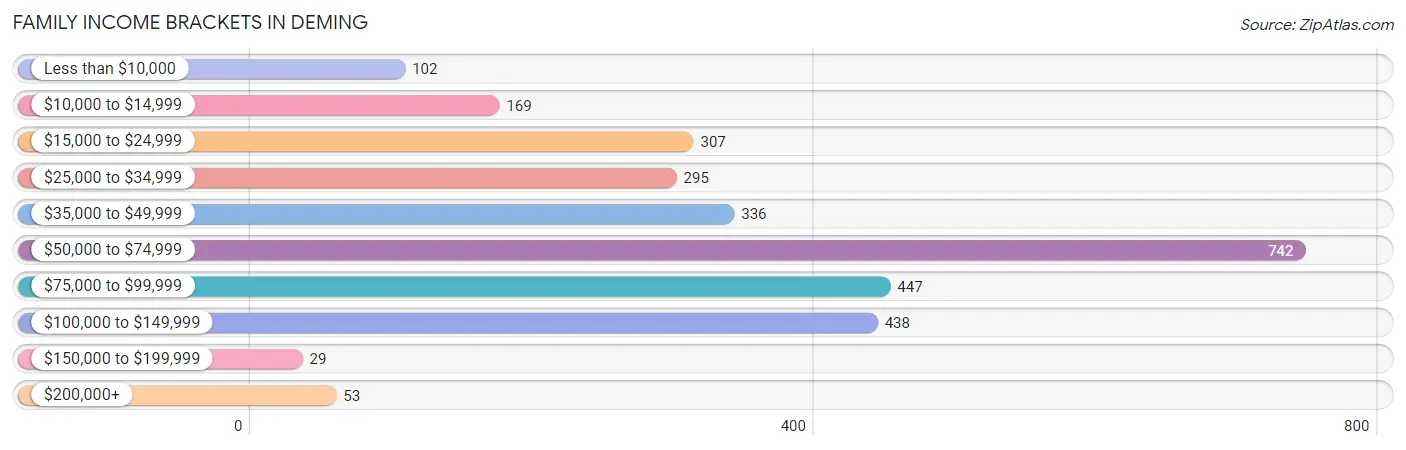
| Income Bracket | # Families | % Families |
| Less than $10,000 | 102 | 3.5% |
| $10,000 to $14,999 | 169 | 5.8% |
| $15,000 to $24,999 | 307 | 10.5% |
| $25,000 to $34,999 | 295 | 10.1% |
| $35,000 to $49,999 | 336 | 11.5% |
| $50,000 to $74,999 | 742 | 25.4% |
| $75,000 to $99,999 | 447 | 15.3% |
| $100,000 to $149,999 | 438 | 15.0% |
| $150,000 to $199,999 | 29 | 1.0% |
| $200,000+ | 53 | 1.8% |
Family Income by Famaliy Size in Deming
7+ person families (42 | 1.4%) account for the highest median family income in Deming with $102,794 per family, while 2-person families (1,137 | 38.9%) have the highest median income of $26,432 per family member.
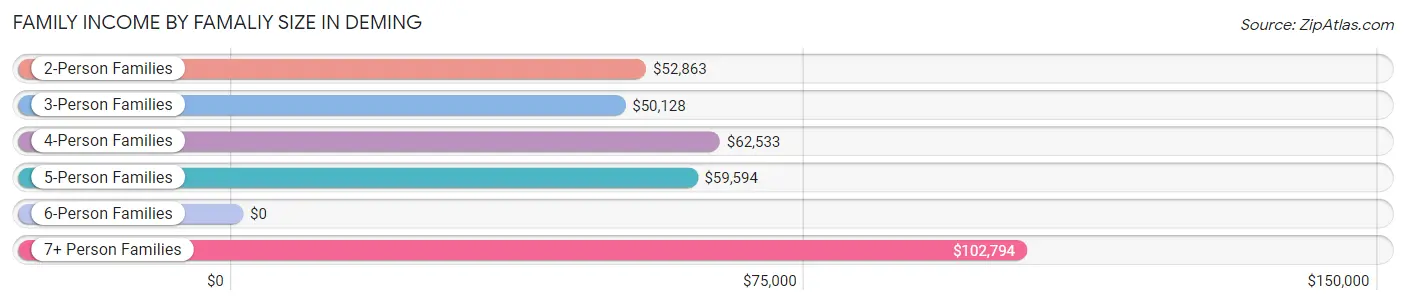
| Income Bracket | # Families | Median Income |
| 2-Person Families | 1,137 (38.9%) | $52,863 |
| 3-Person Families | 708 (24.2%) | $50,128 |
| 4-Person Families | 511 (17.5%) | $62,533 |
| 5-Person Families | 455 (15.6%) | $59,594 |
| 6-Person Families | 67 (2.3%) | $0 |
| 7+ Person Families | 42 (1.4%) | $102,794 |
| Total | 2,920 (100.0%) | $52,097 |
Family Income by Number of Earners in Deming
The median family income in Deming is $52,097, with families comprising 3+ earners (265) having the highest median family income of $94,958, while families with no earners (521) have the lowest median family income of $28,250, accounting for 9.1% and 17.8% of families, respectively.
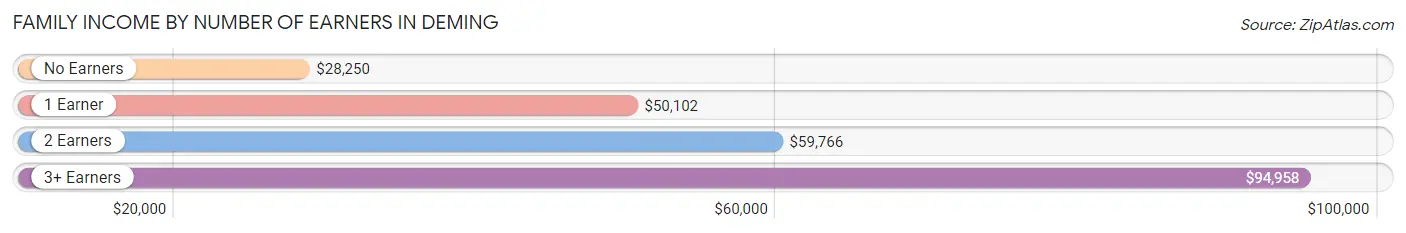
| Number of Earners | # Families | Median Income |
| No Earners | 521 (17.8%) | $28,250 |
| 1 Earner | 1,310 (44.9%) | $50,102 |
| 2 Earners | 824 (28.2%) | $59,766 |
| 3+ Earners | 265 (9.1%) | $94,958 |
| Total | 2,920 (100.0%) | $52,097 |
Household Income in Deming
Household Income Brackets in Deming
With 1,024 households falling in the category, the $15,000 to $24,999 income range is the most frequent in Deming, accounting for 19.0% of all households. In contrast, only 27 households (0.5%) fall into the $150,000 to $199,999 income bracket, making it the least populous group.
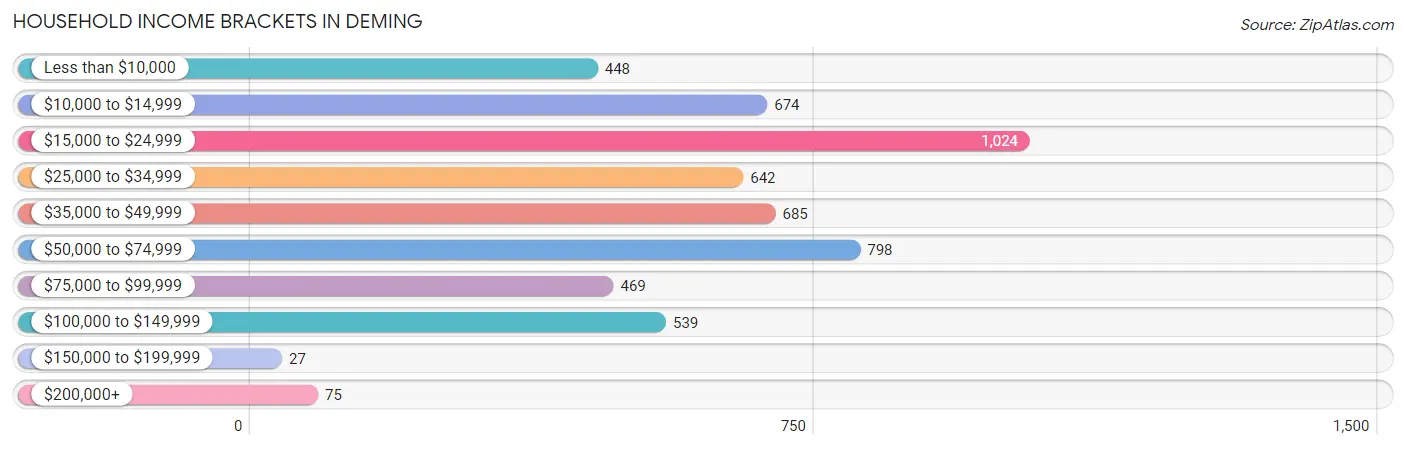
| Income Bracket | # Households | % Households |
| Less than $10,000 | 448 | 8.3% |
| $10,000 to $14,999 | 674 | 12.5% |
| $15,000 to $24,999 | 1,024 | 19.0% |
| $25,000 to $34,999 | 642 | 11.9% |
| $35,000 to $49,999 | 685 | 12.7% |
| $50,000 to $74,999 | 798 | 14.8% |
| $75,000 to $99,999 | 469 | 8.7% |
| $100,000 to $149,999 | 539 | 10.0% |
| $150,000 to $199,999 | 27 | 0.5% |
| $200,000+ | 75 | 1.4% |
Household Income by Householder Age in Deming
The median household income in Deming is $33,548, with the highest median household income of $43,874 found in the 25 to 44 years age bracket for the primary householder. A total of 1,345 households (24.9%) fall into this category. Meanwhile, the 15 to 24 years age bracket for the primary householder has the lowest median household income of $23,725, with 206 households (3.8%) in this group.
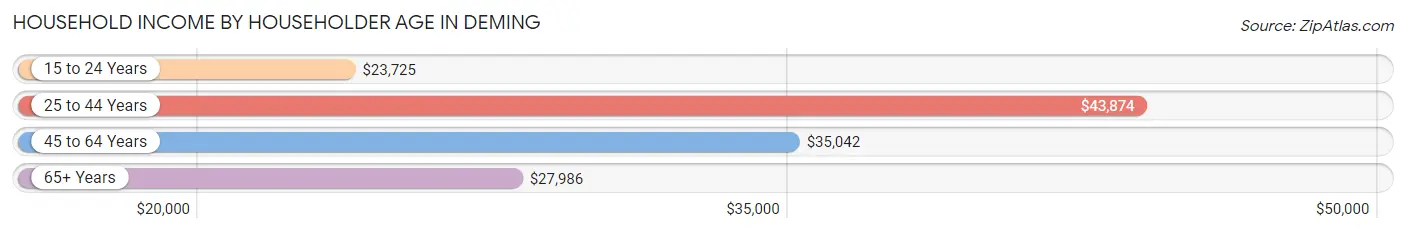
| Income Bracket | # Households | Median Income |
| 15 to 24 Years | 206 (3.8%) | $23,725 |
| 25 to 44 Years | 1,345 (24.9%) | $43,874 |
| 45 to 64 Years | 1,594 (29.6%) | $35,042 |
| 65+ Years | 2,247 (41.7%) | $27,986 |
| Total | 5,392 (100.0%) | $33,548 |
Poverty in Deming
Income Below Poverty by Sex and Age in Deming
With 22.5% poverty level for males and 25.6% for females among the residents of Deming, 15 year old males and 16 and 17 year old females are the most vulnerable to poverty, with 47 males (83.9%) and 90 females (52.0%) in their respective age groups living below the poverty level.
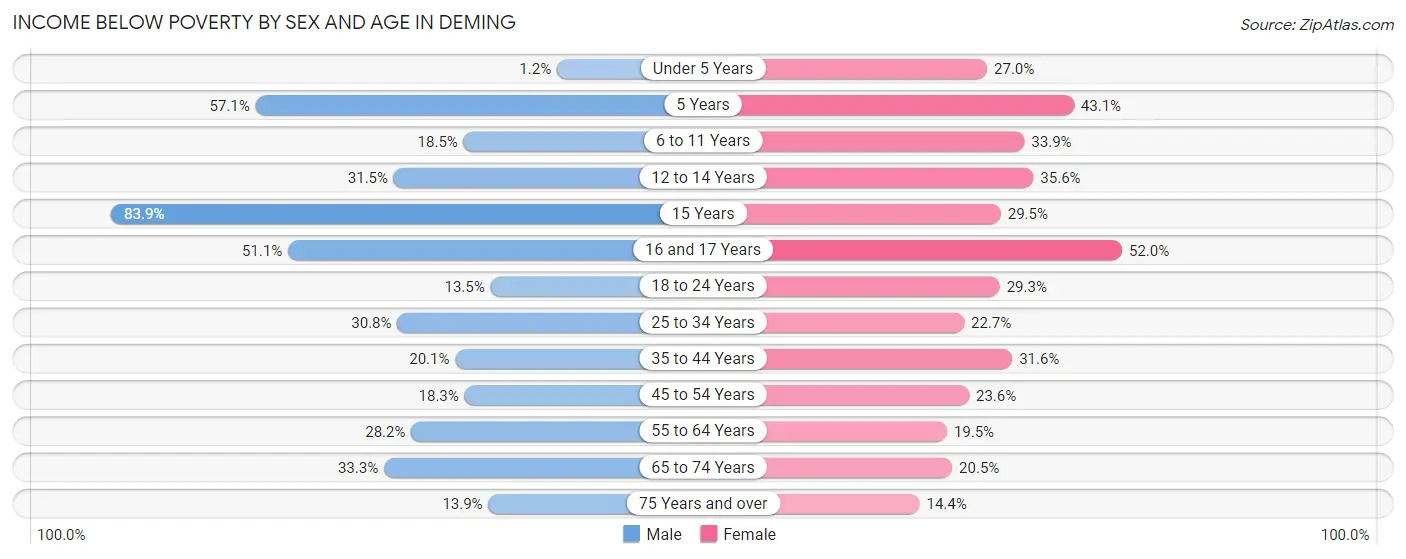
| Age Bracket | Male | Female |
| Under 5 Years | 10 (1.2%) | 147 (27.0%) |
| 5 Years | 36 (57.1%) | 28 (43.1%) |
| 6 to 11 Years | 99 (18.5%) | 259 (33.9%) |
| 12 to 14 Years | 112 (31.5%) | 90 (35.6%) |
| 15 Years | 47 (83.9%) | 31 (29.5%) |
| 16 and 17 Years | 95 (51.1%) | 90 (52.0%) |
| 18 to 24 Years | 70 (13.5%) | 212 (29.3%) |
| 25 to 34 Years | 297 (30.8%) | 184 (22.7%) |
| 35 to 44 Years | 152 (20.1%) | 211 (31.6%) |
| 45 to 54 Years | 112 (18.3%) | 192 (23.6%) |
| 55 to 64 Years | 215 (28.2%) | 163 (19.5%) |
| 65 to 74 Years | 250 (33.3%) | 180 (20.5%) |
| 75 Years and over | 87 (13.9%) | 111 (14.4%) |
| Total | 1,582 (22.5%) | 1,898 (25.6%) |
Income Above Poverty by Sex and Age in Deming
According to the poverty statistics in Deming, males aged under 5 years and females aged 75 years and over are the age groups that are most secure financially, with 98.8% of males and 85.6% of females in these age groups living above the poverty line.
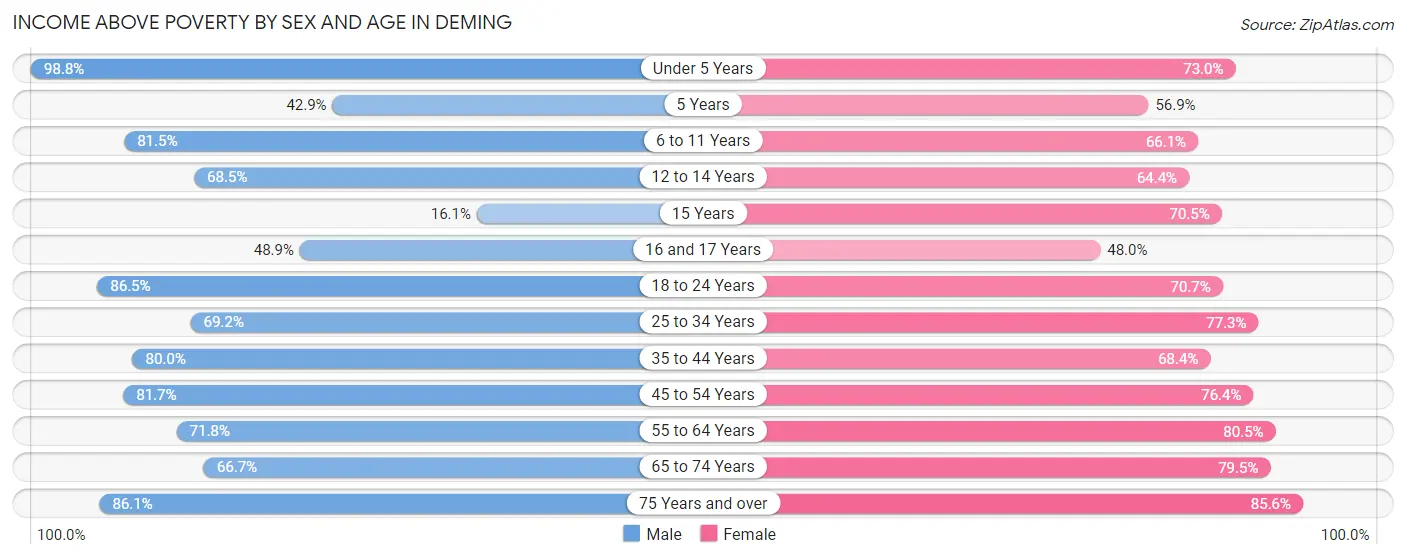
| Age Bracket | Male | Female |
| Under 5 Years | 835 (98.8%) | 398 (73.0%) |
| 5 Years | 27 (42.9%) | 37 (56.9%) |
| 6 to 11 Years | 436 (81.5%) | 505 (66.1%) |
| 12 to 14 Years | 244 (68.5%) | 163 (64.4%) |
| 15 Years | 9 (16.1%) | 74 (70.5%) |
| 16 and 17 Years | 91 (48.9%) | 83 (48.0%) |
| 18 to 24 Years | 448 (86.5%) | 511 (70.7%) |
| 25 to 34 Years | 667 (69.2%) | 627 (77.3%) |
| 35 to 44 Years | 606 (79.9%) | 456 (68.4%) |
| 45 to 54 Years | 499 (81.7%) | 621 (76.4%) |
| 55 to 64 Years | 547 (71.8%) | 672 (80.5%) |
| 65 to 74 Years | 501 (66.7%) | 699 (79.5%) |
| 75 Years and over | 539 (86.1%) | 658 (85.6%) |
| Total | 5,449 (77.5%) | 5,504 (74.4%) |
Income Below Poverty Among Married-Couple Families in Deming
The poverty statistics for married-couple families in Deming show that 13.1% or 264 of the total 2,013 families live below the poverty line. Families with 5 or more children have the highest poverty rate of 100.0%, comprising of 8 families. On the other hand, families with 1 or 2 children have the lowest poverty rate of 5.1%, which includes 23 families.
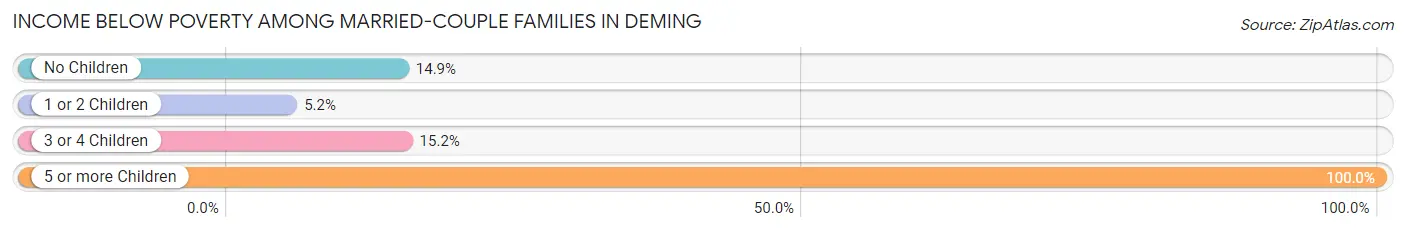
| Children | Above Poverty | Below Poverty |
| No Children | 979 (85.1%) | 171 (14.9%) |
| 1 or 2 Children | 424 (94.9%) | 23 (5.1%) |
| 3 or 4 Children | 346 (84.8%) | 62 (15.2%) |
| 5 or more Children | 0 (0.0%) | 8 (100.0%) |
| Total | 1,749 (86.9%) | 264 (13.1%) |
Income Below Poverty Among Single-Parent Households in Deming
According to the poverty data in Deming, 27.5% or 65 single-father households and 31.1% or 209 single-mother households are living below the poverty line. Among single-father households, those with 3 or 4 children have the highest poverty rate, with 29 households (50.9%) experiencing poverty. Likewise, among single-mother households, those with 5 or more children have the highest poverty rate, with 19 households (100.0%) falling below the poverty line.

| Children | Single Father | Single Mother |
| No Children | 25 (29.8%) | 14 (9.5%) |
| 1 or 2 Children | 11 (11.6%) | 127 (29.3%) |
| 3 or 4 Children | 29 (50.9%) | 49 (68.1%) |
| 5 or more Children | 0 (0.0%) | 19 (100.0%) |
| Total | 65 (27.5%) | 209 (31.1%) |
Income Below Poverty Among Married-Couple vs Single-Parent Households in Deming
The poverty data for Deming shows that 264 of the married-couple family households (13.1%) and 274 of the single-parent households (30.2%) are living below the poverty level. Within the married-couple family households, those with 5 or more children have the highest poverty rate, with 8 households (100.0%) falling below the poverty line. Among the single-parent households, those with 5 or more children have the highest poverty rate, with 19 household (100.0%) living below poverty.
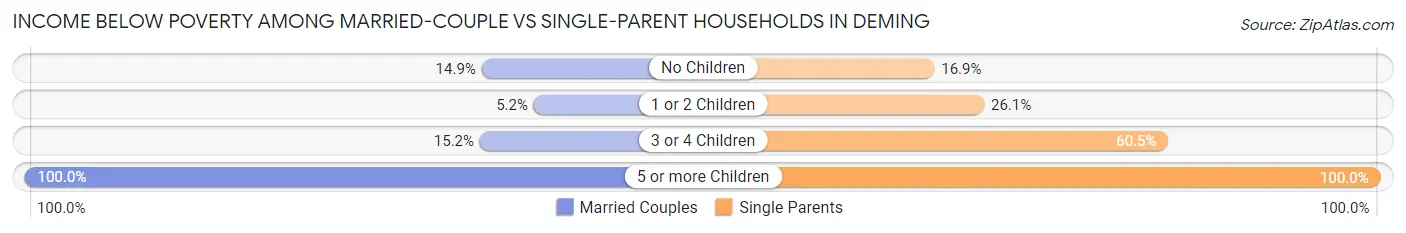
| Children | Married-Couple Families | Single-Parent Households |
| No Children | 171 (14.9%) | 39 (16.9%) |
| 1 or 2 Children | 23 (5.1%) | 138 (26.1%) |
| 3 or 4 Children | 62 (15.2%) | 78 (60.5%) |
| 5 or more Children | 8 (100.0%) | 19 (100.0%) |
| Total | 264 (13.1%) | 274 (30.2%) |
Race in Deming
The most populous races in Deming are Hispanic or Latino (11,067 | 75.0%), White / Caucasian (9,464 | 64.1%), and Two or more Races (3,395 | 23.0%).
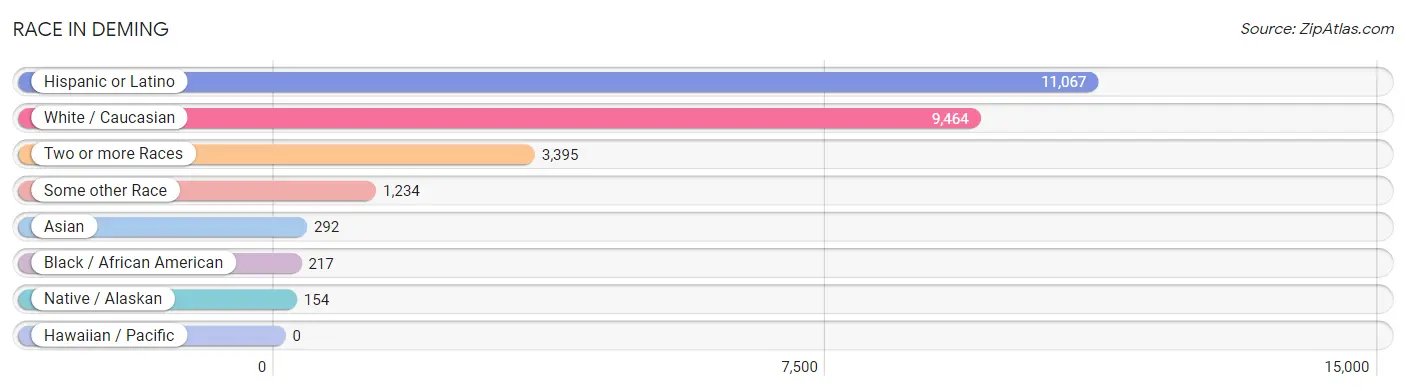
| Race | # Population | % Population |
| Asian | 292 | 2.0% |
| Black / African American | 217 | 1.5% |
| Hawaiian / Pacific | 0 | 0.0% |
| Hispanic or Latino | 11,067 | 75.0% |
| Native / Alaskan | 154 | 1.0% |
| White / Caucasian | 9,464 | 64.1% |
| Two or more Races | 3,395 | 23.0% |
| Some other Race | 1,234 | 8.4% |
| Total | 14,756 | 100.0% |
Ancestry in Deming
The most populous ancestries reported in Deming are Mexican (10,332 | 70.0%), German (517 | 3.5%), American (406 | 2.8%), English (389 | 2.6%), and Irish (367 | 2.5%), together accounting for 81.4% of all Deming residents.
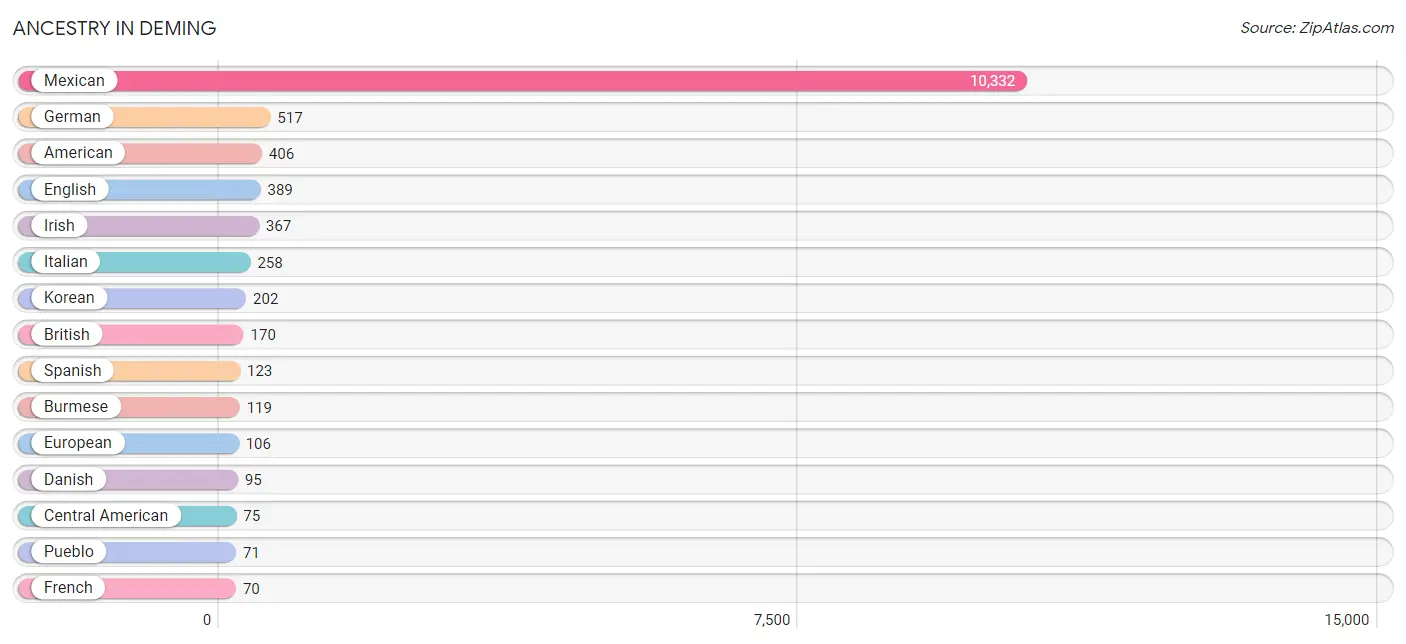
| Ancestry | # Population | % Population |
| American | 406 | 2.8% |
| Apache | 6 | 0.0% |
| Armenian | 7 | 0.1% |
| Basque | 9 | 0.1% |
| British | 170 | 1.1% |
| Burmese | 119 | 0.8% |
| Canadian | 37 | 0.3% |
| Central American | 75 | 0.5% |
| Cherokee | 50 | 0.3% |
| Creek | 19 | 0.1% |
| Cuban | 24 | 0.2% |
| Danish | 95 | 0.6% |
| Dominican | 2 | 0.0% |
| Dutch | 55 | 0.4% |
| English | 389 | 2.6% |
| European | 106 | 0.7% |
| Finnish | 31 | 0.2% |
| French | 70 | 0.5% |
| German | 517 | 3.5% |
| Guatemalan | 22 | 0.2% |
| Hungarian | 4 | 0.0% |
| Iranian | 7 | 0.1% |
| Irish | 367 | 2.5% |
| Italian | 258 | 1.8% |
| Korean | 202 | 1.4% |
| Mexican | 10,332 | 70.0% |
| Mexican American Indian | 38 | 0.3% |
| Navajo | 10 | 0.1% |
| Norwegian | 46 | 0.3% |
| Panamanian | 24 | 0.2% |
| Polish | 56 | 0.4% |
| Pueblo | 71 | 0.5% |
| Puerto Rican | 52 | 0.4% |
| Russian | 17 | 0.1% |
| Salvadoran | 29 | 0.2% |
| Scandinavian | 3 | 0.0% |
| Scotch-Irish | 35 | 0.2% |
| Scottish | 37 | 0.3% |
| Spaniard | 62 | 0.4% |
| Spanish | 123 | 0.8% |
| Spanish American | 29 | 0.2% |
| Swedish | 54 | 0.4% |
| Swiss | 4 | 0.0% |
| Thai | 4 | 0.0% |
| Welsh | 20 | 0.1% |
| Yugoslavian | 21 | 0.1% | View All 46 Rows |
Immigrants in Deming
The most numerous immigrant groups reported in Deming came from Central America (2,665 | 18.1%), Latin America (2,665 | 18.1%), Mexico (2,604 | 17.6%), Asia (90 | 0.6%), and Philippines (79 | 0.5%), together accounting for 54.9% of all Deming residents.
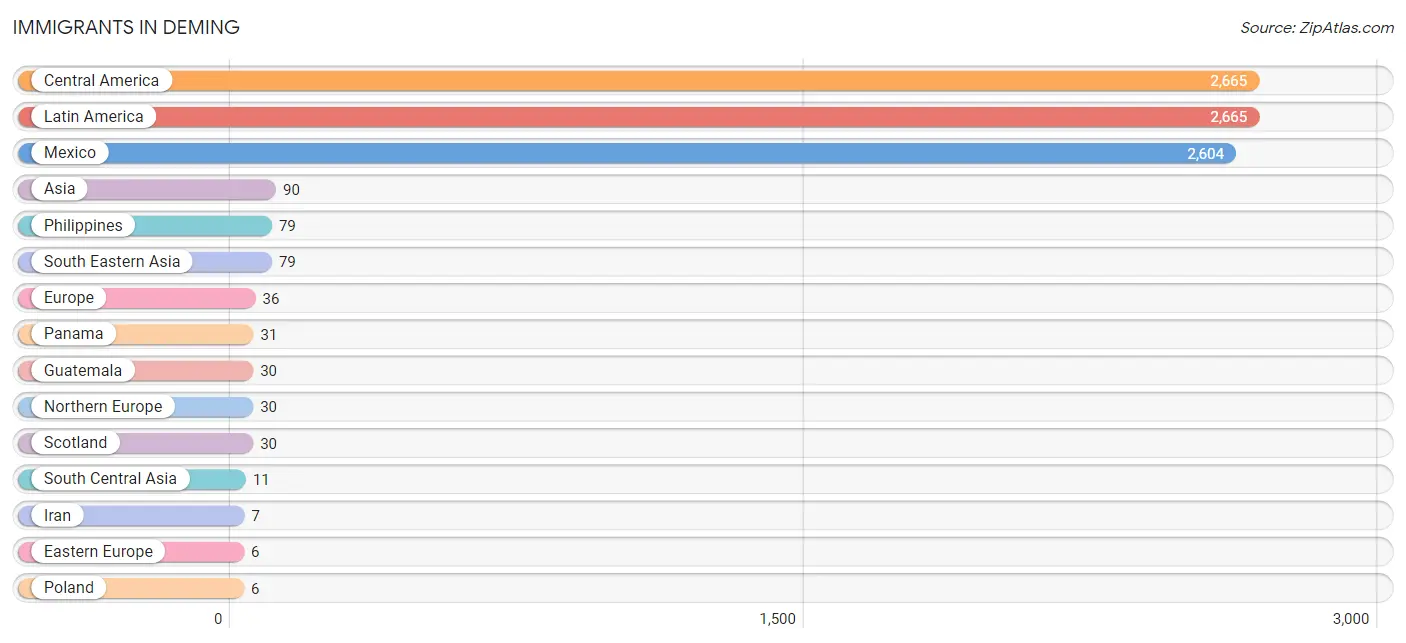
| Immigration Origin | # Population | % Population |
| Asia | 90 | 0.6% |
| Central America | 2,665 | 18.1% |
| Eastern Europe | 6 | 0.0% |
| Europe | 36 | 0.2% |
| Guatemala | 30 | 0.2% |
| India | 4 | 0.0% |
| Iran | 7 | 0.1% |
| Latin America | 2,665 | 18.1% |
| Mexico | 2,604 | 17.6% |
| Northern Europe | 30 | 0.2% |
| Panama | 31 | 0.2% |
| Philippines | 79 | 0.5% |
| Poland | 6 | 0.0% |
| Scotland | 30 | 0.2% |
| South Central Asia | 11 | 0.1% |
| South Eastern Asia | 79 | 0.5% | View All 16 Rows |
Sex and Age in Deming
Sex and Age in Deming
The most populous age groups in Deming are Under 5 Years (845 | 11.7%) for men and 10 to 14 Years (557 | 7.4%) for women.
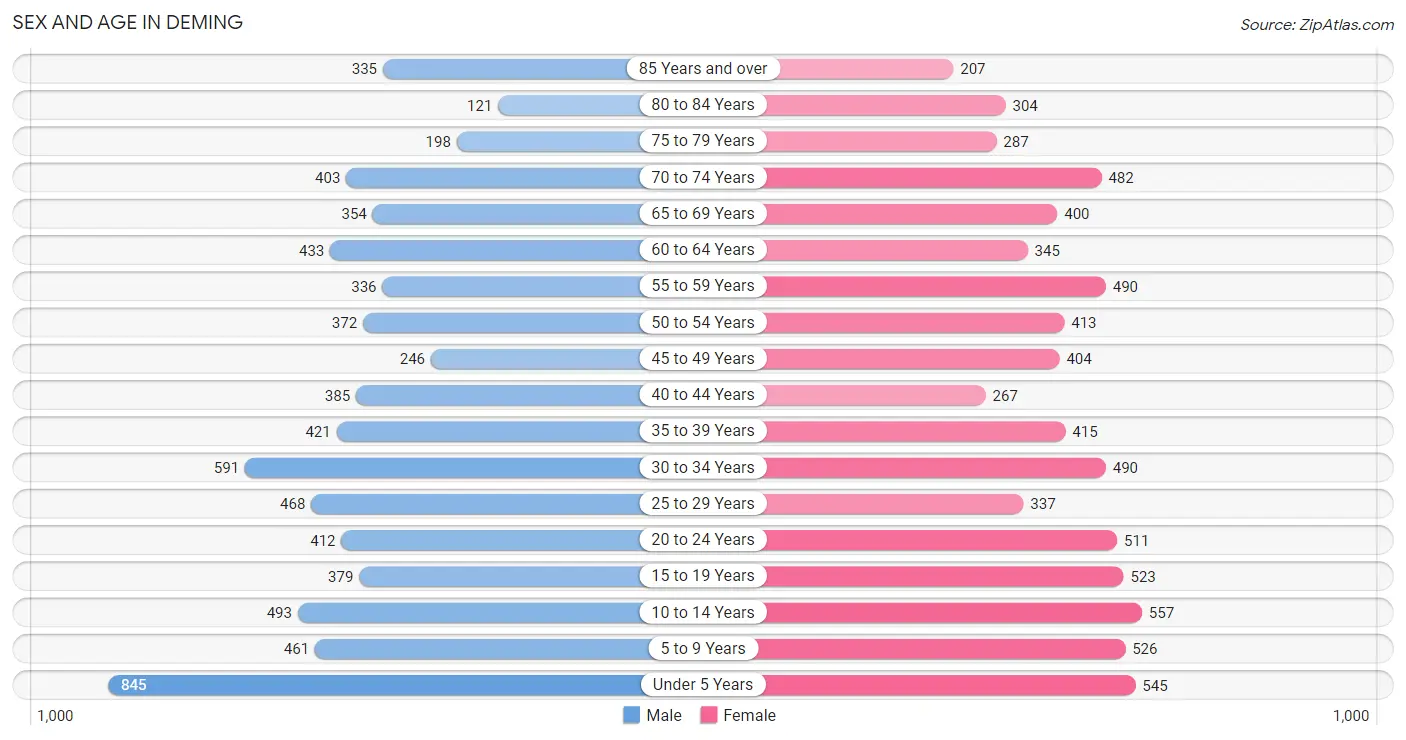
| Age Bracket | Male | Female |
| Under 5 Years | 845 (11.7%) | 545 (7.3%) |
| 5 to 9 Years | 461 (6.4%) | 526 (7.0%) |
| 10 to 14 Years | 493 (6.8%) | 557 (7.4%) |
| 15 to 19 Years | 379 (5.2%) | 523 (7.0%) |
| 20 to 24 Years | 412 (5.7%) | 511 (6.8%) |
| 25 to 29 Years | 468 (6.5%) | 337 (4.5%) |
| 30 to 34 Years | 591 (8.2%) | 490 (6.5%) |
| 35 to 39 Years | 421 (5.8%) | 415 (5.5%) |
| 40 to 44 Years | 385 (5.3%) | 267 (3.6%) |
| 45 to 49 Years | 246 (3.4%) | 404 (5.4%) |
| 50 to 54 Years | 372 (5.1%) | 413 (5.5%) |
| 55 to 59 Years | 336 (4.6%) | 490 (6.5%) |
| 60 to 64 Years | 433 (6.0%) | 345 (4.6%) |
| 65 to 69 Years | 354 (4.9%) | 400 (5.3%) |
| 70 to 74 Years | 403 (5.6%) | 482 (6.4%) |
| 75 to 79 Years | 198 (2.7%) | 287 (3.8%) |
| 80 to 84 Years | 121 (1.7%) | 304 (4.1%) |
| 85 Years and over | 335 (4.6%) | 207 (2.8%) |
| Total | 7,253 (100.0%) | 7,503 (100.0%) |
Families and Households in Deming
Median Family Size in Deming
The median family size in Deming is 3.84 persons per family, with single female/mother families (671 | 23.0%) accounting for the largest median family size of 4.01 persons per family. On the other hand, single male/father families (236 | 8.1%) represent the smallest median family size with 3.55 persons per family.
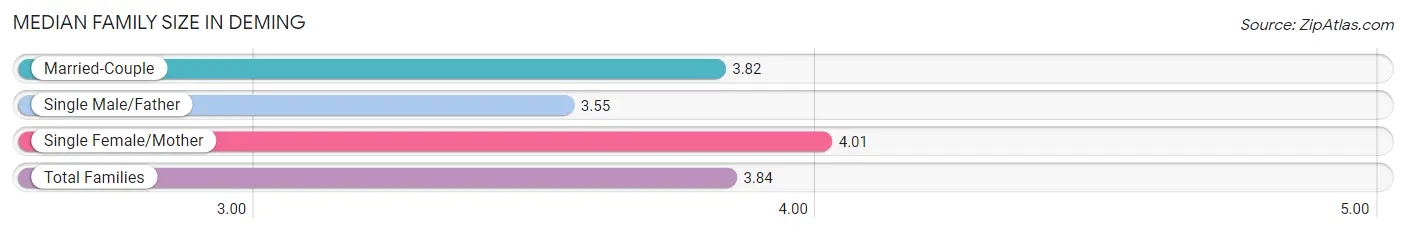
| Family Type | # Families | Family Size |
| Married-Couple | 2,013 (68.9%) | 3.82 |
| Single Male/Father | 236 (8.1%) | 3.55 |
| Single Female/Mother | 671 (23.0%) | 4.01 |
| Total Families | 2,920 (100.0%) | 3.84 |
Median Household Size in Deming
The median household size in Deming is 2.67 persons per household, with single male/father households (236 | 4.4%) accounting for the largest median household size of 4.22 persons per household. non-family households (2,472 | 45.9%) represent the smallest median household size with 1.16 persons per household.
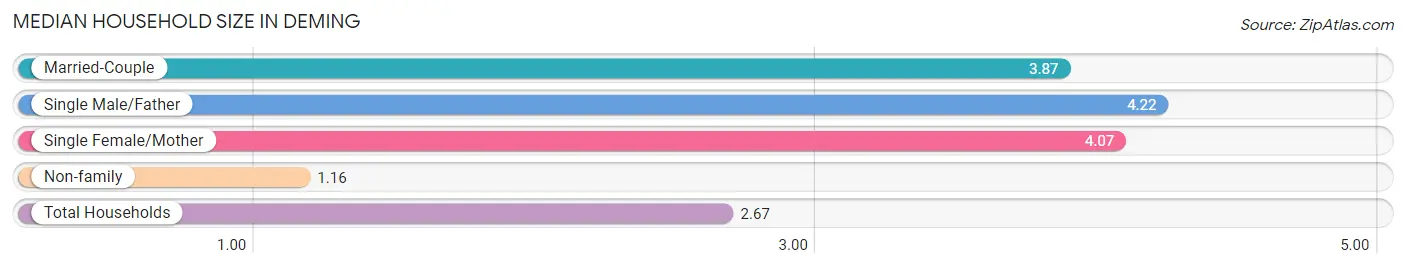
| Household Type | # Households | Household Size |
| Married-Couple | 2,013 (37.3%) | 3.87 |
| Single Male/Father | 236 (4.4%) | 4.22 |
| Single Female/Mother | 671 (12.4%) | 4.07 |
| Non-family | 2,472 (45.9%) | 1.16 |
| Total Households | 5,392 (100.0%) | 2.67 |
Household Size by Marriage Status in Deming
Out of a total of 5,392 households in Deming, 2,920 (54.1%) are family households, while 2,472 (45.9%) are nonfamily households. The most numerous type of family households are 2-person households, comprising 1,062, and the most common type of nonfamily households are 1-person households, comprising 2,250.
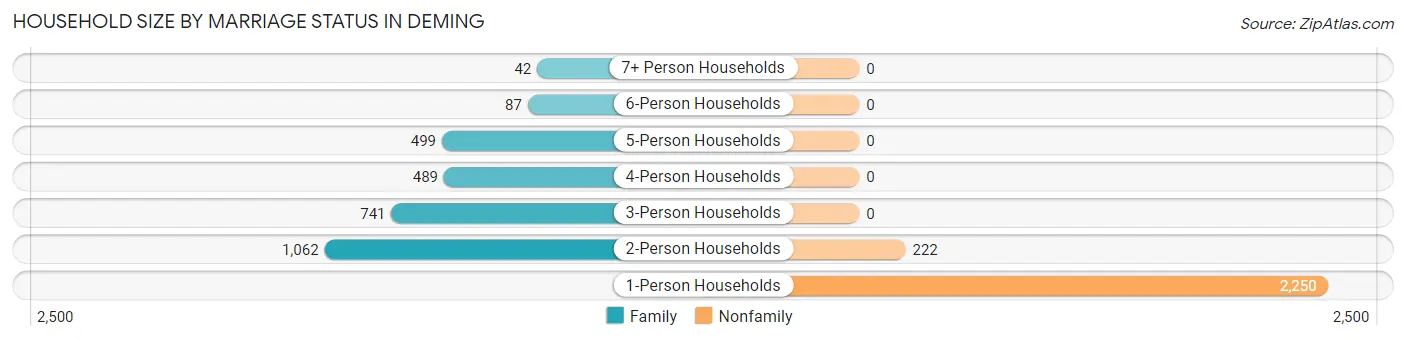
| Household Size | Family Households | Nonfamily Households |
| 1-Person Households | - | 2,250 (41.7%) |
| 2-Person Households | 1,062 (19.7%) | 222 (4.1%) |
| 3-Person Households | 741 (13.7%) | 0 (0.0%) |
| 4-Person Households | 489 (9.1%) | 0 (0.0%) |
| 5-Person Households | 499 (9.2%) | 0 (0.0%) |
| 6-Person Households | 87 (1.6%) | 0 (0.0%) |
| 7+ Person Households | 42 (0.8%) | 0 (0.0%) |
| Total | 2,920 (54.1%) | 2,472 (45.9%) |
Female Fertility in Deming
Fertility by Age in Deming
Average fertility rate in Deming is 38.0 births per 1,000 women. Women in the age bracket of 20 to 34 years have the highest fertility rate with 75.0 births per 1,000 women. Women in the age bracket of 20 to 34 years acount for 89.4% of all women with births.
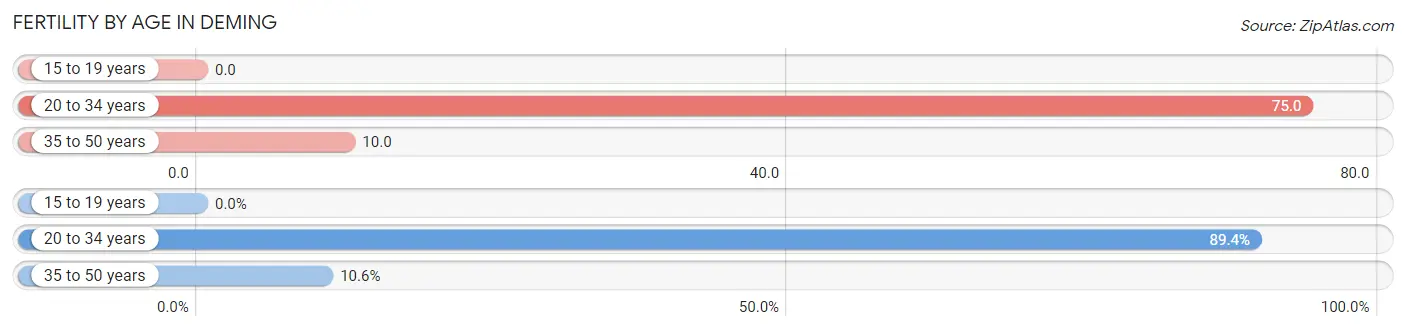
| Age Bracket | Women with Births | Births / 1,000 Women |
| 15 to 19 years | 0 (0.0%) | 0.0 |
| 20 to 34 years | 101 (89.4%) | 75.0 |
| 35 to 50 years | 12 (10.6%) | 10.0 |
| Total | 113 (100.0%) | 38.0 |
Fertility by Age by Marriage Status in Deming
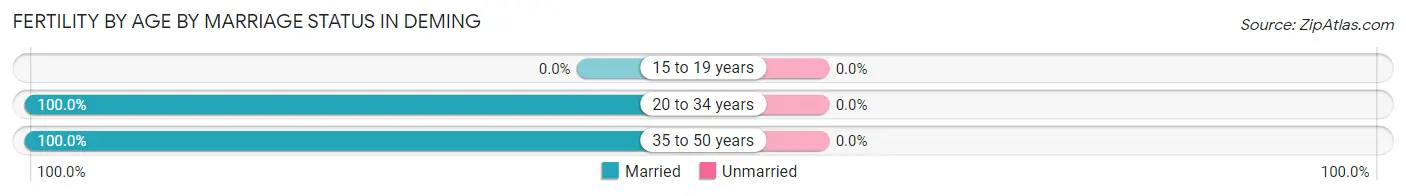
| Age Bracket | Married | Unmarried |
| 15 to 19 years | 0 (0.0%) | 0 (0.0%) |
| 20 to 34 years | 101 (100.0%) | 0 (0.0%) |
| 35 to 50 years | 12 (100.0%) | 0 (0.0%) |
| Total | 113 (100.0%) | 0 (0.0%) |
Fertility by Education in Deming
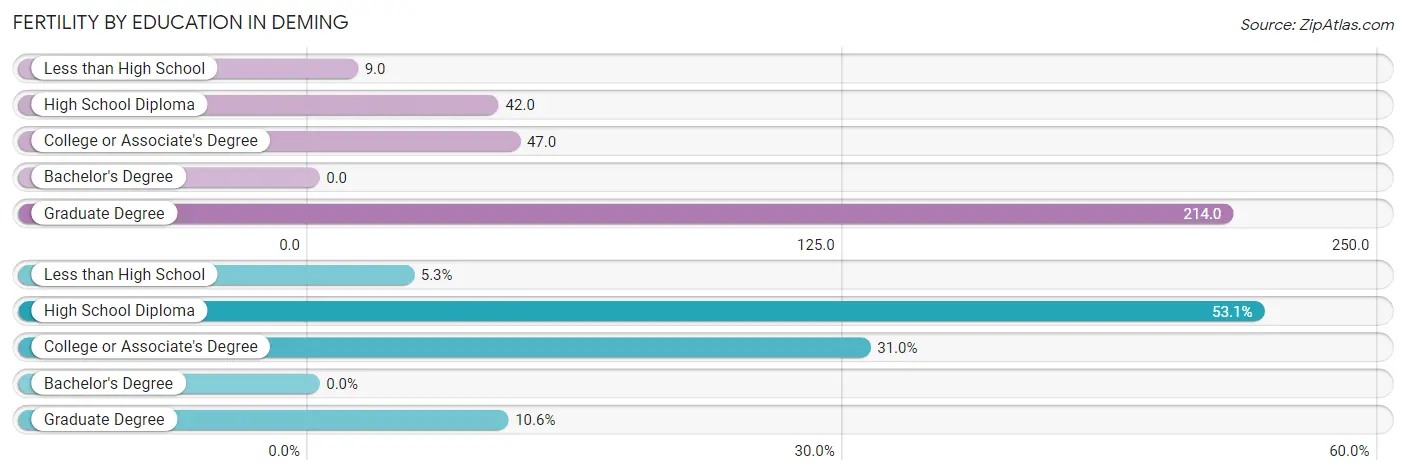
| Educational Attainment | Women with Births | Births / 1,000 Women |
| Less than High School | 6 (5.3%) | 9.0 |
| High School Diploma | 60 (53.1%) | 42.0 |
| College or Associate's Degree | 35 (31.0%) | 47.0 |
| Bachelor's Degree | 0 (0.0%) | 0.0 |
| Graduate Degree | 12 (10.6%) | 214.0 |
| Total | 113 (100.0%) | 38.0 |
Fertility by Education by Marriage Status in Deming
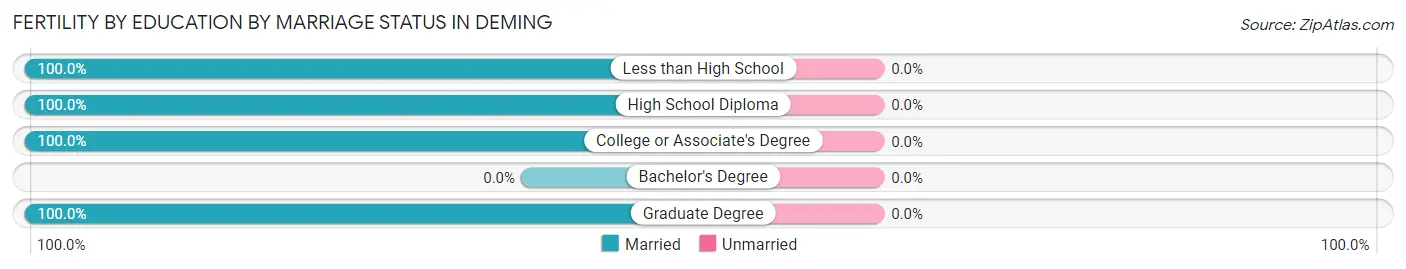
| Educational Attainment | Married | Unmarried |
| Less than High School | 6 (100.0%) | 0 (0.0%) |
| High School Diploma | 60 (100.0%) | 0 (0.0%) |
| College or Associate's Degree | 35 (100.0%) | 0 (0.0%) |
| Bachelor's Degree | 0 (0.0%) | 0 (0.0%) |
| Graduate Degree | 12 (100.0%) | 0 (0.0%) |
| Total | 113 (100.0%) | 0 (0.0%) |
Employment Characteristics in Deming
Employment by Class of Employer in Deming
Among the 4,562 employed individuals in Deming, private company employees (3,065 | 67.2%), local government employees (489 | 10.7%), and state government employees (400 | 8.8%) make up the most common classes of employment.
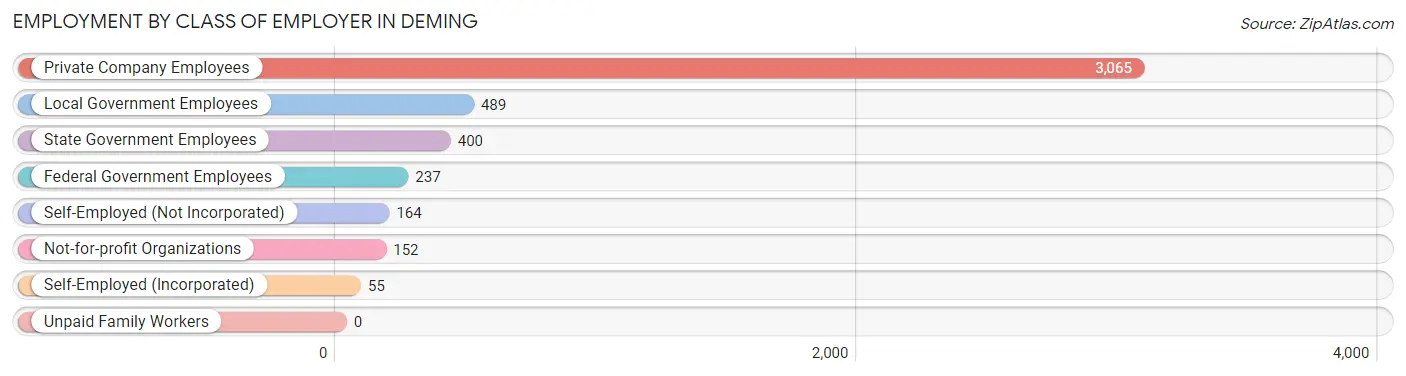
| Employer Class | # Employees | % Employees |
| Private Company Employees | 3,065 | 67.2% |
| Self-Employed (Incorporated) | 55 | 1.2% |
| Self-Employed (Not Incorporated) | 164 | 3.6% |
| Not-for-profit Organizations | 152 | 3.3% |
| Local Government Employees | 489 | 10.7% |
| State Government Employees | 400 | 8.8% |
| Federal Government Employees | 237 | 5.2% |
| Unpaid Family Workers | 0 | 0.0% |
| Total | 4,562 | 100.0% |
Employment Status by Age in Deming
According to the labor force statistics for Deming, out of the total population over 16 years of age (11,168), 45.4% or 5,070 individuals are in the labor force, with 7.5% or 380 of them unemployed. The age group with the highest labor force participation rate is 45 to 54 years, with 74.8% or 1,073 individuals in the labor force. Within the labor force, the 55 to 59 years age range has the highest percentage of unemployed individuals, with 18.8% or 102 of them being unemployed.
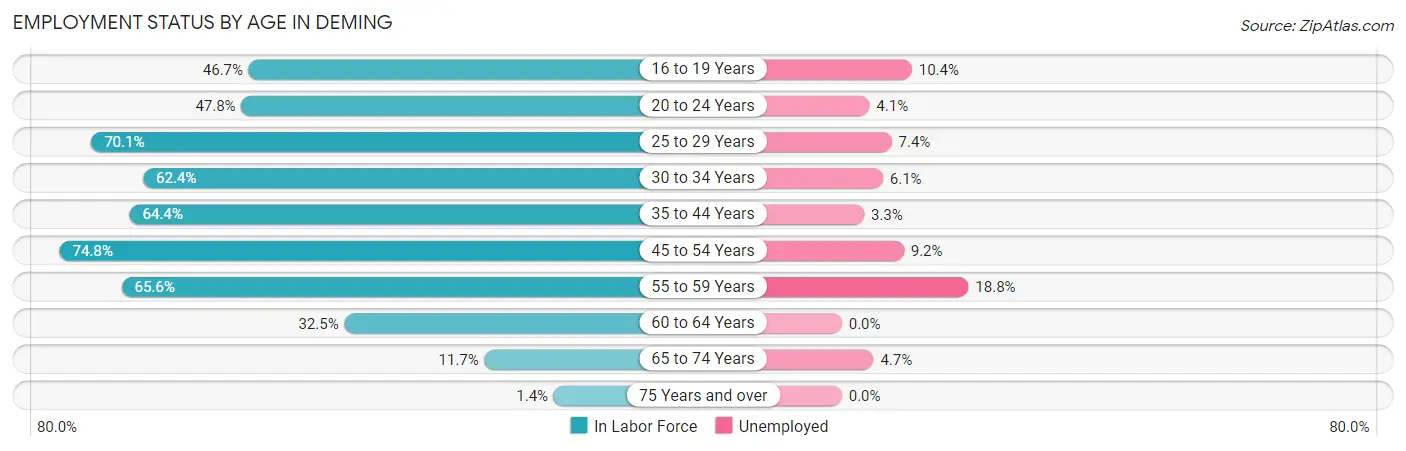
| Age Bracket | In Labor Force | Unemployed |
| 16 to 19 Years | 346 (46.7%) | 36 (10.4%) |
| 20 to 24 Years | 441 (47.8%) | 18 (4.1%) |
| 25 to 29 Years | 564 (70.1%) | 42 (7.4%) |
| 30 to 34 Years | 675 (62.4%) | 41 (6.1%) |
| 35 to 44 Years | 958 (64.4%) | 32 (3.3%) |
| 45 to 54 Years | 1,073 (74.8%) | 99 (9.2%) |
| 55 to 59 Years | 542 (65.6%) | 102 (18.8%) |
| 60 to 64 Years | 253 (32.5%) | 0 (0.0%) |
| 65 to 74 Years | 192 (11.7%) | 9 (4.7%) |
| 75 Years and over | 20 (1.4%) | 0 (0.0%) |
| Total | 5,070 (45.4%) | 380 (7.5%) |
Employment Status by Educational Attainment in Deming
According to labor force statistics for Deming, 63.4% of individuals (4,066) out of the total population between 25 and 64 years of age (6,413) are in the labor force, with 7.8% or 317 of them being unemployed. The group with the highest labor force participation rate are those with the educational attainment of bachelor's degree or higher, with 91.6% or 468 individuals in the labor force. Within the labor force, individuals with less than high school education have the highest percentage of unemployment, with 12.6% or 97 of them being unemployed.
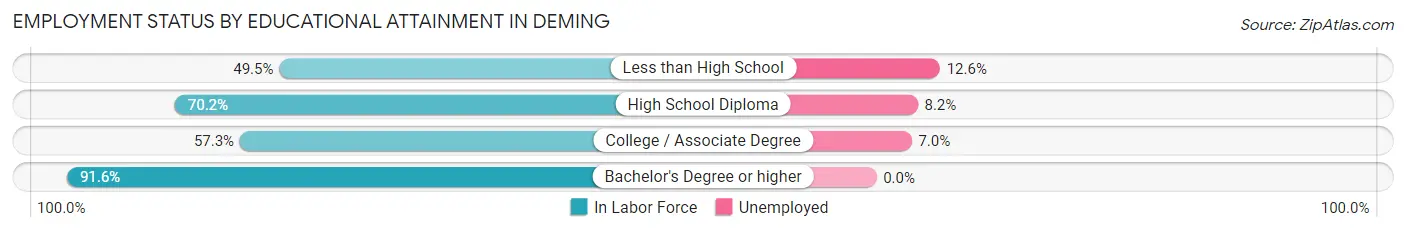
| Educational Attainment | In Labor Force | Unemployed |
| Less than High School | 769 (49.5%) | 196 (12.6%) |
| High School Diploma | 1,834 (70.2%) | 214 (8.2%) |
| College / Associate Degree | 994 (57.3%) | 121 (7.0%) |
| Bachelor's Degree or higher | 468 (91.6%) | 0 (0.0%) |
| Total | 4,066 (63.4%) | 500 (7.8%) |
Employment Occupations by Sex in Deming
Management, Business, Science and Arts Occupations
The most common Management, Business, Science and Arts occupations in Deming are Community & Social Service (450 | 9.7%), Education Instruction & Library (340 | 7.3%), Management (316 | 6.8%), Business & Financial (175 | 3.7%), and Computers, Engineering & Science (113 | 2.4%).
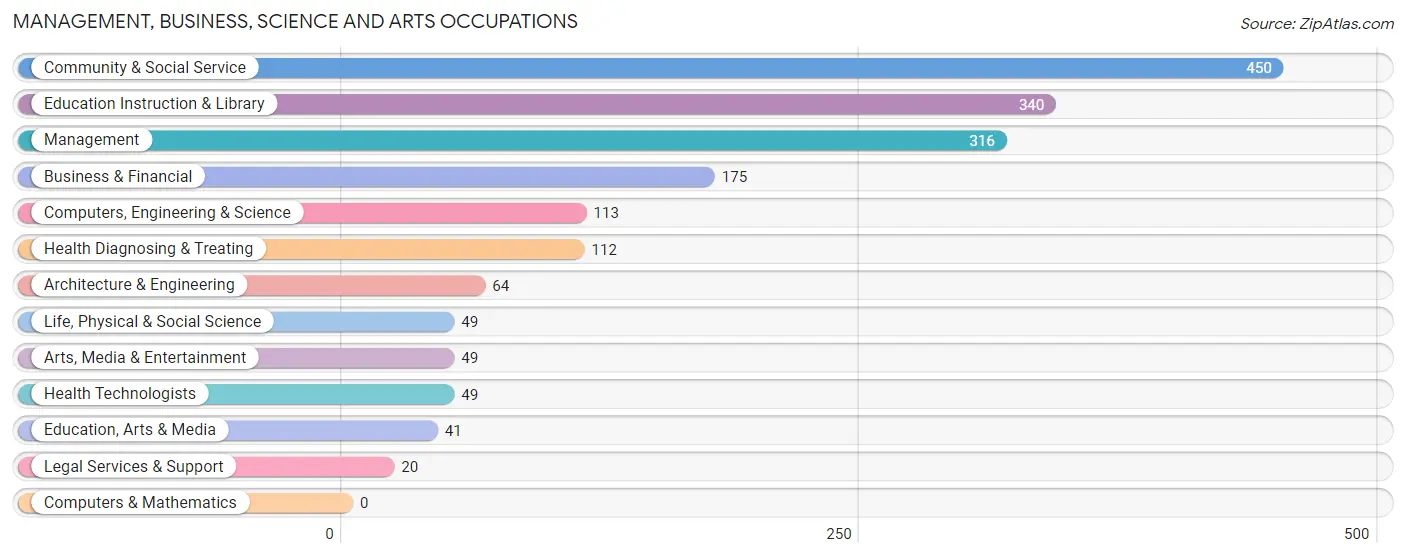
Management, Business, Science and Arts Occupations by Sex
Within the Management, Business, Science and Arts occupations in Deming, the most male-oriented occupations are Computers, Engineering & Science (100.0%), Architecture & Engineering (100.0%), and Life, Physical & Social Science (100.0%), while the most female-oriented occupations are Education, Arts & Media (100.0%), Legal Services & Support (100.0%), and Arts, Media & Entertainment (100.0%).
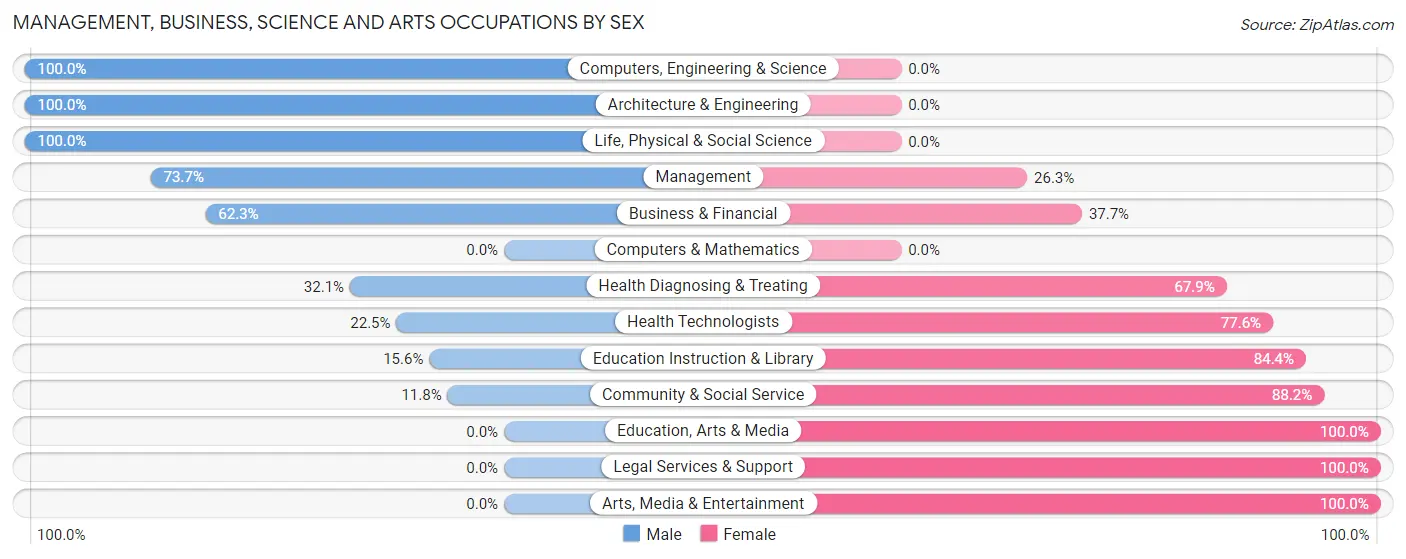
| Occupation | Male | Female |
| Management | 233 (73.7%) | 83 (26.3%) |
| Business & Financial | 109 (62.3%) | 66 (37.7%) |
| Computers, Engineering & Science | 113 (100.0%) | 0 (0.0%) |
| Computers & Mathematics | 0 (0.0%) | 0 (0.0%) |
| Architecture & Engineering | 64 (100.0%) | 0 (0.0%) |
| Life, Physical & Social Science | 49 (100.0%) | 0 (0.0%) |
| Community & Social Service | 53 (11.8%) | 397 (88.2%) |
| Education, Arts & Media | 0 (0.0%) | 41 (100.0%) |
| Legal Services & Support | 0 (0.0%) | 20 (100.0%) |
| Education Instruction & Library | 53 (15.6%) | 287 (84.4%) |
| Arts, Media & Entertainment | 0 (0.0%) | 49 (100.0%) |
| Health Diagnosing & Treating | 36 (32.1%) | 76 (67.9%) |
| Health Technologists | 11 (22.5%) | 38 (77.5%) |
| Total (Category) | 544 (46.7%) | 622 (53.3%) |
| Total (Overall) | 2,535 (54.3%) | 2,129 (45.7%) |
Services Occupations
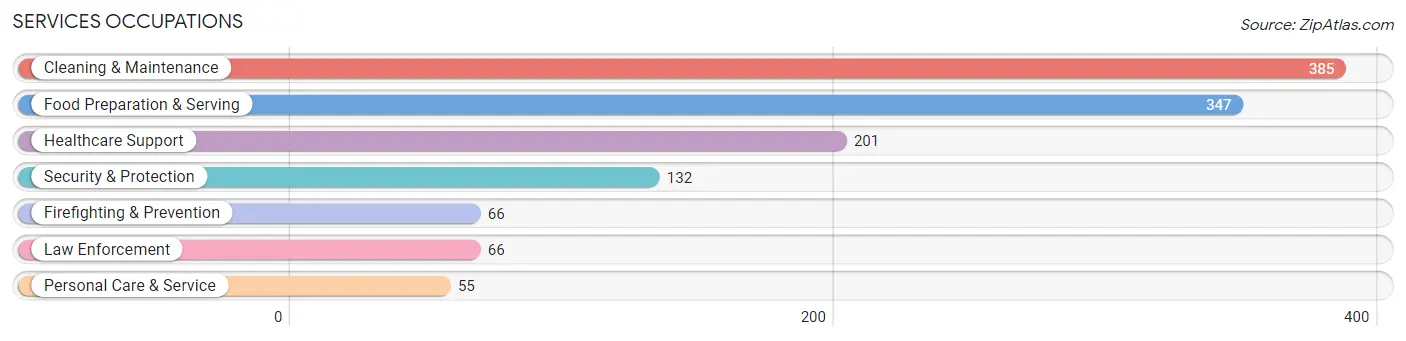
The most common Services occupations in Deming are Cleaning & Maintenance (385 | 8.3%), Food Preparation & Serving (347 | 7.4%), Healthcare Support (201 | 4.3%), Security & Protection (132 | 2.8%), and Firefighting & Prevention (66 | 1.4%).
Services Occupations by Sex
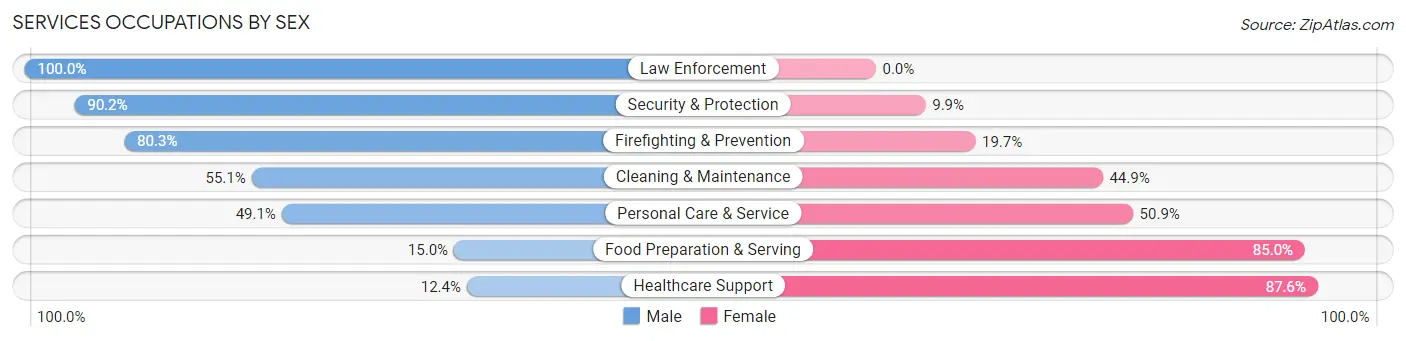
Within the Services occupations in Deming, the most male-oriented occupations are Law Enforcement (100.0%), Security & Protection (90.1%), and Firefighting & Prevention (80.3%), while the most female-oriented occupations are Healthcare Support (87.6%), Food Preparation & Serving (85.0%), and Personal Care & Service (50.9%).
| Occupation | Male | Female |
| Healthcare Support | 25 (12.4%) | 176 (87.6%) |
| Security & Protection | 119 (90.1%) | 13 (9.9%) |
| Firefighting & Prevention | 53 (80.3%) | 13 (19.7%) |
| Law Enforcement | 66 (100.0%) | 0 (0.0%) |
| Food Preparation & Serving | 52 (15.0%) | 295 (85.0%) |
| Cleaning & Maintenance | 212 (55.1%) | 173 (44.9%) |
| Personal Care & Service | 27 (49.1%) | 28 (50.9%) |
| Total (Category) | 435 (38.8%) | 685 (61.2%) |
| Total (Overall) | 2,535 (54.3%) | 2,129 (45.7%) |
Sales and Office Occupations
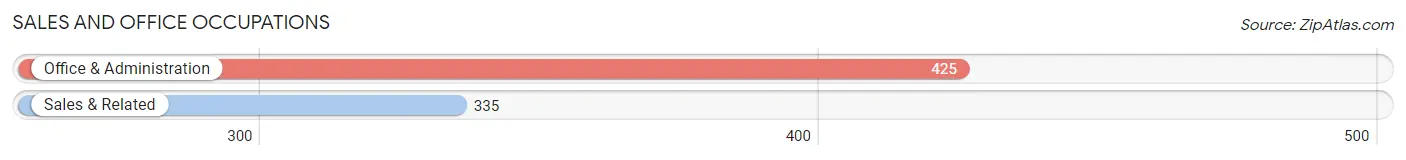
The most common Sales and Office occupations in Deming are Office & Administration (425 | 9.1%), and Sales & Related (335 | 7.2%).
Sales and Office Occupations by Sex

| Occupation | Male | Female |
| Sales & Related | 93 (27.8%) | 242 (72.2%) |
| Office & Administration | 76 (17.9%) | 349 (82.1%) |
| Total (Category) | 169 (22.2%) | 591 (77.8%) |
| Total (Overall) | 2,535 (54.3%) | 2,129 (45.7%) |
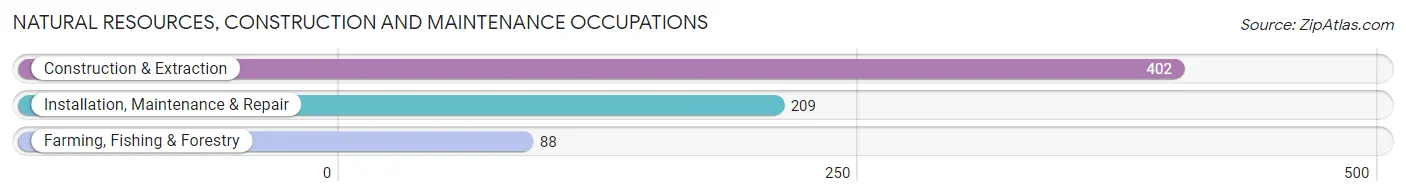
Natural Resources, Construction and Maintenance Occupations
The most common Natural Resources, Construction and Maintenance occupations in Deming are Construction & Extraction (402 | 8.6%), Installation, Maintenance & Repair (209 | 4.5%), and Farming, Fishing & Forestry (88 | 1.9%).
Natural Resources, Construction and Maintenance Occupations by Sex
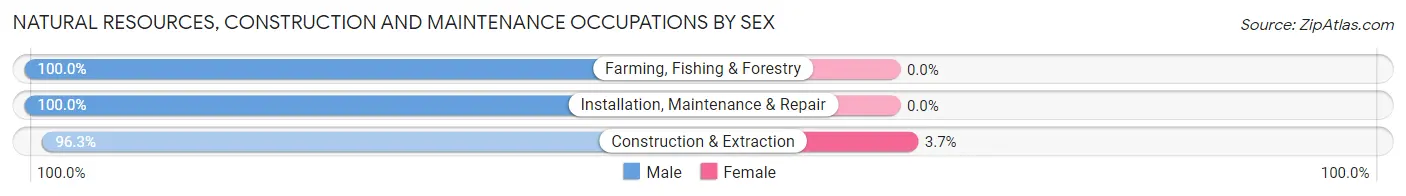
| Occupation | Male | Female |
| Farming, Fishing & Forestry | 88 (100.0%) | 0 (0.0%) |
| Construction & Extraction | 387 (96.3%) | 15 (3.7%) |
| Installation, Maintenance & Repair | 209 (100.0%) | 0 (0.0%) |
| Total (Category) | 684 (97.9%) | 15 (2.1%) |
| Total (Overall) | 2,535 (54.3%) | 2,129 (45.7%) |
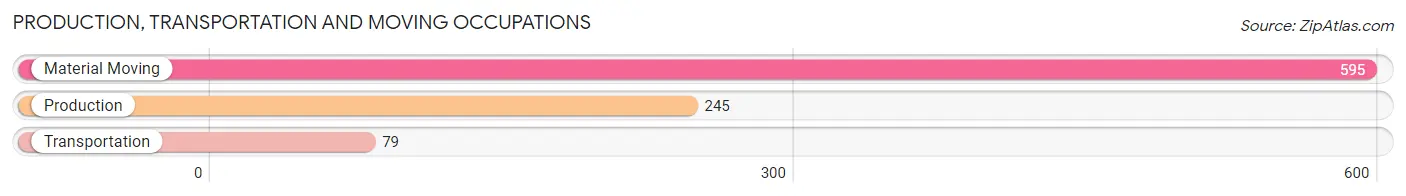
Production, Transportation and Moving Occupations
The most common Production, Transportation and Moving occupations in Deming are Material Moving (595 | 12.8%), Production (245 | 5.2%), and Transportation (79 | 1.7%).
Production, Transportation and Moving Occupations by Sex
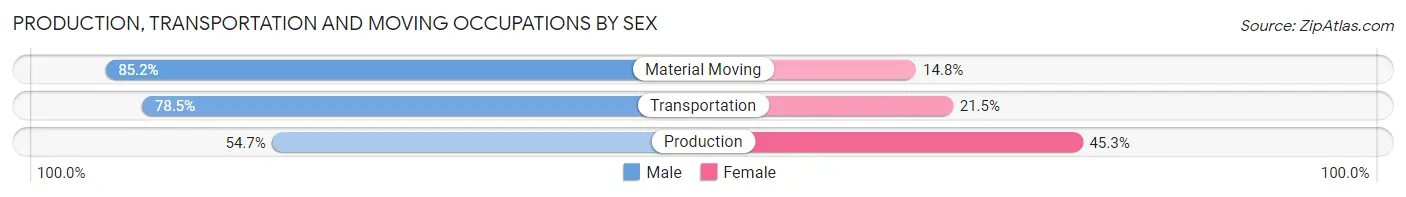
| Occupation | Male | Female |
| Production | 134 (54.7%) | 111 (45.3%) |
| Transportation | 62 (78.5%) | 17 (21.5%) |
| Material Moving | 507 (85.2%) | 88 (14.8%) |
| Total (Category) | 703 (76.5%) | 216 (23.5%) |
| Total (Overall) | 2,535 (54.3%) | 2,129 (45.7%) |
Employment Industries by Sex in Deming
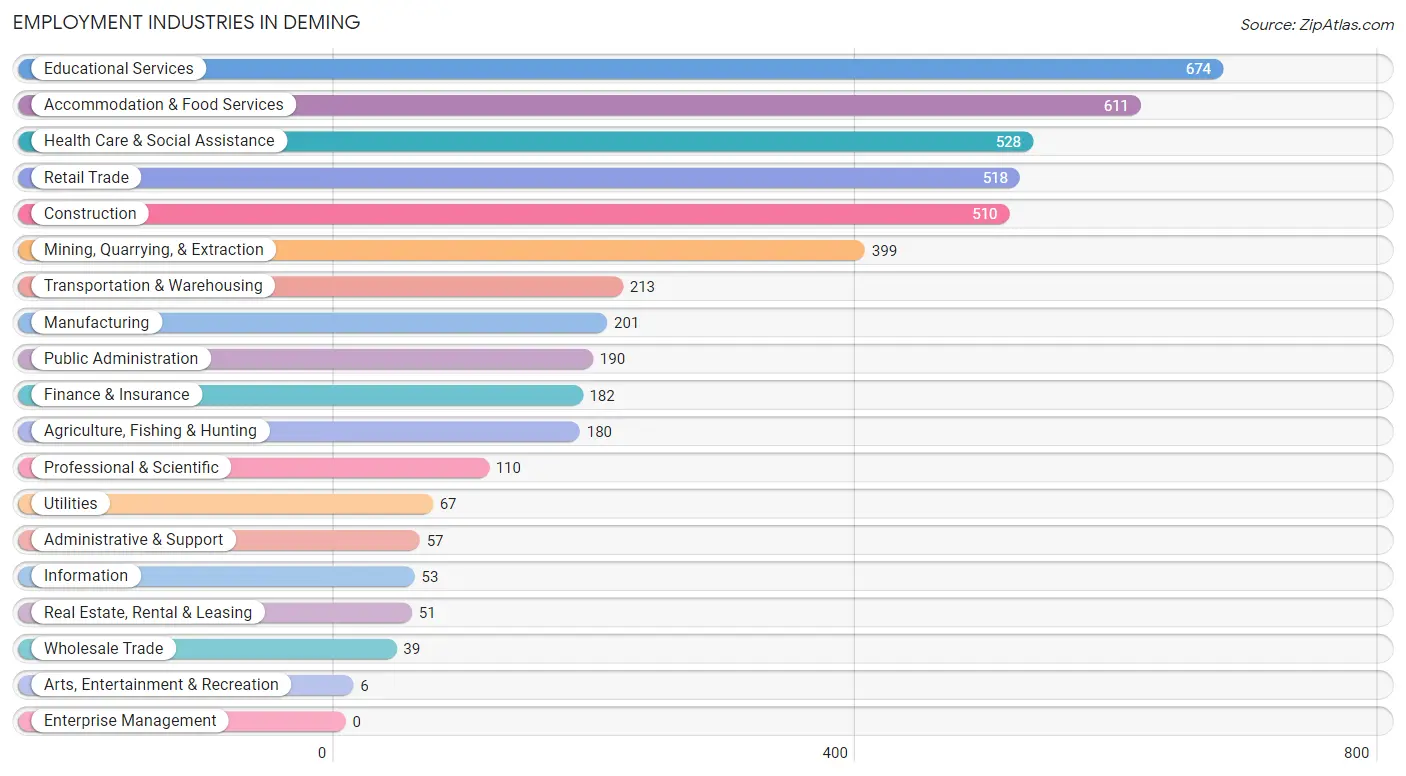
Employment Industries in Deming
The major employment industries in Deming include Educational Services (674 | 14.4%), Accommodation & Food Services (611 | 13.1%), Health Care & Social Assistance (528 | 11.3%), Retail Trade (518 | 11.1%), and Construction (510 | 10.9%).
Employment Industries by Sex in Deming
The Deming industries that see more men than women are Mining, Quarrying, & Extraction (100.0%), Information (100.0%), and Transportation & Warehousing (96.7%), whereas the industries that tend to have a higher number of women are Utilities (100.0%), Arts, Entertainment & Recreation (100.0%), and Wholesale Trade (82.1%).
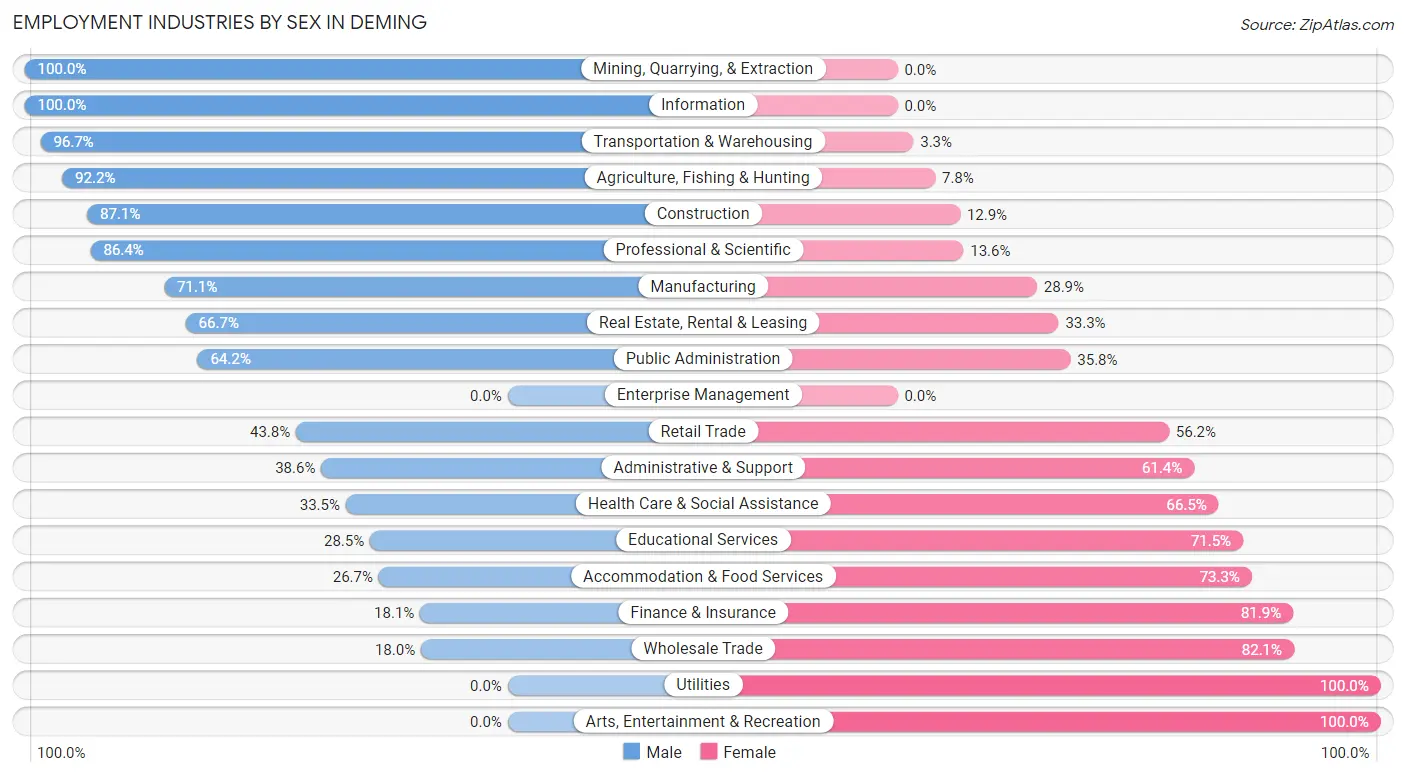
| Industry | Male | Female |
| Agriculture, Fishing & Hunting | 166 (92.2%) | 14 (7.8%) |
| Mining, Quarrying, & Extraction | 399 (100.0%) | 0 (0.0%) |
| Construction | 444 (87.1%) | 66 (12.9%) |
| Manufacturing | 143 (71.1%) | 58 (28.9%) |
| Wholesale Trade | 7 (17.9%) | 32 (82.1%) |
| Retail Trade | 227 (43.8%) | 291 (56.2%) |
| Transportation & Warehousing | 206 (96.7%) | 7 (3.3%) |
| Utilities | 0 (0.0%) | 67 (100.0%) |
| Information | 53 (100.0%) | 0 (0.0%) |
| Finance & Insurance | 33 (18.1%) | 149 (81.9%) |
| Real Estate, Rental & Leasing | 34 (66.7%) | 17 (33.3%) |
| Professional & Scientific | 95 (86.4%) | 15 (13.6%) |
| Enterprise Management | 0 (0.0%) | 0 (0.0%) |
| Administrative & Support | 22 (38.6%) | 35 (61.4%) |
| Educational Services | 192 (28.5%) | 482 (71.5%) |
| Health Care & Social Assistance | 177 (33.5%) | 351 (66.5%) |
| Arts, Entertainment & Recreation | 0 (0.0%) | 6 (100.0%) |
| Accommodation & Food Services | 163 (26.7%) | 448 (73.3%) |
| Public Administration | 122 (64.2%) | 68 (35.8%) |
| Total | 2,535 (54.3%) | 2,129 (45.7%) |
Education in Deming
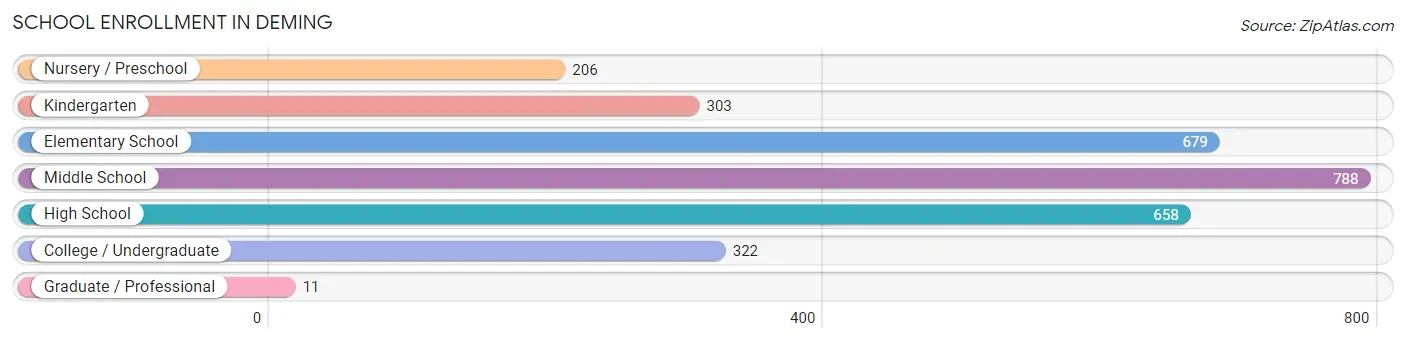
School Enrollment in Deming
The most common levels of schooling among the 2,967 students in Deming are middle school (788 | 26.6%), elementary school (679 | 22.9%), and high school (658 | 22.2%).
| School Level | # Students | % Students |
| Nursery / Preschool | 206 | 6.9% |
| Kindergarten | 303 | 10.2% |
| Elementary School | 679 | 22.9% |
| Middle School | 788 | 26.6% |
| High School | 658 | 22.2% |
| College / Undergraduate | 322 | 10.8% |
| Graduate / Professional | 11 | 0.4% |
| Total | 2,967 | 100.0% |
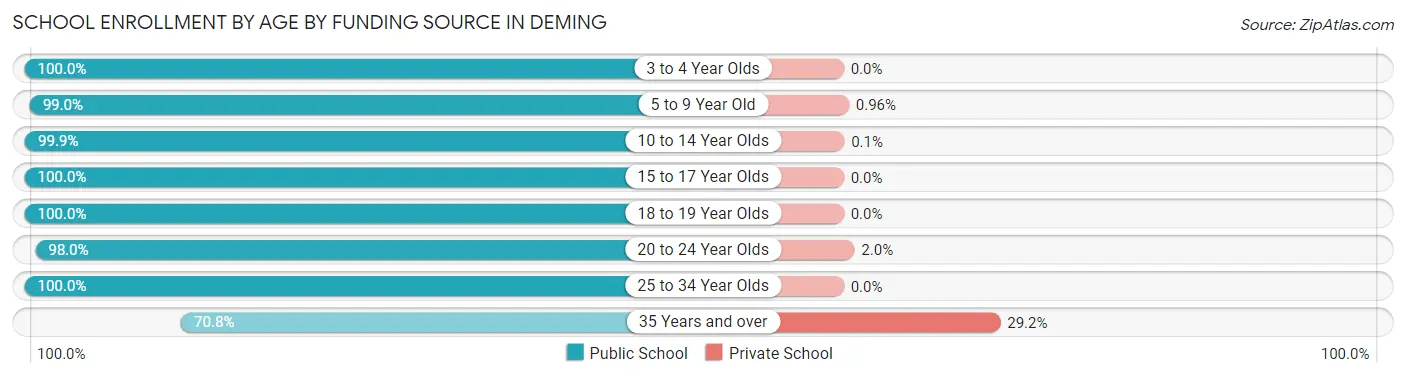
School Enrollment by Age by Funding Source in Deming
Out of a total of 2,967 students who are enrolled in schools in Deming, 27 (0.9%) attend a private institution, while the remaining 2,940 (99.1%) are enrolled in public schools. The age group of 35 years and over has the highest likelihood of being enrolled in private schools, with 14 (29.2% in the age bracket) enrolled. Conversely, the age group of 3 to 4 year olds has the lowest likelihood of being enrolled in a private school, with 199 (100.0% in the age bracket) attending a public institution.
| Age Bracket | Public School | Private School |
| 3 to 4 Year Olds | 199 (100.0%) | 0 (0.0%) |
| 5 to 9 Year Old | 924 (99.0%) | 9 (1.0%) |
| 10 to 14 Year Olds | 984 (99.9%) | 1 (0.1%) |
| 15 to 17 Year Olds | 489 (100.0%) | 0 (0.0%) |
| 18 to 19 Year Olds | 116 (100.0%) | 0 (0.0%) |
| 20 to 24 Year Olds | 98 (98.0%) | 2 (2.0%) |
| 25 to 34 Year Olds | 97 (100.0%) | 0 (0.0%) |
| 35 Years and over | 34 (70.8%) | 14 (29.2%) |
| Total | 2,940 (99.1%) | 27 (0.9%) |
Educational Attainment by Field of Study in Deming
Education (342 | 30.6%), business (151 | 13.5%), arts & humanities (128 | 11.5%), physical & health sciences (86 | 7.7%), and engineering (85 | 7.6%) are the most common fields of study among 1,116 individuals in Deming who have obtained a bachelor's degree or higher.
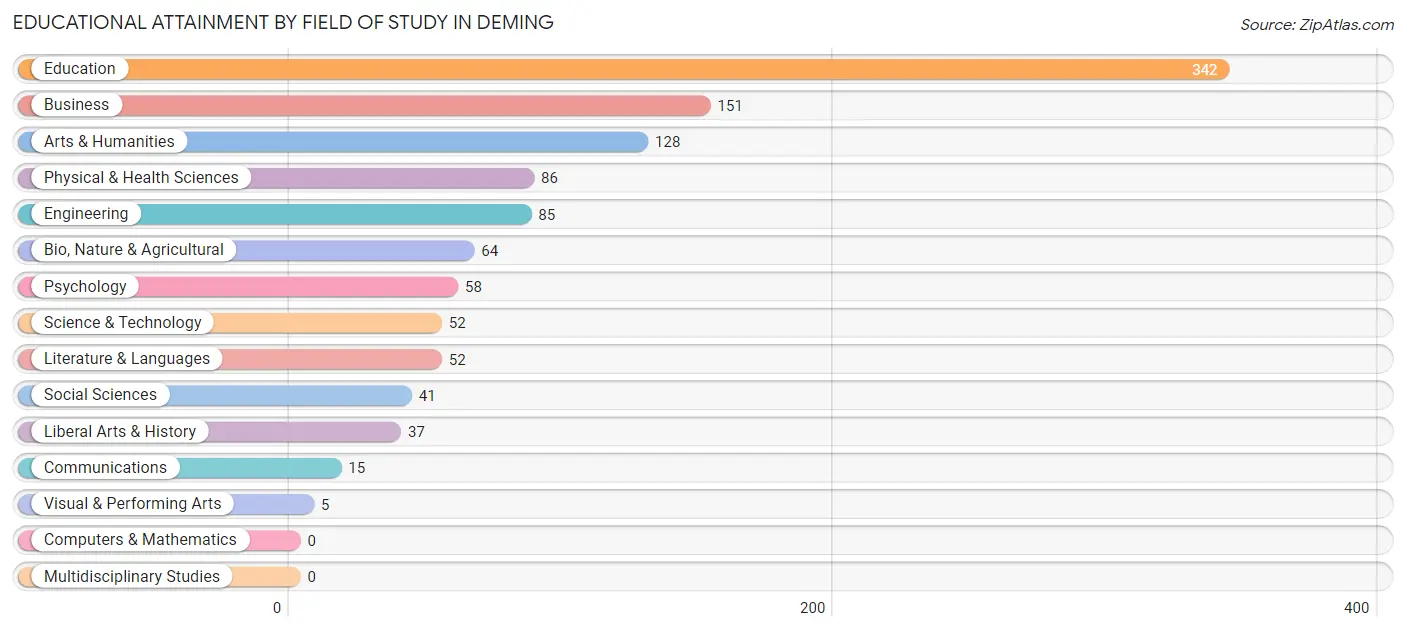
| Field of Study | # Graduates | % Graduates |
| Computers & Mathematics | 0 | 0.0% |
| Bio, Nature & Agricultural | 64 | 5.7% |
| Physical & Health Sciences | 86 | 7.7% |
| Psychology | 58 | 5.2% |
| Social Sciences | 41 | 3.7% |
| Engineering | 85 | 7.6% |
| Multidisciplinary Studies | 0 | 0.0% |
| Science & Technology | 52 | 4.7% |
| Business | 151 | 13.5% |
| Education | 342 | 30.6% |
| Literature & Languages | 52 | 4.7% |
| Liberal Arts & History | 37 | 3.3% |
| Visual & Performing Arts | 5 | 0.4% |
| Communications | 15 | 1.3% |
| Arts & Humanities | 128 | 11.5% |
| Total | 1,116 | 100.0% |
Transportation & Commute in Deming
Vehicle Availability by Sex in Deming
The most prevalent vehicle ownership categories in Deming are males with 2 vehicles (844, accounting for 34.2%) and females with 2 vehicles (755, making up 40.3%).
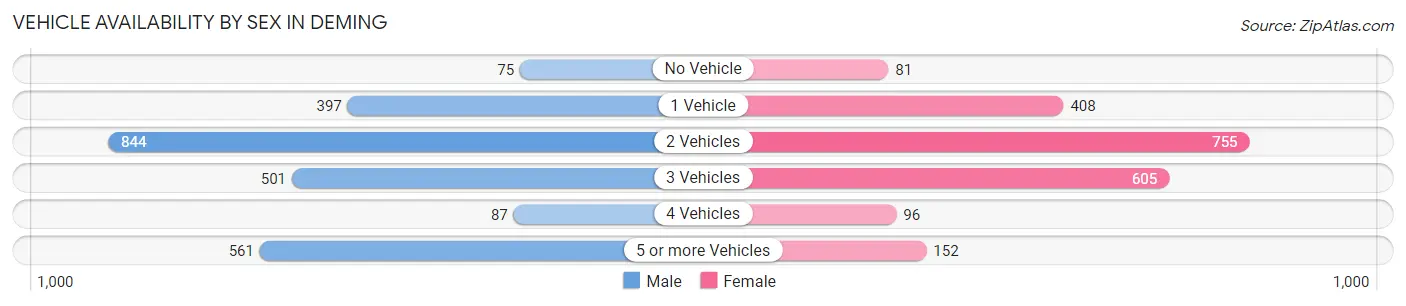
| Vehicles Available | Male | Female |
| No Vehicle | 75 (3.0%) | 81 (3.9%) |
| 1 Vehicle | 397 (16.1%) | 408 (19.5%) |
| 2 Vehicles | 844 (34.2%) | 755 (36.0%) |
| 3 Vehicles | 501 (20.3%) | 605 (28.8%) |
| 4 Vehicles | 87 (3.5%) | 96 (4.6%) |
| 5 or more Vehicles | 561 (22.8%) | 152 (7.2%) |
| Total | 2,465 (100.0%) | 2,097 (100.0%) |
Commute Time in Deming
The most frequently occuring commute durations in Deming are 5 to 9 minutes (1,516 commuters, 34.6%), 10 to 14 minutes (1,112 commuters, 25.4%), and less than 5 minutes (374 commuters, 8.5%).
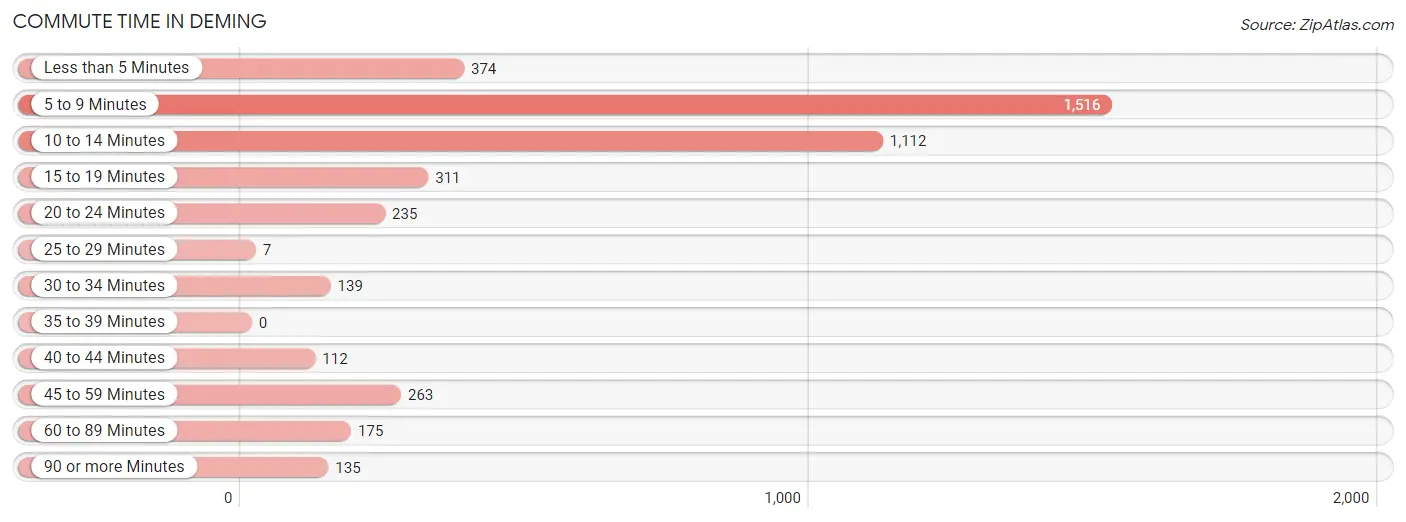
| Commute Time | # Commuters | % Commuters |
| Less than 5 Minutes | 374 | 8.5% |
| 5 to 9 Minutes | 1,516 | 34.6% |
| 10 to 14 Minutes | 1,112 | 25.4% |
| 15 to 19 Minutes | 311 | 7.1% |
| 20 to 24 Minutes | 235 | 5.4% |
| 25 to 29 Minutes | 7 | 0.2% |
| 30 to 34 Minutes | 139 | 3.2% |
| 35 to 39 Minutes | 0 | 0.0% |
| 40 to 44 Minutes | 112 | 2.6% |
| 45 to 59 Minutes | 263 | 6.0% |
| 60 to 89 Minutes | 175 | 4.0% |
| 90 or more Minutes | 135 | 3.1% |
Commute Time by Sex in Deming
The most common commute times in Deming are 10 to 14 minutes (589 commuters, 24.7%) for males and 5 to 9 minutes (1,014 commuters, 50.7%) for females.
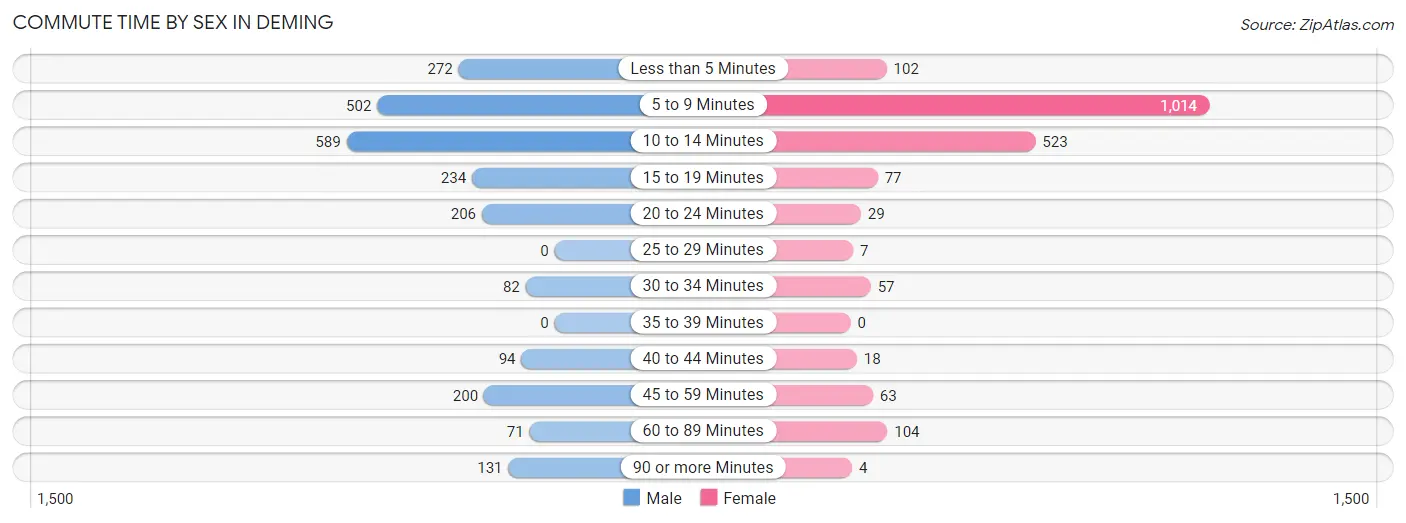
| Commute Time | Male | Female |
| Less than 5 Minutes | 272 (11.4%) | 102 (5.1%) |
| 5 to 9 Minutes | 502 (21.1%) | 1,014 (50.7%) |
| 10 to 14 Minutes | 589 (24.7%) | 523 (26.2%) |
| 15 to 19 Minutes | 234 (9.8%) | 77 (3.8%) |
| 20 to 24 Minutes | 206 (8.6%) | 29 (1.5%) |
| 25 to 29 Minutes | 0 (0.0%) | 7 (0.4%) |
| 30 to 34 Minutes | 82 (3.4%) | 57 (2.9%) |
| 35 to 39 Minutes | 0 (0.0%) | 0 (0.0%) |
| 40 to 44 Minutes | 94 (4.0%) | 18 (0.9%) |
| 45 to 59 Minutes | 200 (8.4%) | 63 (3.2%) |
| 60 to 89 Minutes | 71 (3.0%) | 104 (5.2%) |
| 90 or more Minutes | 131 (5.5%) | 4 (0.2%) |
Time of Departure to Work by Sex in Deming
The most frequent times of departure to work in Deming are 6:30 AM to 6:59 AM (441, 18.5%) for males and 7:30 AM to 7:59 AM (598, 29.9%) for females.
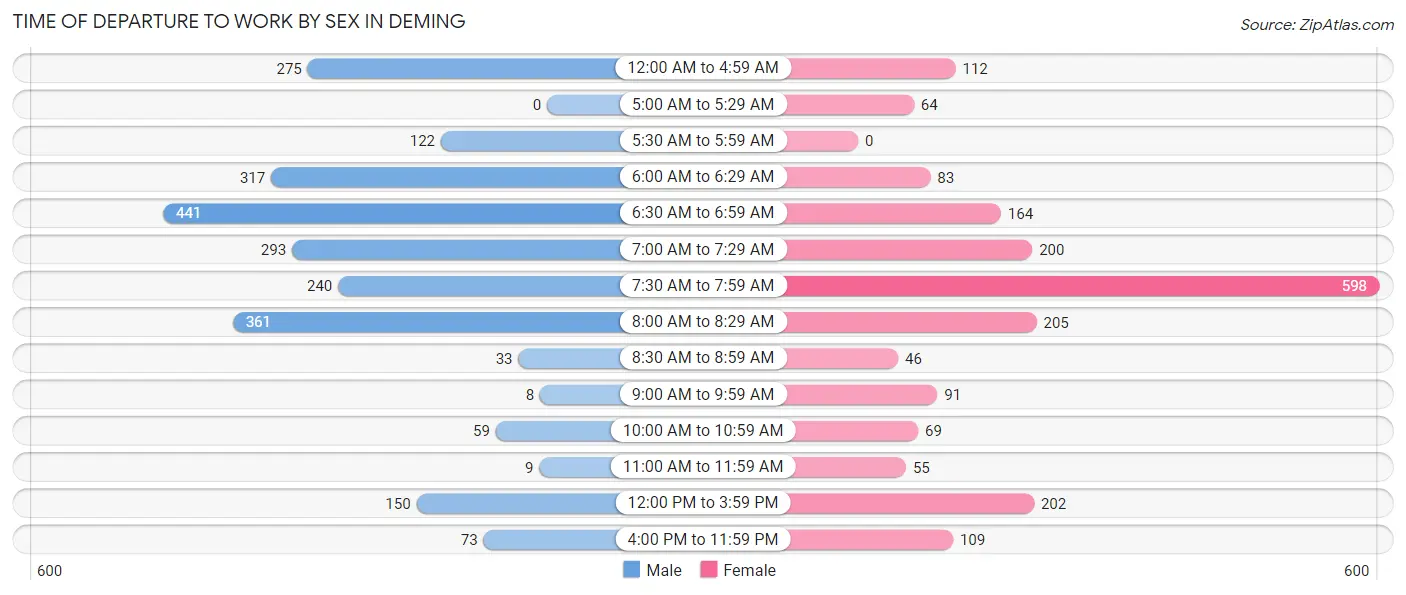
| Time of Departure | Male | Female |
| 12:00 AM to 4:59 AM | 275 (11.6%) | 112 (5.6%) |
| 5:00 AM to 5:29 AM | 0 (0.0%) | 64 (3.2%) |
| 5:30 AM to 5:59 AM | 122 (5.1%) | 0 (0.0%) |
| 6:00 AM to 6:29 AM | 317 (13.3%) | 83 (4.2%) |
| 6:30 AM to 6:59 AM | 441 (18.5%) | 164 (8.2%) |
| 7:00 AM to 7:29 AM | 293 (12.3%) | 200 (10.0%) |
| 7:30 AM to 7:59 AM | 240 (10.1%) | 598 (29.9%) |
| 8:00 AM to 8:29 AM | 361 (15.2%) | 205 (10.3%) |
| 8:30 AM to 8:59 AM | 33 (1.4%) | 46 (2.3%) |
| 9:00 AM to 9:59 AM | 8 (0.3%) | 91 (4.5%) |
| 10:00 AM to 10:59 AM | 59 (2.5%) | 69 (3.5%) |
| 11:00 AM to 11:59 AM | 9 (0.4%) | 55 (2.8%) |
| 12:00 PM to 3:59 PM | 150 (6.3%) | 202 (10.1%) |
| 4:00 PM to 11:59 PM | 73 (3.1%) | 109 (5.5%) |
| Total | 2,381 (100.0%) | 1,998 (100.0%) |
Housing Occupancy in Deming
Occupancy by Ownership in Deming
Of the total 5,392 dwellings in Deming, owner-occupied units account for 3,325 (61.7%), while renter-occupied units make up 2,067 (38.3%).
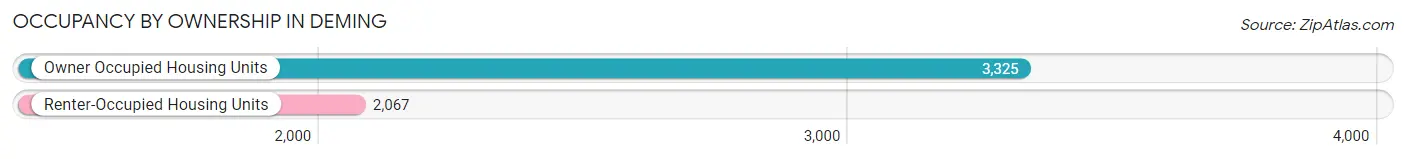
| Occupancy | # Housing Units | % Housing Units |
| Owner Occupied Housing Units | 3,325 | 61.7% |
| Renter-Occupied Housing Units | 2,067 | 38.3% |
| Total Occupied Housing Units | 5,392 | 100.0% |
Occupancy by Household Size in Deming
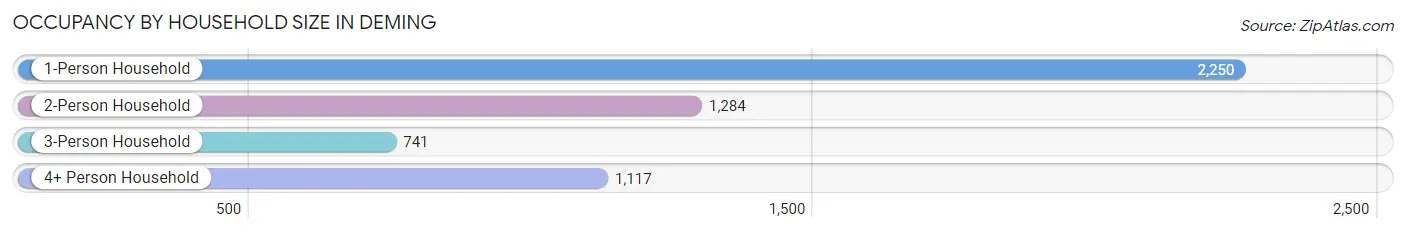
| Household Size | # Housing Units | % Housing Units |
| 1-Person Household | 2,250 | 41.7% |
| 2-Person Household | 1,284 | 23.8% |
| 3-Person Household | 741 | 13.7% |
| 4+ Person Household | 1,117 | 20.7% |
| Total Housing Units | 5,392 | 100.0% |
Occupancy by Ownership by Household Size in Deming
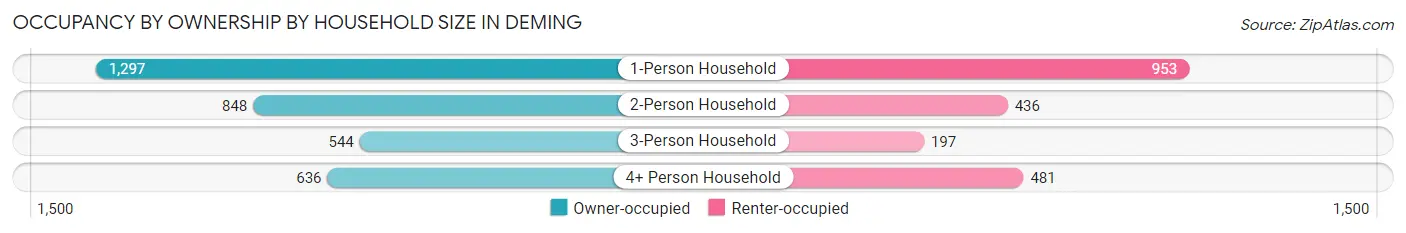
| Household Size | Owner-occupied | Renter-occupied |
| 1-Person Household | 1,297 (57.6%) | 953 (42.4%) |
| 2-Person Household | 848 (66.0%) | 436 (34.0%) |
| 3-Person Household | 544 (73.4%) | 197 (26.6%) |
| 4+ Person Household | 636 (56.9%) | 481 (43.1%) |
| Total Housing Units | 3,325 (61.7%) | 2,067 (38.3%) |
Occupancy by Educational Attainment in Deming
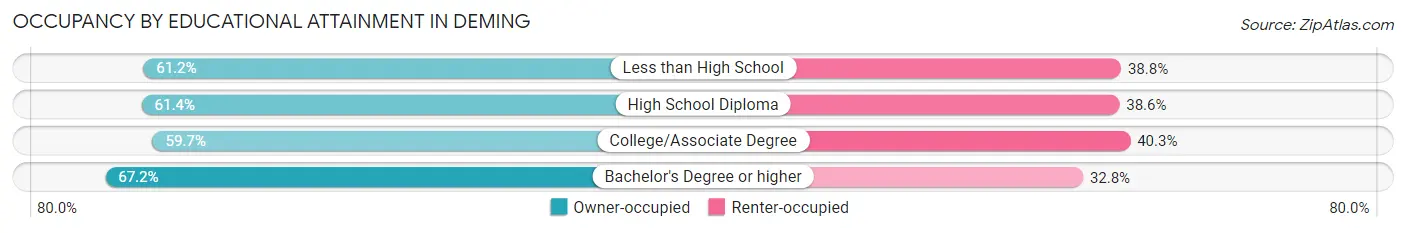
| Household Size | Owner-occupied | Renter-occupied |
| Less than High School | 920 (61.2%) | 584 (38.8%) |
| High School Diploma | 1,144 (61.4%) | 718 (38.6%) |
| College/Associate Degree | 800 (59.7%) | 540 (40.3%) |
| Bachelor's Degree or higher | 461 (67.2%) | 225 (32.8%) |
Occupancy by Age of Householder in Deming
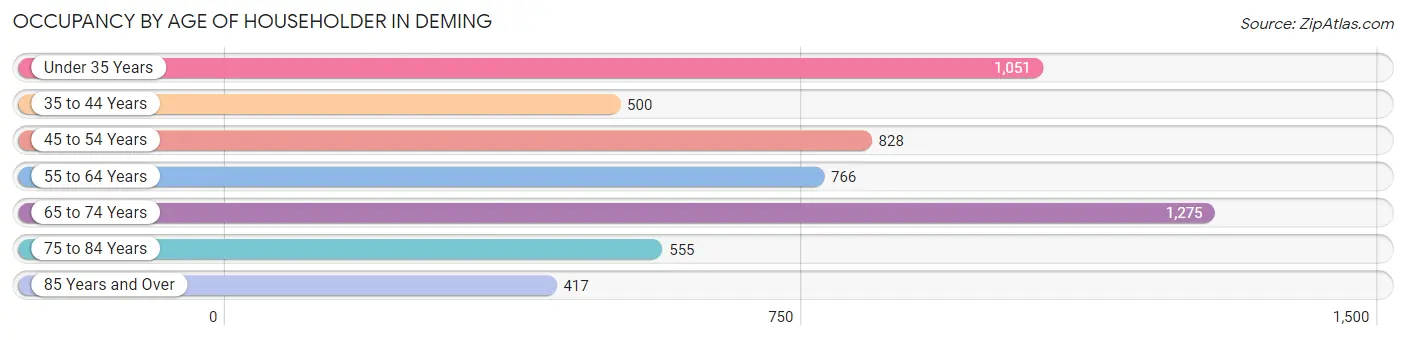
| Age Bracket | # Households | % Households |
| Under 35 Years | 1,051 | 19.5% |
| 35 to 44 Years | 500 | 9.3% |
| 45 to 54 Years | 828 | 15.4% |
| 55 to 64 Years | 766 | 14.2% |
| 65 to 74 Years | 1,275 | 23.6% |
| 75 to 84 Years | 555 | 10.3% |
| 85 Years and Over | 417 | 7.7% |
| Total | 5,392 | 100.0% |
Housing Finances in Deming
Median Income by Occupancy in Deming
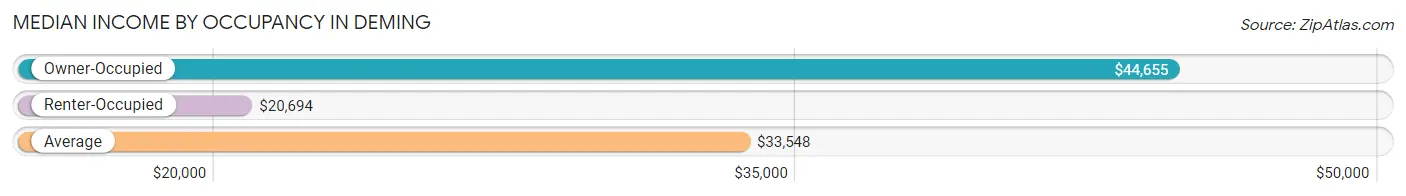
| Occupancy Type | # Households | Median Income |
| Owner-Occupied | 3,325 (61.7%) | $44,655 |
| Renter-Occupied | 2,067 (38.3%) | $20,694 |
| Average | 5,392 (100.0%) | $33,548 |
Occupancy by Householder Income Bracket in Deming
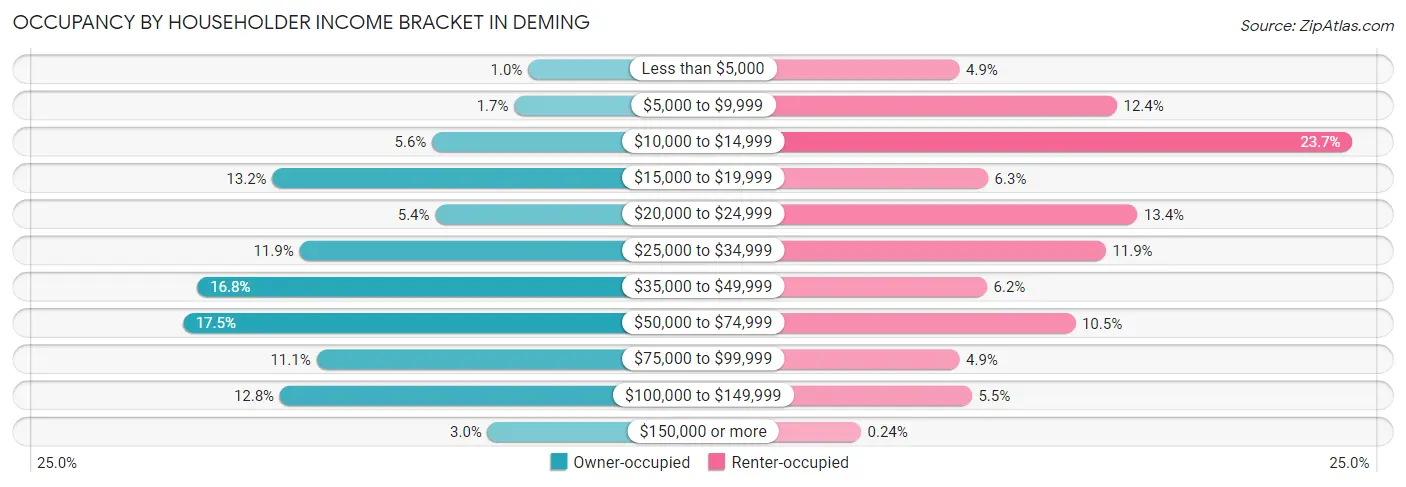
| Income Bracket | Owner-occupied | Renter-occupied |
| Less than $5,000 | 34 (1.0%) | 102 (4.9%) |
| $5,000 to $9,999 | 56 (1.7%) | 257 (12.4%) |
| $10,000 to $14,999 | 186 (5.6%) | 489 (23.7%) |
| $15,000 to $19,999 | 439 (13.2%) | 130 (6.3%) |
| $20,000 to $24,999 | 181 (5.4%) | 277 (13.4%) |
| $25,000 to $34,999 | 396 (11.9%) | 246 (11.9%) |
| $35,000 to $49,999 | 558 (16.8%) | 129 (6.2%) |
| $50,000 to $74,999 | 581 (17.5%) | 216 (10.4%) |
| $75,000 to $99,999 | 369 (11.1%) | 102 (4.9%) |
| $100,000 to $149,999 | 427 (12.8%) | 114 (5.5%) |
| $150,000 or more | 98 (2.9%) | 5 (0.2%) |
| Total | 3,325 (100.0%) | 2,067 (100.0%) |
Monthly Housing Cost Tiers in Deming
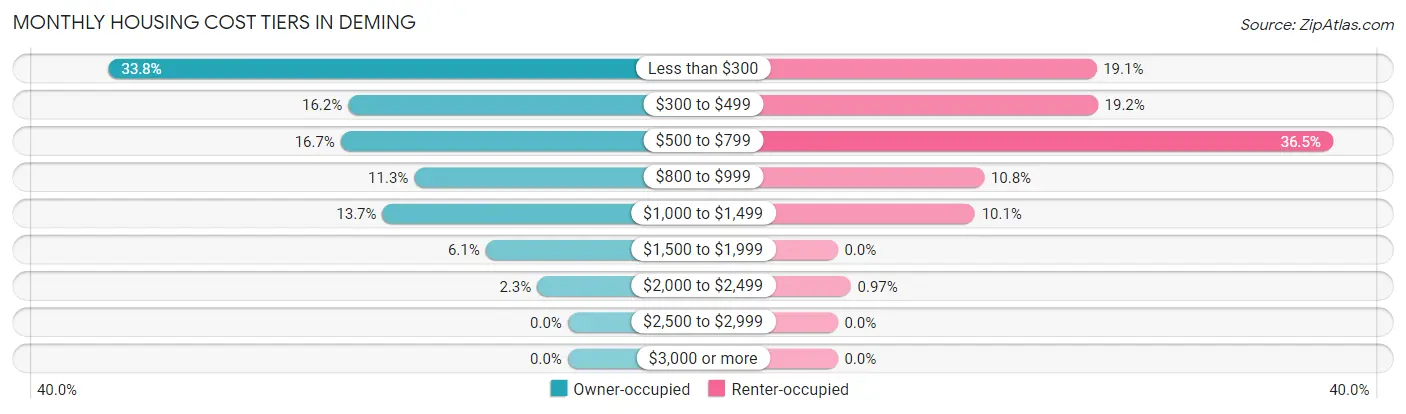
| Monthly Cost | Owner-occupied | Renter-occupied |
| Less than $300 | 1,125 (33.8%) | 394 (19.1%) |
| $300 to $499 | 538 (16.2%) | 396 (19.2%) |
| $500 to $799 | 556 (16.7%) | 754 (36.5%) |
| $800 to $999 | 376 (11.3%) | 223 (10.8%) |
| $1,000 to $1,499 | 454 (13.7%) | 209 (10.1%) |
| $1,500 to $1,999 | 201 (6.0%) | 0 (0.0%) |
| $2,000 to $2,499 | 75 (2.3%) | 20 (1.0%) |
| $2,500 to $2,999 | 0 (0.0%) | 0 (0.0%) |
| $3,000 or more | 0 (0.0%) | 0 (0.0%) |
| Total | 3,325 (100.0%) | 2,067 (100.0%) |
Physical Housing Characteristics in Deming
Housing Structures in Deming
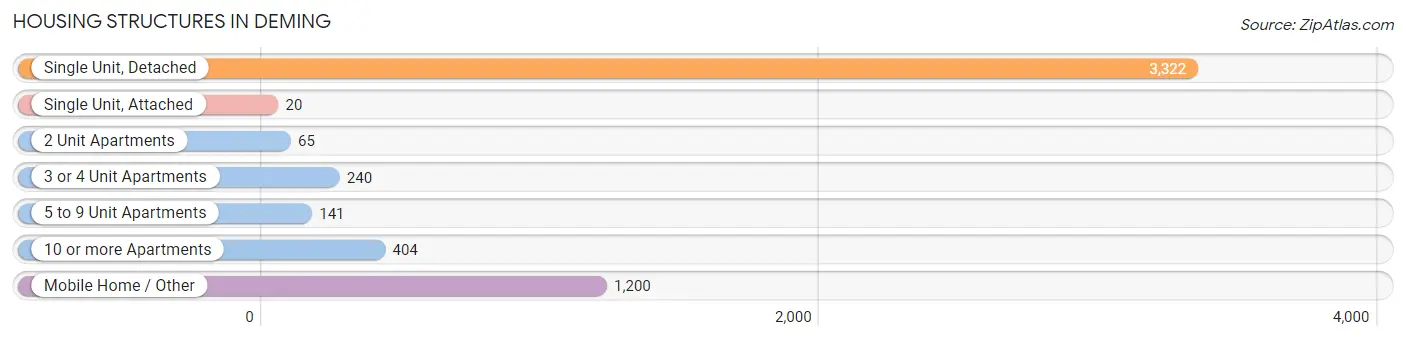
| Structure Type | # Housing Units | % Housing Units |
| Single Unit, Detached | 3,322 | 61.6% |
| Single Unit, Attached | 20 | 0.4% |
| 2 Unit Apartments | 65 | 1.2% |
| 3 or 4 Unit Apartments | 240 | 4.4% |
| 5 to 9 Unit Apartments | 141 | 2.6% |
| 10 or more Apartments | 404 | 7.5% |
| Mobile Home / Other | 1,200 | 22.3% |
| Total | 5,392 | 100.0% |
Housing Structures by Occupancy in Deming
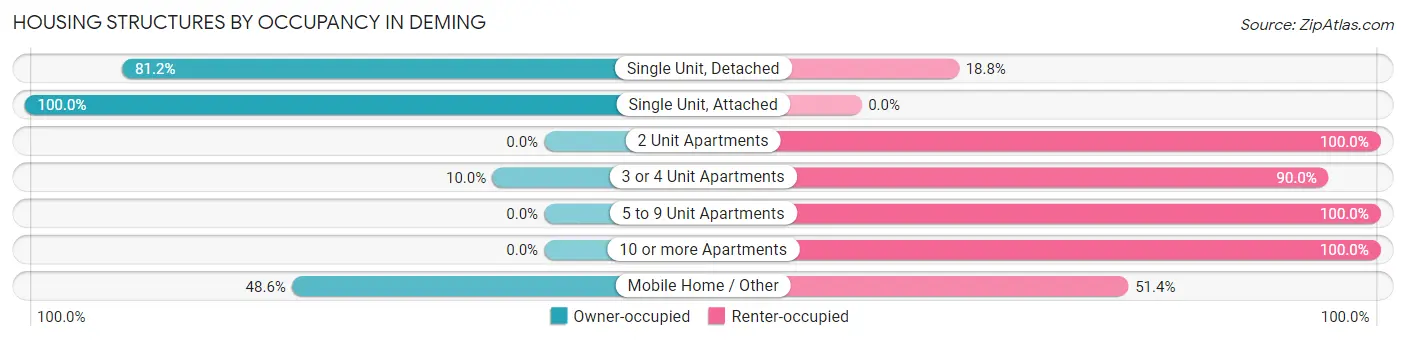
| Structure Type | Owner-occupied | Renter-occupied |
| Single Unit, Detached | 2,698 (81.2%) | 624 (18.8%) |
| Single Unit, Attached | 20 (100.0%) | 0 (0.0%) |
| 2 Unit Apartments | 0 (0.0%) | 65 (100.0%) |
| 3 or 4 Unit Apartments | 24 (10.0%) | 216 (90.0%) |
| 5 to 9 Unit Apartments | 0 (0.0%) | 141 (100.0%) |
| 10 or more Apartments | 0 (0.0%) | 404 (100.0%) |
| Mobile Home / Other | 583 (48.6%) | 617 (51.4%) |
| Total | 3,325 (61.7%) | 2,067 (38.3%) |
Housing Structures by Number of Rooms in Deming
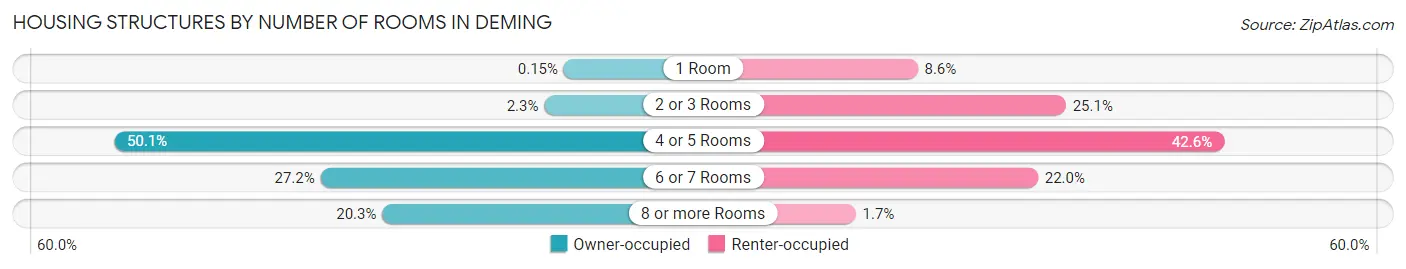
| Number of Rooms | Owner-occupied | Renter-occupied |
| 1 Room | 5 (0.2%) | 178 (8.6%) |
| 2 or 3 Rooms | 77 (2.3%) | 518 (25.1%) |
| 4 or 5 Rooms | 1,665 (50.1%) | 881 (42.6%) |
| 6 or 7 Rooms | 903 (27.2%) | 454 (22.0%) |
| 8 or more Rooms | 675 (20.3%) | 36 (1.7%) |
| Total | 3,325 (100.0%) | 2,067 (100.0%) |
Housing Structure by Heating Type in Deming
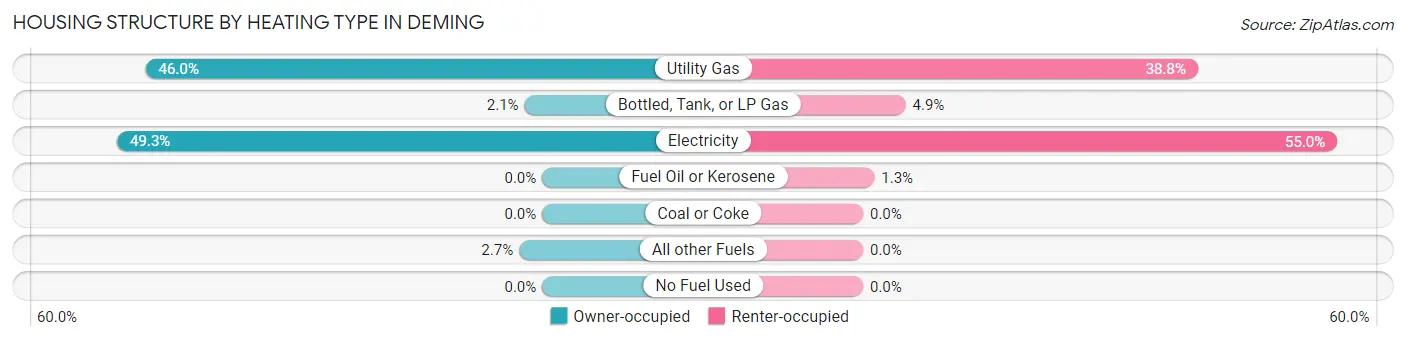
| Heating Type | Owner-occupied | Renter-occupied |
| Utility Gas | 1,529 (46.0%) | 802 (38.8%) |
| Bottled, Tank, or LP Gas | 68 (2.1%) | 102 (4.9%) |
| Electricity | 1,639 (49.3%) | 1,136 (55.0%) |
| Fuel Oil or Kerosene | 0 (0.0%) | 27 (1.3%) |
| Coal or Coke | 0 (0.0%) | 0 (0.0%) |
| All other Fuels | 89 (2.7%) | 0 (0.0%) |
| No Fuel Used | 0 (0.0%) | 0 (0.0%) |
| Total | 3,325 (100.0%) | 2,067 (100.0%) |
Household Vehicle Usage in Deming
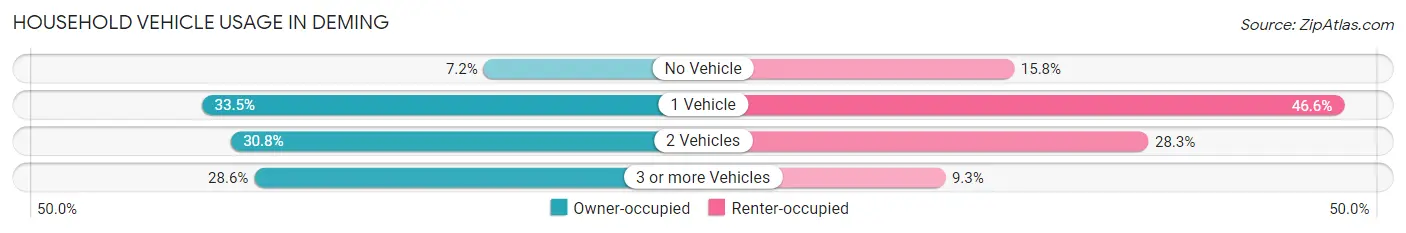
| Vehicles per Household | Owner-occupied | Renter-occupied |
| No Vehicle | 238 (7.2%) | 326 (15.8%) |
| 1 Vehicle | 1,113 (33.5%) | 963 (46.6%) |
| 2 Vehicles | 1,024 (30.8%) | 585 (28.3%) |
| 3 or more Vehicles | 950 (28.6%) | 193 (9.3%) |
| Total | 3,325 (100.0%) | 2,067 (100.0%) |
Real Estate & Mortgages in Deming
Real Estate and Mortgage Overview in Deming
| Characteristic | Without Mortgage | With Mortgage |
| Housing Units | 1,810 | 1,515 |
| Median Property Value | $86,900 | $157,200 |
| Median Household Income | $38,190 | $67 |
| Monthly Housing Costs | $250 | $0 |
| Real Estate Taxes | $479 | $64 |
Property Value by Mortgage Status in Deming
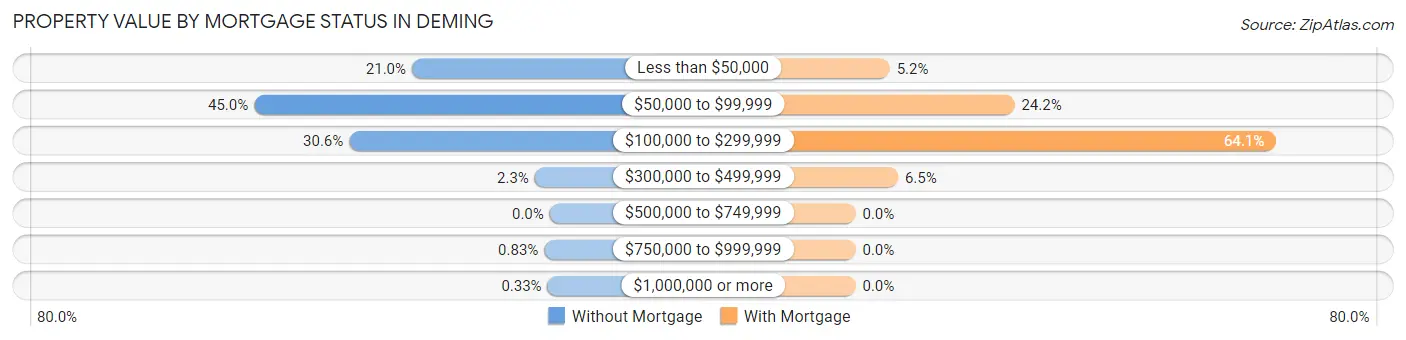
| Property Value | Without Mortgage | With Mortgage |
| Less than $50,000 | 380 (21.0%) | 79 (5.2%) |
| $50,000 to $99,999 | 815 (45.0%) | 367 (24.2%) |
| $100,000 to $299,999 | 553 (30.5%) | 971 (64.1%) |
| $300,000 to $499,999 | 41 (2.3%) | 98 (6.5%) |
| $500,000 to $749,999 | 0 (0.0%) | 0 (0.0%) |
| $750,000 to $999,999 | 15 (0.8%) | 0 (0.0%) |
| $1,000,000 or more | 6 (0.3%) | 0 (0.0%) |
| Total | 1,810 (100.0%) | 1,515 (100.0%) |
Household Income by Mortgage Status in Deming
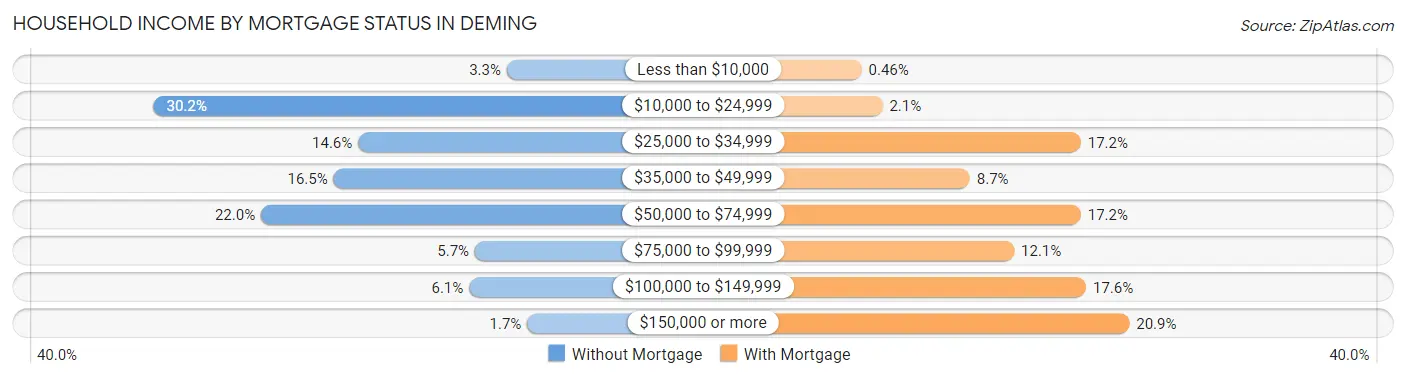
| Household Income | Without Mortgage | With Mortgage |
| Less than $10,000 | 59 (3.3%) | 7 (0.5%) |
| $10,000 to $24,999 | 546 (30.2%) | 31 (2.1%) |
| $25,000 to $34,999 | 264 (14.6%) | 260 (17.2%) |
| $35,000 to $49,999 | 298 (16.5%) | 132 (8.7%) |
| $50,000 to $74,999 | 398 (22.0%) | 260 (17.2%) |
| $75,000 to $99,999 | 103 (5.7%) | 183 (12.1%) |
| $100,000 to $149,999 | 111 (6.1%) | 266 (17.6%) |
| $150,000 or more | 31 (1.7%) | 316 (20.9%) |
| Total | 1,810 (100.0%) | 1,515 (100.0%) |
Property Value to Household Income Ratio in Deming
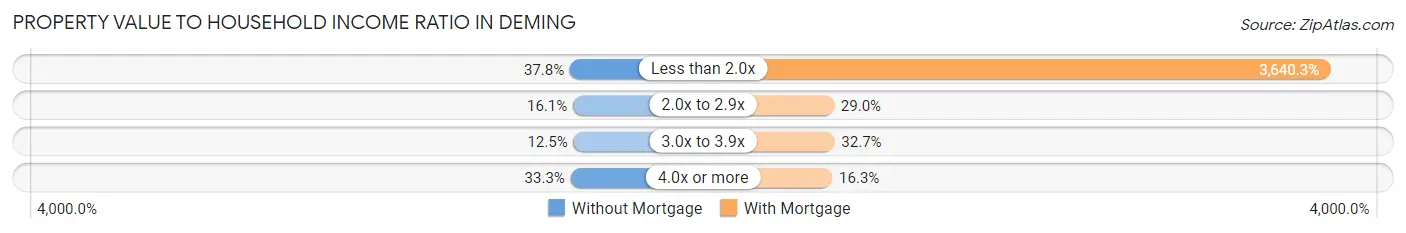
| Value-to-Income Ratio | Without Mortgage | With Mortgage |
| Less than 2.0x | 684 (37.8%) | 55,150 (3,640.3%) |
| 2.0x to 2.9x | 292 (16.1%) | 440 (29.0%) |
| 3.0x to 3.9x | 226 (12.5%) | 495 (32.7%) |
| 4.0x or more | 602 (33.3%) | 247 (16.3%) |
| Total | 1,810 (100.0%) | 1,515 (100.0%) |
Real Estate Taxes by Mortgage Status in Deming
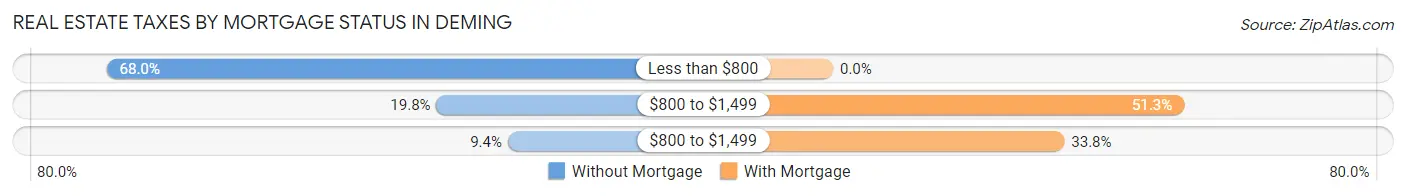
| Property Taxes | Without Mortgage | With Mortgage |
| Less than $800 | 1,231 (68.0%) | 0 (0.0%) |
| $800 to $1,499 | 359 (19.8%) | 777 (51.3%) |
| $800 to $1,499 | 170 (9.4%) | 512 (33.8%) |
| Total | 1,810 (100.0%) | 1,515 (100.0%) |
Health & Disability in Deming
Health Insurance Coverage by Age in Deming
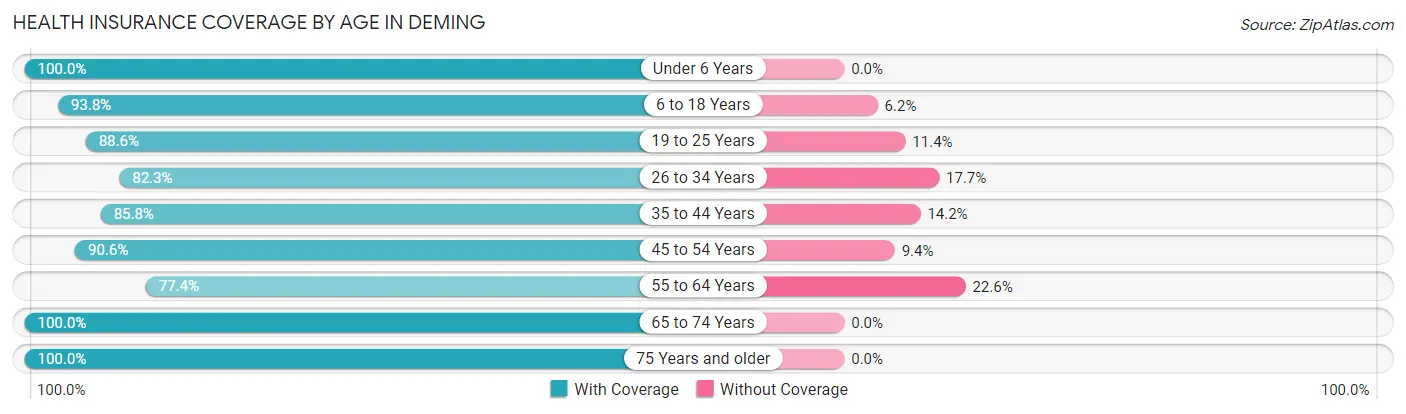
| Age Bracket | With Coverage | Without Coverage |
| Under 6 Years | 1,518 (100.0%) | 0 (0.0%) |
| 6 to 18 Years | 2,532 (93.8%) | 168 (6.2%) |
| 19 to 25 Years | 987 (88.6%) | 127 (11.4%) |
| 26 to 34 Years | 1,342 (82.3%) | 288 (17.7%) |
| 35 to 44 Years | 1,202 (85.8%) | 199 (14.2%) |
| 45 to 54 Years | 1,290 (90.6%) | 134 (9.4%) |
| 55 to 64 Years | 1,236 (77.4%) | 361 (22.6%) |
| 65 to 74 Years | 1,630 (100.0%) | 0 (0.0%) |
| 75 Years and older | 1,395 (100.0%) | 0 (0.0%) |
| Total | 13,132 (91.1%) | 1,277 (8.9%) |
Health Insurance Coverage by Citizenship Status in Deming
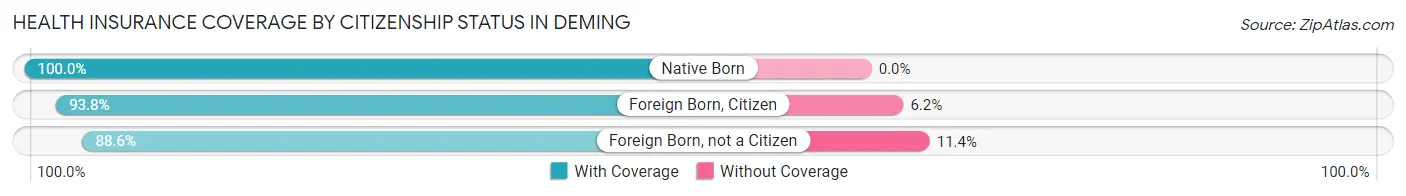
| Citizenship Status | With Coverage | Without Coverage |
| Native Born | 1,518 (100.0%) | 0 (0.0%) |
| Foreign Born, Citizen | 2,532 (93.8%) | 168 (6.2%) |
| Foreign Born, not a Citizen | 987 (88.6%) | 127 (11.4%) |
Health Insurance Coverage by Household Income in Deming
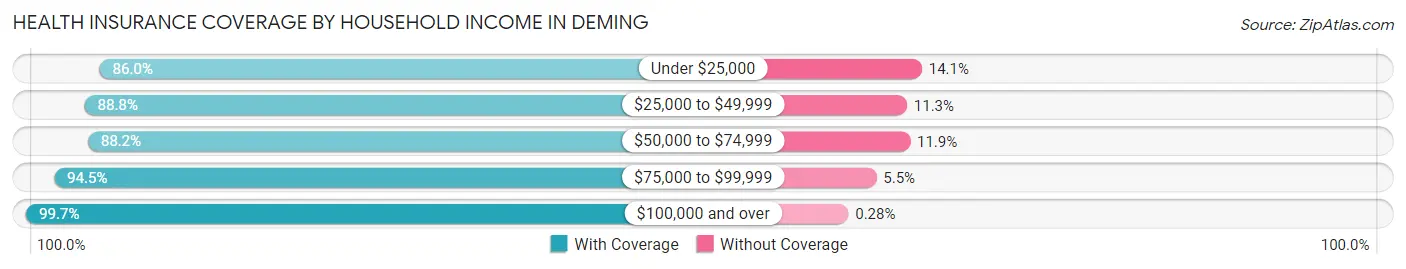
| Household Income | With Coverage | Without Coverage |
| Under $25,000 | 3,194 (86.0%) | 522 (14.1%) |
| $25,000 to $49,999 | 2,871 (88.7%) | 364 (11.3%) |
| $50,000 to $74,999 | 2,134 (88.1%) | 287 (11.8%) |
| $75,000 to $99,999 | 1,624 (94.5%) | 95 (5.5%) |
| $100,000 and over | 3,257 (99.7%) | 9 (0.3%) |
Public vs Private Health Insurance Coverage by Age in Deming
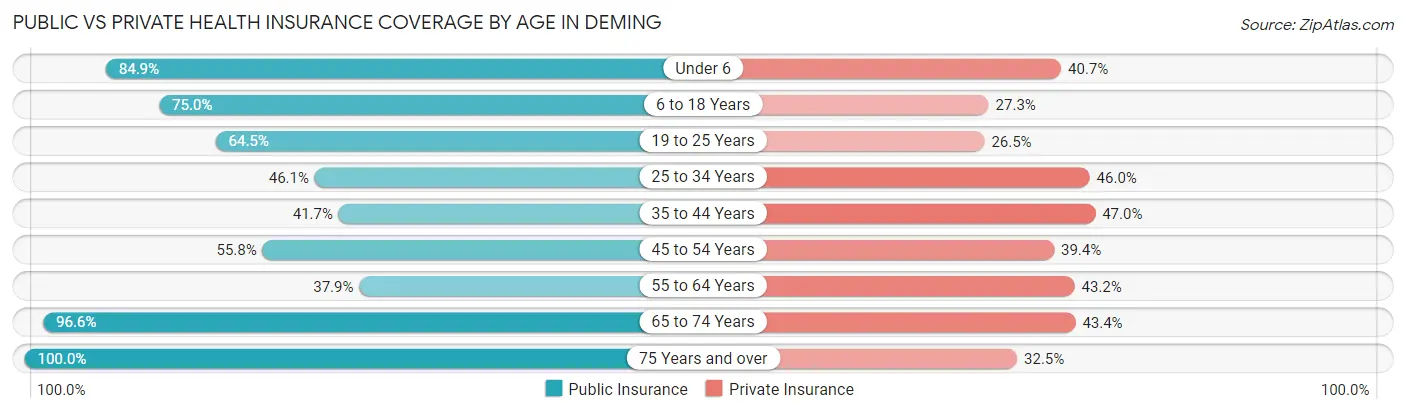
| Age Bracket | Public Insurance | Private Insurance |
| Under 6 | 1,289 (84.9%) | 618 (40.7%) |
| 6 to 18 Years | 2,026 (75.0%) | 736 (27.3%) |
| 19 to 25 Years | 719 (64.5%) | 295 (26.5%) |
| 25 to 34 Years | 752 (46.1%) | 750 (46.0%) |
| 35 to 44 Years | 584 (41.7%) | 659 (47.0%) |
| 45 to 54 Years | 795 (55.8%) | 561 (39.4%) |
| 55 to 64 Years | 605 (37.9%) | 690 (43.2%) |
| 65 to 74 Years | 1,574 (96.6%) | 707 (43.4%) |
| 75 Years and over | 1,395 (100.0%) | 454 (32.5%) |
| Total | 9,739 (67.6%) | 5,470 (38.0%) |
Disability Status by Sex by Age in Deming
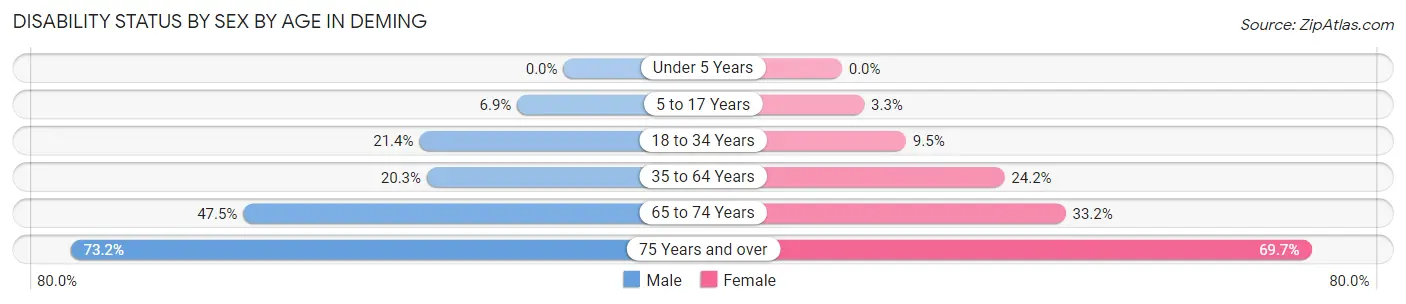
| Age Bracket | Male | Female |
| Under 5 Years | 0 (0.0%) | 0 (0.0%) |
| 5 to 17 Years | 82 (6.9%) | 45 (3.3%) |
| 18 to 34 Years | 317 (21.4%) | 146 (9.5%) |
| 35 to 64 Years | 427 (20.3%) | 559 (24.1%) |
| 65 to 74 Years | 357 (47.5%) | 292 (33.2%) |
| 75 Years and over | 458 (73.2%) | 536 (69.7%) |
Disability Class by Sex by Age in Deming
Disability Class: Hearing Difficulty
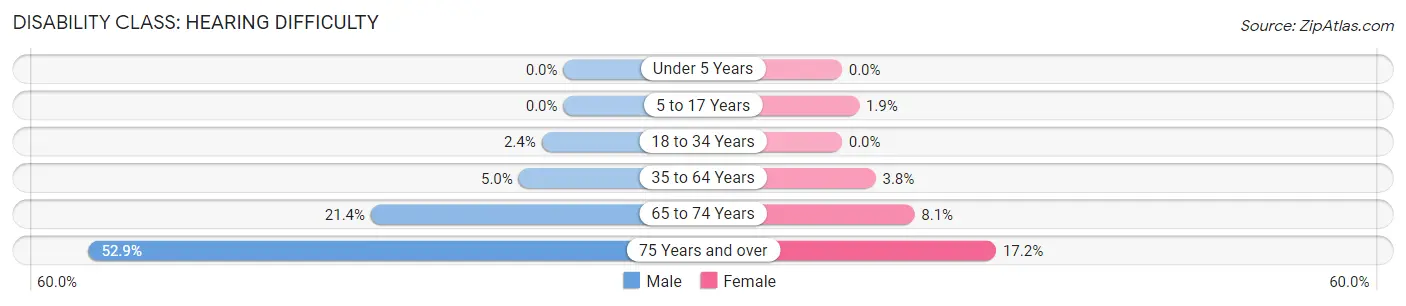
| Age Bracket | Male | Female |
| Under 5 Years | 0 (0.0%) | 0 (0.0%) |
| 5 to 17 Years | 0 (0.0%) | 26 (1.9%) |
| 18 to 34 Years | 36 (2.4%) | 0 (0.0%) |
| 35 to 64 Years | 105 (5.0%) | 87 (3.8%) |
| 65 to 74 Years | 161 (21.4%) | 71 (8.1%) |
| 75 Years and over | 331 (52.9%) | 132 (17.2%) |
Disability Class: Vision Difficulty
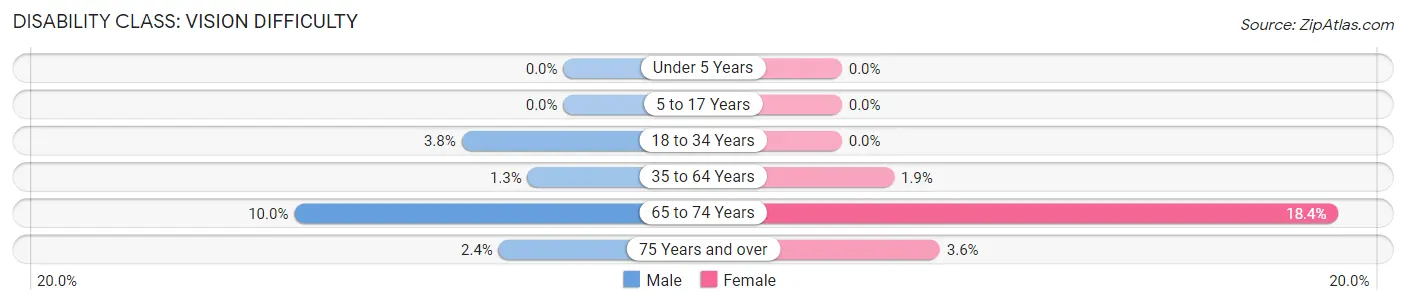
| Age Bracket | Male | Female |
| Under 5 Years | 0 (0.0%) | 0 (0.0%) |
| 5 to 17 Years | 0 (0.0%) | 0 (0.0%) |
| 18 to 34 Years | 56 (3.8%) | 0 (0.0%) |
| 35 to 64 Years | 28 (1.3%) | 45 (1.9%) |
| 65 to 74 Years | 75 (10.0%) | 162 (18.4%) |
| 75 Years and over | 15 (2.4%) | 28 (3.6%) |
Disability Class: Cognitive Difficulty
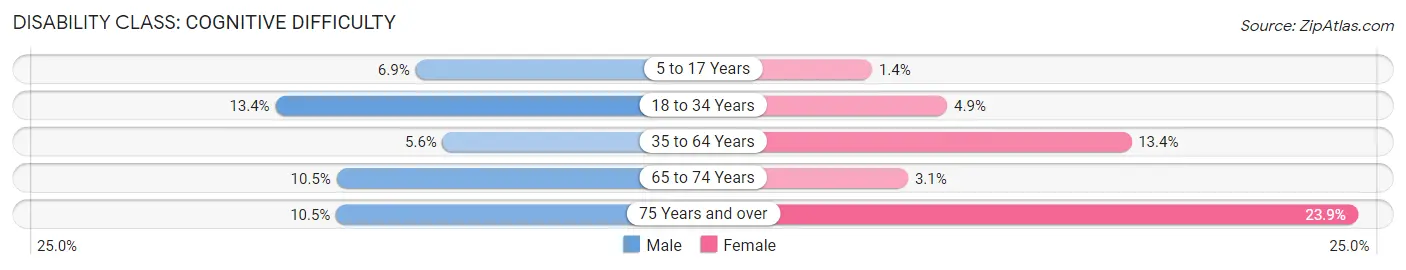
| Age Bracket | Male | Female |
| 5 to 17 Years | 82 (6.9%) | 19 (1.4%) |
| 18 to 34 Years | 198 (13.4%) | 75 (4.9%) |
| 35 to 64 Years | 118 (5.6%) | 311 (13.4%) |
| 65 to 74 Years | 79 (10.5%) | 27 (3.1%) |
| 75 Years and over | 66 (10.5%) | 184 (23.9%) |
Disability Class: Ambulatory Difficulty
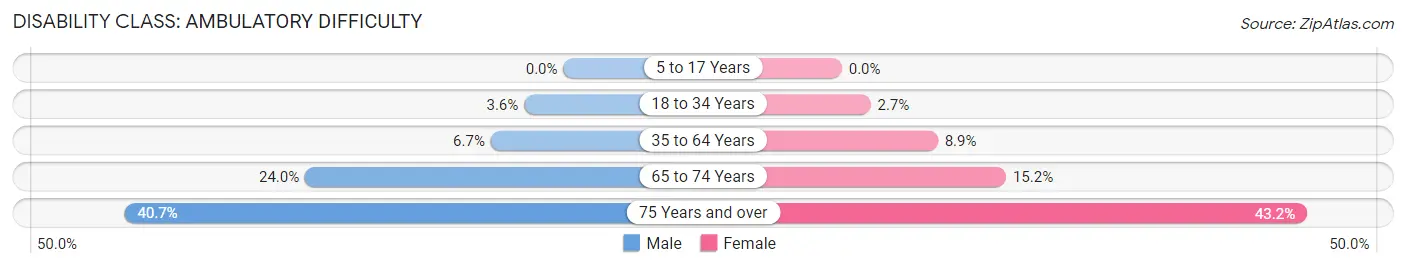
| Age Bracket | Male | Female |
| 5 to 17 Years | 0 (0.0%) | 0 (0.0%) |
| 18 to 34 Years | 54 (3.6%) | 41 (2.7%) |
| 35 to 64 Years | 142 (6.7%) | 206 (8.9%) |
| 65 to 74 Years | 180 (24.0%) | 134 (15.2%) |
| 75 Years and over | 255 (40.7%) | 332 (43.2%) |
Disability Class: Self-Care Difficulty
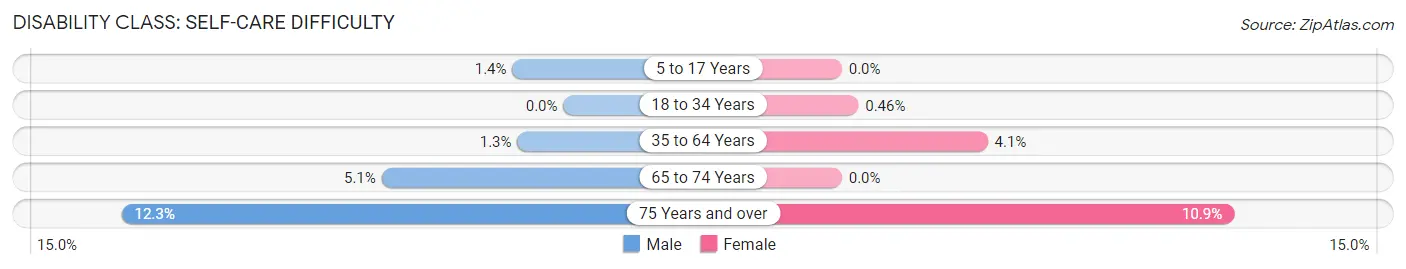
| Age Bracket | Male | Female |
| 5 to 17 Years | 17 (1.4%) | 0 (0.0%) |
| 18 to 34 Years | 0 (0.0%) | 7 (0.5%) |
| 35 to 64 Years | 27 (1.3%) | 94 (4.1%) |
| 65 to 74 Years | 38 (5.1%) | 0 (0.0%) |
| 75 Years and over | 77 (12.3%) | 84 (10.9%) |
Technology Access in Deming
Computing Device Access in Deming
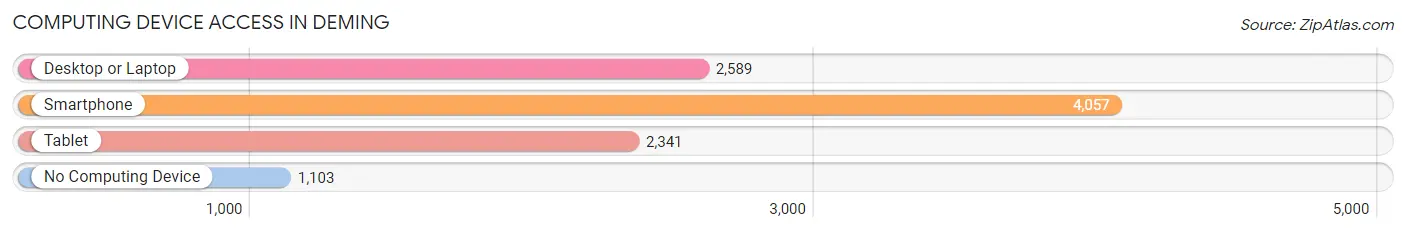
| Device Type | # Households | % Households |
| Desktop or Laptop | 2,589 | 48.0% |
| Smartphone | 4,057 | 75.2% |
| Tablet | 2,341 | 43.4% |
| No Computing Device | 1,103 | 20.5% |
| Total | 5,392 | 100.0% |
Internet Access in Deming
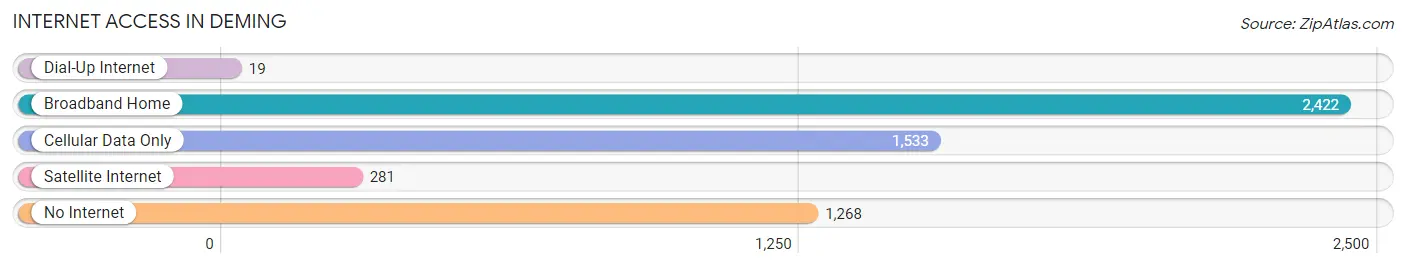
| Internet Type | # Households | % Households |
| Dial-Up Internet | 19 | 0.4% |
| Broadband Home | 2,422 | 44.9% |
| Cellular Data Only | 1,533 | 28.4% |
| Satellite Internet | 281 | 5.2% |
| No Internet | 1,268 | 23.5% |
| Total | 5,392 | 100.0% |
Deming Summary
Deming, New Mexico is a small city located in the southwestern part of the state, in Luna County. It is situated on the banks of the Mimbres River, and is surrounded by the Chihuahuan Desert. The city has a population of 14,855 as of the 2010 census, and is the county seat of Luna County.
History
The area that is now Deming was originally inhabited by the Mimbres people, who were part of the Mogollon culture. The Mimbres were a semi-nomadic people who lived in the area for centuries before the arrival of Europeans.
The first Europeans to arrive in the area were Spanish explorers in the late 16th century. The area was part of the Spanish Empire until 1821, when Mexico gained its independence. The area was then part of the Mexican state of Chihuahua until 1848, when the Treaty of Guadalupe Hidalgo ended the Mexican-American War and the area became part of the United States.
In 1881, the Atchison, Topeka and Santa Fe Railway built a line through the area, and the town of Deming was founded in 1881. The town was named after Mary Ann Deming Crocker, the wife of railroad magnate Charles Crocker.
Geography
Deming is located in the southwestern part of New Mexico, in Luna County. It is situated on the banks of the Mimbres River, and is surrounded by the Chihuahuan Desert. The city has an elevation of 4,567 feet (1,393 m).
The city has a total area of 8.3 square miles (21.5 km2), of which 8.2 square miles (21.3 km2) is land and 0.1 square miles (0.2 km2) is water.
Economy
Deming’s economy is largely based on agriculture and tourism. The city is home to several large farms, including the Deming Dairy, which produces milk, cheese, and other dairy products. The city is also home to several tourist attractions, including the Deming Luna Mimbres Museum, the Deming Arts Center, and the Deming Speedway.
Deming is also home to several manufacturing companies, including the Deming Manufacturing Company, which produces industrial equipment, and the Deming Machine Company, which produces machine tools.
Demographics
As of the 2010 census, Deming had a population of 14,855. The racial makeup of the city was 75.3% White, 0.7% African American, 1.2% Native American, 0.5% Asian, 0.1% Pacific Islander, 19.2% from other races, and 3.0% from two or more races. Hispanic or Latino of any race were 57.2% of the population.
The median income for a household in the city was $25,944, and the median income for a family was $30,917. The per capita income for the city was $13,945. About 22.2% of families and 25.7% of the population were below the poverty line, including 36.2% of those under age 18 and 16.2% of those age 65 or over.
Common Questions
What is Per Capita Income in Deming?
Per Capita income in Deming is $19,657.
What is the Median Family Income in Deming?
Median Family Income in Deming is $52,097.
What is the Median Household income in Deming?
Median Household Income in Deming is $33,548.
What is Income or Wage Gap in Deming?
Income or Wage Gap in Deming is 38.2%.
Women in Deming earn 61.8 cents for every dollar earned by a man.
What is Family Income Deficit in Deming?
Family Income Deficit in Deming is $8,314.
Families that are below poverty line in Deming earn $8,314 less on average than the poverty threshold level.
What is Inequality or Gini Index in Deming?
Inequality or Gini Index in Deming is 0.45.
What is the Total Population of Deming?
Total Population of Deming is 14,756.
What is the Total Male Population of Deming?
Total Male Population of Deming is 7,253.
What is the Total Female Population of Deming?
Total Female Population of Deming is 7,503.
What is the Ratio of Males per 100 Females in Deming?
There are 96.67 Males per 100 Females in Deming.
What is the Ratio of Females per 100 Males in Deming?
There are 103.45 Females per 100 Males in Deming.
What is the Median Population Age in Deming?
Median Population Age in Deming is 36.1 Years.
What is the Average Family Size in Deming
Average Family Size in Deming is 3.8 People.
What is the Average Household Size in Deming
Average Household Size in Deming is 2.7 People.
How Large is the Labor Force in Deming?
There are 5,070 People in the Labor Forcein in Deming.
What is the Percentage of People in the Labor Force in Deming?
45.4% of People are in the Labor Force in Deming.
What is the Unemployment Rate in Deming?
Unemployment Rate in Deming is 7.5%.