Luna County, NM Map & Demographics
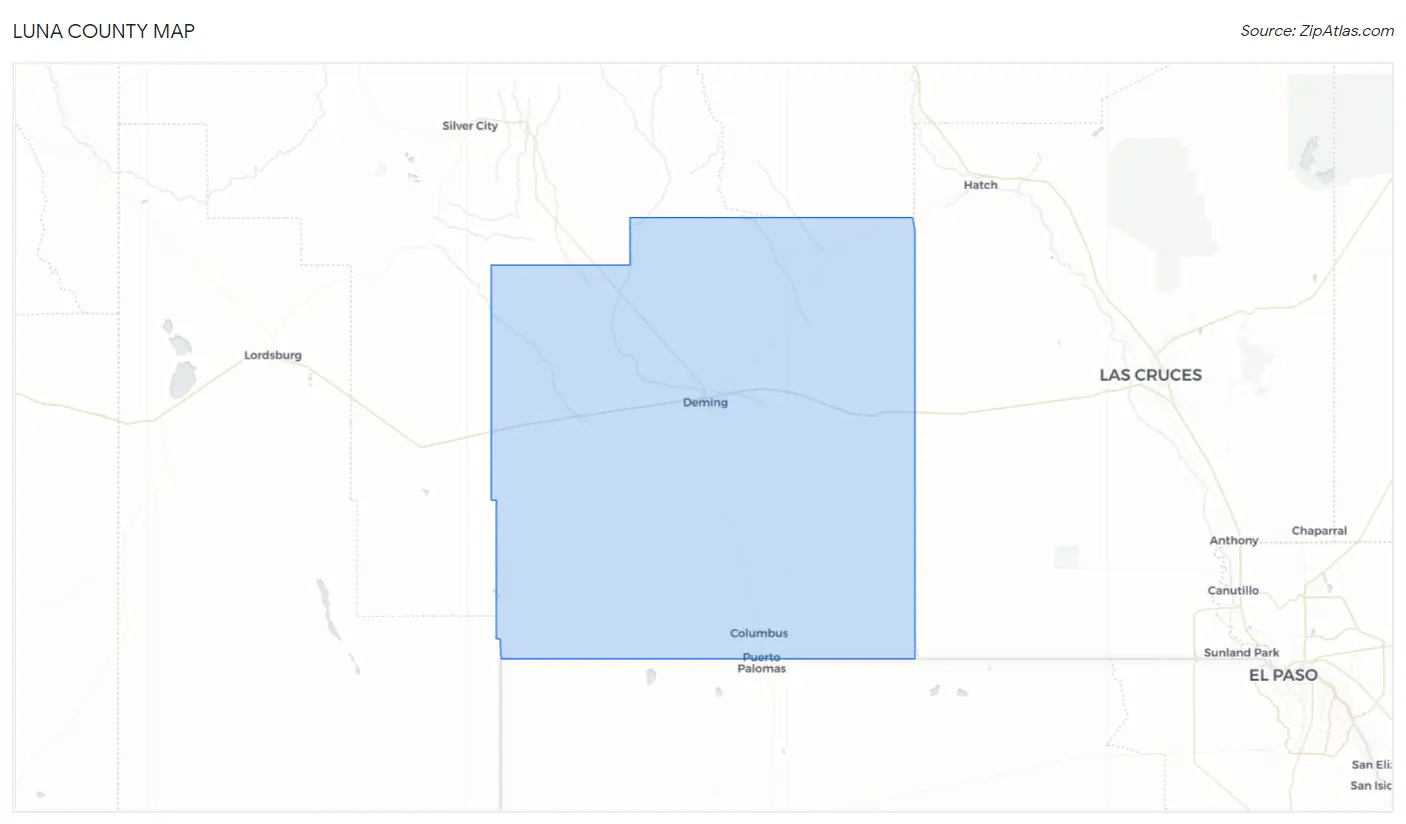
Luna County Map
Luna County Overview
$20,799
PER CAPITA INCOME
$51,654
AVG FAMILY INCOME
$38,241
AVG HOUSEHOLD INCOME
49.9%
WAGE / INCOME GAP [ % ]
50.1¢/ $1
WAGE / INCOME GAP [ $ ]
$9,548
FAMILY INCOME DEFICIT
0.45
INEQUALITY / GINI INDEX
25,393
TOTAL POPULATION
12,969
MALE POPULATION
12,424
FEMALE POPULATION
104.39
MALES / 100 FEMALES
95.80
FEMALES / 100 MALES
36.5
MEDIAN AGE
3.8
AVG FAMILY SIZE
2.8
AVG HOUSEHOLD SIZE
8,933
LABOR FORCE [ PEOPLE ]
46.2%
PERCENT IN LABOR FORCE
7.0%
UNEMPLOYMENT RATE
Income in Luna County
Income Overview in Luna County
Per Capita Income in Luna County is $20,799, while median incomes of families and households are $51,654 and $38,241 respectively.
| Characteristic | Number | Measure |
| Per Capita Income | 25,393 | $20,799 |
| Median Family Income | 5,190 | $51,654 |
| Mean Family Income | 5,190 | $63,792 |
| Median Household Income | 8,951 | $38,241 |
| Mean Household Income | 8,951 | $51,973 |
| Income Deficit | 5,190 | $9,548 |
| Wage / Income Gap (%) | 25,393 | 49.93% |
| Wage / Income Gap ($) | 25,393 | 50.07¢ per $1 |
| Gini / Inequality Index | 25,393 | 0.45 |
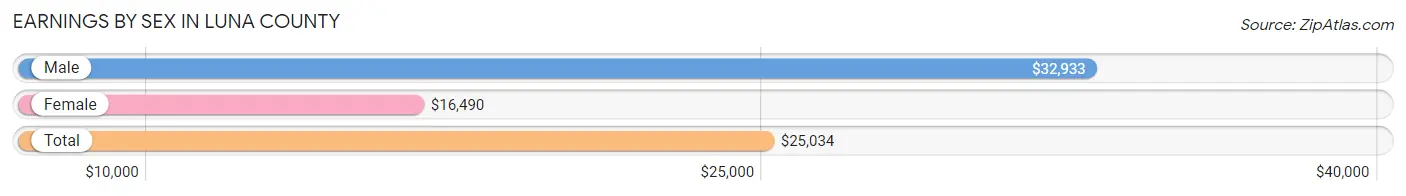
Earnings by Sex in Luna County
Average Earnings in Luna County are $25,034, $32,933 for men and $16,490 for women, a difference of 49.9%.
| Sex | Number | Average Earnings |
| Male | 5,320 (54.7%) | $32,933 |
| Female | 4,408 (45.3%) | $16,490 |
| Total | 9,728 (100.0%) | $25,034 |
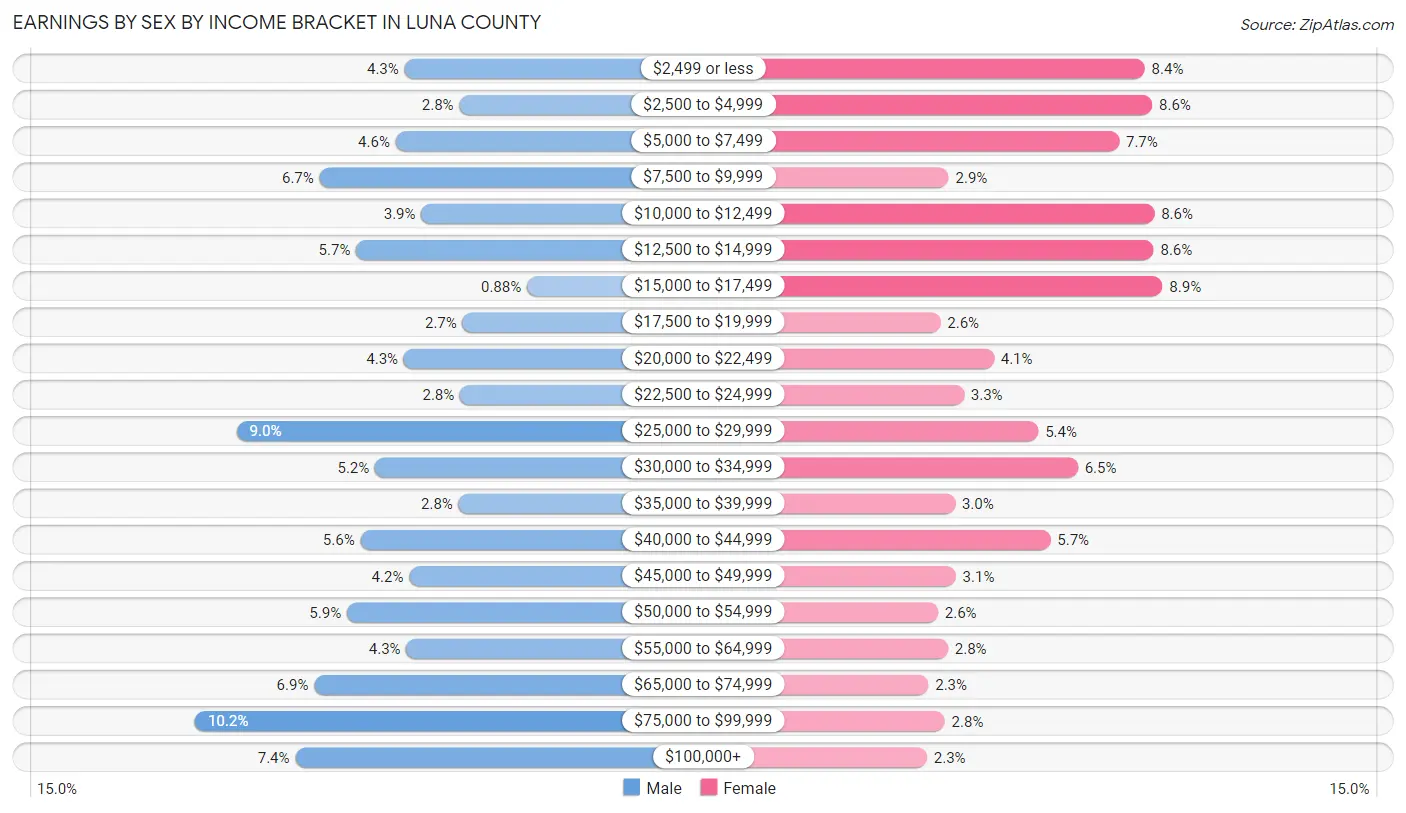
Earnings by Sex by Income Bracket in Luna County
The most common earnings brackets in Luna County are $75,000 to $99,999 for men (543 | 10.2%) and $15,000 to $17,499 for women (391 | 8.9%).
| Income | Male | Female |
| $2,499 or less | 230 (4.3%) | 369 (8.4%) |
| $2,500 to $4,999 | 148 (2.8%) | 378 (8.6%) |
| $5,000 to $7,499 | 243 (4.6%) | 337 (7.6%) |
| $7,500 to $9,999 | 357 (6.7%) | 126 (2.9%) |
| $10,000 to $12,499 | 205 (3.8%) | 381 (8.6%) |
| $12,500 to $14,999 | 302 (5.7%) | 380 (8.6%) |
| $15,000 to $17,499 | 47 (0.9%) | 391 (8.9%) |
| $17,500 to $19,999 | 143 (2.7%) | 116 (2.6%) |
| $20,000 to $22,499 | 231 (4.3%) | 182 (4.1%) |
| $22,500 to $24,999 | 147 (2.8%) | 145 (3.3%) |
| $25,000 to $29,999 | 481 (9.0%) | 237 (5.4%) |
| $30,000 to $34,999 | 274 (5.1%) | 286 (6.5%) |
| $35,000 to $39,999 | 149 (2.8%) | 134 (3.0%) |
| $40,000 to $44,999 | 296 (5.6%) | 252 (5.7%) |
| $45,000 to $49,999 | 223 (4.2%) | 135 (3.1%) |
| $50,000 to $54,999 | 316 (5.9%) | 113 (2.6%) |
| $55,000 to $64,999 | 227 (4.3%) | 125 (2.8%) |
| $65,000 to $74,999 | 365 (6.9%) | 101 (2.3%) |
| $75,000 to $99,999 | 543 (10.2%) | 121 (2.8%) |
| $100,000+ | 393 (7.4%) | 99 (2.2%) |
| Total | 5,320 (100.0%) | 4,408 (100.0%) |
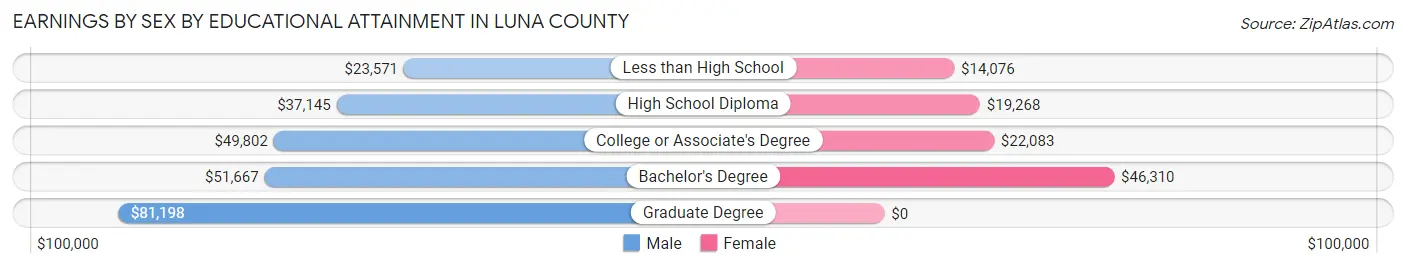
Earnings by Sex by Educational Attainment in Luna County
Average earnings in Luna County are $42,905 for men and $19,192 for women, a difference of 55.3%. Men with an educational attainment of graduate degree enjoy the highest average annual earnings of $81,198, while those with less than high school education earn the least with $23,571. Women with an educational attainment of bachelor's degree earn the most with the average annual earnings of $46,310, while those with less than high school education have the smallest earnings of $14,076.
| Educational Attainment | Male Income | Female Income |
| Less than High School | $23,571 | $14,076 |
| High School Diploma | $37,145 | $19,268 |
| College or Associate's Degree | $49,802 | $22,083 |
| Bachelor's Degree | $51,667 | $46,310 |
| Graduate Degree | $81,198 | $0 |
| Total | $42,905 | $19,192 |
Family Income in Luna County
Family Income Brackets in Luna County
According to the Luna County family income data, there are 1,028 families falling into the $50,000 to $74,999 income range, which is the most common income bracket and makes up 19.8% of all families. Conversely, the $200,000+ income bracket is the least frequent group with only 99 families (1.9%) belonging to this category.
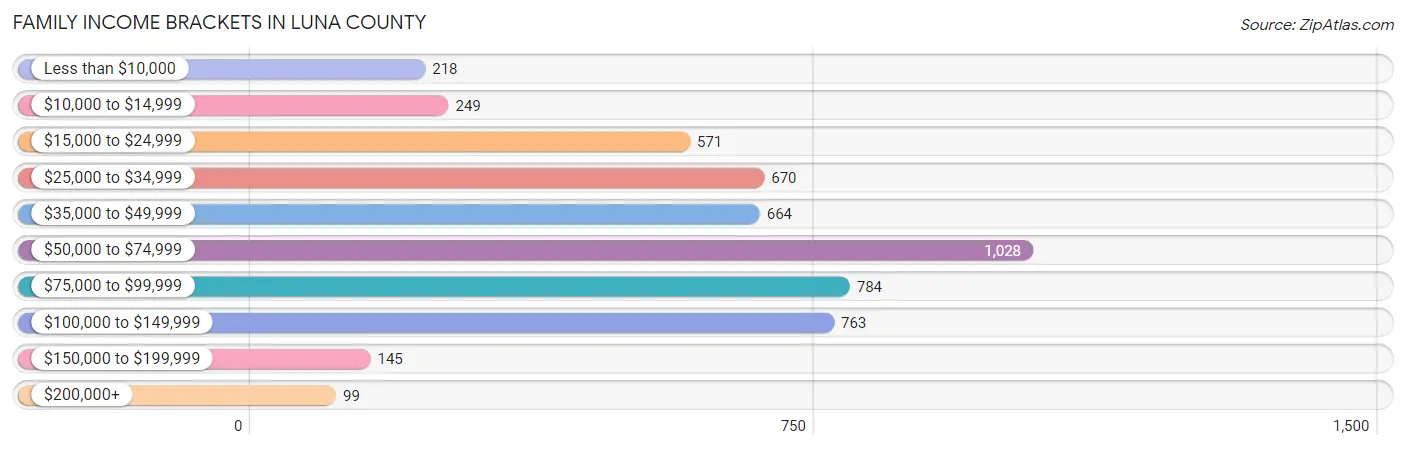
| Income Bracket | # Families | % Families |
| Less than $10,000 | 218 | 4.2% |
| $10,000 to $14,999 | 249 | 4.8% |
| $15,000 to $24,999 | 571 | 11.0% |
| $25,000 to $34,999 | 670 | 12.9% |
| $35,000 to $49,999 | 664 | 12.8% |
| $50,000 to $74,999 | 1,028 | 19.8% |
| $75,000 to $99,999 | 784 | 15.1% |
| $100,000 to $149,999 | 763 | 14.7% |
| $150,000 to $199,999 | 145 | 2.8% |
| $200,000+ | 99 | 1.9% |
Family Income by Famaliy Size in Luna County
7+ person families (53 | 1.0%) account for the highest median family income in Luna County with $103,603 per family, while 2-person families (2,264 | 43.6%) have the highest median income of $27,863 per family member.
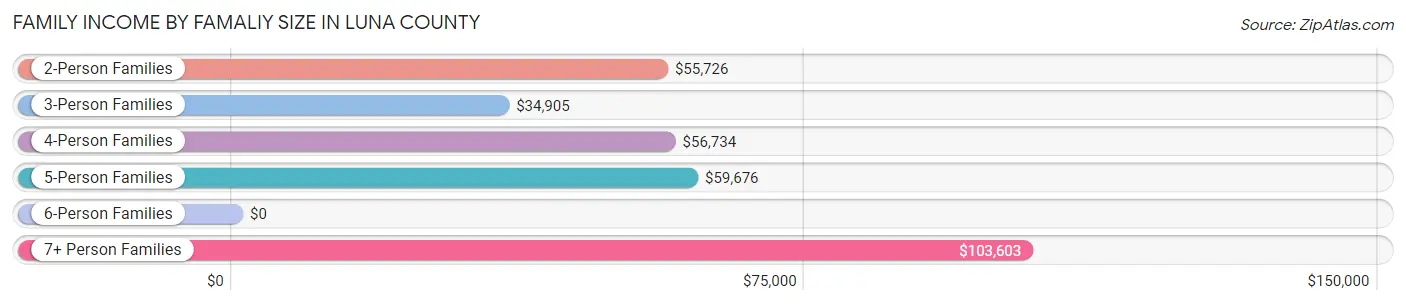
| Income Bracket | # Families | Median Income |
| 2-Person Families | 2,264 (43.6%) | $55,726 |
| 3-Person Families | 1,239 (23.9%) | $34,905 |
| 4-Person Families | 787 (15.2%) | $56,734 |
| 5-Person Families | 660 (12.7%) | $59,676 |
| 6-Person Families | 187 (3.6%) | $0 |
| 7+ Person Families | 53 (1.0%) | $103,603 |
| Total | 5,190 (100.0%) | $51,654 |
Family Income by Number of Earners in Luna County
The median family income in Luna County is $51,654, with families comprising 3+ earners (464) having the highest median family income of $100,756, while families with no earners (1,114) have the lowest median family income of $31,471, accounting for 8.9% and 21.5% of families, respectively.
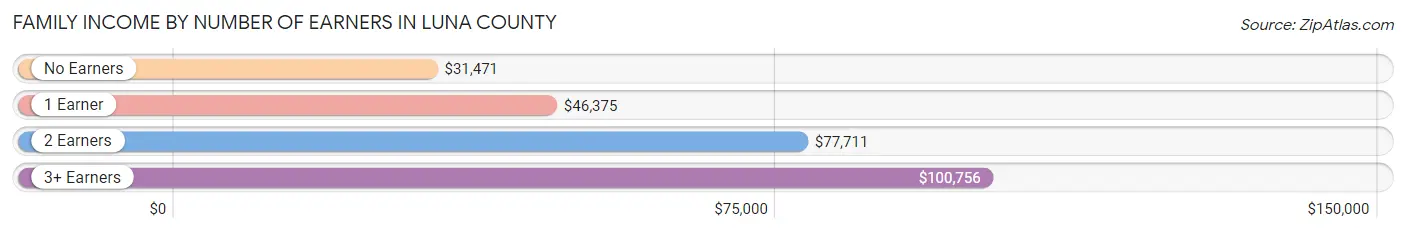
| Number of Earners | # Families | Median Income |
| No Earners | 1,114 (21.5%) | $31,471 |
| 1 Earner | 2,204 (42.5%) | $46,375 |
| 2 Earners | 1,408 (27.1%) | $77,711 |
| 3+ Earners | 464 (8.9%) | $100,756 |
| Total | 5,190 (100.0%) | $51,654 |
Household Income in Luna County
Household Income Brackets in Luna County
With 1,549 households falling in the category, the $15,000 to $24,999 income range is the most frequent in Luna County, accounting for 17.3% of all households. In contrast, only 125 households (1.4%) fall into the $200,000+ income bracket, making it the least populous group.
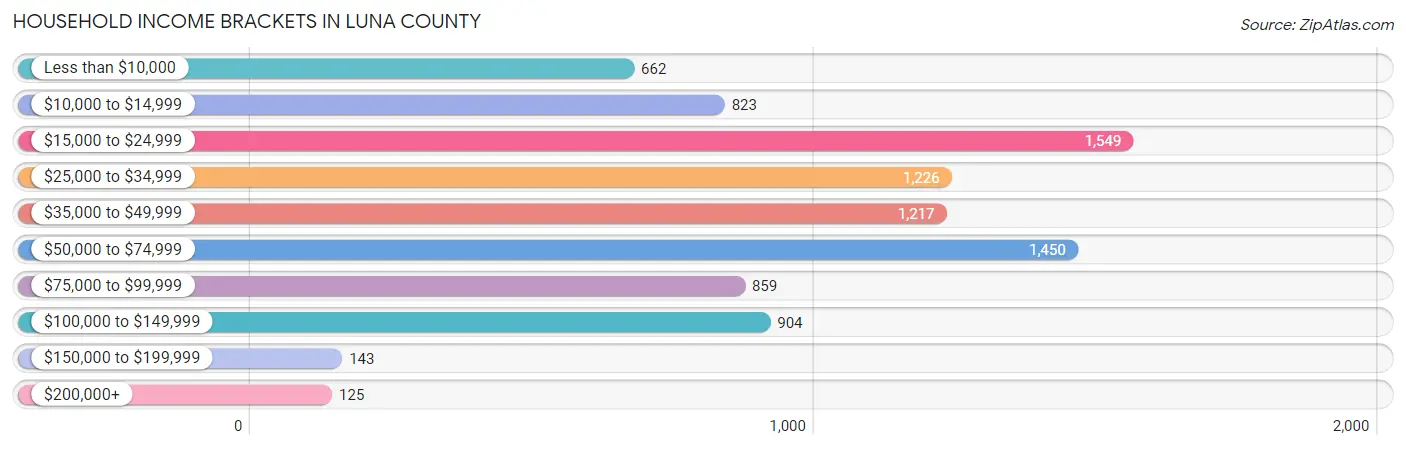
| Income Bracket | # Households | % Households |
| Less than $10,000 | 662 | 7.4% |
| $10,000 to $14,999 | 823 | 9.2% |
| $15,000 to $24,999 | 1,549 | 17.3% |
| $25,000 to $34,999 | 1,226 | 13.7% |
| $35,000 to $49,999 | 1,217 | 13.6% |
| $50,000 to $74,999 | 1,450 | 16.2% |
| $75,000 to $99,999 | 859 | 9.6% |
| $100,000 to $149,999 | 904 | 10.1% |
| $150,000 to $199,999 | 143 | 1.6% |
| $200,000+ | 125 | 1.4% |
Household Income by Householder Age in Luna County
The median household income in Luna County is $38,241, with the highest median household income of $44,666 found in the 25 to 44 years age bracket for the primary householder. A total of 2,469 households (27.6%) fall into this category. Meanwhile, the 15 to 24 years age bracket for the primary householder has the lowest median household income of $27,688, with 279 households (3.1%) in this group.
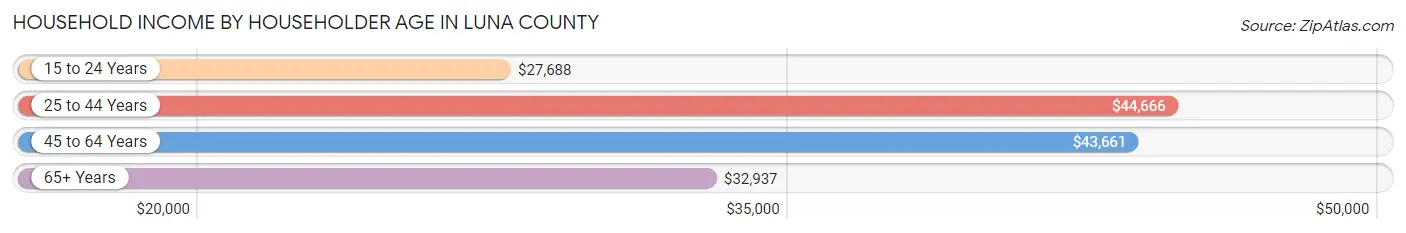
| Income Bracket | # Households | Median Income |
| 15 to 24 Years | 279 (3.1%) | $27,688 |
| 25 to 44 Years | 2,469 (27.6%) | $44,666 |
| 45 to 64 Years | 2,719 (30.4%) | $43,661 |
| 65+ Years | 3,484 (38.9%) | $32,937 |
| Total | 8,951 (100.0%) | $38,241 |
Poverty in Luna County
Income Below Poverty by Sex and Age in Luna County
With 20.2% poverty level for males and 26.5% for females among the residents of Luna County, 16 and 17 year old males and 16 and 17 year old females are the most vulnerable to poverty, with 212 males (65.8%) and 279 females (68.9%) in their respective age groups living below the poverty level.
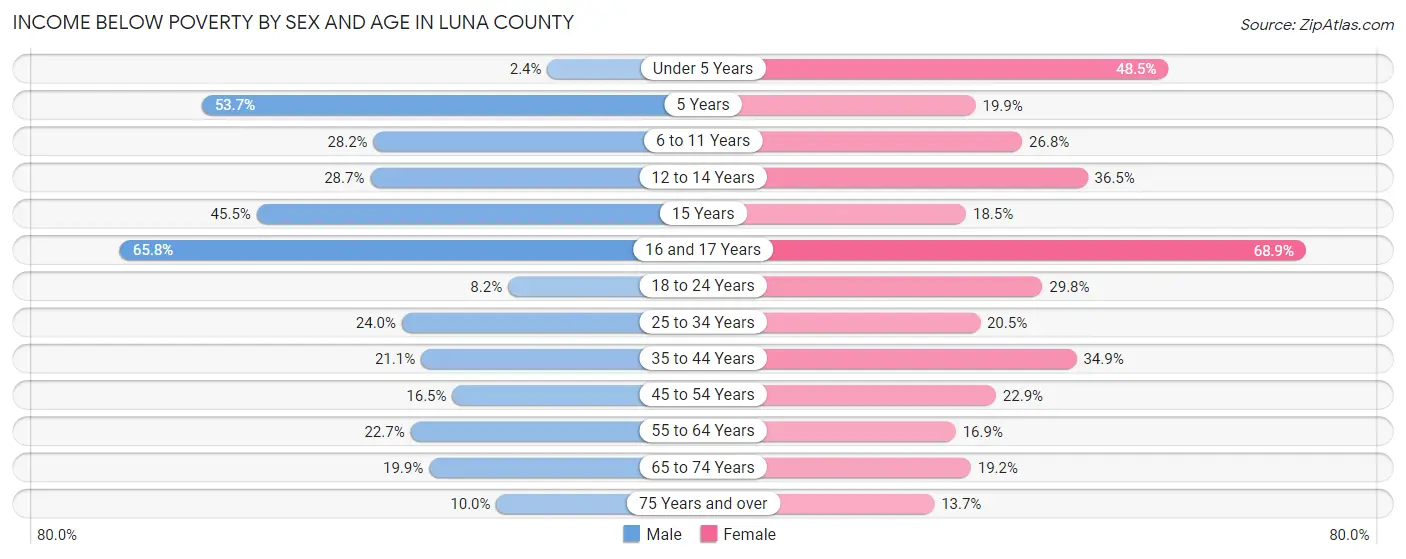
| Age Bracket | Male | Female |
| Under 5 Years | 26 (2.4%) | 435 (48.5%) |
| 5 Years | 80 (53.7%) | 28 (19.9%) |
| 6 to 11 Years | 273 (28.2%) | 343 (26.8%) |
| 12 to 14 Years | 195 (28.7%) | 146 (36.5%) |
| 15 Years | 97 (45.5%) | 31 (18.4%) |
| 16 and 17 Years | 212 (65.8%) | 279 (68.9%) |
| 18 to 24 Years | 87 (8.2%) | 296 (29.8%) |
| 25 to 34 Years | 389 (24.0%) | 314 (20.5%) |
| 35 to 44 Years | 294 (21.1%) | 420 (34.8%) |
| 45 to 54 Years | 202 (16.5%) | 284 (22.9%) |
| 55 to 64 Years | 313 (22.7%) | 247 (16.9%) |
| 65 to 74 Years | 287 (19.9%) | 259 (19.2%) |
| 75 Years and over | 117 (10.0%) | 162 (13.7%) |
| Total | 2,572 (20.2%) | 3,244 (26.5%) |
Income Above Poverty by Sex and Age in Luna County
According to the poverty statistics in Luna County, males aged under 5 years and females aged 75 years and over are the age groups that are most secure financially, with 97.6% of males and 86.3% of females in these age groups living above the poverty line.
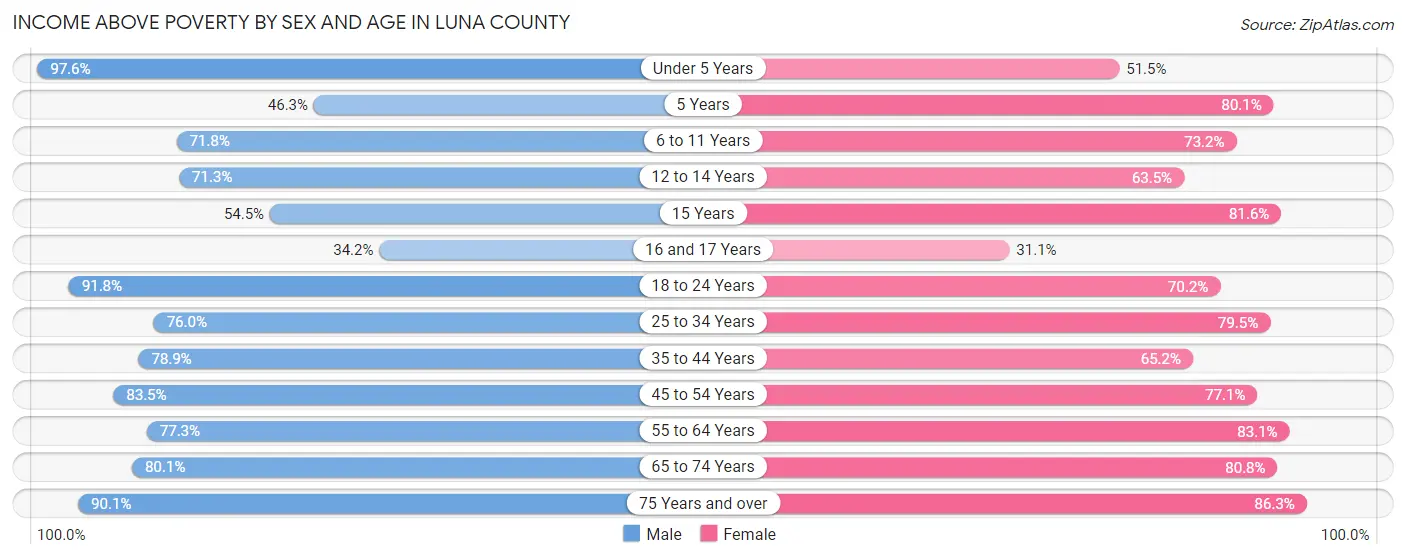
| Age Bracket | Male | Female |
| Under 5 Years | 1,073 (97.6%) | 462 (51.5%) |
| 5 Years | 69 (46.3%) | 113 (80.1%) |
| 6 to 11 Years | 695 (71.8%) | 938 (73.2%) |
| 12 to 14 Years | 485 (71.3%) | 254 (63.5%) |
| 15 Years | 116 (54.5%) | 137 (81.6%) |
| 16 and 17 Years | 110 (34.2%) | 126 (31.1%) |
| 18 to 24 Years | 971 (91.8%) | 698 (70.2%) |
| 25 to 34 Years | 1,233 (76.0%) | 1,216 (79.5%) |
| 35 to 44 Years | 1,097 (78.9%) | 785 (65.1%) |
| 45 to 54 Years | 1,024 (83.5%) | 957 (77.1%) |
| 55 to 64 Years | 1,066 (77.3%) | 1,213 (83.1%) |
| 65 to 74 Years | 1,152 (80.1%) | 1,093 (80.8%) |
| 75 Years and over | 1,059 (90.0%) | 1,019 (86.3%) |
| Total | 10,150 (79.8%) | 9,011 (73.5%) |
Income Below Poverty Among Married-Couple Families in Luna County
The poverty statistics for married-couple families in Luna County show that 13.9% or 494 of the total 3,568 families live below the poverty line. Families with 5 or more children have the highest poverty rate of 100.0%, comprising of 8 families. On the other hand, families with no children have the lowest poverty rate of 11.3%, which includes 232 families.
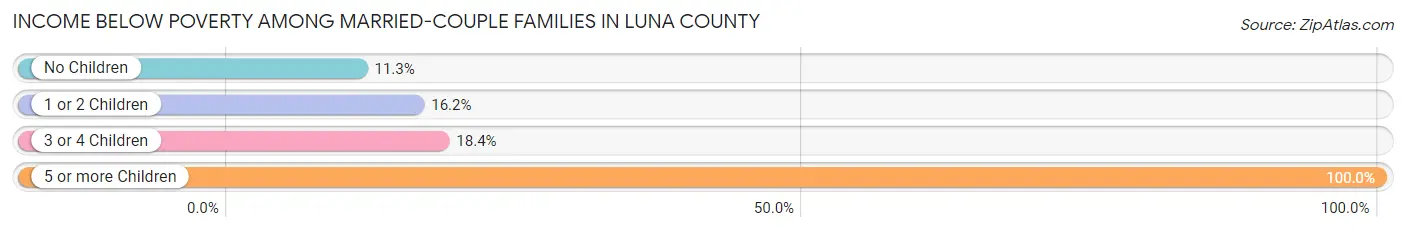
| Children | Above Poverty | Below Poverty |
| No Children | 1,827 (88.7%) | 232 (11.3%) |
| 1 or 2 Children | 848 (83.8%) | 164 (16.2%) |
| 3 or 4 Children | 399 (81.6%) | 90 (18.4%) |
| 5 or more Children | 0 (0.0%) | 8 (100.0%) |
| Total | 3,074 (86.2%) | 494 (13.9%) |
Income Below Poverty Among Single-Parent Households in Luna County
According to the poverty data in Luna County, 13.6% or 77 single-father households and 40.7% or 430 single-mother households are living below the poverty line. Among single-father households, those with 3 or 4 children have the highest poverty rate, with 41 households (59.4%) experiencing poverty. Likewise, among single-mother households, those with 5 or more children have the highest poverty rate, with 82 households (100.0%) falling below the poverty line.
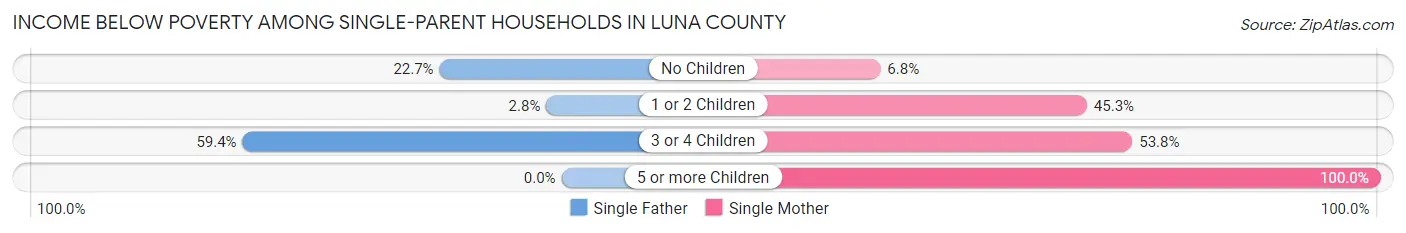
| Children | Single Father | Single Mother |
| No Children | 25 (22.7%) | 18 (6.8%) |
| 1 or 2 Children | 11 (2.8%) | 280 (45.3%) |
| 3 or 4 Children | 41 (59.4%) | 50 (53.8%) |
| 5 or more Children | 0 (0.0%) | 82 (100.0%) |
| Total | 77 (13.6%) | 430 (40.7%) |
Income Below Poverty Among Married-Couple vs Single-Parent Households in Luna County
The poverty data for Luna County shows that 494 of the married-couple family households (13.9%) and 507 of the single-parent households (31.3%) are living below the poverty level. Within the married-couple family households, those with 5 or more children have the highest poverty rate, with 8 households (100.0%) falling below the poverty line. Among the single-parent households, those with 5 or more children have the highest poverty rate, with 82 household (100.0%) living below poverty.
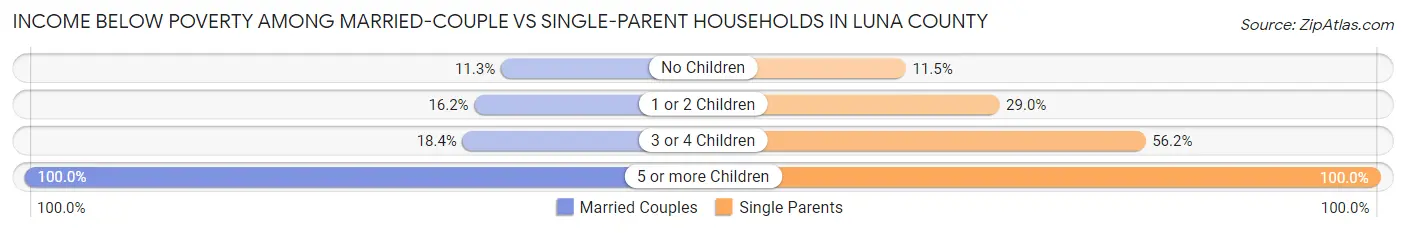
| Children | Married-Couple Families | Single-Parent Households |
| No Children | 232 (11.3%) | 43 (11.5%) |
| 1 or 2 Children | 164 (16.2%) | 291 (29.0%) |
| 3 or 4 Children | 90 (18.4%) | 91 (56.2%) |
| 5 or more Children | 8 (100.0%) | 82 (100.0%) |
| Total | 494 (13.9%) | 507 (31.3%) |
Race in Luna County
The most populous races in Luna County are Hispanic or Latino (17,472 | 68.8%), White / Caucasian (17,075 | 67.2%), and Two or more Races (5,493 | 21.6%).
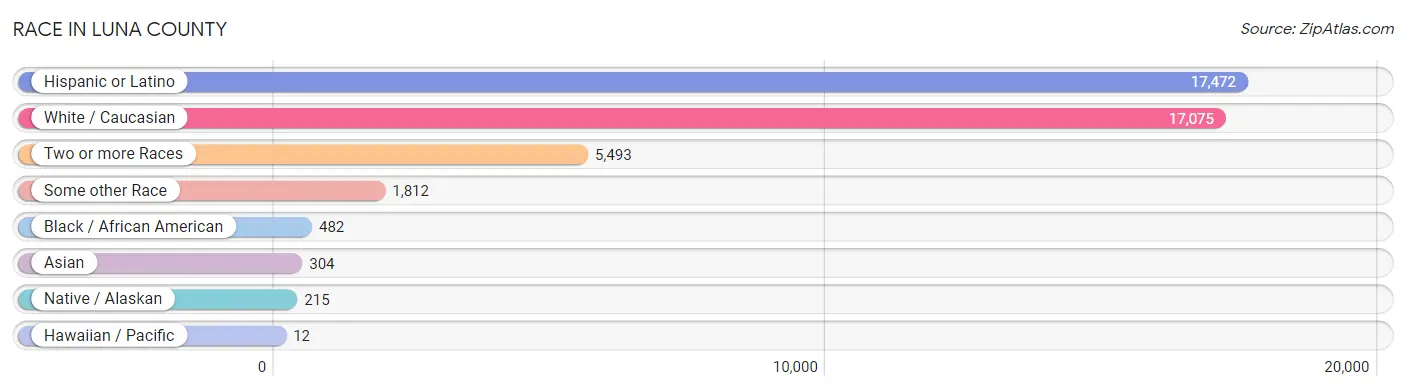
| Race | # Population | % Population |
| Asian | 304 | 1.2% |
| Black / African American | 482 | 1.9% |
| Hawaiian / Pacific | 12 | 0.1% |
| Hispanic or Latino | 17,472 | 68.8% |
| Native / Alaskan | 215 | 0.9% |
| White / Caucasian | 17,075 | 67.2% |
| Two or more Races | 5,493 | 21.6% |
| Some other Race | 1,812 | 7.1% |
| Total | 25,393 | 100.0% |
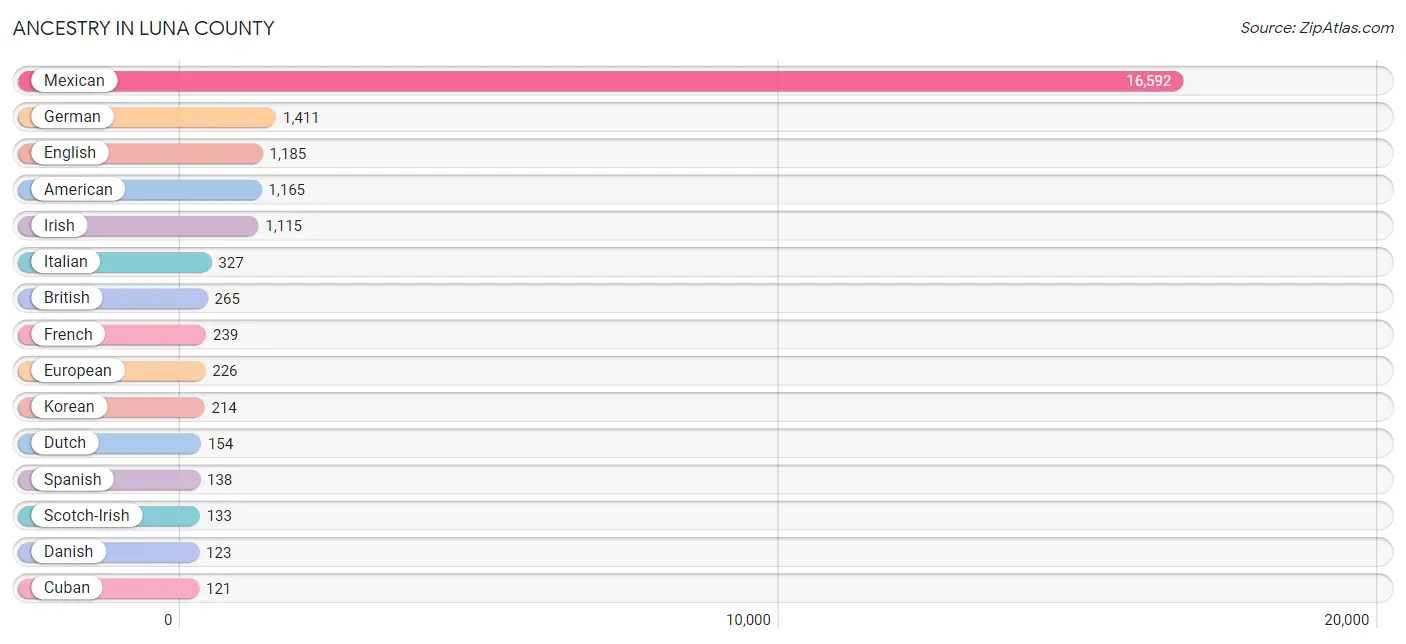
Ancestry in Luna County
The most populous ancestries reported in Luna County are Mexican (16,592 | 65.3%), German (1,411 | 5.6%), English (1,185 | 4.7%), American (1,165 | 4.6%), and Irish (1,115 | 4.4%), together accounting for 84.6% of all Luna County residents.
| Ancestry | # Population | % Population |
| African | 34 | 0.1% |
| American | 1,165 | 4.6% |
| Apache | 71 | 0.3% |
| Arab | 22 | 0.1% |
| Armenian | 7 | 0.0% |
| Basque | 9 | 0.0% |
| Bhutanese | 2 | 0.0% |
| Blackfeet | 1 | 0.0% |
| British | 265 | 1.0% |
| Burmese | 119 | 0.5% |
| Canadian | 37 | 0.2% |
| Central American | 75 | 0.3% |
| Cherokee | 89 | 0.4% |
| Choctaw | 1 | 0.0% |
| Creek | 19 | 0.1% |
| Cuban | 121 | 0.5% |
| Czech | 94 | 0.4% |
| Czechoslovakian | 72 | 0.3% |
| Danish | 123 | 0.5% |
| Dominican | 2 | 0.0% |
| Dutch | 154 | 0.6% |
| English | 1,185 | 4.7% |
| European | 226 | 0.9% |
| Finnish | 31 | 0.1% |
| French | 239 | 0.9% |
| German | 1,411 | 5.6% |
| Greek | 4 | 0.0% |
| Guamanian / Chamorro | 12 | 0.1% |
| Guatemalan | 22 | 0.1% |
| Hungarian | 4 | 0.0% |
| Iranian | 28 | 0.1% |
| Irish | 1,115 | 4.4% |
| Italian | 327 | 1.3% |
| Korean | 214 | 0.8% |
| Lithuanian | 24 | 0.1% |
| Mexican | 16,592 | 65.3% |
| Mexican American Indian | 56 | 0.2% |
| Moroccan | 22 | 0.1% |
| Navajo | 36 | 0.1% |
| Northern European | 21 | 0.1% |
| Norwegian | 46 | 0.2% |
| Paiute | 10 | 0.0% |
| Panamanian | 24 | 0.1% |
| Pennsylvania German | 19 | 0.1% |
| Polish | 83 | 0.3% |
| Portuguese | 5 | 0.0% |
| Pueblo | 108 | 0.4% |
| Puerto Rican | 52 | 0.2% |
| Romanian | 25 | 0.1% |
| Russian | 19 | 0.1% |
| Salvadoran | 29 | 0.1% |
| Scandinavian | 21 | 0.1% |
| Scotch-Irish | 133 | 0.5% |
| Scottish | 107 | 0.4% |
| Serbian | 8 | 0.0% |
| Slovak | 3 | 0.0% |
| Spaniard | 83 | 0.3% |
| Spanish | 138 | 0.5% |
| Spanish American | 29 | 0.1% |
| Subsaharan African | 34 | 0.1% |
| Swedish | 64 | 0.3% |
| Swiss | 15 | 0.1% |
| Thai | 4 | 0.0% |
| Welsh | 74 | 0.3% |
| Yugoslavian | 21 | 0.1% | View All 65 Rows |
Immigrants in Luna County
The most numerous immigrant groups reported in Luna County came from Latin America (3,841 | 15.1%), Central America (3,807 | 15.0%), Mexico (3,734 | 14.7%), Asia (102 | 0.4%), and Philippines (91 | 0.4%), together accounting for 45.6% of all Luna County residents.
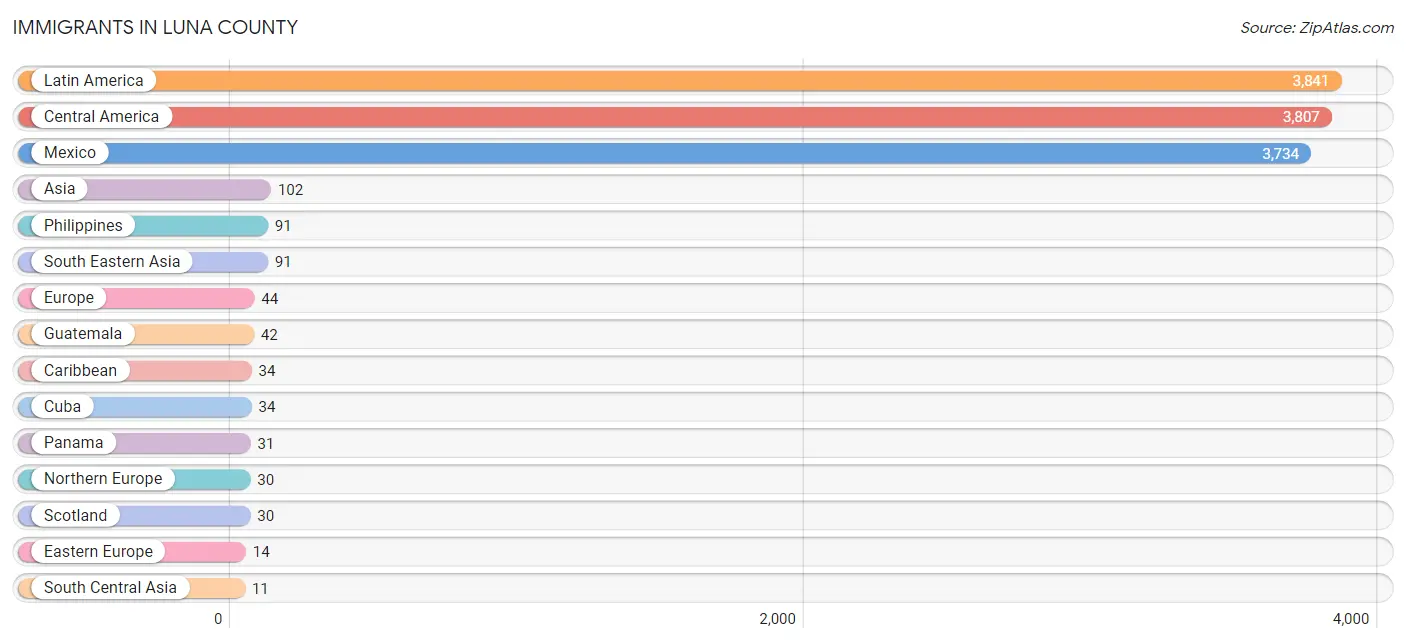
| Immigration Origin | # Population | % Population |
| Asia | 102 | 0.4% |
| Caribbean | 34 | 0.1% |
| Central America | 3,807 | 15.0% |
| Cuba | 34 | 0.1% |
| Eastern Europe | 14 | 0.1% |
| Europe | 44 | 0.2% |
| Guatemala | 42 | 0.2% |
| India | 4 | 0.0% |
| Iran | 7 | 0.0% |
| Latin America | 3,841 | 15.1% |
| Mexico | 3,734 | 14.7% |
| Northern Europe | 30 | 0.1% |
| Panama | 31 | 0.1% |
| Philippines | 91 | 0.4% |
| Poland | 6 | 0.0% |
| Scotland | 30 | 0.1% |
| Serbia | 8 | 0.0% |
| South Central Asia | 11 | 0.0% |
| South Eastern Asia | 91 | 0.4% | View All 19 Rows |
Sex and Age in Luna County
Sex and Age in Luna County
The most populous age groups in Luna County are Under 5 Years (1,099 | 8.5%) for men and 5 to 9 Years (1,085 | 8.7%) for women.
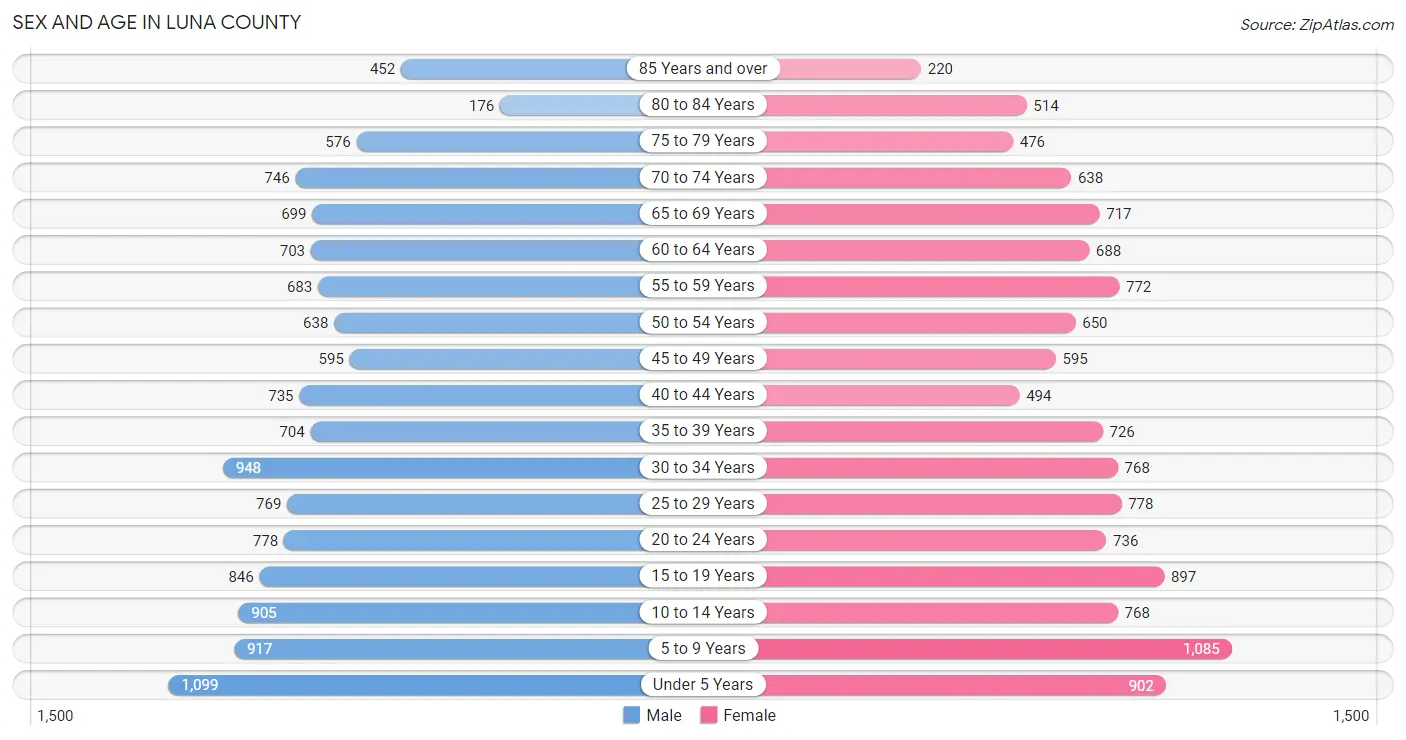
| Age Bracket | Male | Female |
| Under 5 Years | 1,099 (8.5%) | 902 (7.3%) |
| 5 to 9 Years | 917 (7.1%) | 1,085 (8.7%) |
| 10 to 14 Years | 905 (7.0%) | 768 (6.2%) |
| 15 to 19 Years | 846 (6.5%) | 897 (7.2%) |
| 20 to 24 Years | 778 (6.0%) | 736 (5.9%) |
| 25 to 29 Years | 769 (5.9%) | 778 (6.3%) |
| 30 to 34 Years | 948 (7.3%) | 768 (6.2%) |
| 35 to 39 Years | 704 (5.4%) | 726 (5.8%) |
| 40 to 44 Years | 735 (5.7%) | 494 (4.0%) |
| 45 to 49 Years | 595 (4.6%) | 595 (4.8%) |
| 50 to 54 Years | 638 (4.9%) | 650 (5.2%) |
| 55 to 59 Years | 683 (5.3%) | 772 (6.2%) |
| 60 to 64 Years | 703 (5.4%) | 688 (5.5%) |
| 65 to 69 Years | 699 (5.4%) | 717 (5.8%) |
| 70 to 74 Years | 746 (5.8%) | 638 (5.1%) |
| 75 to 79 Years | 576 (4.4%) | 476 (3.8%) |
| 80 to 84 Years | 176 (1.4%) | 514 (4.1%) |
| 85 Years and over | 452 (3.5%) | 220 (1.8%) |
| Total | 12,969 (100.0%) | 12,424 (100.0%) |
Families and Households in Luna County
Median Family Size in Luna County
The median family size in Luna County is 3.81 persons per family, with single female/mother families (1,056 | 20.3%) accounting for the largest median family size of 4.08 persons per family. On the other hand, single male/father families (566 | 10.9%) represent the smallest median family size with 3.21 persons per family.
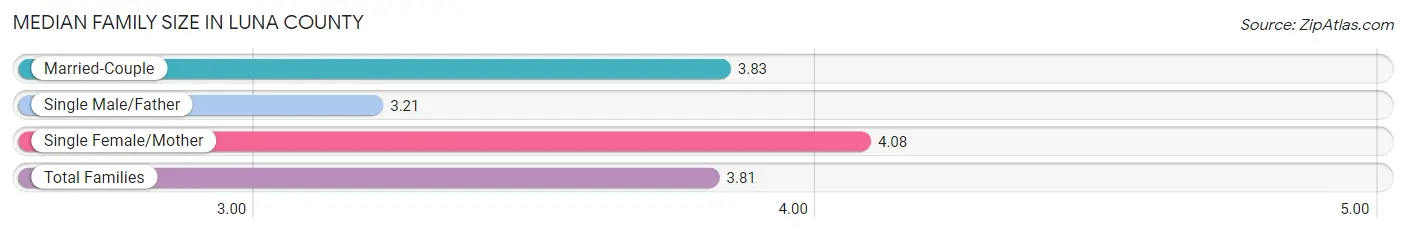
| Family Type | # Families | Family Size |
| Married-Couple | 3,568 (68.8%) | 3.83 |
| Single Male/Father | 566 (10.9%) | 3.21 |
| Single Female/Mother | 1,056 (20.3%) | 4.08 |
| Total Families | 5,190 (100.0%) | 3.81 |
Median Household Size in Luna County
The median household size in Luna County is 2.79 persons per household, with single female/mother households (1,056 | 11.8%) accounting for the largest median household size of 4.18 persons per household. non-family households (3,761 | 42.0%) represent the smallest median household size with 1.23 persons per household.
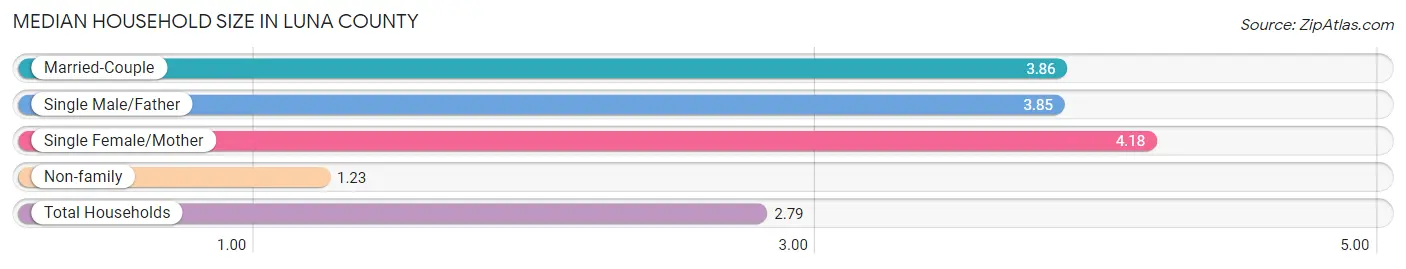
| Household Type | # Households | Household Size |
| Married-Couple | 3,568 (39.9%) | 3.86 |
| Single Male/Father | 566 (6.3%) | 3.85 |
| Single Female/Mother | 1,056 (11.8%) | 4.18 |
| Non-family | 3,761 (42.0%) | 1.23 |
| Total Households | 8,951 (100.0%) | 2.79 |
Household Size by Marriage Status in Luna County
Out of a total of 8,951 households in Luna County, 5,190 (58.0%) are family households, while 3,761 (42.0%) are nonfamily households. The most numerous type of family households are 2-person households, comprising 1,964, and the most common type of nonfamily households are 1-person households, comprising 3,266.
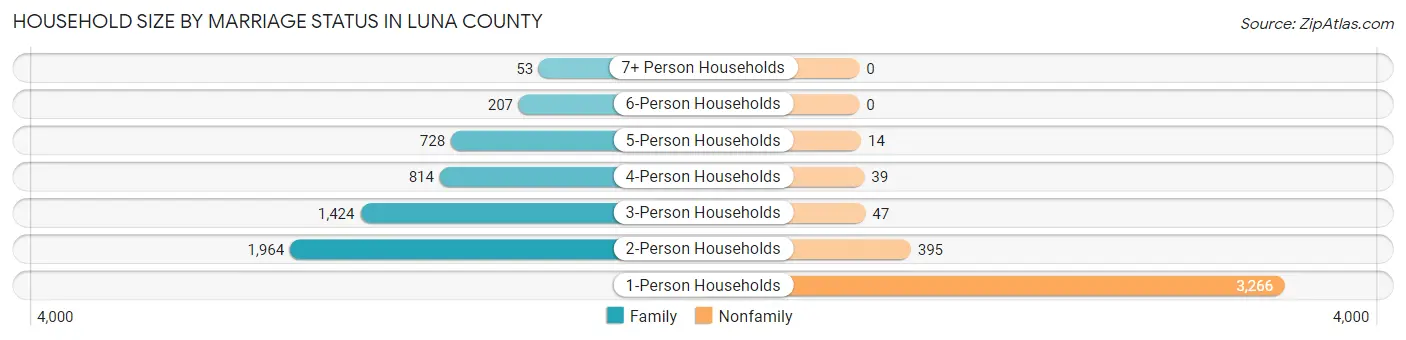
| Household Size | Family Households | Nonfamily Households |
| 1-Person Households | - | 3,266 (36.5%) |
| 2-Person Households | 1,964 (21.9%) | 395 (4.4%) |
| 3-Person Households | 1,424 (15.9%) | 47 (0.5%) |
| 4-Person Households | 814 (9.1%) | 39 (0.4%) |
| 5-Person Households | 728 (8.1%) | 14 (0.2%) |
| 6-Person Households | 207 (2.3%) | 0 (0.0%) |
| 7+ Person Households | 53 (0.6%) | 0 (0.0%) |
| Total | 5,190 (58.0%) | 3,761 (42.0%) |
Female Fertility in Luna County
Fertility by Age in Luna County
Average fertility rate in Luna County is 38.0 births per 1,000 women. Women in the age bracket of 20 to 34 years have the highest fertility rate with 79.0 births per 1,000 women. Women in the age bracket of 20 to 34 years acount for 93.8% of all women with births.
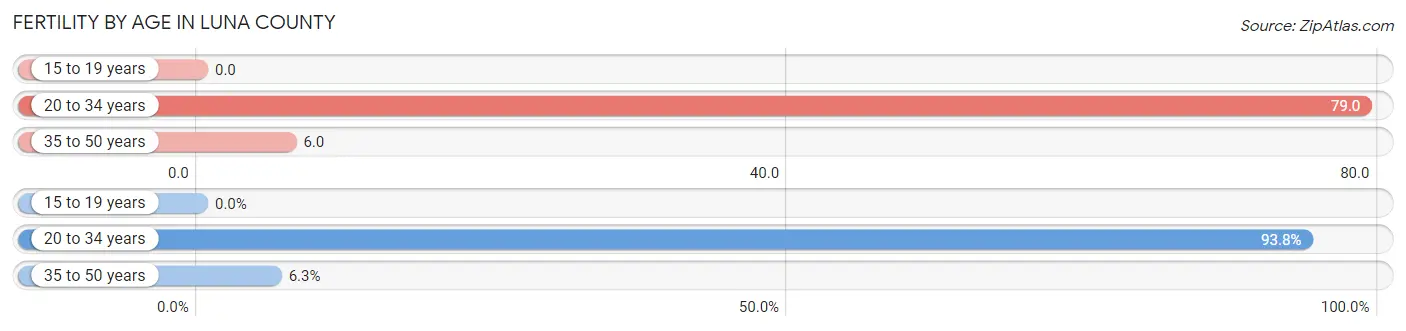
| Age Bracket | Women with Births | Births / 1,000 Women |
| 15 to 19 years | 0 (0.0%) | 0.0 |
| 20 to 34 years | 180 (93.8%) | 79.0 |
| 35 to 50 years | 12 (6.2%) | 6.0 |
| Total | 192 (100.0%) | 38.0 |
Fertility by Age by Marriage Status in Luna County
62.0% of women with births (192) in Luna County are married. The highest percentage of unmarried women with births falls into 20 to 34 years age bracket with 40.6% of them unmarried at the time of birth, while the lowest percentage of unmarried women with births belong to 35 to 50 years age bracket with 0.0% of them unmarried.
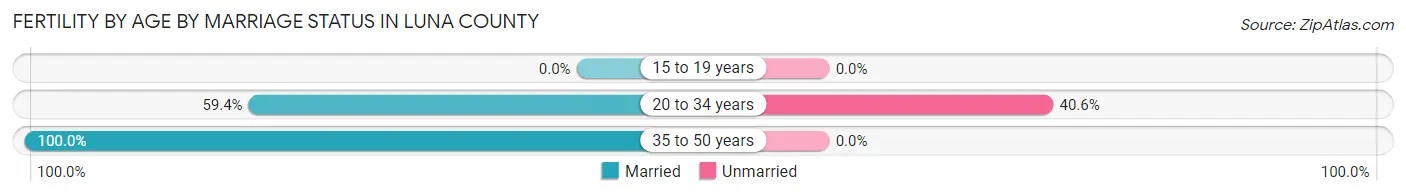
| Age Bracket | Married | Unmarried |
| 15 to 19 years | 0 (0.0%) | 0 (0.0%) |
| 20 to 34 years | 107 (59.4%) | 73 (40.6%) |
| 35 to 50 years | 12 (100.0%) | 0 (0.0%) |
| Total | 119 (62.0%) | 73 (38.0%) |
Fertility by Education in Luna County
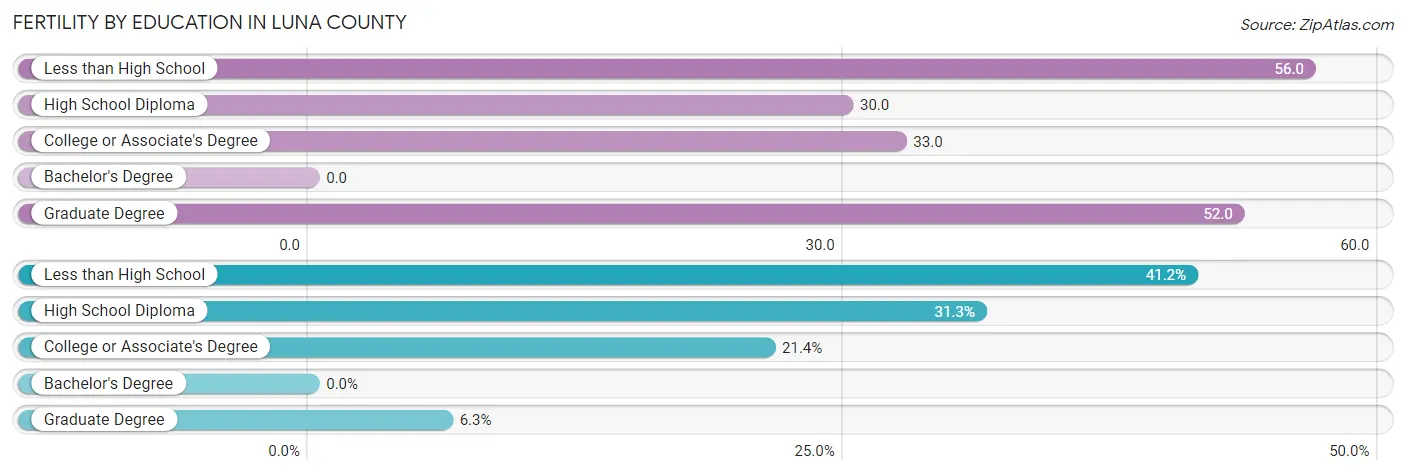
| Educational Attainment | Women with Births | Births / 1,000 Women |
| Less than High School | 79 (41.1%) | 56.0 |
| High School Diploma | 60 (31.2%) | 30.0 |
| College or Associate's Degree | 41 (21.3%) | 33.0 |
| Bachelor's Degree | 0 (0.0%) | 0.0 |
| Graduate Degree | 12 (6.2%) | 52.0 |
| Total | 192 (100.0%) | 38.0 |
Fertility by Education by Marriage Status in Luna County
38.0% of women with births in Luna County are unmarried. Women with the educational attainment of high school diploma are most likely to be married with 100.0% of them married at childbirth, while women with the educational attainment of less than high school are least likely to be married with 92.4% of them unmarried at childbirth.
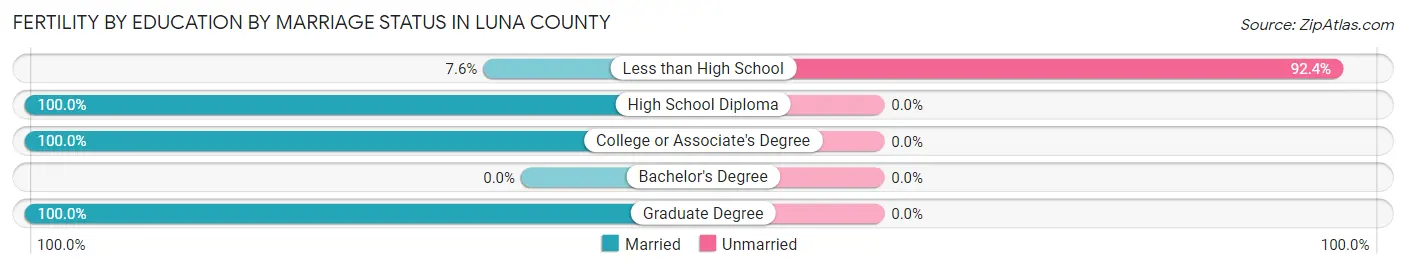
| Educational Attainment | Married | Unmarried |
| Less than High School | 6 (7.6%) | 73 (92.4%) |
| High School Diploma | 60 (100.0%) | 0 (0.0%) |
| College or Associate's Degree | 41 (100.0%) | 0 (0.0%) |
| Bachelor's Degree | 0 (0.0%) | 0 (0.0%) |
| Graduate Degree | 12 (100.0%) | 0 (0.0%) |
| Total | 119 (62.0%) | 73 (38.0%) |
Employment Characteristics in Luna County
Employment by Class of Employer in Luna County
Among the 8,172 employed individuals in Luna County, private company employees (5,703 | 69.8%), local government employees (867 | 10.6%), and state government employees (632 | 7.7%) make up the most common classes of employment.
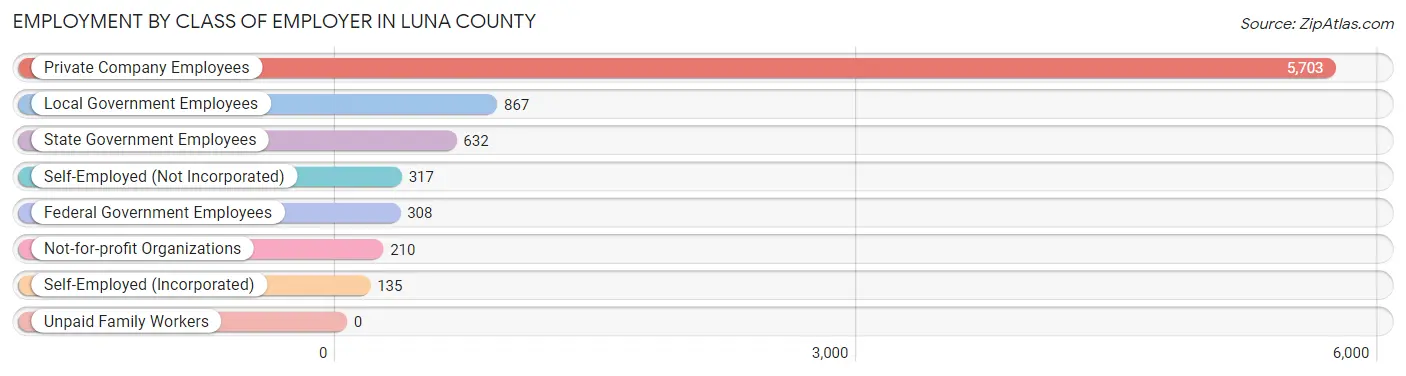
| Employer Class | # Employees | % Employees |
| Private Company Employees | 5,703 | 69.8% |
| Self-Employed (Incorporated) | 135 | 1.7% |
| Self-Employed (Not Incorporated) | 317 | 3.9% |
| Not-for-profit Organizations | 210 | 2.6% |
| Local Government Employees | 867 | 10.6% |
| State Government Employees | 632 | 7.7% |
| Federal Government Employees | 308 | 3.8% |
| Unpaid Family Workers | 0 | 0.0% |
| Total | 8,172 | 100.0% |
Employment Status by Age in Luna County
According to the labor force statistics for Luna County, out of the total population over 16 years of age (19,336), 46.2% or 8,933 individuals are in the labor force, with 7.0% or 625 of them unemployed. The age group with the highest labor force participation rate is 25 to 29 years, with 77.2% or 1,194 individuals in the labor force. Within the labor force, the 55 to 59 years age range has the highest percentage of unemployed individuals, with 13.9% or 125 of them being unemployed.
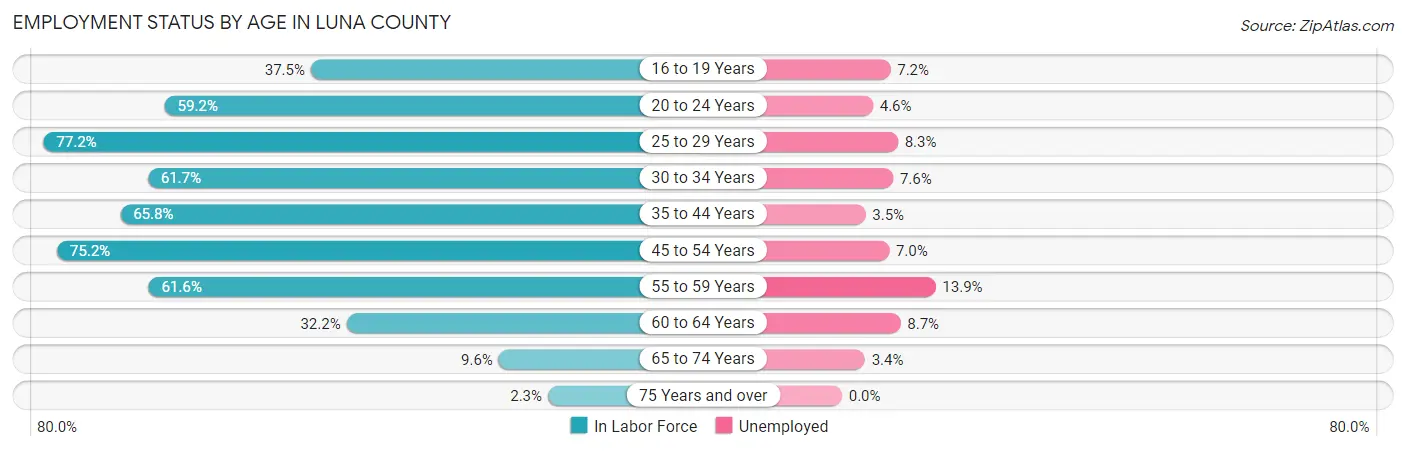
| Age Bracket | In Labor Force | Unemployed |
| 16 to 19 Years | 511 (37.5%) | 37 (7.2%) |
| 20 to 24 Years | 896 (59.2%) | 41 (4.6%) |
| 25 to 29 Years | 1,194 (77.2%) | 99 (8.3%) |
| 30 to 34 Years | 1,059 (61.7%) | 80 (7.6%) |
| 35 to 44 Years | 1,750 (65.8%) | 61 (3.5%) |
| 45 to 54 Years | 1,863 (75.2%) | 130 (7.0%) |
| 55 to 59 Years | 896 (61.6%) | 125 (13.9%) |
| 60 to 64 Years | 448 (32.2%) | 39 (8.7%) |
| 65 to 74 Years | 269 (9.6%) | 9 (3.4%) |
| 75 Years and over | 56 (2.3%) | 0 (0.0%) |
| Total | 8,933 (46.2%) | 625 (7.0%) |
Employment Status by Educational Attainment in Luna County
According to labor force statistics for Luna County, 64.1% of individuals (7,209) out of the total population between 25 and 64 years of age (11,246) are in the labor force, with 7.4% or 533 of them being unemployed. The group with the highest labor force participation rate are those with the educational attainment of bachelor's degree or higher, with 89.2% or 1,012 individuals in the labor force. Within the labor force, individuals with less than high school education have the highest percentage of unemployment, with 13.6% or 162 of them being unemployed.
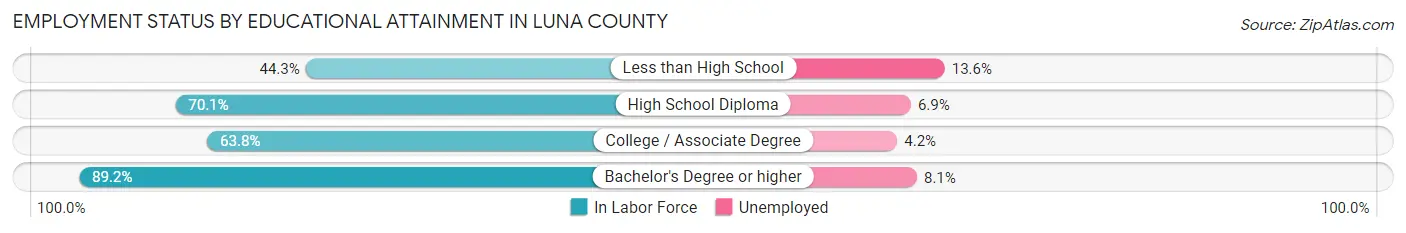
| Educational Attainment | In Labor Force | Unemployed |
| Less than High School | 1,189 (44.3%) | 365 (13.6%) |
| High School Diploma | 3,028 (70.1%) | 298 (6.9%) |
| College / Associate Degree | 1,983 (63.8%) | 131 (4.2%) |
| Bachelor's Degree or higher | 1,012 (89.2%) | 92 (8.1%) |
| Total | 7,209 (64.1%) | 832 (7.4%) |
Employment Occupations by Sex in Luna County
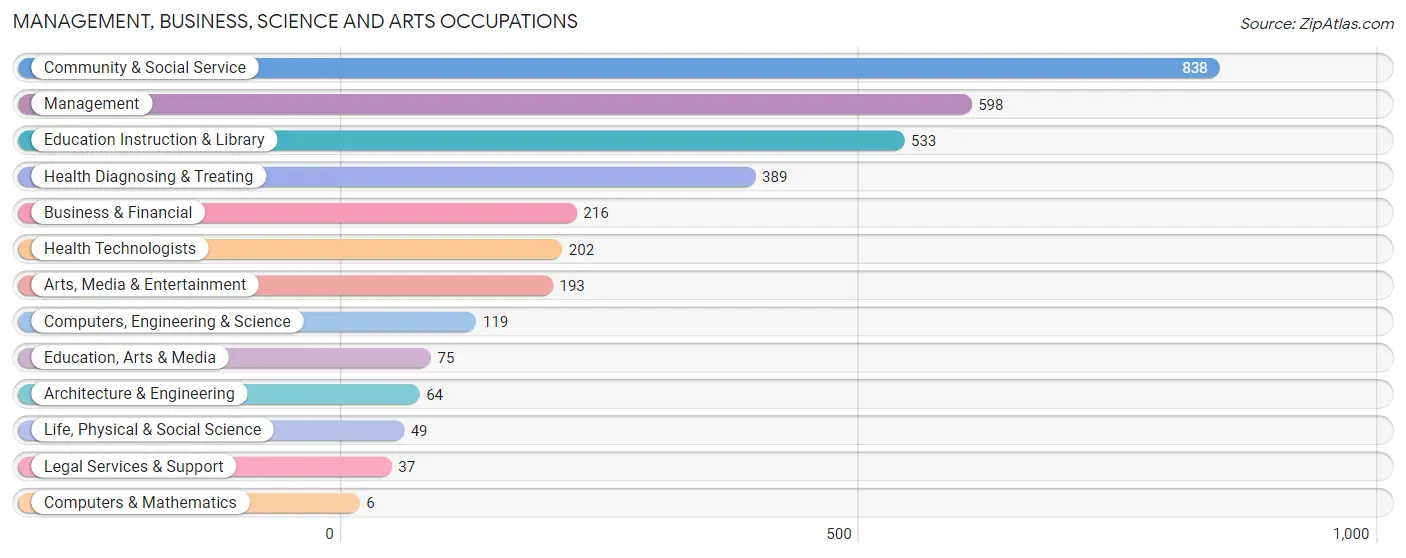
Management, Business, Science and Arts Occupations
The most common Management, Business, Science and Arts occupations in Luna County are Community & Social Service (838 | 10.1%), Management (598 | 7.2%), Education Instruction & Library (533 | 6.4%), Health Diagnosing & Treating (389 | 4.7%), and Business & Financial (216 | 2.6%).
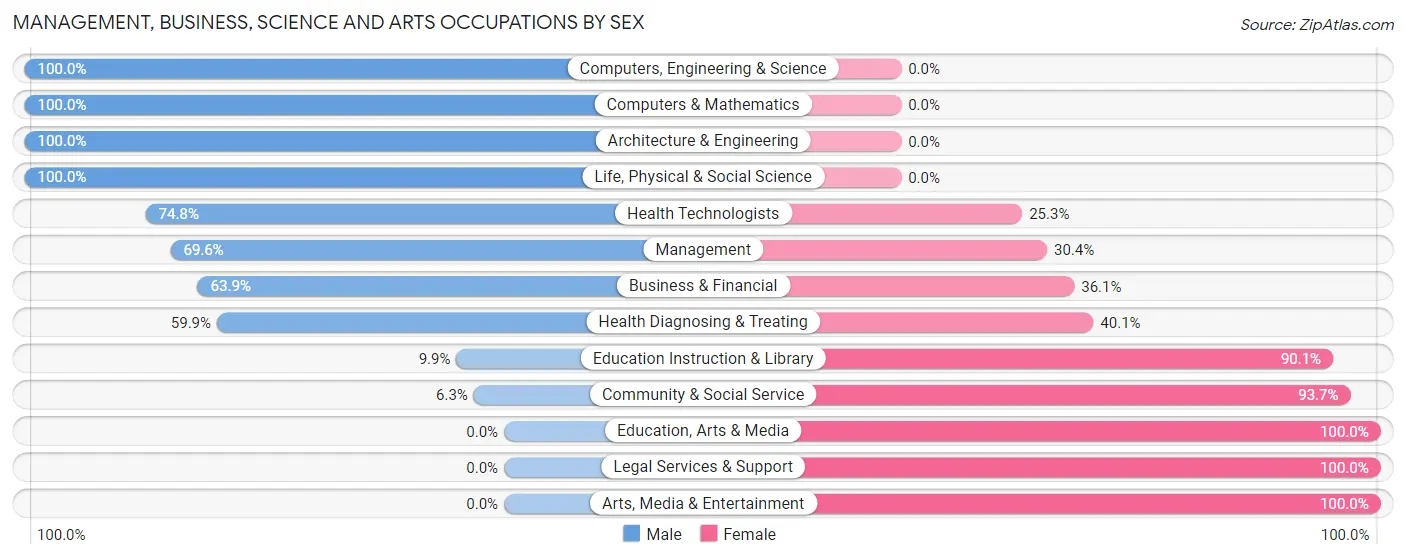
Management, Business, Science and Arts Occupations by Sex
Within the Management, Business, Science and Arts occupations in Luna County, the most male-oriented occupations are Computers, Engineering & Science (100.0%), Computers & Mathematics (100.0%), and Architecture & Engineering (100.0%), while the most female-oriented occupations are Education, Arts & Media (100.0%), Legal Services & Support (100.0%), and Arts, Media & Entertainment (100.0%).
| Occupation | Male | Female |
| Management | 416 (69.6%) | 182 (30.4%) |
| Business & Financial | 138 (63.9%) | 78 (36.1%) |
| Computers, Engineering & Science | 119 (100.0%) | 0 (0.0%) |
| Computers & Mathematics | 6 (100.0%) | 0 (0.0%) |
| Architecture & Engineering | 64 (100.0%) | 0 (0.0%) |
| Life, Physical & Social Science | 49 (100.0%) | 0 (0.0%) |
| Community & Social Service | 53 (6.3%) | 785 (93.7%) |
| Education, Arts & Media | 0 (0.0%) | 75 (100.0%) |
| Legal Services & Support | 0 (0.0%) | 37 (100.0%) |
| Education Instruction & Library | 53 (9.9%) | 480 (90.1%) |
| Arts, Media & Entertainment | 0 (0.0%) | 193 (100.0%) |
| Health Diagnosing & Treating | 233 (59.9%) | 156 (40.1%) |
| Health Technologists | 151 (74.8%) | 51 (25.3%) |
| Total (Category) | 959 (44.4%) | 1,201 (55.6%) |
| Total (Overall) | 4,652 (56.1%) | 3,644 (43.9%) |
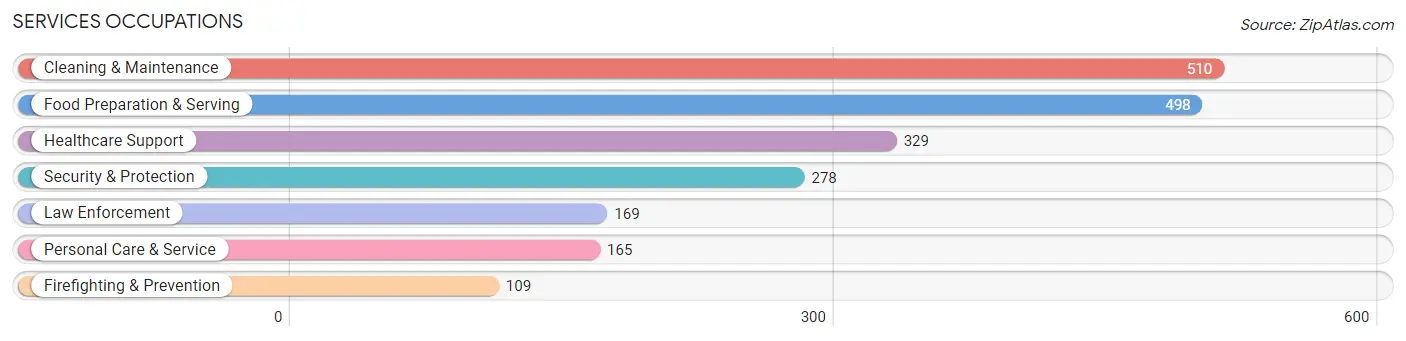
Services Occupations
The most common Services occupations in Luna County are Cleaning & Maintenance (510 | 6.1%), Food Preparation & Serving (498 | 6.0%), Healthcare Support (329 | 4.0%), Security & Protection (278 | 3.4%), and Law Enforcement (169 | 2.0%).
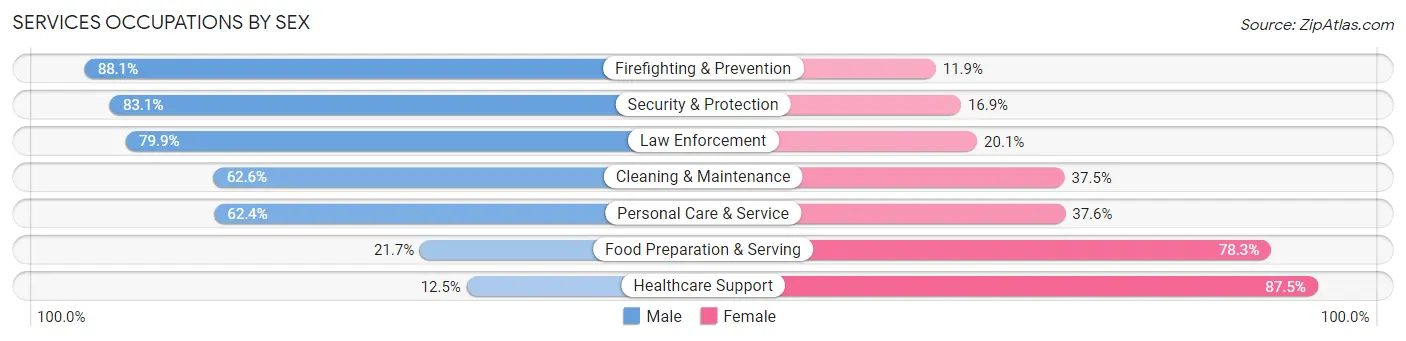
Services Occupations by Sex
Within the Services occupations in Luna County, the most male-oriented occupations are Firefighting & Prevention (88.1%), Security & Protection (83.1%), and Law Enforcement (79.9%), while the most female-oriented occupations are Healthcare Support (87.5%), Food Preparation & Serving (78.3%), and Personal Care & Service (37.6%).
| Occupation | Male | Female |
| Healthcare Support | 41 (12.5%) | 288 (87.5%) |
| Security & Protection | 231 (83.1%) | 47 (16.9%) |
| Firefighting & Prevention | 96 (88.1%) | 13 (11.9%) |
| Law Enforcement | 135 (79.9%) | 34 (20.1%) |
| Food Preparation & Serving | 108 (21.7%) | 390 (78.3%) |
| Cleaning & Maintenance | 319 (62.5%) | 191 (37.4%) |
| Personal Care & Service | 103 (62.4%) | 62 (37.6%) |
| Total (Category) | 802 (45.1%) | 978 (54.9%) |
| Total (Overall) | 4,652 (56.1%) | 3,644 (43.9%) |
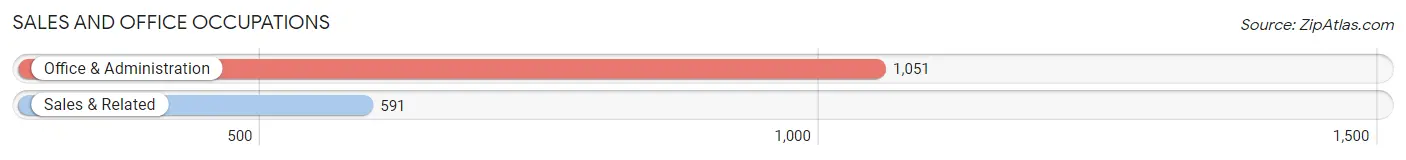
Sales and Office Occupations
The most common Sales and Office occupations in Luna County are Office & Administration (1,051 | 12.7%), and Sales & Related (591 | 7.1%).
Sales and Office Occupations by Sex
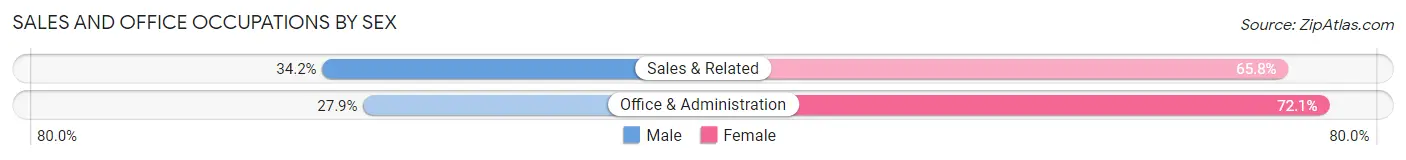
| Occupation | Male | Female |
| Sales & Related | 202 (34.2%) | 389 (65.8%) |
| Office & Administration | 293 (27.9%) | 758 (72.1%) |
| Total (Category) | 495 (30.1%) | 1,147 (69.9%) |
| Total (Overall) | 4,652 (56.1%) | 3,644 (43.9%) |
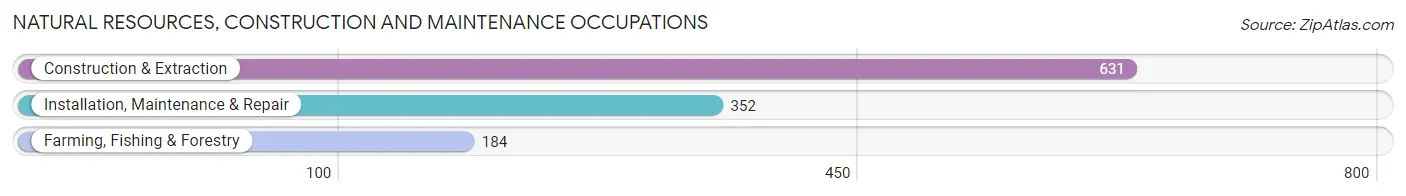
Natural Resources, Construction and Maintenance Occupations
The most common Natural Resources, Construction and Maintenance occupations in Luna County are Construction & Extraction (631 | 7.6%), Installation, Maintenance & Repair (352 | 4.2%), and Farming, Fishing & Forestry (184 | 2.2%).
Natural Resources, Construction and Maintenance Occupations by Sex
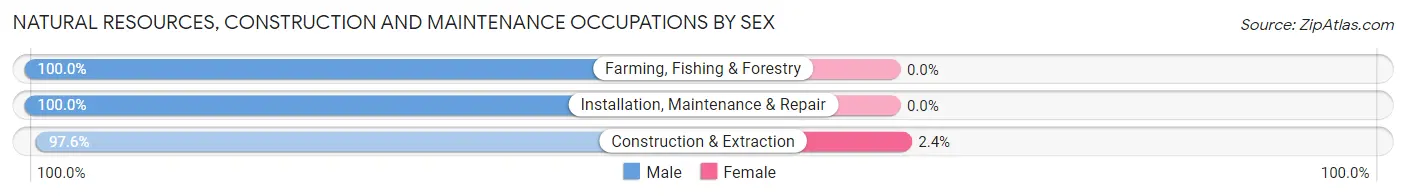
| Occupation | Male | Female |
| Farming, Fishing & Forestry | 184 (100.0%) | 0 (0.0%) |
| Construction & Extraction | 616 (97.6%) | 15 (2.4%) |
| Installation, Maintenance & Repair | 352 (100.0%) | 0 (0.0%) |
| Total (Category) | 1,152 (98.7%) | 15 (1.3%) |
| Total (Overall) | 4,652 (56.1%) | 3,644 (43.9%) |
Production, Transportation and Moving Occupations
The most common Production, Transportation and Moving occupations in Luna County are Material Moving (805 | 9.7%), Production (393 | 4.7%), and Transportation (349 | 4.2%).
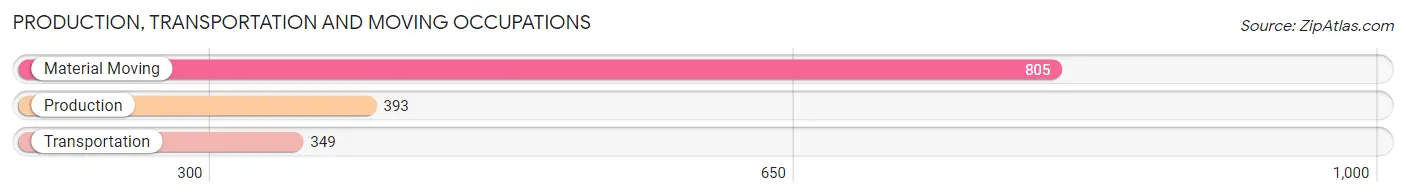
Production, Transportation and Moving Occupations by Sex
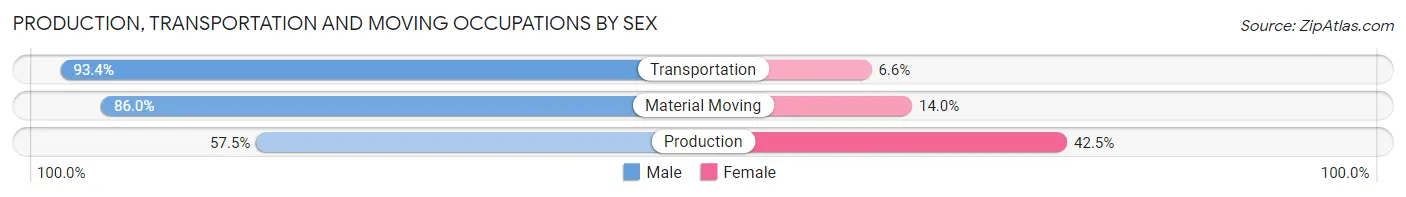
| Occupation | Male | Female |
| Production | 226 (57.5%) | 167 (42.5%) |
| Transportation | 326 (93.4%) | 23 (6.6%) |
| Material Moving | 692 (86.0%) | 113 (14.0%) |
| Total (Category) | 1,244 (80.4%) | 303 (19.6%) |
| Total (Overall) | 4,652 (56.1%) | 3,644 (43.9%) |
Employment Industries by Sex in Luna County
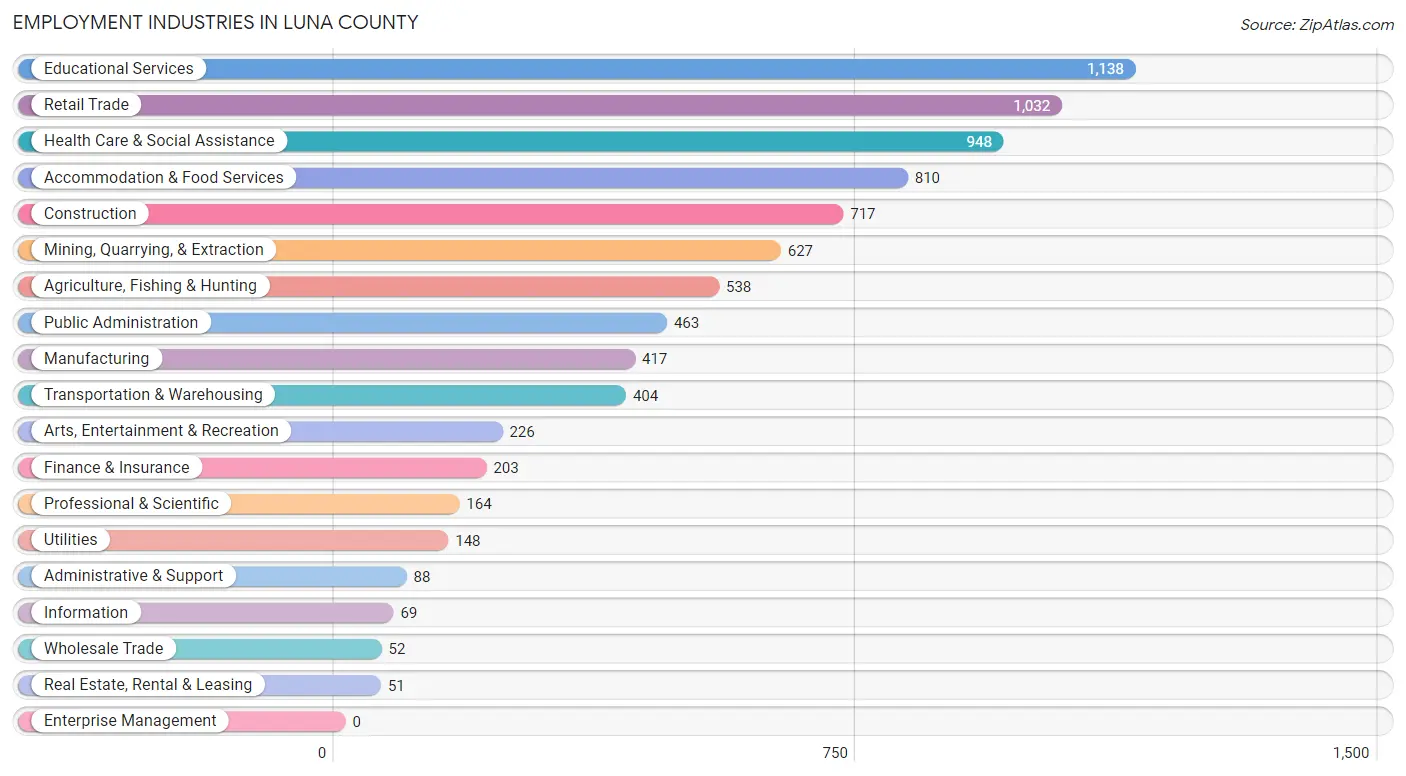
Employment Industries in Luna County
The major employment industries in Luna County include Educational Services (1,138 | 13.7%), Retail Trade (1,032 | 12.4%), Health Care & Social Assistance (948 | 11.4%), Accommodation & Food Services (810 | 9.8%), and Construction (717 | 8.6%).
Employment Industries by Sex in Luna County
The Luna County industries that see more men than women are Mining, Quarrying, & Extraction (100.0%), Transportation & Warehousing (91.8%), and Construction (88.0%), whereas the industries that tend to have a higher number of women are Wholesale Trade (86.5%), Finance & Insurance (83.7%), and Health Care & Social Assistance (73.7%).
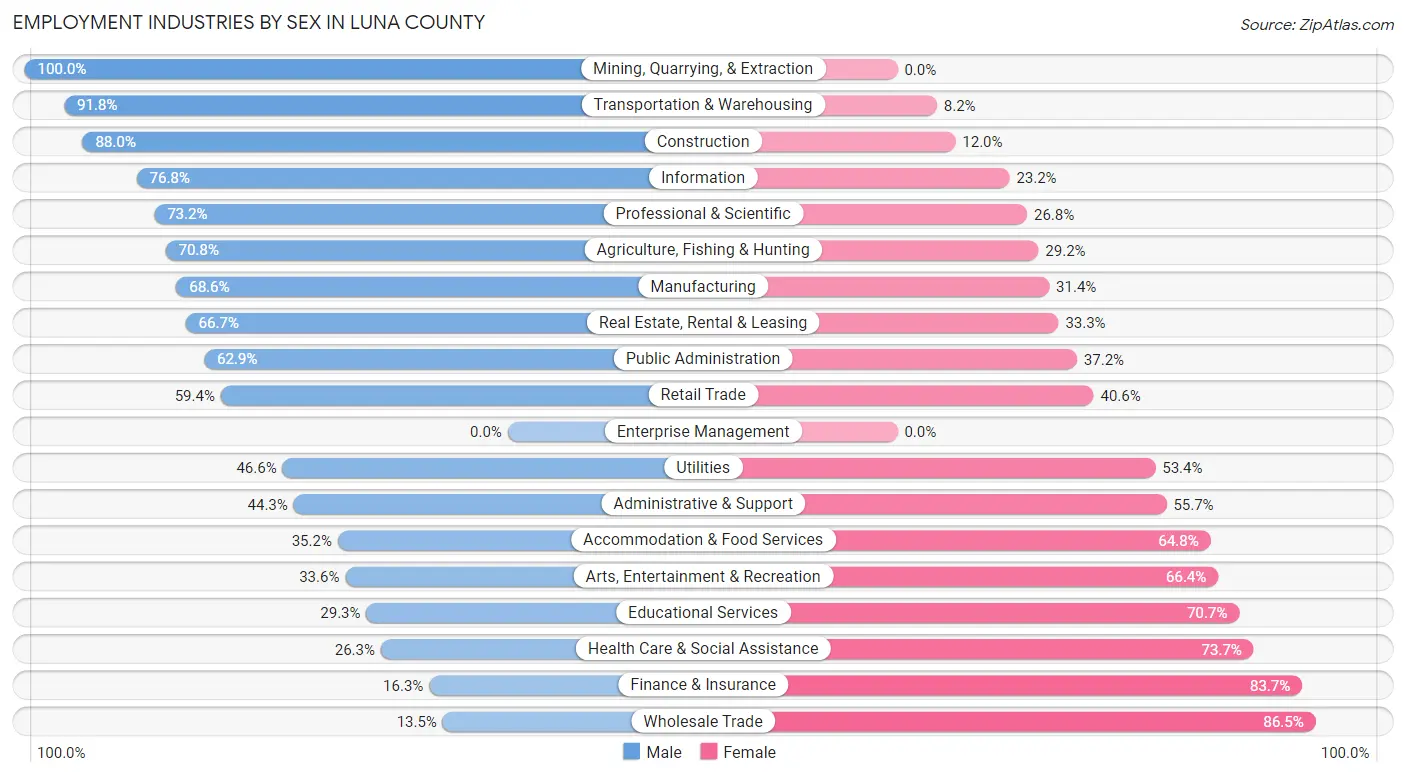
| Industry | Male | Female |
| Agriculture, Fishing & Hunting | 381 (70.8%) | 157 (29.2%) |
| Mining, Quarrying, & Extraction | 627 (100.0%) | 0 (0.0%) |
| Construction | 631 (88.0%) | 86 (12.0%) |
| Manufacturing | 286 (68.6%) | 131 (31.4%) |
| Wholesale Trade | 7 (13.5%) | 45 (86.5%) |
| Retail Trade | 613 (59.4%) | 419 (40.6%) |
| Transportation & Warehousing | 371 (91.8%) | 33 (8.2%) |
| Utilities | 69 (46.6%) | 79 (53.4%) |
| Information | 53 (76.8%) | 16 (23.2%) |
| Finance & Insurance | 33 (16.3%) | 170 (83.7%) |
| Real Estate, Rental & Leasing | 34 (66.7%) | 17 (33.3%) |
| Professional & Scientific | 120 (73.2%) | 44 (26.8%) |
| Enterprise Management | 0 (0.0%) | 0 (0.0%) |
| Administrative & Support | 39 (44.3%) | 49 (55.7%) |
| Educational Services | 333 (29.3%) | 805 (70.7%) |
| Health Care & Social Assistance | 249 (26.3%) | 699 (73.7%) |
| Arts, Entertainment & Recreation | 76 (33.6%) | 150 (66.4%) |
| Accommodation & Food Services | 285 (35.2%) | 525 (64.8%) |
| Public Administration | 291 (62.8%) | 172 (37.1%) |
| Total | 4,652 (56.1%) | 3,644 (43.9%) |
Education in Luna County
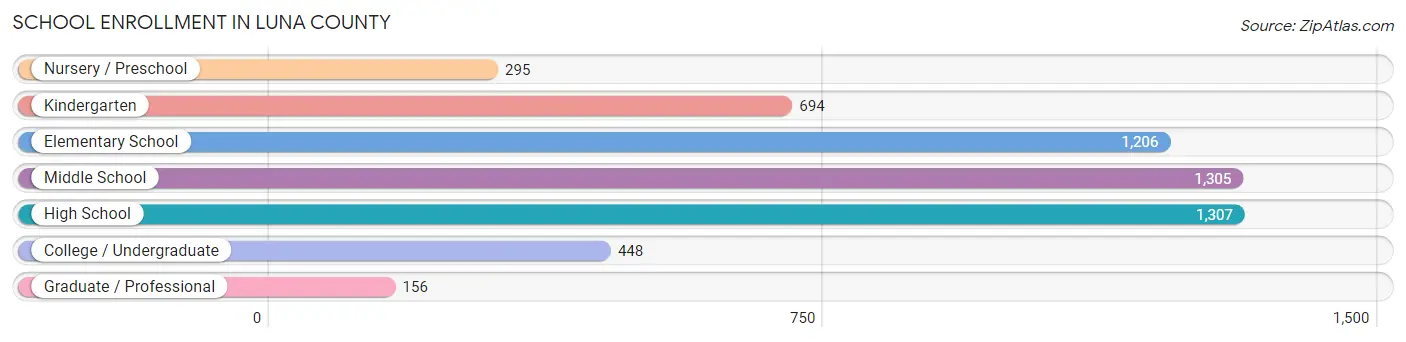
School Enrollment in Luna County
The most common levels of schooling among the 5,411 students in Luna County are high school (1,307 | 24.1%), middle school (1,305 | 24.1%), and elementary school (1,206 | 22.3%).
| School Level | # Students | % Students |
| Nursery / Preschool | 295 | 5.4% |
| Kindergarten | 694 | 12.8% |
| Elementary School | 1,206 | 22.3% |
| Middle School | 1,305 | 24.1% |
| High School | 1,307 | 24.1% |
| College / Undergraduate | 448 | 8.3% |
| Graduate / Professional | 156 | 2.9% |
| Total | 5,411 | 100.0% |
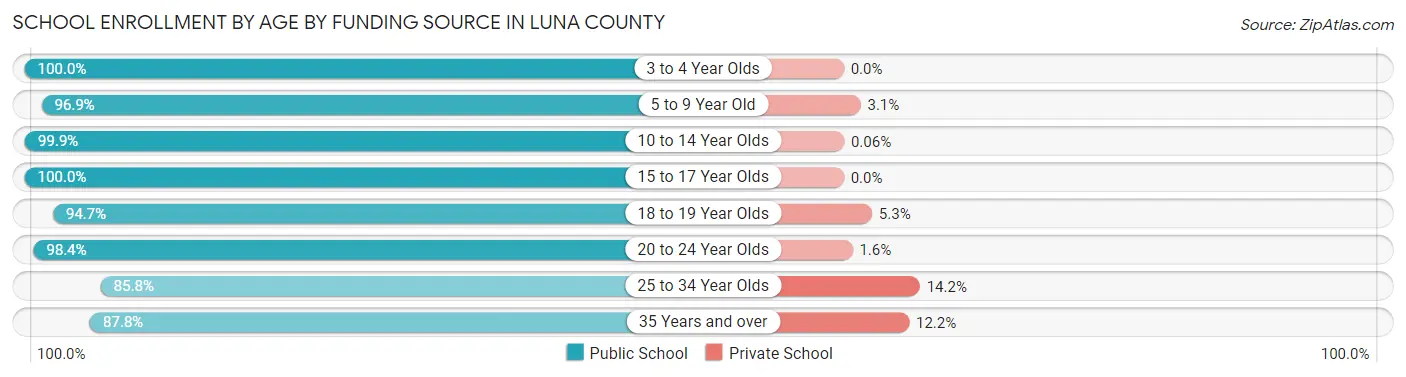
School Enrollment by Age by Funding Source in Luna County
Out of a total of 5,411 students who are enrolled in schools in Luna County, 119 (2.2%) attend a private institution, while the remaining 5,292 (97.8%) are enrolled in public schools. The age group of 25 to 34 year olds has the highest likelihood of being enrolled in private schools, with 36 (14.2% in the age bracket) enrolled. Conversely, the age group of 3 to 4 year olds has the lowest likelihood of being enrolled in a private school, with 288 (100.0% in the age bracket) attending a public institution.
| Age Bracket | Public School | Private School |
| 3 to 4 Year Olds | 288 (100.0%) | 0 (0.0%) |
| 5 to 9 Year Old | 1,788 (96.9%) | 58 (3.1%) |
| 10 to 14 Year Olds | 1,576 (99.9%) | 1 (0.1%) |
| 15 to 17 Year Olds | 1,057 (100.0%) | 0 (0.0%) |
| 18 to 19 Year Olds | 144 (94.7%) | 8 (5.3%) |
| 20 to 24 Year Olds | 120 (98.4%) | 2 (1.6%) |
| 25 to 34 Year Olds | 218 (85.8%) | 36 (14.2%) |
| 35 Years and over | 101 (87.8%) | 14 (12.2%) |
| Total | 5,292 (97.8%) | 119 (2.2%) |
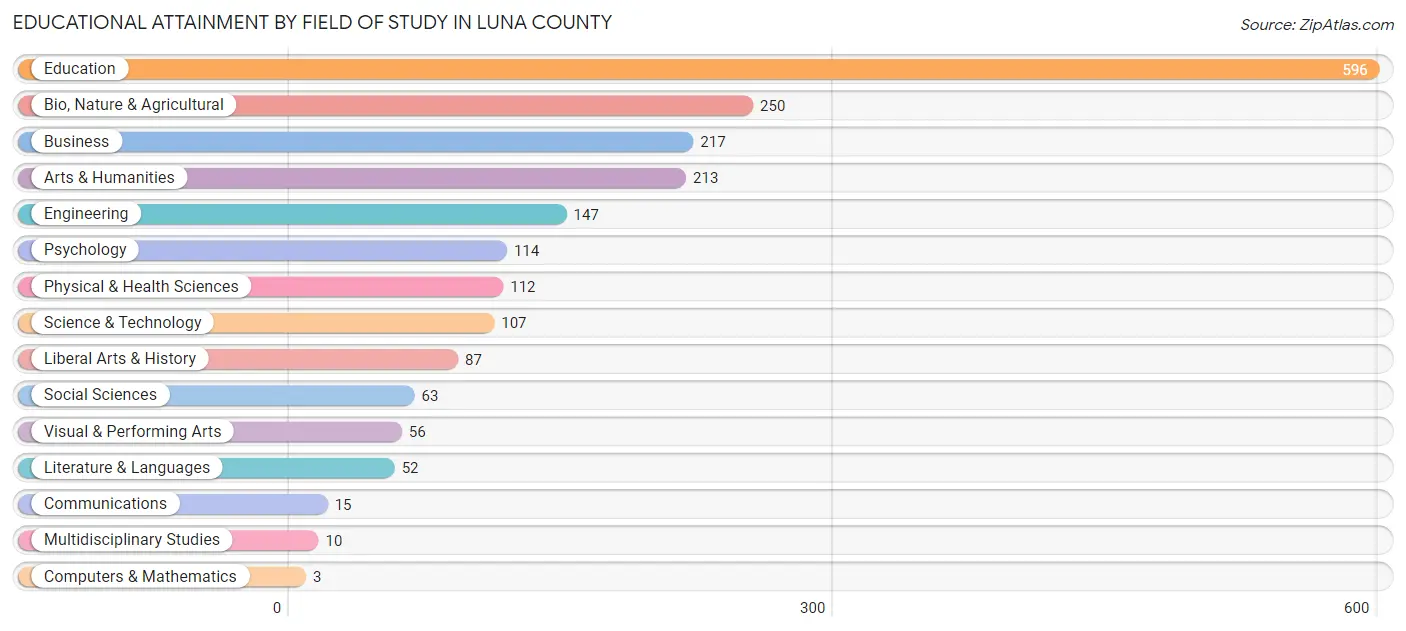
Educational Attainment by Field of Study in Luna County
Education (596 | 29.2%), bio, nature & agricultural (250 | 12.2%), business (217 | 10.6%), arts & humanities (213 | 10.4%), and engineering (147 | 7.2%) are the most common fields of study among 2,042 individuals in Luna County who have obtained a bachelor's degree or higher.
| Field of Study | # Graduates | % Graduates |
| Computers & Mathematics | 3 | 0.2% |
| Bio, Nature & Agricultural | 250 | 12.2% |
| Physical & Health Sciences | 112 | 5.5% |
| Psychology | 114 | 5.6% |
| Social Sciences | 63 | 3.1% |
| Engineering | 147 | 7.2% |
| Multidisciplinary Studies | 10 | 0.5% |
| Science & Technology | 107 | 5.2% |
| Business | 217 | 10.6% |
| Education | 596 | 29.2% |
| Literature & Languages | 52 | 2.5% |
| Liberal Arts & History | 87 | 4.3% |
| Visual & Performing Arts | 56 | 2.7% |
| Communications | 15 | 0.7% |
| Arts & Humanities | 213 | 10.4% |
| Total | 2,042 | 100.0% |
Transportation & Commute in Luna County
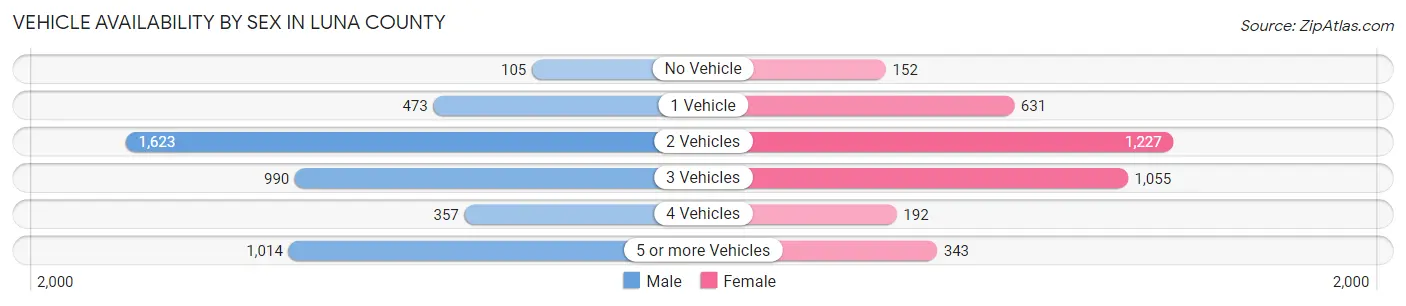
Vehicle Availability by Sex in Luna County
The most prevalent vehicle ownership categories in Luna County are males with 2 vehicles (1,623, accounting for 35.6%) and females with 2 vehicles (1,227, making up 45.1%).
| Vehicles Available | Male | Female |
| No Vehicle | 105 (2.3%) | 152 (4.2%) |
| 1 Vehicle | 473 (10.4%) | 631 (17.5%) |
| 2 Vehicles | 1,623 (35.6%) | 1,227 (34.1%) |
| 3 Vehicles | 990 (21.7%) | 1,055 (29.3%) |
| 4 Vehicles | 357 (7.8%) | 192 (5.3%) |
| 5 or more Vehicles | 1,014 (22.2%) | 343 (9.5%) |
| Total | 4,562 (100.0%) | 3,600 (100.0%) |
Commute Time in Luna County
The most frequently occuring commute durations in Luna County are 5 to 9 minutes (1,871 commuters, 24.5%), 10 to 14 minutes (1,860 commuters, 24.4%), and 15 to 19 minutes (951 commuters, 12.4%).
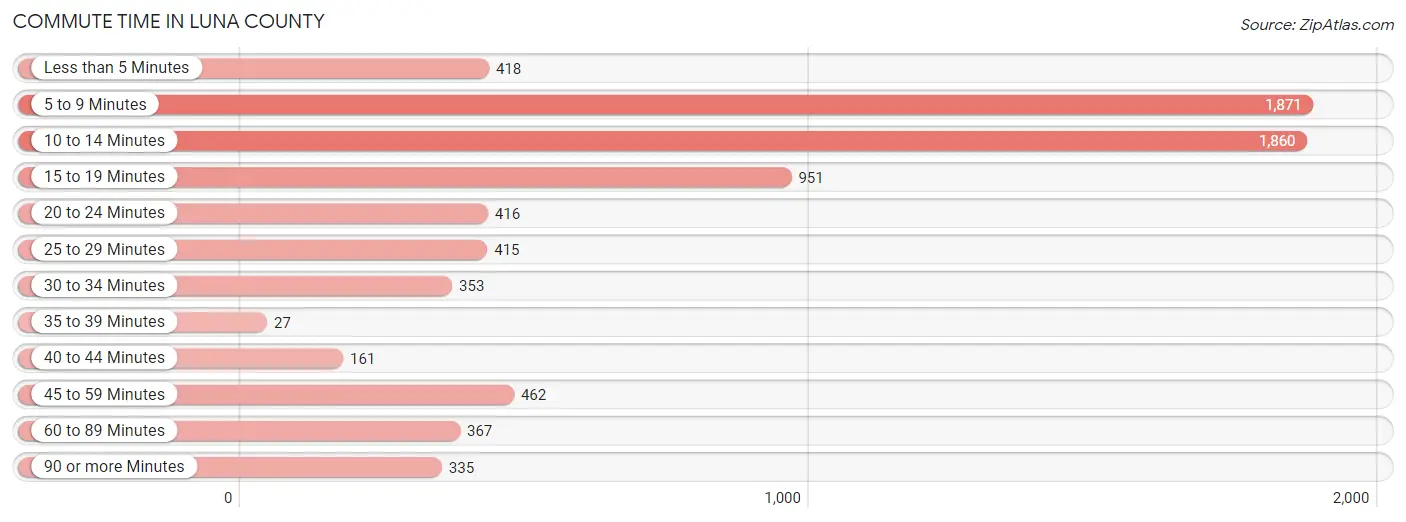
| Commute Time | # Commuters | % Commuters |
| Less than 5 Minutes | 418 | 5.5% |
| 5 to 9 Minutes | 1,871 | 24.5% |
| 10 to 14 Minutes | 1,860 | 24.4% |
| 15 to 19 Minutes | 951 | 12.4% |
| 20 to 24 Minutes | 416 | 5.4% |
| 25 to 29 Minutes | 415 | 5.4% |
| 30 to 34 Minutes | 353 | 4.6% |
| 35 to 39 Minutes | 27 | 0.4% |
| 40 to 44 Minutes | 161 | 2.1% |
| 45 to 59 Minutes | 462 | 6.0% |
| 60 to 89 Minutes | 367 | 4.8% |
| 90 or more Minutes | 335 | 4.4% |
Commute Time by Sex in Luna County
The most common commute times in Luna County are 10 to 14 minutes (949 commuters, 21.4%) for males and 5 to 9 minutes (1,281 commuters, 40.0%) for females.
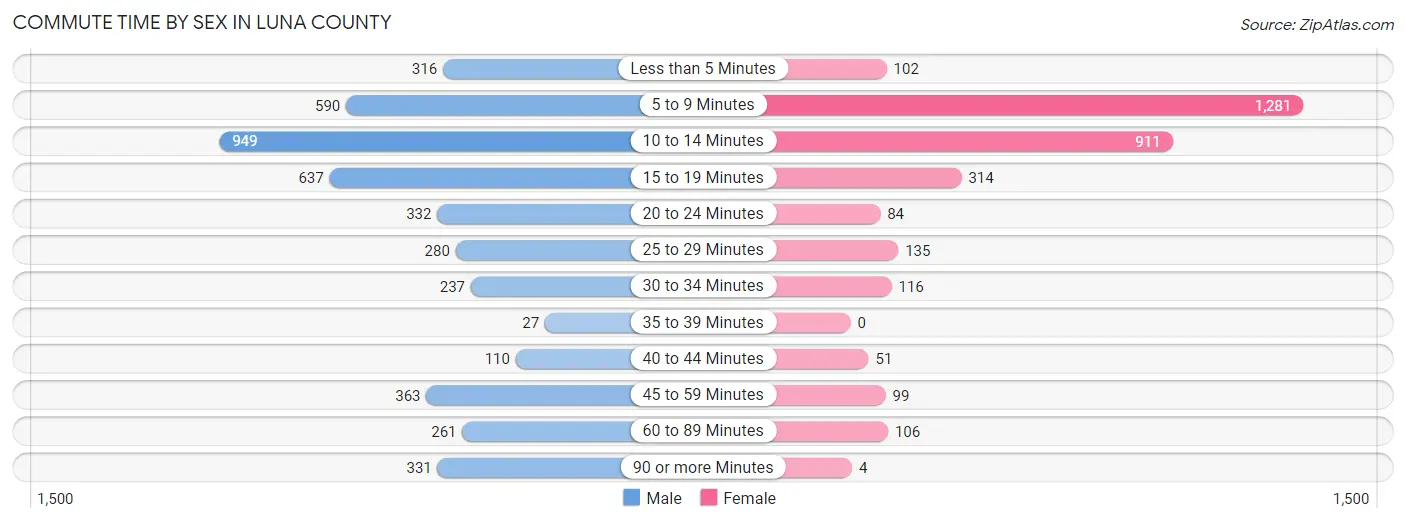
| Commute Time | Male | Female |
| Less than 5 Minutes | 316 (7.1%) | 102 (3.2%) |
| 5 to 9 Minutes | 590 (13.3%) | 1,281 (40.0%) |
| 10 to 14 Minutes | 949 (21.4%) | 911 (28.4%) |
| 15 to 19 Minutes | 637 (14.4%) | 314 (9.8%) |
| 20 to 24 Minutes | 332 (7.5%) | 84 (2.6%) |
| 25 to 29 Minutes | 280 (6.3%) | 135 (4.2%) |
| 30 to 34 Minutes | 237 (5.3%) | 116 (3.6%) |
| 35 to 39 Minutes | 27 (0.6%) | 0 (0.0%) |
| 40 to 44 Minutes | 110 (2.5%) | 51 (1.6%) |
| 45 to 59 Minutes | 363 (8.2%) | 99 (3.1%) |
| 60 to 89 Minutes | 261 (5.9%) | 106 (3.3%) |
| 90 or more Minutes | 331 (7.5%) | 4 (0.1%) |
Time of Departure to Work by Sex in Luna County
The most frequent times of departure to work in Luna County are 6:30 AM to 6:59 AM (594, 13.4%) for males and 7:30 AM to 7:59 AM (1,107, 34.6%) for females.
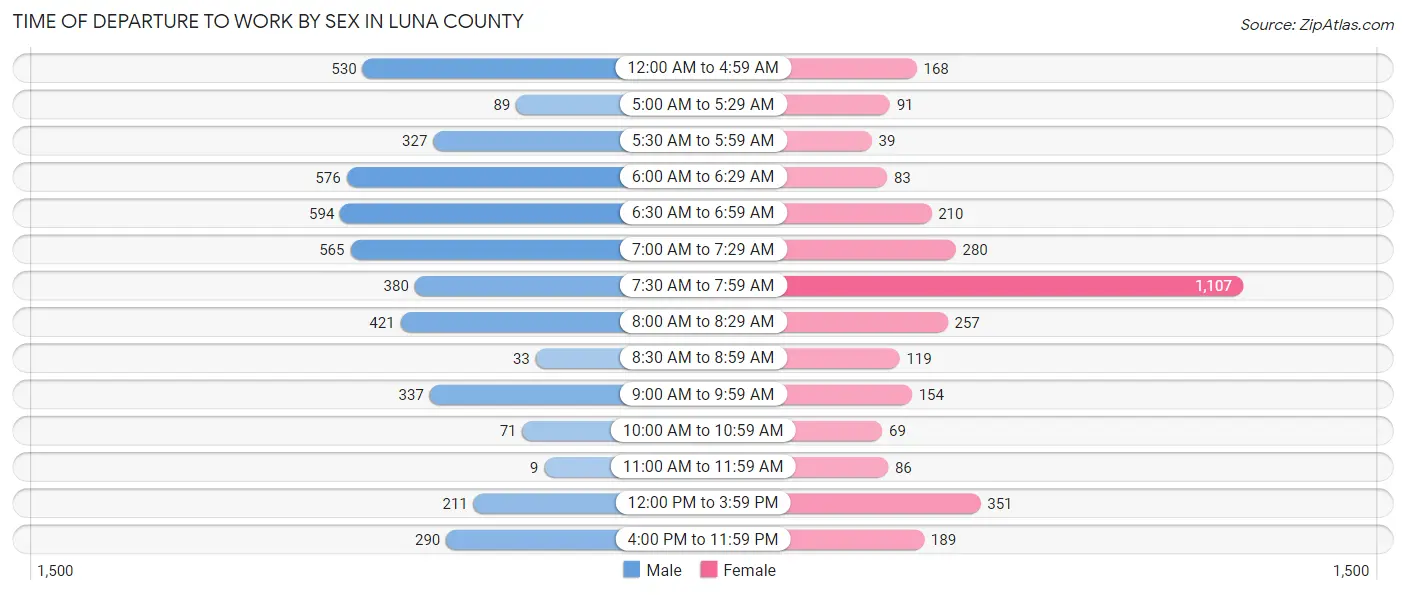
| Time of Departure | Male | Female |
| 12:00 AM to 4:59 AM | 530 (12.0%) | 168 (5.2%) |
| 5:00 AM to 5:29 AM | 89 (2.0%) | 91 (2.8%) |
| 5:30 AM to 5:59 AM | 327 (7.4%) | 39 (1.2%) |
| 6:00 AM to 6:29 AM | 576 (13.0%) | 83 (2.6%) |
| 6:30 AM to 6:59 AM | 594 (13.4%) | 210 (6.6%) |
| 7:00 AM to 7:29 AM | 565 (12.8%) | 280 (8.7%) |
| 7:30 AM to 7:59 AM | 380 (8.6%) | 1,107 (34.6%) |
| 8:00 AM to 8:29 AM | 421 (9.5%) | 257 (8.0%) |
| 8:30 AM to 8:59 AM | 33 (0.7%) | 119 (3.7%) |
| 9:00 AM to 9:59 AM | 337 (7.6%) | 154 (4.8%) |
| 10:00 AM to 10:59 AM | 71 (1.6%) | 69 (2.1%) |
| 11:00 AM to 11:59 AM | 9 (0.2%) | 86 (2.7%) |
| 12:00 PM to 3:59 PM | 211 (4.8%) | 351 (11.0%) |
| 4:00 PM to 11:59 PM | 290 (6.5%) | 189 (5.9%) |
| Total | 4,433 (100.0%) | 3,203 (100.0%) |
Housing Occupancy in Luna County
Occupancy by Ownership in Luna County
Of the total 8,951 dwellings in Luna County, owner-occupied units account for 5,962 (66.6%), while renter-occupied units make up 2,989 (33.4%).
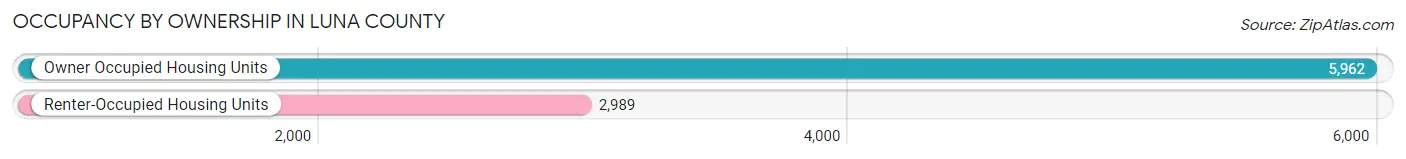
| Occupancy | # Housing Units | % Housing Units |
| Owner Occupied Housing Units | 5,962 | 66.6% |
| Renter-Occupied Housing Units | 2,989 | 33.4% |
| Total Occupied Housing Units | 8,951 | 100.0% |
Occupancy by Household Size in Luna County
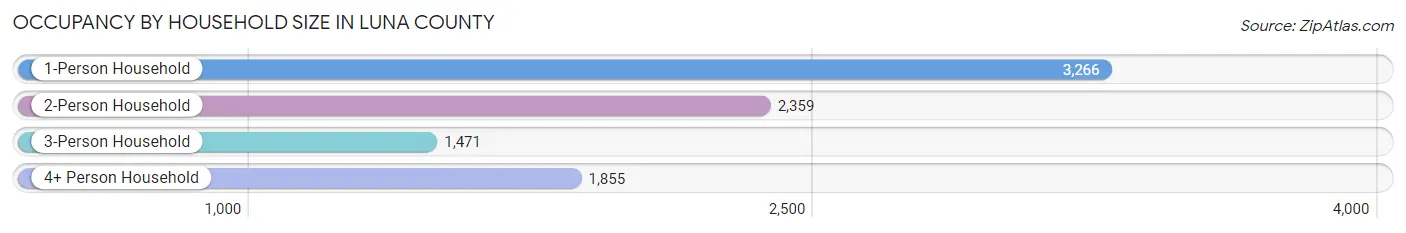
| Household Size | # Housing Units | % Housing Units |
| 1-Person Household | 3,266 | 36.5% |
| 2-Person Household | 2,359 | 26.4% |
| 3-Person Household | 1,471 | 16.4% |
| 4+ Person Household | 1,855 | 20.7% |
| Total Housing Units | 8,951 | 100.0% |
Occupancy by Ownership by Household Size in Luna County
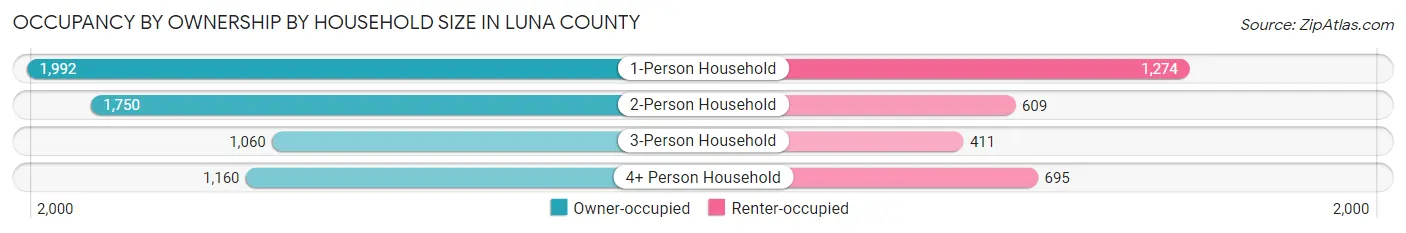
| Household Size | Owner-occupied | Renter-occupied |
| 1-Person Household | 1,992 (61.0%) | 1,274 (39.0%) |
| 2-Person Household | 1,750 (74.2%) | 609 (25.8%) |
| 3-Person Household | 1,060 (72.1%) | 411 (27.9%) |
| 4+ Person Household | 1,160 (62.5%) | 695 (37.5%) |
| Total Housing Units | 5,962 (66.6%) | 2,989 (33.4%) |
Occupancy by Educational Attainment in Luna County
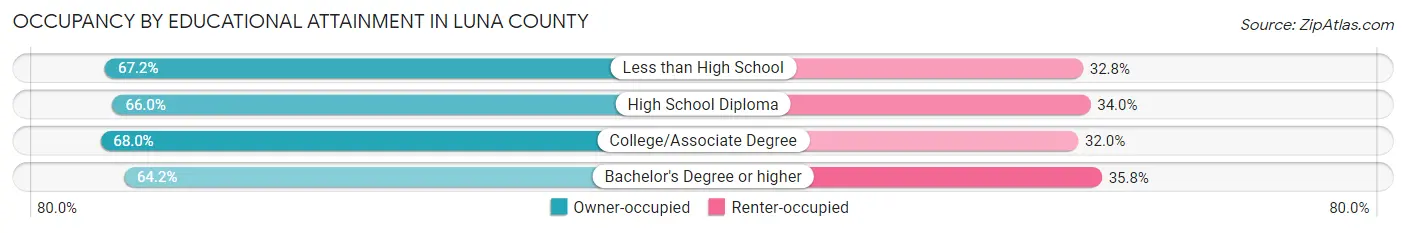
| Household Size | Owner-occupied | Renter-occupied |
| Less than High School | 1,559 (67.2%) | 760 (32.8%) |
| High School Diploma | 2,044 (66.0%) | 1,051 (34.0%) |
| College/Associate Degree | 1,587 (68.0%) | 748 (32.0%) |
| Bachelor's Degree or higher | 772 (64.2%) | 430 (35.8%) |
Occupancy by Age of Householder in Luna County
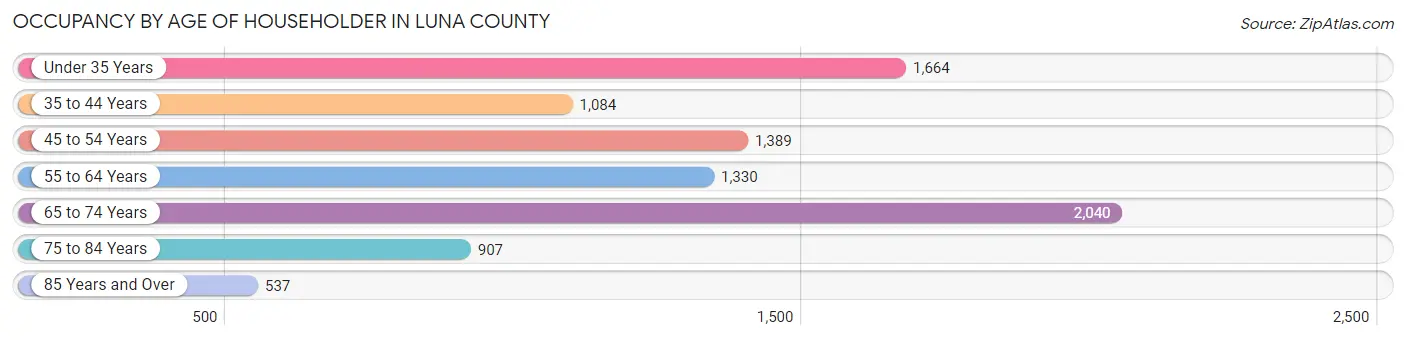
| Age Bracket | # Households | % Households |
| Under 35 Years | 1,664 | 18.6% |
| 35 to 44 Years | 1,084 | 12.1% |
| 45 to 54 Years | 1,389 | 15.5% |
| 55 to 64 Years | 1,330 | 14.9% |
| 65 to 74 Years | 2,040 | 22.8% |
| 75 to 84 Years | 907 | 10.1% |
| 85 Years and Over | 537 | 6.0% |
| Total | 8,951 | 100.0% |
Housing Finances in Luna County
Median Income by Occupancy in Luna County
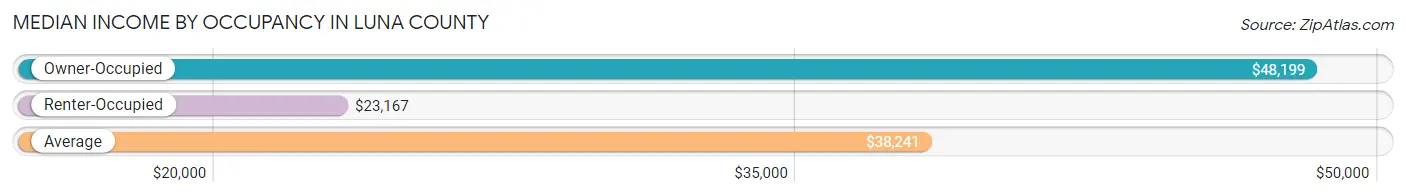
| Occupancy Type | # Households | Median Income |
| Owner-Occupied | 5,962 (66.6%) | $48,199 |
| Renter-Occupied | 2,989 (33.4%) | $23,167 |
| Average | 8,951 (100.0%) | $38,241 |
Occupancy by Householder Income Bracket in Luna County
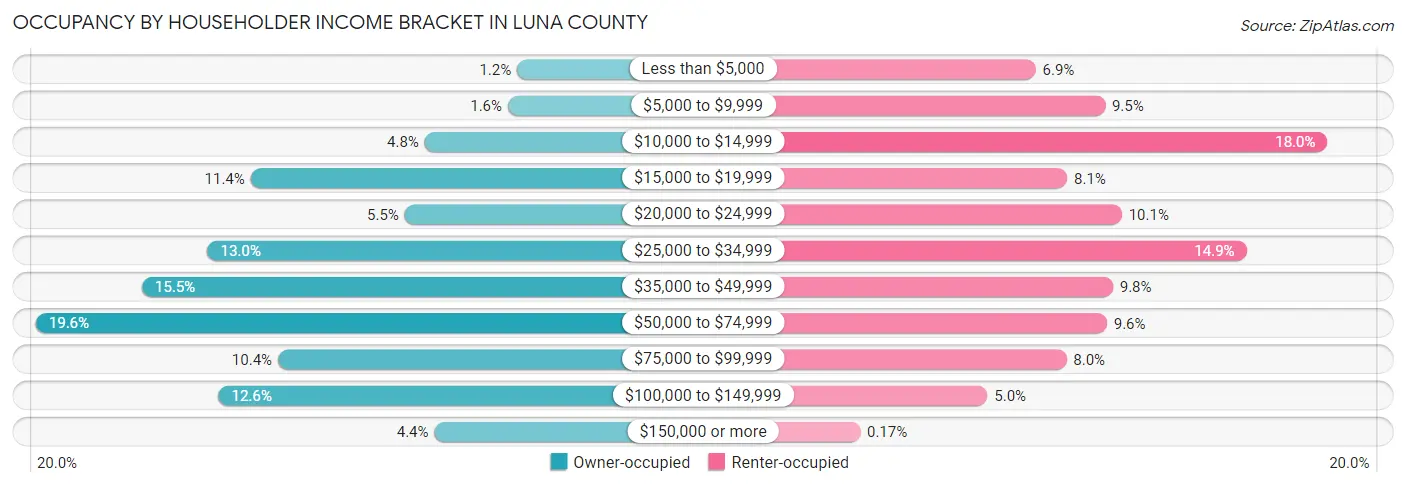
| Income Bracket | Owner-occupied | Renter-occupied |
| Less than $5,000 | 74 (1.2%) | 205 (6.9%) |
| $5,000 to $9,999 | 95 (1.6%) | 284 (9.5%) |
| $10,000 to $14,999 | 284 (4.8%) | 537 (18.0%) |
| $15,000 to $19,999 | 679 (11.4%) | 241 (8.1%) |
| $20,000 to $24,999 | 329 (5.5%) | 303 (10.1%) |
| $25,000 to $34,999 | 777 (13.0%) | 445 (14.9%) |
| $35,000 to $49,999 | 926 (15.5%) | 293 (9.8%) |
| $50,000 to $74,999 | 1,167 (19.6%) | 286 (9.6%) |
| $75,000 to $99,999 | 617 (10.3%) | 240 (8.0%) |
| $100,000 to $149,999 | 752 (12.6%) | 150 (5.0%) |
| $150,000 or more | 262 (4.4%) | 5 (0.2%) |
| Total | 5,962 (100.0%) | 2,989 (100.0%) |
Monthly Housing Cost Tiers in Luna County
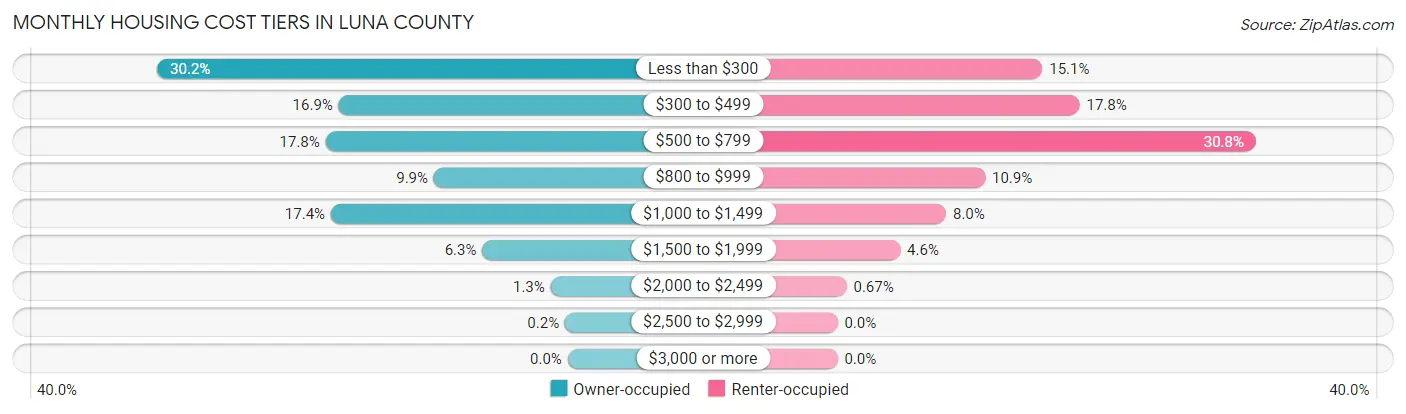
| Monthly Cost | Owner-occupied | Renter-occupied |
| Less than $300 | 1,803 (30.2%) | 451 (15.1%) |
| $300 to $499 | 1,006 (16.9%) | 533 (17.8%) |
| $500 to $799 | 1,063 (17.8%) | 921 (30.8%) |
| $800 to $999 | 588 (9.9%) | 325 (10.9%) |
| $1,000 to $1,499 | 1,040 (17.4%) | 239 (8.0%) |
| $1,500 to $1,999 | 375 (6.3%) | 138 (4.6%) |
| $2,000 to $2,499 | 75 (1.3%) | 20 (0.7%) |
| $2,500 to $2,999 | 12 (0.2%) | 0 (0.0%) |
| $3,000 or more | 0 (0.0%) | 0 (0.0%) |
| Total | 5,962 (100.0%) | 2,989 (100.0%) |
Physical Housing Characteristics in Luna County
Housing Structures in Luna County
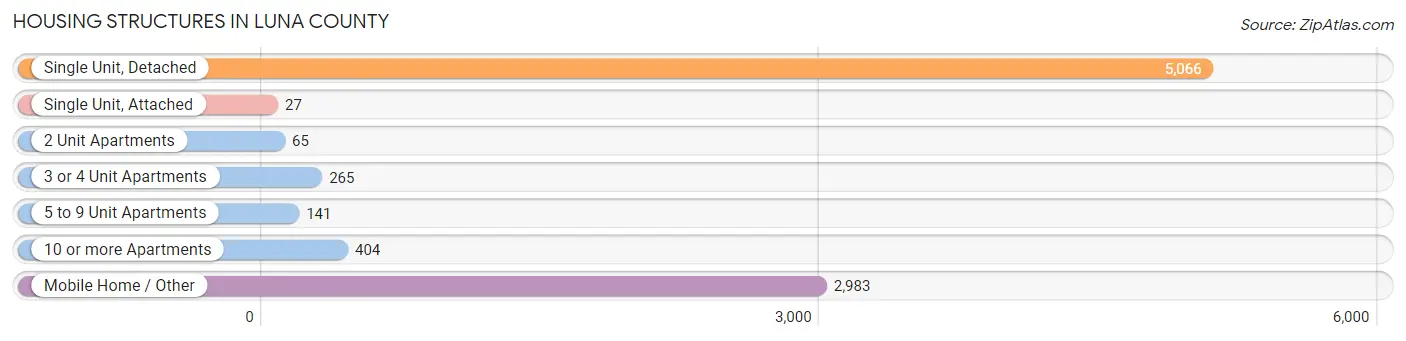
| Structure Type | # Housing Units | % Housing Units |
| Single Unit, Detached | 5,066 | 56.6% |
| Single Unit, Attached | 27 | 0.3% |
| 2 Unit Apartments | 65 | 0.7% |
| 3 or 4 Unit Apartments | 265 | 3.0% |
| 5 to 9 Unit Apartments | 141 | 1.6% |
| 10 or more Apartments | 404 | 4.5% |
| Mobile Home / Other | 2,983 | 33.3% |
| Total | 8,951 | 100.0% |
Housing Structures by Occupancy in Luna County
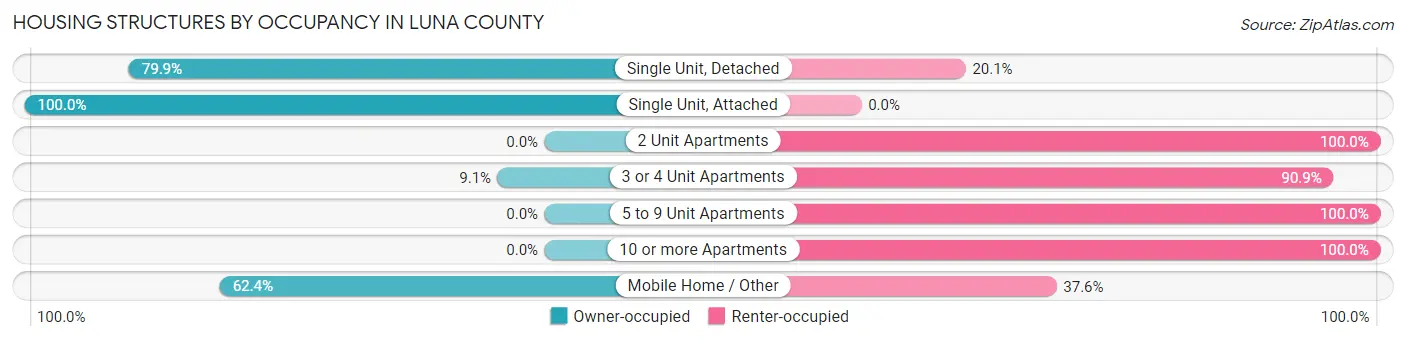
| Structure Type | Owner-occupied | Renter-occupied |
| Single Unit, Detached | 4,049 (79.9%) | 1,017 (20.1%) |
| Single Unit, Attached | 27 (100.0%) | 0 (0.0%) |
| 2 Unit Apartments | 0 (0.0%) | 65 (100.0%) |
| 3 or 4 Unit Apartments | 24 (9.1%) | 241 (90.9%) |
| 5 to 9 Unit Apartments | 0 (0.0%) | 141 (100.0%) |
| 10 or more Apartments | 0 (0.0%) | 404 (100.0%) |
| Mobile Home / Other | 1,862 (62.4%) | 1,121 (37.6%) |
| Total | 5,962 (66.6%) | 2,989 (33.4%) |
Housing Structures by Number of Rooms in Luna County
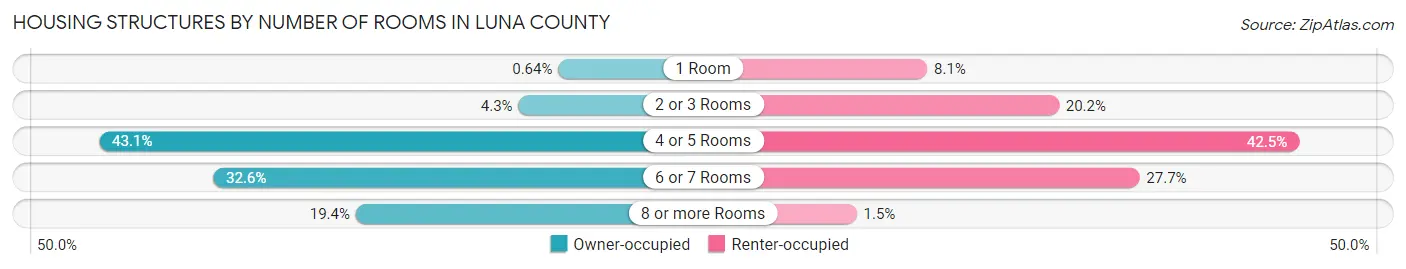
| Number of Rooms | Owner-occupied | Renter-occupied |
| 1 Room | 38 (0.6%) | 241 (8.1%) |
| 2 or 3 Rooms | 258 (4.3%) | 605 (20.2%) |
| 4 or 5 Rooms | 2,570 (43.1%) | 1,269 (42.5%) |
| 6 or 7 Rooms | 1,941 (32.6%) | 828 (27.7%) |
| 8 or more Rooms | 1,155 (19.4%) | 46 (1.5%) |
| Total | 5,962 (100.0%) | 2,989 (100.0%) |
Housing Structure by Heating Type in Luna County
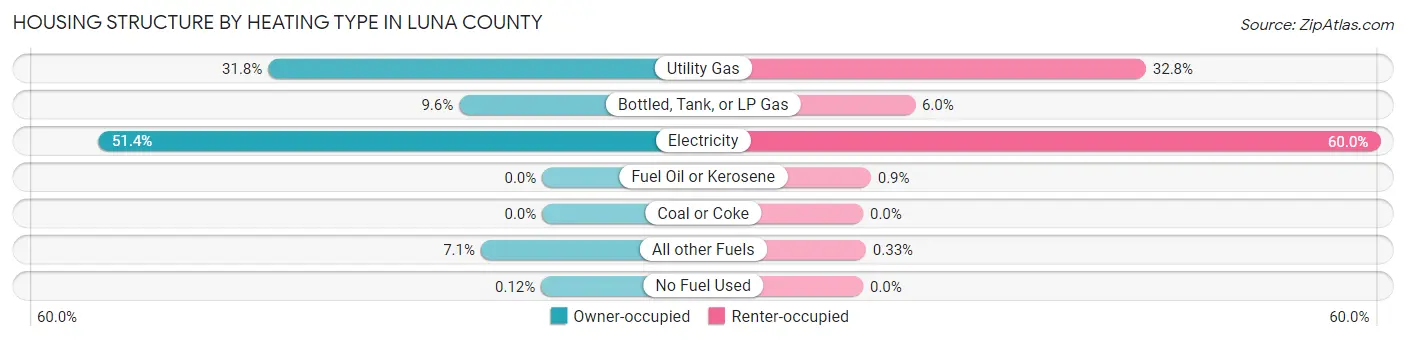
| Heating Type | Owner-occupied | Renter-occupied |
| Utility Gas | 1,894 (31.8%) | 980 (32.8%) |
| Bottled, Tank, or LP Gas | 574 (9.6%) | 180 (6.0%) |
| Electricity | 3,063 (51.4%) | 1,792 (60.0%) |
| Fuel Oil or Kerosene | 0 (0.0%) | 27 (0.9%) |
| Coal or Coke | 0 (0.0%) | 0 (0.0%) |
| All other Fuels | 424 (7.1%) | 10 (0.3%) |
| No Fuel Used | 7 (0.1%) | 0 (0.0%) |
| Total | 5,962 (100.0%) | 2,989 (100.0%) |
Household Vehicle Usage in Luna County
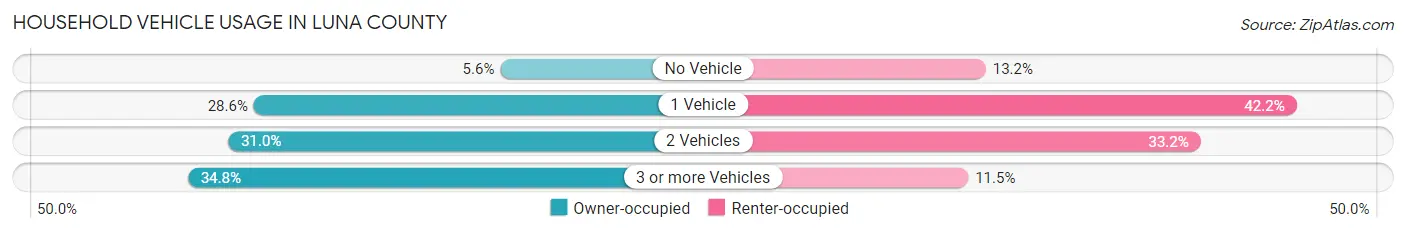
| Vehicles per Household | Owner-occupied | Renter-occupied |
| No Vehicle | 334 (5.6%) | 393 (13.2%) |
| 1 Vehicle | 1,706 (28.6%) | 1,260 (42.1%) |
| 2 Vehicles | 1,849 (31.0%) | 992 (33.2%) |
| 3 or more Vehicles | 2,073 (34.8%) | 344 (11.5%) |
| Total | 5,962 (100.0%) | 2,989 (100.0%) |
Real Estate & Mortgages in Luna County
Real Estate and Mortgage Overview in Luna County
| Characteristic | Without Mortgage | With Mortgage |
| Housing Units | 3,207 | 2,755 |
| Median Property Value | $90,900 | $126,000 |
| Median Household Income | $37,608 | $160 |
| Monthly Housing Costs | $270 | $0 |
| Real Estate Taxes | $517 | $160 |
Property Value by Mortgage Status in Luna County
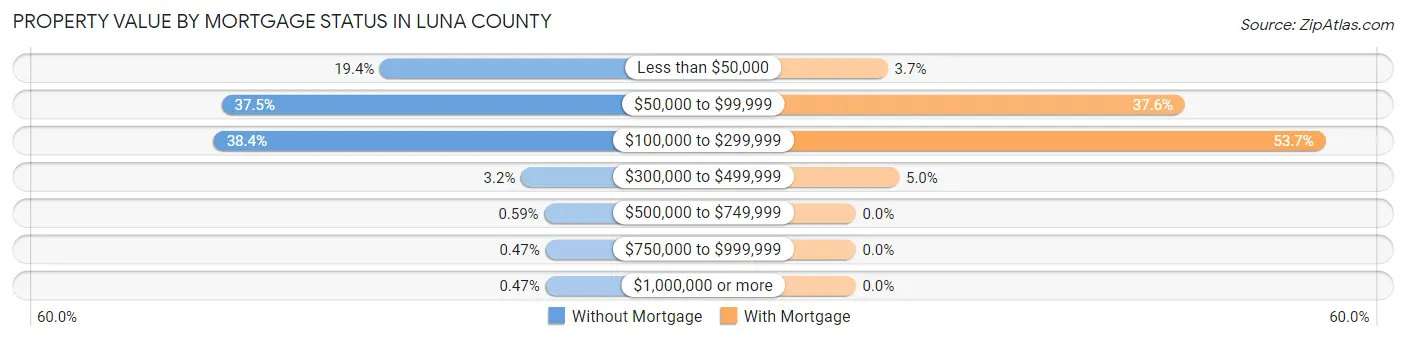
| Property Value | Without Mortgage | With Mortgage |
| Less than $50,000 | 621 (19.4%) | 101 (3.7%) |
| $50,000 to $99,999 | 1,202 (37.5%) | 1,037 (37.6%) |
| $100,000 to $299,999 | 1,231 (38.4%) | 1,480 (53.7%) |
| $300,000 to $499,999 | 104 (3.2%) | 137 (5.0%) |
| $500,000 to $749,999 | 19 (0.6%) | 0 (0.0%) |
| $750,000 to $999,999 | 15 (0.5%) | 0 (0.0%) |
| $1,000,000 or more | 15 (0.5%) | 0 (0.0%) |
| Total | 3,207 (100.0%) | 2,755 (100.0%) |
Household Income by Mortgage Status in Luna County
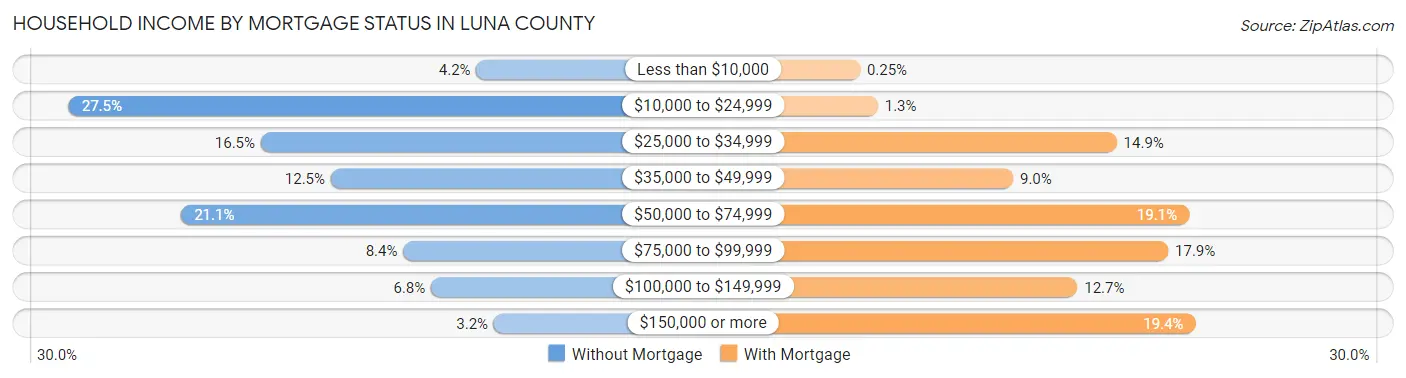
| Household Income | Without Mortgage | With Mortgage |
| Less than $10,000 | 134 (4.2%) | 7 (0.3%) |
| $10,000 to $24,999 | 881 (27.5%) | 35 (1.3%) |
| $25,000 to $34,999 | 529 (16.5%) | 411 (14.9%) |
| $35,000 to $49,999 | 401 (12.5%) | 248 (9.0%) |
| $50,000 to $74,999 | 675 (21.0%) | 525 (19.1%) |
| $75,000 to $99,999 | 268 (8.4%) | 492 (17.9%) |
| $100,000 to $149,999 | 217 (6.8%) | 349 (12.7%) |
| $150,000 or more | 102 (3.2%) | 535 (19.4%) |
| Total | 3,207 (100.0%) | 2,755 (100.0%) |
Property Value to Household Income Ratio in Luna County
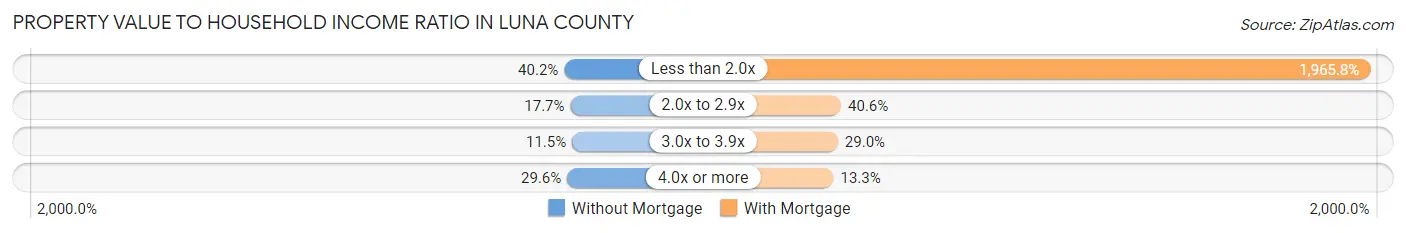
| Value-to-Income Ratio | Without Mortgage | With Mortgage |
| Less than 2.0x | 1,289 (40.2%) | 54,159 (1,965.8%) |
| 2.0x to 2.9x | 566 (17.6%) | 1,119 (40.6%) |
| 3.0x to 3.9x | 369 (11.5%) | 798 (29.0%) |
| 4.0x or more | 948 (29.6%) | 365 (13.3%) |
| Total | 3,207 (100.0%) | 2,755 (100.0%) |
Real Estate Taxes by Mortgage Status in Luna County
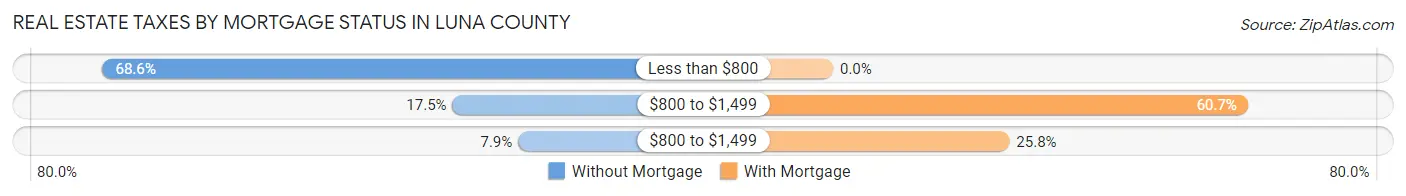
| Property Taxes | Without Mortgage | With Mortgage |
| Less than $800 | 2,200 (68.6%) | 0 (0.0%) |
| $800 to $1,499 | 561 (17.5%) | 1,673 (60.7%) |
| $800 to $1,499 | 253 (7.9%) | 710 (25.8%) |
| Total | 3,207 (100.0%) | 2,755 (100.0%) |
Health & Disability in Luna County
Health Insurance Coverage by Age in Luna County
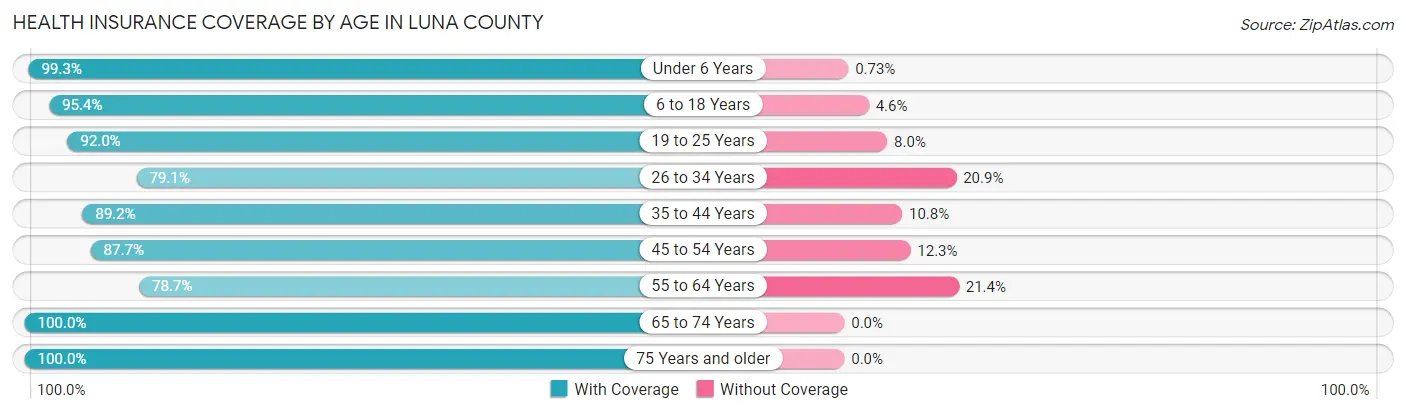
| Age Bracket | With Coverage | Without Coverage |
| Under 6 Years | 2,304 (99.3%) | 17 (0.7%) |
| 6 to 18 Years | 4,646 (95.4%) | 222 (4.6%) |
| 19 to 25 Years | 1,751 (92.0%) | 152 (8.0%) |
| 26 to 34 Years | 2,317 (79.1%) | 611 (20.9%) |
| 35 to 44 Years | 2,295 (89.2%) | 277 (10.8%) |
| 45 to 54 Years | 2,163 (87.7%) | 304 (12.3%) |
| 55 to 64 Years | 2,233 (78.6%) | 606 (21.3%) |
| 65 to 74 Years | 2,791 (100.0%) | 0 (0.0%) |
| 75 Years and older | 2,357 (100.0%) | 0 (0.0%) |
| Total | 22,857 (91.3%) | 2,189 (8.7%) |
Health Insurance Coverage by Citizenship Status in Luna County
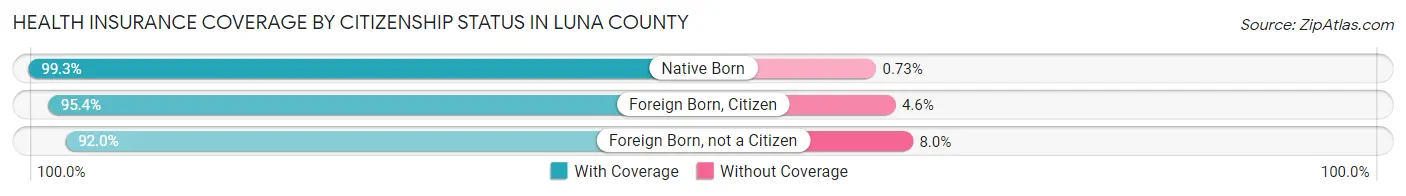
| Citizenship Status | With Coverage | Without Coverage |
| Native Born | 2,304 (99.3%) | 17 (0.7%) |
| Foreign Born, Citizen | 4,646 (95.4%) | 222 (4.6%) |
| Foreign Born, not a Citizen | 1,751 (92.0%) | 152 (8.0%) |
Health Insurance Coverage by Household Income in Luna County
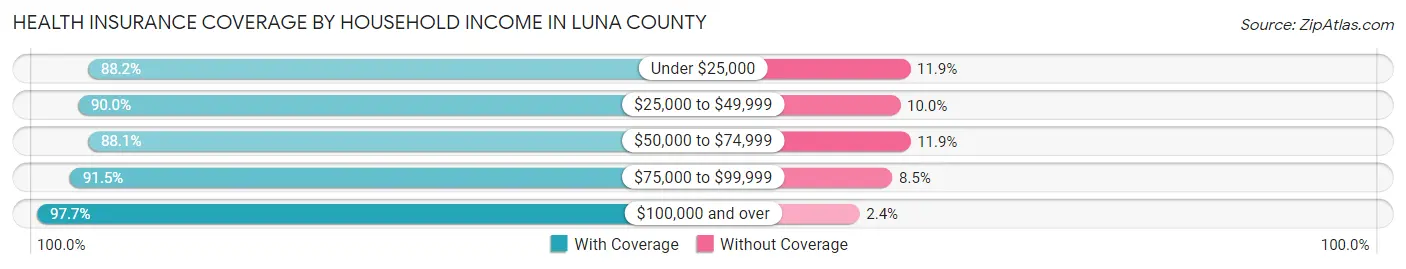
| Household Income | With Coverage | Without Coverage |
| Under $25,000 | 5,049 (88.1%) | 679 (11.8%) |
| $25,000 to $49,999 | 5,827 (90.0%) | 645 (10.0%) |
| $50,000 to $74,999 | 3,473 (88.1%) | 468 (11.9%) |
| $75,000 to $99,999 | 2,683 (91.5%) | 249 (8.5%) |
| $100,000 and over | 5,746 (97.7%) | 138 (2.4%) |
Public vs Private Health Insurance Coverage by Age in Luna County
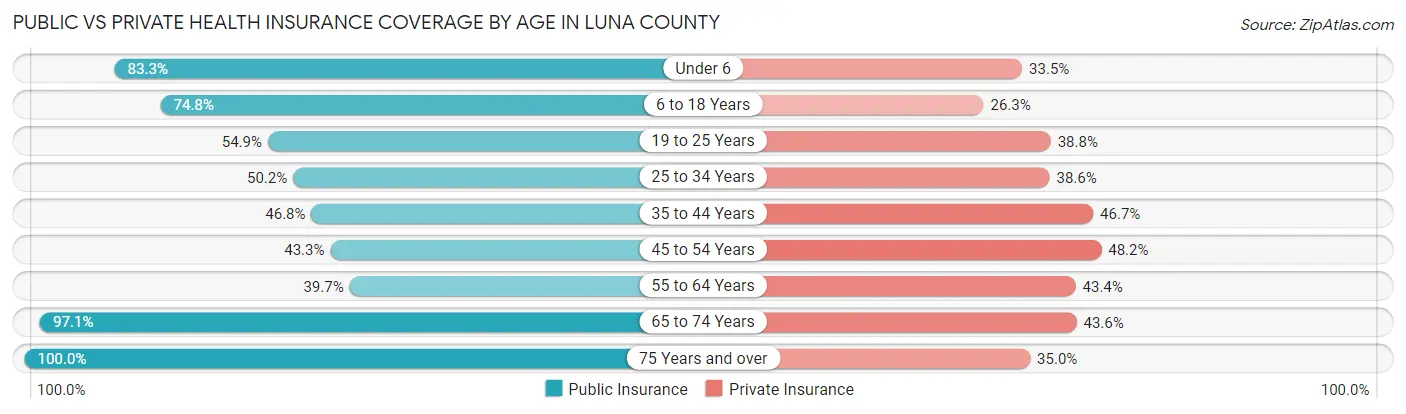
| Age Bracket | Public Insurance | Private Insurance |
| Under 6 | 1,933 (83.3%) | 777 (33.5%) |
| 6 to 18 Years | 3,639 (74.8%) | 1,281 (26.3%) |
| 19 to 25 Years | 1,044 (54.9%) | 738 (38.8%) |
| 25 to 34 Years | 1,469 (50.2%) | 1,129 (38.6%) |
| 35 to 44 Years | 1,203 (46.8%) | 1,200 (46.7%) |
| 45 to 54 Years | 1,067 (43.2%) | 1,188 (48.2%) |
| 55 to 64 Years | 1,127 (39.7%) | 1,232 (43.4%) |
| 65 to 74 Years | 2,711 (97.1%) | 1,216 (43.6%) |
| 75 Years and over | 2,357 (100.0%) | 824 (35.0%) |
| Total | 16,550 (66.1%) | 9,585 (38.3%) |
Disability Status by Sex by Age in Luna County
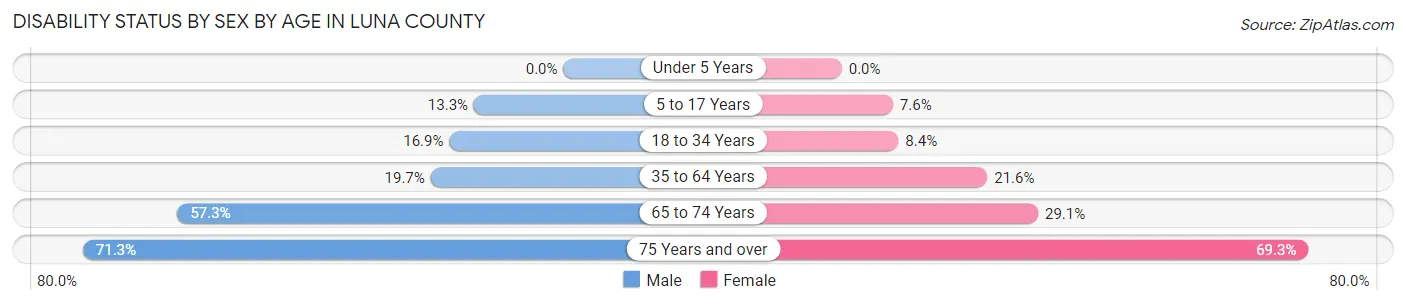
| Age Bracket | Male | Female |
| Under 5 Years | 0 (0.0%) | 0 (0.0%) |
| 5 to 17 Years | 313 (13.3%) | 184 (7.6%) |
| 18 to 34 Years | 454 (16.9%) | 215 (8.4%) |
| 35 to 64 Years | 783 (19.7%) | 844 (21.6%) |
| 65 to 74 Years | 825 (57.3%) | 394 (29.1%) |
| 75 Years and over | 839 (71.3%) | 818 (69.3%) |
Disability Class by Sex by Age in Luna County
Disability Class: Hearing Difficulty
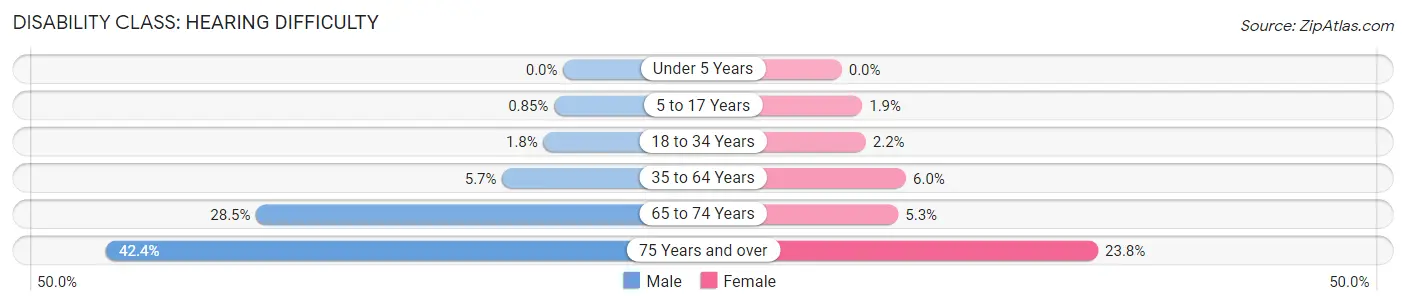
| Age Bracket | Male | Female |
| Under 5 Years | 0 (0.0%) | 0 (0.0%) |
| 5 to 17 Years | 20 (0.9%) | 46 (1.9%) |
| 18 to 34 Years | 49 (1.8%) | 57 (2.2%) |
| 35 to 64 Years | 225 (5.7%) | 233 (6.0%) |
| 65 to 74 Years | 410 (28.5%) | 71 (5.2%) |
| 75 Years and over | 499 (42.4%) | 281 (23.8%) |
Disability Class: Vision Difficulty
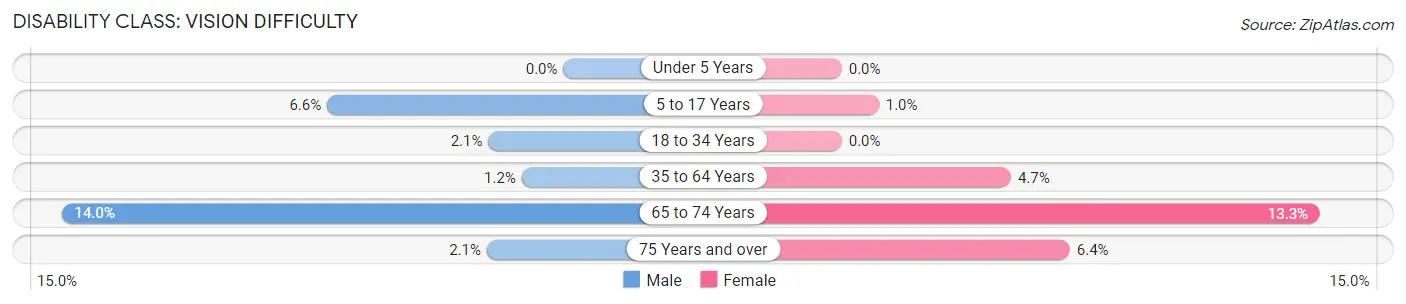
| Age Bracket | Male | Female |
| Under 5 Years | 0 (0.0%) | 0 (0.0%) |
| 5 to 17 Years | 155 (6.6%) | 25 (1.0%) |
| 18 to 34 Years | 56 (2.1%) | 0 (0.0%) |
| 35 to 64 Years | 46 (1.2%) | 184 (4.7%) |
| 65 to 74 Years | 201 (14.0%) | 180 (13.3%) |
| 75 Years and over | 25 (2.1%) | 75 (6.4%) |
Disability Class: Cognitive Difficulty
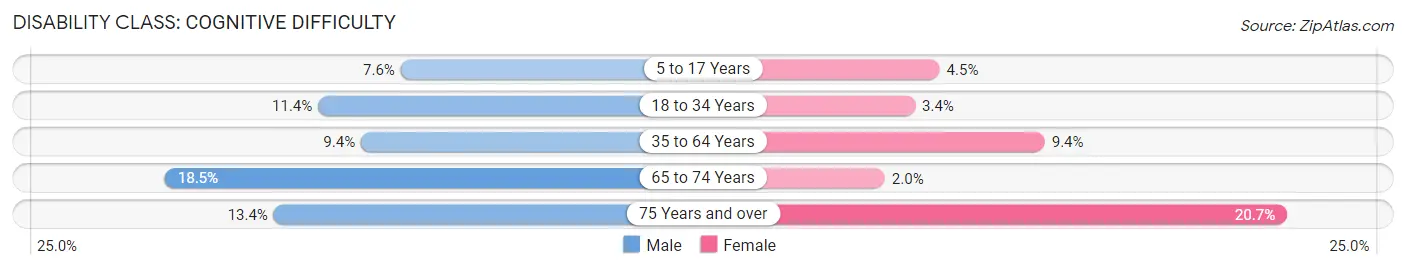
| Age Bracket | Male | Female |
| 5 to 17 Years | 178 (7.5%) | 110 (4.5%) |
| 18 to 34 Years | 305 (11.4%) | 87 (3.4%) |
| 35 to 64 Years | 373 (9.4%) | 368 (9.4%) |
| 65 to 74 Years | 266 (18.5%) | 27 (2.0%) |
| 75 Years and over | 158 (13.4%) | 244 (20.7%) |
Disability Class: Ambulatory Difficulty
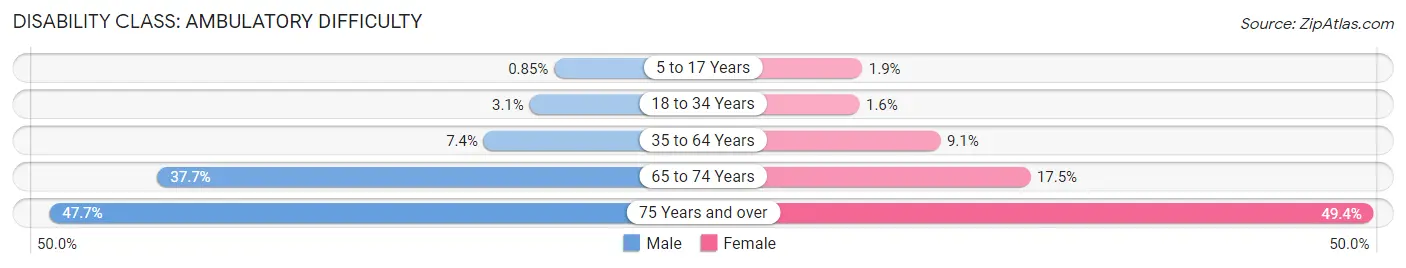
| Age Bracket | Male | Female |
| 5 to 17 Years | 20 (0.9%) | 45 (1.9%) |
| 18 to 34 Years | 84 (3.1%) | 41 (1.6%) |
| 35 to 64 Years | 293 (7.4%) | 356 (9.1%) |
| 65 to 74 Years | 542 (37.7%) | 236 (17.5%) |
| 75 Years and over | 561 (47.7%) | 583 (49.4%) |
Disability Class: Self-Care Difficulty
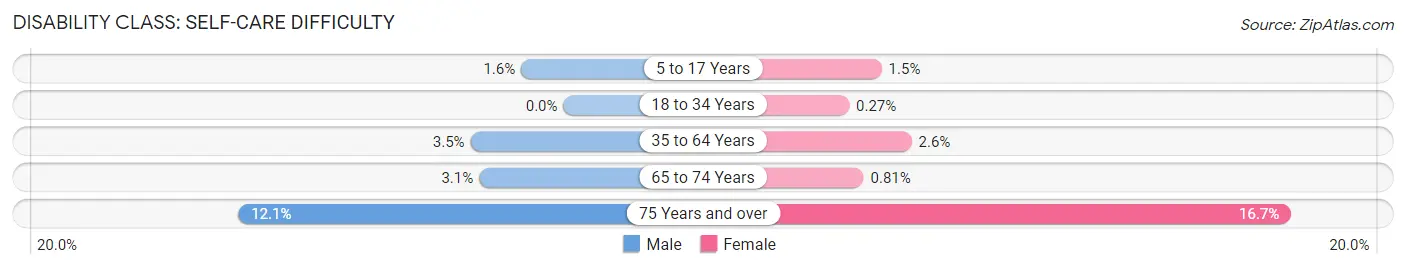
| Age Bracket | Male | Female |
| 5 to 17 Years | 37 (1.6%) | 36 (1.5%) |
| 18 to 34 Years | 0 (0.0%) | 7 (0.3%) |
| 35 to 64 Years | 137 (3.5%) | 101 (2.6%) |
| 65 to 74 Years | 45 (3.1%) | 11 (0.8%) |
| 75 Years and over | 142 (12.1%) | 197 (16.7%) |
Technology Access in Luna County
Computing Device Access in Luna County
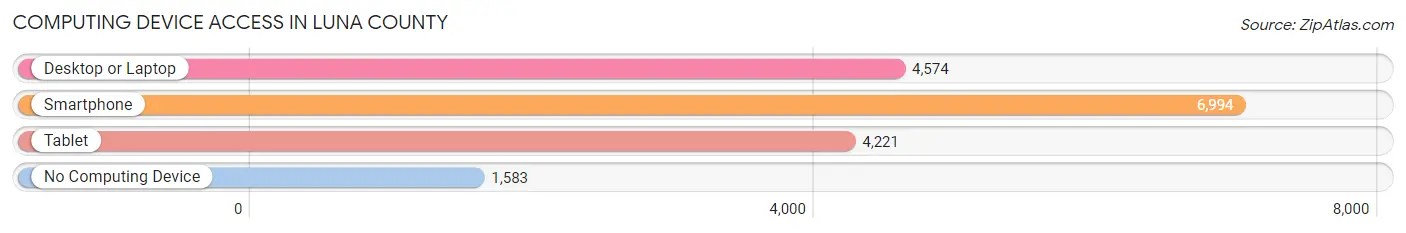
| Device Type | # Households | % Households |
| Desktop or Laptop | 4,574 | 51.1% |
| Smartphone | 6,994 | 78.1% |
| Tablet | 4,221 | 47.2% |
| No Computing Device | 1,583 | 17.7% |
| Total | 8,951 | 100.0% |
Internet Access in Luna County
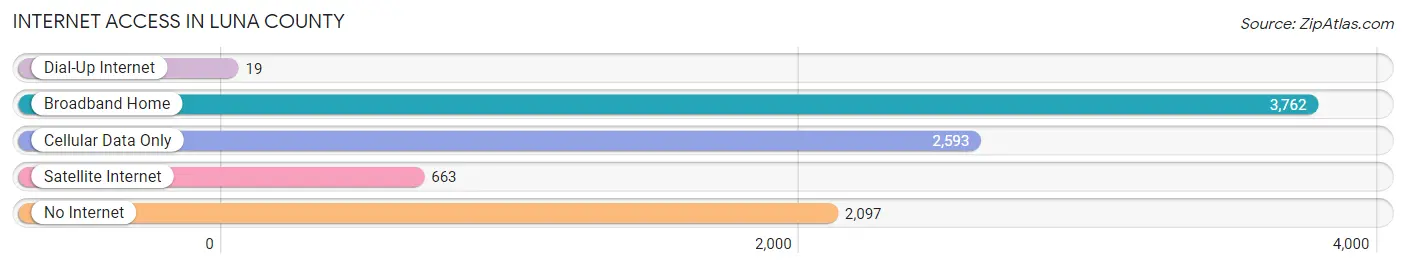
| Internet Type | # Households | % Households |
| Dial-Up Internet | 19 | 0.2% |
| Broadband Home | 3,762 | 42.0% |
| Cellular Data Only | 2,593 | 29.0% |
| Satellite Internet | 663 | 7.4% |
| No Internet | 2,097 | 23.4% |
| Total | 8,951 | 100.0% |
Luna County Summary
Luna County is located in the southwestern corner of New Mexico, and is bordered by the states of Arizona and Mexico. It is the second largest county in the state, with an area of 5,912 square miles. The county seat is Deming, and the largest city is Columbus. The population of Luna County was estimated to be 25,095 in 2019.
Geography
Luna County is located in the Chihuahuan Desert, and is characterized by flat to rolling terrain. The county is divided into two distinct regions: the western portion is part of the Basin and Range Province, while the eastern portion is part of the Rio Grande Valley. The county is home to several mountain ranges, including the Florida Mountains, the Animas Mountains, and the Peloncillo Mountains. The county is also home to several rivers, including the Rio Grande, the Mimbres River, and the San Simon River.
The climate of Luna County is arid, with hot summers and mild winters. The average annual precipitation is 8.5 inches, with most of the precipitation occurring in the summer months.
Economy
Luna County is largely rural, and the economy is largely based on agriculture and ranching. The county is home to several large farms and ranches, and the main crops grown in the county are cotton, alfalfa, and pecans. The county is also home to several mining operations, including copper, gold, and silver.
The county is also home to several manufacturing operations, including food processing, furniture manufacturing, and metal fabrication. The county is also home to several retail stores, restaurants, and other businesses.
Demographics
As of the 2010 census, the population of Luna County was 24,233. The racial makeup of the county was 75.3% White, 0.7% African American, 0.9% Native American, 0.3% Asian, 0.1% Pacific Islander, 19.7% from other races, and 3.0% from two or more races. Hispanic or Latino of any race were 57.2% of the population.
The median income for a household in the county was $30,945, and the median income for a family was $35,945. The per capita income for the county was $15,945. About 20.3% of the population was below the poverty line.
Conclusion
Luna County is a rural county located in the southwestern corner of New Mexico. The county is characterized by flat to rolling terrain, and is home to several mountain ranges and rivers. The economy of the county is largely based on agriculture and ranching, and the county is also home to several manufacturing and retail businesses. The population of the county is largely Hispanic or Latino, and the median income for a household is below the poverty line.
Common Questions
What is Per Capita Income in Luna County?
Per Capita income in Luna County is $20,799.
What is the Median Family Income in Luna County?
Median Family Income in Luna County is $51,654.
What is the Median Household income in Luna County?
Median Household Income in Luna County is $38,241.
What is Income or Wage Gap in Luna County?
Income or Wage Gap in Luna County is 49.9%.
Women in Luna County earn 50.1 cents for every dollar earned by a man.
What is Family Income Deficit in Luna County?
Family Income Deficit in Luna County is $9,548.
Families that are below poverty line in Luna County earn $9,548 less on average than the poverty threshold level.
What is Inequality or Gini Index in Luna County?
Inequality or Gini Index in Luna County is 0.45.
What is the Total Population of Luna County?
Total Population of Luna County is 25,393.
What is the Total Male Population of Luna County?
Total Male Population of Luna County is 12,969.
What is the Total Female Population of Luna County?
Total Female Population of Luna County is 12,424.
What is the Ratio of Males per 100 Females in Luna County?
There are 104.39 Males per 100 Females in Luna County.
What is the Ratio of Females per 100 Males in Luna County?
There are 95.80 Females per 100 Males in Luna County.
What is the Median Population Age in Luna County?
Median Population Age in Luna County is 36.5 Years.
What is the Average Family Size in Luna County
Average Family Size in Luna County is 3.8 People.
What is the Average Household Size in Luna County
Average Household Size in Luna County is 2.8 People.
How Large is the Labor Force in Luna County?
There are 8,933 People in the Labor Forcein in Luna County.
What is the Percentage of People in the Labor Force in Luna County?
46.2% of People are in the Labor Force in Luna County.
What is the Unemployment Rate in Luna County?
Unemployment Rate in Luna County is 7.0%.