Colfax County, NM Map & Demographics
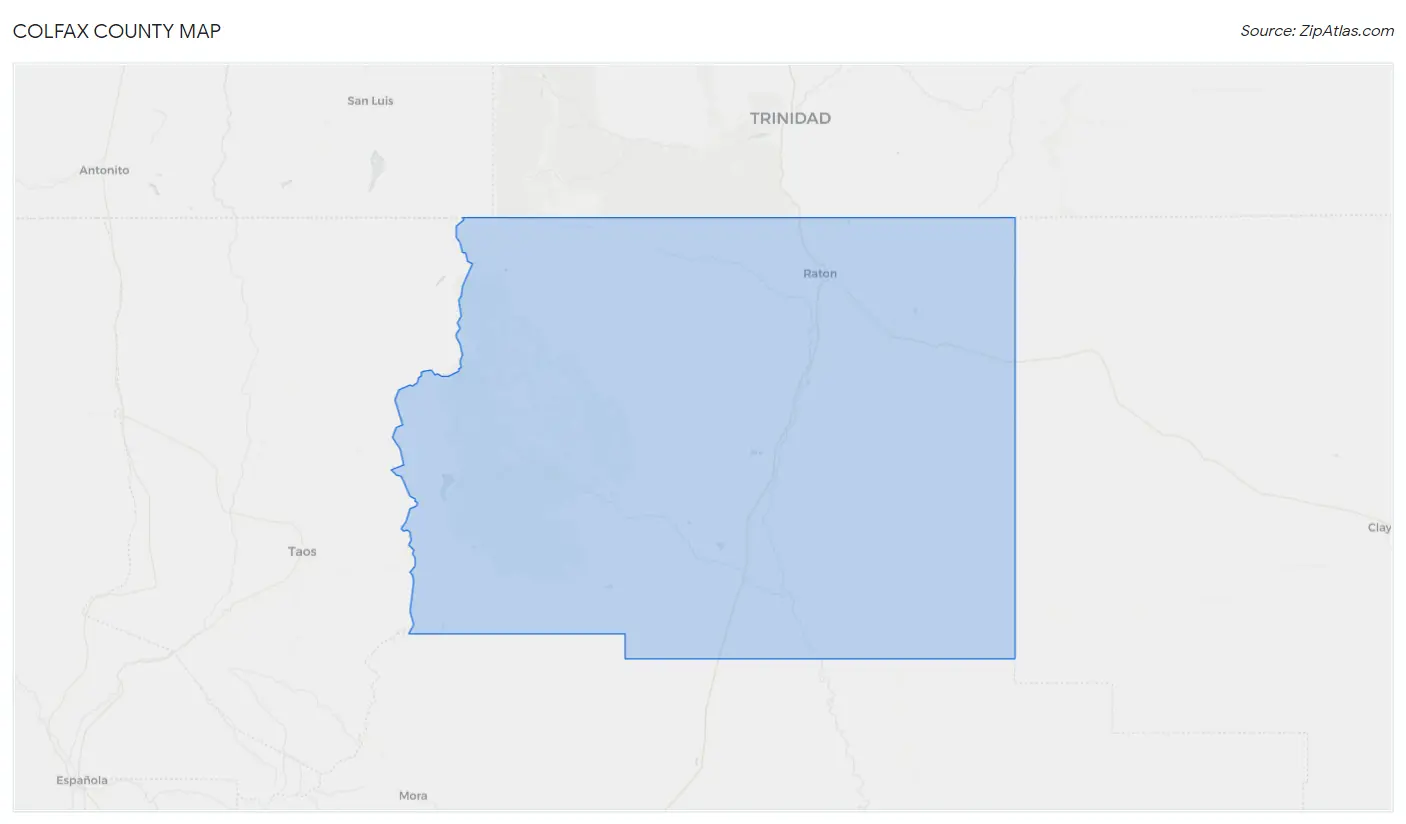
Colfax County Map
Colfax County Overview
$28,275
PER CAPITA INCOME
$62,773
AVG FAMILY INCOME
$46,286
AVG HOUSEHOLD INCOME
25.8%
WAGE / INCOME GAP [ % ]
74.2¢/ $1
WAGE / INCOME GAP [ $ ]
0.42
INEQUALITY / GINI INDEX
12,370
TOTAL POPULATION
6,273
MALE POPULATION
6,097
FEMALE POPULATION
102.89
MALES / 100 FEMALES
97.19
FEMALES / 100 MALES
49.2
MEDIAN AGE
2.7
AVG FAMILY SIZE
2.1
AVG HOUSEHOLD SIZE
5,343
LABOR FORCE [ PEOPLE ]
50.6%
PERCENT IN LABOR FORCE
3.2%
UNEMPLOYMENT RATE
Income in Colfax County
Income Overview in Colfax County
Per Capita Income in Colfax County is $28,275, while median incomes of families and households are $62,773 and $46,286 respectively.
| Characteristic | Number | Measure |
| Per Capita Income | 12,370 | $28,275 |
| Median Family Income | 3,204 | $62,773 |
| Mean Family Income | 3,204 | $75,369 |
| Median Household Income | 5,549 | $46,286 |
| Mean Household Income | 5,549 | $60,486 |
| Income Deficit | 3,204 | $0 |
| Wage / Income Gap (%) | 12,370 | 25.77% |
| Wage / Income Gap ($) | 12,370 | 74.23¢ per $1 |
| Gini / Inequality Index | 12,370 | 0.42 |
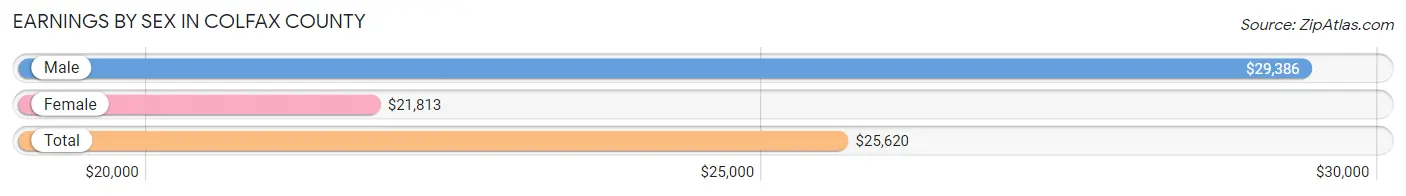
Earnings by Sex in Colfax County
Average Earnings in Colfax County are $25,620, $29,386 for men and $21,813 for women, a difference of 25.8%.
| Sex | Number | Average Earnings |
| Male | 3,013 (53.0%) | $29,386 |
| Female | 2,674 (47.0%) | $21,813 |
| Total | 5,687 (100.0%) | $25,620 |
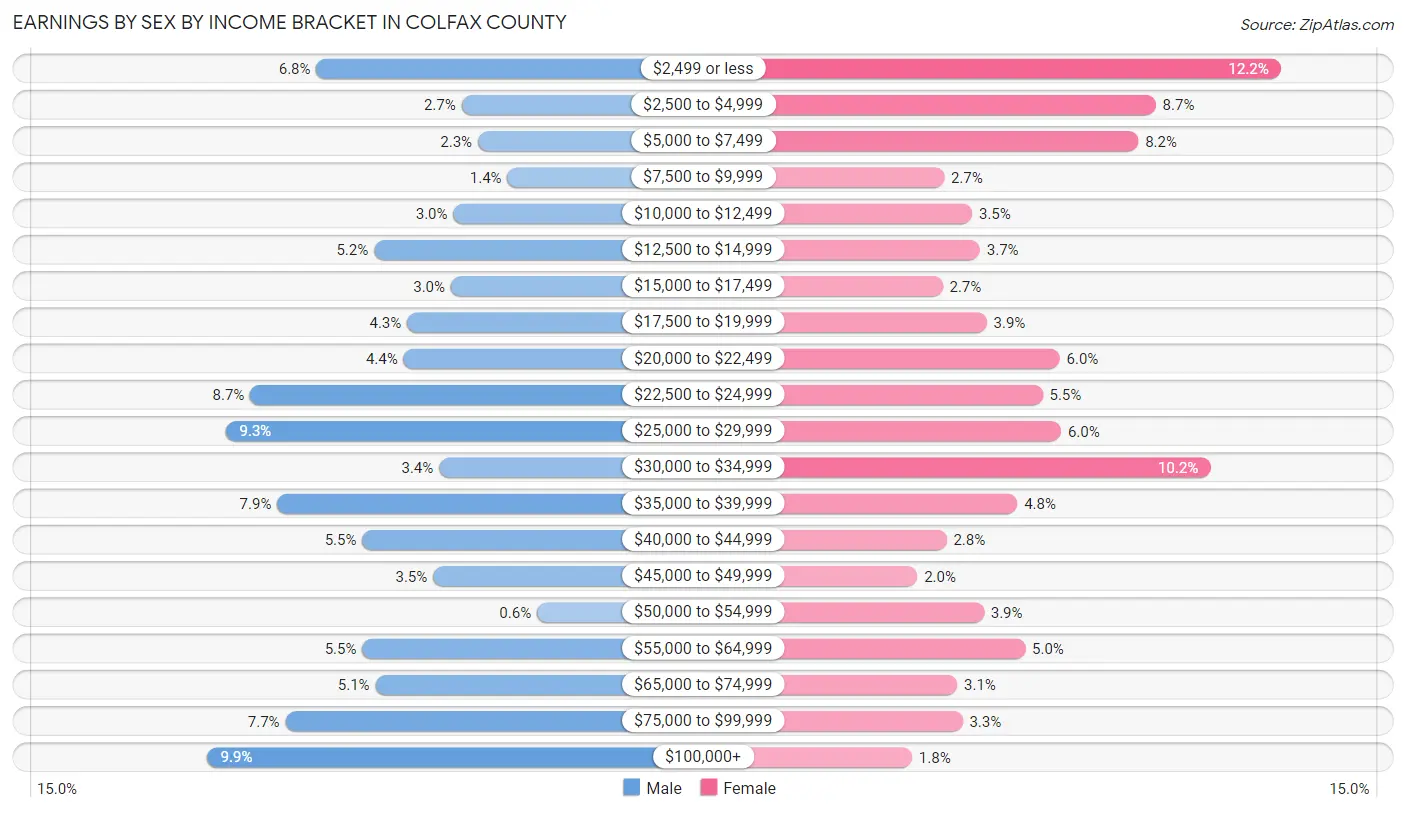
Earnings by Sex by Income Bracket in Colfax County
The most common earnings brackets in Colfax County are $100,000+ for men (297 | 9.9%) and $2,499 or less for women (326 | 12.2%).
| Income | Male | Female |
| $2,499 or less | 205 (6.8%) | 326 (12.2%) |
| $2,500 to $4,999 | 82 (2.7%) | 232 (8.7%) |
| $5,000 to $7,499 | 68 (2.3%) | 219 (8.2%) |
| $7,500 to $9,999 | 43 (1.4%) | 73 (2.7%) |
| $10,000 to $12,499 | 89 (2.9%) | 94 (3.5%) |
| $12,500 to $14,999 | 156 (5.2%) | 100 (3.7%) |
| $15,000 to $17,499 | 91 (3.0%) | 72 (2.7%) |
| $17,500 to $19,999 | 128 (4.3%) | 105 (3.9%) |
| $20,000 to $22,499 | 131 (4.3%) | 160 (6.0%) |
| $22,500 to $24,999 | 261 (8.7%) | 147 (5.5%) |
| $25,000 to $29,999 | 281 (9.3%) | 161 (6.0%) |
| $30,000 to $34,999 | 101 (3.4%) | 273 (10.2%) |
| $35,000 to $39,999 | 238 (7.9%) | 128 (4.8%) |
| $40,000 to $44,999 | 166 (5.5%) | 75 (2.8%) |
| $45,000 to $49,999 | 106 (3.5%) | 53 (2.0%) |
| $50,000 to $54,999 | 18 (0.6%) | 103 (3.8%) |
| $55,000 to $64,999 | 166 (5.5%) | 134 (5.0%) |
| $65,000 to $74,999 | 155 (5.1%) | 83 (3.1%) |
| $75,000 to $99,999 | 231 (7.7%) | 87 (3.3%) |
| $100,000+ | 297 (9.9%) | 49 (1.8%) |
| Total | 3,013 (100.0%) | 2,674 (100.0%) |
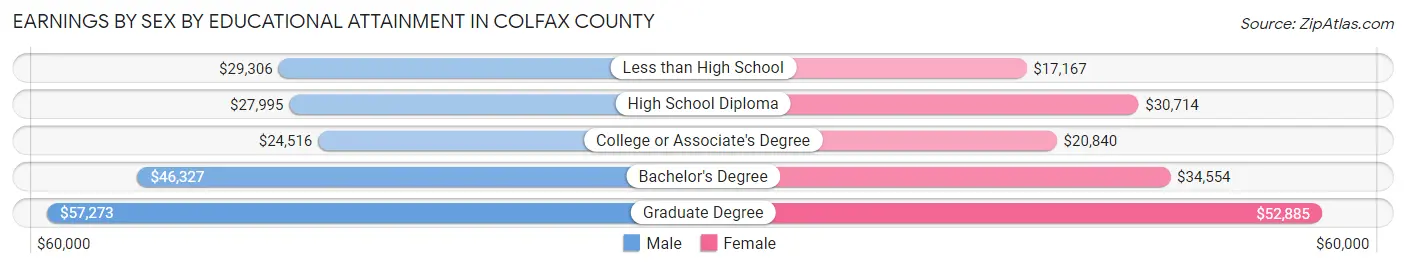
Earnings by Sex by Educational Attainment in Colfax County
Average earnings in Colfax County are $32,782 for men and $24,566 for women, a difference of 25.1%. Men with an educational attainment of graduate degree enjoy the highest average annual earnings of $57,273, while those with college or associate's degree education earn the least with $24,516. Women with an educational attainment of graduate degree earn the most with the average annual earnings of $52,885, while those with less than high school education have the smallest earnings of $17,167.
| Educational Attainment | Male Income | Female Income |
| Less than High School | $29,306 | $17,167 |
| High School Diploma | $27,995 | $30,714 |
| College or Associate's Degree | $24,516 | $20,840 |
| Bachelor's Degree | $46,327 | $34,554 |
| Graduate Degree | $57,273 | $52,885 |
| Total | $32,782 | $24,566 |
Family Income in Colfax County
Family Income Brackets in Colfax County
According to the Colfax County family income data, there are 711 families falling into the $50,000 to $74,999 income range, which is the most common income bracket and makes up 22.2% of all families. Conversely, the $10,000 to $14,999 income bracket is the least frequent group with only 13 families (0.4%) belonging to this category.
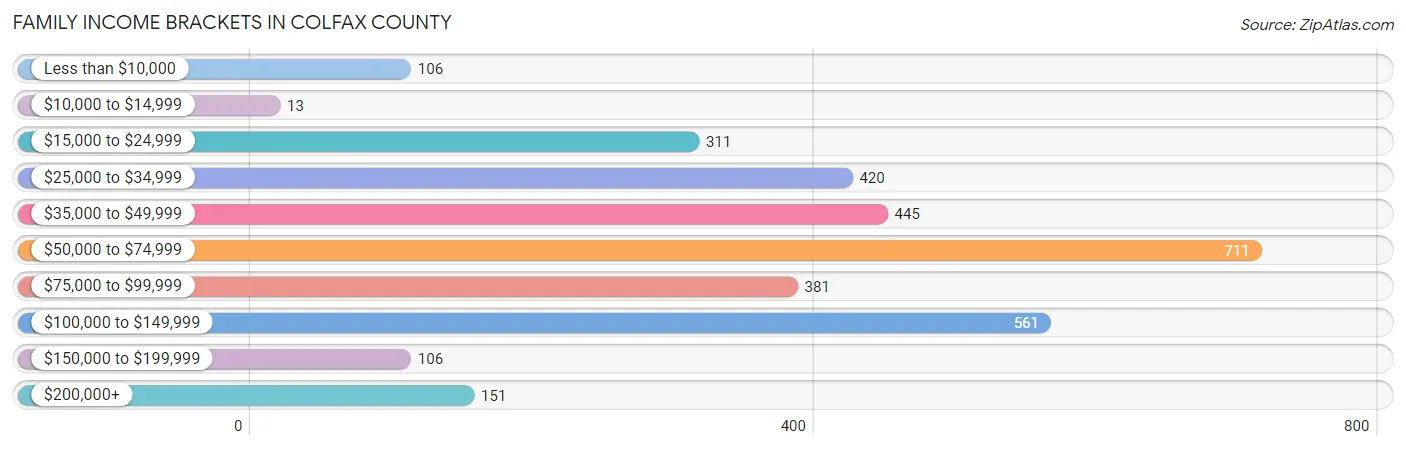
| Income Bracket | # Families | % Families |
| Less than $10,000 | 106 | 3.3% |
| $10,000 to $14,999 | 13 | 0.4% |
| $15,000 to $24,999 | 311 | 9.7% |
| $25,000 to $34,999 | 420 | 13.1% |
| $35,000 to $49,999 | 445 | 13.9% |
| $50,000 to $74,999 | 711 | 22.2% |
| $75,000 to $99,999 | 381 | 11.9% |
| $100,000 to $149,999 | 561 | 17.5% |
| $150,000 to $199,999 | 106 | 3.3% |
| $200,000+ | 151 | 4.7% |
Family Income by Famaliy Size in Colfax County
3-person families (584 | 18.2%) account for the highest median family income in Colfax County with $68,393 per family, while 2-person families (1,999 | 62.4%) have the highest median income of $32,595 per family member.
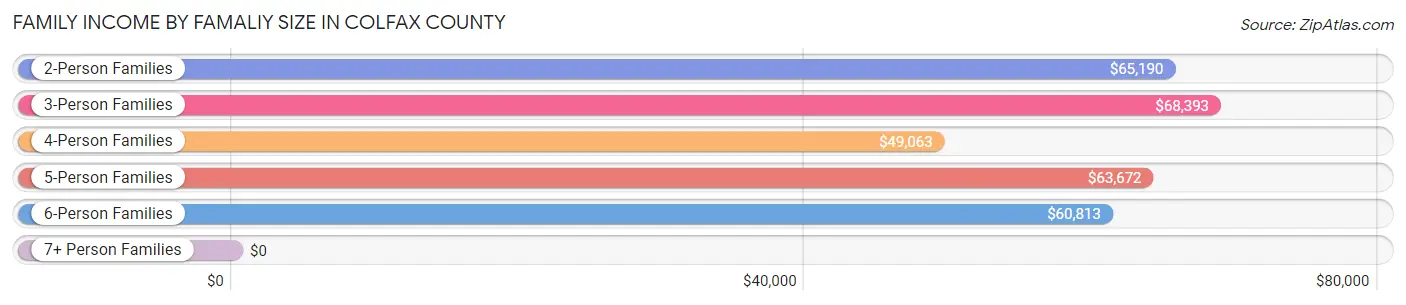
| Income Bracket | # Families | Median Income |
| 2-Person Families | 1,999 (62.4%) | $65,190 |
| 3-Person Families | 584 (18.2%) | $68,393 |
| 4-Person Families | 318 (9.9%) | $49,063 |
| 5-Person Families | 214 (6.7%) | $63,672 |
| 6-Person Families | 45 (1.4%) | $60,813 |
| 7+ Person Families | 44 (1.4%) | $0 |
| Total | 3,204 (100.0%) | $62,773 |
Family Income by Number of Earners in Colfax County
The median family income in Colfax County is $62,773, with families comprising 3+ earners (120) having the highest median family income of $116,250, while families with no earners (887) have the lowest median family income of $43,750, accounting for 3.7% and 27.7% of families, respectively.
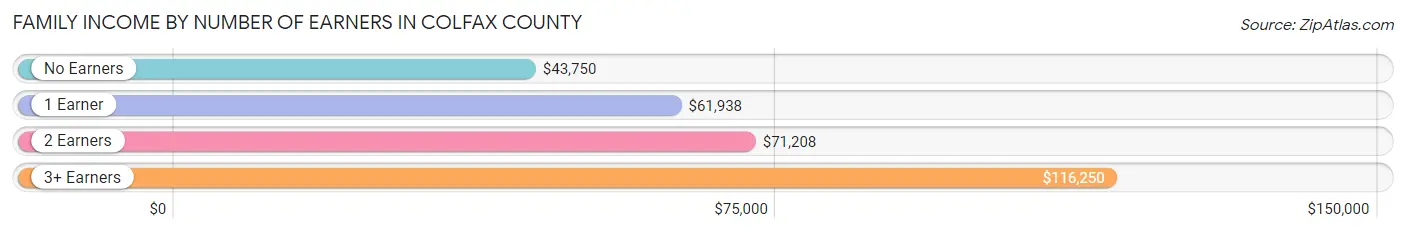
| Number of Earners | # Families | Median Income |
| No Earners | 887 (27.7%) | $43,750 |
| 1 Earner | 1,017 (31.7%) | $61,938 |
| 2 Earners | 1,180 (36.8%) | $71,208 |
| 3+ Earners | 120 (3.7%) | $116,250 |
| Total | 3,204 (100.0%) | $62,773 |
Household Income in Colfax County
Household Income Brackets in Colfax County
With 1,171 households falling in the category, the $50,000 to $74,999 income range is the most frequent in Colfax County, accounting for 21.1% of all households. In contrast, only 128 households (2.3%) fall into the $150,000 to $199,999 income bracket, making it the least populous group.
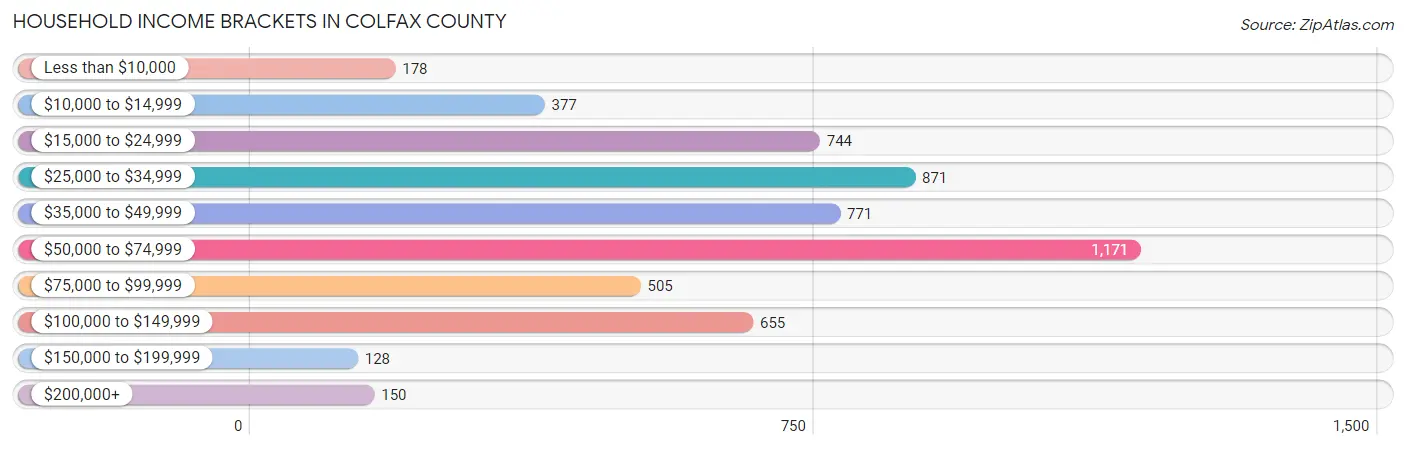
| Income Bracket | # Households | % Households |
| Less than $10,000 | 178 | 3.2% |
| $10,000 to $14,999 | 377 | 6.8% |
| $15,000 to $24,999 | 744 | 13.4% |
| $25,000 to $34,999 | 871 | 15.7% |
| $35,000 to $49,999 | 771 | 13.9% |
| $50,000 to $74,999 | 1,171 | 21.1% |
| $75,000 to $99,999 | 505 | 9.1% |
| $100,000 to $149,999 | 655 | 11.8% |
| $150,000 to $199,999 | 128 | 2.3% |
| $200,000+ | 150 | 2.7% |
Household Income by Householder Age in Colfax County
The median household income in Colfax County is $46,286, with the highest median household income of $58,209 found in the 45 to 64 years age bracket for the primary householder. A total of 1,859 households (33.5%) fall into this category. Meanwhile, the 15 to 24 years age bracket for the primary householder has the lowest median household income of $0, with 278 households (5.0%) in this group.
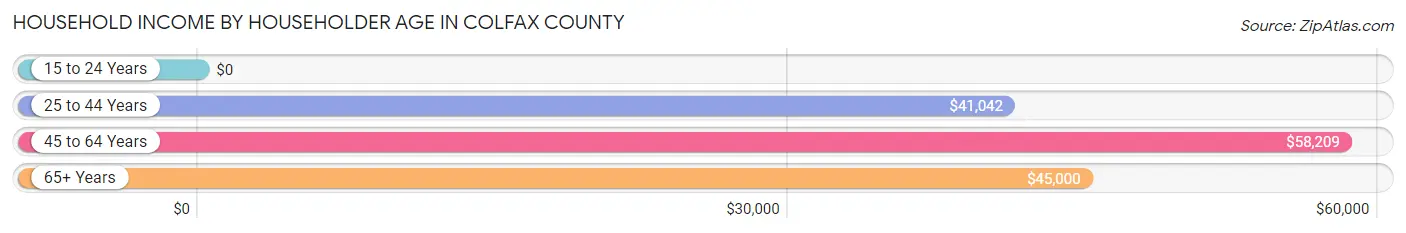
| Income Bracket | # Households | Median Income |
| 15 to 24 Years | 278 (5.0%) | $0 |
| 25 to 44 Years | 1,126 (20.3%) | $41,042 |
| 45 to 64 Years | 1,859 (33.5%) | $58,209 |
| 65+ Years | 2,286 (41.2%) | $45,000 |
| Total | 5,549 (100.0%) | $46,286 |
Poverty in Colfax County
Income Below Poverty by Sex and Age in Colfax County
With 15.3% poverty level for males and 20.8% for females among the residents of Colfax County, 15 year old males and 5 year old females are the most vulnerable to poverty, with 21 males (80.8%) and 69 females (71.9%) in their respective age groups living below the poverty level.
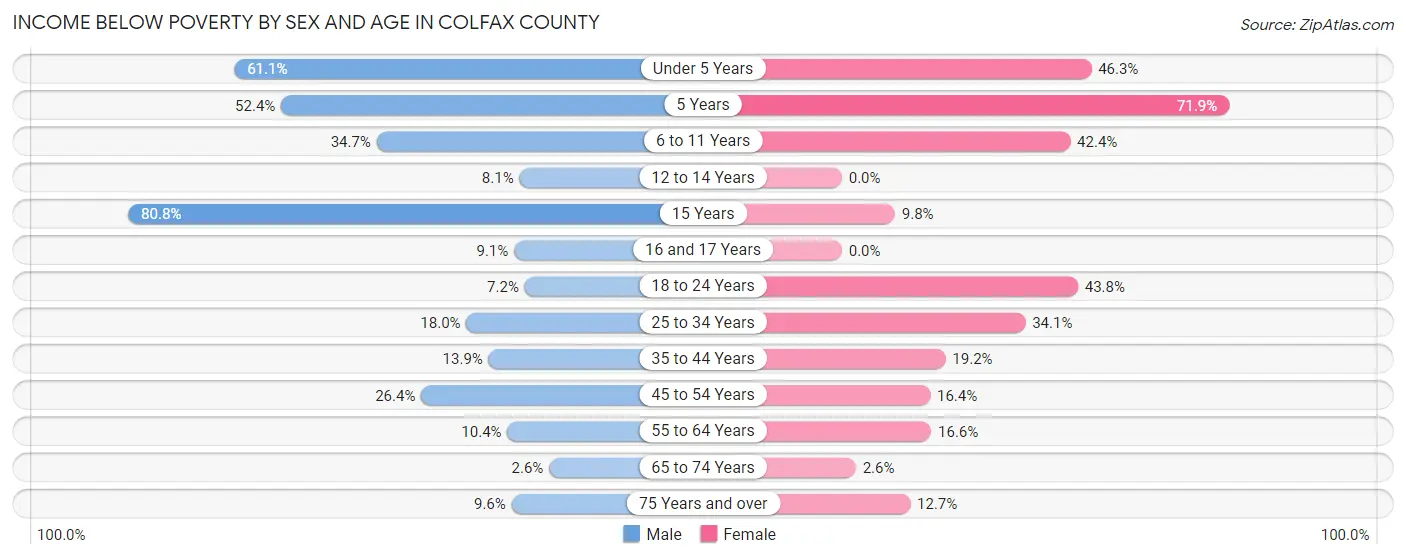
| Age Bracket | Male | Female |
| Under 5 Years | 113 (61.1%) | 131 (46.3%) |
| 5 Years | 44 (52.4%) | 69 (71.9%) |
| 6 to 11 Years | 123 (34.6%) | 170 (42.4%) |
| 12 to 14 Years | 14 (8.1%) | 0 (0.0%) |
| 15 Years | 21 (80.8%) | 6 (9.8%) |
| 16 and 17 Years | 16 (9.1%) | 0 (0.0%) |
| 18 to 24 Years | 38 (7.2%) | 173 (43.8%) |
| 25 to 34 Years | 100 (18.0%) | 206 (34.1%) |
| 35 to 44 Years | 79 (13.9%) | 105 (19.2%) |
| 45 to 54 Years | 163 (26.4%) | 105 (16.4%) |
| 55 to 64 Years | 94 (10.4%) | 160 (16.6%) |
| 65 to 74 Years | 27 (2.6%) | 25 (2.6%) |
| 75 Years and over | 60 (9.6%) | 88 (12.7%) |
| Total | 892 (15.3%) | 1,238 (20.8%) |
Income Above Poverty by Sex and Age in Colfax County
According to the poverty statistics in Colfax County, males aged 65 to 74 years and females aged 12 to 14 years are the age groups that are most secure financially, with 97.4% of males and 100.0% of females in these age groups living above the poverty line.
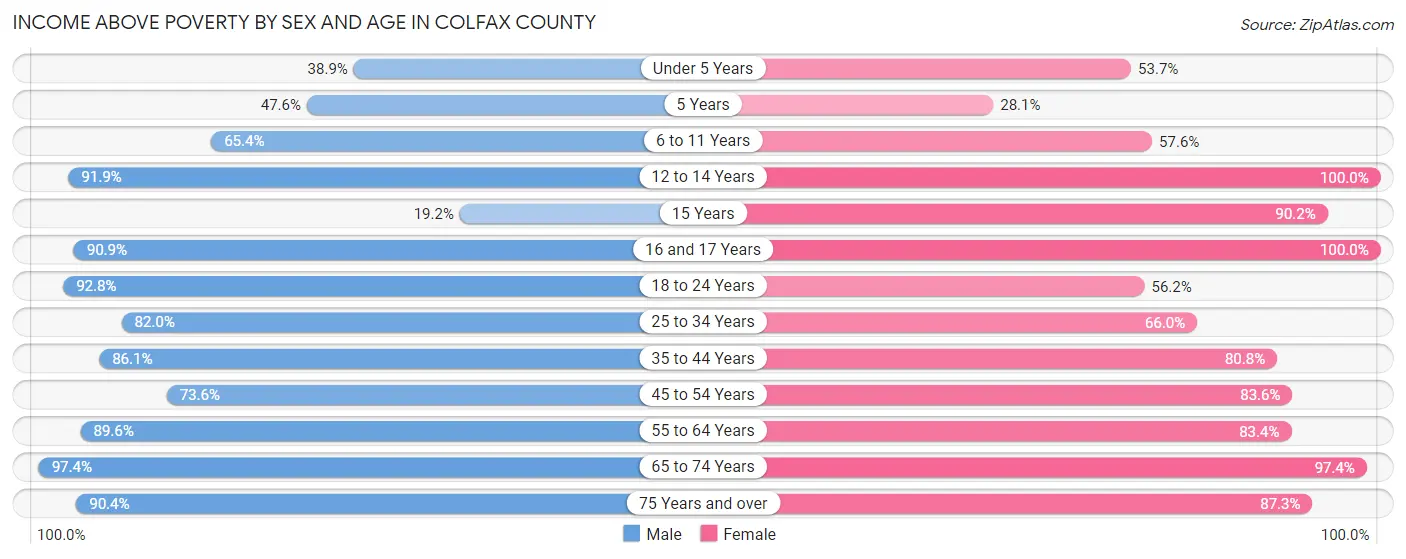
| Age Bracket | Male | Female |
| Under 5 Years | 72 (38.9%) | 152 (53.7%) |
| 5 Years | 40 (47.6%) | 27 (28.1%) |
| 6 to 11 Years | 232 (65.3%) | 231 (57.6%) |
| 12 to 14 Years | 158 (91.9%) | 114 (100.0%) |
| 15 Years | 5 (19.2%) | 55 (90.2%) |
| 16 and 17 Years | 159 (90.9%) | 181 (100.0%) |
| 18 to 24 Years | 492 (92.8%) | 222 (56.2%) |
| 25 to 34 Years | 456 (82.0%) | 399 (65.9%) |
| 35 to 44 Years | 491 (86.1%) | 441 (80.8%) |
| 45 to 54 Years | 455 (73.6%) | 536 (83.6%) |
| 55 to 64 Years | 812 (89.6%) | 805 (83.4%) |
| 65 to 74 Years | 1,001 (97.4%) | 943 (97.4%) |
| 75 Years and over | 565 (90.4%) | 606 (87.3%) |
| Total | 4,938 (84.7%) | 4,712 (79.2%) |
Income Below Poverty Among Married-Couple Families in Colfax County
The poverty statistics for married-couple families in Colfax County show that 7.3% or 167 of the total 2,274 families live below the poverty line. Families with 5 or more children have the highest poverty rate of 100.0%, comprising of 37 families. On the other hand, families with no children have the lowest poverty rate of 1.8%, which includes 30 families.
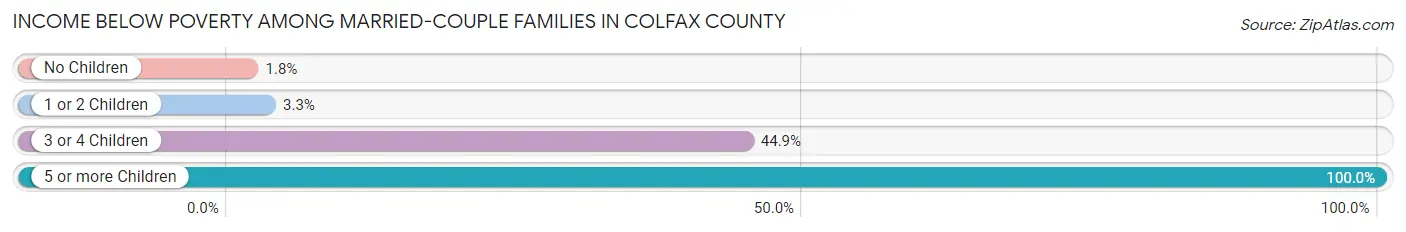
| Children | Above Poverty | Below Poverty |
| No Children | 1,648 (98.2%) | 30 (1.8%) |
| 1 or 2 Children | 351 (96.7%) | 12 (3.3%) |
| 3 or 4 Children | 108 (55.1%) | 88 (44.9%) |
| 5 or more Children | 0 (0.0%) | 37 (100.0%) |
| Total | 2,107 (92.7%) | 167 (7.3%) |
Income Below Poverty Among Single-Parent Households in Colfax County
According to the poverty data in Colfax County, 15.8% or 60 single-father households and 28.1% or 154 single-mother households are living below the poverty line. Among single-father households, those with no children have the highest poverty rate, with 31 households (18.8%) experiencing poverty. Likewise, among single-mother households, those with 3 or 4 children have the highest poverty rate, with 15 households (100.0%) falling below the poverty line.
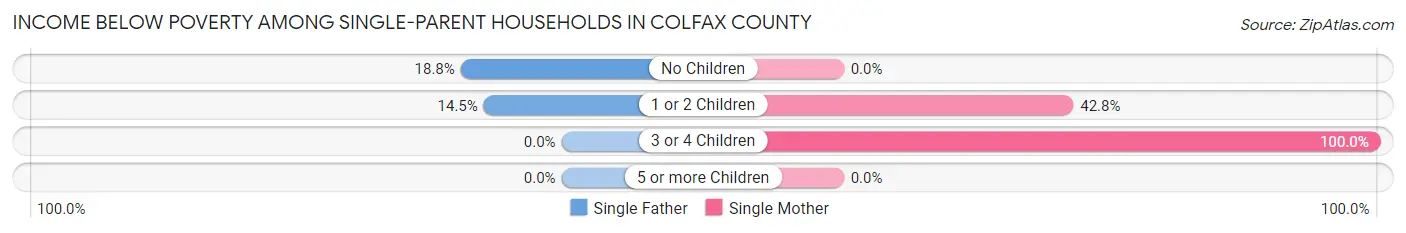
| Children | Single Father | Single Mother |
| No Children | 31 (18.8%) | 0 (0.0%) |
| 1 or 2 Children | 29 (14.5%) | 139 (42.8%) |
| 3 or 4 Children | 0 (0.0%) | 15 (100.0%) |
| 5 or more Children | 0 (0.0%) | 0 (0.0%) |
| Total | 60 (15.8%) | 154 (28.1%) |
Income Below Poverty Among Married-Couple vs Single-Parent Households in Colfax County
The poverty data for Colfax County shows that 167 of the married-couple family households (7.3%) and 214 of the single-parent households (23.0%) are living below the poverty level. Within the married-couple family households, those with 5 or more children have the highest poverty rate, with 37 households (100.0%) falling below the poverty line. Among the single-parent households, those with 3 or 4 children have the highest poverty rate, with 15 household (48.4%) living below poverty.
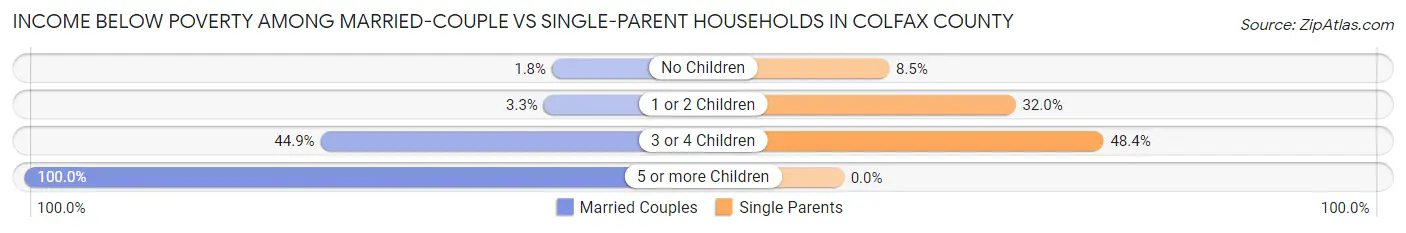
| Children | Married-Couple Families | Single-Parent Households |
| No Children | 30 (1.8%) | 31 (8.5%) |
| 1 or 2 Children | 12 (3.3%) | 168 (32.0%) |
| 3 or 4 Children | 88 (44.9%) | 15 (48.4%) |
| 5 or more Children | 37 (100.0%) | 0 (0.0%) |
| Total | 167 (7.3%) | 214 (23.0%) |
Race in Colfax County
The most populous races in Colfax County are White / Caucasian (9,129 | 73.8%), Hispanic or Latino (6,084 | 49.2%), and Two or more Races (1,784 | 14.4%).
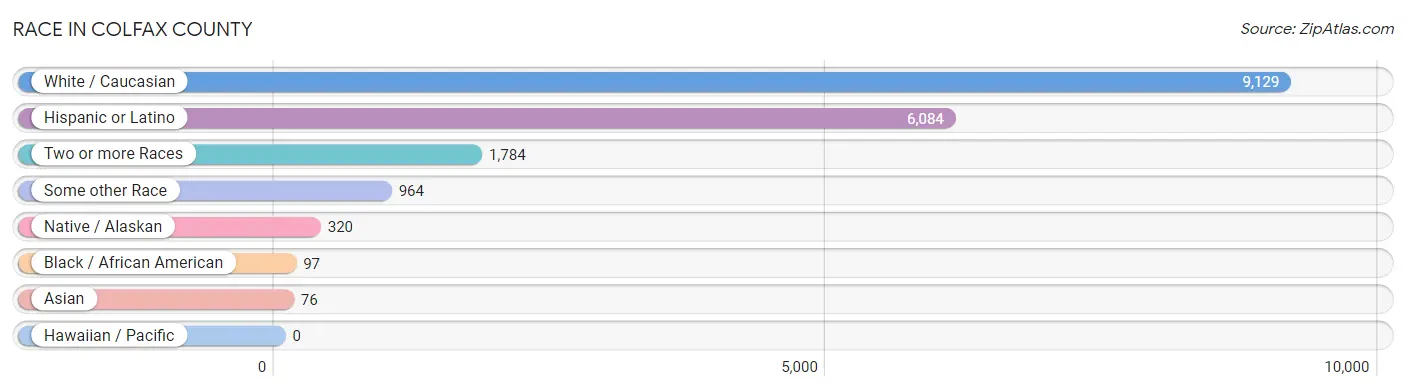
| Race | # Population | % Population |
| Asian | 76 | 0.6% |
| Black / African American | 97 | 0.8% |
| Hawaiian / Pacific | 0 | 0.0% |
| Hispanic or Latino | 6,084 | 49.2% |
| Native / Alaskan | 320 | 2.6% |
| White / Caucasian | 9,129 | 73.8% |
| Two or more Races | 1,784 | 14.4% |
| Some other Race | 964 | 7.8% |
| Total | 12,370 | 100.0% |
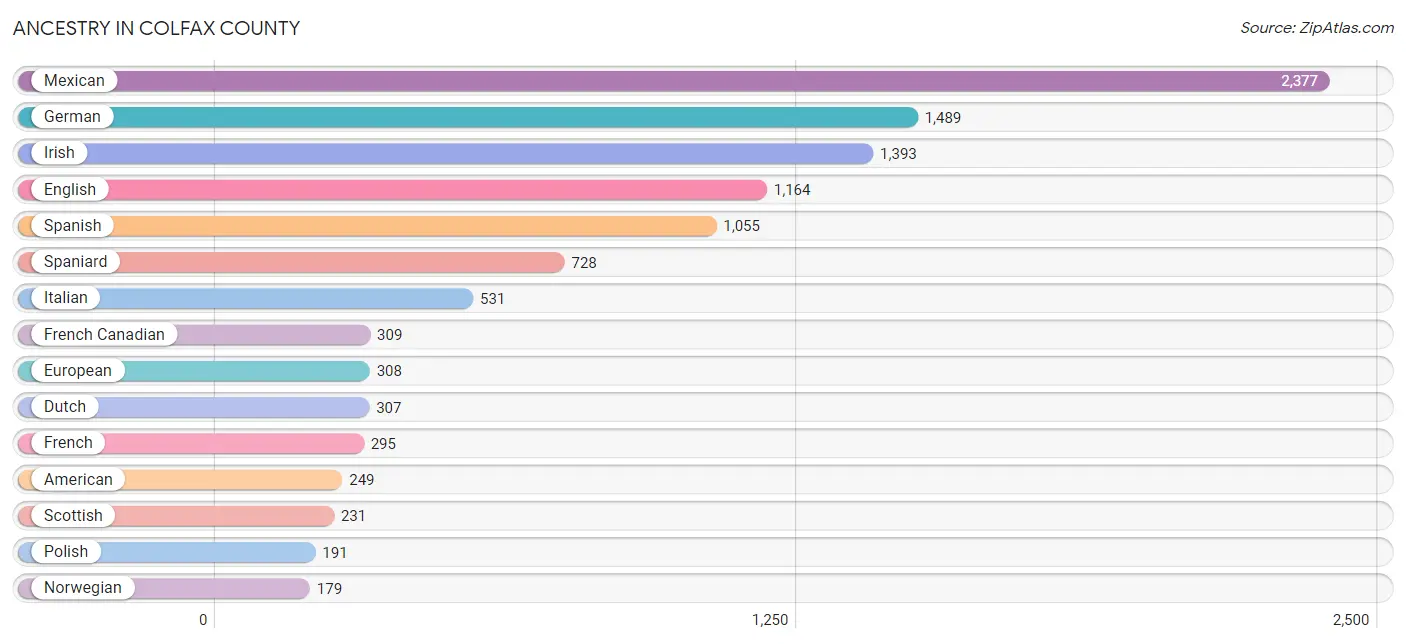
Ancestry in Colfax County
The most populous ancestries reported in Colfax County are Mexican (2,377 | 19.2%), German (1,489 | 12.0%), Irish (1,393 | 11.3%), English (1,164 | 9.4%), and Spanish (1,055 | 8.5%), together accounting for 60.5% of all Colfax County residents.
| Ancestry | # Population | % Population |
| African | 40 | 0.3% |
| American | 249 | 2.0% |
| Apache | 82 | 0.7% |
| Arab | 123 | 1.0% |
| Austrian | 32 | 0.3% |
| British | 32 | 0.3% |
| Burmese | 67 | 0.5% |
| Central American | 12 | 0.1% |
| Cherokee | 44 | 0.4% |
| Chickasaw | 49 | 0.4% |
| Chilean | 16 | 0.1% |
| Choctaw | 47 | 0.4% |
| Costa Rican | 10 | 0.1% |
| Croatian | 41 | 0.3% |
| Cuban | 30 | 0.2% |
| Czech | 63 | 0.5% |
| Danish | 28 | 0.2% |
| Dutch | 307 | 2.5% |
| Dutch West Indian | 14 | 0.1% |
| Eastern European | 9 | 0.1% |
| English | 1,164 | 9.4% |
| European | 308 | 2.5% |
| Finnish | 5 | 0.0% |
| French | 295 | 2.4% |
| French Canadian | 309 | 2.5% |
| German | 1,489 | 12.0% |
| Greek | 72 | 0.6% |
| Irish | 1,393 | 11.3% |
| Italian | 531 | 4.3% |
| Lebanese | 64 | 0.5% |
| Lithuanian | 2 | 0.0% |
| Mexican | 2,377 | 19.2% |
| Mexican American Indian | 7 | 0.1% |
| Native Hawaiian | 6 | 0.1% |
| Navajo | 163 | 1.3% |
| Northern European | 4 | 0.0% |
| Norwegian | 179 | 1.5% |
| Pakistani | 6 | 0.1% |
| Palestinian | 10 | 0.1% |
| Pennsylvania German | 5 | 0.0% |
| Peruvian | 73 | 0.6% |
| Polish | 191 | 1.5% |
| Portuguese | 13 | 0.1% |
| Potawatomi | 1 | 0.0% |
| Pueblo | 36 | 0.3% |
| Puerto Rican | 57 | 0.5% |
| Russian | 56 | 0.4% |
| Salvadoran | 2 | 0.0% |
| Scandinavian | 36 | 0.3% |
| Scotch-Irish | 172 | 1.4% |
| Scottish | 231 | 1.9% |
| Sioux | 12 | 0.1% |
| Slavic | 18 | 0.2% |
| South American | 89 | 0.7% |
| South American Indian | 73 | 0.6% |
| Spaniard | 728 | 5.9% |
| Spanish | 1,055 | 8.5% |
| Spanish American | 95 | 0.8% |
| Subsaharan African | 43 | 0.4% |
| Swedish | 109 | 0.9% |
| Thai | 70 | 0.6% |
| Welsh | 77 | 0.6% |
| Yugoslavian | 30 | 0.2% | View All 63 Rows |
Immigrants in Colfax County
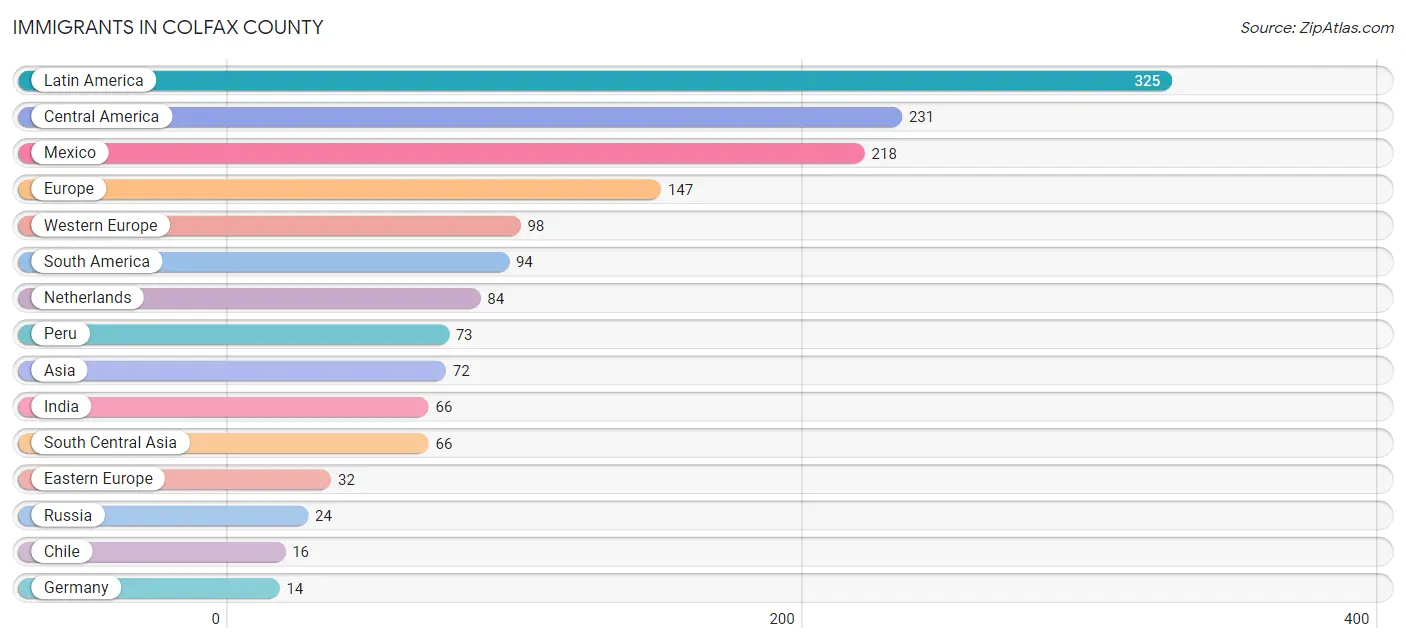
The most numerous immigrant groups reported in Colfax County came from Latin America (325 | 2.6%), Central America (231 | 1.9%), Mexico (218 | 1.8%), Europe (147 | 1.2%), and Western Europe (98 | 0.8%), together accounting for 8.2% of all Colfax County residents.
| Immigration Origin | # Population | % Population |
| Africa | 1 | 0.0% |
| Asia | 72 | 0.6% |
| Canada | 4 | 0.0% |
| Central America | 231 | 1.9% |
| Chile | 16 | 0.1% |
| Eastern Africa | 1 | 0.0% |
| Eastern Europe | 32 | 0.3% |
| Ecuador | 5 | 0.0% |
| El Salvador | 2 | 0.0% |
| Europe | 147 | 1.2% |
| Germany | 14 | 0.1% |
| Guatemala | 11 | 0.1% |
| India | 66 | 0.5% |
| Italy | 6 | 0.1% |
| Latin America | 325 | 2.6% |
| Mexico | 218 | 1.8% |
| Netherlands | 84 | 0.7% |
| Northern Europe | 11 | 0.1% |
| Peru | 73 | 0.6% |
| Poland | 8 | 0.1% |
| Russia | 24 | 0.2% |
| South America | 94 | 0.8% |
| South Central Asia | 66 | 0.5% |
| South Eastern Asia | 6 | 0.1% |
| Southern Europe | 6 | 0.1% |
| Thailand | 6 | 0.1% |
| Western Europe | 98 | 0.8% | View All 27 Rows |
Sex and Age in Colfax County
Sex and Age in Colfax County
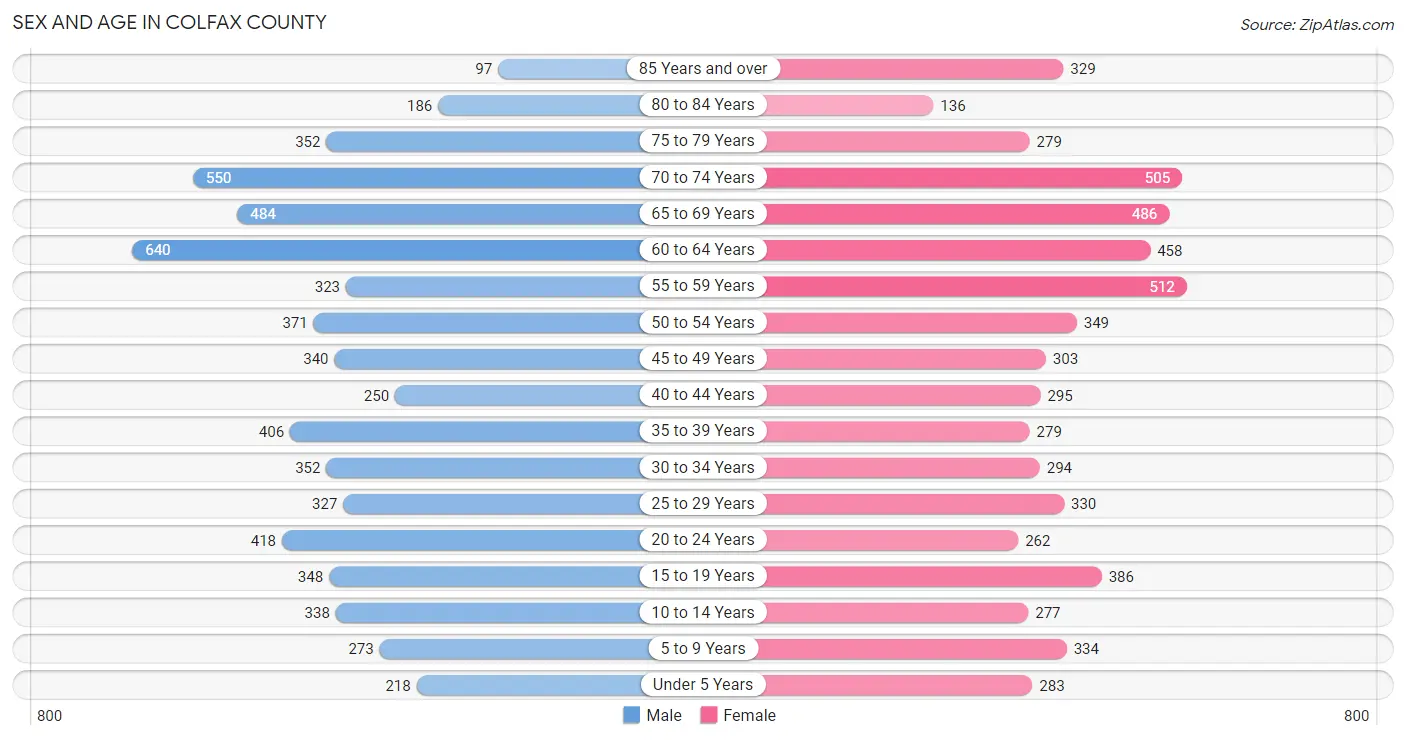
The most populous age groups in Colfax County are 60 to 64 Years (640 | 10.2%) for men and 55 to 59 Years (512 | 8.4%) for women.
| Age Bracket | Male | Female |
| Under 5 Years | 218 (3.5%) | 283 (4.6%) |
| 5 to 9 Years | 273 (4.3%) | 334 (5.5%) |
| 10 to 14 Years | 338 (5.4%) | 277 (4.5%) |
| 15 to 19 Years | 348 (5.6%) | 386 (6.3%) |
| 20 to 24 Years | 418 (6.7%) | 262 (4.3%) |
| 25 to 29 Years | 327 (5.2%) | 330 (5.4%) |
| 30 to 34 Years | 352 (5.6%) | 294 (4.8%) |
| 35 to 39 Years | 406 (6.5%) | 279 (4.6%) |
| 40 to 44 Years | 250 (4.0%) | 295 (4.8%) |
| 45 to 49 Years | 340 (5.4%) | 303 (5.0%) |
| 50 to 54 Years | 371 (5.9%) | 349 (5.7%) |
| 55 to 59 Years | 323 (5.1%) | 512 (8.4%) |
| 60 to 64 Years | 640 (10.2%) | 458 (7.5%) |
| 65 to 69 Years | 484 (7.7%) | 486 (8.0%) |
| 70 to 74 Years | 550 (8.8%) | 505 (8.3%) |
| 75 to 79 Years | 352 (5.6%) | 279 (4.6%) |
| 80 to 84 Years | 186 (3.0%) | 136 (2.2%) |
| 85 Years and over | 97 (1.5%) | 329 (5.4%) |
| Total | 6,273 (100.0%) | 6,097 (100.0%) |
Families and Households in Colfax County
Median Family Size in Colfax County
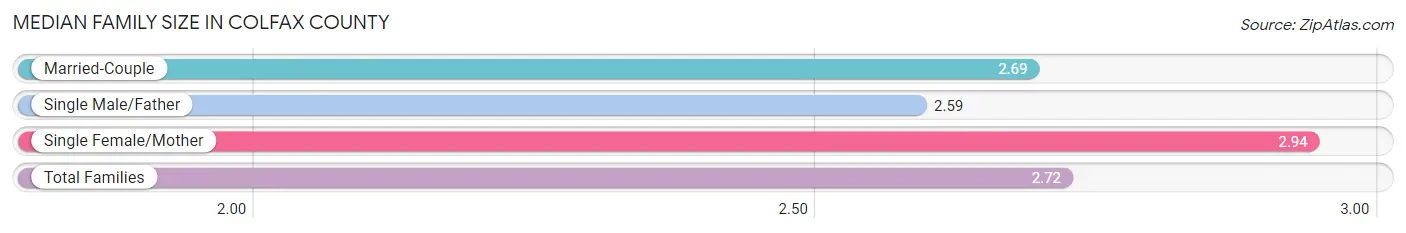
The median family size in Colfax County is 2.72 persons per family, with single female/mother families (549 | 17.1%) accounting for the largest median family size of 2.94 persons per family. On the other hand, single male/father families (381 | 11.9%) represent the smallest median family size with 2.59 persons per family.
| Family Type | # Families | Family Size |
| Married-Couple | 2,274 (71.0%) | 2.69 |
| Single Male/Father | 381 (11.9%) | 2.59 |
| Single Female/Mother | 549 (17.1%) | 2.94 |
| Total Families | 3,204 (100.0%) | 2.72 |
Median Household Size in Colfax County
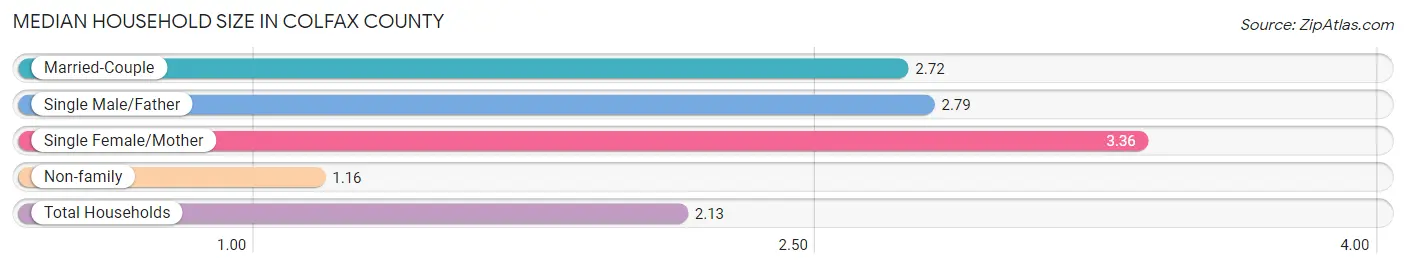
The median household size in Colfax County is 2.13 persons per household, with single female/mother households (549 | 9.9%) accounting for the largest median household size of 3.36 persons per household. non-family households (2,345 | 42.3%) represent the smallest median household size with 1.16 persons per household.
| Household Type | # Households | Household Size |
| Married-Couple | 2,274 (41.0%) | 2.72 |
| Single Male/Father | 381 (6.9%) | 2.79 |
| Single Female/Mother | 549 (9.9%) | 3.36 |
| Non-family | 2,345 (42.3%) | 1.16 |
| Total Households | 5,549 (100.0%) | 2.13 |
Household Size by Marriage Status in Colfax County
Out of a total of 5,549 households in Colfax County, 3,204 (57.7%) are family households, while 2,345 (42.3%) are nonfamily households. The most numerous type of family households are 2-person households, comprising 1,856, and the most common type of nonfamily households are 1-person households, comprising 2,028.
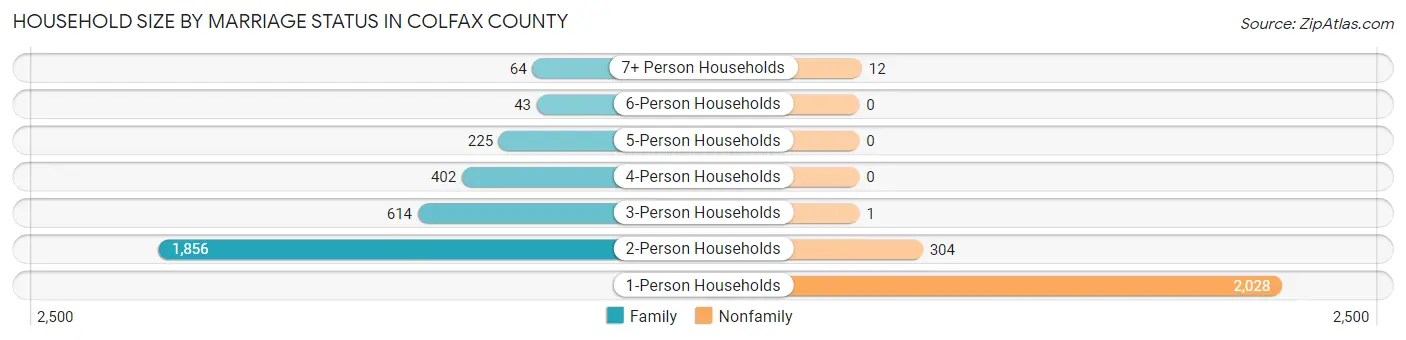
| Household Size | Family Households | Nonfamily Households |
| 1-Person Households | - | 2,028 (36.5%) |
| 2-Person Households | 1,856 (33.5%) | 304 (5.5%) |
| 3-Person Households | 614 (11.1%) | 1 (0.0%) |
| 4-Person Households | 402 (7.2%) | 0 (0.0%) |
| 5-Person Households | 225 (4.1%) | 0 (0.0%) |
| 6-Person Households | 43 (0.8%) | 0 (0.0%) |
| 7+ Person Households | 64 (1.1%) | 12 (0.2%) |
| Total | 3,204 (57.7%) | 2,345 (42.3%) |
Female Fertility in Colfax County
Fertility by Age in Colfax County
Average fertility rate in Colfax County is 48.0 births per 1,000 women. Women in the age bracket of 20 to 34 years have the highest fertility rate with 89.0 births per 1,000 women. Women in the age bracket of 20 to 34 years acount for 75.2% of all women with births.
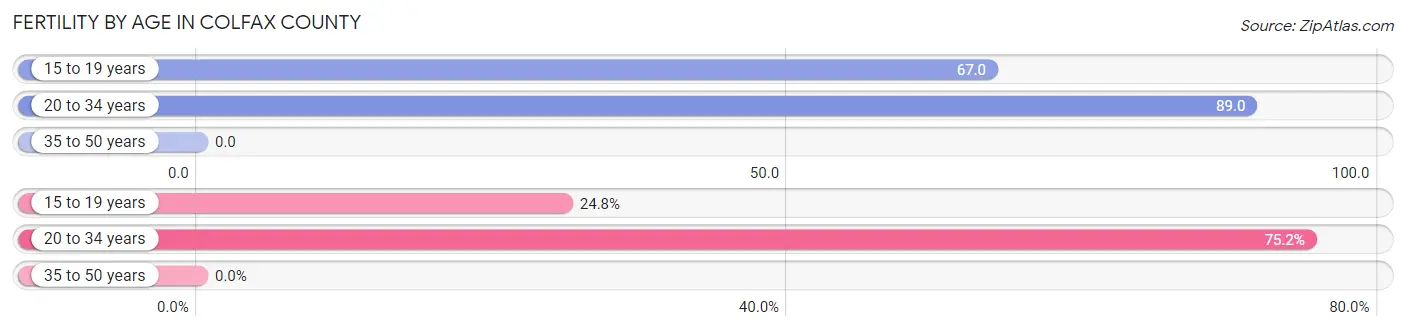
| Age Bracket | Women with Births | Births / 1,000 Women |
| 15 to 19 years | 26 (24.8%) | 67.0 |
| 20 to 34 years | 79 (75.2%) | 89.0 |
| 35 to 50 years | 0 (0.0%) | 0.0 |
| Total | 105 (100.0%) | 48.0 |
Fertility by Age by Marriage Status in Colfax County
32.4% of women with births (105) in Colfax County are married. The highest percentage of unmarried women with births falls into 15 to 19 years age bracket with 100.0% of them unmarried at the time of birth, while the lowest percentage of unmarried women with births belong to 20 to 34 years age bracket with 57.0% of them unmarried.
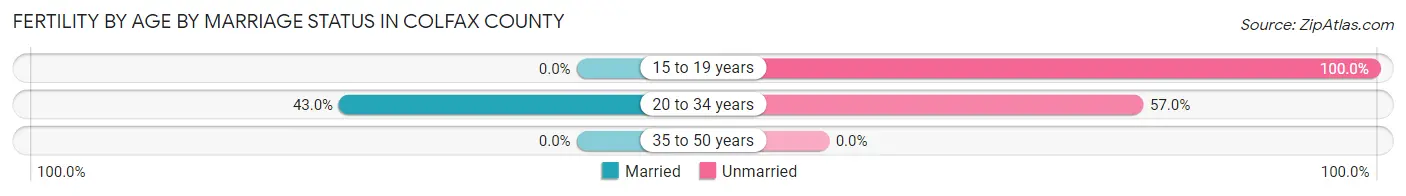
| Age Bracket | Married | Unmarried |
| 15 to 19 years | 0 (0.0%) | 26 (100.0%) |
| 20 to 34 years | 34 (43.0%) | 45 (57.0%) |
| 35 to 50 years | 0 (0.0%) | 0 (0.0%) |
| Total | 34 (32.4%) | 71 (67.6%) |
Fertility by Education in Colfax County
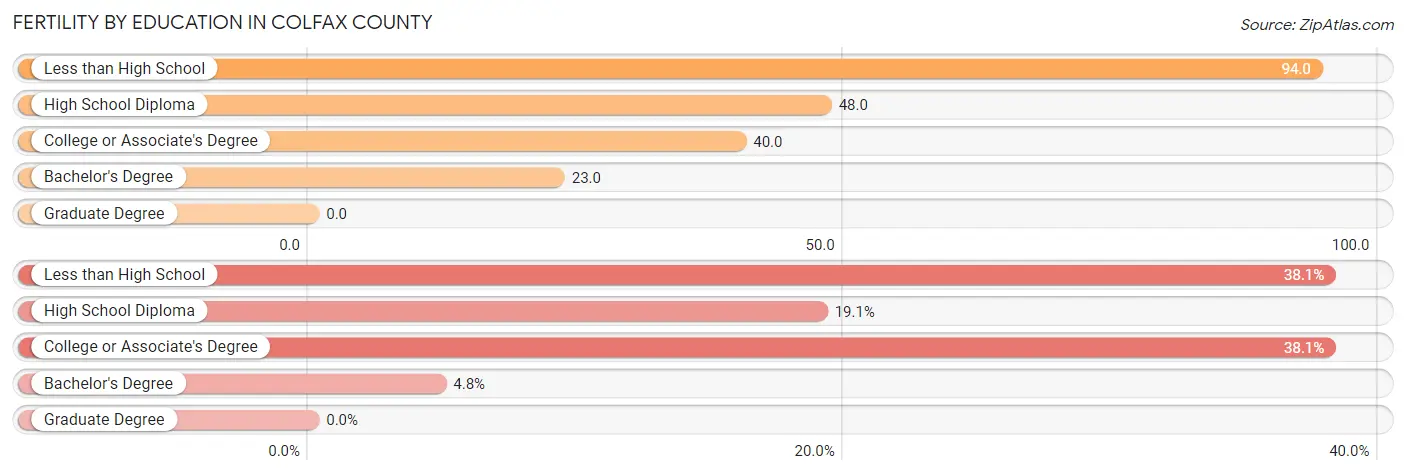
| Educational Attainment | Women with Births | Births / 1,000 Women |
| Less than High School | 40 (38.1%) | 94.0 |
| High School Diploma | 20 (19.1%) | 48.0 |
| College or Associate's Degree | 40 (38.1%) | 40.0 |
| Bachelor's Degree | 5 (4.8%) | 23.0 |
| Graduate Degree | 0 (0.0%) | 0.0 |
| Total | 105 (100.0%) | 48.0 |
Fertility by Education by Marriage Status in Colfax County
67.6% of women with births in Colfax County are unmarried. Women with the educational attainment of college or associate's degree are most likely to be married with 65.0% of them married at childbirth, while women with the educational attainment of high school diploma are least likely to be married with 100.0% of them unmarried at childbirth.
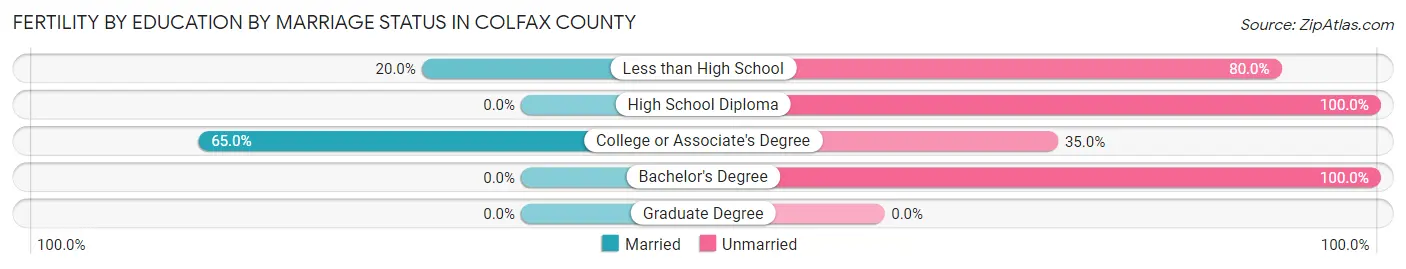
| Educational Attainment | Married | Unmarried |
| Less than High School | 8 (20.0%) | 32 (80.0%) |
| High School Diploma | 0 (0.0%) | 20 (100.0%) |
| College or Associate's Degree | 26 (65.0%) | 14 (35.0%) |
| Bachelor's Degree | 0 (0.0%) | 5 (100.0%) |
| Graduate Degree | 0 (0.0%) | 0 (0.0%) |
| Total | 34 (32.4%) | 71 (67.6%) |
Employment Characteristics in Colfax County
Employment by Class of Employer in Colfax County
Among the 4,949 employed individuals in Colfax County, private company employees (2,680 | 54.1%), state government employees (571 | 11.5%), and not-for-profit organizations (503 | 10.2%) make up the most common classes of employment.
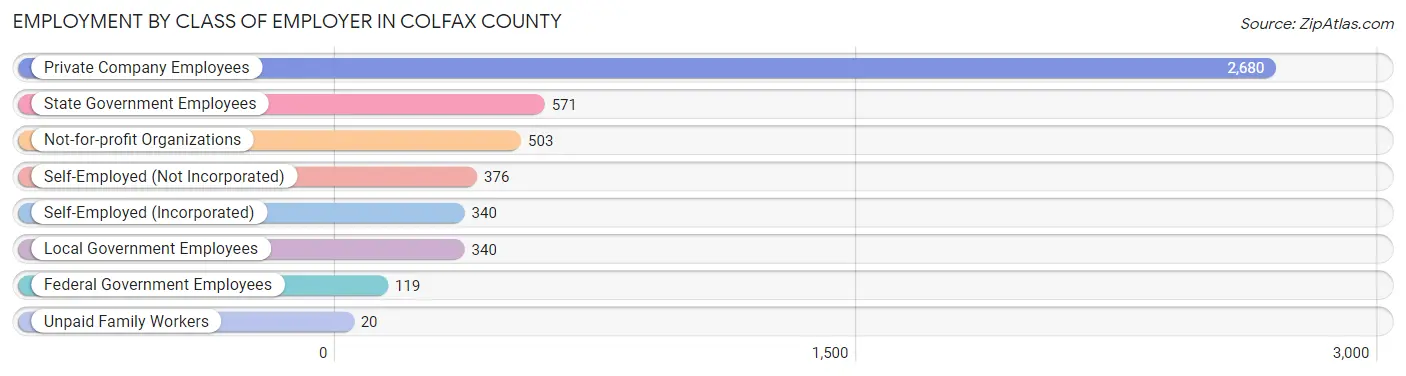
| Employer Class | # Employees | % Employees |
| Private Company Employees | 2,680 | 54.1% |
| Self-Employed (Incorporated) | 340 | 6.9% |
| Self-Employed (Not Incorporated) | 376 | 7.6% |
| Not-for-profit Organizations | 503 | 10.2% |
| Local Government Employees | 340 | 6.9% |
| State Government Employees | 571 | 11.5% |
| Federal Government Employees | 119 | 2.4% |
| Unpaid Family Workers | 20 | 0.4% |
| Total | 4,949 | 100.0% |
Employment Status by Age in Colfax County
According to the labor force statistics for Colfax County, out of the total population over 16 years of age (10,559), 50.6% or 5,343 individuals are in the labor force, with 3.2% or 171 of them unemployed. The age group with the highest labor force participation rate is 25 to 29 years, with 82.5% or 542 individuals in the labor force. Within the labor force, the 55 to 59 years age range has the highest percentage of unemployed individuals, with 9.4% or 54 of them being unemployed.
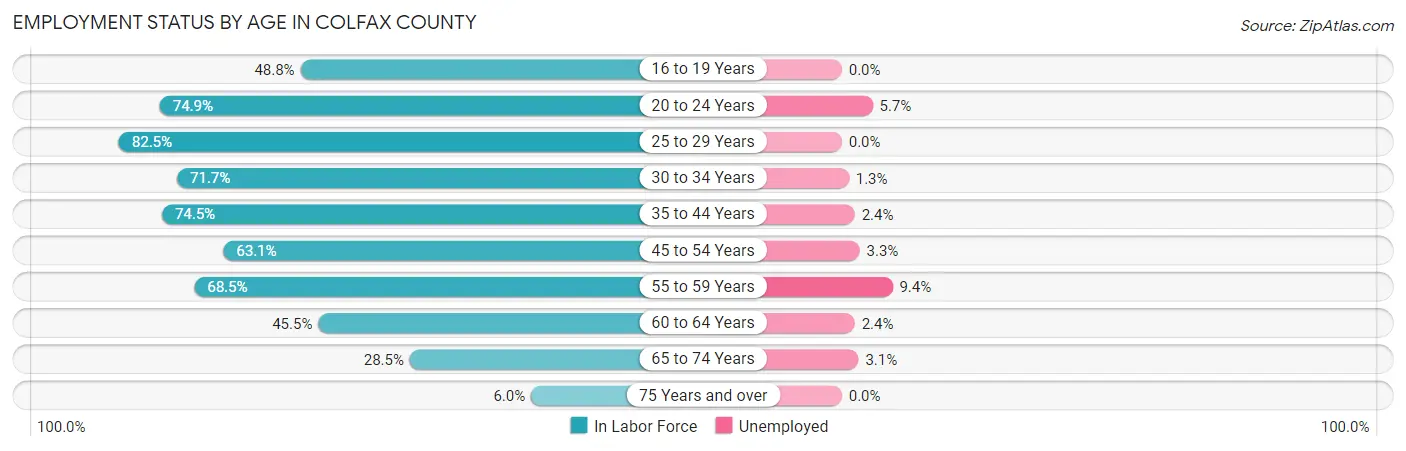
| Age Bracket | In Labor Force | Unemployed |
| 16 to 19 Years | 315 (48.8%) | 0 (0.0%) |
| 20 to 24 Years | 509 (74.9%) | 29 (5.7%) |
| 25 to 29 Years | 542 (82.5%) | 0 (0.0%) |
| 30 to 34 Years | 463 (71.7%) | 6 (1.3%) |
| 35 to 44 Years | 916 (74.5%) | 22 (2.4%) |
| 45 to 54 Years | 860 (63.1%) | 28 (3.3%) |
| 55 to 59 Years | 572 (68.5%) | 54 (9.4%) |
| 60 to 64 Years | 500 (45.5%) | 12 (2.4%) |
| 65 to 74 Years | 577 (28.5%) | 18 (3.1%) |
| 75 Years and over | 83 (6.0%) | 0 (0.0%) |
| Total | 5,343 (50.6%) | 171 (3.2%) |
Employment Status by Educational Attainment in Colfax County
According to labor force statistics for Colfax County, 66.1% of individuals (3,853) out of the total population between 25 and 64 years of age (5,829) are in the labor force, with 3.2% or 123 of them being unemployed. The group with the highest labor force participation rate are those with the educational attainment of bachelor's degree or higher, with 80.6% or 893 individuals in the labor force. Within the labor force, individuals with less than high school education have the highest percentage of unemployment, with 18.7% or 59 of them being unemployed.
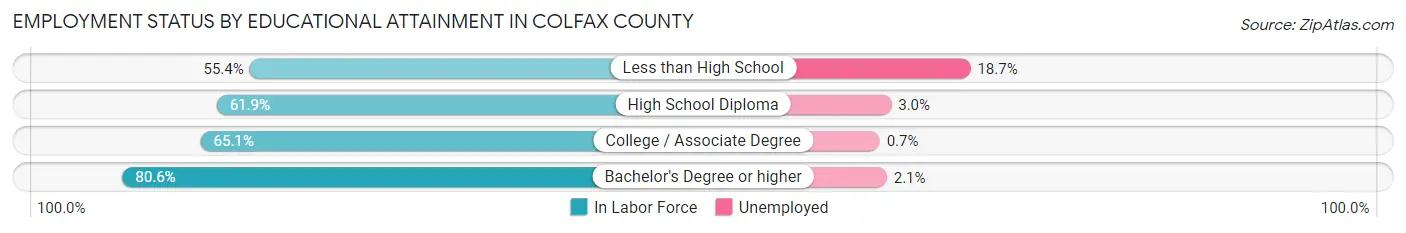
| Educational Attainment | In Labor Force | Unemployed |
| Less than High School | 315 (55.4%) | 106 (18.7%) |
| High School Diploma | 1,135 (61.9%) | 55 (3.0%) |
| College / Associate Degree | 1,510 (65.1%) | 16 (0.7%) |
| Bachelor's Degree or higher | 893 (80.6%) | 23 (2.1%) |
| Total | 3,853 (66.1%) | 187 (3.2%) |
Employment Occupations by Sex in Colfax County
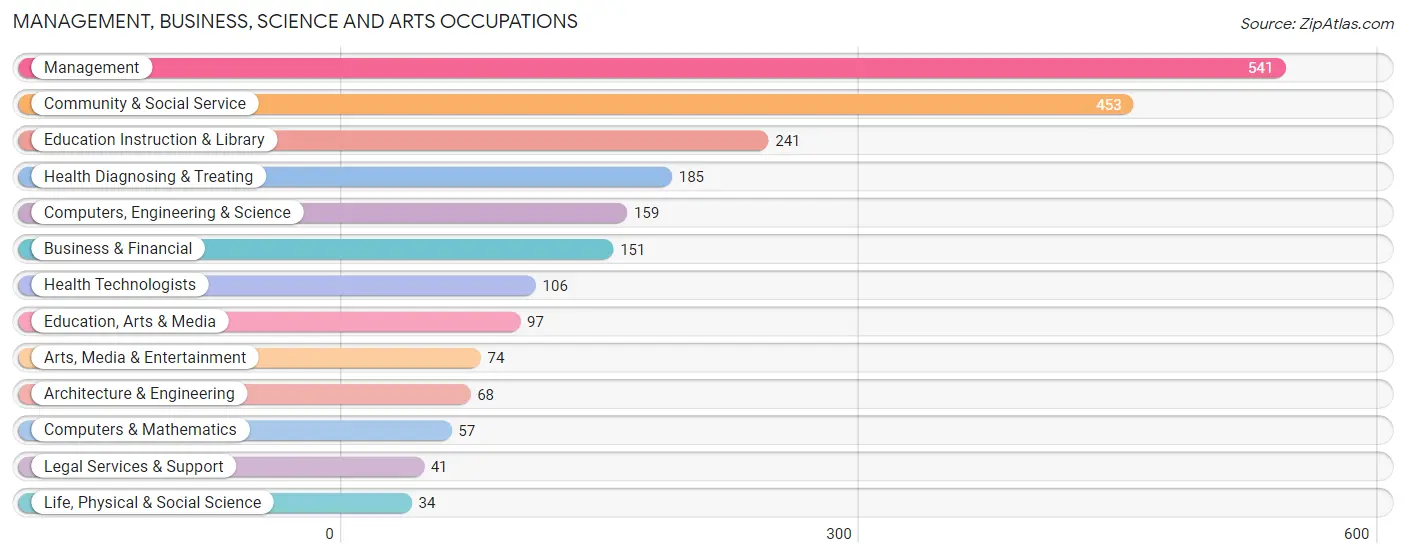
Management, Business, Science and Arts Occupations
The most common Management, Business, Science and Arts occupations in Colfax County are Management (541 | 10.5%), Community & Social Service (453 | 8.8%), Education Instruction & Library (241 | 4.7%), Health Diagnosing & Treating (185 | 3.6%), and Computers, Engineering & Science (159 | 3.1%).
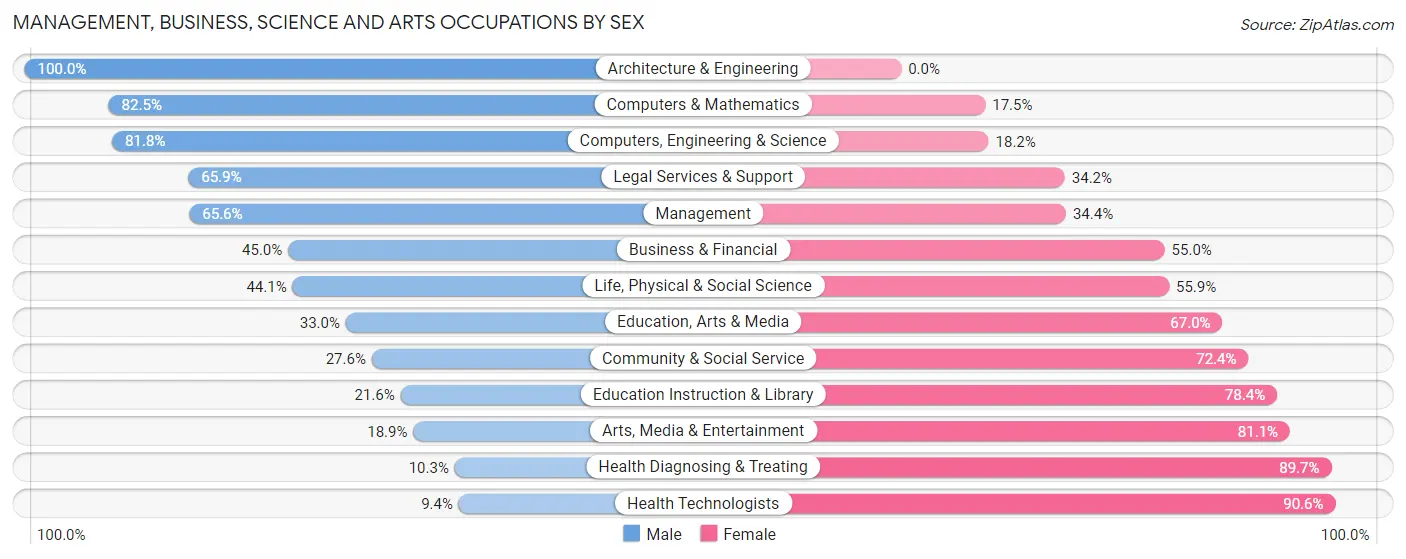
Management, Business, Science and Arts Occupations by Sex
Within the Management, Business, Science and Arts occupations in Colfax County, the most male-oriented occupations are Architecture & Engineering (100.0%), Computers & Mathematics (82.5%), and Computers, Engineering & Science (81.8%), while the most female-oriented occupations are Health Technologists (90.6%), Health Diagnosing & Treating (89.7%), and Arts, Media & Entertainment (81.1%).
| Occupation | Male | Female |
| Management | 355 (65.6%) | 186 (34.4%) |
| Business & Financial | 68 (45.0%) | 83 (55.0%) |
| Computers, Engineering & Science | 130 (81.8%) | 29 (18.2%) |
| Computers & Mathematics | 47 (82.5%) | 10 (17.5%) |
| Architecture & Engineering | 68 (100.0%) | 0 (0.0%) |
| Life, Physical & Social Science | 15 (44.1%) | 19 (55.9%) |
| Community & Social Service | 125 (27.6%) | 328 (72.4%) |
| Education, Arts & Media | 32 (33.0%) | 65 (67.0%) |
| Legal Services & Support | 27 (65.8%) | 14 (34.2%) |
| Education Instruction & Library | 52 (21.6%) | 189 (78.4%) |
| Arts, Media & Entertainment | 14 (18.9%) | 60 (81.1%) |
| Health Diagnosing & Treating | 19 (10.3%) | 166 (89.7%) |
| Health Technologists | 10 (9.4%) | 96 (90.6%) |
| Total (Category) | 697 (46.8%) | 792 (53.2%) |
| Total (Overall) | 2,669 (51.7%) | 2,491 (48.3%) |
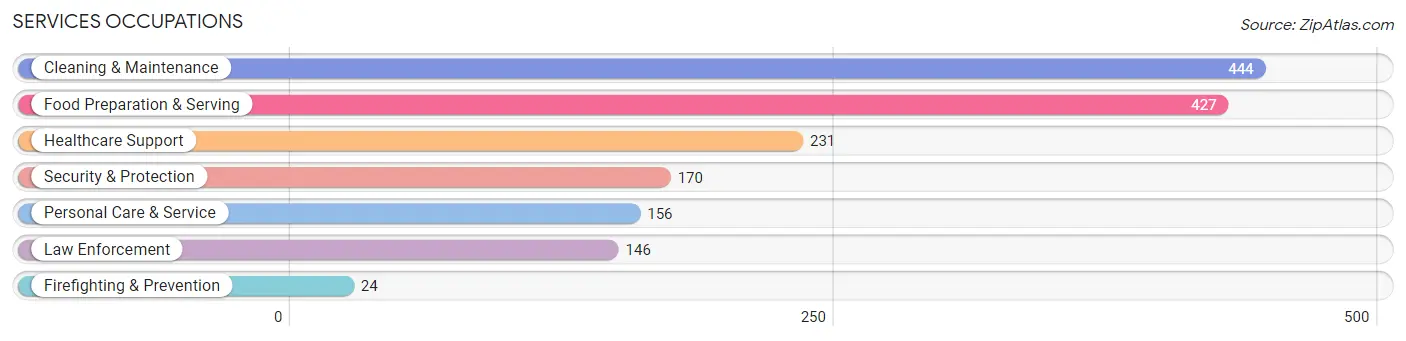
Services Occupations
The most common Services occupations in Colfax County are Cleaning & Maintenance (444 | 8.6%), Food Preparation & Serving (427 | 8.3%), Healthcare Support (231 | 4.5%), Security & Protection (170 | 3.3%), and Personal Care & Service (156 | 3.0%).
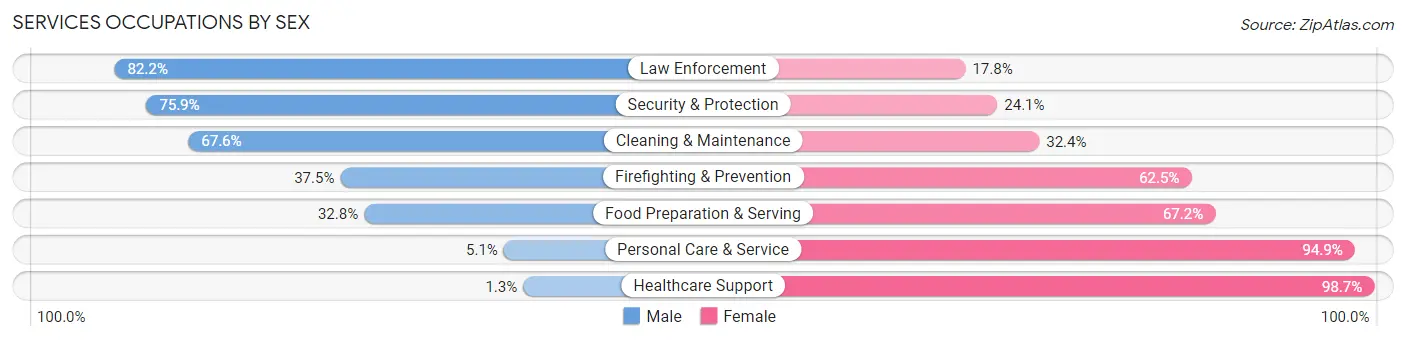
Services Occupations by Sex
Within the Services occupations in Colfax County, the most male-oriented occupations are Law Enforcement (82.2%), Security & Protection (75.9%), and Cleaning & Maintenance (67.6%), while the most female-oriented occupations are Healthcare Support (98.7%), Personal Care & Service (94.9%), and Food Preparation & Serving (67.2%).
| Occupation | Male | Female |
| Healthcare Support | 3 (1.3%) | 228 (98.7%) |
| Security & Protection | 129 (75.9%) | 41 (24.1%) |
| Firefighting & Prevention | 9 (37.5%) | 15 (62.5%) |
| Law Enforcement | 120 (82.2%) | 26 (17.8%) |
| Food Preparation & Serving | 140 (32.8%) | 287 (67.2%) |
| Cleaning & Maintenance | 300 (67.6%) | 144 (32.4%) |
| Personal Care & Service | 8 (5.1%) | 148 (94.9%) |
| Total (Category) | 580 (40.6%) | 848 (59.4%) |
| Total (Overall) | 2,669 (51.7%) | 2,491 (48.3%) |
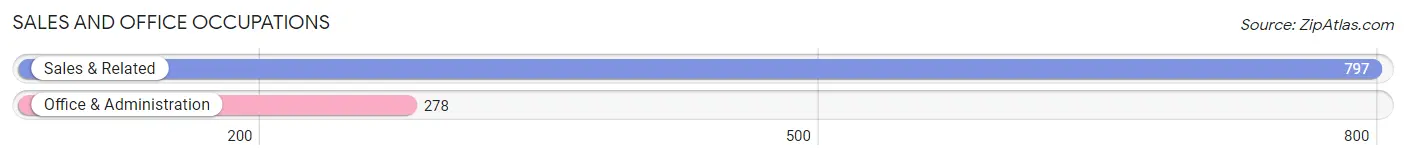
Sales and Office Occupations
The most common Sales and Office occupations in Colfax County are Sales & Related (797 | 15.4%), and Office & Administration (278 | 5.4%).
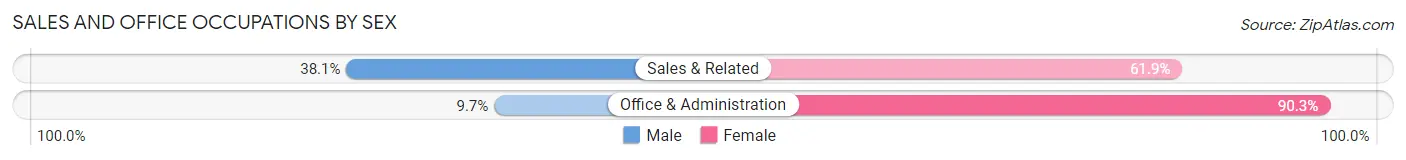
Sales and Office Occupations by Sex
| Occupation | Male | Female |
| Sales & Related | 304 (38.1%) | 493 (61.9%) |
| Office & Administration | 27 (9.7%) | 251 (90.3%) |
| Total (Category) | 331 (30.8%) | 744 (69.2%) |
| Total (Overall) | 2,669 (51.7%) | 2,491 (48.3%) |
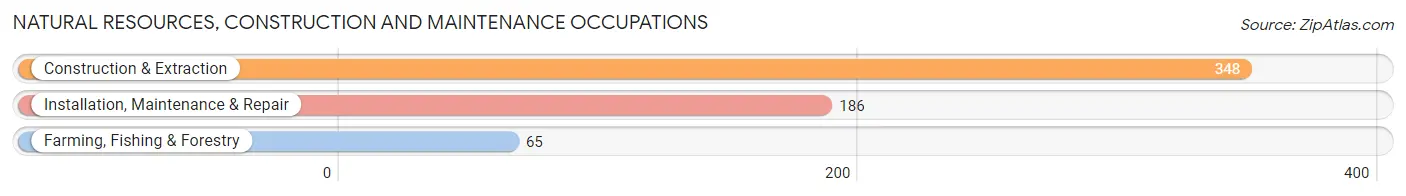
Natural Resources, Construction and Maintenance Occupations
The most common Natural Resources, Construction and Maintenance occupations in Colfax County are Construction & Extraction (348 | 6.7%), Installation, Maintenance & Repair (186 | 3.6%), and Farming, Fishing & Forestry (65 | 1.3%).
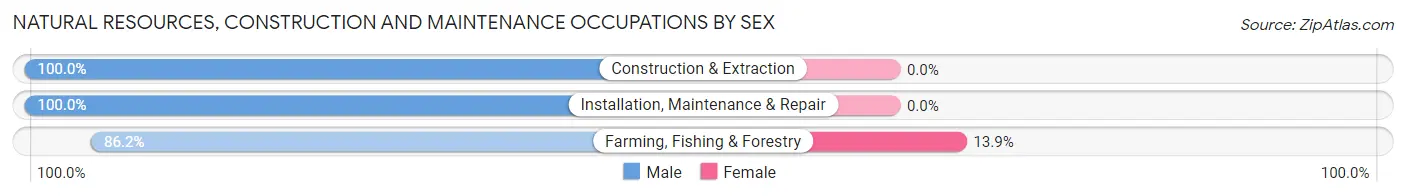
Natural Resources, Construction and Maintenance Occupations by Sex
| Occupation | Male | Female |
| Farming, Fishing & Forestry | 56 (86.2%) | 9 (13.9%) |
| Construction & Extraction | 348 (100.0%) | 0 (0.0%) |
| Installation, Maintenance & Repair | 186 (100.0%) | 0 (0.0%) |
| Total (Category) | 590 (98.5%) | 9 (1.5%) |
| Total (Overall) | 2,669 (51.7%) | 2,491 (48.3%) |
Production, Transportation and Moving Occupations
The most common Production, Transportation and Moving occupations in Colfax County are Transportation (220 | 4.3%), Production (210 | 4.1%), and Material Moving (139 | 2.7%).
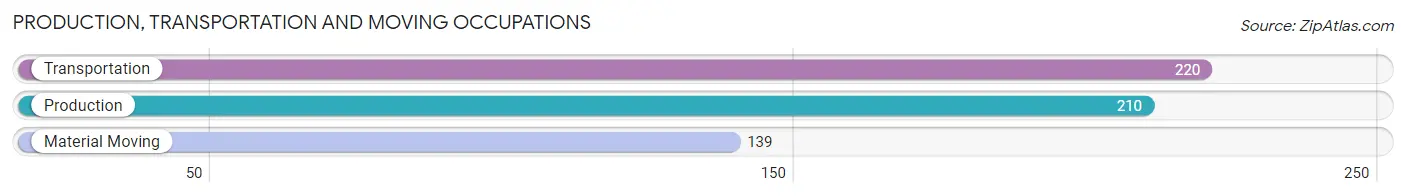
Production, Transportation and Moving Occupations by Sex
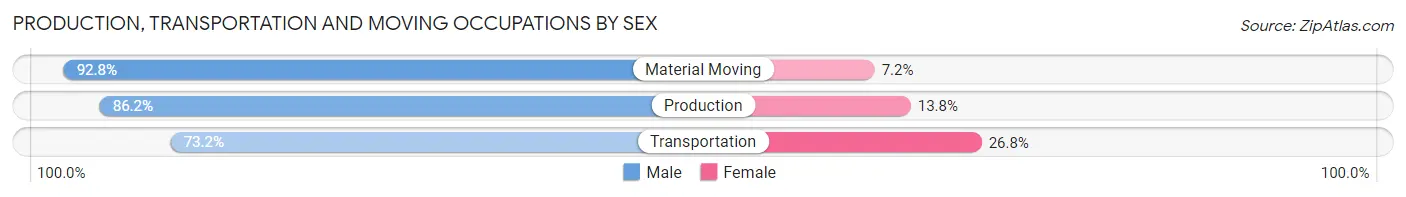
| Occupation | Male | Female |
| Production | 181 (86.2%) | 29 (13.8%) |
| Transportation | 161 (73.2%) | 59 (26.8%) |
| Material Moving | 129 (92.8%) | 10 (7.2%) |
| Total (Category) | 471 (82.8%) | 98 (17.2%) |
| Total (Overall) | 2,669 (51.7%) | 2,491 (48.3%) |
Employment Industries by Sex in Colfax County
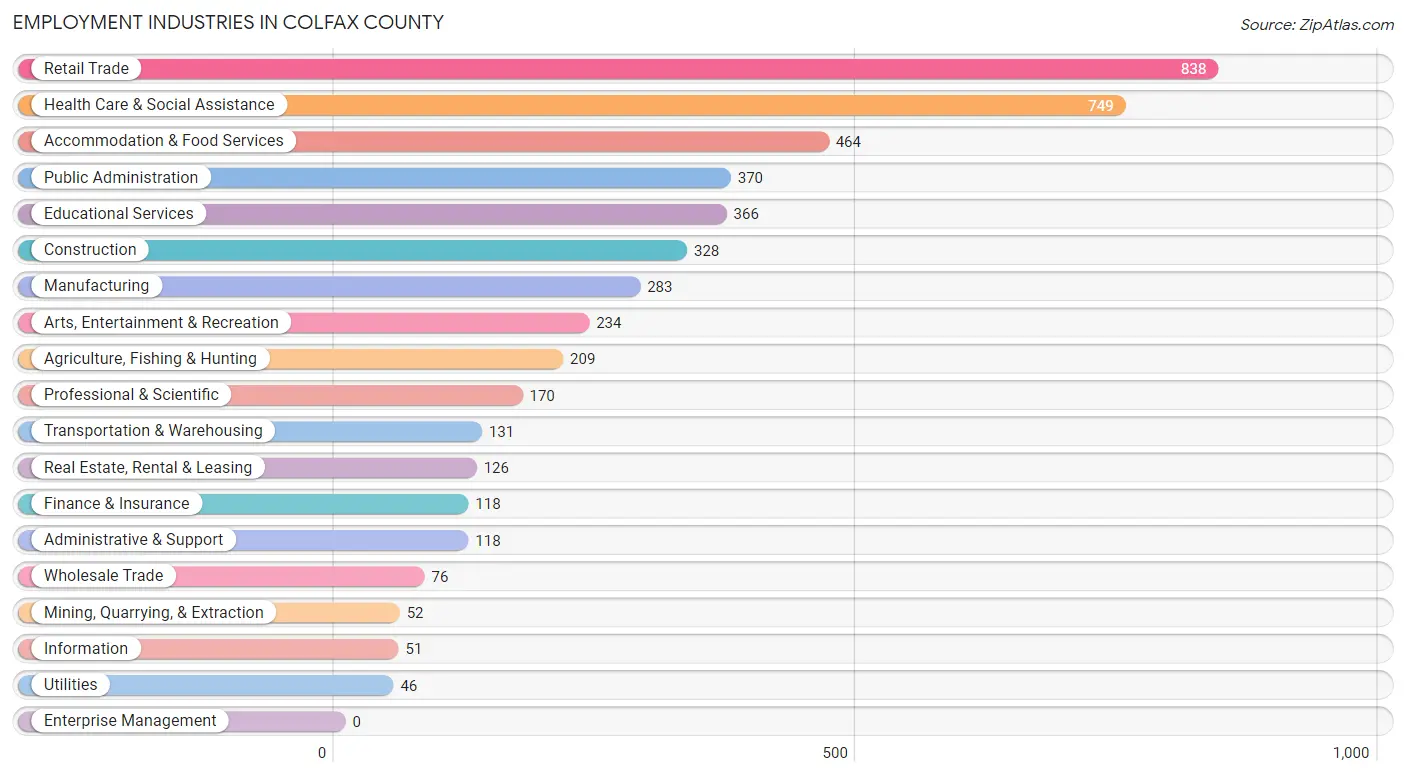
Employment Industries in Colfax County
The major employment industries in Colfax County include Retail Trade (838 | 16.2%), Health Care & Social Assistance (749 | 14.5%), Accommodation & Food Services (464 | 9.0%), Public Administration (370 | 7.2%), and Educational Services (366 | 7.1%).
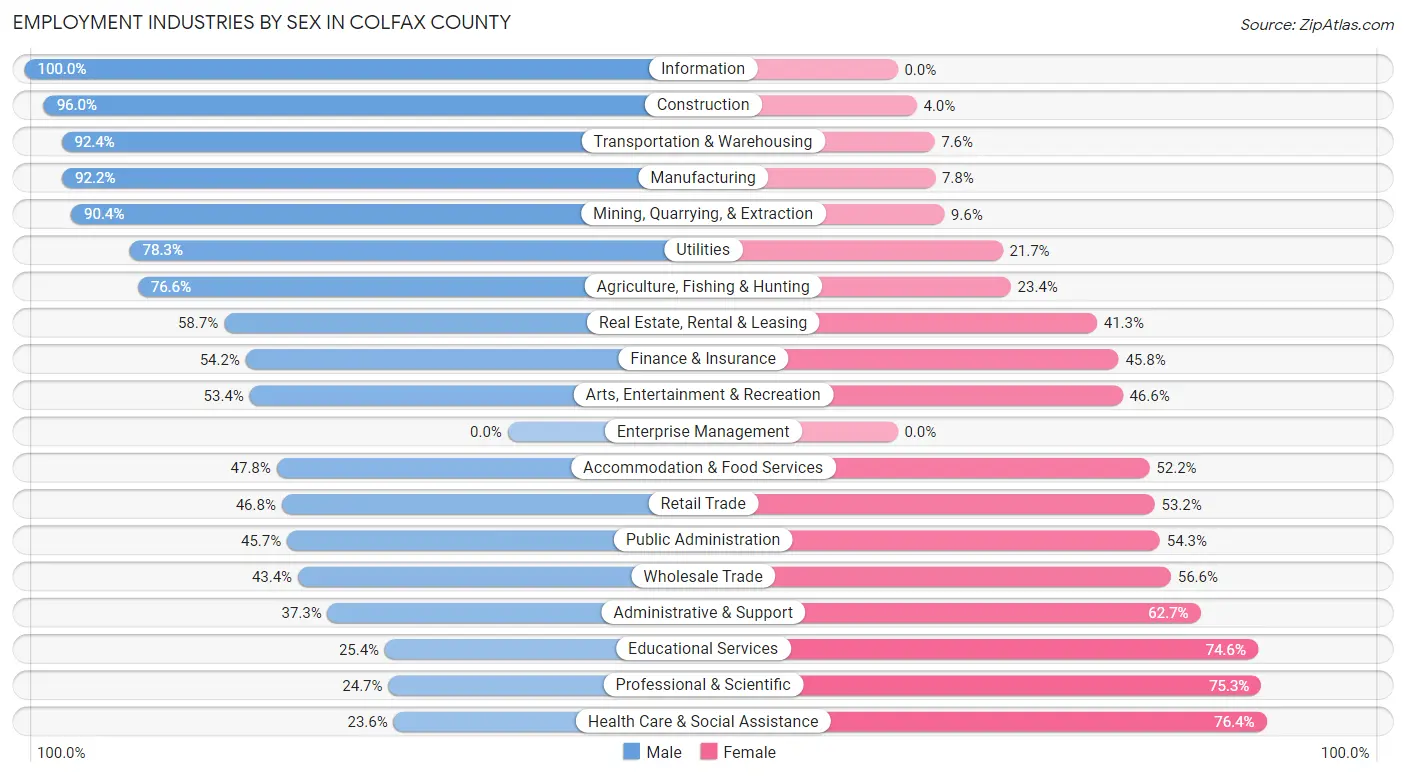
Employment Industries by Sex in Colfax County
The Colfax County industries that see more men than women are Information (100.0%), Construction (96.0%), and Transportation & Warehousing (92.4%), whereas the industries that tend to have a higher number of women are Health Care & Social Assistance (76.4%), Professional & Scientific (75.3%), and Educational Services (74.6%).
| Industry | Male | Female |
| Agriculture, Fishing & Hunting | 160 (76.6%) | 49 (23.4%) |
| Mining, Quarrying, & Extraction | 47 (90.4%) | 5 (9.6%) |
| Construction | 315 (96.0%) | 13 (4.0%) |
| Manufacturing | 261 (92.2%) | 22 (7.8%) |
| Wholesale Trade | 33 (43.4%) | 43 (56.6%) |
| Retail Trade | 392 (46.8%) | 446 (53.2%) |
| Transportation & Warehousing | 121 (92.4%) | 10 (7.6%) |
| Utilities | 36 (78.3%) | 10 (21.7%) |
| Information | 51 (100.0%) | 0 (0.0%) |
| Finance & Insurance | 64 (54.2%) | 54 (45.8%) |
| Real Estate, Rental & Leasing | 74 (58.7%) | 52 (41.3%) |
| Professional & Scientific | 42 (24.7%) | 128 (75.3%) |
| Enterprise Management | 0 (0.0%) | 0 (0.0%) |
| Administrative & Support | 44 (37.3%) | 74 (62.7%) |
| Educational Services | 93 (25.4%) | 273 (74.6%) |
| Health Care & Social Assistance | 177 (23.6%) | 572 (76.4%) |
| Arts, Entertainment & Recreation | 125 (53.4%) | 109 (46.6%) |
| Accommodation & Food Services | 222 (47.8%) | 242 (52.2%) |
| Public Administration | 169 (45.7%) | 201 (54.3%) |
| Total | 2,669 (51.7%) | 2,491 (48.3%) |
Education in Colfax County
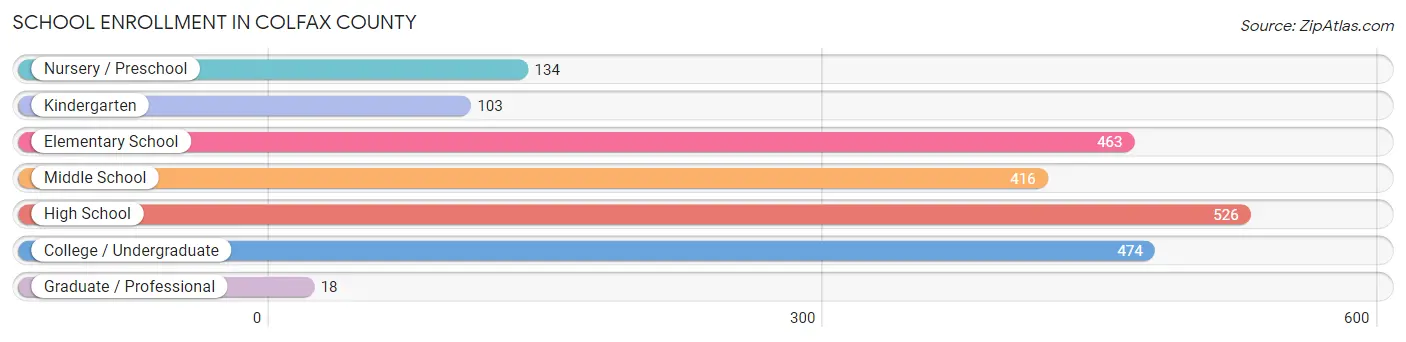
School Enrollment in Colfax County
The most common levels of schooling among the 2,134 students in Colfax County are high school (526 | 24.6%), college / undergraduate (474 | 22.2%), and elementary school (463 | 21.7%).
| School Level | # Students | % Students |
| Nursery / Preschool | 134 | 6.3% |
| Kindergarten | 103 | 4.8% |
| Elementary School | 463 | 21.7% |
| Middle School | 416 | 19.5% |
| High School | 526 | 24.6% |
| College / Undergraduate | 474 | 22.2% |
| Graduate / Professional | 18 | 0.8% |
| Total | 2,134 | 100.0% |
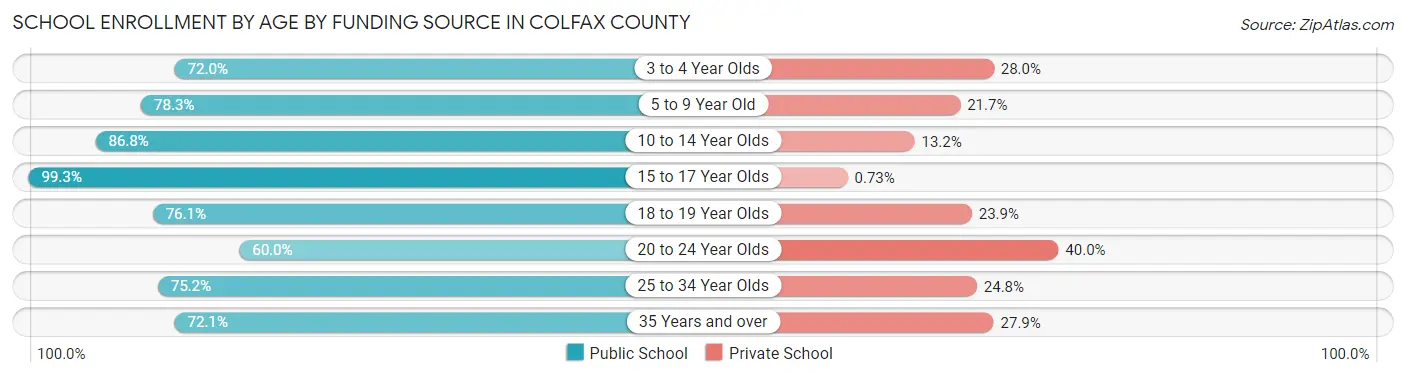
School Enrollment by Age by Funding Source in Colfax County
Out of a total of 2,134 students who are enrolled in schools in Colfax County, 380 (17.8%) attend a private institution, while the remaining 1,754 (82.2%) are enrolled in public schools. The age group of 20 to 24 year olds has the highest likelihood of being enrolled in private schools, with 62 (40.0% in the age bracket) enrolled. Conversely, the age group of 15 to 17 year olds has the lowest likelihood of being enrolled in a private school, with 407 (99.3% in the age bracket) attending a public institution.
| Age Bracket | Public School | Private School |
| 3 to 4 Year Olds | 67 (72.0%) | 26 (28.0%) |
| 5 to 9 Year Old | 422 (78.3%) | 117 (21.7%) |
| 10 to 14 Year Olds | 467 (86.8%) | 71 (13.2%) |
| 15 to 17 Year Olds | 407 (99.3%) | 3 (0.7%) |
| 18 to 19 Year Olds | 118 (76.1%) | 37 (23.9%) |
| 20 to 24 Year Olds | 93 (60.0%) | 62 (40.0%) |
| 25 to 34 Year Olds | 100 (75.2%) | 33 (24.8%) |
| 35 Years and over | 80 (72.1%) | 31 (27.9%) |
| Total | 1,754 (82.2%) | 380 (17.8%) |
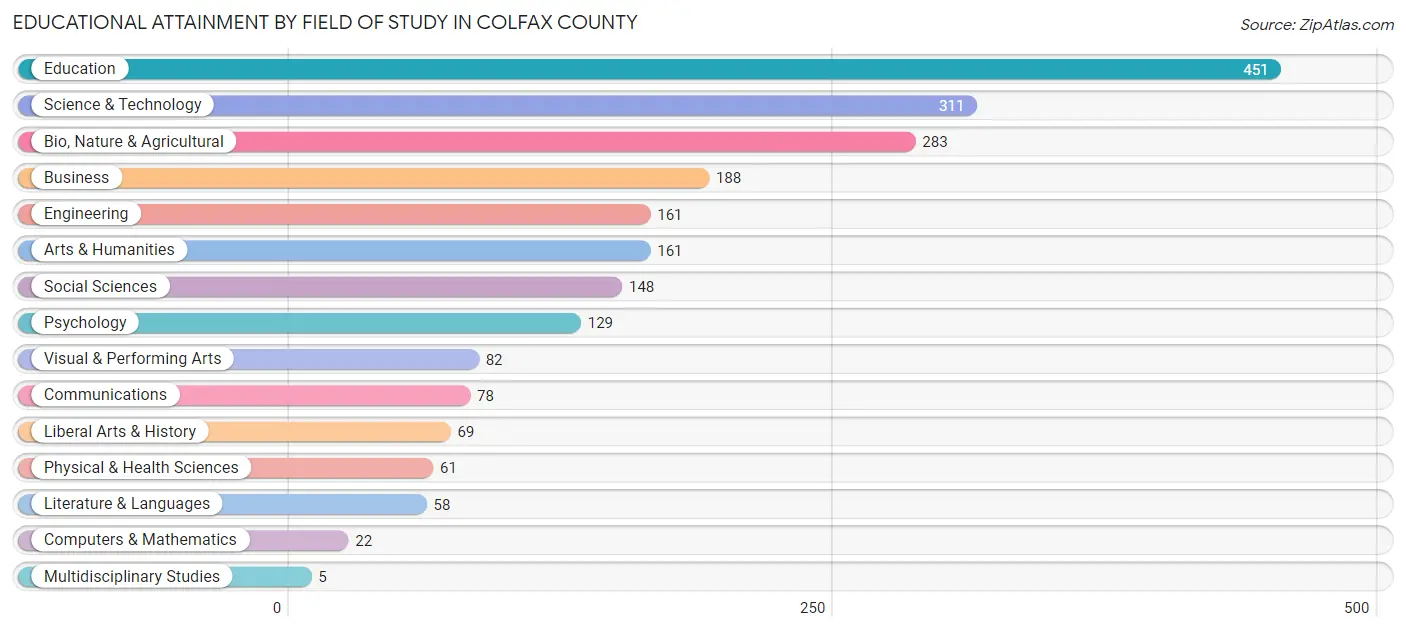
Educational Attainment by Field of Study in Colfax County
Education (451 | 20.4%), science & technology (311 | 14.1%), bio, nature & agricultural (283 | 12.8%), business (188 | 8.5%), and engineering (161 | 7.3%) are the most common fields of study among 2,207 individuals in Colfax County who have obtained a bachelor's degree or higher.
| Field of Study | # Graduates | % Graduates |
| Computers & Mathematics | 22 | 1.0% |
| Bio, Nature & Agricultural | 283 | 12.8% |
| Physical & Health Sciences | 61 | 2.8% |
| Psychology | 129 | 5.9% |
| Social Sciences | 148 | 6.7% |
| Engineering | 161 | 7.3% |
| Multidisciplinary Studies | 5 | 0.2% |
| Science & Technology | 311 | 14.1% |
| Business | 188 | 8.5% |
| Education | 451 | 20.4% |
| Literature & Languages | 58 | 2.6% |
| Liberal Arts & History | 69 | 3.1% |
| Visual & Performing Arts | 82 | 3.7% |
| Communications | 78 | 3.5% |
| Arts & Humanities | 161 | 7.3% |
| Total | 2,207 | 100.0% |
Transportation & Commute in Colfax County
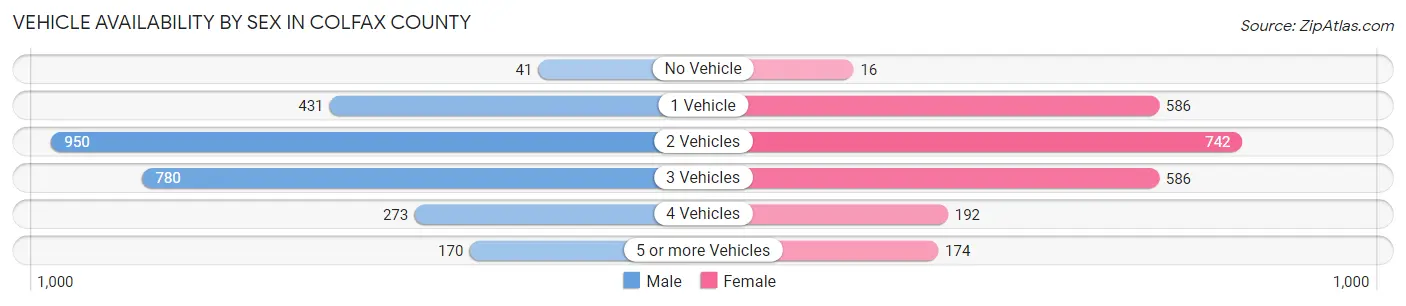
Vehicle Availability by Sex in Colfax County
The most prevalent vehicle ownership categories in Colfax County are males with 2 vehicles (950, accounting for 35.9%) and females with 2 vehicles (742, making up 41.4%).
| Vehicles Available | Male | Female |
| No Vehicle | 41 (1.5%) | 16 (0.7%) |
| 1 Vehicle | 431 (16.3%) | 586 (25.5%) |
| 2 Vehicles | 950 (35.9%) | 742 (32.3%) |
| 3 Vehicles | 780 (29.5%) | 586 (25.5%) |
| 4 Vehicles | 273 (10.3%) | 192 (8.4%) |
| 5 or more Vehicles | 170 (6.4%) | 174 (7.6%) |
| Total | 2,645 (100.0%) | 2,296 (100.0%) |
Commute Time in Colfax County
The most frequently occuring commute durations in Colfax County are 5 to 9 minutes (1,558 commuters, 35.4%), 10 to 14 minutes (845 commuters, 19.2%), and less than 5 minutes (510 commuters, 11.6%).
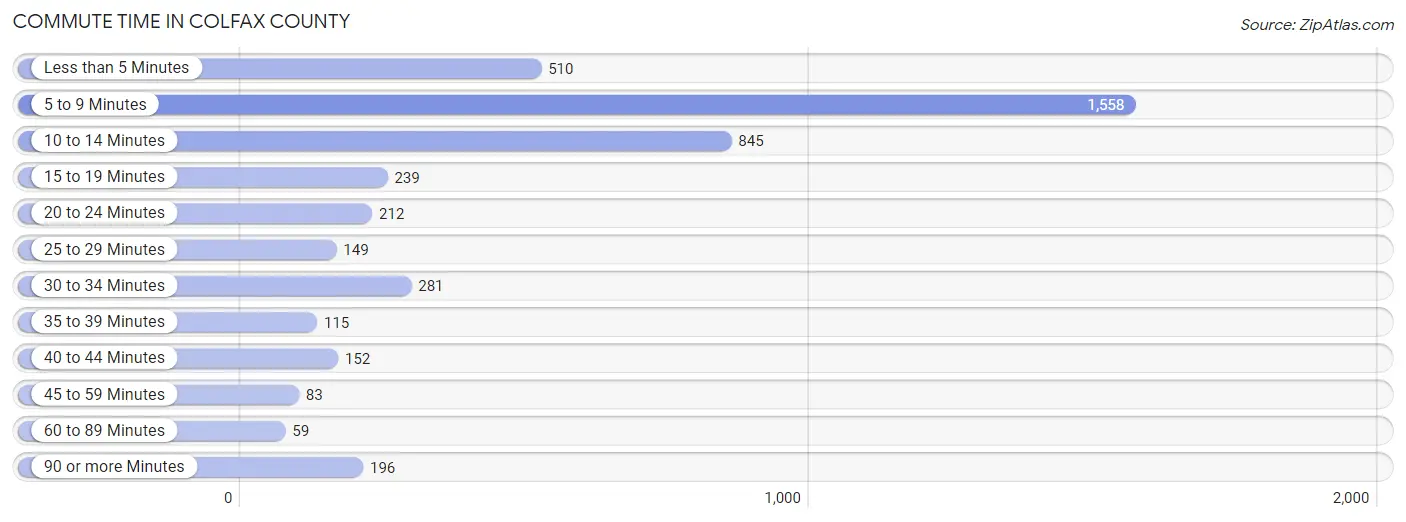
| Commute Time | # Commuters | % Commuters |
| Less than 5 Minutes | 510 | 11.6% |
| 5 to 9 Minutes | 1,558 | 35.4% |
| 10 to 14 Minutes | 845 | 19.2% |
| 15 to 19 Minutes | 239 | 5.4% |
| 20 to 24 Minutes | 212 | 4.8% |
| 25 to 29 Minutes | 149 | 3.4% |
| 30 to 34 Minutes | 281 | 6.4% |
| 35 to 39 Minutes | 115 | 2.6% |
| 40 to 44 Minutes | 152 | 3.5% |
| 45 to 59 Minutes | 83 | 1.9% |
| 60 to 89 Minutes | 59 | 1.3% |
| 90 or more Minutes | 196 | 4.5% |
Commute Time by Sex in Colfax County
The most common commute times in Colfax County are 5 to 9 minutes (643 commuters, 26.7%) for males and 5 to 9 minutes (915 commuters, 46.0%) for females.
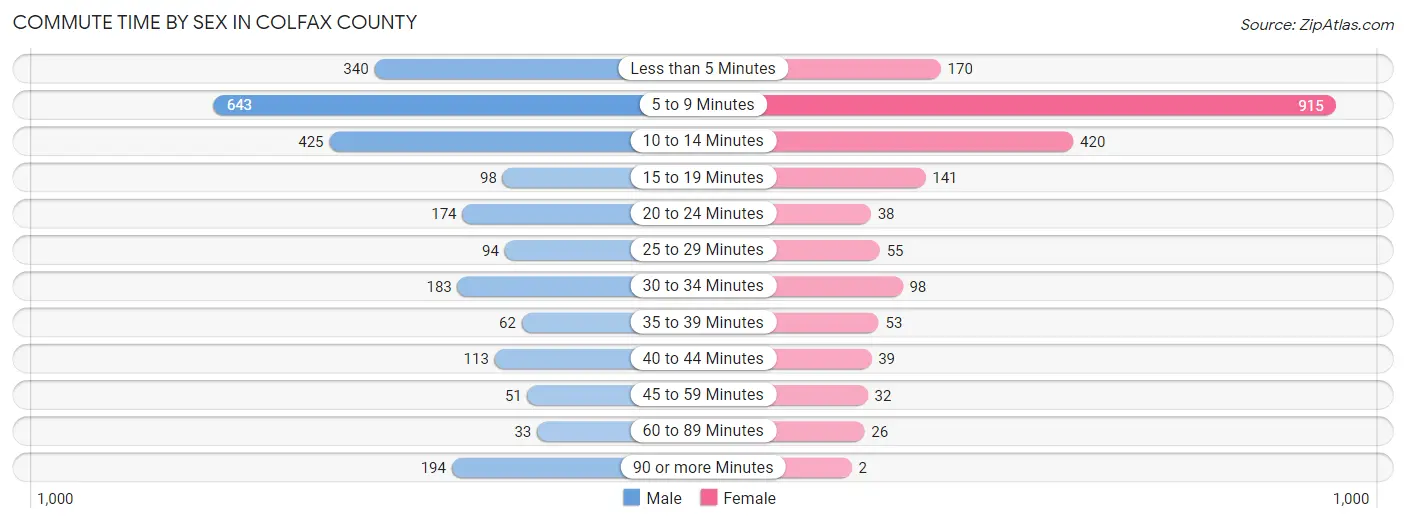
| Commute Time | Male | Female |
| Less than 5 Minutes | 340 (14.1%) | 170 (8.6%) |
| 5 to 9 Minutes | 643 (26.7%) | 915 (46.0%) |
| 10 to 14 Minutes | 425 (17.6%) | 420 (21.1%) |
| 15 to 19 Minutes | 98 (4.1%) | 141 (7.1%) |
| 20 to 24 Minutes | 174 (7.2%) | 38 (1.9%) |
| 25 to 29 Minutes | 94 (3.9%) | 55 (2.8%) |
| 30 to 34 Minutes | 183 (7.6%) | 98 (4.9%) |
| 35 to 39 Minutes | 62 (2.6%) | 53 (2.7%) |
| 40 to 44 Minutes | 113 (4.7%) | 39 (2.0%) |
| 45 to 59 Minutes | 51 (2.1%) | 32 (1.6%) |
| 60 to 89 Minutes | 33 (1.4%) | 26 (1.3%) |
| 90 or more Minutes | 194 (8.1%) | 2 (0.1%) |
Time of Departure to Work by Sex in Colfax County
The most frequent times of departure to work in Colfax County are 7:30 AM to 7:59 AM (398, 16.5%) for males and 7:30 AM to 7:59 AM (391, 19.7%) for females.
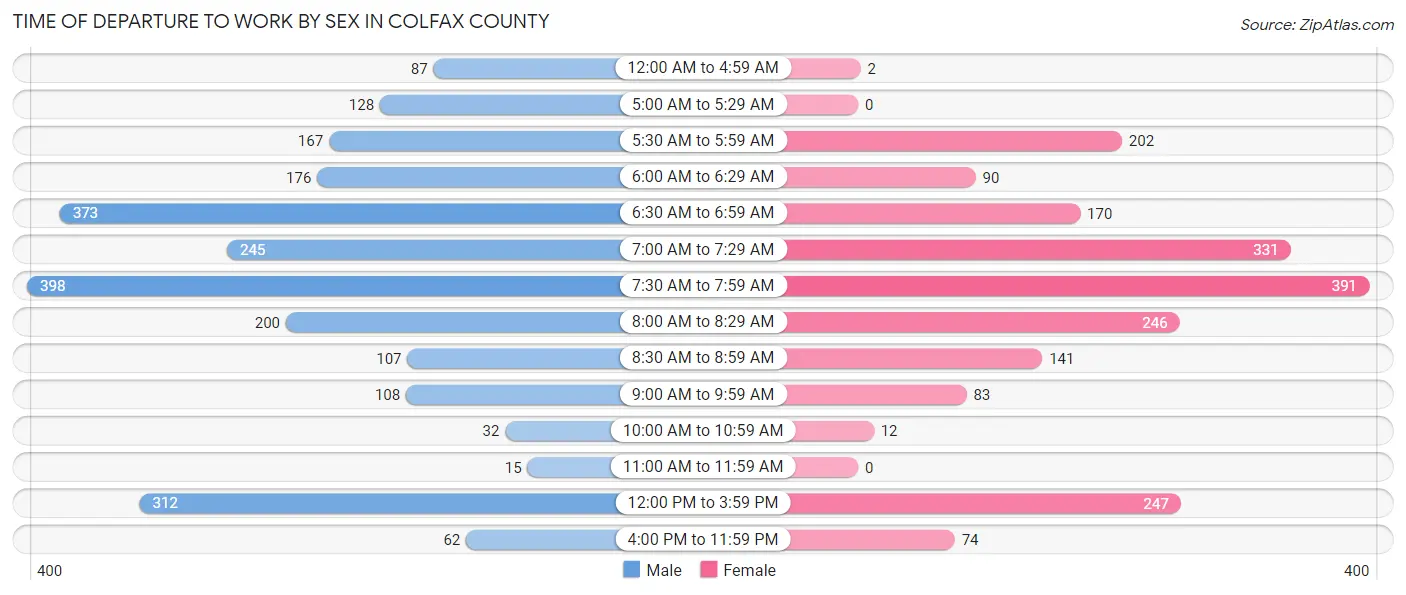
| Time of Departure | Male | Female |
| 12:00 AM to 4:59 AM | 87 (3.6%) | 2 (0.1%) |
| 5:00 AM to 5:29 AM | 128 (5.3%) | 0 (0.0%) |
| 5:30 AM to 5:59 AM | 167 (6.9%) | 202 (10.2%) |
| 6:00 AM to 6:29 AM | 176 (7.3%) | 90 (4.5%) |
| 6:30 AM to 6:59 AM | 373 (15.5%) | 170 (8.6%) |
| 7:00 AM to 7:29 AM | 245 (10.2%) | 331 (16.6%) |
| 7:30 AM to 7:59 AM | 398 (16.5%) | 391 (19.7%) |
| 8:00 AM to 8:29 AM | 200 (8.3%) | 246 (12.4%) |
| 8:30 AM to 8:59 AM | 107 (4.4%) | 141 (7.1%) |
| 9:00 AM to 9:59 AM | 108 (4.5%) | 83 (4.2%) |
| 10:00 AM to 10:59 AM | 32 (1.3%) | 12 (0.6%) |
| 11:00 AM to 11:59 AM | 15 (0.6%) | 0 (0.0%) |
| 12:00 PM to 3:59 PM | 312 (13.0%) | 247 (12.4%) |
| 4:00 PM to 11:59 PM | 62 (2.6%) | 74 (3.7%) |
| Total | 2,410 (100.0%) | 1,989 (100.0%) |
Housing Occupancy in Colfax County
Occupancy by Ownership in Colfax County
Of the total 5,549 dwellings in Colfax County, owner-occupied units account for 3,979 (71.7%), while renter-occupied units make up 1,570 (28.3%).
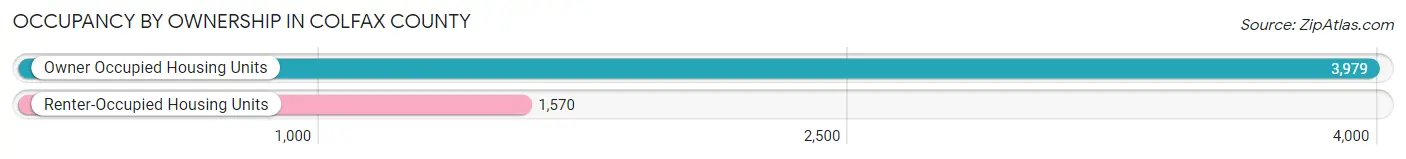
| Occupancy | # Housing Units | % Housing Units |
| Owner Occupied Housing Units | 3,979 | 71.7% |
| Renter-Occupied Housing Units | 1,570 | 28.3% |
| Total Occupied Housing Units | 5,549 | 100.0% |
Occupancy by Household Size in Colfax County
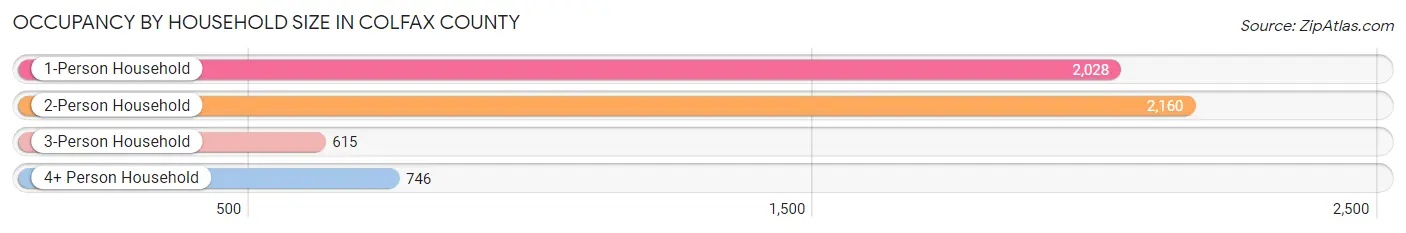
| Household Size | # Housing Units | % Housing Units |
| 1-Person Household | 2,028 | 36.5% |
| 2-Person Household | 2,160 | 38.9% |
| 3-Person Household | 615 | 11.1% |
| 4+ Person Household | 746 | 13.4% |
| Total Housing Units | 5,549 | 100.0% |
Occupancy by Ownership by Household Size in Colfax County
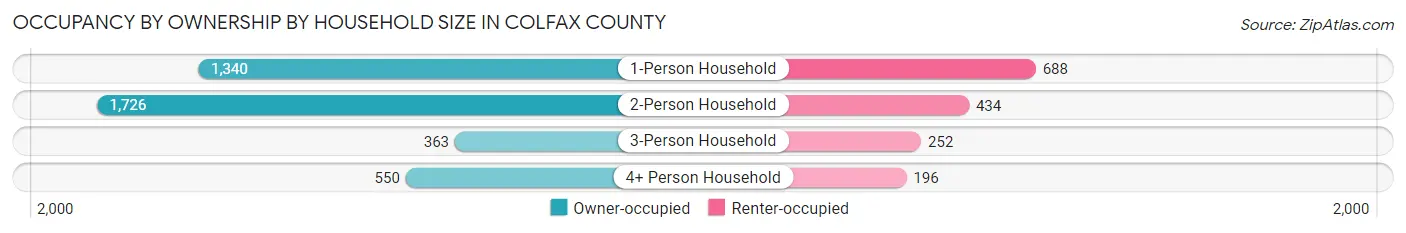
| Household Size | Owner-occupied | Renter-occupied |
| 1-Person Household | 1,340 (66.1%) | 688 (33.9%) |
| 2-Person Household | 1,726 (79.9%) | 434 (20.1%) |
| 3-Person Household | 363 (59.0%) | 252 (41.0%) |
| 4+ Person Household | 550 (73.7%) | 196 (26.3%) |
| Total Housing Units | 3,979 (71.7%) | 1,570 (28.3%) |
Occupancy by Educational Attainment in Colfax County
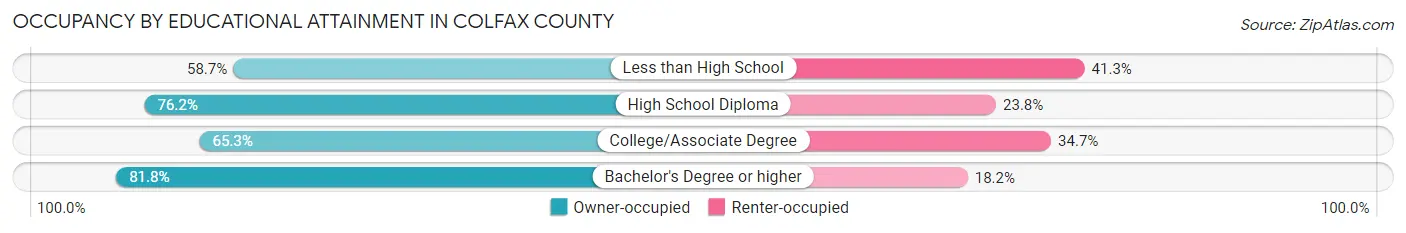
| Household Size | Owner-occupied | Renter-occupied |
| Less than High School | 308 (58.7%) | 217 (41.3%) |
| High School Diploma | 1,295 (76.2%) | 404 (23.8%) |
| College/Associate Degree | 1,363 (65.3%) | 724 (34.7%) |
| Bachelor's Degree or higher | 1,013 (81.8%) | 225 (18.2%) |
Occupancy by Age of Householder in Colfax County
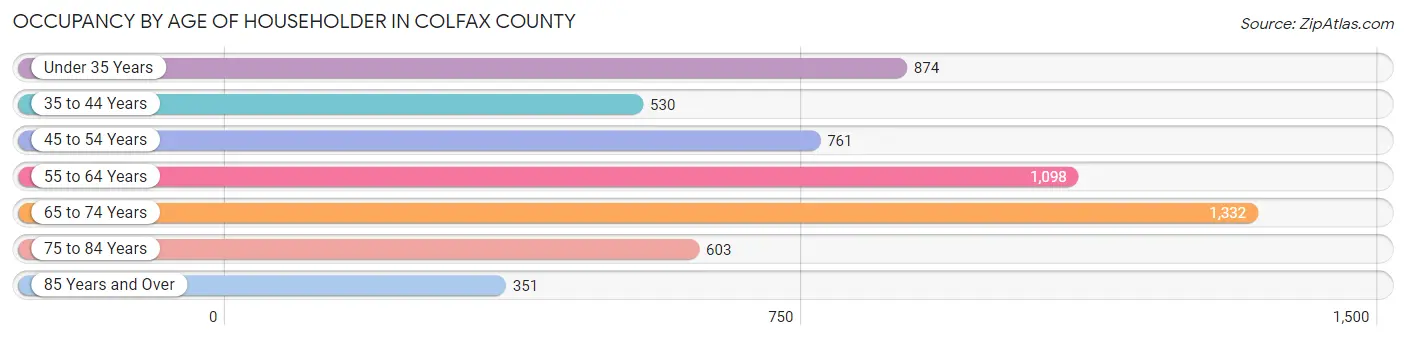
| Age Bracket | # Households | % Households |
| Under 35 Years | 874 | 15.8% |
| 35 to 44 Years | 530 | 9.6% |
| 45 to 54 Years | 761 | 13.7% |
| 55 to 64 Years | 1,098 | 19.8% |
| 65 to 74 Years | 1,332 | 24.0% |
| 75 to 84 Years | 603 | 10.9% |
| 85 Years and Over | 351 | 6.3% |
| Total | 5,549 | 100.0% |
Housing Finances in Colfax County
Median Income by Occupancy in Colfax County
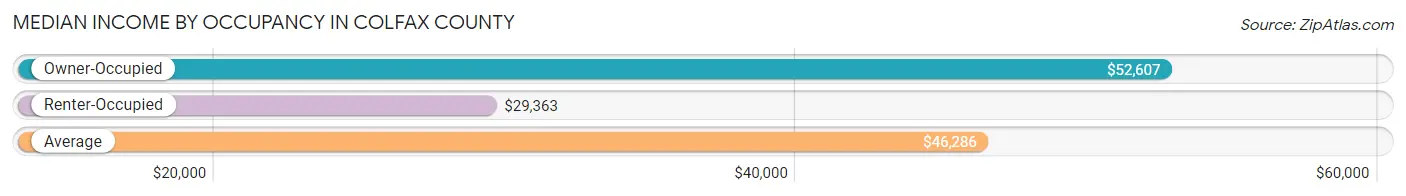
| Occupancy Type | # Households | Median Income |
| Owner-Occupied | 3,979 (71.7%) | $52,607 |
| Renter-Occupied | 1,570 (28.3%) | $29,363 |
| Average | 5,549 (100.0%) | $46,286 |
Occupancy by Householder Income Bracket in Colfax County
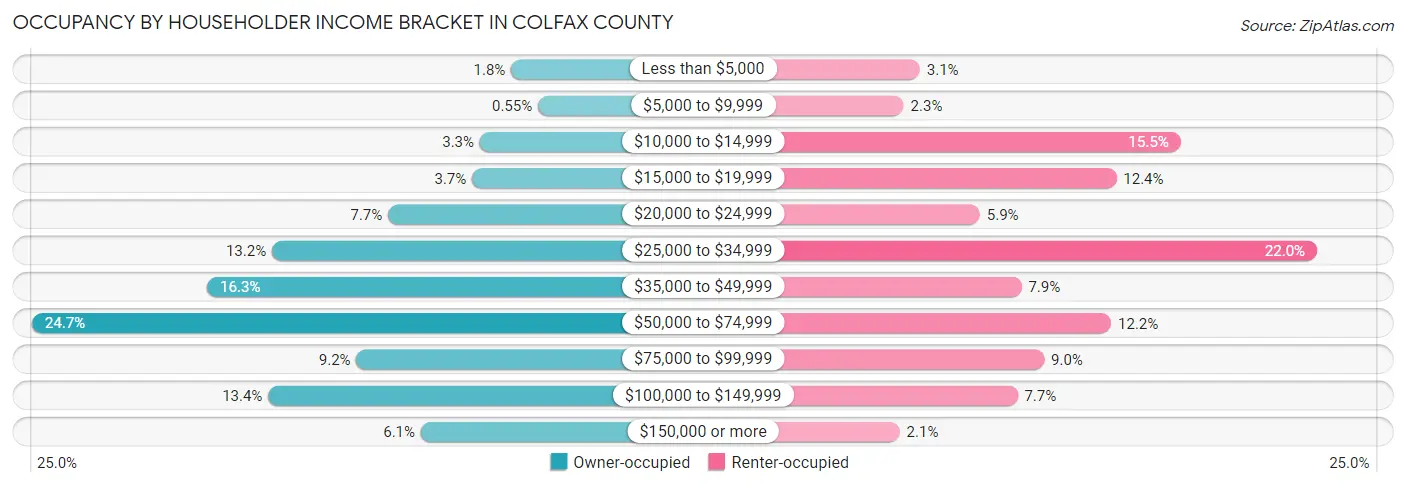
| Income Bracket | Owner-occupied | Renter-occupied |
| Less than $5,000 | 73 (1.8%) | 48 (3.1%) |
| $5,000 to $9,999 | 22 (0.5%) | 36 (2.3%) |
| $10,000 to $14,999 | 132 (3.3%) | 243 (15.5%) |
| $15,000 to $19,999 | 147 (3.7%) | 195 (12.4%) |
| $20,000 to $24,999 | 306 (7.7%) | 93 (5.9%) |
| $25,000 to $34,999 | 526 (13.2%) | 345 (22.0%) |
| $35,000 to $49,999 | 649 (16.3%) | 124 (7.9%) |
| $50,000 to $74,999 | 981 (24.6%) | 191 (12.2%) |
| $75,000 to $99,999 | 366 (9.2%) | 141 (9.0%) |
| $100,000 to $149,999 | 533 (13.4%) | 121 (7.7%) |
| $150,000 or more | 244 (6.1%) | 33 (2.1%) |
| Total | 3,979 (100.0%) | 1,570 (100.0%) |
Monthly Housing Cost Tiers in Colfax County
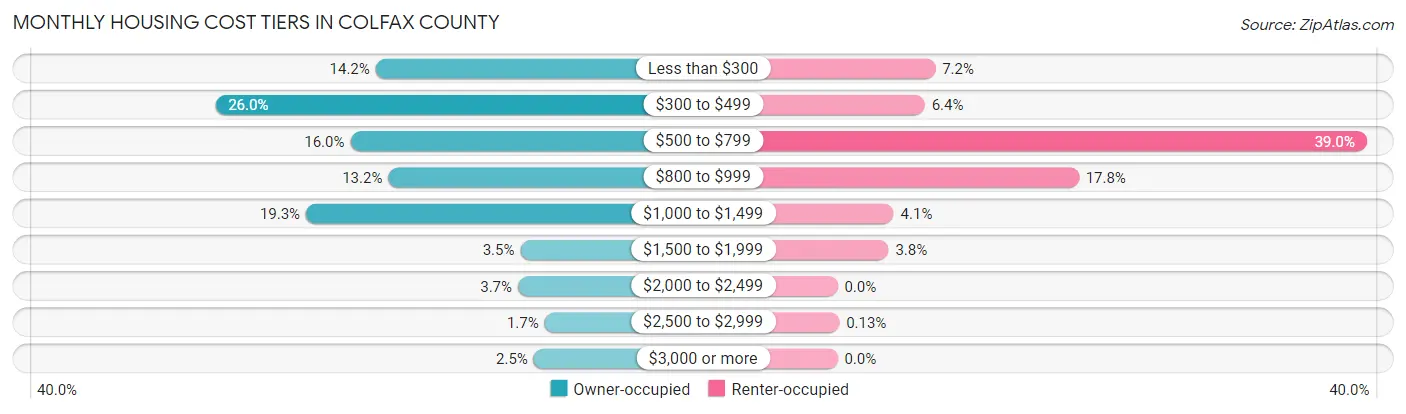
| Monthly Cost | Owner-occupied | Renter-occupied |
| Less than $300 | 563 (14.1%) | 113 (7.2%) |
| $300 to $499 | 1,033 (26.0%) | 101 (6.4%) |
| $500 to $799 | 637 (16.0%) | 612 (39.0%) |
| $800 to $999 | 526 (13.2%) | 279 (17.8%) |
| $1,000 to $1,499 | 767 (19.3%) | 65 (4.1%) |
| $1,500 to $1,999 | 139 (3.5%) | 59 (3.8%) |
| $2,000 to $2,499 | 146 (3.7%) | 0 (0.0%) |
| $2,500 to $2,999 | 68 (1.7%) | 2 (0.1%) |
| $3,000 or more | 100 (2.5%) | 0 (0.0%) |
| Total | 3,979 (100.0%) | 1,570 (100.0%) |
Physical Housing Characteristics in Colfax County
Housing Structures in Colfax County
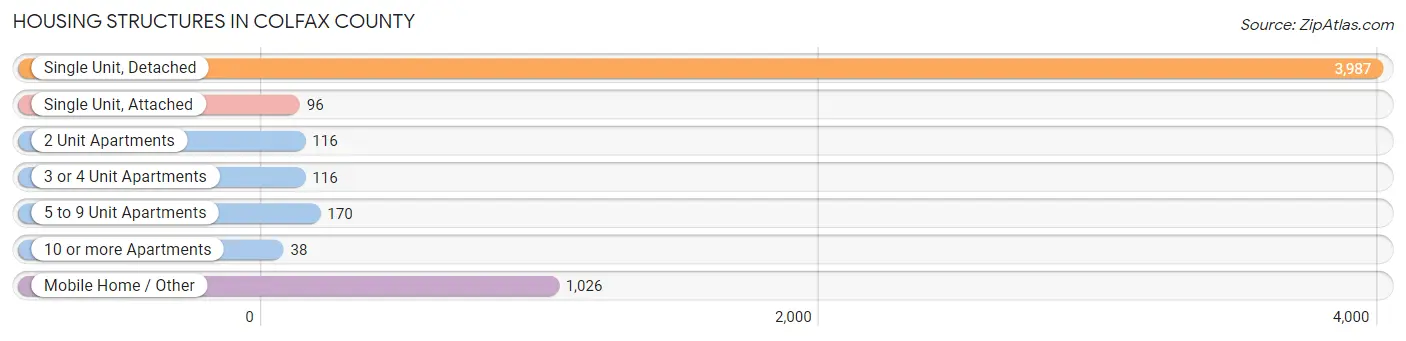
| Structure Type | # Housing Units | % Housing Units |
| Single Unit, Detached | 3,987 | 71.9% |
| Single Unit, Attached | 96 | 1.7% |
| 2 Unit Apartments | 116 | 2.1% |
| 3 or 4 Unit Apartments | 116 | 2.1% |
| 5 to 9 Unit Apartments | 170 | 3.1% |
| 10 or more Apartments | 38 | 0.7% |
| Mobile Home / Other | 1,026 | 18.5% |
| Total | 5,549 | 100.0% |
Housing Structures by Occupancy in Colfax County
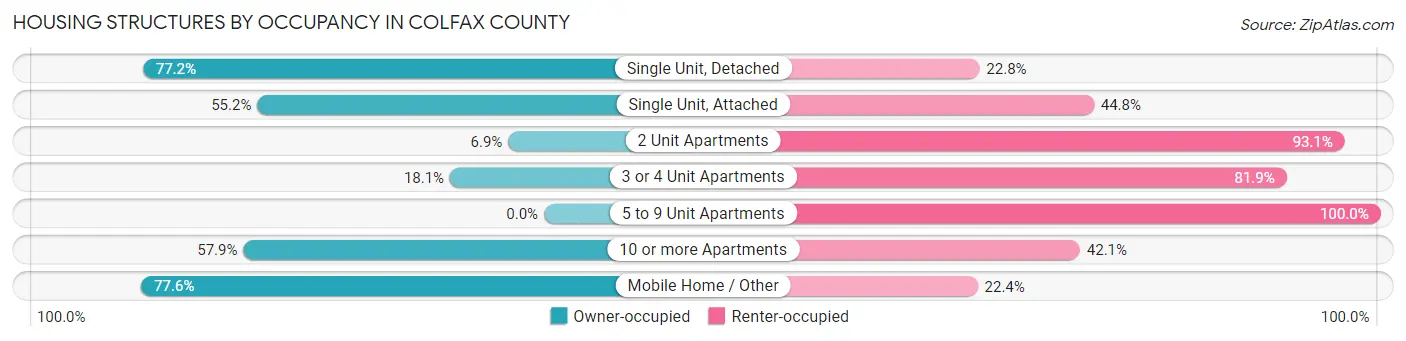
| Structure Type | Owner-occupied | Renter-occupied |
| Single Unit, Detached | 3,079 (77.2%) | 908 (22.8%) |
| Single Unit, Attached | 53 (55.2%) | 43 (44.8%) |
| 2 Unit Apartments | 8 (6.9%) | 108 (93.1%) |
| 3 or 4 Unit Apartments | 21 (18.1%) | 95 (81.9%) |
| 5 to 9 Unit Apartments | 0 (0.0%) | 170 (100.0%) |
| 10 or more Apartments | 22 (57.9%) | 16 (42.1%) |
| Mobile Home / Other | 796 (77.6%) | 230 (22.4%) |
| Total | 3,979 (71.7%) | 1,570 (28.3%) |
Housing Structures by Number of Rooms in Colfax County
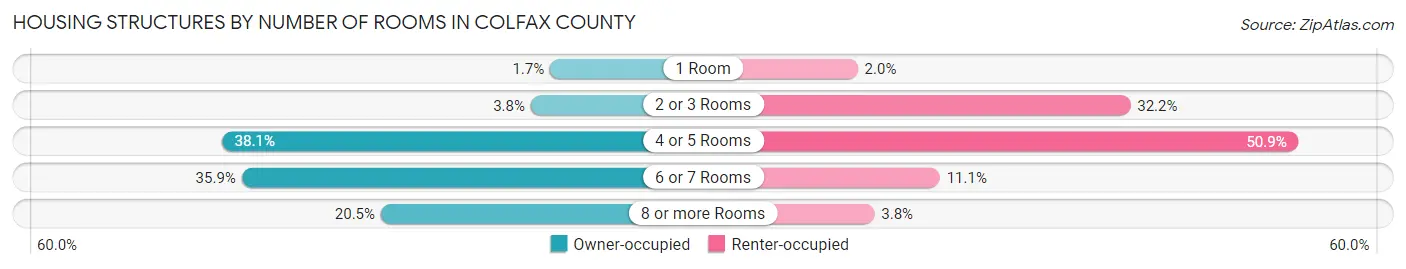
| Number of Rooms | Owner-occupied | Renter-occupied |
| 1 Room | 67 (1.7%) | 31 (2.0%) |
| 2 or 3 Rooms | 152 (3.8%) | 506 (32.2%) |
| 4 or 5 Rooms | 1,517 (38.1%) | 799 (50.9%) |
| 6 or 7 Rooms | 1,429 (35.9%) | 174 (11.1%) |
| 8 or more Rooms | 814 (20.5%) | 60 (3.8%) |
| Total | 3,979 (100.0%) | 1,570 (100.0%) |
Housing Structure by Heating Type in Colfax County
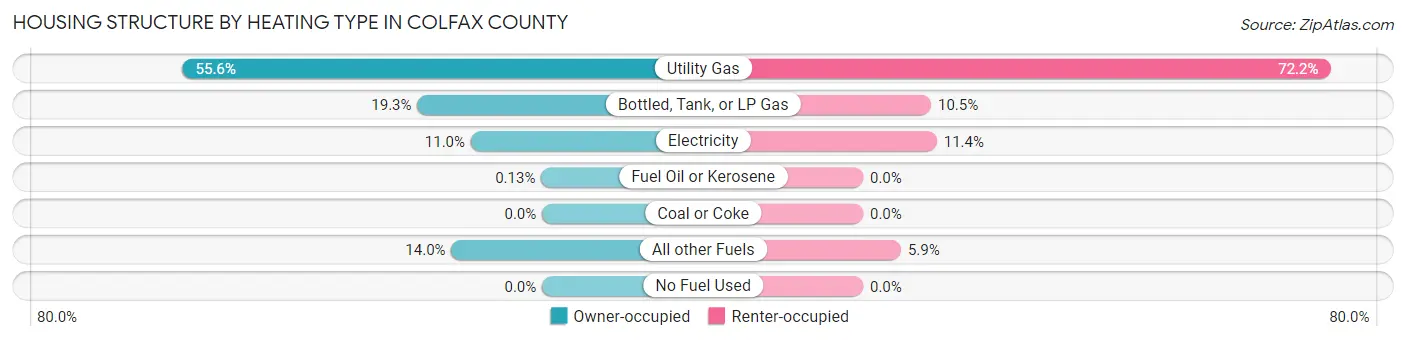
| Heating Type | Owner-occupied | Renter-occupied |
| Utility Gas | 2,211 (55.6%) | 1,134 (72.2%) |
| Bottled, Tank, or LP Gas | 767 (19.3%) | 165 (10.5%) |
| Electricity | 438 (11.0%) | 179 (11.4%) |
| Fuel Oil or Kerosene | 5 (0.1%) | 0 (0.0%) |
| Coal or Coke | 0 (0.0%) | 0 (0.0%) |
| All other Fuels | 558 (14.0%) | 92 (5.9%) |
| No Fuel Used | 0 (0.0%) | 0 (0.0%) |
| Total | 3,979 (100.0%) | 1,570 (100.0%) |
Household Vehicle Usage in Colfax County
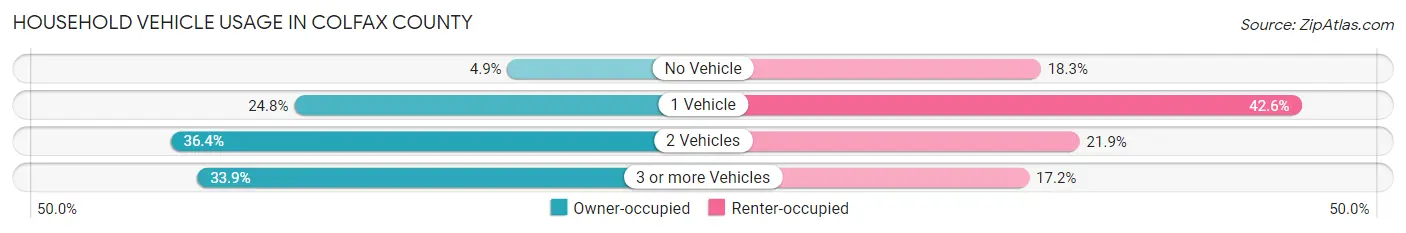
| Vehicles per Household | Owner-occupied | Renter-occupied |
| No Vehicle | 196 (4.9%) | 287 (18.3%) |
| 1 Vehicle | 988 (24.8%) | 669 (42.6%) |
| 2 Vehicles | 1,447 (36.4%) | 344 (21.9%) |
| 3 or more Vehicles | 1,348 (33.9%) | 270 (17.2%) |
| Total | 3,979 (100.0%) | 1,570 (100.0%) |
Real Estate & Mortgages in Colfax County
Real Estate and Mortgage Overview in Colfax County
| Characteristic | Without Mortgage | With Mortgage |
| Housing Units | 2,304 | 1,675 |
| Median Property Value | $128,900 | $148,400 |
| Median Household Income | $48,088 | $110 |
| Monthly Housing Costs | $399 | $100 |
| Real Estate Taxes | $716 | $30 |
Property Value by Mortgage Status in Colfax County
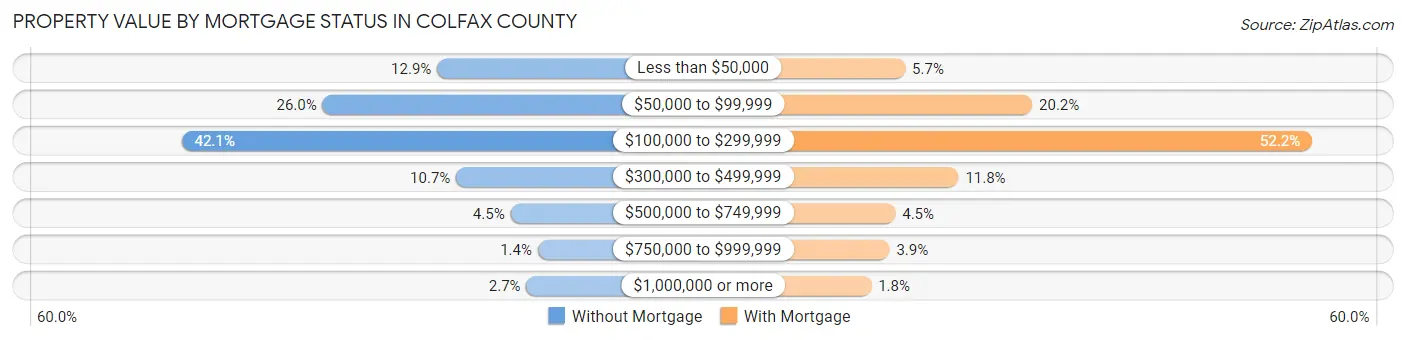
| Property Value | Without Mortgage | With Mortgage |
| Less than $50,000 | 296 (12.9%) | 95 (5.7%) |
| $50,000 to $99,999 | 598 (26.0%) | 338 (20.2%) |
| $100,000 to $299,999 | 969 (42.1%) | 874 (52.2%) |
| $300,000 to $499,999 | 246 (10.7%) | 197 (11.8%) |
| $500,000 to $749,999 | 103 (4.5%) | 76 (4.5%) |
| $750,000 to $999,999 | 31 (1.3%) | 65 (3.9%) |
| $1,000,000 or more | 61 (2.6%) | 30 (1.8%) |
| Total | 2,304 (100.0%) | 1,675 (100.0%) |
Household Income by Mortgage Status in Colfax County
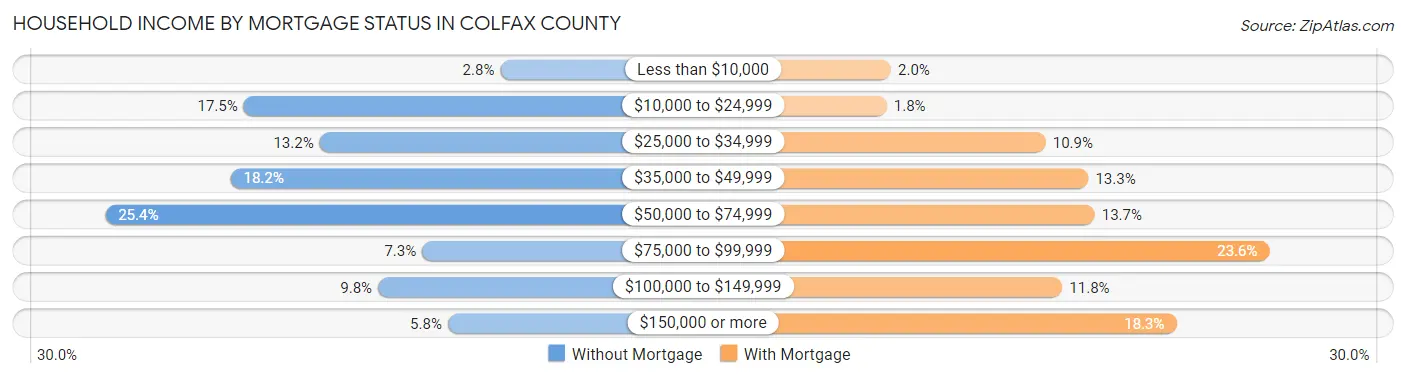
| Household Income | Without Mortgage | With Mortgage |
| Less than $10,000 | 65 (2.8%) | 34 (2.0%) |
| $10,000 to $24,999 | 403 (17.5%) | 30 (1.8%) |
| $25,000 to $34,999 | 303 (13.2%) | 182 (10.9%) |
| $35,000 to $49,999 | 420 (18.2%) | 223 (13.3%) |
| $50,000 to $74,999 | 585 (25.4%) | 229 (13.7%) |
| $75,000 to $99,999 | 168 (7.3%) | 396 (23.6%) |
| $100,000 to $149,999 | 226 (9.8%) | 198 (11.8%) |
| $150,000 or more | 134 (5.8%) | 307 (18.3%) |
| Total | 2,304 (100.0%) | 1,675 (100.0%) |
Property Value to Household Income Ratio in Colfax County
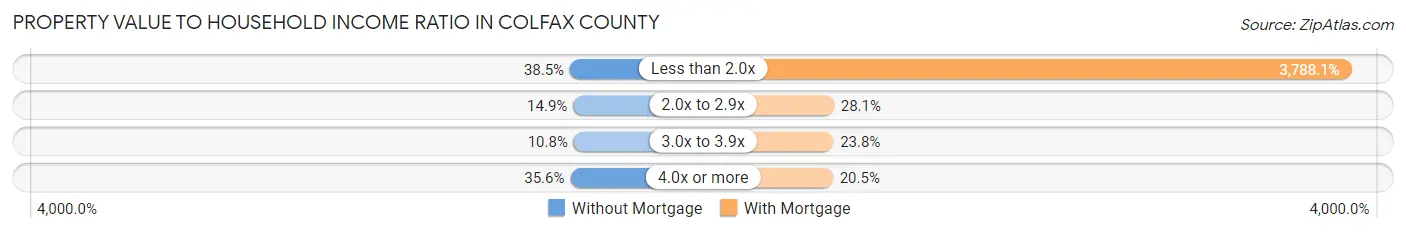
| Value-to-Income Ratio | Without Mortgage | With Mortgage |
| Less than 2.0x | 886 (38.5%) | 63,451 (3,788.1%) |
| 2.0x to 2.9x | 344 (14.9%) | 471 (28.1%) |
| 3.0x to 3.9x | 249 (10.8%) | 399 (23.8%) |
| 4.0x or more | 819 (35.5%) | 344 (20.5%) |
| Total | 2,304 (100.0%) | 1,675 (100.0%) |
Real Estate Taxes by Mortgage Status in Colfax County
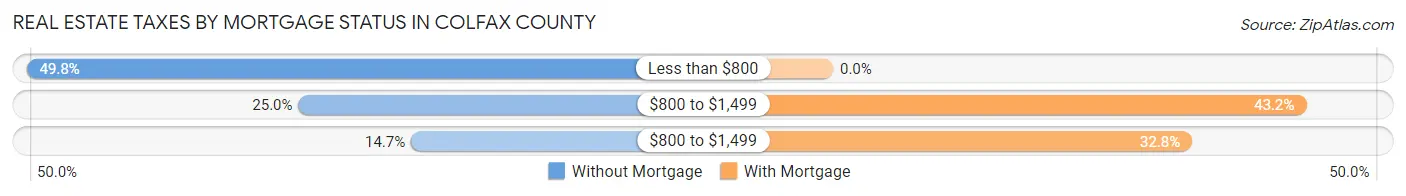
| Property Taxes | Without Mortgage | With Mortgage |
| Less than $800 | 1,148 (49.8%) | 0 (0.0%) |
| $800 to $1,499 | 576 (25.0%) | 724 (43.2%) |
| $800 to $1,499 | 339 (14.7%) | 549 (32.8%) |
| Total | 2,304 (100.0%) | 1,675 (100.0%) |
Health & Disability in Colfax County
Health Insurance Coverage by Age in Colfax County
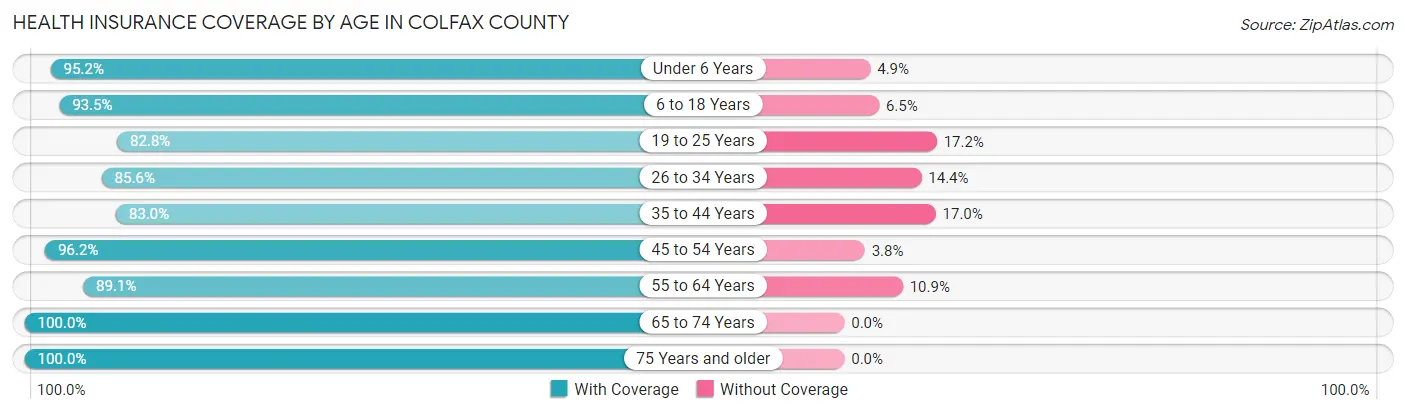
| Age Bracket | With Coverage | Without Coverage |
| Under 6 Years | 648 (95.2%) | 33 (4.9%) |
| 6 to 18 Years | 1,477 (93.5%) | 102 (6.5%) |
| 19 to 25 Years | 783 (82.8%) | 163 (17.2%) |
| 26 to 34 Years | 888 (85.6%) | 149 (14.4%) |
| 35 to 44 Years | 926 (83.0%) | 190 (17.0%) |
| 45 to 54 Years | 1,211 (96.2%) | 48 (3.8%) |
| 55 to 64 Years | 1,667 (89.1%) | 204 (10.9%) |
| 65 to 74 Years | 1,996 (100.0%) | 0 (0.0%) |
| 75 Years and older | 1,319 (100.0%) | 0 (0.0%) |
| Total | 10,915 (92.5%) | 889 (7.5%) |
Health Insurance Coverage by Citizenship Status in Colfax County
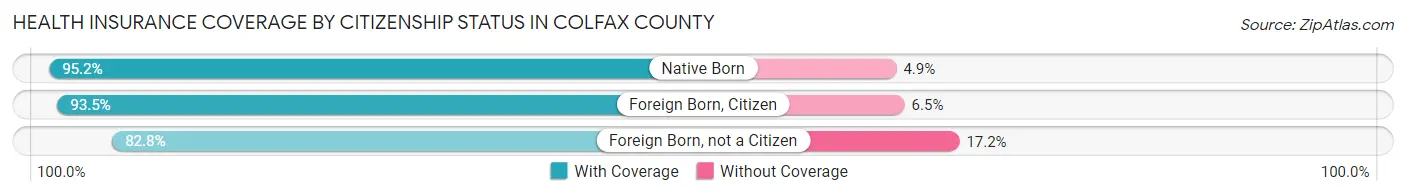
| Citizenship Status | With Coverage | Without Coverage |
| Native Born | 648 (95.2%) | 33 (4.9%) |
| Foreign Born, Citizen | 1,477 (93.5%) | 102 (6.5%) |
| Foreign Born, not a Citizen | 783 (82.8%) | 163 (17.2%) |
Health Insurance Coverage by Household Income in Colfax County

| Household Income | With Coverage | Without Coverage |
| Under $25,000 | 1,990 (95.5%) | 93 (4.5%) |
| $25,000 to $49,999 | 3,119 (90.6%) | 324 (9.4%) |
| $50,000 to $74,999 | 2,076 (86.3%) | 330 (13.7%) |
| $75,000 to $99,999 | 1,372 (95.8%) | 60 (4.2%) |
| $100,000 and over | 2,350 (96.6%) | 82 (3.4%) |
Public vs Private Health Insurance Coverage by Age in Colfax County
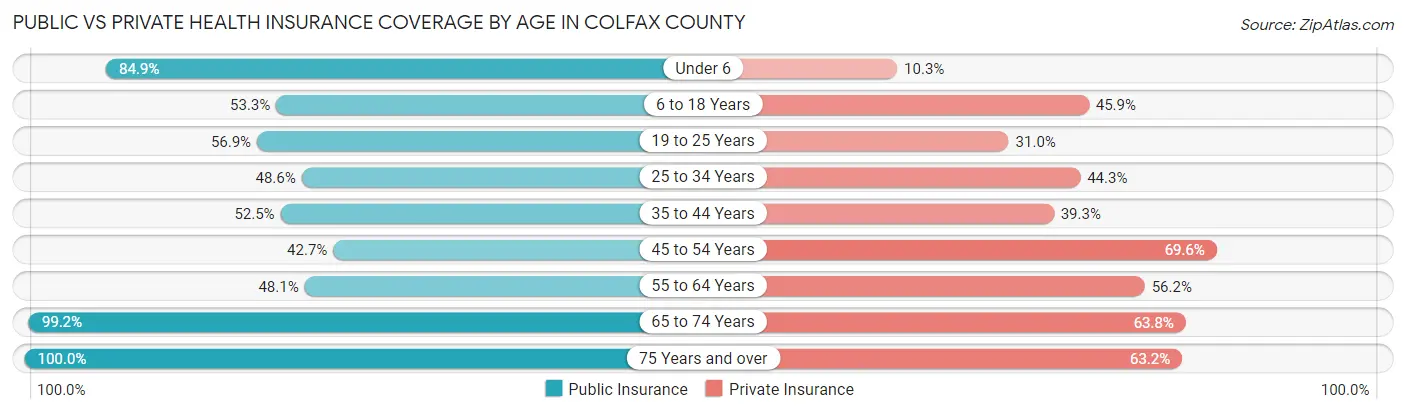
| Age Bracket | Public Insurance | Private Insurance |
| Under 6 | 578 (84.9%) | 70 (10.3%) |
| 6 to 18 Years | 842 (53.3%) | 724 (45.9%) |
| 19 to 25 Years | 538 (56.9%) | 293 (31.0%) |
| 25 to 34 Years | 504 (48.6%) | 459 (44.3%) |
| 35 to 44 Years | 586 (52.5%) | 439 (39.3%) |
| 45 to 54 Years | 538 (42.7%) | 876 (69.6%) |
| 55 to 64 Years | 899 (48.0%) | 1,052 (56.2%) |
| 65 to 74 Years | 1,980 (99.2%) | 1,274 (63.8%) |
| 75 Years and over | 1,319 (100.0%) | 833 (63.1%) |
| Total | 7,784 (65.9%) | 6,020 (51.0%) |
Disability Status by Sex by Age in Colfax County
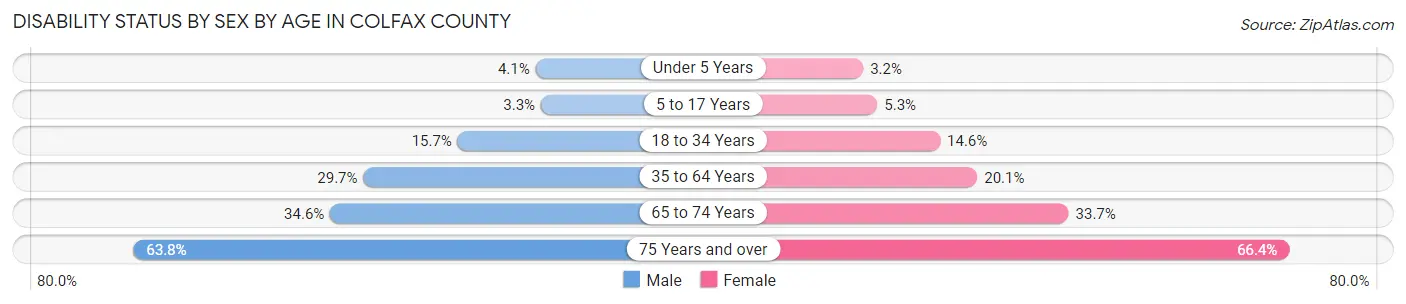
| Age Bracket | Male | Female |
| Under 5 Years | 9 (4.1%) | 9 (3.2%) |
| 5 to 17 Years | 27 (3.3%) | 45 (5.3%) |
| 18 to 34 Years | 169 (15.7%) | 146 (14.6%) |
| 35 to 64 Years | 622 (29.7%) | 433 (20.1%) |
| 65 to 74 Years | 356 (34.6%) | 326 (33.7%) |
| 75 Years and over | 399 (63.8%) | 461 (66.4%) |
Disability Class by Sex by Age in Colfax County
Disability Class: Hearing Difficulty
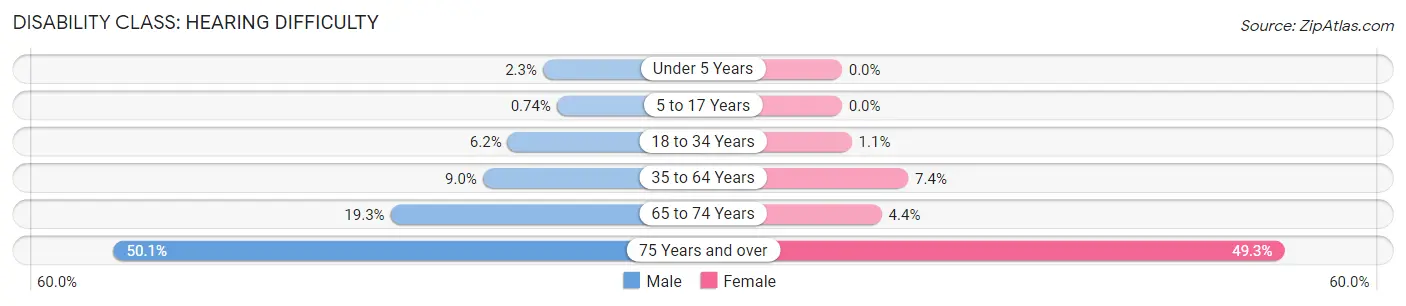
| Age Bracket | Male | Female |
| Under 5 Years | 5 (2.3%) | 0 (0.0%) |
| 5 to 17 Years | 6 (0.7%) | 0 (0.0%) |
| 18 to 34 Years | 67 (6.2%) | 11 (1.1%) |
| 35 to 64 Years | 188 (9.0%) | 159 (7.4%) |
| 65 to 74 Years | 198 (19.3%) | 43 (4.4%) |
| 75 Years and over | 313 (50.1%) | 342 (49.3%) |
Disability Class: Vision Difficulty
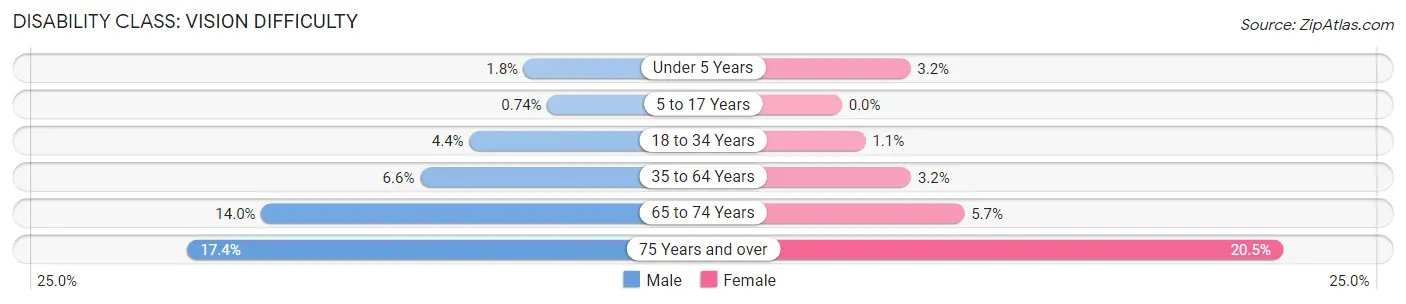
| Age Bracket | Male | Female |
| Under 5 Years | 4 (1.8%) | 9 (3.2%) |
| 5 to 17 Years | 6 (0.7%) | 0 (0.0%) |
| 18 to 34 Years | 47 (4.4%) | 11 (1.1%) |
| 35 to 64 Years | 139 (6.6%) | 69 (3.2%) |
| 65 to 74 Years | 144 (14.0%) | 55 (5.7%) |
| 75 Years and over | 109 (17.4%) | 142 (20.5%) |
Disability Class: Cognitive Difficulty
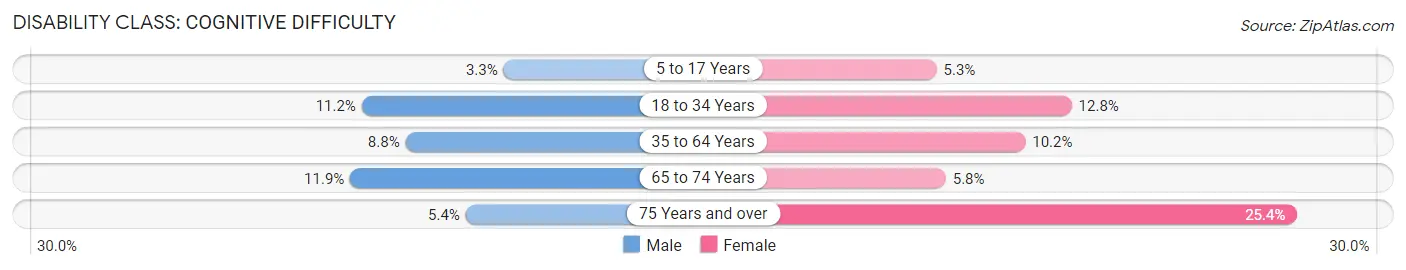
| Age Bracket | Male | Female |
| 5 to 17 Years | 27 (3.3%) | 45 (5.3%) |
| 18 to 34 Years | 121 (11.2%) | 128 (12.8%) |
| 35 to 64 Years | 184 (8.8%) | 220 (10.2%) |
| 65 to 74 Years | 122 (11.9%) | 56 (5.8%) |
| 75 Years and over | 34 (5.4%) | 176 (25.4%) |
Disability Class: Ambulatory Difficulty
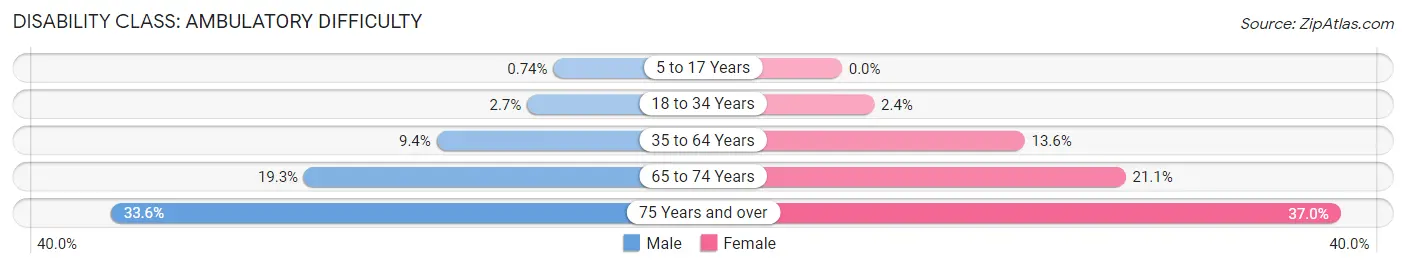
| Age Bracket | Male | Female |
| 5 to 17 Years | 6 (0.7%) | 0 (0.0%) |
| 18 to 34 Years | 29 (2.7%) | 24 (2.4%) |
| 35 to 64 Years | 197 (9.4%) | 292 (13.6%) |
| 65 to 74 Years | 198 (19.3%) | 204 (21.1%) |
| 75 Years and over | 210 (33.6%) | 257 (37.0%) |
Disability Class: Self-Care Difficulty
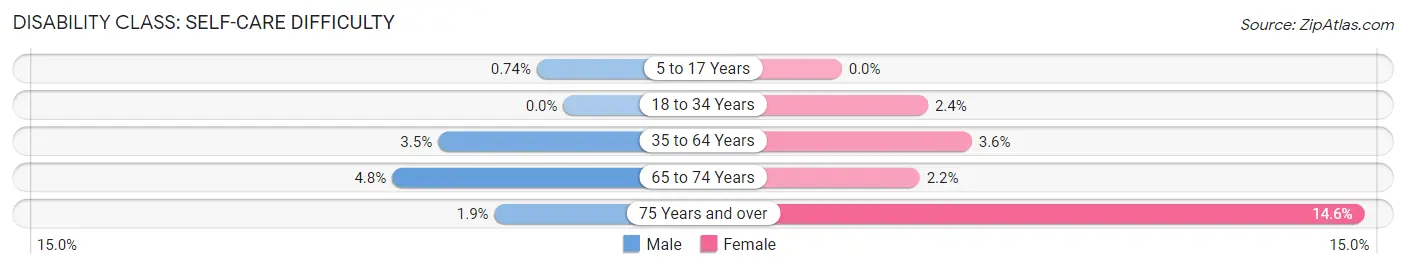
| Age Bracket | Male | Female |
| 5 to 17 Years | 6 (0.7%) | 0 (0.0%) |
| 18 to 34 Years | 0 (0.0%) | 24 (2.4%) |
| 35 to 64 Years | 73 (3.5%) | 78 (3.6%) |
| 65 to 74 Years | 49 (4.8%) | 21 (2.2%) |
| 75 Years and over | 12 (1.9%) | 101 (14.5%) |
Technology Access in Colfax County
Computing Device Access in Colfax County
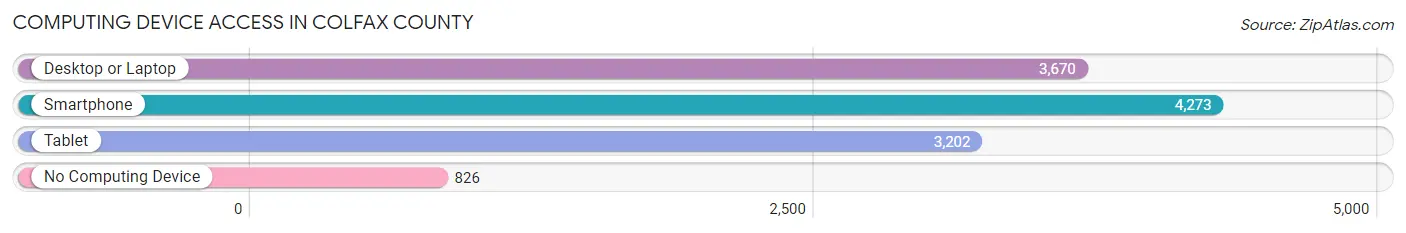
| Device Type | # Households | % Households |
| Desktop or Laptop | 3,670 | 66.1% |
| Smartphone | 4,273 | 77.0% |
| Tablet | 3,202 | 57.7% |
| No Computing Device | 826 | 14.9% |
| Total | 5,549 | 100.0% |
Internet Access in Colfax County
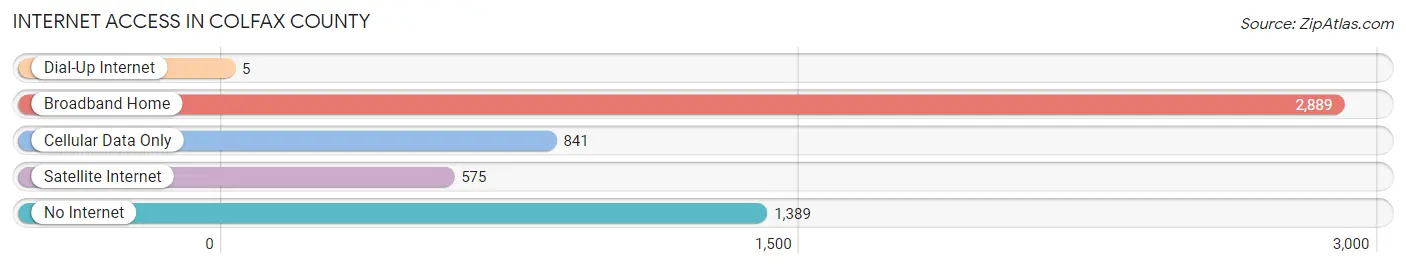
| Internet Type | # Households | % Households |
| Dial-Up Internet | 5 | 0.1% |
| Broadband Home | 2,889 | 52.1% |
| Cellular Data Only | 841 | 15.2% |
| Satellite Internet | 575 | 10.4% |
| No Internet | 1,389 | 25.0% |
| Total | 5,549 | 100.0% |
Colfax County Summary
Colfax County is located in the northeastern corner of New Mexico, and is bordered by Oklahoma to the east, Texas to the south, and Colorado to the north. The county seat is Raton, and the county is named after Schuyler Colfax, the 17th Vice President of the United States. The county has a total area of 2,945 square miles, and a population of 12,837 as of the 2010 census.
Geography
Colfax County is located in the northeastern corner of New Mexico, and is bordered by Oklahoma to the east, Texas to the south, and Colorado to the north. The county is located in the Raton Basin, which is a large intermontane basin that is part of the Great Plains. The county is mostly flat, with elevations ranging from 4,800 feet in the northeast to 6,000 feet in the southwest. The highest point in the county is Baldy Peak, which has an elevation of 8,717 feet. The county is drained by the Canadian River and its tributaries, including the Cimarron River, which flows through the county from north to south.
The county is mostly covered in grasslands, with some areas of shrubland and forest. The grasslands are dominated by blue grama, western wheatgrass, and little bluestem. The shrublands are dominated by sagebrush, rabbitbrush, and fourwing saltbush. The forests are dominated by ponderosa pine, Douglas fir, and aspen.
Economy
Colfax County’s economy is largely based on agriculture and ranching. The county is home to several large cattle ranches, and the county’s agricultural products include hay, wheat, corn, and alfalfa. The county is also home to several coal mines, and the county’s coal production is the second highest in the state.
The county is also home to several tourist attractions, including the Capulin Volcano National Monument, the Santa Fe Trail, and the Raton Pass. The county is also home to several ski resorts, including the Angel Fire Resort and the Red River Ski Area.
Demographics
As of the 2010 census, the population of Colfax County was 12,837. The population is largely white, with a small Hispanic minority. The median household income in the county is $41,945, and the median age is 41.7 years.
The county is home to several Native American tribes, including the Ute, Apache, and Navajo. The county is also home to several Hispanic communities, including the towns of Cimarron and Springer.
Conclusion
Colfax County is located in the northeastern corner of New Mexico, and is bordered by Oklahoma to the east, Texas to the south, and Colorado to the north. The county has a total area of 2,945 square miles, and a population of 12,837 as of the 2010 census. The county’s economy is largely based on agriculture and ranching, and the county is also home to several tourist attractions and ski resorts. The population of the county is largely white, with a small Hispanic minority. The county is also home to several Native American tribes, and several Hispanic communities.
Common Questions
What is Per Capita Income in Colfax County?
Per Capita income in Colfax County is $28,275.
What is the Median Family Income in Colfax County?
Median Family Income in Colfax County is $62,773.
What is the Median Household income in Colfax County?
Median Household Income in Colfax County is $46,286.
What is Income or Wage Gap in Colfax County?
Income or Wage Gap in Colfax County is 25.8%.
Women in Colfax County earn 74.2 cents for every dollar earned by a man.
What is Inequality or Gini Index in Colfax County?
Inequality or Gini Index in Colfax County is 0.42.
What is the Total Population of Colfax County?
Total Population of Colfax County is 12,370.
What is the Total Male Population of Colfax County?
Total Male Population of Colfax County is 6,273.
What is the Total Female Population of Colfax County?
Total Female Population of Colfax County is 6,097.
What is the Ratio of Males per 100 Females in Colfax County?
There are 102.89 Males per 100 Females in Colfax County.
What is the Ratio of Females per 100 Males in Colfax County?
There are 97.19 Females per 100 Males in Colfax County.
What is the Median Population Age in Colfax County?
Median Population Age in Colfax County is 49.2 Years.
What is the Average Family Size in Colfax County
Average Family Size in Colfax County is 2.7 People.
What is the Average Household Size in Colfax County
Average Household Size in Colfax County is 2.1 People.
How Large is the Labor Force in Colfax County?
There are 5,343 People in the Labor Forcein in Colfax County.
What is the Percentage of People in the Labor Force in Colfax County?
50.6% of People are in the Labor Force in Colfax County.
What is the Unemployment Rate in Colfax County?
Unemployment Rate in Colfax County is 3.2%.