North Valley, NM Map & Demographics
North Valley Map
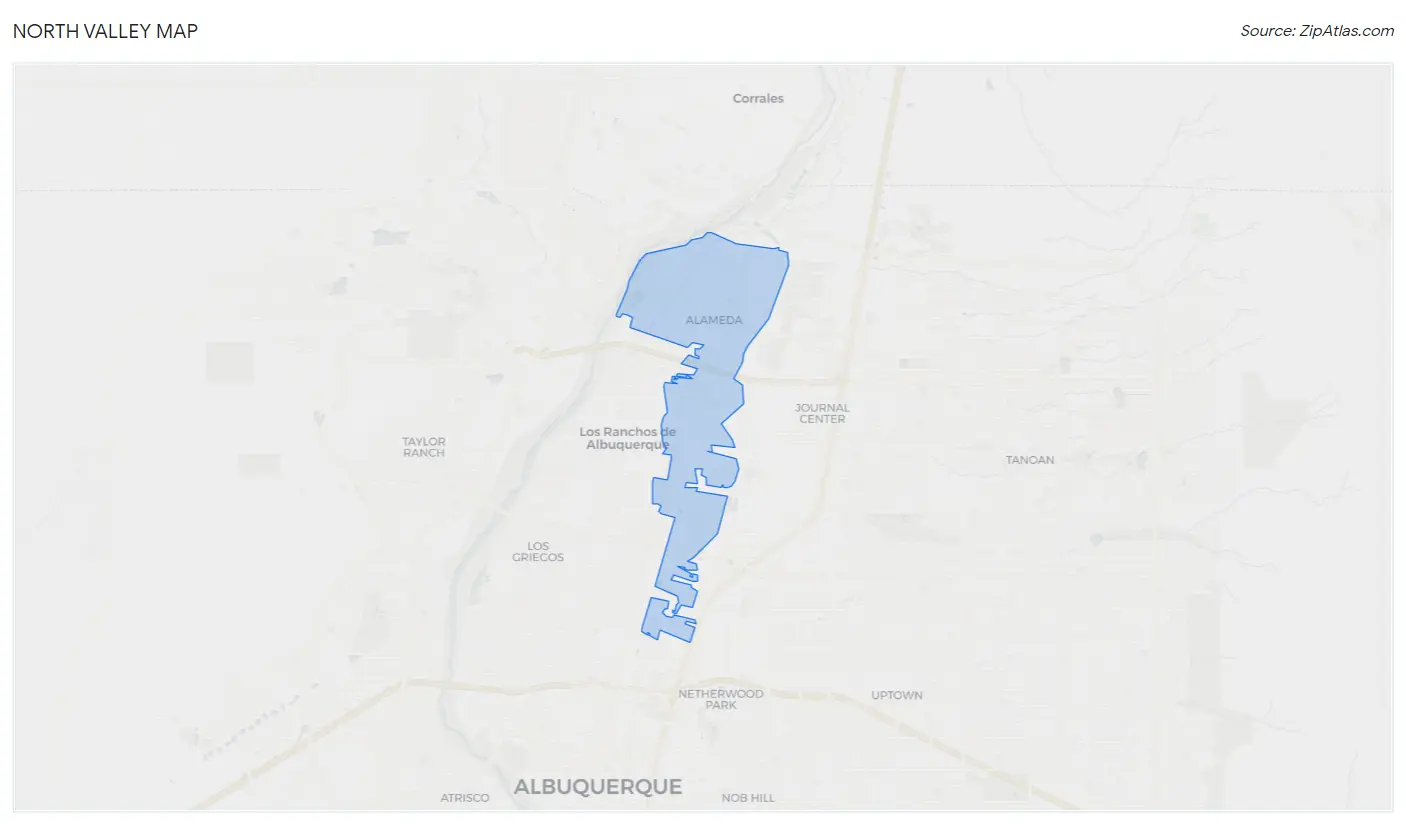
North Valley Overview
$33,831
PER CAPITA INCOME
$67,378
AVG FAMILY INCOME
$59,421
AVG HOUSEHOLD INCOME
35.9%
WAGE / INCOME GAP [ % ]
64.1¢/ $1
WAGE / INCOME GAP [ $ ]
0.48
INEQUALITY / GINI INDEX
11,256
TOTAL POPULATION
5,418
MALE POPULATION
5,838
FEMALE POPULATION
92.81
MALES / 100 FEMALES
107.75
FEMALES / 100 MALES
45.6
MEDIAN AGE
3.1
AVG FAMILY SIZE
2.6
AVG HOUSEHOLD SIZE
5,189
LABOR FORCE [ PEOPLE ]
54.2%
PERCENT IN LABOR FORCE
4.6%
UNEMPLOYMENT RATE
Income in North Valley
Income Overview in North Valley
Per Capita Income in North Valley is $33,831, while median incomes of families and households are $67,378 and $59,421 respectively.
| Characteristic | Number | Measure |
| Per Capita Income | 11,256 | $33,831 |
| Median Family Income | 2,928 | $67,378 |
| Mean Family Income | 2,928 | $97,119 |
| Median Household Income | 4,332 | $59,421 |
| Mean Household Income | 4,332 | $82,657 |
| Income Deficit | 2,928 | $0 |
| Wage / Income Gap (%) | 11,256 | 35.94% |
| Wage / Income Gap ($) | 11,256 | 64.06¢ per $1 |
| Gini / Inequality Index | 11,256 | 0.48 |
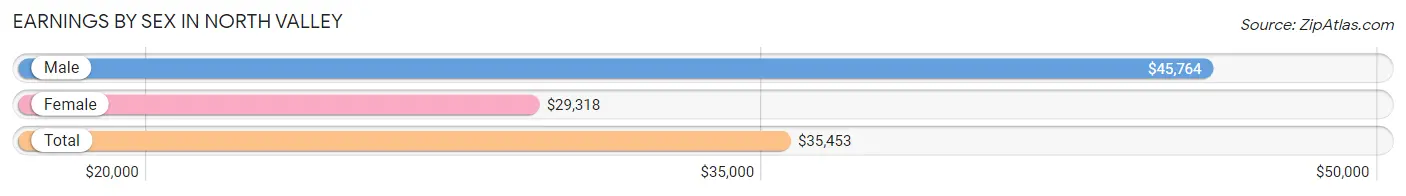
Earnings by Sex in North Valley
Average Earnings in North Valley are $35,453, $45,764 for men and $29,318 for women, a difference of 35.9%.
| Sex | Number | Average Earnings |
| Male | 2,697 (48.2%) | $45,764 |
| Female | 2,898 (51.8%) | $29,318 |
| Total | 5,595 (100.0%) | $35,453 |
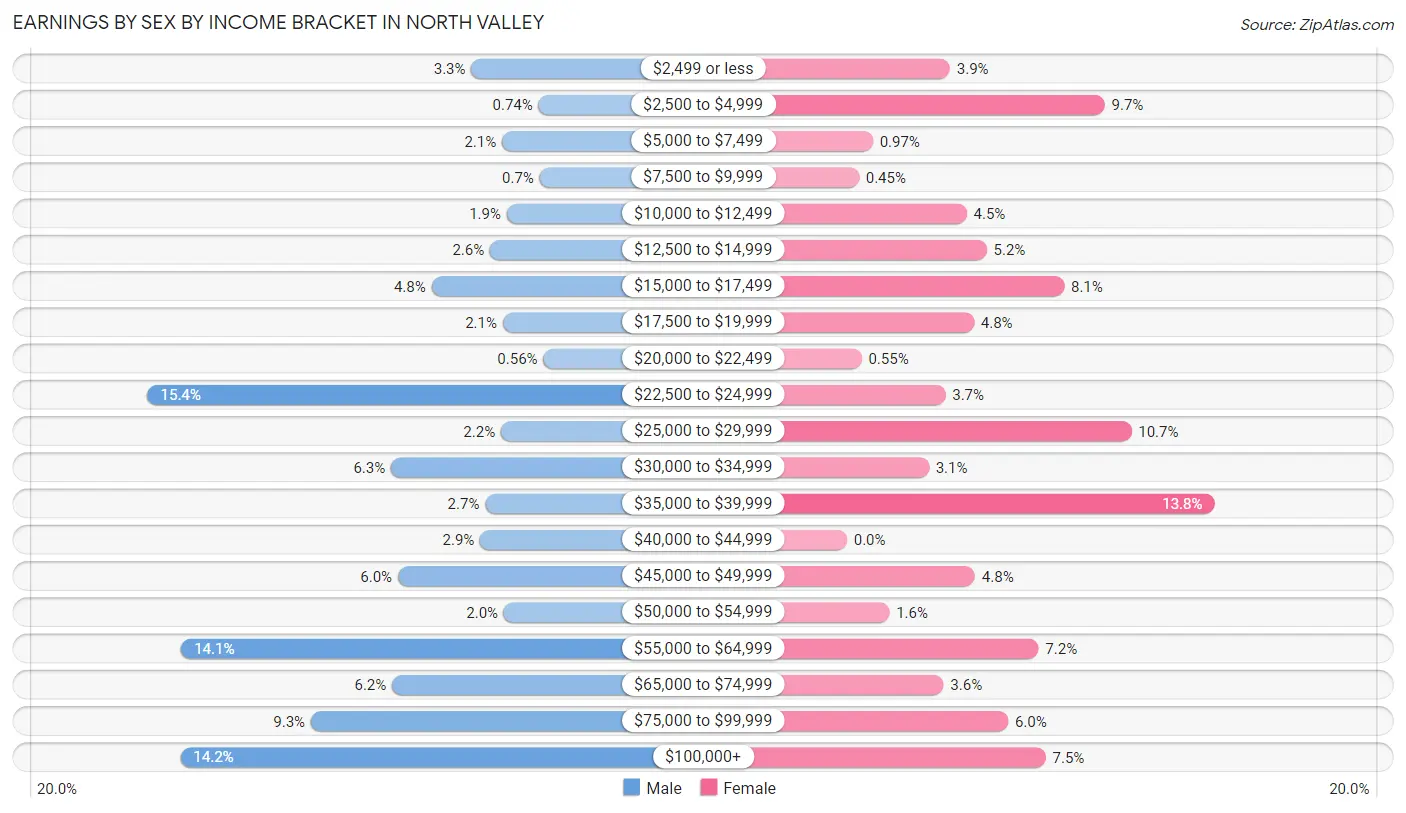
Earnings by Sex by Income Bracket in North Valley
The most common earnings brackets in North Valley are $22,500 to $24,999 for men (415 | 15.4%) and $35,000 to $39,999 for women (399 | 13.8%).
| Income | Male | Female |
| $2,499 or less | 88 (3.3%) | 112 (3.9%) |
| $2,500 to $4,999 | 20 (0.7%) | 280 (9.7%) |
| $5,000 to $7,499 | 57 (2.1%) | 28 (1.0%) |
| $7,500 to $9,999 | 19 (0.7%) | 13 (0.4%) |
| $10,000 to $12,499 | 52 (1.9%) | 130 (4.5%) |
| $12,500 to $14,999 | 69 (2.6%) | 152 (5.2%) |
| $15,000 to $17,499 | 128 (4.8%) | 236 (8.1%) |
| $17,500 to $19,999 | 56 (2.1%) | 138 (4.8%) |
| $20,000 to $22,499 | 15 (0.6%) | 16 (0.5%) |
| $22,500 to $24,999 | 415 (15.4%) | 107 (3.7%) |
| $25,000 to $29,999 | 58 (2.1%) | 309 (10.7%) |
| $30,000 to $34,999 | 169 (6.3%) | 89 (3.1%) |
| $35,000 to $39,999 | 74 (2.7%) | 399 (13.8%) |
| $40,000 to $44,999 | 79 (2.9%) | 0 (0.0%) |
| $45,000 to $49,999 | 162 (6.0%) | 139 (4.8%) |
| $50,000 to $54,999 | 55 (2.0%) | 46 (1.6%) |
| $55,000 to $64,999 | 381 (14.1%) | 208 (7.2%) |
| $65,000 to $74,999 | 168 (6.2%) | 105 (3.6%) |
| $75,000 to $99,999 | 250 (9.3%) | 175 (6.0%) |
| $100,000+ | 382 (14.2%) | 216 (7.4%) |
| Total | 2,697 (100.0%) | 2,898 (100.0%) |
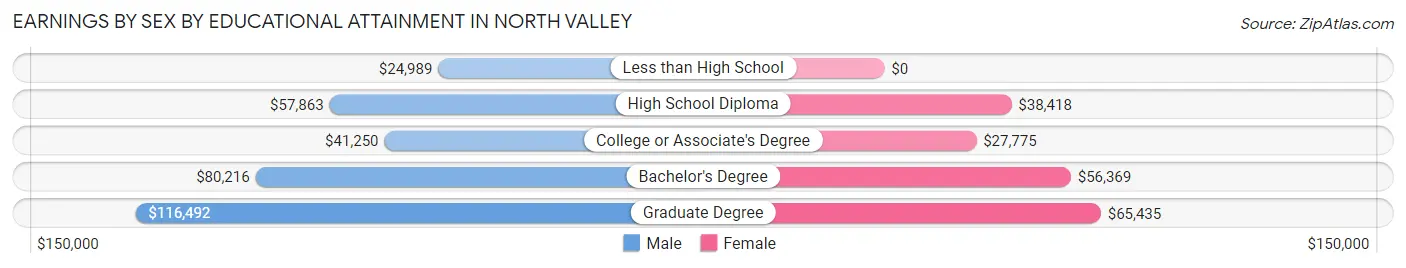
Earnings by Sex by Educational Attainment in North Valley
Average earnings in North Valley are $53,406 for men and $35,993 for women, a difference of 32.6%. Men with an educational attainment of graduate degree enjoy the highest average annual earnings of $116,492, while those with less than high school education earn the least with $24,989. Women with an educational attainment of graduate degree earn the most with the average annual earnings of $65,435, while those with college or associate's degree education have the smallest earnings of $27,775.
| Educational Attainment | Male Income | Female Income |
| Less than High School | $24,989 | $0 |
| High School Diploma | $57,863 | $38,418 |
| College or Associate's Degree | $41,250 | $27,775 |
| Bachelor's Degree | $80,216 | $56,369 |
| Graduate Degree | $116,492 | $65,435 |
| Total | $53,406 | $35,993 |
Family Income in North Valley
Family Income Brackets in North Valley
According to the North Valley family income data, there are 468 families falling into the $100,000 to $149,999 income range, which is the most common income bracket and makes up 16.0% of all families. Conversely, the $25,000 to $34,999 income bracket is the least frequent group with only 56 families (1.9%) belonging to this category.
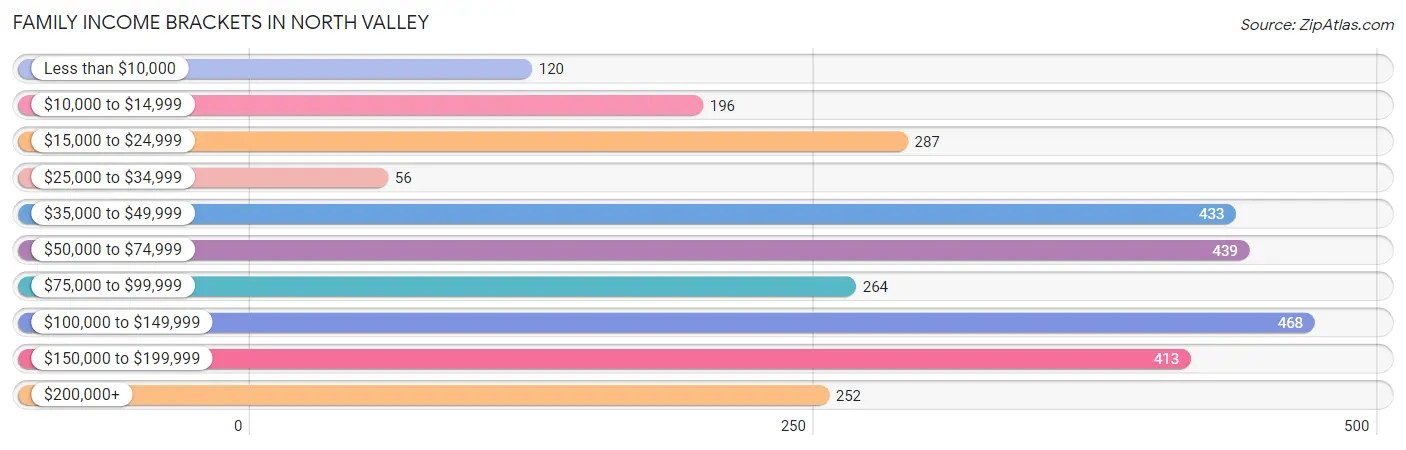
| Income Bracket | # Families | % Families |
| Less than $10,000 | 120 | 4.1% |
| $10,000 to $14,999 | 196 | 6.7% |
| $15,000 to $24,999 | 287 | 9.8% |
| $25,000 to $34,999 | 56 | 1.9% |
| $35,000 to $49,999 | 433 | 14.8% |
| $50,000 to $74,999 | 439 | 15.0% |
| $75,000 to $99,999 | 264 | 9.0% |
| $100,000 to $149,999 | 468 | 16.0% |
| $150,000 to $199,999 | 413 | 14.1% |
| $200,000+ | 252 | 8.6% |
Family Income by Famaliy Size in North Valley
4-person families (515 | 17.6%) account for the highest median family income in North Valley with $118,250 per family, while 2-person families (1,274 | 43.5%) have the highest median income of $29,688 per family member.
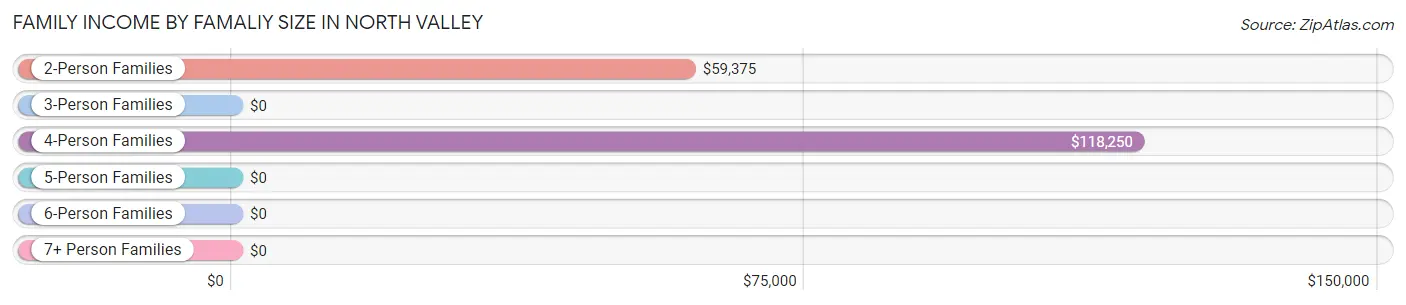
| Income Bracket | # Families | Median Income |
| 2-Person Families | 1,274 (43.5%) | $59,375 |
| 3-Person Families | 864 (29.5%) | $0 |
| 4-Person Families | 515 (17.6%) | $118,250 |
| 5-Person Families | 212 (7.2%) | $0 |
| 6-Person Families | 42 (1.4%) | $0 |
| 7+ Person Families | 21 (0.7%) | $0 |
| Total | 2,928 (100.0%) | $67,378 |
Family Income by Number of Earners in North Valley
The median family income in North Valley is $67,378, with families comprising 2 earners (957) having the highest median family income of $142,594, while families with 1 earner (1,172) have the lowest median family income of $37,355, accounting for 32.7% and 40.0% of families, respectively.
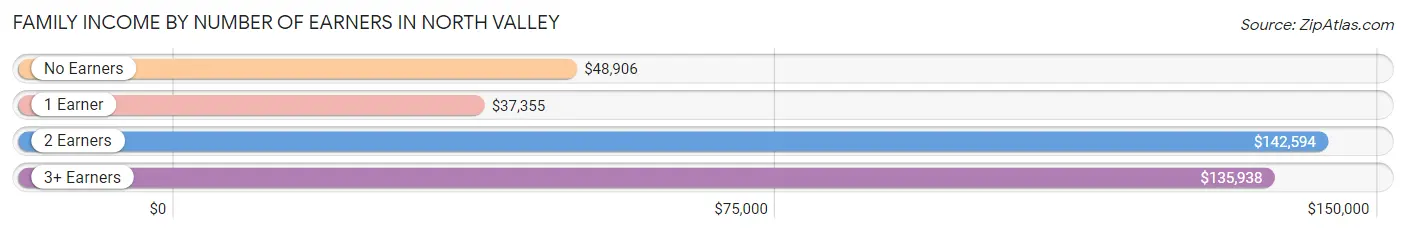
| Number of Earners | # Families | Median Income |
| No Earners | 531 (18.1%) | $48,906 |
| 1 Earner | 1,172 (40.0%) | $37,355 |
| 2 Earners | 957 (32.7%) | $142,594 |
| 3+ Earners | 268 (9.1%) | $135,938 |
| Total | 2,928 (100.0%) | $67,378 |
Household Income in North Valley
Household Income Brackets in North Valley
With 888 households falling in the category, the $50,000 to $74,999 income range is the most frequent in North Valley, accounting for 20.5% of all households. In contrast, only 260 households (6.0%) fall into the $10,000 to $14,999 income bracket, making it the least populous group.
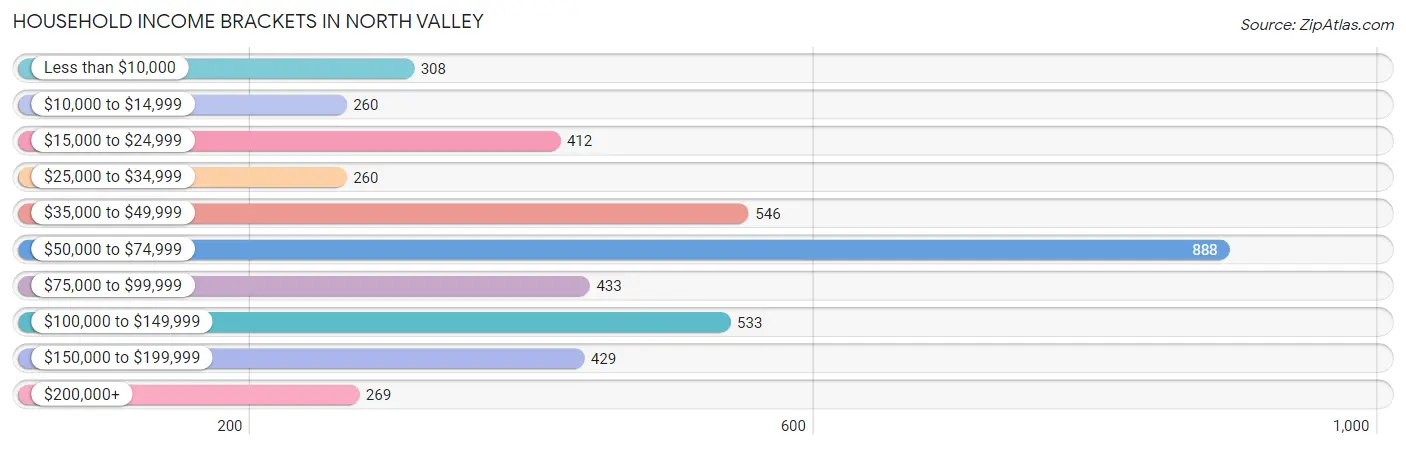
| Income Bracket | # Households | % Households |
| Less than $10,000 | 308 | 7.1% |
| $10,000 to $14,999 | 260 | 6.0% |
| $15,000 to $24,999 | 412 | 9.5% |
| $25,000 to $34,999 | 260 | 6.0% |
| $35,000 to $49,999 | 546 | 12.6% |
| $50,000 to $74,999 | 888 | 20.5% |
| $75,000 to $99,999 | 433 | 10.0% |
| $100,000 to $149,999 | 533 | 12.3% |
| $150,000 to $199,999 | 429 | 9.9% |
| $200,000+ | 269 | 6.2% |
Household Income by Householder Age in North Valley
The median household income in North Valley is $59,421, with the highest median household income of $78,408 found in the 15 to 24 years age bracket for the primary householder. A total of 215 households (5.0%) fall into this category. Meanwhile, the 65+ years age bracket for the primary householder has the lowest median household income of $48,375, with 1,389 households (32.1%) in this group.
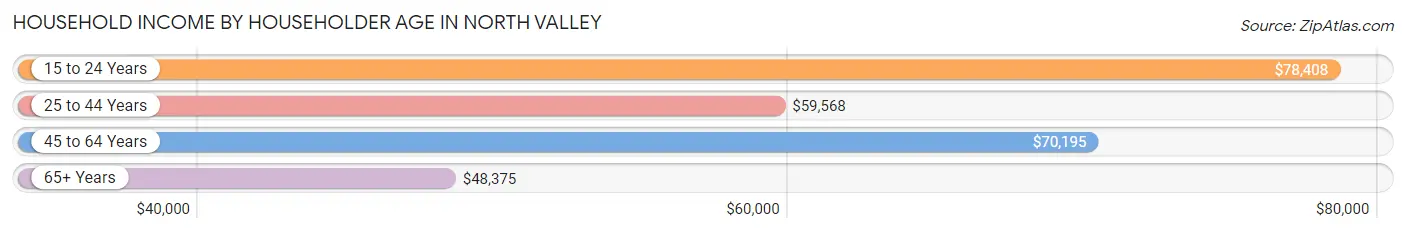
| Income Bracket | # Households | Median Income |
| 15 to 24 Years | 215 (5.0%) | $78,408 |
| 25 to 44 Years | 967 (22.3%) | $59,568 |
| 45 to 64 Years | 1,761 (40.6%) | $70,195 |
| 65+ Years | 1,389 (32.1%) | $48,375 |
| Total | 4,332 (100.0%) | $59,421 |
Poverty in North Valley
Income Below Poverty by Sex and Age in North Valley
With 18.5% poverty level for males and 20.2% for females among the residents of North Valley, 6 to 11 year old males and 35 to 44 year old females are the most vulnerable to poverty, with 283 males (88.7%) and 249 females (47.1%) in their respective age groups living below the poverty level.
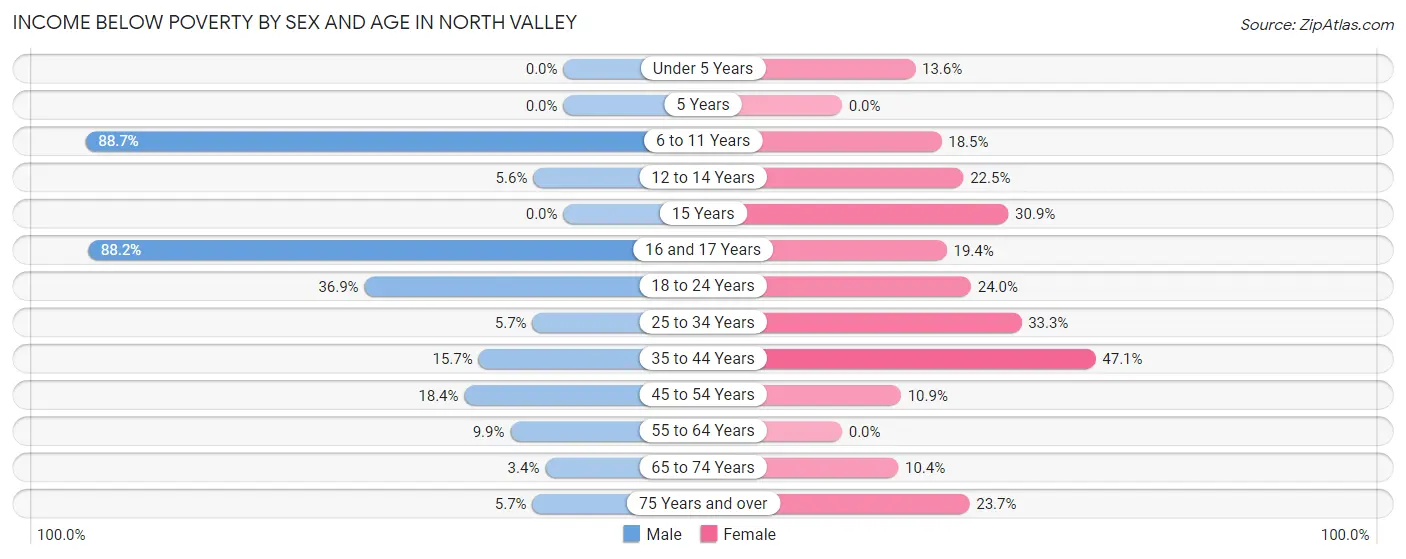
| Age Bracket | Male | Female |
| Under 5 Years | 0 (0.0%) | 25 (13.6%) |
| 5 Years | 0 (0.0%) | 0 (0.0%) |
| 6 to 11 Years | 283 (88.7%) | 84 (18.5%) |
| 12 to 14 Years | 8 (5.6%) | 16 (22.5%) |
| 15 Years | 0 (0.0%) | 21 (30.9%) |
| 16 and 17 Years | 90 (88.2%) | 21 (19.4%) |
| 18 to 24 Years | 144 (36.9%) | 103 (23.9%) |
| 25 to 34 Years | 23 (5.7%) | 361 (33.3%) |
| 35 to 44 Years | 116 (15.7%) | 249 (47.1%) |
| 45 to 54 Years | 181 (18.4%) | 73 (10.9%) |
| 55 to 64 Years | 85 (9.9%) | 0 (0.0%) |
| 65 to 74 Years | 18 (3.4%) | 79 (10.4%) |
| 75 Years and over | 26 (5.7%) | 142 (23.7%) |
| Total | 974 (18.5%) | 1,174 (20.2%) |
Income Above Poverty by Sex and Age in North Valley
According to the poverty statistics in North Valley, males aged under 5 years and females aged 5 years are the age groups that are most secure financially, with 100.0% of males and 100.0% of females in these age groups living above the poverty line.
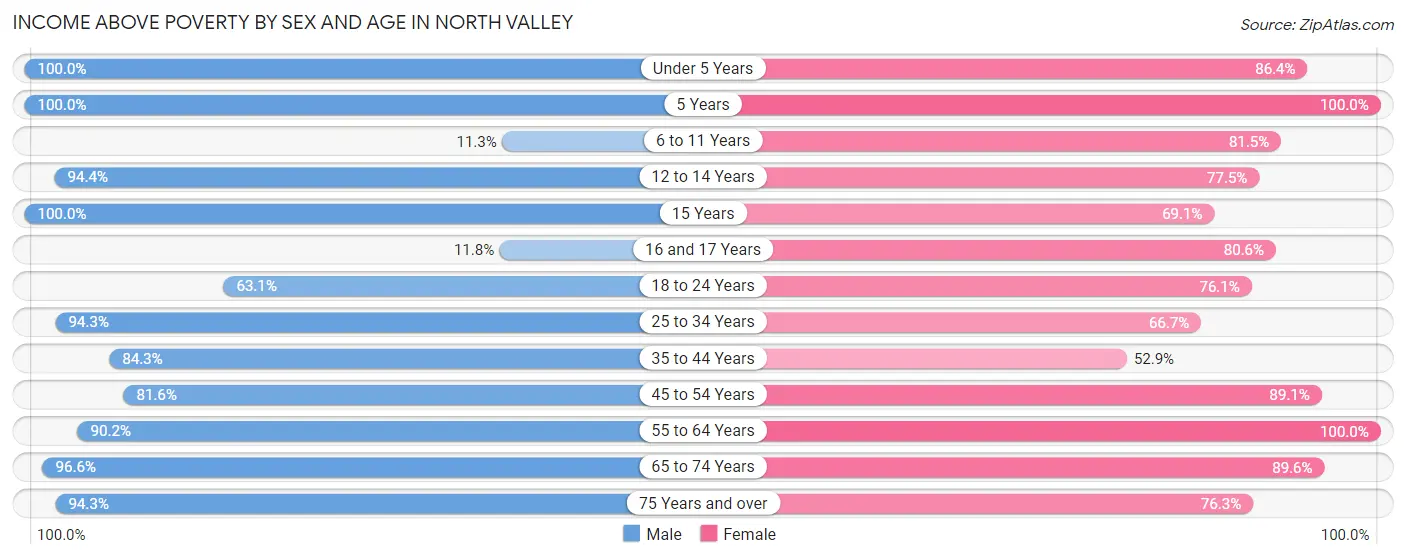
| Age Bracket | Male | Female |
| Under 5 Years | 290 (100.0%) | 159 (86.4%) |
| 5 Years | 26 (100.0%) | 65 (100.0%) |
| 6 to 11 Years | 36 (11.3%) | 371 (81.5%) |
| 12 to 14 Years | 135 (94.4%) | 55 (77.5%) |
| 15 Years | 21 (100.0%) | 47 (69.1%) |
| 16 and 17 Years | 12 (11.8%) | 87 (80.6%) |
| 18 to 24 Years | 246 (63.1%) | 327 (76.0%) |
| 25 to 34 Years | 378 (94.3%) | 723 (66.7%) |
| 35 to 44 Years | 621 (84.3%) | 280 (52.9%) |
| 45 to 54 Years | 804 (81.6%) | 594 (89.1%) |
| 55 to 64 Years | 778 (90.1%) | 807 (100.0%) |
| 65 to 74 Years | 518 (96.6%) | 678 (89.6%) |
| 75 Years and over | 427 (94.3%) | 458 (76.3%) |
| Total | 4,292 (81.5%) | 4,651 (79.8%) |
Income Below Poverty Among Married-Couple Families in North Valley
The poverty statistics for married-couple families in North Valley show that 5.2% or 99 of the total 1,913 families live below the poverty line. Families with 1 or 2 children have the highest poverty rate of 13.6%, comprising of 84 families. On the other hand, families with 3 or 4 children have the lowest poverty rate of 0.0%, which includes 0 families.
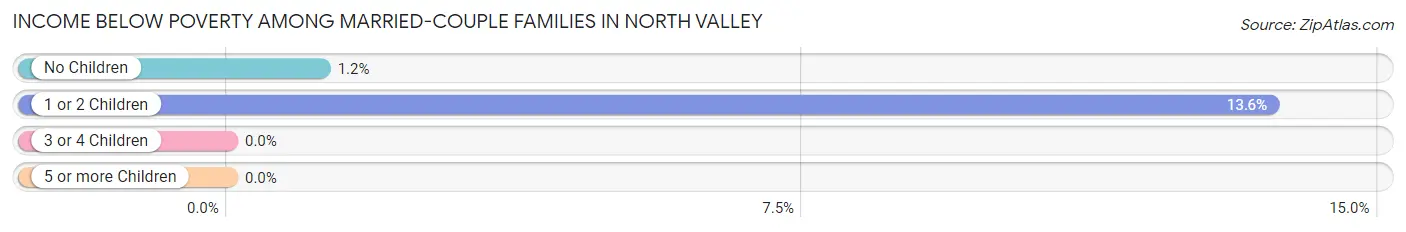
| Children | Above Poverty | Below Poverty |
| No Children | 1,220 (98.8%) | 15 (1.2%) |
| 1 or 2 Children | 534 (86.4%) | 84 (13.6%) |
| 3 or 4 Children | 60 (100.0%) | 0 (0.0%) |
| 5 or more Children | 0 (0.0%) | 0 (0.0%) |
| Total | 1,814 (94.8%) | 99 (5.2%) |
Income Below Poverty Among Single-Parent Households in North Valley
According to the poverty data in North Valley, 21.7% or 73 single-father households and 47.6% or 323 single-mother households are living below the poverty line. Among single-father households, those with 1 or 2 children have the highest poverty rate, with 73 households (75.3%) experiencing poverty. Likewise, among single-mother households, those with 3 or 4 children have the highest poverty rate, with 23 households (95.8%) falling below the poverty line.
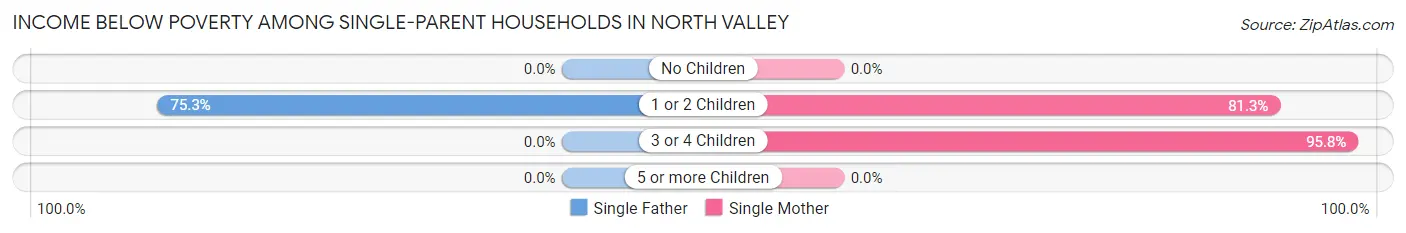
| Children | Single Father | Single Mother |
| No Children | 0 (0.0%) | 0 (0.0%) |
| 1 or 2 Children | 73 (75.3%) | 300 (81.3%) |
| 3 or 4 Children | 0 (0.0%) | 23 (95.8%) |
| 5 or more Children | 0 (0.0%) | 0 (0.0%) |
| Total | 73 (21.7%) | 323 (47.6%) |
Income Below Poverty Among Married-Couple vs Single-Parent Households in North Valley
The poverty data for North Valley shows that 99 of the married-couple family households (5.2%) and 396 of the single-parent households (39.0%) are living below the poverty level. Within the married-couple family households, those with 1 or 2 children have the highest poverty rate, with 84 households (13.6%) falling below the poverty line. Among the single-parent households, those with 1 or 2 children have the highest poverty rate, with 373 household (80.0%) living below poverty.
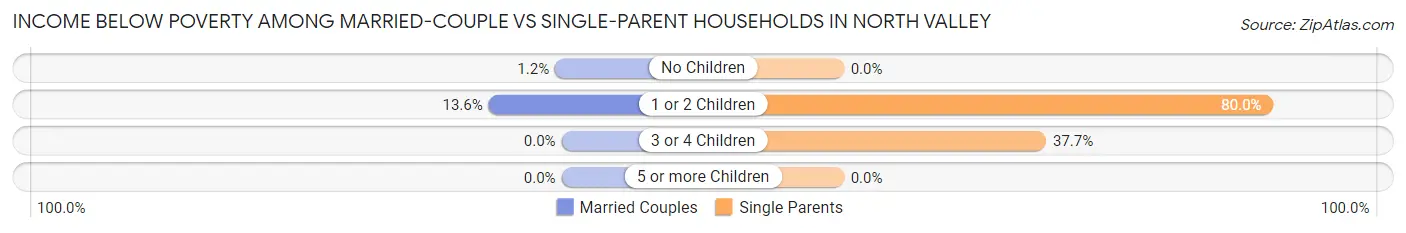
| Children | Married-Couple Families | Single-Parent Households |
| No Children | 15 (1.2%) | 0 (0.0%) |
| 1 or 2 Children | 84 (13.6%) | 373 (80.0%) |
| 3 or 4 Children | 0 (0.0%) | 23 (37.7%) |
| 5 or more Children | 0 (0.0%) | 0 (0.0%) |
| Total | 99 (5.2%) | 396 (39.0%) |
Race in North Valley
The most populous races in North Valley are White / Caucasian (7,597 | 67.5%), Hispanic or Latino (6,403 | 56.9%), and Two or more Races (1,793 | 15.9%).
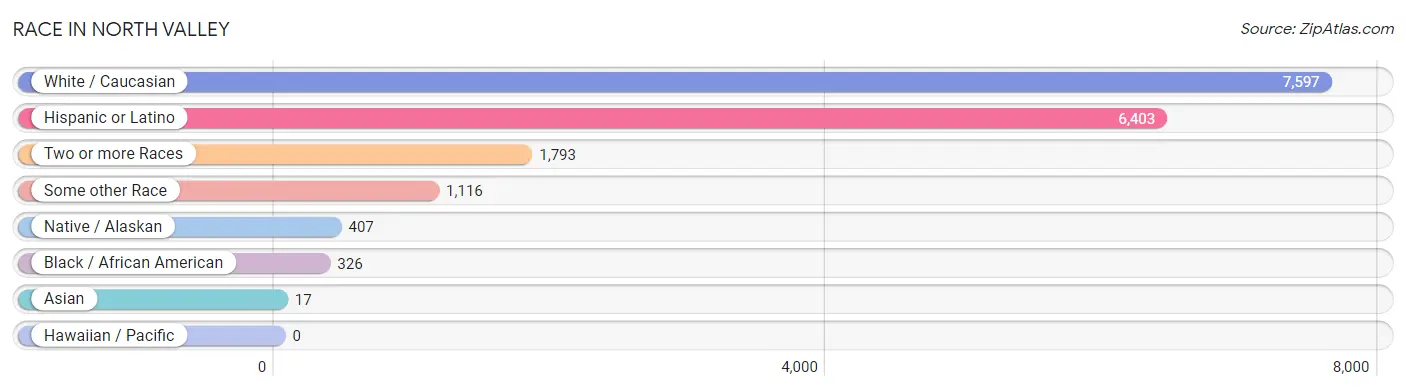
| Race | # Population | % Population |
| Asian | 17 | 0.2% |
| Black / African American | 326 | 2.9% |
| Hawaiian / Pacific | 0 | 0.0% |
| Hispanic or Latino | 6,403 | 56.9% |
| Native / Alaskan | 407 | 3.6% |
| White / Caucasian | 7,597 | 67.5% |
| Two or more Races | 1,793 | 15.9% |
| Some other Race | 1,116 | 9.9% |
| Total | 11,256 | 100.0% |
Ancestry in North Valley
The most populous ancestries reported in North Valley are Mexican (2,709 | 24.1%), Spaniard (941 | 8.4%), Spanish (909 | 8.1%), German (722 | 6.4%), and English (656 | 5.8%), together accounting for 52.7% of all North Valley residents.
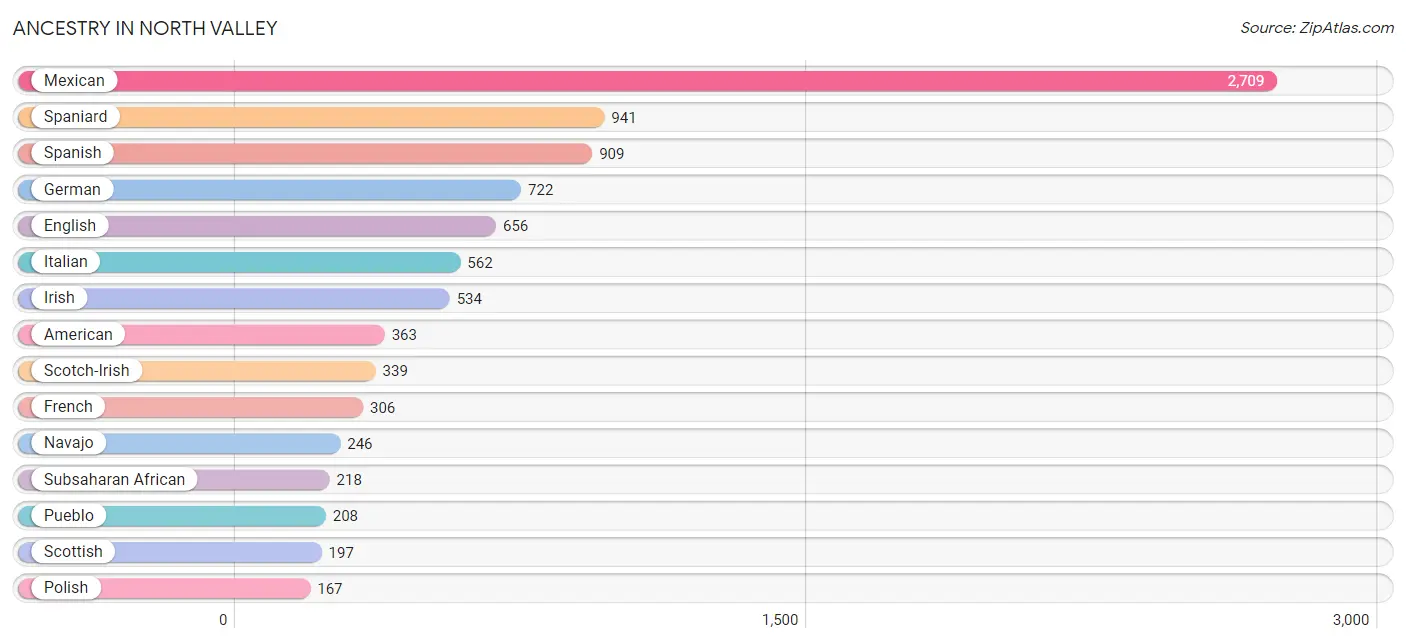
| Ancestry | # Population | % Population |
| American | 363 | 3.2% |
| Apache | 3 | 0.0% |
| Arab | 16 | 0.1% |
| Basque | 14 | 0.1% |
| Belgian | 18 | 0.2% |
| British | 24 | 0.2% |
| Burmese | 8 | 0.1% |
| Cherokee | 7 | 0.1% |
| Chilean | 62 | 0.5% |
| Danish | 83 | 0.7% |
| Dutch | 137 | 1.2% |
| Eastern European | 46 | 0.4% |
| Ecuadorian | 27 | 0.2% |
| English | 656 | 5.8% |
| European | 120 | 1.1% |
| French | 306 | 2.7% |
| German | 722 | 6.4% |
| Greek | 12 | 0.1% |
| Indian (Asian) | 68 | 0.6% |
| Iranian | 35 | 0.3% |
| Irish | 534 | 4.7% |
| Italian | 562 | 5.0% |
| Mexican | 2,709 | 24.1% |
| Moroccan | 16 | 0.1% |
| Navajo | 246 | 2.2% |
| Northern European | 111 | 1.0% |
| Norwegian | 64 | 0.6% |
| Pennsylvania German | 17 | 0.2% |
| Polish | 167 | 1.5% |
| Pueblo | 208 | 1.8% |
| Puerto Rican | 17 | 0.2% |
| Scandinavian | 76 | 0.7% |
| Scotch-Irish | 339 | 3.0% |
| Scottish | 197 | 1.8% |
| Slovak | 16 | 0.1% |
| South American | 89 | 0.8% |
| Spaniard | 941 | 8.4% |
| Spanish | 909 | 8.1% |
| Subsaharan African | 218 | 1.9% |
| Swedish | 123 | 1.1% |
| Swiss | 11 | 0.1% |
| Ukrainian | 14 | 0.1% |
| Welsh | 59 | 0.5% | View All 43 Rows |
Immigrants in North Valley
The most numerous immigrant groups reported in North Valley came from Latin America (611 | 5.4%), Central America (584 | 5.2%), Mexico (584 | 5.2%), Africa (221 | 2.0%), and Middle Africa (221 | 2.0%), together accounting for 19.7% of all North Valley residents.
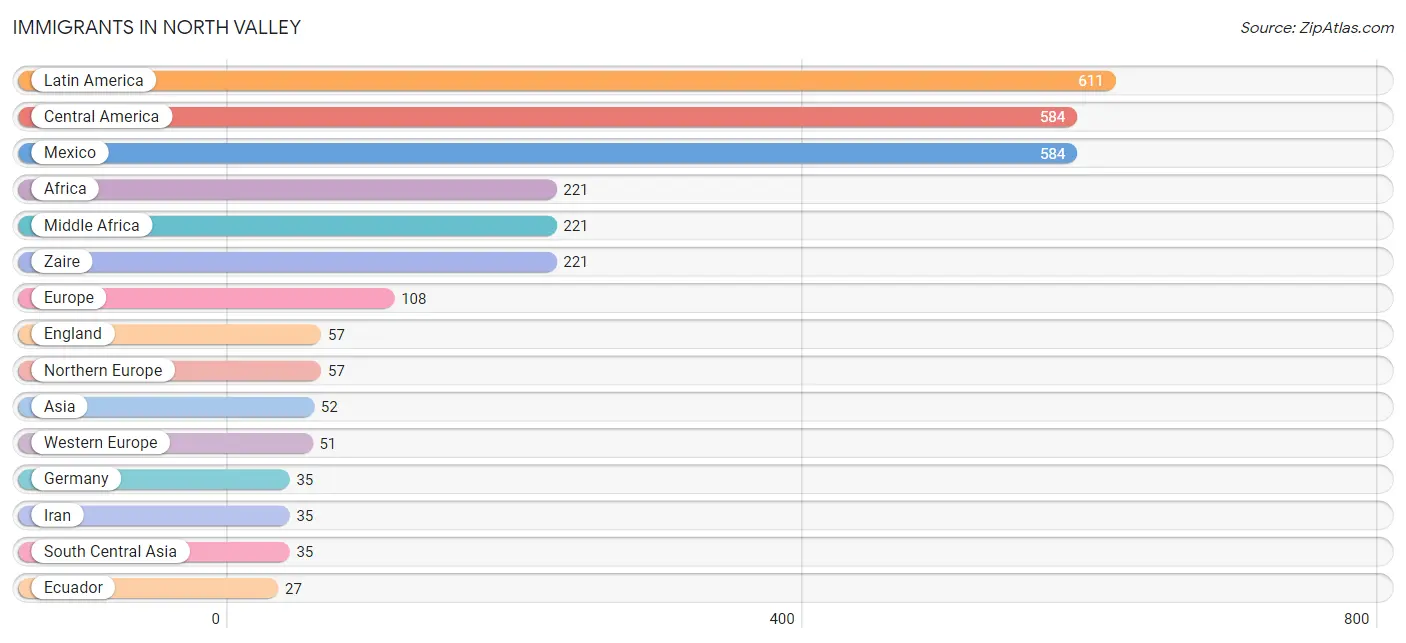
| Immigration Origin | # Population | % Population |
| Africa | 221 | 2.0% |
| Asia | 52 | 0.5% |
| Canada | 14 | 0.1% |
| Central America | 584 | 5.2% |
| China | 17 | 0.2% |
| Eastern Asia | 17 | 0.2% |
| Ecuador | 27 | 0.2% |
| England | 57 | 0.5% |
| Europe | 108 | 1.0% |
| France | 16 | 0.1% |
| Germany | 35 | 0.3% |
| Hong Kong | 17 | 0.2% |
| Iran | 35 | 0.3% |
| Latin America | 611 | 5.4% |
| Mexico | 584 | 5.2% |
| Middle Africa | 221 | 2.0% |
| Northern Europe | 57 | 0.5% |
| South America | 27 | 0.2% |
| South Central Asia | 35 | 0.3% |
| Western Europe | 51 | 0.4% |
| Zaire | 221 | 2.0% | View All 21 Rows |
Sex and Age in North Valley
Sex and Age in North Valley
The most populous age groups in North Valley are 45 to 49 Years (665 | 12.3%) for men and 60 to 64 Years (567 | 9.7%) for women.
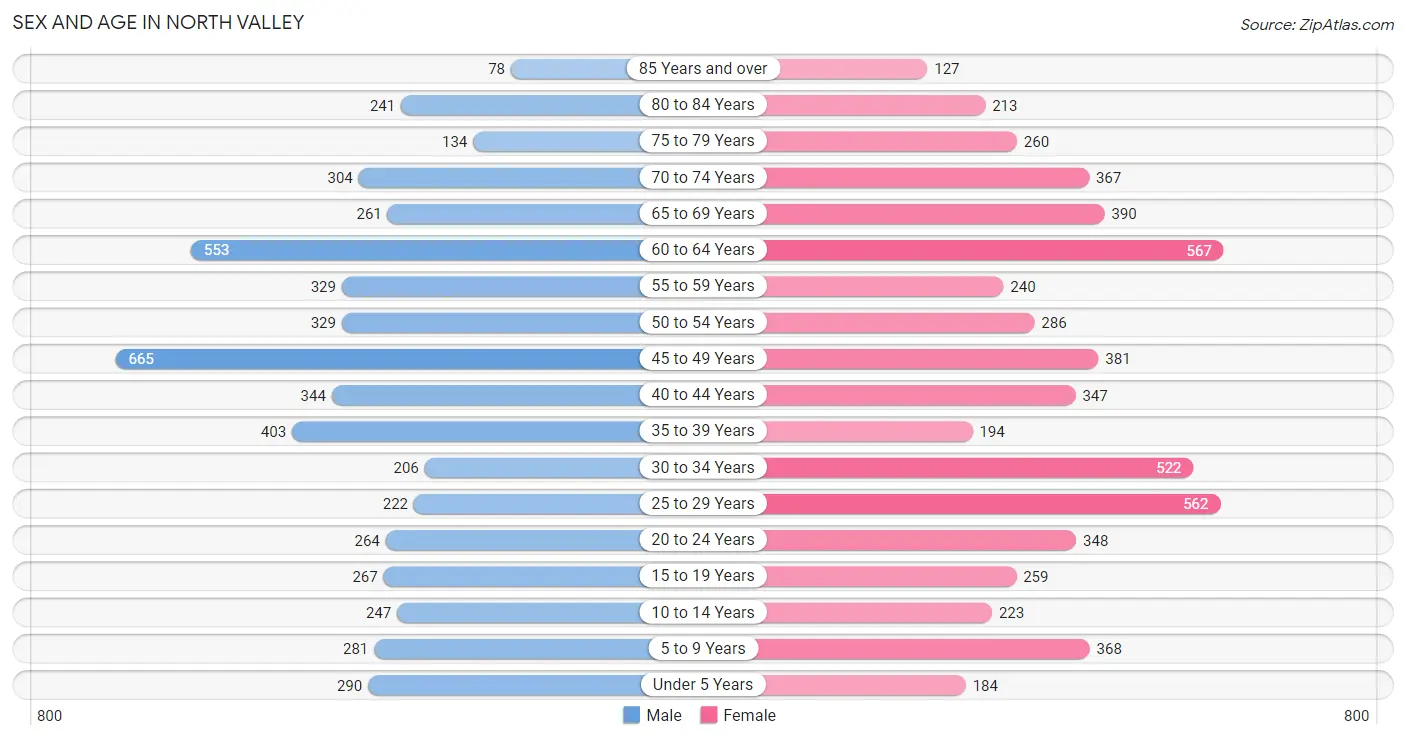
| Age Bracket | Male | Female |
| Under 5 Years | 290 (5.3%) | 184 (3.2%) |
| 5 to 9 Years | 281 (5.2%) | 368 (6.3%) |
| 10 to 14 Years | 247 (4.6%) | 223 (3.8%) |
| 15 to 19 Years | 267 (4.9%) | 259 (4.4%) |
| 20 to 24 Years | 264 (4.9%) | 348 (6.0%) |
| 25 to 29 Years | 222 (4.1%) | 562 (9.6%) |
| 30 to 34 Years | 206 (3.8%) | 522 (8.9%) |
| 35 to 39 Years | 403 (7.4%) | 194 (3.3%) |
| 40 to 44 Years | 344 (6.4%) | 347 (5.9%) |
| 45 to 49 Years | 665 (12.3%) | 381 (6.5%) |
| 50 to 54 Years | 329 (6.1%) | 286 (4.9%) |
| 55 to 59 Years | 329 (6.1%) | 240 (4.1%) |
| 60 to 64 Years | 553 (10.2%) | 567 (9.7%) |
| 65 to 69 Years | 261 (4.8%) | 390 (6.7%) |
| 70 to 74 Years | 304 (5.6%) | 367 (6.3%) |
| 75 to 79 Years | 134 (2.5%) | 260 (4.4%) |
| 80 to 84 Years | 241 (4.4%) | 213 (3.6%) |
| 85 Years and over | 78 (1.4%) | 127 (2.2%) |
| Total | 5,418 (100.0%) | 5,838 (100.0%) |
Families and Households in North Valley
Median Family Size in North Valley
The median family size in North Valley is 3.07 persons per family, with married-couple families (1,913 | 65.3%) accounting for the largest median family size of 3.12 persons per family. On the other hand, single female/mother families (679 | 23.2%) represent the smallest median family size with 2.97 persons per family.
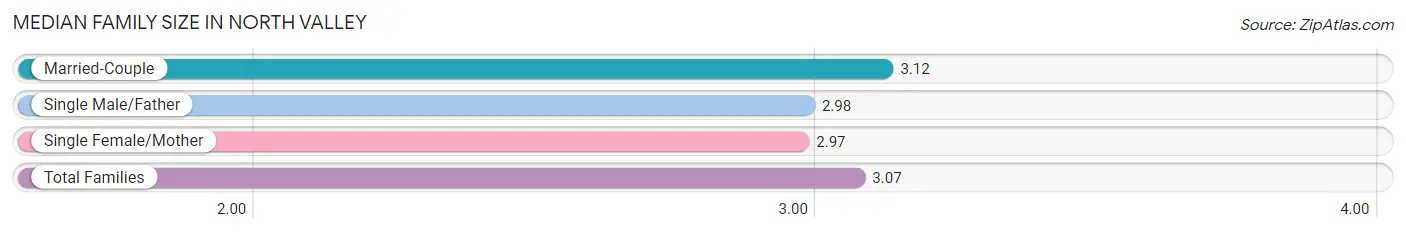
| Family Type | # Families | Family Size |
| Married-Couple | 1,913 (65.3%) | 3.12 |
| Single Male/Father | 336 (11.5%) | 2.98 |
| Single Female/Mother | 679 (23.2%) | 2.97 |
| Total Families | 2,928 (100.0%) | 3.07 |
Median Household Size in North Valley
The median household size in North Valley is 2.57 persons per household, with single male/father households (336 | 7.8%) accounting for the largest median household size of 3.28 persons per household. non-family households (1,404 | 32.4%) represent the smallest median household size with 1.20 persons per household.
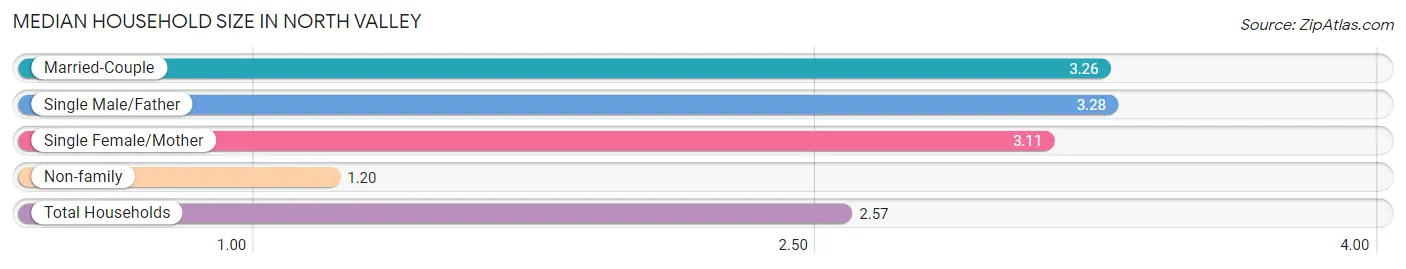
| Household Type | # Households | Household Size |
| Married-Couple | 1,913 (44.2%) | 3.26 |
| Single Male/Father | 336 (7.8%) | 3.28 |
| Single Female/Mother | 679 (15.7%) | 3.11 |
| Non-family | 1,404 (32.4%) | 1.20 |
| Total Households | 4,332 (100.0%) | 2.57 |
Household Size by Marriage Status in North Valley
Out of a total of 4,332 households in North Valley, 2,928 (67.6%) are family households, while 1,404 (32.4%) are nonfamily households. The most numerous type of family households are 2-person households, comprising 1,164, and the most common type of nonfamily households are 1-person households, comprising 1,162.
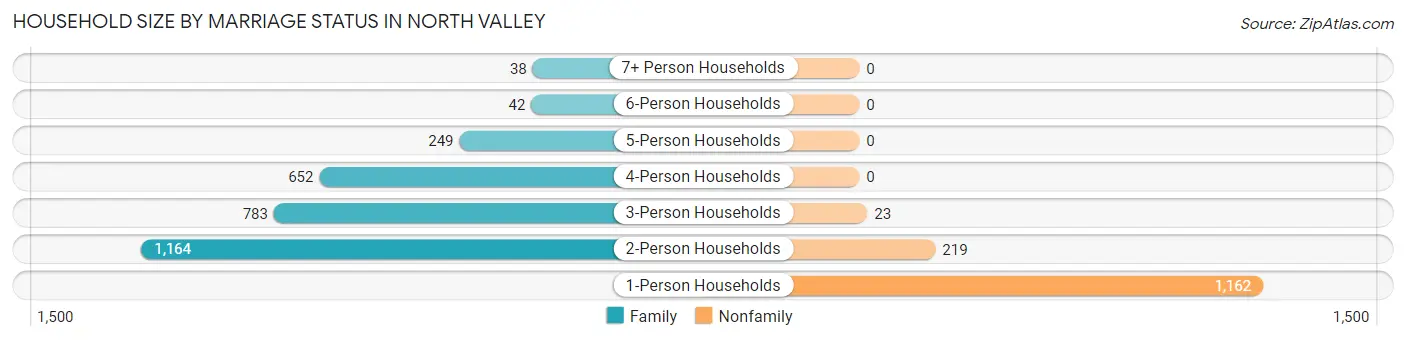
| Household Size | Family Households | Nonfamily Households |
| 1-Person Households | - | 1,162 (26.8%) |
| 2-Person Households | 1,164 (26.9%) | 219 (5.1%) |
| 3-Person Households | 783 (18.1%) | 23 (0.5%) |
| 4-Person Households | 652 (15.0%) | 0 (0.0%) |
| 5-Person Households | 249 (5.8%) | 0 (0.0%) |
| 6-Person Households | 42 (1.0%) | 0 (0.0%) |
| 7+ Person Households | 38 (0.9%) | 0 (0.0%) |
| Total | 2,928 (67.6%) | 1,404 (32.4%) |
Female Fertility in North Valley
Fertility by Age in North Valley
Average fertility rate in North Valley is 6.0 births per 1,000 women. Women in the age bracket of 20 to 34 years have the highest fertility rate with 12.0 births per 1,000 women. Women in the age bracket of 20 to 34 years acount for 100.0% of all women with births.
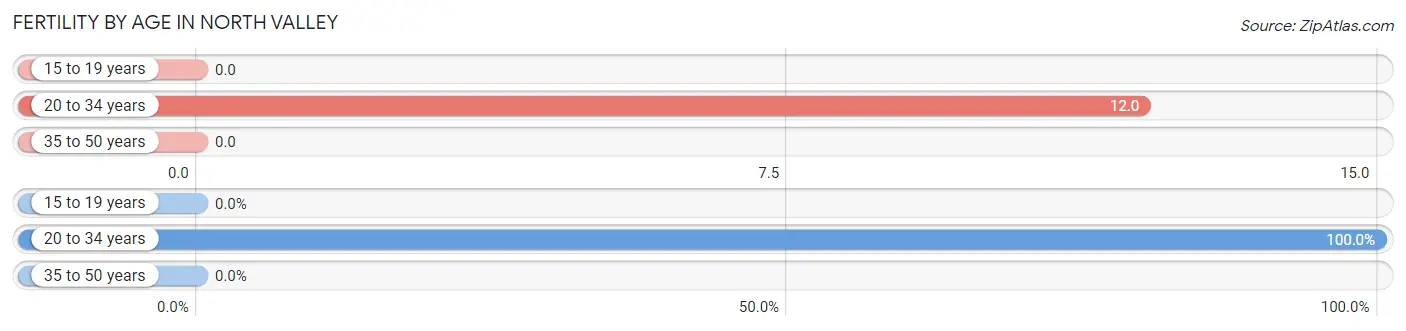
| Age Bracket | Women with Births | Births / 1,000 Women |
| 15 to 19 years | 0 (0.0%) | 0.0 |
| 20 to 34 years | 17 (100.0%) | 12.0 |
| 35 to 50 years | 0 (0.0%) | 0.0 |
| Total | 17 (100.0%) | 6.0 |
Fertility by Age by Marriage Status in North Valley
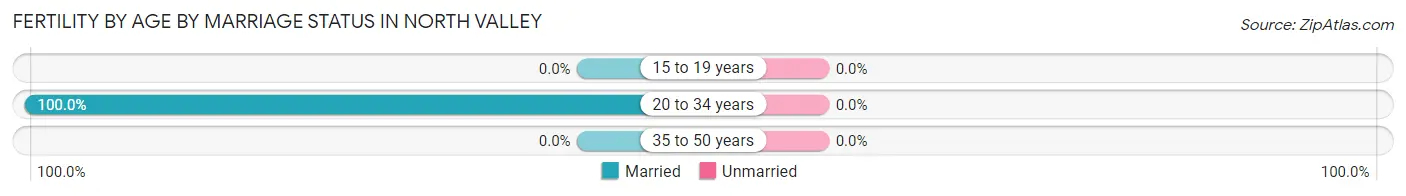
| Age Bracket | Married | Unmarried |
| 15 to 19 years | 0 (0.0%) | 0 (0.0%) |
| 20 to 34 years | 17 (100.0%) | 0 (0.0%) |
| 35 to 50 years | 0 (0.0%) | 0 (0.0%) |
| Total | 17 (100.0%) | 0 (0.0%) |
Fertility by Education in North Valley
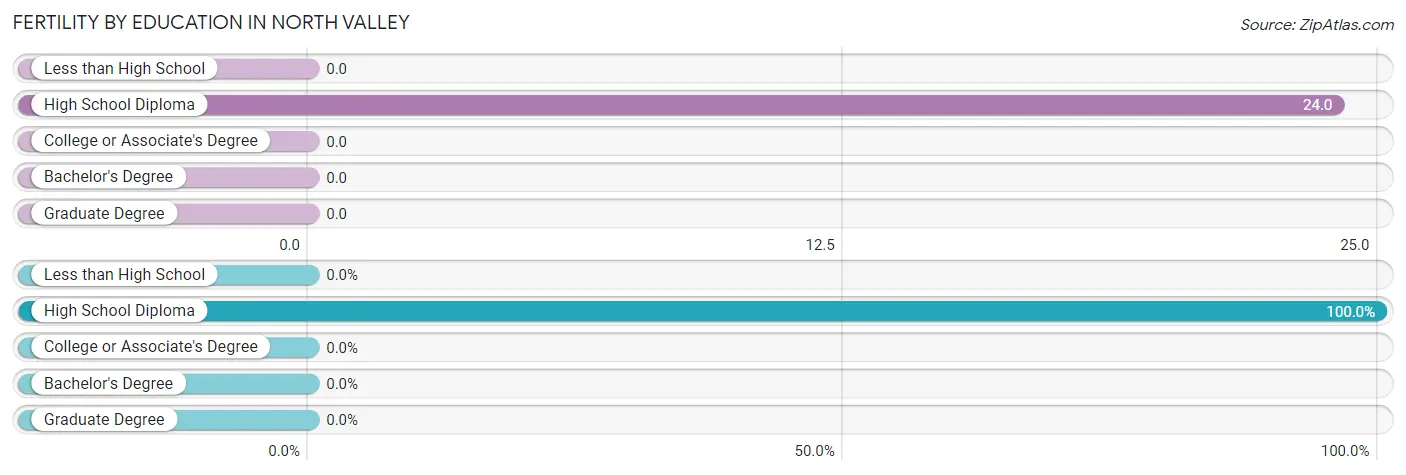
| Educational Attainment | Women with Births | Births / 1,000 Women |
| Less than High School | 0 (0.0%) | 0.0 |
| High School Diploma | 17 (100.0%) | 24.0 |
| College or Associate's Degree | 0 (0.0%) | 0.0 |
| Bachelor's Degree | 0 (0.0%) | 0.0 |
| Graduate Degree | 0 (0.0%) | 0.0 |
| Total | 17 (100.0%) | 6.0 |
Fertility by Education by Marriage Status in North Valley
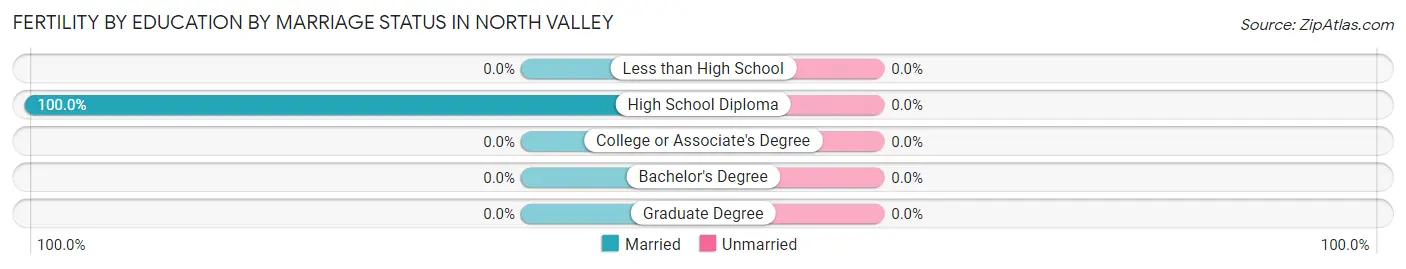
| Educational Attainment | Married | Unmarried |
| Less than High School | 0 (0.0%) | 0 (0.0%) |
| High School Diploma | 17 (100.0%) | 0 (0.0%) |
| College or Associate's Degree | 0 (0.0%) | 0 (0.0%) |
| Bachelor's Degree | 0 (0.0%) | 0 (0.0%) |
| Graduate Degree | 0 (0.0%) | 0 (0.0%) |
| Total | 17 (100.0%) | 0 (0.0%) |
Employment Characteristics in North Valley
Employment by Class of Employer in North Valley
Among the 4,930 employed individuals in North Valley, private company employees (3,076 | 62.4%), not-for-profit organizations (551 | 11.2%), and local government employees (471 | 9.6%) make up the most common classes of employment.
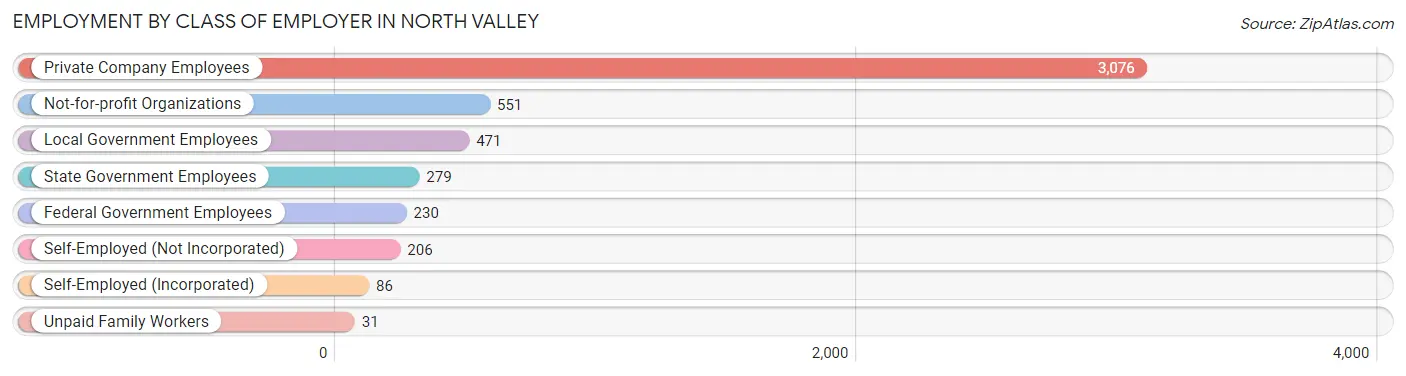
| Employer Class | # Employees | % Employees |
| Private Company Employees | 3,076 | 62.4% |
| Self-Employed (Incorporated) | 86 | 1.7% |
| Self-Employed (Not Incorporated) | 206 | 4.2% |
| Not-for-profit Organizations | 551 | 11.2% |
| Local Government Employees | 471 | 9.6% |
| State Government Employees | 279 | 5.7% |
| Federal Government Employees | 230 | 4.7% |
| Unpaid Family Workers | 31 | 0.6% |
| Total | 4,930 | 100.0% |
Employment Status by Age in North Valley
According to the labor force statistics for North Valley, out of the total population over 16 years of age (9,573), 54.2% or 5,189 individuals are in the labor force, with 4.6% or 239 of them unemployed. The age group with the highest labor force participation rate is 35 to 44 years, with 81.0% or 1,043 individuals in the labor force. Within the labor force, the 16 to 19 years age range has the highest percentage of unemployed individuals, with 29.1% or 74 of them being unemployed.
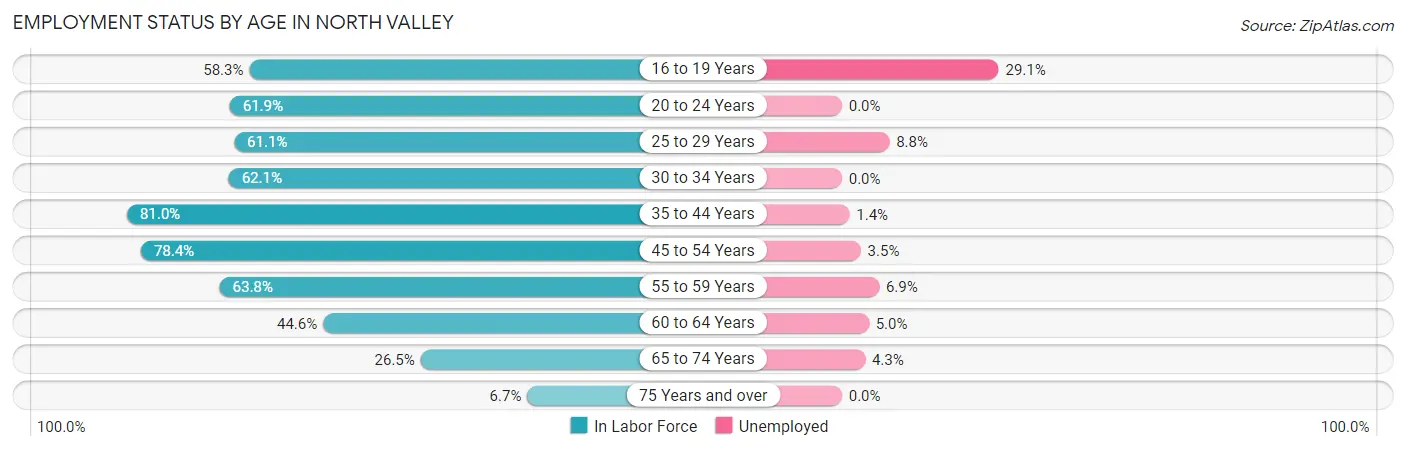
| Age Bracket | In Labor Force | Unemployed |
| 16 to 19 Years | 254 (58.3%) | 74 (29.1%) |
| 20 to 24 Years | 379 (61.9%) | 0 (0.0%) |
| 25 to 29 Years | 479 (61.1%) | 42 (8.8%) |
| 30 to 34 Years | 452 (62.1%) | 0 (0.0%) |
| 35 to 44 Years | 1,043 (81.0%) | 15 (1.4%) |
| 45 to 54 Years | 1,302 (78.4%) | 46 (3.5%) |
| 55 to 59 Years | 363 (63.8%) | 25 (6.9%) |
| 60 to 64 Years | 500 (44.6%) | 25 (5.0%) |
| 65 to 74 Years | 350 (26.5%) | 15 (4.3%) |
| 75 Years and over | 71 (6.7%) | 0 (0.0%) |
| Total | 5,189 (54.2%) | 239 (4.6%) |
Employment Status by Educational Attainment in North Valley
According to labor force statistics for North Valley, 67.3% of individuals (4,139) out of the total population between 25 and 64 years of age (6,150) are in the labor force, with 3.7% or 153 of them being unemployed. The group with the highest labor force participation rate are those with the educational attainment of bachelor's degree or higher, with 85.9% or 1,306 individuals in the labor force. Within the labor force, individuals with college / associate degree education have the highest percentage of unemployment, with 6.2% or 81 of them being unemployed.
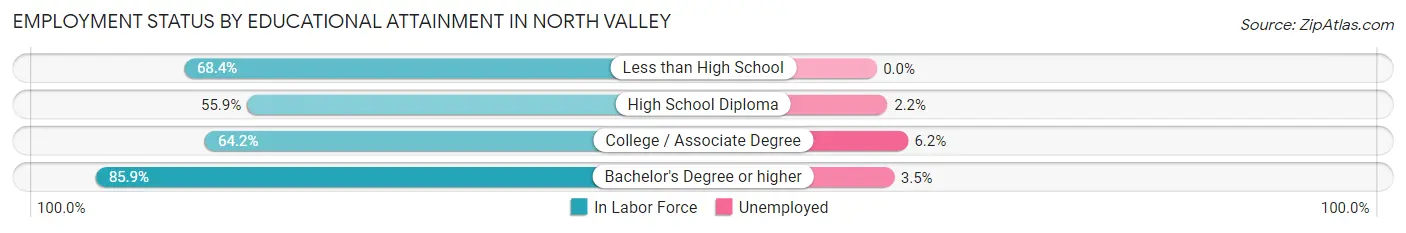
| Educational Attainment | In Labor Force | Unemployed |
| Less than High School | 411 (68.4%) | 0 (0.0%) |
| High School Diploma | 1,120 (55.9%) | 44 (2.2%) |
| College / Associate Degree | 1,300 (64.2%) | 126 (6.2%) |
| Bachelor's Degree or higher | 1,306 (85.9%) | 53 (3.5%) |
| Total | 4,139 (67.3%) | 228 (3.7%) |
Employment Occupations by Sex in North Valley
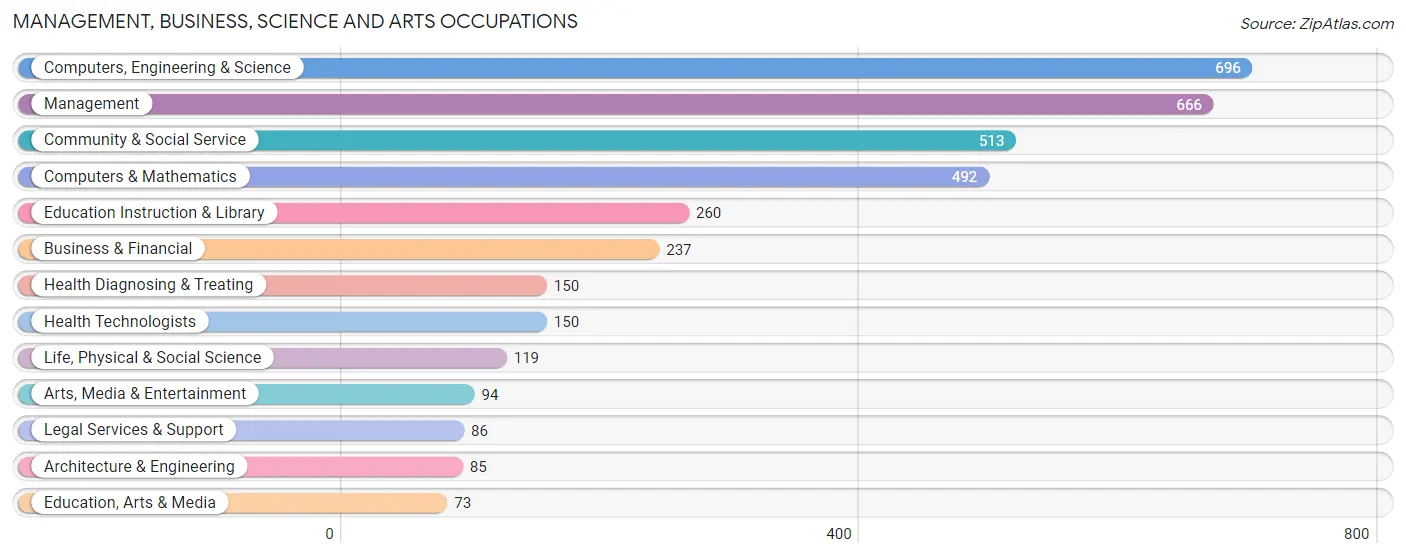
Management, Business, Science and Arts Occupations
The most common Management, Business, Science and Arts occupations in North Valley are Computers, Engineering & Science (696 | 14.1%), Management (666 | 13.5%), Community & Social Service (513 | 10.4%), Computers & Mathematics (492 | 9.9%), and Education Instruction & Library (260 | 5.2%).
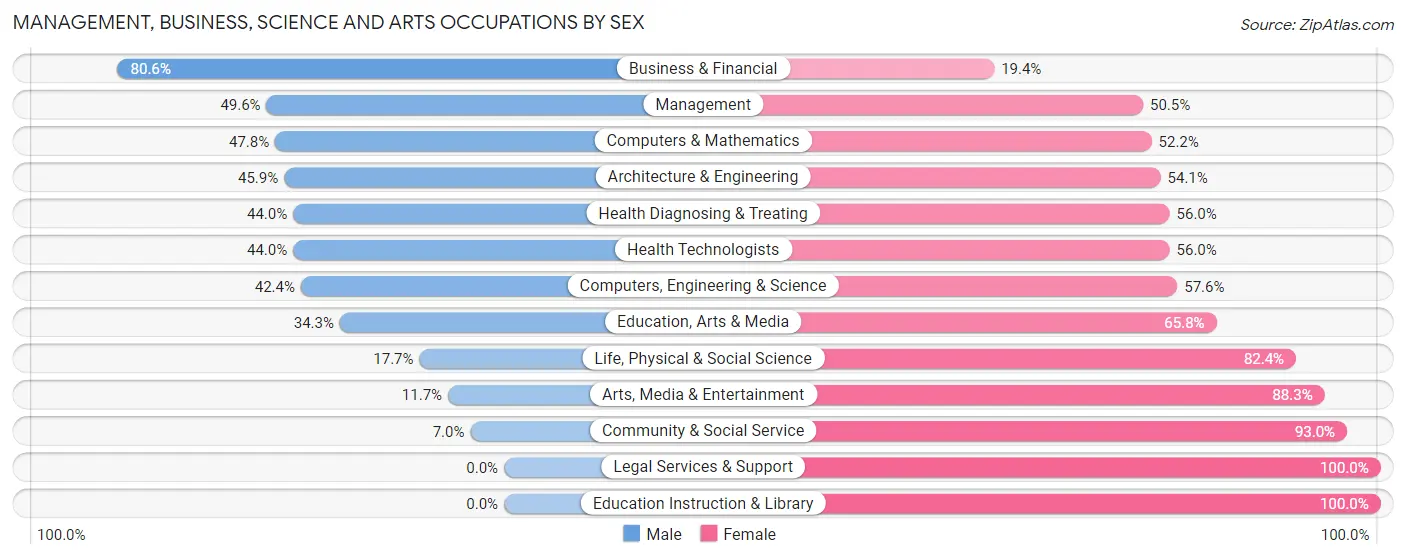
Management, Business, Science and Arts Occupations by Sex
Within the Management, Business, Science and Arts occupations in North Valley, the most male-oriented occupations are Business & Financial (80.6%), Management (49.5%), and Computers & Mathematics (47.8%), while the most female-oriented occupations are Legal Services & Support (100.0%), Education Instruction & Library (100.0%), and Community & Social Service (93.0%).
| Occupation | Male | Female |
| Management | 330 (49.5%) | 336 (50.4%) |
| Business & Financial | 191 (80.6%) | 46 (19.4%) |
| Computers, Engineering & Science | 295 (42.4%) | 401 (57.6%) |
| Computers & Mathematics | 235 (47.8%) | 257 (52.2%) |
| Architecture & Engineering | 39 (45.9%) | 46 (54.1%) |
| Life, Physical & Social Science | 21 (17.6%) | 98 (82.4%) |
| Community & Social Service | 36 (7.0%) | 477 (93.0%) |
| Education, Arts & Media | 25 (34.3%) | 48 (65.7%) |
| Legal Services & Support | 0 (0.0%) | 86 (100.0%) |
| Education Instruction & Library | 0 (0.0%) | 260 (100.0%) |
| Arts, Media & Entertainment | 11 (11.7%) | 83 (88.3%) |
| Health Diagnosing & Treating | 66 (44.0%) | 84 (56.0%) |
| Health Technologists | 66 (44.0%) | 84 (56.0%) |
| Total (Category) | 918 (40.6%) | 1,344 (59.4%) |
| Total (Overall) | 2,497 (50.4%) | 2,454 (49.6%) |
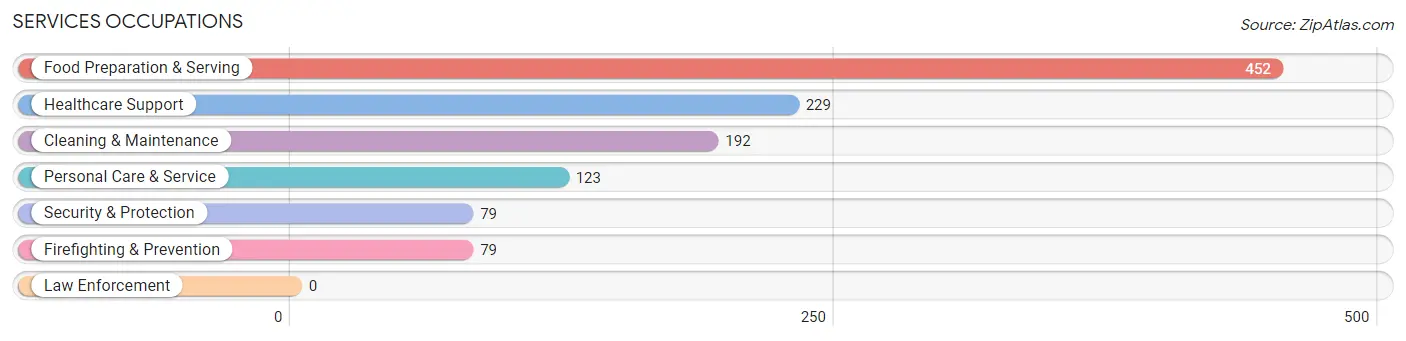
Services Occupations
The most common Services occupations in North Valley are Food Preparation & Serving (452 | 9.1%), Healthcare Support (229 | 4.6%), Cleaning & Maintenance (192 | 3.9%), Personal Care & Service (123 | 2.5%), and Security & Protection (79 | 1.6%).
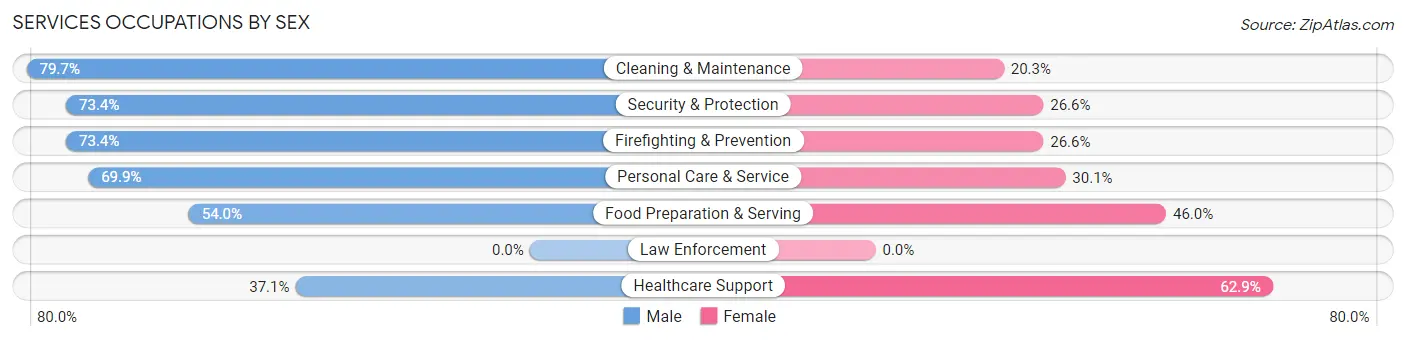
Services Occupations by Sex
Within the Services occupations in North Valley, the most male-oriented occupations are Cleaning & Maintenance (79.7%), Security & Protection (73.4%), and Firefighting & Prevention (73.4%), while the most female-oriented occupations are Healthcare Support (62.9%), Food Preparation & Serving (46.0%), and Personal Care & Service (30.1%).
| Occupation | Male | Female |
| Healthcare Support | 85 (37.1%) | 144 (62.9%) |
| Security & Protection | 58 (73.4%) | 21 (26.6%) |
| Firefighting & Prevention | 58 (73.4%) | 21 (26.6%) |
| Law Enforcement | 0 (0.0%) | 0 (0.0%) |
| Food Preparation & Serving | 244 (54.0%) | 208 (46.0%) |
| Cleaning & Maintenance | 153 (79.7%) | 39 (20.3%) |
| Personal Care & Service | 86 (69.9%) | 37 (30.1%) |
| Total (Category) | 626 (58.2%) | 449 (41.8%) |
| Total (Overall) | 2,497 (50.4%) | 2,454 (49.6%) |
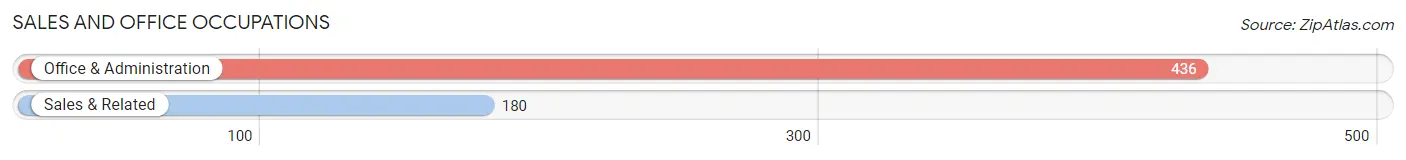
Sales and Office Occupations
The most common Sales and Office occupations in North Valley are Office & Administration (436 | 8.8%), and Sales & Related (180 | 3.6%).
Sales and Office Occupations by Sex
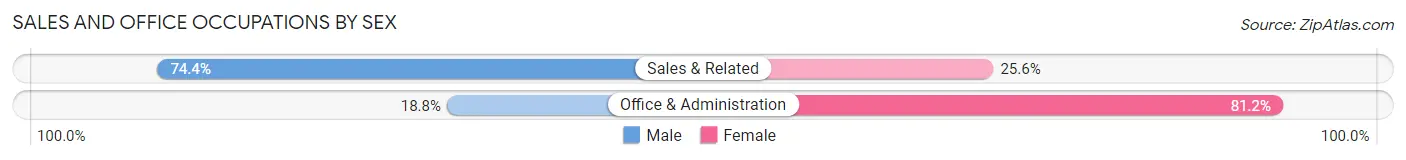
| Occupation | Male | Female |
| Sales & Related | 134 (74.4%) | 46 (25.6%) |
| Office & Administration | 82 (18.8%) | 354 (81.2%) |
| Total (Category) | 216 (35.1%) | 400 (64.9%) |
| Total (Overall) | 2,497 (50.4%) | 2,454 (49.6%) |
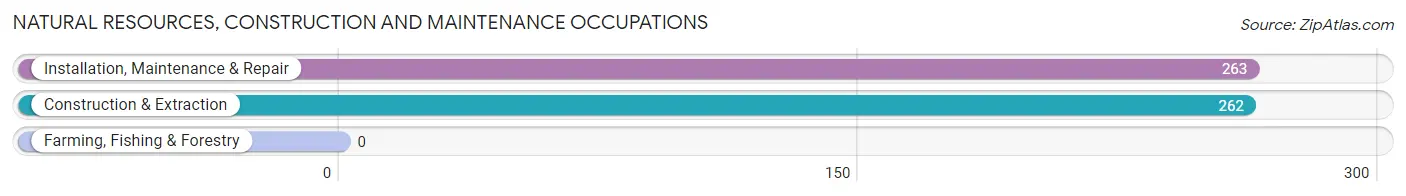
Natural Resources, Construction and Maintenance Occupations
The most common Natural Resources, Construction and Maintenance occupations in North Valley are Installation, Maintenance & Repair (263 | 5.3%), and Construction & Extraction (262 | 5.3%).
Natural Resources, Construction and Maintenance Occupations by Sex
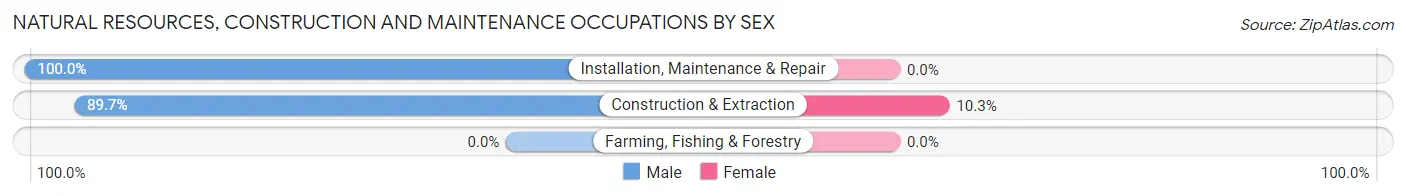
| Occupation | Male | Female |
| Farming, Fishing & Forestry | 0 (0.0%) | 0 (0.0%) |
| Construction & Extraction | 235 (89.7%) | 27 (10.3%) |
| Installation, Maintenance & Repair | 263 (100.0%) | 0 (0.0%) |
| Total (Category) | 498 (94.9%) | 27 (5.1%) |
| Total (Overall) | 2,497 (50.4%) | 2,454 (49.6%) |
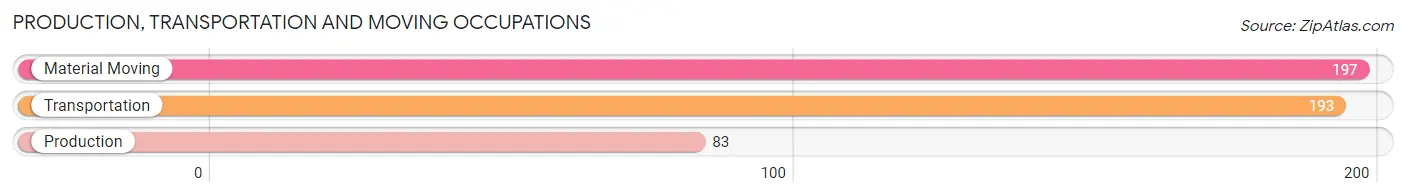
Production, Transportation and Moving Occupations
The most common Production, Transportation and Moving occupations in North Valley are Material Moving (197 | 4.0%), Transportation (193 | 3.9%), and Production (83 | 1.7%).
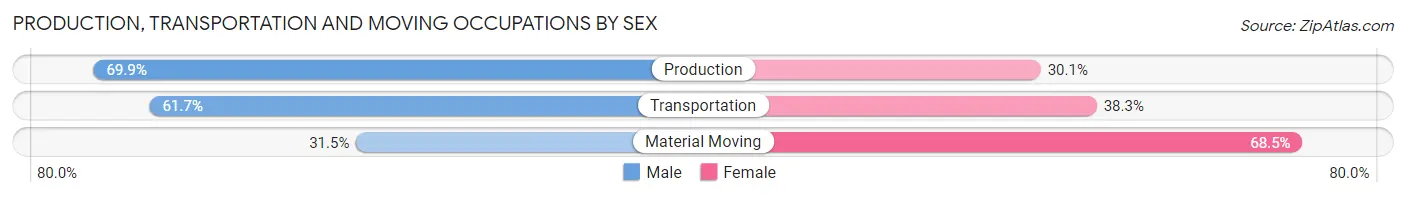
Production, Transportation and Moving Occupations by Sex
| Occupation | Male | Female |
| Production | 58 (69.9%) | 25 (30.1%) |
| Transportation | 119 (61.7%) | 74 (38.3%) |
| Material Moving | 62 (31.5%) | 135 (68.5%) |
| Total (Category) | 239 (50.5%) | 234 (49.5%) |
| Total (Overall) | 2,497 (50.4%) | 2,454 (49.6%) |
Employment Industries by Sex in North Valley
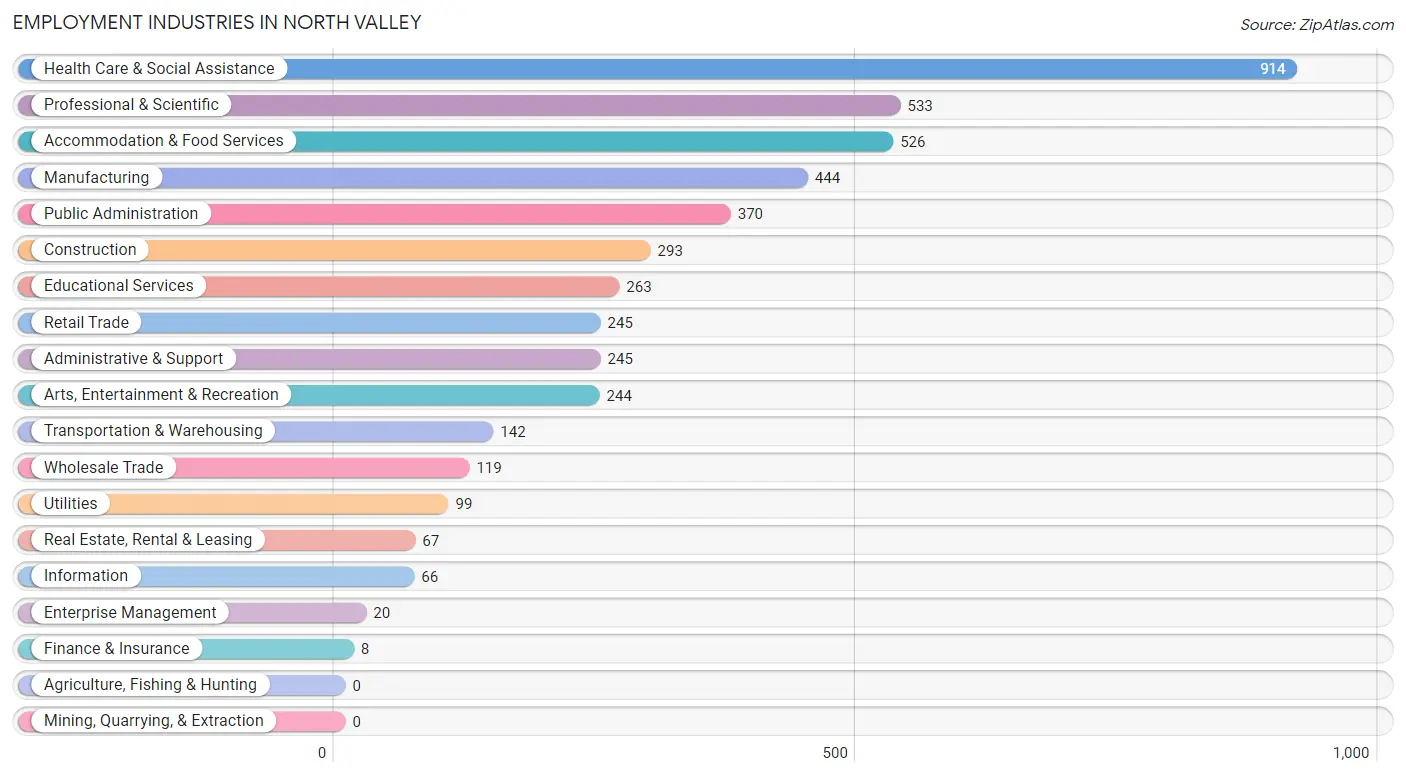
Employment Industries in North Valley
The major employment industries in North Valley include Health Care & Social Assistance (914 | 18.5%), Professional & Scientific (533 | 10.8%), Accommodation & Food Services (526 | 10.6%), Manufacturing (444 | 9.0%), and Public Administration (370 | 7.5%).
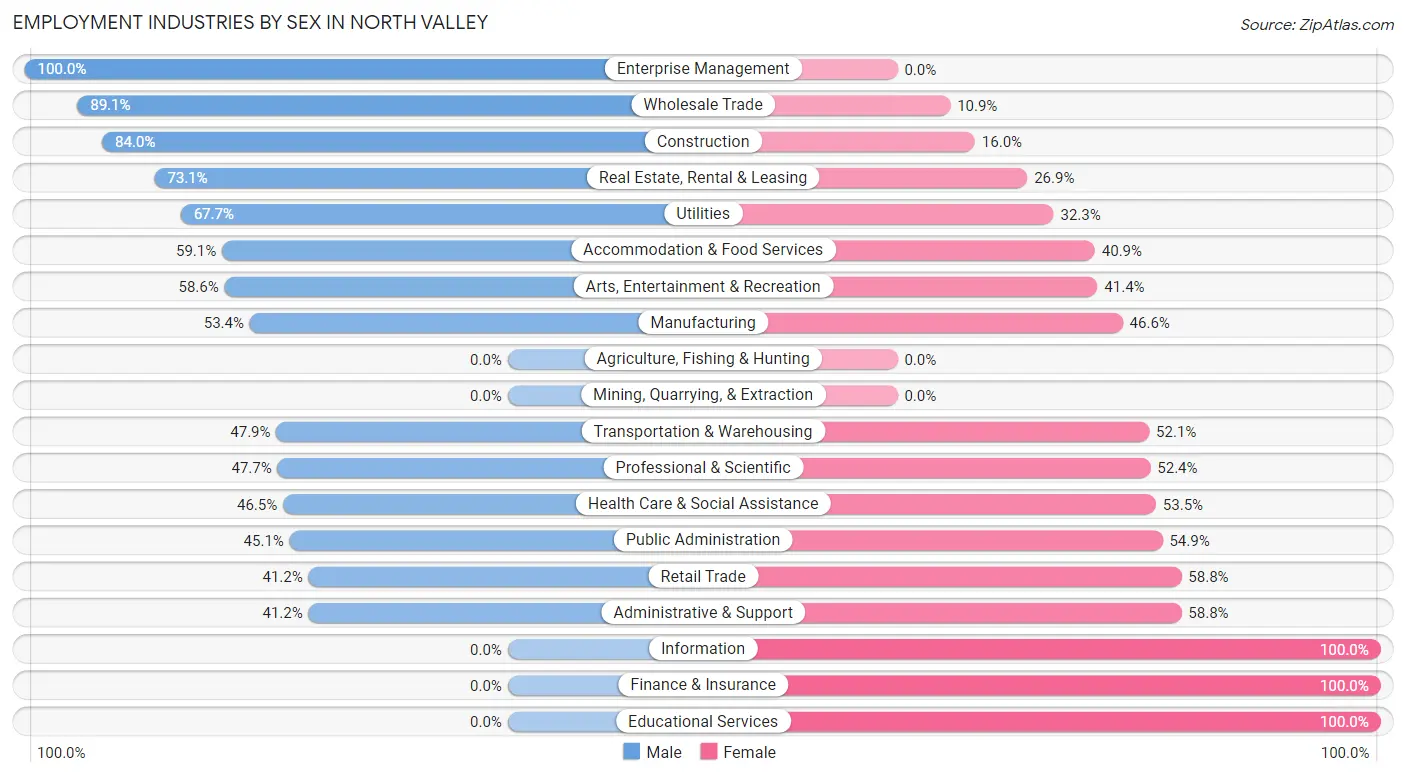
Employment Industries by Sex in North Valley
The North Valley industries that see more men than women are Enterprise Management (100.0%), Wholesale Trade (89.1%), and Construction (84.0%), whereas the industries that tend to have a higher number of women are Information (100.0%), Finance & Insurance (100.0%), and Educational Services (100.0%).
| Industry | Male | Female |
| Agriculture, Fishing & Hunting | 0 (0.0%) | 0 (0.0%) |
| Mining, Quarrying, & Extraction | 0 (0.0%) | 0 (0.0%) |
| Construction | 246 (84.0%) | 47 (16.0%) |
| Manufacturing | 237 (53.4%) | 207 (46.6%) |
| Wholesale Trade | 106 (89.1%) | 13 (10.9%) |
| Retail Trade | 101 (41.2%) | 144 (58.8%) |
| Transportation & Warehousing | 68 (47.9%) | 74 (52.1%) |
| Utilities | 67 (67.7%) | 32 (32.3%) |
| Information | 0 (0.0%) | 66 (100.0%) |
| Finance & Insurance | 0 (0.0%) | 8 (100.0%) |
| Real Estate, Rental & Leasing | 49 (73.1%) | 18 (26.9%) |
| Professional & Scientific | 254 (47.6%) | 279 (52.3%) |
| Enterprise Management | 20 (100.0%) | 0 (0.0%) |
| Administrative & Support | 101 (41.2%) | 144 (58.8%) |
| Educational Services | 0 (0.0%) | 263 (100.0%) |
| Health Care & Social Assistance | 425 (46.5%) | 489 (53.5%) |
| Arts, Entertainment & Recreation | 143 (58.6%) | 101 (41.4%) |
| Accommodation & Food Services | 311 (59.1%) | 215 (40.9%) |
| Public Administration | 167 (45.1%) | 203 (54.9%) |
| Total | 2,497 (50.4%) | 2,454 (49.6%) |
Education in North Valley
School Enrollment in North Valley
The most common levels of schooling among the 2,032 students in North Valley are elementary school (535 | 26.3%), high school (463 | 22.8%), and college / undergraduate (390 | 19.2%).
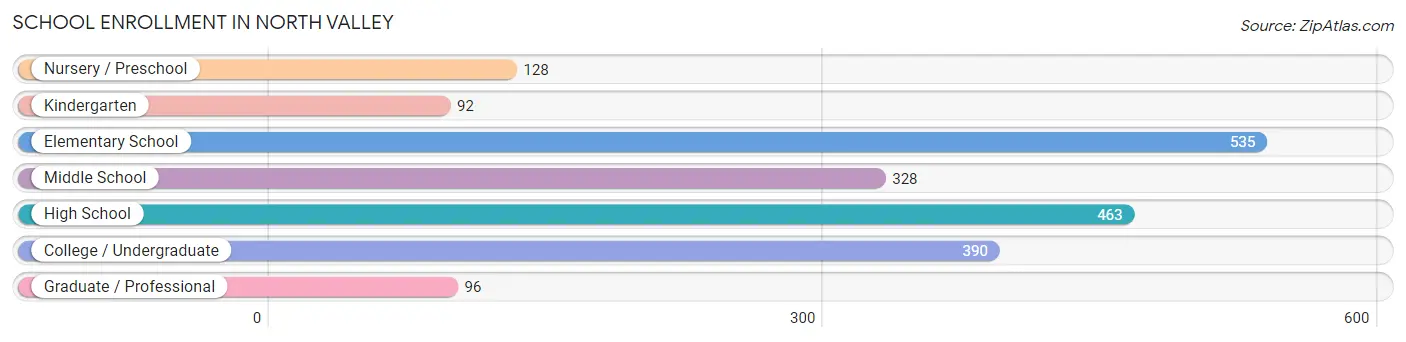
| School Level | # Students | % Students |
| Nursery / Preschool | 128 | 6.3% |
| Kindergarten | 92 | 4.5% |
| Elementary School | 535 | 26.3% |
| Middle School | 328 | 16.1% |
| High School | 463 | 22.8% |
| College / Undergraduate | 390 | 19.2% |
| Graduate / Professional | 96 | 4.7% |
| Total | 2,032 | 100.0% |
School Enrollment by Age by Funding Source in North Valley
Out of a total of 2,032 students who are enrolled in schools in North Valley, 246 (12.1%) attend a private institution, while the remaining 1,786 (87.9%) are enrolled in public schools. The age group of 35 years and over has the highest likelihood of being enrolled in private schools, with 43 (32.8% in the age bracket) enrolled. Conversely, the age group of 25 to 34 year olds has the lowest likelihood of being enrolled in a private school, with 130 (100.0% in the age bracket) attending a public institution.
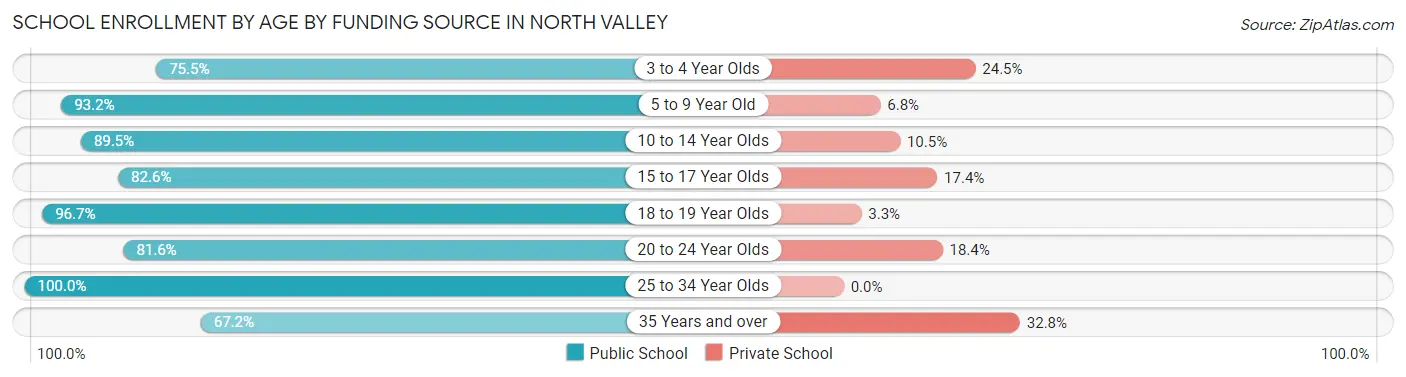
| Age Bracket | Public School | Private School |
| 3 to 4 Year Olds | 80 (75.5%) | 26 (24.5%) |
| 5 to 9 Year Old | 546 (93.2%) | 40 (6.8%) |
| 10 to 14 Year Olds | 418 (89.5%) | 49 (10.5%) |
| 15 to 17 Year Olds | 223 (82.6%) | 47 (17.4%) |
| 18 to 19 Year Olds | 147 (96.7%) | 5 (3.3%) |
| 20 to 24 Year Olds | 155 (81.6%) | 35 (18.4%) |
| 25 to 34 Year Olds | 130 (100.0%) | 0 (0.0%) |
| 35 Years and over | 88 (67.2%) | 43 (32.8%) |
| Total | 1,786 (87.9%) | 246 (12.1%) |
Educational Attainment by Field of Study in North Valley
Business (436 | 18.3%), education (317 | 13.3%), literature & languages (232 | 9.8%), social sciences (210 | 8.8%), and visual & performing arts (195 | 8.2%) are the most common fields of study among 2,378 individuals in North Valley who have obtained a bachelor's degree or higher.
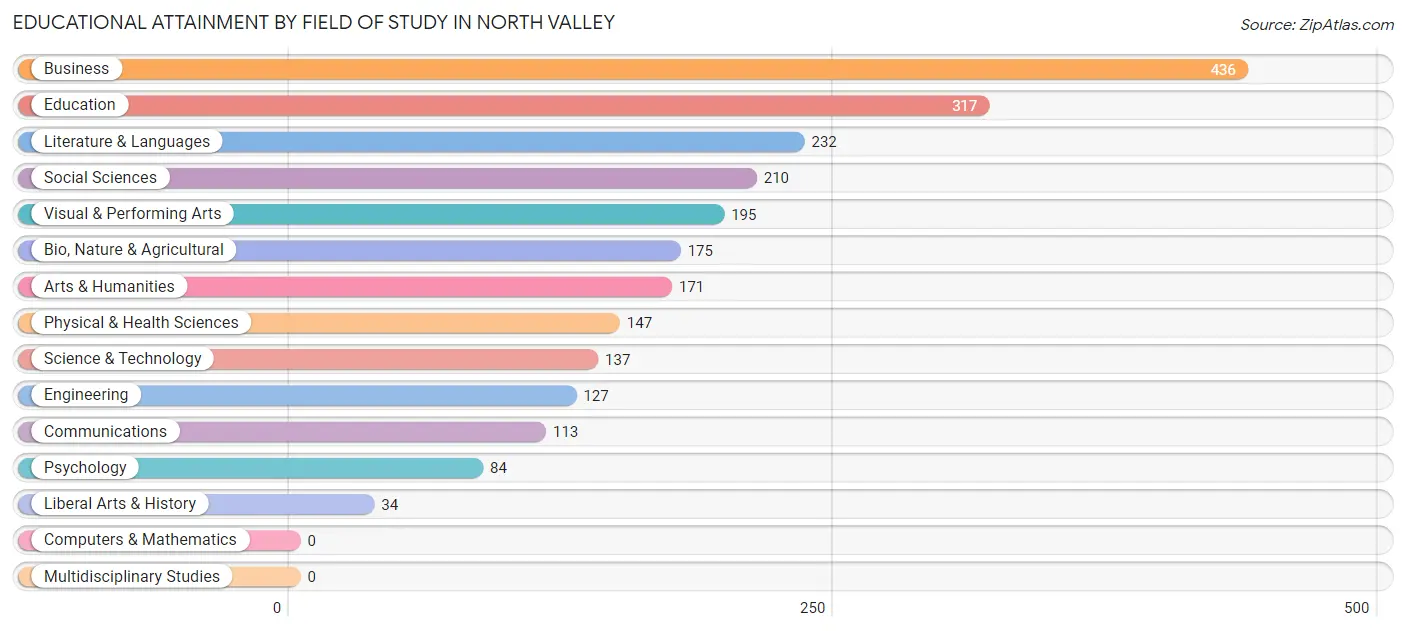
| Field of Study | # Graduates | % Graduates |
| Computers & Mathematics | 0 | 0.0% |
| Bio, Nature & Agricultural | 175 | 7.4% |
| Physical & Health Sciences | 147 | 6.2% |
| Psychology | 84 | 3.5% |
| Social Sciences | 210 | 8.8% |
| Engineering | 127 | 5.3% |
| Multidisciplinary Studies | 0 | 0.0% |
| Science & Technology | 137 | 5.8% |
| Business | 436 | 18.3% |
| Education | 317 | 13.3% |
| Literature & Languages | 232 | 9.8% |
| Liberal Arts & History | 34 | 1.4% |
| Visual & Performing Arts | 195 | 8.2% |
| Communications | 113 | 4.8% |
| Arts & Humanities | 171 | 7.2% |
| Total | 2,378 | 100.0% |
Transportation & Commute in North Valley
Vehicle Availability by Sex in North Valley
The most prevalent vehicle ownership categories in North Valley are males with 2 vehicles (1,001, accounting for 40.4%) and females with 2 vehicles (1,042, making up 40.8%).
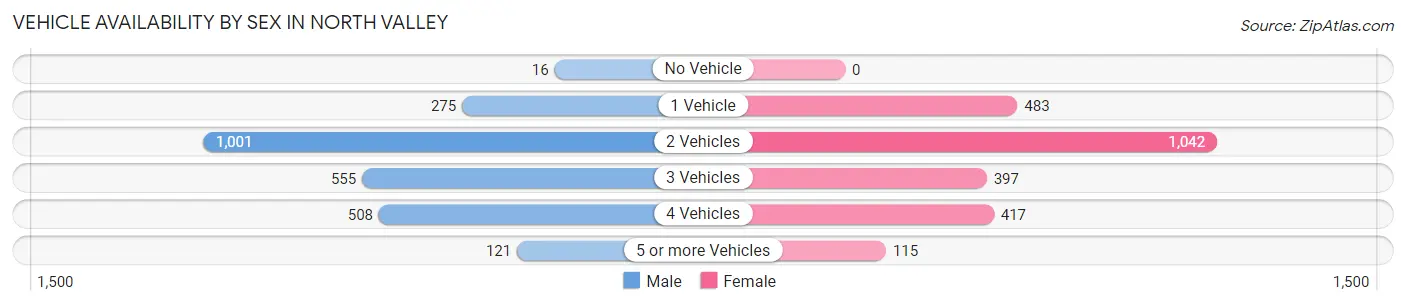
| Vehicles Available | Male | Female |
| No Vehicle | 16 (0.6%) | 0 (0.0%) |
| 1 Vehicle | 275 (11.1%) | 483 (19.7%) |
| 2 Vehicles | 1,001 (40.4%) | 1,042 (42.5%) |
| 3 Vehicles | 555 (22.4%) | 397 (16.2%) |
| 4 Vehicles | 508 (20.5%) | 417 (17.0%) |
| 5 or more Vehicles | 121 (4.9%) | 115 (4.7%) |
| Total | 2,476 (100.0%) | 2,454 (100.0%) |
Commute Time in North Valley
The most frequently occuring commute durations in North Valley are 30 to 34 minutes (1,066 commuters, 24.8%), 15 to 19 minutes (886 commuters, 20.6%), and 10 to 14 minutes (770 commuters, 17.9%).
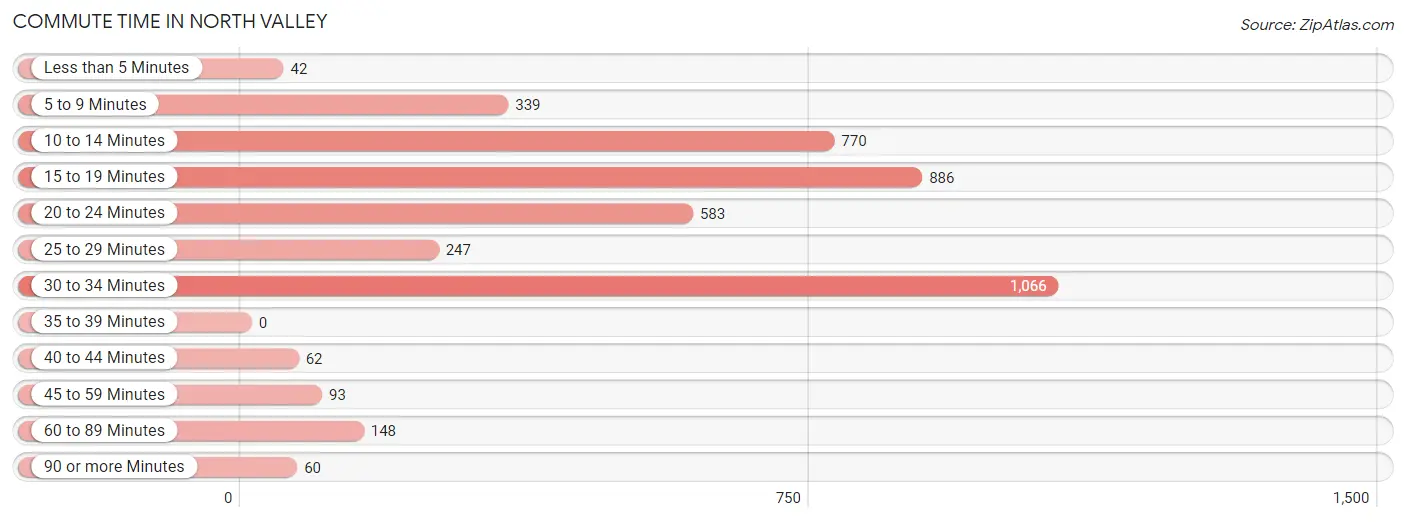
| Commute Time | # Commuters | % Commuters |
| Less than 5 Minutes | 42 | 1.0% |
| 5 to 9 Minutes | 339 | 7.9% |
| 10 to 14 Minutes | 770 | 17.9% |
| 15 to 19 Minutes | 886 | 20.6% |
| 20 to 24 Minutes | 583 | 13.6% |
| 25 to 29 Minutes | 247 | 5.8% |
| 30 to 34 Minutes | 1,066 | 24.8% |
| 35 to 39 Minutes | 0 | 0.0% |
| 40 to 44 Minutes | 62 | 1.4% |
| 45 to 59 Minutes | 93 | 2.2% |
| 60 to 89 Minutes | 148 | 3.5% |
| 90 or more Minutes | 60 | 1.4% |
Commute Time by Sex in North Valley
The most common commute times in North Valley are 30 to 34 minutes (519 commuters, 24.6%) for males and 30 to 34 minutes (547 commuters, 25.1%) for females.
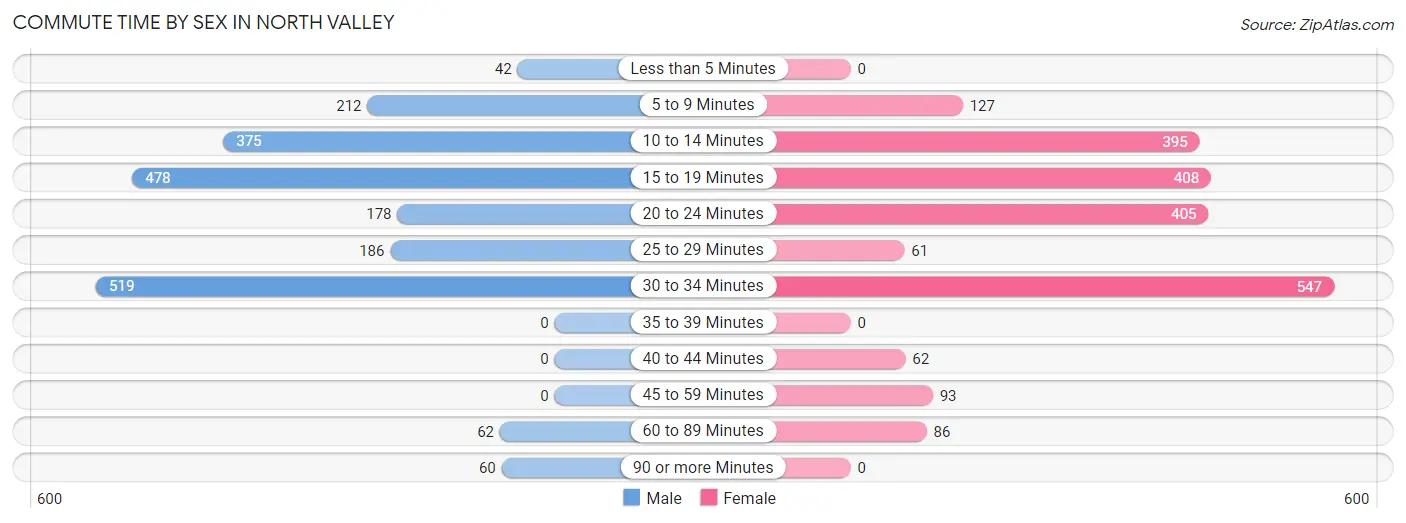
| Commute Time | Male | Female |
| Less than 5 Minutes | 42 (2.0%) | 0 (0.0%) |
| 5 to 9 Minutes | 212 (10.0%) | 127 (5.8%) |
| 10 to 14 Minutes | 375 (17.8%) | 395 (18.1%) |
| 15 to 19 Minutes | 478 (22.6%) | 408 (18.7%) |
| 20 to 24 Minutes | 178 (8.4%) | 405 (18.5%) |
| 25 to 29 Minutes | 186 (8.8%) | 61 (2.8%) |
| 30 to 34 Minutes | 519 (24.6%) | 547 (25.1%) |
| 35 to 39 Minutes | 0 (0.0%) | 0 (0.0%) |
| 40 to 44 Minutes | 0 (0.0%) | 62 (2.8%) |
| 45 to 59 Minutes | 0 (0.0%) | 93 (4.3%) |
| 60 to 89 Minutes | 62 (2.9%) | 86 (3.9%) |
| 90 or more Minutes | 60 (2.8%) | 0 (0.0%) |
Time of Departure to Work by Sex in North Valley
The most frequent times of departure to work in North Valley are 6:30 AM to 6:59 AM (335, 15.9%) for males and 8:00 AM to 8:29 AM (485, 22.2%) for females.
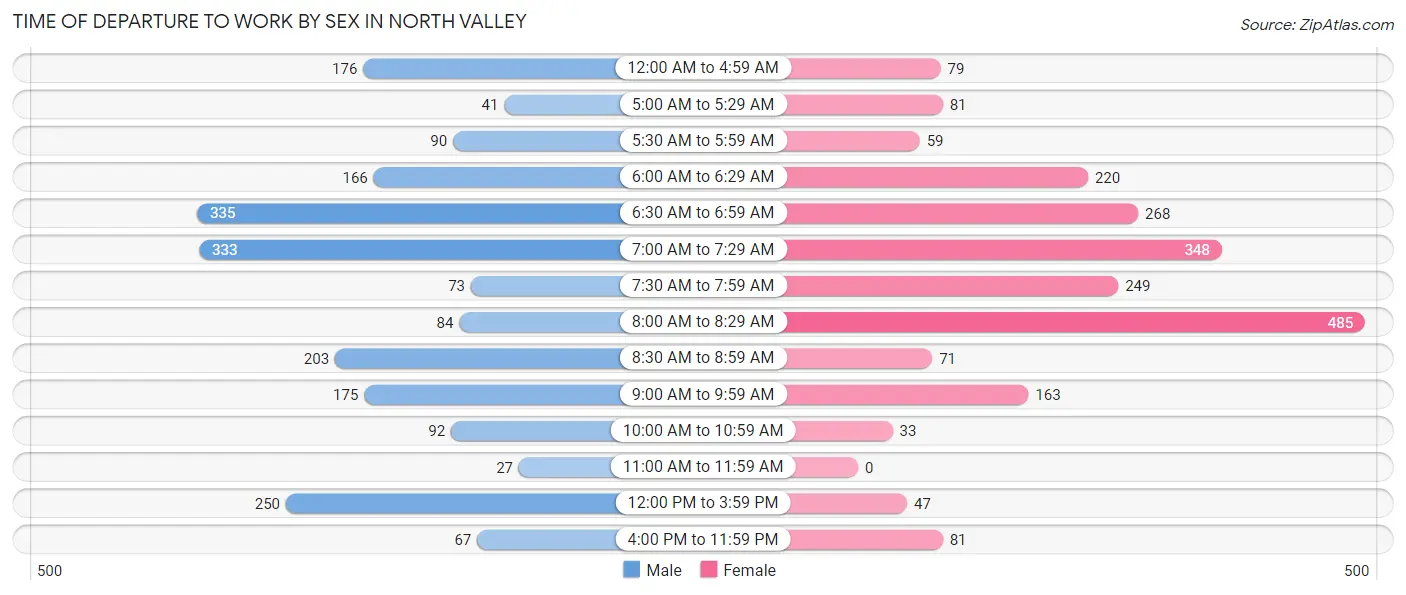
| Time of Departure | Male | Female |
| 12:00 AM to 4:59 AM | 176 (8.3%) | 79 (3.6%) |
| 5:00 AM to 5:29 AM | 41 (1.9%) | 81 (3.7%) |
| 5:30 AM to 5:59 AM | 90 (4.3%) | 59 (2.7%) |
| 6:00 AM to 6:29 AM | 166 (7.9%) | 220 (10.1%) |
| 6:30 AM to 6:59 AM | 335 (15.9%) | 268 (12.3%) |
| 7:00 AM to 7:29 AM | 333 (15.8%) | 348 (15.9%) |
| 7:30 AM to 7:59 AM | 73 (3.5%) | 249 (11.4%) |
| 8:00 AM to 8:29 AM | 84 (4.0%) | 485 (22.2%) |
| 8:30 AM to 8:59 AM | 203 (9.6%) | 71 (3.3%) |
| 9:00 AM to 9:59 AM | 175 (8.3%) | 163 (7.5%) |
| 10:00 AM to 10:59 AM | 92 (4.4%) | 33 (1.5%) |
| 11:00 AM to 11:59 AM | 27 (1.3%) | 0 (0.0%) |
| 12:00 PM to 3:59 PM | 250 (11.8%) | 47 (2.1%) |
| 4:00 PM to 11:59 PM | 67 (3.2%) | 81 (3.7%) |
| Total | 2,112 (100.0%) | 2,184 (100.0%) |
Housing Occupancy in North Valley
Occupancy by Ownership in North Valley
Of the total 4,332 dwellings in North Valley, owner-occupied units account for 3,362 (77.6%), while renter-occupied units make up 970 (22.4%).
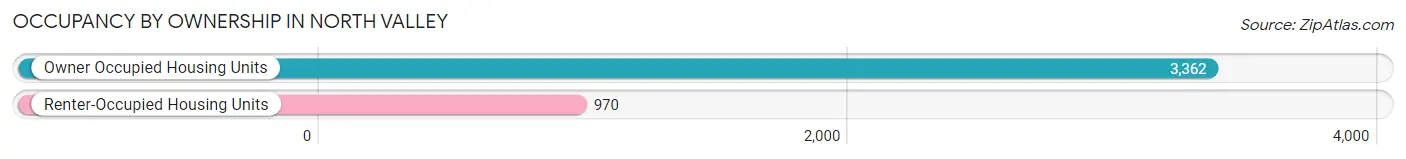
| Occupancy | # Housing Units | % Housing Units |
| Owner Occupied Housing Units | 3,362 | 77.6% |
| Renter-Occupied Housing Units | 970 | 22.4% |
| Total Occupied Housing Units | 4,332 | 100.0% |
Occupancy by Household Size in North Valley
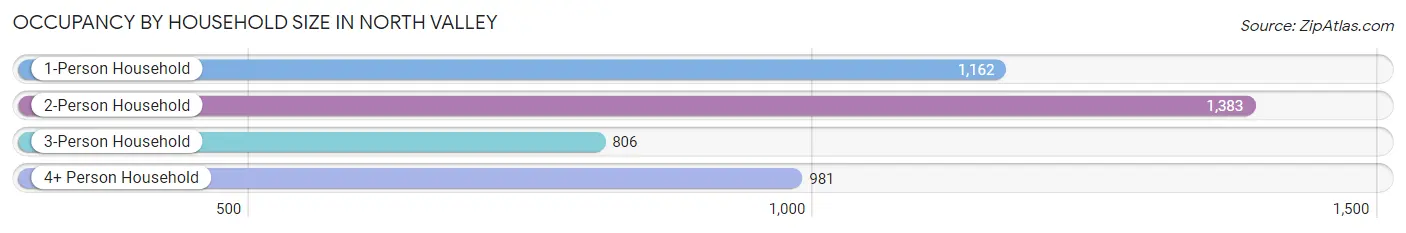
| Household Size | # Housing Units | % Housing Units |
| 1-Person Household | 1,162 | 26.8% |
| 2-Person Household | 1,383 | 31.9% |
| 3-Person Household | 806 | 18.6% |
| 4+ Person Household | 981 | 22.7% |
| Total Housing Units | 4,332 | 100.0% |
Occupancy by Ownership by Household Size in North Valley
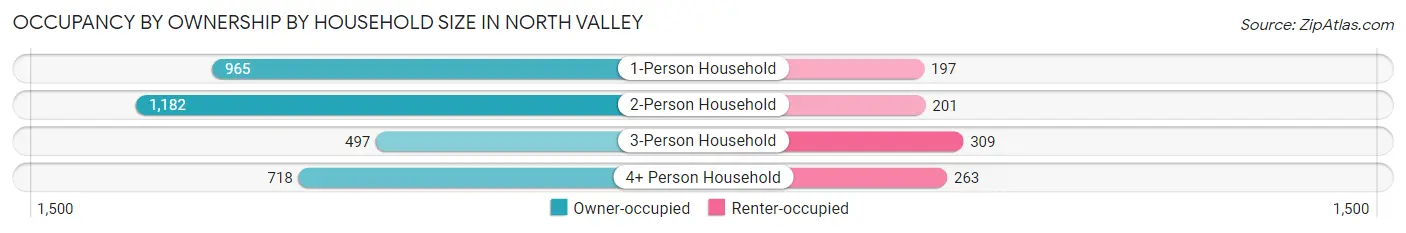
| Household Size | Owner-occupied | Renter-occupied |
| 1-Person Household | 965 (83.1%) | 197 (17.0%) |
| 2-Person Household | 1,182 (85.5%) | 201 (14.5%) |
| 3-Person Household | 497 (61.7%) | 309 (38.3%) |
| 4+ Person Household | 718 (73.2%) | 263 (26.8%) |
| Total Housing Units | 3,362 (77.6%) | 970 (22.4%) |
Occupancy by Educational Attainment in North Valley
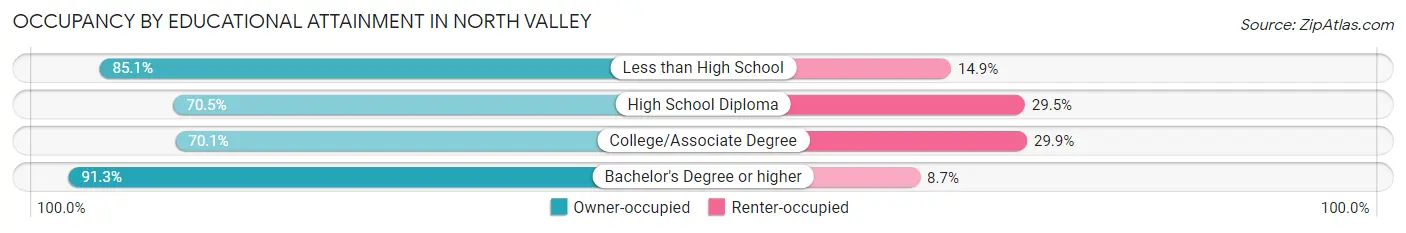
| Household Size | Owner-occupied | Renter-occupied |
| Less than High School | 361 (85.1%) | 63 (14.9%) |
| High School Diploma | 710 (70.5%) | 297 (29.5%) |
| College/Associate Degree | 1,181 (70.1%) | 504 (29.9%) |
| Bachelor's Degree or higher | 1,110 (91.3%) | 106 (8.7%) |
Occupancy by Age of Householder in North Valley
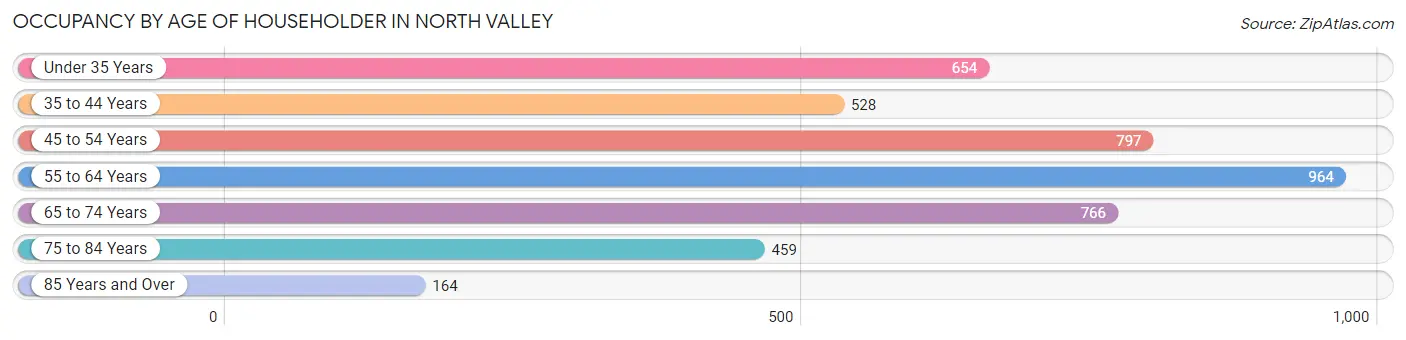
| Age Bracket | # Households | % Households |
| Under 35 Years | 654 | 15.1% |
| 35 to 44 Years | 528 | 12.2% |
| 45 to 54 Years | 797 | 18.4% |
| 55 to 64 Years | 964 | 22.3% |
| 65 to 74 Years | 766 | 17.7% |
| 75 to 84 Years | 459 | 10.6% |
| 85 Years and Over | 164 | 3.8% |
| Total | 4,332 | 100.0% |
Housing Finances in North Valley
Median Income by Occupancy in North Valley
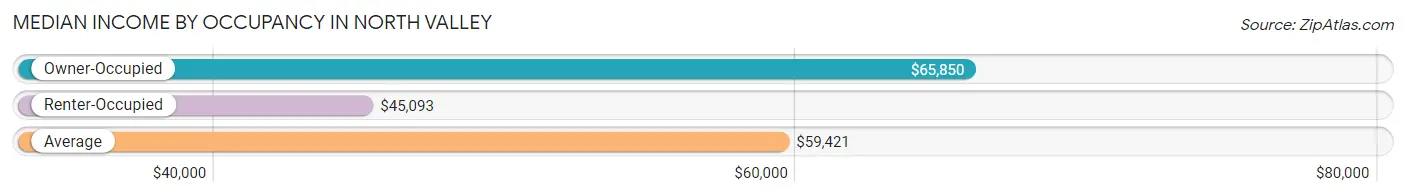
| Occupancy Type | # Households | Median Income |
| Owner-Occupied | 3,362 (77.6%) | $65,850 |
| Renter-Occupied | 970 (22.4%) | $45,093 |
| Average | 4,332 (100.0%) | $59,421 |
Occupancy by Householder Income Bracket in North Valley
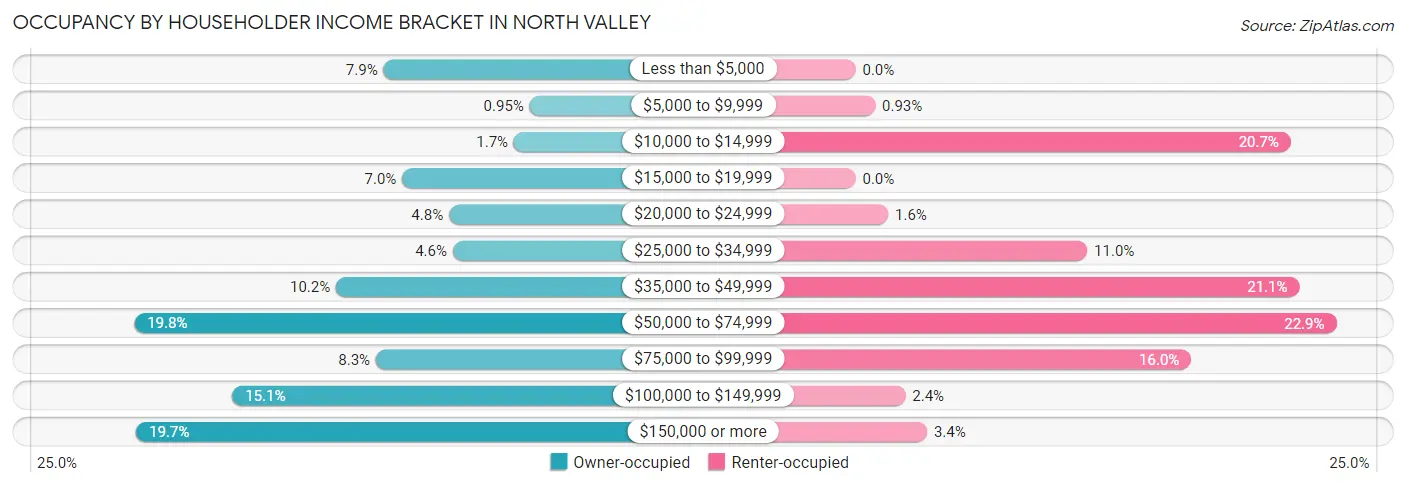
| Income Bracket | Owner-occupied | Renter-occupied |
| Less than $5,000 | 266 (7.9%) | 0 (0.0%) |
| $5,000 to $9,999 | 32 (0.9%) | 9 (0.9%) |
| $10,000 to $14,999 | 57 (1.7%) | 201 (20.7%) |
| $15,000 to $19,999 | 236 (7.0%) | 0 (0.0%) |
| $20,000 to $24,999 | 161 (4.8%) | 15 (1.5%) |
| $25,000 to $34,999 | 155 (4.6%) | 107 (11.0%) |
| $35,000 to $49,999 | 342 (10.2%) | 205 (21.1%) |
| $50,000 to $74,999 | 665 (19.8%) | 222 (22.9%) |
| $75,000 to $99,999 | 278 (8.3%) | 155 (16.0%) |
| $100,000 to $149,999 | 508 (15.1%) | 23 (2.4%) |
| $150,000 or more | 662 (19.7%) | 33 (3.4%) |
| Total | 3,362 (100.0%) | 970 (100.0%) |
Monthly Housing Cost Tiers in North Valley
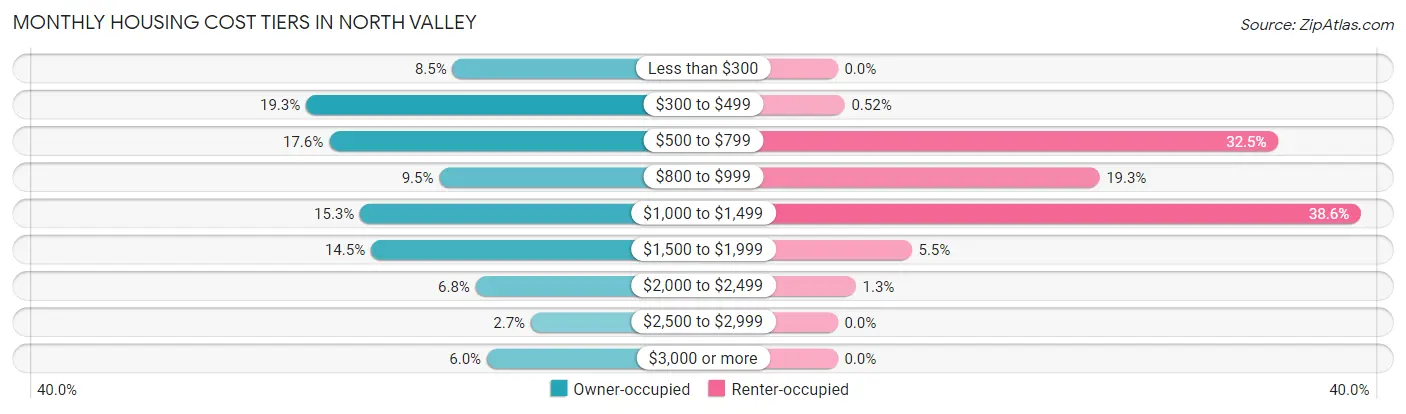
| Monthly Cost | Owner-occupied | Renter-occupied |
| Less than $300 | 285 (8.5%) | 0 (0.0%) |
| $300 to $499 | 648 (19.3%) | 5 (0.5%) |
| $500 to $799 | 591 (17.6%) | 315 (32.5%) |
| $800 to $999 | 318 (9.5%) | 187 (19.3%) |
| $1,000 to $1,499 | 514 (15.3%) | 374 (38.6%) |
| $1,500 to $1,999 | 487 (14.5%) | 53 (5.5%) |
| $2,000 to $2,499 | 228 (6.8%) | 13 (1.3%) |
| $2,500 to $2,999 | 91 (2.7%) | 0 (0.0%) |
| $3,000 or more | 200 (5.9%) | 0 (0.0%) |
| Total | 3,362 (100.0%) | 970 (100.0%) |
Physical Housing Characteristics in North Valley
Housing Structures in North Valley
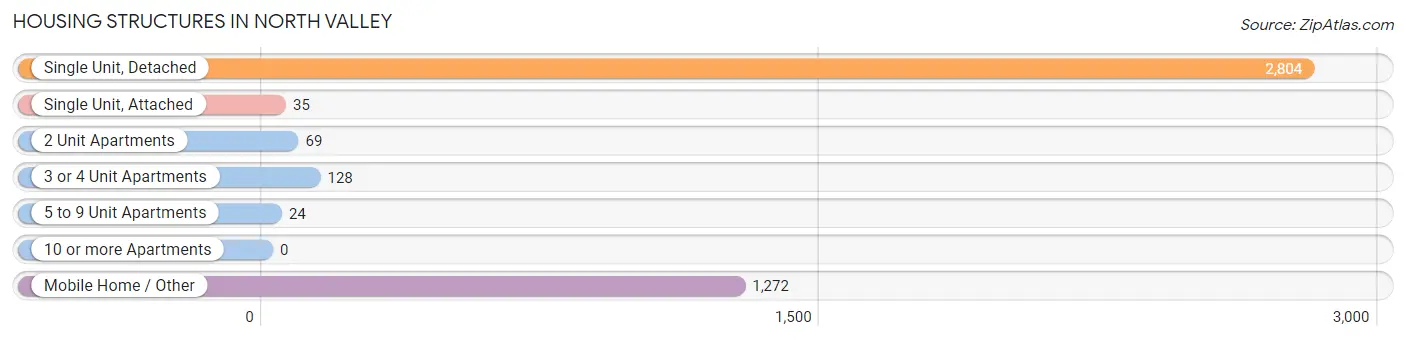
| Structure Type | # Housing Units | % Housing Units |
| Single Unit, Detached | 2,804 | 64.7% |
| Single Unit, Attached | 35 | 0.8% |
| 2 Unit Apartments | 69 | 1.6% |
| 3 or 4 Unit Apartments | 128 | 2.9% |
| 5 to 9 Unit Apartments | 24 | 0.5% |
| 10 or more Apartments | 0 | 0.0% |
| Mobile Home / Other | 1,272 | 29.4% |
| Total | 4,332 | 100.0% |
Housing Structures by Occupancy in North Valley
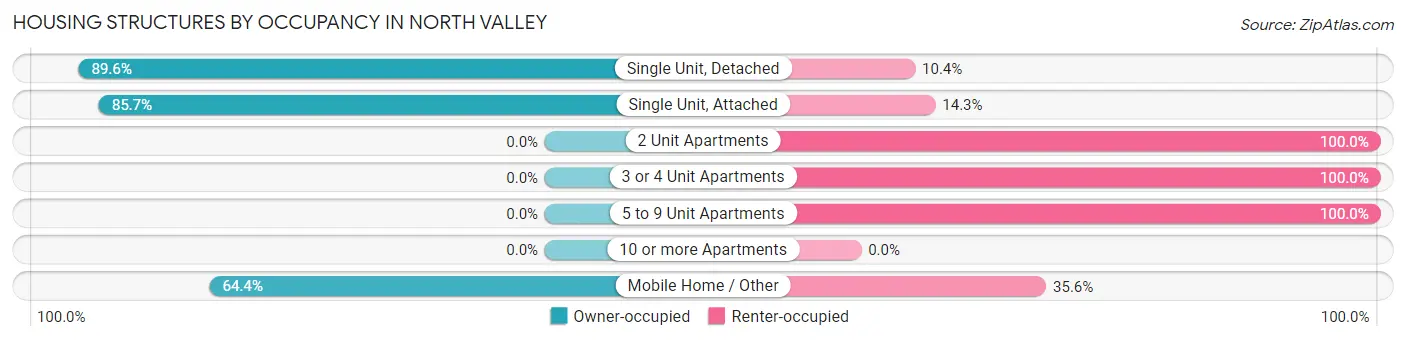
| Structure Type | Owner-occupied | Renter-occupied |
| Single Unit, Detached | 2,513 (89.6%) | 291 (10.4%) |
| Single Unit, Attached | 30 (85.7%) | 5 (14.3%) |
| 2 Unit Apartments | 0 (0.0%) | 69 (100.0%) |
| 3 or 4 Unit Apartments | 0 (0.0%) | 128 (100.0%) |
| 5 to 9 Unit Apartments | 0 (0.0%) | 24 (100.0%) |
| 10 or more Apartments | 0 (0.0%) | 0 (0.0%) |
| Mobile Home / Other | 819 (64.4%) | 453 (35.6%) |
| Total | 3,362 (77.6%) | 970 (22.4%) |
Housing Structures by Number of Rooms in North Valley
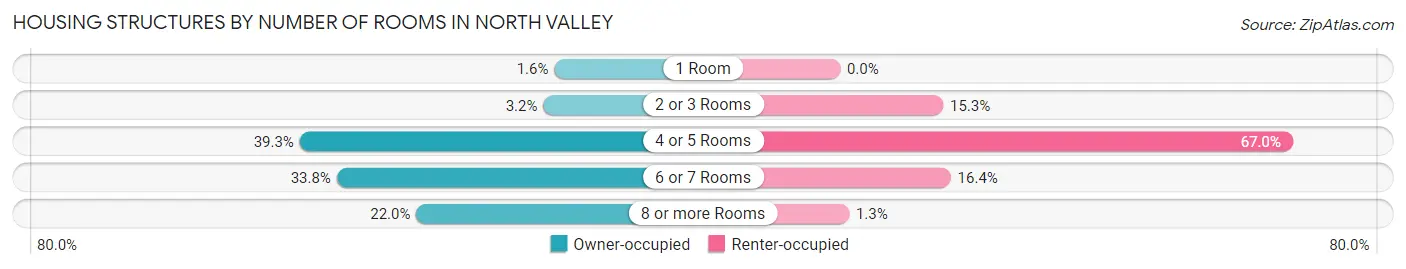
| Number of Rooms | Owner-occupied | Renter-occupied |
| 1 Room | 54 (1.6%) | 0 (0.0%) |
| 2 or 3 Rooms | 109 (3.2%) | 148 (15.3%) |
| 4 or 5 Rooms | 1,321 (39.3%) | 650 (67.0%) |
| 6 or 7 Rooms | 1,137 (33.8%) | 159 (16.4%) |
| 8 or more Rooms | 741 (22.0%) | 13 (1.3%) |
| Total | 3,362 (100.0%) | 970 (100.0%) |
Housing Structure by Heating Type in North Valley
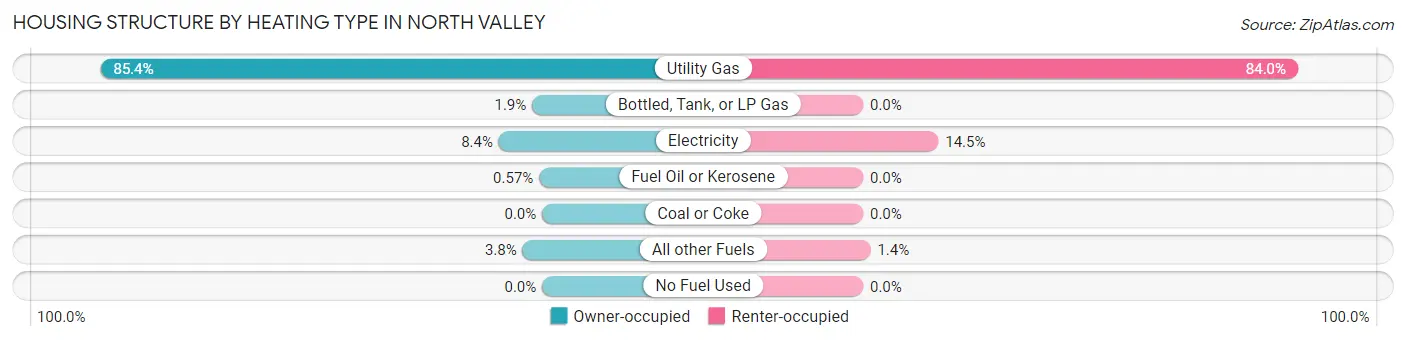
| Heating Type | Owner-occupied | Renter-occupied |
| Utility Gas | 2,870 (85.4%) | 815 (84.0%) |
| Bottled, Tank, or LP Gas | 65 (1.9%) | 0 (0.0%) |
| Electricity | 281 (8.4%) | 141 (14.5%) |
| Fuel Oil or Kerosene | 19 (0.6%) | 0 (0.0%) |
| Coal or Coke | 0 (0.0%) | 0 (0.0%) |
| All other Fuels | 127 (3.8%) | 14 (1.4%) |
| No Fuel Used | 0 (0.0%) | 0 (0.0%) |
| Total | 3,362 (100.0%) | 970 (100.0%) |
Household Vehicle Usage in North Valley
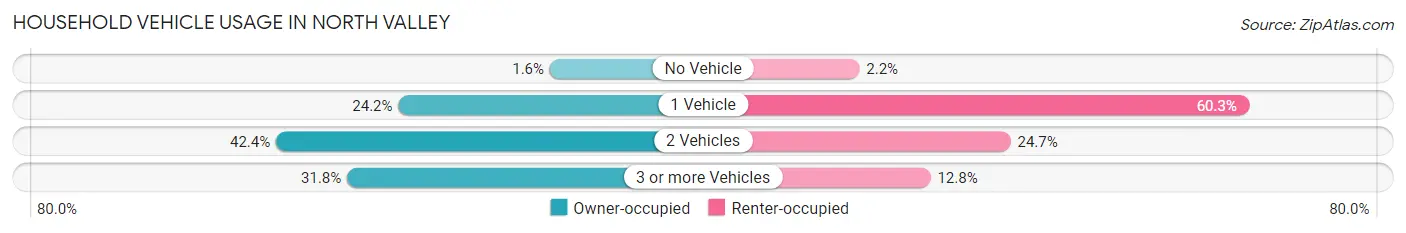
| Vehicles per Household | Owner-occupied | Renter-occupied |
| No Vehicle | 52 (1.5%) | 21 (2.2%) |
| 1 Vehicle | 813 (24.2%) | 585 (60.3%) |
| 2 Vehicles | 1,427 (42.4%) | 240 (24.7%) |
| 3 or more Vehicles | 1,070 (31.8%) | 124 (12.8%) |
| Total | 3,362 (100.0%) | 970 (100.0%) |
Real Estate & Mortgages in North Valley
Real Estate and Mortgage Overview in North Valley
| Characteristic | Without Mortgage | With Mortgage |
| Housing Units | 1,731 | 1,631 |
| Median Property Value | $214,500 | $323,900 |
| Median Household Income | $41,131 | $493 |
| Monthly Housing Costs | $492 | $181 |
| Real Estate Taxes | $1,777 | $27 |
Property Value by Mortgage Status in North Valley
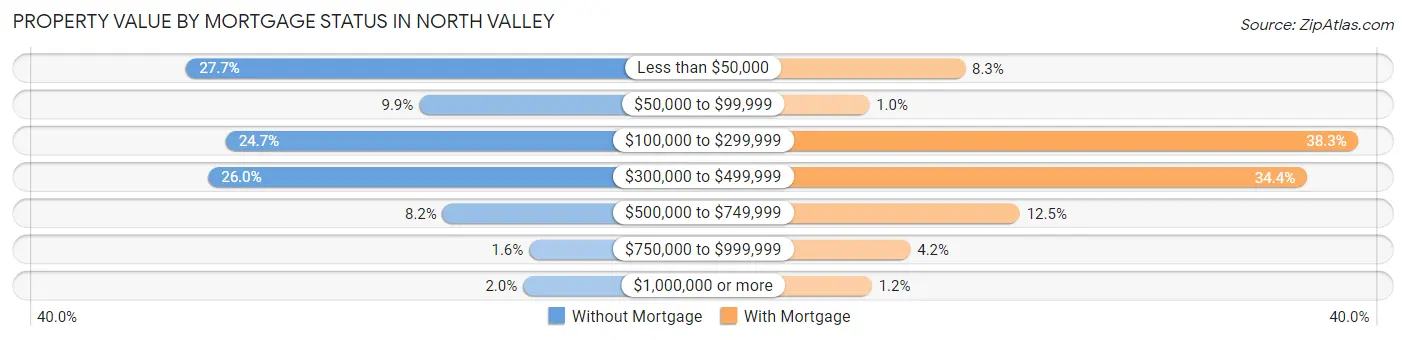
| Property Value | Without Mortgage | With Mortgage |
| Less than $50,000 | 479 (27.7%) | 136 (8.3%) |
| $50,000 to $99,999 | 172 (9.9%) | 17 (1.0%) |
| $100,000 to $299,999 | 427 (24.7%) | 625 (38.3%) |
| $300,000 to $499,999 | 450 (26.0%) | 561 (34.4%) |
| $500,000 to $749,999 | 141 (8.2%) | 204 (12.5%) |
| $750,000 to $999,999 | 27 (1.6%) | 68 (4.2%) |
| $1,000,000 or more | 35 (2.0%) | 20 (1.2%) |
| Total | 1,731 (100.0%) | 1,631 (100.0%) |
Household Income by Mortgage Status in North Valley
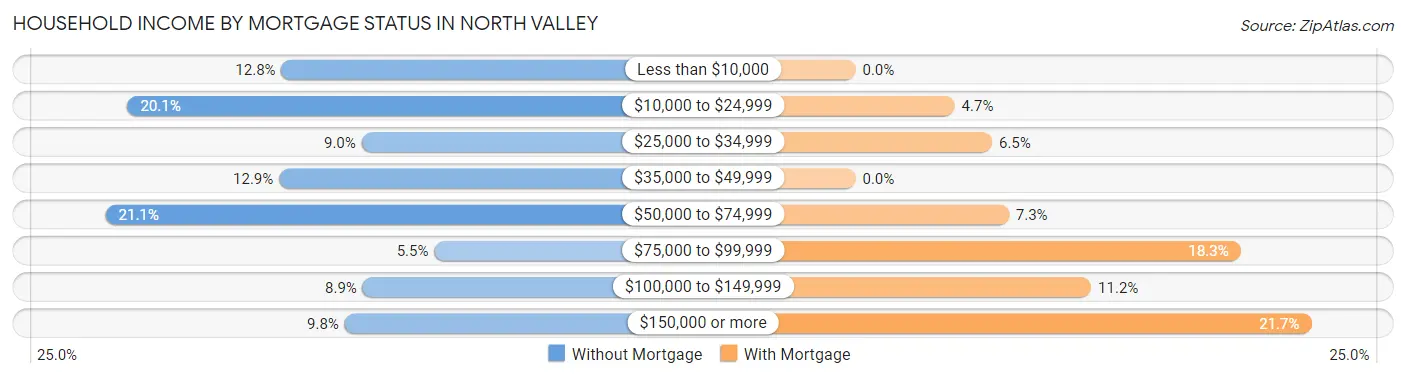
| Household Income | Without Mortgage | With Mortgage |
| Less than $10,000 | 221 (12.8%) | 0 (0.0%) |
| $10,000 to $24,999 | 348 (20.1%) | 77 (4.7%) |
| $25,000 to $34,999 | 155 (8.9%) | 106 (6.5%) |
| $35,000 to $49,999 | 223 (12.9%) | 0 (0.0%) |
| $50,000 to $74,999 | 366 (21.1%) | 119 (7.3%) |
| $75,000 to $99,999 | 95 (5.5%) | 299 (18.3%) |
| $100,000 to $149,999 | 154 (8.9%) | 183 (11.2%) |
| $150,000 or more | 169 (9.8%) | 354 (21.7%) |
| Total | 1,731 (100.0%) | 1,631 (100.0%) |
Property Value to Household Income Ratio in North Valley
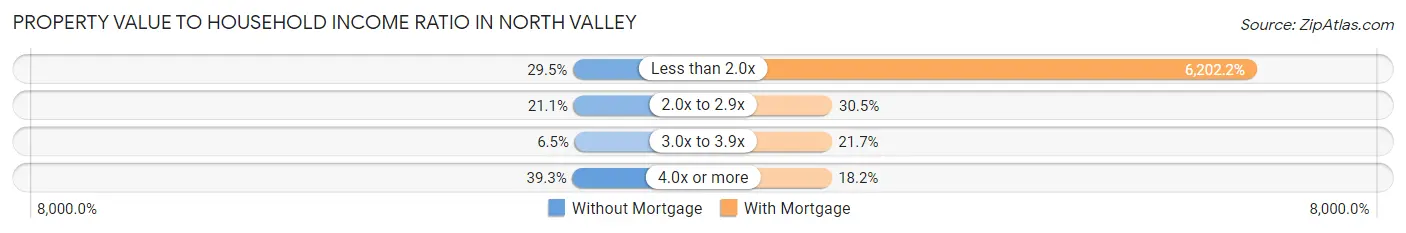
| Value-to-Income Ratio | Without Mortgage | With Mortgage |
| Less than 2.0x | 510 (29.5%) | 101,158 (6,202.2%) |
| 2.0x to 2.9x | 366 (21.1%) | 497 (30.5%) |
| 3.0x to 3.9x | 112 (6.5%) | 354 (21.7%) |
| 4.0x or more | 681 (39.3%) | 297 (18.2%) |
| Total | 1,731 (100.0%) | 1,631 (100.0%) |
Real Estate Taxes by Mortgage Status in North Valley
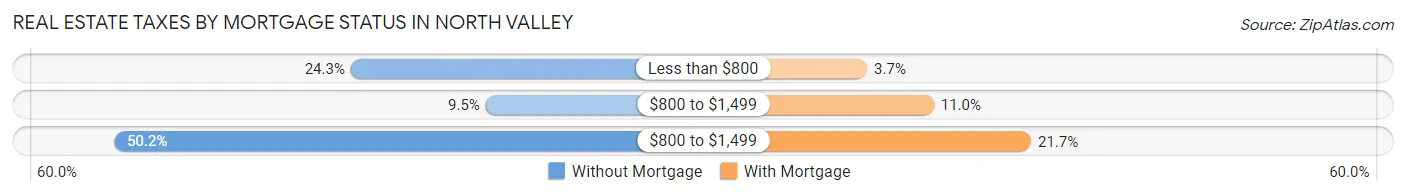
| Property Taxes | Without Mortgage | With Mortgage |
| Less than $800 | 420 (24.3%) | 61 (3.7%) |
| $800 to $1,499 | 164 (9.5%) | 180 (11.0%) |
| $800 to $1,499 | 869 (50.2%) | 354 (21.7%) |
| Total | 1,731 (100.0%) | 1,631 (100.0%) |
Health & Disability in North Valley
Health Insurance Coverage by Age in North Valley
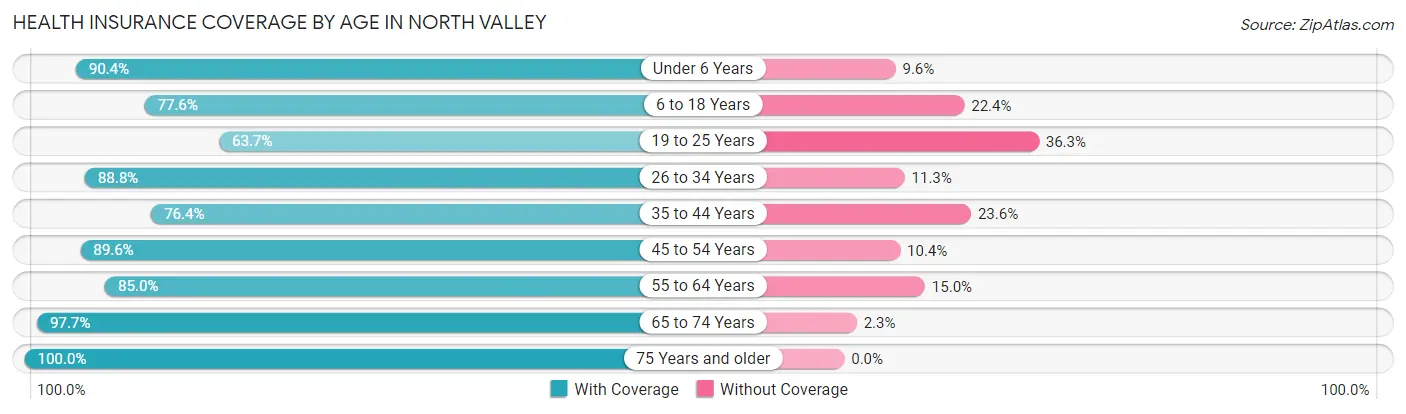
| Age Bracket | With Coverage | Without Coverage |
| Under 6 Years | 511 (90.4%) | 54 (9.6%) |
| 6 to 18 Years | 1,155 (77.6%) | 333 (22.4%) |
| 19 to 25 Years | 594 (63.7%) | 338 (36.3%) |
| 26 to 34 Years | 1,073 (88.7%) | 136 (11.3%) |
| 35 to 44 Years | 967 (76.4%) | 299 (23.6%) |
| 45 to 54 Years | 1,480 (89.6%) | 172 (10.4%) |
| 55 to 64 Years | 1,419 (85.0%) | 251 (15.0%) |
| 65 to 74 Years | 1,263 (97.7%) | 30 (2.3%) |
| 75 Years and older | 1,053 (100.0%) | 0 (0.0%) |
| Total | 9,515 (85.5%) | 1,613 (14.5%) |
Health Insurance Coverage by Citizenship Status in North Valley
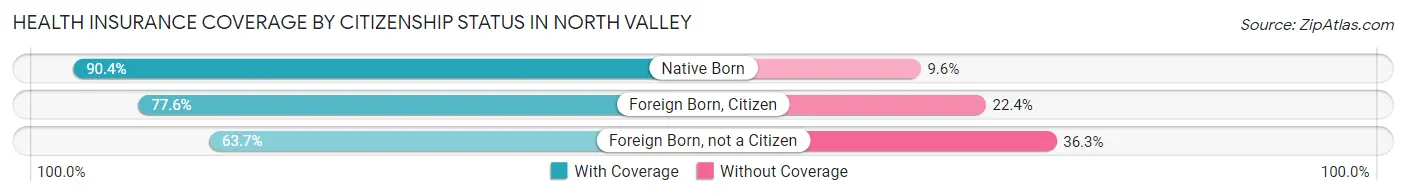
| Citizenship Status | With Coverage | Without Coverage |
| Native Born | 511 (90.4%) | 54 (9.6%) |
| Foreign Born, Citizen | 1,155 (77.6%) | 333 (22.4%) |
| Foreign Born, not a Citizen | 594 (63.7%) | 338 (36.3%) |
Health Insurance Coverage by Household Income in North Valley
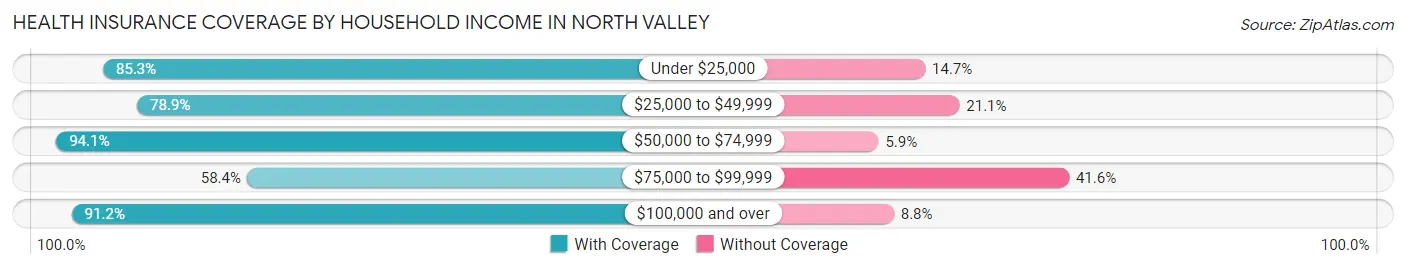
| Household Income | With Coverage | Without Coverage |
| Under $25,000 | 1,704 (85.3%) | 293 (14.7%) |
| $25,000 to $49,999 | 1,104 (78.9%) | 295 (21.1%) |
| $50,000 to $74,999 | 2,204 (94.1%) | 139 (5.9%) |
| $75,000 to $99,999 | 732 (58.4%) | 522 (41.6%) |
| $100,000 and over | 3,771 (91.2%) | 364 (8.8%) |
Public vs Private Health Insurance Coverage by Age in North Valley
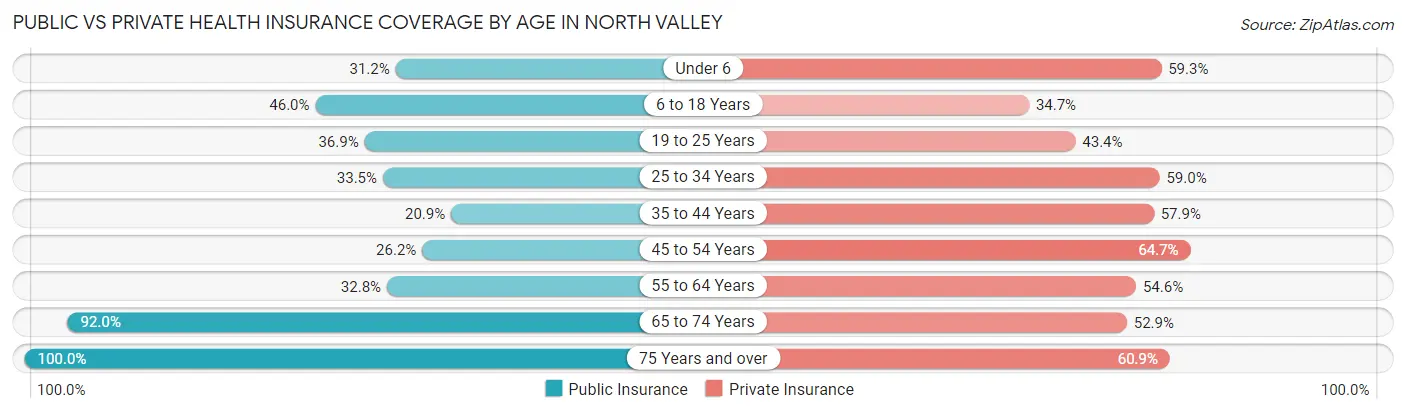
| Age Bracket | Public Insurance | Private Insurance |
| Under 6 | 176 (31.1%) | 335 (59.3%) |
| 6 to 18 Years | 685 (46.0%) | 517 (34.7%) |
| 19 to 25 Years | 344 (36.9%) | 404 (43.3%) |
| 25 to 34 Years | 405 (33.5%) | 713 (59.0%) |
| 35 to 44 Years | 264 (20.8%) | 733 (57.9%) |
| 45 to 54 Years | 433 (26.2%) | 1,069 (64.7%) |
| 55 to 64 Years | 547 (32.8%) | 912 (54.6%) |
| 65 to 74 Years | 1,190 (92.0%) | 684 (52.9%) |
| 75 Years and over | 1,053 (100.0%) | 641 (60.9%) |
| Total | 5,097 (45.8%) | 6,008 (54.0%) |
Disability Status by Sex by Age in North Valley
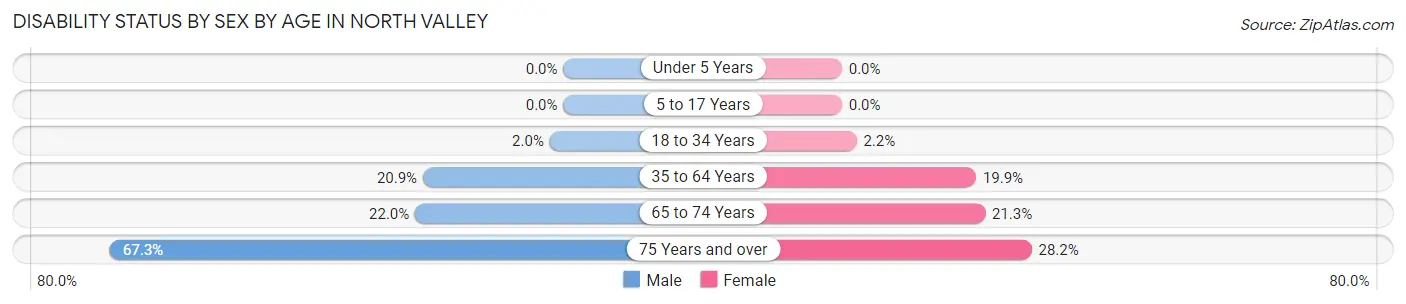
| Age Bracket | Male | Female |
| Under 5 Years | 0 (0.0%) | 0 (0.0%) |
| 5 to 17 Years | 0 (0.0%) | 0 (0.0%) |
| 18 to 34 Years | 16 (2.0%) | 33 (2.2%) |
| 35 to 64 Years | 539 (20.8%) | 399 (19.9%) |
| 65 to 74 Years | 118 (22.0%) | 161 (21.3%) |
| 75 Years and over | 305 (67.3%) | 169 (28.2%) |
Disability Class by Sex by Age in North Valley
Disability Class: Hearing Difficulty
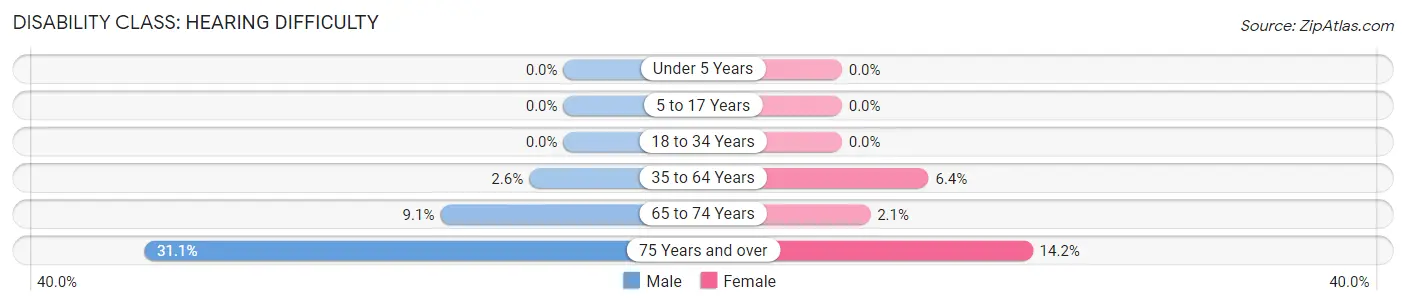
| Age Bracket | Male | Female |
| Under 5 Years | 0 (0.0%) | 0 (0.0%) |
| 5 to 17 Years | 0 (0.0%) | 0 (0.0%) |
| 18 to 34 Years | 0 (0.0%) | 0 (0.0%) |
| 35 to 64 Years | 66 (2.5%) | 129 (6.4%) |
| 65 to 74 Years | 49 (9.1%) | 16 (2.1%) |
| 75 Years and over | 141 (31.1%) | 85 (14.2%) |
Disability Class: Vision Difficulty
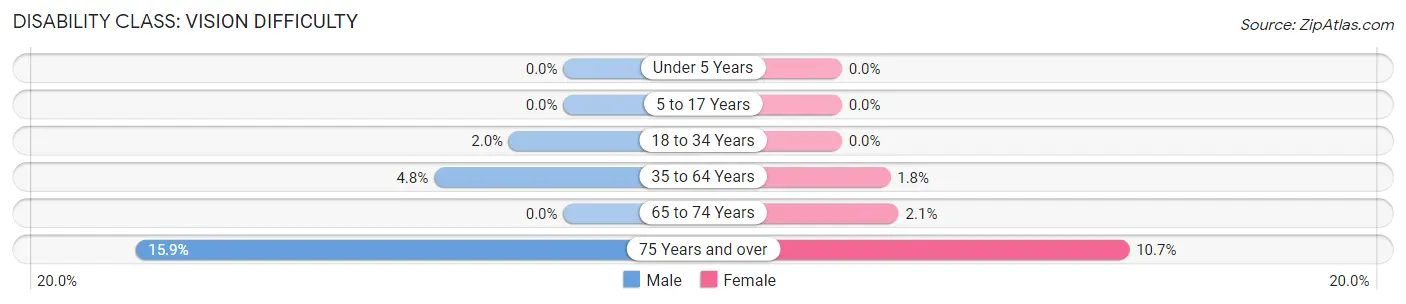
| Age Bracket | Male | Female |
| Under 5 Years | 0 (0.0%) | 0 (0.0%) |
| 5 to 17 Years | 0 (0.0%) | 0 (0.0%) |
| 18 to 34 Years | 16 (2.0%) | 0 (0.0%) |
| 35 to 64 Years | 124 (4.8%) | 36 (1.8%) |
| 65 to 74 Years | 0 (0.0%) | 16 (2.1%) |
| 75 Years and over | 72 (15.9%) | 64 (10.7%) |
Disability Class: Cognitive Difficulty
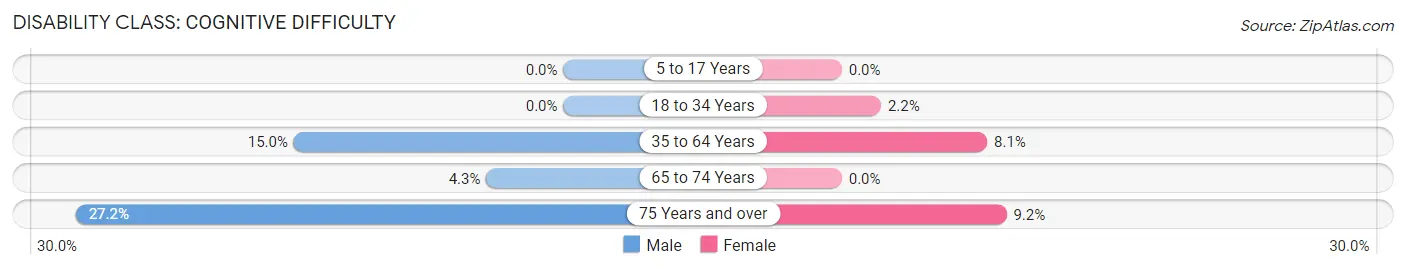
| Age Bracket | Male | Female |
| 5 to 17 Years | 0 (0.0%) | 0 (0.0%) |
| 18 to 34 Years | 0 (0.0%) | 33 (2.2%) |
| 35 to 64 Years | 388 (15.0%) | 162 (8.1%) |
| 65 to 74 Years | 23 (4.3%) | 0 (0.0%) |
| 75 Years and over | 123 (27.2%) | 55 (9.2%) |
Disability Class: Ambulatory Difficulty
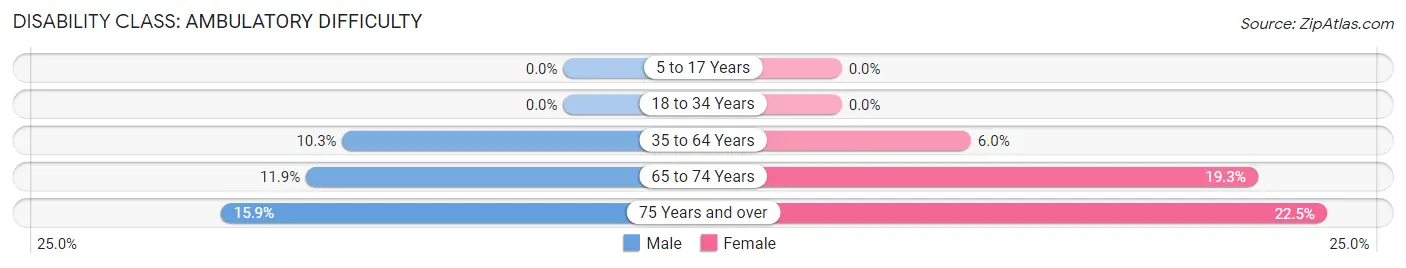
| Age Bracket | Male | Female |
| 5 to 17 Years | 0 (0.0%) | 0 (0.0%) |
| 18 to 34 Years | 0 (0.0%) | 0 (0.0%) |
| 35 to 64 Years | 265 (10.2%) | 120 (6.0%) |
| 65 to 74 Years | 64 (11.9%) | 146 (19.3%) |
| 75 Years and over | 72 (15.9%) | 135 (22.5%) |
Disability Class: Self-Care Difficulty
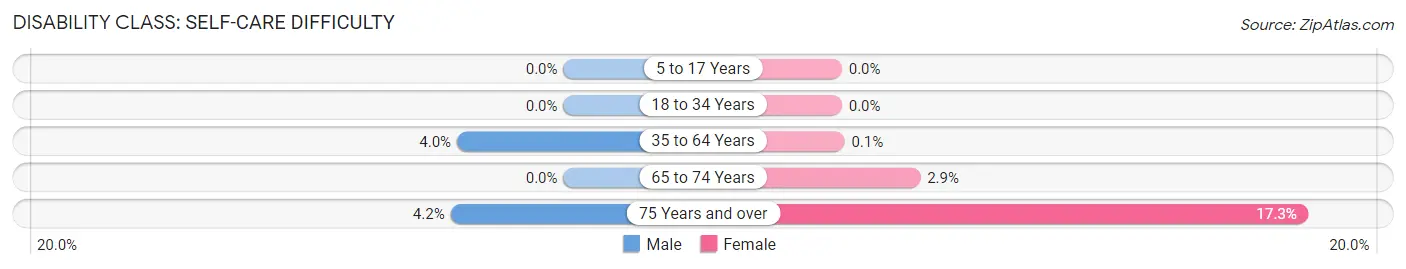
| Age Bracket | Male | Female |
| 5 to 17 Years | 0 (0.0%) | 0 (0.0%) |
| 18 to 34 Years | 0 (0.0%) | 0 (0.0%) |
| 35 to 64 Years | 102 (4.0%) | 2 (0.1%) |
| 65 to 74 Years | 0 (0.0%) | 22 (2.9%) |
| 75 Years and over | 19 (4.2%) | 104 (17.3%) |
Technology Access in North Valley
Computing Device Access in North Valley
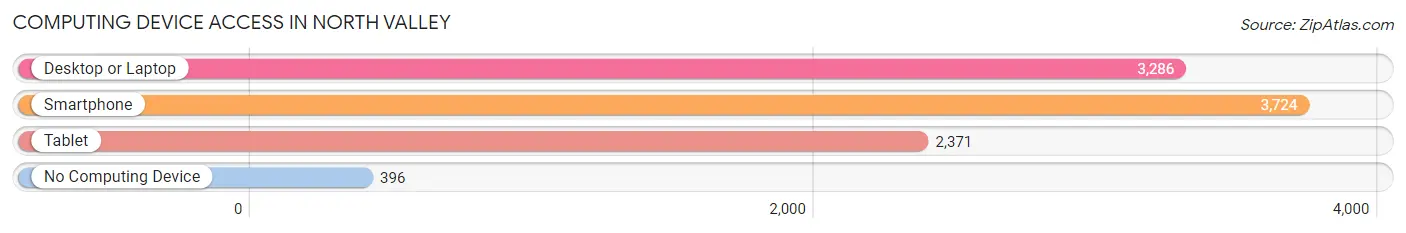
| Device Type | # Households | % Households |
| Desktop or Laptop | 3,286 | 75.8% |
| Smartphone | 3,724 | 86.0% |
| Tablet | 2,371 | 54.7% |
| No Computing Device | 396 | 9.1% |
| Total | 4,332 | 100.0% |
Internet Access in North Valley
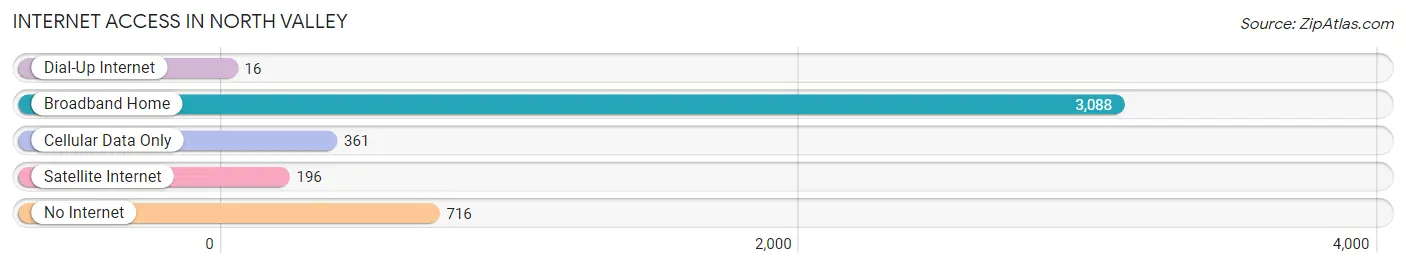
| Internet Type | # Households | % Households |
| Dial-Up Internet | 16 | 0.4% |
| Broadband Home | 3,088 | 71.3% |
| Cellular Data Only | 361 | 8.3% |
| Satellite Internet | 196 | 4.5% |
| No Internet | 716 | 16.5% |
| Total | 4,332 | 100.0% |
North Valley Summary
North Valley is a census-designated place (CDP) located in Bernalillo County, New Mexico. It is situated in the North Valley area of Albuquerque, and is bordered by the Rio Grande to the south, the Sandia Mountains to the east, and the Petroglyph National Monument to the west. The population of North Valley was 8,945 at the 2010 census.
Geography
North Valley is located at 35°11'17" North, 106°37'17" West (35.188056, -106.621389). It has an elevation of 5,072 feet (1,547 m).
The CDP has a total area of 4 2 square miles 10 8 km2 all of it land
History
The area now known as North Valley was originally inhabited by Native American tribes, including the Pueblo, Apache, and Navajo. The first European settlers arrived in the area in the late 1700s, and the area was annexed by the United States in 1848.
In the early 1900s, the area was primarily used for farming and ranching. In the 1950s, the area began to experience rapid growth as the city of Albuquerque expanded. The area was officially designated as the North Valley CDP in 1980.
Economy
The economy of North Valley is primarily based on services and retail. The area is home to several large retail stores, including Walmart, Target, and Home Depot. There are also several restaurants, banks, and other businesses located in the area.
The area is also home to several industrial and manufacturing businesses, including Intel, Honeywell, and Sandia National Laboratories.
Demographics
As of the 2010 census, the population of North Valley was 8,945. The racial makeup of the CDP was 73.3% White, 1.7% African American, 1.2% Native American, 0.7% Asian, 0.1% Pacific Islander, 19.2% from other races, and 4.0% from two or more races. Hispanic or Latino of any race were 44.2% of the population.
The median household income in North Valley was $37,917, and the median family income was $41,917. The per capita income for the CDP was $17,917.
Education
North Valley is served by the Albuquerque Public Schools district. The area is home to several elementary schools, including North Valley Elementary School, Valley View Elementary School, and North Star Elementary School. There is also one middle school, North Valley Middle School, and one high school, Valley High School.
Conclusion
North Valley is a census-designated place located in Bernalillo County, New Mexico. It is situated in the North Valley area of Albuquerque, and is bordered by the Rio Grande to the south, the Sandia Mountains to the east, and the Petroglyph National Monument to the west. The population of North Valley was 8,945 at the 2010 census. The economy of North Valley is primarily based on services and retail, and the area is also home to several industrial and manufacturing businesses. The racial makeup of the CDP was 73.3% White, 1.7% African American, 1.2% Native American, 0.7% Asian, 0.1% Pacific Islander, 19.2% from other races, and 4.0% from two or more races. Hispanic or Latino of any race were 44.2% of the population. North Valley is served by the Albuquerque Public Schools district.
Common Questions
What is Per Capita Income in North Valley?
Per Capita income in North Valley is $33,831.
What is the Median Family Income in North Valley?
Median Family Income in North Valley is $67,378.
What is the Median Household income in North Valley?
Median Household Income in North Valley is $59,421.
What is Income or Wage Gap in North Valley?
Income or Wage Gap in North Valley is 35.9%.
Women in North Valley earn 64.1 cents for every dollar earned by a man.
What is Inequality or Gini Index in North Valley?
Inequality or Gini Index in North Valley is 0.48.
What is the Total Population of North Valley?
Total Population of North Valley is 11,256.
What is the Total Male Population of North Valley?
Total Male Population of North Valley is 5,418.
What is the Total Female Population of North Valley?
Total Female Population of North Valley is 5,838.
What is the Ratio of Males per 100 Females in North Valley?
There are 92.81 Males per 100 Females in North Valley.
What is the Ratio of Females per 100 Males in North Valley?
There are 107.75 Females per 100 Males in North Valley.
What is the Median Population Age in North Valley?
Median Population Age in North Valley is 45.6 Years.
What is the Average Family Size in North Valley
Average Family Size in North Valley is 3.1 People.
What is the Average Household Size in North Valley
Average Household Size in North Valley is 2.6 People.
How Large is the Labor Force in North Valley?
There are 5,189 People in the Labor Forcein in North Valley.
What is the Percentage of People in the Labor Force in North Valley?
54.2% of People are in the Labor Force in North Valley.
What is the Unemployment Rate in North Valley?
Unemployment Rate in North Valley is 4.6%.