Los Alamos County, NM Map & Demographics
Los Alamos County Map
Los Alamos County Overview
$71,527
PER CAPITA INCOME
$158,708
AVG FAMILY INCOME
$135,801
AVG HOUSEHOLD INCOME
35.7%
WAGE / INCOME GAP [ % ]
64.3¢/ $1
WAGE / INCOME GAP [ $ ]
$7,953
FAMILY INCOME DEFICIT
0.39
INEQUALITY / GINI INDEX
19,253
TOTAL POPULATION
9,884
MALE POPULATION
9,369
FEMALE POPULATION
105.50
MALES / 100 FEMALES
94.79
FEMALES / 100 MALES
41.2
MEDIAN AGE
3.0
AVG FAMILY SIZE
2.4
AVG HOUSEHOLD SIZE
10,575
LABOR FORCE [ PEOPLE ]
67.5%
PERCENT IN LABOR FORCE
1.9%
UNEMPLOYMENT RATE
Los Alamos County Area Codes
Income in Los Alamos County
Income Overview in Los Alamos County
Per Capita Income in Los Alamos County is $71,527, while median incomes of families and households are $158,708 and $135,801 respectively.
| Characteristic | Number | Measure |
| Per Capita Income | 19,253 | $71,527 |
| Median Family Income | 5,229 | $158,708 |
| Mean Family Income | 5,229 | $196,231 |
| Median Household Income | 8,149 | $135,801 |
| Mean Household Income | 8,149 | $165,058 |
| Income Deficit | 5,229 | $7,953 |
| Wage / Income Gap (%) | 19,253 | 35.69% |
| Wage / Income Gap ($) | 19,253 | 64.31¢ per $1 |
| Gini / Inequality Index | 19,253 | 0.39 |
Earnings by Sex in Los Alamos County
Average Earnings in Los Alamos County are $83,135, $99,370 for men and $63,904 for women, a difference of 35.7%.
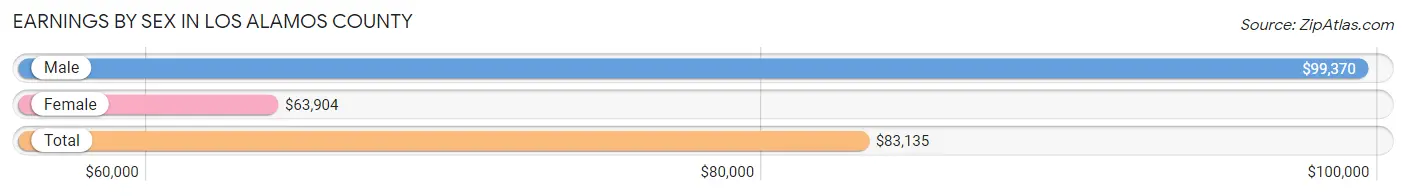
| Sex | Number | Average Earnings |
| Male | 6,155 (55.2%) | $99,370 |
| Female | 4,990 (44.8%) | $63,904 |
| Total | 11,145 (100.0%) | $83,135 |
Earnings by Sex by Income Bracket in Los Alamos County
The most common earnings brackets in Los Alamos County are $100,000+ for men (3,046 | 49.5%) and $100,000+ for women (1,459 | 29.2%).
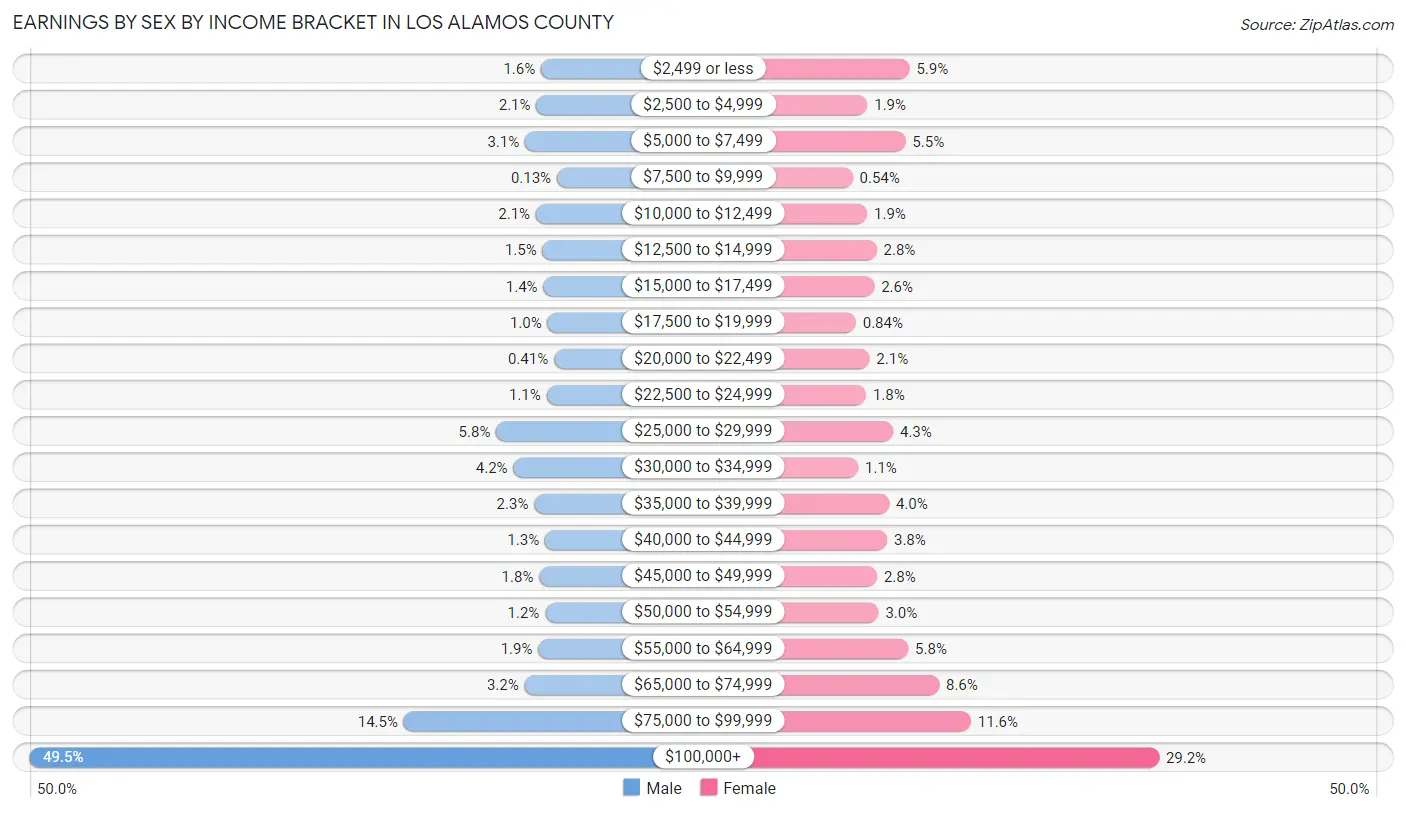
| Income | Male | Female |
| $2,499 or less | 100 (1.6%) | 293 (5.9%) |
| $2,500 to $4,999 | 127 (2.1%) | 96 (1.9%) |
| $5,000 to $7,499 | 192 (3.1%) | 274 (5.5%) |
| $7,500 to $9,999 | 8 (0.1%) | 27 (0.5%) |
| $10,000 to $12,499 | 129 (2.1%) | 95 (1.9%) |
| $12,500 to $14,999 | 91 (1.5%) | 139 (2.8%) |
| $15,000 to $17,499 | 86 (1.4%) | 128 (2.6%) |
| $17,500 to $19,999 | 62 (1.0%) | 42 (0.8%) |
| $20,000 to $22,499 | 25 (0.4%) | 106 (2.1%) |
| $22,500 to $24,999 | 68 (1.1%) | 90 (1.8%) |
| $25,000 to $29,999 | 358 (5.8%) | 216 (4.3%) |
| $30,000 to $34,999 | 259 (4.2%) | 53 (1.1%) |
| $35,000 to $39,999 | 139 (2.3%) | 197 (4.0%) |
| $40,000 to $44,999 | 77 (1.3%) | 188 (3.8%) |
| $45,000 to $49,999 | 110 (1.8%) | 141 (2.8%) |
| $50,000 to $54,999 | 76 (1.2%) | 148 (3.0%) |
| $55,000 to $64,999 | 116 (1.9%) | 287 (5.8%) |
| $65,000 to $74,999 | 195 (3.2%) | 431 (8.6%) |
| $75,000 to $99,999 | 891 (14.5%) | 580 (11.6%) |
| $100,000+ | 3,046 (49.5%) | 1,459 (29.2%) |
| Total | 6,155 (100.0%) | 4,990 (100.0%) |
Earnings by Sex by Educational Attainment in Los Alamos County
Average earnings in Los Alamos County are $107,838 for men and $72,955 for women, a difference of 32.4%. Men with an educational attainment of graduate degree enjoy the highest average annual earnings of $141,438, while those with college or associate's degree education earn the least with $77,500. Women with an educational attainment of less than high school earn the most with the average annual earnings of $116,193, while those with college or associate's degree education have the smallest earnings of $39,435.
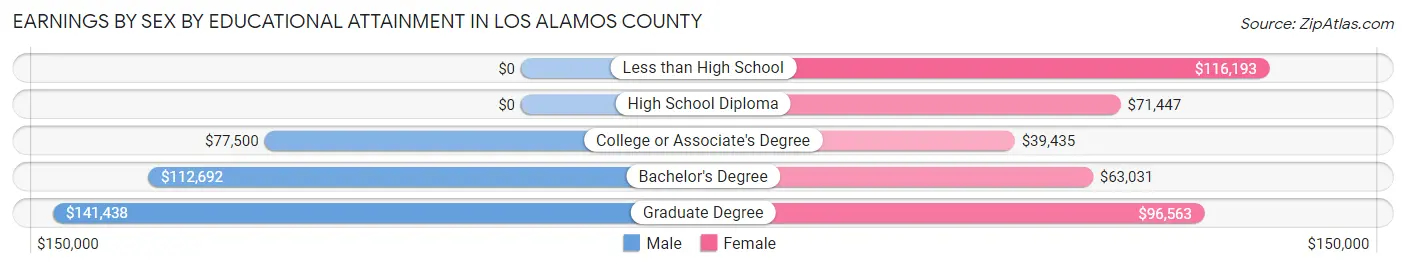
| Educational Attainment | Male Income | Female Income |
| Less than High School | - | - |
| High School Diploma | - | - |
| College or Associate's Degree | $77,500 | $39,435 |
| Bachelor's Degree | $112,692 | $63,031 |
| Graduate Degree | $141,438 | $96,563 |
| Total | $107,838 | $72,955 |
Family Income in Los Alamos County
Family Income Brackets in Los Alamos County
According to the Los Alamos County family income data, there are 1,867 families falling into the $200,000+ income range, which is the most common income bracket and makes up 35.7% of all families. Conversely, the less than $10,000 income bracket is the least frequent group with only 31 families (0.6%) belonging to this category.
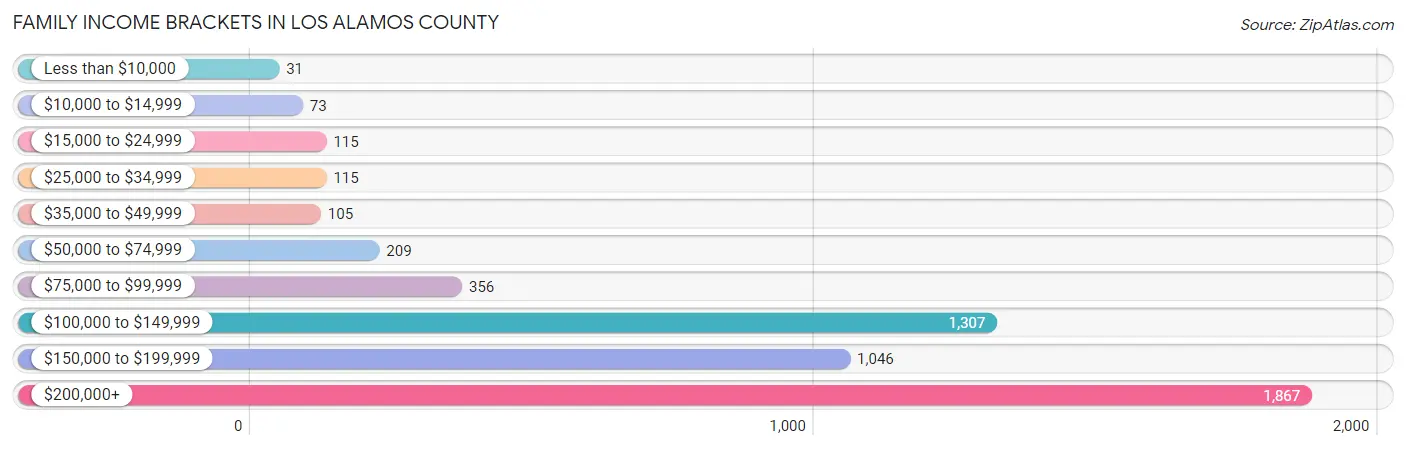
| Income Bracket | # Families | % Families |
| Less than $10,000 | 31 | 0.6% |
| $10,000 to $14,999 | 73 | 1.4% |
| $15,000 to $24,999 | 115 | 2.2% |
| $25,000 to $34,999 | 115 | 2.2% |
| $35,000 to $49,999 | 105 | 2.0% |
| $50,000 to $74,999 | 209 | 4.0% |
| $75,000 to $99,999 | 356 | 6.8% |
| $100,000 to $149,999 | 1,307 | 25.0% |
| $150,000 to $199,999 | 1,046 | 20.0% |
| $200,000+ | 1,867 | 35.7% |
Family Income by Famaliy Size in Los Alamos County
4-person families (997 | 19.1%) account for the highest median family income in Los Alamos County with $208,250 per family, while 2-person families (2,748 | 52.5%) have the highest median income of $75,310 per family member.
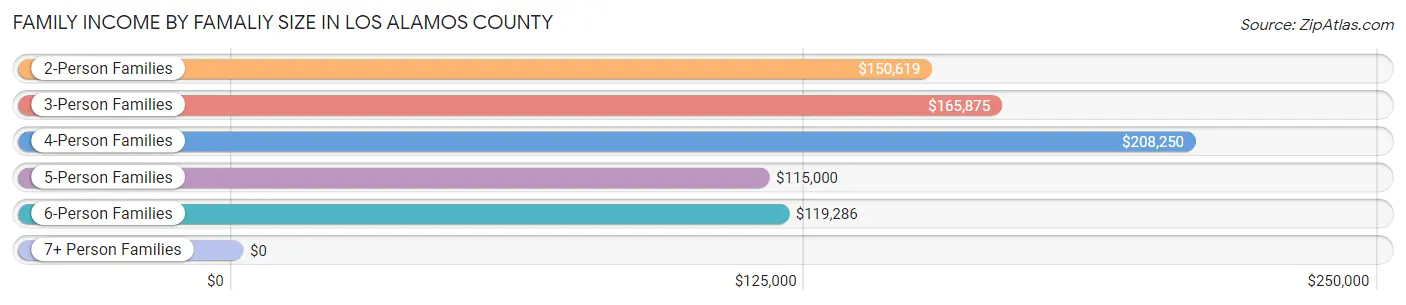
| Income Bracket | # Families | Median Income |
| 2-Person Families | 2,748 (52.5%) | $150,619 |
| 3-Person Families | 1,082 (20.7%) | $165,875 |
| 4-Person Families | 997 (19.1%) | $208,250 |
| 5-Person Families | 238 (4.5%) | $115,000 |
| 6-Person Families | 154 (2.9%) | $119,286 |
| 7+ Person Families | 10 (0.2%) | $0 |
| Total | 5,229 (100.0%) | $158,708 |
Family Income by Number of Earners in Los Alamos County
The median family income in Los Alamos County is $158,708, with families comprising 3+ earners (337) having the highest median family income of $219,813, while families with no earners (801) have the lowest median family income of $119,485, accounting for 6.4% and 15.3% of families, respectively.
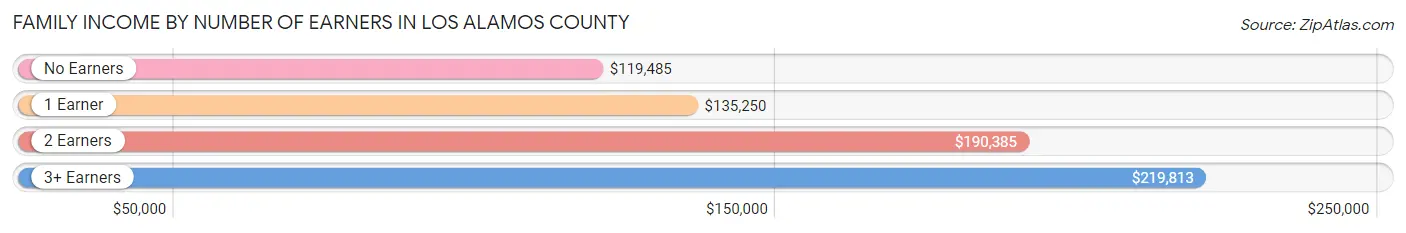
| Number of Earners | # Families | Median Income |
| No Earners | 801 (15.3%) | $119,485 |
| 1 Earner | 1,359 (26.0%) | $135,250 |
| 2 Earners | 2,732 (52.2%) | $190,385 |
| 3+ Earners | 337 (6.4%) | $219,813 |
| Total | 5,229 (100.0%) | $158,708 |
Household Income in Los Alamos County
Household Income Brackets in Los Alamos County
With 2,143 households falling in the category, the $200,000+ income range is the most frequent in Los Alamos County, accounting for 26.3% of all households. In contrast, only 81 households (1.0%) fall into the $10,000 to $14,999 income bracket, making it the least populous group.
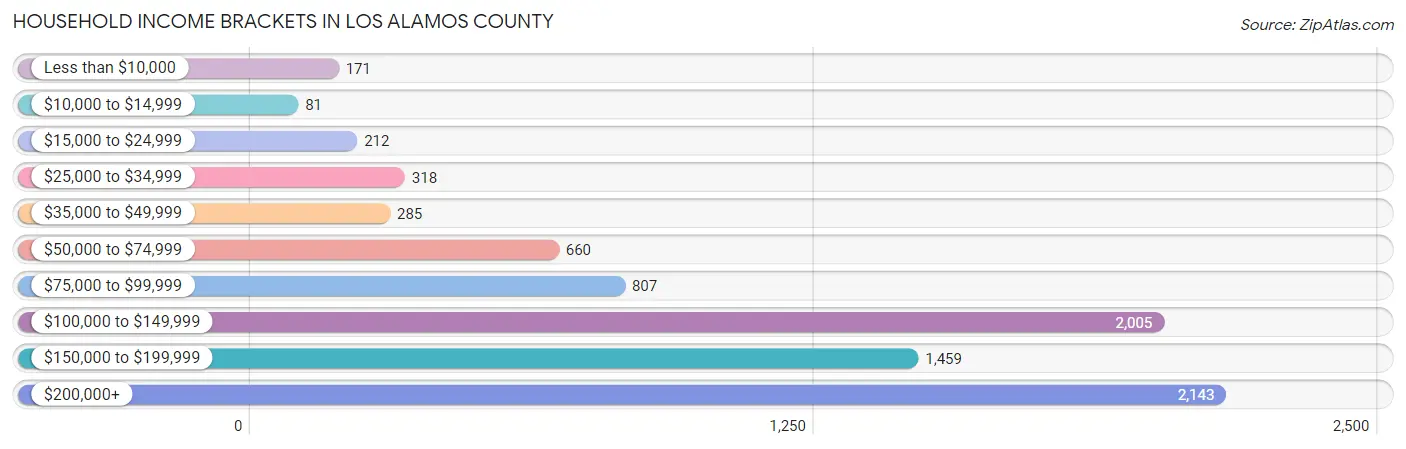
| Income Bracket | # Households | % Households |
| Less than $10,000 | 171 | 2.1% |
| $10,000 to $14,999 | 81 | 1.0% |
| $15,000 to $24,999 | 212 | 2.6% |
| $25,000 to $34,999 | 318 | 3.9% |
| $35,000 to $49,999 | 285 | 3.5% |
| $50,000 to $74,999 | 660 | 8.1% |
| $75,000 to $99,999 | 807 | 9.9% |
| $100,000 to $149,999 | 2,005 | 24.6% |
| $150,000 to $199,999 | 1,459 | 17.9% |
| $200,000+ | 2,143 | 26.3% |
Household Income by Householder Age in Los Alamos County
The median household income in Los Alamos County is $135,801, with the highest median household income of $154,846 found in the 45 to 64 years age bracket for the primary householder. A total of 3,328 households (40.8%) fall into this category. Meanwhile, the 15 to 24 years age bracket for the primary householder has the lowest median household income of $0, with 318 households (3.9%) in this group.
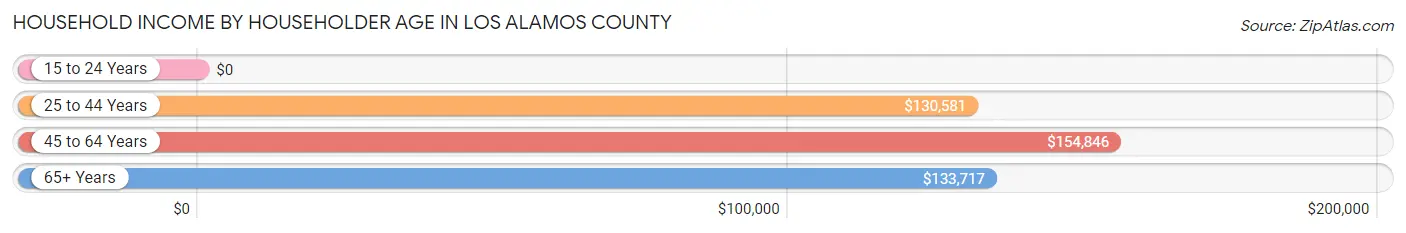
| Income Bracket | # Households | Median Income |
| 15 to 24 Years | 318 (3.9%) | $0 |
| 25 to 44 Years | 2,572 (31.6%) | $130,581 |
| 45 to 64 Years | 3,328 (40.8%) | $154,846 |
| 65+ Years | 1,931 (23.7%) | $133,717 |
| Total | 8,149 (100.0%) | $135,801 |
Poverty in Los Alamos County
Income Below Poverty by Sex and Age in Los Alamos County
With 3.2% poverty level for males and 4.2% for females among the residents of Los Alamos County, under 5 year old males and 18 to 24 year old females are the most vulnerable to poverty, with 63 males (14.2%) and 151 females (27.9%) in their respective age groups living below the poverty level.
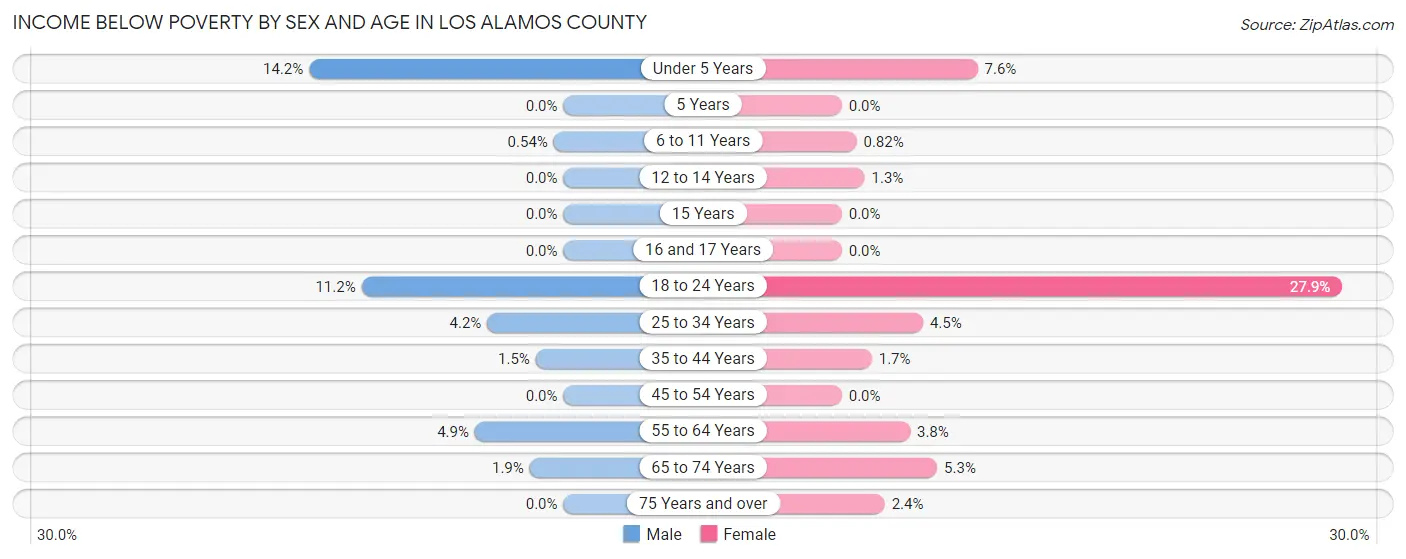
| Age Bracket | Male | Female |
| Under 5 Years | 63 (14.2%) | 36 (7.6%) |
| 5 Years | 0 (0.0%) | 0 (0.0%) |
| 6 to 11 Years | 5 (0.5%) | 6 (0.8%) |
| 12 to 14 Years | 0 (0.0%) | 5 (1.3%) |
| 15 Years | 0 (0.0%) | 0 (0.0%) |
| 16 and 17 Years | 0 (0.0%) | 0 (0.0%) |
| 18 to 24 Years | 75 (11.2%) | 151 (27.9%) |
| 25 to 34 Years | 62 (4.2%) | 54 (4.5%) |
| 35 to 44 Years | 21 (1.5%) | 19 (1.7%) |
| 45 to 54 Years | 0 (0.0%) | 0 (0.0%) |
| 55 to 64 Years | 74 (4.9%) | 51 (3.8%) |
| 65 to 74 Years | 18 (1.9%) | 51 (5.3%) |
| 75 Years and over | 0 (0.0%) | 19 (2.4%) |
| Total | 318 (3.2%) | 392 (4.2%) |
Income Above Poverty by Sex and Age in Los Alamos County
According to the poverty statistics in Los Alamos County, males aged 5 years and females aged 5 years are the age groups that are most secure financially, with 100.0% of males and 100.0% of females in these age groups living above the poverty line.
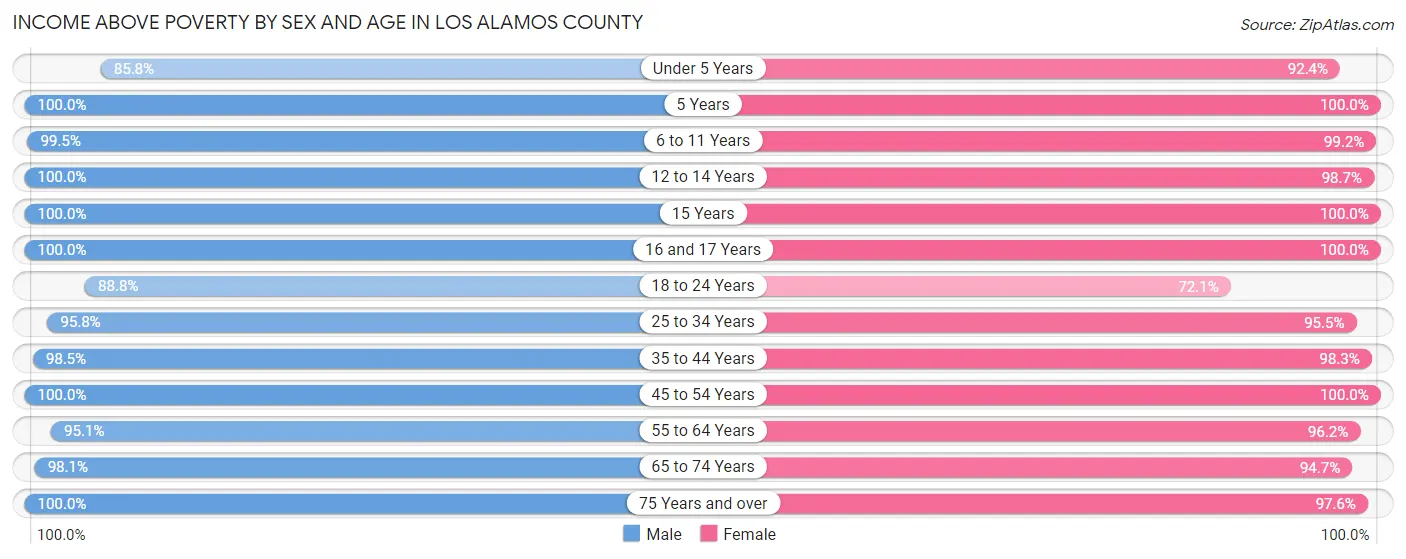
| Age Bracket | Male | Female |
| Under 5 Years | 382 (85.8%) | 440 (92.4%) |
| 5 Years | 65 (100.0%) | 77 (100.0%) |
| 6 to 11 Years | 919 (99.5%) | 722 (99.2%) |
| 12 to 14 Years | 237 (100.0%) | 389 (98.7%) |
| 15 Years | 134 (100.0%) | 87 (100.0%) |
| 16 and 17 Years | 269 (100.0%) | 289 (100.0%) |
| 18 to 24 Years | 592 (88.8%) | 391 (72.1%) |
| 25 to 34 Years | 1,400 (95.8%) | 1,142 (95.5%) |
| 35 to 44 Years | 1,345 (98.5%) | 1,117 (98.3%) |
| 45 to 54 Years | 1,153 (100.0%) | 1,275 (100.0%) |
| 55 to 64 Years | 1,426 (95.1%) | 1,292 (96.2%) |
| 65 to 74 Years | 939 (98.1%) | 910 (94.7%) |
| 75 Years and over | 666 (100.0%) | 777 (97.6%) |
| Total | 9,527 (96.8%) | 8,908 (95.8%) |
Income Below Poverty Among Married-Couple Families in Los Alamos County
The poverty statistics for married-couple families in Los Alamos County show that 1.7% or 74 of the total 4,468 families live below the poverty line. Families with 3 or 4 children have the highest poverty rate of 3.9%, comprising of 12 families. On the other hand, families with 5 or more children have the lowest poverty rate of 0.0%, which includes 0 families.
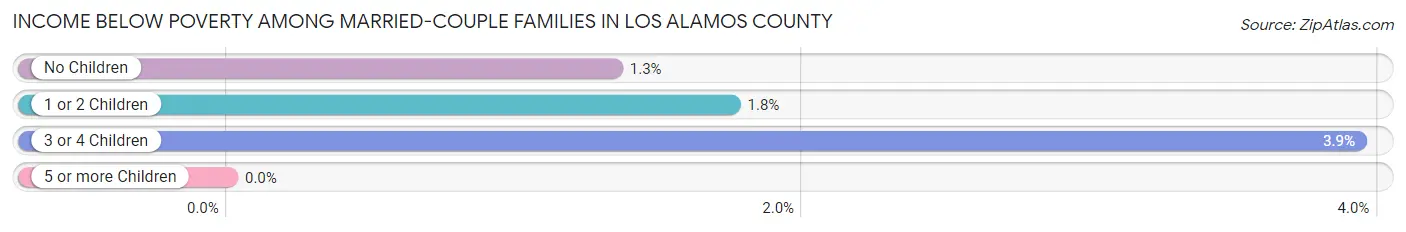
| Children | Above Poverty | Below Poverty |
| No Children | 2,575 (98.7%) | 35 (1.3%) |
| 1 or 2 Children | 1,516 (98.3%) | 27 (1.8%) |
| 3 or 4 Children | 293 (96.1%) | 12 (3.9%) |
| 5 or more Children | 10 (100.0%) | 0 (0.0%) |
| Total | 4,394 (98.3%) | 74 (1.7%) |
Income Below Poverty Among Single-Parent Households in Los Alamos County
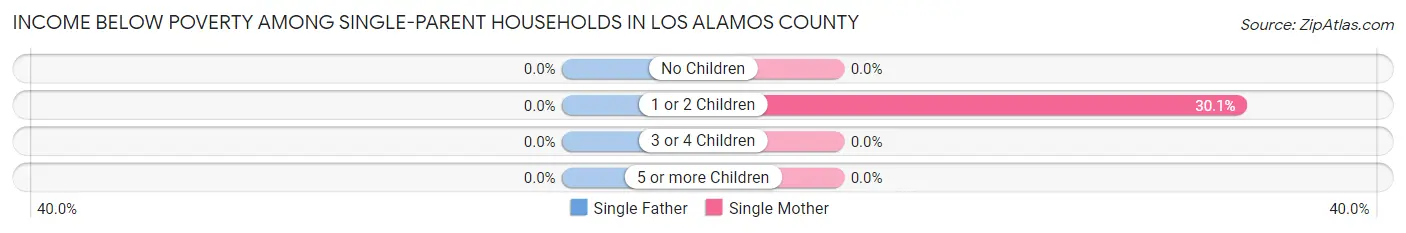
| Children | Single Father | Single Mother |
| No Children | 0 (0.0%) | 0 (0.0%) |
| 1 or 2 Children | 0 (0.0%) | 80 (30.1%) |
| 3 or 4 Children | 0 (0.0%) | 0 (0.0%) |
| 5 or more Children | 0 (0.0%) | 0 (0.0%) |
| Total | 0 (0.0%) | 80 (16.5%) |
Income Below Poverty Among Married-Couple vs Single-Parent Households in Los Alamos County
The poverty data for Los Alamos County shows that 74 of the married-couple family households (1.7%) and 80 of the single-parent households (10.5%) are living below the poverty level. Within the married-couple family households, those with 3 or 4 children have the highest poverty rate, with 12 households (3.9%) falling below the poverty line. Among the single-parent households, those with 1 or 2 children have the highest poverty rate, with 80 household (19.8%) living below poverty.
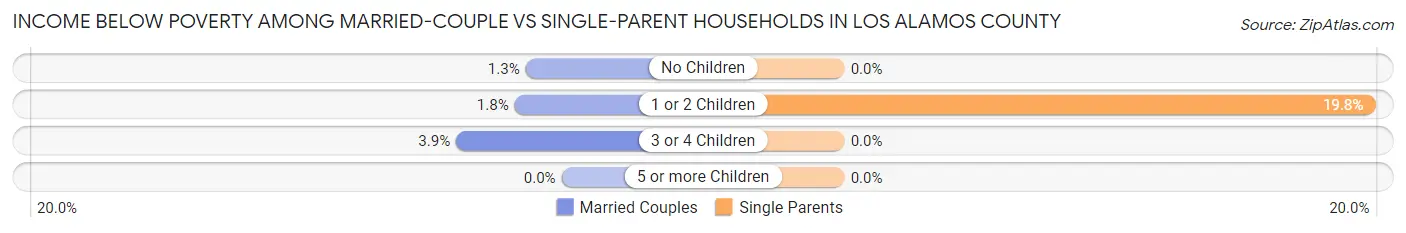
| Children | Married-Couple Families | Single-Parent Households |
| No Children | 35 (1.3%) | 0 (0.0%) |
| 1 or 2 Children | 27 (1.8%) | 80 (19.8%) |
| 3 or 4 Children | 12 (3.9%) | 0 (0.0%) |
| 5 or more Children | 0 (0.0%) | 0 (0.0%) |
| Total | 74 (1.7%) | 80 (10.5%) |
Race in Los Alamos County
The most populous races in Los Alamos County are White / Caucasian (15,140 | 78.6%), Hispanic or Latino (3,525 | 18.3%), and Two or more Races (2,000 | 10.4%).
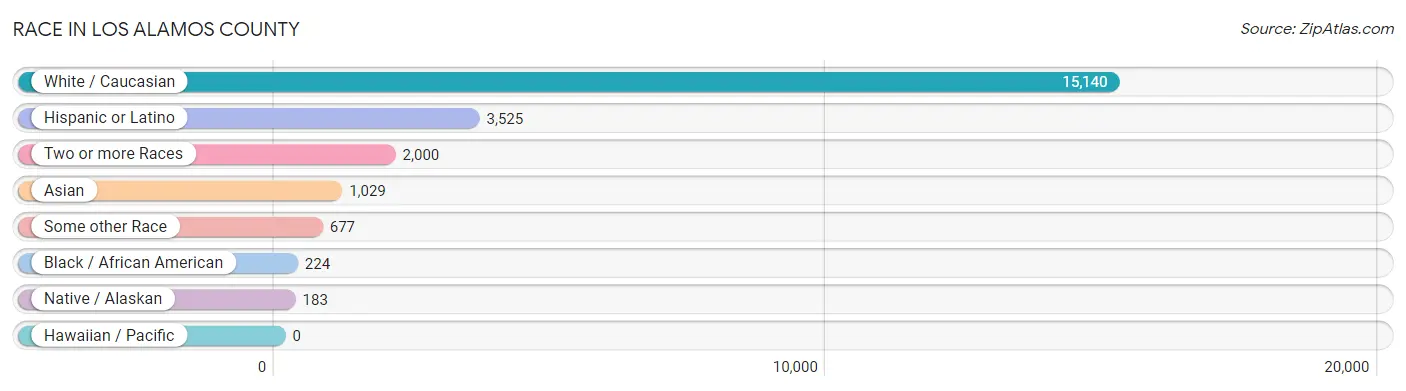
| Race | # Population | % Population |
| Asian | 1,029 | 5.3% |
| Black / African American | 224 | 1.2% |
| Hawaiian / Pacific | 0 | 0.0% |
| Hispanic or Latino | 3,525 | 18.3% |
| Native / Alaskan | 183 | 0.9% |
| White / Caucasian | 15,140 | 78.6% |
| Two or more Races | 2,000 | 10.4% |
| Some other Race | 677 | 3.5% |
| Total | 19,253 | 100.0% |
Ancestry in Los Alamos County
The most populous ancestries reported in Los Alamos County are English (3,430 | 17.8%), German (3,210 | 16.7%), Irish (2,031 | 10.5%), Mexican (1,763 | 9.2%), and European (1,114 | 5.8%), together accounting for 60.0% of all Los Alamos County residents.
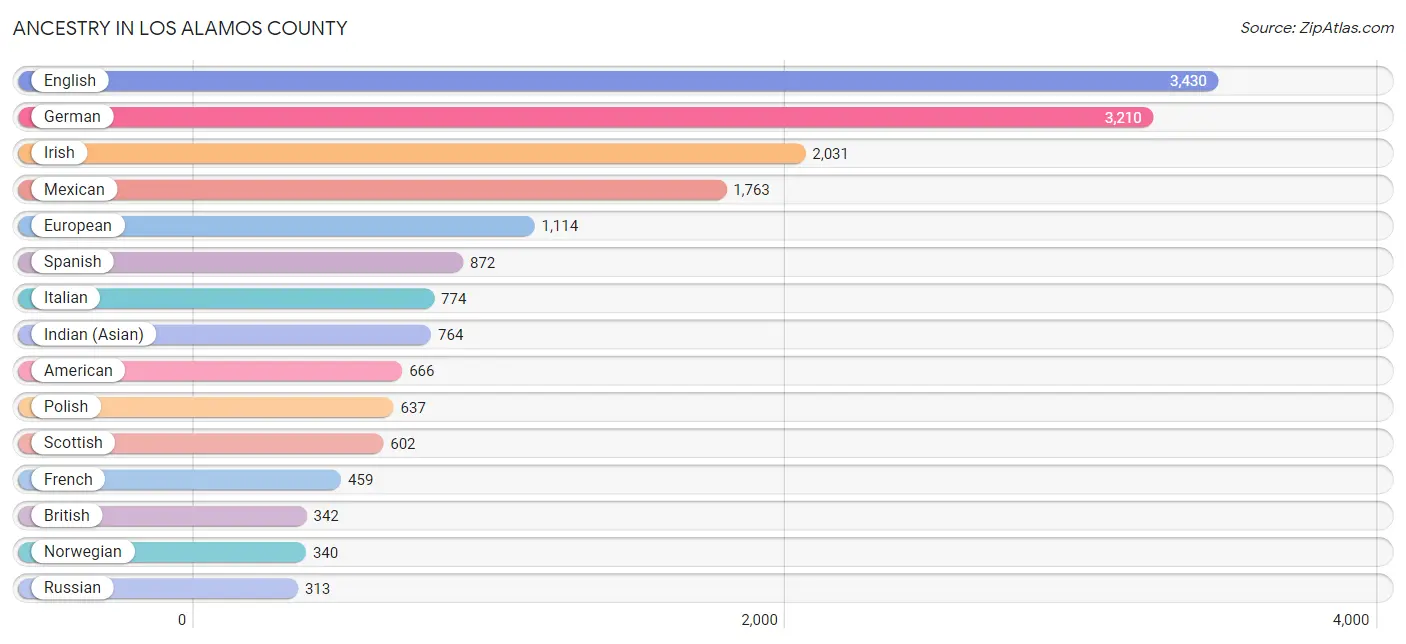
| Ancestry | # Population | % Population |
| African | 3 | 0.0% |
| American | 666 | 3.5% |
| Apache | 1 | 0.0% |
| Arab | 76 | 0.4% |
| Argentinean | 10 | 0.1% |
| Armenian | 16 | 0.1% |
| Basque | 4 | 0.0% |
| Belgian | 114 | 0.6% |
| Bhutanese | 143 | 0.7% |
| British | 342 | 1.8% |
| British West Indian | 42 | 0.2% |
| Burmese | 176 | 0.9% |
| Canadian | 57 | 0.3% |
| Central American | 186 | 1.0% |
| Central American Indian | 11 | 0.1% |
| Cherokee | 48 | 0.3% |
| Chippewa | 19 | 0.1% |
| Choctaw | 45 | 0.2% |
| Colombian | 47 | 0.2% |
| Colville | 13 | 0.1% |
| Croatian | 11 | 0.1% |
| Czech | 62 | 0.3% |
| Czechoslovakian | 7 | 0.0% |
| Danish | 189 | 1.0% |
| Dutch | 188 | 1.0% |
| Eastern European | 193 | 1.0% |
| Ecuadorian | 15 | 0.1% |
| English | 3,430 | 17.8% |
| Ethiopian | 43 | 0.2% |
| European | 1,114 | 5.8% |
| Filipino | 84 | 0.4% |
| Finnish | 24 | 0.1% |
| French | 459 | 2.4% |
| French Canadian | 155 | 0.8% |
| German | 3,210 | 16.7% |
| Greek | 80 | 0.4% |
| Guamanian / Chamorro | 31 | 0.2% |
| Guatemalan | 30 | 0.2% |
| Hungarian | 106 | 0.5% |
| Indian (Asian) | 764 | 4.0% |
| Irish | 2,031 | 10.5% |
| Israeli | 11 | 0.1% |
| Italian | 774 | 4.0% |
| Jamaican | 27 | 0.1% |
| Korean | 144 | 0.7% |
| Laotian | 14 | 0.1% |
| Latvian | 24 | 0.1% |
| Lebanese | 52 | 0.3% |
| Lithuanian | 21 | 0.1% |
| Malaysian | 20 | 0.1% |
| Mexican | 1,763 | 9.2% |
| Native Hawaiian | 63 | 0.3% |
| Navajo | 135 | 0.7% |
| New Zealander | 10 | 0.1% |
| Nicaraguan | 131 | 0.7% |
| Nigerian | 29 | 0.2% |
| Northern European | 58 | 0.3% |
| Norwegian | 340 | 1.8% |
| Pakistani | 3 | 0.0% |
| Panamanian | 8 | 0.0% |
| Peruvian | 17 | 0.1% |
| Polish | 637 | 3.3% |
| Portuguese | 134 | 0.7% |
| Pueblo | 41 | 0.2% |
| Puerto Rican | 114 | 0.6% |
| Romanian | 35 | 0.2% |
| Russian | 313 | 1.6% |
| Samoan | 22 | 0.1% |
| Scandinavian | 291 | 1.5% |
| Scotch-Irish | 278 | 1.4% |
| Scottish | 602 | 3.1% |
| Serbian | 42 | 0.2% |
| Slavic | 10 | 0.1% |
| Slovak | 29 | 0.2% |
| Slovene | 47 | 0.2% |
| South American | 89 | 0.5% |
| Spaniard | 272 | 1.4% |
| Spanish | 872 | 4.5% |
| Sri Lankan | 11 | 0.1% |
| Subsaharan African | 75 | 0.4% |
| Swedish | 289 | 1.5% |
| Swiss | 103 | 0.5% |
| Thai | 138 | 0.7% |
| Turkish | 9 | 0.1% |
| Ukrainian | 107 | 0.6% |
| Vietnamese | 45 | 0.2% |
| Welsh | 145 | 0.7% |
| Yugoslavian | 9 | 0.1% | View All 88 Rows |
Immigrants in Los Alamos County
The most numerous immigrant groups reported in Los Alamos County came from Asia (858 | 4.5%), Eastern Asia (626 | 3.3%), China (521 | 2.7%), Europe (485 | 2.5%), and Latin America (299 | 1.5%), together accounting for 14.5% of all Los Alamos County residents.
| Immigration Origin | # Population | % Population |
| Africa | 72 | 0.4% |
| Argentina | 10 | 0.1% |
| Asia | 858 | 4.5% |
| Austria | 13 | 0.1% |
| Bangladesh | 45 | 0.2% |
| Belarus | 10 | 0.1% |
| Bosnia and Herzegovina | 12 | 0.1% |
| Canada | 110 | 0.6% |
| Caribbean | 59 | 0.3% |
| Central America | 168 | 0.9% |
| China | 521 | 2.7% |
| Colombia | 47 | 0.2% |
| Croatia | 5 | 0.0% |
| Czechoslovakia | 18 | 0.1% |
| Eastern Africa | 43 | 0.2% |
| Eastern Asia | 626 | 3.3% |
| Eastern Europe | 267 | 1.4% |
| Ecuador | 15 | 0.1% |
| England | 20 | 0.1% |
| Ethiopia | 43 | 0.2% |
| Europe | 485 | 2.5% |
| Germany | 63 | 0.3% |
| Greece | 20 | 0.1% |
| Guatemala | 1 | 0.0% |
| India | 98 | 0.5% |
| Italy | 19 | 0.1% |
| Jamaica | 31 | 0.2% |
| Japan | 23 | 0.1% |
| Korea | 82 | 0.4% |
| Latin America | 299 | 1.5% |
| Latvia | 9 | 0.1% |
| Mexico | 167 | 0.9% |
| Netherlands | 17 | 0.1% |
| Nigeria | 29 | 0.2% |
| Northern Europe | 32 | 0.2% |
| Oceania | 10 | 0.1% |
| Pakistan | 8 | 0.0% |
| Philippines | 26 | 0.1% |
| Poland | 38 | 0.2% |
| Portugal | 20 | 0.1% |
| Romania | 8 | 0.0% |
| Russia | 43 | 0.2% |
| Serbia | 42 | 0.2% |
| South America | 72 | 0.4% |
| South Central Asia | 151 | 0.8% |
| South Eastern Asia | 55 | 0.3% |
| Southern Europe | 83 | 0.4% |
| Spain | 24 | 0.1% |
| Switzerland | 10 | 0.1% |
| Taiwan | 81 | 0.4% |
| Turkey | 9 | 0.1% |
| Ukraine | 50 | 0.3% |
| Vietnam | 29 | 0.2% |
| Western Africa | 29 | 0.2% |
| Western Asia | 26 | 0.1% |
| Western Europe | 103 | 0.5% | View All 56 Rows |
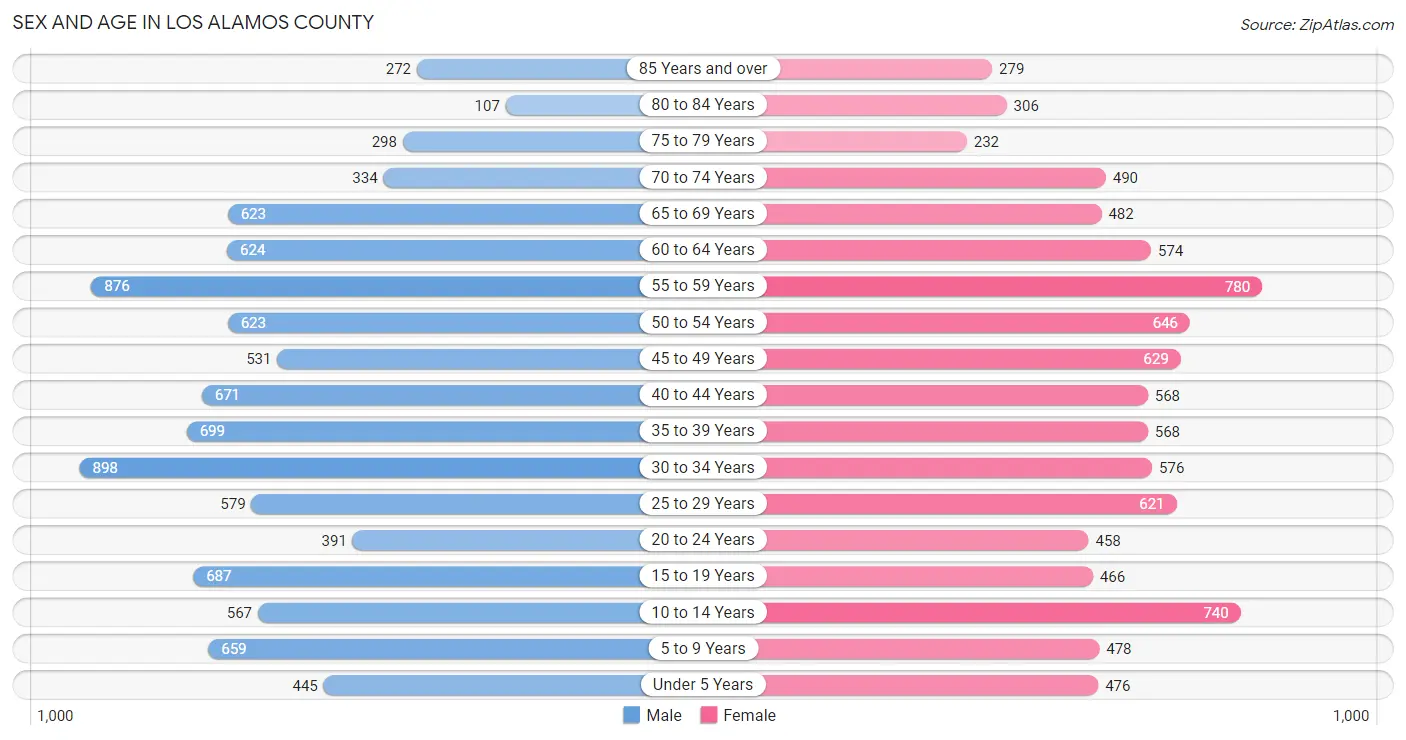
Sex and Age in Los Alamos County
Sex and Age in Los Alamos County
The most populous age groups in Los Alamos County are 30 to 34 Years (898 | 9.1%) for men and 55 to 59 Years (780 | 8.3%) for women.
| Age Bracket | Male | Female |
| Under 5 Years | 445 (4.5%) | 476 (5.1%) |
| 5 to 9 Years | 659 (6.7%) | 478 (5.1%) |
| 10 to 14 Years | 567 (5.7%) | 740 (7.9%) |
| 15 to 19 Years | 687 (7.0%) | 466 (5.0%) |
| 20 to 24 Years | 391 (4.0%) | 458 (4.9%) |
| 25 to 29 Years | 579 (5.9%) | 621 (6.6%) |
| 30 to 34 Years | 898 (9.1%) | 576 (6.1%) |
| 35 to 39 Years | 699 (7.1%) | 568 (6.1%) |
| 40 to 44 Years | 671 (6.8%) | 568 (6.1%) |
| 45 to 49 Years | 531 (5.4%) | 629 (6.7%) |
| 50 to 54 Years | 623 (6.3%) | 646 (6.9%) |
| 55 to 59 Years | 876 (8.9%) | 780 (8.3%) |
| 60 to 64 Years | 624 (6.3%) | 574 (6.1%) |
| 65 to 69 Years | 623 (6.3%) | 482 (5.1%) |
| 70 to 74 Years | 334 (3.4%) | 490 (5.2%) |
| 75 to 79 Years | 298 (3.0%) | 232 (2.5%) |
| 80 to 84 Years | 107 (1.1%) | 306 (3.3%) |
| 85 Years and over | 272 (2.8%) | 279 (3.0%) |
| Total | 9,884 (100.0%) | 9,369 (100.0%) |
Families and Households in Los Alamos County
Median Family Size in Los Alamos County
The median family size in Los Alamos County is 2.95 persons per family, with single male/father families (277 | 5.3%) accounting for the largest median family size of 3.32 persons per family. On the other hand, single female/mother families (484 | 9.3%) represent the smallest median family size with 2.50 persons per family.
| Family Type | # Families | Family Size |
| Married-Couple | 4,468 (85.5%) | 2.97 |
| Single Male/Father | 277 (5.3%) | 3.32 |
| Single Female/Mother | 484 (9.3%) | 2.50 |
| Total Families | 5,229 (100.0%) | 2.95 |
Median Household Size in Los Alamos County
The median household size in Los Alamos County is 2.35 persons per household, with single male/father households (277 | 3.4%) accounting for the largest median household size of 3.57 persons per household. non-family households (2,920 | 35.8%) represent the smallest median household size with 1.18 persons per household.
| Household Type | # Households | Household Size |
| Married-Couple | 4,468 (54.8%) | 3.01 |
| Single Male/Father | 277 (3.4%) | 3.57 |
| Single Female/Mother | 484 (5.9%) | 2.63 |
| Non-family | 2,920 (35.8%) | 1.18 |
| Total Households | 8,149 (100.0%) | 2.35 |
Household Size by Marriage Status in Los Alamos County
Out of a total of 8,149 households in Los Alamos County, 5,229 (64.2%) are family households, while 2,920 (35.8%) are nonfamily households. The most numerous type of family households are 2-person households, comprising 2,620, and the most common type of nonfamily households are 1-person households, comprising 2,440.
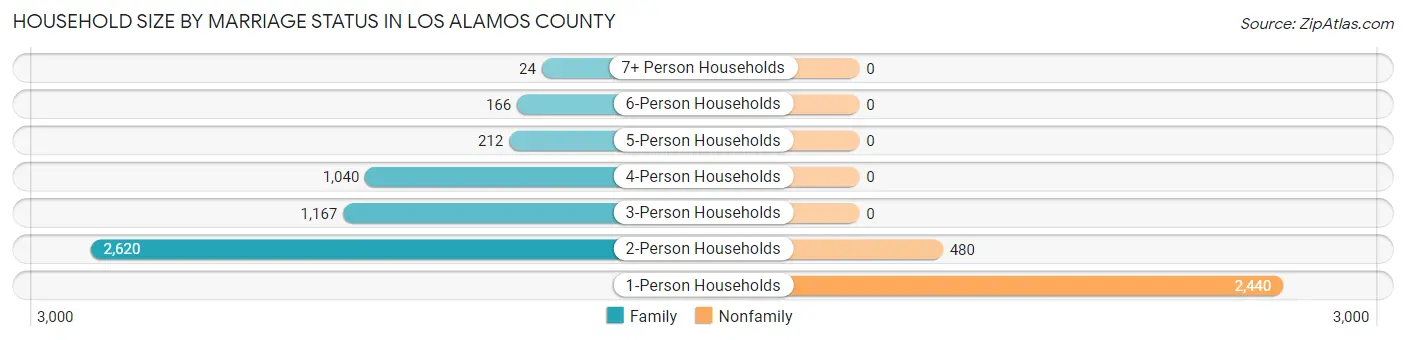
| Household Size | Family Households | Nonfamily Households |
| 1-Person Households | - | 2,440 (29.9%) |
| 2-Person Households | 2,620 (32.2%) | 480 (5.9%) |
| 3-Person Households | 1,167 (14.3%) | 0 (0.0%) |
| 4-Person Households | 1,040 (12.8%) | 0 (0.0%) |
| 5-Person Households | 212 (2.6%) | 0 (0.0%) |
| 6-Person Households | 166 (2.0%) | 0 (0.0%) |
| 7+ Person Households | 24 (0.3%) | 0 (0.0%) |
| Total | 5,229 (64.2%) | 2,920 (35.8%) |
Female Fertility in Los Alamos County
Fertility by Age in Los Alamos County
Average fertility rate in Los Alamos County is 73.0 births per 1,000 women. Women in the age bracket of 20 to 34 years have the highest fertility rate with 133.0 births per 1,000 women. Women in the age bracket of 20 to 34 years acount for 74.8% of all women with births.
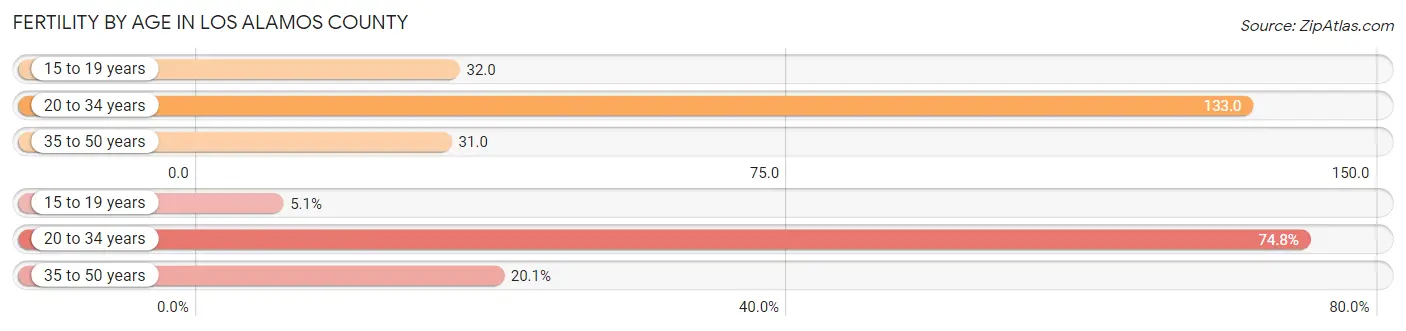
| Age Bracket | Women with Births | Births / 1,000 Women |
| 15 to 19 years | 15 (5.1%) | 32.0 |
| 20 to 34 years | 220 (74.8%) | 133.0 |
| 35 to 50 years | 59 (20.1%) | 31.0 |
| Total | 294 (100.0%) | 73.0 |
Fertility by Age by Marriage Status in Los Alamos County
59.9% of women with births (294) in Los Alamos County are married. The highest percentage of unmarried women with births falls into 15 to 19 years age bracket with 100.0% of them unmarried at the time of birth, while the lowest percentage of unmarried women with births belong to 35 to 50 years age bracket with 0.0% of them unmarried.
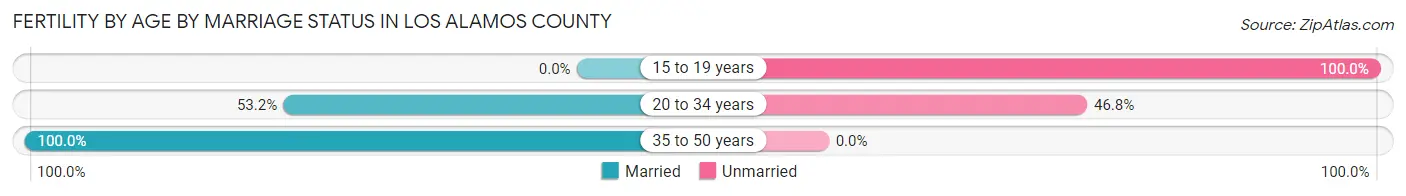
| Age Bracket | Married | Unmarried |
| 15 to 19 years | 0 (0.0%) | 15 (100.0%) |
| 20 to 34 years | 117 (53.2%) | 103 (46.8%) |
| 35 to 50 years | 59 (100.0%) | 0 (0.0%) |
| Total | 176 (59.9%) | 118 (40.1%) |
Fertility by Education in Los Alamos County
Average fertility rate in Los Alamos County is 73.0 births per 1,000 women. Women with the education attainment of high school diploma have the highest fertility rate of 181.0 births per 1,000 women, while women with the education attainment of less than high school have the lowest fertility at 32.0 births per 1,000 women. Women with the education attainment of high school diploma represent 31.6% of all women with births.
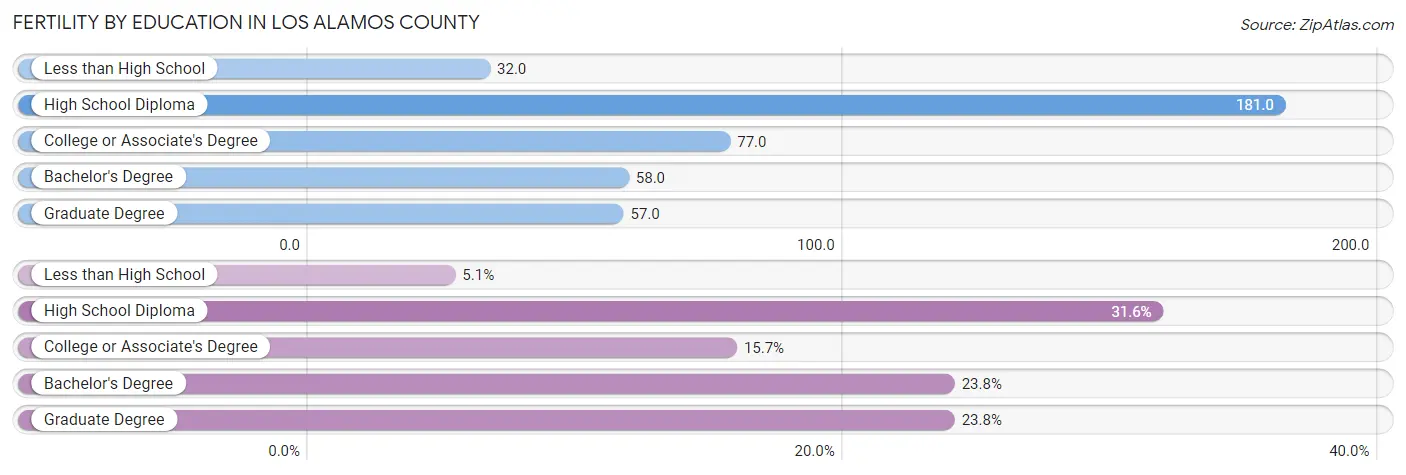
| Educational Attainment | Women with Births | Births / 1,000 Women |
| Less than High School | 15 (5.1%) | 32.0 |
| High School Diploma | 93 (31.6%) | 181.0 |
| College or Associate's Degree | 46 (15.7%) | 77.0 |
| Bachelor's Degree | 70 (23.8%) | 58.0 |
| Graduate Degree | 70 (23.8%) | 57.0 |
| Total | 294 (100.0%) | 73.0 |
Fertility by Education by Marriage Status in Los Alamos County
40.1% of women with births in Los Alamos County are unmarried. Women with the educational attainment of bachelor's degree are most likely to be married with 100.0% of them married at childbirth, while women with the educational attainment of less than high school are least likely to be married with 100.0% of them unmarried at childbirth.
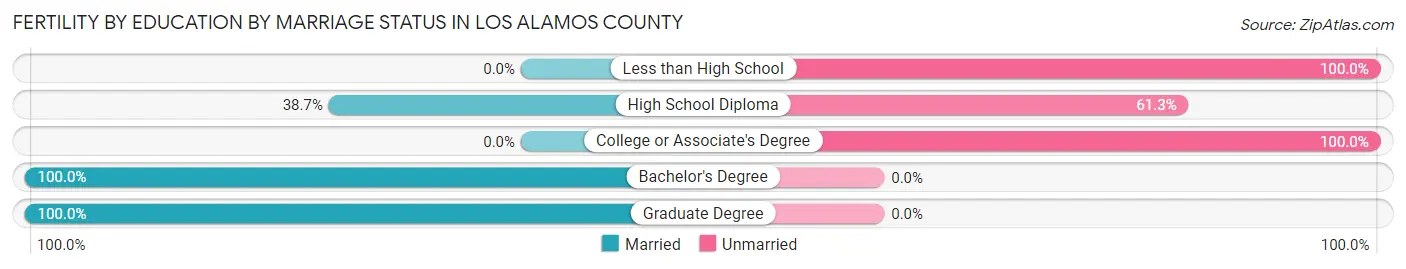
| Educational Attainment | Married | Unmarried |
| Less than High School | 0 (0.0%) | 15 (100.0%) |
| High School Diploma | 36 (38.7%) | 57 (61.3%) |
| College or Associate's Degree | 0 (0.0%) | 46 (100.0%) |
| Bachelor's Degree | 70 (100.0%) | 0 (0.0%) |
| Graduate Degree | 70 (100.0%) | 0 (0.0%) |
| Total | 176 (59.9%) | 118 (40.1%) |
Employment Characteristics in Los Alamos County
Employment by Class of Employer in Los Alamos County
Among the 10,197 employed individuals in Los Alamos County, private company employees (4,013 | 39.4%), federal government employees (3,101 | 30.4%), and not-for-profit organizations (1,093 | 10.7%) make up the most common classes of employment.
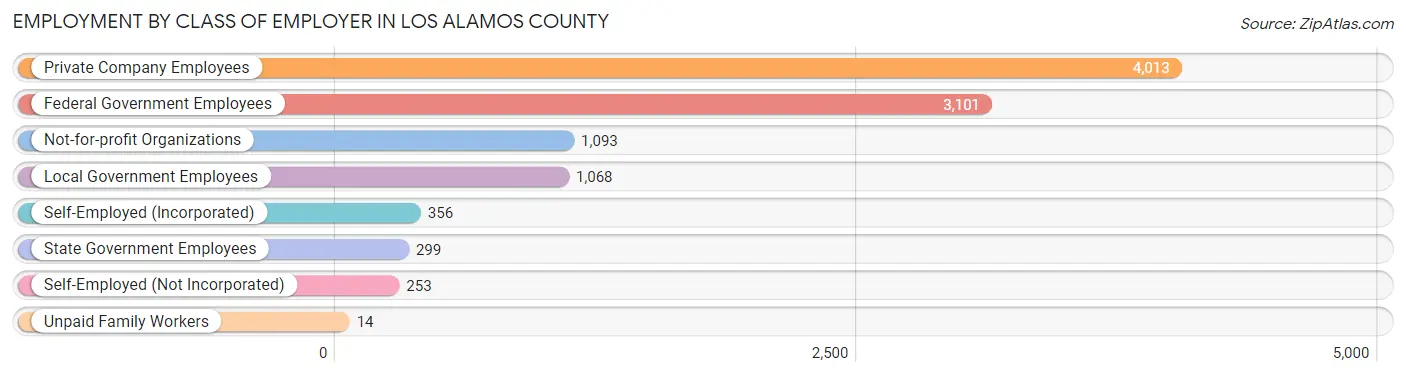
| Employer Class | # Employees | % Employees |
| Private Company Employees | 4,013 | 39.4% |
| Self-Employed (Incorporated) | 356 | 3.5% |
| Self-Employed (Not Incorporated) | 253 | 2.5% |
| Not-for-profit Organizations | 1,093 | 10.7% |
| Local Government Employees | 1,068 | 10.5% |
| State Government Employees | 299 | 2.9% |
| Federal Government Employees | 3,101 | 30.4% |
| Unpaid Family Workers | 14 | 0.1% |
| Total | 10,197 | 100.0% |
Employment Status by Age in Los Alamos County
According to the labor force statistics for Los Alamos County, out of the total population over 16 years of age (15,667), 67.5% or 10,575 individuals are in the labor force, with 1.9% or 201 of them unemployed. The age group with the highest labor force participation rate is 30 to 34 years, with 88.5% or 1,304 individuals in the labor force. Within the labor force, the 20 to 24 years age range has the highest percentage of unemployed individuals, with 6.2% or 44 of them being unemployed.
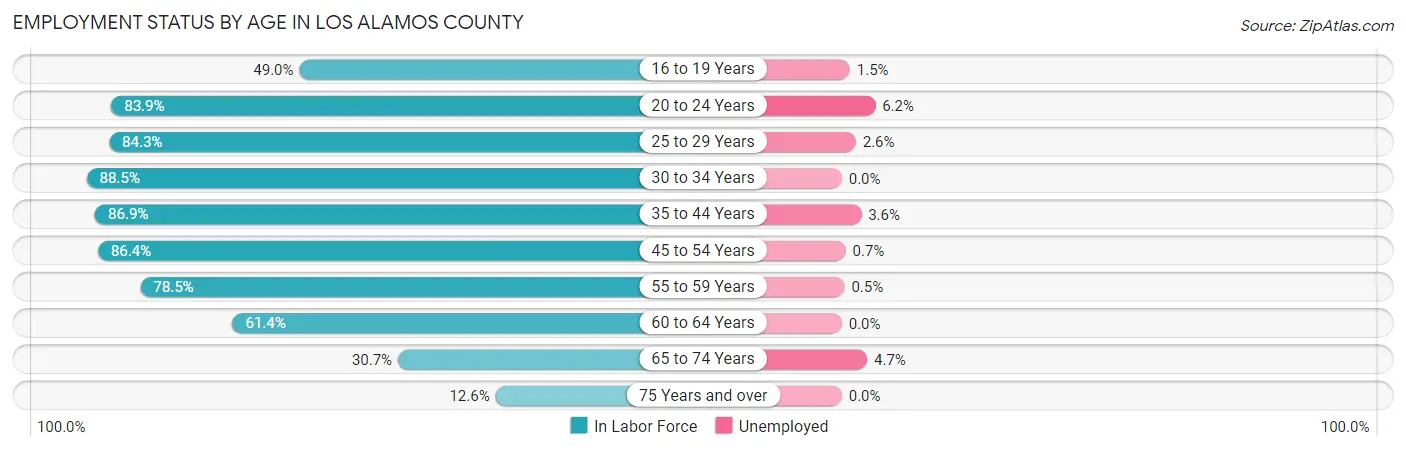
| Age Bracket | In Labor Force | Unemployed |
| 16 to 19 Years | 457 (49.0%) | 7 (1.5%) |
| 20 to 24 Years | 712 (83.9%) | 44 (6.2%) |
| 25 to 29 Years | 1,012 (84.3%) | 26 (2.6%) |
| 30 to 34 Years | 1,304 (88.5%) | 0 (0.0%) |
| 35 to 44 Years | 2,178 (86.9%) | 78 (3.6%) |
| 45 to 54 Years | 2,099 (86.4%) | 15 (0.7%) |
| 55 to 59 Years | 1,300 (78.5%) | 6 (0.5%) |
| 60 to 64 Years | 736 (61.4%) | 0 (0.0%) |
| 65 to 74 Years | 592 (30.7%) | 28 (4.7%) |
| 75 Years and over | 188 (12.6%) | 0 (0.0%) |
| Total | 10,575 (67.5%) | 201 (1.9%) |
Employment Status by Educational Attainment in Los Alamos County
According to labor force statistics for Los Alamos County, 82.5% of individuals (8,632) out of the total population between 25 and 64 years of age (10,463) are in the labor force, with 1.4% or 121 of them being unemployed. The group with the highest labor force participation rate are those with the educational attainment of bachelor's degree or higher, with 87.2% or 6,339 individuals in the labor force. Within the labor force, individuals with high school diploma education have the highest percentage of unemployment, with 3.0% or 26 of them being unemployed.
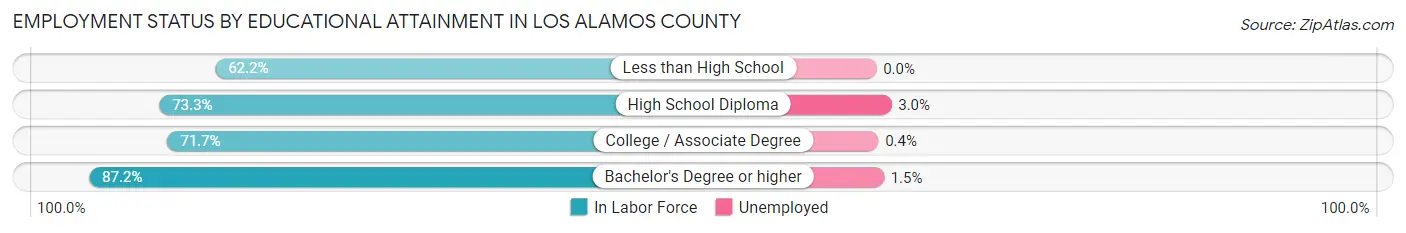
| Educational Attainment | In Labor Force | Unemployed |
| Less than High School | 148 (62.2%) | 0 (0.0%) |
| High School Diploma | 863 (73.3%) | 35 (3.0%) |
| College / Associate Degree | 1,276 (71.7%) | 7 (0.4%) |
| Bachelor's Degree or higher | 6,339 (87.2%) | 109 (1.5%) |
| Total | 8,632 (82.5%) | 146 (1.4%) |
Employment Occupations by Sex in Los Alamos County
Management, Business, Science and Arts Occupations
The most common Management, Business, Science and Arts occupations in Los Alamos County are Computers, Engineering & Science (4,170 | 40.6%), Life, Physical & Social Science (2,120 | 20.6%), Architecture & Engineering (1,169 | 11.4%), Community & Social Service (1,164 | 11.3%), and Management (1,051 | 10.2%).
Management, Business, Science and Arts Occupations by Sex
Within the Management, Business, Science and Arts occupations in Los Alamos County, the most male-oriented occupations are Architecture & Engineering (86.9%), Computers, Engineering & Science (72.5%), and Life, Physical & Social Science (70.5%), while the most female-oriented occupations are Education, Arts & Media (83.1%), Health Technologists (80.7%), and Legal Services & Support (80.4%).
| Occupation | Male | Female |
| Management | 561 (53.4%) | 490 (46.6%) |
| Business & Financial | 198 (34.9%) | 369 (65.1%) |
| Computers, Engineering & Science | 3,025 (72.5%) | 1,145 (27.5%) |
| Computers & Mathematics | 514 (58.3%) | 367 (41.7%) |
| Architecture & Engineering | 1,016 (86.9%) | 153 (13.1%) |
| Life, Physical & Social Science | 1,495 (70.5%) | 625 (29.5%) |
| Community & Social Service | 310 (26.6%) | 854 (73.4%) |
| Education, Arts & Media | 21 (16.9%) | 103 (83.1%) |
| Legal Services & Support | 19 (19.6%) | 78 (80.4%) |
| Education Instruction & Library | 139 (23.5%) | 452 (76.5%) |
| Arts, Media & Entertainment | 131 (37.2%) | 221 (62.8%) |
| Health Diagnosing & Treating | 125 (21.3%) | 461 (78.7%) |
| Health Technologists | 105 (19.3%) | 440 (80.7%) |
| Total (Category) | 4,219 (56.0%) | 3,319 (44.0%) |
| Total (Overall) | 5,730 (55.7%) | 4,548 (44.3%) |
Services Occupations
The most common Services occupations in Los Alamos County are Food Preparation & Serving (322 | 3.1%), Security & Protection (260 | 2.5%), Healthcare Support (154 | 1.5%), Law Enforcement (145 | 1.4%), and Firefighting & Prevention (115 | 1.1%).
Services Occupations by Sex
Within the Services occupations in Los Alamos County, the most male-oriented occupations are Firefighting & Prevention (87.8%), Food Preparation & Serving (61.5%), and Cleaning & Maintenance (56.7%), while the most female-oriented occupations are Law Enforcement (89.0%), Healthcare Support (77.9%), and Security & Protection (55.0%).
| Occupation | Male | Female |
| Healthcare Support | 34 (22.1%) | 120 (77.9%) |
| Security & Protection | 117 (45.0%) | 143 (55.0%) |
| Firefighting & Prevention | 101 (87.8%) | 14 (12.2%) |
| Law Enforcement | 16 (11.0%) | 129 (89.0%) |
| Food Preparation & Serving | 198 (61.5%) | 124 (38.5%) |
| Cleaning & Maintenance | 55 (56.7%) | 42 (43.3%) |
| Personal Care & Service | 46 (49.5%) | 47 (50.5%) |
| Total (Category) | 450 (48.6%) | 476 (51.4%) |
| Total (Overall) | 5,730 (55.7%) | 4,548 (44.3%) |
Sales and Office Occupations
The most common Sales and Office occupations in Los Alamos County are Office & Administration (625 | 6.1%), and Sales & Related (274 | 2.7%).
Sales and Office Occupations by Sex
| Occupation | Male | Female |
| Sales & Related | 110 (40.2%) | 164 (59.9%) |
| Office & Administration | 218 (34.9%) | 407 (65.1%) |
| Total (Category) | 328 (36.5%) | 571 (63.5%) |
| Total (Overall) | 5,730 (55.7%) | 4,548 (44.3%) |
Natural Resources, Construction and Maintenance Occupations
The most common Natural Resources, Construction and Maintenance occupations in Los Alamos County are Installation, Maintenance & Repair (235 | 2.3%), and Construction & Extraction (198 | 1.9%).
Natural Resources, Construction and Maintenance Occupations by Sex
| Occupation | Male | Female |
| Farming, Fishing & Forestry | 0 (0.0%) | 0 (0.0%) |
| Construction & Extraction | 169 (85.4%) | 29 (14.6%) |
| Installation, Maintenance & Repair | 235 (100.0%) | 0 (0.0%) |
| Total (Category) | 404 (93.3%) | 29 (6.7%) |
| Total (Overall) | 5,730 (55.7%) | 4,548 (44.3%) |
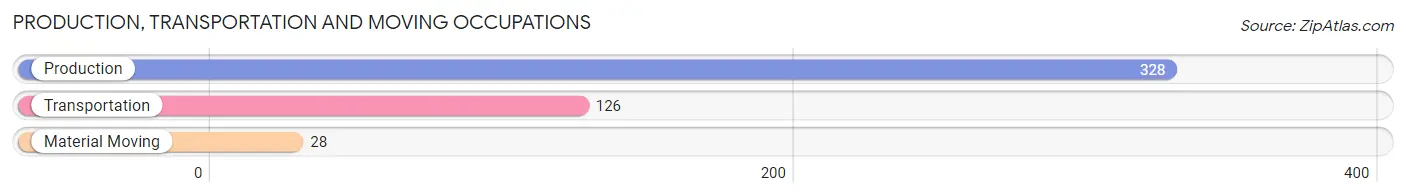
Production, Transportation and Moving Occupations
The most common Production, Transportation and Moving occupations in Los Alamos County are Production (328 | 3.2%), Transportation (126 | 1.2%), and Material Moving (28 | 0.3%).
Production, Transportation and Moving Occupations by Sex
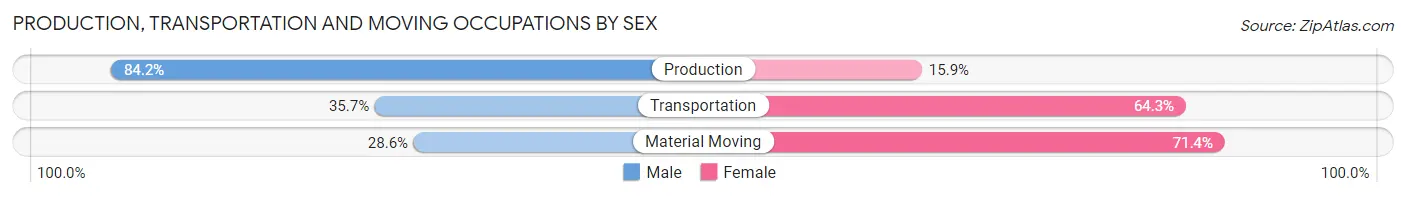
| Occupation | Male | Female |
| Production | 276 (84.2%) | 52 (15.9%) |
| Transportation | 45 (35.7%) | 81 (64.3%) |
| Material Moving | 8 (28.6%) | 20 (71.4%) |
| Total (Category) | 329 (68.3%) | 153 (31.7%) |
| Total (Overall) | 5,730 (55.7%) | 4,548 (44.3%) |
Employment Industries by Sex in Los Alamos County
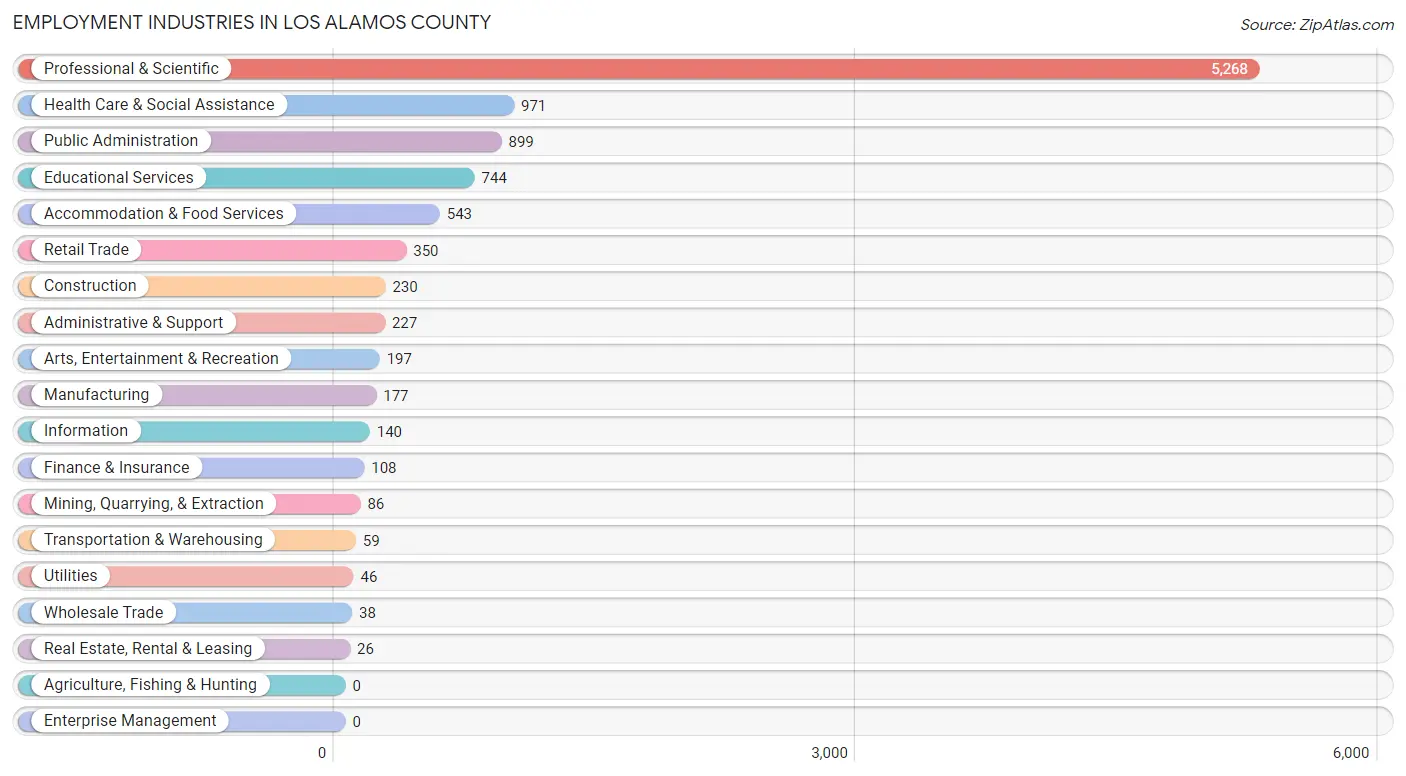
Employment Industries in Los Alamos County
The major employment industries in Los Alamos County include Professional & Scientific (5,268 | 51.3%), Health Care & Social Assistance (971 | 9.5%), Public Administration (899 | 8.7%), Educational Services (744 | 7.2%), and Accommodation & Food Services (543 | 5.3%).
Employment Industries by Sex in Los Alamos County
The Los Alamos County industries that see more men than women are Utilities (100.0%), Construction (91.7%), and Wholesale Trade (86.8%), whereas the industries that tend to have a higher number of women are Real Estate, Rental & Leasing (100.0%), Transportation & Warehousing (78.0%), and Finance & Insurance (77.8%).
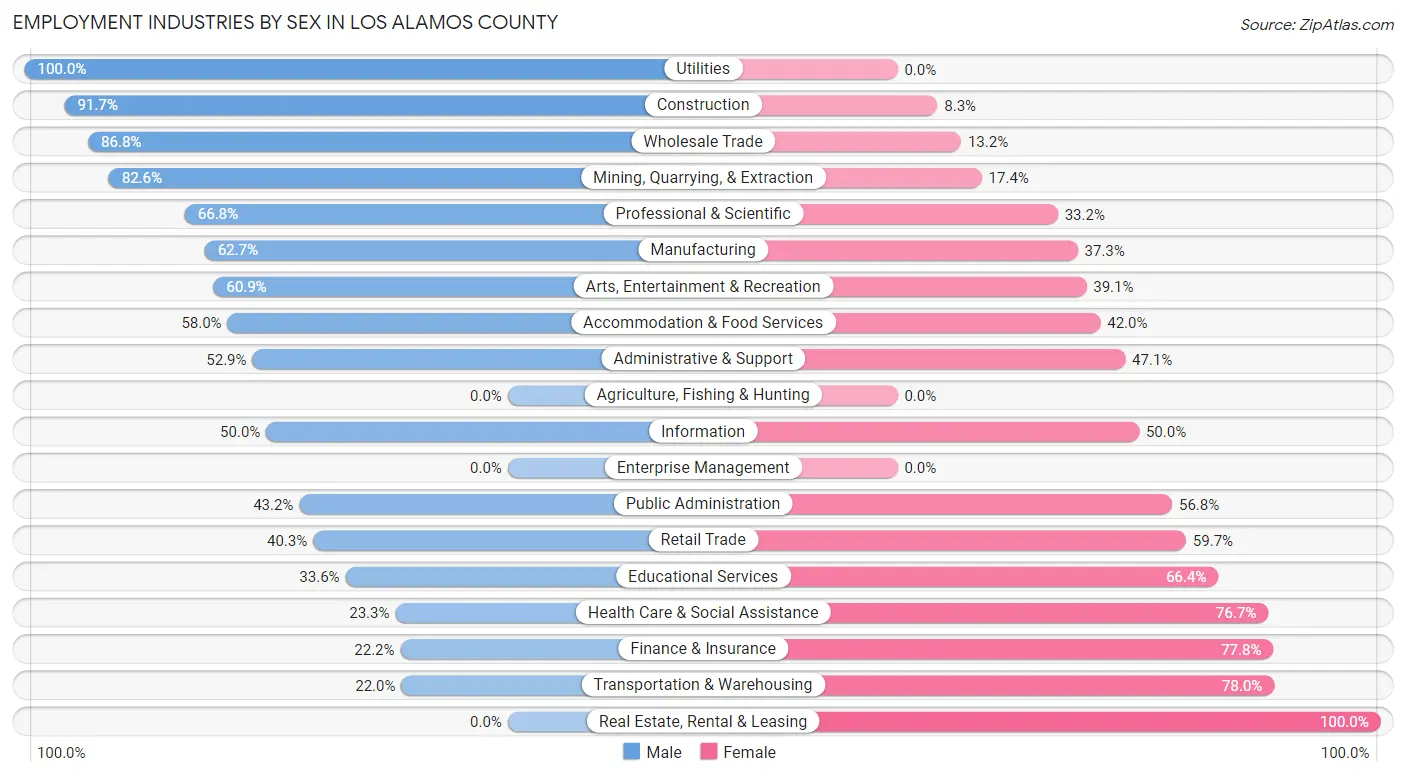
| Industry | Male | Female |
| Agriculture, Fishing & Hunting | 0 (0.0%) | 0 (0.0%) |
| Mining, Quarrying, & Extraction | 71 (82.6%) | 15 (17.4%) |
| Construction | 211 (91.7%) | 19 (8.3%) |
| Manufacturing | 111 (62.7%) | 66 (37.3%) |
| Wholesale Trade | 33 (86.8%) | 5 (13.2%) |
| Retail Trade | 141 (40.3%) | 209 (59.7%) |
| Transportation & Warehousing | 13 (22.0%) | 46 (78.0%) |
| Utilities | 46 (100.0%) | 0 (0.0%) |
| Information | 70 (50.0%) | 70 (50.0%) |
| Finance & Insurance | 24 (22.2%) | 84 (77.8%) |
| Real Estate, Rental & Leasing | 0 (0.0%) | 26 (100.0%) |
| Professional & Scientific | 3,520 (66.8%) | 1,748 (33.2%) |
| Enterprise Management | 0 (0.0%) | 0 (0.0%) |
| Administrative & Support | 120 (52.9%) | 107 (47.1%) |
| Educational Services | 250 (33.6%) | 494 (66.4%) |
| Health Care & Social Assistance | 226 (23.3%) | 745 (76.7%) |
| Arts, Entertainment & Recreation | 120 (60.9%) | 77 (39.1%) |
| Accommodation & Food Services | 315 (58.0%) | 228 (42.0%) |
| Public Administration | 388 (43.2%) | 511 (56.8%) |
| Total | 5,730 (55.7%) | 4,548 (44.3%) |
Education in Los Alamos County
School Enrollment in Los Alamos County
The most common levels of schooling among the 4,870 students in Los Alamos County are high school (1,123 | 23.1%), elementary school (1,033 | 21.2%), and middle school (967 | 19.9%).
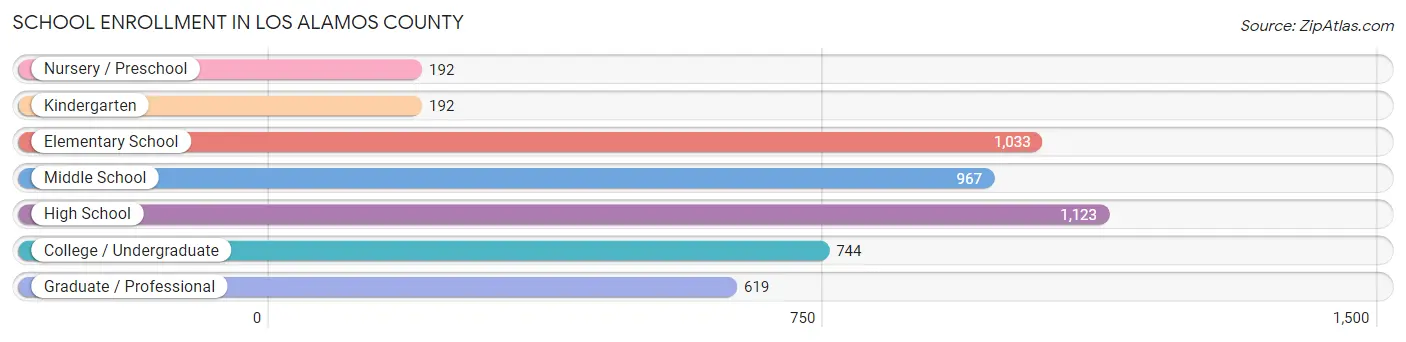
| School Level | # Students | % Students |
| Nursery / Preschool | 192 | 3.9% |
| Kindergarten | 192 | 3.9% |
| Elementary School | 1,033 | 21.2% |
| Middle School | 967 | 19.9% |
| High School | 1,123 | 23.1% |
| College / Undergraduate | 744 | 15.3% |
| Graduate / Professional | 619 | 12.7% |
| Total | 4,870 | 100.0% |
School Enrollment by Age by Funding Source in Los Alamos County
Out of a total of 4,870 students who are enrolled in schools in Los Alamos County, 623 (12.8%) attend a private institution, while the remaining 4,247 (87.2%) are enrolled in public schools. The age group of 3 to 4 year olds has the highest likelihood of being enrolled in private schools, with 60 (34.5% in the age bracket) enrolled. Conversely, the age group of 10 to 14 year olds has the lowest likelihood of being enrolled in a private school, with 1,288 (98.6% in the age bracket) attending a public institution.
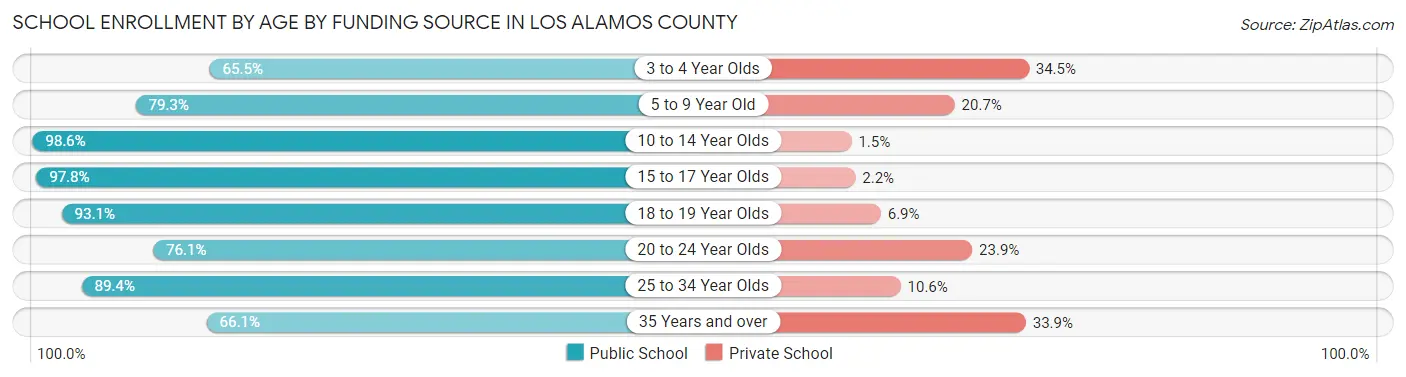
| Age Bracket | Public School | Private School |
| 3 to 4 Year Olds | 114 (65.5%) | 60 (34.5%) |
| 5 to 9 Year Old | 871 (79.3%) | 227 (20.7%) |
| 10 to 14 Year Olds | 1,288 (98.6%) | 19 (1.5%) |
| 15 to 17 Year Olds | 762 (97.8%) | 17 (2.2%) |
| 18 to 19 Year Olds | 310 (93.1%) | 23 (6.9%) |
| 20 to 24 Year Olds | 248 (76.1%) | 78 (23.9%) |
| 25 to 34 Year Olds | 354 (89.4%) | 42 (10.6%) |
| 35 Years and over | 302 (66.1%) | 155 (33.9%) |
| Total | 4,247 (87.2%) | 623 (12.8%) |
Educational Attainment by Field of Study in Los Alamos County
Engineering (1,976 | 18.4%), physical & health sciences (1,895 | 17.7%), computers & mathematics (1,082 | 10.1%), bio, nature & agricultural (924 | 8.6%), and business (902 | 8.4%) are the most common fields of study among 10,718 individuals in Los Alamos County who have obtained a bachelor's degree or higher.
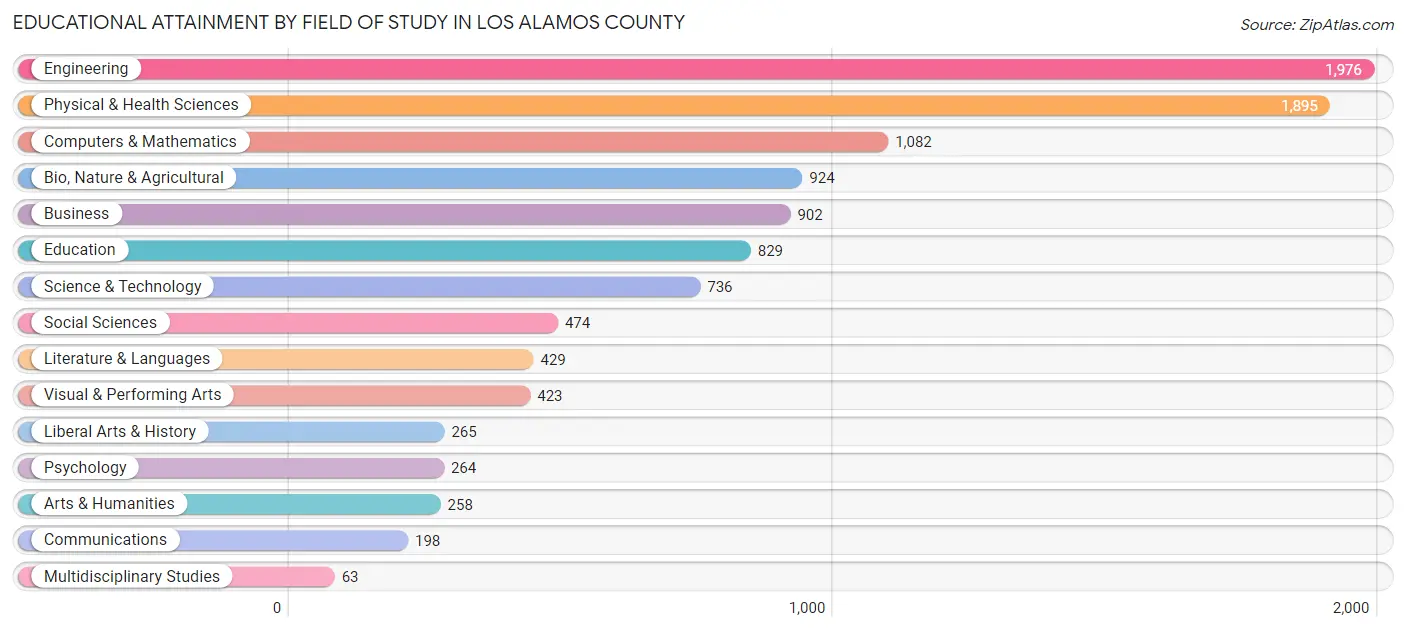
| Field of Study | # Graduates | % Graduates |
| Computers & Mathematics | 1,082 | 10.1% |
| Bio, Nature & Agricultural | 924 | 8.6% |
| Physical & Health Sciences | 1,895 | 17.7% |
| Psychology | 264 | 2.5% |
| Social Sciences | 474 | 4.4% |
| Engineering | 1,976 | 18.4% |
| Multidisciplinary Studies | 63 | 0.6% |
| Science & Technology | 736 | 6.9% |
| Business | 902 | 8.4% |
| Education | 829 | 7.7% |
| Literature & Languages | 429 | 4.0% |
| Liberal Arts & History | 265 | 2.5% |
| Visual & Performing Arts | 423 | 4.0% |
| Communications | 198 | 1.8% |
| Arts & Humanities | 258 | 2.4% |
| Total | 10,718 | 100.0% |
Transportation & Commute in Los Alamos County
Vehicle Availability by Sex in Los Alamos County
The most prevalent vehicle ownership categories in Los Alamos County are males with 2 vehicles (2,466, accounting for 43.2%) and females with 2 vehicles (1,860, making up 55.1%).
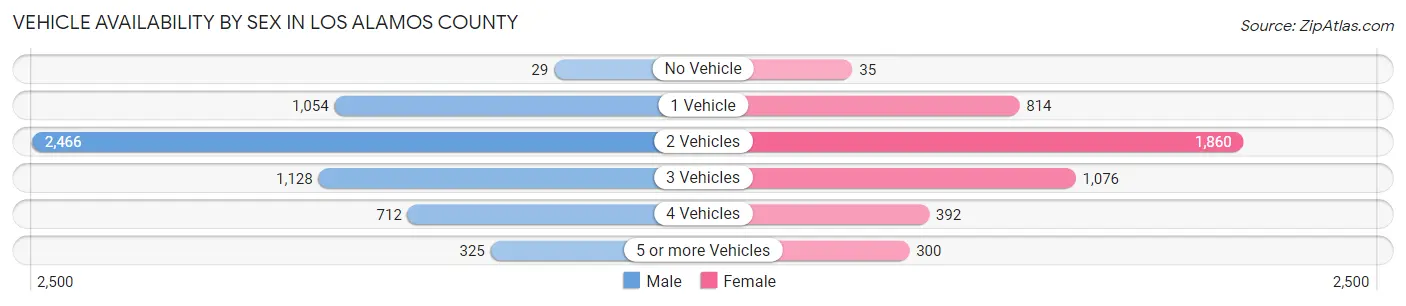
| Vehicles Available | Male | Female |
| No Vehicle | 29 (0.5%) | 35 (0.8%) |
| 1 Vehicle | 1,054 (18.4%) | 814 (18.2%) |
| 2 Vehicles | 2,466 (43.2%) | 1,860 (41.5%) |
| 3 Vehicles | 1,128 (19.7%) | 1,076 (24.0%) |
| 4 Vehicles | 712 (12.5%) | 392 (8.8%) |
| 5 or more Vehicles | 325 (5.7%) | 300 (6.7%) |
| Total | 5,714 (100.0%) | 4,477 (100.0%) |
Commute Time in Los Alamos County
The most frequently occuring commute durations in Los Alamos County are 10 to 14 minutes (2,565 commuters, 28.5%), 15 to 19 minutes (2,202 commuters, 24.5%), and 5 to 9 minutes (1,628 commuters, 18.1%).
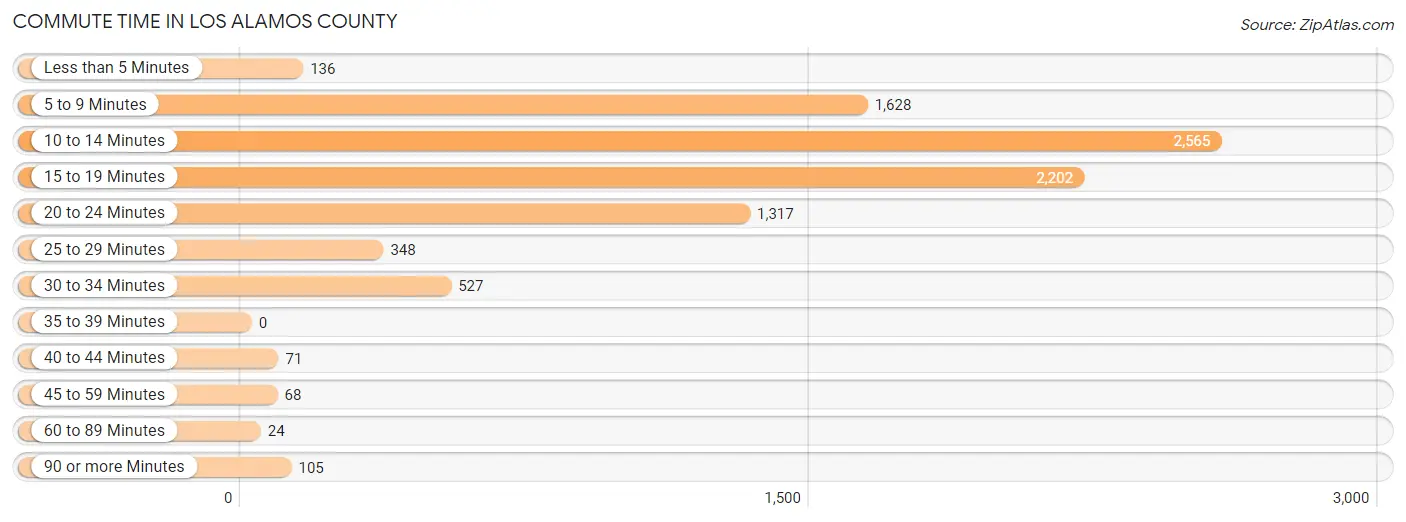
| Commute Time | # Commuters | % Commuters |
| Less than 5 Minutes | 136 | 1.5% |
| 5 to 9 Minutes | 1,628 | 18.1% |
| 10 to 14 Minutes | 2,565 | 28.5% |
| 15 to 19 Minutes | 2,202 | 24.5% |
| 20 to 24 Minutes | 1,317 | 14.6% |
| 25 to 29 Minutes | 348 | 3.9% |
| 30 to 34 Minutes | 527 | 5.9% |
| 35 to 39 Minutes | 0 | 0.0% |
| 40 to 44 Minutes | 71 | 0.8% |
| 45 to 59 Minutes | 68 | 0.8% |
| 60 to 89 Minutes | 24 | 0.3% |
| 90 or more Minutes | 105 | 1.2% |
Commute Time by Sex in Los Alamos County
The most common commute times in Los Alamos County are 10 to 14 minutes (1,513 commuters, 29.0%) for males and 10 to 14 minutes (1,052 commuters, 27.8%) for females.
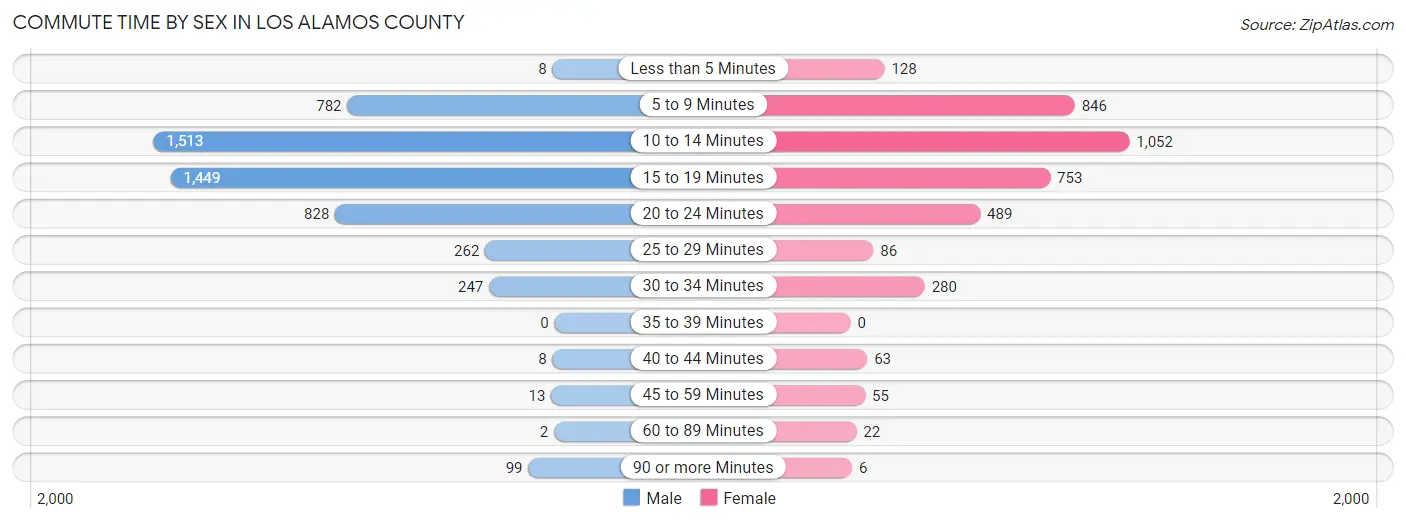
| Commute Time | Male | Female |
| Less than 5 Minutes | 8 (0.2%) | 128 (3.4%) |
| 5 to 9 Minutes | 782 (15.0%) | 846 (22.4%) |
| 10 to 14 Minutes | 1,513 (29.0%) | 1,052 (27.8%) |
| 15 to 19 Minutes | 1,449 (27.8%) | 753 (19.9%) |
| 20 to 24 Minutes | 828 (15.9%) | 489 (12.9%) |
| 25 to 29 Minutes | 262 (5.0%) | 86 (2.3%) |
| 30 to 34 Minutes | 247 (4.7%) | 280 (7.4%) |
| 35 to 39 Minutes | 0 (0.0%) | 0 (0.0%) |
| 40 to 44 Minutes | 8 (0.2%) | 63 (1.7%) |
| 45 to 59 Minutes | 13 (0.3%) | 55 (1.5%) |
| 60 to 89 Minutes | 2 (0.0%) | 22 (0.6%) |
| 90 or more Minutes | 99 (1.9%) | 6 (0.2%) |
Time of Departure to Work by Sex in Los Alamos County
The most frequent times of departure to work in Los Alamos County are 7:00 AM to 7:29 AM (931, 17.9%) for males and 7:30 AM to 7:59 AM (800, 21.2%) for females.
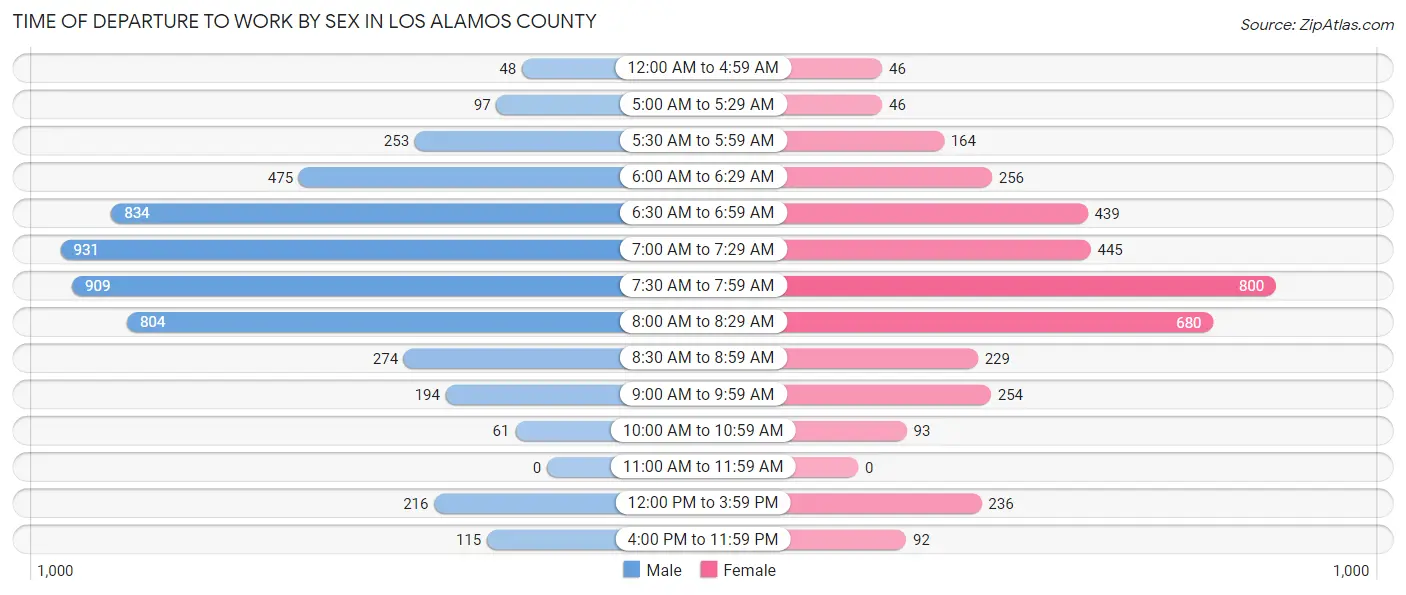
| Time of Departure | Male | Female |
| 12:00 AM to 4:59 AM | 48 (0.9%) | 46 (1.2%) |
| 5:00 AM to 5:29 AM | 97 (1.9%) | 46 (1.2%) |
| 5:30 AM to 5:59 AM | 253 (4.9%) | 164 (4.3%) |
| 6:00 AM to 6:29 AM | 475 (9.1%) | 256 (6.8%) |
| 6:30 AM to 6:59 AM | 834 (16.0%) | 439 (11.6%) |
| 7:00 AM to 7:29 AM | 931 (17.9%) | 445 (11.8%) |
| 7:30 AM to 7:59 AM | 909 (17.4%) | 800 (21.2%) |
| 8:00 AM to 8:29 AM | 804 (15.4%) | 680 (18.0%) |
| 8:30 AM to 8:59 AM | 274 (5.3%) | 229 (6.1%) |
| 9:00 AM to 9:59 AM | 194 (3.7%) | 254 (6.7%) |
| 10:00 AM to 10:59 AM | 61 (1.2%) | 93 (2.5%) |
| 11:00 AM to 11:59 AM | 0 (0.0%) | 0 (0.0%) |
| 12:00 PM to 3:59 PM | 216 (4.2%) | 236 (6.2%) |
| 4:00 PM to 11:59 PM | 115 (2.2%) | 92 (2.4%) |
| Total | 5,211 (100.0%) | 3,780 (100.0%) |
Housing Occupancy in Los Alamos County
Occupancy by Ownership in Los Alamos County
Of the total 8,149 dwellings in Los Alamos County, owner-occupied units account for 5,929 (72.8%), while renter-occupied units make up 2,220 (27.2%).
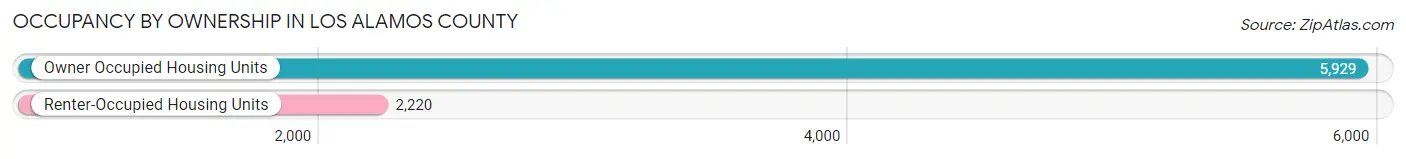
| Occupancy | # Housing Units | % Housing Units |
| Owner Occupied Housing Units | 5,929 | 72.8% |
| Renter-Occupied Housing Units | 2,220 | 27.2% |
| Total Occupied Housing Units | 8,149 | 100.0% |
Occupancy by Household Size in Los Alamos County
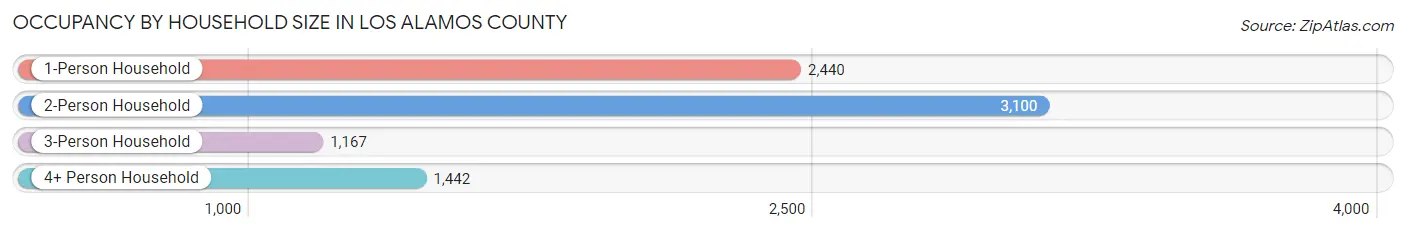
| Household Size | # Housing Units | % Housing Units |
| 1-Person Household | 2,440 | 29.9% |
| 2-Person Household | 3,100 | 38.0% |
| 3-Person Household | 1,167 | 14.3% |
| 4+ Person Household | 1,442 | 17.7% |
| Total Housing Units | 8,149 | 100.0% |
Occupancy by Ownership by Household Size in Los Alamos County
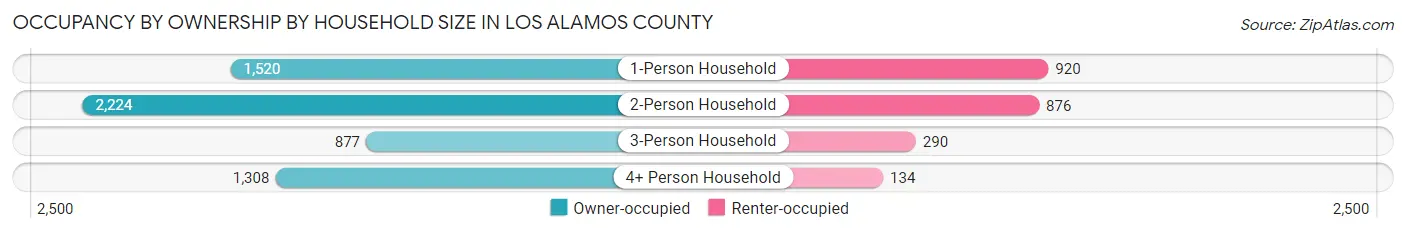
| Household Size | Owner-occupied | Renter-occupied |
| 1-Person Household | 1,520 (62.3%) | 920 (37.7%) |
| 2-Person Household | 2,224 (71.7%) | 876 (28.3%) |
| 3-Person Household | 877 (75.1%) | 290 (24.8%) |
| 4+ Person Household | 1,308 (90.7%) | 134 (9.3%) |
| Total Housing Units | 5,929 (72.8%) | 2,220 (27.2%) |
Occupancy by Educational Attainment in Los Alamos County

| Household Size | Owner-occupied | Renter-occupied |
| Less than High School | 69 (37.9%) | 113 (62.1%) |
| High School Diploma | 143 (54.0%) | 122 (46.0%) |
| College/Associate Degree | 1,142 (68.9%) | 516 (31.1%) |
| Bachelor's Degree or higher | 4,575 (75.7%) | 1,469 (24.3%) |
Occupancy by Age of Householder in Los Alamos County
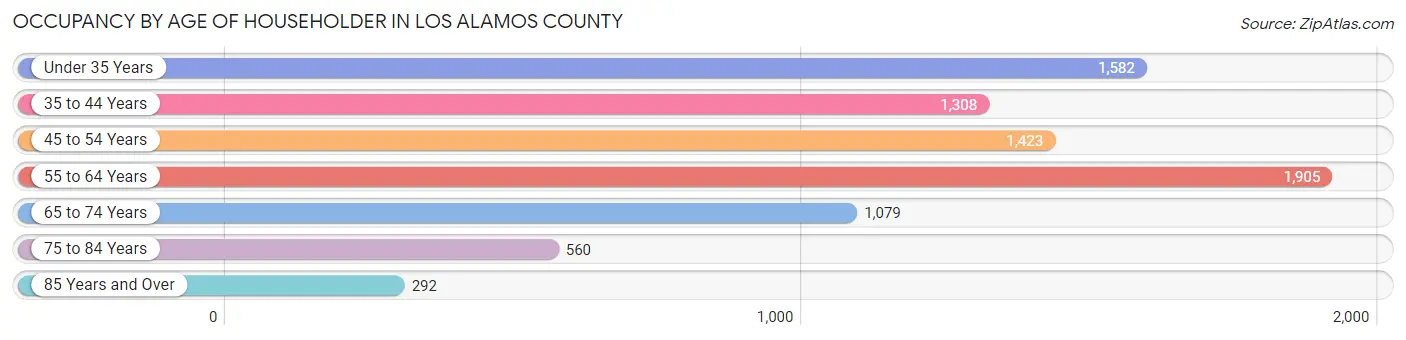
| Age Bracket | # Households | % Households |
| Under 35 Years | 1,582 | 19.4% |
| 35 to 44 Years | 1,308 | 16.1% |
| 45 to 54 Years | 1,423 | 17.5% |
| 55 to 64 Years | 1,905 | 23.4% |
| 65 to 74 Years | 1,079 | 13.2% |
| 75 to 84 Years | 560 | 6.9% |
| 85 Years and Over | 292 | 3.6% |
| Total | 8,149 | 100.0% |
Housing Finances in Los Alamos County
Median Income by Occupancy in Los Alamos County
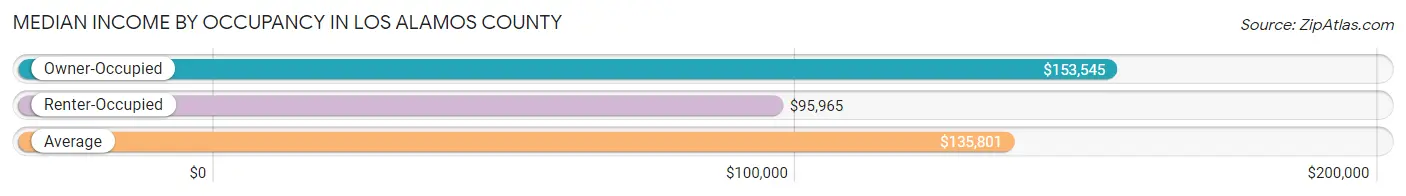
| Occupancy Type | # Households | Median Income |
| Owner-Occupied | 5,929 (72.8%) | $153,545 |
| Renter-Occupied | 2,220 (27.2%) | $95,965 |
| Average | 8,149 (100.0%) | $135,801 |
Occupancy by Householder Income Bracket in Los Alamos County
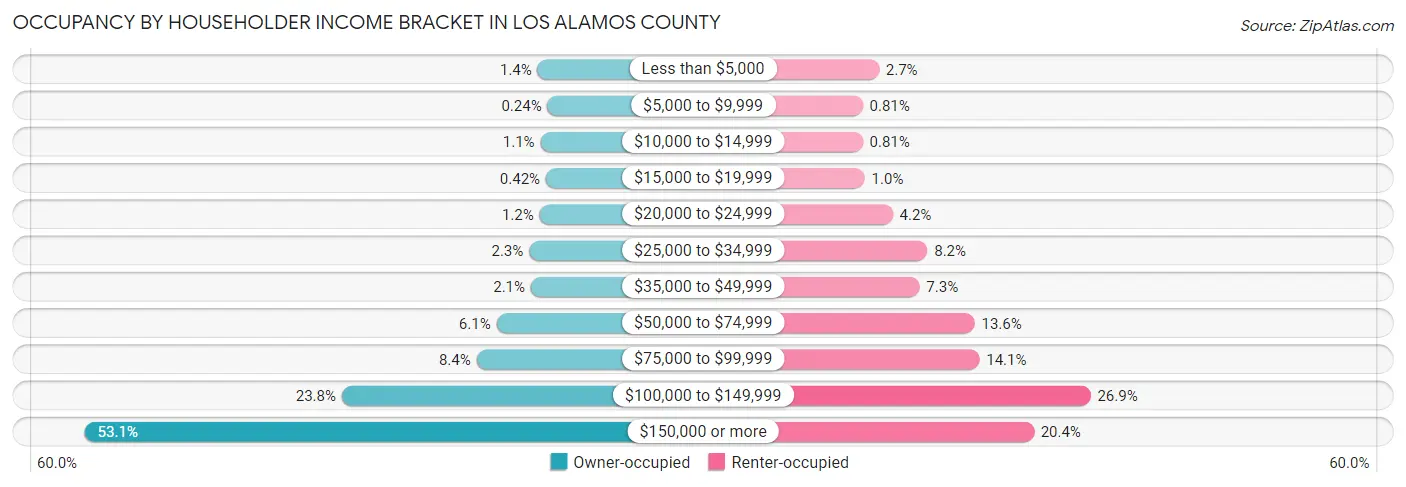
| Income Bracket | Owner-occupied | Renter-occupied |
| Less than $5,000 | 81 (1.4%) | 59 (2.7%) |
| $5,000 to $9,999 | 14 (0.2%) | 18 (0.8%) |
| $10,000 to $14,999 | 62 (1.1%) | 18 (0.8%) |
| $15,000 to $19,999 | 25 (0.4%) | 23 (1.0%) |
| $20,000 to $24,999 | 68 (1.1%) | 94 (4.2%) |
| $25,000 to $34,999 | 139 (2.3%) | 182 (8.2%) |
| $35,000 to $49,999 | 127 (2.1%) | 162 (7.3%) |
| $50,000 to $74,999 | 360 (6.1%) | 302 (13.6%) |
| $75,000 to $99,999 | 495 (8.4%) | 314 (14.1%) |
| $100,000 to $149,999 | 1,408 (23.7%) | 596 (26.9%) |
| $150,000 or more | 3,150 (53.1%) | 452 (20.4%) |
| Total | 5,929 (100.0%) | 2,220 (100.0%) |
Monthly Housing Cost Tiers in Los Alamos County
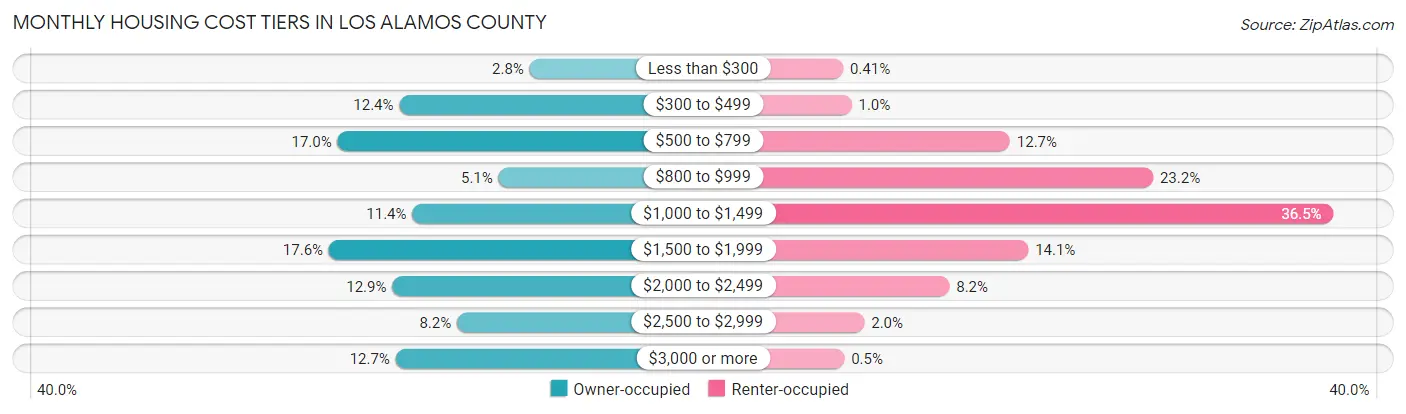
| Monthly Cost | Owner-occupied | Renter-occupied |
| Less than $300 | 166 (2.8%) | 9 (0.4%) |
| $300 to $499 | 735 (12.4%) | 23 (1.0%) |
| $500 to $799 | 1,005 (17.0%) | 282 (12.7%) |
| $800 to $999 | 302 (5.1%) | 516 (23.2%) |
| $1,000 to $1,499 | 678 (11.4%) | 811 (36.5%) |
| $1,500 to $1,999 | 1,043 (17.6%) | 312 (14.1%) |
| $2,000 to $2,499 | 766 (12.9%) | 183 (8.2%) |
| $2,500 to $2,999 | 483 (8.2%) | 44 (2.0%) |
| $3,000 or more | 751 (12.7%) | 11 (0.5%) |
| Total | 5,929 (100.0%) | 2,220 (100.0%) |
Physical Housing Characteristics in Los Alamos County
Housing Structures in Los Alamos County
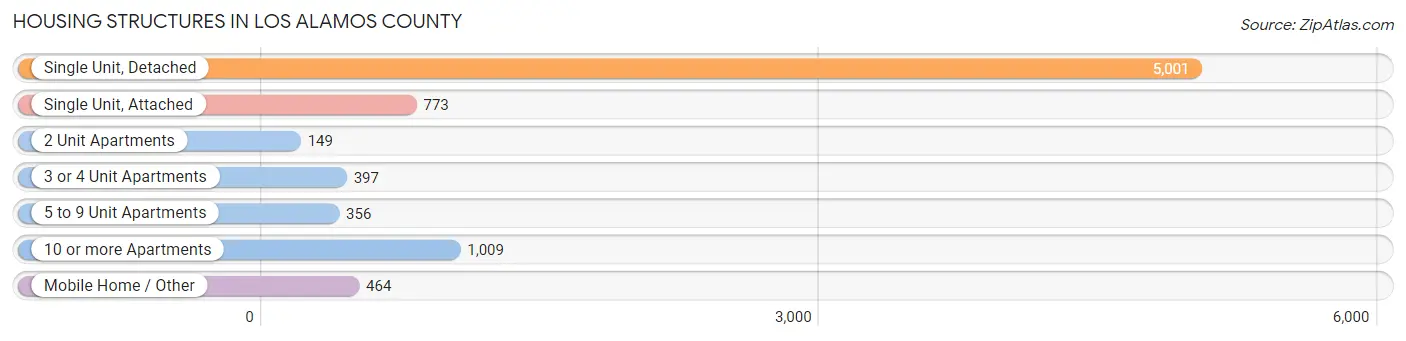
| Structure Type | # Housing Units | % Housing Units |
| Single Unit, Detached | 5,001 | 61.4% |
| Single Unit, Attached | 773 | 9.5% |
| 2 Unit Apartments | 149 | 1.8% |
| 3 or 4 Unit Apartments | 397 | 4.9% |
| 5 to 9 Unit Apartments | 356 | 4.4% |
| 10 or more Apartments | 1,009 | 12.4% |
| Mobile Home / Other | 464 | 5.7% |
| Total | 8,149 | 100.0% |
Housing Structures by Occupancy in Los Alamos County
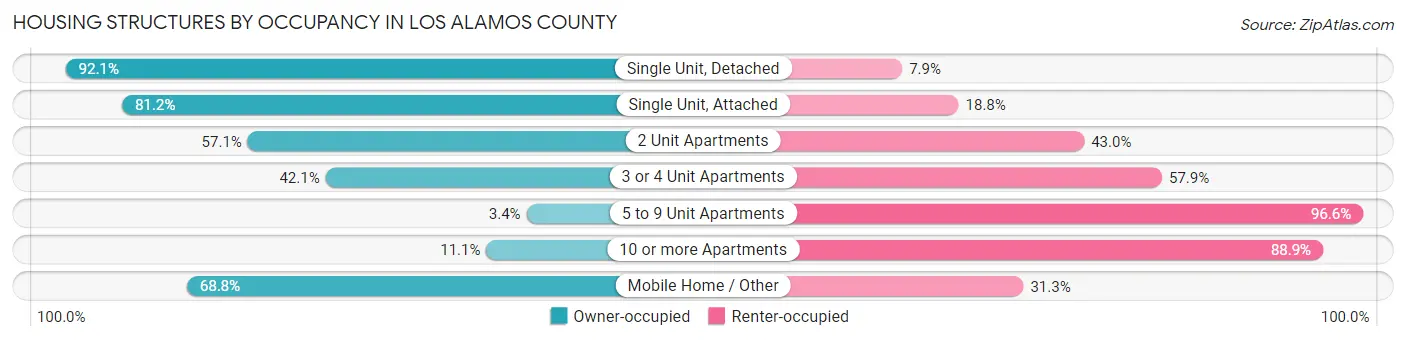
| Structure Type | Owner-occupied | Renter-occupied |
| Single Unit, Detached | 4,606 (92.1%) | 395 (7.9%) |
| Single Unit, Attached | 628 (81.2%) | 145 (18.8%) |
| 2 Unit Apartments | 85 (57.1%) | 64 (42.9%) |
| 3 or 4 Unit Apartments | 167 (42.1%) | 230 (57.9%) |
| 5 to 9 Unit Apartments | 12 (3.4%) | 344 (96.6%) |
| 10 or more Apartments | 112 (11.1%) | 897 (88.9%) |
| Mobile Home / Other | 319 (68.8%) | 145 (31.2%) |
| Total | 5,929 (72.8%) | 2,220 (27.2%) |
Housing Structures by Number of Rooms in Los Alamos County
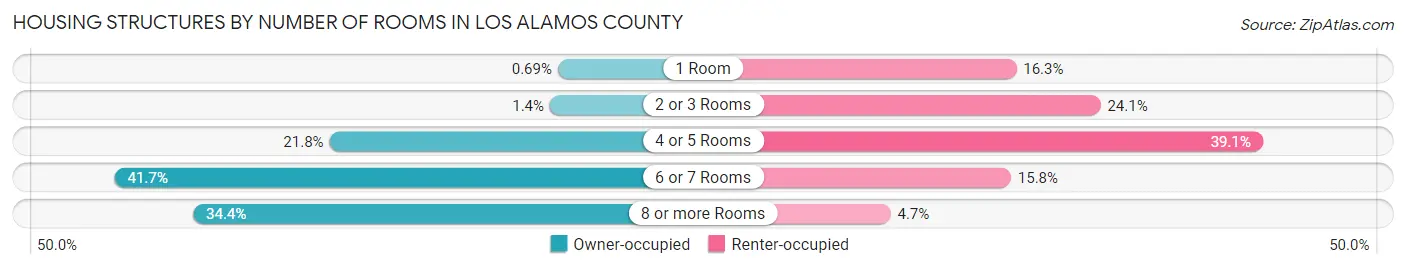
| Number of Rooms | Owner-occupied | Renter-occupied |
| 1 Room | 41 (0.7%) | 362 (16.3%) |
| 2 or 3 Rooms | 84 (1.4%) | 535 (24.1%) |
| 4 or 5 Rooms | 1,293 (21.8%) | 868 (39.1%) |
| 6 or 7 Rooms | 2,471 (41.7%) | 351 (15.8%) |
| 8 or more Rooms | 2,040 (34.4%) | 104 (4.7%) |
| Total | 5,929 (100.0%) | 2,220 (100.0%) |
Housing Structure by Heating Type in Los Alamos County
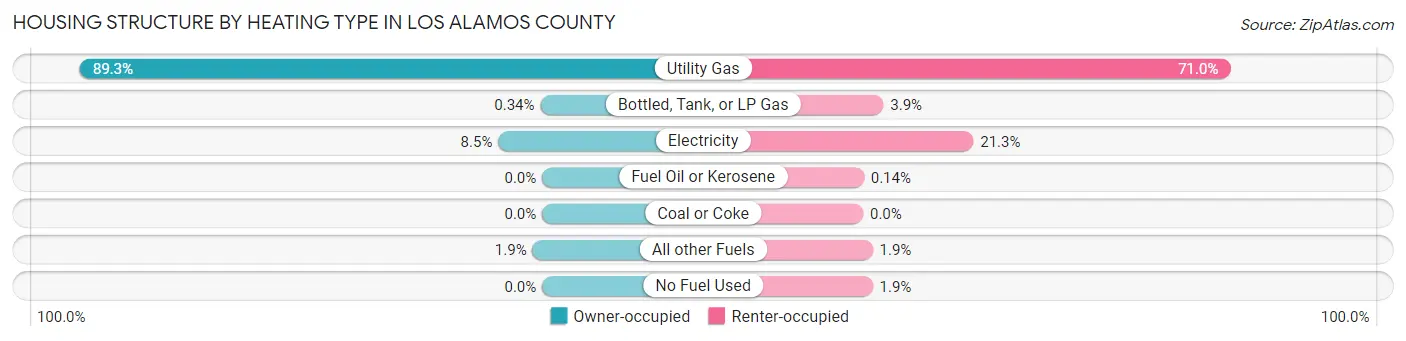
| Heating Type | Owner-occupied | Renter-occupied |
| Utility Gas | 5,296 (89.3%) | 1,575 (71.0%) |
| Bottled, Tank, or LP Gas | 20 (0.3%) | 87 (3.9%) |
| Electricity | 503 (8.5%) | 473 (21.3%) |
| Fuel Oil or Kerosene | 0 (0.0%) | 3 (0.1%) |
| Coal or Coke | 0 (0.0%) | 0 (0.0%) |
| All other Fuels | 110 (1.9%) | 41 (1.8%) |
| No Fuel Used | 0 (0.0%) | 41 (1.8%) |
| Total | 5,929 (100.0%) | 2,220 (100.0%) |
Household Vehicle Usage in Los Alamos County
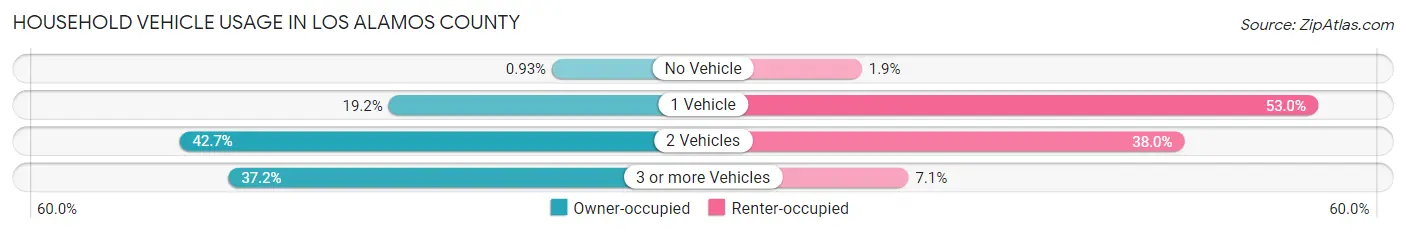
| Vehicles per Household | Owner-occupied | Renter-occupied |
| No Vehicle | 55 (0.9%) | 42 (1.9%) |
| 1 Vehicle | 1,140 (19.2%) | 1,176 (53.0%) |
| 2 Vehicles | 2,529 (42.6%) | 844 (38.0%) |
| 3 or more Vehicles | 2,205 (37.2%) | 158 (7.1%) |
| Total | 5,929 (100.0%) | 2,220 (100.0%) |
Real Estate & Mortgages in Los Alamos County
Real Estate and Mortgage Overview in Los Alamos County
| Characteristic | Without Mortgage | With Mortgage |
| Housing Units | 2,248 | 3,681 |
| Median Property Value | $370,700 | $436,300 |
| Median Household Income | $130,158 | $2,255 |
| Monthly Housing Costs | $562 | $751 |
| Real Estate Taxes | $2,299 | $95 |
Property Value by Mortgage Status in Los Alamos County
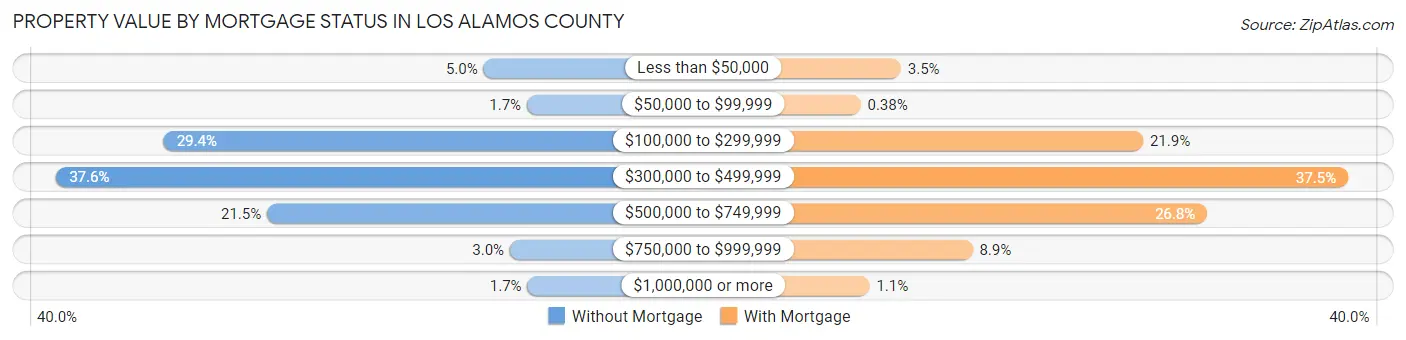
| Property Value | Without Mortgage | With Mortgage |
| Less than $50,000 | 113 (5.0%) | 127 (3.5%) |
| $50,000 to $99,999 | 39 (1.7%) | 14 (0.4%) |
| $100,000 to $299,999 | 661 (29.4%) | 806 (21.9%) |
| $300,000 to $499,999 | 845 (37.6%) | 1,381 (37.5%) |
| $500,000 to $749,999 | 484 (21.5%) | 986 (26.8%) |
| $750,000 to $999,999 | 68 (3.0%) | 328 (8.9%) |
| $1,000,000 or more | 38 (1.7%) | 39 (1.1%) |
| Total | 2,248 (100.0%) | 3,681 (100.0%) |
Household Income by Mortgage Status in Los Alamos County
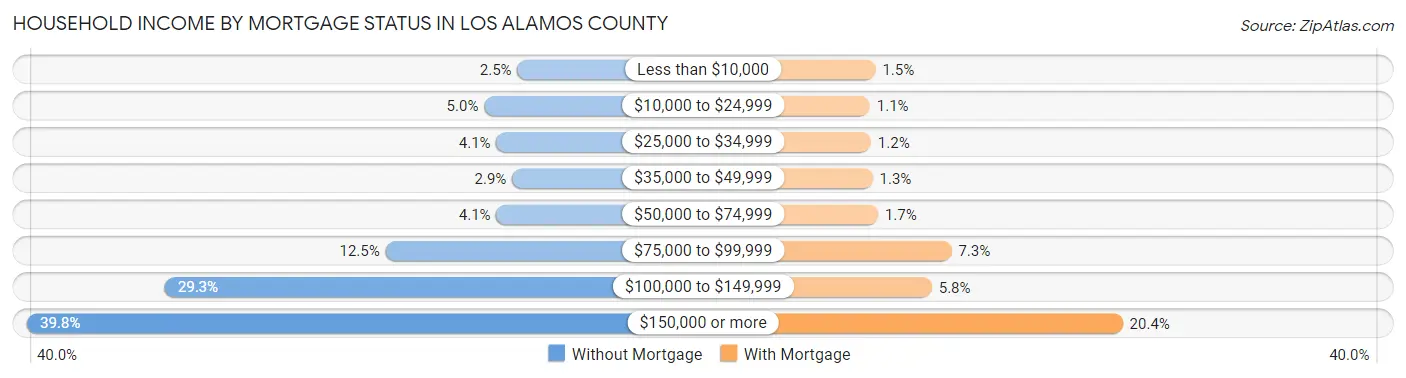
| Household Income | Without Mortgage | With Mortgage |
| Less than $10,000 | 55 (2.5%) | 56 (1.5%) |
| $10,000 to $24,999 | 112 (5.0%) | 40 (1.1%) |
| $25,000 to $34,999 | 91 (4.1%) | 43 (1.2%) |
| $35,000 to $49,999 | 64 (2.9%) | 48 (1.3%) |
| $50,000 to $74,999 | 91 (4.1%) | 63 (1.7%) |
| $75,000 to $99,999 | 281 (12.5%) | 269 (7.3%) |
| $100,000 to $149,999 | 659 (29.3%) | 214 (5.8%) |
| $150,000 or more | 895 (39.8%) | 749 (20.3%) |
| Total | 2,248 (100.0%) | 3,681 (100.0%) |
Property Value to Household Income Ratio in Los Alamos County
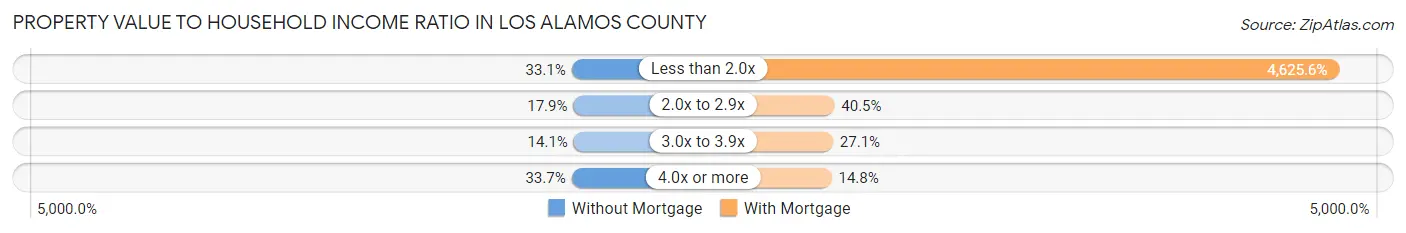
| Value-to-Income Ratio | Without Mortgage | With Mortgage |
| Less than 2.0x | 743 (33.1%) | 170,268 (4,625.6%) |
| 2.0x to 2.9x | 402 (17.9%) | 1,490 (40.5%) |
| 3.0x to 3.9x | 316 (14.1%) | 997 (27.1%) |
| 4.0x or more | 758 (33.7%) | 543 (14.7%) |
| Total | 2,248 (100.0%) | 3,681 (100.0%) |
Real Estate Taxes by Mortgage Status in Los Alamos County
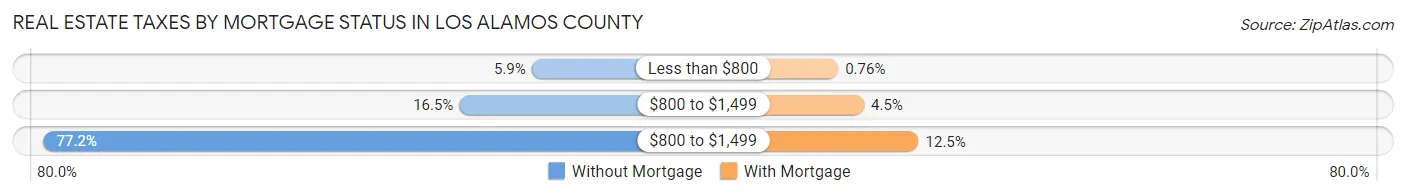
| Property Taxes | Without Mortgage | With Mortgage |
| Less than $800 | 133 (5.9%) | 28 (0.8%) |
| $800 to $1,499 | 371 (16.5%) | 167 (4.5%) |
| $800 to $1,499 | 1,736 (77.2%) | 460 (12.5%) |
| Total | 2,248 (100.0%) | 3,681 (100.0%) |
Health & Disability in Los Alamos County
Health Insurance Coverage by Age in Los Alamos County
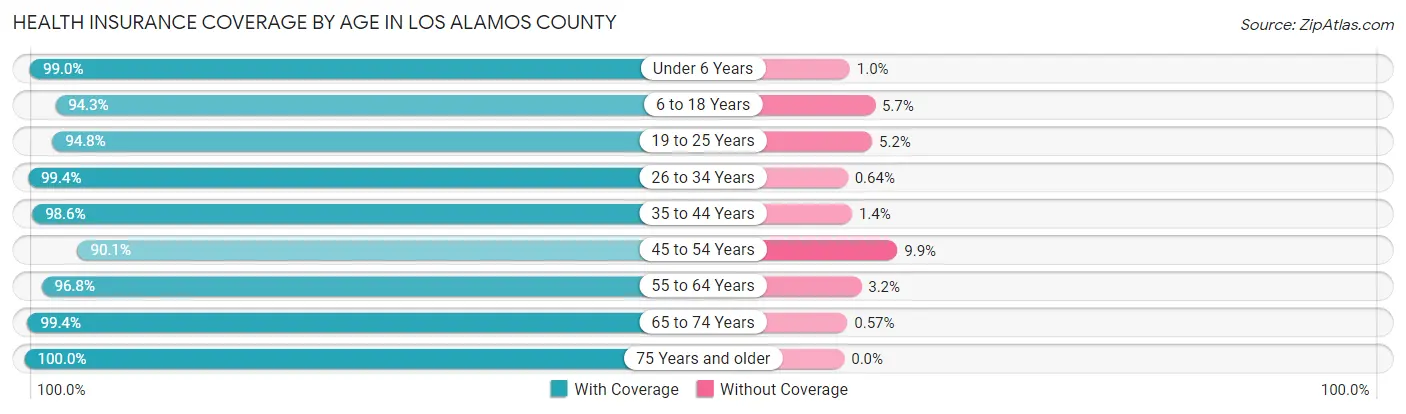
| Age Bracket | With Coverage | Without Coverage |
| Under 6 Years | 1,052 (99.0%) | 11 (1.0%) |
| 6 to 18 Years | 3,032 (94.3%) | 184 (5.7%) |
| 19 to 25 Years | 1,282 (94.8%) | 70 (5.2%) |
| 26 to 34 Years | 2,346 (99.4%) | 15 (0.6%) |
| 35 to 44 Years | 2,421 (98.6%) | 35 (1.4%) |
| 45 to 54 Years | 2,169 (90.1%) | 238 (9.9%) |
| 55 to 64 Years | 2,753 (96.8%) | 90 (3.2%) |
| 65 to 74 Years | 1,907 (99.4%) | 11 (0.6%) |
| 75 Years and older | 1,462 (100.0%) | 0 (0.0%) |
| Total | 18,424 (96.6%) | 654 (3.4%) |
Health Insurance Coverage by Citizenship Status in Los Alamos County
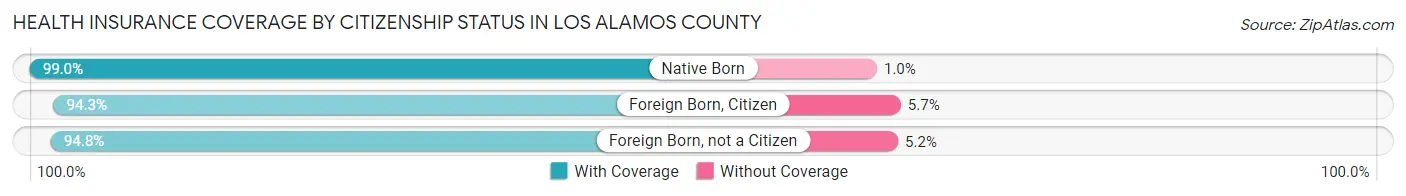
| Citizenship Status | With Coverage | Without Coverage |
| Native Born | 1,052 (99.0%) | 11 (1.0%) |
| Foreign Born, Citizen | 3,032 (94.3%) | 184 (5.7%) |
| Foreign Born, not a Citizen | 1,282 (94.8%) | 70 (5.2%) |
Health Insurance Coverage by Household Income in Los Alamos County
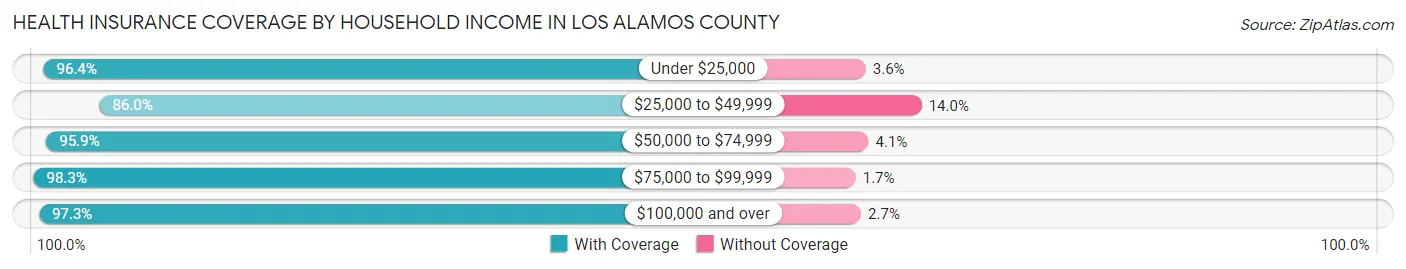
| Household Income | With Coverage | Without Coverage |
| Under $25,000 | 729 (96.4%) | 27 (3.6%) |
| $25,000 to $49,999 | 1,004 (86.0%) | 164 (14.0%) |
| $50,000 to $74,999 | 1,034 (95.9%) | 44 (4.1%) |
| $75,000 to $99,999 | 1,458 (98.3%) | 25 (1.7%) |
| $100,000 and over | 14,174 (97.3%) | 392 (2.7%) |
Public vs Private Health Insurance Coverage by Age in Los Alamos County
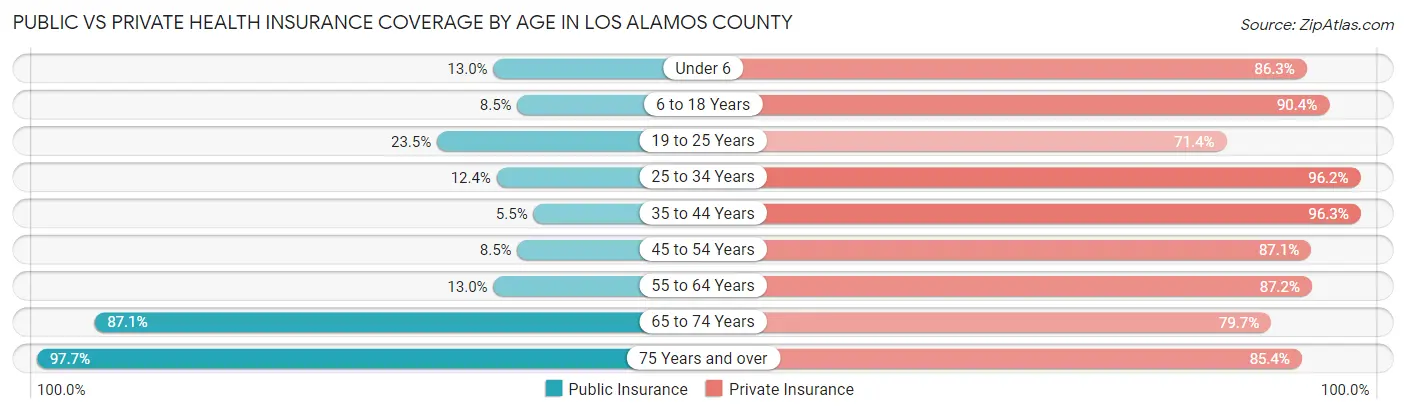
| Age Bracket | Public Insurance | Private Insurance |
| Under 6 | 138 (13.0%) | 917 (86.3%) |
| 6 to 18 Years | 274 (8.5%) | 2,908 (90.4%) |
| 19 to 25 Years | 317 (23.4%) | 965 (71.4%) |
| 25 to 34 Years | 292 (12.4%) | 2,272 (96.2%) |
| 35 to 44 Years | 136 (5.5%) | 2,365 (96.3%) |
| 45 to 54 Years | 205 (8.5%) | 2,096 (87.1%) |
| 55 to 64 Years | 369 (13.0%) | 2,480 (87.2%) |
| 65 to 74 Years | 1,670 (87.1%) | 1,528 (79.7%) |
| 75 Years and over | 1,429 (97.7%) | 1,248 (85.4%) |
| Total | 4,830 (25.3%) | 16,779 (87.9%) |
Disability Status by Sex by Age in Los Alamos County
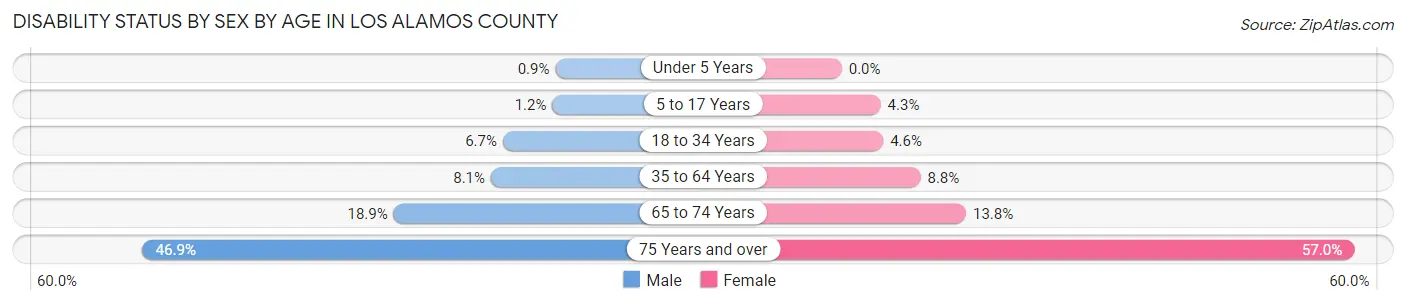
| Age Bracket | Male | Female |
| Under 5 Years | 4 (0.9%) | 0 (0.0%) |
| 5 to 17 Years | 20 (1.2%) | 69 (4.3%) |
| 18 to 34 Years | 144 (6.7%) | 79 (4.6%) |
| 35 to 64 Years | 319 (8.1%) | 329 (8.8%) |
| 65 to 74 Years | 181 (18.9%) | 133 (13.8%) |
| 75 Years and over | 312 (46.9%) | 454 (57.0%) |
Disability Class by Sex by Age in Los Alamos County
Disability Class: Hearing Difficulty
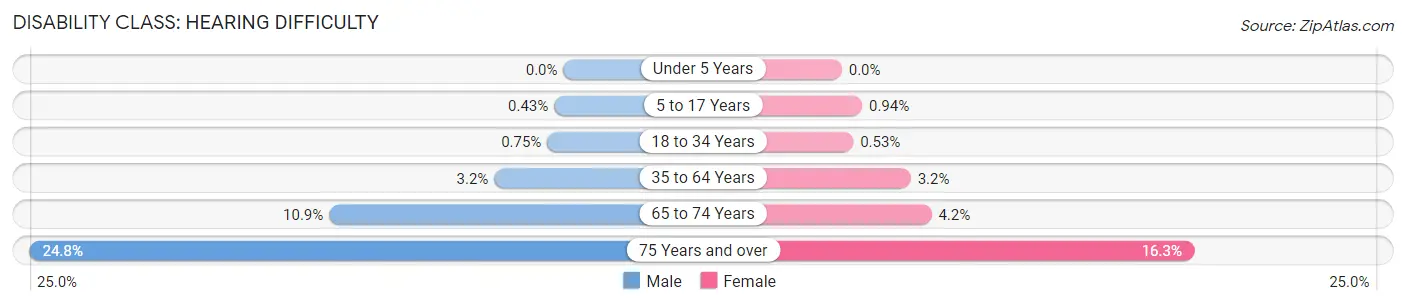
| Age Bracket | Male | Female |
| Under 5 Years | 0 (0.0%) | 0 (0.0%) |
| 5 to 17 Years | 7 (0.4%) | 15 (0.9%) |
| 18 to 34 Years | 16 (0.7%) | 9 (0.5%) |
| 35 to 64 Years | 127 (3.2%) | 120 (3.2%) |
| 65 to 74 Years | 104 (10.9%) | 40 (4.2%) |
| 75 Years and over | 165 (24.8%) | 130 (16.3%) |
Disability Class: Vision Difficulty
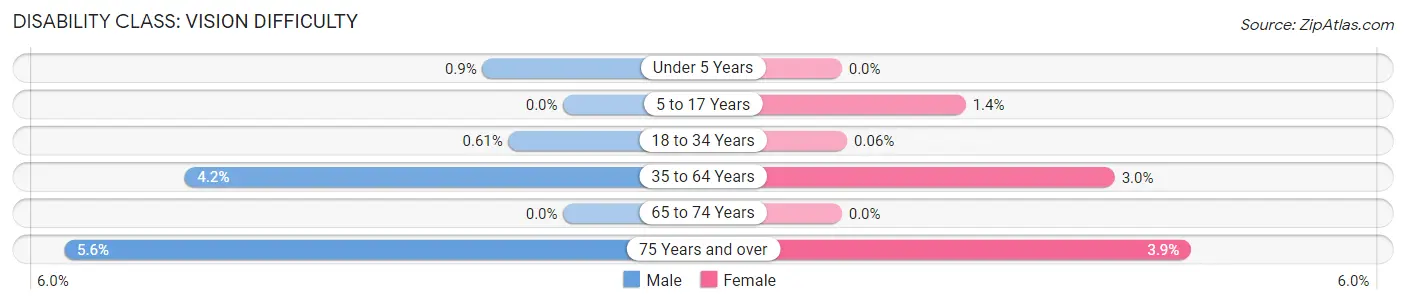
| Age Bracket | Male | Female |
| Under 5 Years | 4 (0.9%) | 0 (0.0%) |
| 5 to 17 Years | 0 (0.0%) | 22 (1.4%) |
| 18 to 34 Years | 13 (0.6%) | 1 (0.1%) |
| 35 to 64 Years | 167 (4.2%) | 114 (3.0%) |
| 65 to 74 Years | 0 (0.0%) | 0 (0.0%) |
| 75 Years and over | 37 (5.6%) | 31 (3.9%) |
Disability Class: Cognitive Difficulty
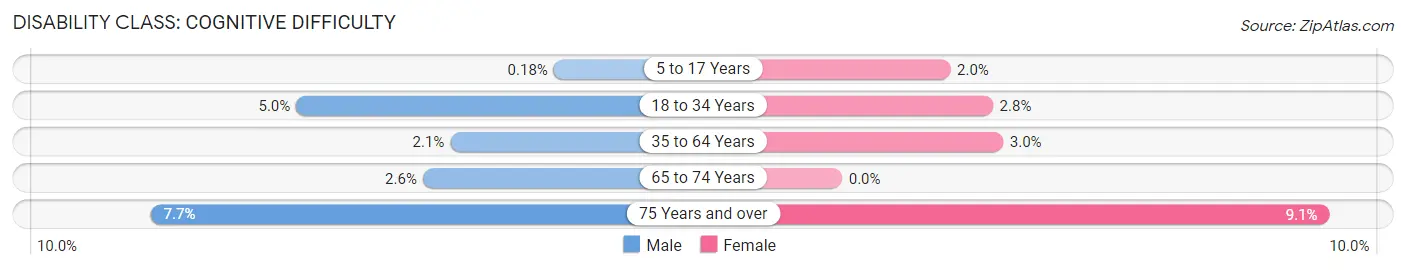
| Age Bracket | Male | Female |
| 5 to 17 Years | 3 (0.2%) | 32 (2.0%) |
| 18 to 34 Years | 106 (5.0%) | 48 (2.8%) |
| 35 to 64 Years | 83 (2.1%) | 112 (3.0%) |
| 65 to 74 Years | 25 (2.6%) | 0 (0.0%) |
| 75 Years and over | 51 (7.7%) | 72 (9.0%) |
Disability Class: Ambulatory Difficulty
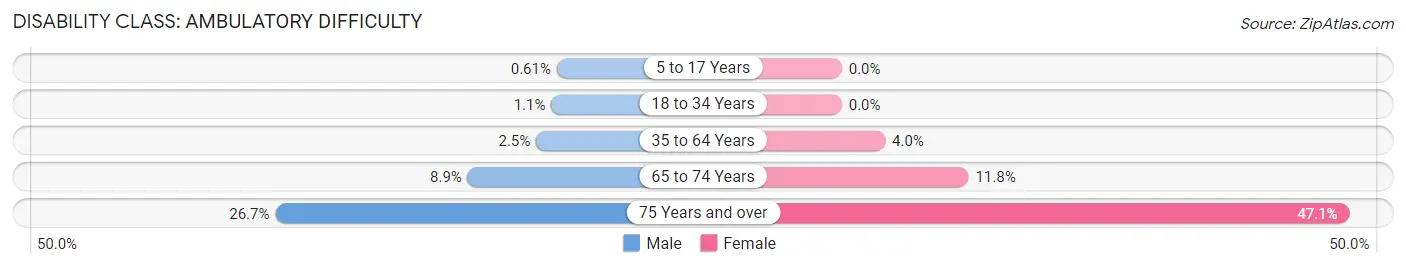
| Age Bracket | Male | Female |
| 5 to 17 Years | 10 (0.6%) | 0 (0.0%) |
| 18 to 34 Years | 24 (1.1%) | 0 (0.0%) |
| 35 to 64 Years | 100 (2.5%) | 151 (4.0%) |
| 65 to 74 Years | 85 (8.9%) | 113 (11.8%) |
| 75 Years and over | 178 (26.7%) | 375 (47.1%) |
Disability Class: Self-Care Difficulty
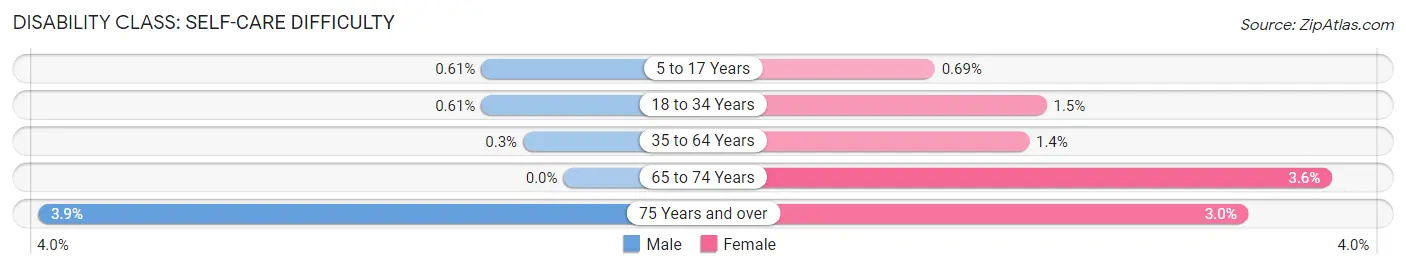
| Age Bracket | Male | Female |
| 5 to 17 Years | 10 (0.6%) | 11 (0.7%) |
| 18 to 34 Years | 13 (0.6%) | 26 (1.5%) |
| 35 to 64 Years | 12 (0.3%) | 52 (1.4%) |
| 65 to 74 Years | 0 (0.0%) | 35 (3.6%) |
| 75 Years and over | 26 (3.9%) | 24 (3.0%) |
Technology Access in Los Alamos County
Computing Device Access in Los Alamos County
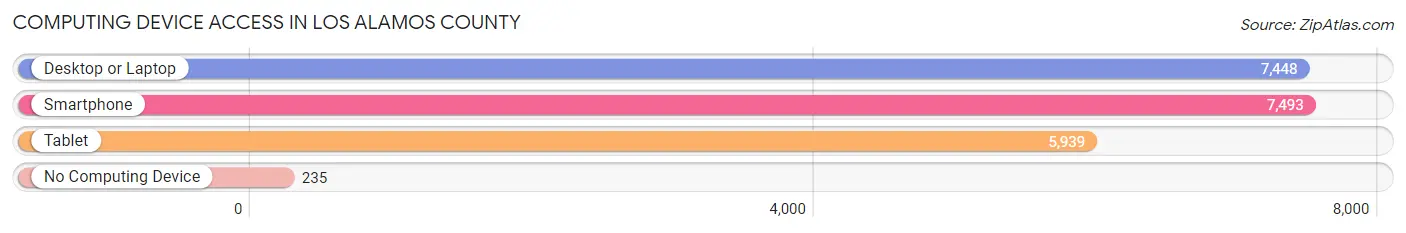
| Device Type | # Households | % Households |
| Desktop or Laptop | 7,448 | 91.4% |
| Smartphone | 7,493 | 91.9% |
| Tablet | 5,939 | 72.9% |
| No Computing Device | 235 | 2.9% |
| Total | 8,149 | 100.0% |
Internet Access in Los Alamos County
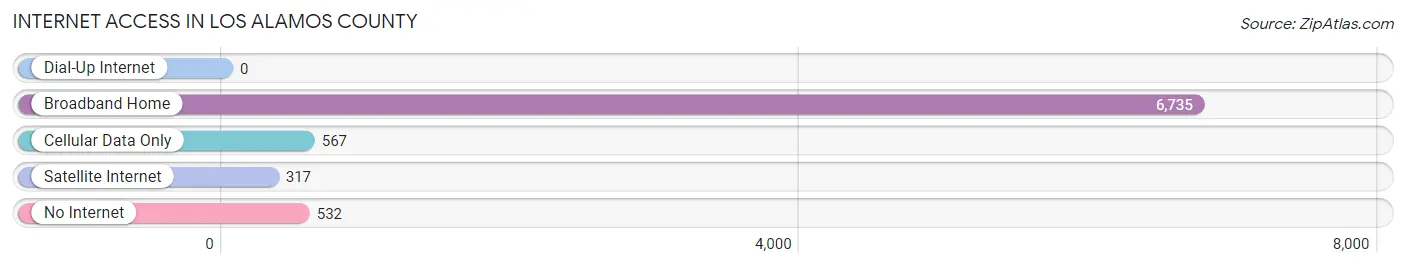
| Internet Type | # Households | % Households |
| Dial-Up Internet | 0 | 0.0% |
| Broadband Home | 6,735 | 82.7% |
| Cellular Data Only | 567 | 7.0% |
| Satellite Internet | 317 | 3.9% |
| No Internet | 532 | 6.5% |
| Total | 8,149 | 100.0% |
Los Alamos County Summary
Los Alamos County, New Mexico is located in the north-central part of the state and is part of the Four Corners region. It is bordered by Rio Arriba County to the north, Santa Fe County to the east, Sandoval County to the south, and San Juan County to the west. The county seat is Los Alamos, which is also the county’s largest city. The county was established in 1949 and has a population of 18,343 as of the 2020 census.
Geography
Los Alamos County is located in the northern part of the state and is part of the Four Corners region. It is bordered by Rio Arriba County to the north, Santa Fe County to the east, Sandoval County to the south, and San Juan County to the west. The county covers an area of 1,902 square miles and is the smallest county in New Mexico. The county is located in the Jemez Mountains and is home to the Valles Caldera National Preserve, which is a large volcanic crater. The highest point in the county is the summit of Cerro Grande at an elevation of 10,197 feet. The county is also home to the Los Alamos National Laboratory, which is a nuclear research facility.
Economy
Los Alamos County has a diverse economy that is largely driven by the Los Alamos National Laboratory. The laboratory is the largest employer in the county and is responsible for the majority of the county’s economic activity. Other major employers in the county include Los Alamos Medical Center, Los Alamos Public Schools, Los Alamos County Government, and Los Alamos National Bank. The county also has a thriving tourism industry, with visitors coming to the area to explore the Valles Caldera National Preserve and other attractions.
Demographics
As of the 2020 census, Los Alamos County had a population of 18,343. The population is predominantly white (83.3%), with smaller percentages of Hispanic (7.7%), Native American (2.2%), Asian (2.1%), and African American (1.2%) residents. The median household income in the county is $90,945, which is significantly higher than the state median of $48,945. The median age in the county is 43.3, and the median home value is $364,400.
History
Los Alamos County was established in 1949 and was named after the nearby Los Alamos Ranch School. The school was founded in 1917 and was a private boarding school for boys. During World War II, the school was used as a secret research facility for the Manhattan Project, which developed the first atomic bomb. After the war, the school was closed and the area was turned into a national laboratory. The county has since become a major center for scientific research and development.
Common Questions
What is Per Capita Income in Los Alamos County?
Per Capita income in Los Alamos County is $71,527.
What is the Median Family Income in Los Alamos County?
Median Family Income in Los Alamos County is $158,708.
What is the Median Household income in Los Alamos County?
Median Household Income in Los Alamos County is $135,801.
What is Income or Wage Gap in Los Alamos County?
Income or Wage Gap in Los Alamos County is 35.7%.
Women in Los Alamos County earn 64.3 cents for every dollar earned by a man.
What is Family Income Deficit in Los Alamos County?
Family Income Deficit in Los Alamos County is $7,953.
Families that are below poverty line in Los Alamos County earn $7,953 less on average than the poverty threshold level.
What is Inequality or Gini Index in Los Alamos County?
Inequality or Gini Index in Los Alamos County is 0.39.
What is the Total Population of Los Alamos County?
Total Population of Los Alamos County is 19,253.
What is the Total Male Population of Los Alamos County?
Total Male Population of Los Alamos County is 9,884.
What is the Total Female Population of Los Alamos County?
Total Female Population of Los Alamos County is 9,369.
What is the Ratio of Males per 100 Females in Los Alamos County?
There are 105.50 Males per 100 Females in Los Alamos County.
What is the Ratio of Females per 100 Males in Los Alamos County?
There are 94.79 Females per 100 Males in Los Alamos County.
What is the Median Population Age in Los Alamos County?
Median Population Age in Los Alamos County is 41.2 Years.
What is the Average Family Size in Los Alamos County
Average Family Size in Los Alamos County is 3.0 People.
What is the Average Household Size in Los Alamos County
Average Household Size in Los Alamos County is 2.4 People.
How Large is the Labor Force in Los Alamos County?
There are 10,575 People in the Labor Forcein in Los Alamos County.
What is the Percentage of People in the Labor Force in Los Alamos County?
67.5% of People are in the Labor Force in Los Alamos County.
What is the Unemployment Rate in Los Alamos County?
Unemployment Rate in Los Alamos County is 1.9%.