South Valley, NM Map & Demographics
South Valley Map
South Valley Overview
$24,047
PER CAPITA INCOME
$58,528
AVG FAMILY INCOME
$44,670
AVG HOUSEHOLD INCOME
22.0%
WAGE / INCOME GAP [ % ]
78.0¢/ $1
WAGE / INCOME GAP [ $ ]
$11,868
FAMILY INCOME DEFICIT
0.45
INEQUALITY / GINI INDEX
37,601
TOTAL POPULATION
19,099
MALE POPULATION
18,502
FEMALE POPULATION
103.23
MALES / 100 FEMALES
96.87
FEMALES / 100 MALES
39.7
MEDIAN AGE
3.5
AVG FAMILY SIZE
2.8
AVG HOUSEHOLD SIZE
16,213
LABOR FORCE [ PEOPLE ]
54.3%
PERCENT IN LABOR FORCE
5.7%
UNEMPLOYMENT RATE
Income in South Valley
Income Overview in South Valley
Per Capita Income in South Valley is $24,047, while median incomes of families and households are $58,528 and $44,670 respectively.
| Characteristic | Number | Measure |
| Per Capita Income | 37,601 | $24,047 |
| Median Family Income | 8,873 | $58,528 |
| Mean Family Income | 8,873 | $71,534 |
| Median Household Income | 13,161 | $44,670 |
| Mean Household Income | 13,161 | $61,737 |
| Income Deficit | 8,873 | $11,868 |
| Wage / Income Gap (%) | 37,601 | 22.01% |
| Wage / Income Gap ($) | 37,601 | 77.99¢ per $1 |
| Gini / Inequality Index | 37,601 | 0.45 |
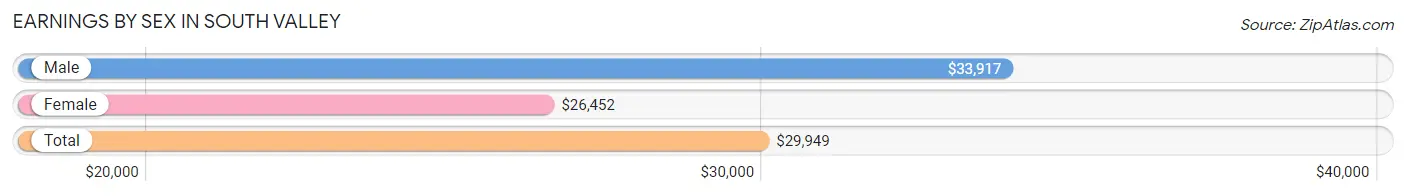
Earnings by Sex in South Valley
Average Earnings in South Valley are $29,949, $33,917 for men and $26,452 for women, a difference of 22.0%.
| Sex | Number | Average Earnings |
| Male | 9,291 (56.3%) | $33,917 |
| Female | 7,222 (43.7%) | $26,452 |
| Total | 16,513 (100.0%) | $29,949 |
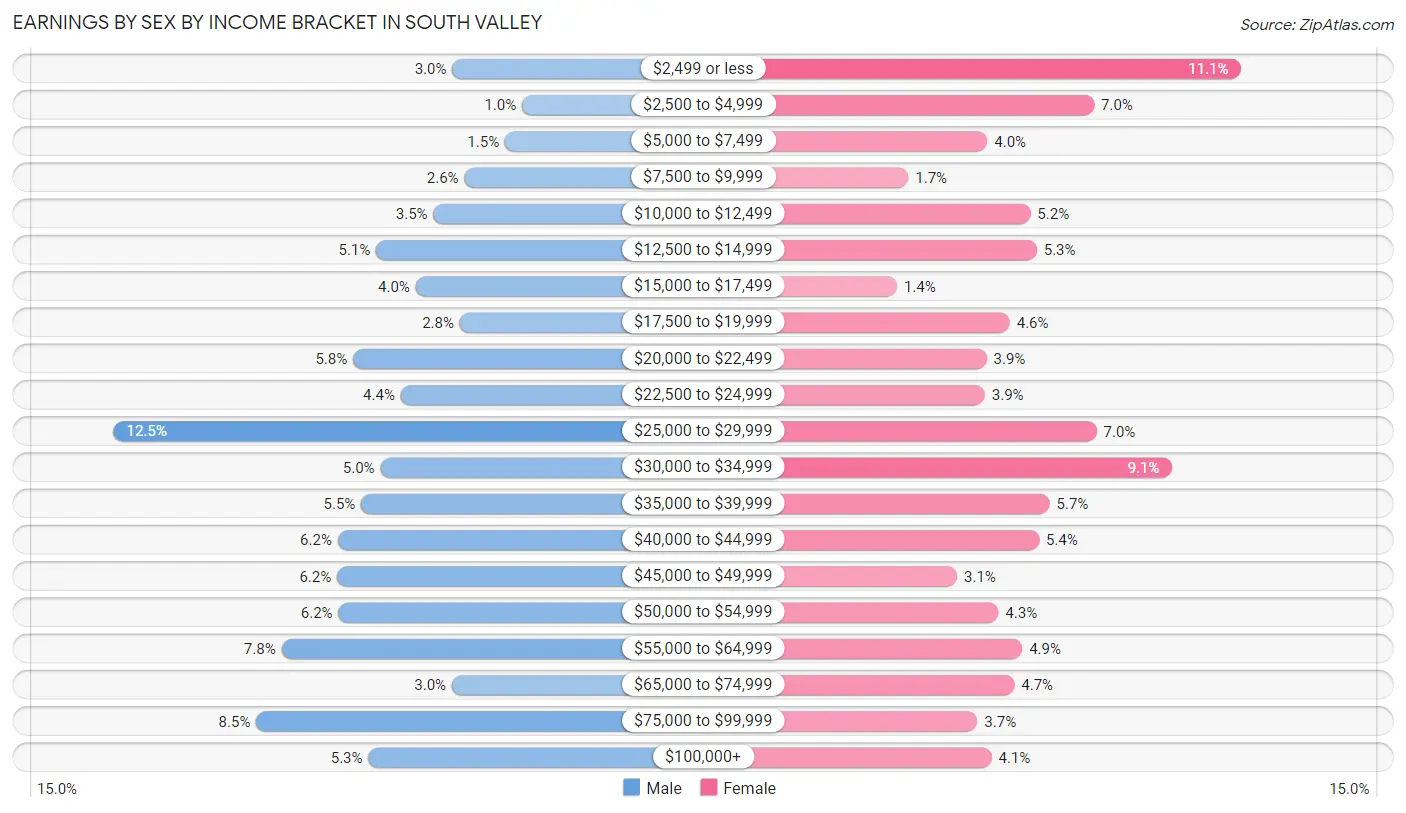
Earnings by Sex by Income Bracket in South Valley
The most common earnings brackets in South Valley are $25,000 to $29,999 for men (1,161 | 12.5%) and $2,499 or less for women (799 | 11.1%).
| Income | Male | Female |
| $2,499 or less | 277 (3.0%) | 799 (11.1%) |
| $2,500 to $4,999 | 95 (1.0%) | 502 (7.0%) |
| $5,000 to $7,499 | 139 (1.5%) | 285 (4.0%) |
| $7,500 to $9,999 | 245 (2.6%) | 125 (1.7%) |
| $10,000 to $12,499 | 326 (3.5%) | 373 (5.2%) |
| $12,500 to $14,999 | 476 (5.1%) | 386 (5.3%) |
| $15,000 to $17,499 | 373 (4.0%) | 102 (1.4%) |
| $17,500 to $19,999 | 257 (2.8%) | 331 (4.6%) |
| $20,000 to $22,499 | 536 (5.8%) | 284 (3.9%) |
| $22,500 to $24,999 | 412 (4.4%) | 280 (3.9%) |
| $25,000 to $29,999 | 1,161 (12.5%) | 507 (7.0%) |
| $30,000 to $34,999 | 465 (5.0%) | 659 (9.1%) |
| $35,000 to $39,999 | 515 (5.5%) | 412 (5.7%) |
| $40,000 to $44,999 | 576 (6.2%) | 390 (5.4%) |
| $45,000 to $49,999 | 578 (6.2%) | 224 (3.1%) |
| $50,000 to $54,999 | 574 (6.2%) | 308 (4.3%) |
| $55,000 to $64,999 | 723 (7.8%) | 356 (4.9%) |
| $65,000 to $74,999 | 278 (3.0%) | 340 (4.7%) |
| $75,000 to $99,999 | 789 (8.5%) | 265 (3.7%) |
| $100,000+ | 496 (5.3%) | 294 (4.1%) |
| Total | 9,291 (100.0%) | 7,222 (100.0%) |
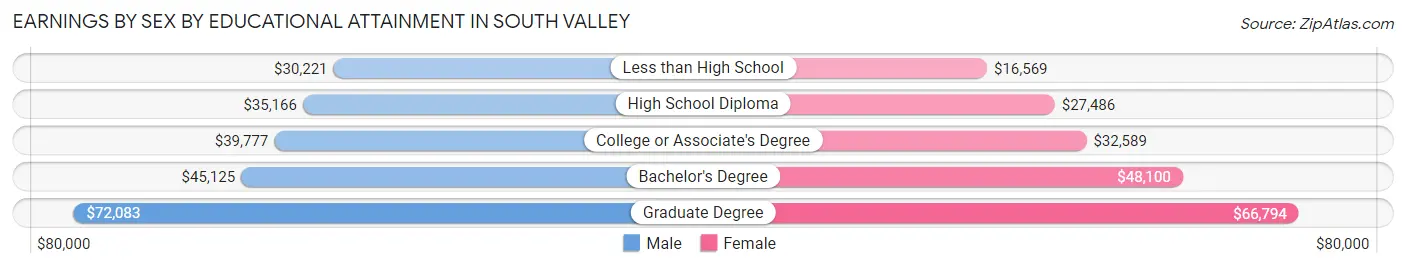
Earnings by Sex by Educational Attainment in South Valley
Average earnings in South Valley are $37,233 for men and $32,311 for women, a difference of 13.2%. Men with an educational attainment of graduate degree enjoy the highest average annual earnings of $72,083, while those with less than high school education earn the least with $30,221. Women with an educational attainment of graduate degree earn the most with the average annual earnings of $66,794, while those with less than high school education have the smallest earnings of $16,569.
| Educational Attainment | Male Income | Female Income |
| Less than High School | $30,221 | $16,569 |
| High School Diploma | $35,166 | $27,486 |
| College or Associate's Degree | $39,777 | $32,589 |
| Bachelor's Degree | $45,125 | $48,100 |
| Graduate Degree | $72,083 | $66,794 |
| Total | $37,233 | $32,311 |
Family Income in South Valley
Family Income Brackets in South Valley
According to the South Valley family income data, there are 1,597 families falling into the $75,000 to $99,999 income range, which is the most common income bracket and makes up 18.0% of all families. Conversely, the $200,000+ income bracket is the least frequent group with only 328 families (3.7%) belonging to this category.
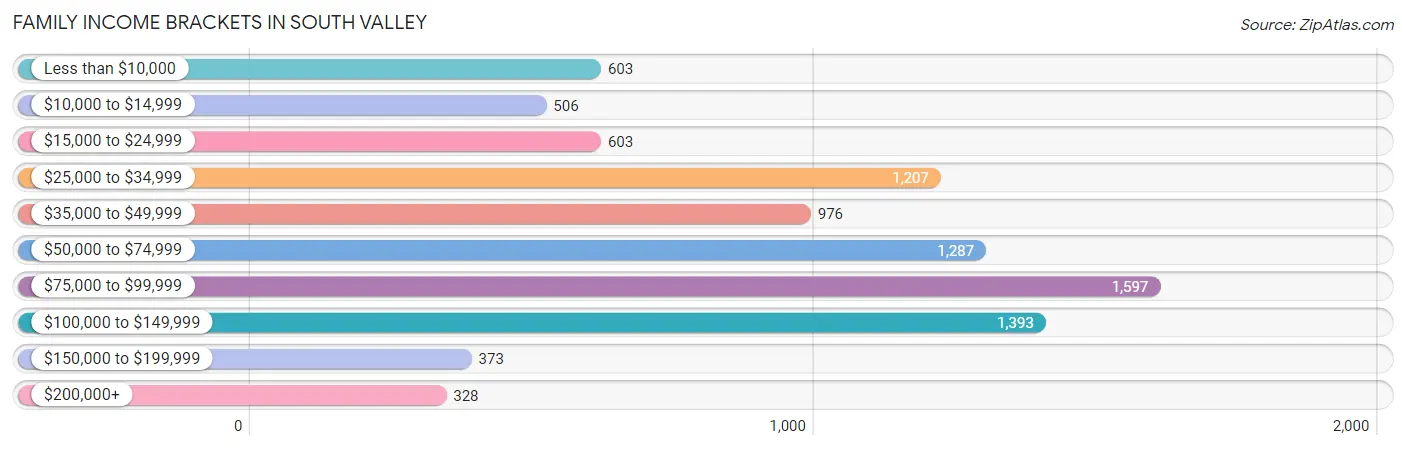
| Income Bracket | # Families | % Families |
| Less than $10,000 | 603 | 6.8% |
| $10,000 to $14,999 | 506 | 5.7% |
| $15,000 to $24,999 | 603 | 6.8% |
| $25,000 to $34,999 | 1,207 | 13.6% |
| $35,000 to $49,999 | 976 | 11.0% |
| $50,000 to $74,999 | 1,287 | 14.5% |
| $75,000 to $99,999 | 1,597 | 18.0% |
| $100,000 to $149,999 | 1,393 | 15.7% |
| $150,000 to $199,999 | 373 | 4.2% |
| $200,000+ | 328 | 3.7% |
Family Income by Famaliy Size in South Valley
7+ person families (275 | 3.1%) account for the highest median family income in South Valley with $91,722 per family, while 2-person families (4,057 | 45.7%) have the highest median income of $27,894 per family member.
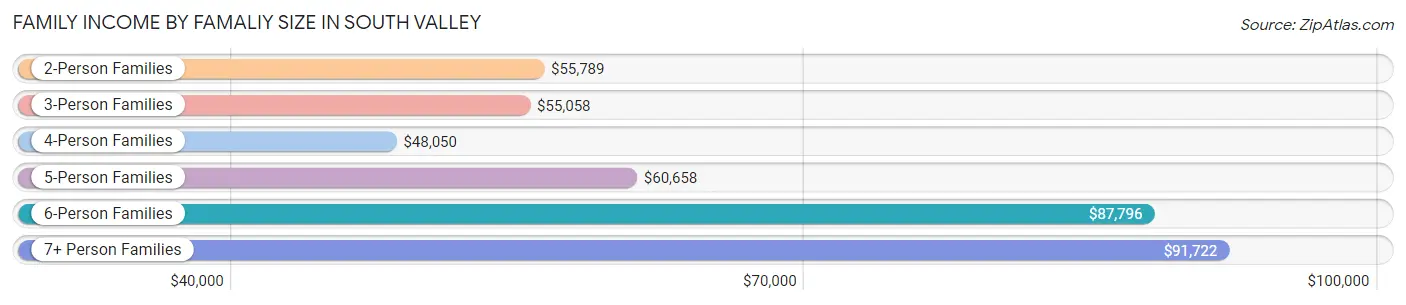
| Income Bracket | # Families | Median Income |
| 2-Person Families | 4,057 (45.7%) | $55,789 |
| 3-Person Families | 1,644 (18.5%) | $55,058 |
| 4-Person Families | 1,803 (20.3%) | $48,050 |
| 5-Person Families | 816 (9.2%) | $60,658 |
| 6-Person Families | 278 (3.1%) | $87,796 |
| 7+ Person Families | 275 (3.1%) | $91,722 |
| Total | 8,873 (100.0%) | $58,528 |
Family Income by Number of Earners in South Valley
The median family income in South Valley is $58,528, with families comprising 3+ earners (819) having the highest median family income of $106,056, while families with no earners (2,087) have the lowest median family income of $29,250, accounting for 9.2% and 23.5% of families, respectively.
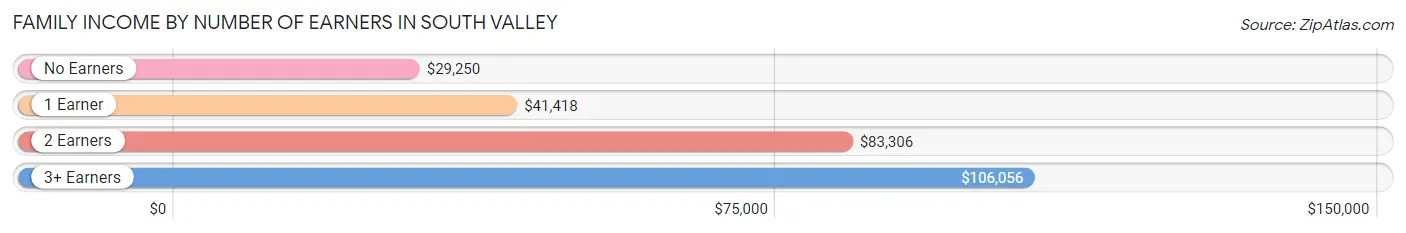
| Number of Earners | # Families | Median Income |
| No Earners | 2,087 (23.5%) | $29,250 |
| 1 Earner | 3,305 (37.2%) | $41,418 |
| 2 Earners | 2,662 (30.0%) | $83,306 |
| 3+ Earners | 819 (9.2%) | $106,056 |
| Total | 8,873 (100.0%) | $58,528 |
Household Income in South Valley
Household Income Brackets in South Valley
With 1,895 households falling in the category, the $75,000 to $99,999 income range is the most frequent in South Valley, accounting for 14.4% of all households. In contrast, only 355 households (2.7%) fall into the $200,000+ income bracket, making it the least populous group.
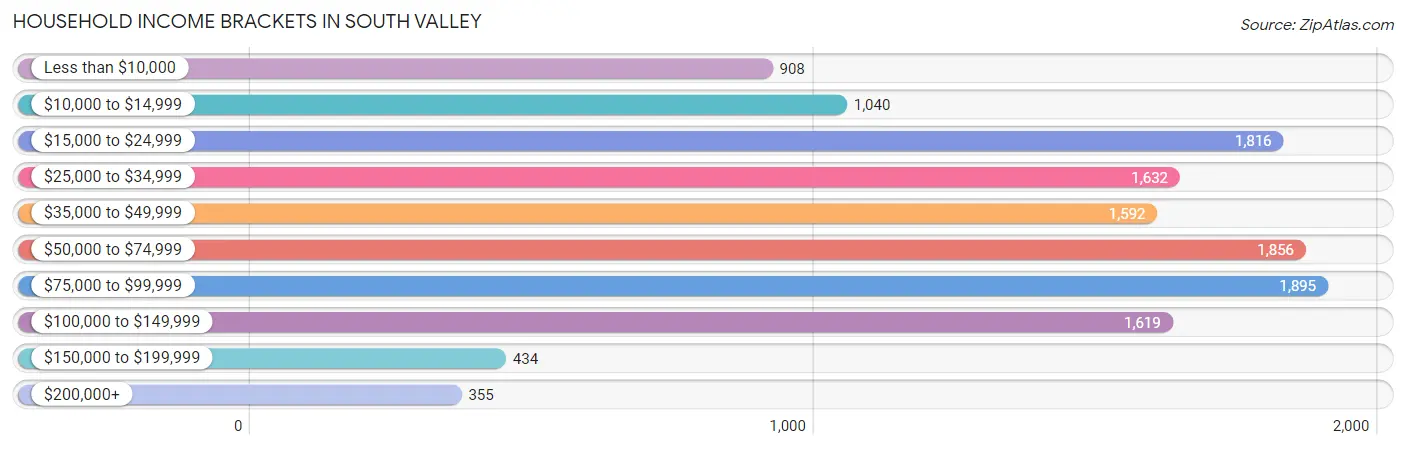
| Income Bracket | # Households | % Households |
| Less than $10,000 | 908 | 6.9% |
| $10,000 to $14,999 | 1,040 | 7.9% |
| $15,000 to $24,999 | 1,816 | 13.8% |
| $25,000 to $34,999 | 1,632 | 12.4% |
| $35,000 to $49,999 | 1,592 | 12.1% |
| $50,000 to $74,999 | 1,856 | 14.1% |
| $75,000 to $99,999 | 1,895 | 14.4% |
| $100,000 to $149,999 | 1,619 | 12.3% |
| $150,000 to $199,999 | 434 | 3.3% |
| $200,000+ | 355 | 2.7% |
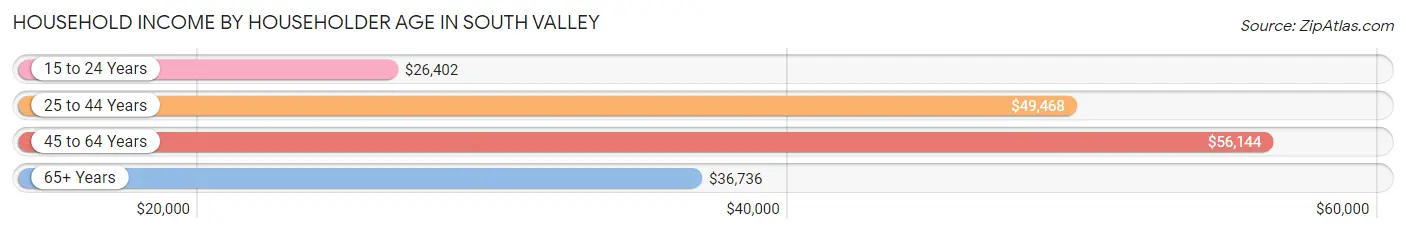
Household Income by Householder Age in South Valley
The median household income in South Valley is $44,670, with the highest median household income of $56,144 found in the 45 to 64 years age bracket for the primary householder. A total of 4,659 households (35.4%) fall into this category. Meanwhile, the 15 to 24 years age bracket for the primary householder has the lowest median household income of $26,402, with 368 households (2.8%) in this group.
| Income Bracket | # Households | Median Income |
| 15 to 24 Years | 368 (2.8%) | $26,402 |
| 25 to 44 Years | 3,775 (28.7%) | $49,468 |
| 45 to 64 Years | 4,659 (35.4%) | $56,144 |
| 65+ Years | 4,359 (33.1%) | $36,736 |
| Total | 13,161 (100.0%) | $44,670 |
Poverty in South Valley
Income Below Poverty by Sex and Age in South Valley
With 19.3% poverty level for males and 22.7% for females among the residents of South Valley, 16 and 17 year old males and under 5 year old females are the most vulnerable to poverty, with 153 males (38.5%) and 354 females (42.7%) in their respective age groups living below the poverty level.
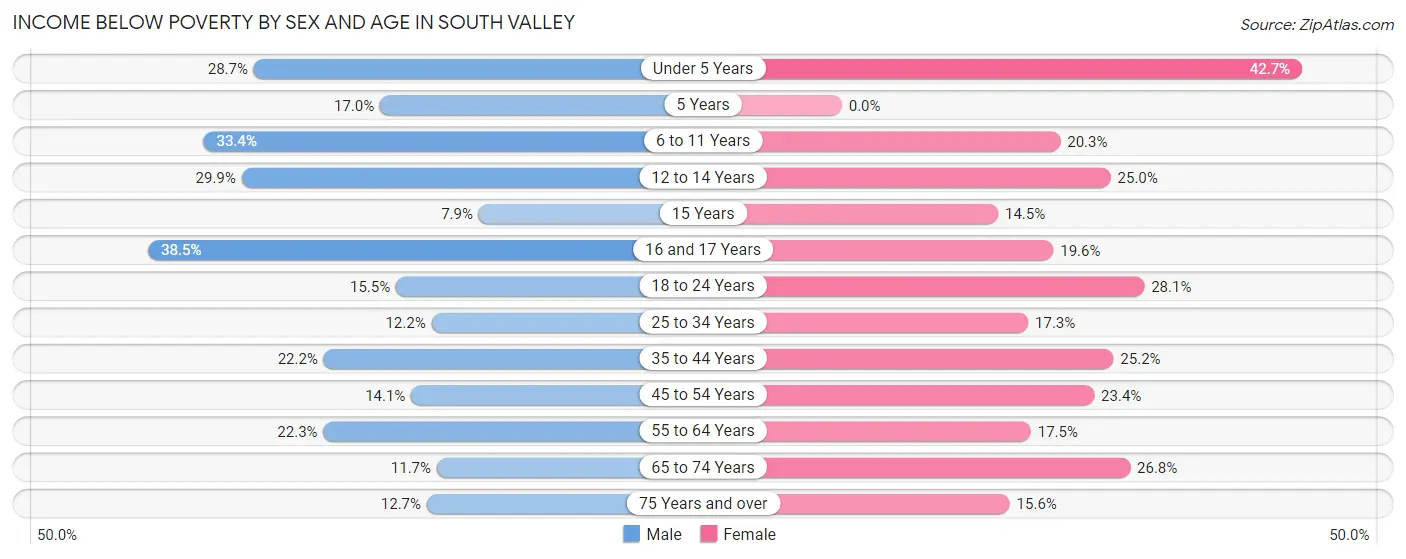
| Age Bracket | Male | Female |
| Under 5 Years | 318 (28.7%) | 354 (42.7%) |
| 5 Years | 25 (17.0%) | 0 (0.0%) |
| 6 to 11 Years | 430 (33.4%) | 333 (20.3%) |
| 12 to 14 Years | 272 (29.9%) | 247 (24.9%) |
| 15 Years | 30 (7.9%) | 38 (14.5%) |
| 16 and 17 Years | 153 (38.5%) | 85 (19.6%) |
| 18 to 24 Years | 226 (15.5%) | 517 (28.1%) |
| 25 to 34 Years | 308 (12.2%) | 340 (17.3%) |
| 35 to 44 Years | 682 (22.2%) | 528 (25.2%) |
| 45 to 54 Years | 258 (14.1%) | 495 (23.4%) |
| 55 to 64 Years | 554 (22.3%) | 422 (17.5%) |
| 65 to 74 Years | 230 (11.7%) | 597 (26.8%) |
| 75 Years and over | 182 (12.7%) | 237 (15.6%) |
| Total | 3,668 (19.3%) | 4,193 (22.7%) |
Income Above Poverty by Sex and Age in South Valley
According to the poverty statistics in South Valley, males aged 15 years and females aged 5 years are the age groups that are most secure financially, with 92.1% of males and 100.0% of females in these age groups living above the poverty line.
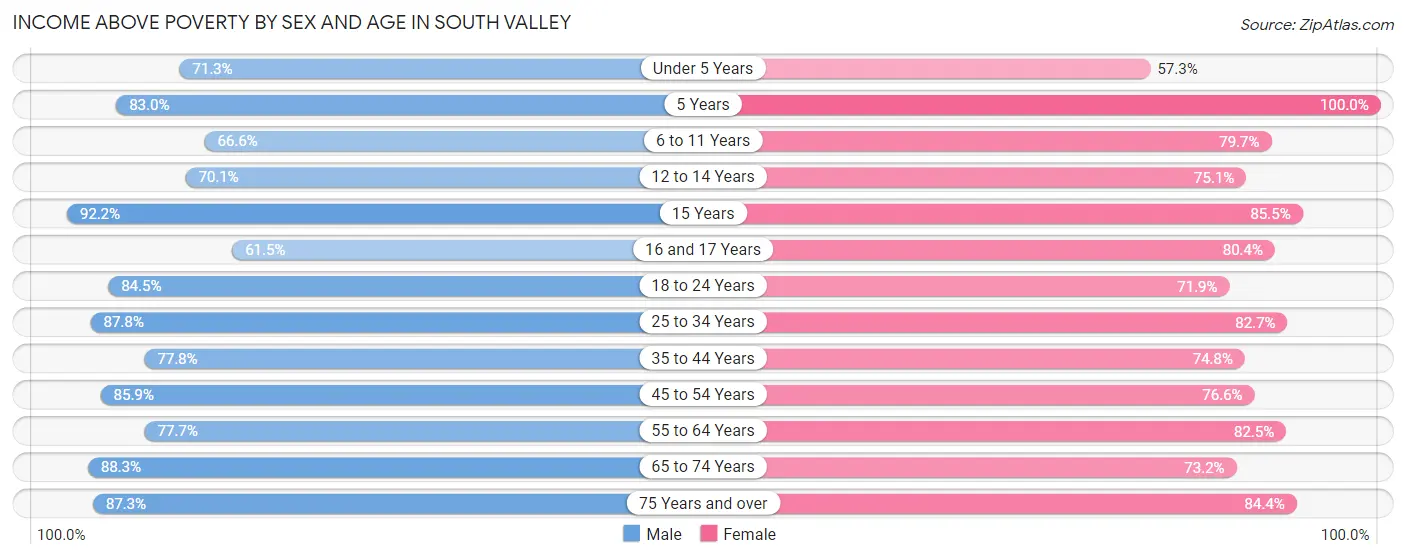
| Age Bracket | Male | Female |
| Under 5 Years | 789 (71.3%) | 475 (57.3%) |
| 5 Years | 122 (83.0%) | 111 (100.0%) |
| 6 to 11 Years | 858 (66.6%) | 1,309 (79.7%) |
| 12 to 14 Years | 639 (70.1%) | 743 (75.0%) |
| 15 Years | 352 (92.1%) | 224 (85.5%) |
| 16 and 17 Years | 244 (61.5%) | 348 (80.4%) |
| 18 to 24 Years | 1,229 (84.5%) | 1,325 (71.9%) |
| 25 to 34 Years | 2,209 (87.8%) | 1,626 (82.7%) |
| 35 to 44 Years | 2,385 (77.8%) | 1,566 (74.8%) |
| 45 to 54 Years | 1,569 (85.9%) | 1,619 (76.6%) |
| 55 to 64 Years | 1,934 (77.7%) | 1,984 (82.5%) |
| 65 to 74 Years | 1,729 (88.3%) | 1,634 (73.2%) |
| 75 Years and over | 1,255 (87.3%) | 1,284 (84.4%) |
| Total | 15,314 (80.7%) | 14,248 (77.3%) |
Income Below Poverty Among Married-Couple Families in South Valley
The poverty statistics for married-couple families in South Valley show that 12.8% or 715 of the total 5,574 families live below the poverty line. Families with 1 or 2 children have the highest poverty rate of 19.2%, comprising of 331 families. On the other hand, families with 5 or more children have the lowest poverty rate of 0.0%, which includes 0 families.
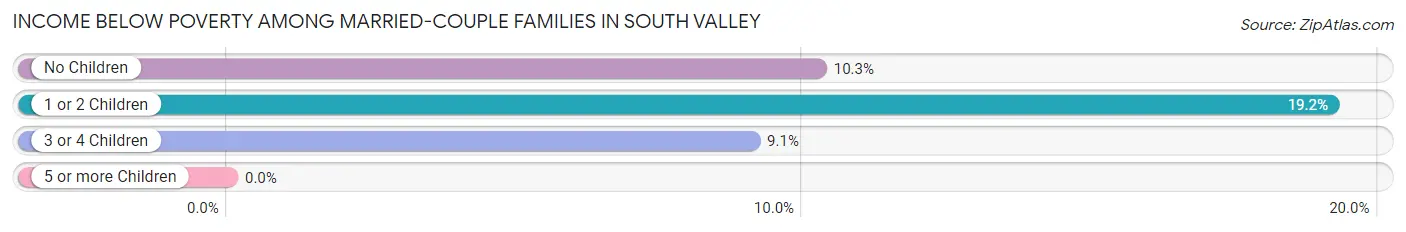
| Children | Above Poverty | Below Poverty |
| No Children | 2,995 (89.7%) | 342 (10.2%) |
| 1 or 2 Children | 1,395 (80.8%) | 331 (19.2%) |
| 3 or 4 Children | 420 (90.9%) | 42 (9.1%) |
| 5 or more Children | 49 (100.0%) | 0 (0.0%) |
| Total | 4,859 (87.2%) | 715 (12.8%) |
Income Below Poverty Among Single-Parent Households in South Valley
According to the poverty data in South Valley, 22.7% or 212 single-father households and 29.6% or 699 single-mother households are living below the poverty line. Among single-father households, those with 3 or 4 children have the highest poverty rate, with 24 households (49.0%) experiencing poverty. Likewise, among single-mother households, those with 3 or 4 children have the highest poverty rate, with 184 households (62.0%) falling below the poverty line.
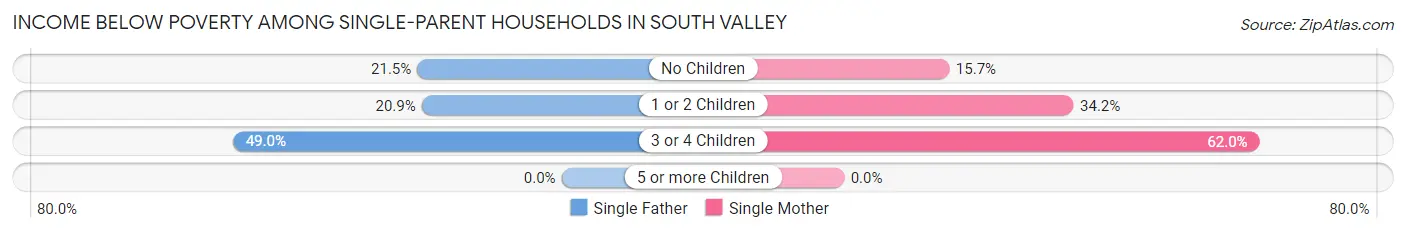
| Children | Single Father | Single Mother |
| No Children | 100 (21.5%) | 130 (15.7%) |
| 1 or 2 Children | 88 (20.8%) | 385 (34.2%) |
| 3 or 4 Children | 24 (49.0%) | 184 (62.0%) |
| 5 or more Children | 0 (0.0%) | 0 (0.0%) |
| Total | 212 (22.7%) | 699 (29.6%) |
Income Below Poverty Among Married-Couple vs Single-Parent Households in South Valley
The poverty data for South Valley shows that 715 of the married-couple family households (12.8%) and 911 of the single-parent households (27.6%) are living below the poverty level. Within the married-couple family households, those with 1 or 2 children have the highest poverty rate, with 331 households (19.2%) falling below the poverty line. Among the single-parent households, those with 3 or 4 children have the highest poverty rate, with 208 household (60.1%) living below poverty.
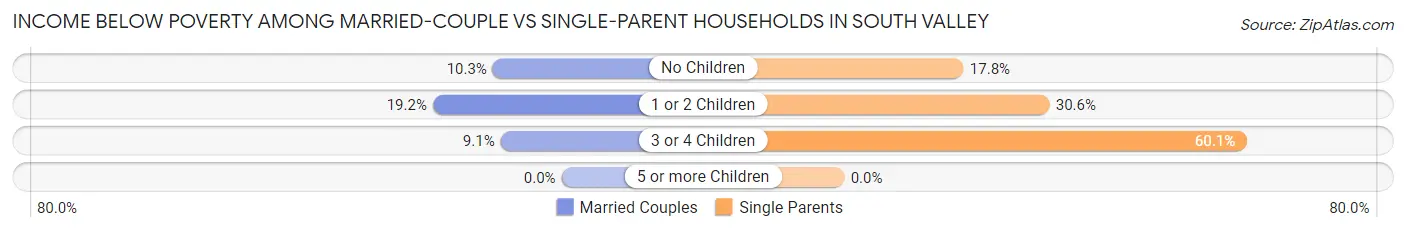
| Children | Married-Couple Families | Single-Parent Households |
| No Children | 342 (10.2%) | 230 (17.8%) |
| 1 or 2 Children | 331 (19.2%) | 473 (30.6%) |
| 3 or 4 Children | 42 (9.1%) | 208 (60.1%) |
| 5 or more Children | 0 (0.0%) | 0 (0.0%) |
| Total | 715 (12.8%) | 911 (27.6%) |
Race in South Valley
The most populous races in South Valley are Hispanic or Latino (30,779 | 81.9%), White / Caucasian (18,121 | 48.2%), and Two or more Races (9,581 | 25.5%).
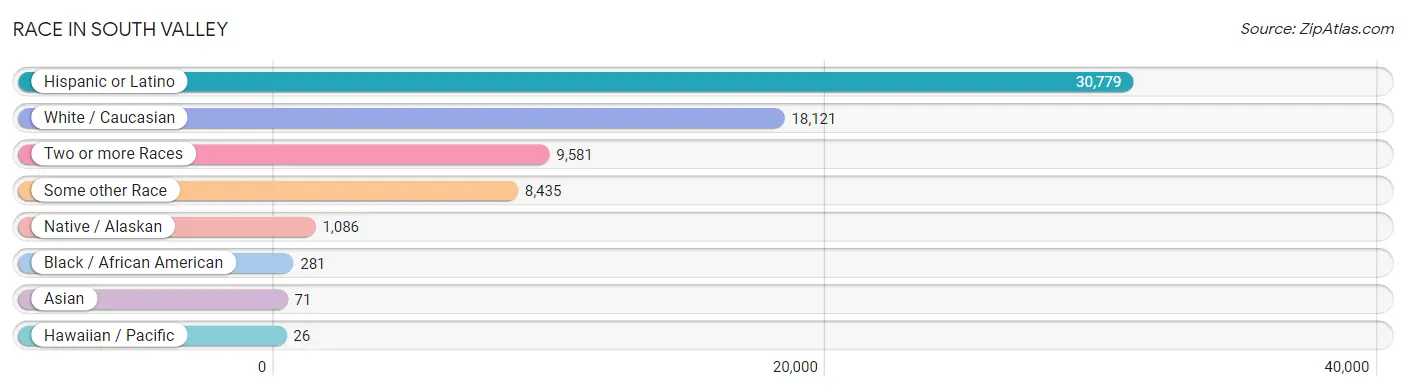
| Race | # Population | % Population |
| Asian | 71 | 0.2% |
| Black / African American | 281 | 0.7% |
| Hawaiian / Pacific | 26 | 0.1% |
| Hispanic or Latino | 30,779 | 81.9% |
| Native / Alaskan | 1,086 | 2.9% |
| White / Caucasian | 18,121 | 48.2% |
| Two or more Races | 9,581 | 25.5% |
| Some other Race | 8,435 | 22.4% |
| Total | 37,601 | 100.0% |
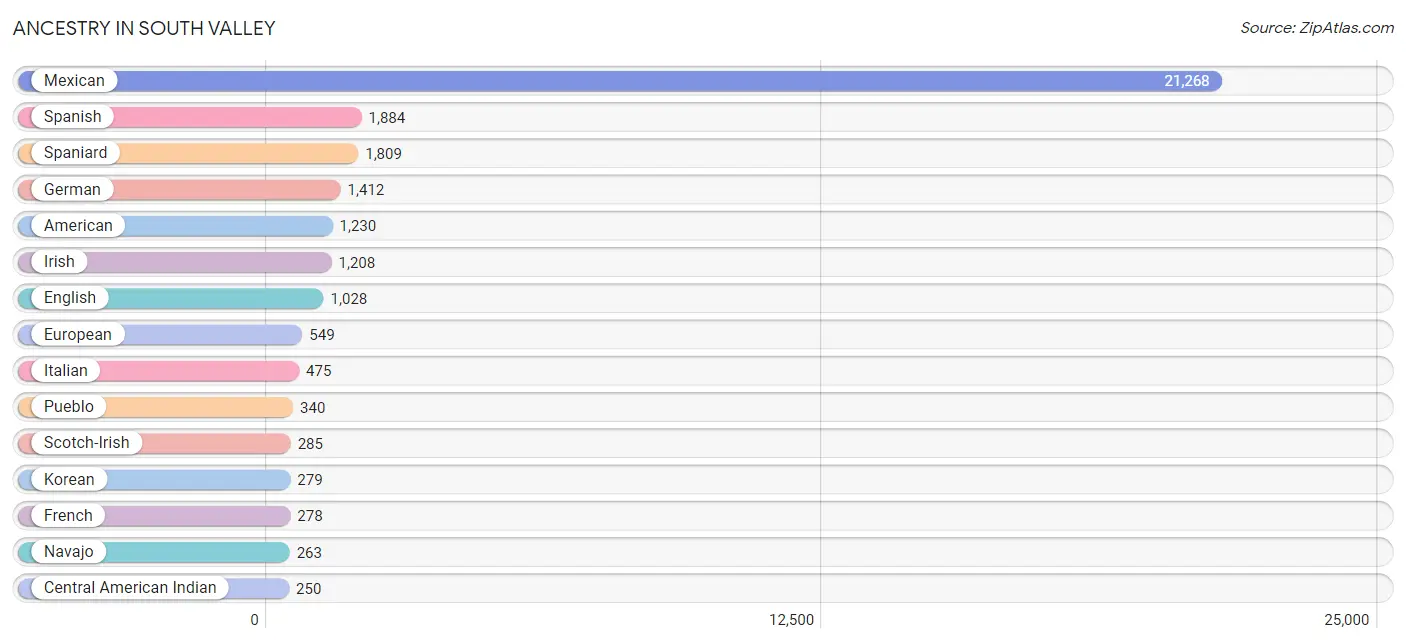
Ancestry in South Valley
The most populous ancestries reported in South Valley are Mexican (21,268 | 56.6%), Spanish (1,884 | 5.0%), Spaniard (1,809 | 4.8%), German (1,412 | 3.8%), and American (1,230 | 3.3%), together accounting for 73.4% of all South Valley residents.
| Ancestry | # Population | % Population |
| African | 90 | 0.2% |
| American | 1,230 | 3.3% |
| Apache | 45 | 0.1% |
| Arab | 93 | 0.3% |
| Blackfeet | 18 | 0.1% |
| British | 144 | 0.4% |
| Burmese | 10 | 0.0% |
| Central American | 230 | 0.6% |
| Central American Indian | 250 | 0.7% |
| Cherokee | 122 | 0.3% |
| Chilean | 19 | 0.1% |
| Choctaw | 67 | 0.2% |
| Costa Rican | 52 | 0.1% |
| Croatian | 14 | 0.0% |
| Cuban | 220 | 0.6% |
| Czech | 20 | 0.1% |
| Danish | 93 | 0.3% |
| Dominican | 90 | 0.2% |
| Dutch | 38 | 0.1% |
| Eastern European | 77 | 0.2% |
| Ecuadorian | 76 | 0.2% |
| Egyptian | 14 | 0.0% |
| English | 1,028 | 2.7% |
| European | 549 | 1.5% |
| Finnish | 4 | 0.0% |
| French | 278 | 0.7% |
| French Canadian | 45 | 0.1% |
| German | 1,412 | 3.8% |
| Greek | 44 | 0.1% |
| Guamanian / Chamorro | 12 | 0.0% |
| Guatemalan | 53 | 0.1% |
| Haitian | 1 | 0.0% |
| Hungarian | 70 | 0.2% |
| Indian (Asian) | 11 | 0.0% |
| Irish | 1,208 | 3.2% |
| Italian | 475 | 1.3% |
| Jamaican | 11 | 0.0% |
| Korean | 279 | 0.7% |
| Lebanese | 66 | 0.2% |
| Lithuanian | 31 | 0.1% |
| Mexican | 21,268 | 56.6% |
| Mexican American Indian | 246 | 0.6% |
| Native Hawaiian | 43 | 0.1% |
| Navajo | 263 | 0.7% |
| Nigerian | 11 | 0.0% |
| Northern European | 43 | 0.1% |
| Norwegian | 86 | 0.2% |
| Polish | 112 | 0.3% |
| Portuguese | 46 | 0.1% |
| Pueblo | 340 | 0.9% |
| Puerto Rican | 197 | 0.5% |
| Romanian | 8 | 0.0% |
| Russian | 45 | 0.1% |
| Scandinavian | 21 | 0.1% |
| Scotch-Irish | 285 | 0.8% |
| Scottish | 197 | 0.5% |
| Slavic | 12 | 0.0% |
| Slovene | 3 | 0.0% |
| South American | 108 | 0.3% |
| Spaniard | 1,809 | 4.8% |
| Spanish | 1,884 | 5.0% |
| Spanish American | 103 | 0.3% |
| Subsaharan African | 211 | 0.6% |
| Swedish | 90 | 0.2% |
| Swiss | 11 | 0.0% |
| Syrian | 5 | 0.0% |
| Thai | 31 | 0.1% |
| Ukrainian | 71 | 0.2% |
| Venezuelan | 13 | 0.0% |
| Welsh | 46 | 0.1% |
| West Indian | 90 | 0.2% | View All 71 Rows |
Immigrants in South Valley
The most numerous immigrant groups reported in South Valley came from Latin America (5,226 | 13.9%), Central America (4,927 | 13.1%), Mexico (4,908 | 13.1%), Caribbean (261 | 0.7%), and Cuba (180 | 0.5%), together accounting for 41.2% of all South Valley residents.
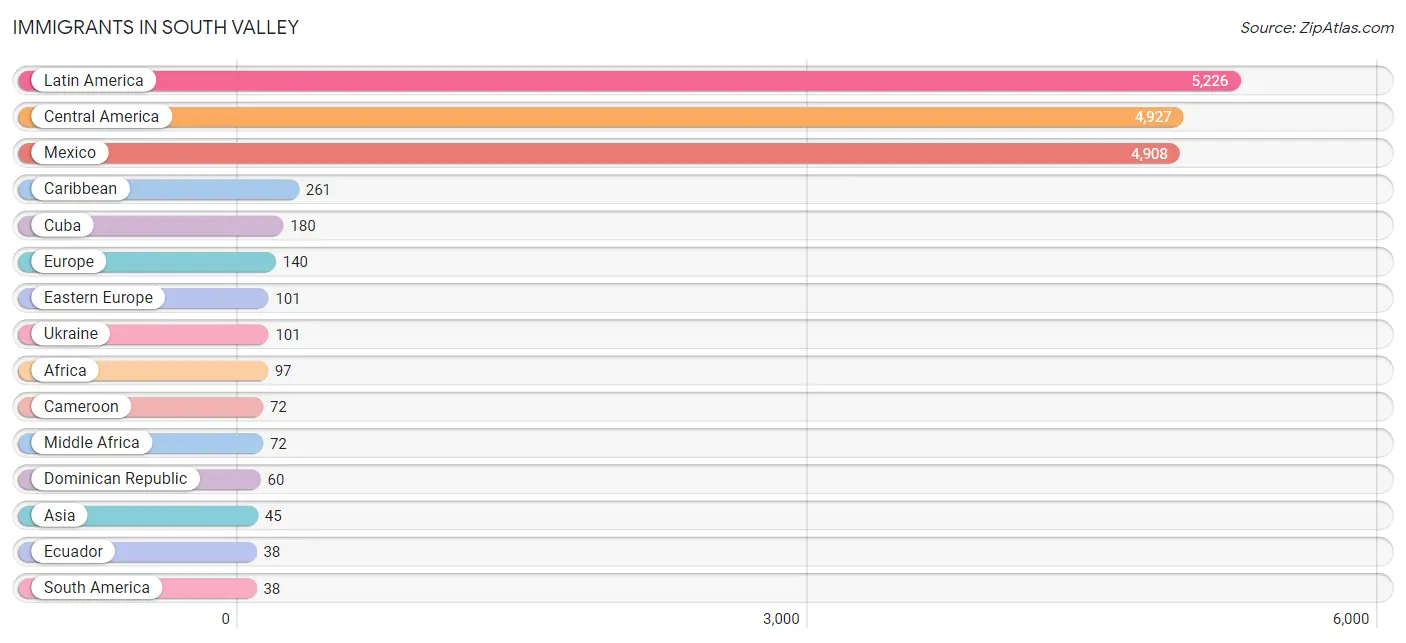
| Immigration Origin | # Population | % Population |
| Africa | 97 | 0.3% |
| Asia | 45 | 0.1% |
| Cameroon | 72 | 0.2% |
| Caribbean | 261 | 0.7% |
| Central America | 4,927 | 13.1% |
| Cuba | 180 | 0.5% |
| Denmark | 5 | 0.0% |
| Dominican Republic | 60 | 0.2% |
| Eastern Asia | 9 | 0.0% |
| Eastern Europe | 101 | 0.3% |
| Ecuador | 38 | 0.1% |
| Egypt | 14 | 0.0% |
| England | 9 | 0.0% |
| Europe | 140 | 0.4% |
| Germany | 4 | 0.0% |
| Guatemala | 19 | 0.1% |
| Haiti | 1 | 0.0% |
| Jamaica | 11 | 0.0% |
| Japan | 9 | 0.0% |
| Latin America | 5,226 | 13.9% |
| Mexico | 4,908 | 13.1% |
| Middle Africa | 72 | 0.2% |
| Nigeria | 11 | 0.0% |
| Northern Africa | 14 | 0.0% |
| Northern Europe | 14 | 0.0% |
| Philippines | 36 | 0.1% |
| South America | 38 | 0.1% |
| South Eastern Asia | 36 | 0.1% |
| Southern Europe | 11 | 0.0% |
| Spain | 11 | 0.0% |
| Trinidad and Tobago | 9 | 0.0% |
| Ukraine | 101 | 0.3% |
| Western Africa | 11 | 0.0% |
| Western Europe | 14 | 0.0% | View All 34 Rows |
Sex and Age in South Valley
Sex and Age in South Valley
The most populous age groups in South Valley are 40 to 44 Years (1,782 | 9.3%) for men and 10 to 14 Years (1,645 | 8.9%) for women.
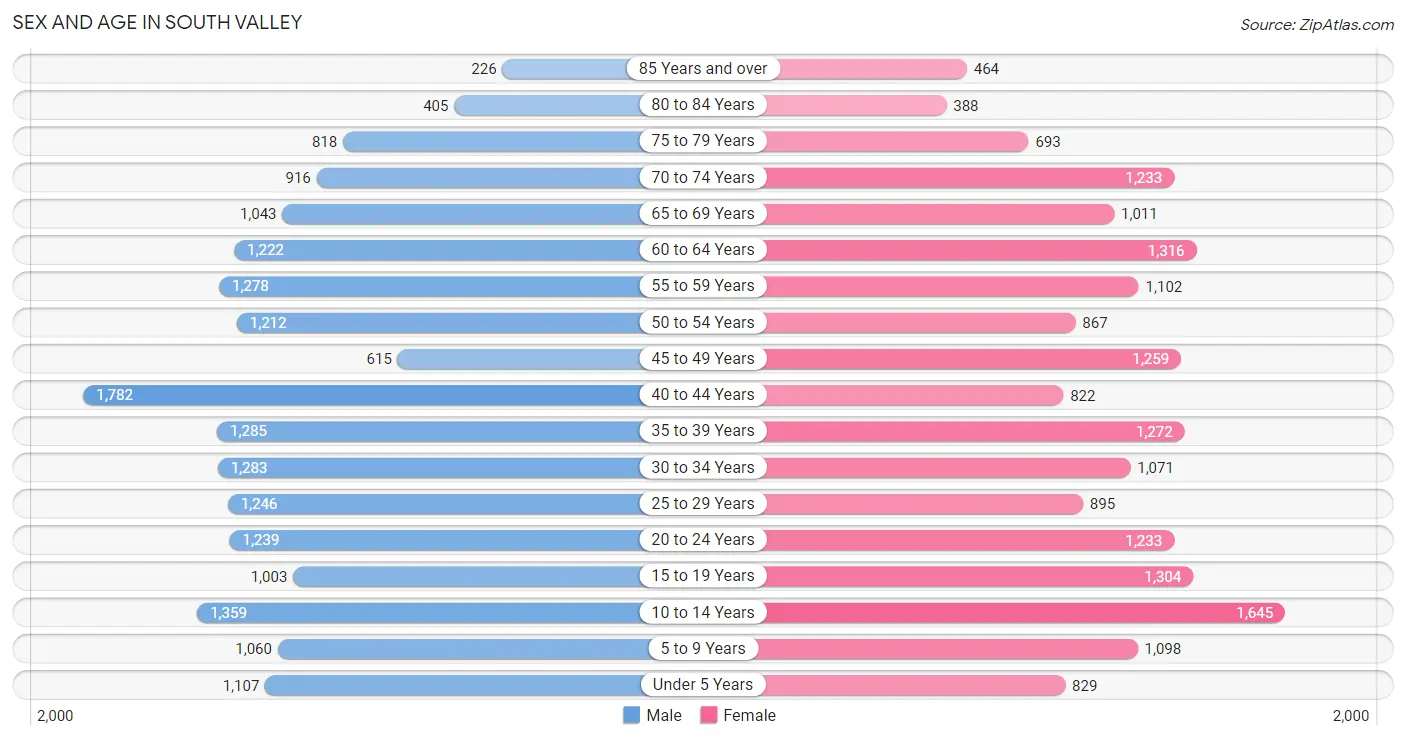
| Age Bracket | Male | Female |
| Under 5 Years | 1,107 (5.8%) | 829 (4.5%) |
| 5 to 9 Years | 1,060 (5.6%) | 1,098 (5.9%) |
| 10 to 14 Years | 1,359 (7.1%) | 1,645 (8.9%) |
| 15 to 19 Years | 1,003 (5.2%) | 1,304 (7.0%) |
| 20 to 24 Years | 1,239 (6.5%) | 1,233 (6.7%) |
| 25 to 29 Years | 1,246 (6.5%) | 895 (4.8%) |
| 30 to 34 Years | 1,283 (6.7%) | 1,071 (5.8%) |
| 35 to 39 Years | 1,285 (6.7%) | 1,272 (6.9%) |
| 40 to 44 Years | 1,782 (9.3%) | 822 (4.4%) |
| 45 to 49 Years | 615 (3.2%) | 1,259 (6.8%) |
| 50 to 54 Years | 1,212 (6.4%) | 867 (4.7%) |
| 55 to 59 Years | 1,278 (6.7%) | 1,102 (6.0%) |
| 60 to 64 Years | 1,222 (6.4%) | 1,316 (7.1%) |
| 65 to 69 Years | 1,043 (5.5%) | 1,011 (5.5%) |
| 70 to 74 Years | 916 (4.8%) | 1,233 (6.7%) |
| 75 to 79 Years | 818 (4.3%) | 693 (3.7%) |
| 80 to 84 Years | 405 (2.1%) | 388 (2.1%) |
| 85 Years and over | 226 (1.2%) | 464 (2.5%) |
| Total | 19,099 (100.0%) | 18,502 (100.0%) |
Families and Households in South Valley
Median Family Size in South Valley
The median family size in South Valley is 3.49 persons per family, with single female/mother families (2,363 | 26.6%) accounting for the largest median family size of 3.68 persons per family. On the other hand, single male/father families (936 | 10.5%) represent the smallest median family size with 2.63 persons per family.
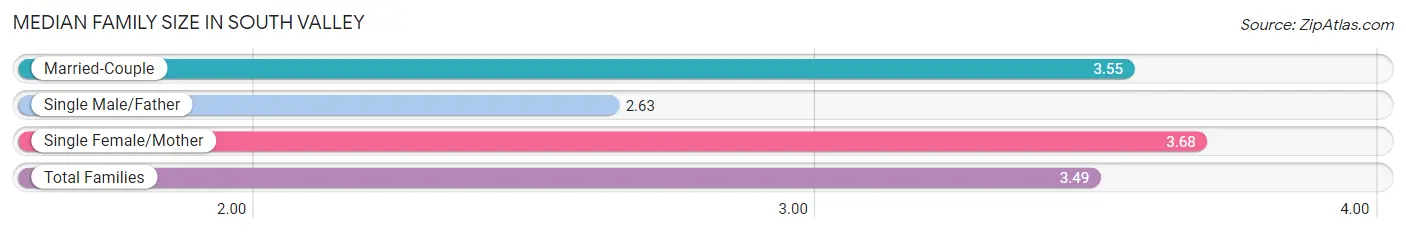
| Family Type | # Families | Family Size |
| Married-Couple | 5,574 (62.8%) | 3.55 |
| Single Male/Father | 936 (10.5%) | 2.63 |
| Single Female/Mother | 2,363 (26.6%) | 3.68 |
| Total Families | 8,873 (100.0%) | 3.49 |
Median Household Size in South Valley
The median household size in South Valley is 2.82 persons per household, with single female/mother households (2,363 | 17.9%) accounting for the largest median household size of 4.04 persons per household. non-family households (4,288 | 32.6%) represent the smallest median household size with 1.13 persons per household.
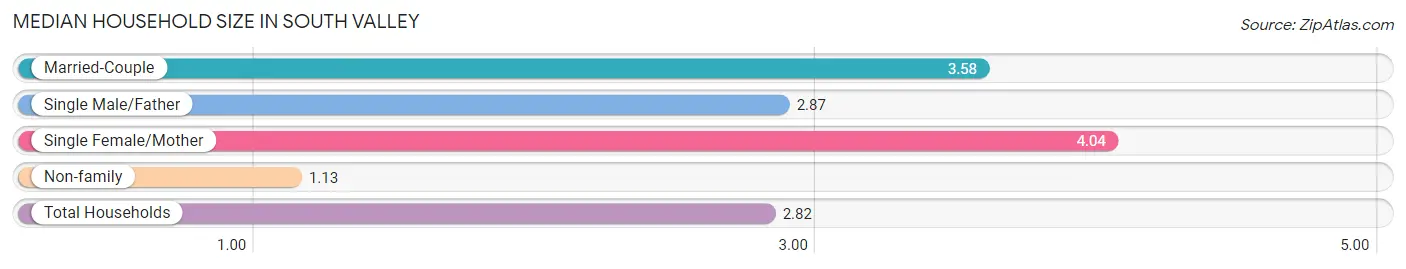
| Household Type | # Households | Household Size |
| Married-Couple | 5,574 (42.3%) | 3.58 |
| Single Male/Father | 936 (7.1%) | 2.87 |
| Single Female/Mother | 2,363 (17.9%) | 4.04 |
| Non-family | 4,288 (32.6%) | 1.13 |
| Total Households | 13,161 (100.0%) | 2.82 |
Household Size by Marriage Status in South Valley
Out of a total of 13,161 households in South Valley, 8,873 (67.4%) are family households, while 4,288 (32.6%) are nonfamily households. The most numerous type of family households are 2-person households, comprising 3,656, and the most common type of nonfamily households are 1-person households, comprising 3,839.
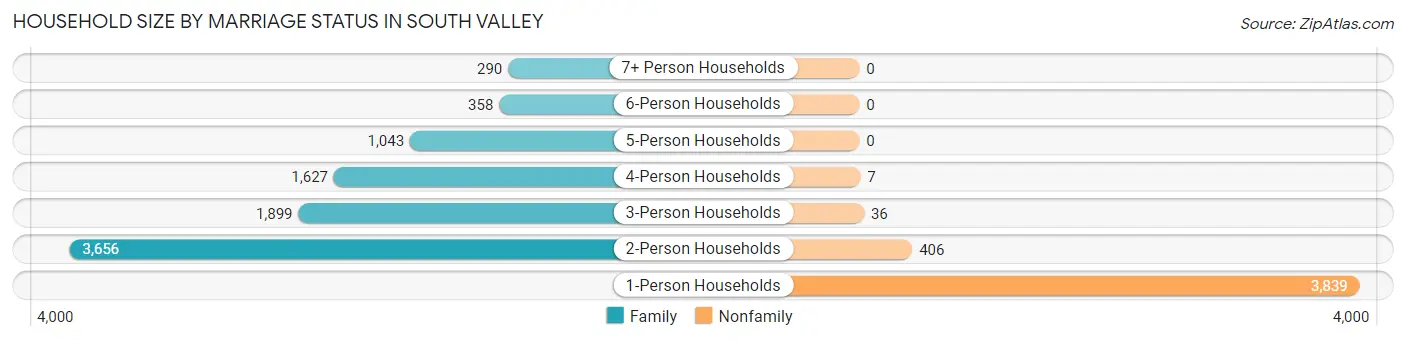
| Household Size | Family Households | Nonfamily Households |
| 1-Person Households | - | 3,839 (29.2%) |
| 2-Person Households | 3,656 (27.8%) | 406 (3.1%) |
| 3-Person Households | 1,899 (14.4%) | 36 (0.3%) |
| 4-Person Households | 1,627 (12.4%) | 7 (0.1%) |
| 5-Person Households | 1,043 (7.9%) | 0 (0.0%) |
| 6-Person Households | 358 (2.7%) | 0 (0.0%) |
| 7+ Person Households | 290 (2.2%) | 0 (0.0%) |
| Total | 8,873 (67.4%) | 4,288 (32.6%) |
Female Fertility in South Valley
Fertility by Age in South Valley
Average fertility rate in South Valley is 58.0 births per 1,000 women. Women in the age bracket of 20 to 34 years have the highest fertility rate with 120.0 births per 1,000 women. Women in the age bracket of 20 to 34 years acount for 81.4% of all women with births.
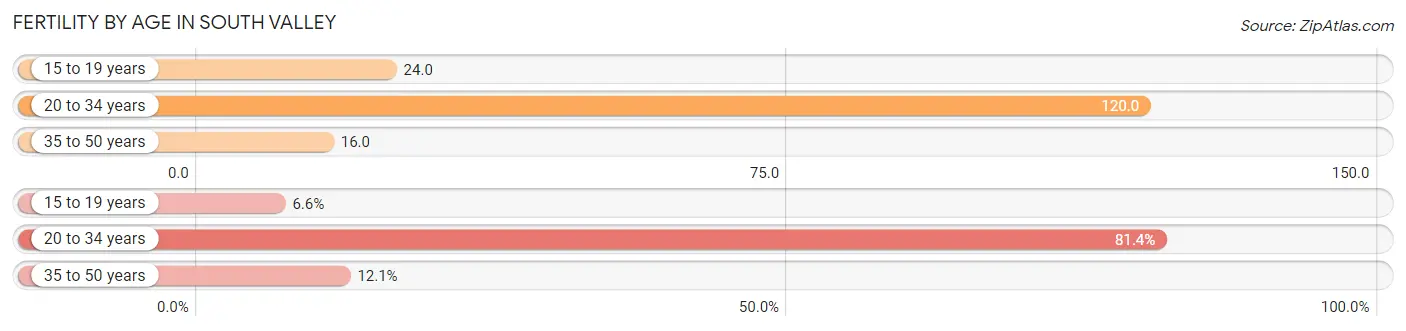
| Age Bracket | Women with Births | Births / 1,000 Women |
| 15 to 19 years | 31 (6.6%) | 24.0 |
| 20 to 34 years | 384 (81.4%) | 120.0 |
| 35 to 50 years | 57 (12.1%) | 16.0 |
| Total | 472 (100.0%) | 58.0 |
Fertility by Age by Marriage Status in South Valley
40.0% of women with births (472) in South Valley are married. The highest percentage of unmarried women with births falls into 35 to 50 years age bracket with 100.0% of them unmarried at the time of birth, while the lowest percentage of unmarried women with births belong to 15 to 19 years age bracket with 0.0% of them unmarried.
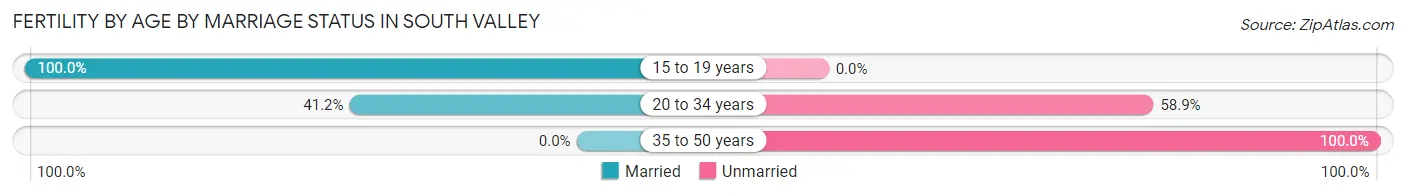
| Age Bracket | Married | Unmarried |
| 15 to 19 years | 31 (100.0%) | 0 (0.0%) |
| 20 to 34 years | 158 (41.1%) | 226 (58.9%) |
| 35 to 50 years | 0 (0.0%) | 57 (100.0%) |
| Total | 189 (40.0%) | 283 (60.0%) |
Fertility by Education in South Valley
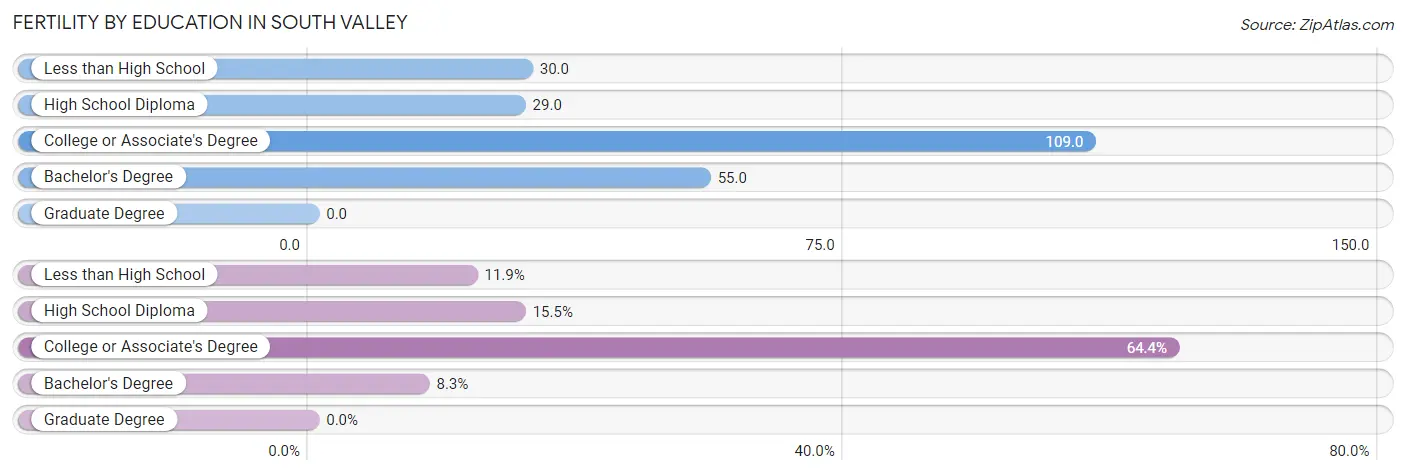
| Educational Attainment | Women with Births | Births / 1,000 Women |
| Less than High School | 56 (11.9%) | 30.0 |
| High School Diploma | 73 (15.5%) | 29.0 |
| College or Associate's Degree | 304 (64.4%) | 109.0 |
| Bachelor's Degree | 39 (8.3%) | 55.0 |
| Graduate Degree | 0 (0.0%) | 0.0 |
| Total | 472 (100.0%) | 58.0 |
Fertility by Education by Marriage Status in South Valley
60.0% of women with births in South Valley are unmarried. Women with the educational attainment of high school diploma are most likely to be married with 100.0% of them married at childbirth, while women with the educational attainment of less than high school are least likely to be married with 100.0% of them unmarried at childbirth.
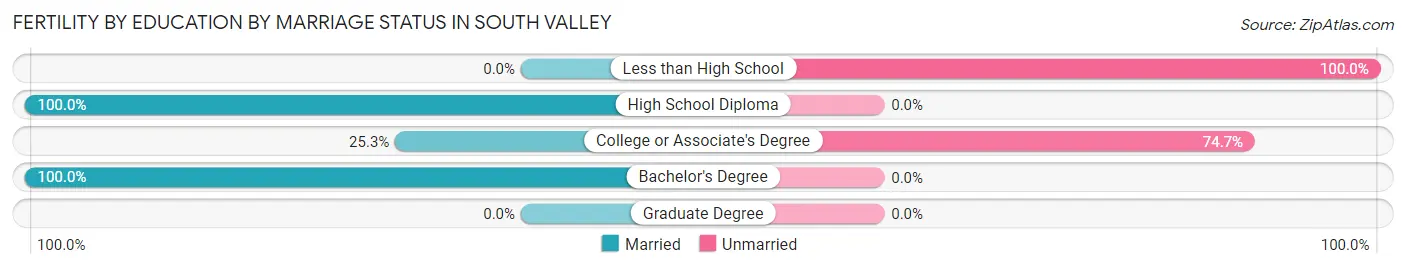
| Educational Attainment | Married | Unmarried |
| Less than High School | 0 (0.0%) | 56 (100.0%) |
| High School Diploma | 73 (100.0%) | 0 (0.0%) |
| College or Associate's Degree | 77 (25.3%) | 227 (74.7%) |
| Bachelor's Degree | 39 (100.0%) | 0 (0.0%) |
| Graduate Degree | 0 (0.0%) | 0 (0.0%) |
| Total | 189 (40.0%) | 283 (60.0%) |
Employment Characteristics in South Valley
Employment by Class of Employer in South Valley
Among the 15,111 employed individuals in South Valley, private company employees (9,724 | 64.3%), local government employees (1,512 | 10.0%), and not-for-profit organizations (1,172 | 7.8%) make up the most common classes of employment.
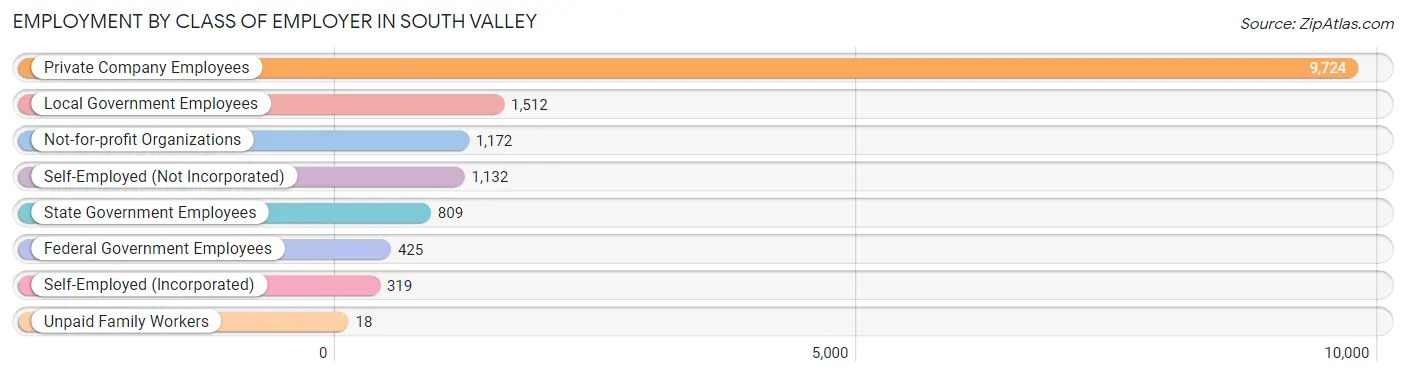
| Employer Class | # Employees | % Employees |
| Private Company Employees | 9,724 | 64.3% |
| Self-Employed (Incorporated) | 319 | 2.1% |
| Self-Employed (Not Incorporated) | 1,132 | 7.5% |
| Not-for-profit Organizations | 1,172 | 7.8% |
| Local Government Employees | 1,512 | 10.0% |
| State Government Employees | 809 | 5.3% |
| Federal Government Employees | 425 | 2.8% |
| Unpaid Family Workers | 18 | 0.1% |
| Total | 15,111 | 100.0% |
Employment Status by Age in South Valley
According to the labor force statistics for South Valley, out of the total population over 16 years of age (29,859), 54.3% or 16,213 individuals are in the labor force, with 5.7% or 924 of them unemployed. The age group with the highest labor force participation rate is 25 to 29 years, with 84.0% or 1,798 individuals in the labor force. Within the labor force, the 35 to 44 years age range has the highest percentage of unemployed individuals, with 8.1% or 316 of them being unemployed.
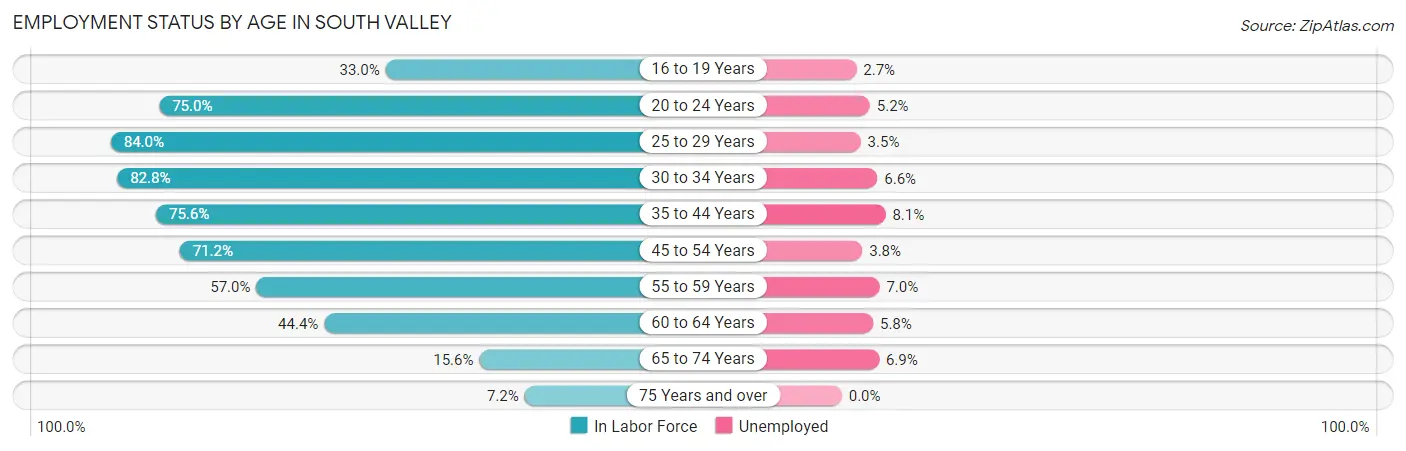
| Age Bracket | In Labor Force | Unemployed |
| 16 to 19 Years | 549 (33.0%) | 15 (2.7%) |
| 20 to 24 Years | 1,854 (75.0%) | 96 (5.2%) |
| 25 to 29 Years | 1,798 (84.0%) | 63 (3.5%) |
| 30 to 34 Years | 1,949 (82.8%) | 129 (6.6%) |
| 35 to 44 Years | 3,902 (75.6%) | 316 (8.1%) |
| 45 to 54 Years | 2,815 (71.2%) | 107 (3.8%) |
| 55 to 59 Years | 1,357 (57.0%) | 95 (7.0%) |
| 60 to 64 Years | 1,127 (44.4%) | 65 (5.8%) |
| 65 to 74 Years | 656 (15.6%) | 45 (6.9%) |
| 75 Years and over | 216 (7.2%) | 0 (0.0%) |
| Total | 16,213 (54.3%) | 924 (5.7%) |
Employment Status by Educational Attainment in South Valley
According to labor force statistics for South Valley, 69.9% of individuals (12,950) out of the total population between 25 and 64 years of age (18,527) are in the labor force, with 6.0% or 777 of them being unemployed. The group with the highest labor force participation rate are those with the educational attainment of bachelor's degree or higher, with 83.6% or 2,113 individuals in the labor force. Within the labor force, individuals with college / associate degree education have the highest percentage of unemployment, with 10.5% or 424 of them being unemployed.
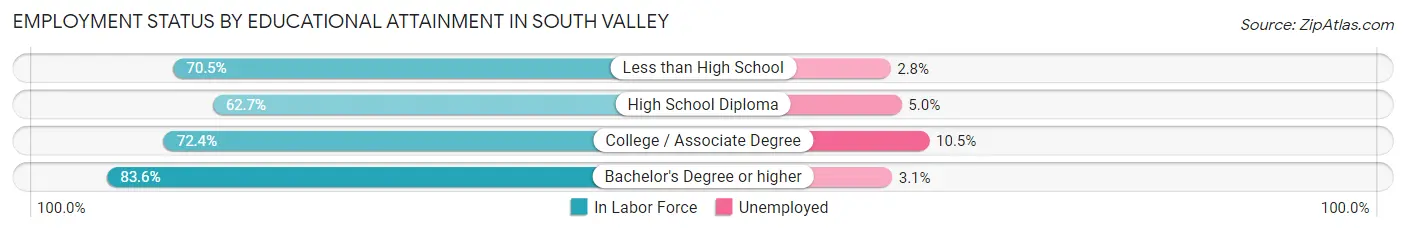
| Educational Attainment | In Labor Force | Unemployed |
| Less than High School | 2,360 (70.5%) | 94 (2.8%) |
| High School Diploma | 4,434 (62.7%) | 354 (5.0%) |
| College / Associate Degree | 4,041 (72.4%) | 586 (10.5%) |
| Bachelor's Degree or higher | 2,113 (83.6%) | 78 (3.1%) |
| Total | 12,950 (69.9%) | 1,112 (6.0%) |
Employment Occupations by Sex in South Valley
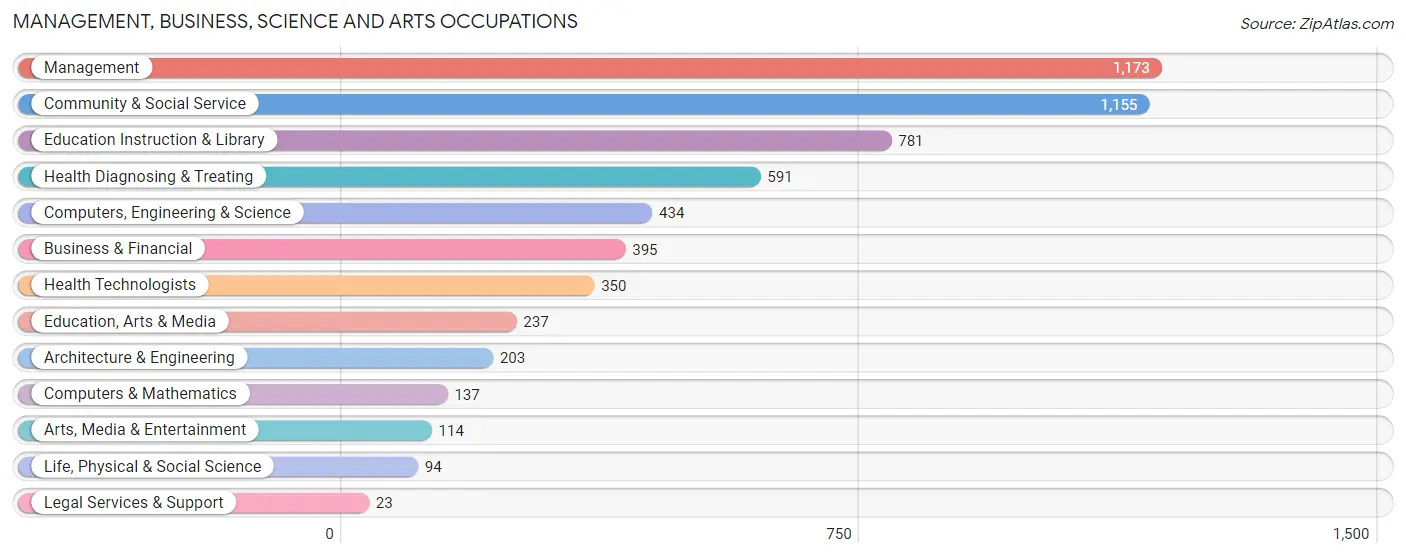
Management, Business, Science and Arts Occupations
The most common Management, Business, Science and Arts occupations in South Valley are Management (1,173 | 7.7%), Community & Social Service (1,155 | 7.6%), Education Instruction & Library (781 | 5.1%), Health Diagnosing & Treating (591 | 3.9%), and Computers, Engineering & Science (434 | 2.9%).
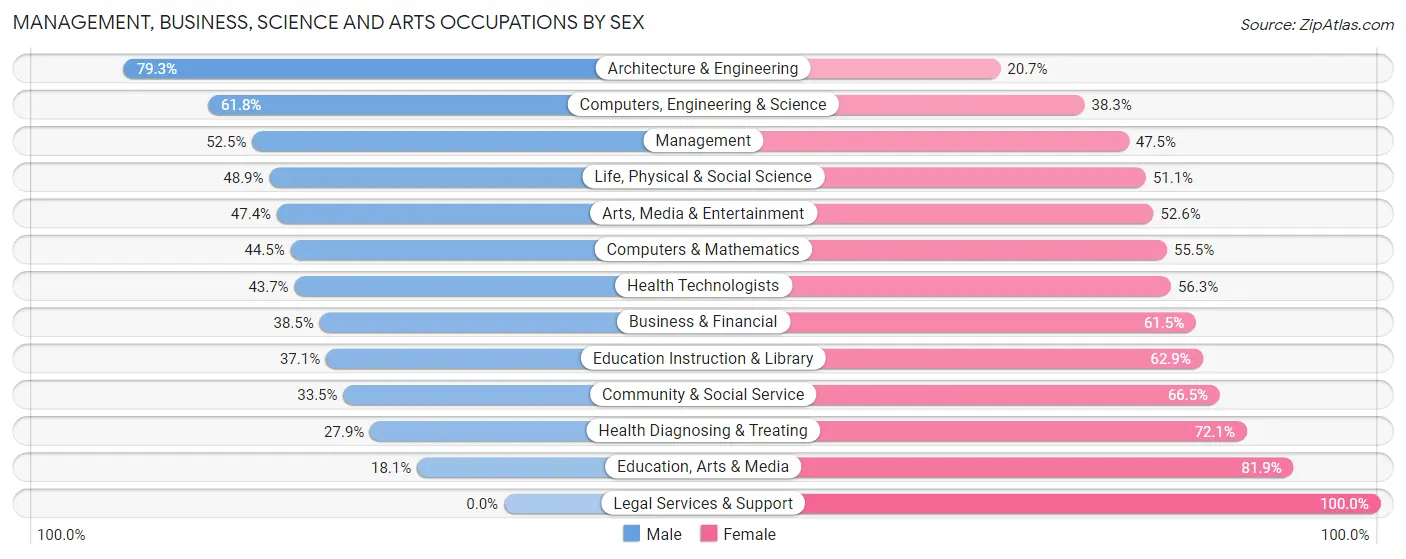
Management, Business, Science and Arts Occupations by Sex
Within the Management, Business, Science and Arts occupations in South Valley, the most male-oriented occupations are Architecture & Engineering (79.3%), Computers, Engineering & Science (61.8%), and Management (52.5%), while the most female-oriented occupations are Legal Services & Support (100.0%), Education, Arts & Media (81.9%), and Health Diagnosing & Treating (72.1%).
| Occupation | Male | Female |
| Management | 616 (52.5%) | 557 (47.5%) |
| Business & Financial | 152 (38.5%) | 243 (61.5%) |
| Computers, Engineering & Science | 268 (61.8%) | 166 (38.3%) |
| Computers & Mathematics | 61 (44.5%) | 76 (55.5%) |
| Architecture & Engineering | 161 (79.3%) | 42 (20.7%) |
| Life, Physical & Social Science | 46 (48.9%) | 48 (51.1%) |
| Community & Social Service | 387 (33.5%) | 768 (66.5%) |
| Education, Arts & Media | 43 (18.1%) | 194 (81.9%) |
| Legal Services & Support | 0 (0.0%) | 23 (100.0%) |
| Education Instruction & Library | 290 (37.1%) | 491 (62.9%) |
| Arts, Media & Entertainment | 54 (47.4%) | 60 (52.6%) |
| Health Diagnosing & Treating | 165 (27.9%) | 426 (72.1%) |
| Health Technologists | 153 (43.7%) | 197 (56.3%) |
| Total (Category) | 1,588 (42.4%) | 2,160 (57.6%) |
| Total (Overall) | 8,792 (57.7%) | 6,451 (42.3%) |
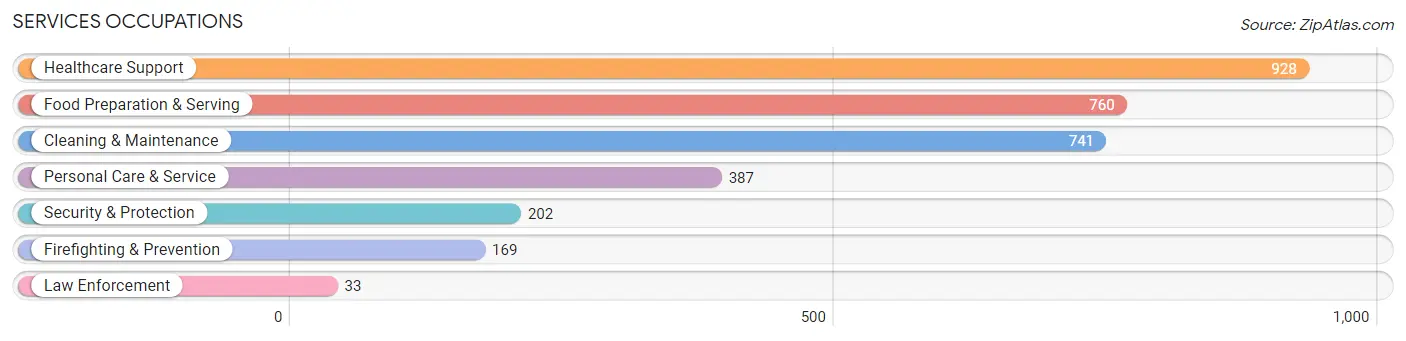
Services Occupations
The most common Services occupations in South Valley are Healthcare Support (928 | 6.1%), Food Preparation & Serving (760 | 5.0%), Cleaning & Maintenance (741 | 4.9%), Personal Care & Service (387 | 2.5%), and Security & Protection (202 | 1.3%).
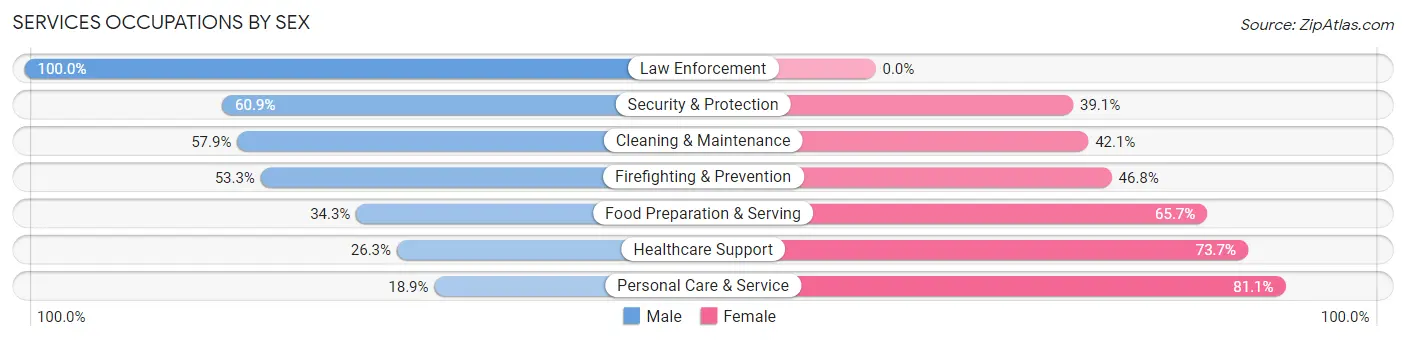
Services Occupations by Sex
Within the Services occupations in South Valley, the most male-oriented occupations are Law Enforcement (100.0%), Security & Protection (60.9%), and Cleaning & Maintenance (57.9%), while the most female-oriented occupations are Personal Care & Service (81.1%), Healthcare Support (73.7%), and Food Preparation & Serving (65.7%).
| Occupation | Male | Female |
| Healthcare Support | 244 (26.3%) | 684 (73.7%) |
| Security & Protection | 123 (60.9%) | 79 (39.1%) |
| Firefighting & Prevention | 90 (53.2%) | 79 (46.8%) |
| Law Enforcement | 33 (100.0%) | 0 (0.0%) |
| Food Preparation & Serving | 261 (34.3%) | 499 (65.7%) |
| Cleaning & Maintenance | 429 (57.9%) | 312 (42.1%) |
| Personal Care & Service | 73 (18.9%) | 314 (81.1%) |
| Total (Category) | 1,130 (37.4%) | 1,888 (62.6%) |
| Total (Overall) | 8,792 (57.7%) | 6,451 (42.3%) |
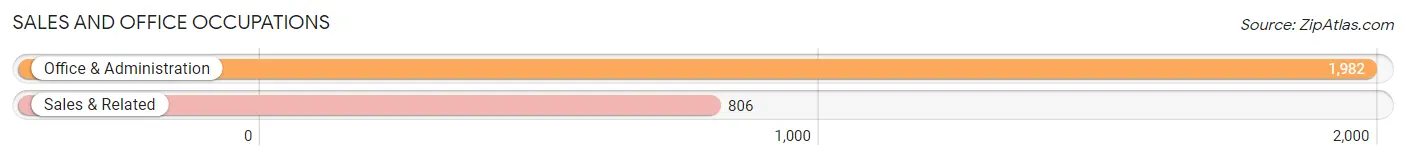
Sales and Office Occupations
The most common Sales and Office occupations in South Valley are Office & Administration (1,982 | 13.0%), and Sales & Related (806 | 5.3%).
Sales and Office Occupations by Sex
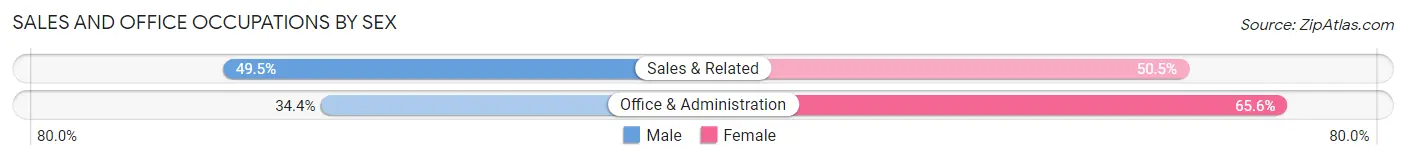
| Occupation | Male | Female |
| Sales & Related | 399 (49.5%) | 407 (50.5%) |
| Office & Administration | 681 (34.4%) | 1,301 (65.6%) |
| Total (Category) | 1,080 (38.7%) | 1,708 (61.3%) |
| Total (Overall) | 8,792 (57.7%) | 6,451 (42.3%) |
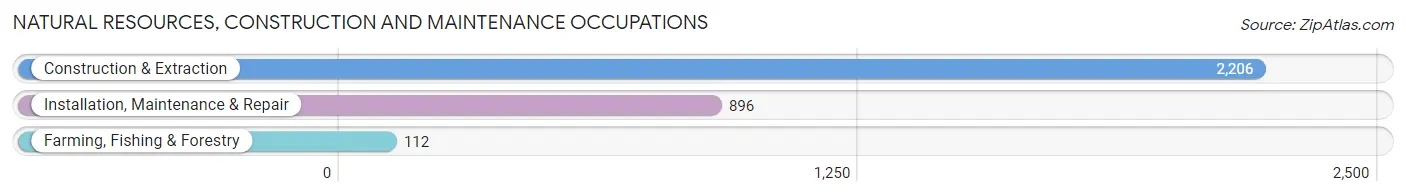
Natural Resources, Construction and Maintenance Occupations
The most common Natural Resources, Construction and Maintenance occupations in South Valley are Construction & Extraction (2,206 | 14.5%), Installation, Maintenance & Repair (896 | 5.9%), and Farming, Fishing & Forestry (112 | 0.7%).
Natural Resources, Construction and Maintenance Occupations by Sex
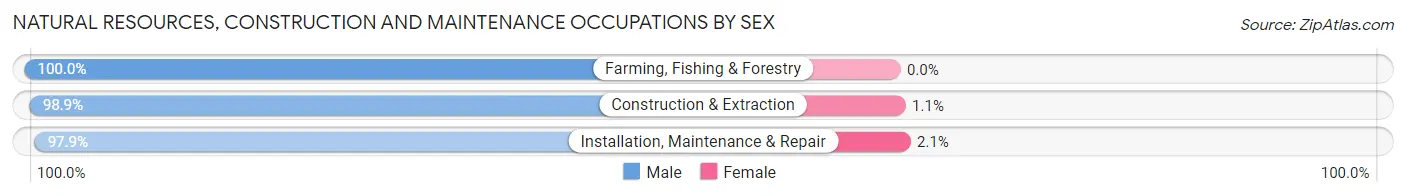
| Occupation | Male | Female |
| Farming, Fishing & Forestry | 112 (100.0%) | 0 (0.0%) |
| Construction & Extraction | 2,182 (98.9%) | 24 (1.1%) |
| Installation, Maintenance & Repair | 877 (97.9%) | 19 (2.1%) |
| Total (Category) | 3,171 (98.7%) | 43 (1.3%) |
| Total (Overall) | 8,792 (57.7%) | 6,451 (42.3%) |
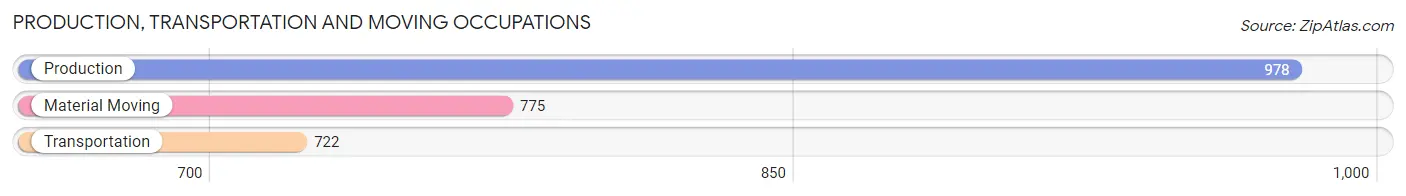
Production, Transportation and Moving Occupations
The most common Production, Transportation and Moving occupations in South Valley are Production (978 | 6.4%), Material Moving (775 | 5.1%), and Transportation (722 | 4.7%).
Production, Transportation and Moving Occupations by Sex
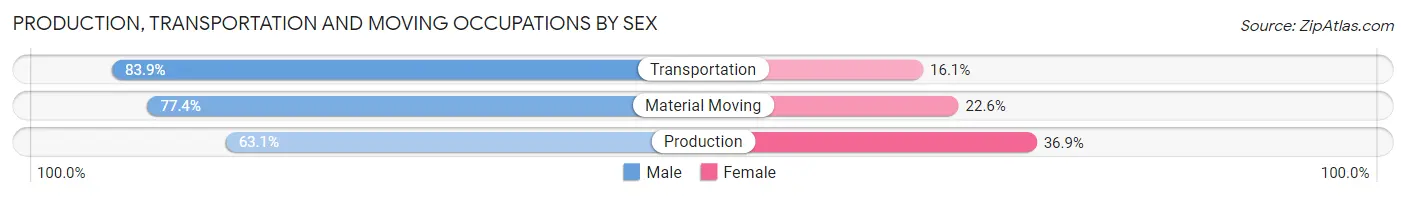
| Occupation | Male | Female |
| Production | 617 (63.1%) | 361 (36.9%) |
| Transportation | 606 (83.9%) | 116 (16.1%) |
| Material Moving | 600 (77.4%) | 175 (22.6%) |
| Total (Category) | 1,823 (73.7%) | 652 (26.3%) |
| Total (Overall) | 8,792 (57.7%) | 6,451 (42.3%) |
Employment Industries by Sex in South Valley
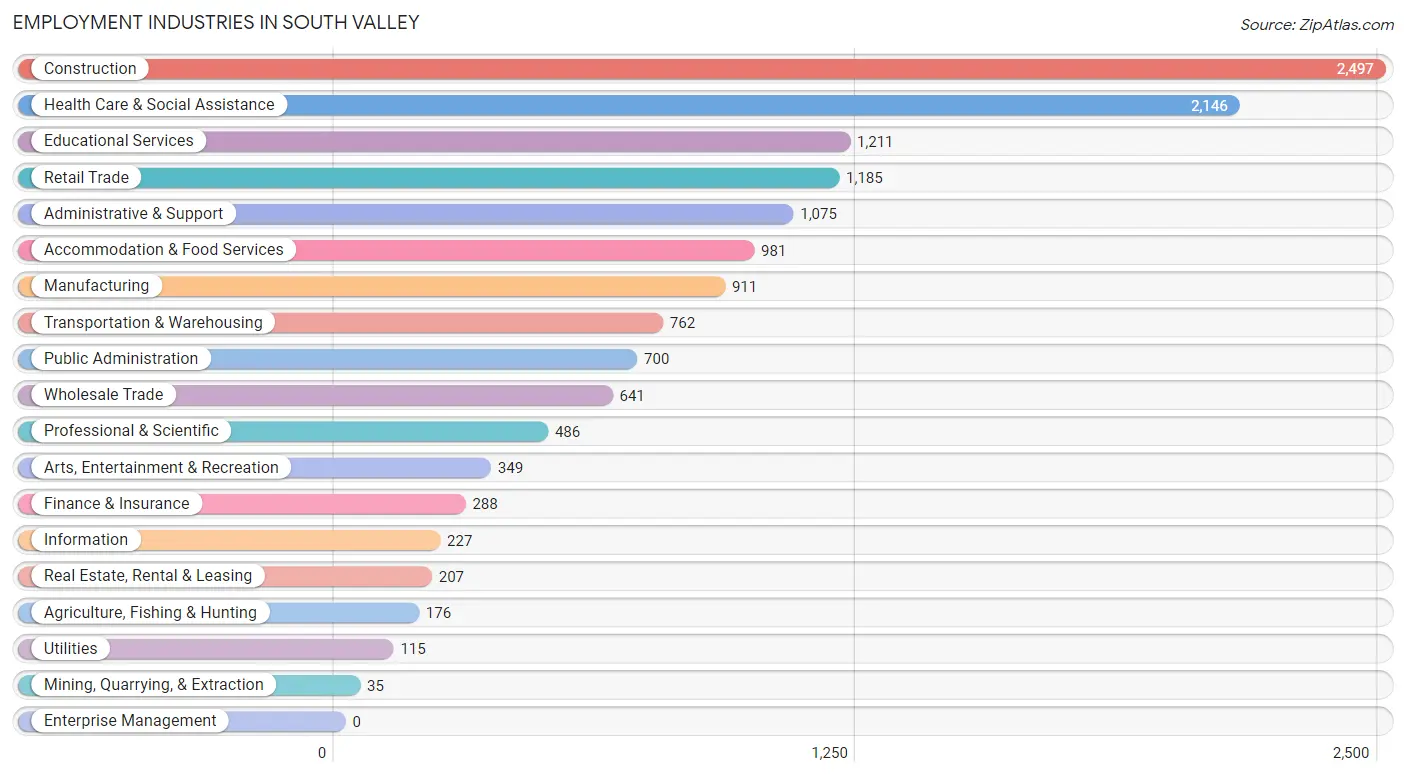
Employment Industries in South Valley
The major employment industries in South Valley include Construction (2,497 | 16.4%), Health Care & Social Assistance (2,146 | 14.1%), Educational Services (1,211 | 7.9%), Retail Trade (1,185 | 7.8%), and Administrative & Support (1,075 | 7.0%).
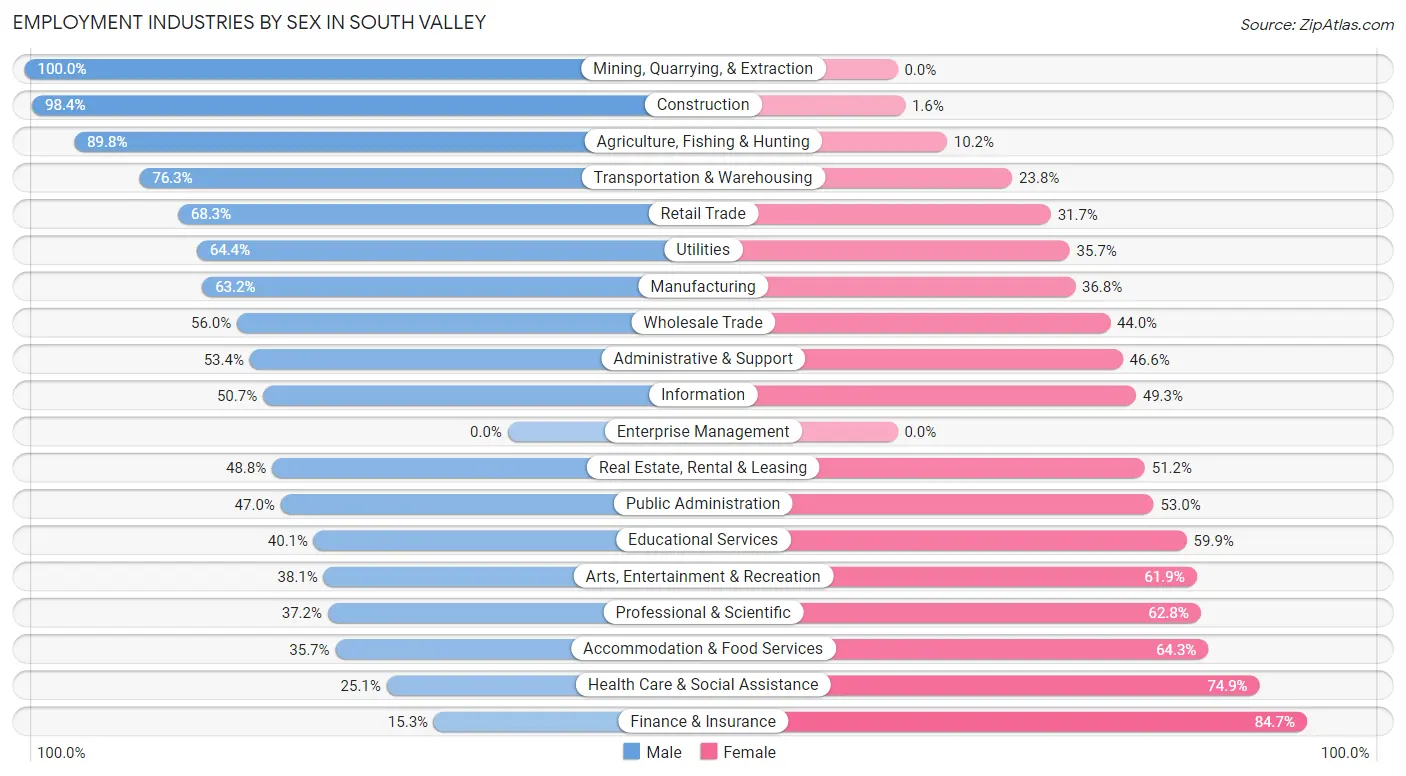
Employment Industries by Sex in South Valley
The South Valley industries that see more men than women are Mining, Quarrying, & Extraction (100.0%), Construction (98.4%), and Agriculture, Fishing & Hunting (89.8%), whereas the industries that tend to have a higher number of women are Finance & Insurance (84.7%), Health Care & Social Assistance (74.9%), and Accommodation & Food Services (64.3%).
| Industry | Male | Female |
| Agriculture, Fishing & Hunting | 158 (89.8%) | 18 (10.2%) |
| Mining, Quarrying, & Extraction | 35 (100.0%) | 0 (0.0%) |
| Construction | 2,458 (98.4%) | 39 (1.6%) |
| Manufacturing | 576 (63.2%) | 335 (36.8%) |
| Wholesale Trade | 359 (56.0%) | 282 (44.0%) |
| Retail Trade | 809 (68.3%) | 376 (31.7%) |
| Transportation & Warehousing | 581 (76.2%) | 181 (23.7%) |
| Utilities | 74 (64.3%) | 41 (35.6%) |
| Information | 115 (50.7%) | 112 (49.3%) |
| Finance & Insurance | 44 (15.3%) | 244 (84.7%) |
| Real Estate, Rental & Leasing | 101 (48.8%) | 106 (51.2%) |
| Professional & Scientific | 181 (37.2%) | 305 (62.8%) |
| Enterprise Management | 0 (0.0%) | 0 (0.0%) |
| Administrative & Support | 574 (53.4%) | 501 (46.6%) |
| Educational Services | 486 (40.1%) | 725 (59.9%) |
| Health Care & Social Assistance | 538 (25.1%) | 1,608 (74.9%) |
| Arts, Entertainment & Recreation | 133 (38.1%) | 216 (61.9%) |
| Accommodation & Food Services | 350 (35.7%) | 631 (64.3%) |
| Public Administration | 329 (47.0%) | 371 (53.0%) |
| Total | 8,792 (57.7%) | 6,451 (42.3%) |
Education in South Valley
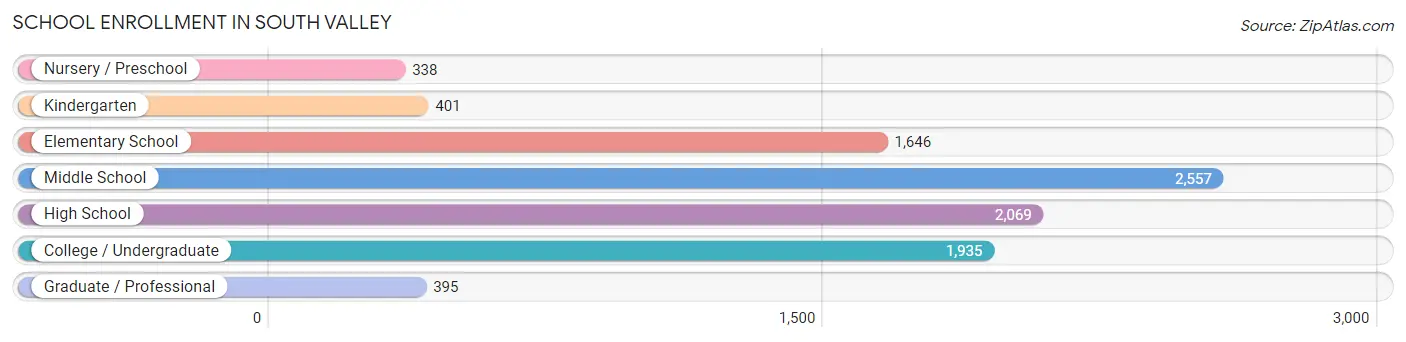
School Enrollment in South Valley
The most common levels of schooling among the 9,341 students in South Valley are middle school (2,557 | 27.4%), high school (2,069 | 22.2%), and college / undergraduate (1,935 | 20.7%).
| School Level | # Students | % Students |
| Nursery / Preschool | 338 | 3.6% |
| Kindergarten | 401 | 4.3% |
| Elementary School | 1,646 | 17.6% |
| Middle School | 2,557 | 27.4% |
| High School | 2,069 | 22.2% |
| College / Undergraduate | 1,935 | 20.7% |
| Graduate / Professional | 395 | 4.2% |
| Total | 9,341 | 100.0% |
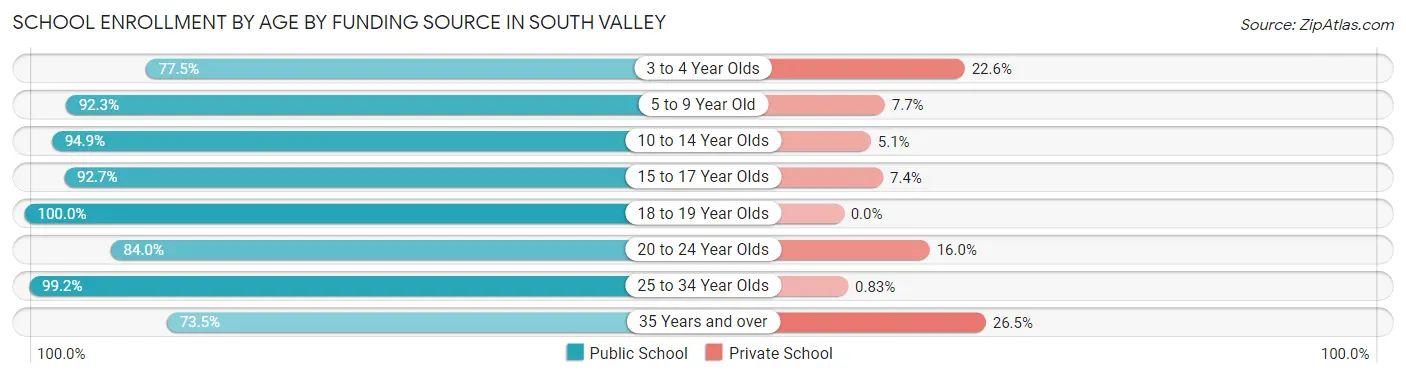
School Enrollment by Age by Funding Source in South Valley
Out of a total of 9,341 students who are enrolled in schools in South Valley, 794 (8.5%) attend a private institution, while the remaining 8,547 (91.5%) are enrolled in public schools. The age group of 35 years and over has the highest likelihood of being enrolled in private schools, with 193 (26.5% in the age bracket) enrolled. Conversely, the age group of 18 to 19 year olds has the lowest likelihood of being enrolled in a private school, with 577 (100.0% in the age bracket) attending a public institution.
| Age Bracket | Public School | Private School |
| 3 to 4 Year Olds | 213 (77.4%) | 62 (22.6%) |
| 5 to 9 Year Old | 1,891 (92.3%) | 157 (7.7%) |
| 10 to 14 Year Olds | 2,816 (94.9%) | 150 (5.1%) |
| 15 to 17 Year Olds | 1,286 (92.6%) | 102 (7.3%) |
| 18 to 19 Year Olds | 577 (100.0%) | 0 (0.0%) |
| 20 to 24 Year Olds | 634 (84.0%) | 121 (16.0%) |
| 25 to 34 Year Olds | 598 (99.2%) | 5 (0.8%) |
| 35 Years and over | 536 (73.5%) | 193 (26.5%) |
| Total | 8,547 (91.5%) | 794 (8.5%) |
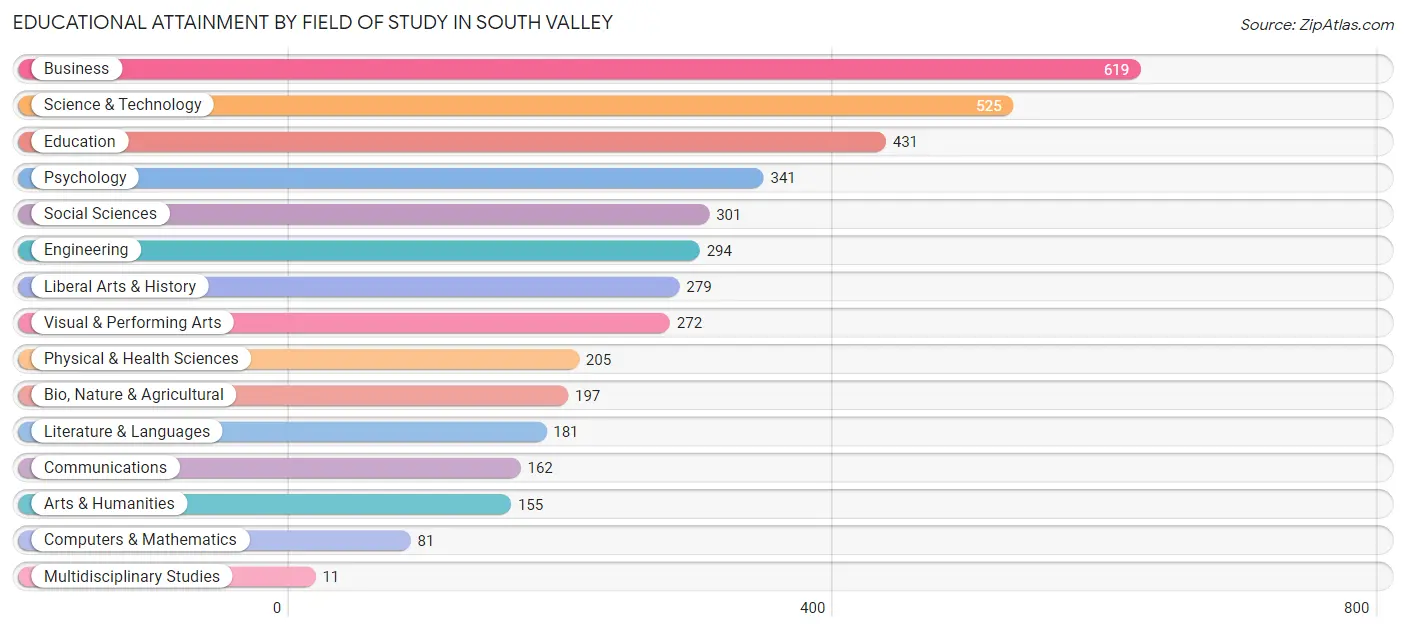
Educational Attainment by Field of Study in South Valley
Business (619 | 15.3%), science & technology (525 | 13.0%), education (431 | 10.6%), psychology (341 | 8.4%), and social sciences (301 | 7.4%) are the most common fields of study among 4,054 individuals in South Valley who have obtained a bachelor's degree or higher.
| Field of Study | # Graduates | % Graduates |
| Computers & Mathematics | 81 | 2.0% |
| Bio, Nature & Agricultural | 197 | 4.9% |
| Physical & Health Sciences | 205 | 5.1% |
| Psychology | 341 | 8.4% |
| Social Sciences | 301 | 7.4% |
| Engineering | 294 | 7.2% |
| Multidisciplinary Studies | 11 | 0.3% |
| Science & Technology | 525 | 13.0% |
| Business | 619 | 15.3% |
| Education | 431 | 10.6% |
| Literature & Languages | 181 | 4.5% |
| Liberal Arts & History | 279 | 6.9% |
| Visual & Performing Arts | 272 | 6.7% |
| Communications | 162 | 4.0% |
| Arts & Humanities | 155 | 3.8% |
| Total | 4,054 | 100.0% |
Transportation & Commute in South Valley
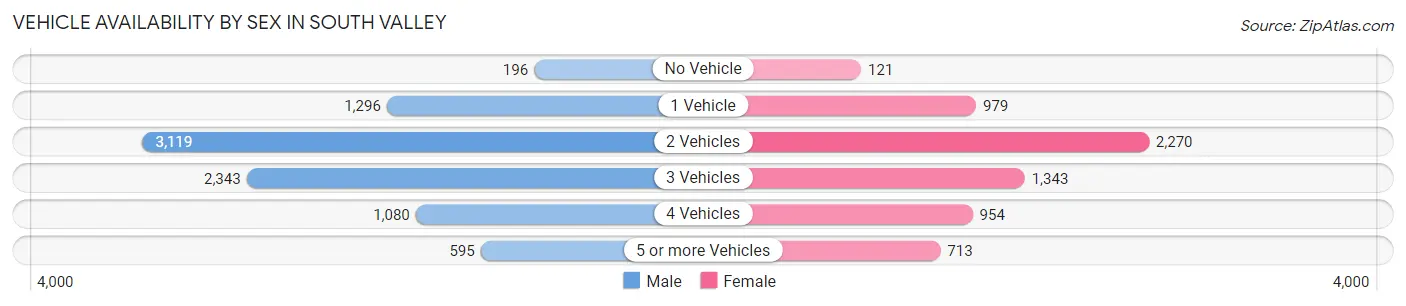
Vehicle Availability by Sex in South Valley
The most prevalent vehicle ownership categories in South Valley are males with 2 vehicles (3,119, accounting for 36.1%) and females with 2 vehicles (2,270, making up 48.9%).
| Vehicles Available | Male | Female |
| No Vehicle | 196 (2.3%) | 121 (1.9%) |
| 1 Vehicle | 1,296 (15.0%) | 979 (15.3%) |
| 2 Vehicles | 3,119 (36.1%) | 2,270 (35.6%) |
| 3 Vehicles | 2,343 (27.2%) | 1,343 (21.0%) |
| 4 Vehicles | 1,080 (12.5%) | 954 (14.9%) |
| 5 or more Vehicles | 595 (6.9%) | 713 (11.2%) |
| Total | 8,629 (100.0%) | 6,380 (100.0%) |
Commute Time in South Valley
The most frequently occuring commute durations in South Valley are 20 to 24 minutes (2,890 commuters, 20.6%), 30 to 34 minutes (2,420 commuters, 17.3%), and 15 to 19 minutes (2,393 commuters, 17.1%).
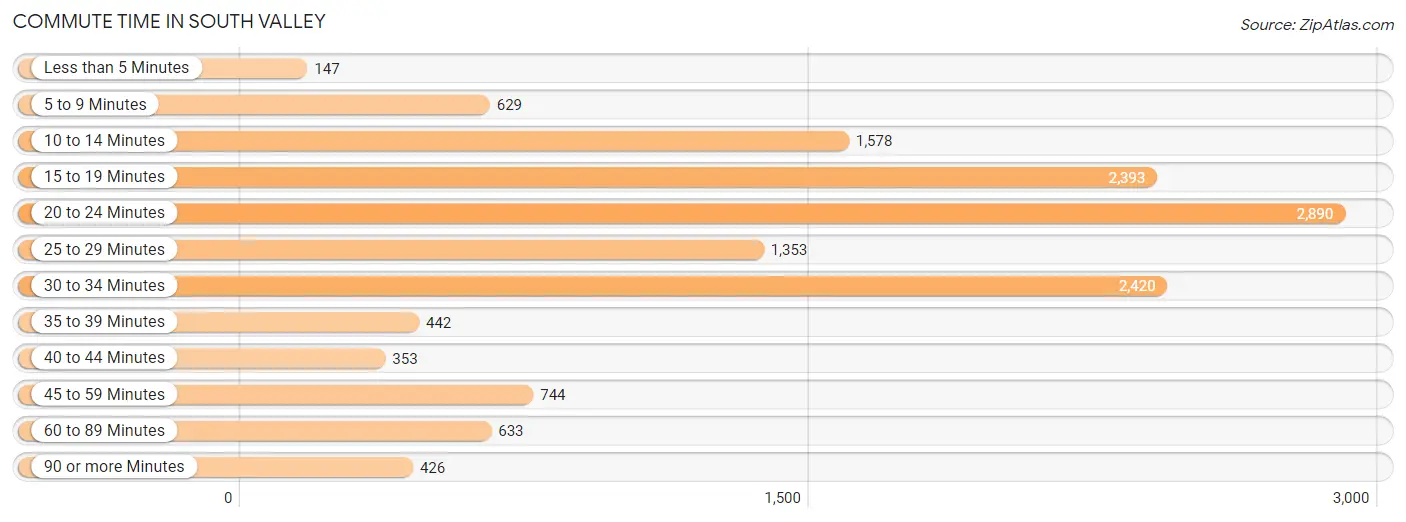
| Commute Time | # Commuters | % Commuters |
| Less than 5 Minutes | 147 | 1.1% |
| 5 to 9 Minutes | 629 | 4.5% |
| 10 to 14 Minutes | 1,578 | 11.3% |
| 15 to 19 Minutes | 2,393 | 17.1% |
| 20 to 24 Minutes | 2,890 | 20.6% |
| 25 to 29 Minutes | 1,353 | 9.7% |
| 30 to 34 Minutes | 2,420 | 17.3% |
| 35 to 39 Minutes | 442 | 3.2% |
| 40 to 44 Minutes | 353 | 2.5% |
| 45 to 59 Minutes | 744 | 5.3% |
| 60 to 89 Minutes | 633 | 4.5% |
| 90 or more Minutes | 426 | 3.0% |
Commute Time by Sex in South Valley
The most common commute times in South Valley are 20 to 24 minutes (1,985 commuters, 24.1%) for males and 30 to 34 minutes (1,159 commuters, 20.1%) for females.
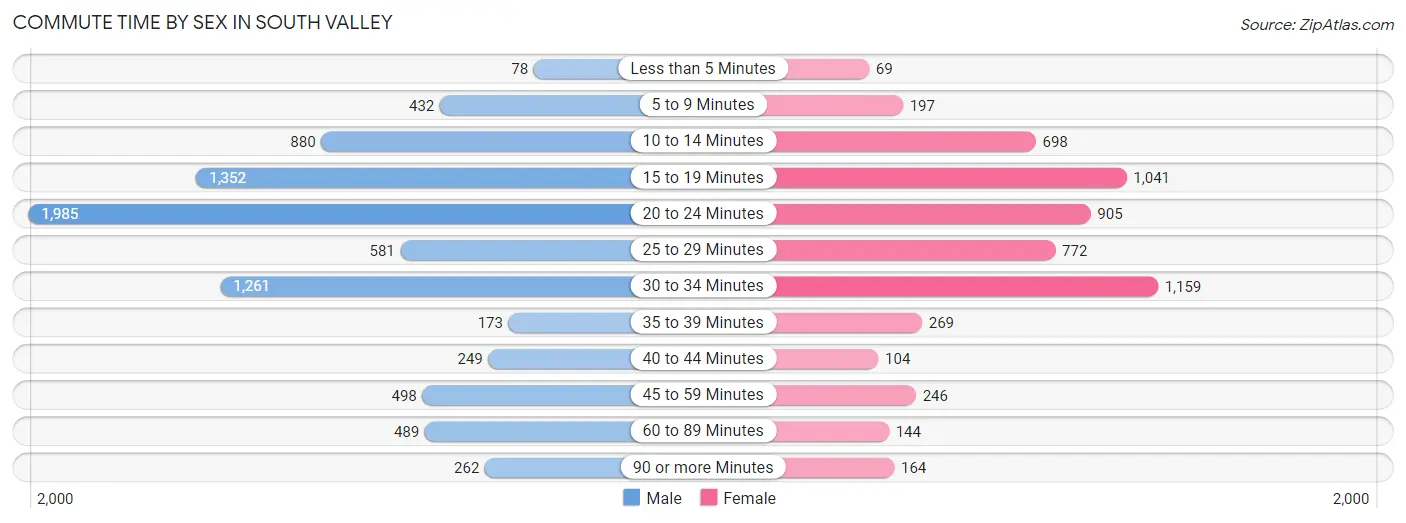
| Commute Time | Male | Female |
| Less than 5 Minutes | 78 (0.9%) | 69 (1.2%) |
| 5 to 9 Minutes | 432 (5.2%) | 197 (3.4%) |
| 10 to 14 Minutes | 880 (10.7%) | 698 (12.1%) |
| 15 to 19 Minutes | 1,352 (16.4%) | 1,041 (18.0%) |
| 20 to 24 Minutes | 1,985 (24.1%) | 905 (15.7%) |
| 25 to 29 Minutes | 581 (7.0%) | 772 (13.4%) |
| 30 to 34 Minutes | 1,261 (15.3%) | 1,159 (20.1%) |
| 35 to 39 Minutes | 173 (2.1%) | 269 (4.7%) |
| 40 to 44 Minutes | 249 (3.0%) | 104 (1.8%) |
| 45 to 59 Minutes | 498 (6.0%) | 246 (4.3%) |
| 60 to 89 Minutes | 489 (5.9%) | 144 (2.5%) |
| 90 or more Minutes | 262 (3.2%) | 164 (2.8%) |
Time of Departure to Work by Sex in South Valley
The most frequent times of departure to work in South Valley are 7:00 AM to 7:29 AM (1,336, 16.2%) for males and 8:00 AM to 8:29 AM (976, 16.9%) for females.
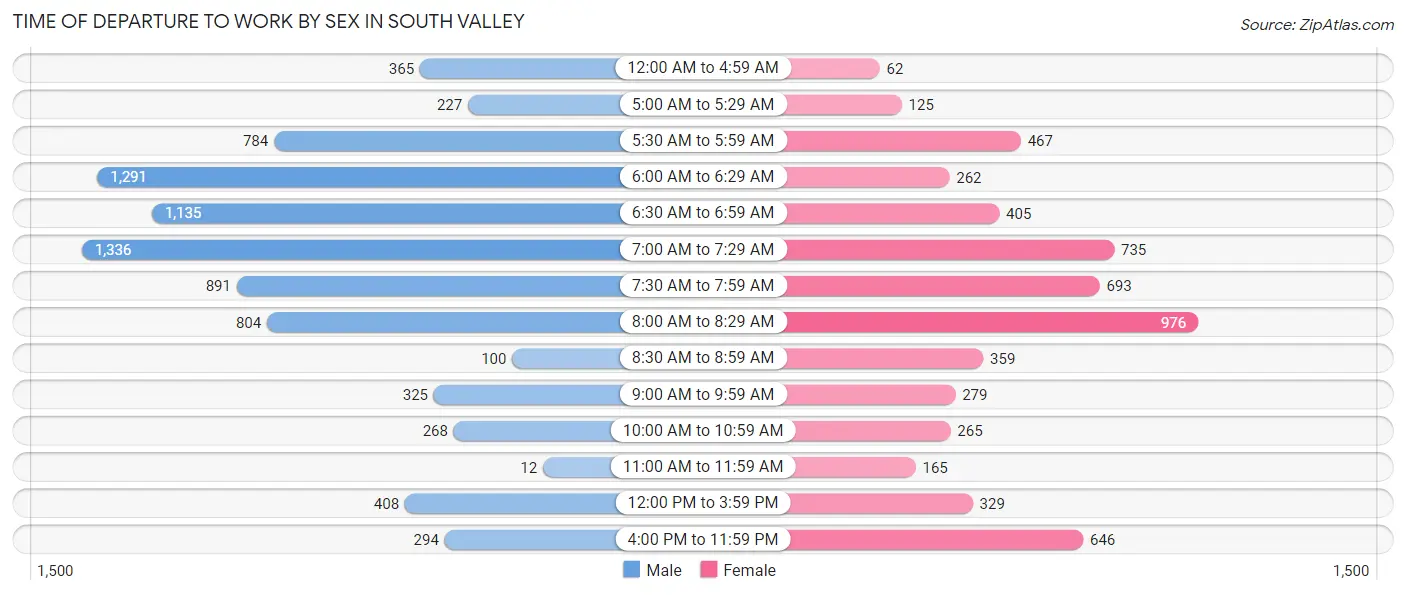
| Time of Departure | Male | Female |
| 12:00 AM to 4:59 AM | 365 (4.4%) | 62 (1.1%) |
| 5:00 AM to 5:29 AM | 227 (2.8%) | 125 (2.2%) |
| 5:30 AM to 5:59 AM | 784 (9.5%) | 467 (8.1%) |
| 6:00 AM to 6:29 AM | 1,291 (15.7%) | 262 (4.5%) |
| 6:30 AM to 6:59 AM | 1,135 (13.8%) | 405 (7.0%) |
| 7:00 AM to 7:29 AM | 1,336 (16.2%) | 735 (12.7%) |
| 7:30 AM to 7:59 AM | 891 (10.8%) | 693 (12.0%) |
| 8:00 AM to 8:29 AM | 804 (9.8%) | 976 (16.9%) |
| 8:30 AM to 8:59 AM | 100 (1.2%) | 359 (6.2%) |
| 9:00 AM to 9:59 AM | 325 (3.9%) | 279 (4.8%) |
| 10:00 AM to 10:59 AM | 268 (3.3%) | 265 (4.6%) |
| 11:00 AM to 11:59 AM | 12 (0.2%) | 165 (2.9%) |
| 12:00 PM to 3:59 PM | 408 (5.0%) | 329 (5.7%) |
| 4:00 PM to 11:59 PM | 294 (3.6%) | 646 (11.2%) |
| Total | 8,240 (100.0%) | 5,768 (100.0%) |
Housing Occupancy in South Valley
Occupancy by Ownership in South Valley
Of the total 13,161 dwellings in South Valley, owner-occupied units account for 9,429 (71.6%), while renter-occupied units make up 3,732 (28.4%).
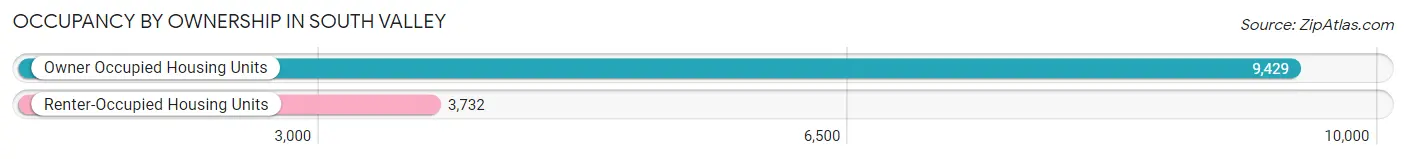
| Occupancy | # Housing Units | % Housing Units |
| Owner Occupied Housing Units | 9,429 | 71.6% |
| Renter-Occupied Housing Units | 3,732 | 28.4% |
| Total Occupied Housing Units | 13,161 | 100.0% |
Occupancy by Household Size in South Valley
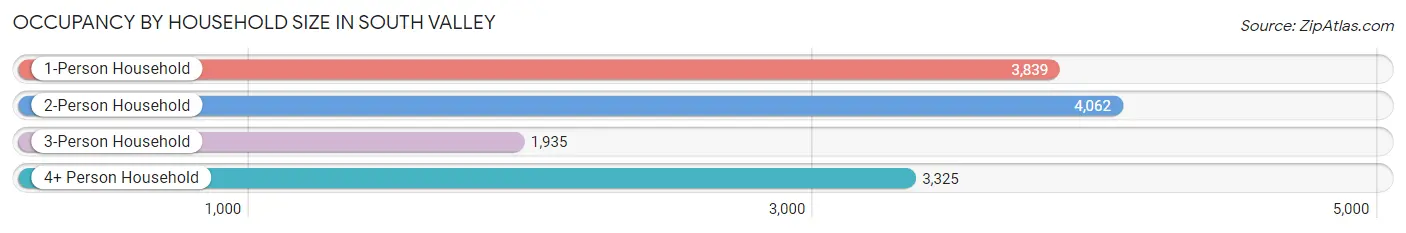
| Household Size | # Housing Units | % Housing Units |
| 1-Person Household | 3,839 | 29.2% |
| 2-Person Household | 4,062 | 30.9% |
| 3-Person Household | 1,935 | 14.7% |
| 4+ Person Household | 3,325 | 25.3% |
| Total Housing Units | 13,161 | 100.0% |
Occupancy by Ownership by Household Size in South Valley
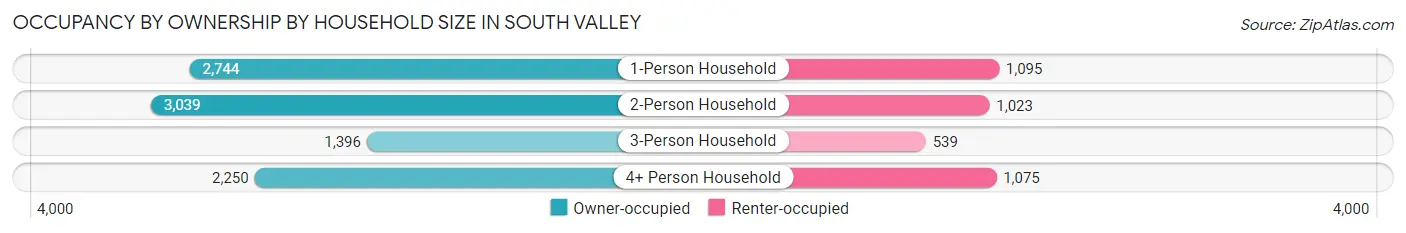
| Household Size | Owner-occupied | Renter-occupied |
| 1-Person Household | 2,744 (71.5%) | 1,095 (28.5%) |
| 2-Person Household | 3,039 (74.8%) | 1,023 (25.2%) |
| 3-Person Household | 1,396 (72.1%) | 539 (27.9%) |
| 4+ Person Household | 2,250 (67.7%) | 1,075 (32.3%) |
| Total Housing Units | 9,429 (71.6%) | 3,732 (28.4%) |
Occupancy by Educational Attainment in South Valley
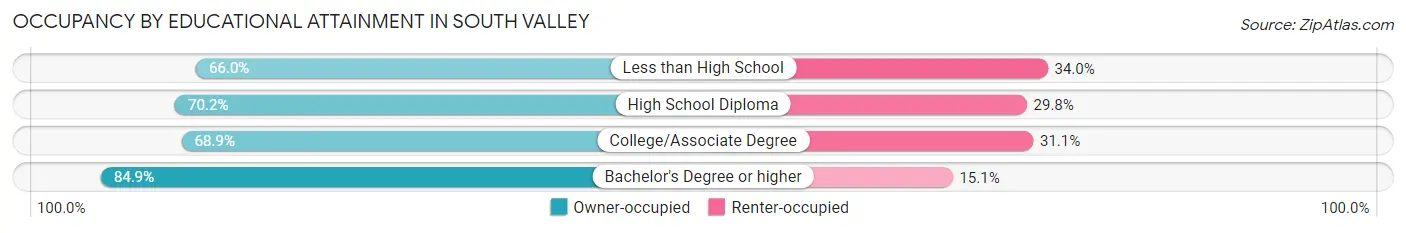
| Household Size | Owner-occupied | Renter-occupied |
| Less than High School | 1,700 (66.0%) | 875 (34.0%) |
| High School Diploma | 3,079 (70.2%) | 1,309 (29.8%) |
| College/Associate Degree | 2,631 (68.9%) | 1,188 (31.1%) |
| Bachelor's Degree or higher | 2,019 (84.9%) | 360 (15.1%) |
Occupancy by Age of Householder in South Valley
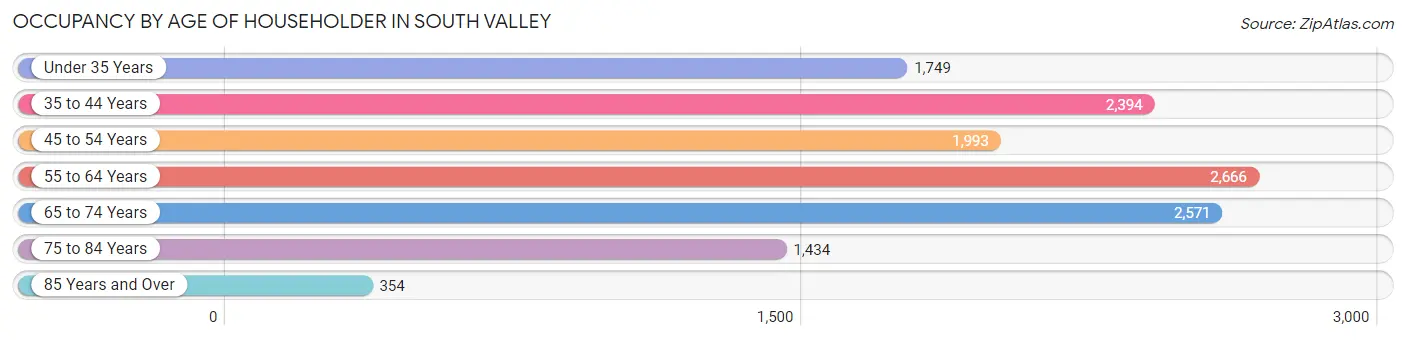
| Age Bracket | # Households | % Households |
| Under 35 Years | 1,749 | 13.3% |
| 35 to 44 Years | 2,394 | 18.2% |
| 45 to 54 Years | 1,993 | 15.1% |
| 55 to 64 Years | 2,666 | 20.3% |
| 65 to 74 Years | 2,571 | 19.5% |
| 75 to 84 Years | 1,434 | 10.9% |
| 85 Years and Over | 354 | 2.7% |
| Total | 13,161 | 100.0% |
Housing Finances in South Valley
Median Income by Occupancy in South Valley
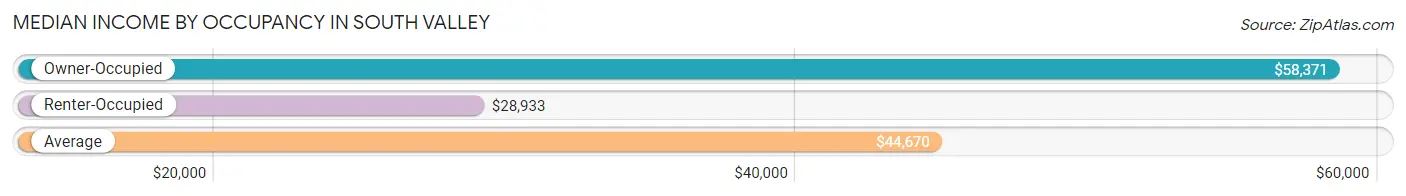
| Occupancy Type | # Households | Median Income |
| Owner-Occupied | 9,429 (71.6%) | $58,371 |
| Renter-Occupied | 3,732 (28.4%) | $28,933 |
| Average | 13,161 (100.0%) | $44,670 |
Occupancy by Householder Income Bracket in South Valley
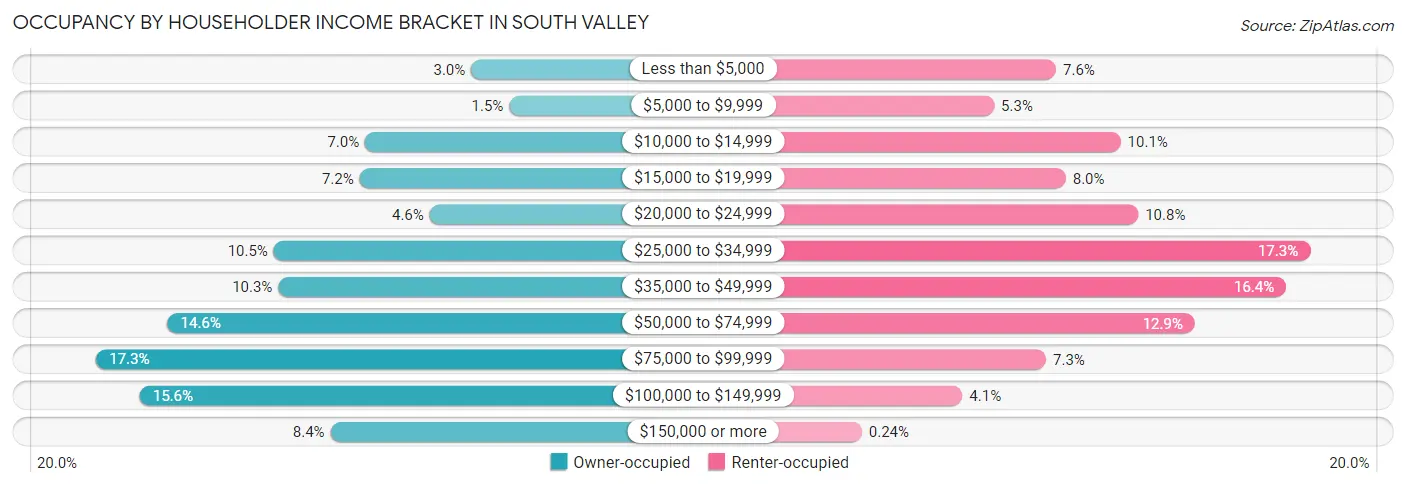
| Income Bracket | Owner-occupied | Renter-occupied |
| Less than $5,000 | 282 (3.0%) | 285 (7.6%) |
| $5,000 to $9,999 | 145 (1.5%) | 197 (5.3%) |
| $10,000 to $14,999 | 663 (7.0%) | 377 (10.1%) |
| $15,000 to $19,999 | 683 (7.2%) | 299 (8.0%) |
| $20,000 to $24,999 | 431 (4.6%) | 402 (10.8%) |
| $25,000 to $34,999 | 991 (10.5%) | 646 (17.3%) |
| $35,000 to $49,999 | 975 (10.3%) | 612 (16.4%) |
| $50,000 to $74,999 | 1,372 (14.5%) | 482 (12.9%) |
| $75,000 to $99,999 | 1,628 (17.3%) | 271 (7.3%) |
| $100,000 to $149,999 | 1,472 (15.6%) | 152 (4.1%) |
| $150,000 or more | 787 (8.4%) | 9 (0.2%) |
| Total | 9,429 (100.0%) | 3,732 (100.0%) |
Monthly Housing Cost Tiers in South Valley
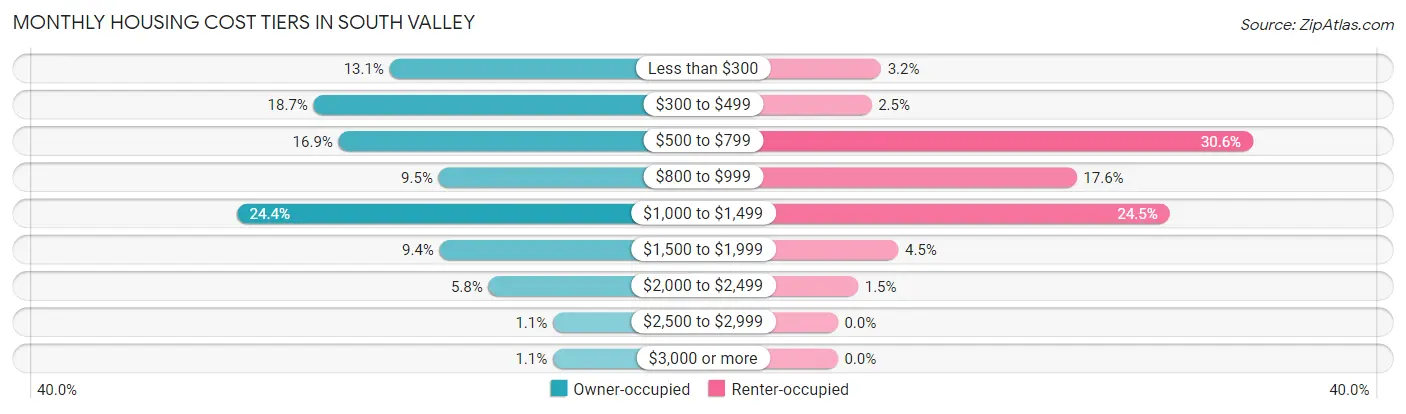
| Monthly Cost | Owner-occupied | Renter-occupied |
| Less than $300 | 1,236 (13.1%) | 119 (3.2%) |
| $300 to $499 | 1,764 (18.7%) | 93 (2.5%) |
| $500 to $799 | 1,591 (16.9%) | 1,142 (30.6%) |
| $800 to $999 | 896 (9.5%) | 657 (17.6%) |
| $1,000 to $1,499 | 2,299 (24.4%) | 913 (24.5%) |
| $1,500 to $1,999 | 889 (9.4%) | 167 (4.5%) |
| $2,000 to $2,499 | 550 (5.8%) | 56 (1.5%) |
| $2,500 to $2,999 | 102 (1.1%) | 0 (0.0%) |
| $3,000 or more | 102 (1.1%) | 0 (0.0%) |
| Total | 9,429 (100.0%) | 3,732 (100.0%) |
Physical Housing Characteristics in South Valley
Housing Structures in South Valley
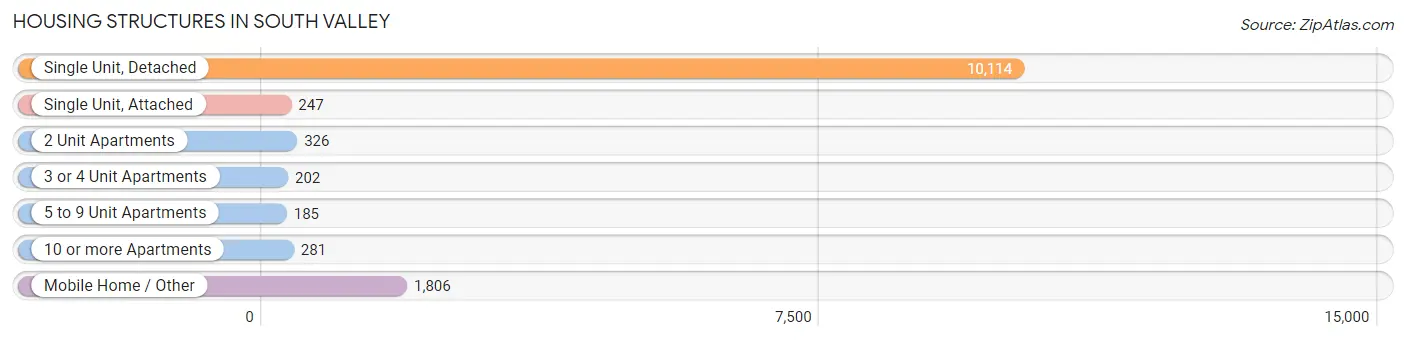
| Structure Type | # Housing Units | % Housing Units |
| Single Unit, Detached | 10,114 | 76.8% |
| Single Unit, Attached | 247 | 1.9% |
| 2 Unit Apartments | 326 | 2.5% |
| 3 or 4 Unit Apartments | 202 | 1.5% |
| 5 to 9 Unit Apartments | 185 | 1.4% |
| 10 or more Apartments | 281 | 2.1% |
| Mobile Home / Other | 1,806 | 13.7% |
| Total | 13,161 | 100.0% |
Housing Structures by Occupancy in South Valley
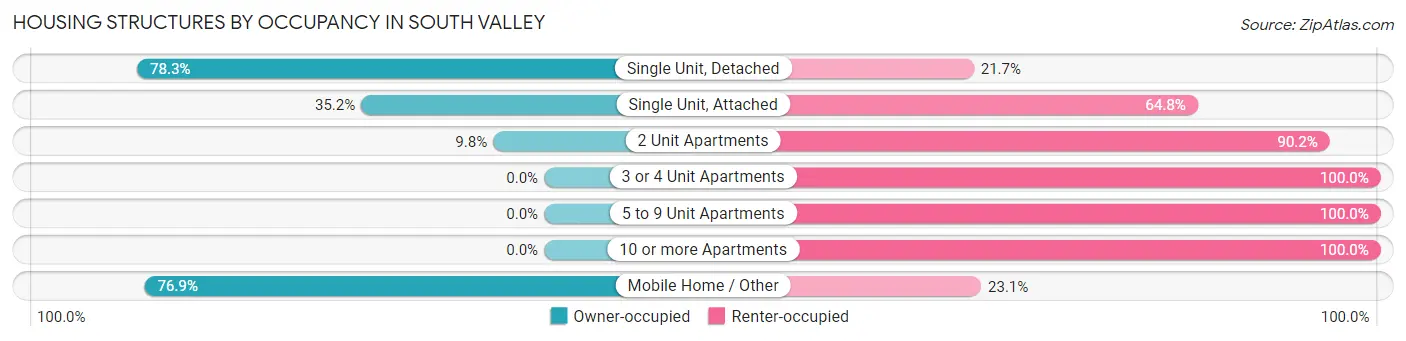
| Structure Type | Owner-occupied | Renter-occupied |
| Single Unit, Detached | 7,921 (78.3%) | 2,193 (21.7%) |
| Single Unit, Attached | 87 (35.2%) | 160 (64.8%) |
| 2 Unit Apartments | 32 (9.8%) | 294 (90.2%) |
| 3 or 4 Unit Apartments | 0 (0.0%) | 202 (100.0%) |
| 5 to 9 Unit Apartments | 0 (0.0%) | 185 (100.0%) |
| 10 or more Apartments | 0 (0.0%) | 281 (100.0%) |
| Mobile Home / Other | 1,389 (76.9%) | 417 (23.1%) |
| Total | 9,429 (71.6%) | 3,732 (28.4%) |
Housing Structures by Number of Rooms in South Valley
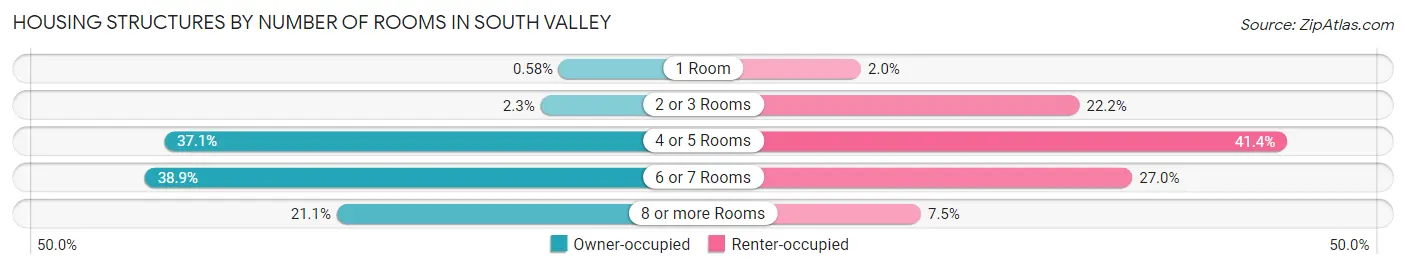
| Number of Rooms | Owner-occupied | Renter-occupied |
| 1 Room | 55 (0.6%) | 73 (2.0%) |
| 2 or 3 Rooms | 216 (2.3%) | 827 (22.2%) |
| 4 or 5 Rooms | 3,499 (37.1%) | 1,543 (41.3%) |
| 6 or 7 Rooms | 3,667 (38.9%) | 1,009 (27.0%) |
| 8 or more Rooms | 1,992 (21.1%) | 280 (7.5%) |
| Total | 9,429 (100.0%) | 3,732 (100.0%) |
Housing Structure by Heating Type in South Valley
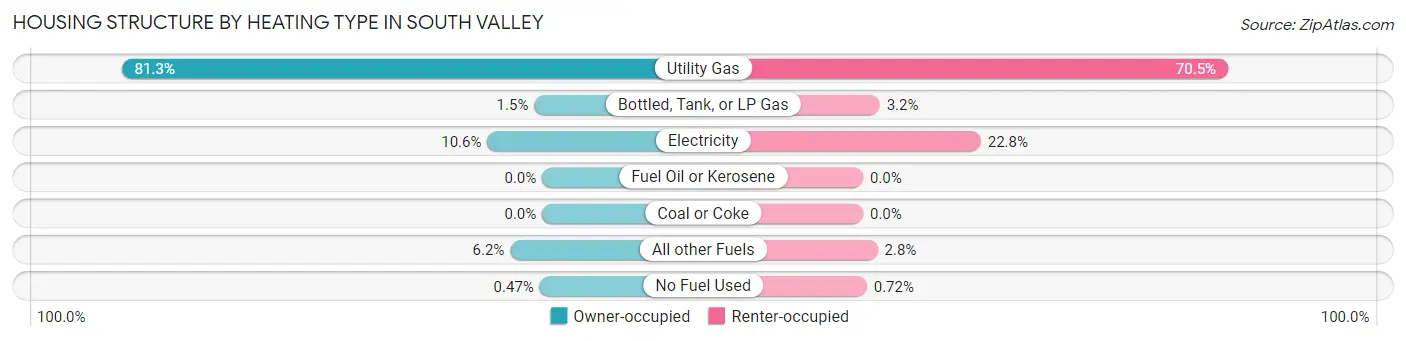
| Heating Type | Owner-occupied | Renter-occupied |
| Utility Gas | 7,662 (81.3%) | 2,631 (70.5%) |
| Bottled, Tank, or LP Gas | 143 (1.5%) | 120 (3.2%) |
| Electricity | 999 (10.6%) | 849 (22.8%) |
| Fuel Oil or Kerosene | 0 (0.0%) | 0 (0.0%) |
| Coal or Coke | 0 (0.0%) | 0 (0.0%) |
| All other Fuels | 581 (6.2%) | 105 (2.8%) |
| No Fuel Used | 44 (0.5%) | 27 (0.7%) |
| Total | 9,429 (100.0%) | 3,732 (100.0%) |
Household Vehicle Usage in South Valley
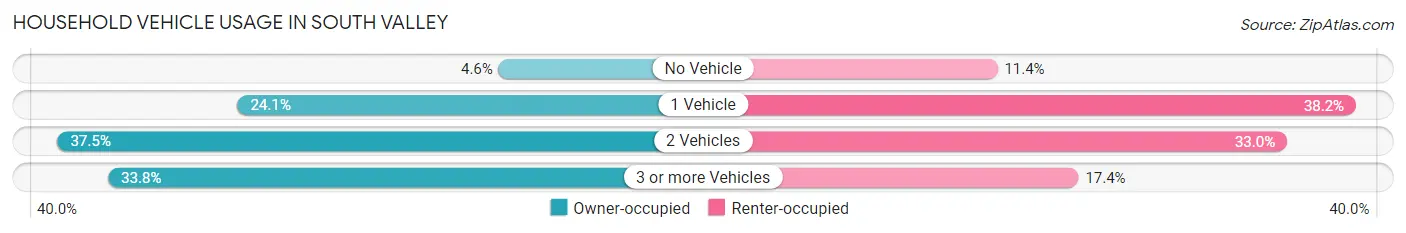
| Vehicles per Household | Owner-occupied | Renter-occupied |
| No Vehicle | 434 (4.6%) | 425 (11.4%) |
| 1 Vehicle | 2,272 (24.1%) | 1,424 (38.2%) |
| 2 Vehicles | 3,540 (37.5%) | 1,232 (33.0%) |
| 3 or more Vehicles | 3,183 (33.8%) | 651 (17.4%) |
| Total | 9,429 (100.0%) | 3,732 (100.0%) |
Real Estate & Mortgages in South Valley
Real Estate and Mortgage Overview in South Valley
| Characteristic | Without Mortgage | With Mortgage |
| Housing Units | 4,260 | 5,169 |
| Median Property Value | $165,100 | $198,300 |
| Median Household Income | $46,204 | $436 |
| Monthly Housing Costs | $388 | $93 |
| Real Estate Taxes | $1,330 | $246 |
Property Value by Mortgage Status in South Valley
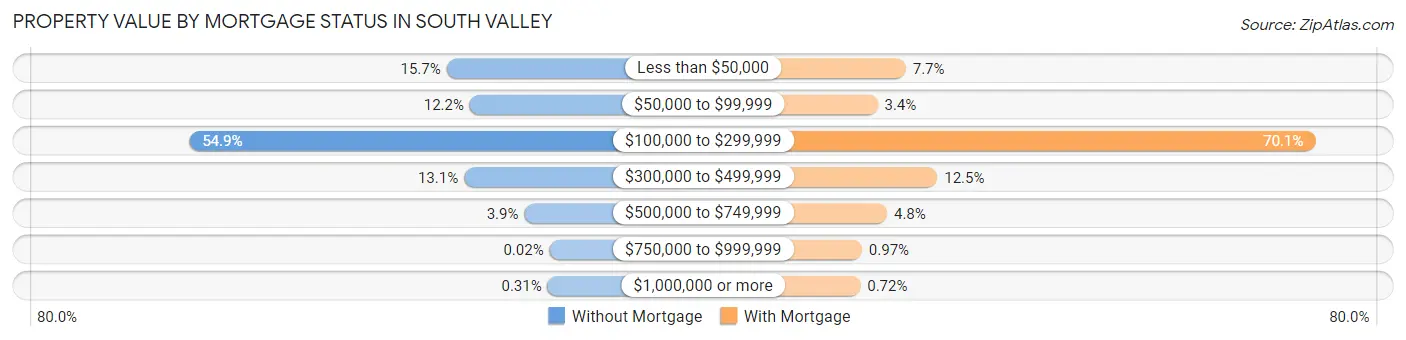
| Property Value | Without Mortgage | With Mortgage |
| Less than $50,000 | 669 (15.7%) | 396 (7.7%) |
| $50,000 to $99,999 | 518 (12.2%) | 173 (3.4%) |
| $100,000 to $299,999 | 2,339 (54.9%) | 3,621 (70.1%) |
| $300,000 to $499,999 | 556 (13.1%) | 644 (12.5%) |
| $500,000 to $749,999 | 164 (3.8%) | 248 (4.8%) |
| $750,000 to $999,999 | 1 (0.0%) | 50 (1.0%) |
| $1,000,000 or more | 13 (0.3%) | 37 (0.7%) |
| Total | 4,260 (100.0%) | 5,169 (100.0%) |
Household Income by Mortgage Status in South Valley
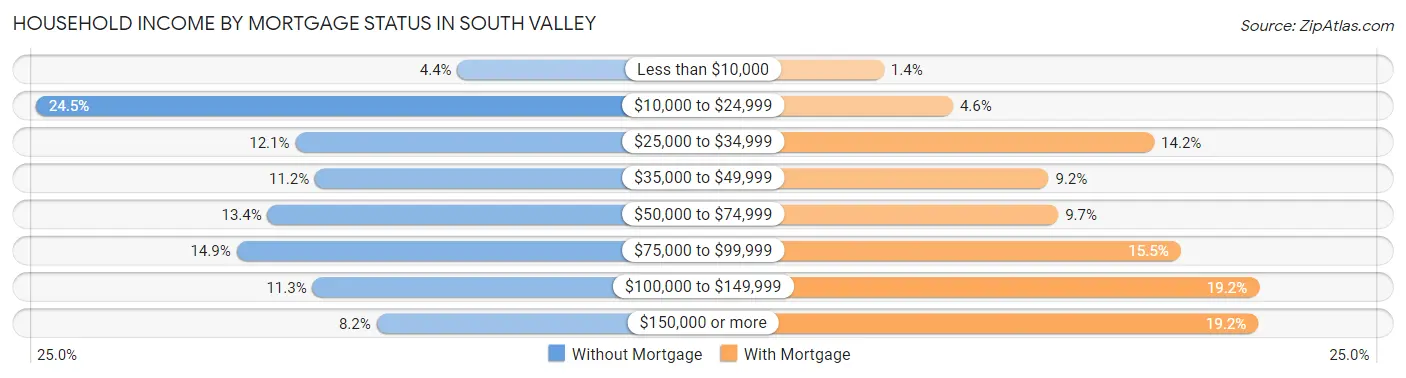
| Household Income | Without Mortgage | With Mortgage |
| Less than $10,000 | 187 (4.4%) | 70 (1.3%) |
| $10,000 to $24,999 | 1,042 (24.5%) | 240 (4.6%) |
| $25,000 to $34,999 | 516 (12.1%) | 735 (14.2%) |
| $35,000 to $49,999 | 476 (11.2%) | 475 (9.2%) |
| $50,000 to $74,999 | 572 (13.4%) | 499 (9.7%) |
| $75,000 to $99,999 | 635 (14.9%) | 800 (15.5%) |
| $100,000 to $149,999 | 481 (11.3%) | 993 (19.2%) |
| $150,000 or more | 351 (8.2%) | 991 (19.2%) |
| Total | 4,260 (100.0%) | 5,169 (100.0%) |
Property Value to Household Income Ratio in South Valley
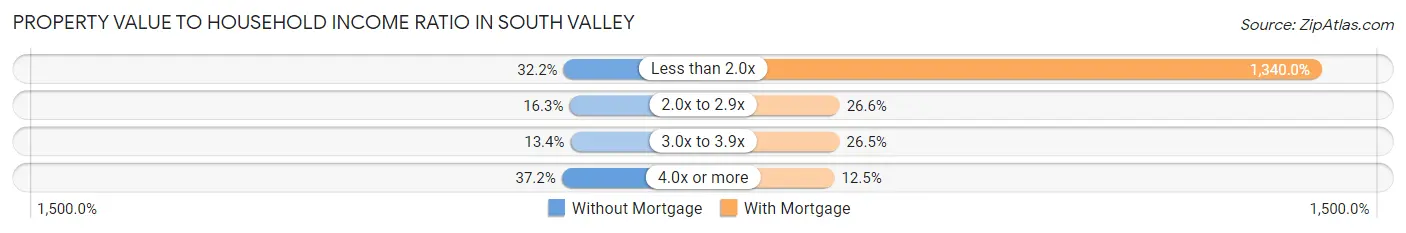
| Value-to-Income Ratio | Without Mortgage | With Mortgage |
| Less than 2.0x | 1,371 (32.2%) | 69,264 (1,340.0%) |
| 2.0x to 2.9x | 696 (16.3%) | 1,376 (26.6%) |
| 3.0x to 3.9x | 570 (13.4%) | 1,372 (26.5%) |
| 4.0x or more | 1,584 (37.2%) | 645 (12.5%) |
| Total | 4,260 (100.0%) | 5,169 (100.0%) |
Real Estate Taxes by Mortgage Status in South Valley
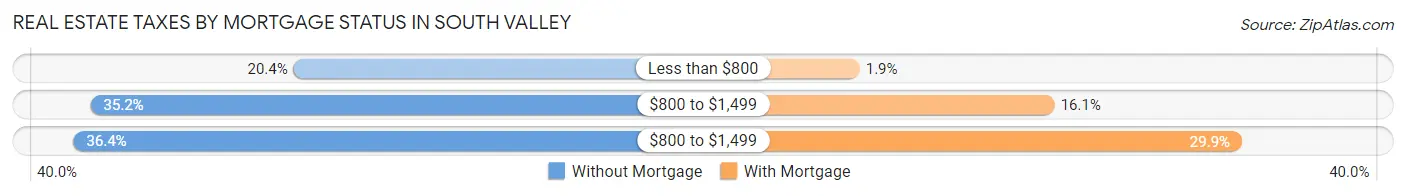
| Property Taxes | Without Mortgage | With Mortgage |
| Less than $800 | 867 (20.3%) | 97 (1.9%) |
| $800 to $1,499 | 1,499 (35.2%) | 833 (16.1%) |
| $800 to $1,499 | 1,552 (36.4%) | 1,544 (29.9%) |
| Total | 4,260 (100.0%) | 5,169 (100.0%) |
Health & Disability in South Valley
Health Insurance Coverage by Age in South Valley
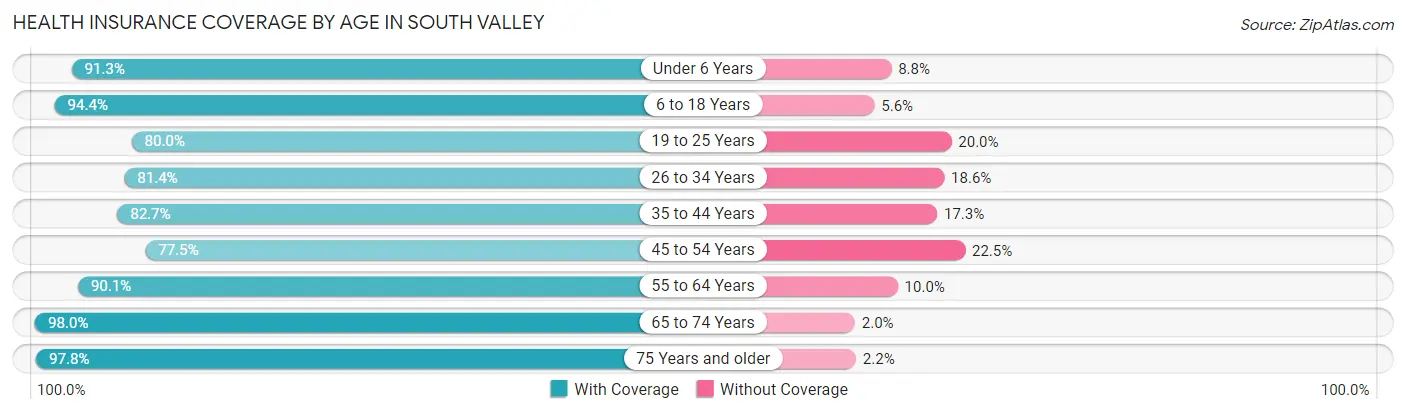
| Age Bracket | With Coverage | Without Coverage |
| Under 6 Years | 2,002 (91.2%) | 192 (8.7%) |
| 6 to 18 Years | 6,260 (94.4%) | 372 (5.6%) |
| 19 to 25 Years | 2,803 (80.0%) | 699 (20.0%) |
| 26 to 34 Years | 3,238 (81.4%) | 741 (18.6%) |
| 35 to 44 Years | 4,268 (82.7%) | 893 (17.3%) |
| 45 to 54 Years | 3,054 (77.5%) | 887 (22.5%) |
| 55 to 64 Years | 4,407 (90.0%) | 487 (10.0%) |
| 65 to 74 Years | 4,108 (98.0%) | 82 (2.0%) |
| 75 Years and older | 2,894 (97.8%) | 64 (2.2%) |
| Total | 33,034 (88.2%) | 4,417 (11.8%) |
Health Insurance Coverage by Citizenship Status in South Valley
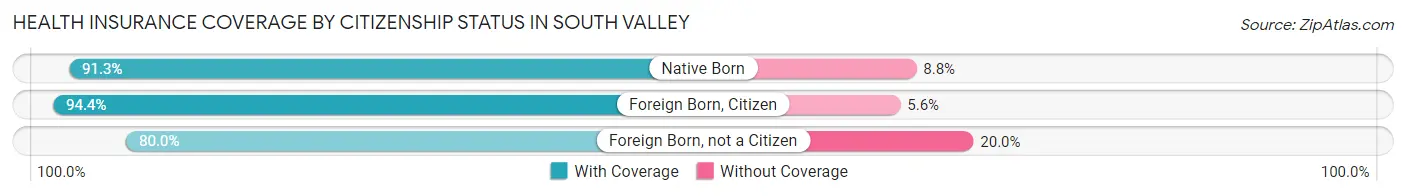
| Citizenship Status | With Coverage | Without Coverage |
| Native Born | 2,002 (91.2%) | 192 (8.7%) |
| Foreign Born, Citizen | 6,260 (94.4%) | 372 (5.6%) |
| Foreign Born, not a Citizen | 2,803 (80.0%) | 699 (20.0%) |
Health Insurance Coverage by Household Income in South Valley
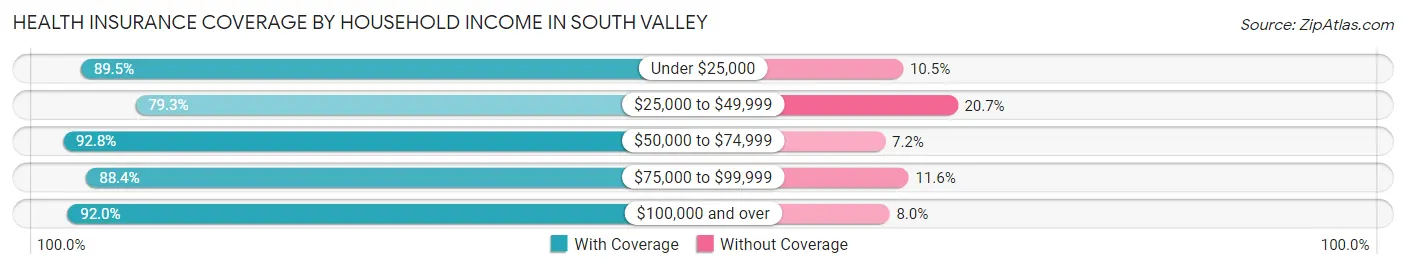
| Household Income | With Coverage | Without Coverage |
| Under $25,000 | 6,676 (89.5%) | 786 (10.5%) |
| $25,000 to $49,999 | 6,464 (79.3%) | 1,690 (20.7%) |
| $50,000 to $74,999 | 4,615 (92.8%) | 357 (7.2%) |
| $75,000 to $99,999 | 6,687 (88.4%) | 875 (11.6%) |
| $100,000 and over | 8,158 (92.0%) | 709 (8.0%) |
Public vs Private Health Insurance Coverage by Age in South Valley
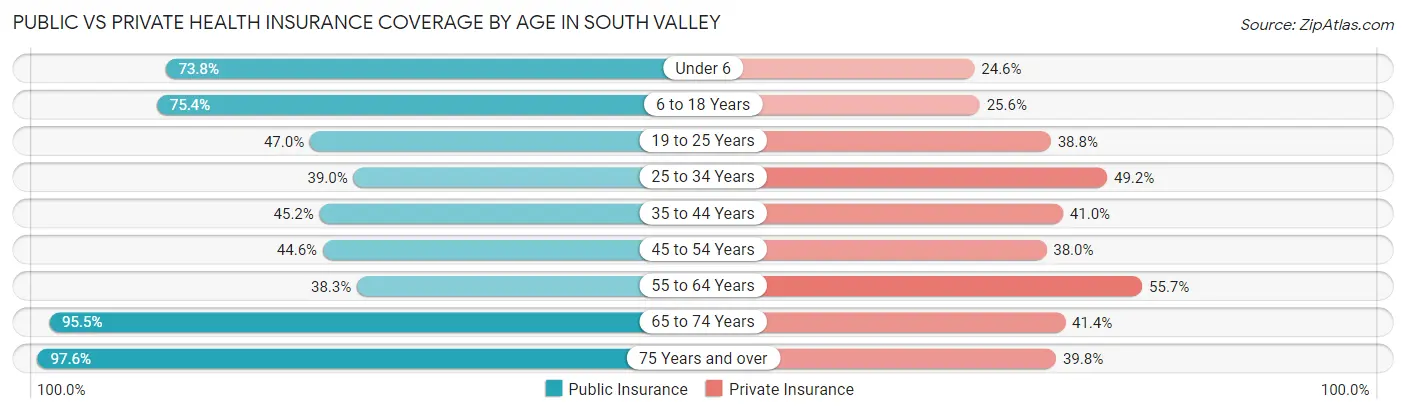
| Age Bracket | Public Insurance | Private Insurance |
| Under 6 | 1,620 (73.8%) | 540 (24.6%) |
| 6 to 18 Years | 5,003 (75.4%) | 1,698 (25.6%) |
| 19 to 25 Years | 1,647 (47.0%) | 1,358 (38.8%) |
| 25 to 34 Years | 1,550 (39.0%) | 1,959 (49.2%) |
| 35 to 44 Years | 2,335 (45.2%) | 2,118 (41.0%) |
| 45 to 54 Years | 1,759 (44.6%) | 1,496 (38.0%) |
| 55 to 64 Years | 1,874 (38.3%) | 2,728 (55.7%) |
| 65 to 74 Years | 4,000 (95.5%) | 1,736 (41.4%) |
| 75 Years and over | 2,886 (97.6%) | 1,176 (39.8%) |
| Total | 22,674 (60.5%) | 14,809 (39.5%) |
Disability Status by Sex by Age in South Valley
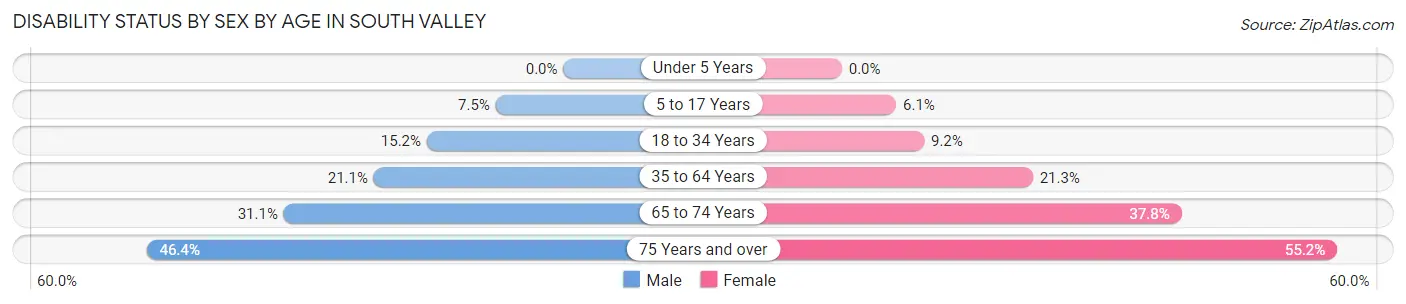
| Age Bracket | Male | Female |
| Under 5 Years | 0 (0.0%) | 0 (0.0%) |
| 5 to 17 Years | 241 (7.5%) | 208 (6.0%) |
| 18 to 34 Years | 597 (15.2%) | 349 (9.2%) |
| 35 to 64 Years | 1,558 (21.1%) | 1,406 (21.3%) |
| 65 to 74 Years | 610 (31.1%) | 844 (37.8%) |
| 75 Years and over | 667 (46.4%) | 839 (55.2%) |
Disability Class by Sex by Age in South Valley
Disability Class: Hearing Difficulty
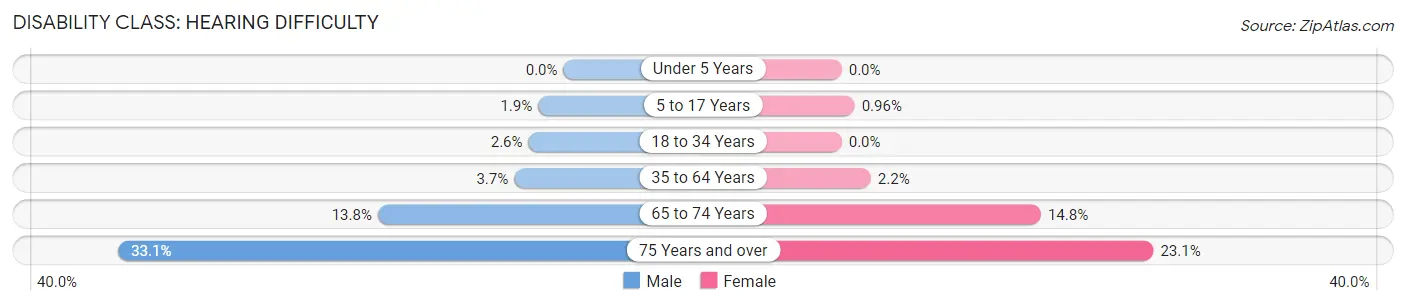
| Age Bracket | Male | Female |
| Under 5 Years | 0 (0.0%) | 0 (0.0%) |
| 5 to 17 Years | 60 (1.9%) | 33 (1.0%) |
| 18 to 34 Years | 102 (2.6%) | 0 (0.0%) |
| 35 to 64 Years | 270 (3.7%) | 143 (2.2%) |
| 65 to 74 Years | 270 (13.8%) | 330 (14.8%) |
| 75 Years and over | 475 (33.1%) | 352 (23.1%) |
Disability Class: Vision Difficulty
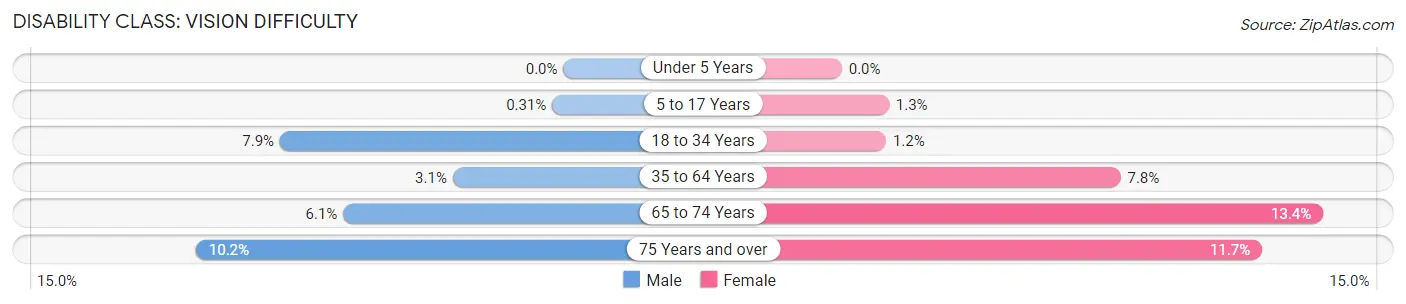
| Age Bracket | Male | Female |
| Under 5 Years | 0 (0.0%) | 0 (0.0%) |
| 5 to 17 Years | 10 (0.3%) | 45 (1.3%) |
| 18 to 34 Years | 310 (7.9%) | 47 (1.2%) |
| 35 to 64 Years | 227 (3.1%) | 513 (7.8%) |
| 65 to 74 Years | 120 (6.1%) | 299 (13.4%) |
| 75 Years and over | 147 (10.2%) | 178 (11.7%) |
Disability Class: Cognitive Difficulty
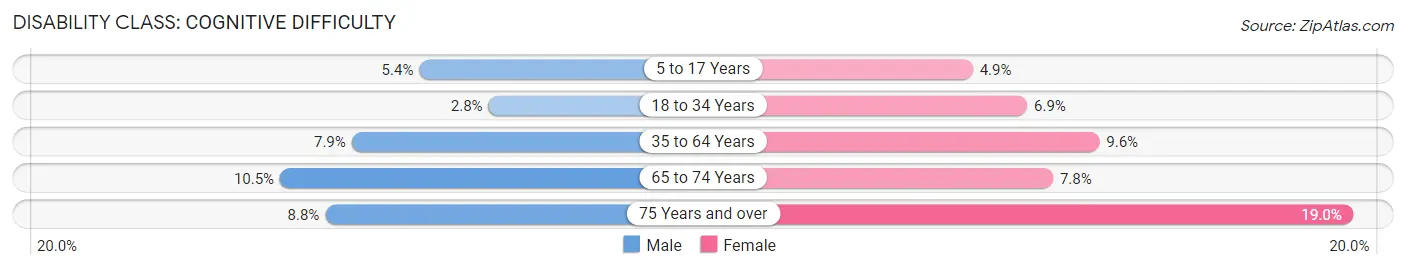
| Age Bracket | Male | Female |
| 5 to 17 Years | 171 (5.3%) | 167 (4.9%) |
| 18 to 34 Years | 109 (2.8%) | 262 (6.9%) |
| 35 to 64 Years | 580 (7.9%) | 632 (9.6%) |
| 65 to 74 Years | 206 (10.5%) | 175 (7.8%) |
| 75 Years and over | 127 (8.8%) | 289 (19.0%) |
Disability Class: Ambulatory Difficulty
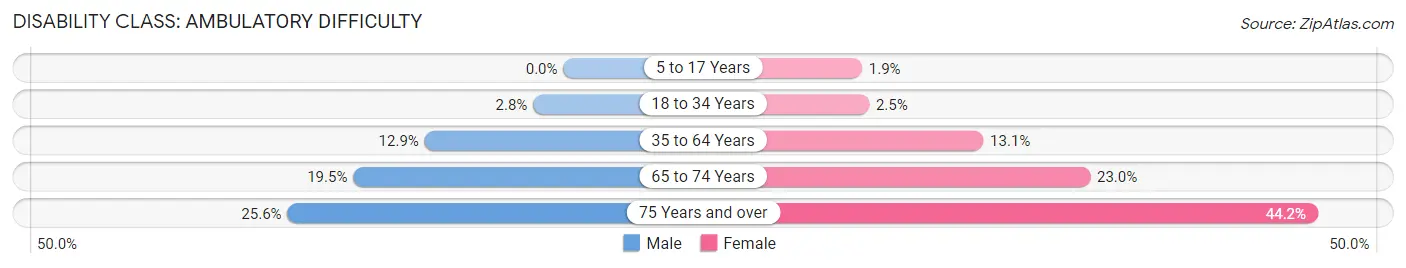
| Age Bracket | Male | Female |
| 5 to 17 Years | 0 (0.0%) | 64 (1.9%) |
| 18 to 34 Years | 110 (2.8%) | 96 (2.5%) |
| 35 to 64 Years | 950 (12.9%) | 868 (13.1%) |
| 65 to 74 Years | 382 (19.5%) | 514 (23.0%) |
| 75 Years and over | 368 (25.6%) | 672 (44.2%) |
Disability Class: Self-Care Difficulty
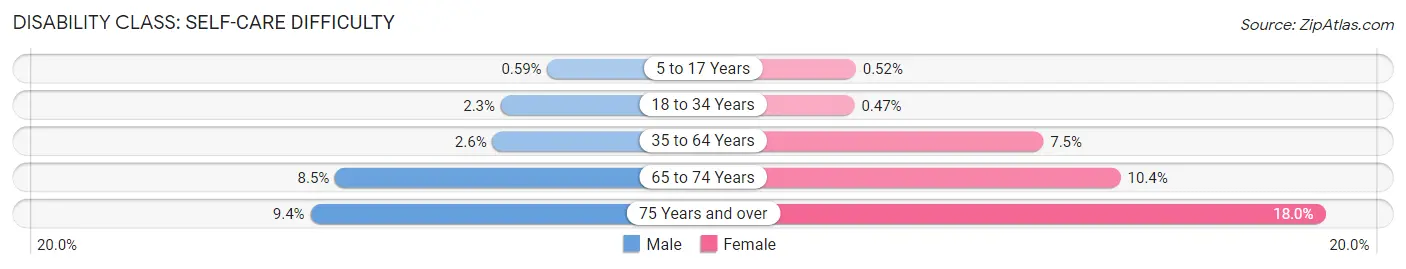
| Age Bracket | Male | Female |
| 5 to 17 Years | 19 (0.6%) | 18 (0.5%) |
| 18 to 34 Years | 91 (2.3%) | 18 (0.5%) |
| 35 to 64 Years | 194 (2.6%) | 495 (7.5%) |
| 65 to 74 Years | 166 (8.5%) | 231 (10.3%) |
| 75 Years and over | 135 (9.4%) | 273 (17.9%) |
Technology Access in South Valley
Computing Device Access in South Valley
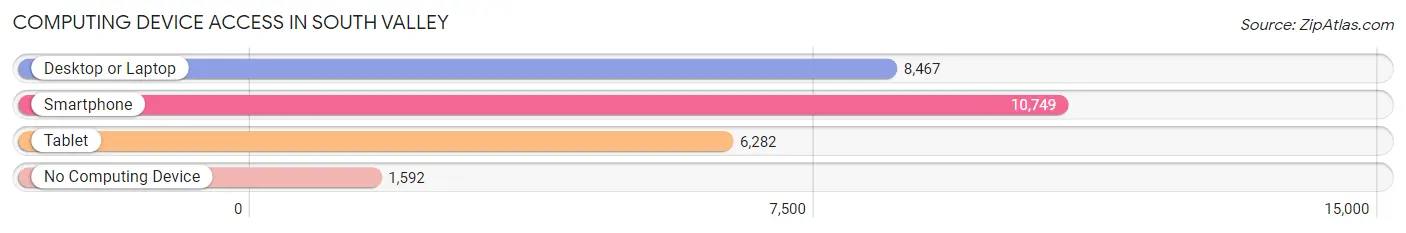
| Device Type | # Households | % Households |
| Desktop or Laptop | 8,467 | 64.3% |
| Smartphone | 10,749 | 81.7% |
| Tablet | 6,282 | 47.7% |
| No Computing Device | 1,592 | 12.1% |
| Total | 13,161 | 100.0% |
Internet Access in South Valley
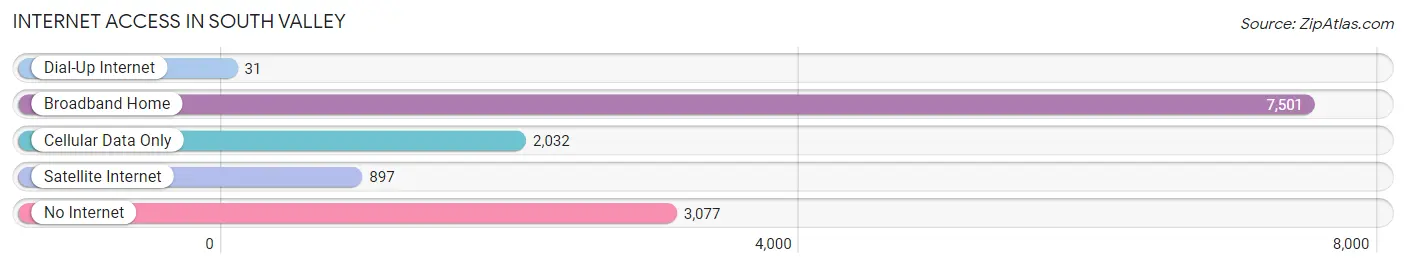
| Internet Type | # Households | % Households |
| Dial-Up Internet | 31 | 0.2% |
| Broadband Home | 7,501 | 57.0% |
| Cellular Data Only | 2,032 | 15.4% |
| Satellite Internet | 897 | 6.8% |
| No Internet | 3,077 | 23.4% |
| Total | 13,161 | 100.0% |
South Valley Summary
South Valley is a census-designated place (CDP) located in Bernalillo County, New Mexico, United States. It is part of the Albuquerque Metropolitan Statistical Area. The population was 28,743 at the 2010 census.
Geography
South Valley is located at 35°1′25″N 106°37′17″W (35.023750, -106.621389). According to the United States Census Bureau, the CDP has a total area of 8.3 square miles (21.5 km2), all land.
History
The area now known as South Valley was originally inhabited by the Pueblo Indians. The first European settlers arrived in the area in the late 1700s. The area was part of the Spanish land grant of Alameda de los Pobres, which was granted to Don Francisco Xavier Chávez in 1790. The area was later annexed by the United States in 1848 as part of the Treaty of Guadalupe Hidalgo.
In the late 1800s, the area was settled by farmers and ranchers. The area was known as the South Valley until the 1950s, when it was annexed by the City of Albuquerque.
Economy
South Valley is home to a variety of businesses, including retail stores, restaurants, and manufacturing plants. The area is also home to several industrial parks, including the South Valley Industrial Park and the South Valley Business Park.
The area is also home to several educational institutions, including the University of New Mexico, Central New Mexico Community College, and the South Valley Academy.
Demographics
As of the census of 2010, there were 28,743 people, 10,845 households, and 7,845 families residing in the CDP. The population density was 3,457.3 people per square mile (1,339.2/km2). There were 11,845 housing units at an average density of 1,427.3 per square mile (551.3/km2). The racial makeup of the CDP was 63.2% White, 2.3% African American, 1.2% Native American, 0.7% Asian, 0.1% Pacific Islander, 28.7% from other races, and 4.0% from two or more races. Hispanic or Latino of any race were 63.2% of the population.
There were 10,845 households, out of which 37.2% had children under the age of 18 living with them, 48.2% were married couples living together, 16.7% had a female householder with no husband present, and 28.2% were non-families. 22.2% of all households were made up of individuals, and 7.2% had someone living alone who was 65 years of age or older. The average household size was 2.67 and the average family size was 3.14.
In the CDP, the population was spread out, with 28.2% under the age of 18, 10.2% from 18 to 24, 29.7% from 25 to 44, 21.3% from 45 to 64, and 10.6% who were 65 years of age or older. The median age was 33 years. For every 100 females, there were 95.2 males. For every 100 females age 18 and over, there were 91.3 males.
The median income for a household in the CDP was $33,945, and the median income for a family was $37,945. Males had a median income of $30,945 versus $25,945 for females. The per capita income for the CDP was $15,945. About 14.2% of families and 17.2% of the population were below the poverty line, including 22.2% of those under age 18 and 11.2% of those age 65 or over.
Common Questions
What is Per Capita Income in South Valley?
Per Capita income in South Valley is $24,047.
What is the Median Family Income in South Valley?
Median Family Income in South Valley is $58,528.
What is the Median Household income in South Valley?
Median Household Income in South Valley is $44,670.
What is Income or Wage Gap in South Valley?
Income or Wage Gap in South Valley is 22.0%.
Women in South Valley earn 78.0 cents for every dollar earned by a man.
What is Family Income Deficit in South Valley?
Family Income Deficit in South Valley is $11,868.
Families that are below poverty line in South Valley earn $11,868 less on average than the poverty threshold level.
What is Inequality or Gini Index in South Valley?
Inequality or Gini Index in South Valley is 0.45.
What is the Total Population of South Valley?
Total Population of South Valley is 37,601.
What is the Total Male Population of South Valley?
Total Male Population of South Valley is 19,099.
What is the Total Female Population of South Valley?
Total Female Population of South Valley is 18,502.
What is the Ratio of Males per 100 Females in South Valley?
There are 103.23 Males per 100 Females in South Valley.
What is the Ratio of Females per 100 Males in South Valley?
There are 96.87 Females per 100 Males in South Valley.
What is the Median Population Age in South Valley?
Median Population Age in South Valley is 39.7 Years.
What is the Average Family Size in South Valley
Average Family Size in South Valley is 3.5 People.
What is the Average Household Size in South Valley
Average Household Size in South Valley is 2.8 People.
How Large is the Labor Force in South Valley?
There are 16,213 People in the Labor Forcein in South Valley.
What is the Percentage of People in the Labor Force in South Valley?
54.3% of People are in the Labor Force in South Valley.
What is the Unemployment Rate in South Valley?
Unemployment Rate in South Valley is 5.7%.