Guadalupe County, NM Map & Demographics
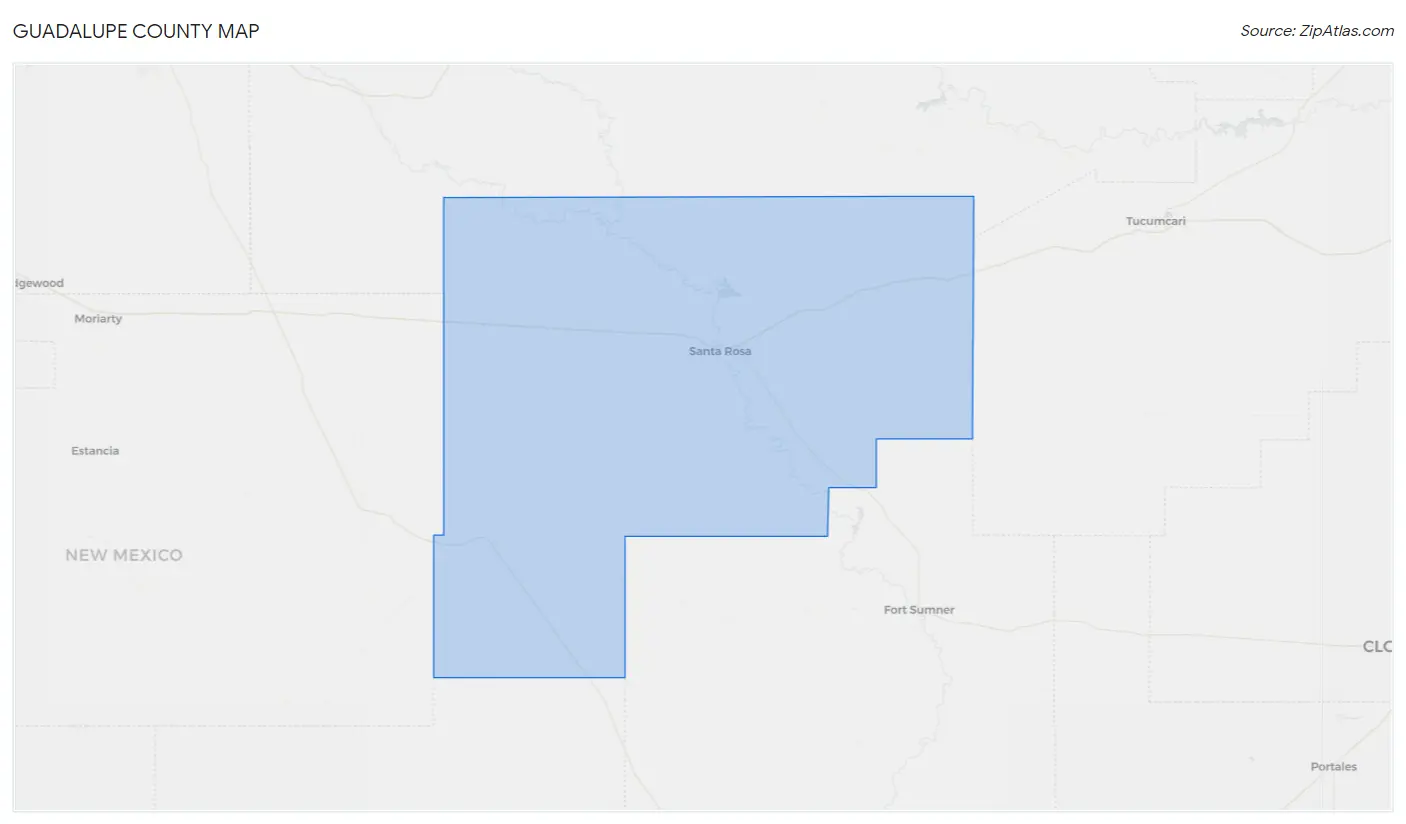
Guadalupe County Map
Guadalupe County Overview
$27,526
PER CAPITA INCOME
$50,650
AVG FAMILY INCOME
$38,713
AVG HOUSEHOLD INCOME
11.4%
WAGE / INCOME GAP [ % ]
88.6¢/ $1
WAGE / INCOME GAP [ $ ]
0.61
INEQUALITY / GINI INDEX
4,413
TOTAL POPULATION
2,590
MALE POPULATION
1,823
FEMALE POPULATION
142.07
MALES / 100 FEMALES
70.39
FEMALES / 100 MALES
43.0
MEDIAN AGE
4.0
AVG FAMILY SIZE
2.9
AVG HOUSEHOLD SIZE
1,813
LABOR FORCE [ PEOPLE ]
49.5%
PERCENT IN LABOR FORCE
9.8%
UNEMPLOYMENT RATE
Income in Guadalupe County
Income Overview in Guadalupe County
Per Capita Income in Guadalupe County is $27,526, while median incomes of families and households are $50,650 and $38,713 respectively.
| Characteristic | Number | Measure |
| Per Capita Income | 4,413 | $27,526 |
| Median Family Income | 807 | $50,650 |
| Mean Family Income | 807 | $116,026 |
| Median Household Income | 1,295 | $38,713 |
| Mean Household Income | 1,295 | $84,666 |
| Income Deficit | 807 | $0 |
| Wage / Income Gap (%) | 4,413 | 11.44% |
| Wage / Income Gap ($) | 4,413 | 88.56¢ per $1 |
| Gini / Inequality Index | 4,413 | 0.61 |
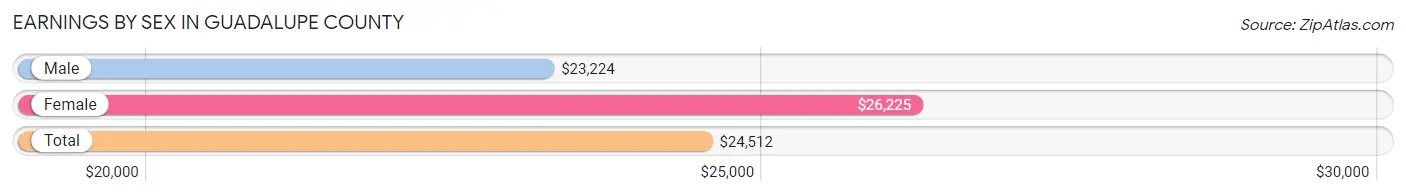
Earnings by Sex in Guadalupe County
Average Earnings in Guadalupe County are $24,512, $23,224 for men and $26,225 for women, a difference of 11.4%.
| Sex | Number | Average Earnings |
| Male | 1,036 (56.6%) | $23,224 |
| Female | 793 (43.4%) | $26,225 |
| Total | 1,829 (100.0%) | $24,512 |
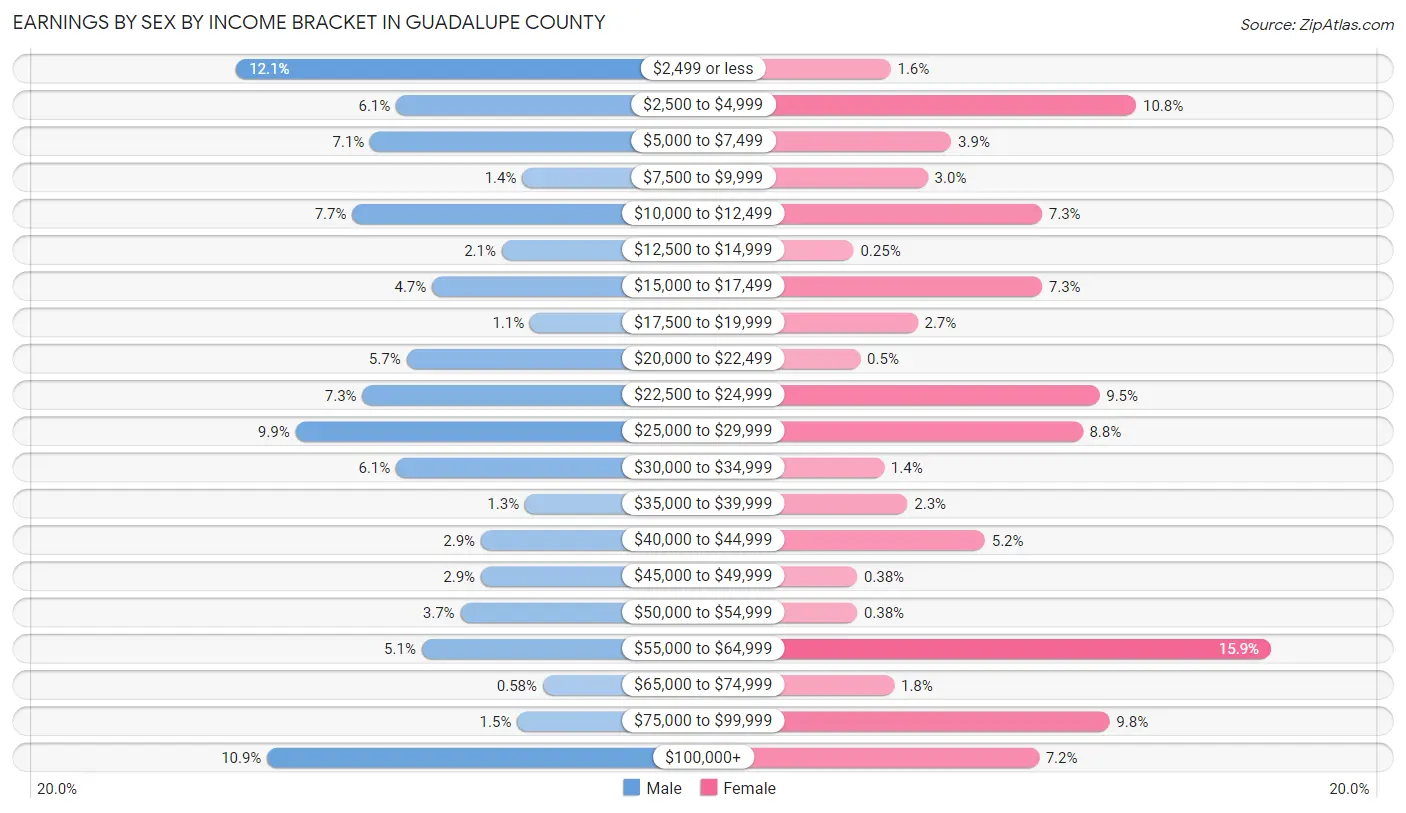
Earnings by Sex by Income Bracket in Guadalupe County
The most common earnings brackets in Guadalupe County are $2,499 or less for men (125 | 12.1%) and $55,000 to $64,999 for women (126 | 15.9%).
| Income | Male | Female |
| $2,499 or less | 125 (12.1%) | 13 (1.6%) |
| $2,500 to $4,999 | 63 (6.1%) | 86 (10.8%) |
| $5,000 to $7,499 | 73 (7.0%) | 31 (3.9%) |
| $7,500 to $9,999 | 14 (1.3%) | 24 (3.0%) |
| $10,000 to $12,499 | 80 (7.7%) | 58 (7.3%) |
| $12,500 to $14,999 | 22 (2.1%) | 2 (0.3%) |
| $15,000 to $17,499 | 49 (4.7%) | 58 (7.3%) |
| $17,500 to $19,999 | 11 (1.1%) | 21 (2.6%) |
| $20,000 to $22,499 | 59 (5.7%) | 4 (0.5%) |
| $22,500 to $24,999 | 76 (7.3%) | 75 (9.5%) |
| $25,000 to $29,999 | 102 (9.9%) | 70 (8.8%) |
| $30,000 to $34,999 | 63 (6.1%) | 11 (1.4%) |
| $35,000 to $39,999 | 13 (1.3%) | 18 (2.3%) |
| $40,000 to $44,999 | 30 (2.9%) | 41 (5.2%) |
| $45,000 to $49,999 | 30 (2.9%) | 3 (0.4%) |
| $50,000 to $54,999 | 38 (3.7%) | 3 (0.4%) |
| $55,000 to $64,999 | 53 (5.1%) | 126 (15.9%) |
| $65,000 to $74,999 | 6 (0.6%) | 14 (1.8%) |
| $75,000 to $99,999 | 16 (1.5%) | 78 (9.8%) |
| $100,000+ | 113 (10.9%) | 57 (7.2%) |
| Total | 1,036 (100.0%) | 793 (100.0%) |
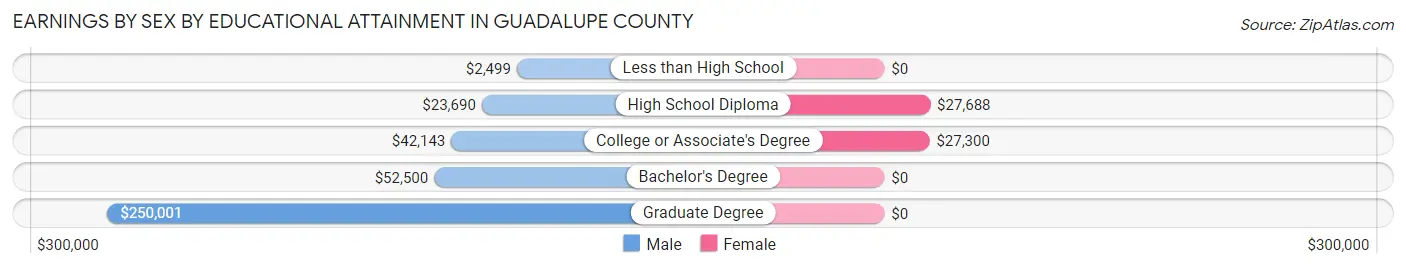
Earnings by Sex by Educational Attainment in Guadalupe County
Average earnings in Guadalupe County are $26,207 for men and $26,900 for women, a difference of 2.6%. Men with an educational attainment of graduate degree enjoy the highest average annual earnings of $250,001, while those with less than high school education earn the least with $2,499. Women with an educational attainment of high school diploma earn the most with the average annual earnings of $27,688, while those with college or associate's degree education have the smallest earnings of $27,300.
| Educational Attainment | Male Income | Female Income |
| Less than High School | $2,499 | $0 |
| High School Diploma | $23,690 | $27,688 |
| College or Associate's Degree | $42,143 | $27,300 |
| Bachelor's Degree | $52,500 | $0 |
| Graduate Degree | $250,001 | $0 |
| Total | $26,207 | $26,900 |
Family Income in Guadalupe County
Family Income Brackets in Guadalupe County
According to the Guadalupe County family income data, there are 147 families falling into the $200,000+ income range, which is the most common income bracket and makes up 18.2% of all families.
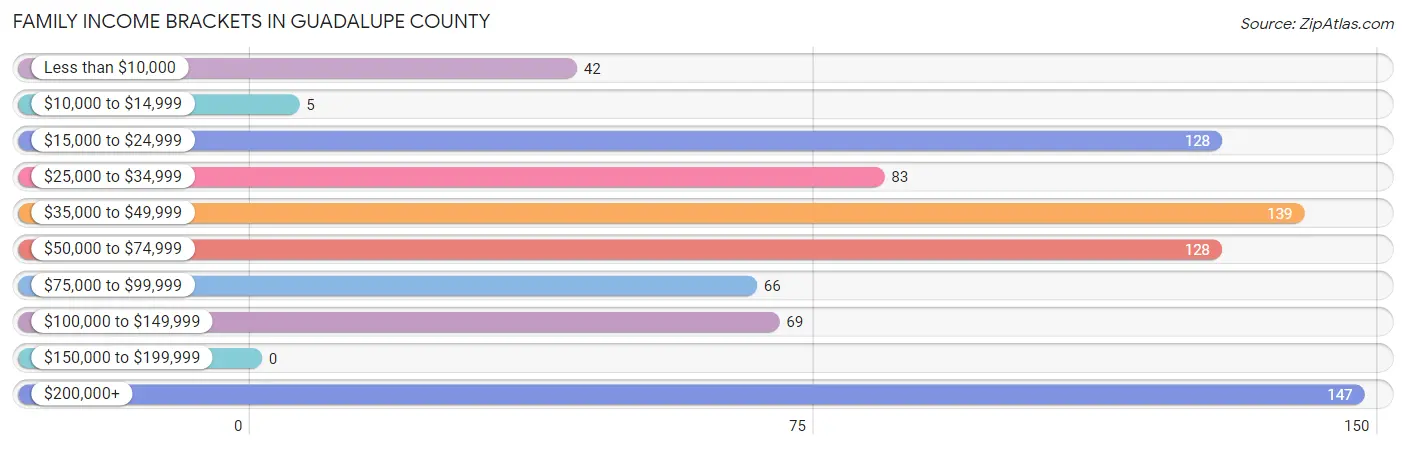
| Income Bracket | # Families | % Families |
| Less than $10,000 | 42 | 5.2% |
| $10,000 to $14,999 | 5 | 0.6% |
| $15,000 to $24,999 | 128 | 15.9% |
| $25,000 to $34,999 | 83 | 10.3% |
| $35,000 to $49,999 | 139 | 17.2% |
| $50,000 to $74,999 | 128 | 15.9% |
| $75,000 to $99,999 | 66 | 8.2% |
| $100,000 to $149,999 | 69 | 8.6% |
| $150,000 to $199,999 | 0 | 0.0% |
| $200,000+ | 147 | 18.2% |
Family Income by Famaliy Size in Guadalupe County
5-person families (77 | 9.5%) account for the highest median family income in Guadalupe County with $94,821 per family, while 2-person families (374 | 46.3%) have the highest median income of $22,708 per family member.
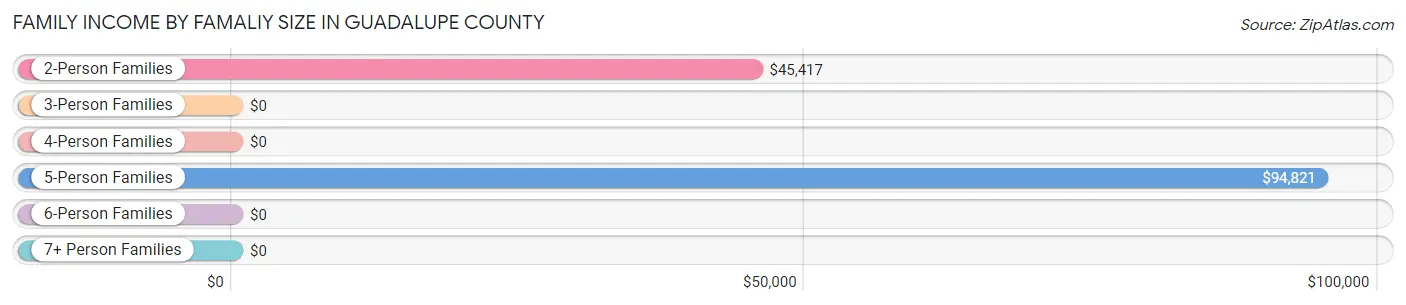
| Income Bracket | # Families | Median Income |
| 2-Person Families | 374 (46.3%) | $45,417 |
| 3-Person Families | 243 (30.1%) | $0 |
| 4-Person Families | 99 (12.3%) | $0 |
| 5-Person Families | 77 (9.5%) | $94,821 |
| 6-Person Families | 14 (1.7%) | $0 |
| 7+ Person Families | 0 (0.0%) | $0 |
| Total | 807 (100.0%) | $50,650 |
Family Income by Number of Earners in Guadalupe County
The median family income in Guadalupe County is $50,650, with families comprising 3+ earners (94) having the highest median family income of $250,001, while families with no earners (238) have the lowest median family income of $21,466, accounting for 11.7% and 29.5% of families, respectively.
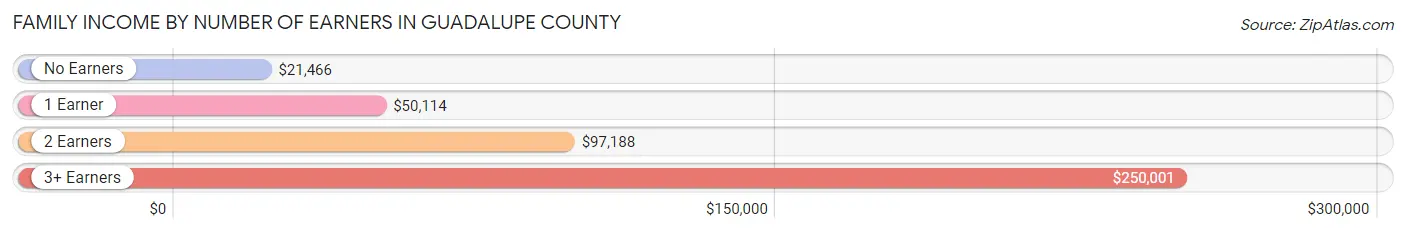
| Number of Earners | # Families | Median Income |
| No Earners | 238 (29.5%) | $21,466 |
| 1 Earner | 208 (25.8%) | $50,114 |
| 2 Earners | 267 (33.1%) | $97,188 |
| 3+ Earners | 94 (11.7%) | $250,001 |
| Total | 807 (100.0%) | $50,650 |
Household Income in Guadalupe County
Household Income Brackets in Guadalupe County
With 254 households falling in the category, the $35,000 to $49,999 income range is the most frequent in Guadalupe County, accounting for 19.6% of all households.
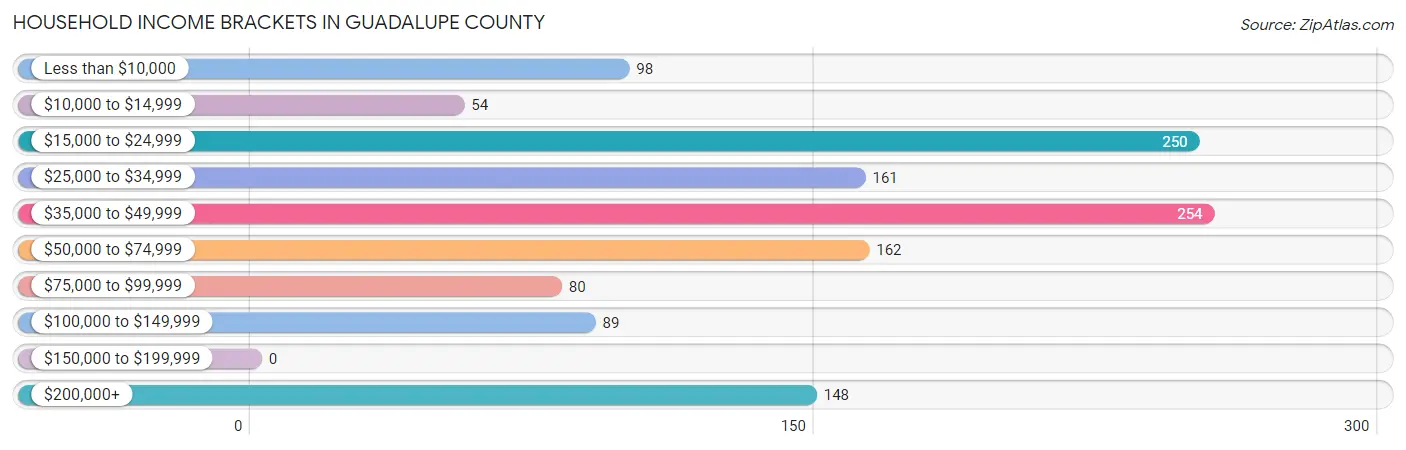
| Income Bracket | # Households | % Households |
| Less than $10,000 | 98 | 7.6% |
| $10,000 to $14,999 | 54 | 4.2% |
| $15,000 to $24,999 | 250 | 19.3% |
| $25,000 to $34,999 | 161 | 12.4% |
| $35,000 to $49,999 | 254 | 19.6% |
| $50,000 to $74,999 | 162 | 12.5% |
| $75,000 to $99,999 | 80 | 6.2% |
| $100,000 to $149,999 | 89 | 6.9% |
| $150,000 to $199,999 | 0 | 0.0% |
| $200,000+ | 148 | 11.4% |
Household Income by Householder Age in Guadalupe County
The median household income in Guadalupe County is $38,713, with the highest median household income of $47,125 found in the 25 to 44 years age bracket for the primary householder. A total of 231 households (17.8%) fall into this category. Meanwhile, the 65+ years age bracket for the primary householder has the lowest median household income of $30,714, with 486 households (37.5%) in this group.
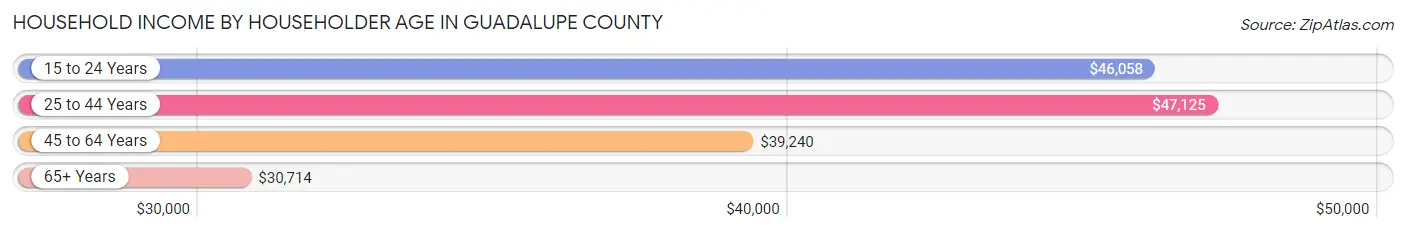
| Income Bracket | # Households | Median Income |
| 15 to 24 Years | 35 (2.7%) | $46,058 |
| 25 to 44 Years | 231 (17.8%) | $47,125 |
| 45 to 64 Years | 543 (41.9%) | $39,240 |
| 65+ Years | 486 (37.5%) | $30,714 |
| Total | 1,295 (100.0%) | $38,713 |
Poverty in Guadalupe County
Income Below Poverty by Sex and Age in Guadalupe County
With 22.8% poverty level for males and 18.3% for females among the residents of Guadalupe County, 18 to 24 year old males and 15 year old females are the most vulnerable to poverty, with 99 males (63.9%) and 5 females (100.0%) in their respective age groups living below the poverty level.
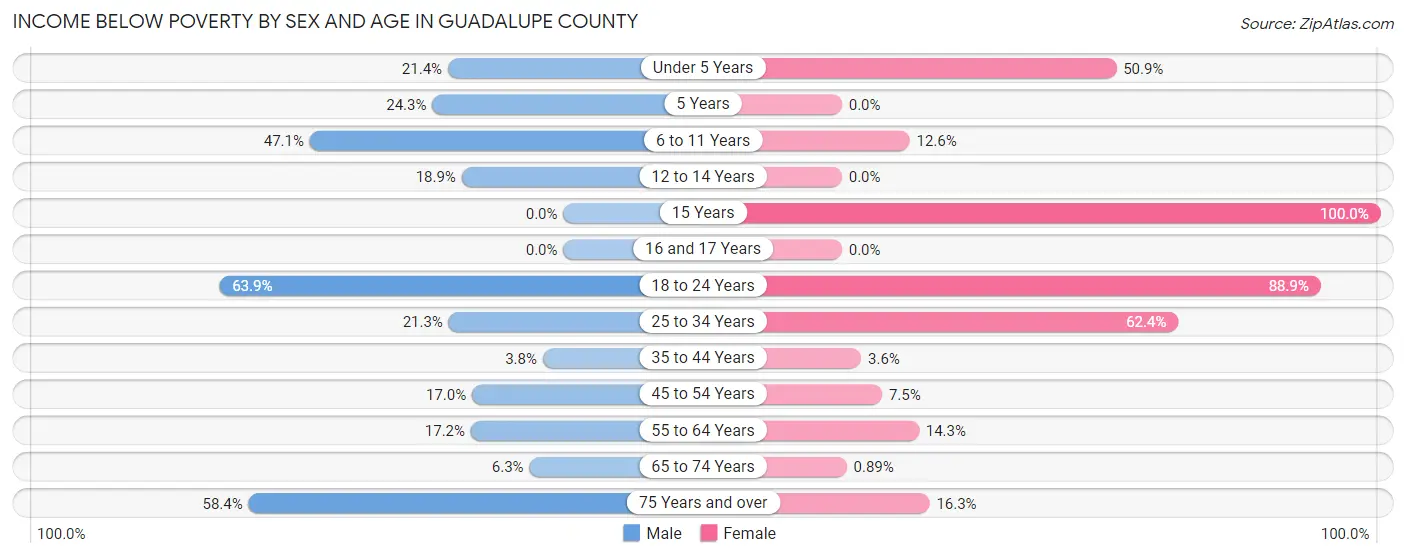
| Age Bracket | Male | Female |
| Under 5 Years | 15 (21.4%) | 55 (50.9%) |
| 5 Years | 27 (24.3%) | 0 (0.0%) |
| 6 to 11 Years | 48 (47.1%) | 20 (12.6%) |
| 12 to 14 Years | 20 (18.9%) | 0 (0.0%) |
| 15 Years | 0 (0.0%) | 5 (100.0%) |
| 16 and 17 Years | 0 (0.0%) | 0 (0.0%) |
| 18 to 24 Years | 99 (63.9%) | 16 (88.9%) |
| 25 to 34 Years | 30 (21.3%) | 138 (62.4%) |
| 35 to 44 Years | 10 (3.8%) | 13 (3.6%) |
| 45 to 54 Years | 40 (17.0%) | 12 (7.4%) |
| 55 to 64 Years | 57 (17.2%) | 45 (14.3%) |
| 65 to 74 Years | 18 (6.3%) | 2 (0.9%) |
| 75 Years and over | 104 (58.4%) | 27 (16.3%) |
| Total | 468 (22.8%) | 333 (18.3%) |
Income Above Poverty by Sex and Age in Guadalupe County
According to the poverty statistics in Guadalupe County, males aged 15 years and females aged 12 to 14 years are the age groups that are most secure financially, with 100.0% of males and 100.0% of females in these age groups living above the poverty line.
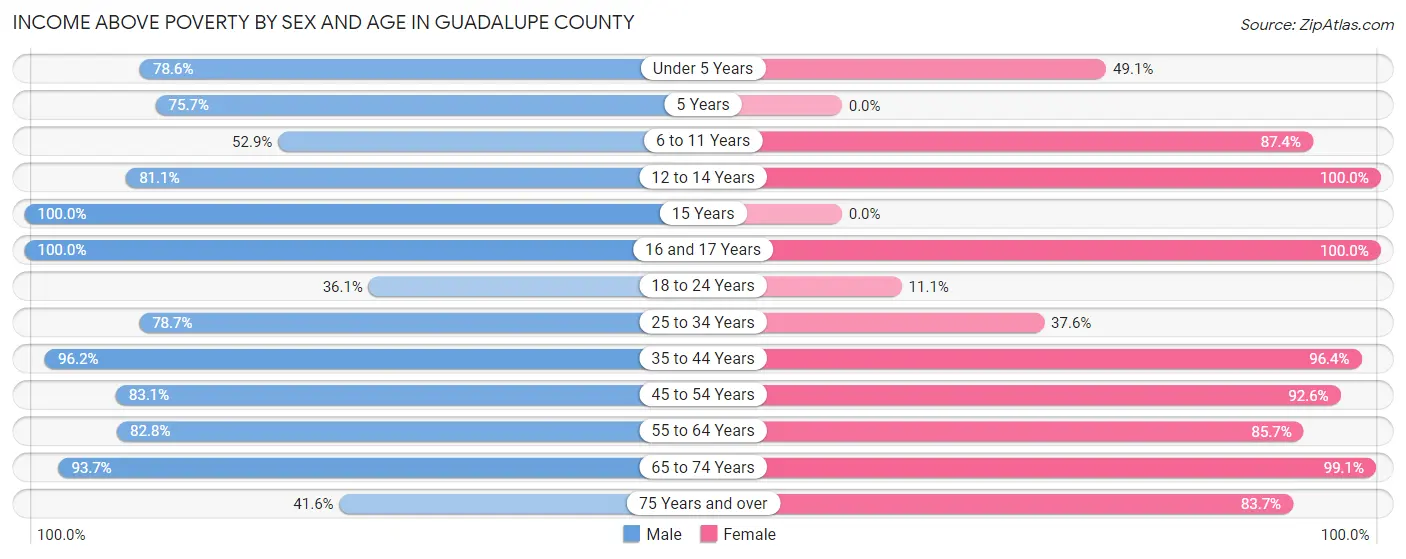
| Age Bracket | Male | Female |
| Under 5 Years | 55 (78.6%) | 53 (49.1%) |
| 5 Years | 84 (75.7%) | 0 (0.0%) |
| 6 to 11 Years | 54 (52.9%) | 139 (87.4%) |
| 12 to 14 Years | 86 (81.1%) | 69 (100.0%) |
| 15 Years | 20 (100.0%) | 0 (0.0%) |
| 16 and 17 Years | 56 (100.0%) | 13 (100.0%) |
| 18 to 24 Years | 56 (36.1%) | 2 (11.1%) |
| 25 to 34 Years | 111 (78.7%) | 83 (37.6%) |
| 35 to 44 Years | 252 (96.2%) | 350 (96.4%) |
| 45 to 54 Years | 196 (83.1%) | 149 (92.5%) |
| 55 to 64 Years | 275 (82.8%) | 270 (85.7%) |
| 65 to 74 Years | 268 (93.7%) | 222 (99.1%) |
| 75 Years and over | 74 (41.6%) | 139 (83.7%) |
| Total | 1,587 (77.2%) | 1,489 (81.7%) |
Income Below Poverty Among Married-Couple Families in Guadalupe County
The poverty statistics for married-couple families in Guadalupe County show that 19.6% or 115 of the total 587 families live below the poverty line. Families with 3 or 4 children have the highest poverty rate of 22.9%, comprising of 8 families. On the other hand, families with 1 or 2 children have the lowest poverty rate of 16.3%, which includes 21 families.
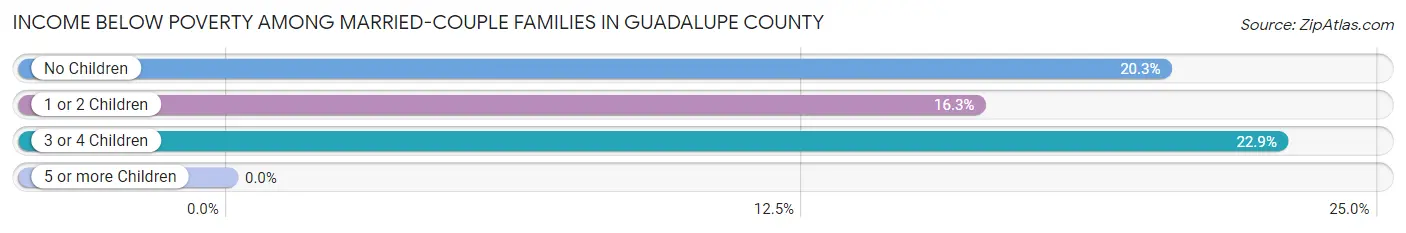
| Children | Above Poverty | Below Poverty |
| No Children | 337 (79.7%) | 86 (20.3%) |
| 1 or 2 Children | 108 (83.7%) | 21 (16.3%) |
| 3 or 4 Children | 27 (77.1%) | 8 (22.9%) |
| 5 or more Children | 0 (0.0%) | 0 (0.0%) |
| Total | 472 (80.4%) | 115 (19.6%) |
Income Below Poverty Among Single-Parent Households in Guadalupe County
According to the poverty data in Guadalupe County, 11.4% or 12 single-father households and 19.1% or 22 single-mother households are living below the poverty line. Among single-father households, those with 1 or 2 children have the highest poverty rate, with 12 households (66.7%) experiencing poverty. Likewise, among single-mother households, those with 5 or more children have the highest poverty rate, with 2 households (100.0%) falling below the poverty line.
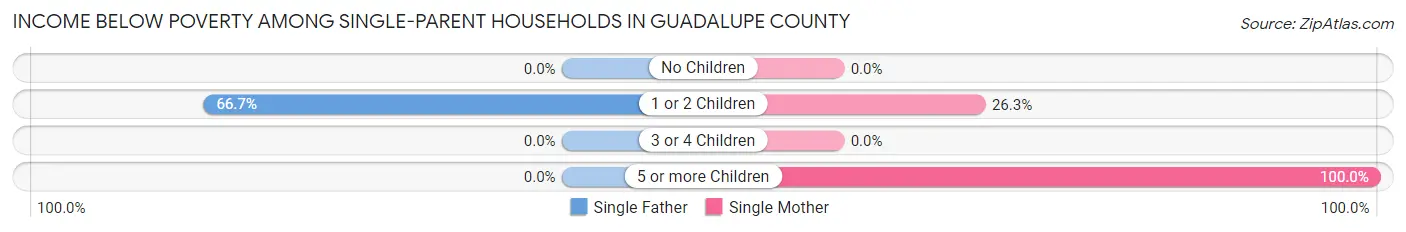
| Children | Single Father | Single Mother |
| No Children | 0 (0.0%) | 0 (0.0%) |
| 1 or 2 Children | 12 (66.7%) | 20 (26.3%) |
| 3 or 4 Children | 0 (0.0%) | 0 (0.0%) |
| 5 or more Children | 0 (0.0%) | 2 (100.0%) |
| Total | 12 (11.4%) | 22 (19.1%) |
Income Below Poverty Among Married-Couple vs Single-Parent Households in Guadalupe County
The poverty data for Guadalupe County shows that 115 of the married-couple family households (19.6%) and 34 of the single-parent households (15.4%) are living below the poverty level. Within the married-couple family households, those with 3 or 4 children have the highest poverty rate, with 8 households (22.9%) falling below the poverty line. Among the single-parent households, those with 5 or more children have the highest poverty rate, with 2 household (100.0%) living below poverty.
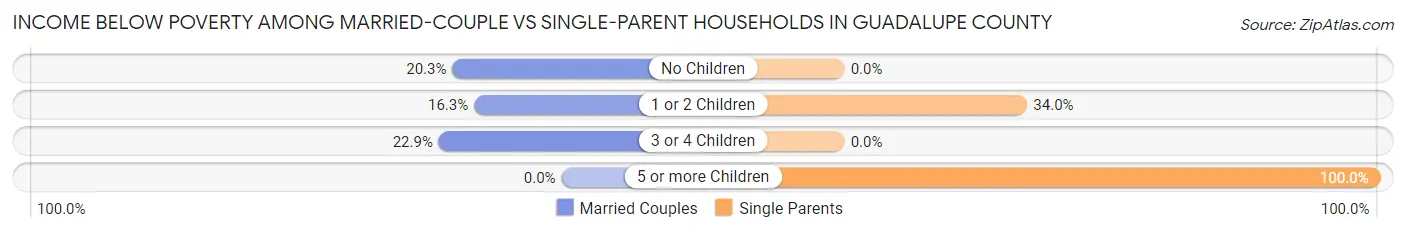
| Children | Married-Couple Families | Single-Parent Households |
| No Children | 86 (20.3%) | 0 (0.0%) |
| 1 or 2 Children | 21 (16.3%) | 32 (34.0%) |
| 3 or 4 Children | 8 (22.9%) | 0 (0.0%) |
| 5 or more Children | 0 (0.0%) | 2 (100.0%) |
| Total | 115 (19.6%) | 34 (15.4%) |
Race in Guadalupe County
The most populous races in Guadalupe County are Hispanic or Latino (3,321 | 75.2%), White / Caucasian (2,028 | 46.0%), and Two or more Races (1,040 | 23.6%).
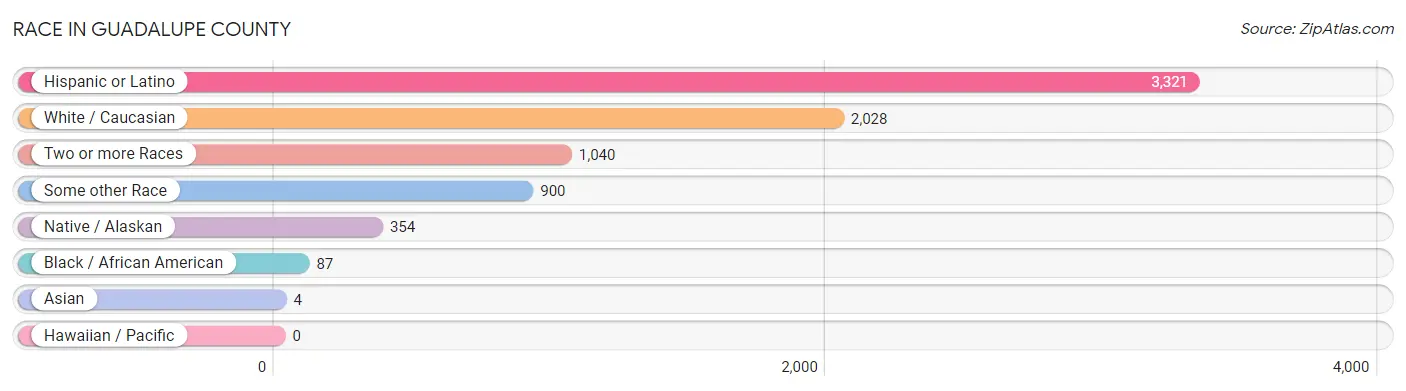
| Race | # Population | % Population |
| Asian | 4 | 0.1% |
| Black / African American | 87 | 2.0% |
| Hawaiian / Pacific | 0 | 0.0% |
| Hispanic or Latino | 3,321 | 75.2% |
| Native / Alaskan | 354 | 8.0% |
| White / Caucasian | 2,028 | 46.0% |
| Two or more Races | 1,040 | 23.6% |
| Some other Race | 900 | 20.4% |
| Total | 4,413 | 100.0% |
Ancestry in Guadalupe County
The most populous ancestries reported in Guadalupe County are Mexican (1,823 | 41.3%), Spanish (503 | 11.4%), German (336 | 7.6%), English (241 | 5.5%), and American (220 | 5.0%), together accounting for 70.8% of all Guadalupe County residents.
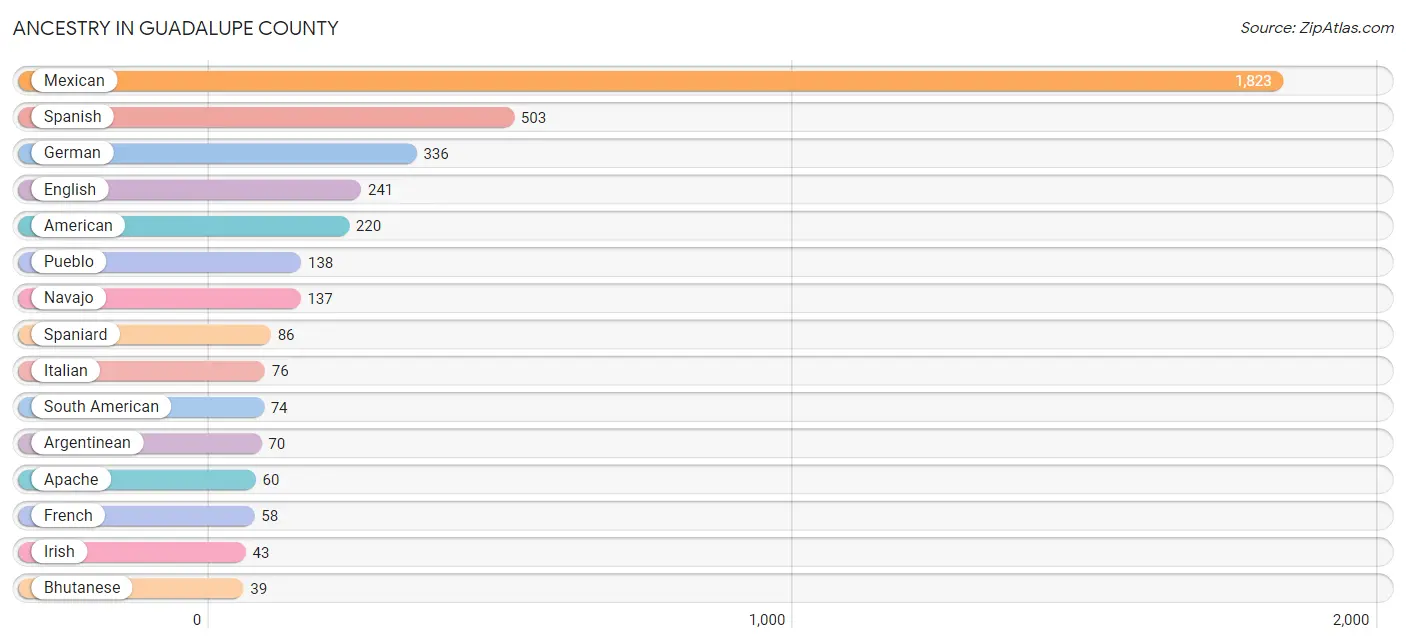
| Ancestry | # Population | % Population |
| American | 220 | 5.0% |
| Apache | 60 | 1.4% |
| Arab | 5 | 0.1% |
| Argentinean | 70 | 1.6% |
| Basque | 3 | 0.1% |
| Bhutanese | 39 | 0.9% |
| British | 24 | 0.5% |
| Central American | 4 | 0.1% |
| Central American Indian | 33 | 0.7% |
| Cheyenne | 25 | 0.6% |
| Dutch | 4 | 0.1% |
| English | 241 | 5.5% |
| European | 4 | 0.1% |
| French | 58 | 1.3% |
| German | 336 | 7.6% |
| Irish | 43 | 1.0% |
| Italian | 76 | 1.7% |
| Mexican | 1,823 | 41.3% |
| Moroccan | 5 | 0.1% |
| Navajo | 137 | 3.1% |
| Polish | 3 | 0.1% |
| Pueblo | 138 | 3.1% |
| Russian | 5 | 0.1% |
| Salvadoran | 4 | 0.1% |
| Samoan | 5 | 0.1% |
| Scottish | 21 | 0.5% |
| Sioux | 5 | 0.1% |
| South American | 74 | 1.7% |
| Spaniard | 86 | 1.9% |
| Spanish | 503 | 11.4% |
| Swedish | 9 | 0.2% |
| Thai | 4 | 0.1% |
| Venezuelan | 4 | 0.1% |
| Welsh | 25 | 0.6% | View All 34 Rows |
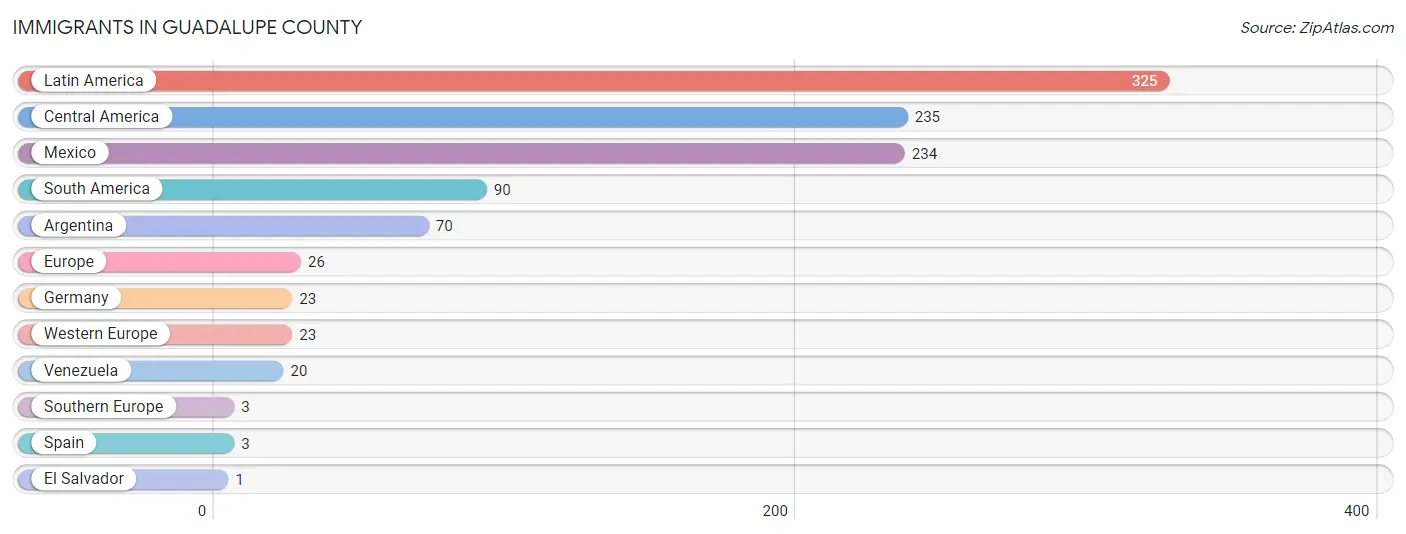
Immigrants in Guadalupe County
The most numerous immigrant groups reported in Guadalupe County came from Latin America (325 | 7.4%), Central America (235 | 5.3%), Mexico (234 | 5.3%), South America (90 | 2.0%), and Argentina (70 | 1.6%), together accounting for 21.6% of all Guadalupe County residents.
| Immigration Origin | # Population | % Population |
| Argentina | 70 | 1.6% |
| Central America | 235 | 5.3% |
| El Salvador | 1 | 0.0% |
| Europe | 26 | 0.6% |
| Germany | 23 | 0.5% |
| Latin America | 325 | 7.4% |
| Mexico | 234 | 5.3% |
| South America | 90 | 2.0% |
| Southern Europe | 3 | 0.1% |
| Spain | 3 | 0.1% |
| Venezuela | 20 | 0.4% |
| Western Europe | 23 | 0.5% | View All 12 Rows |
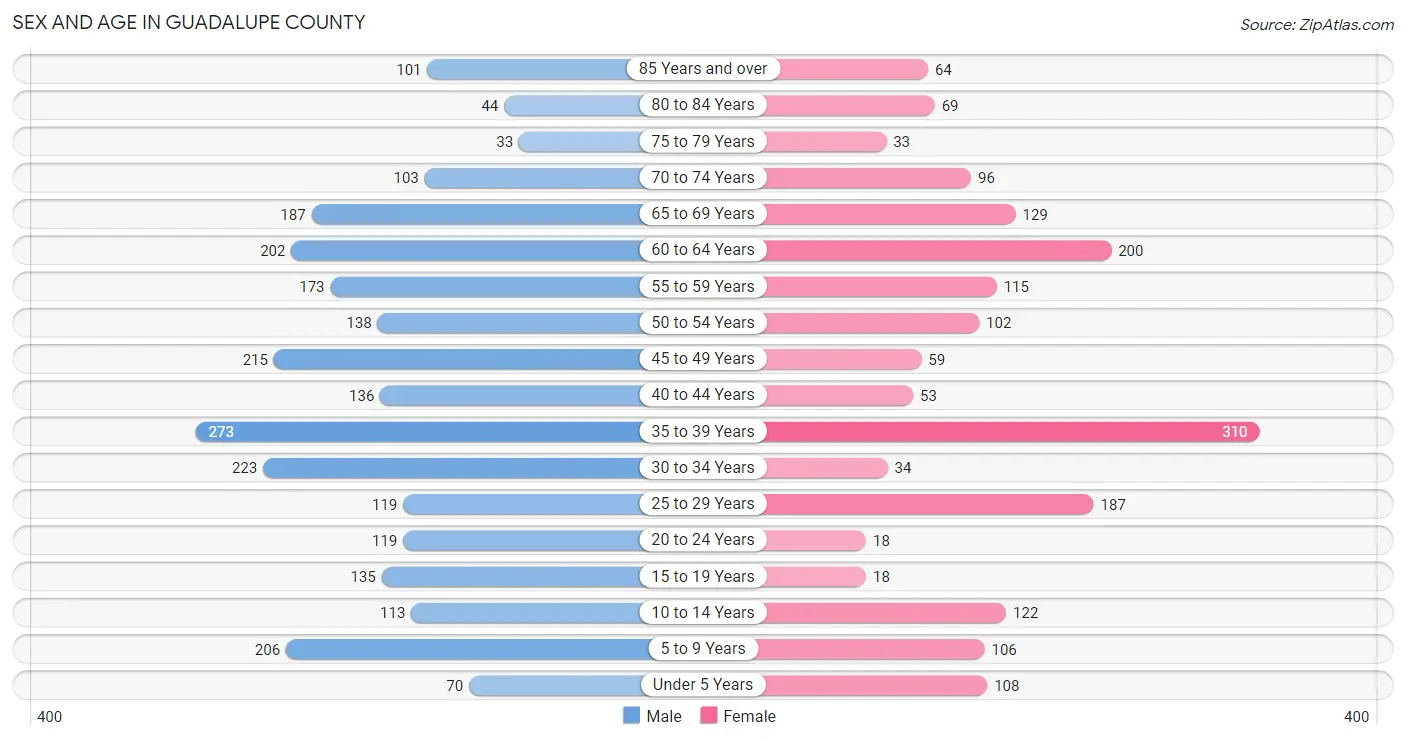
Sex and Age in Guadalupe County
Sex and Age in Guadalupe County
The most populous age groups in Guadalupe County are 35 to 39 Years (273 | 10.5%) for men and 35 to 39 Years (310 | 17.0%) for women.
| Age Bracket | Male | Female |
| Under 5 Years | 70 (2.7%) | 108 (5.9%) |
| 5 to 9 Years | 206 (8.0%) | 106 (5.8%) |
| 10 to 14 Years | 113 (4.4%) | 122 (6.7%) |
| 15 to 19 Years | 135 (5.2%) | 18 (1.0%) |
| 20 to 24 Years | 119 (4.6%) | 18 (1.0%) |
| 25 to 29 Years | 119 (4.6%) | 187 (10.3%) |
| 30 to 34 Years | 223 (8.6%) | 34 (1.9%) |
| 35 to 39 Years | 273 (10.5%) | 310 (17.0%) |
| 40 to 44 Years | 136 (5.2%) | 53 (2.9%) |
| 45 to 49 Years | 215 (8.3%) | 59 (3.2%) |
| 50 to 54 Years | 138 (5.3%) | 102 (5.6%) |
| 55 to 59 Years | 173 (6.7%) | 115 (6.3%) |
| 60 to 64 Years | 202 (7.8%) | 200 (11.0%) |
| 65 to 69 Years | 187 (7.2%) | 129 (7.1%) |
| 70 to 74 Years | 103 (4.0%) | 96 (5.3%) |
| 75 to 79 Years | 33 (1.3%) | 33 (1.8%) |
| 80 to 84 Years | 44 (1.7%) | 69 (3.8%) |
| 85 Years and over | 101 (3.9%) | 64 (3.5%) |
| Total | 2,590 (100.0%) | 1,823 (100.0%) |
Families and Households in Guadalupe County
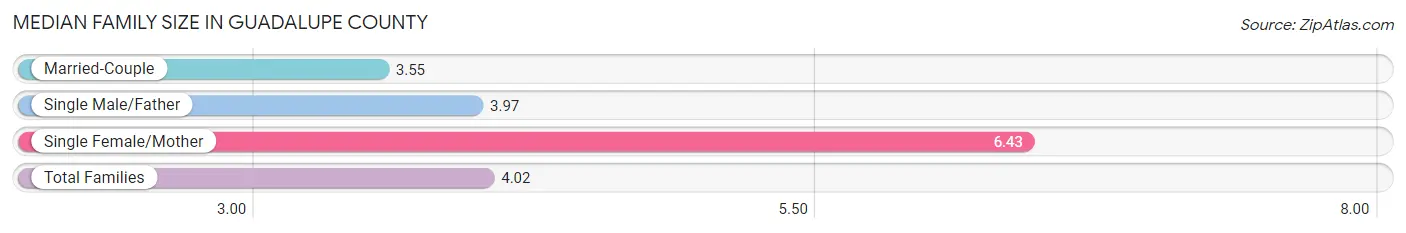
Median Family Size in Guadalupe County
The median family size in Guadalupe County is 4.02 persons per family, with single female/mother families (115 | 14.2%) accounting for the largest median family size of 6.43 persons per family. On the other hand, married-couple families (587 | 72.7%) represent the smallest median family size with 3.55 persons per family.
| Family Type | # Families | Family Size |
| Married-Couple | 587 (72.7%) | 3.55 |
| Single Male/Father | 105 (13.0%) | 3.97 |
| Single Female/Mother | 115 (14.2%) | 6.43 |
| Total Families | 807 (100.0%) | 4.02 |
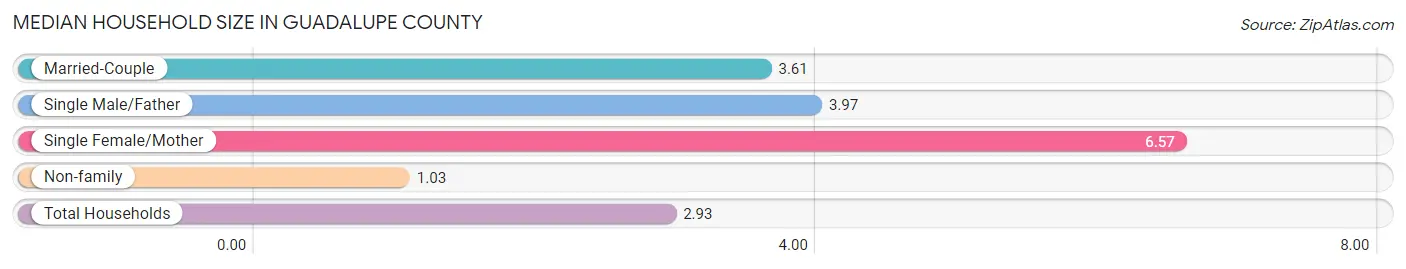
Median Household Size in Guadalupe County
The median household size in Guadalupe County is 2.93 persons per household, with single female/mother households (115 | 8.9%) accounting for the largest median household size of 6.57 persons per household. non-family households (488 | 37.7%) represent the smallest median household size with 1.03 persons per household.
| Household Type | # Households | Household Size |
| Married-Couple | 587 (45.3%) | 3.61 |
| Single Male/Father | 105 (8.1%) | 3.97 |
| Single Female/Mother | 115 (8.9%) | 6.57 |
| Non-family | 488 (37.7%) | 1.03 |
| Total Households | 1,295 (100.0%) | 2.93 |
Household Size by Marriage Status in Guadalupe County
Out of a total of 1,295 households in Guadalupe County, 807 (62.3%) are family households, while 488 (37.7%) are nonfamily households. The most numerous type of family households are 2-person households, comprising 364, and the most common type of nonfamily households are 1-person households, comprising 470.
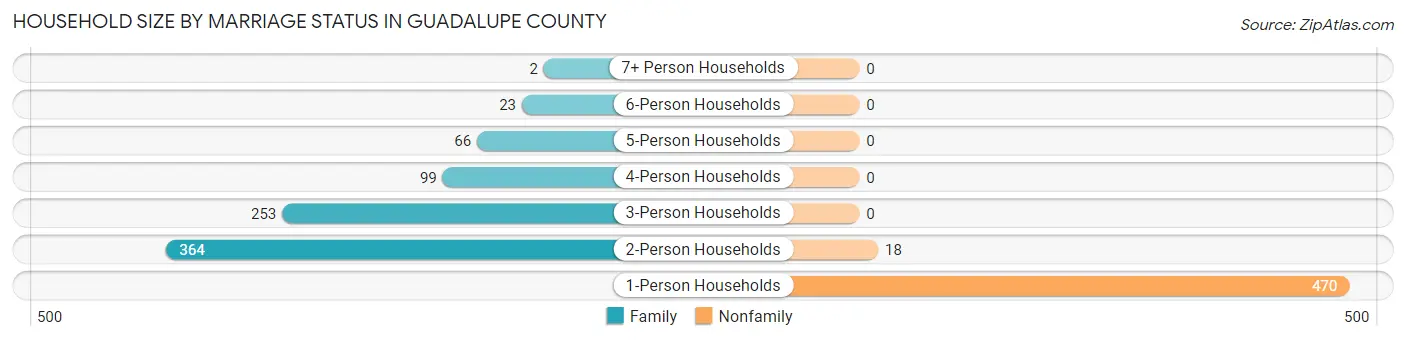
| Household Size | Family Households | Nonfamily Households |
| 1-Person Households | - | 470 (36.3%) |
| 2-Person Households | 364 (28.1%) | 18 (1.4%) |
| 3-Person Households | 253 (19.5%) | 0 (0.0%) |
| 4-Person Households | 99 (7.6%) | 0 (0.0%) |
| 5-Person Households | 66 (5.1%) | 0 (0.0%) |
| 6-Person Households | 23 (1.8%) | 0 (0.0%) |
| 7+ Person Households | 2 (0.2%) | 0 (0.0%) |
| Total | 807 (62.3%) | 488 (37.7%) |
Female Fertility in Guadalupe County
Fertility by Age in Guadalupe County
Average fertility rate in Guadalupe County is 40.0 births per 1,000 women. Women in the age bracket of 20 to 34 years have the highest fertility rate with 113.0 births per 1,000 women. Women in the age bracket of 20 to 34 years acount for 100.0% of all women with births.
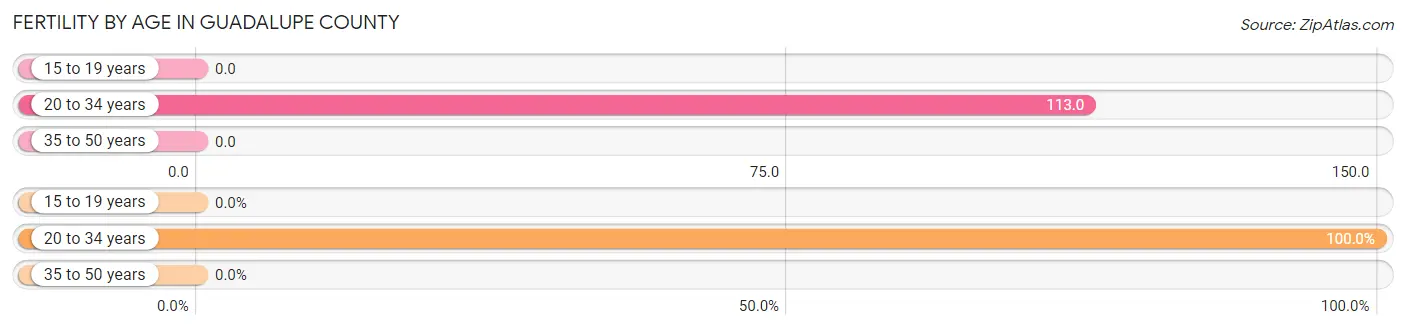
| Age Bracket | Women with Births | Births / 1,000 Women |
| 15 to 19 years | 0 (0.0%) | 0.0 |
| 20 to 34 years | 27 (100.0%) | 113.0 |
| 35 to 50 years | 0 (0.0%) | 0.0 |
| Total | 27 (100.0%) | 40.0 |
Fertility by Age by Marriage Status in Guadalupe County
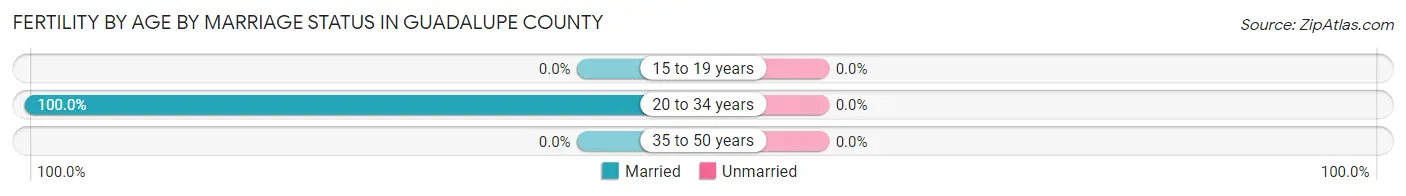
| Age Bracket | Married | Unmarried |
| 15 to 19 years | 0 (0.0%) | 0 (0.0%) |
| 20 to 34 years | 27 (100.0%) | 0 (0.0%) |
| 35 to 50 years | 0 (0.0%) | 0 (0.0%) |
| Total | 27 (100.0%) | 0 (0.0%) |
Fertility by Education in Guadalupe County
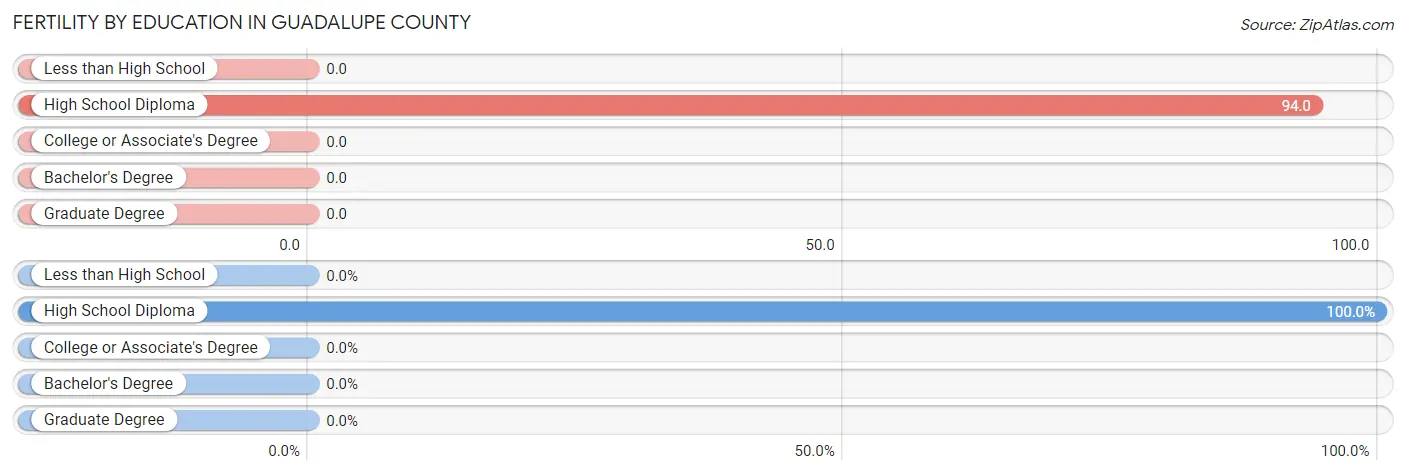
| Educational Attainment | Women with Births | Births / 1,000 Women |
| Less than High School | 0 (0.0%) | 0.0 |
| High School Diploma | 27 (100.0%) | 94.0 |
| College or Associate's Degree | 0 (0.0%) | 0.0 |
| Bachelor's Degree | 0 (0.0%) | 0.0 |
| Graduate Degree | 0 (0.0%) | 0.0 |
| Total | 27 (100.0%) | 40.0 |
Fertility by Education by Marriage Status in Guadalupe County
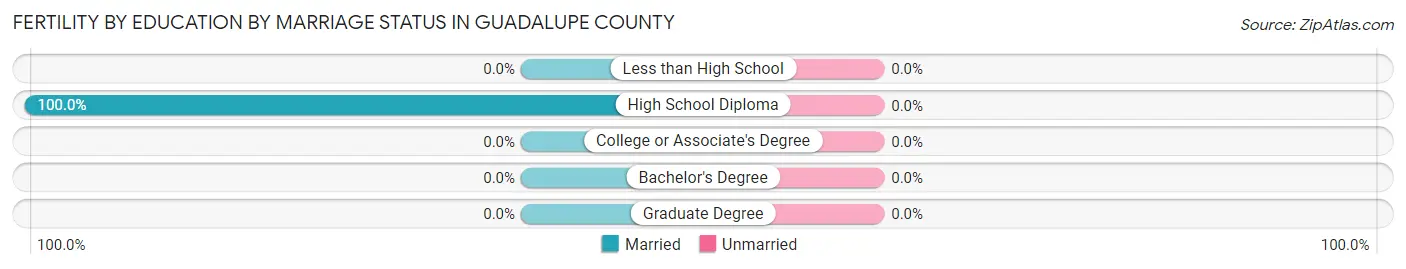
| Educational Attainment | Married | Unmarried |
| Less than High School | 0 (0.0%) | 0 (0.0%) |
| High School Diploma | 27 (100.0%) | 0 (0.0%) |
| College or Associate's Degree | 0 (0.0%) | 0 (0.0%) |
| Bachelor's Degree | 0 (0.0%) | 0 (0.0%) |
| Graduate Degree | 0 (0.0%) | 0 (0.0%) |
| Total | 27 (100.0%) | 0 (0.0%) |
Employment Characteristics in Guadalupe County
Employment by Class of Employer in Guadalupe County
Among the 1,526 employed individuals in Guadalupe County, private company employees (625 | 41.0%), not-for-profit organizations (214 | 14.0%), and state government employees (201 | 13.2%) make up the most common classes of employment.
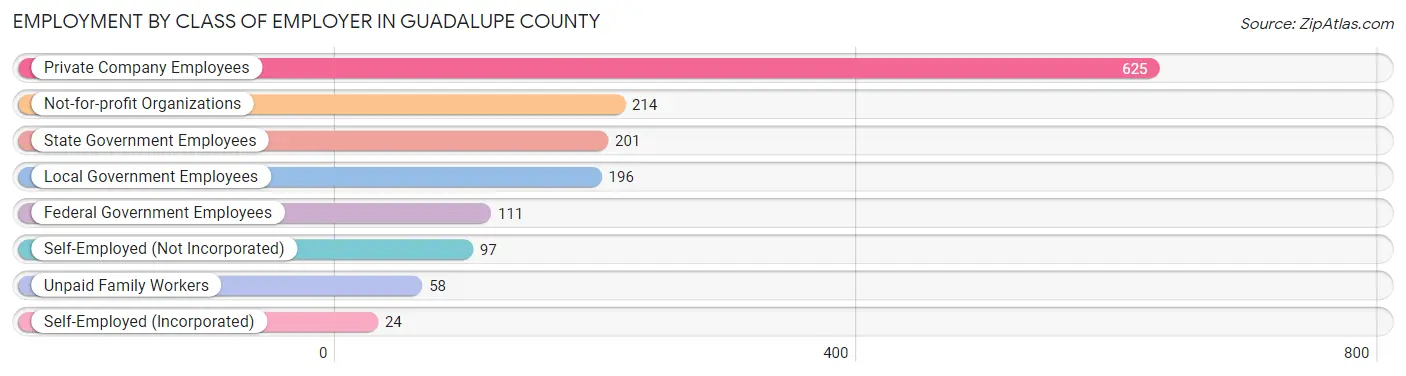
| Employer Class | # Employees | % Employees |
| Private Company Employees | 625 | 41.0% |
| Self-Employed (Incorporated) | 24 | 1.6% |
| Self-Employed (Not Incorporated) | 97 | 6.4% |
| Not-for-profit Organizations | 214 | 14.0% |
| Local Government Employees | 196 | 12.8% |
| State Government Employees | 201 | 13.2% |
| Federal Government Employees | 111 | 7.3% |
| Unpaid Family Workers | 58 | 3.8% |
| Total | 1,526 | 100.0% |
Employment Status by Age in Guadalupe County
According to the labor force statistics for Guadalupe County, out of the total population over 16 years of age (3,663), 49.5% or 1,813 individuals are in the labor force, with 9.8% or 178 of them unemployed. The age group with the highest labor force participation rate is 16 to 19 years, with 85.2% or 109 individuals in the labor force. Within the labor force, the 25 to 29 years age range has the highest percentage of unemployed individuals, with 60.6% or 100 of them being unemployed.
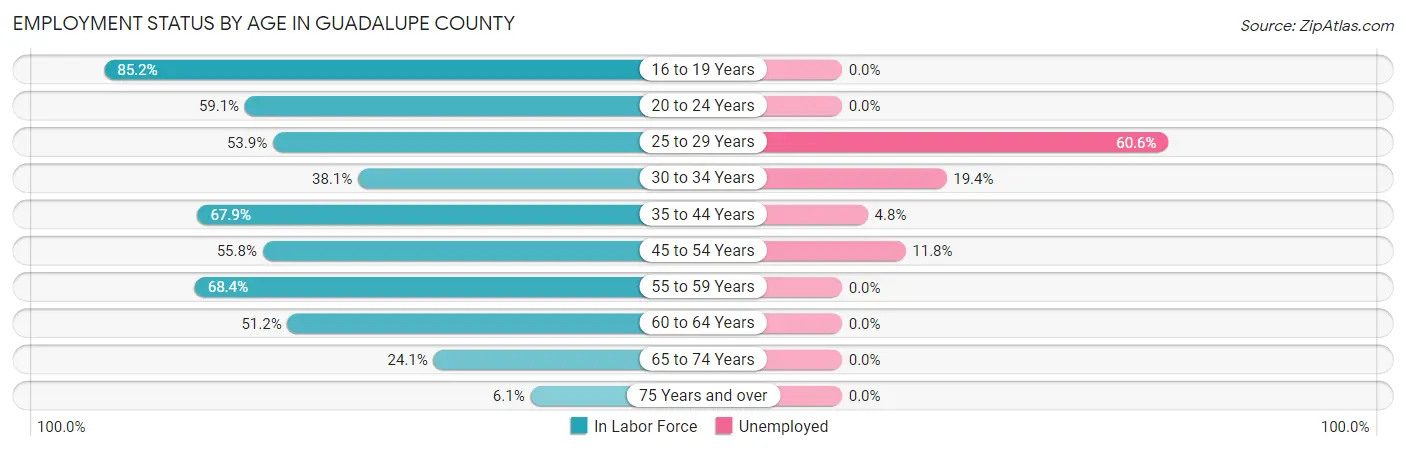
| Age Bracket | In Labor Force | Unemployed |
| 16 to 19 Years | 109 (85.2%) | 0 (0.0%) |
| 20 to 24 Years | 81 (59.1%) | 0 (0.0%) |
| 25 to 29 Years | 165 (53.9%) | 100 (60.6%) |
| 30 to 34 Years | 98 (38.1%) | 19 (19.4%) |
| 35 to 44 Years | 524 (67.9%) | 25 (4.8%) |
| 45 to 54 Years | 287 (55.8%) | 34 (11.8%) |
| 55 to 59 Years | 197 (68.4%) | 0 (0.0%) |
| 60 to 64 Years | 206 (51.2%) | 0 (0.0%) |
| 65 to 74 Years | 124 (24.1%) | 0 (0.0%) |
| 75 Years and over | 21 (6.1%) | 0 (0.0%) |
| Total | 1,813 (49.5%) | 178 (9.8%) |
Employment Status by Educational Attainment in Guadalupe County
According to labor force statistics for Guadalupe County, 58.2% of individuals (1,478) out of the total population between 25 and 64 years of age (2,539) are in the labor force, with 12.1% or 179 of them being unemployed. The group with the highest labor force participation rate are those with the educational attainment of high school diploma, with 65.1% or 730 individuals in the labor force. Within the labor force, individuals with less than high school education have the highest percentage of unemployment, with 23.4% or 39 of them being unemployed.
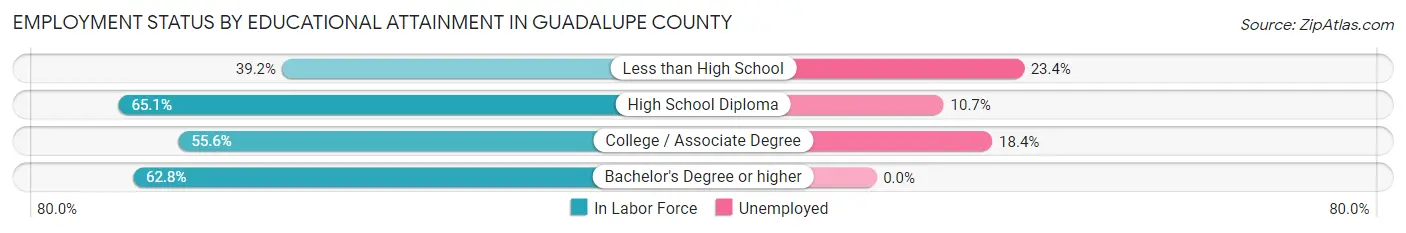
| Educational Attainment | In Labor Force | Unemployed |
| Less than High School | 167 (39.2%) | 100 (23.4%) |
| High School Diploma | 730 (65.1%) | 120 (10.7%) |
| College / Associate Degree | 332 (55.6%) | 110 (18.4%) |
| Bachelor's Degree or higher | 248 (62.8%) | 0 (0.0%) |
| Total | 1,478 (58.2%) | 307 (12.1%) |
Employment Occupations by Sex in Guadalupe County
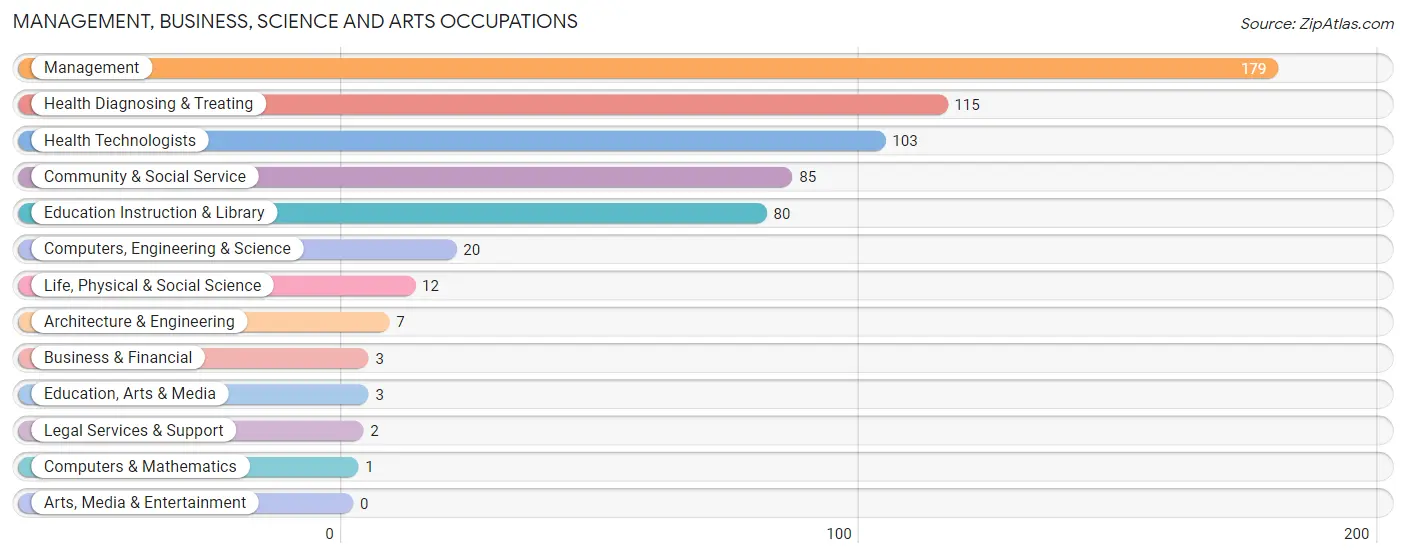
Management, Business, Science and Arts Occupations
The most common Management, Business, Science and Arts occupations in Guadalupe County are Management (179 | 11.0%), Health Diagnosing & Treating (115 | 7.0%), Health Technologists (103 | 6.3%), Community & Social Service (85 | 5.2%), and Education Instruction & Library (80 | 4.9%).
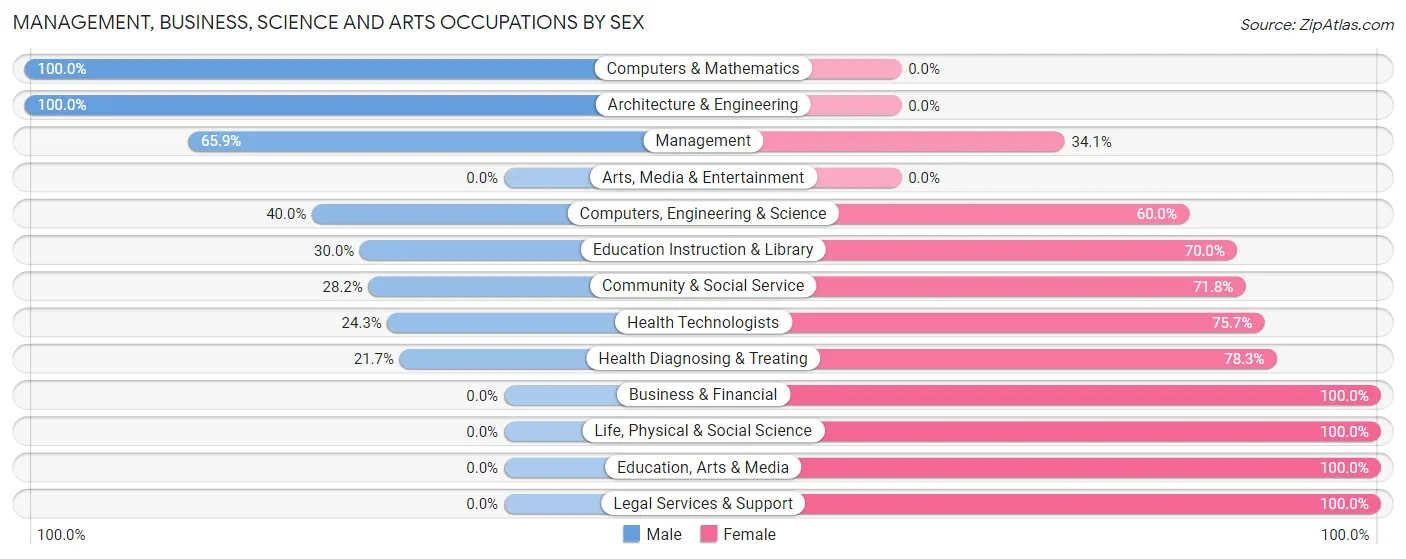
Management, Business, Science and Arts Occupations by Sex
Within the Management, Business, Science and Arts occupations in Guadalupe County, the most male-oriented occupations are Computers & Mathematics (100.0%), Architecture & Engineering (100.0%), and Management (65.9%), while the most female-oriented occupations are Business & Financial (100.0%), Life, Physical & Social Science (100.0%), and Education, Arts & Media (100.0%).
| Occupation | Male | Female |
| Management | 118 (65.9%) | 61 (34.1%) |
| Business & Financial | 0 (0.0%) | 3 (100.0%) |
| Computers, Engineering & Science | 8 (40.0%) | 12 (60.0%) |
| Computers & Mathematics | 1 (100.0%) | 0 (0.0%) |
| Architecture & Engineering | 7 (100.0%) | 0 (0.0%) |
| Life, Physical & Social Science | 0 (0.0%) | 12 (100.0%) |
| Community & Social Service | 24 (28.2%) | 61 (71.8%) |
| Education, Arts & Media | 0 (0.0%) | 3 (100.0%) |
| Legal Services & Support | 0 (0.0%) | 2 (100.0%) |
| Education Instruction & Library | 24 (30.0%) | 56 (70.0%) |
| Arts, Media & Entertainment | 0 (0.0%) | 0 (0.0%) |
| Health Diagnosing & Treating | 25 (21.7%) | 90 (78.3%) |
| Health Technologists | 25 (24.3%) | 78 (75.7%) |
| Total (Category) | 175 (43.5%) | 227 (56.5%) |
| Total (Overall) | 977 (59.8%) | 657 (40.2%) |
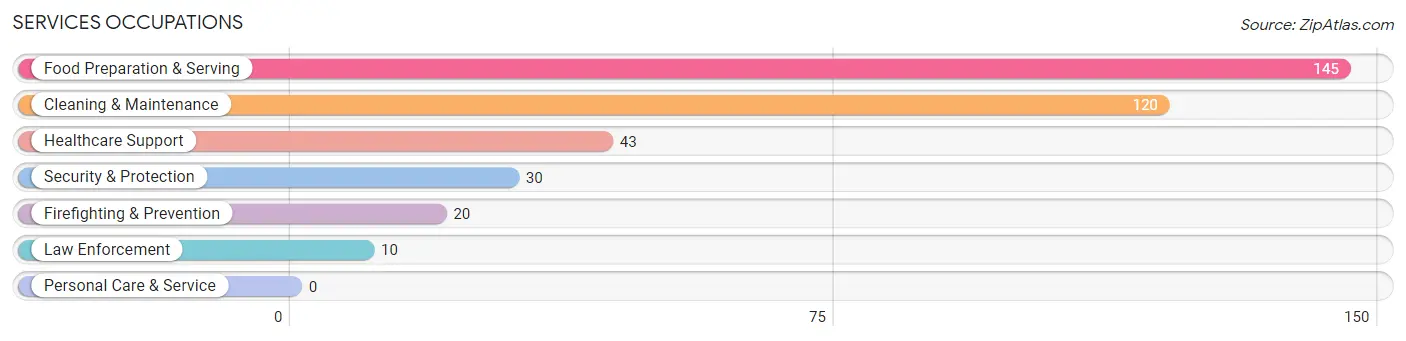
Services Occupations
The most common Services occupations in Guadalupe County are Food Preparation & Serving (145 | 8.9%), Cleaning & Maintenance (120 | 7.3%), Healthcare Support (43 | 2.6%), Security & Protection (30 | 1.8%), and Firefighting & Prevention (20 | 1.2%).
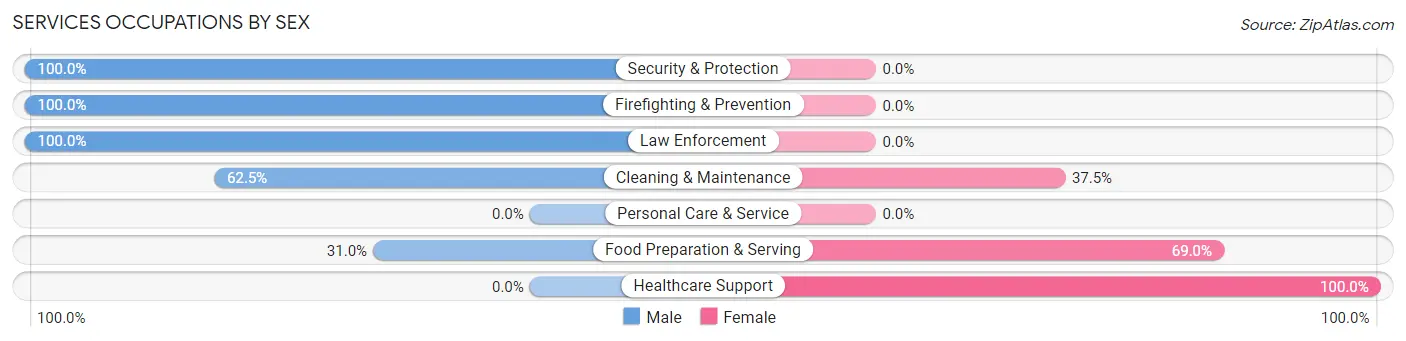
Services Occupations by Sex
Within the Services occupations in Guadalupe County, the most male-oriented occupations are Security & Protection (100.0%), Firefighting & Prevention (100.0%), and Law Enforcement (100.0%), while the most female-oriented occupations are Healthcare Support (100.0%), Food Preparation & Serving (69.0%), and Cleaning & Maintenance (37.5%).
| Occupation | Male | Female |
| Healthcare Support | 0 (0.0%) | 43 (100.0%) |
| Security & Protection | 30 (100.0%) | 0 (0.0%) |
| Firefighting & Prevention | 20 (100.0%) | 0 (0.0%) |
| Law Enforcement | 10 (100.0%) | 0 (0.0%) |
| Food Preparation & Serving | 45 (31.0%) | 100 (69.0%) |
| Cleaning & Maintenance | 75 (62.5%) | 45 (37.5%) |
| Personal Care & Service | 0 (0.0%) | 0 (0.0%) |
| Total (Category) | 150 (44.4%) | 188 (55.6%) |
| Total (Overall) | 977 (59.8%) | 657 (40.2%) |
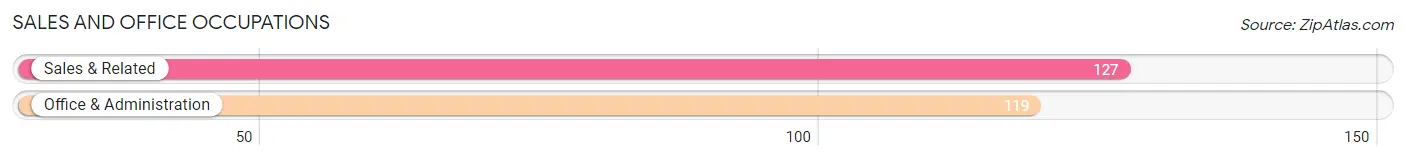
Sales and Office Occupations
The most common Sales and Office occupations in Guadalupe County are Sales & Related (127 | 7.8%), and Office & Administration (119 | 7.3%).
Sales and Office Occupations by Sex
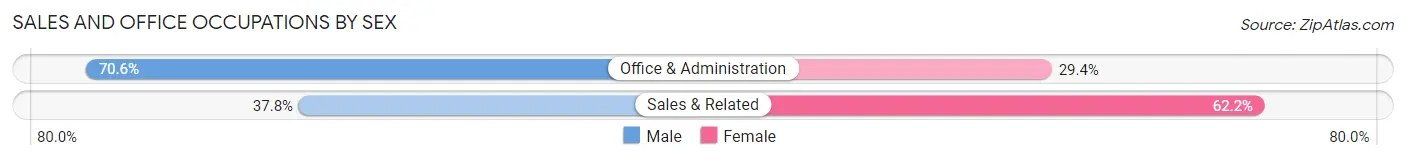
| Occupation | Male | Female |
| Sales & Related | 48 (37.8%) | 79 (62.2%) |
| Office & Administration | 84 (70.6%) | 35 (29.4%) |
| Total (Category) | 132 (53.7%) | 114 (46.3%) |
| Total (Overall) | 977 (59.8%) | 657 (40.2%) |
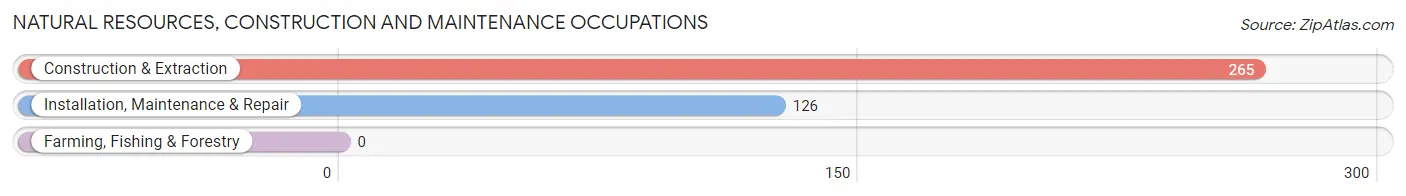
Natural Resources, Construction and Maintenance Occupations
The most common Natural Resources, Construction and Maintenance occupations in Guadalupe County are Construction & Extraction (265 | 16.2%), and Installation, Maintenance & Repair (126 | 7.7%).
Natural Resources, Construction and Maintenance Occupations by Sex
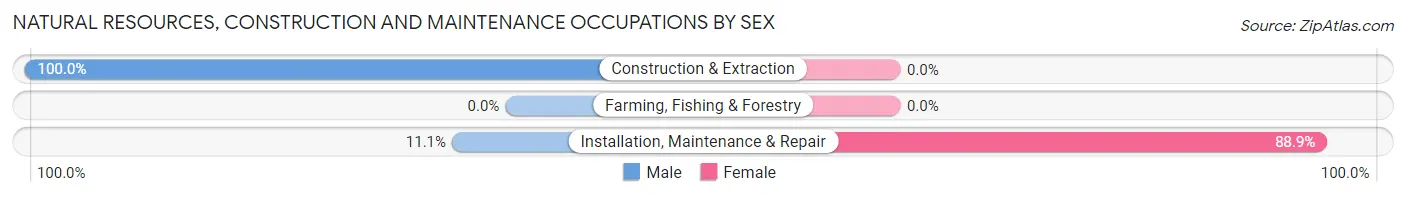
| Occupation | Male | Female |
| Farming, Fishing & Forestry | 0 (0.0%) | 0 (0.0%) |
| Construction & Extraction | 265 (100.0%) | 0 (0.0%) |
| Installation, Maintenance & Repair | 14 (11.1%) | 112 (88.9%) |
| Total (Category) | 279 (71.4%) | 112 (28.6%) |
| Total (Overall) | 977 (59.8%) | 657 (40.2%) |
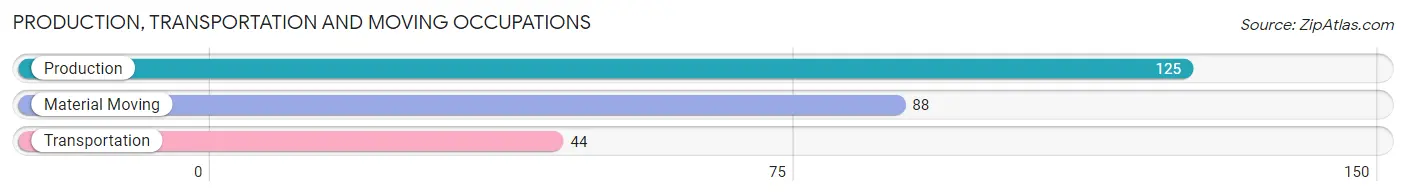
Production, Transportation and Moving Occupations
The most common Production, Transportation and Moving occupations in Guadalupe County are Production (125 | 7.6%), Material Moving (88 | 5.4%), and Transportation (44 | 2.7%).
Production, Transportation and Moving Occupations by Sex
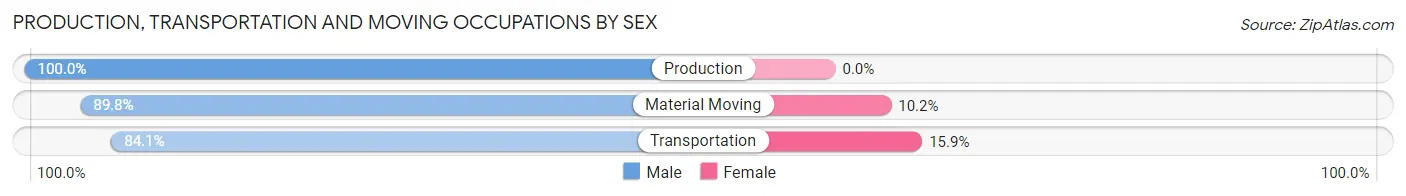
| Occupation | Male | Female |
| Production | 125 (100.0%) | 0 (0.0%) |
| Transportation | 37 (84.1%) | 7 (15.9%) |
| Material Moving | 79 (89.8%) | 9 (10.2%) |
| Total (Category) | 241 (93.8%) | 16 (6.2%) |
| Total (Overall) | 977 (59.8%) | 657 (40.2%) |
Employment Industries by Sex in Guadalupe County
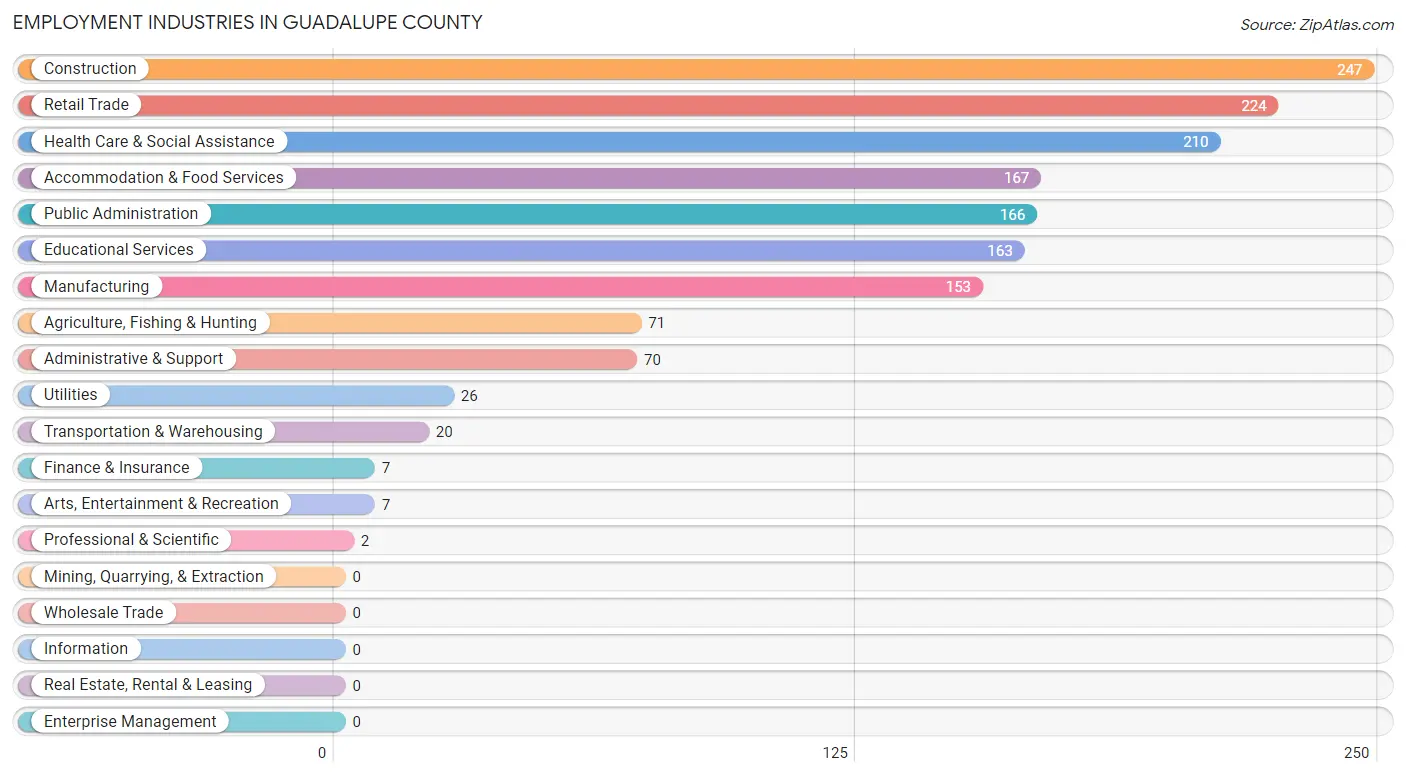
Employment Industries in Guadalupe County
The major employment industries in Guadalupe County include Construction (247 | 15.1%), Retail Trade (224 | 13.7%), Health Care & Social Assistance (210 | 12.9%), Accommodation & Food Services (167 | 10.2%), and Public Administration (166 | 10.2%).
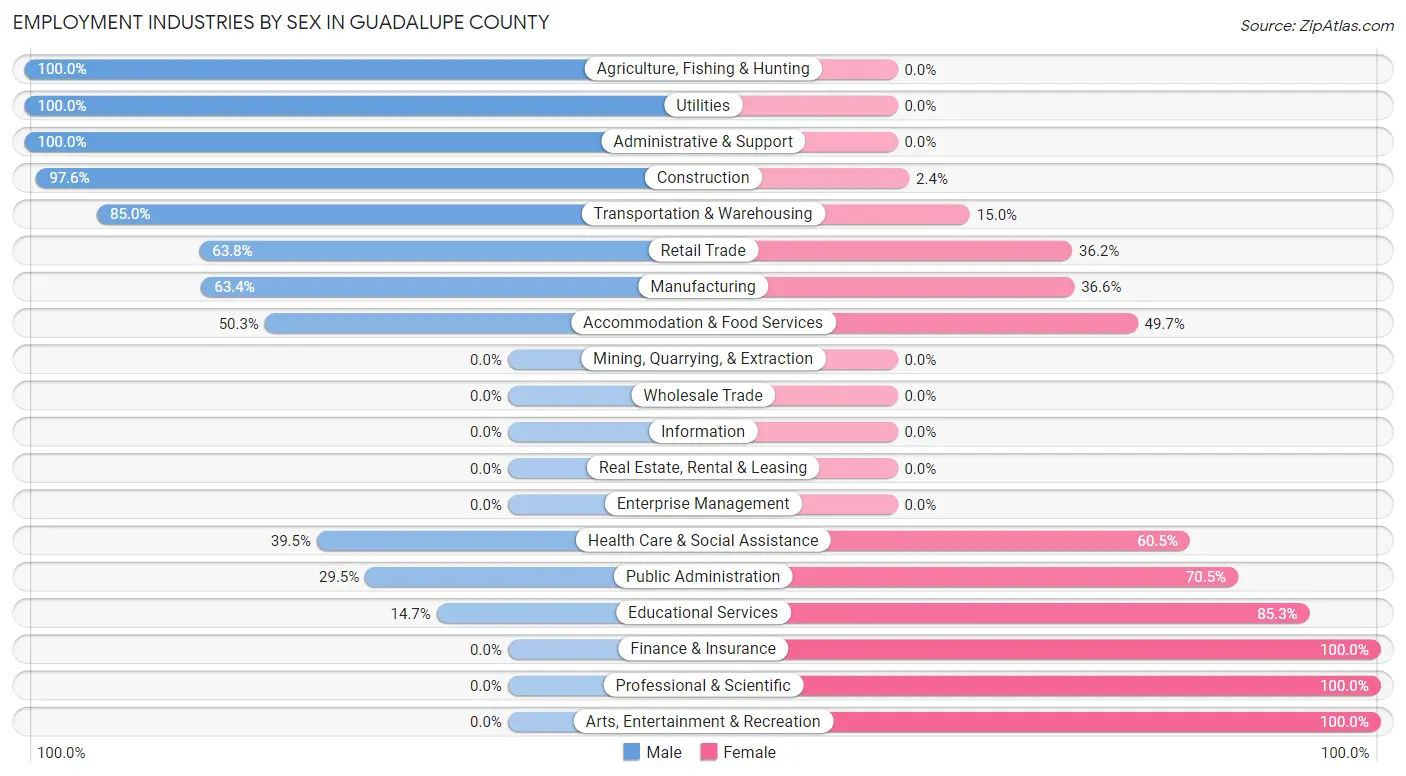
Employment Industries by Sex in Guadalupe County
The Guadalupe County industries that see more men than women are Agriculture, Fishing & Hunting (100.0%), Utilities (100.0%), and Administrative & Support (100.0%), whereas the industries that tend to have a higher number of women are Finance & Insurance (100.0%), Professional & Scientific (100.0%), and Arts, Entertainment & Recreation (100.0%).
| Industry | Male | Female |
| Agriculture, Fishing & Hunting | 71 (100.0%) | 0 (0.0%) |
| Mining, Quarrying, & Extraction | 0 (0.0%) | 0 (0.0%) |
| Construction | 241 (97.6%) | 6 (2.4%) |
| Manufacturing | 97 (63.4%) | 56 (36.6%) |
| Wholesale Trade | 0 (0.0%) | 0 (0.0%) |
| Retail Trade | 143 (63.8%) | 81 (36.2%) |
| Transportation & Warehousing | 17 (85.0%) | 3 (15.0%) |
| Utilities | 26 (100.0%) | 0 (0.0%) |
| Information | 0 (0.0%) | 0 (0.0%) |
| Finance & Insurance | 0 (0.0%) | 7 (100.0%) |
| Real Estate, Rental & Leasing | 0 (0.0%) | 0 (0.0%) |
| Professional & Scientific | 0 (0.0%) | 2 (100.0%) |
| Enterprise Management | 0 (0.0%) | 0 (0.0%) |
| Administrative & Support | 70 (100.0%) | 0 (0.0%) |
| Educational Services | 24 (14.7%) | 139 (85.3%) |
| Health Care & Social Assistance | 83 (39.5%) | 127 (60.5%) |
| Arts, Entertainment & Recreation | 0 (0.0%) | 7 (100.0%) |
| Accommodation & Food Services | 84 (50.3%) | 83 (49.7%) |
| Public Administration | 49 (29.5%) | 117 (70.5%) |
| Total | 977 (59.8%) | 657 (40.2%) |
Education in Guadalupe County
School Enrollment in Guadalupe County
The most common levels of schooling among the 822 students in Guadalupe County are high school (222 | 27.0%), middle school (187 | 22.8%), and kindergarten (160 | 19.5%).
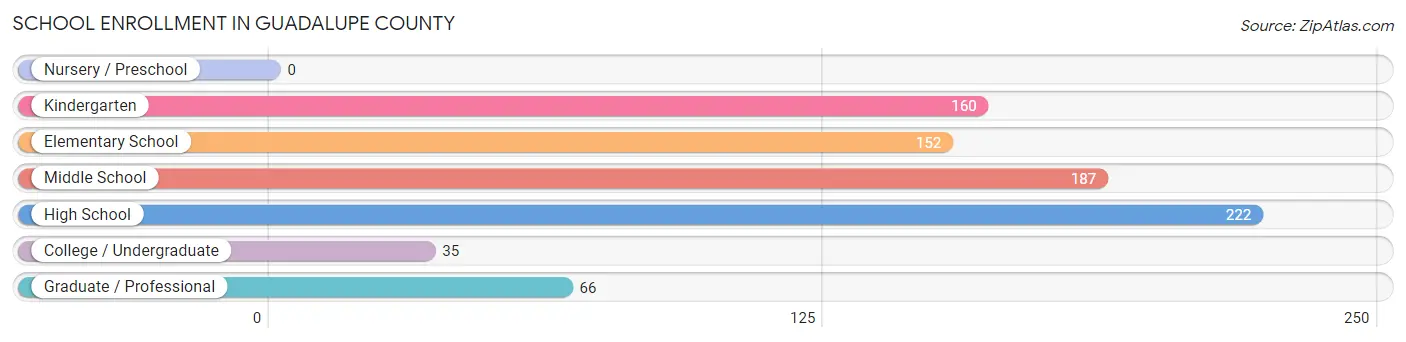
| School Level | # Students | % Students |
| Nursery / Preschool | 0 | 0.0% |
| Kindergarten | 160 | 19.5% |
| Elementary School | 152 | 18.5% |
| Middle School | 187 | 22.8% |
| High School | 222 | 27.0% |
| College / Undergraduate | 35 | 4.3% |
| Graduate / Professional | 66 | 8.0% |
| Total | 822 | 100.0% |
School Enrollment by Age by Funding Source in Guadalupe County
Out of a total of 822 students who are enrolled in schools in Guadalupe County, 78 (9.5%) attend a private institution, while the remaining 744 (90.5%) are enrolled in public schools. The age group of 25 to 34 year olds has the highest likelihood of being enrolled in private schools, with 33 (63.5% in the age bracket) enrolled. Conversely, the age group of 5 to 9 year old has the lowest likelihood of being enrolled in a private school, with 305 (100.0% in the age bracket) attending a public institution.
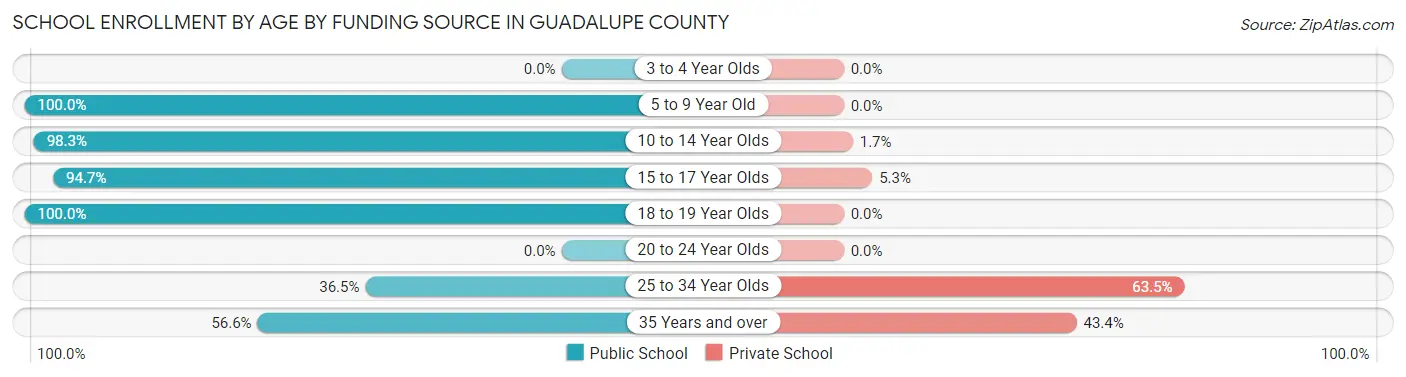
| Age Bracket | Public School | Private School |
| 3 to 4 Year Olds | 0 (0.0%) | 0 (0.0%) |
| 5 to 9 Year Old | 305 (100.0%) | 0 (0.0%) |
| 10 to 14 Year Olds | 231 (98.3%) | 4 (1.7%) |
| 15 to 17 Year Olds | 89 (94.7%) | 5 (5.3%) |
| 18 to 19 Year Olds | 53 (100.0%) | 0 (0.0%) |
| 20 to 24 Year Olds | 0 (0.0%) | 0 (0.0%) |
| 25 to 34 Year Olds | 19 (36.5%) | 33 (63.5%) |
| 35 Years and over | 47 (56.6%) | 36 (43.4%) |
| Total | 744 (90.5%) | 78 (9.5%) |
Educational Attainment by Field of Study in Guadalupe County
Science & technology (126 | 25.7%), social sciences (110 | 22.4%), education (85 | 17.3%), bio, nature & agricultural (47 | 9.6%), and arts & humanities (27 | 5.5%) are the most common fields of study among 491 individuals in Guadalupe County who have obtained a bachelor's degree or higher.
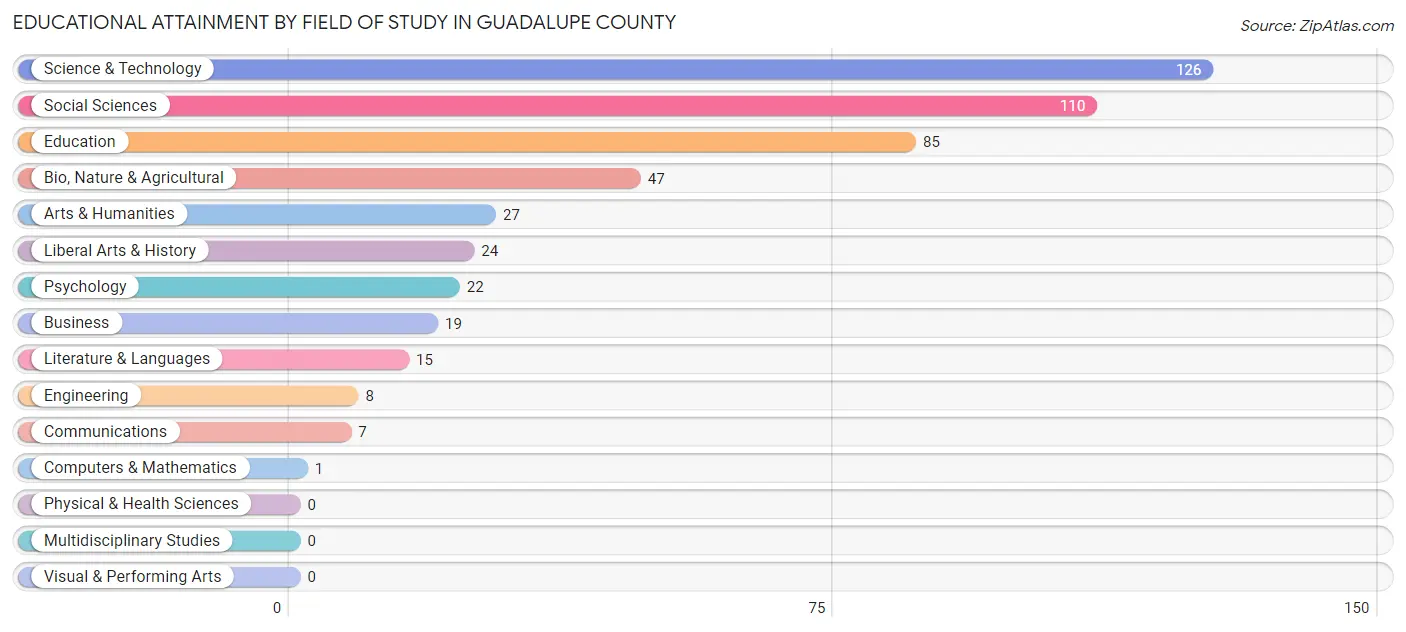
| Field of Study | # Graduates | % Graduates |
| Computers & Mathematics | 1 | 0.2% |
| Bio, Nature & Agricultural | 47 | 9.6% |
| Physical & Health Sciences | 0 | 0.0% |
| Psychology | 22 | 4.5% |
| Social Sciences | 110 | 22.4% |
| Engineering | 8 | 1.6% |
| Multidisciplinary Studies | 0 | 0.0% |
| Science & Technology | 126 | 25.7% |
| Business | 19 | 3.9% |
| Education | 85 | 17.3% |
| Literature & Languages | 15 | 3.0% |
| Liberal Arts & History | 24 | 4.9% |
| Visual & Performing Arts | 0 | 0.0% |
| Communications | 7 | 1.4% |
| Arts & Humanities | 27 | 5.5% |
| Total | 491 | 100.0% |
Transportation & Commute in Guadalupe County
Vehicle Availability by Sex in Guadalupe County
The most prevalent vehicle ownership categories in Guadalupe County are males with 2 vehicles (301, accounting for 36.8%) and females with 2 vehicles (111, making up 46.0%).
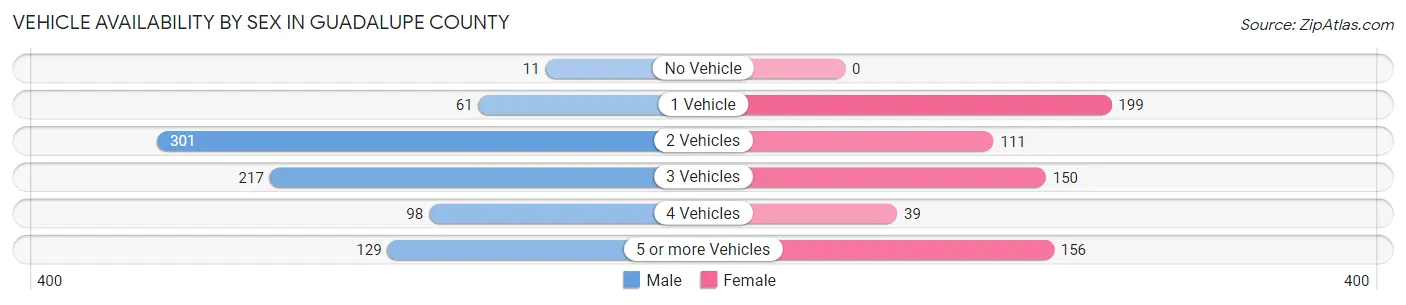
| Vehicles Available | Male | Female |
| No Vehicle | 11 (1.3%) | 0 (0.0%) |
| 1 Vehicle | 61 (7.5%) | 199 (30.4%) |
| 2 Vehicles | 301 (36.8%) | 111 (17.0%) |
| 3 Vehicles | 217 (26.6%) | 150 (22.9%) |
| 4 Vehicles | 98 (12.0%) | 39 (5.9%) |
| 5 or more Vehicles | 129 (15.8%) | 156 (23.8%) |
| Total | 817 (100.0%) | 655 (100.0%) |
Commute Time in Guadalupe County
The most frequently occuring commute durations in Guadalupe County are 5 to 9 minutes (395 commuters, 27.3%), less than 5 minutes (299 commuters, 20.6%), and 15 to 19 minutes (209 commuters, 14.4%).
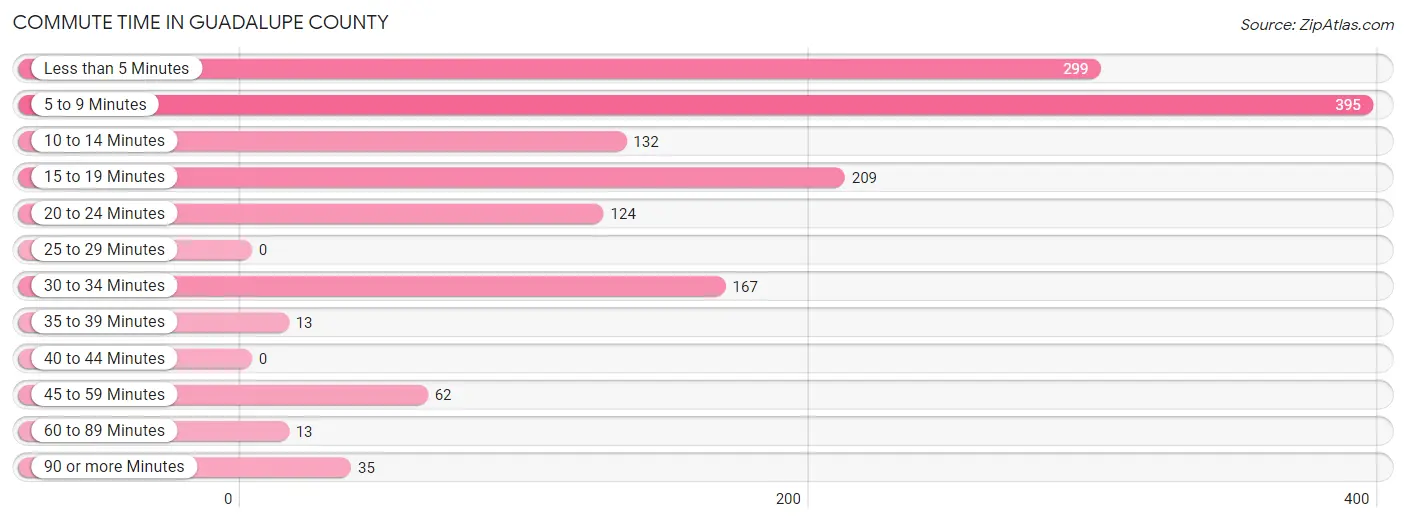
| Commute Time | # Commuters | % Commuters |
| Less than 5 Minutes | 299 | 20.6% |
| 5 to 9 Minutes | 395 | 27.3% |
| 10 to 14 Minutes | 132 | 9.1% |
| 15 to 19 Minutes | 209 | 14.4% |
| 20 to 24 Minutes | 124 | 8.6% |
| 25 to 29 Minutes | 0 | 0.0% |
| 30 to 34 Minutes | 167 | 11.5% |
| 35 to 39 Minutes | 13 | 0.9% |
| 40 to 44 Minutes | 0 | 0.0% |
| 45 to 59 Minutes | 62 | 4.3% |
| 60 to 89 Minutes | 13 | 0.9% |
| 90 or more Minutes | 35 | 2.4% |
Commute Time by Sex in Guadalupe County
The most common commute times in Guadalupe County are 5 to 9 minutes (186 commuters, 22.9%) for males and 5 to 9 minutes (209 commuters, 32.8%) for females.
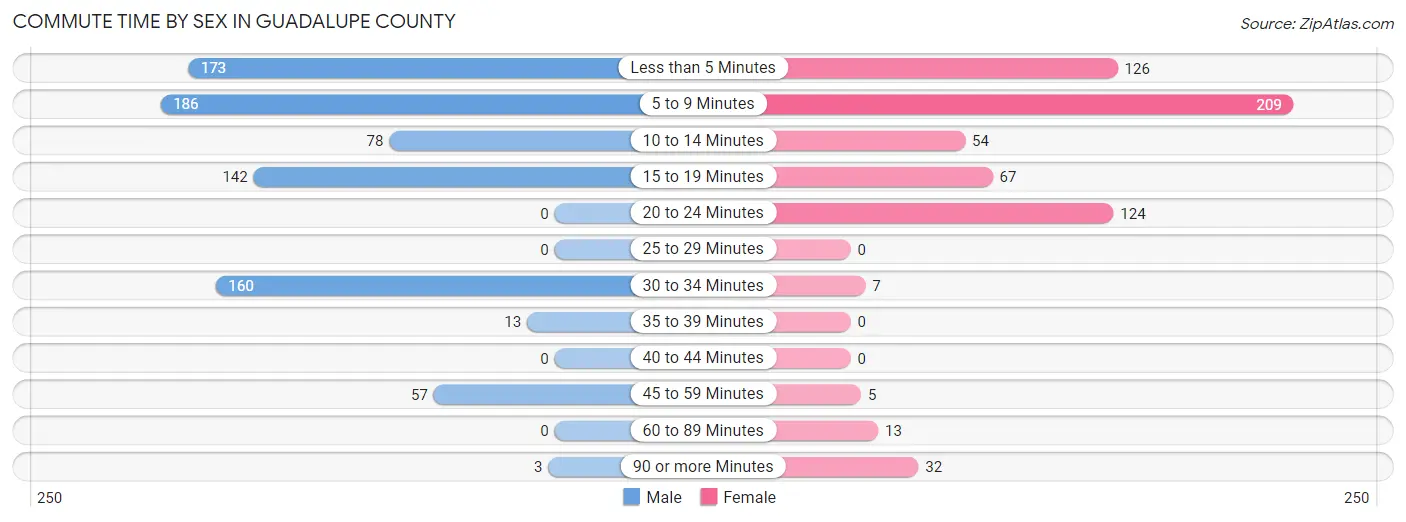
| Commute Time | Male | Female |
| Less than 5 Minutes | 173 (21.3%) | 126 (19.8%) |
| 5 to 9 Minutes | 186 (22.9%) | 209 (32.8%) |
| 10 to 14 Minutes | 78 (9.6%) | 54 (8.5%) |
| 15 to 19 Minutes | 142 (17.5%) | 67 (10.5%) |
| 20 to 24 Minutes | 0 (0.0%) | 124 (19.5%) |
| 25 to 29 Minutes | 0 (0.0%) | 0 (0.0%) |
| 30 to 34 Minutes | 160 (19.7%) | 7 (1.1%) |
| 35 to 39 Minutes | 13 (1.6%) | 0 (0.0%) |
| 40 to 44 Minutes | 0 (0.0%) | 0 (0.0%) |
| 45 to 59 Minutes | 57 (7.0%) | 5 (0.8%) |
| 60 to 89 Minutes | 0 (0.0%) | 13 (2.0%) |
| 90 or more Minutes | 3 (0.4%) | 32 (5.0%) |
Time of Departure to Work by Sex in Guadalupe County
The most frequent times of departure to work in Guadalupe County are 6:30 AM to 6:59 AM (154, 19.0%) for males and 6:30 AM to 6:59 AM (182, 28.6%) for females.
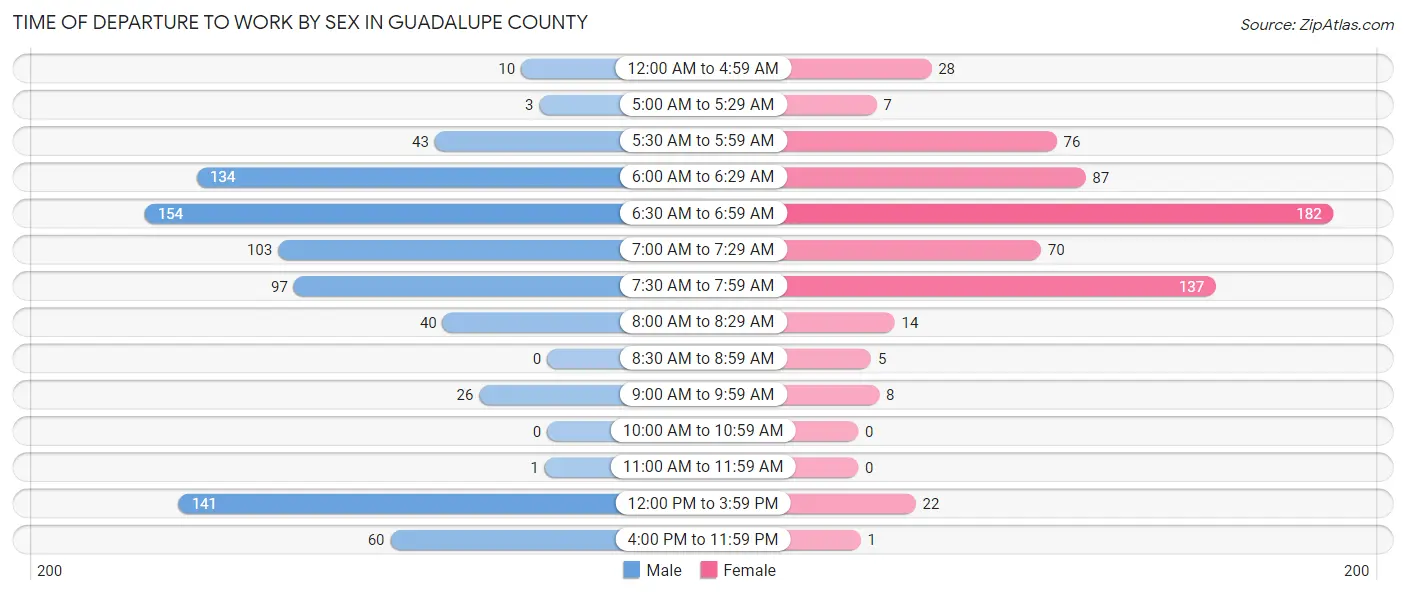
| Time of Departure | Male | Female |
| 12:00 AM to 4:59 AM | 10 (1.2%) | 28 (4.4%) |
| 5:00 AM to 5:29 AM | 3 (0.4%) | 7 (1.1%) |
| 5:30 AM to 5:59 AM | 43 (5.3%) | 76 (11.9%) |
| 6:00 AM to 6:29 AM | 134 (16.5%) | 87 (13.7%) |
| 6:30 AM to 6:59 AM | 154 (19.0%) | 182 (28.6%) |
| 7:00 AM to 7:29 AM | 103 (12.7%) | 70 (11.0%) |
| 7:30 AM to 7:59 AM | 97 (11.9%) | 137 (21.5%) |
| 8:00 AM to 8:29 AM | 40 (4.9%) | 14 (2.2%) |
| 8:30 AM to 8:59 AM | 0 (0.0%) | 5 (0.8%) |
| 9:00 AM to 9:59 AM | 26 (3.2%) | 8 (1.3%) |
| 10:00 AM to 10:59 AM | 0 (0.0%) | 0 (0.0%) |
| 11:00 AM to 11:59 AM | 1 (0.1%) | 0 (0.0%) |
| 12:00 PM to 3:59 PM | 141 (17.4%) | 22 (3.5%) |
| 4:00 PM to 11:59 PM | 60 (7.4%) | 1 (0.2%) |
| Total | 812 (100.0%) | 637 (100.0%) |
Housing Occupancy in Guadalupe County
Occupancy by Ownership in Guadalupe County
Of the total 1,295 dwellings in Guadalupe County, owner-occupied units account for 1,013 (78.2%), while renter-occupied units make up 282 (21.8%).
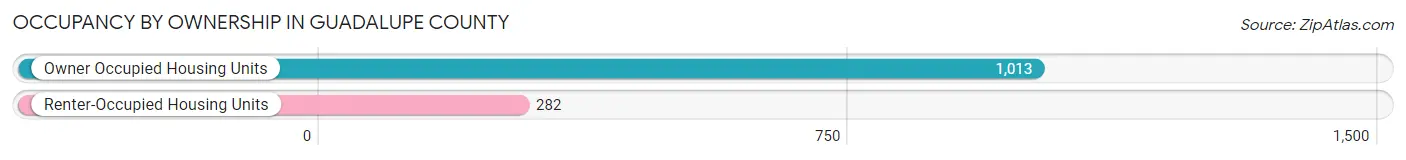
| Occupancy | # Housing Units | % Housing Units |
| Owner Occupied Housing Units | 1,013 | 78.2% |
| Renter-Occupied Housing Units | 282 | 21.8% |
| Total Occupied Housing Units | 1,295 | 100.0% |
Occupancy by Household Size in Guadalupe County
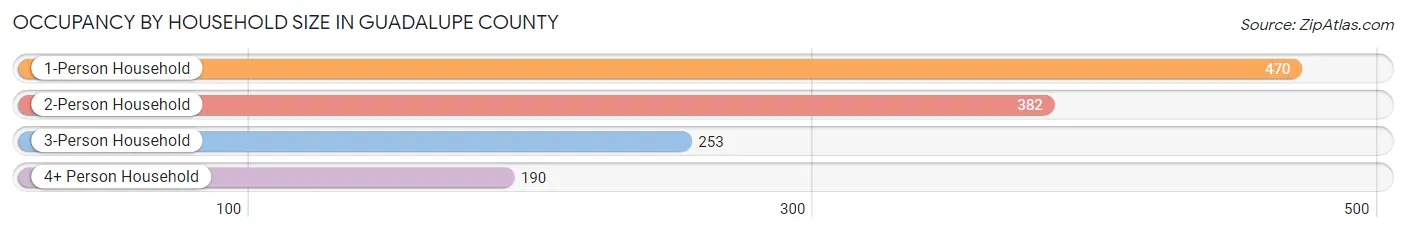
| Household Size | # Housing Units | % Housing Units |
| 1-Person Household | 470 | 36.3% |
| 2-Person Household | 382 | 29.5% |
| 3-Person Household | 253 | 19.5% |
| 4+ Person Household | 190 | 14.7% |
| Total Housing Units | 1,295 | 100.0% |
Occupancy by Ownership by Household Size in Guadalupe County
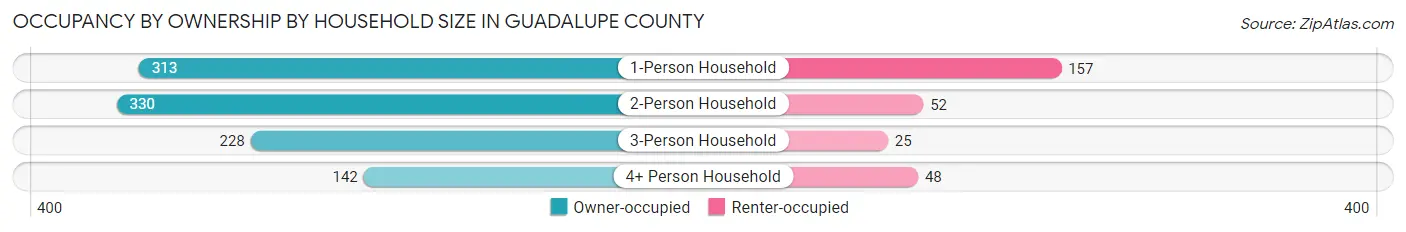
| Household Size | Owner-occupied | Renter-occupied |
| 1-Person Household | 313 (66.6%) | 157 (33.4%) |
| 2-Person Household | 330 (86.4%) | 52 (13.6%) |
| 3-Person Household | 228 (90.1%) | 25 (9.9%) |
| 4+ Person Household | 142 (74.7%) | 48 (25.3%) |
| Total Housing Units | 1,013 (78.2%) | 282 (21.8%) |
Occupancy by Educational Attainment in Guadalupe County
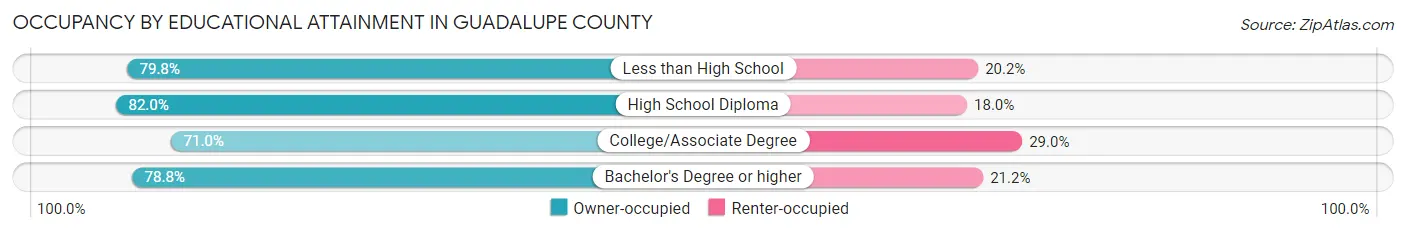
| Household Size | Owner-occupied | Renter-occupied |
| Less than High School | 138 (79.8%) | 35 (20.2%) |
| High School Diploma | 500 (82.0%) | 110 (18.0%) |
| College/Associate Degree | 260 (71.0%) | 106 (29.0%) |
| Bachelor's Degree or higher | 115 (78.8%) | 31 (21.2%) |
Occupancy by Age of Householder in Guadalupe County
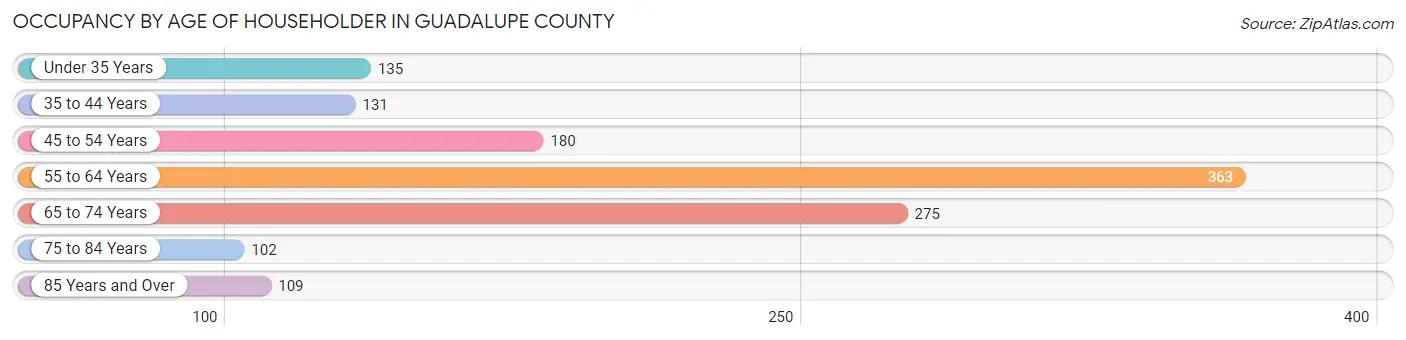
| Age Bracket | # Households | % Households |
| Under 35 Years | 135 | 10.4% |
| 35 to 44 Years | 131 | 10.1% |
| 45 to 54 Years | 180 | 13.9% |
| 55 to 64 Years | 363 | 28.0% |
| 65 to 74 Years | 275 | 21.2% |
| 75 to 84 Years | 102 | 7.9% |
| 85 Years and Over | 109 | 8.4% |
| Total | 1,295 | 100.0% |
Housing Finances in Guadalupe County
Median Income by Occupancy in Guadalupe County
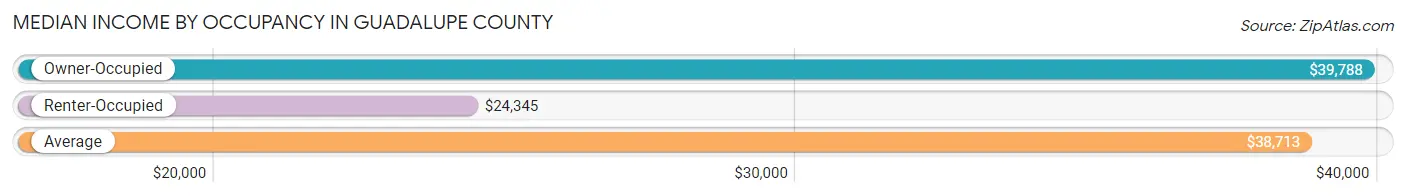
| Occupancy Type | # Households | Median Income |
| Owner-Occupied | 1,013 (78.2%) | $39,788 |
| Renter-Occupied | 282 (21.8%) | $24,345 |
| Average | 1,295 (100.0%) | $38,713 |
Occupancy by Householder Income Bracket in Guadalupe County
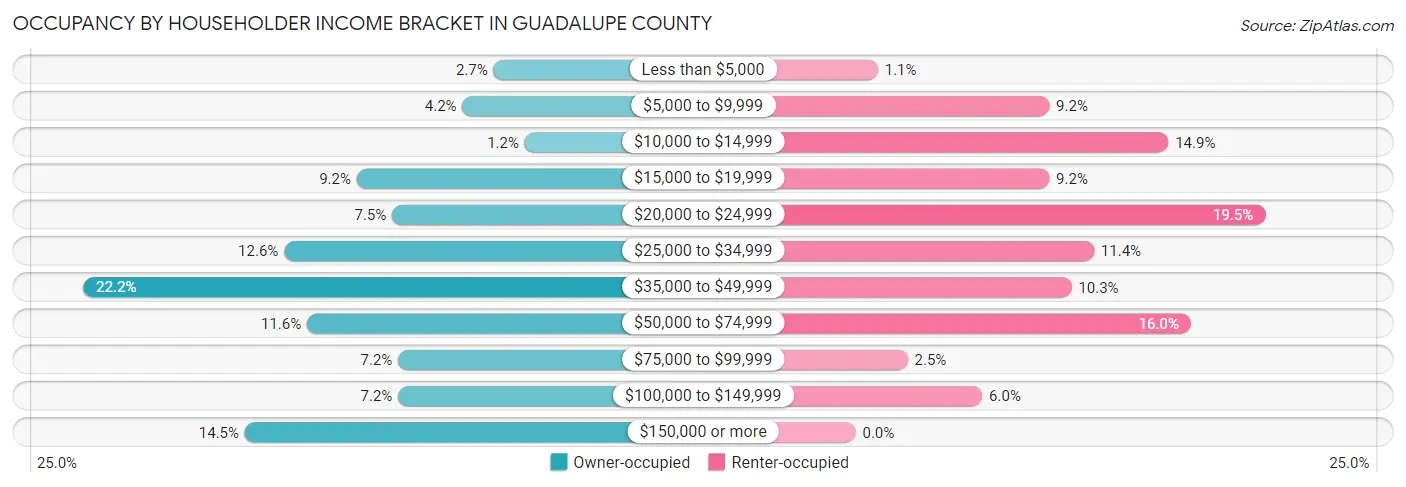
| Income Bracket | Owner-occupied | Renter-occupied |
| Less than $5,000 | 27 (2.7%) | 3 (1.1%) |
| $5,000 to $9,999 | 42 (4.2%) | 26 (9.2%) |
| $10,000 to $14,999 | 12 (1.2%) | 42 (14.9%) |
| $15,000 to $19,999 | 93 (9.2%) | 26 (9.2%) |
| $20,000 to $24,999 | 76 (7.5%) | 55 (19.5%) |
| $25,000 to $34,999 | 128 (12.6%) | 32 (11.4%) |
| $35,000 to $49,999 | 225 (22.2%) | 29 (10.3%) |
| $50,000 to $74,999 | 117 (11.6%) | 45 (16.0%) |
| $75,000 to $99,999 | 73 (7.2%) | 7 (2.5%) |
| $100,000 to $149,999 | 73 (7.2%) | 17 (6.0%) |
| $150,000 or more | 147 (14.5%) | 0 (0.0%) |
| Total | 1,013 (100.0%) | 282 (100.0%) |
Monthly Housing Cost Tiers in Guadalupe County
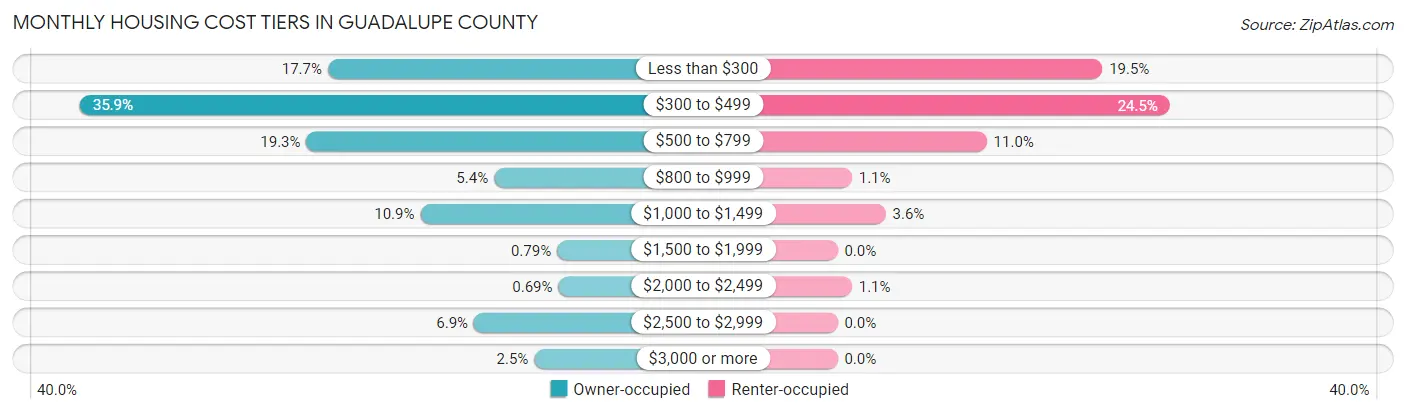
| Monthly Cost | Owner-occupied | Renter-occupied |
| Less than $300 | 179 (17.7%) | 55 (19.5%) |
| $300 to $499 | 364 (35.9%) | 69 (24.5%) |
| $500 to $799 | 195 (19.3%) | 31 (11.0%) |
| $800 to $999 | 55 (5.4%) | 3 (1.1%) |
| $1,000 to $1,499 | 110 (10.9%) | 10 (3.5%) |
| $1,500 to $1,999 | 8 (0.8%) | 0 (0.0%) |
| $2,000 to $2,499 | 7 (0.7%) | 3 (1.1%) |
| $2,500 to $2,999 | 70 (6.9%) | 0 (0.0%) |
| $3,000 or more | 25 (2.5%) | 0 (0.0%) |
| Total | 1,013 (100.0%) | 282 (100.0%) |
Physical Housing Characteristics in Guadalupe County
Housing Structures in Guadalupe County
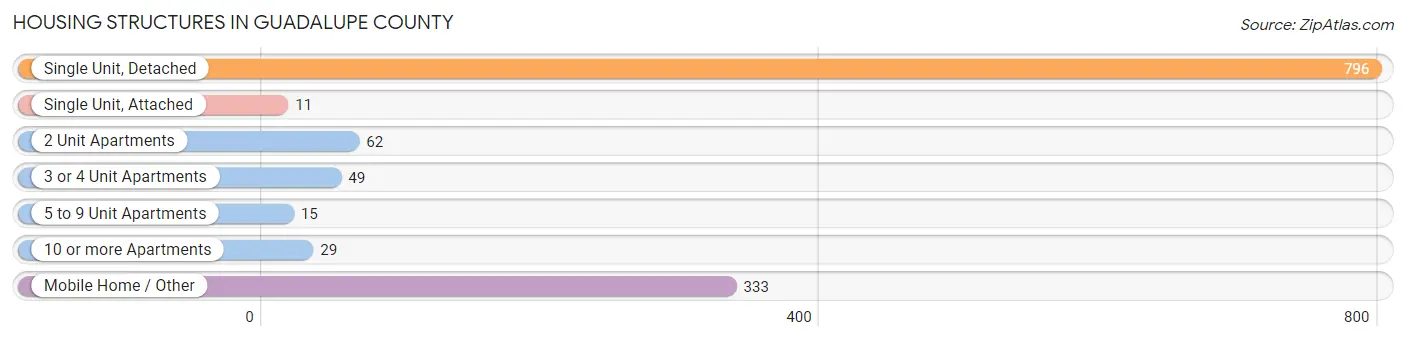
| Structure Type | # Housing Units | % Housing Units |
| Single Unit, Detached | 796 | 61.5% |
| Single Unit, Attached | 11 | 0.9% |
| 2 Unit Apartments | 62 | 4.8% |
| 3 or 4 Unit Apartments | 49 | 3.8% |
| 5 to 9 Unit Apartments | 15 | 1.2% |
| 10 or more Apartments | 29 | 2.2% |
| Mobile Home / Other | 333 | 25.7% |
| Total | 1,295 | 100.0% |
Housing Structures by Occupancy in Guadalupe County
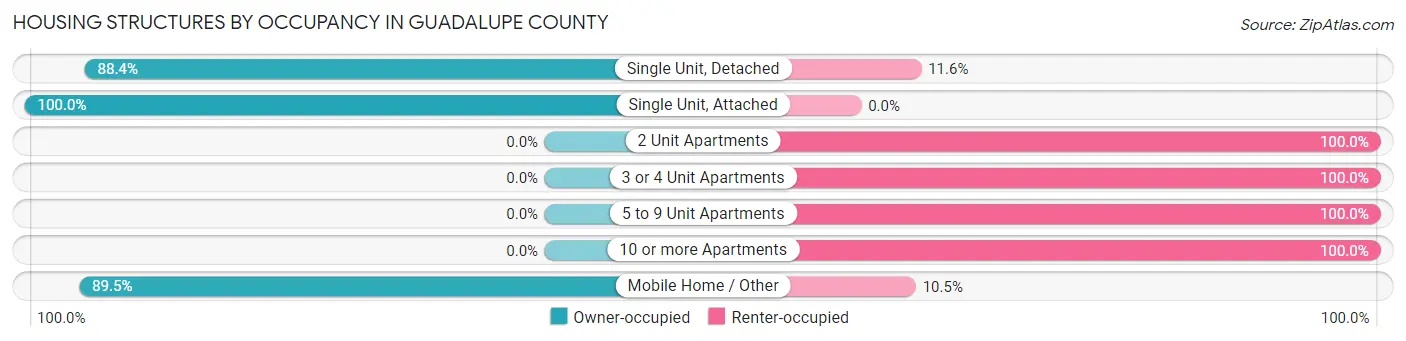
| Structure Type | Owner-occupied | Renter-occupied |
| Single Unit, Detached | 704 (88.4%) | 92 (11.6%) |
| Single Unit, Attached | 11 (100.0%) | 0 (0.0%) |
| 2 Unit Apartments | 0 (0.0%) | 62 (100.0%) |
| 3 or 4 Unit Apartments | 0 (0.0%) | 49 (100.0%) |
| 5 to 9 Unit Apartments | 0 (0.0%) | 15 (100.0%) |
| 10 or more Apartments | 0 (0.0%) | 29 (100.0%) |
| Mobile Home / Other | 298 (89.5%) | 35 (10.5%) |
| Total | 1,013 (78.2%) | 282 (21.8%) |
Housing Structures by Number of Rooms in Guadalupe County
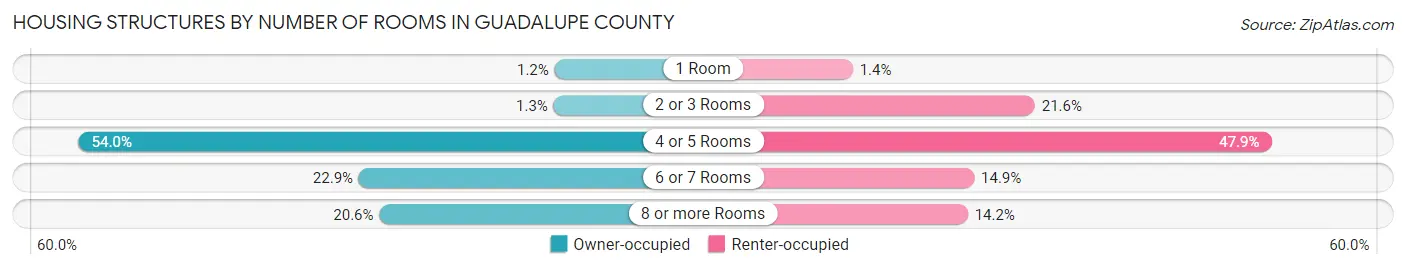
| Number of Rooms | Owner-occupied | Renter-occupied |
| 1 Room | 12 (1.2%) | 4 (1.4%) |
| 2 or 3 Rooms | 13 (1.3%) | 61 (21.6%) |
| 4 or 5 Rooms | 547 (54.0%) | 135 (47.9%) |
| 6 or 7 Rooms | 232 (22.9%) | 42 (14.9%) |
| 8 or more Rooms | 209 (20.6%) | 40 (14.2%) |
| Total | 1,013 (100.0%) | 282 (100.0%) |
Housing Structure by Heating Type in Guadalupe County
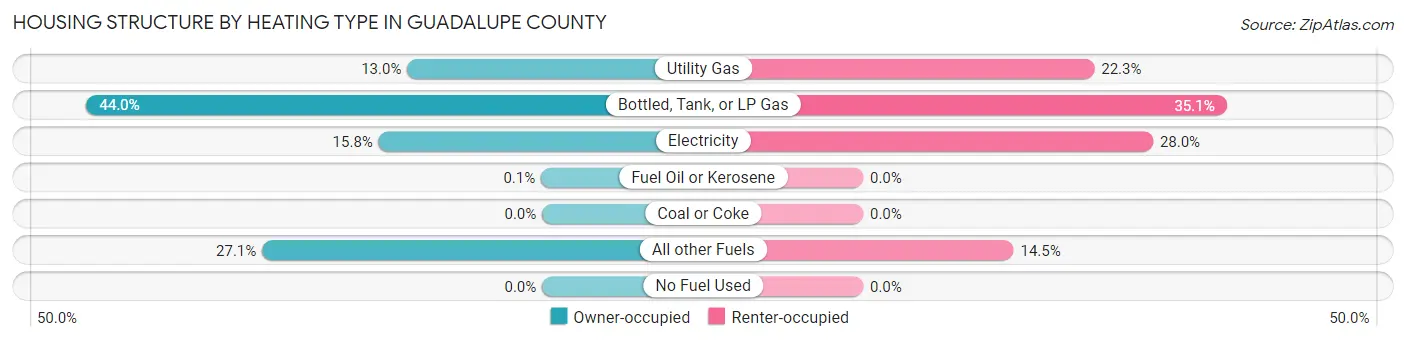
| Heating Type | Owner-occupied | Renter-occupied |
| Utility Gas | 132 (13.0%) | 63 (22.3%) |
| Bottled, Tank, or LP Gas | 446 (44.0%) | 99 (35.1%) |
| Electricity | 160 (15.8%) | 79 (28.0%) |
| Fuel Oil or Kerosene | 1 (0.1%) | 0 (0.0%) |
| Coal or Coke | 0 (0.0%) | 0 (0.0%) |
| All other Fuels | 274 (27.1%) | 41 (14.5%) |
| No Fuel Used | 0 (0.0%) | 0 (0.0%) |
| Total | 1,013 (100.0%) | 282 (100.0%) |
Household Vehicle Usage in Guadalupe County
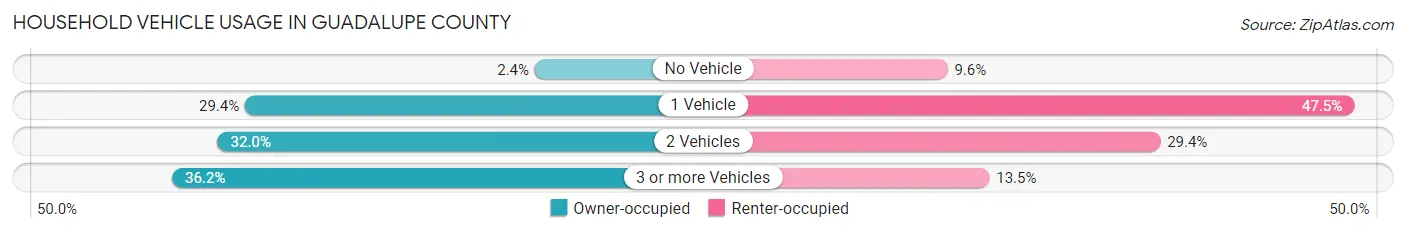
| Vehicles per Household | Owner-occupied | Renter-occupied |
| No Vehicle | 24 (2.4%) | 27 (9.6%) |
| 1 Vehicle | 298 (29.4%) | 134 (47.5%) |
| 2 Vehicles | 324 (32.0%) | 83 (29.4%) |
| 3 or more Vehicles | 367 (36.2%) | 38 (13.5%) |
| Total | 1,013 (100.0%) | 282 (100.0%) |
Real Estate & Mortgages in Guadalupe County
Real Estate and Mortgage Overview in Guadalupe County
| Characteristic | Without Mortgage | With Mortgage |
| Housing Units | 735 | 278 |
| Median Property Value | $111,000 | $166,100 |
| Median Household Income | $37,344 | $134 |
| Monthly Housing Costs | $415 | $25 |
| Real Estate Taxes | $396 | $5 |
Property Value by Mortgage Status in Guadalupe County
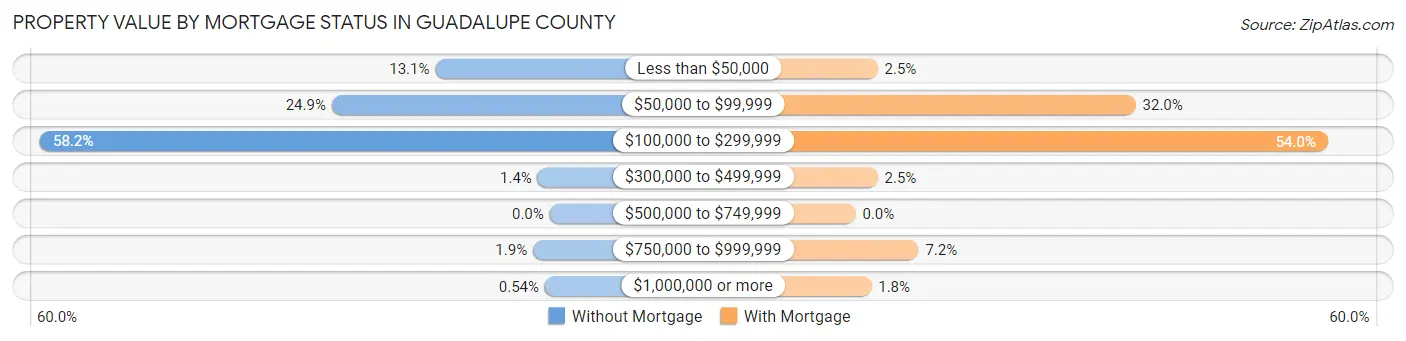
| Property Value | Without Mortgage | With Mortgage |
| Less than $50,000 | 96 (13.1%) | 7 (2.5%) |
| $50,000 to $99,999 | 183 (24.9%) | 89 (32.0%) |
| $100,000 to $299,999 | 428 (58.2%) | 150 (54.0%) |
| $300,000 to $499,999 | 10 (1.4%) | 7 (2.5%) |
| $500,000 to $749,999 | 0 (0.0%) | 0 (0.0%) |
| $750,000 to $999,999 | 14 (1.9%) | 20 (7.2%) |
| $1,000,000 or more | 4 (0.5%) | 5 (1.8%) |
| Total | 735 (100.0%) | 278 (100.0%) |
Household Income by Mortgage Status in Guadalupe County
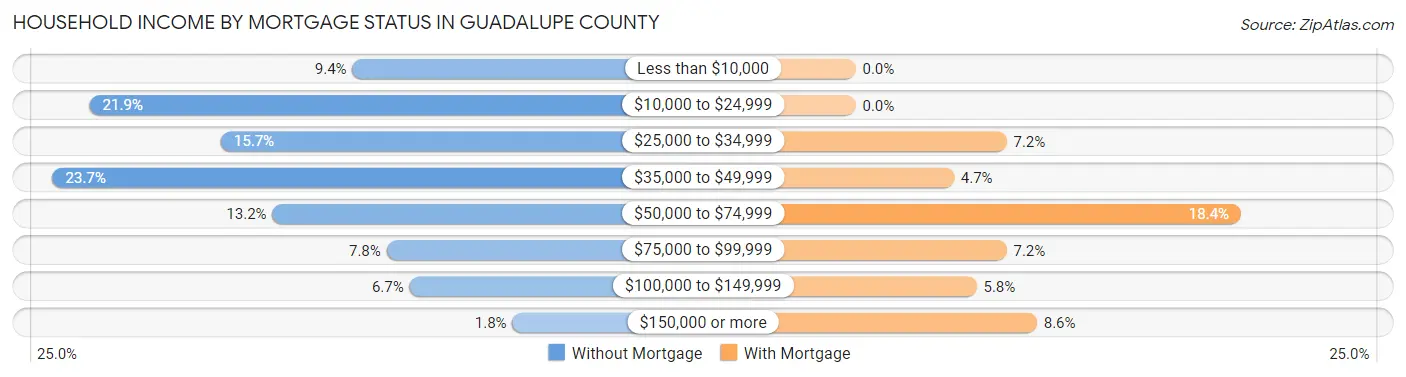
| Household Income | Without Mortgage | With Mortgage |
| Less than $10,000 | 69 (9.4%) | 0 (0.0%) |
| $10,000 to $24,999 | 161 (21.9%) | 0 (0.0%) |
| $25,000 to $34,999 | 115 (15.7%) | 20 (7.2%) |
| $35,000 to $49,999 | 174 (23.7%) | 13 (4.7%) |
| $50,000 to $74,999 | 97 (13.2%) | 51 (18.3%) |
| $75,000 to $99,999 | 57 (7.8%) | 20 (7.2%) |
| $100,000 to $149,999 | 49 (6.7%) | 16 (5.8%) |
| $150,000 or more | 13 (1.8%) | 24 (8.6%) |
| Total | 735 (100.0%) | 278 (100.0%) |
Property Value to Household Income Ratio in Guadalupe County
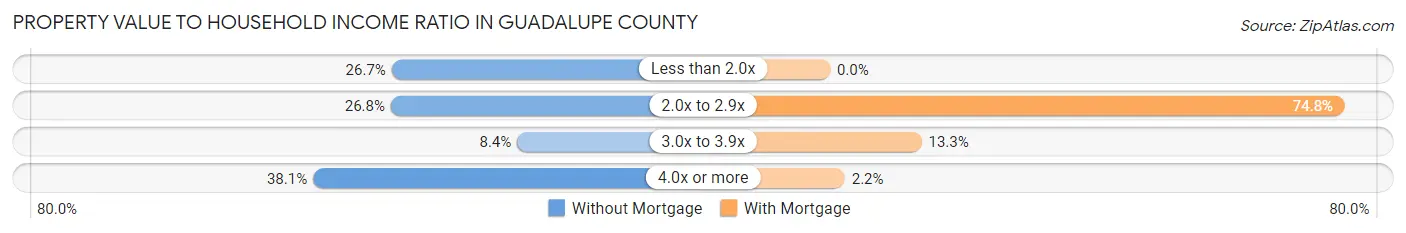
| Value-to-Income Ratio | Without Mortgage | With Mortgage |
| Less than 2.0x | 196 (26.7%) | 0 (0.0%) |
| 2.0x to 2.9x | 197 (26.8%) | 208 (74.8%) |
| 3.0x to 3.9x | 62 (8.4%) | 37 (13.3%) |
| 4.0x or more | 280 (38.1%) | 6 (2.2%) |
| Total | 735 (100.0%) | 278 (100.0%) |
Real Estate Taxes by Mortgage Status in Guadalupe County
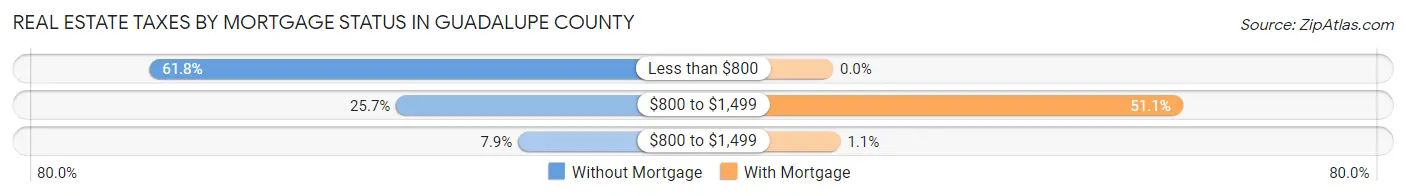
| Property Taxes | Without Mortgage | With Mortgage |
| Less than $800 | 454 (61.8%) | 0 (0.0%) |
| $800 to $1,499 | 189 (25.7%) | 142 (51.1%) |
| $800 to $1,499 | 58 (7.9%) | 3 (1.1%) |
| Total | 735 (100.0%) | 278 (100.0%) |
Health & Disability in Guadalupe County
Health Insurance Coverage by Age in Guadalupe County
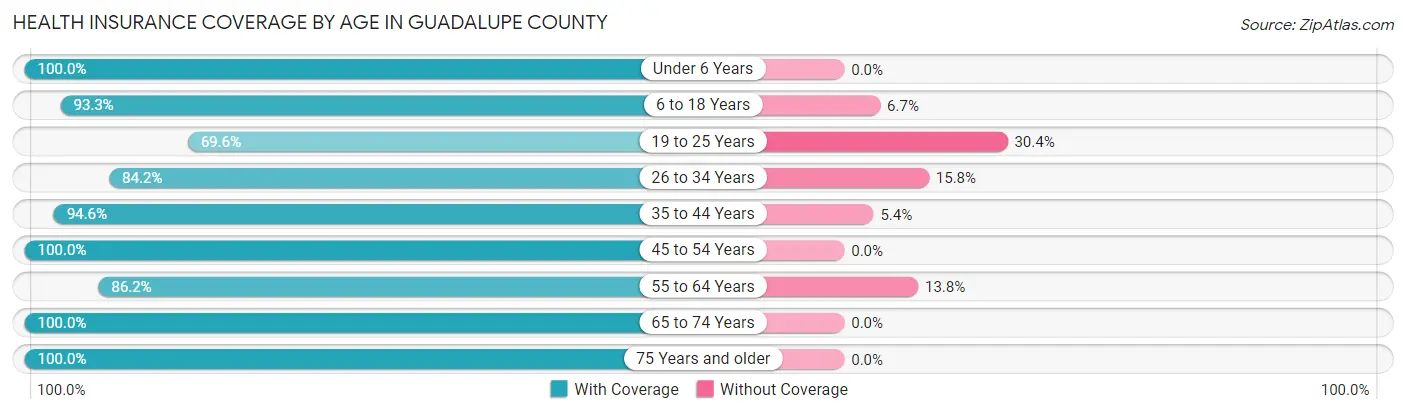
| Age Bracket | With Coverage | Without Coverage |
| Under 6 Years | 289 (100.0%) | 0 (0.0%) |
| 6 to 18 Years | 544 (93.3%) | 39 (6.7%) |
| 19 to 25 Years | 128 (69.6%) | 56 (30.4%) |
| 26 to 34 Years | 251 (84.2%) | 47 (15.8%) |
| 35 to 44 Years | 591 (94.6%) | 34 (5.4%) |
| 45 to 54 Years | 397 (100.0%) | 0 (0.0%) |
| 55 to 64 Years | 558 (86.2%) | 89 (13.8%) |
| 65 to 74 Years | 510 (100.0%) | 0 (0.0%) |
| 75 Years and older | 344 (100.0%) | 0 (0.0%) |
| Total | 3,612 (93.2%) | 265 (6.8%) |
Health Insurance Coverage by Citizenship Status in Guadalupe County
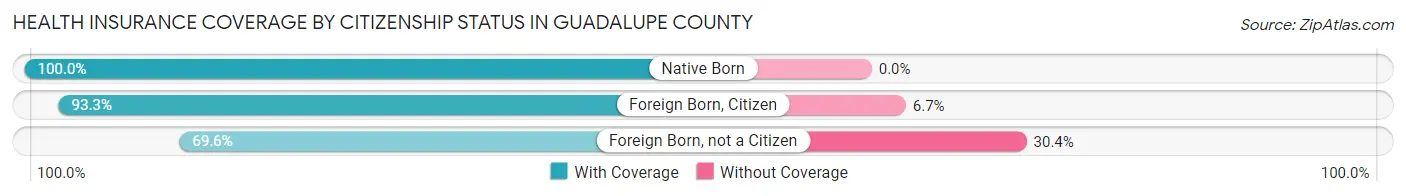
| Citizenship Status | With Coverage | Without Coverage |
| Native Born | 289 (100.0%) | 0 (0.0%) |
| Foreign Born, Citizen | 544 (93.3%) | 39 (6.7%) |
| Foreign Born, not a Citizen | 128 (69.6%) | 56 (30.4%) |
Health Insurance Coverage by Household Income in Guadalupe County
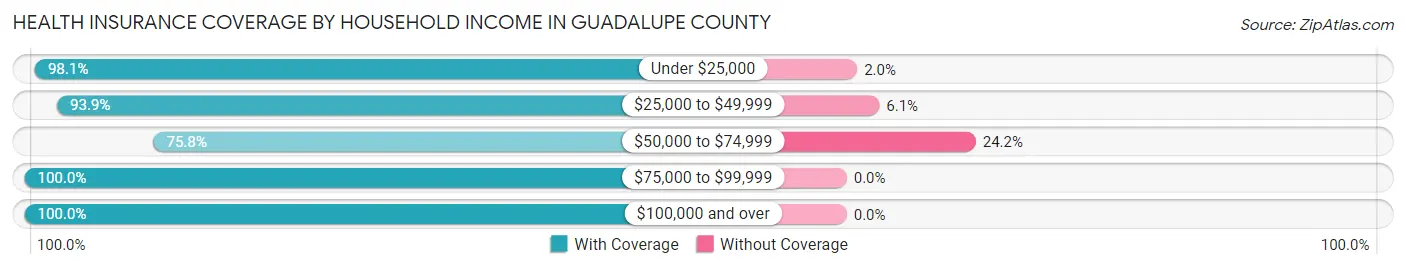
| Household Income | With Coverage | Without Coverage |
| Under $25,000 | 805 (98.1%) | 16 (1.9%) |
| $25,000 to $49,999 | 1,016 (93.9%) | 66 (6.1%) |
| $50,000 to $74,999 | 574 (75.8%) | 183 (24.2%) |
| $75,000 to $99,999 | 229 (100.0%) | 0 (0.0%) |
| $100,000 and over | 910 (100.0%) | 0 (0.0%) |
Public vs Private Health Insurance Coverage by Age in Guadalupe County
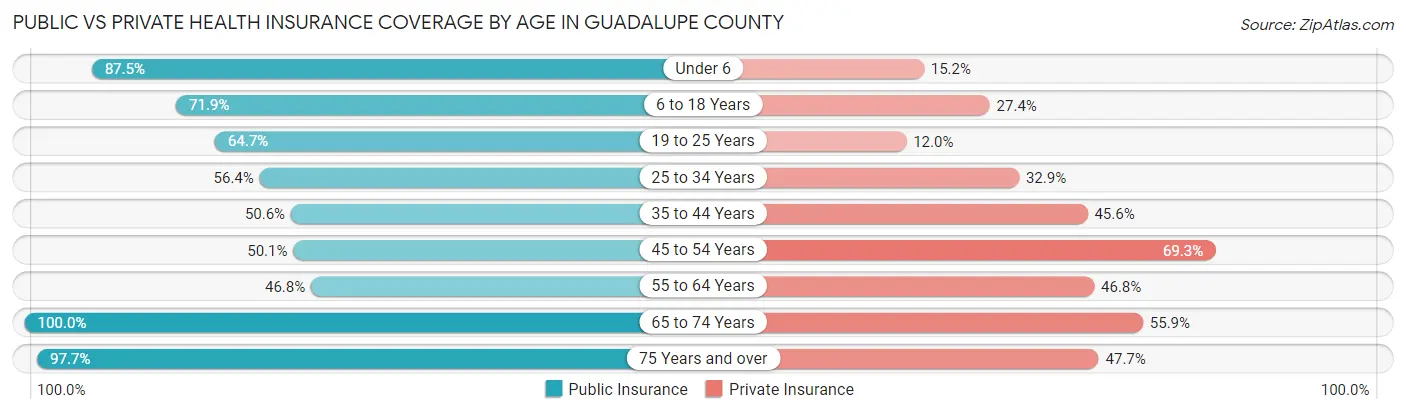
| Age Bracket | Public Insurance | Private Insurance |
| Under 6 | 253 (87.5%) | 44 (15.2%) |
| 6 to 18 Years | 419 (71.9%) | 160 (27.4%) |
| 19 to 25 Years | 119 (64.7%) | 22 (12.0%) |
| 25 to 34 Years | 168 (56.4%) | 98 (32.9%) |
| 35 to 44 Years | 316 (50.6%) | 285 (45.6%) |
| 45 to 54 Years | 199 (50.1%) | 275 (69.3%) |
| 55 to 64 Years | 303 (46.8%) | 303 (46.8%) |
| 65 to 74 Years | 510 (100.0%) | 285 (55.9%) |
| 75 Years and over | 336 (97.7%) | 164 (47.7%) |
| Total | 2,623 (67.7%) | 1,636 (42.2%) |
Disability Status by Sex by Age in Guadalupe County
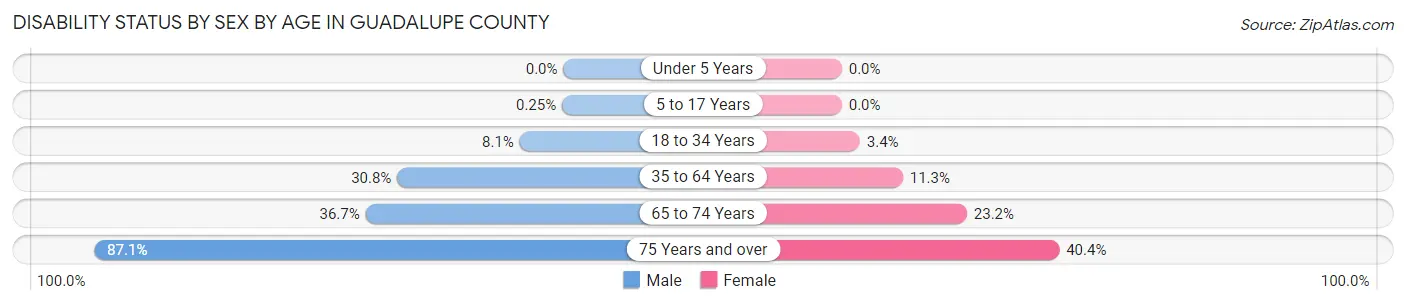
| Age Bracket | Male | Female |
| Under 5 Years | 0 (0.0%) | 0 (0.0%) |
| 5 to 17 Years | 1 (0.3%) | 0 (0.0%) |
| 18 to 34 Years | 24 (8.1%) | 8 (3.4%) |
| 35 to 64 Years | 256 (30.8%) | 95 (11.3%) |
| 65 to 74 Years | 105 (36.7%) | 52 (23.2%) |
| 75 Years and over | 155 (87.1%) | 67 (40.4%) |
Disability Class by Sex by Age in Guadalupe County
Disability Class: Hearing Difficulty
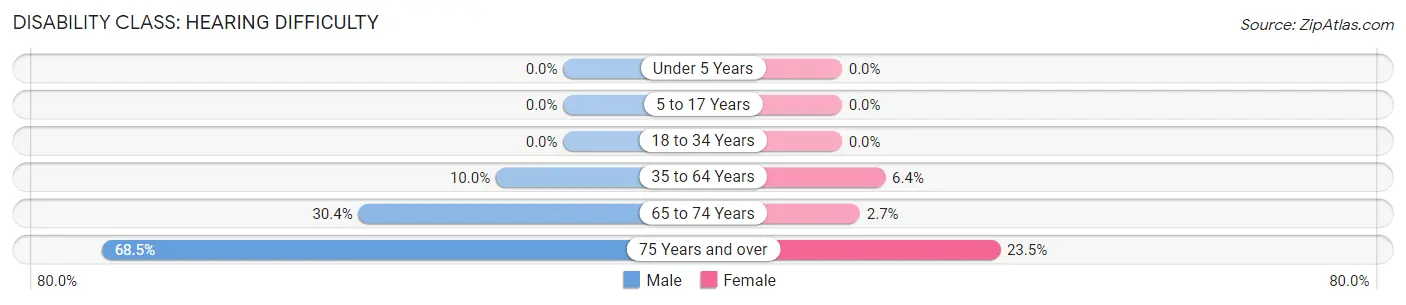
| Age Bracket | Male | Female |
| Under 5 Years | 0 (0.0%) | 0 (0.0%) |
| 5 to 17 Years | 0 (0.0%) | 0 (0.0%) |
| 18 to 34 Years | 0 (0.0%) | 0 (0.0%) |
| 35 to 64 Years | 83 (10.0%) | 54 (6.4%) |
| 65 to 74 Years | 87 (30.4%) | 6 (2.7%) |
| 75 Years and over | 122 (68.5%) | 39 (23.5%) |
Disability Class: Vision Difficulty
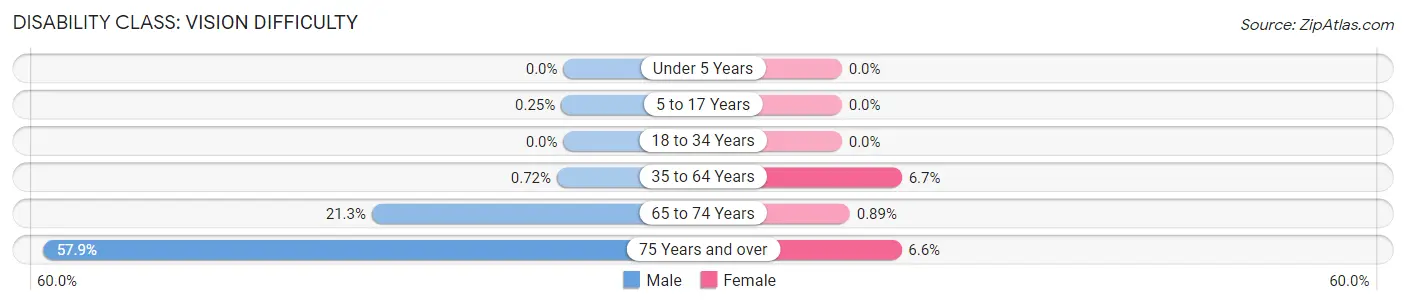
| Age Bracket | Male | Female |
| Under 5 Years | 0 (0.0%) | 0 (0.0%) |
| 5 to 17 Years | 1 (0.3%) | 0 (0.0%) |
| 18 to 34 Years | 0 (0.0%) | 0 (0.0%) |
| 35 to 64 Years | 6 (0.7%) | 56 (6.7%) |
| 65 to 74 Years | 61 (21.3%) | 2 (0.9%) |
| 75 Years and over | 103 (57.9%) | 11 (6.6%) |
Disability Class: Cognitive Difficulty
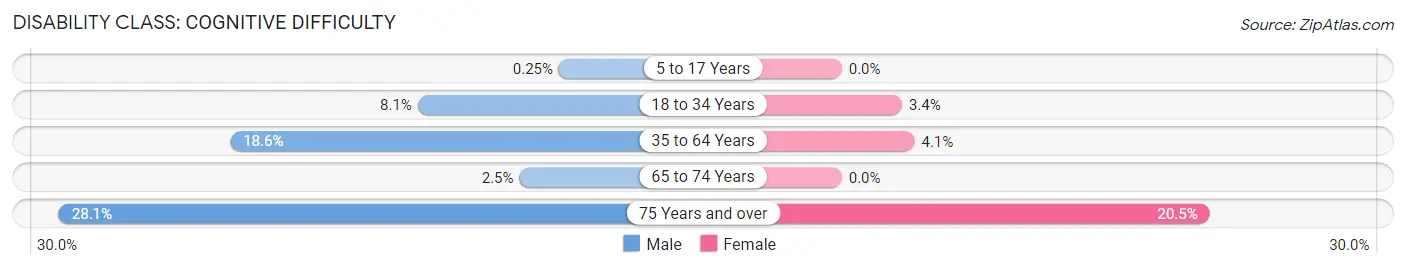
| Age Bracket | Male | Female |
| 5 to 17 Years | 1 (0.3%) | 0 (0.0%) |
| 18 to 34 Years | 24 (8.1%) | 8 (3.4%) |
| 35 to 64 Years | 154 (18.5%) | 34 (4.1%) |
| 65 to 74 Years | 7 (2.5%) | 0 (0.0%) |
| 75 Years and over | 50 (28.1%) | 34 (20.5%) |
Disability Class: Ambulatory Difficulty
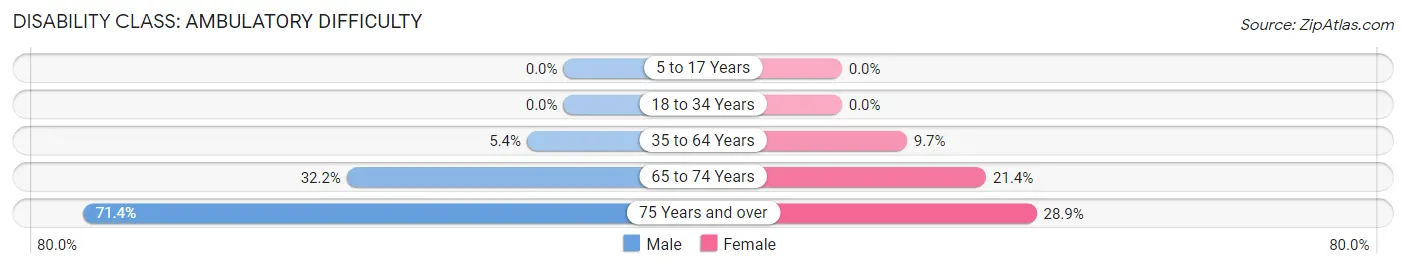
| Age Bracket | Male | Female |
| 5 to 17 Years | 0 (0.0%) | 0 (0.0%) |
| 18 to 34 Years | 0 (0.0%) | 0 (0.0%) |
| 35 to 64 Years | 45 (5.4%) | 81 (9.7%) |
| 65 to 74 Years | 92 (32.2%) | 48 (21.4%) |
| 75 Years and over | 127 (71.4%) | 48 (28.9%) |
Disability Class: Self-Care Difficulty
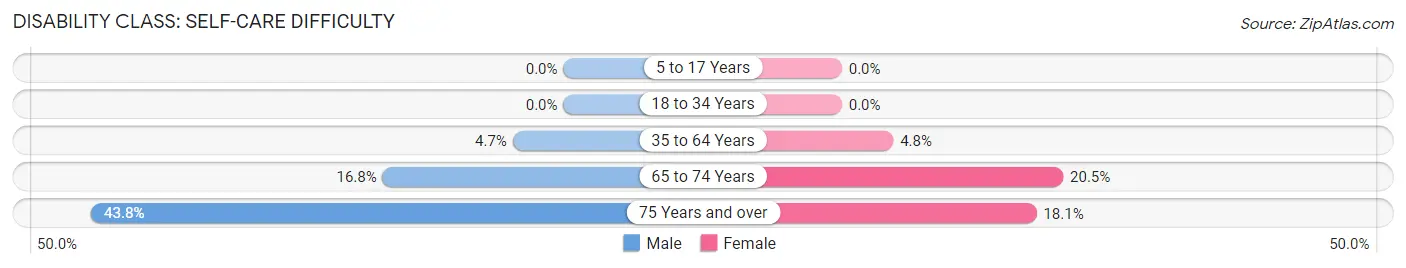
| Age Bracket | Male | Female |
| 5 to 17 Years | 0 (0.0%) | 0 (0.0%) |
| 18 to 34 Years | 0 (0.0%) | 0 (0.0%) |
| 35 to 64 Years | 39 (4.7%) | 40 (4.8%) |
| 65 to 74 Years | 48 (16.8%) | 46 (20.5%) |
| 75 Years and over | 78 (43.8%) | 30 (18.1%) |
Technology Access in Guadalupe County
Computing Device Access in Guadalupe County
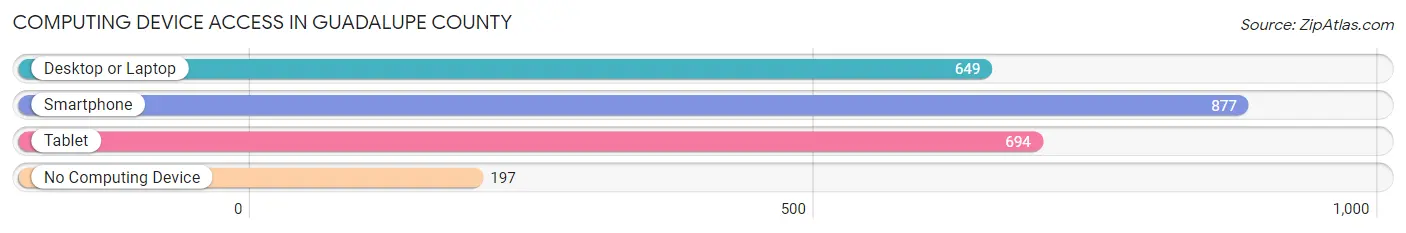
| Device Type | # Households | % Households |
| Desktop or Laptop | 649 | 50.1% |
| Smartphone | 877 | 67.7% |
| Tablet | 694 | 53.6% |
| No Computing Device | 197 | 15.2% |
| Total | 1,295 | 100.0% |
Internet Access in Guadalupe County
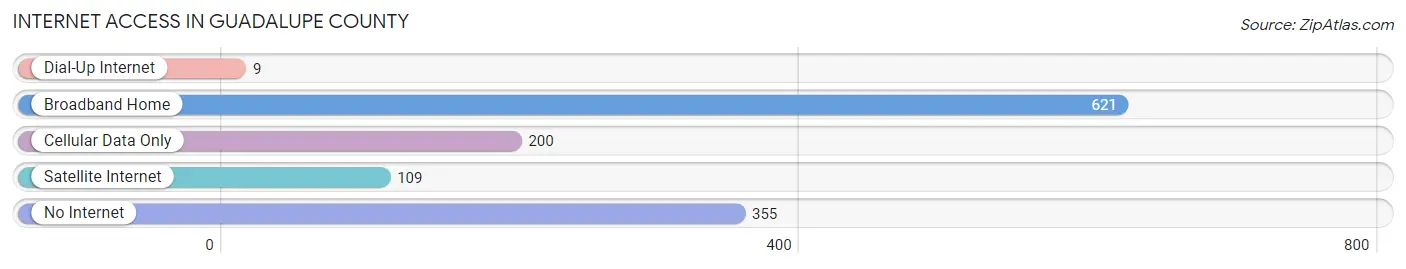
| Internet Type | # Households | % Households |
| Dial-Up Internet | 9 | 0.7% |
| Broadband Home | 621 | 47.9% |
| Cellular Data Only | 200 | 15.4% |
| Satellite Internet | 109 | 8.4% |
| No Internet | 355 | 27.4% |
| Total | 1,295 | 100.0% |
Guadalupe County Summary
Guadalupe County is located in the state of New Mexico, in the United States. It is bordered by San Miguel County to the north, Harding County to the east, Quay County to the south, and De Baca County to the west. The county seat is Santa Rosa, and the largest city is Santa Rosa. The county has a total area of 1,945 square miles, of which 1,944 square miles is land and 1 square mile is water.
History
Guadalupe County was established in 1891 from parts of San Miguel and De Baca counties. It was named for the Guadalupe Mountains, which are located in the county. The county was originally inhabited by Native American tribes, including the Apache, Comanche, and Navajo.
The first European settlers arrived in the area in the late 1800s. The Santa Fe Trail, which ran through the county, was an important route for settlers and traders. The Santa Fe Trail Museum in Santa Rosa is dedicated to the history of the trail.
The county was an important agricultural center in the early 1900s, with crops such as wheat, corn, and alfalfa being grown. The Santa Rosa Irrigation District was established in 1912 to provide water for the area.
Geography
Guadalupe County is located in the eastern part of New Mexico. It is bordered by San Miguel County to the north, Harding County to the east, Quay County to the south, and De Baca County to the west. The county has a total area of 1,945 square miles, of which 1,944 square miles is land and 1 square mile is water.
The county is located in the Great Plains region of the United States. The landscape is mostly flat, with some rolling hills. The Guadalupe Mountains are located in the county, and the highest point in the county is Guadalupe Peak, which has an elevation of 8,749 feet.
The county is home to several rivers, including the Pecos River, which runs through the county. The county also has several lakes, including Lake Carlsbad and Lake Sumner.
Economy
The economy of Guadalupe County is largely based on agriculture. The county is home to several large farms, which produce crops such as wheat, corn, and alfalfa. The county is also home to several oil and gas fields, which provide jobs for many residents.
The county is home to several manufacturing companies, including a cheese factory and a furniture factory. The county is also home to several retail stores, restaurants, and other businesses.
Demographics
As of the 2010 census, the population of Guadalupe County was 4,844. The racial makeup of the county was 75.3% White, 0.7% African American, 1.2% Native American, 0.2% Asian, 0.1% Pacific Islander, 19.7% from other races, and 2.9% from two or more races. Hispanic or Latino of any race were 44.3% of the population.
The median income for a household in the county was $30,938, and the median income for a family was $35,938. The per capita income for the county was $15,938. About 18.3% of the population was below the poverty line.
Common Questions
What is Per Capita Income in Guadalupe County?
Per Capita income in Guadalupe County is $27,526.
What is the Median Family Income in Guadalupe County?
Median Family Income in Guadalupe County is $50,650.
What is the Median Household income in Guadalupe County?
Median Household Income in Guadalupe County is $38,713.
What is Income or Wage Gap in Guadalupe County?
Income or Wage Gap in Guadalupe County is 11.4%.
Women in Guadalupe County earn 88.6 cents for every dollar earned by a man.
What is Inequality or Gini Index in Guadalupe County?
Inequality or Gini Index in Guadalupe County is 0.61.
What is the Total Population of Guadalupe County?
Total Population of Guadalupe County is 4,413.
What is the Total Male Population of Guadalupe County?
Total Male Population of Guadalupe County is 2,590.
What is the Total Female Population of Guadalupe County?
Total Female Population of Guadalupe County is 1,823.
What is the Ratio of Males per 100 Females in Guadalupe County?
There are 142.07 Males per 100 Females in Guadalupe County.
What is the Ratio of Females per 100 Males in Guadalupe County?
There are 70.39 Females per 100 Males in Guadalupe County.
What is the Median Population Age in Guadalupe County?
Median Population Age in Guadalupe County is 43.0 Years.
What is the Average Family Size in Guadalupe County
Average Family Size in Guadalupe County is 4.0 People.
What is the Average Household Size in Guadalupe County
Average Household Size in Guadalupe County is 2.9 People.
How Large is the Labor Force in Guadalupe County?
There are 1,813 People in the Labor Forcein in Guadalupe County.
What is the Percentage of People in the Labor Force in Guadalupe County?
49.5% of People are in the Labor Force in Guadalupe County.
What is the Unemployment Rate in Guadalupe County?
Unemployment Rate in Guadalupe County is 9.8%.