Eddy County, NM Map & Demographics
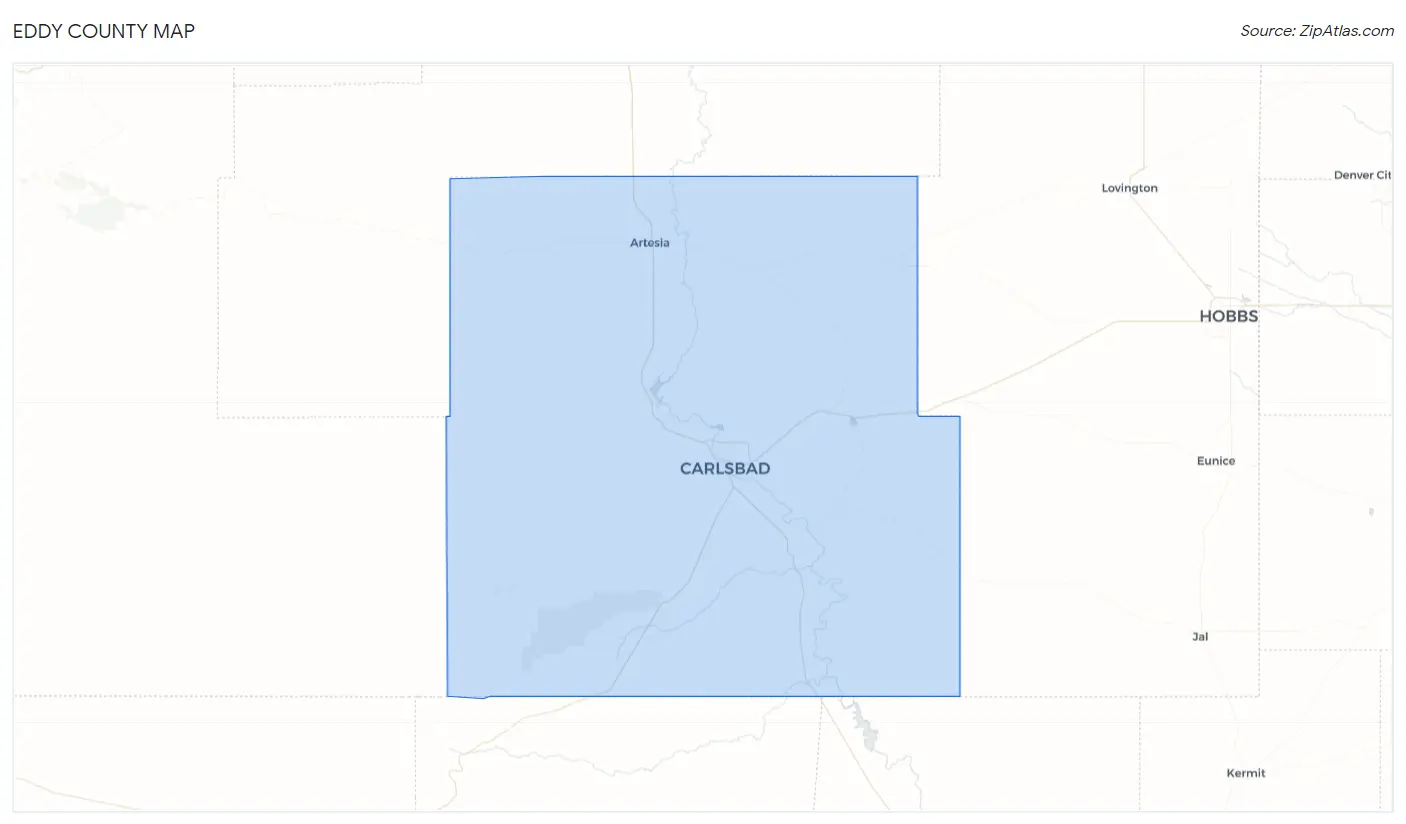
Eddy County Map
Eddy County Overview
$36,274
PER CAPITA INCOME
$95,888
AVG FAMILY INCOME
$77,458
AVG HOUSEHOLD INCOME
50.1%
WAGE / INCOME GAP [ % ]
49.9¢/ $1
WAGE / INCOME GAP [ $ ]
$9,814
FAMILY INCOME DEFICIT
0.43
INEQUALITY / GINI INDEX
61,264
TOTAL POPULATION
31,413
MALE POPULATION
29,851
FEMALE POPULATION
105.23
MALES / 100 FEMALES
95.03
FEMALES / 100 MALES
35.7
MEDIAN AGE
3.2
AVG FAMILY SIZE
2.7
AVG HOUSEHOLD SIZE
28,704
LABOR FORCE [ PEOPLE ]
61.1%
PERCENT IN LABOR FORCE
4.2%
UNEMPLOYMENT RATE
Income in Eddy County
Income Overview in Eddy County
Per Capita Income in Eddy County is $36,274, while median incomes of families and households are $95,888 and $77,458 respectively.
| Characteristic | Number | Measure |
| Per Capita Income | 61,264 | $36,274 |
| Median Family Income | 15,977 | $95,888 |
| Mean Family Income | 15,977 | $110,836 |
| Median Household Income | 22,703 | $77,458 |
| Mean Household Income | 22,703 | $96,185 |
| Income Deficit | 15,977 | $9,814 |
| Wage / Income Gap (%) | 61,264 | 50.07% |
| Wage / Income Gap ($) | 61,264 | 49.93¢ per $1 |
| Gini / Inequality Index | 61,264 | 0.43 |
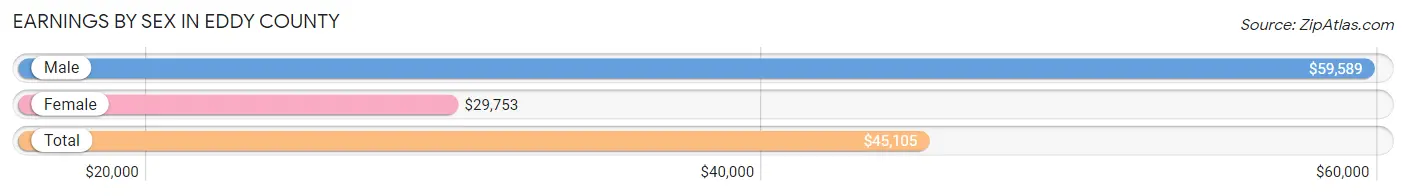
Earnings by Sex in Eddy County
Average Earnings in Eddy County are $45,105, $59,589 for men and $29,753 for women, a difference of 50.1%.
| Sex | Number | Average Earnings |
| Male | 17,734 (58.5%) | $59,589 |
| Female | 12,592 (41.5%) | $29,753 |
| Total | 30,326 (100.0%) | $45,105 |
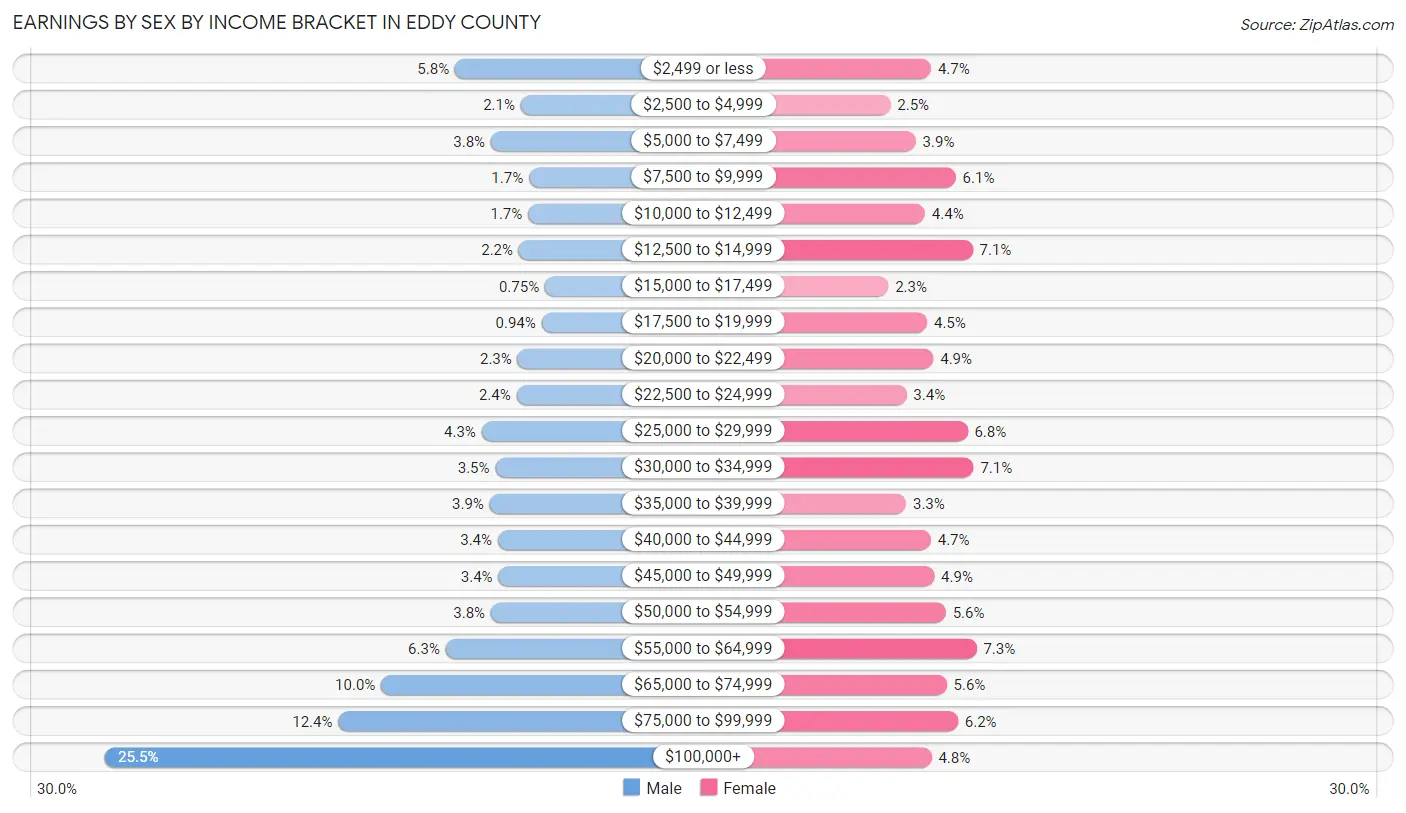
Earnings by Sex by Income Bracket in Eddy County
The most common earnings brackets in Eddy County are $100,000+ for men (4,516 | 25.5%) and $55,000 to $64,999 for women (918 | 7.3%).
| Income | Male | Female |
| $2,499 or less | 1,031 (5.8%) | 595 (4.7%) |
| $2,500 to $4,999 | 374 (2.1%) | 309 (2.5%) |
| $5,000 to $7,499 | 673 (3.8%) | 487 (3.9%) |
| $7,500 to $9,999 | 292 (1.7%) | 771 (6.1%) |
| $10,000 to $12,499 | 301 (1.7%) | 553 (4.4%) |
| $12,500 to $14,999 | 393 (2.2%) | 890 (7.1%) |
| $15,000 to $17,499 | 133 (0.7%) | 294 (2.3%) |
| $17,500 to $19,999 | 166 (0.9%) | 568 (4.5%) |
| $20,000 to $22,499 | 406 (2.3%) | 612 (4.9%) |
| $22,500 to $24,999 | 416 (2.4%) | 422 (3.4%) |
| $25,000 to $29,999 | 764 (4.3%) | 854 (6.8%) |
| $30,000 to $34,999 | 628 (3.5%) | 897 (7.1%) |
| $35,000 to $39,999 | 685 (3.9%) | 419 (3.3%) |
| $40,000 to $44,999 | 603 (3.4%) | 594 (4.7%) |
| $45,000 to $49,999 | 597 (3.4%) | 618 (4.9%) |
| $50,000 to $54,999 | 673 (3.8%) | 700 (5.6%) |
| $55,000 to $64,999 | 1,123 (6.3%) | 918 (7.3%) |
| $65,000 to $74,999 | 1,767 (10.0%) | 706 (5.6%) |
| $75,000 to $99,999 | 2,193 (12.4%) | 786 (6.2%) |
| $100,000+ | 4,516 (25.5%) | 599 (4.8%) |
| Total | 17,734 (100.0%) | 12,592 (100.0%) |
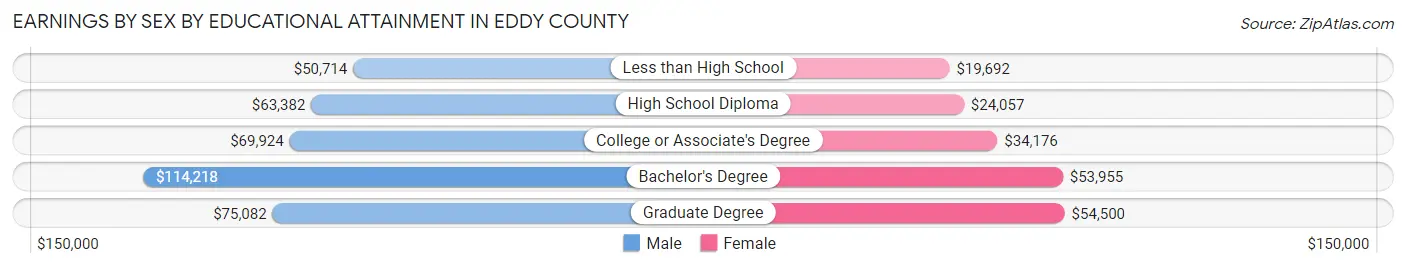
Earnings by Sex by Educational Attainment in Eddy County
Average earnings in Eddy County are $68,909 for men and $34,865 for women, a difference of 49.4%. Men with an educational attainment of bachelor's degree enjoy the highest average annual earnings of $114,218, while those with less than high school education earn the least with $50,714. Women with an educational attainment of graduate degree earn the most with the average annual earnings of $54,500, while those with less than high school education have the smallest earnings of $19,692.
| Educational Attainment | Male Income | Female Income |
| Less than High School | $50,714 | $19,692 |
| High School Diploma | $63,382 | $24,057 |
| College or Associate's Degree | $69,924 | $34,176 |
| Bachelor's Degree | $114,218 | $53,955 |
| Graduate Degree | $75,082 | $54,500 |
| Total | $68,909 | $34,865 |
Family Income in Eddy County
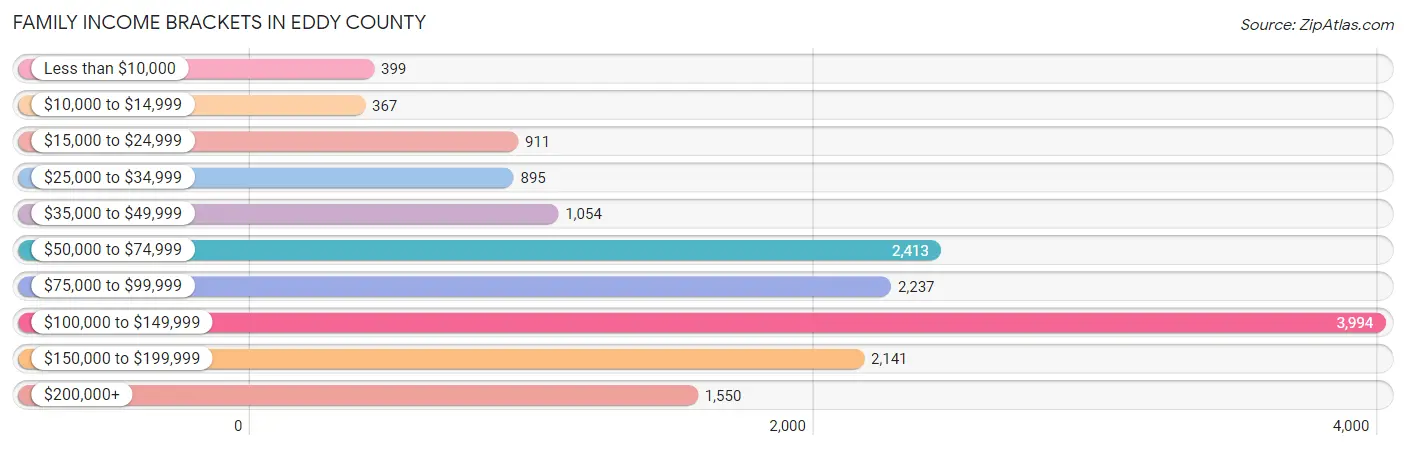
Family Income Brackets in Eddy County
According to the Eddy County family income data, there are 3,994 families falling into the $100,000 to $149,999 income range, which is the most common income bracket and makes up 25.0% of all families. Conversely, the $10,000 to $14,999 income bracket is the least frequent group with only 367 families (2.3%) belonging to this category.
| Income Bracket | # Families | % Families |
| Less than $10,000 | 399 | 2.5% |
| $10,000 to $14,999 | 367 | 2.3% |
| $15,000 to $24,999 | 911 | 5.7% |
| $25,000 to $34,999 | 895 | 5.6% |
| $35,000 to $49,999 | 1,054 | 6.6% |
| $50,000 to $74,999 | 2,413 | 15.1% |
| $75,000 to $99,999 | 2,237 | 14.0% |
| $100,000 to $149,999 | 3,994 | 25.0% |
| $150,000 to $199,999 | 2,141 | 13.4% |
| $200,000+ | 1,550 | 9.7% |
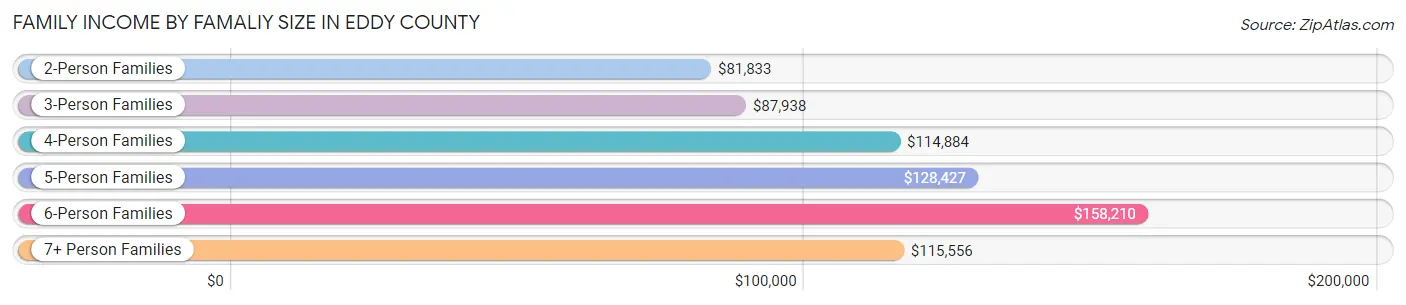
Family Income by Famaliy Size in Eddy County
6-person families (565 | 3.5%) account for the highest median family income in Eddy County with $158,210 per family, while 2-person families (7,523 | 47.1%) have the highest median income of $40,916 per family member.
| Income Bracket | # Families | Median Income |
| 2-Person Families | 7,523 (47.1%) | $81,833 |
| 3-Person Families | 3,265 (20.4%) | $87,938 |
| 4-Person Families | 2,840 (17.8%) | $114,884 |
| 5-Person Families | 1,556 (9.7%) | $128,427 |
| 6-Person Families | 565 (3.5%) | $158,210 |
| 7+ Person Families | 228 (1.4%) | $115,556 |
| Total | 15,977 (100.0%) | $95,888 |
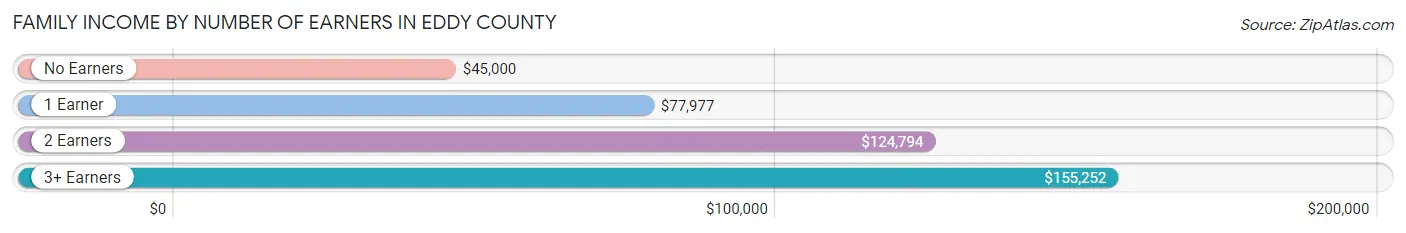
Family Income by Number of Earners in Eddy County
The median family income in Eddy County is $95,888, with families comprising 3+ earners (1,483) having the highest median family income of $155,252, while families with no earners (2,074) have the lowest median family income of $45,000, accounting for 9.3% and 13.0% of families, respectively.
| Number of Earners | # Families | Median Income |
| No Earners | 2,074 (13.0%) | $45,000 |
| 1 Earner | 6,233 (39.0%) | $77,977 |
| 2 Earners | 6,187 (38.7%) | $124,794 |
| 3+ Earners | 1,483 (9.3%) | $155,252 |
| Total | 15,977 (100.0%) | $95,888 |
Household Income in Eddy County
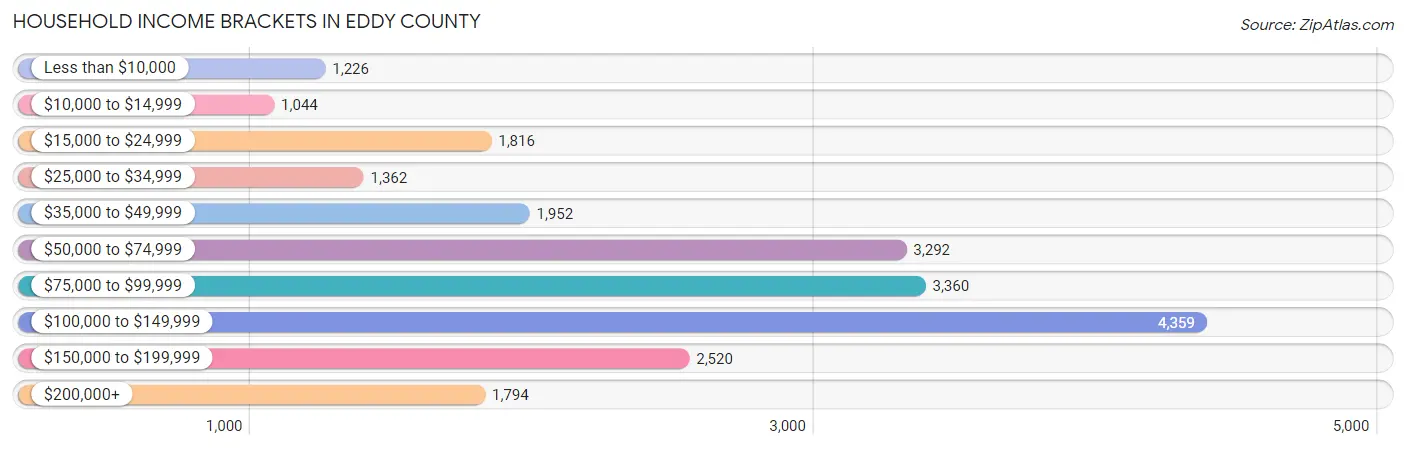
Household Income Brackets in Eddy County
With 4,359 households falling in the category, the $100,000 to $149,999 income range is the most frequent in Eddy County, accounting for 19.2% of all households. In contrast, only 1,044 households (4.6%) fall into the $10,000 to $14,999 income bracket, making it the least populous group.
| Income Bracket | # Households | % Households |
| Less than $10,000 | 1,226 | 5.4% |
| $10,000 to $14,999 | 1,044 | 4.6% |
| $15,000 to $24,999 | 1,816 | 8.0% |
| $25,000 to $34,999 | 1,362 | 6.0% |
| $35,000 to $49,999 | 1,952 | 8.6% |
| $50,000 to $74,999 | 3,292 | 14.5% |
| $75,000 to $99,999 | 3,360 | 14.8% |
| $100,000 to $149,999 | 4,359 | 19.2% |
| $150,000 to $199,999 | 2,520 | 11.1% |
| $200,000+ | 1,794 | 7.9% |
Household Income by Householder Age in Eddy County
The median household income in Eddy County is $77,458, with the highest median household income of $90,006 found in the 25 to 44 years age bracket for the primary householder. A total of 8,213 households (36.2%) fall into this category. Meanwhile, the 65+ years age bracket for the primary householder has the lowest median household income of $48,723, with 5,998 households (26.4%) in this group.
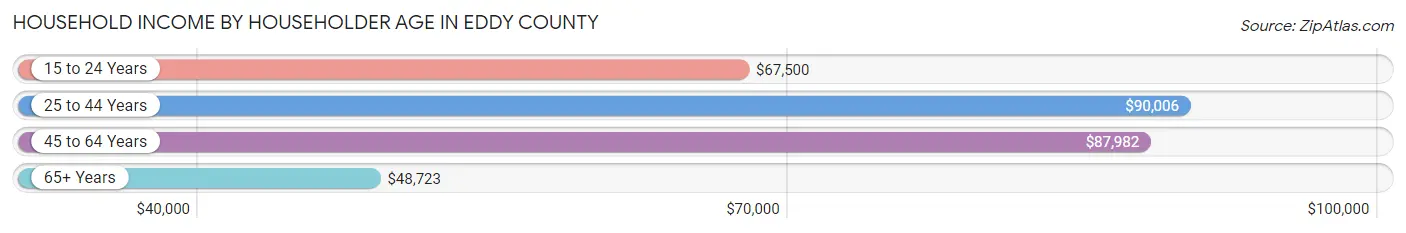
| Income Bracket | # Households | Median Income |
| 15 to 24 Years | 518 (2.3%) | $67,500 |
| 25 to 44 Years | 8,213 (36.2%) | $90,006 |
| 45 to 64 Years | 7,974 (35.1%) | $87,982 |
| 65+ Years | 5,998 (26.4%) | $48,723 |
| Total | 22,703 (100.0%) | $77,458 |
Poverty in Eddy County
Income Below Poverty by Sex and Age in Eddy County
With 9.8% poverty level for males and 13.9% for females among the residents of Eddy County, 16 and 17 year old males and 15 year old females are the most vulnerable to poverty, with 280 males (29.3%) and 131 females (26.6%) in their respective age groups living below the poverty level.
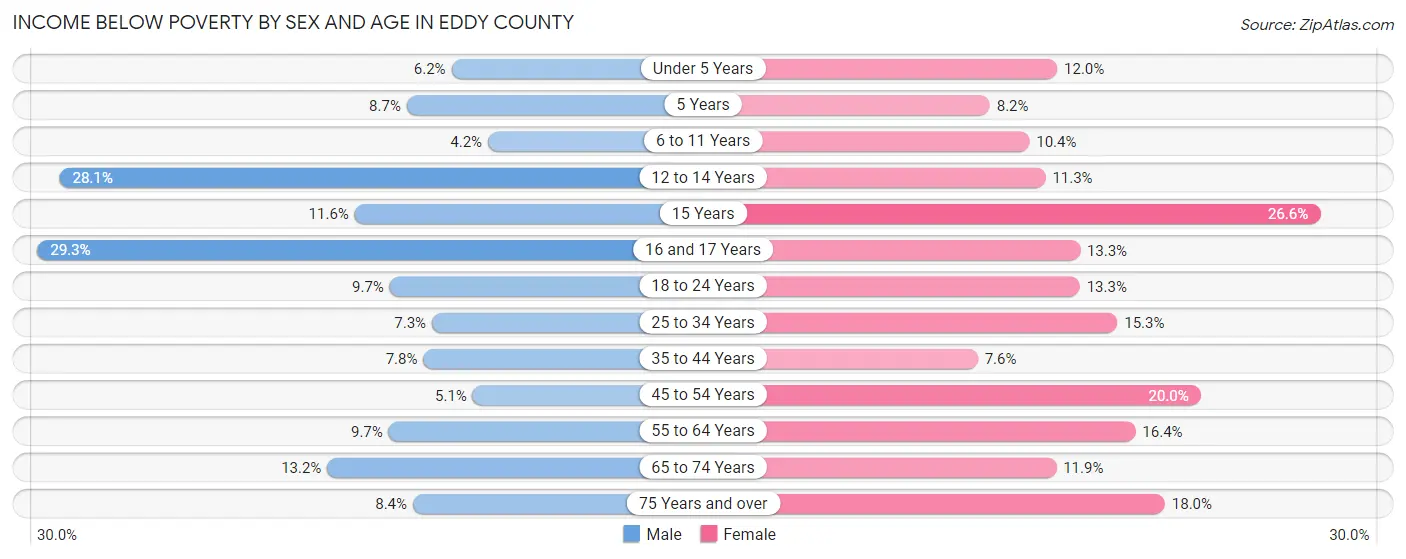
| Age Bracket | Male | Female |
| Under 5 Years | 149 (6.2%) | 239 (12.0%) |
| 5 Years | 28 (8.7%) | 28 (8.2%) |
| 6 to 11 Years | 107 (4.2%) | 279 (10.4%) |
| 12 to 14 Years | 499 (28.1%) | 146 (11.3%) |
| 15 Years | 38 (11.6%) | 131 (26.6%) |
| 16 and 17 Years | 280 (29.3%) | 109 (13.3%) |
| 18 to 24 Years | 279 (9.7%) | 345 (13.3%) |
| 25 to 34 Years | 310 (7.3%) | 626 (15.3%) |
| 35 to 44 Years | 342 (7.8%) | 286 (7.6%) |
| 45 to 54 Years | 174 (5.1%) | 643 (20.0%) |
| 55 to 64 Years | 351 (9.7%) | 603 (16.4%) |
| 65 to 74 Years | 343 (13.2%) | 317 (11.9%) |
| 75 Years and over | 130 (8.4%) | 350 (18.0%) |
| Total | 3,030 (9.8%) | 4,102 (13.9%) |
Income Above Poverty by Sex and Age in Eddy County
According to the poverty statistics in Eddy County, males aged 6 to 11 years and females aged 35 to 44 years are the age groups that are most secure financially, with 95.8% of males and 92.4% of females in these age groups living above the poverty line.
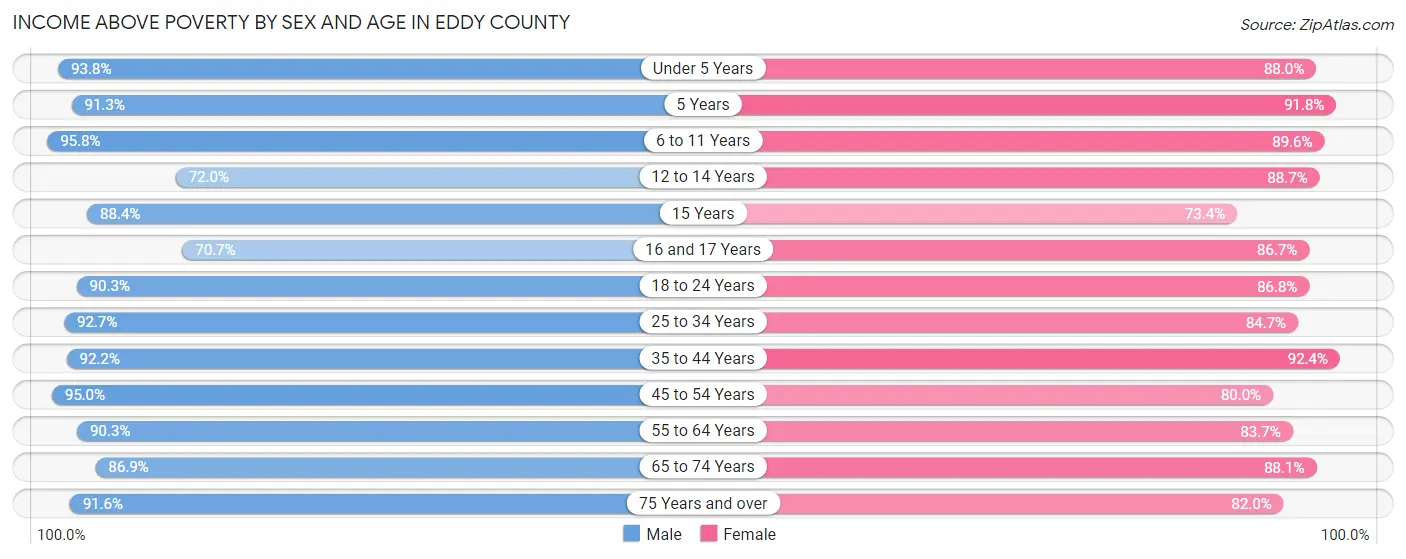
| Age Bracket | Male | Female |
| Under 5 Years | 2,244 (93.8%) | 1,754 (88.0%) |
| 5 Years | 293 (91.3%) | 312 (91.8%) |
| 6 to 11 Years | 2,439 (95.8%) | 2,394 (89.6%) |
| 12 to 14 Years | 1,280 (72.0%) | 1,142 (88.7%) |
| 15 Years | 289 (88.4%) | 361 (73.4%) |
| 16 and 17 Years | 676 (70.7%) | 713 (86.7%) |
| 18 to 24 Years | 2,607 (90.3%) | 2,259 (86.8%) |
| 25 to 34 Years | 3,927 (92.7%) | 3,455 (84.7%) |
| 35 to 44 Years | 4,041 (92.2%) | 3,494 (92.4%) |
| 45 to 54 Years | 3,274 (95.0%) | 2,576 (80.0%) |
| 55 to 64 Years | 3,258 (90.3%) | 3,084 (83.7%) |
| 65 to 74 Years | 2,265 (86.9%) | 2,337 (88.1%) |
| 75 Years and over | 1,421 (91.6%) | 1,596 (82.0%) |
| Total | 28,014 (90.2%) | 25,477 (86.1%) |
Income Below Poverty Among Married-Couple Families in Eddy County
The poverty statistics for married-couple families in Eddy County show that 2.6% or 292 of the total 11,382 families live below the poverty line. Families with 1 or 2 children have the highest poverty rate of 2.9%, comprising of 113 families. On the other hand, families with 3 or 4 children have the lowest poverty rate of 0.0%, which includes 0 families.
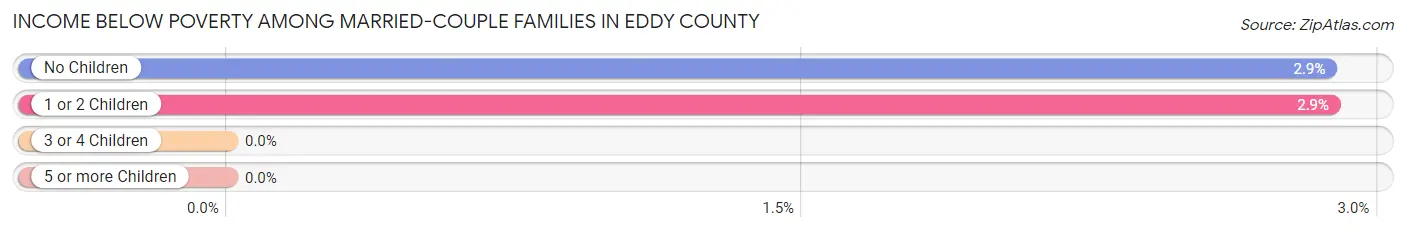
| Children | Above Poverty | Below Poverty |
| No Children | 6,066 (97.1%) | 179 (2.9%) |
| 1 or 2 Children | 3,816 (97.1%) | 113 (2.9%) |
| 3 or 4 Children | 1,082 (100.0%) | 0 (0.0%) |
| 5 or more Children | 126 (100.0%) | 0 (0.0%) |
| Total | 11,090 (97.4%) | 292 (2.6%) |
Income Below Poverty Among Single-Parent Households in Eddy County
According to the poverty data in Eddy County, 14.6% or 247 single-father households and 24.0% or 696 single-mother households are living below the poverty line. Among single-father households, those with 1 or 2 children have the highest poverty rate, with 184 households (23.2%) experiencing poverty. Likewise, among single-mother households, those with 5 or more children have the highest poverty rate, with 30 households (58.8%) falling below the poverty line.
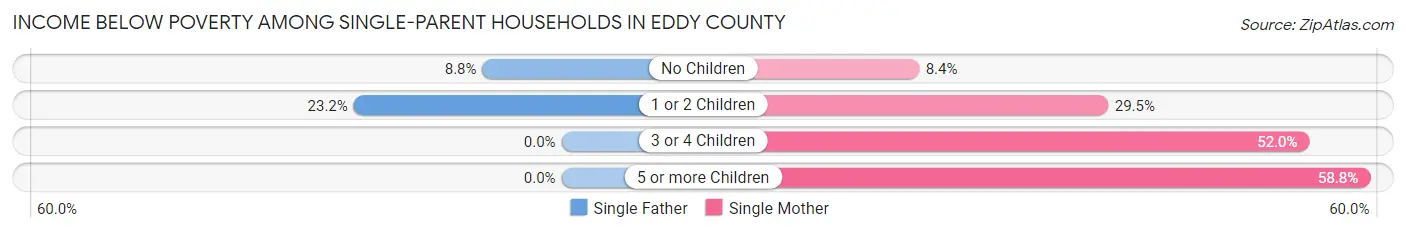
| Children | Single Father | Single Mother |
| No Children | 63 (8.8%) | 98 (8.4%) |
| 1 or 2 Children | 184 (23.2%) | 402 (29.5%) |
| 3 or 4 Children | 0 (0.0%) | 166 (52.0%) |
| 5 or more Children | 0 (0.0%) | 30 (58.8%) |
| Total | 247 (14.6%) | 696 (24.0%) |
Income Below Poverty Among Married-Couple vs Single-Parent Households in Eddy County
The poverty data for Eddy County shows that 292 of the married-couple family households (2.6%) and 943 of the single-parent households (20.5%) are living below the poverty level. Within the married-couple family households, those with 1 or 2 children have the highest poverty rate, with 113 households (2.9%) falling below the poverty line. Among the single-parent households, those with 5 or more children have the highest poverty rate, with 30 household (50.0%) living below poverty.
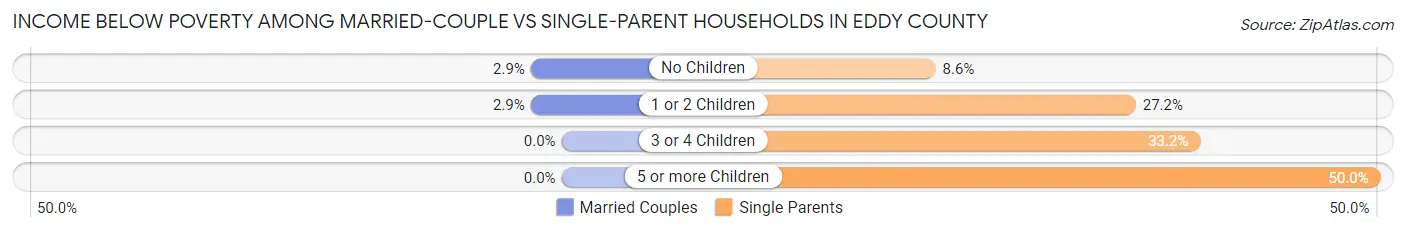
| Children | Married-Couple Families | Single-Parent Households |
| No Children | 179 (2.9%) | 161 (8.6%) |
| 1 or 2 Children | 113 (2.9%) | 586 (27.2%) |
| 3 or 4 Children | 0 (0.0%) | 166 (33.2%) |
| 5 or more Children | 0 (0.0%) | 30 (50.0%) |
| Total | 292 (2.6%) | 943 (20.5%) |
Race in Eddy County
The most populous races in Eddy County are White / Caucasian (43,458 | 70.9%), Hispanic or Latino (31,552 | 51.5%), and Two or more Races (9,905 | 16.2%).
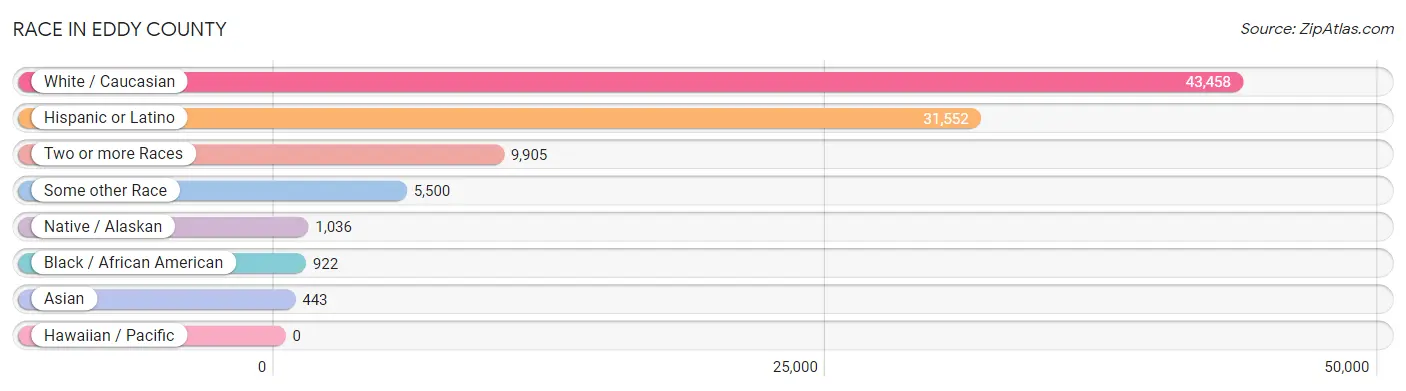
| Race | # Population | % Population |
| Asian | 443 | 0.7% |
| Black / African American | 922 | 1.5% |
| Hawaiian / Pacific | 0 | 0.0% |
| Hispanic or Latino | 31,552 | 51.5% |
| Native / Alaskan | 1,036 | 1.7% |
| White / Caucasian | 43,458 | 70.9% |
| Two or more Races | 9,905 | 16.2% |
| Some other Race | 5,500 | 9.0% |
| Total | 61,264 | 100.0% |
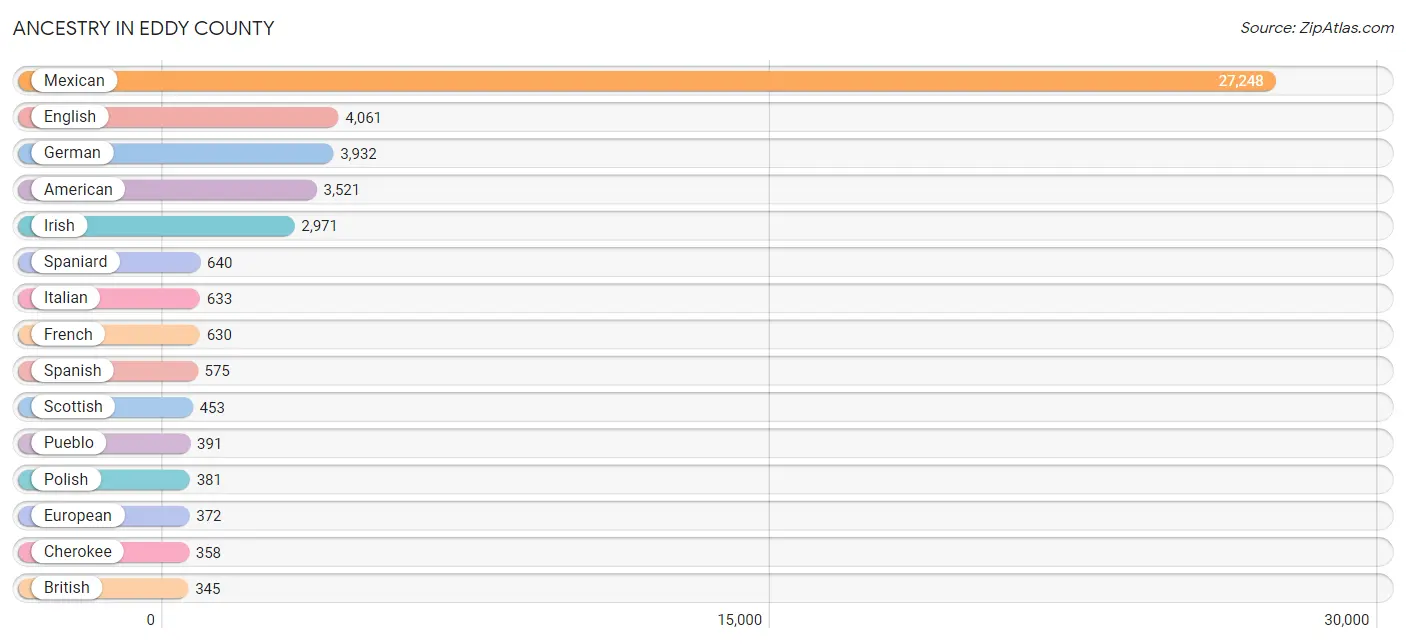
Ancestry in Eddy County
The most populous ancestries reported in Eddy County are Mexican (27,248 | 44.5%), English (4,061 | 6.6%), German (3,932 | 6.4%), American (3,521 | 5.8%), and Irish (2,971 | 4.9%), together accounting for 68.1% of all Eddy County residents.
| Ancestry | # Population | % Population |
| African | 26 | 0.0% |
| Alaska Native | 10 | 0.0% |
| American | 3,521 | 5.8% |
| Apache | 7 | 0.0% |
| Austrian | 7 | 0.0% |
| Bhutanese | 294 | 0.5% |
| Blackfeet | 30 | 0.1% |
| British | 345 | 0.6% |
| Burmese | 43 | 0.1% |
| Cajun | 8 | 0.0% |
| Central American | 118 | 0.2% |
| Central American Indian | 21 | 0.0% |
| Cherokee | 358 | 0.6% |
| Choctaw | 46 | 0.1% |
| Colombian | 21 | 0.0% |
| Comanche | 5 | 0.0% |
| Creek | 8 | 0.0% |
| Cuban | 193 | 0.3% |
| Czech | 79 | 0.1% |
| Danish | 35 | 0.1% |
| Dominican | 64 | 0.1% |
| Dutch | 150 | 0.2% |
| Dutch West Indian | 75 | 0.1% |
| Eastern European | 148 | 0.2% |
| English | 4,061 | 6.6% |
| European | 372 | 0.6% |
| Finnish | 72 | 0.1% |
| French | 630 | 1.0% |
| French Canadian | 29 | 0.1% |
| German | 3,932 | 6.4% |
| Greek | 118 | 0.2% |
| Guatemalan | 39 | 0.1% |
| Honduran | 79 | 0.1% |
| Hopi | 30 | 0.1% |
| Hungarian | 31 | 0.1% |
| Indian (Asian) | 118 | 0.2% |
| Indonesian | 10 | 0.0% |
| Irish | 2,971 | 4.9% |
| Iroquois | 16 | 0.0% |
| Italian | 633 | 1.0% |
| Korean | 279 | 0.5% |
| Lithuanian | 14 | 0.0% |
| Mexican | 27,248 | 44.5% |
| Mexican American Indian | 65 | 0.1% |
| Navajo | 324 | 0.5% |
| Northern European | 4 | 0.0% |
| Norwegian | 232 | 0.4% |
| Polish | 381 | 0.6% |
| Portuguese | 33 | 0.1% |
| Pueblo | 391 | 0.6% |
| Puerto Rican | 104 | 0.2% |
| Russian | 29 | 0.1% |
| Scandinavian | 95 | 0.2% |
| Scotch-Irish | 263 | 0.4% |
| Scottish | 453 | 0.7% |
| Sioux | 1 | 0.0% |
| Slovene | 29 | 0.1% |
| South American | 42 | 0.1% |
| Spaniard | 640 | 1.0% |
| Spanish | 575 | 0.9% |
| Spanish American | 42 | 0.1% |
| Sri Lankan | 16 | 0.0% |
| Subsaharan African | 26 | 0.0% |
| Swedish | 334 | 0.5% |
| Swiss | 47 | 0.1% |
| Thai | 73 | 0.1% |
| Welsh | 185 | 0.3% |
| Yaqui | 113 | 0.2% |
| Yugoslavian | 11 | 0.0% | View All 69 Rows |
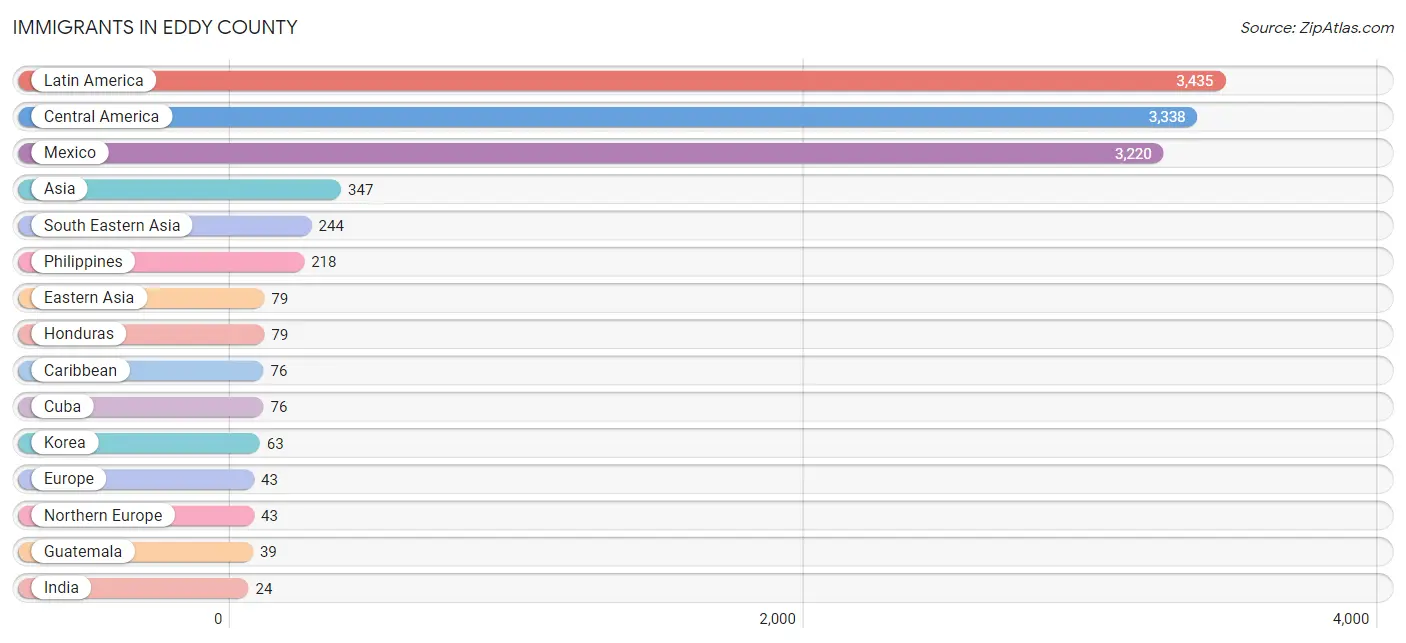
Immigrants in Eddy County
The most numerous immigrant groups reported in Eddy County came from Latin America (3,435 | 5.6%), Central America (3,338 | 5.4%), Mexico (3,220 | 5.3%), Asia (347 | 0.6%), and South Eastern Asia (244 | 0.4%), together accounting for 17.3% of all Eddy County residents.
| Immigration Origin | # Population | % Population |
| Africa | 12 | 0.0% |
| Asia | 347 | 0.6% |
| Bolivia | 21 | 0.0% |
| Caribbean | 76 | 0.1% |
| Central America | 3,338 | 5.4% |
| Cuba | 76 | 0.1% |
| Eastern Asia | 79 | 0.1% |
| Europe | 43 | 0.1% |
| Guatemala | 39 | 0.1% |
| Honduras | 79 | 0.1% |
| India | 24 | 0.0% |
| Japan | 16 | 0.0% |
| Korea | 63 | 0.1% |
| Latin America | 3,435 | 5.6% |
| Mexico | 3,220 | 5.3% |
| Nigeria | 12 | 0.0% |
| Northern Europe | 43 | 0.1% |
| Philippines | 218 | 0.4% |
| Singapore | 13 | 0.0% |
| South America | 21 | 0.0% |
| South Central Asia | 24 | 0.0% |
| South Eastern Asia | 244 | 0.4% |
| Vietnam | 3 | 0.0% |
| Western Africa | 12 | 0.0% | View All 24 Rows |
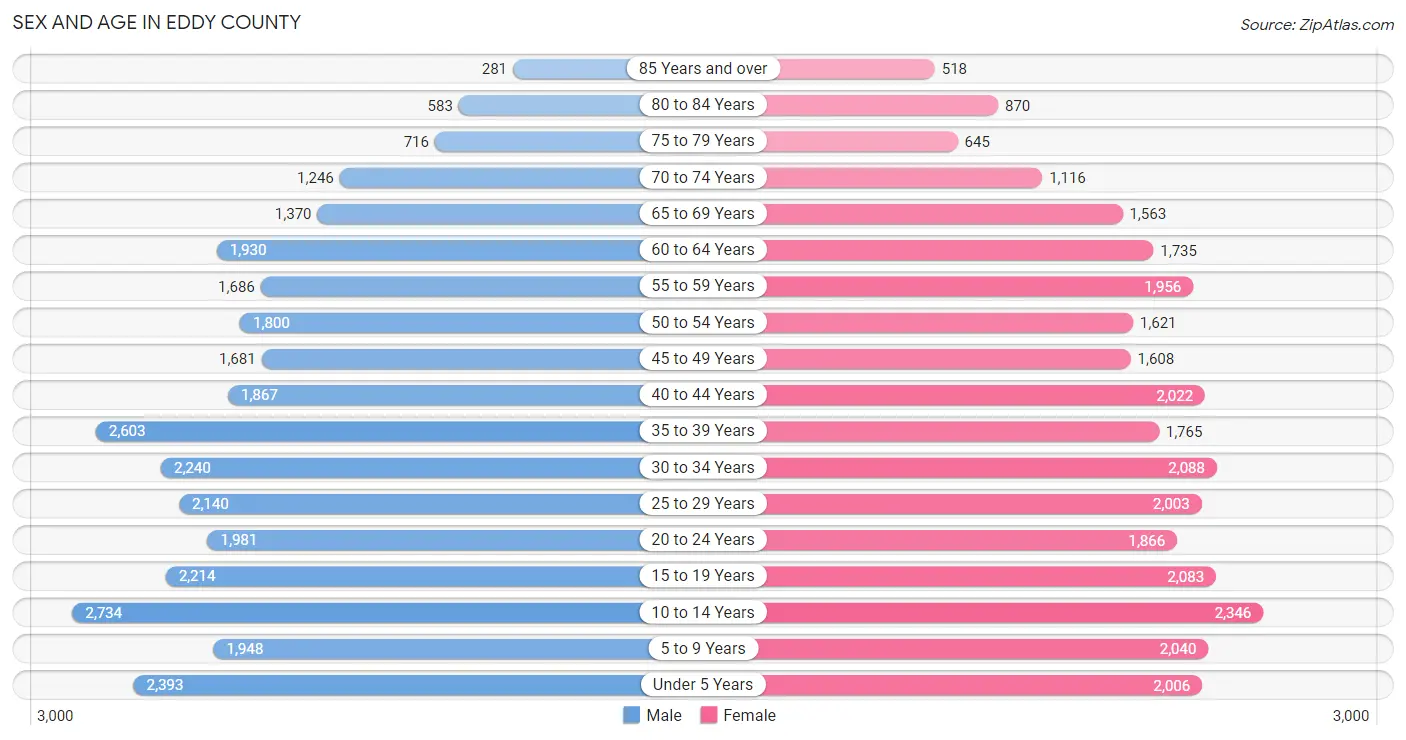
Sex and Age in Eddy County
Sex and Age in Eddy County
The most populous age groups in Eddy County are 10 to 14 Years (2,734 | 8.7%) for men and 10 to 14 Years (2,346 | 7.9%) for women.
| Age Bracket | Male | Female |
| Under 5 Years | 2,393 (7.6%) | 2,006 (6.7%) |
| 5 to 9 Years | 1,948 (6.2%) | 2,040 (6.8%) |
| 10 to 14 Years | 2,734 (8.7%) | 2,346 (7.9%) |
| 15 to 19 Years | 2,214 (7.0%) | 2,083 (7.0%) |
| 20 to 24 Years | 1,981 (6.3%) | 1,866 (6.2%) |
| 25 to 29 Years | 2,140 (6.8%) | 2,003 (6.7%) |
| 30 to 34 Years | 2,240 (7.1%) | 2,088 (7.0%) |
| 35 to 39 Years | 2,603 (8.3%) | 1,765 (5.9%) |
| 40 to 44 Years | 1,867 (5.9%) | 2,022 (6.8%) |
| 45 to 49 Years | 1,681 (5.3%) | 1,608 (5.4%) |
| 50 to 54 Years | 1,800 (5.7%) | 1,621 (5.4%) |
| 55 to 59 Years | 1,686 (5.4%) | 1,956 (6.6%) |
| 60 to 64 Years | 1,930 (6.1%) | 1,735 (5.8%) |
| 65 to 69 Years | 1,370 (4.4%) | 1,563 (5.2%) |
| 70 to 74 Years | 1,246 (4.0%) | 1,116 (3.7%) |
| 75 to 79 Years | 716 (2.3%) | 645 (2.2%) |
| 80 to 84 Years | 583 (1.9%) | 870 (2.9%) |
| 85 Years and over | 281 (0.9%) | 518 (1.7%) |
| Total | 31,413 (100.0%) | 29,851 (100.0%) |
Families and Households in Eddy County
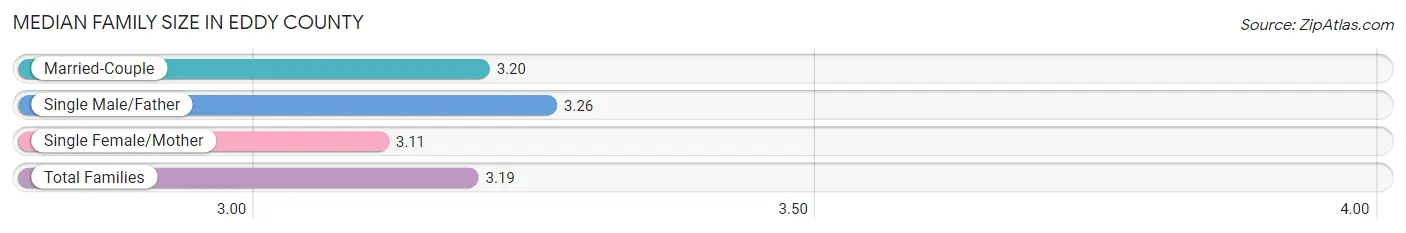
Median Family Size in Eddy County
The median family size in Eddy County is 3.19 persons per family, with single male/father families (1,695 | 10.6%) accounting for the largest median family size of 3.26 persons per family. On the other hand, single female/mother families (2,900 | 18.1%) represent the smallest median family size with 3.11 persons per family.
| Family Type | # Families | Family Size |
| Married-Couple | 11,382 (71.2%) | 3.20 |
| Single Male/Father | 1,695 (10.6%) | 3.26 |
| Single Female/Mother | 2,900 (18.1%) | 3.11 |
| Total Families | 15,977 (100.0%) | 3.19 |
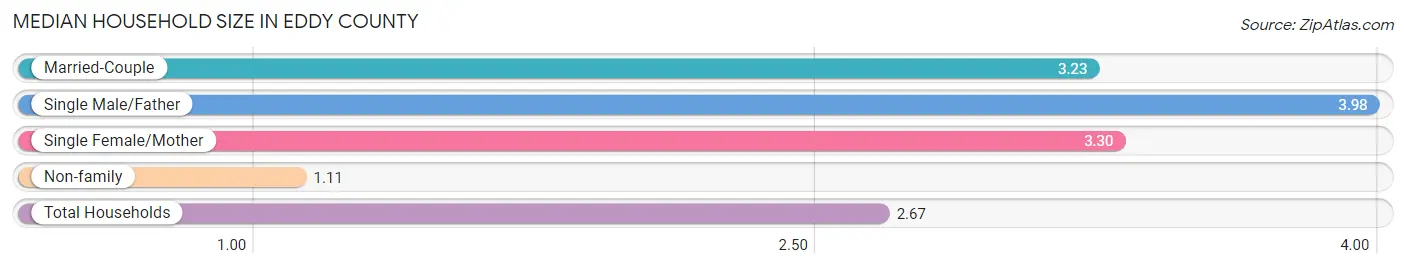
Median Household Size in Eddy County
The median household size in Eddy County is 2.67 persons per household, with single male/father households (1,695 | 7.5%) accounting for the largest median household size of 3.98 persons per household. non-family households (6,726 | 29.6%) represent the smallest median household size with 1.11 persons per household.
| Household Type | # Households | Household Size |
| Married-Couple | 11,382 (50.1%) | 3.23 |
| Single Male/Father | 1,695 (7.5%) | 3.98 |
| Single Female/Mother | 2,900 (12.8%) | 3.30 |
| Non-family | 6,726 (29.6%) | 1.11 |
| Total Households | 22,703 (100.0%) | 2.67 |
Household Size by Marriage Status in Eddy County
Out of a total of 22,703 households in Eddy County, 15,977 (70.4%) are family households, while 6,726 (29.6%) are nonfamily households. The most numerous type of family households are 2-person households, comprising 6,871, and the most common type of nonfamily households are 1-person households, comprising 6,129.
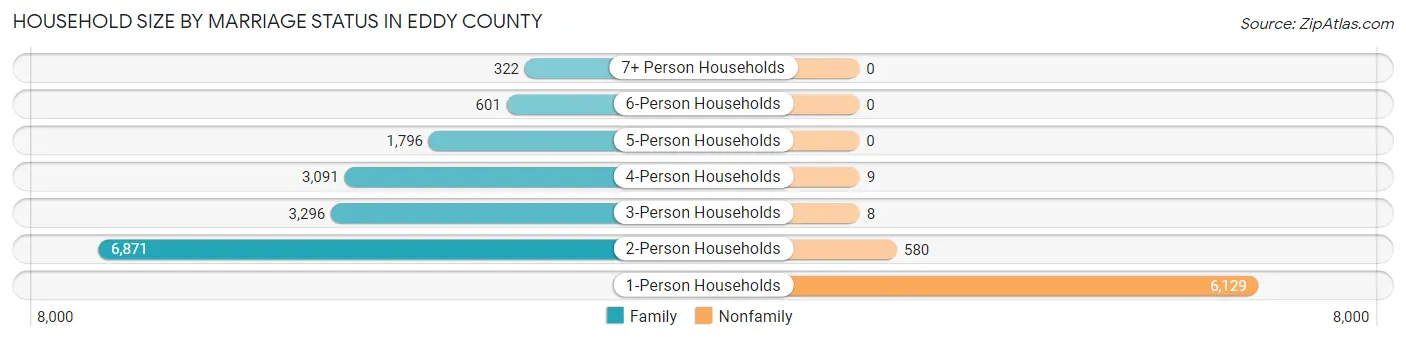
| Household Size | Family Households | Nonfamily Households |
| 1-Person Households | - | 6,129 (27.0%) |
| 2-Person Households | 6,871 (30.3%) | 580 (2.5%) |
| 3-Person Households | 3,296 (14.5%) | 8 (0.0%) |
| 4-Person Households | 3,091 (13.6%) | 9 (0.0%) |
| 5-Person Households | 1,796 (7.9%) | 0 (0.0%) |
| 6-Person Households | 601 (2.6%) | 0 (0.0%) |
| 7+ Person Households | 322 (1.4%) | 0 (0.0%) |
| Total | 15,977 (70.4%) | 6,726 (29.6%) |
Female Fertility in Eddy County
Fertility by Age in Eddy County
Average fertility rate in Eddy County is 67.0 births per 1,000 women. Women in the age bracket of 20 to 34 years have the highest fertility rate with 105.0 births per 1,000 women. Women in the age bracket of 20 to 34 years acount for 68.9% of all women with births.
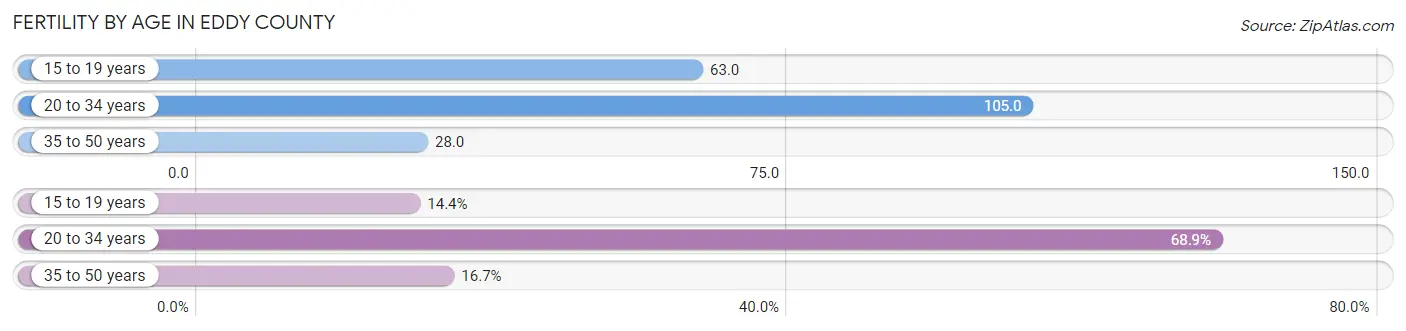
| Age Bracket | Women with Births | Births / 1,000 Women |
| 15 to 19 years | 131 (14.4%) | 63.0 |
| 20 to 34 years | 626 (68.9%) | 105.0 |
| 35 to 50 years | 152 (16.7%) | 28.0 |
| Total | 909 (100.0%) | 67.0 |
Fertility by Age by Marriage Status in Eddy County
61.5% of women with births (909) in Eddy County are married. The highest percentage of unmarried women with births falls into 15 to 19 years age bracket with 100.0% of them unmarried at the time of birth, while the lowest percentage of unmarried women with births belong to 35 to 50 years age bracket with 13.8% of them unmarried.
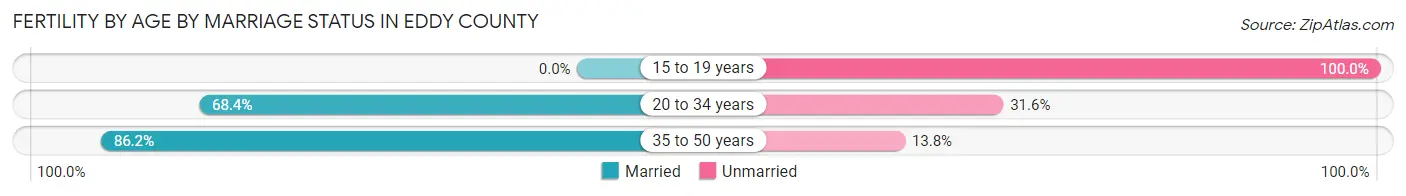
| Age Bracket | Married | Unmarried |
| 15 to 19 years | 0 (0.0%) | 131 (100.0%) |
| 20 to 34 years | 428 (68.4%) | 198 (31.6%) |
| 35 to 50 years | 131 (86.2%) | 21 (13.8%) |
| Total | 559 (61.5%) | 350 (38.5%) |
Fertility by Education in Eddy County
Average fertility rate in Eddy County is 67.0 births per 1,000 women. Women with the education attainment of less than high school have the highest fertility rate of 100.0 births per 1,000 women, while women with the education attainment of high school diploma have the lowest fertility at 41.0 births per 1,000 women. Women with the education attainment of college or associate's degree represent 35.0% of all women with births.
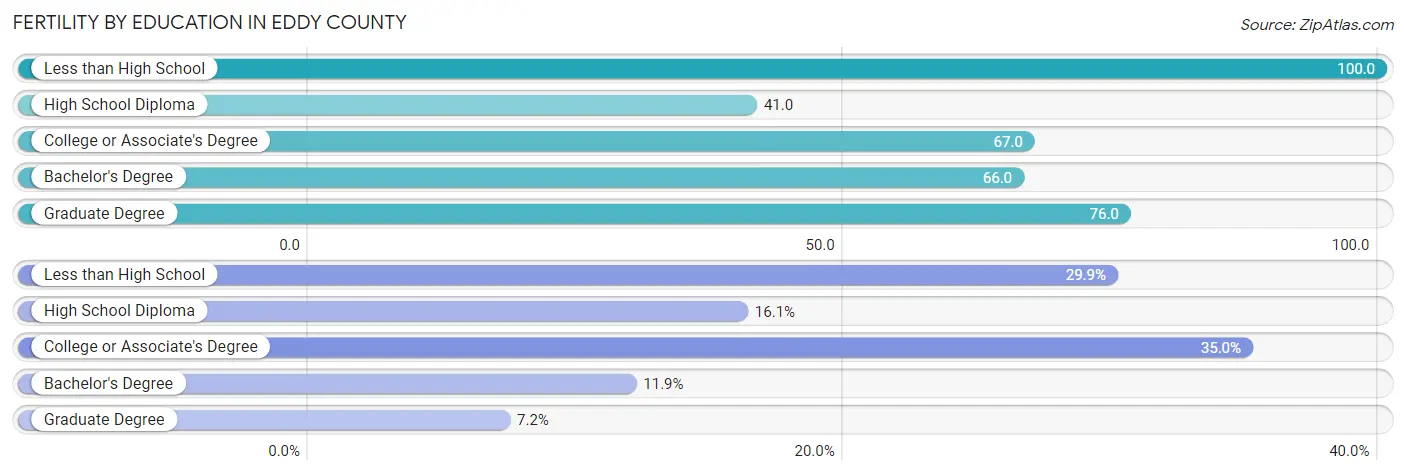
| Educational Attainment | Women with Births | Births / 1,000 Women |
| Less than High School | 272 (29.9%) | 100.0 |
| High School Diploma | 146 (16.1%) | 41.0 |
| College or Associate's Degree | 318 (35.0%) | 67.0 |
| Bachelor's Degree | 108 (11.9%) | 66.0 |
| Graduate Degree | 65 (7.1%) | 76.0 |
| Total | 909 (100.0%) | 67.0 |
Fertility by Education by Marriage Status in Eddy County
38.5% of women with births in Eddy County are unmarried. Women with the educational attainment of bachelor's degree are most likely to be married with 100.0% of them married at childbirth, while women with the educational attainment of less than high school are least likely to be married with 74.3% of them unmarried at childbirth.
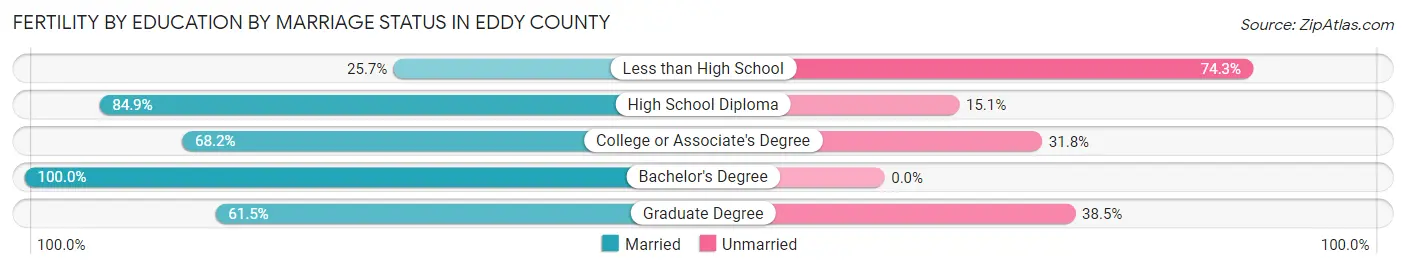
| Educational Attainment | Married | Unmarried |
| Less than High School | 70 (25.7%) | 202 (74.3%) |
| High School Diploma | 124 (84.9%) | 22 (15.1%) |
| College or Associate's Degree | 217 (68.2%) | 101 (31.8%) |
| Bachelor's Degree | 108 (100.0%) | 0 (0.0%) |
| Graduate Degree | 40 (61.5%) | 25 (38.5%) |
| Total | 559 (61.5%) | 350 (38.5%) |
Employment Characteristics in Eddy County
Employment by Class of Employer in Eddy County
Among the 27,002 employed individuals in Eddy County, private company employees (18,392 | 68.1%), not-for-profit organizations (2,102 | 7.8%), and local government employees (1,572 | 5.8%) make up the most common classes of employment.
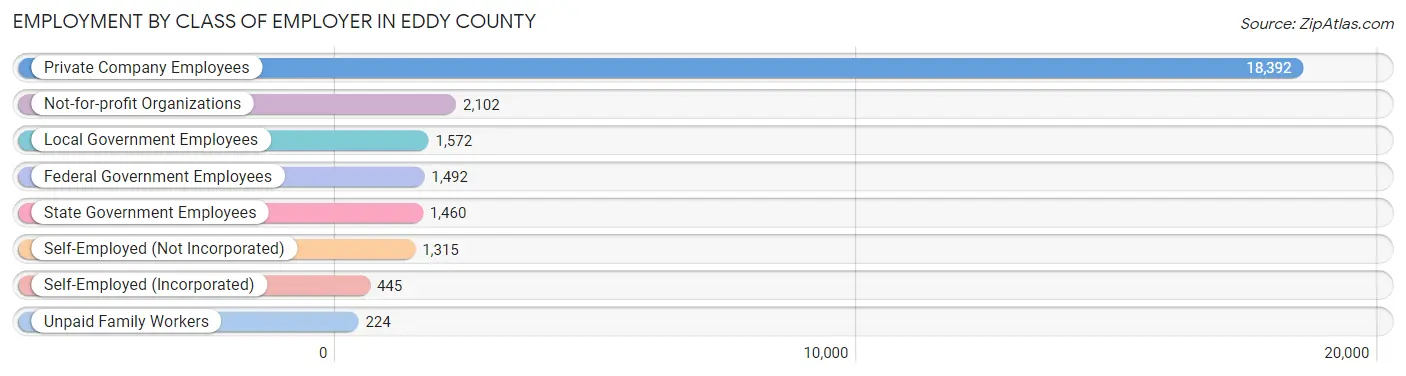
| Employer Class | # Employees | % Employees |
| Private Company Employees | 18,392 | 68.1% |
| Self-Employed (Incorporated) | 445 | 1.7% |
| Self-Employed (Not Incorporated) | 1,315 | 4.9% |
| Not-for-profit Organizations | 2,102 | 7.8% |
| Local Government Employees | 1,572 | 5.8% |
| State Government Employees | 1,460 | 5.4% |
| Federal Government Employees | 1,492 | 5.5% |
| Unpaid Family Workers | 224 | 0.8% |
| Total | 27,002 | 100.0% |
Employment Status by Age in Eddy County
According to the labor force statistics for Eddy County, out of the total population over 16 years of age (46,978), 61.1% or 28,704 individuals are in the labor force, with 4.2% or 1,206 of them unemployed. The age group with the highest labor force participation rate is 35 to 44 years, with 84.4% or 6,969 individuals in the labor force. Within the labor force, the 75 years and over age range has the highest percentage of unemployed individuals, with 20.0% or 61 of them being unemployed.
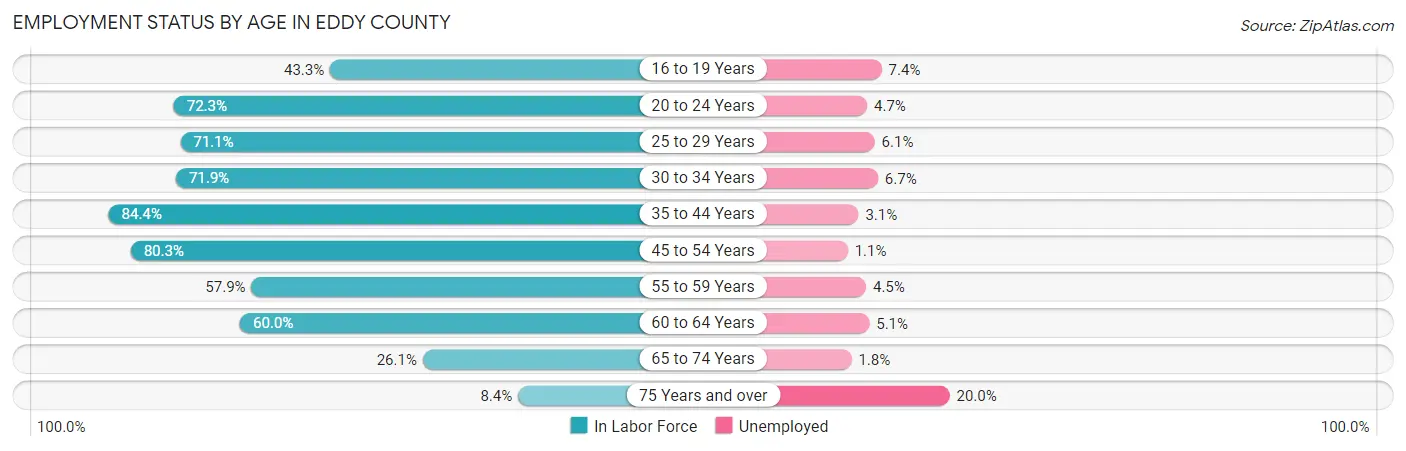
| Age Bracket | In Labor Force | Unemployed |
| 16 to 19 Years | 1,506 (43.3%) | 111 (7.4%) |
| 20 to 24 Years | 2,781 (72.3%) | 131 (4.7%) |
| 25 to 29 Years | 2,946 (71.1%) | 180 (6.1%) |
| 30 to 34 Years | 3,112 (71.9%) | 209 (6.7%) |
| 35 to 44 Years | 6,969 (84.4%) | 216 (3.1%) |
| 45 to 54 Years | 5,388 (80.3%) | 59 (1.1%) |
| 55 to 59 Years | 2,109 (57.9%) | 95 (4.5%) |
| 60 to 64 Years | 2,199 (60.0%) | 112 (5.1%) |
| 65 to 74 Years | 1,382 (26.1%) | 25 (1.8%) |
| 75 Years and over | 303 (8.4%) | 61 (20.0%) |
| Total | 28,704 (61.1%) | 1,206 (4.2%) |
Employment Status by Educational Attainment in Eddy County
According to labor force statistics for Eddy County, 73.9% of individuals (22,721) out of the total population between 25 and 64 years of age (30,745) are in the labor force, with 3.8% or 863 of them being unemployed. The group with the highest labor force participation rate are those with the educational attainment of bachelor's degree or higher, with 82.5% or 4,481 individuals in the labor force. Within the labor force, individuals with less than high school education have the highest percentage of unemployment, with 9.3% or 311 of them being unemployed.
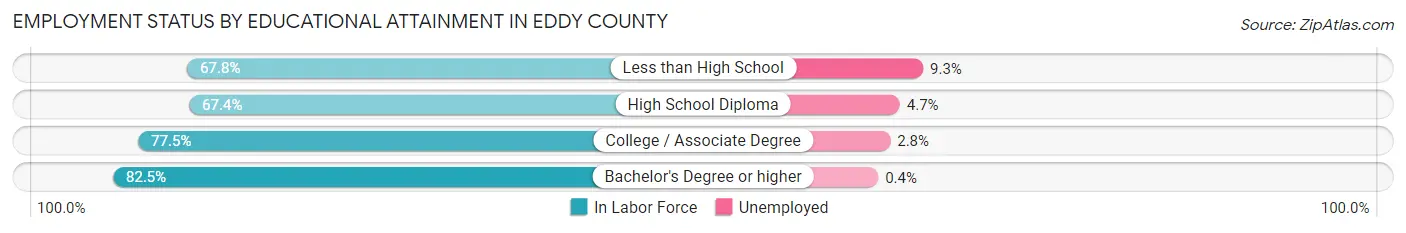
| Educational Attainment | In Labor Force | Unemployed |
| Less than High School | 3,345 (67.8%) | 459 (9.3%) |
| High School Diploma | 6,028 (67.4%) | 420 (4.7%) |
| College / Associate Degree | 8,863 (77.5%) | 320 (2.8%) |
| Bachelor's Degree or higher | 4,481 (82.5%) | 22 (0.4%) |
| Total | 22,721 (73.9%) | 1,168 (3.8%) |
Employment Occupations by Sex in Eddy County
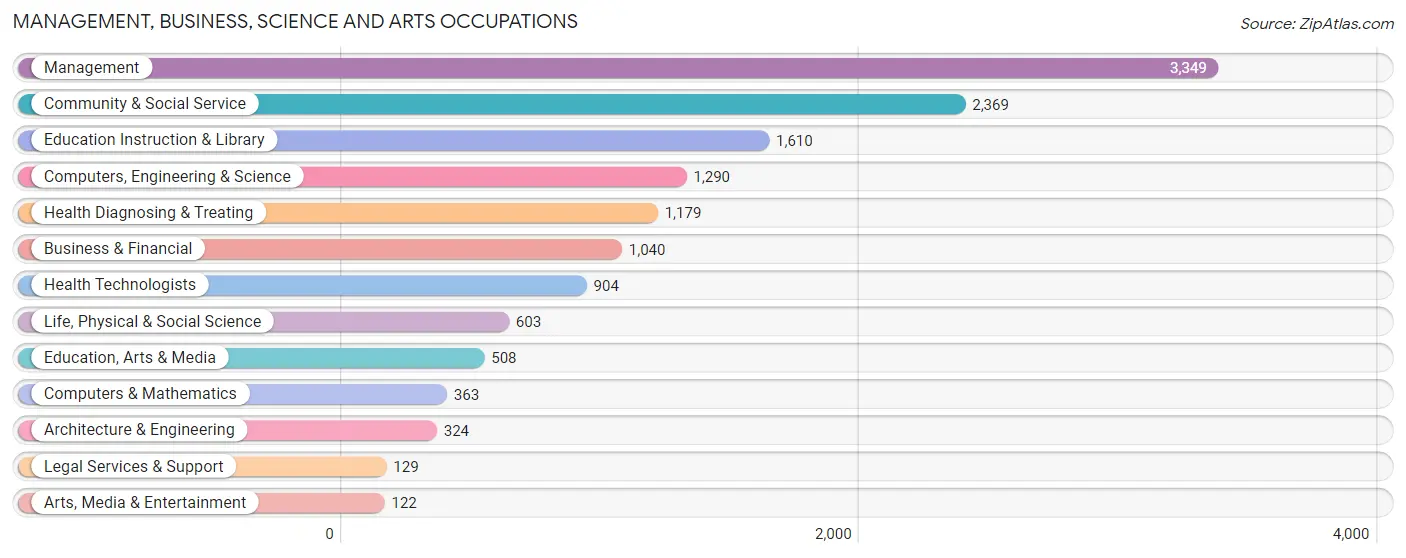
Management, Business, Science and Arts Occupations
The most common Management, Business, Science and Arts occupations in Eddy County are Management (3,349 | 12.2%), Community & Social Service (2,369 | 8.6%), Education Instruction & Library (1,610 | 5.9%), Computers, Engineering & Science (1,290 | 4.7%), and Health Diagnosing & Treating (1,179 | 4.3%).
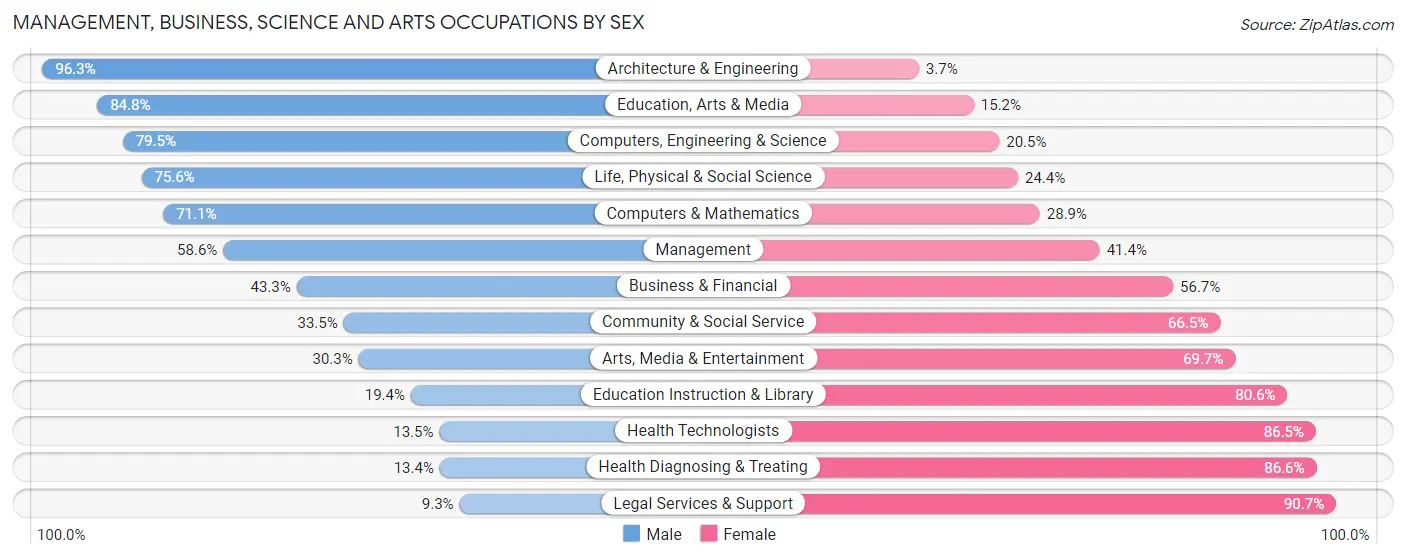
Management, Business, Science and Arts Occupations by Sex
Within the Management, Business, Science and Arts occupations in Eddy County, the most male-oriented occupations are Architecture & Engineering (96.3%), Education, Arts & Media (84.8%), and Computers, Engineering & Science (79.5%), while the most female-oriented occupations are Legal Services & Support (90.7%), Health Diagnosing & Treating (86.6%), and Health Technologists (86.5%).
| Occupation | Male | Female |
| Management | 1,962 (58.6%) | 1,387 (41.4%) |
| Business & Financial | 450 (43.3%) | 590 (56.7%) |
| Computers, Engineering & Science | 1,026 (79.5%) | 264 (20.5%) |
| Computers & Mathematics | 258 (71.1%) | 105 (28.9%) |
| Architecture & Engineering | 312 (96.3%) | 12 (3.7%) |
| Life, Physical & Social Science | 456 (75.6%) | 147 (24.4%) |
| Community & Social Service | 793 (33.5%) | 1,576 (66.5%) |
| Education, Arts & Media | 431 (84.8%) | 77 (15.2%) |
| Legal Services & Support | 12 (9.3%) | 117 (90.7%) |
| Education Instruction & Library | 313 (19.4%) | 1,297 (80.6%) |
| Arts, Media & Entertainment | 37 (30.3%) | 85 (69.7%) |
| Health Diagnosing & Treating | 158 (13.4%) | 1,021 (86.6%) |
| Health Technologists | 122 (13.5%) | 782 (86.5%) |
| Total (Category) | 4,389 (47.6%) | 4,838 (52.4%) |
| Total (Overall) | 15,875 (58.0%) | 11,516 (42.0%) |
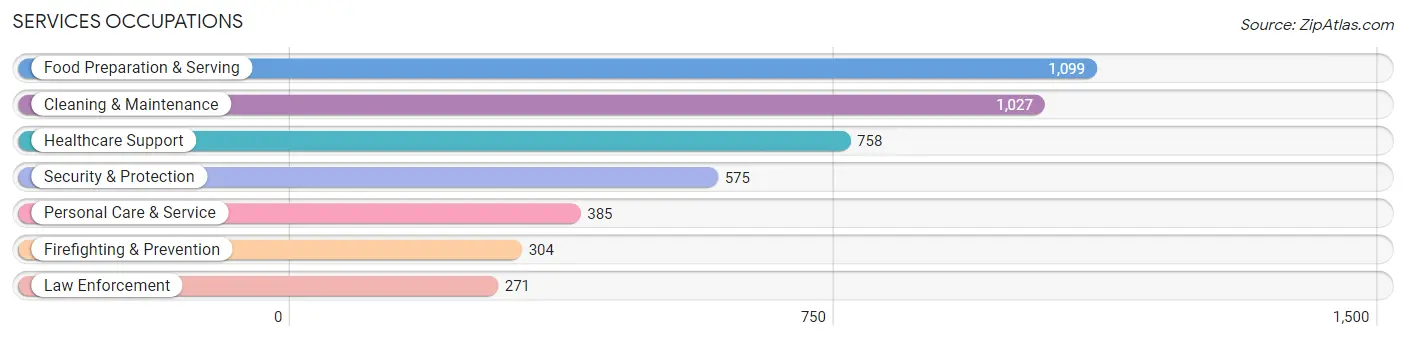
Services Occupations
The most common Services occupations in Eddy County are Food Preparation & Serving (1,099 | 4.0%), Cleaning & Maintenance (1,027 | 3.7%), Healthcare Support (758 | 2.8%), Security & Protection (575 | 2.1%), and Personal Care & Service (385 | 1.4%).
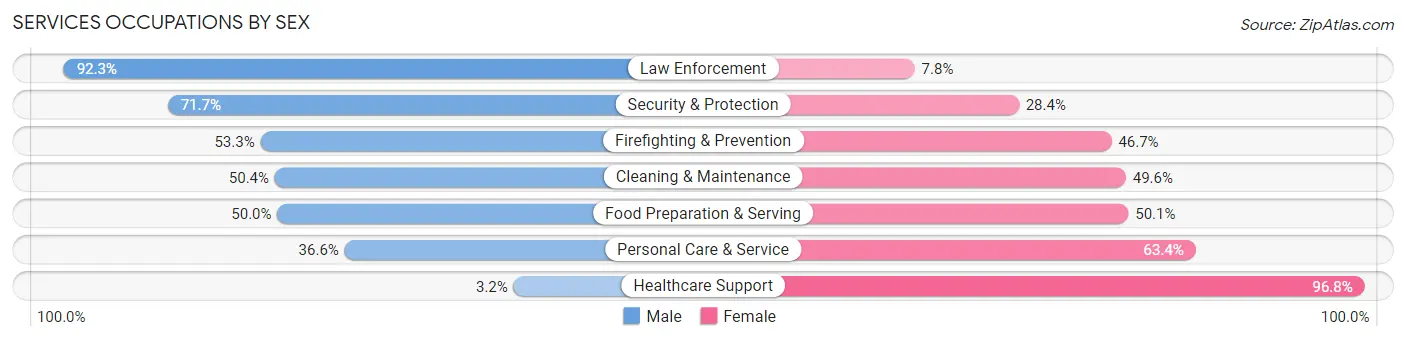
Services Occupations by Sex
Within the Services occupations in Eddy County, the most male-oriented occupations are Law Enforcement (92.2%), Security & Protection (71.7%), and Firefighting & Prevention (53.3%), while the most female-oriented occupations are Healthcare Support (96.8%), Personal Care & Service (63.4%), and Food Preparation & Serving (50.0%).
| Occupation | Male | Female |
| Healthcare Support | 24 (3.2%) | 734 (96.8%) |
| Security & Protection | 412 (71.7%) | 163 (28.3%) |
| Firefighting & Prevention | 162 (53.3%) | 142 (46.7%) |
| Law Enforcement | 250 (92.2%) | 21 (7.7%) |
| Food Preparation & Serving | 549 (49.9%) | 550 (50.0%) |
| Cleaning & Maintenance | 518 (50.4%) | 509 (49.6%) |
| Personal Care & Service | 141 (36.6%) | 244 (63.4%) |
| Total (Category) | 1,644 (42.8%) | 2,200 (57.2%) |
| Total (Overall) | 15,875 (58.0%) | 11,516 (42.0%) |
Sales and Office Occupations
The most common Sales and Office occupations in Eddy County are Office & Administration (3,065 | 11.2%), and Sales & Related (2,370 | 8.6%).
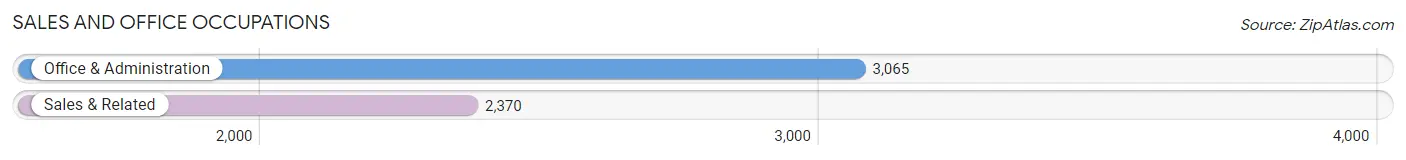
Sales and Office Occupations by Sex
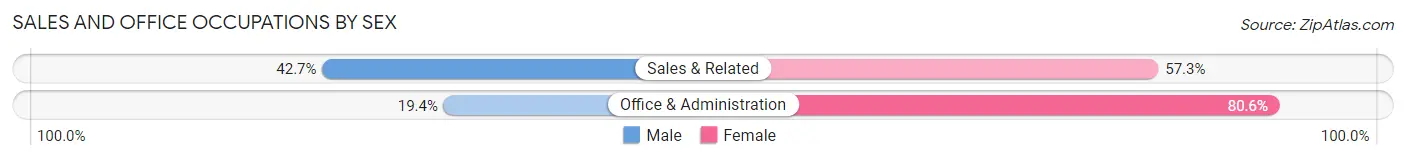
| Occupation | Male | Female |
| Sales & Related | 1,013 (42.7%) | 1,357 (57.3%) |
| Office & Administration | 594 (19.4%) | 2,471 (80.6%) |
| Total (Category) | 1,607 (29.6%) | 3,828 (70.4%) |
| Total (Overall) | 15,875 (58.0%) | 11,516 (42.0%) |
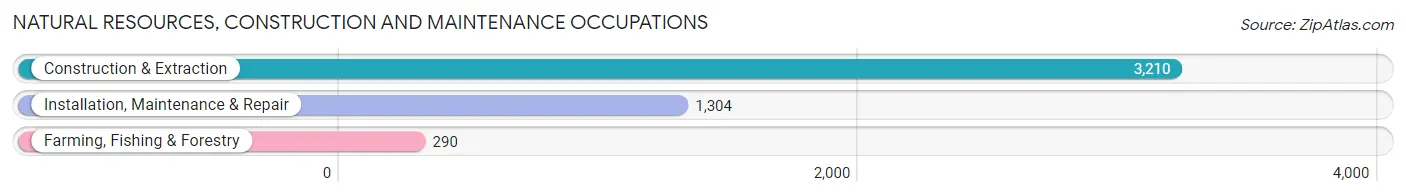
Natural Resources, Construction and Maintenance Occupations
The most common Natural Resources, Construction and Maintenance occupations in Eddy County are Construction & Extraction (3,210 | 11.7%), Installation, Maintenance & Repair (1,304 | 4.8%), and Farming, Fishing & Forestry (290 | 1.1%).
Natural Resources, Construction and Maintenance Occupations by Sex
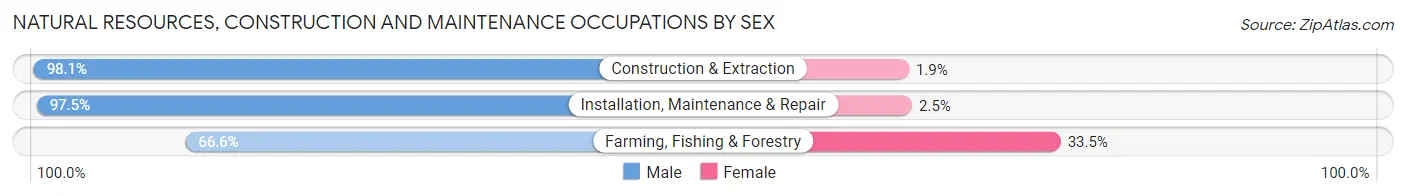
| Occupation | Male | Female |
| Farming, Fishing & Forestry | 193 (66.5%) | 97 (33.5%) |
| Construction & Extraction | 3,149 (98.1%) | 61 (1.9%) |
| Installation, Maintenance & Repair | 1,271 (97.5%) | 33 (2.5%) |
| Total (Category) | 4,613 (96.0%) | 191 (4.0%) |
| Total (Overall) | 15,875 (58.0%) | 11,516 (42.0%) |
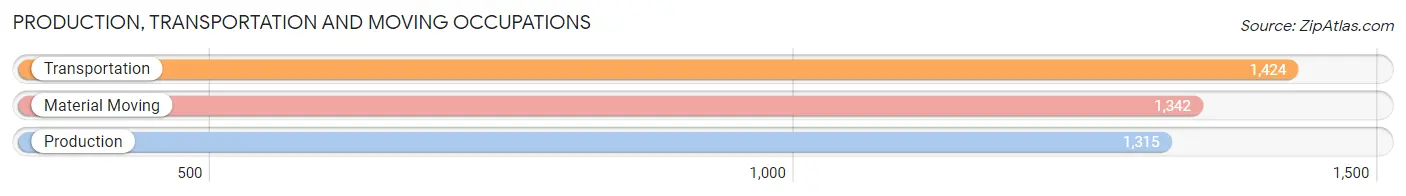
Production, Transportation and Moving Occupations
The most common Production, Transportation and Moving occupations in Eddy County are Transportation (1,424 | 5.2%), Material Moving (1,342 | 4.9%), and Production (1,315 | 4.8%).
Production, Transportation and Moving Occupations by Sex
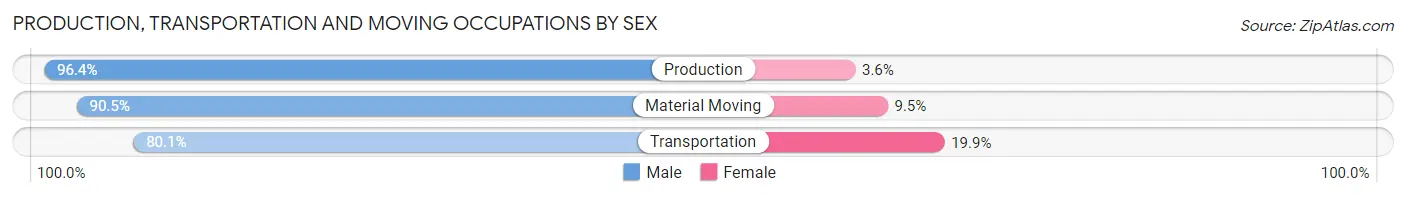
| Occupation | Male | Female |
| Production | 1,268 (96.4%) | 47 (3.6%) |
| Transportation | 1,140 (80.1%) | 284 (19.9%) |
| Material Moving | 1,214 (90.5%) | 128 (9.5%) |
| Total (Category) | 3,622 (88.7%) | 459 (11.3%) |
| Total (Overall) | 15,875 (58.0%) | 11,516 (42.0%) |
Employment Industries by Sex in Eddy County
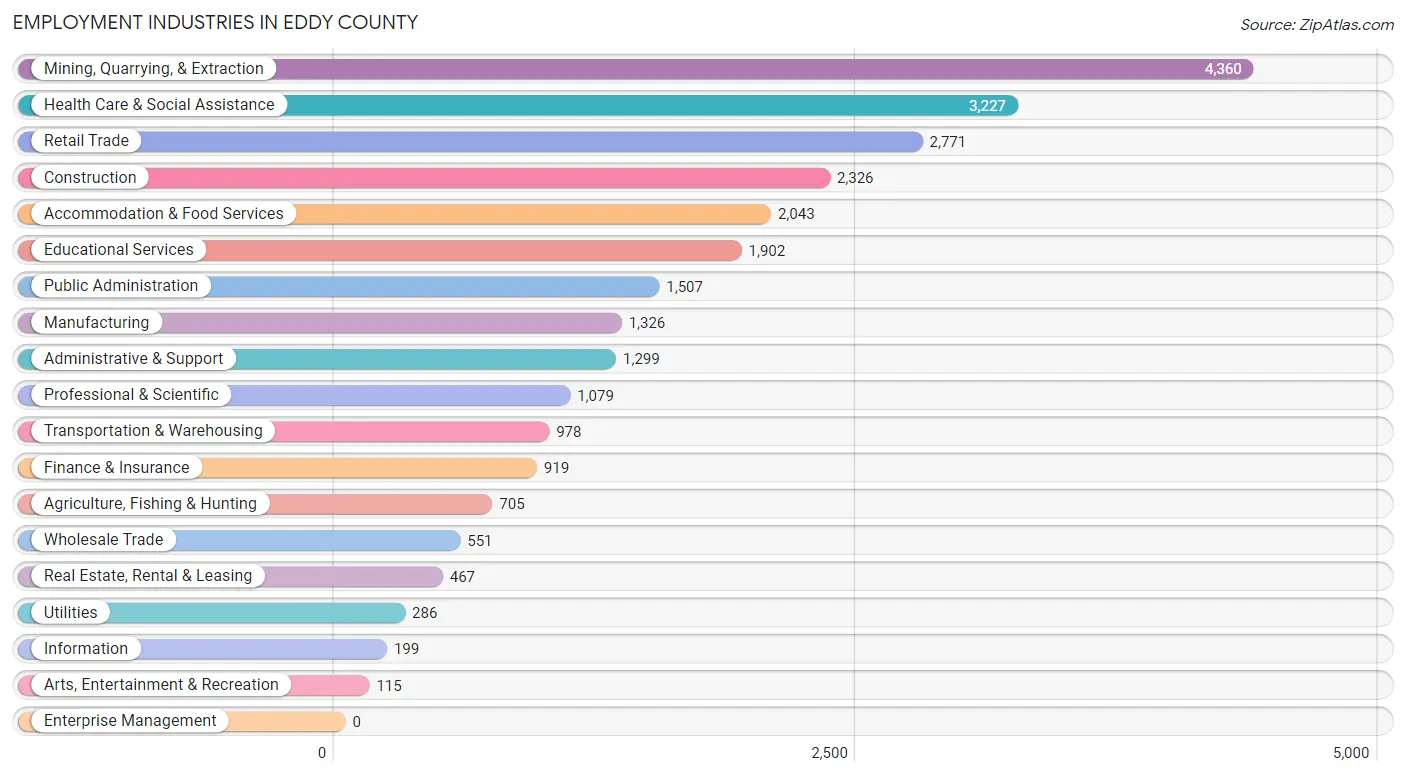
Employment Industries in Eddy County
The major employment industries in Eddy County include Mining, Quarrying, & Extraction (4,360 | 15.9%), Health Care & Social Assistance (3,227 | 11.8%), Retail Trade (2,771 | 10.1%), Construction (2,326 | 8.5%), and Accommodation & Food Services (2,043 | 7.5%).
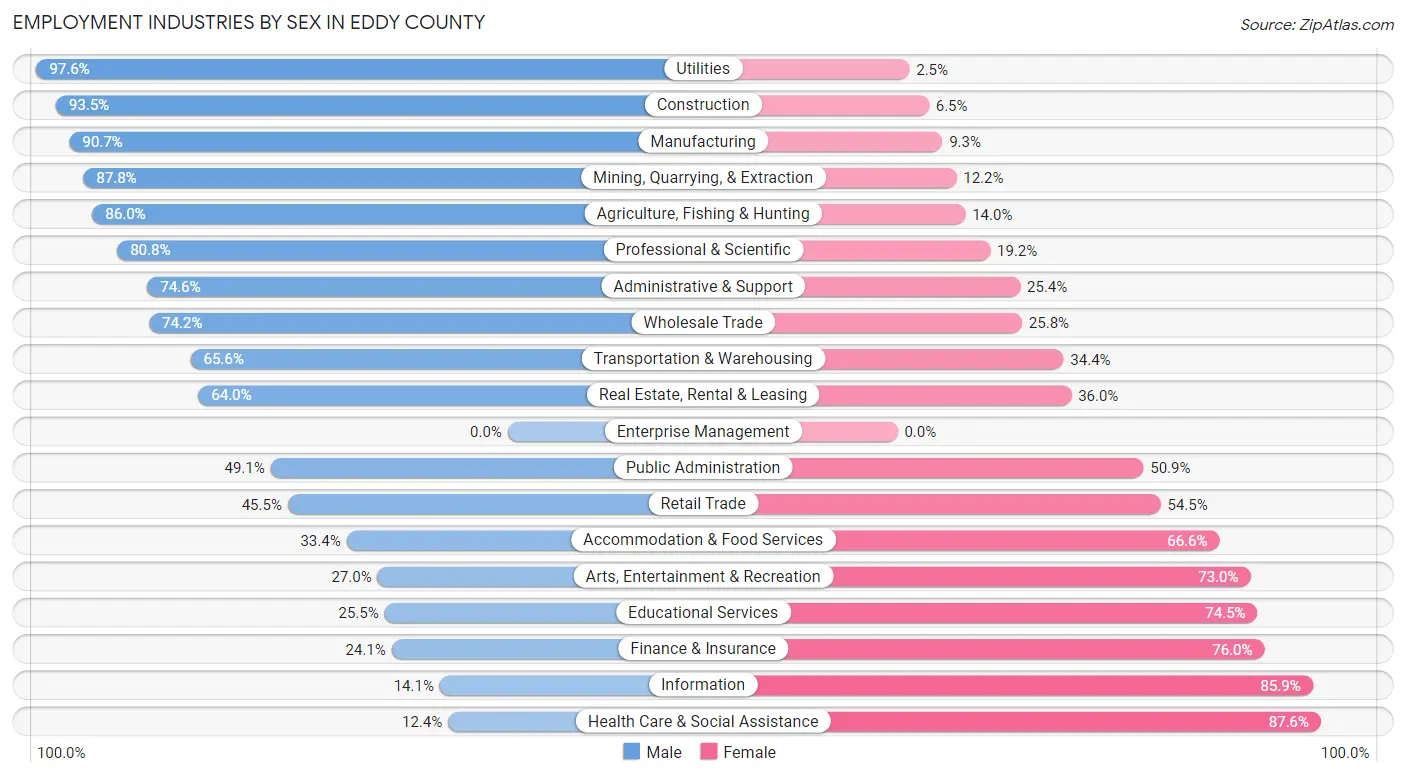
Employment Industries by Sex in Eddy County
The Eddy County industries that see more men than women are Utilities (97.6%), Construction (93.5%), and Manufacturing (90.7%), whereas the industries that tend to have a higher number of women are Health Care & Social Assistance (87.6%), Information (85.9%), and Finance & Insurance (75.9%).
| Industry | Male | Female |
| Agriculture, Fishing & Hunting | 606 (86.0%) | 99 (14.0%) |
| Mining, Quarrying, & Extraction | 3,829 (87.8%) | 531 (12.2%) |
| Construction | 2,175 (93.5%) | 151 (6.5%) |
| Manufacturing | 1,203 (90.7%) | 123 (9.3%) |
| Wholesale Trade | 409 (74.2%) | 142 (25.8%) |
| Retail Trade | 1,262 (45.5%) | 1,509 (54.5%) |
| Transportation & Warehousing | 642 (65.6%) | 336 (34.4%) |
| Utilities | 279 (97.6%) | 7 (2.5%) |
| Information | 28 (14.1%) | 171 (85.9%) |
| Finance & Insurance | 221 (24.0%) | 698 (75.9%) |
| Real Estate, Rental & Leasing | 299 (64.0%) | 168 (36.0%) |
| Professional & Scientific | 872 (80.8%) | 207 (19.2%) |
| Enterprise Management | 0 (0.0%) | 0 (0.0%) |
| Administrative & Support | 969 (74.6%) | 330 (25.4%) |
| Educational Services | 485 (25.5%) | 1,417 (74.5%) |
| Health Care & Social Assistance | 399 (12.4%) | 2,828 (87.6%) |
| Arts, Entertainment & Recreation | 31 (27.0%) | 84 (73.0%) |
| Accommodation & Food Services | 682 (33.4%) | 1,361 (66.6%) |
| Public Administration | 740 (49.1%) | 767 (50.9%) |
| Total | 15,875 (58.0%) | 11,516 (42.0%) |
Education in Eddy County
School Enrollment in Eddy County
The most common levels of schooling among the 14,996 students in Eddy County are middle school (4,350 | 29.0%), elementary school (3,510 | 23.4%), and high school (3,398 | 22.7%).
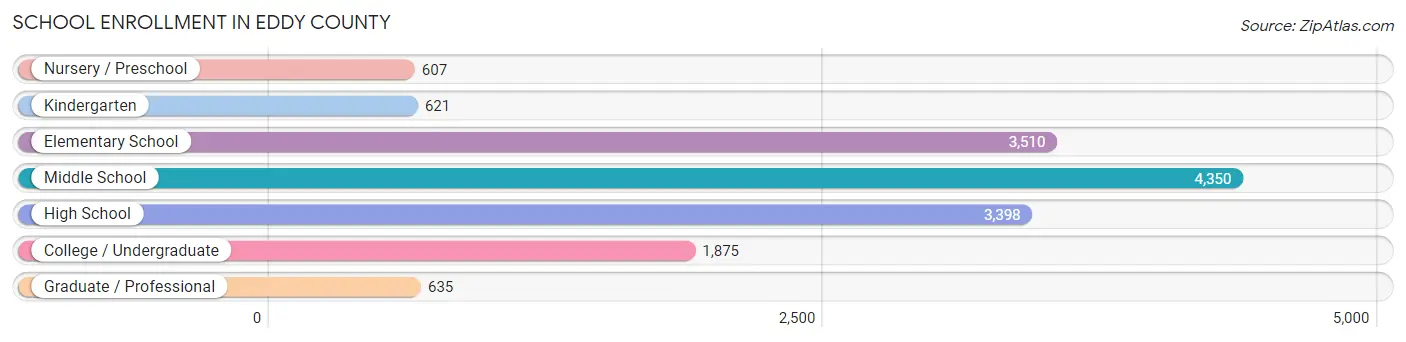
| School Level | # Students | % Students |
| Nursery / Preschool | 607 | 4.1% |
| Kindergarten | 621 | 4.1% |
| Elementary School | 3,510 | 23.4% |
| Middle School | 4,350 | 29.0% |
| High School | 3,398 | 22.7% |
| College / Undergraduate | 1,875 | 12.5% |
| Graduate / Professional | 635 | 4.2% |
| Total | 14,996 | 100.0% |
School Enrollment by Age by Funding Source in Eddy County
Out of a total of 14,996 students who are enrolled in schools in Eddy County, 1,245 (8.3%) attend a private institution, while the remaining 13,751 (91.7%) are enrolled in public schools. The age group of 3 to 4 year olds has the highest likelihood of being enrolled in private schools, with 154 (33.6% in the age bracket) enrolled. Conversely, the age group of 18 to 19 year olds has the lowest likelihood of being enrolled in a private school, with 725 (100.0% in the age bracket) attending a public institution.
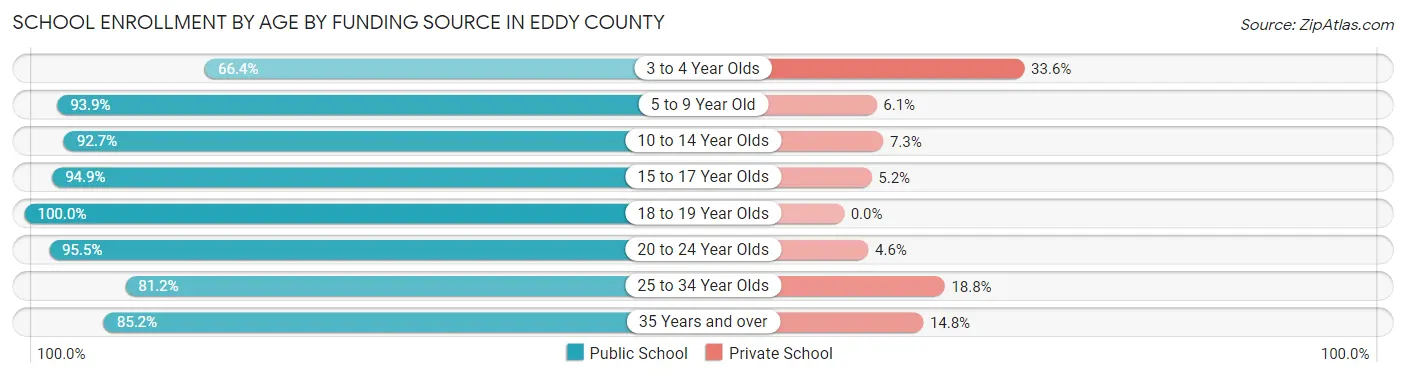
| Age Bracket | Public School | Private School |
| 3 to 4 Year Olds | 304 (66.4%) | 154 (33.6%) |
| 5 to 9 Year Old | 3,507 (93.9%) | 227 (6.1%) |
| 10 to 14 Year Olds | 4,675 (92.7%) | 369 (7.3%) |
| 15 to 17 Year Olds | 2,357 (94.9%) | 128 (5.1%) |
| 18 to 19 Year Olds | 725 (100.0%) | 0 (0.0%) |
| 20 to 24 Year Olds | 482 (95.5%) | 23 (4.5%) |
| 25 to 34 Year Olds | 935 (81.2%) | 216 (18.8%) |
| 35 Years and over | 762 (85.2%) | 132 (14.8%) |
| Total | 13,751 (91.7%) | 1,245 (8.3%) |
Educational Attainment by Field of Study in Eddy County
Education (1,534 | 20.1%), business (1,374 | 18.0%), science & technology (830 | 10.9%), engineering (771 | 10.1%), and bio, nature & agricultural (747 | 9.8%) are the most common fields of study among 7,638 individuals in Eddy County who have obtained a bachelor's degree or higher.
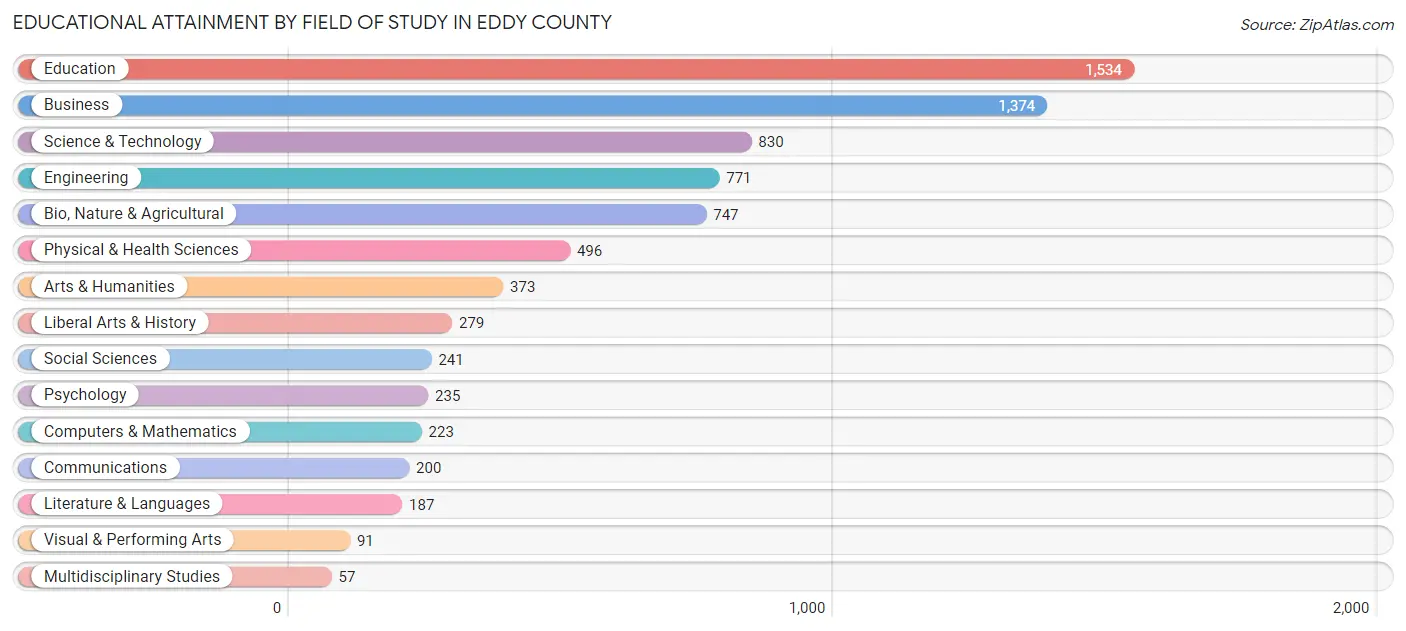
| Field of Study | # Graduates | % Graduates |
| Computers & Mathematics | 223 | 2.9% |
| Bio, Nature & Agricultural | 747 | 9.8% |
| Physical & Health Sciences | 496 | 6.5% |
| Psychology | 235 | 3.1% |
| Social Sciences | 241 | 3.2% |
| Engineering | 771 | 10.1% |
| Multidisciplinary Studies | 57 | 0.7% |
| Science & Technology | 830 | 10.9% |
| Business | 1,374 | 18.0% |
| Education | 1,534 | 20.1% |
| Literature & Languages | 187 | 2.5% |
| Liberal Arts & History | 279 | 3.6% |
| Visual & Performing Arts | 91 | 1.2% |
| Communications | 200 | 2.6% |
| Arts & Humanities | 373 | 4.9% |
| Total | 7,638 | 100.0% |
Transportation & Commute in Eddy County
Vehicle Availability by Sex in Eddy County
The most prevalent vehicle ownership categories in Eddy County are males with 2 vehicles (5,977, accounting for 38.1%) and females with 2 vehicles (3,955, making up 53.4%).
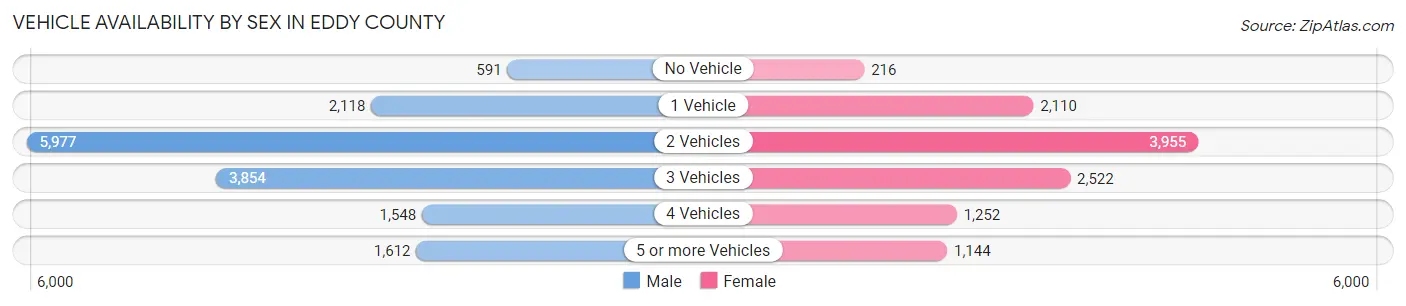
| Vehicles Available | Male | Female |
| No Vehicle | 591 (3.8%) | 216 (1.9%) |
| 1 Vehicle | 2,118 (13.5%) | 2,110 (18.8%) |
| 2 Vehicles | 5,977 (38.1%) | 3,955 (35.3%) |
| 3 Vehicles | 3,854 (24.5%) | 2,522 (22.5%) |
| 4 Vehicles | 1,548 (9.9%) | 1,252 (11.2%) |
| 5 or more Vehicles | 1,612 (10.3%) | 1,144 (10.2%) |
| Total | 15,700 (100.0%) | 11,199 (100.0%) |
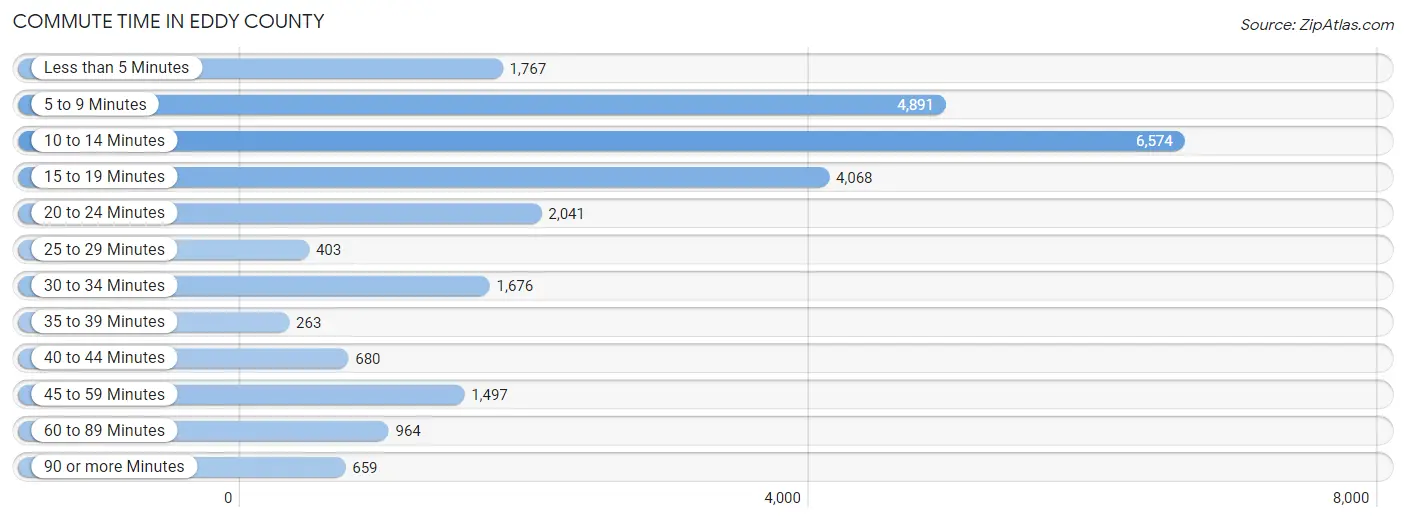
Commute Time in Eddy County
The most frequently occuring commute durations in Eddy County are 10 to 14 minutes (6,574 commuters, 25.8%), 5 to 9 minutes (4,891 commuters, 19.2%), and 15 to 19 minutes (4,068 commuters, 16.0%).
| Commute Time | # Commuters | % Commuters |
| Less than 5 Minutes | 1,767 | 6.9% |
| 5 to 9 Minutes | 4,891 | 19.2% |
| 10 to 14 Minutes | 6,574 | 25.8% |
| 15 to 19 Minutes | 4,068 | 16.0% |
| 20 to 24 Minutes | 2,041 | 8.0% |
| 25 to 29 Minutes | 403 | 1.6% |
| 30 to 34 Minutes | 1,676 | 6.6% |
| 35 to 39 Minutes | 263 | 1.0% |
| 40 to 44 Minutes | 680 | 2.7% |
| 45 to 59 Minutes | 1,497 | 5.9% |
| 60 to 89 Minutes | 964 | 3.8% |
| 90 or more Minutes | 659 | 2.6% |
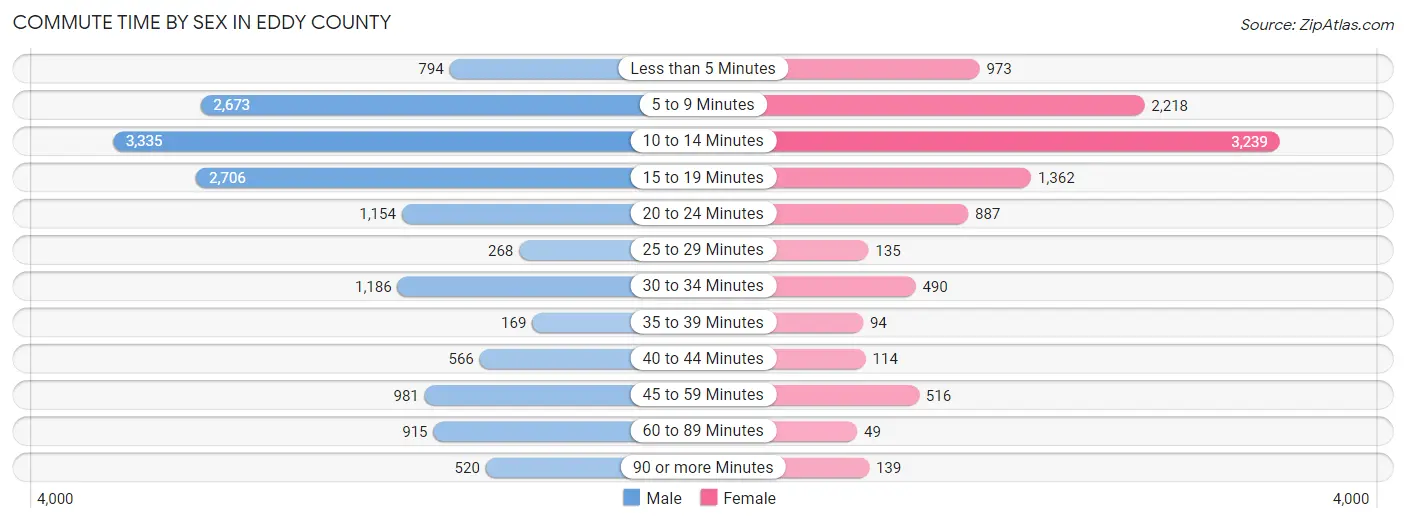
Commute Time by Sex in Eddy County
The most common commute times in Eddy County are 10 to 14 minutes (3,335 commuters, 21.8%) for males and 10 to 14 minutes (3,239 commuters, 31.7%) for females.
| Commute Time | Male | Female |
| Less than 5 Minutes | 794 (5.2%) | 973 (9.5%) |
| 5 to 9 Minutes | 2,673 (17.5%) | 2,218 (21.7%) |
| 10 to 14 Minutes | 3,335 (21.8%) | 3,239 (31.7%) |
| 15 to 19 Minutes | 2,706 (17.7%) | 1,362 (13.3%) |
| 20 to 24 Minutes | 1,154 (7.6%) | 887 (8.7%) |
| 25 to 29 Minutes | 268 (1.8%) | 135 (1.3%) |
| 30 to 34 Minutes | 1,186 (7.8%) | 490 (4.8%) |
| 35 to 39 Minutes | 169 (1.1%) | 94 (0.9%) |
| 40 to 44 Minutes | 566 (3.7%) | 114 (1.1%) |
| 45 to 59 Minutes | 981 (6.4%) | 516 (5.1%) |
| 60 to 89 Minutes | 915 (6.0%) | 49 (0.5%) |
| 90 or more Minutes | 520 (3.4%) | 139 (1.4%) |
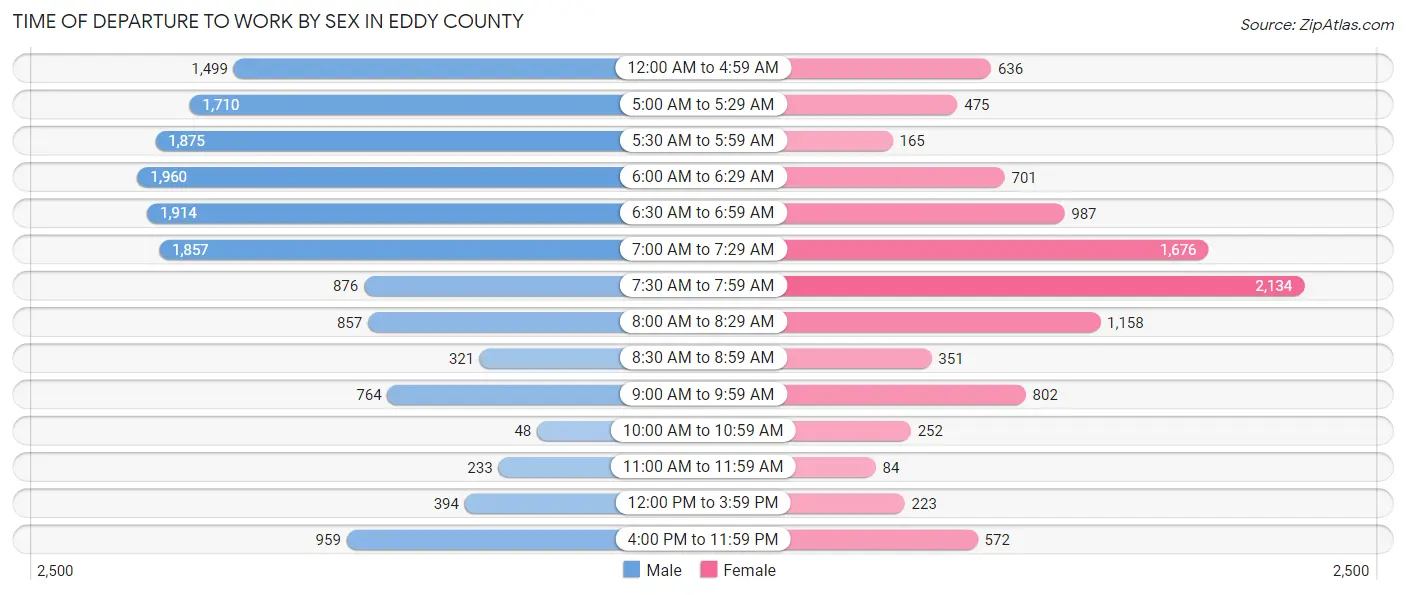
Time of Departure to Work by Sex in Eddy County
The most frequent times of departure to work in Eddy County are 6:00 AM to 6:29 AM (1,960, 12.8%) for males and 7:30 AM to 7:59 AM (2,134, 20.9%) for females.
| Time of Departure | Male | Female |
| 12:00 AM to 4:59 AM | 1,499 (9.8%) | 636 (6.2%) |
| 5:00 AM to 5:29 AM | 1,710 (11.2%) | 475 (4.6%) |
| 5:30 AM to 5:59 AM | 1,875 (12.3%) | 165 (1.6%) |
| 6:00 AM to 6:29 AM | 1,960 (12.8%) | 701 (6.9%) |
| 6:30 AM to 6:59 AM | 1,914 (12.5%) | 987 (9.7%) |
| 7:00 AM to 7:29 AM | 1,857 (12.2%) | 1,676 (16.4%) |
| 7:30 AM to 7:59 AM | 876 (5.7%) | 2,134 (20.9%) |
| 8:00 AM to 8:29 AM | 857 (5.6%) | 1,158 (11.3%) |
| 8:30 AM to 8:59 AM | 321 (2.1%) | 351 (3.4%) |
| 9:00 AM to 9:59 AM | 764 (5.0%) | 802 (7.9%) |
| 10:00 AM to 10:59 AM | 48 (0.3%) | 252 (2.5%) |
| 11:00 AM to 11:59 AM | 233 (1.5%) | 84 (0.8%) |
| 12:00 PM to 3:59 PM | 394 (2.6%) | 223 (2.2%) |
| 4:00 PM to 11:59 PM | 959 (6.3%) | 572 (5.6%) |
| Total | 15,267 (100.0%) | 10,216 (100.0%) |
Housing Occupancy in Eddy County
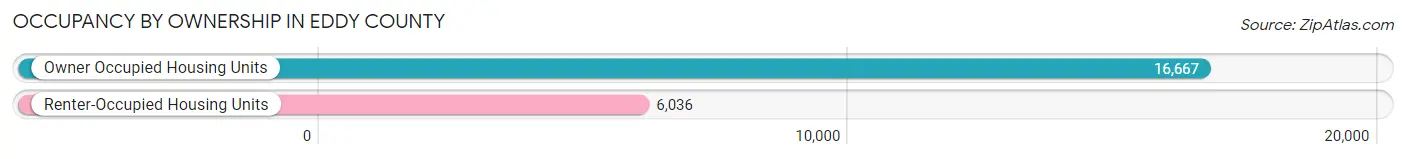
Occupancy by Ownership in Eddy County
Of the total 22,703 dwellings in Eddy County, owner-occupied units account for 16,667 (73.4%), while renter-occupied units make up 6,036 (26.6%).
| Occupancy | # Housing Units | % Housing Units |
| Owner Occupied Housing Units | 16,667 | 73.4% |
| Renter-Occupied Housing Units | 6,036 | 26.6% |
| Total Occupied Housing Units | 22,703 | 100.0% |
Occupancy by Household Size in Eddy County
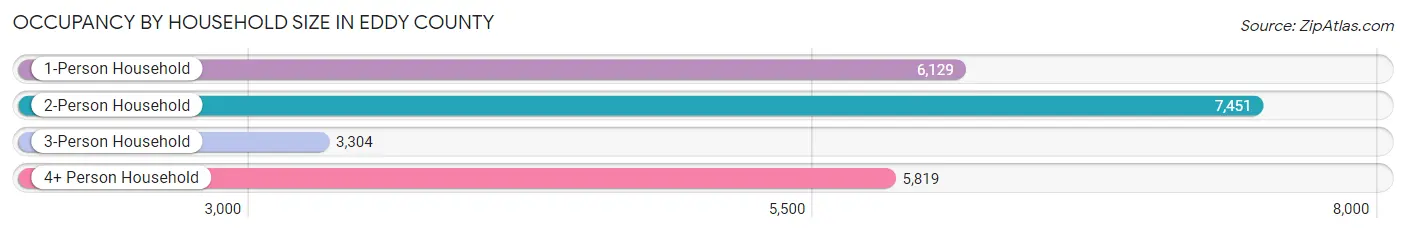
| Household Size | # Housing Units | % Housing Units |
| 1-Person Household | 6,129 | 27.0% |
| 2-Person Household | 7,451 | 32.8% |
| 3-Person Household | 3,304 | 14.5% |
| 4+ Person Household | 5,819 | 25.6% |
| Total Housing Units | 22,703 | 100.0% |
Occupancy by Ownership by Household Size in Eddy County
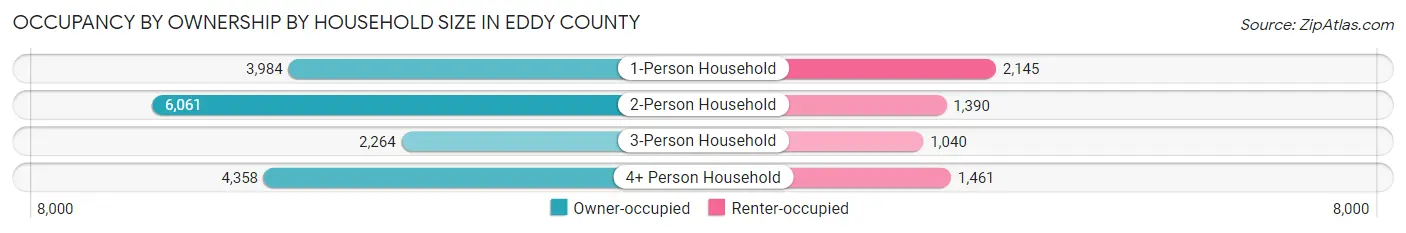
| Household Size | Owner-occupied | Renter-occupied |
| 1-Person Household | 3,984 (65.0%) | 2,145 (35.0%) |
| 2-Person Household | 6,061 (81.3%) | 1,390 (18.7%) |
| 3-Person Household | 2,264 (68.5%) | 1,040 (31.5%) |
| 4+ Person Household | 4,358 (74.9%) | 1,461 (25.1%) |
| Total Housing Units | 16,667 (73.4%) | 6,036 (26.6%) |
Occupancy by Educational Attainment in Eddy County
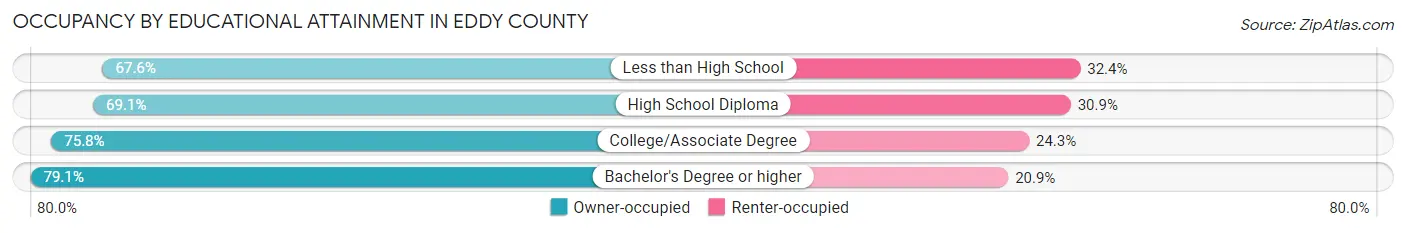
| Household Size | Owner-occupied | Renter-occupied |
| Less than High School | 2,376 (67.6%) | 1,138 (32.4%) |
| High School Diploma | 4,206 (69.1%) | 1,877 (30.9%) |
| College/Associate Degree | 6,333 (75.7%) | 2,027 (24.2%) |
| Bachelor's Degree or higher | 3,752 (79.1%) | 994 (20.9%) |
Occupancy by Age of Householder in Eddy County
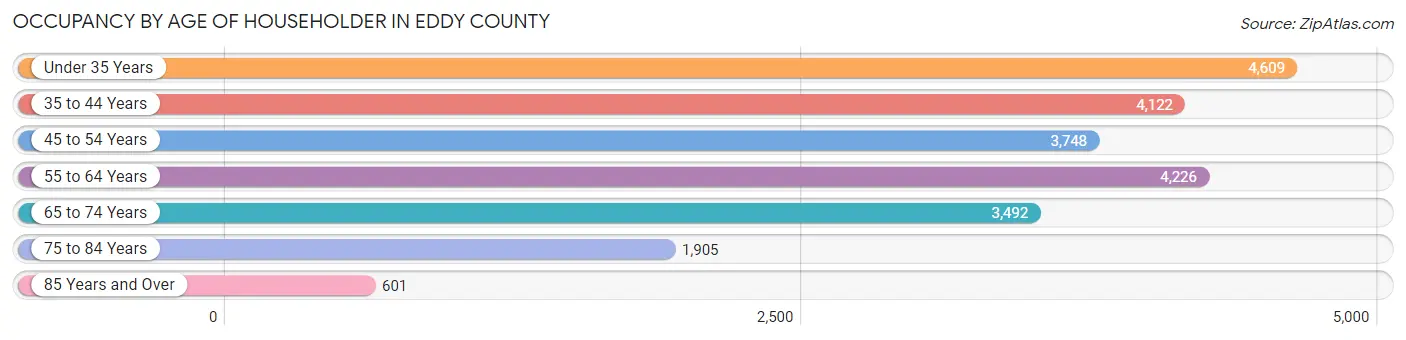
| Age Bracket | # Households | % Households |
| Under 35 Years | 4,609 | 20.3% |
| 35 to 44 Years | 4,122 | 18.2% |
| 45 to 54 Years | 3,748 | 16.5% |
| 55 to 64 Years | 4,226 | 18.6% |
| 65 to 74 Years | 3,492 | 15.4% |
| 75 to 84 Years | 1,905 | 8.4% |
| 85 Years and Over | 601 | 2.6% |
| Total | 22,703 | 100.0% |
Housing Finances in Eddy County
Median Income by Occupancy in Eddy County
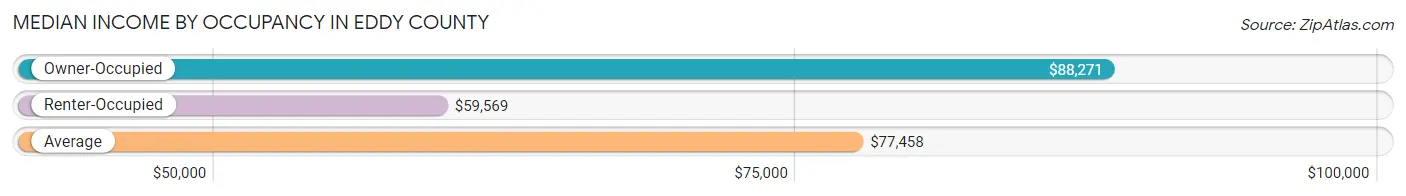
| Occupancy Type | # Households | Median Income |
| Owner-Occupied | 16,667 (73.4%) | $88,271 |
| Renter-Occupied | 6,036 (26.6%) | $59,569 |
| Average | 22,703 (100.0%) | $77,458 |
Occupancy by Householder Income Bracket in Eddy County
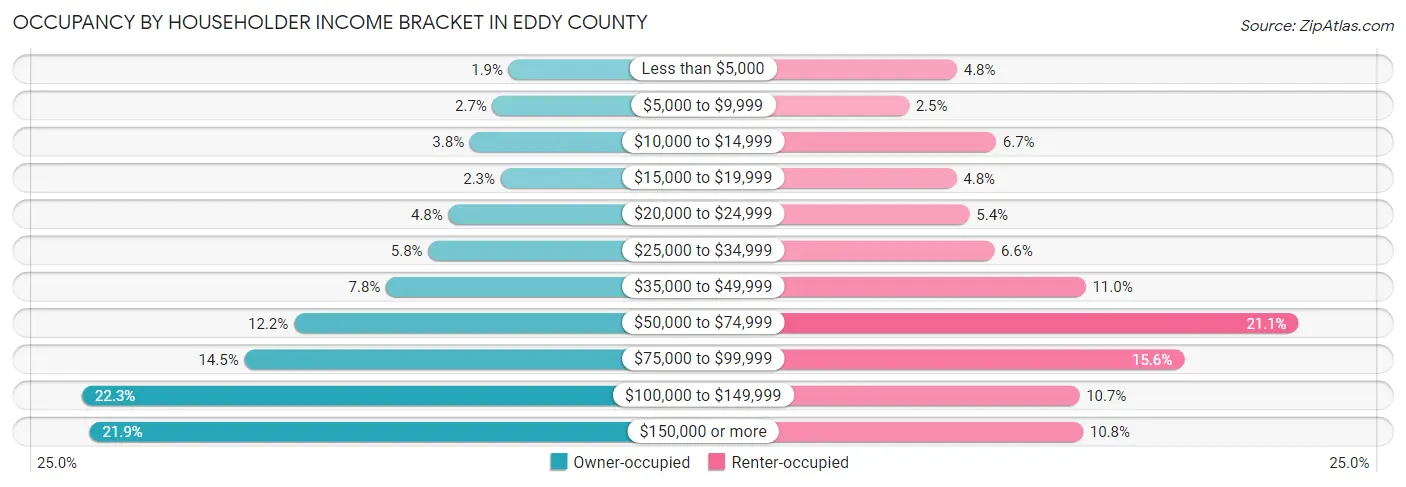
| Income Bracket | Owner-occupied | Renter-occupied |
| Less than $5,000 | 324 (1.9%) | 291 (4.8%) |
| $5,000 to $9,999 | 452 (2.7%) | 153 (2.5%) |
| $10,000 to $14,999 | 632 (3.8%) | 403 (6.7%) |
| $15,000 to $19,999 | 387 (2.3%) | 290 (4.8%) |
| $20,000 to $24,999 | 802 (4.8%) | 327 (5.4%) |
| $25,000 to $34,999 | 961 (5.8%) | 398 (6.6%) |
| $35,000 to $49,999 | 1,296 (7.8%) | 661 (11.0%) |
| $50,000 to $74,999 | 2,029 (12.2%) | 1,273 (21.1%) |
| $75,000 to $99,999 | 2,422 (14.5%) | 944 (15.6%) |
| $100,000 to $149,999 | 3,711 (22.3%) | 643 (10.6%) |
| $150,000 or more | 3,651 (21.9%) | 653 (10.8%) |
| Total | 16,667 (100.0%) | 6,036 (100.0%) |
Monthly Housing Cost Tiers in Eddy County
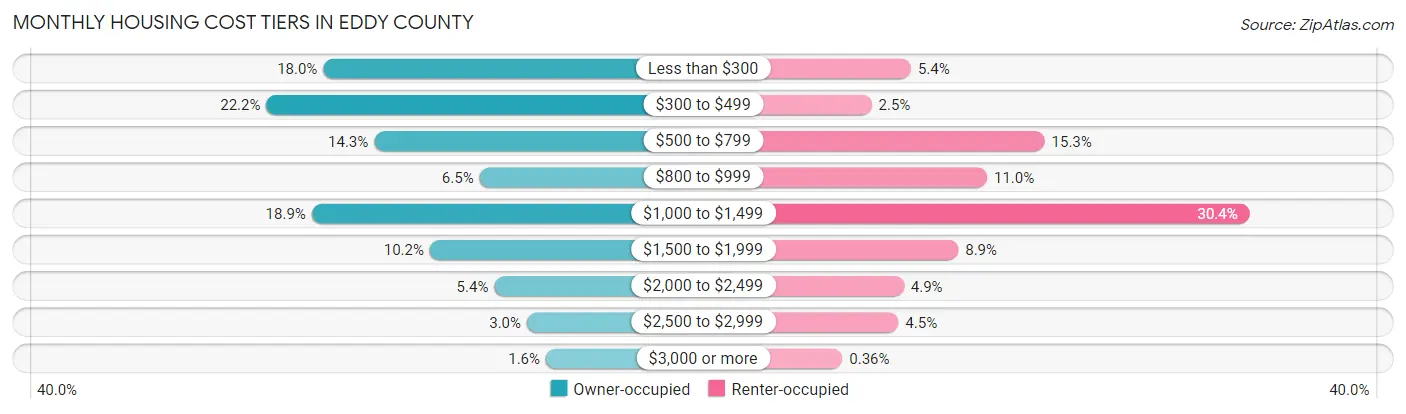
| Monthly Cost | Owner-occupied | Renter-occupied |
| Less than $300 | 3,001 (18.0%) | 327 (5.4%) |
| $300 to $499 | 3,700 (22.2%) | 152 (2.5%) |
| $500 to $799 | 2,376 (14.3%) | 921 (15.3%) |
| $800 to $999 | 1,083 (6.5%) | 665 (11.0%) |
| $1,000 to $1,499 | 3,143 (18.9%) | 1,832 (30.3%) |
| $1,500 to $1,999 | 1,693 (10.2%) | 537 (8.9%) |
| $2,000 to $2,499 | 902 (5.4%) | 295 (4.9%) |
| $2,500 to $2,999 | 501 (3.0%) | 271 (4.5%) |
| $3,000 or more | 268 (1.6%) | 22 (0.4%) |
| Total | 16,667 (100.0%) | 6,036 (100.0%) |
Physical Housing Characteristics in Eddy County
Housing Structures in Eddy County
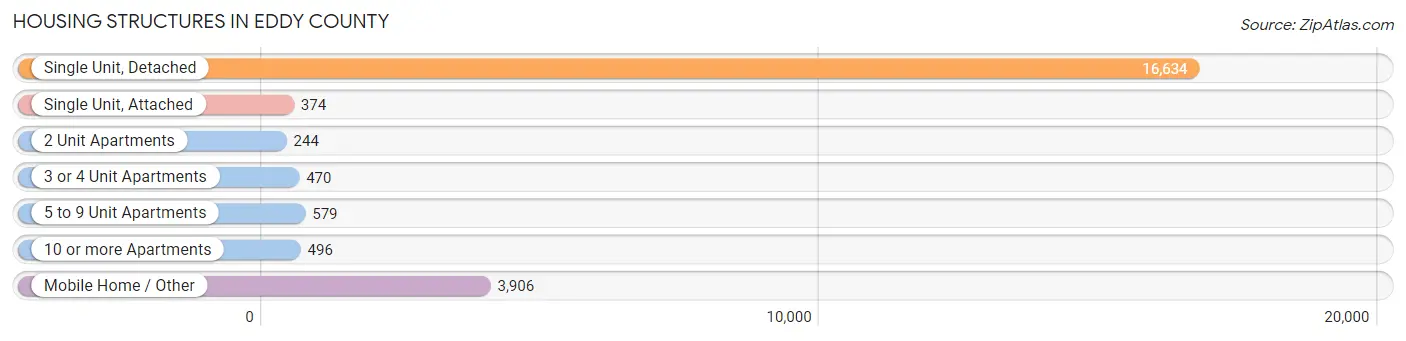
| Structure Type | # Housing Units | % Housing Units |
| Single Unit, Detached | 16,634 | 73.3% |
| Single Unit, Attached | 374 | 1.7% |
| 2 Unit Apartments | 244 | 1.1% |
| 3 or 4 Unit Apartments | 470 | 2.1% |
| 5 to 9 Unit Apartments | 579 | 2.5% |
| 10 or more Apartments | 496 | 2.2% |
| Mobile Home / Other | 3,906 | 17.2% |
| Total | 22,703 | 100.0% |
Housing Structures by Occupancy in Eddy County
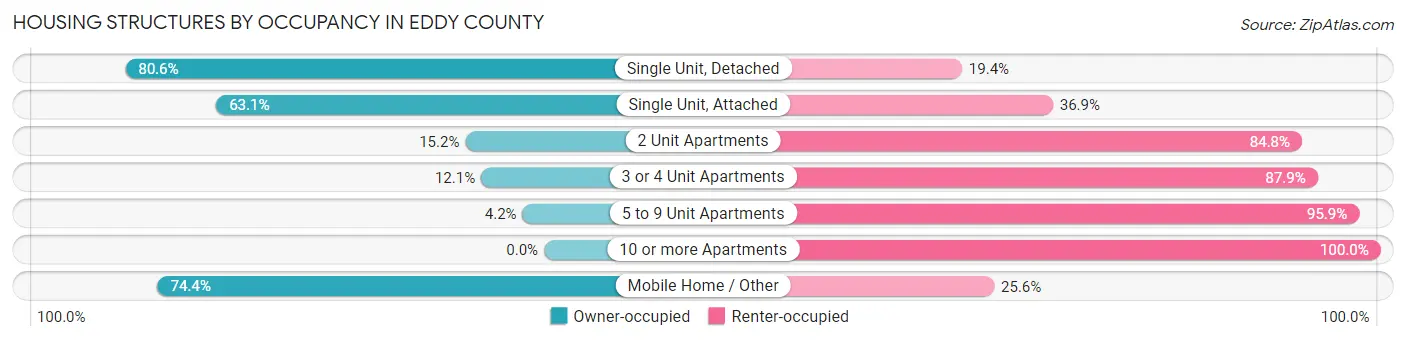
| Structure Type | Owner-occupied | Renter-occupied |
| Single Unit, Detached | 13,407 (80.6%) | 3,227 (19.4%) |
| Single Unit, Attached | 236 (63.1%) | 138 (36.9%) |
| 2 Unit Apartments | 37 (15.2%) | 207 (84.8%) |
| 3 or 4 Unit Apartments | 57 (12.1%) | 413 (87.9%) |
| 5 to 9 Unit Apartments | 24 (4.2%) | 555 (95.9%) |
| 10 or more Apartments | 0 (0.0%) | 496 (100.0%) |
| Mobile Home / Other | 2,906 (74.4%) | 1,000 (25.6%) |
| Total | 16,667 (73.4%) | 6,036 (26.6%) |
Housing Structures by Number of Rooms in Eddy County
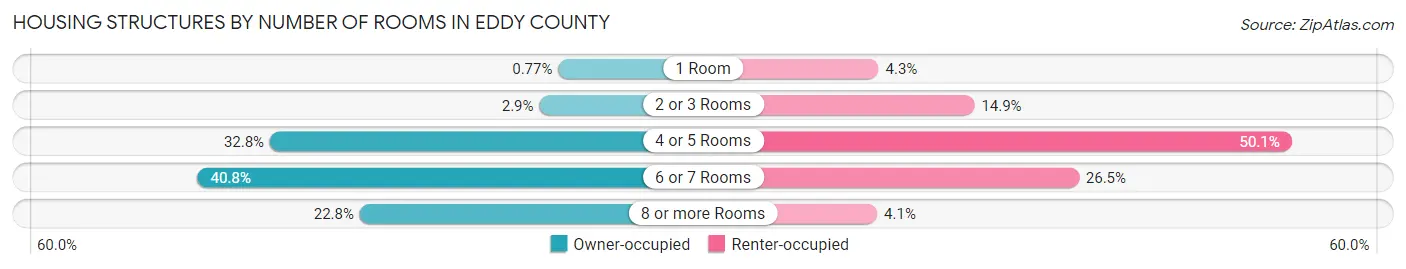
| Number of Rooms | Owner-occupied | Renter-occupied |
| 1 Room | 128 (0.8%) | 259 (4.3%) |
| 2 or 3 Rooms | 478 (2.9%) | 901 (14.9%) |
| 4 or 5 Rooms | 5,461 (32.8%) | 3,026 (50.1%) |
| 6 or 7 Rooms | 6,800 (40.8%) | 1,601 (26.5%) |
| 8 or more Rooms | 3,800 (22.8%) | 249 (4.1%) |
| Total | 16,667 (100.0%) | 6,036 (100.0%) |
Housing Structure by Heating Type in Eddy County
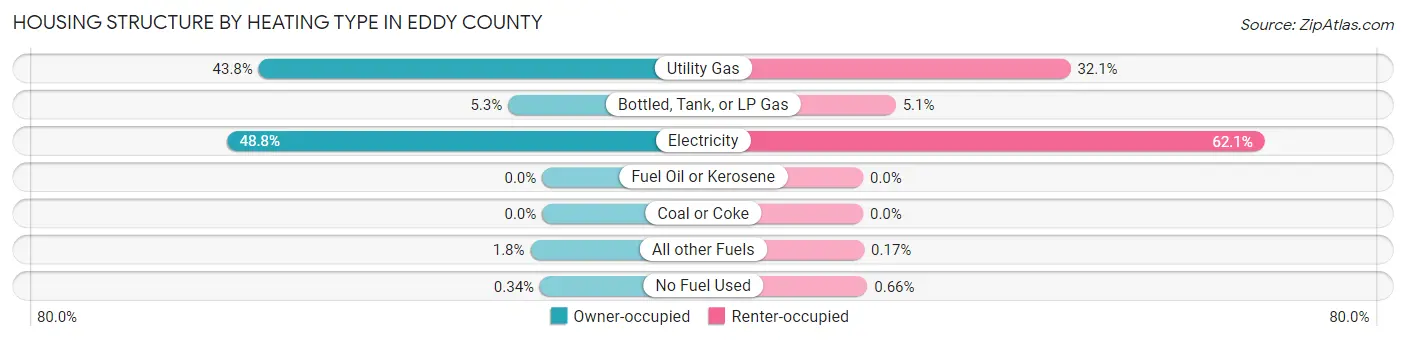
| Heating Type | Owner-occupied | Renter-occupied |
| Utility Gas | 7,303 (43.8%) | 1,935 (32.1%) |
| Bottled, Tank, or LP Gas | 876 (5.3%) | 305 (5.1%) |
| Electricity | 8,129 (48.8%) | 3,746 (62.1%) |
| Fuel Oil or Kerosene | 0 (0.0%) | 0 (0.0%) |
| Coal or Coke | 0 (0.0%) | 0 (0.0%) |
| All other Fuels | 302 (1.8%) | 10 (0.2%) |
| No Fuel Used | 57 (0.3%) | 40 (0.7%) |
| Total | 16,667 (100.0%) | 6,036 (100.0%) |
Household Vehicle Usage in Eddy County
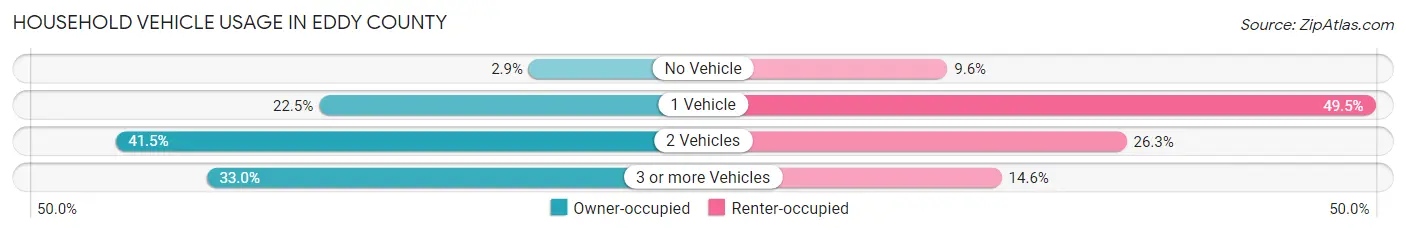
| Vehicles per Household | Owner-occupied | Renter-occupied |
| No Vehicle | 489 (2.9%) | 577 (9.6%) |
| 1 Vehicle | 3,752 (22.5%) | 2,989 (49.5%) |
| 2 Vehicles | 6,922 (41.5%) | 1,587 (26.3%) |
| 3 or more Vehicles | 5,504 (33.0%) | 883 (14.6%) |
| Total | 16,667 (100.0%) | 6,036 (100.0%) |
Real Estate & Mortgages in Eddy County
Real Estate and Mortgage Overview in Eddy County
| Characteristic | Without Mortgage | With Mortgage |
| Housing Units | 8,860 | 7,807 |
| Median Property Value | $169,500 | $226,400 |
| Median Household Income | $63,929 | $2,441 |
| Monthly Housing Costs | $382 | $241 |
| Real Estate Taxes | $681 | $379 |
Property Value by Mortgage Status in Eddy County
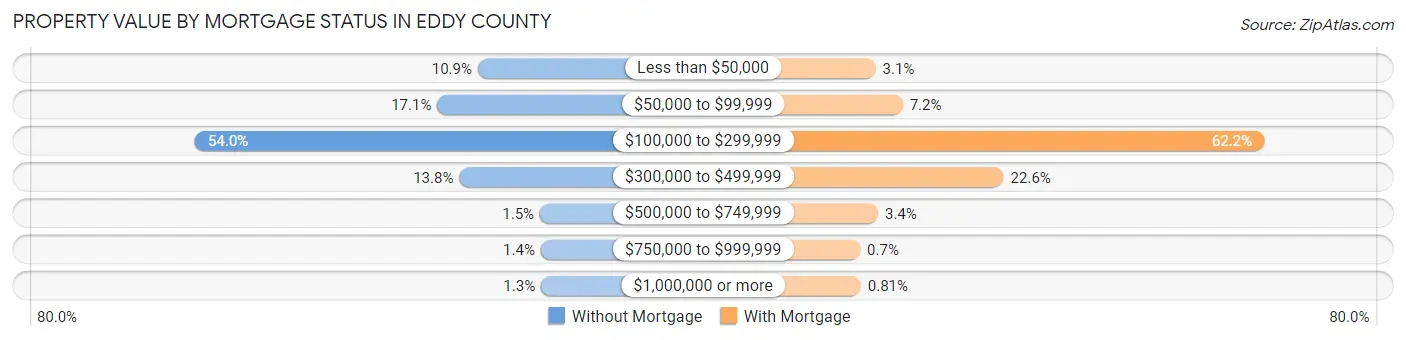
| Property Value | Without Mortgage | With Mortgage |
| Less than $50,000 | 969 (10.9%) | 239 (3.1%) |
| $50,000 to $99,999 | 1,517 (17.1%) | 561 (7.2%) |
| $100,000 to $299,999 | 4,788 (54.0%) | 4,859 (62.2%) |
| $300,000 to $499,999 | 1,220 (13.8%) | 1,762 (22.6%) |
| $500,000 to $749,999 | 130 (1.5%) | 268 (3.4%) |
| $750,000 to $999,999 | 120 (1.3%) | 55 (0.7%) |
| $1,000,000 or more | 116 (1.3%) | 63 (0.8%) |
| Total | 8,860 (100.0%) | 7,807 (100.0%) |
Household Income by Mortgage Status in Eddy County
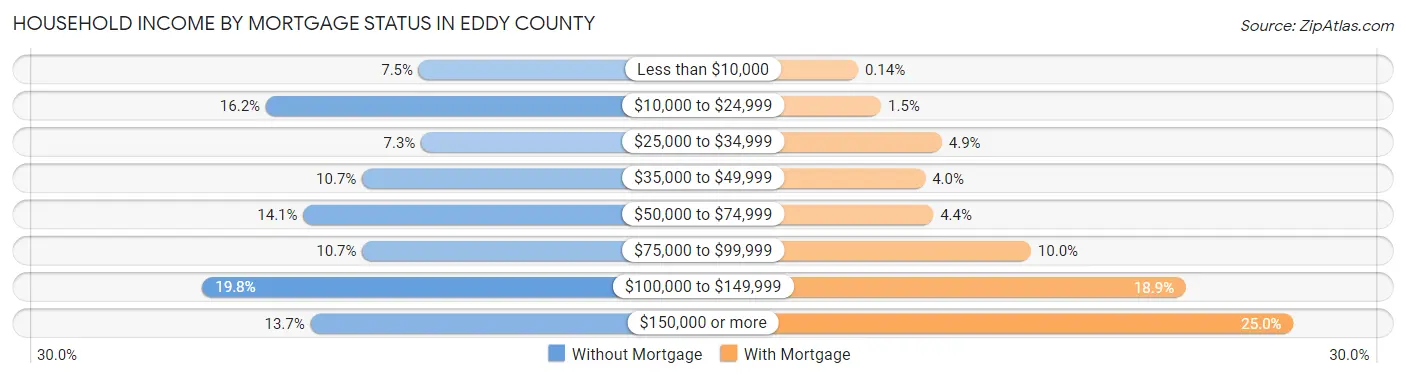
| Household Income | Without Mortgage | With Mortgage |
| Less than $10,000 | 662 (7.5%) | 11 (0.1%) |
| $10,000 to $24,999 | 1,436 (16.2%) | 114 (1.5%) |
| $25,000 to $34,999 | 650 (7.3%) | 385 (4.9%) |
| $35,000 to $49,999 | 949 (10.7%) | 311 (4.0%) |
| $50,000 to $74,999 | 1,247 (14.1%) | 347 (4.4%) |
| $75,000 to $99,999 | 948 (10.7%) | 782 (10.0%) |
| $100,000 to $149,999 | 1,758 (19.8%) | 1,474 (18.9%) |
| $150,000 or more | 1,210 (13.7%) | 1,953 (25.0%) |
| Total | 8,860 (100.0%) | 7,807 (100.0%) |
Property Value to Household Income Ratio in Eddy County
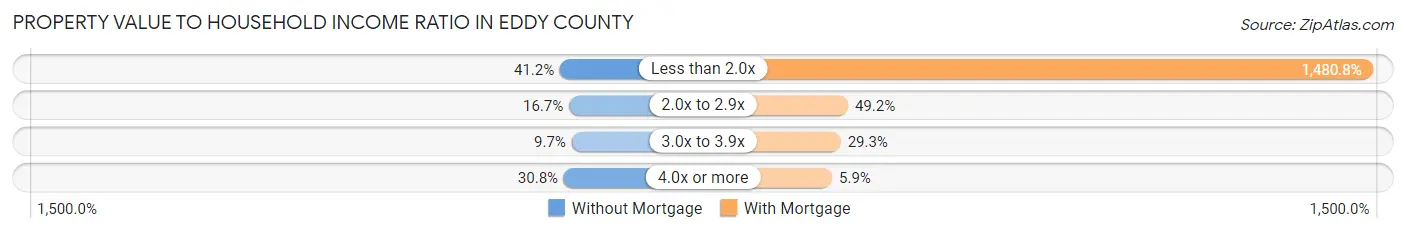
| Value-to-Income Ratio | Without Mortgage | With Mortgage |
| Less than 2.0x | 3,654 (41.2%) | 115,605 (1,480.8%) |
| 2.0x to 2.9x | 1,482 (16.7%) | 3,844 (49.2%) |
| 3.0x to 3.9x | 861 (9.7%) | 2,289 (29.3%) |
| 4.0x or more | 2,730 (30.8%) | 462 (5.9%) |
| Total | 8,860 (100.0%) | 7,807 (100.0%) |
Real Estate Taxes by Mortgage Status in Eddy County
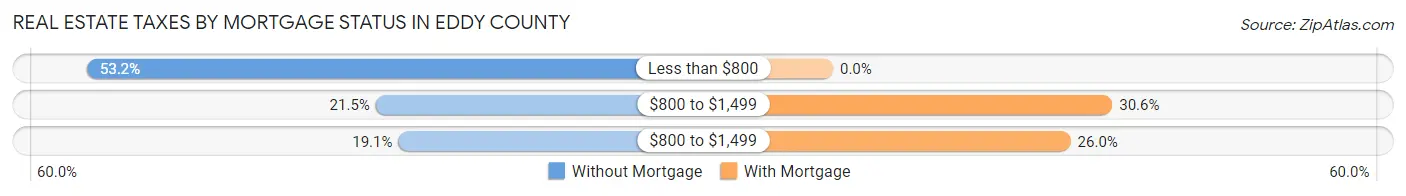
| Property Taxes | Without Mortgage | With Mortgage |
| Less than $800 | 4,711 (53.2%) | 0 (0.0%) |
| $800 to $1,499 | 1,908 (21.5%) | 2,389 (30.6%) |
| $800 to $1,499 | 1,688 (19.1%) | 2,033 (26.0%) |
| Total | 8,860 (100.0%) | 7,807 (100.0%) |
Health & Disability in Eddy County
Health Insurance Coverage by Age in Eddy County
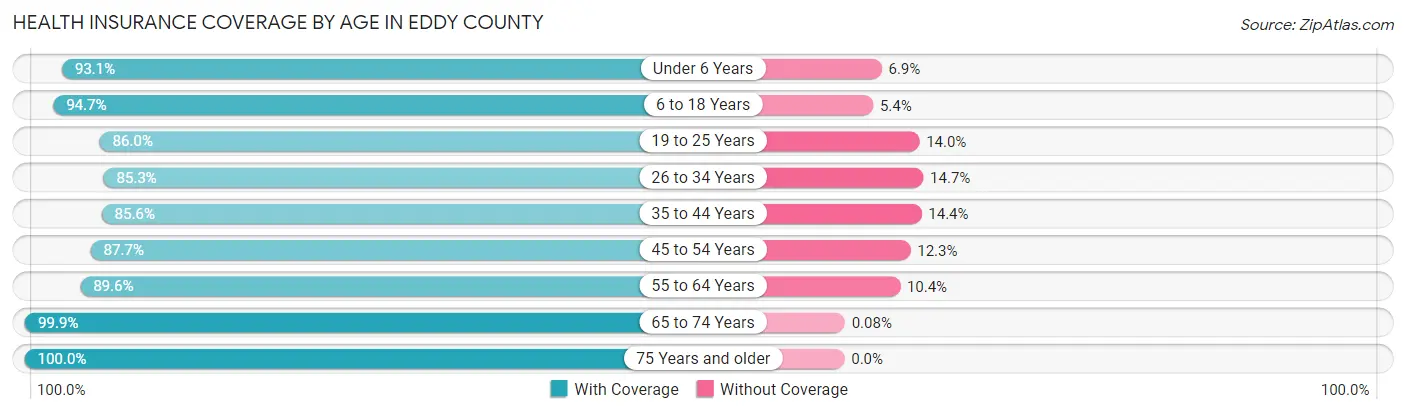
| Age Bracket | With Coverage | Without Coverage |
| Under 6 Years | 4,709 (93.1%) | 351 (6.9%) |
| 6 to 18 Years | 11,254 (94.7%) | 636 (5.3%) |
| 19 to 25 Years | 4,440 (86.0%) | 721 (14.0%) |
| 26 to 34 Years | 6,546 (85.3%) | 1,129 (14.7%) |
| 35 to 44 Years | 6,990 (85.6%) | 1,173 (14.4%) |
| 45 to 54 Years | 5,826 (87.7%) | 818 (12.3%) |
| 55 to 64 Years | 6,539 (89.6%) | 757 (10.4%) |
| 65 to 74 Years | 5,258 (99.9%) | 4 (0.1%) |
| 75 Years and older | 3,497 (100.0%) | 0 (0.0%) |
| Total | 55,059 (90.8%) | 5,589 (9.2%) |
Health Insurance Coverage by Citizenship Status in Eddy County
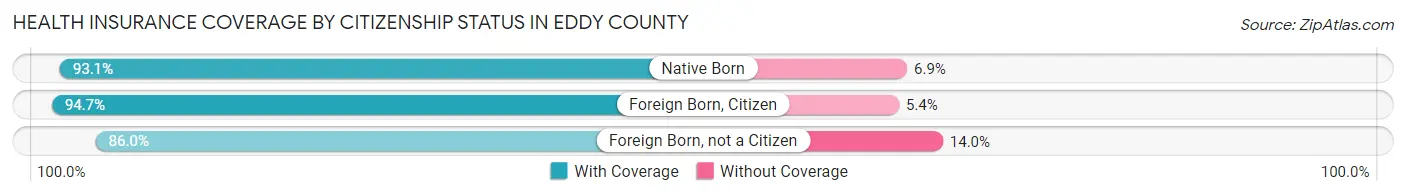
| Citizenship Status | With Coverage | Without Coverage |
| Native Born | 4,709 (93.1%) | 351 (6.9%) |
| Foreign Born, Citizen | 11,254 (94.7%) | 636 (5.3%) |
| Foreign Born, not a Citizen | 4,440 (86.0%) | 721 (14.0%) |
Health Insurance Coverage by Household Income in Eddy County
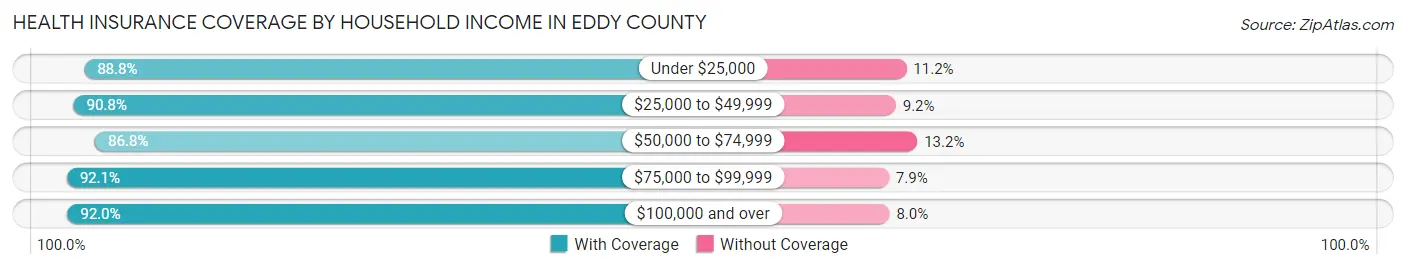
| Household Income | With Coverage | Without Coverage |
| Under $25,000 | 5,925 (88.8%) | 745 (11.2%) |
| $25,000 to $49,999 | 6,767 (90.8%) | 684 (9.2%) |
| $50,000 to $74,999 | 7,684 (86.8%) | 1,169 (13.2%) |
| $75,000 to $99,999 | 8,513 (92.1%) | 729 (7.9%) |
| $100,000 and over | 25,935 (92.0%) | 2,255 (8.0%) |
Public vs Private Health Insurance Coverage by Age in Eddy County
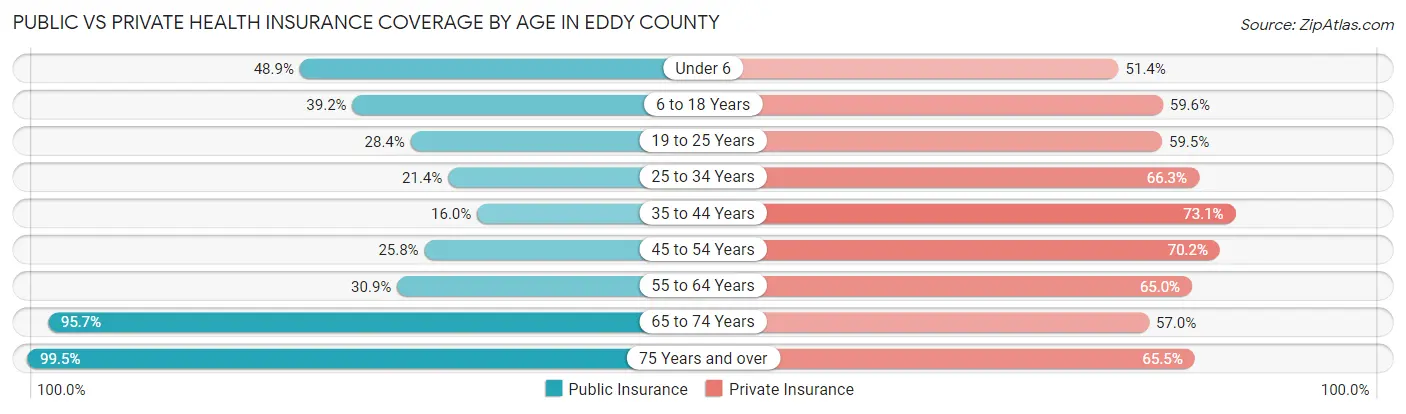
| Age Bracket | Public Insurance | Private Insurance |
| Under 6 | 2,476 (48.9%) | 2,600 (51.4%) |
| 6 to 18 Years | 4,655 (39.2%) | 7,084 (59.6%) |
| 19 to 25 Years | 1,463 (28.3%) | 3,068 (59.5%) |
| 25 to 34 Years | 1,642 (21.4%) | 5,086 (66.3%) |
| 35 to 44 Years | 1,307 (16.0%) | 5,963 (73.1%) |
| 45 to 54 Years | 1,713 (25.8%) | 4,661 (70.2%) |
| 55 to 64 Years | 2,251 (30.8%) | 4,742 (65.0%) |
| 65 to 74 Years | 5,035 (95.7%) | 3,001 (57.0%) |
| 75 Years and over | 3,481 (99.5%) | 2,290 (65.5%) |
| Total | 24,023 (39.6%) | 38,495 (63.5%) |
Disability Status by Sex by Age in Eddy County
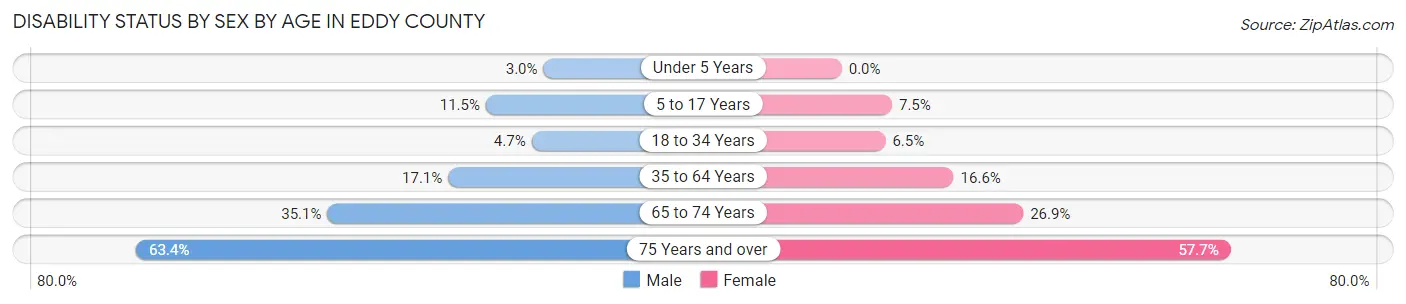
| Age Bracket | Male | Female |
| Under 5 Years | 71 (3.0%) | 0 (0.0%) |
| 5 to 17 Years | 687 (11.5%) | 425 (7.5%) |
| 18 to 34 Years | 333 (4.7%) | 433 (6.5%) |
| 35 to 64 Years | 1,953 (17.1%) | 1,775 (16.6%) |
| 65 to 74 Years | 914 (35.0%) | 715 (26.9%) |
| 75 Years and over | 984 (63.4%) | 1,123 (57.7%) |
Disability Class by Sex by Age in Eddy County
Disability Class: Hearing Difficulty
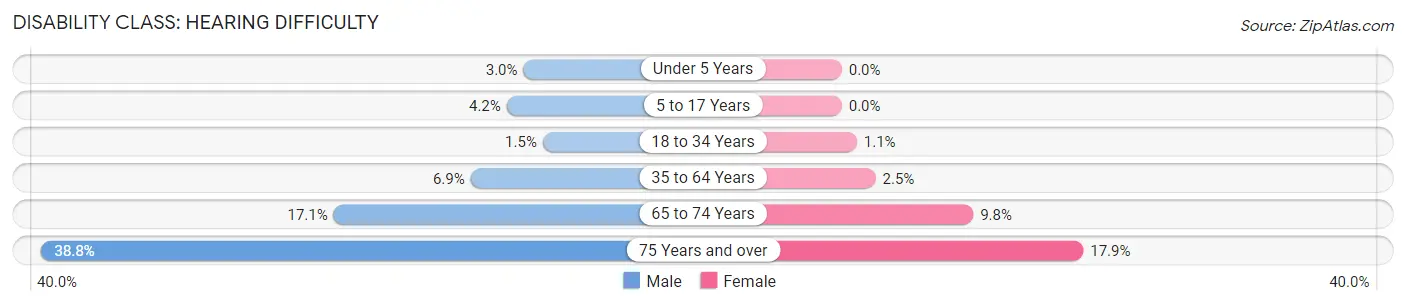
| Age Bracket | Male | Female |
| Under 5 Years | 71 (3.0%) | 0 (0.0%) |
| 5 to 17 Years | 251 (4.2%) | 0 (0.0%) |
| 18 to 34 Years | 108 (1.5%) | 75 (1.1%) |
| 35 to 64 Years | 787 (6.9%) | 268 (2.5%) |
| 65 to 74 Years | 445 (17.1%) | 259 (9.8%) |
| 75 Years and over | 601 (38.8%) | 349 (17.9%) |
Disability Class: Vision Difficulty
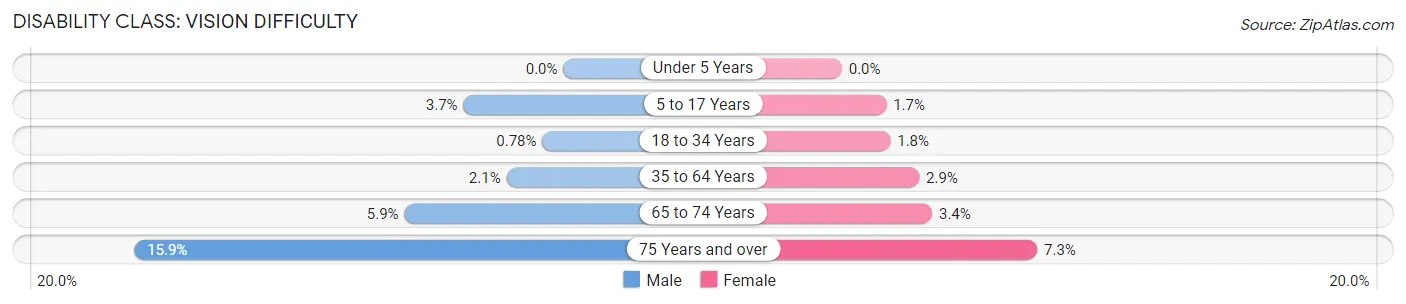
| Age Bracket | Male | Female |
| Under 5 Years | 0 (0.0%) | 0 (0.0%) |
| 5 to 17 Years | 221 (3.7%) | 94 (1.7%) |
| 18 to 34 Years | 55 (0.8%) | 120 (1.8%) |
| 35 to 64 Years | 241 (2.1%) | 307 (2.9%) |
| 65 to 74 Years | 154 (5.9%) | 89 (3.4%) |
| 75 Years and over | 247 (15.9%) | 141 (7.2%) |
Disability Class: Cognitive Difficulty
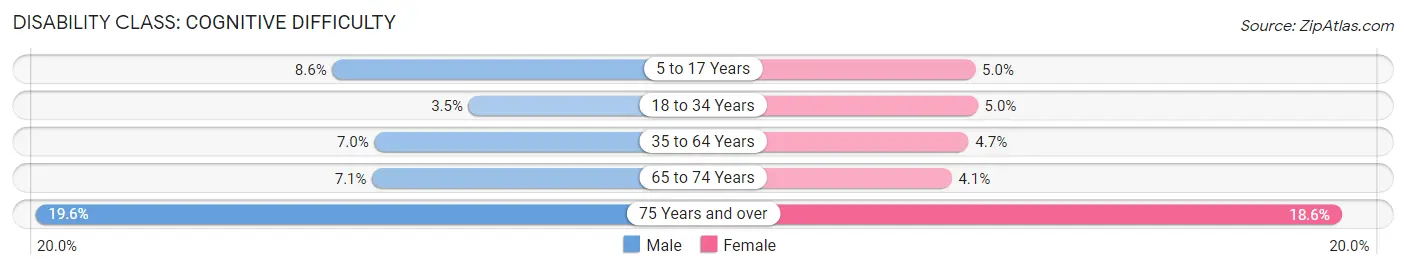
| Age Bracket | Male | Female |
| 5 to 17 Years | 511 (8.6%) | 282 (5.0%) |
| 18 to 34 Years | 247 (3.5%) | 337 (5.0%) |
| 35 to 64 Years | 800 (7.0%) | 502 (4.7%) |
| 65 to 74 Years | 185 (7.1%) | 108 (4.1%) |
| 75 Years and over | 304 (19.6%) | 361 (18.5%) |
Disability Class: Ambulatory Difficulty
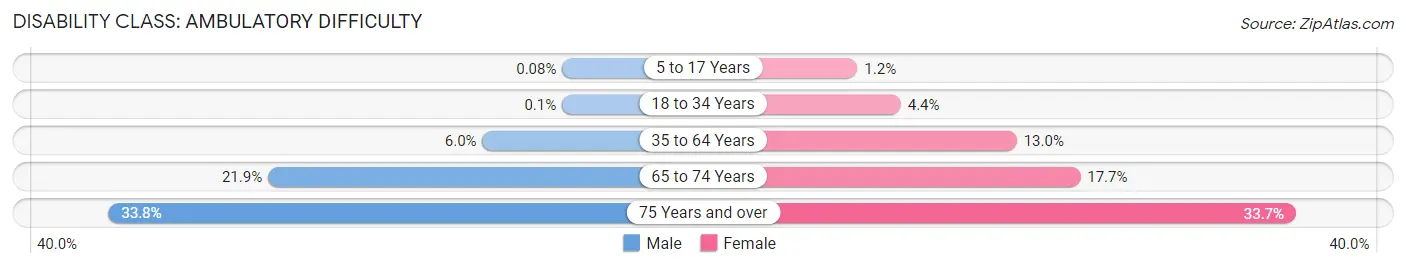
| Age Bracket | Male | Female |
| 5 to 17 Years | 5 (0.1%) | 66 (1.2%) |
| 18 to 34 Years | 7 (0.1%) | 293 (4.4%) |
| 35 to 64 Years | 686 (6.0%) | 1,388 (13.0%) |
| 65 to 74 Years | 572 (21.9%) | 470 (17.7%) |
| 75 Years and over | 524 (33.8%) | 656 (33.7%) |
Disability Class: Self-Care Difficulty
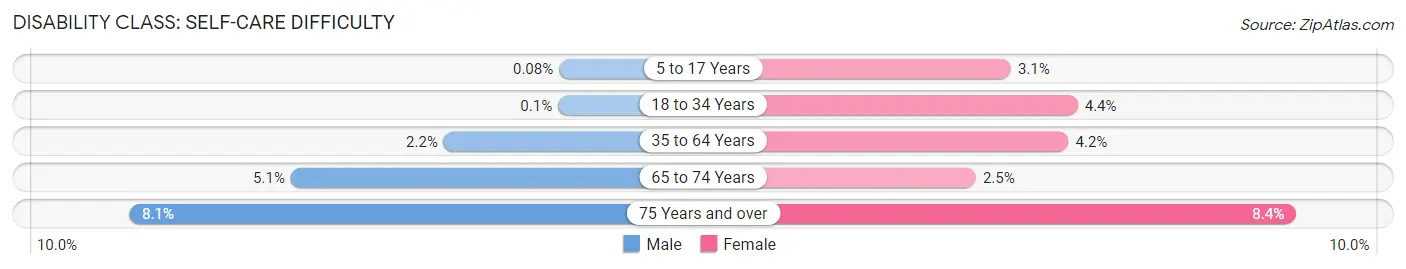
| Age Bracket | Male | Female |
| 5 to 17 Years | 5 (0.1%) | 179 (3.1%) |
| 18 to 34 Years | 7 (0.1%) | 293 (4.4%) |
| 35 to 64 Years | 253 (2.2%) | 450 (4.2%) |
| 65 to 74 Years | 132 (5.1%) | 66 (2.5%) |
| 75 Years and over | 125 (8.1%) | 164 (8.4%) |
Technology Access in Eddy County
Computing Device Access in Eddy County
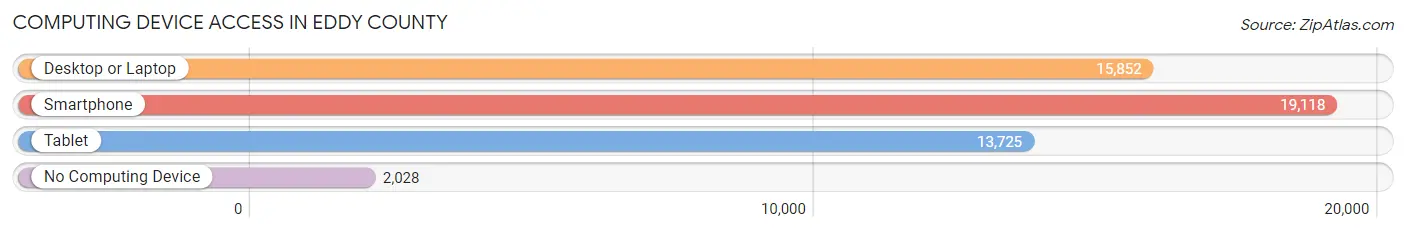
| Device Type | # Households | % Households |
| Desktop or Laptop | 15,852 | 69.8% |
| Smartphone | 19,118 | 84.2% |
| Tablet | 13,725 | 60.5% |
| No Computing Device | 2,028 | 8.9% |
| Total | 22,703 | 100.0% |
Internet Access in Eddy County
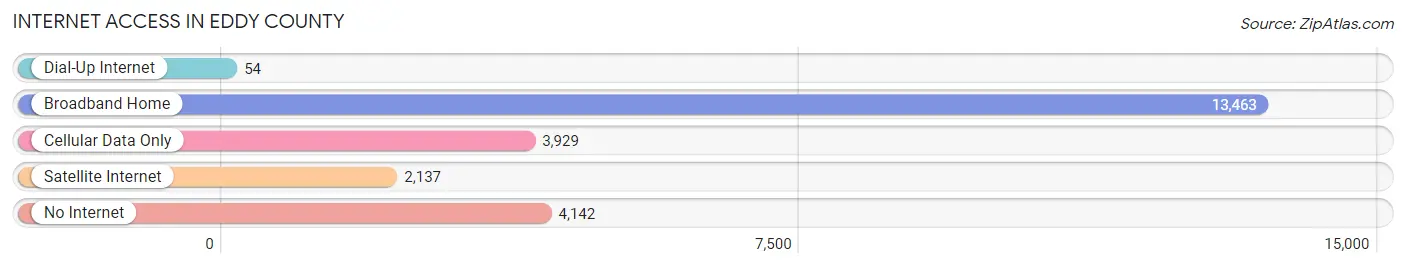
| Internet Type | # Households | % Households |
| Dial-Up Internet | 54 | 0.2% |
| Broadband Home | 13,463 | 59.3% |
| Cellular Data Only | 3,929 | 17.3% |
| Satellite Internet | 2,137 | 9.4% |
| No Internet | 4,142 | 18.2% |
| Total | 22,703 | 100.0% |
Eddy County Summary
Eddy County is located in the southeastern corner of New Mexico, and is bordered by Texas to the east and Chaves County to the north. The county seat is Carlsbad, and the county is named after Confederate Colonel Charles B. Eddy. The county has a total area of 5,814 square miles, making it the fourth largest county in the state.
Geography
Eddy County is located in the Chihuahuan Desert, and is characterized by flat to rolling terrain. The county is home to several mountain ranges, including the Guadalupe Mountains, the Sacramento Mountains, and the San Andres Mountains. The Pecos River runs through the county, and is a major source of water for the area. The county is also home to several lakes, including Lake Carlsbad, Lake Avalon, and Lake McMillan.
The climate of Eddy County is arid, with hot summers and mild winters. The average annual precipitation is about 12 inches, with most of it falling in the summer months.
Economy
Eddy County’s economy is largely based on agriculture and oil and gas production. The county is home to several large agricultural operations, including dairy farms, cotton farms, and pecan orchards. The county is also home to several oil and gas fields, including the Permian Basin and the San Andres Field.
The county is also home to several large employers, including the Carlsbad Caverns National Park, the Waste Isolation Pilot Plant, and the National Solar Observatory. The county is also home to several manufacturing companies, including the Carlsbad Cheese Company and the Carlsbad Pottery Company.
Demographics
As of the 2010 census, Eddy County had a population of 53,829. The population is largely white (77.3%), with smaller percentages of Hispanic (17.2%), African American (2.2%), and Native American (1.3%) residents. The median household income is $41,945, and the median age is 34.
The county is home to several large cities, including Carlsbad (population 26,138), Artesia (population 11,301), and Loving (population 1,845). The county is also home to several smaller towns, including Hope (population 545), Malaga (population 463), and Lakewood (population 437).
Conclusion
Eddy County is a large county in southeastern New Mexico, and is home to several mountain ranges, lakes, and rivers. The county’s economy is largely based on agriculture and oil and gas production, and the county is home to several large employers. The population of Eddy County is largely white, with smaller percentages of Hispanic, African American, and Native American residents. The county is home to several large cities, as well as several smaller towns.
Common Questions
What is Per Capita Income in Eddy County?
Per Capita income in Eddy County is $36,274.
What is the Median Family Income in Eddy County?
Median Family Income in Eddy County is $95,888.
What is the Median Household income in Eddy County?
Median Household Income in Eddy County is $77,458.
What is Income or Wage Gap in Eddy County?
Income or Wage Gap in Eddy County is 50.1%.
Women in Eddy County earn 49.9 cents for every dollar earned by a man.
What is Family Income Deficit in Eddy County?
Family Income Deficit in Eddy County is $9,814.
Families that are below poverty line in Eddy County earn $9,814 less on average than the poverty threshold level.
What is Inequality or Gini Index in Eddy County?
Inequality or Gini Index in Eddy County is 0.43.
What is the Total Population of Eddy County?
Total Population of Eddy County is 61,264.
What is the Total Male Population of Eddy County?
Total Male Population of Eddy County is 31,413.
What is the Total Female Population of Eddy County?
Total Female Population of Eddy County is 29,851.
What is the Ratio of Males per 100 Females in Eddy County?
There are 105.23 Males per 100 Females in Eddy County.
What is the Ratio of Females per 100 Males in Eddy County?
There are 95.03 Females per 100 Males in Eddy County.
What is the Median Population Age in Eddy County?
Median Population Age in Eddy County is 35.7 Years.
What is the Average Family Size in Eddy County
Average Family Size in Eddy County is 3.2 People.
What is the Average Household Size in Eddy County
Average Household Size in Eddy County is 2.7 People.
How Large is the Labor Force in Eddy County?
There are 28,704 People in the Labor Forcein in Eddy County.
What is the Percentage of People in the Labor Force in Eddy County?
61.1% of People are in the Labor Force in Eddy County.
What is the Unemployment Rate in Eddy County?
Unemployment Rate in Eddy County is 4.2%.