San Juan County, NM Map & Demographics
San Juan County Map
San Juan County Overview
$25,008
PER CAPITA INCOME
$58,247
AVG FAMILY INCOME
$50,734
AVG HOUSEHOLD INCOME
33.9%
WAGE / INCOME GAP [ % ]
66.1¢/ $1
WAGE / INCOME GAP [ $ ]
$13,055
FAMILY INCOME DEFICIT
0.47
INEQUALITY / GINI INDEX
121,798
TOTAL POPULATION
60,435
MALE POPULATION
61,363
FEMALE POPULATION
98.49
MALES / 100 FEMALES
101.54
FEMALES / 100 MALES
36.8
MEDIAN AGE
3.5
AVG FAMILY SIZE
2.9
AVG HOUSEHOLD SIZE
50,089
LABOR FORCE [ PEOPLE ]
53.0%
PERCENT IN LABOR FORCE
8.9%
UNEMPLOYMENT RATE
San Juan County Area Codes
Income in San Juan County
Income Overview in San Juan County
Per Capita Income in San Juan County is $25,008, while median incomes of families and households are $58,247 and $50,734 respectively.
| Characteristic | Number | Measure |
| Per Capita Income | 121,798 | $25,008 |
| Median Family Income | 28,622 | $58,247 |
| Mean Family Income | 28,622 | $77,528 |
| Median Household Income | 41,049 | $50,734 |
| Mean Household Income | 41,049 | $69,858 |
| Income Deficit | 28,622 | $13,055 |
| Wage / Income Gap (%) | 121,798 | 33.95% |
| Wage / Income Gap ($) | 121,798 | 66.05¢ per $1 |
| Gini / Inequality Index | 121,798 | 0.47 |
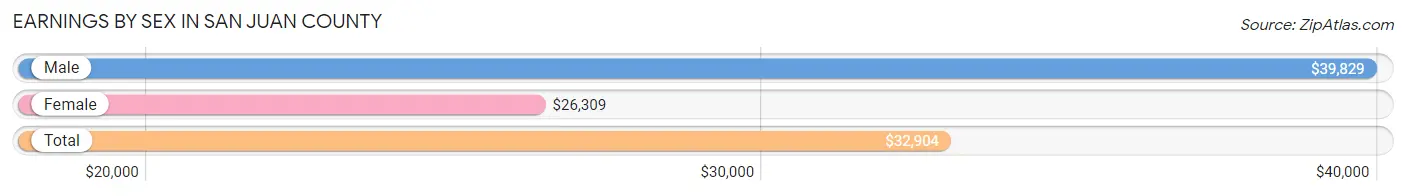
Earnings by Sex in San Juan County
Average Earnings in San Juan County are $32,904, $39,829 for men and $26,309 for women, a difference of 34.0%.
| Sex | Number | Average Earnings |
| Male | 26,735 (52.1%) | $39,829 |
| Female | 24,543 (47.9%) | $26,309 |
| Total | 51,278 (100.0%) | $32,904 |
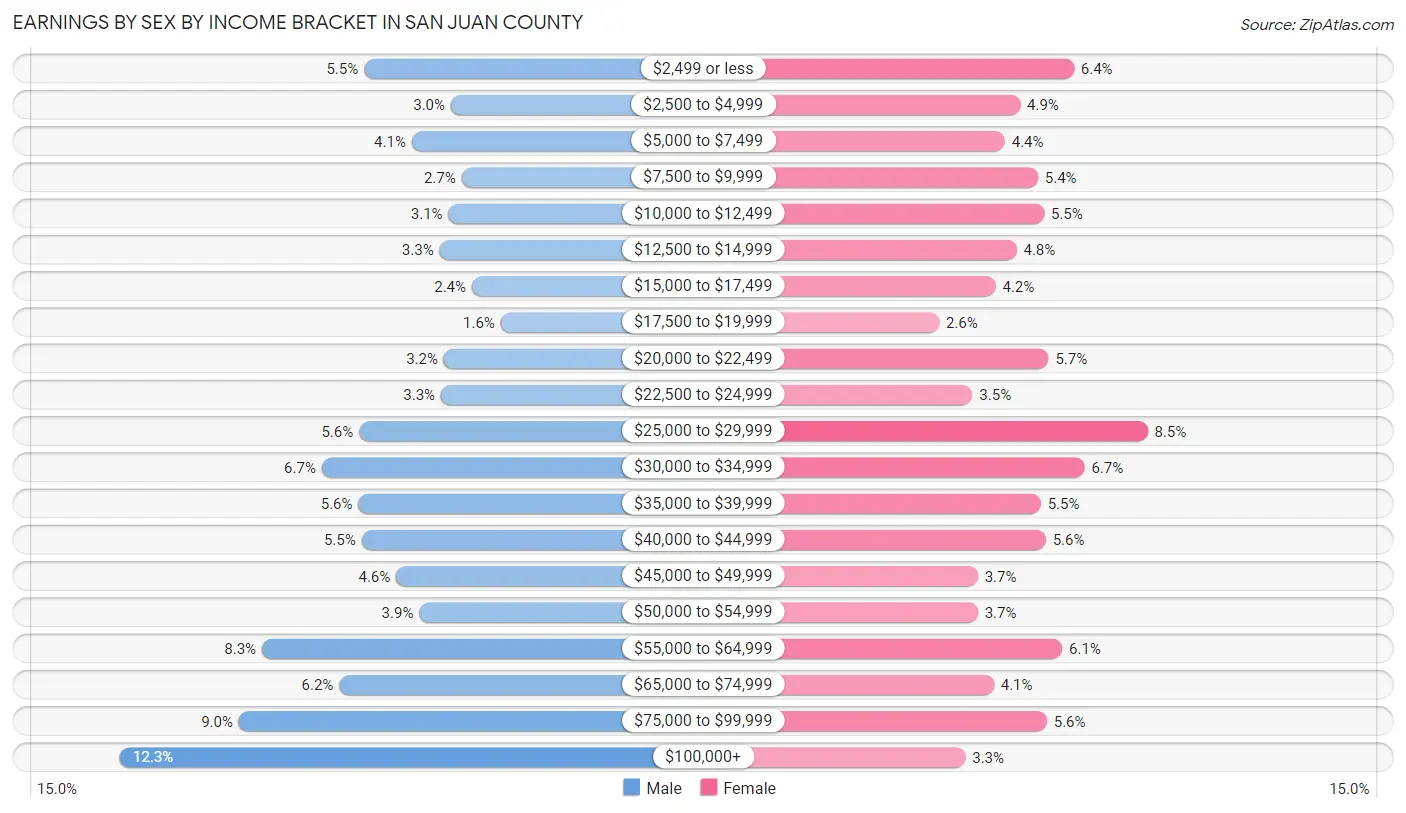
Earnings by Sex by Income Bracket in San Juan County
The most common earnings brackets in San Juan County are $100,000+ for men (3,293 | 12.3%) and $25,000 to $29,999 for women (2,075 | 8.5%).
| Income | Male | Female |
| $2,499 or less | 1,461 (5.5%) | 1,567 (6.4%) |
| $2,500 to $4,999 | 808 (3.0%) | 1,195 (4.9%) |
| $5,000 to $7,499 | 1,102 (4.1%) | 1,089 (4.4%) |
| $7,500 to $9,999 | 727 (2.7%) | 1,317 (5.4%) |
| $10,000 to $12,499 | 826 (3.1%) | 1,359 (5.5%) |
| $12,500 to $14,999 | 892 (3.3%) | 1,171 (4.8%) |
| $15,000 to $17,499 | 649 (2.4%) | 1,027 (4.2%) |
| $17,500 to $19,999 | 434 (1.6%) | 636 (2.6%) |
| $20,000 to $22,499 | 862 (3.2%) | 1,391 (5.7%) |
| $22,500 to $24,999 | 881 (3.3%) | 866 (3.5%) |
| $25,000 to $29,999 | 1,498 (5.6%) | 2,075 (8.5%) |
| $30,000 to $34,999 | 1,779 (6.7%) | 1,639 (6.7%) |
| $35,000 to $39,999 | 1,503 (5.6%) | 1,338 (5.4%) |
| $40,000 to $44,999 | 1,478 (5.5%) | 1,372 (5.6%) |
| $45,000 to $49,999 | 1,220 (4.6%) | 902 (3.7%) |
| $50,000 to $54,999 | 1,045 (3.9%) | 903 (3.7%) |
| $55,000 to $64,999 | 2,228 (8.3%) | 1,486 (6.0%) |
| $65,000 to $74,999 | 1,648 (6.2%) | 1,013 (4.1%) |
| $75,000 to $99,999 | 2,401 (9.0%) | 1,379 (5.6%) |
| $100,000+ | 3,293 (12.3%) | 818 (3.3%) |
| Total | 26,735 (100.0%) | 24,543 (100.0%) |
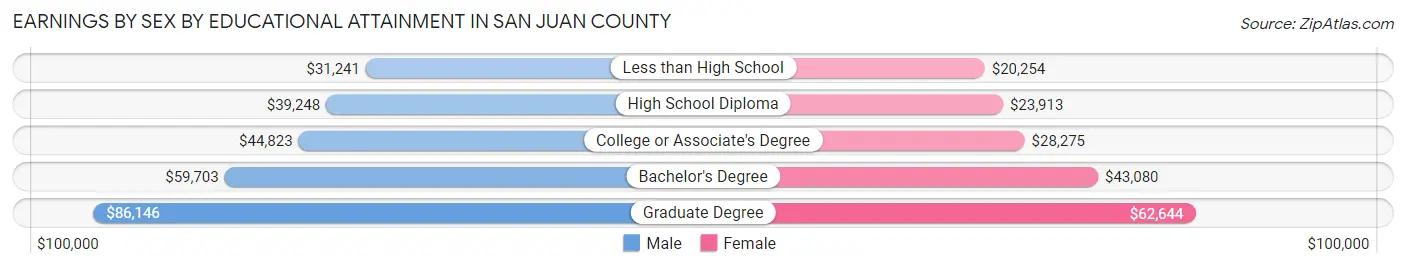
Earnings by Sex by Educational Attainment in San Juan County
Average earnings in San Juan County are $44,095 for men and $29,506 for women, a difference of 33.1%. Men with an educational attainment of graduate degree enjoy the highest average annual earnings of $86,146, while those with less than high school education earn the least with $31,241. Women with an educational attainment of graduate degree earn the most with the average annual earnings of $62,644, while those with less than high school education have the smallest earnings of $20,254.
| Educational Attainment | Male Income | Female Income |
| Less than High School | $31,241 | $20,254 |
| High School Diploma | $39,248 | $23,913 |
| College or Associate's Degree | $44,823 | $28,275 |
| Bachelor's Degree | $59,703 | $43,080 |
| Graduate Degree | $86,146 | $62,644 |
| Total | $44,095 | $29,506 |
Family Income in San Juan County
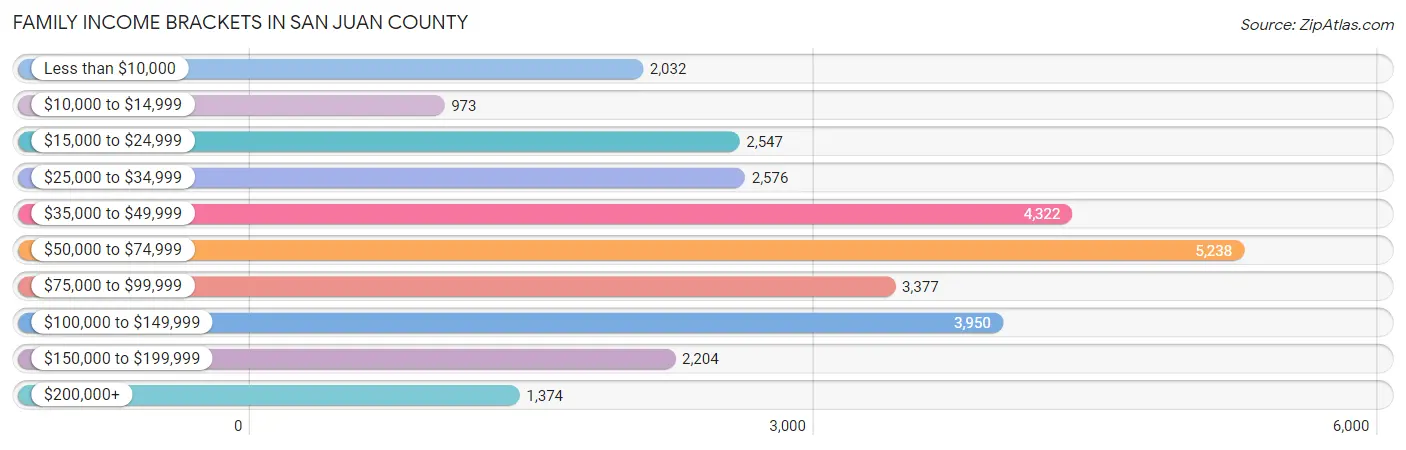
Family Income Brackets in San Juan County
According to the San Juan County family income data, there are 5,238 families falling into the $50,000 to $74,999 income range, which is the most common income bracket and makes up 18.3% of all families. Conversely, the $10,000 to $14,999 income bracket is the least frequent group with only 973 families (3.4%) belonging to this category.
| Income Bracket | # Families | % Families |
| Less than $10,000 | 2,032 | 7.1% |
| $10,000 to $14,999 | 973 | 3.4% |
| $15,000 to $24,999 | 2,547 | 8.9% |
| $25,000 to $34,999 | 2,576 | 9.0% |
| $35,000 to $49,999 | 4,322 | 15.1% |
| $50,000 to $74,999 | 5,238 | 18.3% |
| $75,000 to $99,999 | 3,377 | 11.8% |
| $100,000 to $149,999 | 3,950 | 13.8% |
| $150,000 to $199,999 | 2,204 | 7.7% |
| $200,000+ | 1,374 | 4.8% |
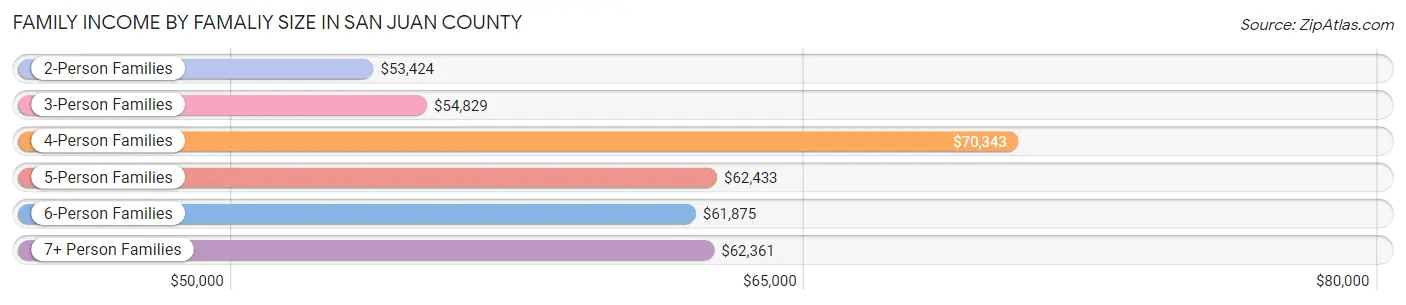
Family Income by Famaliy Size in San Juan County
4-person families (5,217 | 18.2%) account for the highest median family income in San Juan County with $70,343 per family, while 2-person families (12,864 | 44.9%) have the highest median income of $26,712 per family member.
| Income Bracket | # Families | Median Income |
| 2-Person Families | 12,864 (44.9%) | $53,424 |
| 3-Person Families | 5,767 (20.2%) | $54,829 |
| 4-Person Families | 5,217 (18.2%) | $70,343 |
| 5-Person Families | 2,409 (8.4%) | $62,433 |
| 6-Person Families | 1,555 (5.4%) | $61,875 |
| 7+ Person Families | 810 (2.8%) | $62,361 |
| Total | 28,622 (100.0%) | $58,247 |
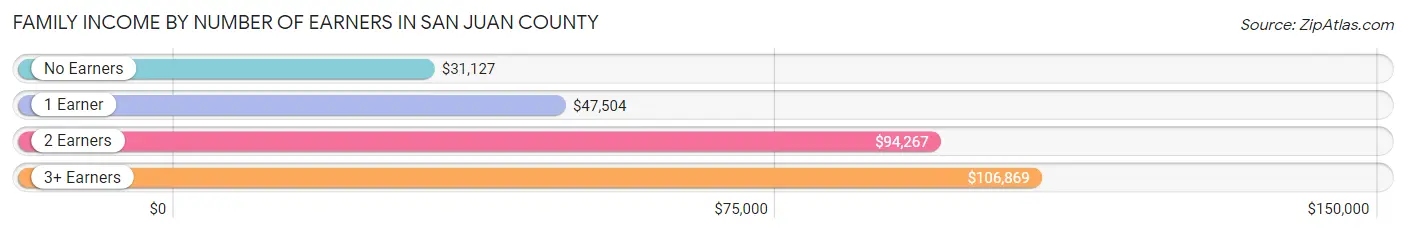
Family Income by Number of Earners in San Juan County
The median family income in San Juan County is $58,247, with families comprising 3+ earners (3,026) having the highest median family income of $106,869, while families with no earners (6,315) have the lowest median family income of $31,127, accounting for 10.6% and 22.1% of families, respectively.
| Number of Earners | # Families | Median Income |
| No Earners | 6,315 (22.1%) | $31,127 |
| 1 Earner | 11,475 (40.1%) | $47,504 |
| 2 Earners | 7,806 (27.3%) | $94,267 |
| 3+ Earners | 3,026 (10.6%) | $106,869 |
| Total | 28,622 (100.0%) | $58,247 |
Household Income in San Juan County
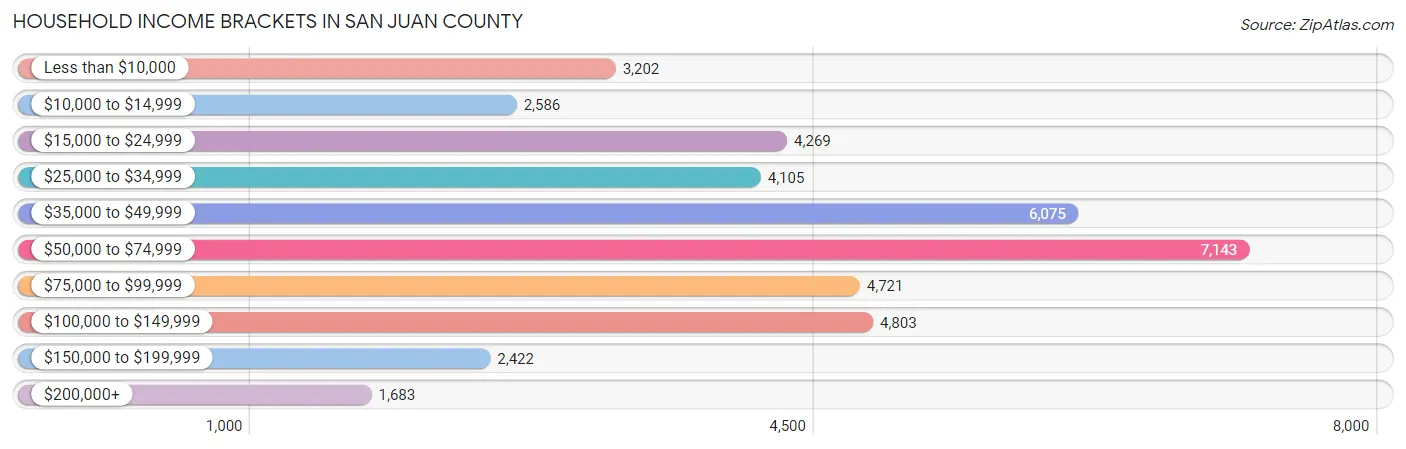
Household Income Brackets in San Juan County
With 7,143 households falling in the category, the $50,000 to $74,999 income range is the most frequent in San Juan County, accounting for 17.4% of all households. In contrast, only 1,683 households (4.1%) fall into the $200,000+ income bracket, making it the least populous group.
| Income Bracket | # Households | % Households |
| Less than $10,000 | 3,202 | 7.8% |
| $10,000 to $14,999 | 2,586 | 6.3% |
| $15,000 to $24,999 | 4,269 | 10.4% |
| $25,000 to $34,999 | 4,105 | 10.0% |
| $35,000 to $49,999 | 6,075 | 14.8% |
| $50,000 to $74,999 | 7,143 | 17.4% |
| $75,000 to $99,999 | 4,721 | 11.5% |
| $100,000 to $149,999 | 4,803 | 11.7% |
| $150,000 to $199,999 | 2,422 | 5.9% |
| $200,000+ | 1,683 | 4.1% |
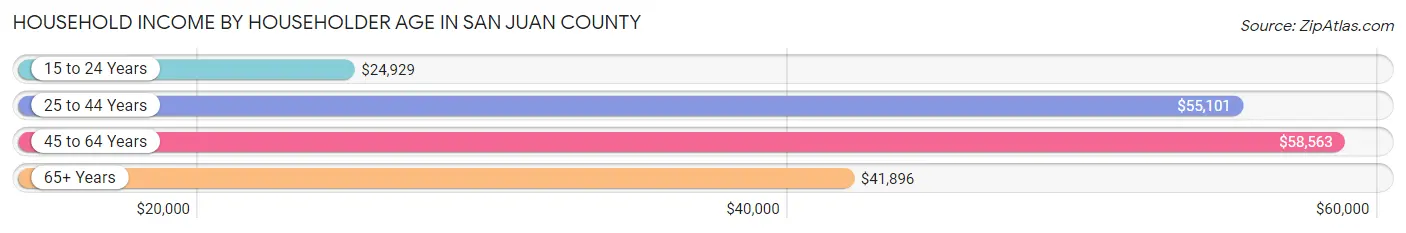
Household Income by Householder Age in San Juan County
The median household income in San Juan County is $50,734, with the highest median household income of $58,563 found in the 45 to 64 years age bracket for the primary householder. A total of 15,552 households (37.9%) fall into this category. Meanwhile, the 15 to 24 years age bracket for the primary householder has the lowest median household income of $24,929, with 995 households (2.4%) in this group.
| Income Bracket | # Households | Median Income |
| 15 to 24 Years | 995 (2.4%) | $24,929 |
| 25 to 44 Years | 12,583 (30.6%) | $55,101 |
| 45 to 64 Years | 15,552 (37.9%) | $58,563 |
| 65+ Years | 11,919 (29.0%) | $41,896 |
| Total | 41,049 (100.0%) | $50,734 |
Poverty in San Juan County
Income Below Poverty by Sex and Age in San Juan County
With 23.9% poverty level for males and 25.1% for females among the residents of San Juan County, 16 and 17 year old males and 5 year old females are the most vulnerable to poverty, with 865 males (40.3%) and 378 females (42.5%) in their respective age groups living below the poverty level.
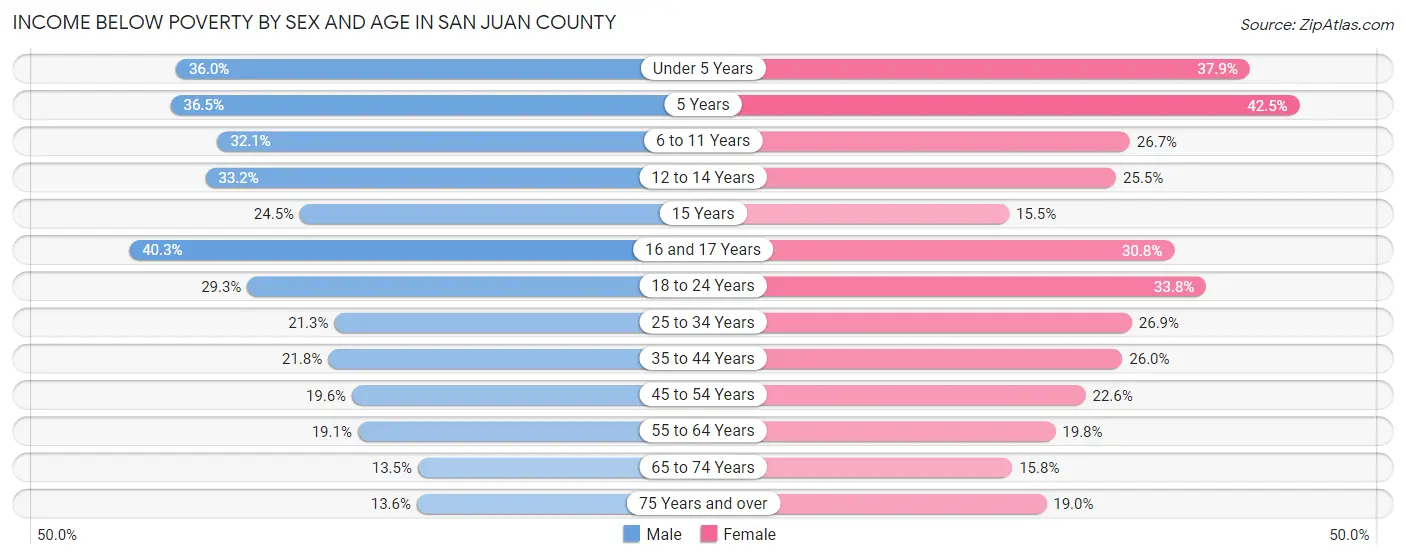
| Age Bracket | Male | Female |
| Under 5 Years | 1,324 (35.9%) | 1,376 (37.9%) |
| 5 Years | 230 (36.4%) | 378 (42.5%) |
| 6 to 11 Years | 1,809 (32.1%) | 1,319 (26.7%) |
| 12 to 14 Years | 972 (33.2%) | 781 (25.5%) |
| 15 Years | 166 (24.4%) | 146 (15.5%) |
| 16 and 17 Years | 865 (40.3%) | 596 (30.8%) |
| 18 to 24 Years | 1,534 (29.3%) | 1,737 (33.8%) |
| 25 to 34 Years | 1,679 (21.3%) | 2,110 (26.9%) |
| 35 to 44 Years | 1,720 (21.8%) | 2,001 (26.0%) |
| 45 to 54 Years | 1,285 (19.6%) | 1,504 (22.6%) |
| 55 to 64 Years | 1,471 (19.1%) | 1,553 (19.8%) |
| 65 to 74 Years | 745 (13.5%) | 942 (15.8%) |
| 75 Years and over | 411 (13.6%) | 804 (19.0%) |
| Total | 14,211 (23.9%) | 15,247 (25.1%) |
Income Above Poverty by Sex and Age in San Juan County
According to the poverty statistics in San Juan County, males aged 65 to 74 years and females aged 15 years are the age groups that are most secure financially, with 86.5% of males and 84.5% of females in these age groups living above the poverty line.
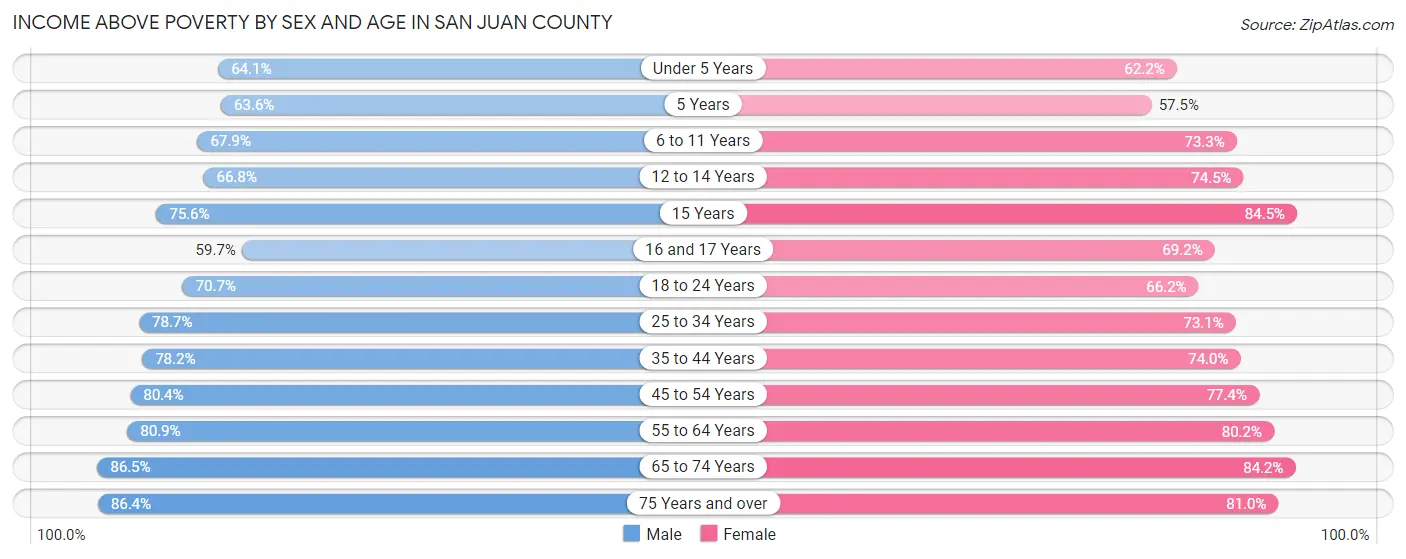
| Age Bracket | Male | Female |
| Under 5 Years | 2,359 (64.0%) | 2,259 (62.2%) |
| 5 Years | 401 (63.5%) | 512 (57.5%) |
| 6 to 11 Years | 3,826 (67.9%) | 3,613 (73.3%) |
| 12 to 14 Years | 1,954 (66.8%) | 2,286 (74.5%) |
| 15 Years | 513 (75.5%) | 794 (84.5%) |
| 16 and 17 Years | 1,282 (59.7%) | 1,337 (69.2%) |
| 18 to 24 Years | 3,694 (70.7%) | 3,400 (66.2%) |
| 25 to 34 Years | 6,217 (78.7%) | 5,729 (73.1%) |
| 35 to 44 Years | 6,154 (78.2%) | 5,682 (74.0%) |
| 45 to 54 Years | 5,264 (80.4%) | 5,144 (77.4%) |
| 55 to 64 Years | 6,237 (80.9%) | 6,282 (80.2%) |
| 65 to 74 Years | 4,768 (86.5%) | 5,014 (84.2%) |
| 75 Years and over | 2,612 (86.4%) | 3,431 (81.0%) |
| Total | 45,281 (76.1%) | 45,483 (74.9%) |
Income Below Poverty Among Married-Couple Families in San Juan County
The poverty statistics for married-couple families in San Juan County show that 10.0% or 1,831 of the total 18,235 families live below the poverty line. Families with 5 or more children have the highest poverty rate of 49.8%, comprising of 157 families. On the other hand, families with no children have the lowest poverty rate of 6.2%, which includes 672 families.
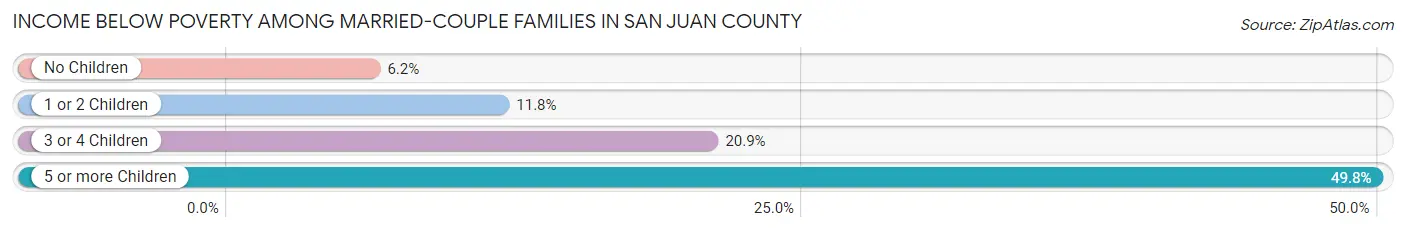
| Children | Above Poverty | Below Poverty |
| No Children | 10,163 (93.8%) | 672 (6.2%) |
| 1 or 2 Children | 4,646 (88.2%) | 622 (11.8%) |
| 3 or 4 Children | 1,437 (79.1%) | 380 (20.9%) |
| 5 or more Children | 158 (50.2%) | 157 (49.8%) |
| Total | 16,404 (90.0%) | 1,831 (10.0%) |
Income Below Poverty Among Single-Parent Households in San Juan County
According to the poverty data in San Juan County, 26.4% or 875 single-father households and 38.3% or 2,708 single-mother households are living below the poverty line. Among single-father households, those with 5 or more children have the highest poverty rate, with 76 households (89.4%) experiencing poverty. Likewise, among single-mother households, those with 3 or 4 children have the highest poverty rate, with 669 households (63.0%) falling below the poverty line.
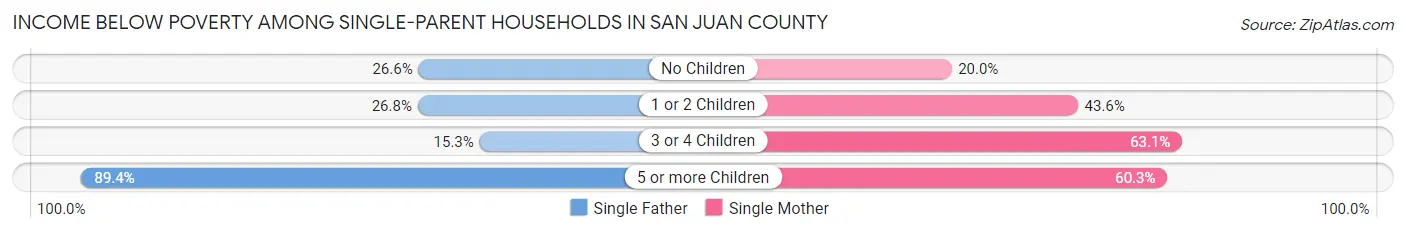
| Children | Single Father | Single Mother |
| No Children | 261 (26.6%) | 505 (20.0%) |
| 1 or 2 Children | 454 (26.8%) | 1,490 (43.6%) |
| 3 or 4 Children | 84 (15.2%) | 669 (63.0%) |
| 5 or more Children | 76 (89.4%) | 44 (60.3%) |
| Total | 875 (26.4%) | 2,708 (38.3%) |
Income Below Poverty Among Married-Couple vs Single-Parent Households in San Juan County
The poverty data for San Juan County shows that 1,831 of the married-couple family households (10.0%) and 3,583 of the single-parent households (34.5%) are living below the poverty level. Within the married-couple family households, those with 5 or more children have the highest poverty rate, with 157 households (49.8%) falling below the poverty line. Among the single-parent households, those with 5 or more children have the highest poverty rate, with 120 household (75.9%) living below poverty.
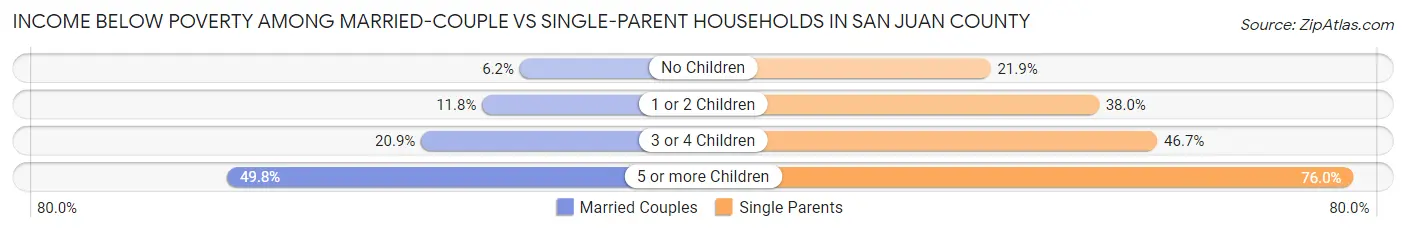
| Children | Married-Couple Families | Single-Parent Households |
| No Children | 672 (6.2%) | 766 (21.9%) |
| 1 or 2 Children | 622 (11.8%) | 1,944 (38.0%) |
| 3 or 4 Children | 380 (20.9%) | 753 (46.7%) |
| 5 or more Children | 157 (49.8%) | 120 (75.9%) |
| Total | 1,831 (10.0%) | 3,583 (34.5%) |
Race in San Juan County
The most populous races in San Juan County are White / Caucasian (54,808 | 45.0%), Native / Alaskan (48,128 | 39.5%), and Hispanic or Latino (26,373 | 21.6%).
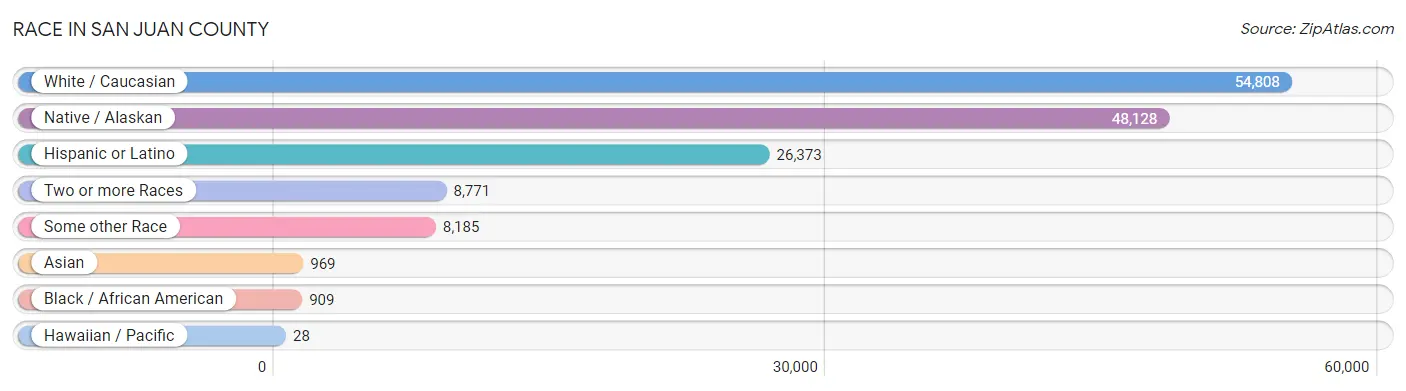
| Race | # Population | % Population |
| Asian | 969 | 0.8% |
| Black / African American | 909 | 0.7% |
| Hawaiian / Pacific | 28 | 0.0% |
| Hispanic or Latino | 26,373 | 21.6% |
| Native / Alaskan | 48,128 | 39.5% |
| White / Caucasian | 54,808 | 45.0% |
| Two or more Races | 8,771 | 7.2% |
| Some other Race | 8,185 | 6.7% |
| Total | 121,798 | 100.0% |
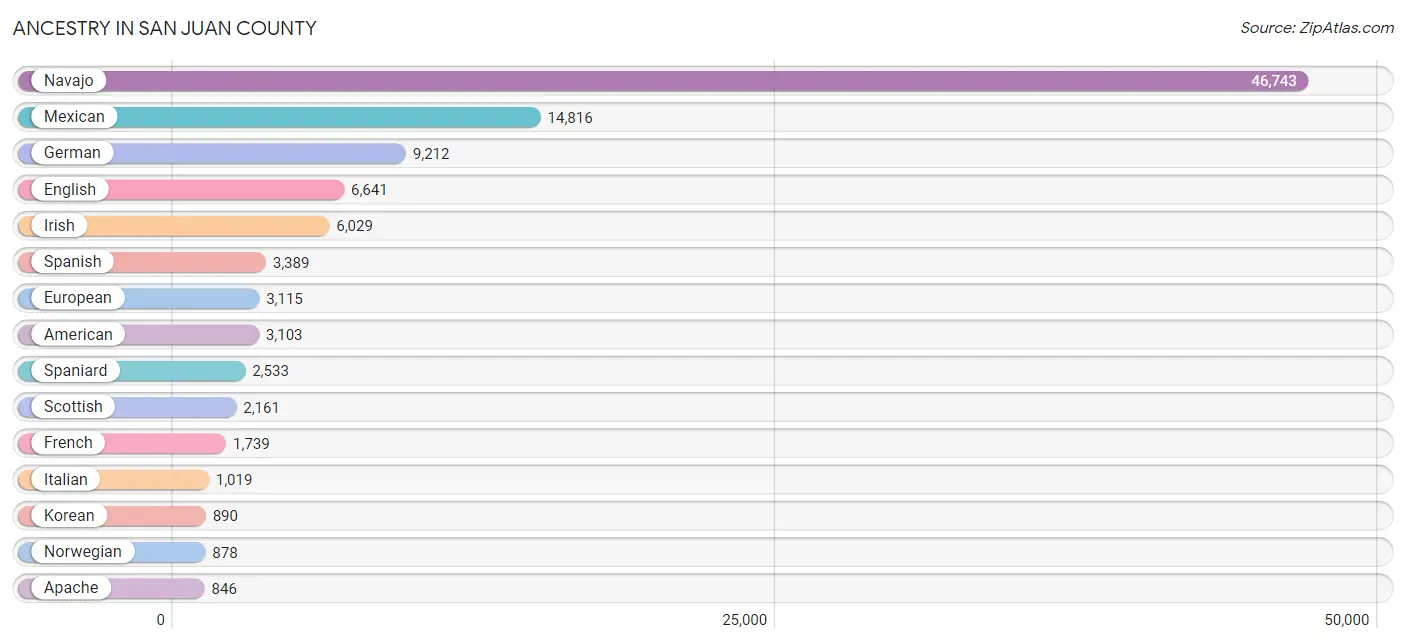
Ancestry in San Juan County
The most populous ancestries reported in San Juan County are Navajo (46,743 | 38.4%), Mexican (14,816 | 12.2%), German (9,212 | 7.6%), English (6,641 | 5.4%), and Irish (6,029 | 5.0%), together accounting for 68.5% of all San Juan County residents.
| Ancestry | # Population | % Population |
| African | 56 | 0.1% |
| Alaska Native | 10 | 0.0% |
| Alaskan Athabascan | 13 | 0.0% |
| Aleut | 13 | 0.0% |
| American | 3,103 | 2.5% |
| Apache | 846 | 0.7% |
| Arab | 54 | 0.0% |
| Argentinean | 5 | 0.0% |
| Armenian | 124 | 0.1% |
| Australian | 19 | 0.0% |
| Austrian | 113 | 0.1% |
| Basque | 41 | 0.0% |
| Belgian | 81 | 0.1% |
| Bhutanese | 123 | 0.1% |
| Blackfeet | 3 | 0.0% |
| Brazilian | 7 | 0.0% |
| British | 475 | 0.4% |
| Burmese | 43 | 0.0% |
| Cajun | 6 | 0.0% |
| Canadian | 100 | 0.1% |
| Central American | 52 | 0.0% |
| Central American Indian | 24 | 0.0% |
| Cherokee | 459 | 0.4% |
| Cheyenne | 2 | 0.0% |
| Chilean | 16 | 0.0% |
| Chippewa | 60 | 0.1% |
| Choctaw | 98 | 0.1% |
| Colombian | 22 | 0.0% |
| Comanche | 12 | 0.0% |
| Creek | 58 | 0.1% |
| Croatian | 16 | 0.0% |
| Cuban | 211 | 0.2% |
| Czech | 202 | 0.2% |
| Czechoslovakian | 32 | 0.0% |
| Danish | 638 | 0.5% |
| Dominican | 11 | 0.0% |
| Dutch | 766 | 0.6% |
| Dutch West Indian | 30 | 0.0% |
| Eastern European | 128 | 0.1% |
| Ecuadorian | 40 | 0.0% |
| Egyptian | 21 | 0.0% |
| English | 6,641 | 5.4% |
| Estonian | 13 | 0.0% |
| European | 3,115 | 2.6% |
| Finnish | 84 | 0.1% |
| French | 1,739 | 1.4% |
| French Canadian | 96 | 0.1% |
| German | 9,212 | 7.6% |
| Greek | 28 | 0.0% |
| Hopi | 90 | 0.1% |
| Hungarian | 185 | 0.2% |
| Indian (Asian) | 86 | 0.1% |
| Iranian | 3 | 0.0% |
| Irish | 6,029 | 5.0% |
| Israeli | 7 | 0.0% |
| Italian | 1,019 | 0.8% |
| Japanese | 6 | 0.0% |
| Korean | 890 | 0.7% |
| Laotian | 22 | 0.0% |
| Lebanese | 33 | 0.0% |
| Liberian | 30 | 0.0% |
| Lithuanian | 41 | 0.0% |
| Malaysian | 54 | 0.0% |
| Mexican | 14,816 | 12.2% |
| Mexican American Indian | 513 | 0.4% |
| Native Hawaiian | 37 | 0.0% |
| Navajo | 46,743 | 38.4% |
| New Zealander | 5 | 0.0% |
| Northern European | 145 | 0.1% |
| Norwegian | 878 | 0.7% |
| Paiute | 62 | 0.1% |
| Pakistani | 13 | 0.0% |
| Panamanian | 7 | 0.0% |
| Pennsylvania German | 38 | 0.0% |
| Peruvian | 23 | 0.0% |
| Pima | 3 | 0.0% |
| Polish | 506 | 0.4% |
| Portuguese | 113 | 0.1% |
| Potawatomi | 62 | 0.1% |
| Pueblo | 367 | 0.3% |
| Puerto Rican | 282 | 0.2% |
| Romanian | 19 | 0.0% |
| Russian | 217 | 0.2% |
| Salvadoran | 45 | 0.0% |
| Samoan | 7 | 0.0% |
| Scandinavian | 249 | 0.2% |
| Scotch-Irish | 388 | 0.3% |
| Scottish | 2,161 | 1.8% |
| Serbian | 1 | 0.0% |
| Shoshone | 15 | 0.0% |
| Sioux | 245 | 0.2% |
| Slavic | 39 | 0.0% |
| Slovak | 40 | 0.0% |
| Slovene | 15 | 0.0% |
| South American | 106 | 0.1% |
| South American Indian | 23 | 0.0% |
| Spaniard | 2,533 | 2.1% |
| Spanish | 3,389 | 2.8% |
| Spanish American | 139 | 0.1% |
| Subsaharan African | 88 | 0.1% |
| Swedish | 599 | 0.5% |
| Swiss | 119 | 0.1% |
| Thai | 46 | 0.0% |
| Tsimshian | 48 | 0.0% |
| Turkish | 22 | 0.0% |
| Ukrainian | 66 | 0.1% |
| Ute | 209 | 0.2% |
| Welsh | 510 | 0.4% |
| West Indian | 45 | 0.0% |
| Yugoslavian | 20 | 0.0% |
| Yuman | 17 | 0.0% | View All 111 Rows |
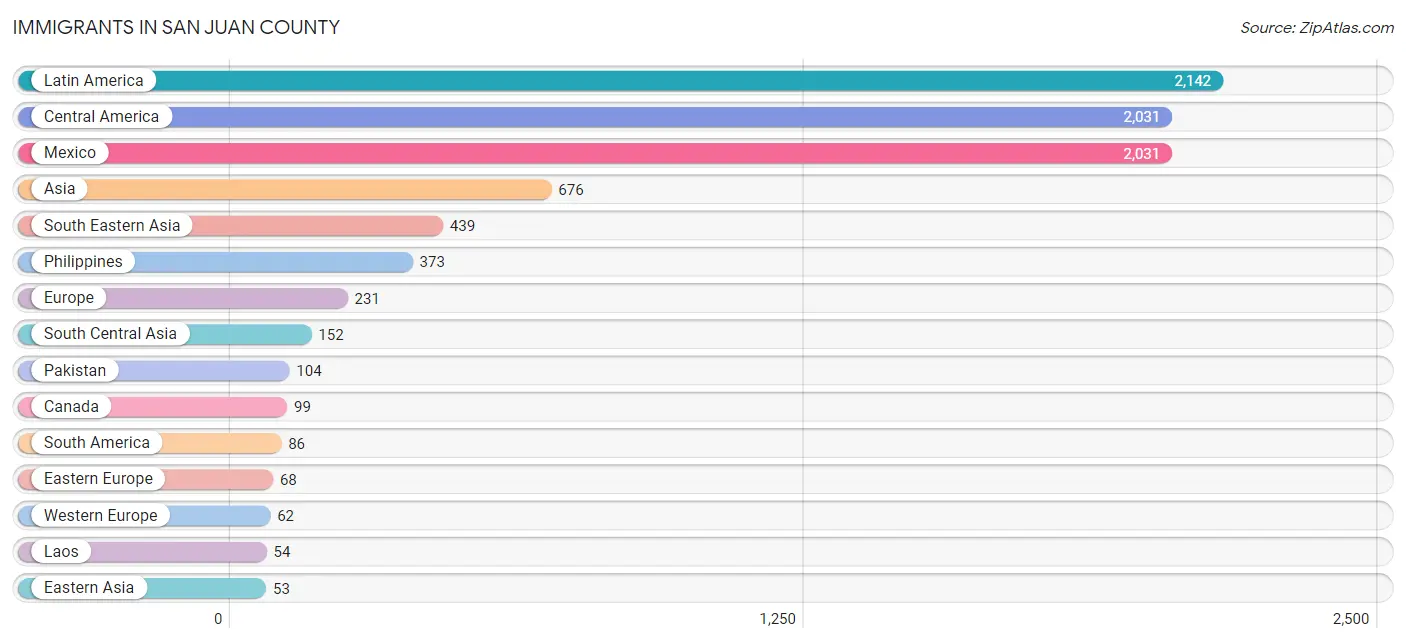
Immigrants in San Juan County
The most numerous immigrant groups reported in San Juan County came from Latin America (2,142 | 1.8%), Central America (2,031 | 1.7%), Mexico (2,031 | 1.7%), Asia (676 | 0.6%), and South Eastern Asia (439 | 0.4%), together accounting for 6.0% of all San Juan County residents.
| Immigration Origin | # Population | % Population |
| Africa | 40 | 0.0% |
| Asia | 676 | 0.6% |
| Australia | 11 | 0.0% |
| Brazil | 47 | 0.0% |
| Cambodia | 6 | 0.0% |
| Canada | 99 | 0.1% |
| Caribbean | 25 | 0.0% |
| Central America | 2,031 | 1.7% |
| China | 38 | 0.0% |
| Cuba | 25 | 0.0% |
| Czechoslovakia | 10 | 0.0% |
| Denmark | 17 | 0.0% |
| Eastern Africa | 5 | 0.0% |
| Eastern Asia | 53 | 0.0% |
| Eastern Europe | 68 | 0.1% |
| Ecuador | 16 | 0.0% |
| England | 14 | 0.0% |
| Eritrea | 5 | 0.0% |
| Europe | 231 | 0.2% |
| France | 24 | 0.0% |
| Germany | 27 | 0.0% |
| India | 48 | 0.0% |
| Indonesia | 2 | 0.0% |
| Israel | 7 | 0.0% |
| Korea | 15 | 0.0% |
| Laos | 54 | 0.0% |
| Latin America | 2,142 | 1.8% |
| Lebanon | 3 | 0.0% |
| Liberia | 30 | 0.0% |
| Mexico | 2,031 | 1.7% |
| Netherlands | 10 | 0.0% |
| Northern Europe | 49 | 0.0% |
| Norway | 7 | 0.0% |
| Oceania | 11 | 0.0% |
| Pakistan | 104 | 0.1% |
| Peru | 23 | 0.0% |
| Philippines | 373 | 0.3% |
| Poland | 9 | 0.0% |
| Russia | 23 | 0.0% |
| Scotland | 11 | 0.0% |
| South Africa | 5 | 0.0% |
| South America | 86 | 0.1% |
| South Central Asia | 152 | 0.1% |
| South Eastern Asia | 439 | 0.4% |
| Southern Europe | 52 | 0.0% |
| Spain | 52 | 0.0% |
| Switzerland | 1 | 0.0% |
| Thailand | 4 | 0.0% |
| Turkey | 22 | 0.0% |
| Ukraine | 13 | 0.0% |
| Western Africa | 30 | 0.0% |
| Western Asia | 32 | 0.0% |
| Western Europe | 62 | 0.1% | View All 53 Rows |
Sex and Age in San Juan County
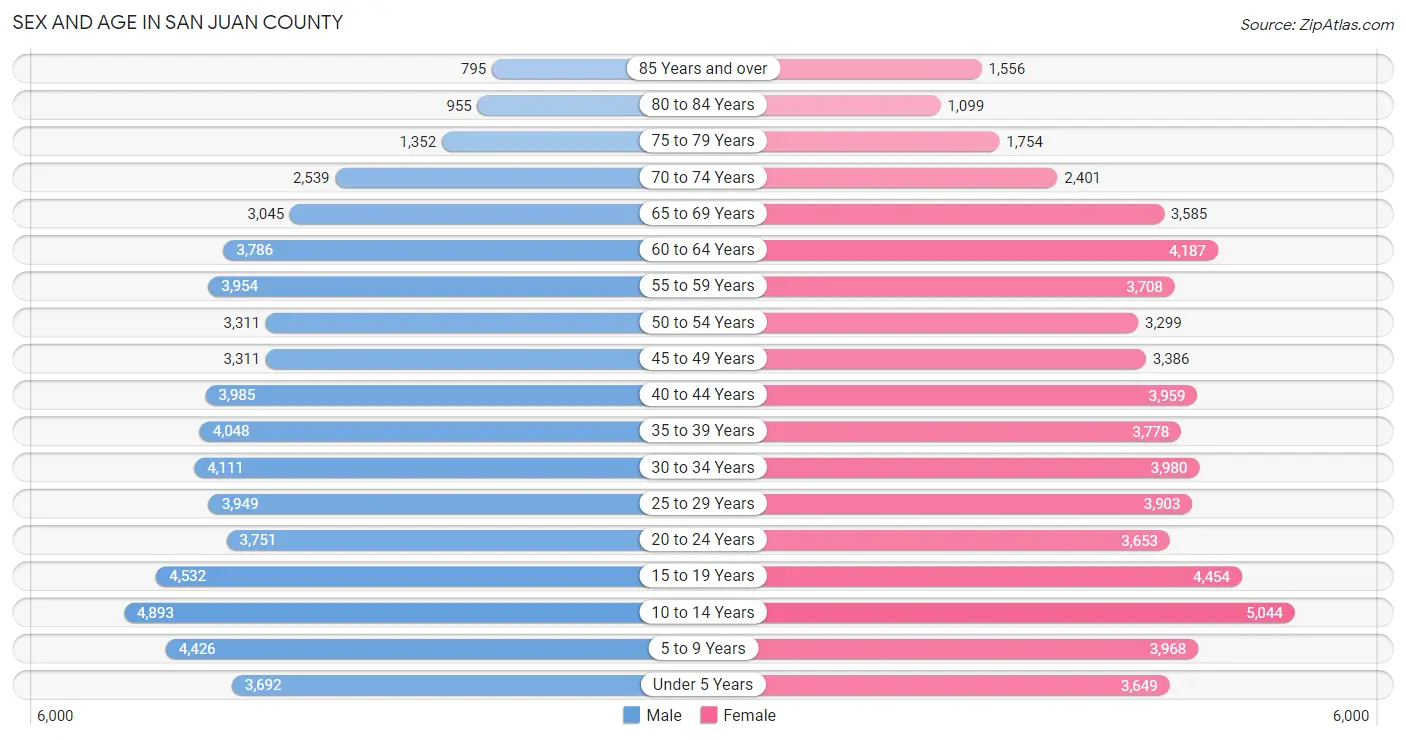
Sex and Age in San Juan County
The most populous age groups in San Juan County are 10 to 14 Years (4,893 | 8.1%) for men and 10 to 14 Years (5,044 | 8.2%) for women.
| Age Bracket | Male | Female |
| Under 5 Years | 3,692 (6.1%) | 3,649 (5.9%) |
| 5 to 9 Years | 4,426 (7.3%) | 3,968 (6.5%) |
| 10 to 14 Years | 4,893 (8.1%) | 5,044 (8.2%) |
| 15 to 19 Years | 4,532 (7.5%) | 4,454 (7.3%) |
| 20 to 24 Years | 3,751 (6.2%) | 3,653 (5.9%) |
| 25 to 29 Years | 3,949 (6.5%) | 3,903 (6.4%) |
| 30 to 34 Years | 4,111 (6.8%) | 3,980 (6.5%) |
| 35 to 39 Years | 4,048 (6.7%) | 3,778 (6.2%) |
| 40 to 44 Years | 3,985 (6.6%) | 3,959 (6.5%) |
| 45 to 49 Years | 3,311 (5.5%) | 3,386 (5.5%) |
| 50 to 54 Years | 3,311 (5.5%) | 3,299 (5.4%) |
| 55 to 59 Years | 3,954 (6.5%) | 3,708 (6.0%) |
| 60 to 64 Years | 3,786 (6.3%) | 4,187 (6.8%) |
| 65 to 69 Years | 3,045 (5.0%) | 3,585 (5.8%) |
| 70 to 74 Years | 2,539 (4.2%) | 2,401 (3.9%) |
| 75 to 79 Years | 1,352 (2.2%) | 1,754 (2.9%) |
| 80 to 84 Years | 955 (1.6%) | 1,099 (1.8%) |
| 85 Years and over | 795 (1.3%) | 1,556 (2.5%) |
| Total | 60,435 (100.0%) | 61,363 (100.0%) |
Families and Households in San Juan County
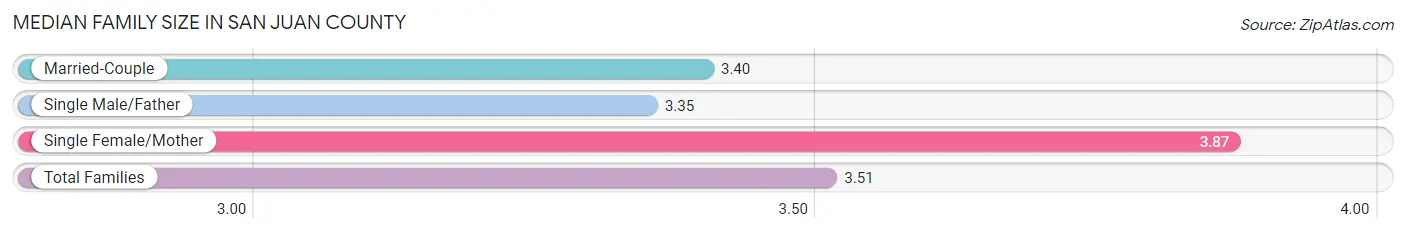
Median Family Size in San Juan County
The median family size in San Juan County is 3.51 persons per family, with single female/mother families (7,075 | 24.7%) accounting for the largest median family size of 3.87 persons per family. On the other hand, single male/father families (3,312 | 11.6%) represent the smallest median family size with 3.35 persons per family.
| Family Type | # Families | Family Size |
| Married-Couple | 18,235 (63.7%) | 3.40 |
| Single Male/Father | 3,312 (11.6%) | 3.35 |
| Single Female/Mother | 7,075 (24.7%) | 3.87 |
| Total Families | 28,622 (100.0%) | 3.51 |
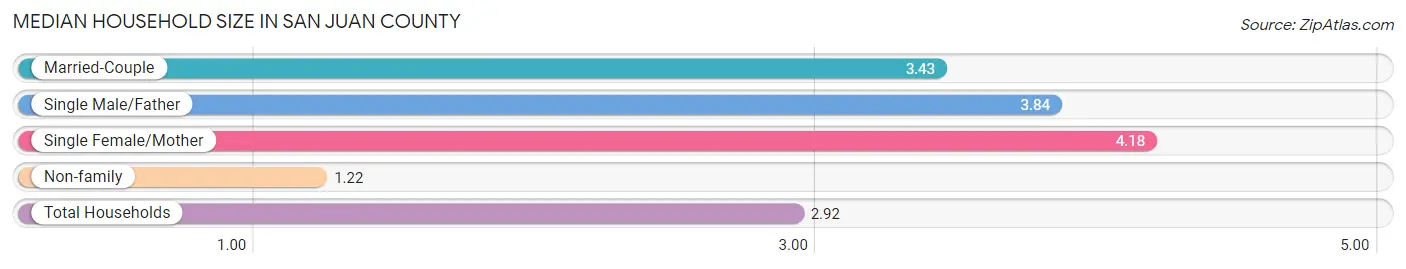
Median Household Size in San Juan County
The median household size in San Juan County is 2.92 persons per household, with single female/mother households (7,075 | 17.2%) accounting for the largest median household size of 4.18 persons per household. non-family households (12,427 | 30.3%) represent the smallest median household size with 1.22 persons per household.
| Household Type | # Households | Household Size |
| Married-Couple | 18,235 (44.4%) | 3.43 |
| Single Male/Father | 3,312 (8.1%) | 3.84 |
| Single Female/Mother | 7,075 (17.2%) | 4.18 |
| Non-family | 12,427 (30.3%) | 1.22 |
| Total Households | 41,049 (100.0%) | 2.92 |
Household Size by Marriage Status in San Juan County
Out of a total of 41,049 households in San Juan County, 28,622 (69.7%) are family households, while 12,427 (30.3%) are nonfamily households. The most numerous type of family households are 2-person households, comprising 11,905, and the most common type of nonfamily households are 1-person households, comprising 10,336.
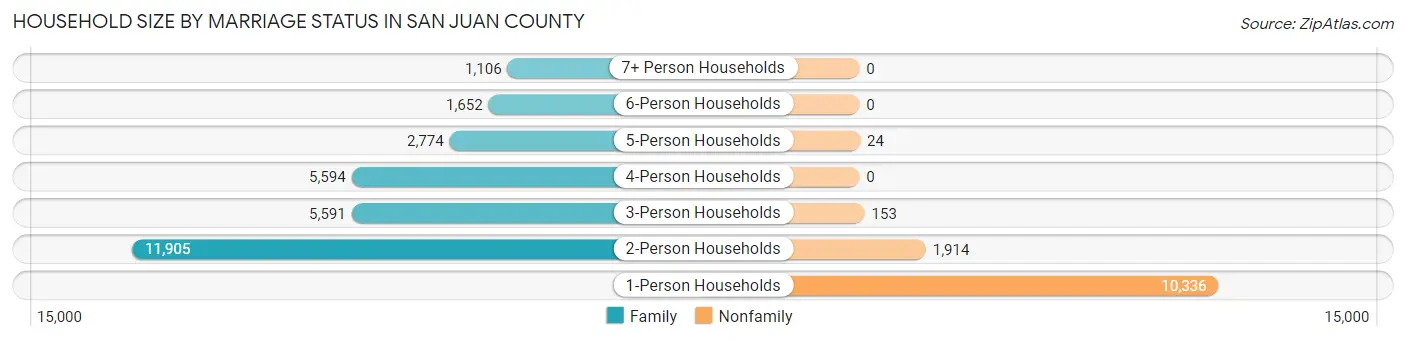
| Household Size | Family Households | Nonfamily Households |
| 1-Person Households | - | 10,336 (25.2%) |
| 2-Person Households | 11,905 (29.0%) | 1,914 (4.7%) |
| 3-Person Households | 5,591 (13.6%) | 153 (0.4%) |
| 4-Person Households | 5,594 (13.6%) | 0 (0.0%) |
| 5-Person Households | 2,774 (6.8%) | 24 (0.1%) |
| 6-Person Households | 1,652 (4.0%) | 0 (0.0%) |
| 7+ Person Households | 1,106 (2.7%) | 0 (0.0%) |
| Total | 28,622 (69.7%) | 12,427 (30.3%) |
Female Fertility in San Juan County
Fertility by Age in San Juan County
Average fertility rate in San Juan County is 60.0 births per 1,000 women. Women in the age bracket of 20 to 34 years have the highest fertility rate with 101.0 births per 1,000 women. Women in the age bracket of 20 to 34 years acount for 70.1% of all women with births.
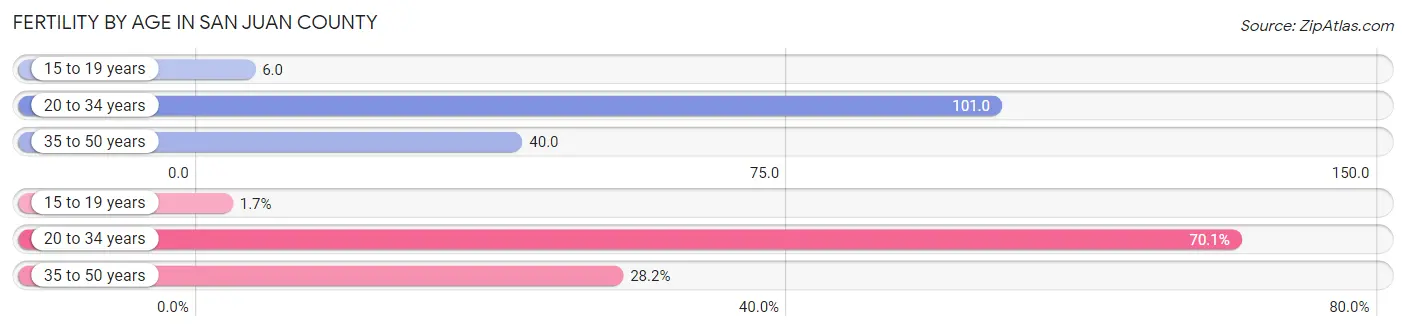
| Age Bracket | Women with Births | Births / 1,000 Women |
| 15 to 19 years | 28 (1.7%) | 6.0 |
| 20 to 34 years | 1,170 (70.1%) | 101.0 |
| 35 to 50 years | 470 (28.2%) | 40.0 |
| Total | 1,668 (100.0%) | 60.0 |
Fertility by Age by Marriage Status in San Juan County
57.4% of women with births (1,668) in San Juan County are married. The highest percentage of unmarried women with births falls into 15 to 19 years age bracket with 82.1% of them unmarried at the time of birth, while the lowest percentage of unmarried women with births belong to 20 to 34 years age bracket with 40.3% of them unmarried.
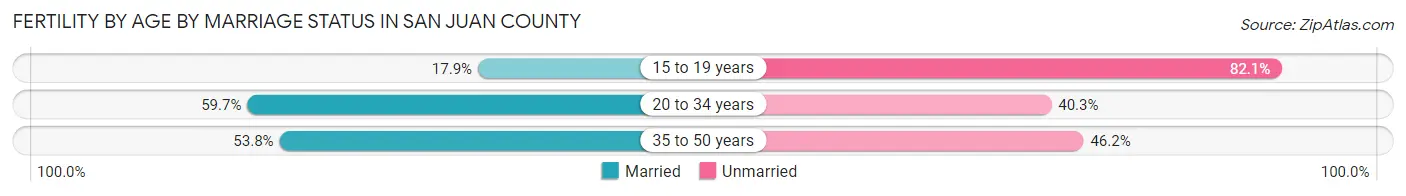
| Age Bracket | Married | Unmarried |
| 15 to 19 years | 5 (17.9%) | 23 (82.1%) |
| 20 to 34 years | 698 (59.7%) | 472 (40.3%) |
| 35 to 50 years | 253 (53.8%) | 217 (46.2%) |
| Total | 957 (57.4%) | 711 (42.6%) |
Fertility by Education in San Juan County
Average fertility rate in San Juan County is 60.0 births per 1,000 women. Women with the education attainment of graduate degree have the highest fertility rate of 170.0 births per 1,000 women, while women with the education attainment of less than high school have the lowest fertility at 27.0 births per 1,000 women. Women with the education attainment of college or associate's degree represent 38.7% of all women with births.
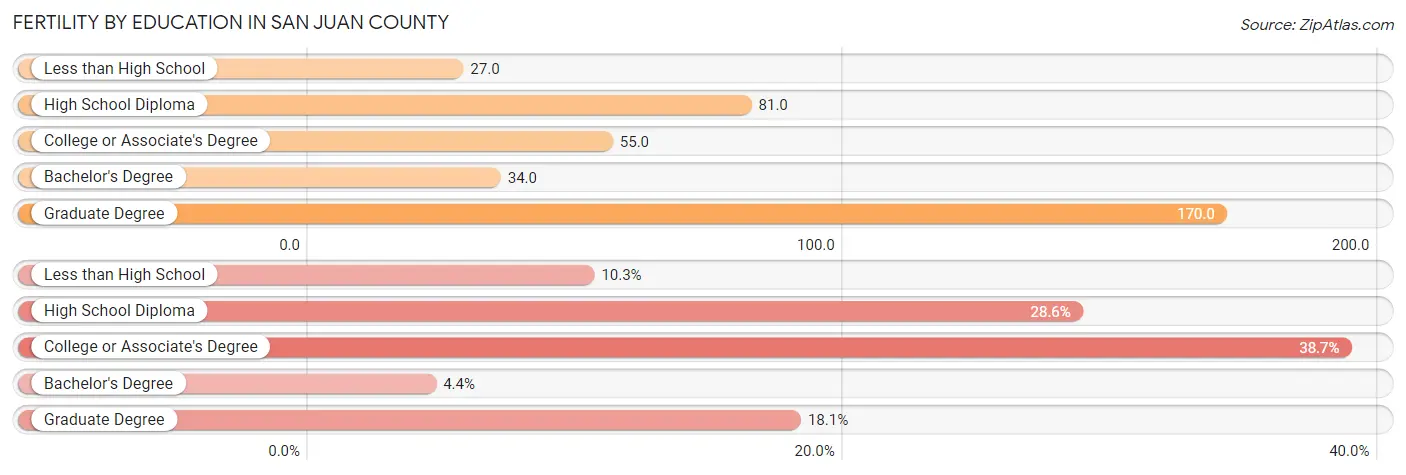
| Educational Attainment | Women with Births | Births / 1,000 Women |
| Less than High School | 172 (10.3%) | 27.0 |
| High School Diploma | 477 (28.6%) | 81.0 |
| College or Associate's Degree | 645 (38.7%) | 55.0 |
| Bachelor's Degree | 73 (4.4%) | 34.0 |
| Graduate Degree | 301 (18.0%) | 170.0 |
| Total | 1,668 (100.0%) | 60.0 |
Fertility by Education by Marriage Status in San Juan County
42.6% of women with births in San Juan County are unmarried. Women with the educational attainment of graduate degree are most likely to be married with 89.4% of them married at childbirth, while women with the educational attainment of less than high school are least likely to be married with 84.9% of them unmarried at childbirth.
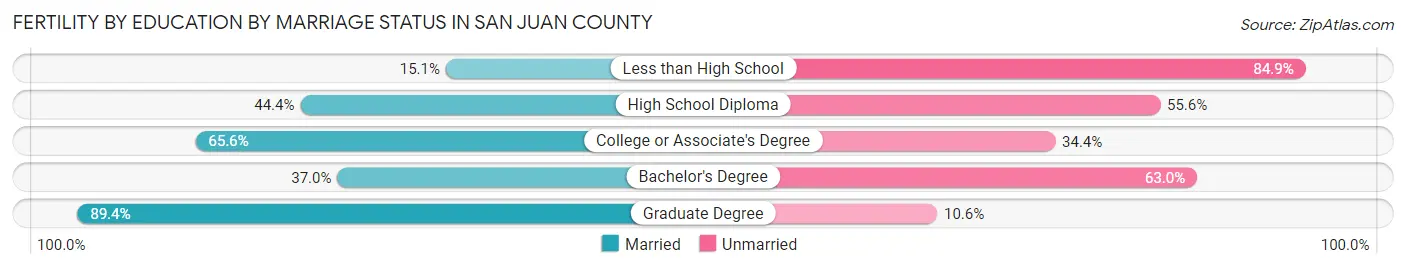
| Educational Attainment | Married | Unmarried |
| Less than High School | 26 (15.1%) | 146 (84.9%) |
| High School Diploma | 212 (44.4%) | 265 (55.6%) |
| College or Associate's Degree | 423 (65.6%) | 222 (34.4%) |
| Bachelor's Degree | 27 (37.0%) | 46 (63.0%) |
| Graduate Degree | 269 (89.4%) | 32 (10.6%) |
| Total | 957 (57.4%) | 711 (42.6%) |
Employment Characteristics in San Juan County
Employment by Class of Employer in San Juan County
Among the 44,516 employed individuals in San Juan County, private company employees (28,449 | 63.9%), local government employees (4,790 | 10.8%), and not-for-profit organizations (2,652 | 6.0%) make up the most common classes of employment.
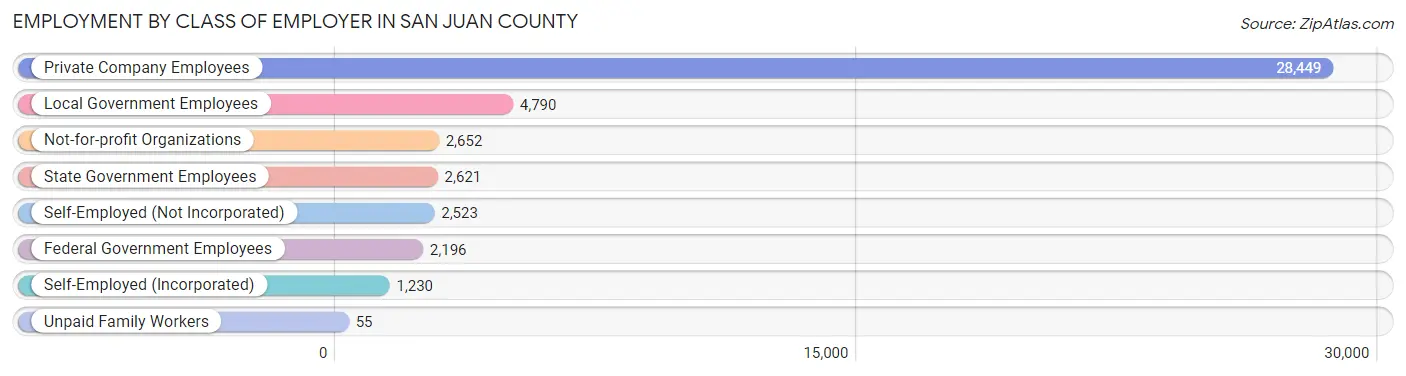
| Employer Class | # Employees | % Employees |
| Private Company Employees | 28,449 | 63.9% |
| Self-Employed (Incorporated) | 1,230 | 2.8% |
| Self-Employed (Not Incorporated) | 2,523 | 5.7% |
| Not-for-profit Organizations | 2,652 | 6.0% |
| Local Government Employees | 4,790 | 10.8% |
| State Government Employees | 2,621 | 5.9% |
| Federal Government Employees | 2,196 | 4.9% |
| Unpaid Family Workers | 55 | 0.1% |
| Total | 44,516 | 100.0% |
Employment Status by Age in San Juan County
According to the labor force statistics for San Juan County, out of the total population over 16 years of age (94,507), 53.0% or 50,089 individuals are in the labor force, with 8.9% or 4,458 of them unemployed. The age group with the highest labor force participation rate is 55 to 59 years, with 72.4% or 5,547 individuals in the labor force. Within the labor force, the 16 to 19 years age range has the highest percentage of unemployed individuals, with 21.7% or 427 of them being unemployed.
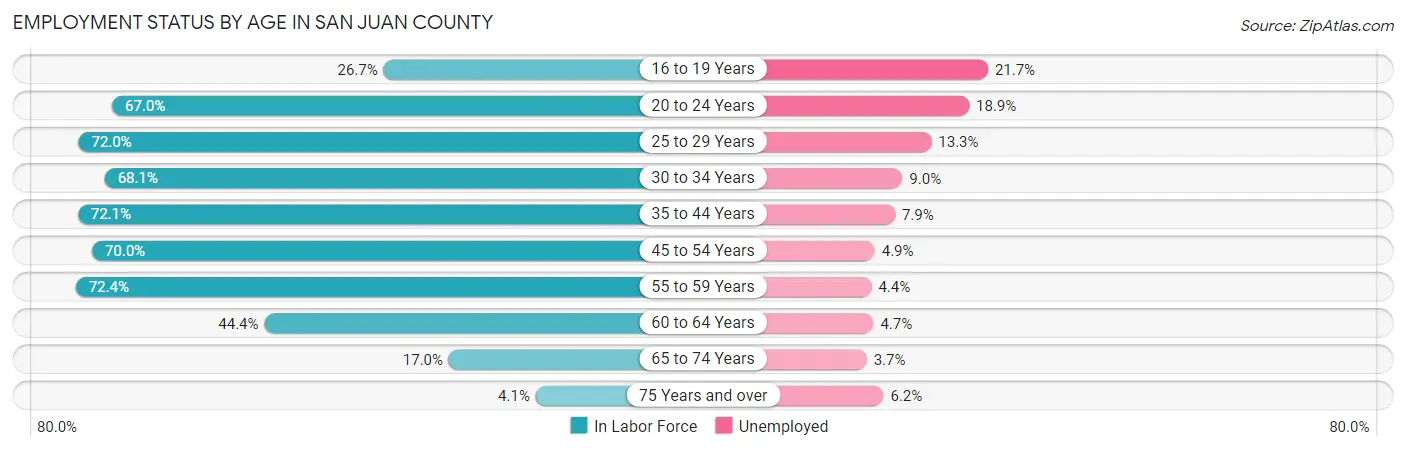
| Age Bracket | In Labor Force | Unemployed |
| 16 to 19 Years | 1,967 (26.7%) | 427 (21.7%) |
| 20 to 24 Years | 4,961 (67.0%) | 938 (18.9%) |
| 25 to 29 Years | 5,653 (72.0%) | 752 (13.3%) |
| 30 to 34 Years | 5,510 (68.1%) | 496 (9.0%) |
| 35 to 44 Years | 11,370 (72.1%) | 898 (7.9%) |
| 45 to 54 Years | 9,315 (70.0%) | 456 (4.9%) |
| 55 to 59 Years | 5,547 (72.4%) | 244 (4.4%) |
| 60 to 64 Years | 3,540 (44.4%) | 166 (4.7%) |
| 65 to 74 Years | 1,967 (17.0%) | 73 (3.7%) |
| 75 Years and over | 308 (4.1%) | 19 (6.2%) |
| Total | 50,089 (53.0%) | 4,458 (8.9%) |
Employment Status by Educational Attainment in San Juan County
According to labor force statistics for San Juan County, 67.5% of individuals (40,942) out of the total population between 25 and 64 years of age (60,655) are in the labor force, with 7.4% or 3,030 of them being unemployed. The group with the highest labor force participation rate are those with the educational attainment of bachelor's degree or higher, with 79.6% or 7,446 individuals in the labor force. Within the labor force, individuals with less than high school education have the highest percentage of unemployment, with 18.3% or 733 of them being unemployed.
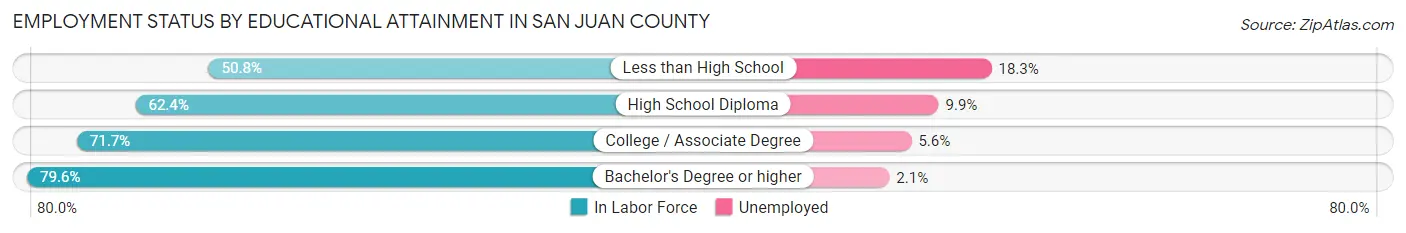
| Educational Attainment | In Labor Force | Unemployed |
| Less than High School | 4,003 (50.8%) | 1,442 (18.3%) |
| High School Diploma | 11,145 (62.4%) | 1,768 (9.9%) |
| College / Associate Degree | 18,328 (71.7%) | 1,431 (5.6%) |
| Bachelor's Degree or higher | 7,446 (79.6%) | 196 (2.1%) |
| Total | 40,942 (67.5%) | 4,488 (7.4%) |
Employment Occupations by Sex in San Juan County
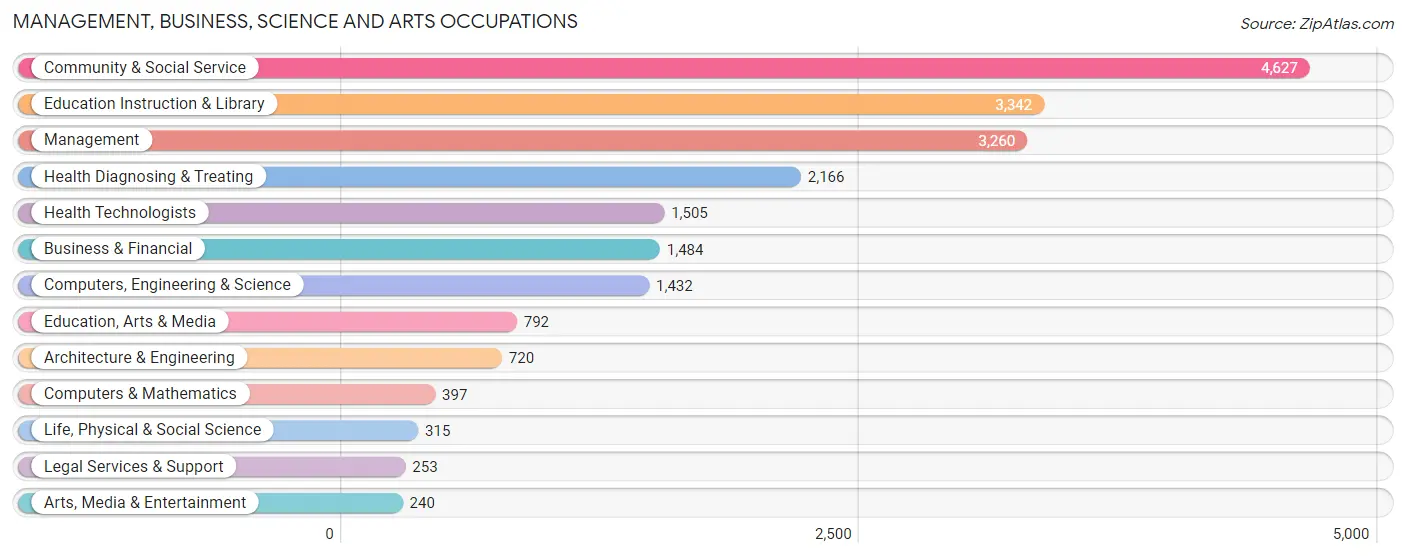
Management, Business, Science and Arts Occupations
The most common Management, Business, Science and Arts occupations in San Juan County are Community & Social Service (4,627 | 10.1%), Education Instruction & Library (3,342 | 7.3%), Management (3,260 | 7.1%), Health Diagnosing & Treating (2,166 | 4.7%), and Health Technologists (1,505 | 3.3%).
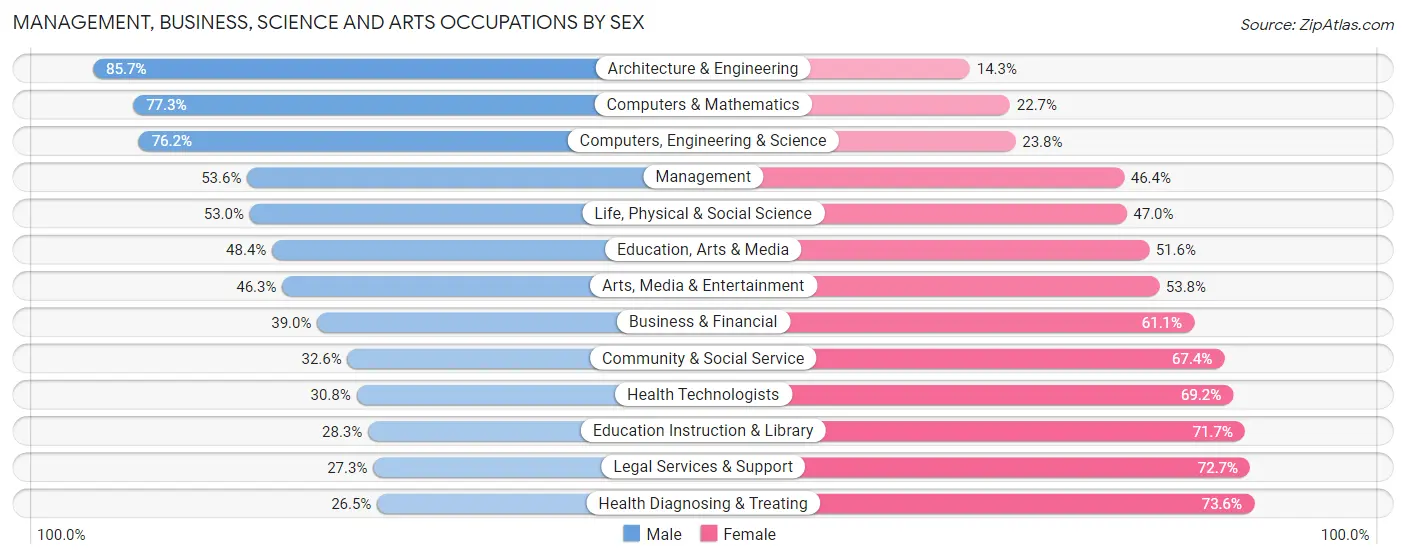
Management, Business, Science and Arts Occupations by Sex
Within the Management, Business, Science and Arts occupations in San Juan County, the most male-oriented occupations are Architecture & Engineering (85.7%), Computers & Mathematics (77.3%), and Computers, Engineering & Science (76.2%), while the most female-oriented occupations are Health Diagnosing & Treating (73.6%), Legal Services & Support (72.7%), and Education Instruction & Library (71.7%).
| Occupation | Male | Female |
| Management | 1,746 (53.6%) | 1,514 (46.4%) |
| Business & Financial | 578 (39.0%) | 906 (61.1%) |
| Computers, Engineering & Science | 1,091 (76.2%) | 341 (23.8%) |
| Computers & Mathematics | 307 (77.3%) | 90 (22.7%) |
| Architecture & Engineering | 617 (85.7%) | 103 (14.3%) |
| Life, Physical & Social Science | 167 (53.0%) | 148 (47.0%) |
| Community & Social Service | 1,510 (32.6%) | 3,117 (67.4%) |
| Education, Arts & Media | 383 (48.4%) | 409 (51.6%) |
| Legal Services & Support | 69 (27.3%) | 184 (72.7%) |
| Education Instruction & Library | 947 (28.3%) | 2,395 (71.7%) |
| Arts, Media & Entertainment | 111 (46.3%) | 129 (53.7%) |
| Health Diagnosing & Treating | 573 (26.5%) | 1,593 (73.6%) |
| Health Technologists | 463 (30.8%) | 1,042 (69.2%) |
| Total (Category) | 5,498 (42.4%) | 7,471 (57.6%) |
| Total (Overall) | 23,927 (52.4%) | 21,725 (47.6%) |
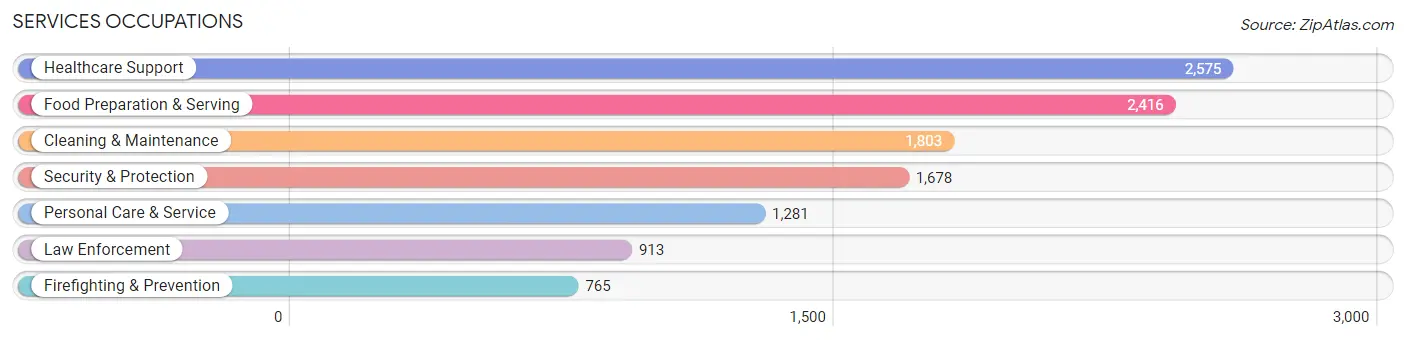
Services Occupations
The most common Services occupations in San Juan County are Healthcare Support (2,575 | 5.6%), Food Preparation & Serving (2,416 | 5.3%), Cleaning & Maintenance (1,803 | 4.0%), Security & Protection (1,678 | 3.7%), and Personal Care & Service (1,281 | 2.8%).
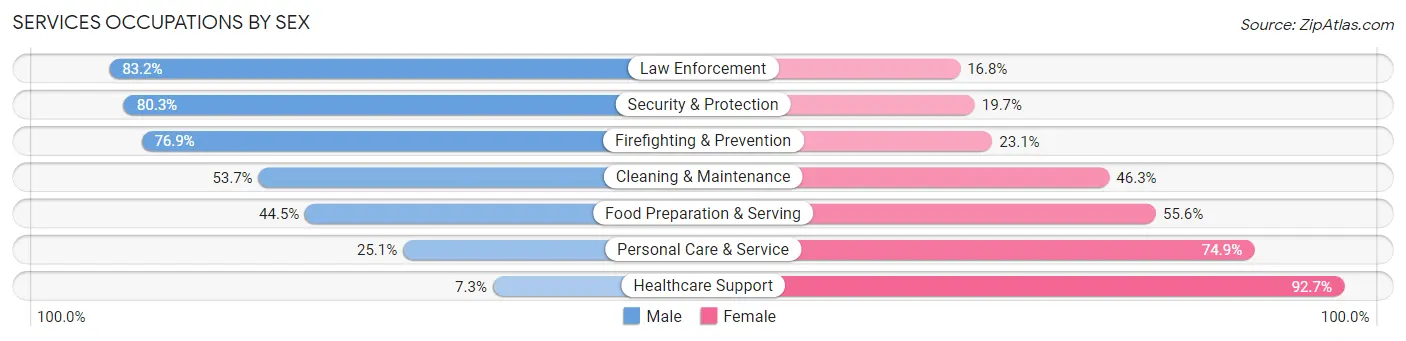
Services Occupations by Sex
Within the Services occupations in San Juan County, the most male-oriented occupations are Law Enforcement (83.2%), Security & Protection (80.3%), and Firefighting & Prevention (76.9%), while the most female-oriented occupations are Healthcare Support (92.7%), Personal Care & Service (74.9%), and Food Preparation & Serving (55.5%).
| Occupation | Male | Female |
| Healthcare Support | 188 (7.3%) | 2,387 (92.7%) |
| Security & Protection | 1,348 (80.3%) | 330 (19.7%) |
| Firefighting & Prevention | 588 (76.9%) | 177 (23.1%) |
| Law Enforcement | 760 (83.2%) | 153 (16.8%) |
| Food Preparation & Serving | 1,074 (44.5%) | 1,342 (55.5%) |
| Cleaning & Maintenance | 968 (53.7%) | 835 (46.3%) |
| Personal Care & Service | 321 (25.1%) | 960 (74.9%) |
| Total (Category) | 3,899 (40.0%) | 5,854 (60.0%) |
| Total (Overall) | 23,927 (52.4%) | 21,725 (47.6%) |
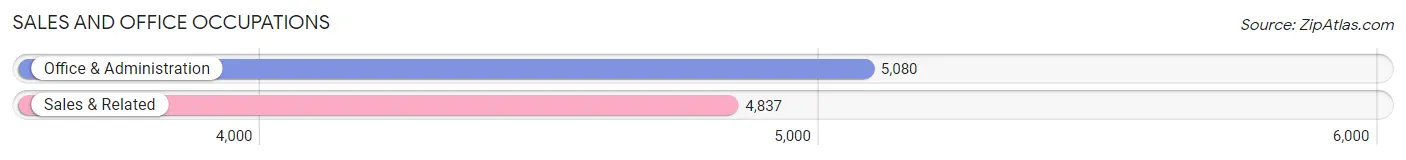
Sales and Office Occupations
The most common Sales and Office occupations in San Juan County are Office & Administration (5,080 | 11.1%), and Sales & Related (4,837 | 10.6%).
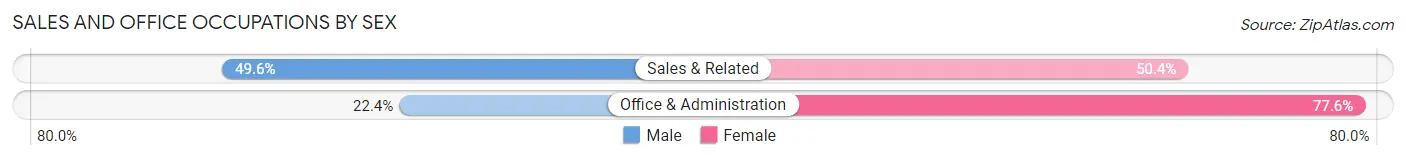
Sales and Office Occupations by Sex
| Occupation | Male | Female |
| Sales & Related | 2,399 (49.6%) | 2,438 (50.4%) |
| Office & Administration | 1,137 (22.4%) | 3,943 (77.6%) |
| Total (Category) | 3,536 (35.7%) | 6,381 (64.3%) |
| Total (Overall) | 23,927 (52.4%) | 21,725 (47.6%) |
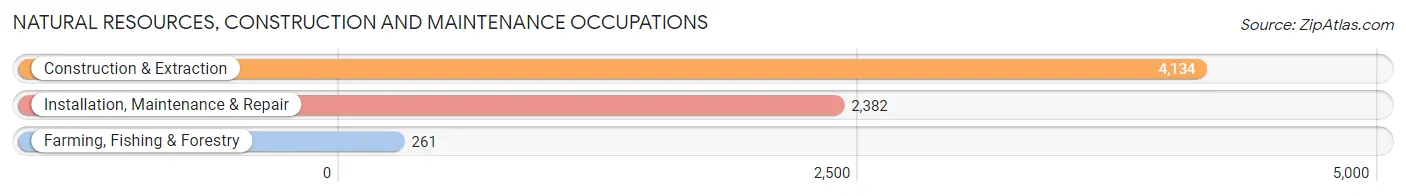
Natural Resources, Construction and Maintenance Occupations
The most common Natural Resources, Construction and Maintenance occupations in San Juan County are Construction & Extraction (4,134 | 9.1%), Installation, Maintenance & Repair (2,382 | 5.2%), and Farming, Fishing & Forestry (261 | 0.6%).
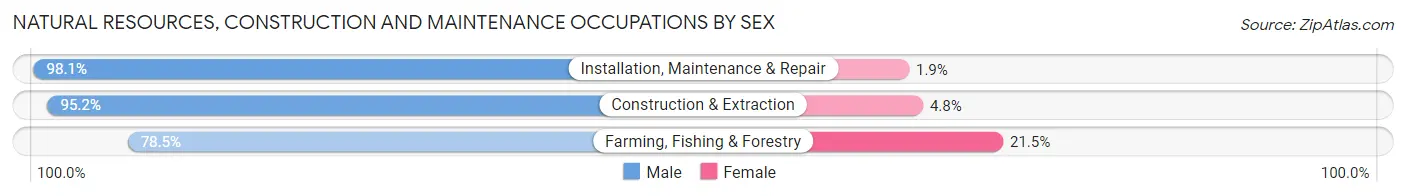
Natural Resources, Construction and Maintenance Occupations by Sex
| Occupation | Male | Female |
| Farming, Fishing & Forestry | 205 (78.5%) | 56 (21.5%) |
| Construction & Extraction | 3,936 (95.2%) | 198 (4.8%) |
| Installation, Maintenance & Repair | 2,337 (98.1%) | 45 (1.9%) |
| Total (Category) | 6,478 (95.6%) | 299 (4.4%) |
| Total (Overall) | 23,927 (52.4%) | 21,725 (47.6%) |
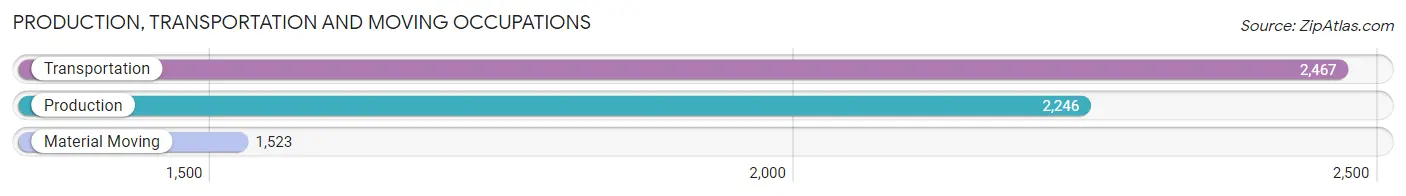
Production, Transportation and Moving Occupations
The most common Production, Transportation and Moving occupations in San Juan County are Transportation (2,467 | 5.4%), Production (2,246 | 4.9%), and Material Moving (1,523 | 3.3%).
Production, Transportation and Moving Occupations by Sex
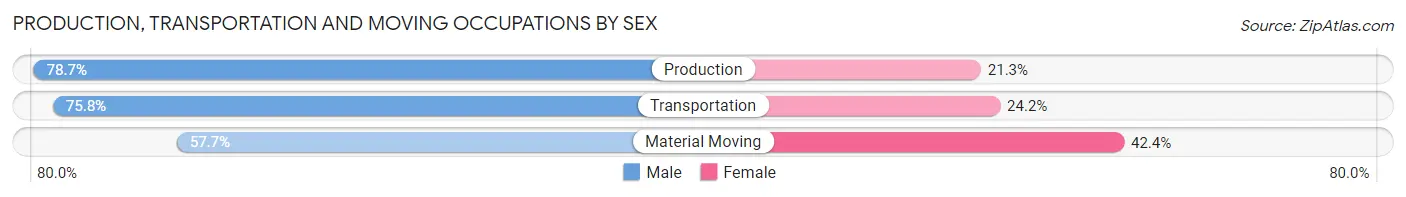
| Occupation | Male | Female |
| Production | 1,767 (78.7%) | 479 (21.3%) |
| Transportation | 1,871 (75.8%) | 596 (24.2%) |
| Material Moving | 878 (57.7%) | 645 (42.3%) |
| Total (Category) | 4,516 (72.4%) | 1,720 (27.6%) |
| Total (Overall) | 23,927 (52.4%) | 21,725 (47.6%) |
Employment Industries by Sex in San Juan County
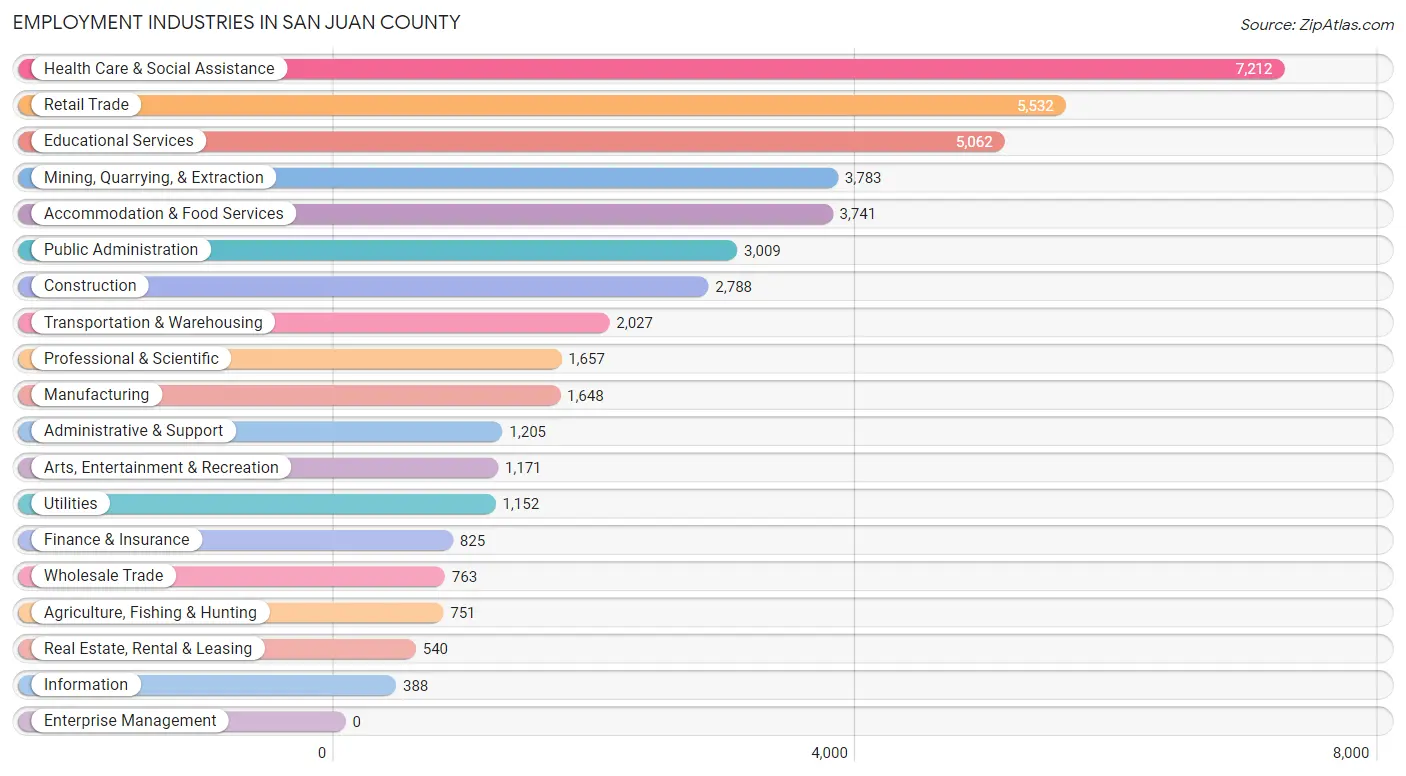
Employment Industries in San Juan County
The major employment industries in San Juan County include Health Care & Social Assistance (7,212 | 15.8%), Retail Trade (5,532 | 12.1%), Educational Services (5,062 | 11.1%), Mining, Quarrying, & Extraction (3,783 | 8.3%), and Accommodation & Food Services (3,741 | 8.2%).
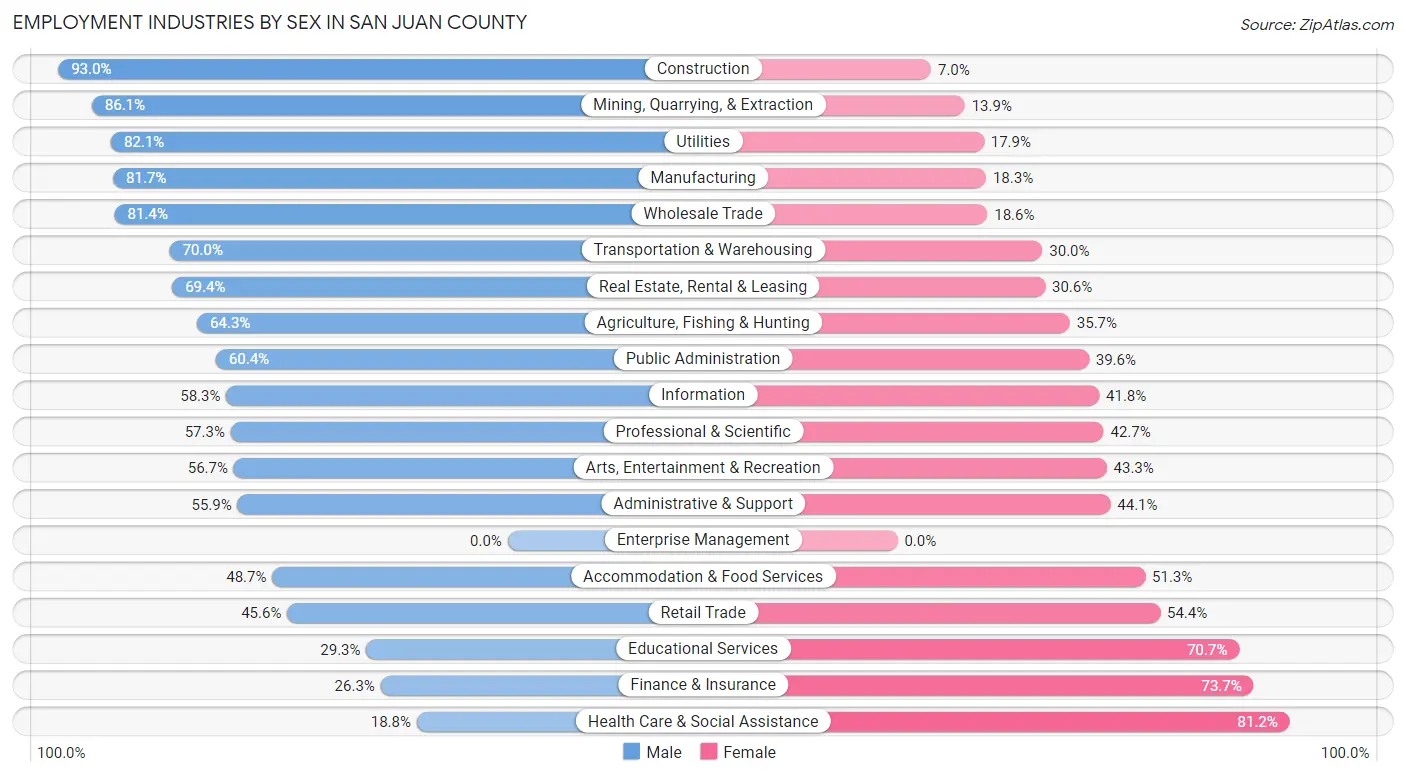
Employment Industries by Sex in San Juan County
The San Juan County industries that see more men than women are Construction (93.0%), Mining, Quarrying, & Extraction (86.1%), and Utilities (82.1%), whereas the industries that tend to have a higher number of women are Health Care & Social Assistance (81.2%), Finance & Insurance (73.7%), and Educational Services (70.7%).
| Industry | Male | Female |
| Agriculture, Fishing & Hunting | 483 (64.3%) | 268 (35.7%) |
| Mining, Quarrying, & Extraction | 3,256 (86.1%) | 527 (13.9%) |
| Construction | 2,594 (93.0%) | 194 (7.0%) |
| Manufacturing | 1,346 (81.7%) | 302 (18.3%) |
| Wholesale Trade | 621 (81.4%) | 142 (18.6%) |
| Retail Trade | 2,525 (45.6%) | 3,007 (54.4%) |
| Transportation & Warehousing | 1,419 (70.0%) | 608 (30.0%) |
| Utilities | 946 (82.1%) | 206 (17.9%) |
| Information | 226 (58.3%) | 162 (41.7%) |
| Finance & Insurance | 217 (26.3%) | 608 (73.7%) |
| Real Estate, Rental & Leasing | 375 (69.4%) | 165 (30.6%) |
| Professional & Scientific | 950 (57.3%) | 707 (42.7%) |
| Enterprise Management | 0 (0.0%) | 0 (0.0%) |
| Administrative & Support | 674 (55.9%) | 531 (44.1%) |
| Educational Services | 1,481 (29.3%) | 3,581 (70.7%) |
| Health Care & Social Assistance | 1,358 (18.8%) | 5,854 (81.2%) |
| Arts, Entertainment & Recreation | 664 (56.7%) | 507 (43.3%) |
| Accommodation & Food Services | 1,823 (48.7%) | 1,918 (51.3%) |
| Public Administration | 1,817 (60.4%) | 1,192 (39.6%) |
| Total | 23,927 (52.4%) | 21,725 (47.6%) |
Education in San Juan County
School Enrollment in San Juan County
The most common levels of schooling among the 30,306 students in San Juan County are elementary school (7,309 | 24.1%), middle school (7,153 | 23.6%), and high school (7,009 | 23.1%).
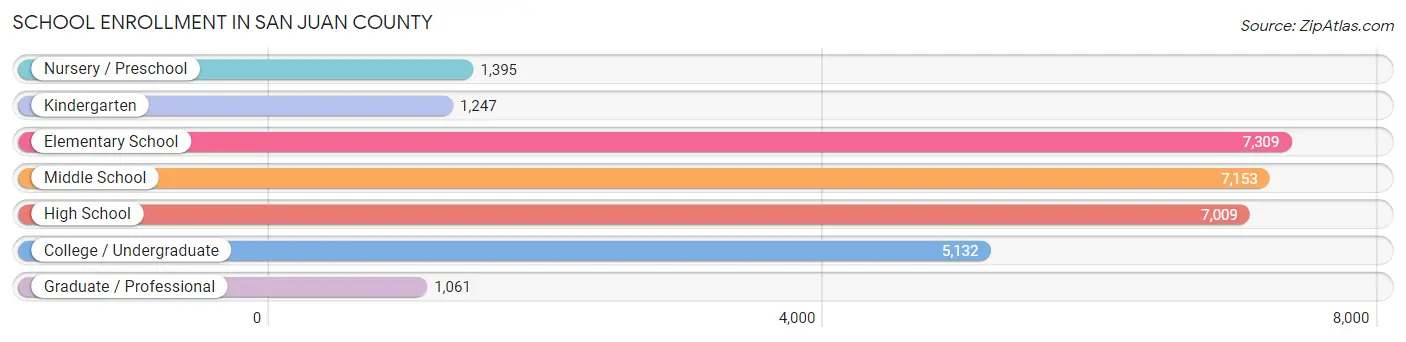
| School Level | # Students | % Students |
| Nursery / Preschool | 1,395 | 4.6% |
| Kindergarten | 1,247 | 4.1% |
| Elementary School | 7,309 | 24.1% |
| Middle School | 7,153 | 23.6% |
| High School | 7,009 | 23.1% |
| College / Undergraduate | 5,132 | 16.9% |
| Graduate / Professional | 1,061 | 3.5% |
| Total | 30,306 | 100.0% |
School Enrollment by Age by Funding Source in San Juan County
Out of a total of 30,306 students who are enrolled in schools in San Juan County, 2,879 (9.5%) attend a private institution, while the remaining 27,427 (90.5%) are enrolled in public schools. The age group of 35 years and over has the highest likelihood of being enrolled in private schools, with 328 (15.0% in the age bracket) enrolled. Conversely, the age group of 18 to 19 year olds has the lowest likelihood of being enrolled in a private school, with 1,890 (94.9% in the age bracket) attending a public institution.
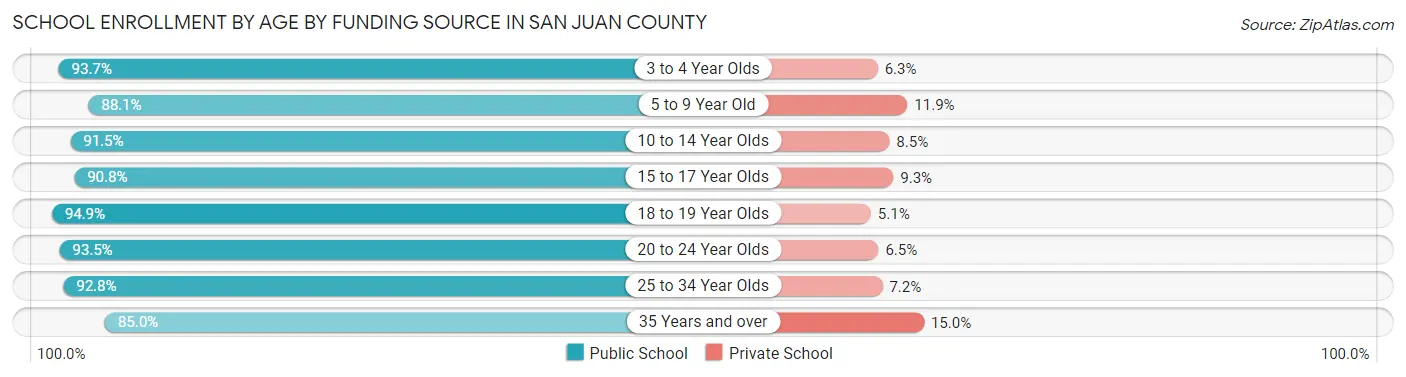
| Age Bracket | Public School | Private School |
| 3 to 4 Year Olds | 945 (93.7%) | 64 (6.3%) |
| 5 to 9 Year Old | 6,835 (88.1%) | 921 (11.9%) |
| 10 to 14 Year Olds | 8,346 (91.5%) | 777 (8.5%) |
| 15 to 17 Year Olds | 4,564 (90.7%) | 465 (9.2%) |
| 18 to 19 Year Olds | 1,890 (94.9%) | 101 (5.1%) |
| 20 to 24 Year Olds | 1,599 (93.5%) | 111 (6.5%) |
| 25 to 34 Year Olds | 1,388 (92.8%) | 108 (7.2%) |
| 35 Years and over | 1,864 (85.0%) | 328 (15.0%) |
| Total | 27,427 (90.5%) | 2,879 (9.5%) |
Educational Attainment by Field of Study in San Juan County
Education (3,014 | 22.2%), business (2,119 | 15.6%), bio, nature & agricultural (1,222 | 9.0%), science & technology (1,019 | 7.5%), and social sciences (972 | 7.2%) are the most common fields of study among 13,567 individuals in San Juan County who have obtained a bachelor's degree or higher.
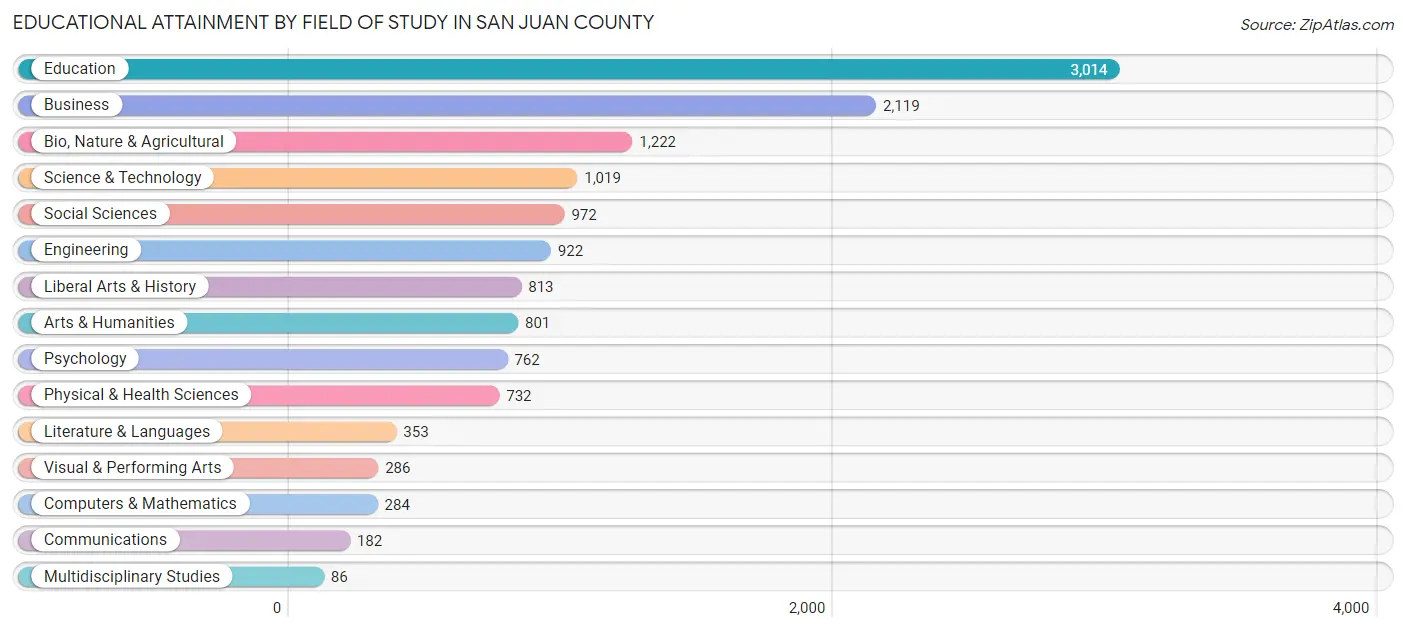
| Field of Study | # Graduates | % Graduates |
| Computers & Mathematics | 284 | 2.1% |
| Bio, Nature & Agricultural | 1,222 | 9.0% |
| Physical & Health Sciences | 732 | 5.4% |
| Psychology | 762 | 5.6% |
| Social Sciences | 972 | 7.2% |
| Engineering | 922 | 6.8% |
| Multidisciplinary Studies | 86 | 0.6% |
| Science & Technology | 1,019 | 7.5% |
| Business | 2,119 | 15.6% |
| Education | 3,014 | 22.2% |
| Literature & Languages | 353 | 2.6% |
| Liberal Arts & History | 813 | 6.0% |
| Visual & Performing Arts | 286 | 2.1% |
| Communications | 182 | 1.3% |
| Arts & Humanities | 801 | 5.9% |
| Total | 13,567 | 100.0% |
Transportation & Commute in San Juan County
Vehicle Availability by Sex in San Juan County
The most prevalent vehicle ownership categories in San Juan County are males with 2 vehicles (8,807, accounting for 37.4%) and females with 2 vehicles (6,820, making up 42.3%).
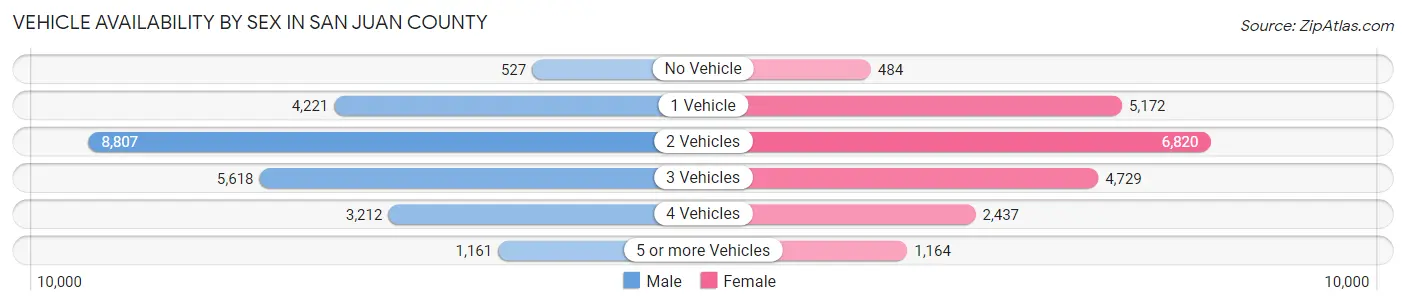
| Vehicles Available | Male | Female |
| No Vehicle | 527 (2.2%) | 484 (2.3%) |
| 1 Vehicle | 4,221 (17.9%) | 5,172 (24.9%) |
| 2 Vehicles | 8,807 (37.4%) | 6,820 (32.8%) |
| 3 Vehicles | 5,618 (23.9%) | 4,729 (22.7%) |
| 4 Vehicles | 3,212 (13.6%) | 2,437 (11.7%) |
| 5 or more Vehicles | 1,161 (4.9%) | 1,164 (5.6%) |
| Total | 23,546 (100.0%) | 20,806 (100.0%) |
Commute Time in San Juan County
The most frequently occuring commute durations in San Juan County are 10 to 14 minutes (6,957 commuters, 16.4%), 15 to 19 minutes (6,157 commuters, 14.5%), and 30 to 34 minutes (5,817 commuters, 13.7%).
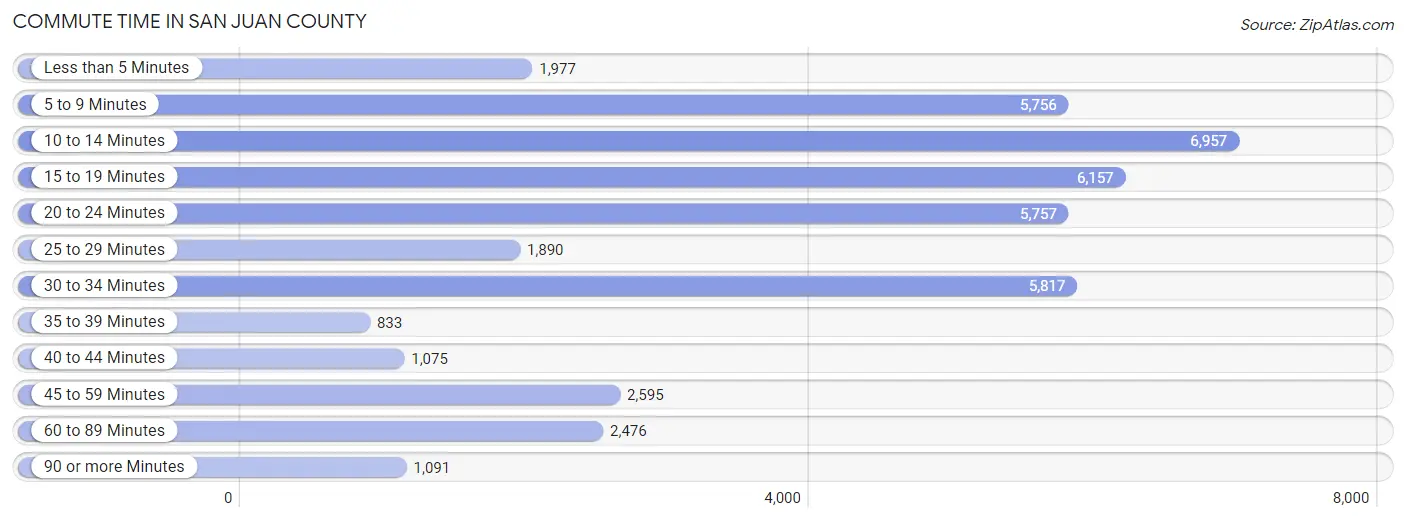
| Commute Time | # Commuters | % Commuters |
| Less than 5 Minutes | 1,977 | 4.7% |
| 5 to 9 Minutes | 5,756 | 13.6% |
| 10 to 14 Minutes | 6,957 | 16.4% |
| 15 to 19 Minutes | 6,157 | 14.5% |
| 20 to 24 Minutes | 5,757 | 13.6% |
| 25 to 29 Minutes | 1,890 | 4.5% |
| 30 to 34 Minutes | 5,817 | 13.7% |
| 35 to 39 Minutes | 833 | 2.0% |
| 40 to 44 Minutes | 1,075 | 2.5% |
| 45 to 59 Minutes | 2,595 | 6.1% |
| 60 to 89 Minutes | 2,476 | 5.8% |
| 90 or more Minutes | 1,091 | 2.6% |
Commute Time by Sex in San Juan County
The most common commute times in San Juan County are 10 to 14 minutes (3,637 commuters, 16.1%) for males and 10 to 14 minutes (3,320 commuters, 16.7%) for females.
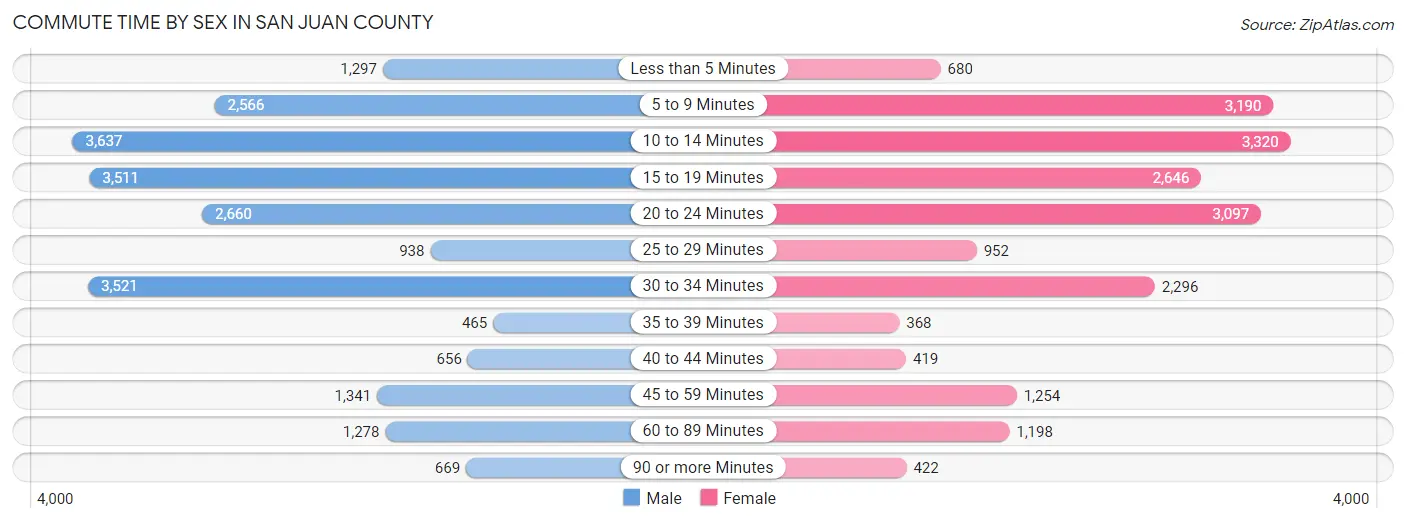
| Commute Time | Male | Female |
| Less than 5 Minutes | 1,297 (5.8%) | 680 (3.4%) |
| 5 to 9 Minutes | 2,566 (11.4%) | 3,190 (16.1%) |
| 10 to 14 Minutes | 3,637 (16.1%) | 3,320 (16.7%) |
| 15 to 19 Minutes | 3,511 (15.6%) | 2,646 (13.3%) |
| 20 to 24 Minutes | 2,660 (11.8%) | 3,097 (15.6%) |
| 25 to 29 Minutes | 938 (4.2%) | 952 (4.8%) |
| 30 to 34 Minutes | 3,521 (15.6%) | 2,296 (11.6%) |
| 35 to 39 Minutes | 465 (2.1%) | 368 (1.8%) |
| 40 to 44 Minutes | 656 (2.9%) | 419 (2.1%) |
| 45 to 59 Minutes | 1,341 (5.9%) | 1,254 (6.3%) |
| 60 to 89 Minutes | 1,278 (5.7%) | 1,198 (6.0%) |
| 90 or more Minutes | 669 (3.0%) | 422 (2.1%) |
Time of Departure to Work by Sex in San Juan County
The most frequent times of departure to work in San Juan County are 7:00 AM to 7:29 AM (3,810, 16.9%) for males and 7:00 AM to 7:29 AM (3,489, 17.6%) for females.
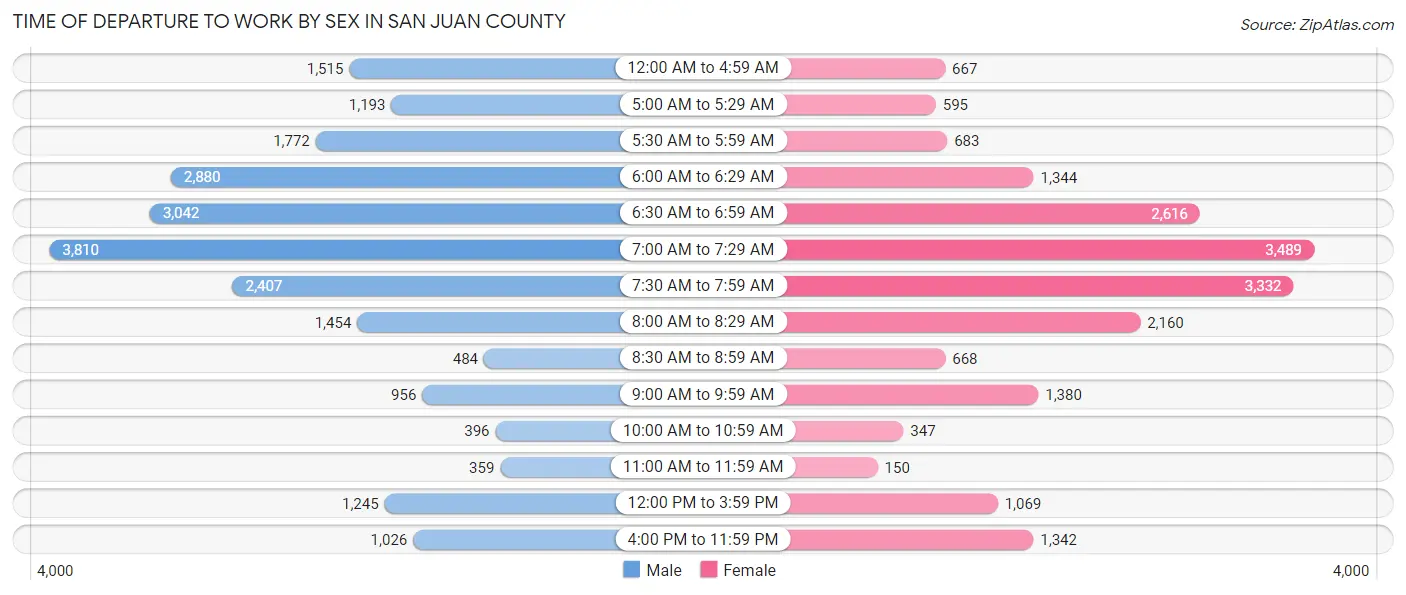
| Time of Departure | Male | Female |
| 12:00 AM to 4:59 AM | 1,515 (6.7%) | 667 (3.4%) |
| 5:00 AM to 5:29 AM | 1,193 (5.3%) | 595 (3.0%) |
| 5:30 AM to 5:59 AM | 1,772 (7.9%) | 683 (3.4%) |
| 6:00 AM to 6:29 AM | 2,880 (12.8%) | 1,344 (6.8%) |
| 6:30 AM to 6:59 AM | 3,042 (13.5%) | 2,616 (13.2%) |
| 7:00 AM to 7:29 AM | 3,810 (16.9%) | 3,489 (17.6%) |
| 7:30 AM to 7:59 AM | 2,407 (10.7%) | 3,332 (16.8%) |
| 8:00 AM to 8:29 AM | 1,454 (6.5%) | 2,160 (10.9%) |
| 8:30 AM to 8:59 AM | 484 (2.1%) | 668 (3.4%) |
| 9:00 AM to 9:59 AM | 956 (4.2%) | 1,380 (7.0%) |
| 10:00 AM to 10:59 AM | 396 (1.8%) | 347 (1.8%) |
| 11:00 AM to 11:59 AM | 359 (1.6%) | 150 (0.8%) |
| 12:00 PM to 3:59 PM | 1,245 (5.5%) | 1,069 (5.4%) |
| 4:00 PM to 11:59 PM | 1,026 (4.5%) | 1,342 (6.8%) |
| Total | 22,539 (100.0%) | 19,842 (100.0%) |
Housing Occupancy in San Juan County
Occupancy by Ownership in San Juan County
Of the total 41,049 dwellings in San Juan County, owner-occupied units account for 28,878 (70.4%), while renter-occupied units make up 12,171 (29.6%).
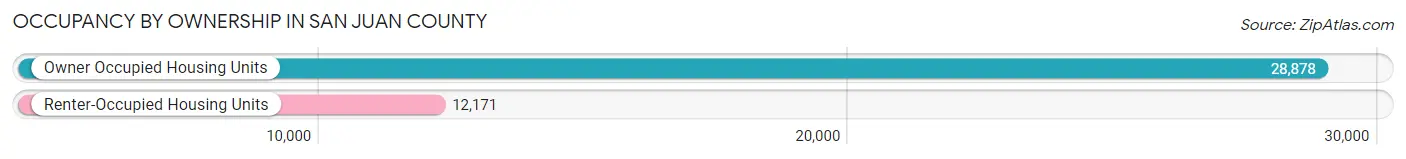
| Occupancy | # Housing Units | % Housing Units |
| Owner Occupied Housing Units | 28,878 | 70.4% |
| Renter-Occupied Housing Units | 12,171 | 29.6% |
| Total Occupied Housing Units | 41,049 | 100.0% |
Occupancy by Household Size in San Juan County
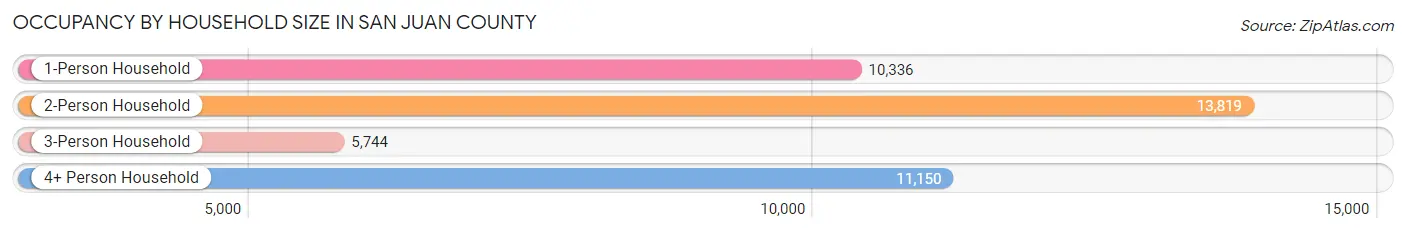
| Household Size | # Housing Units | % Housing Units |
| 1-Person Household | 10,336 | 25.2% |
| 2-Person Household | 13,819 | 33.7% |
| 3-Person Household | 5,744 | 14.0% |
| 4+ Person Household | 11,150 | 27.2% |
| Total Housing Units | 41,049 | 100.0% |
Occupancy by Ownership by Household Size in San Juan County
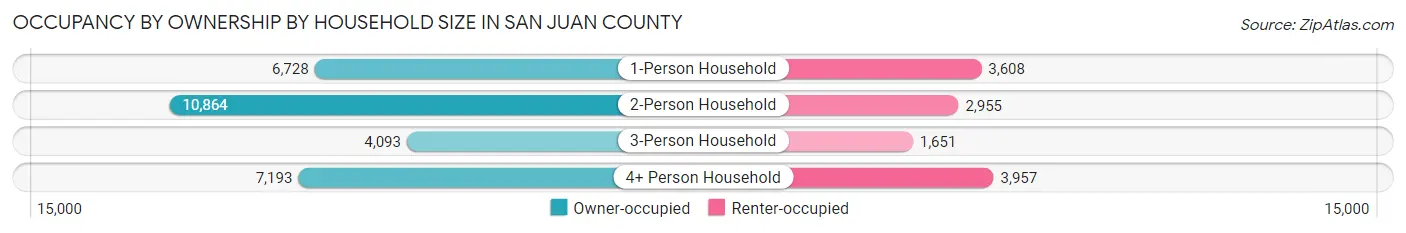
| Household Size | Owner-occupied | Renter-occupied |
| 1-Person Household | 6,728 (65.1%) | 3,608 (34.9%) |
| 2-Person Household | 10,864 (78.6%) | 2,955 (21.4%) |
| 3-Person Household | 4,093 (71.3%) | 1,651 (28.7%) |
| 4+ Person Household | 7,193 (64.5%) | 3,957 (35.5%) |
| Total Housing Units | 28,878 (70.4%) | 12,171 (29.6%) |
Occupancy by Educational Attainment in San Juan County
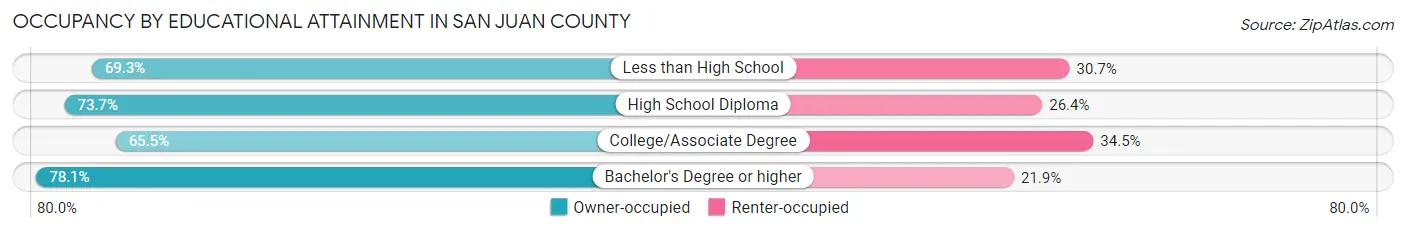
| Household Size | Owner-occupied | Renter-occupied |
| Less than High School | 3,471 (69.3%) | 1,537 (30.7%) |
| High School Diploma | 7,940 (73.7%) | 2,841 (26.4%) |
| College/Associate Degree | 11,807 (65.5%) | 6,209 (34.5%) |
| Bachelor's Degree or higher | 5,660 (78.1%) | 1,584 (21.9%) |
Occupancy by Age of Householder in San Juan County
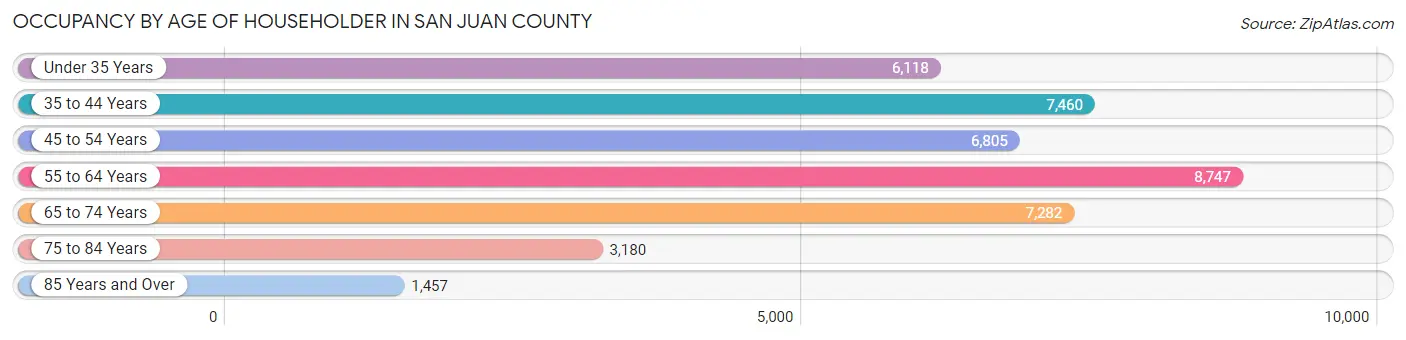
| Age Bracket | # Households | % Households |
| Under 35 Years | 6,118 | 14.9% |
| 35 to 44 Years | 7,460 | 18.2% |
| 45 to 54 Years | 6,805 | 16.6% |
| 55 to 64 Years | 8,747 | 21.3% |
| 65 to 74 Years | 7,282 | 17.7% |
| 75 to 84 Years | 3,180 | 7.7% |
| 85 Years and Over | 1,457 | 3.5% |
| Total | 41,049 | 100.0% |
Housing Finances in San Juan County
Median Income by Occupancy in San Juan County
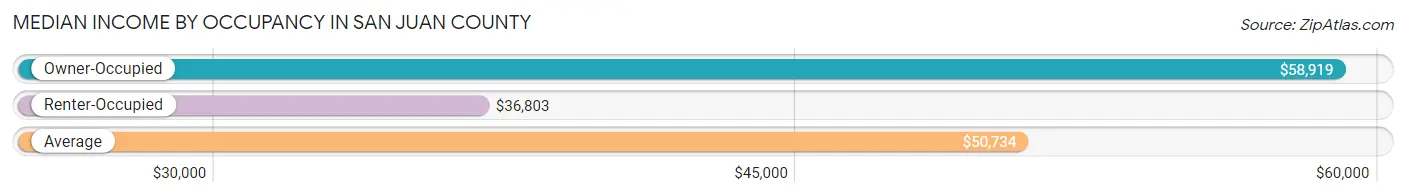
| Occupancy Type | # Households | Median Income |
| Owner-Occupied | 28,878 (70.4%) | $58,919 |
| Renter-Occupied | 12,171 (29.6%) | $36,803 |
| Average | 41,049 (100.0%) | $50,734 |
Occupancy by Householder Income Bracket in San Juan County
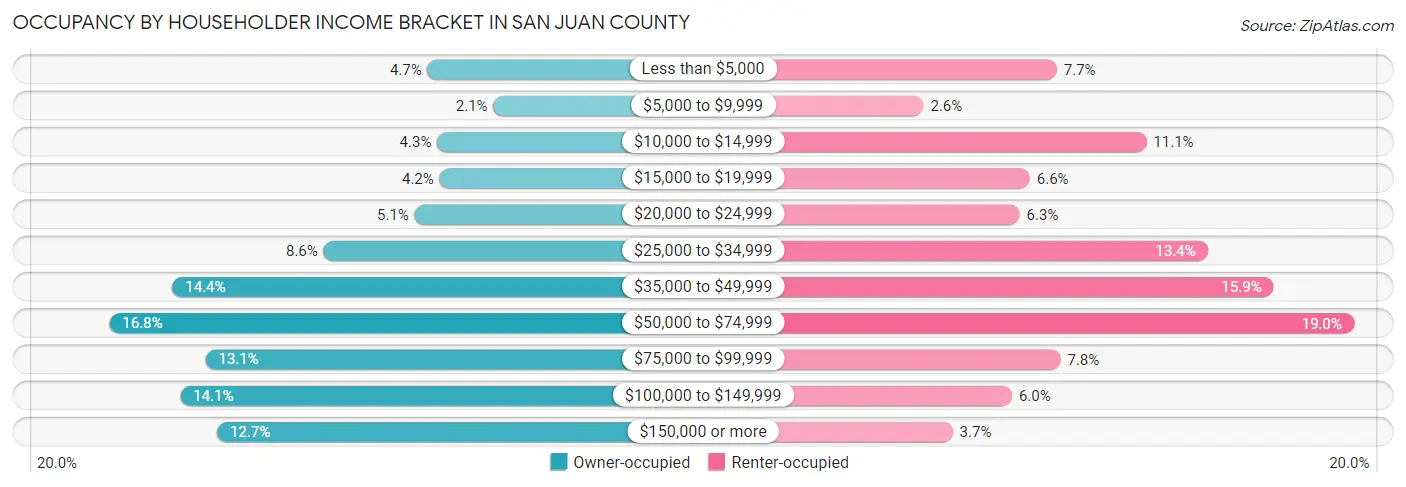
| Income Bracket | Owner-occupied | Renter-occupied |
| Less than $5,000 | 1,343 (4.6%) | 933 (7.7%) |
| $5,000 to $9,999 | 617 (2.1%) | 315 (2.6%) |
| $10,000 to $14,999 | 1,235 (4.3%) | 1,348 (11.1%) |
| $15,000 to $19,999 | 1,209 (4.2%) | 808 (6.6%) |
| $20,000 to $24,999 | 1,485 (5.1%) | 761 (6.2%) |
| $25,000 to $34,999 | 2,485 (8.6%) | 1,632 (13.4%) |
| $35,000 to $49,999 | 4,151 (14.4%) | 1,938 (15.9%) |
| $50,000 to $74,999 | 4,844 (16.8%) | 2,310 (19.0%) |
| $75,000 to $99,999 | 3,785 (13.1%) | 951 (7.8%) |
| $100,000 to $149,999 | 4,064 (14.1%) | 725 (6.0%) |
| $150,000 or more | 3,660 (12.7%) | 450 (3.7%) |
| Total | 28,878 (100.0%) | 12,171 (100.0%) |
Monthly Housing Cost Tiers in San Juan County
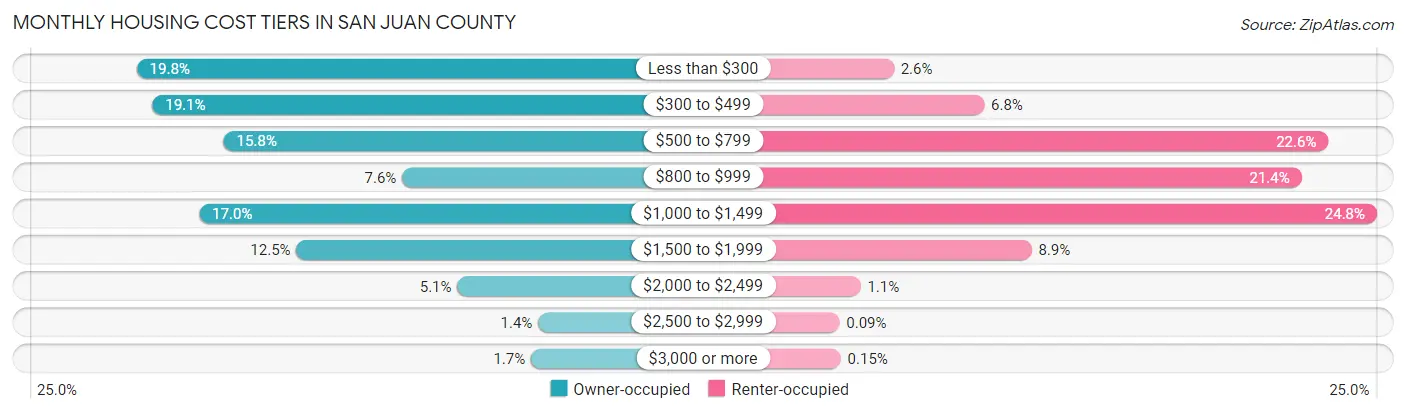
| Monthly Cost | Owner-occupied | Renter-occupied |
| Less than $300 | 5,728 (19.8%) | 315 (2.6%) |
| $300 to $499 | 5,521 (19.1%) | 822 (6.8%) |
| $500 to $799 | 4,573 (15.8%) | 2,750 (22.6%) |
| $800 to $999 | 2,201 (7.6%) | 2,600 (21.4%) |
| $1,000 to $1,499 | 4,901 (17.0%) | 3,022 (24.8%) |
| $1,500 to $1,999 | 3,606 (12.5%) | 1,087 (8.9%) |
| $2,000 to $2,499 | 1,467 (5.1%) | 129 (1.1%) |
| $2,500 to $2,999 | 393 (1.4%) | 11 (0.1%) |
| $3,000 or more | 488 (1.7%) | 18 (0.2%) |
| Total | 28,878 (100.0%) | 12,171 (100.0%) |
Physical Housing Characteristics in San Juan County
Housing Structures in San Juan County
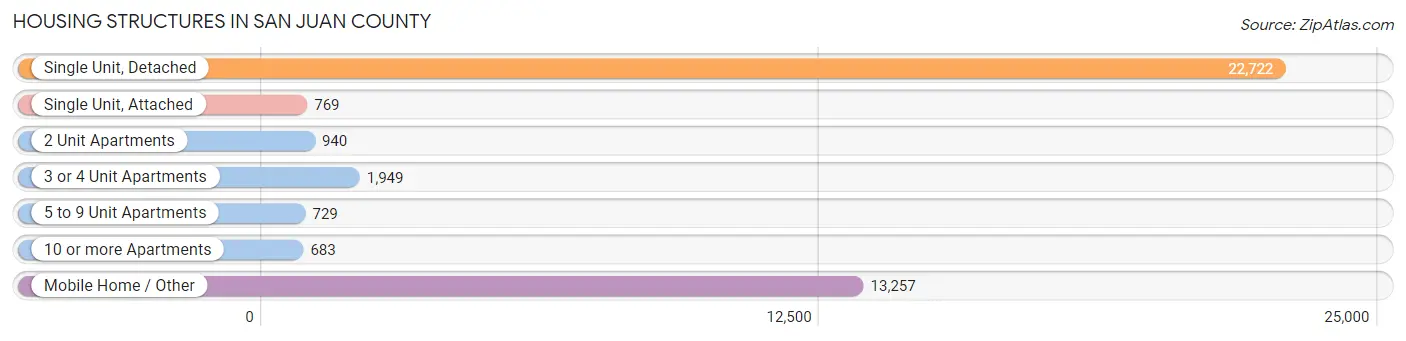
| Structure Type | # Housing Units | % Housing Units |
| Single Unit, Detached | 22,722 | 55.3% |
| Single Unit, Attached | 769 | 1.9% |
| 2 Unit Apartments | 940 | 2.3% |
| 3 or 4 Unit Apartments | 1,949 | 4.8% |
| 5 to 9 Unit Apartments | 729 | 1.8% |
| 10 or more Apartments | 683 | 1.7% |
| Mobile Home / Other | 13,257 | 32.3% |
| Total | 41,049 | 100.0% |
Housing Structures by Occupancy in San Juan County
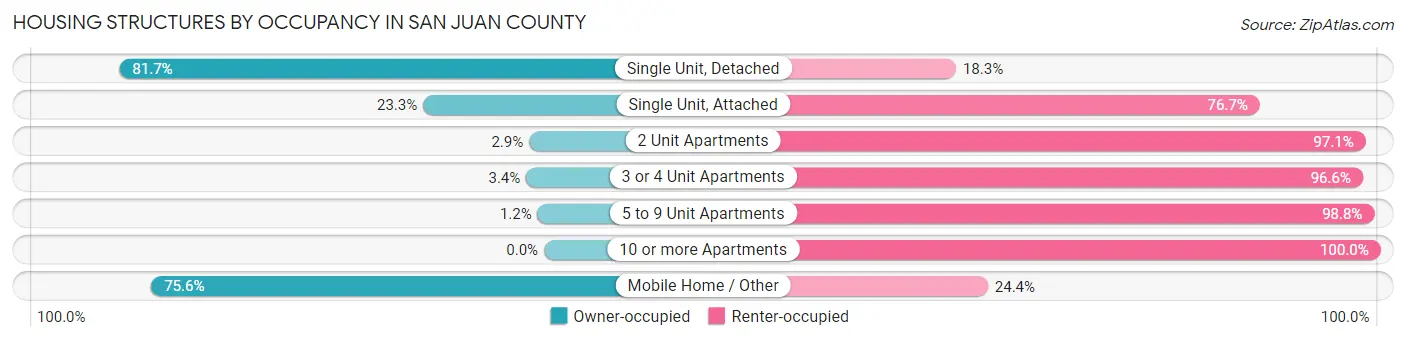
| Structure Type | Owner-occupied | Renter-occupied |
| Single Unit, Detached | 18,573 (81.7%) | 4,149 (18.3%) |
| Single Unit, Attached | 179 (23.3%) | 590 (76.7%) |
| 2 Unit Apartments | 27 (2.9%) | 913 (97.1%) |
| 3 or 4 Unit Apartments | 67 (3.4%) | 1,882 (96.6%) |
| 5 to 9 Unit Apartments | 9 (1.2%) | 720 (98.8%) |
| 10 or more Apartments | 0 (0.0%) | 683 (100.0%) |
| Mobile Home / Other | 10,023 (75.6%) | 3,234 (24.4%) |
| Total | 28,878 (70.4%) | 12,171 (29.6%) |
Housing Structures by Number of Rooms in San Juan County
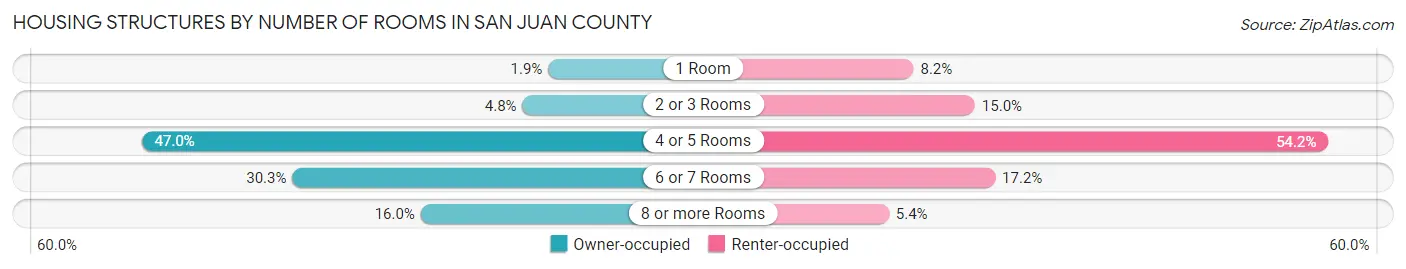
| Number of Rooms | Owner-occupied | Renter-occupied |
| 1 Room | 546 (1.9%) | 994 (8.2%) |
| 2 or 3 Rooms | 1,372 (4.8%) | 1,823 (15.0%) |
| 4 or 5 Rooms | 13,580 (47.0%) | 6,596 (54.2%) |
| 6 or 7 Rooms | 8,747 (30.3%) | 2,097 (17.2%) |
| 8 or more Rooms | 4,633 (16.0%) | 661 (5.4%) |
| Total | 28,878 (100.0%) | 12,171 (100.0%) |
Housing Structure by Heating Type in San Juan County
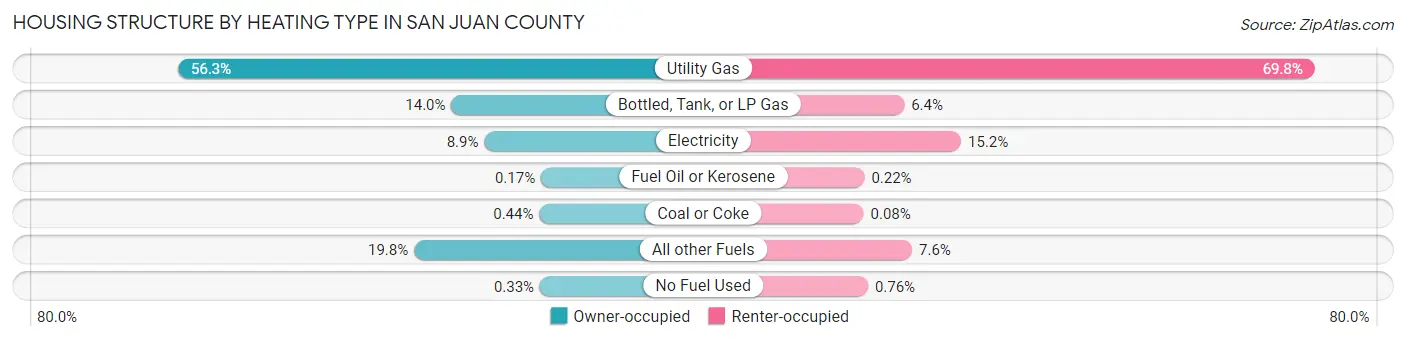
| Heating Type | Owner-occupied | Renter-occupied |
| Utility Gas | 16,259 (56.3%) | 8,498 (69.8%) |
| Bottled, Tank, or LP Gas | 4,053 (14.0%) | 775 (6.4%) |
| Electricity | 2,580 (8.9%) | 1,845 (15.2%) |
| Fuel Oil or Kerosene | 50 (0.2%) | 27 (0.2%) |
| Coal or Coke | 127 (0.4%) | 10 (0.1%) |
| All other Fuels | 5,714 (19.8%) | 923 (7.6%) |
| No Fuel Used | 95 (0.3%) | 93 (0.8%) |
| Total | 28,878 (100.0%) | 12,171 (100.0%) |
Household Vehicle Usage in San Juan County
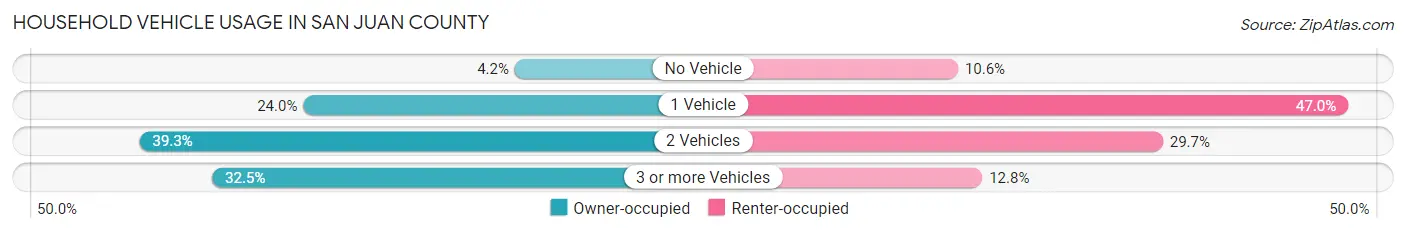
| Vehicles per Household | Owner-occupied | Renter-occupied |
| No Vehicle | 1,223 (4.2%) | 1,284 (10.5%) |
| 1 Vehicle | 6,928 (24.0%) | 5,716 (47.0%) |
| 2 Vehicles | 11,344 (39.3%) | 3,611 (29.7%) |
| 3 or more Vehicles | 9,383 (32.5%) | 1,560 (12.8%) |
| Total | 28,878 (100.0%) | 12,171 (100.0%) |
Real Estate & Mortgages in San Juan County
Real Estate and Mortgage Overview in San Juan County
| Characteristic | Without Mortgage | With Mortgage |
| Housing Units | 16,141 | 12,737 |
| Median Property Value | $122,000 | $211,200 |
| Median Household Income | $43,688 | $2,401 |
| Monthly Housing Costs | $395 | $488 |
| Real Estate Taxes | $930 | $1,106 |
Property Value by Mortgage Status in San Juan County
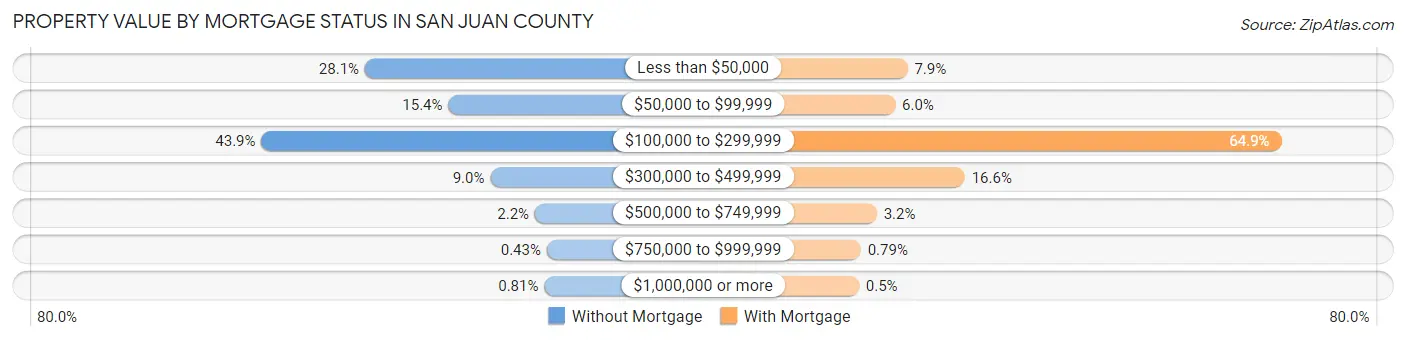
| Property Value | Without Mortgage | With Mortgage |
| Less than $50,000 | 4,542 (28.1%) | 1,007 (7.9%) |
| $50,000 to $99,999 | 2,490 (15.4%) | 768 (6.0%) |
| $100,000 to $299,999 | 7,089 (43.9%) | 8,265 (64.9%) |
| $300,000 to $499,999 | 1,459 (9.0%) | 2,120 (16.6%) |
| $500,000 to $749,999 | 362 (2.2%) | 412 (3.2%) |
| $750,000 to $999,999 | 69 (0.4%) | 101 (0.8%) |
| $1,000,000 or more | 130 (0.8%) | 64 (0.5%) |
| Total | 16,141 (100.0%) | 12,737 (100.0%) |
Household Income by Mortgage Status in San Juan County
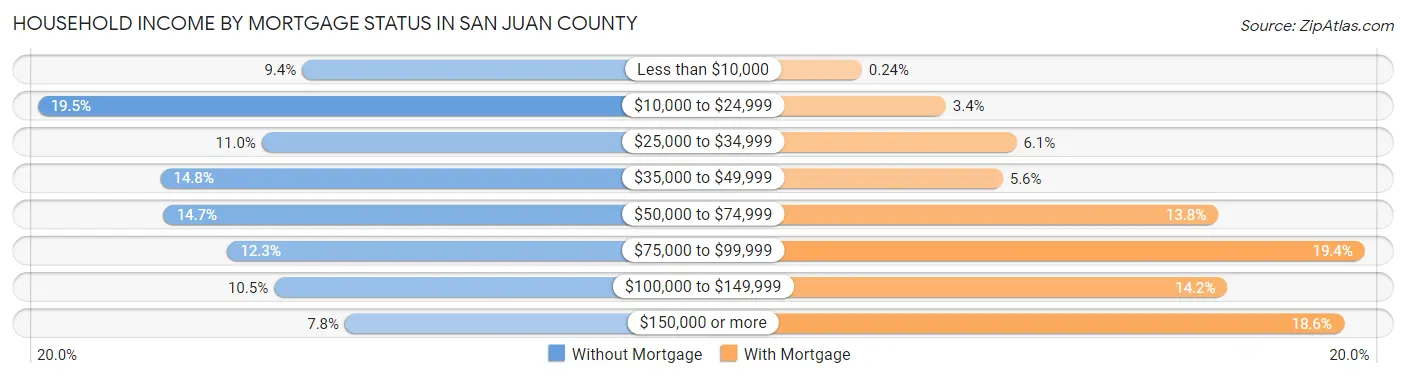
| Household Income | Without Mortgage | With Mortgage |
| Less than $10,000 | 1,522 (9.4%) | 30 (0.2%) |
| $10,000 to $24,999 | 3,148 (19.5%) | 438 (3.4%) |
| $25,000 to $34,999 | 1,771 (11.0%) | 781 (6.1%) |
| $35,000 to $49,999 | 2,392 (14.8%) | 714 (5.6%) |
| $50,000 to $74,999 | 2,373 (14.7%) | 1,759 (13.8%) |
| $75,000 to $99,999 | 1,981 (12.3%) | 2,471 (19.4%) |
| $100,000 to $149,999 | 1,695 (10.5%) | 1,804 (14.2%) |
| $150,000 or more | 1,259 (7.8%) | 2,369 (18.6%) |
| Total | 16,141 (100.0%) | 12,737 (100.0%) |
Property Value to Household Income Ratio in San Juan County
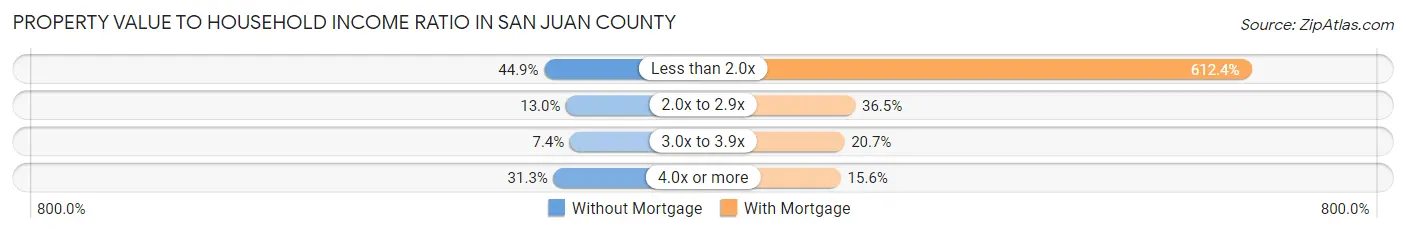
| Value-to-Income Ratio | Without Mortgage | With Mortgage |
| Less than 2.0x | 7,242 (44.9%) | 77,999 (612.4%) |
| 2.0x to 2.9x | 2,094 (13.0%) | 4,642 (36.4%) |
| 3.0x to 3.9x | 1,192 (7.4%) | 2,639 (20.7%) |
| 4.0x or more | 5,056 (31.3%) | 1,989 (15.6%) |
| Total | 16,141 (100.0%) | 12,737 (100.0%) |
Real Estate Taxes by Mortgage Status in San Juan County
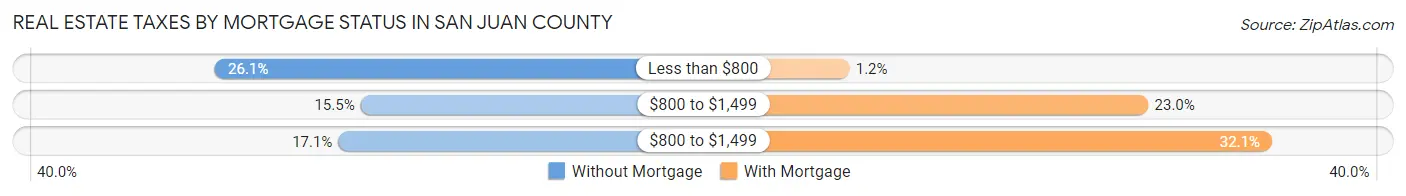
| Property Taxes | Without Mortgage | With Mortgage |
| Less than $800 | 4,210 (26.1%) | 147 (1.1%) |
| $800 to $1,499 | 2,495 (15.5%) | 2,927 (23.0%) |
| $800 to $1,499 | 2,758 (17.1%) | 4,084 (32.1%) |
| Total | 16,141 (100.0%) | 12,737 (100.0%) |
Health & Disability in San Juan County
Health Insurance Coverage by Age in San Juan County
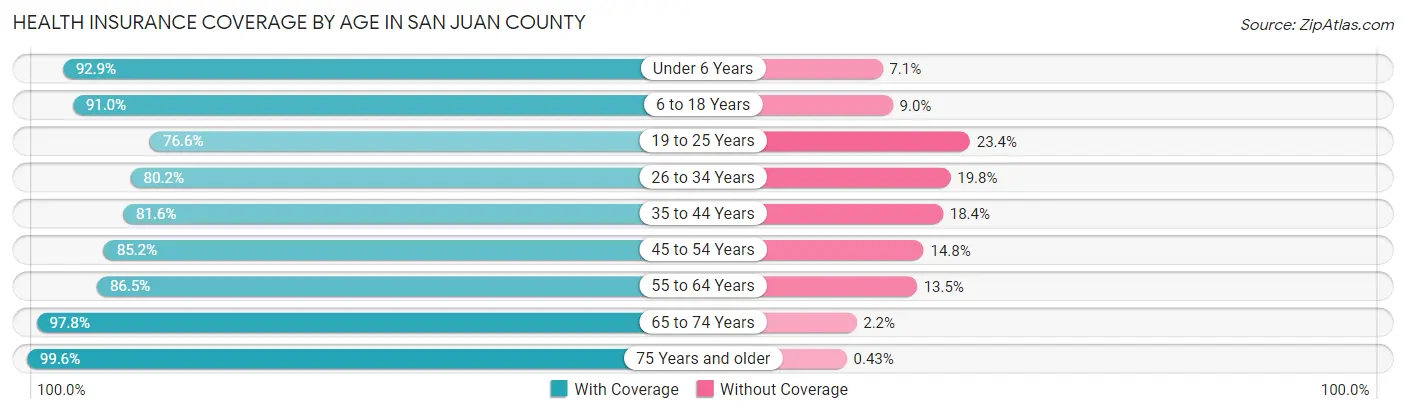
| Age Bracket | With Coverage | Without Coverage |
| Under 6 Years | 8,234 (92.9%) | 630 (7.1%) |
| 6 to 18 Years | 21,913 (91.0%) | 2,168 (9.0%) |
| 19 to 25 Years | 7,900 (76.6%) | 2,413 (23.4%) |
| 26 to 34 Years | 11,474 (80.2%) | 2,827 (19.8%) |
| 35 to 44 Years | 12,699 (81.6%) | 2,858 (18.4%) |
| 45 to 54 Years | 11,246 (85.2%) | 1,950 (14.8%) |
| 55 to 64 Years | 13,445 (86.5%) | 2,098 (13.5%) |
| 65 to 74 Years | 11,213 (97.8%) | 256 (2.2%) |
| 75 Years and older | 7,227 (99.6%) | 31 (0.4%) |
| Total | 105,351 (87.4%) | 15,231 (12.6%) |
Health Insurance Coverage by Citizenship Status in San Juan County
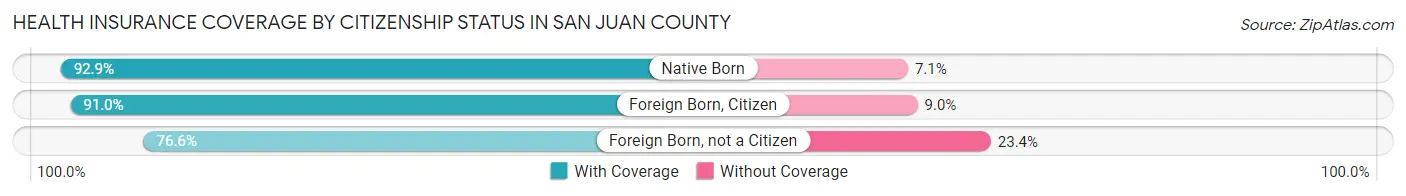
| Citizenship Status | With Coverage | Without Coverage |
| Native Born | 8,234 (92.9%) | 630 (7.1%) |
| Foreign Born, Citizen | 21,913 (91.0%) | 2,168 (9.0%) |
| Foreign Born, not a Citizen | 7,900 (76.6%) | 2,413 (23.4%) |
Health Insurance Coverage by Household Income in San Juan County
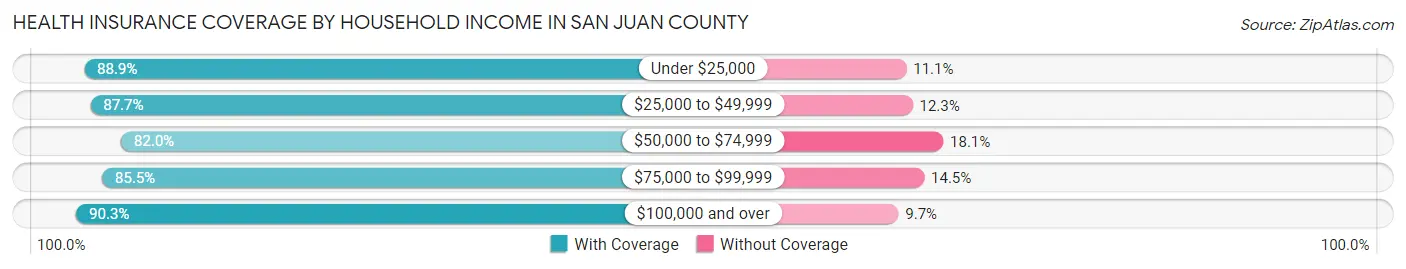
| Household Income | With Coverage | Without Coverage |
| Under $25,000 | 20,526 (88.9%) | 2,574 (11.1%) |
| $25,000 to $49,999 | 25,338 (87.7%) | 3,557 (12.3%) |
| $50,000 to $74,999 | 16,983 (82.0%) | 3,741 (18.0%) |
| $75,000 to $99,999 | 13,912 (85.5%) | 2,358 (14.5%) |
| $100,000 and over | 28,062 (90.3%) | 3,001 (9.7%) |
Public vs Private Health Insurance Coverage by Age in San Juan County
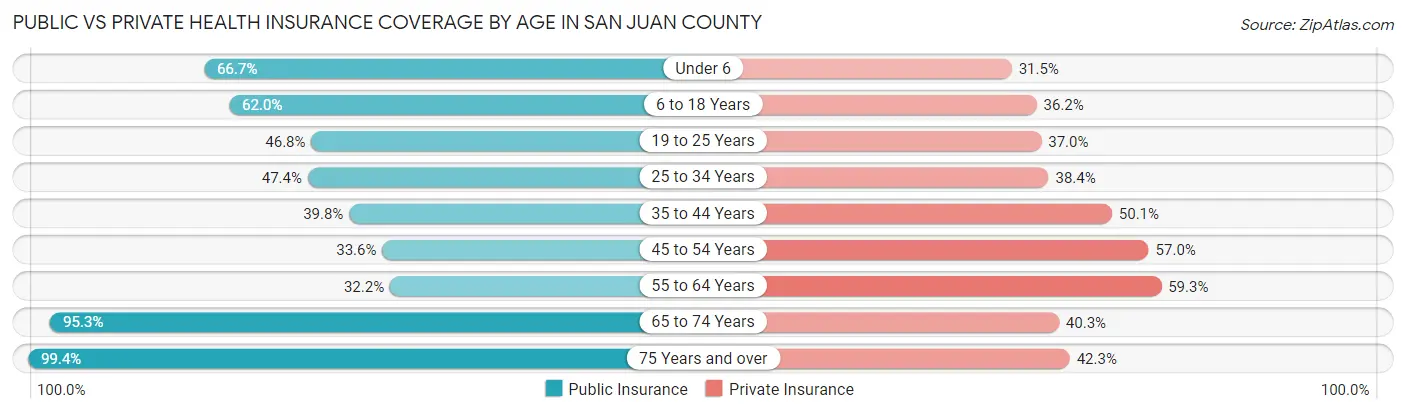
| Age Bracket | Public Insurance | Private Insurance |
| Under 6 | 5,912 (66.7%) | 2,796 (31.5%) |
| 6 to 18 Years | 14,941 (62.0%) | 8,706 (36.1%) |
| 19 to 25 Years | 4,823 (46.8%) | 3,819 (37.0%) |
| 25 to 34 Years | 6,784 (47.4%) | 5,489 (38.4%) |
| 35 to 44 Years | 6,184 (39.8%) | 7,799 (50.1%) |
| 45 to 54 Years | 4,435 (33.6%) | 7,516 (57.0%) |
| 55 to 64 Years | 5,001 (32.2%) | 9,216 (59.3%) |
| 65 to 74 Years | 10,928 (95.3%) | 4,622 (40.3%) |
| 75 Years and over | 7,212 (99.4%) | 3,071 (42.3%) |
| Total | 66,220 (54.9%) | 53,034 (44.0%) |
Disability Status by Sex by Age in San Juan County
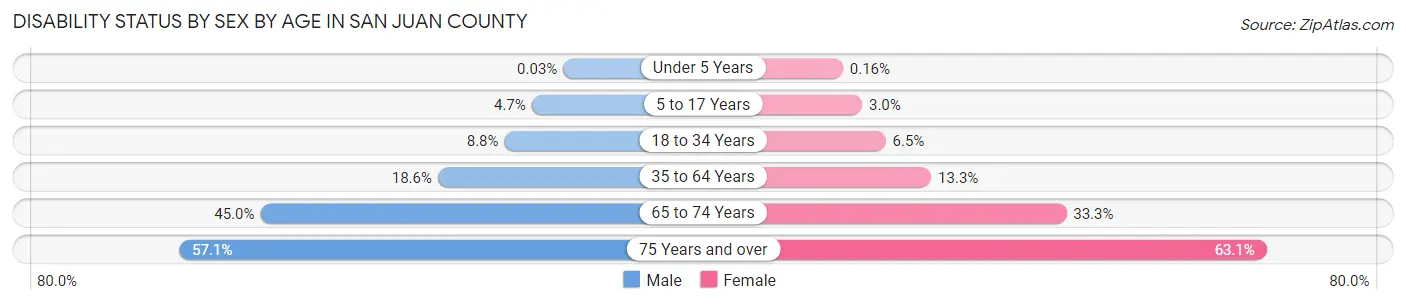
| Age Bracket | Male | Female |
| Under 5 Years | 1 (0.0%) | 6 (0.2%) |
| 5 to 17 Years | 572 (4.7%) | 358 (3.0%) |
| 18 to 34 Years | 1,151 (8.8%) | 849 (6.5%) |
| 35 to 64 Years | 4,125 (18.6%) | 2,941 (13.3%) |
| 65 to 74 Years | 2,481 (45.0%) | 1,985 (33.3%) |
| 75 Years and over | 1,725 (57.1%) | 2,672 (63.1%) |
Disability Class by Sex by Age in San Juan County
Disability Class: Hearing Difficulty
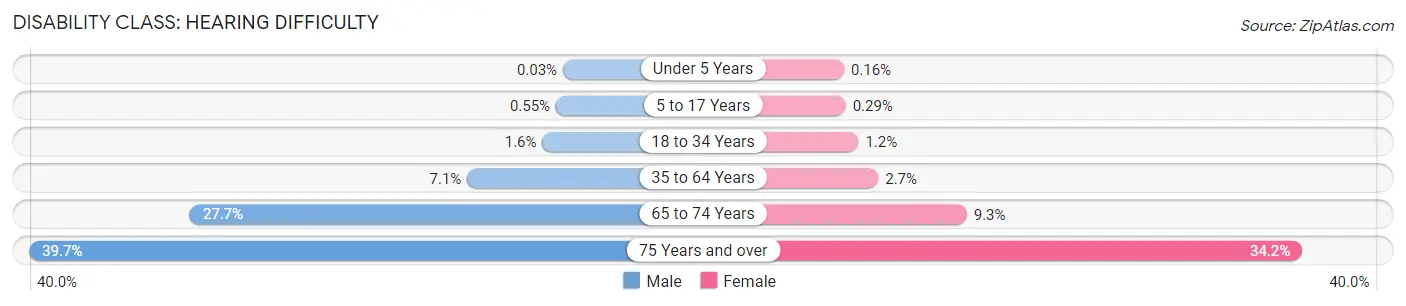
| Age Bracket | Male | Female |
| Under 5 Years | 1 (0.0%) | 6 (0.2%) |
| 5 to 17 Years | 67 (0.5%) | 35 (0.3%) |
| 18 to 34 Years | 205 (1.6%) | 162 (1.2%) |
| 35 to 64 Years | 1,580 (7.1%) | 600 (2.7%) |
| 65 to 74 Years | 1,529 (27.7%) | 553 (9.3%) |
| 75 Years and over | 1,199 (39.7%) | 1,447 (34.2%) |
Disability Class: Vision Difficulty
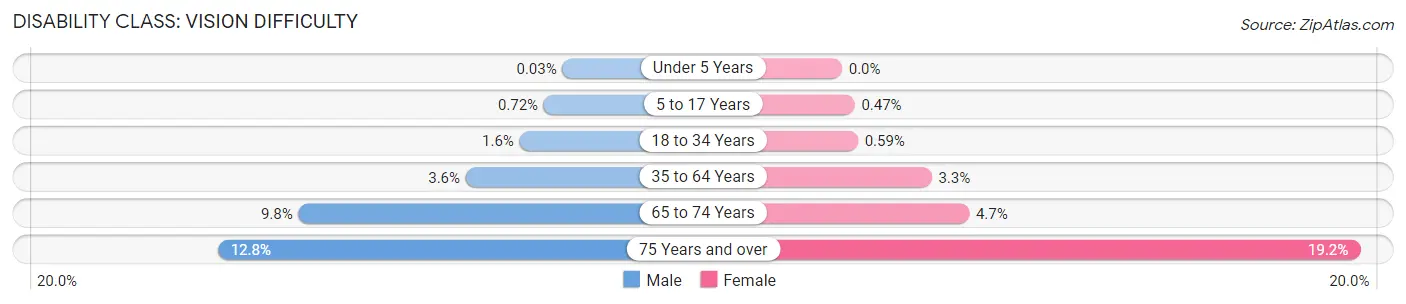
| Age Bracket | Male | Female |
| Under 5 Years | 1 (0.0%) | 0 (0.0%) |
| 5 to 17 Years | 87 (0.7%) | 56 (0.5%) |
| 18 to 34 Years | 213 (1.6%) | 77 (0.6%) |
| 35 to 64 Years | 800 (3.6%) | 738 (3.3%) |
| 65 to 74 Years | 542 (9.8%) | 281 (4.7%) |
| 75 Years and over | 388 (12.8%) | 815 (19.2%) |
Disability Class: Cognitive Difficulty
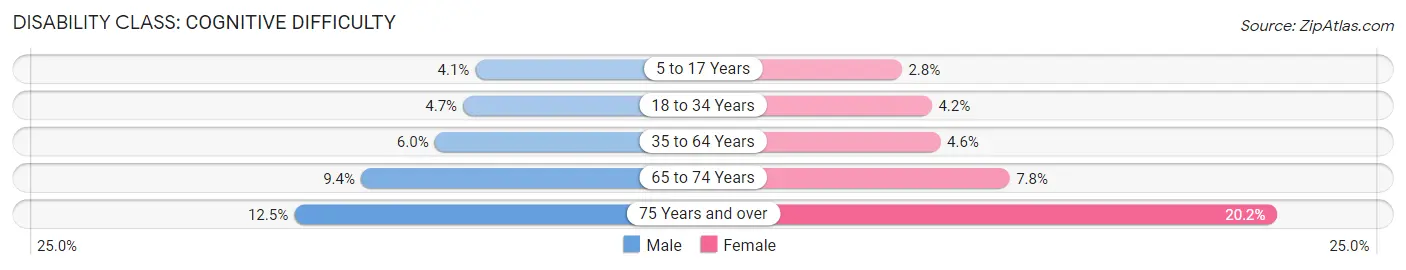
| Age Bracket | Male | Female |
| 5 to 17 Years | 497 (4.1%) | 330 (2.8%) |
| 18 to 34 Years | 613 (4.7%) | 543 (4.2%) |
| 35 to 64 Years | 1,324 (6.0%) | 1,010 (4.6%) |
| 65 to 74 Years | 518 (9.4%) | 463 (7.8%) |
| 75 Years and over | 378 (12.5%) | 856 (20.2%) |
Disability Class: Ambulatory Difficulty
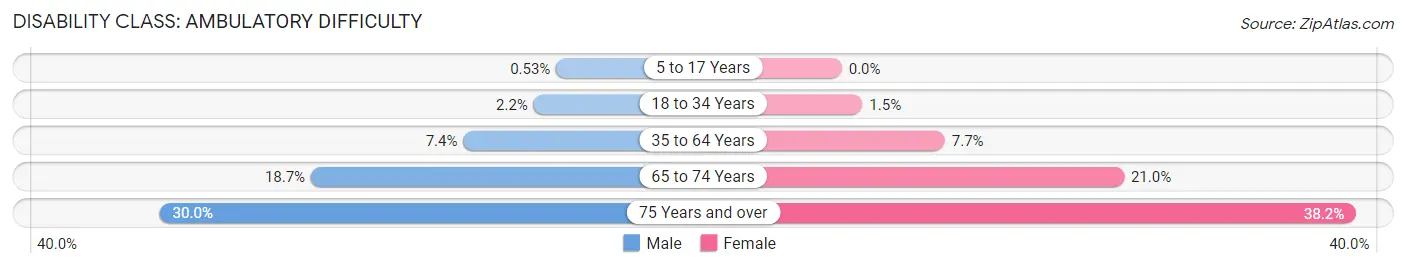
| Age Bracket | Male | Female |
| 5 to 17 Years | 64 (0.5%) | 0 (0.0%) |
| 18 to 34 Years | 289 (2.2%) | 200 (1.5%) |
| 35 to 64 Years | 1,644 (7.4%) | 1,695 (7.6%) |
| 65 to 74 Years | 1,033 (18.7%) | 1,248 (20.9%) |
| 75 Years and over | 906 (30.0%) | 1,617 (38.2%) |
Disability Class: Self-Care Difficulty
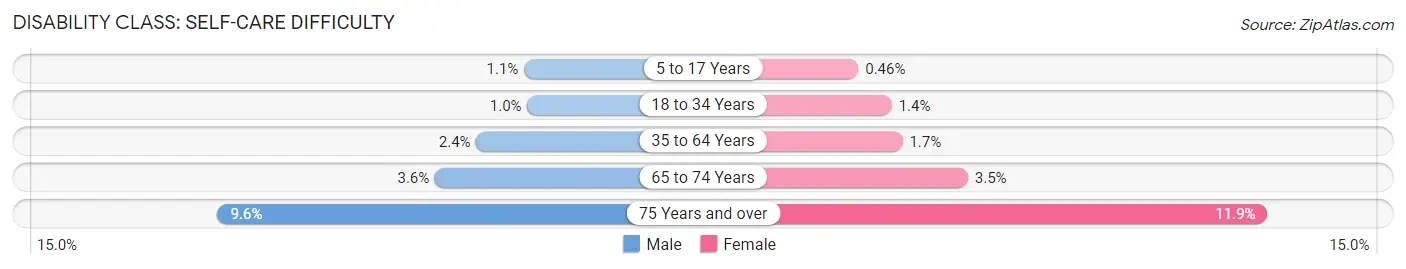
| Age Bracket | Male | Female |
| 5 to 17 Years | 132 (1.1%) | 55 (0.5%) |
| 18 to 34 Years | 131 (1.0%) | 182 (1.4%) |
| 35 to 64 Years | 536 (2.4%) | 375 (1.7%) |
| 65 to 74 Years | 197 (3.6%) | 209 (3.5%) |
| 75 Years and over | 291 (9.6%) | 502 (11.8%) |
Technology Access in San Juan County
Computing Device Access in San Juan County
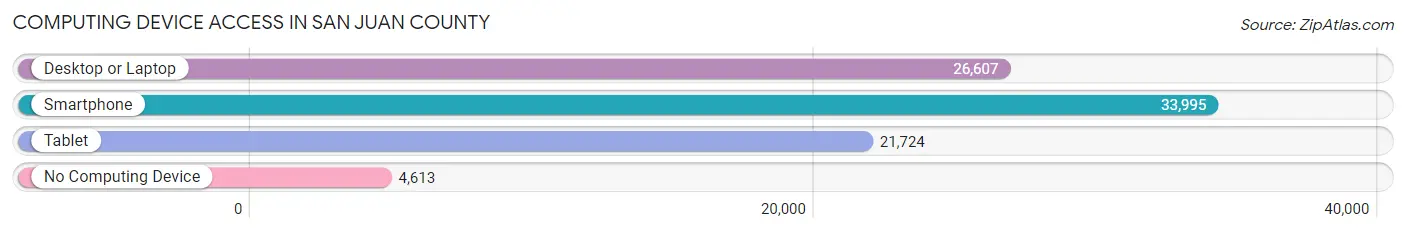
| Device Type | # Households | % Households |
| Desktop or Laptop | 26,607 | 64.8% |
| Smartphone | 33,995 | 82.8% |
| Tablet | 21,724 | 52.9% |
| No Computing Device | 4,613 | 11.2% |
| Total | 41,049 | 100.0% |
Internet Access in San Juan County
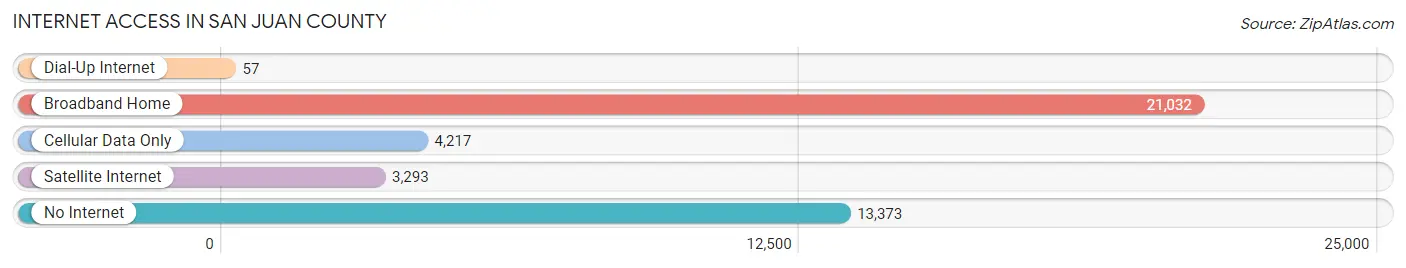
| Internet Type | # Households | % Households |
| Dial-Up Internet | 57 | 0.1% |
| Broadband Home | 21,032 | 51.2% |
| Cellular Data Only | 4,217 | 10.3% |
| Satellite Internet | 3,293 | 8.0% |
| No Internet | 13,373 | 32.6% |
| Total | 41,049 | 100.0% |
San Juan County Summary
San Juan County is located in the northwestern corner of New Mexico and is the largest county in the state. It is bordered by Colorado to the north, Arizona to the west, and the Navajo Nation to the east. The county seat is Aztec, and the largest city is Farmington. The county was established in 1887 and is named after the San Juan River, which flows through the county.
Geography
San Juan County covers an area of 5,538 square miles, making it the largest county in New Mexico. The county is located in the Four Corners region of the state, and is bordered by Colorado to the north, Arizona to the west, and the Navajo Nation to the east. The county is divided into two distinct regions: the high desert of the northwest and the low desert of the southeast. The northwest is characterized by high mesas, deep canyons, and rugged terrain, while the southeast is characterized by flat plains and rolling hills. The county is home to several national parks and monuments, including Chaco Culture National Historical Park, Aztec Ruins National Monument, and the Bisti/De-Na-Zin Wilderness.
Economy
San Juan County is an important economic center in the Four Corners region. The county’s economy is largely based on agriculture, energy production, and tourism. Agriculture is the largest sector of the economy, with crops such as alfalfa, hay, and wheat being grown in the county. Energy production is also an important part of the economy, with oil and natural gas being extracted from the county’s many oil and gas fields. Tourism is also an important part of the economy, with visitors coming to the county to visit its many national parks and monuments.
Demographics
As of the 2010 census, San Juan County had a population of 130,044. The population is largely Native American, with the Navajo Nation making up the largest ethnic group in the county. Other ethnic groups include Hispanic, White, and African American. The median household income in the county is $41,945, and the median home value is $133,400.
History
San Juan County was established in 1887 and is named after the San Juan River, which flows through the county. The county was originally inhabited by the Navajo, Ute, and Pueblo tribes, and was later settled by Spanish colonists in the late 1700s. The county was an important center of trade and commerce in the Four Corners region, and was home to several important trading posts. In the late 1800s, the county was opened up to homesteaders, and the population began to grow. The county was also an important center of mining and energy production, with oil and natural gas being extracted from the county’s many oil and gas fields. Today, San Juan County is an important economic center in the Four Corners region, with agriculture, energy production, and tourism being the main drivers of the economy.
Common Questions
What is Per Capita Income in San Juan County?
Per Capita income in San Juan County is $25,008.
What is the Median Family Income in San Juan County?
Median Family Income in San Juan County is $58,247.
What is the Median Household income in San Juan County?
Median Household Income in San Juan County is $50,734.
What is Income or Wage Gap in San Juan County?
Income or Wage Gap in San Juan County is 33.9%.
Women in San Juan County earn 66.1 cents for every dollar earned by a man.
What is Family Income Deficit in San Juan County?
Family Income Deficit in San Juan County is $13,055.
Families that are below poverty line in San Juan County earn $13,055 less on average than the poverty threshold level.
What is Inequality or Gini Index in San Juan County?
Inequality or Gini Index in San Juan County is 0.47.
What is the Total Population of San Juan County?
Total Population of San Juan County is 121,798.
What is the Total Male Population of San Juan County?
Total Male Population of San Juan County is 60,435.
What is the Total Female Population of San Juan County?
Total Female Population of San Juan County is 61,363.
What is the Ratio of Males per 100 Females in San Juan County?
There are 98.49 Males per 100 Females in San Juan County.
What is the Ratio of Females per 100 Males in San Juan County?
There are 101.54 Females per 100 Males in San Juan County.
What is the Median Population Age in San Juan County?
Median Population Age in San Juan County is 36.8 Years.
What is the Average Family Size in San Juan County
Average Family Size in San Juan County is 3.5 People.
What is the Average Household Size in San Juan County
Average Household Size in San Juan County is 2.9 People.
How Large is the Labor Force in San Juan County?
There are 50,089 People in the Labor Forcein in San Juan County.
What is the Percentage of People in the Labor Force in San Juan County?
53.0% of People are in the Labor Force in San Juan County.
What is the Unemployment Rate in San Juan County?
Unemployment Rate in San Juan County is 8.9%.