Quay County, NM Map & Demographics
Quay County Map
Quay County Overview
$25,348
PER CAPITA INCOME
$49,970
AVG FAMILY INCOME
$38,998
AVG HOUSEHOLD INCOME
16.3%
WAGE / INCOME GAP [ % ]
83.7¢/ $1
WAGE / INCOME GAP [ $ ]
0.46
INEQUALITY / GINI INDEX
8,641
TOTAL POPULATION
4,206
MALE POPULATION
4,435
FEMALE POPULATION
94.84
MALES / 100 FEMALES
105.44
FEMALES / 100 MALES
46.6
MEDIAN AGE
3.2
AVG FAMILY SIZE
2.3
AVG HOUSEHOLD SIZE
3,658
LABOR FORCE [ PEOPLE ]
52.9%
PERCENT IN LABOR FORCE
4.8%
UNEMPLOYMENT RATE
Quay County Area Codes
Income in Quay County
Income Overview in Quay County
Per Capita Income in Quay County is $25,348, while median incomes of families and households are $49,970 and $38,998 respectively.
| Characteristic | Number | Measure |
| Per Capita Income | 8,641 | $25,348 |
| Median Family Income | 1,875 | $49,970 |
| Mean Family Income | 1,875 | $68,544 |
| Median Household Income | 3,757 | $38,998 |
| Mean Household Income | 3,757 | $53,058 |
| Income Deficit | 1,875 | $0 |
| Wage / Income Gap (%) | 8,641 | 16.32% |
| Wage / Income Gap ($) | 8,641 | 83.68¢ per $1 |
| Gini / Inequality Index | 8,641 | 0.46 |
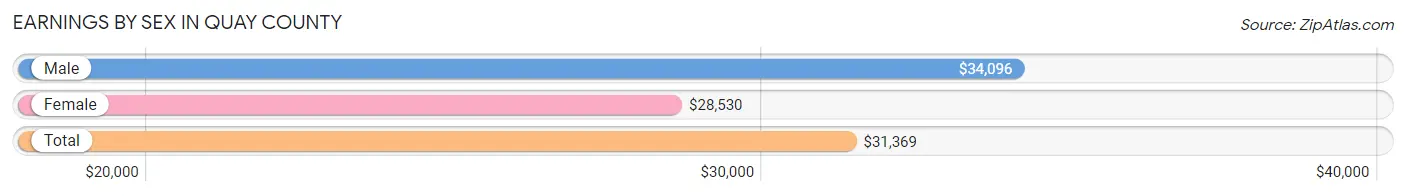
Earnings by Sex in Quay County
Average Earnings in Quay County are $31,369, $34,096 for men and $28,530 for women, a difference of 16.3%.
| Sex | Number | Average Earnings |
| Male | 2,005 (53.2%) | $34,096 |
| Female | 1,763 (46.8%) | $28,530 |
| Total | 3,768 (100.0%) | $31,369 |
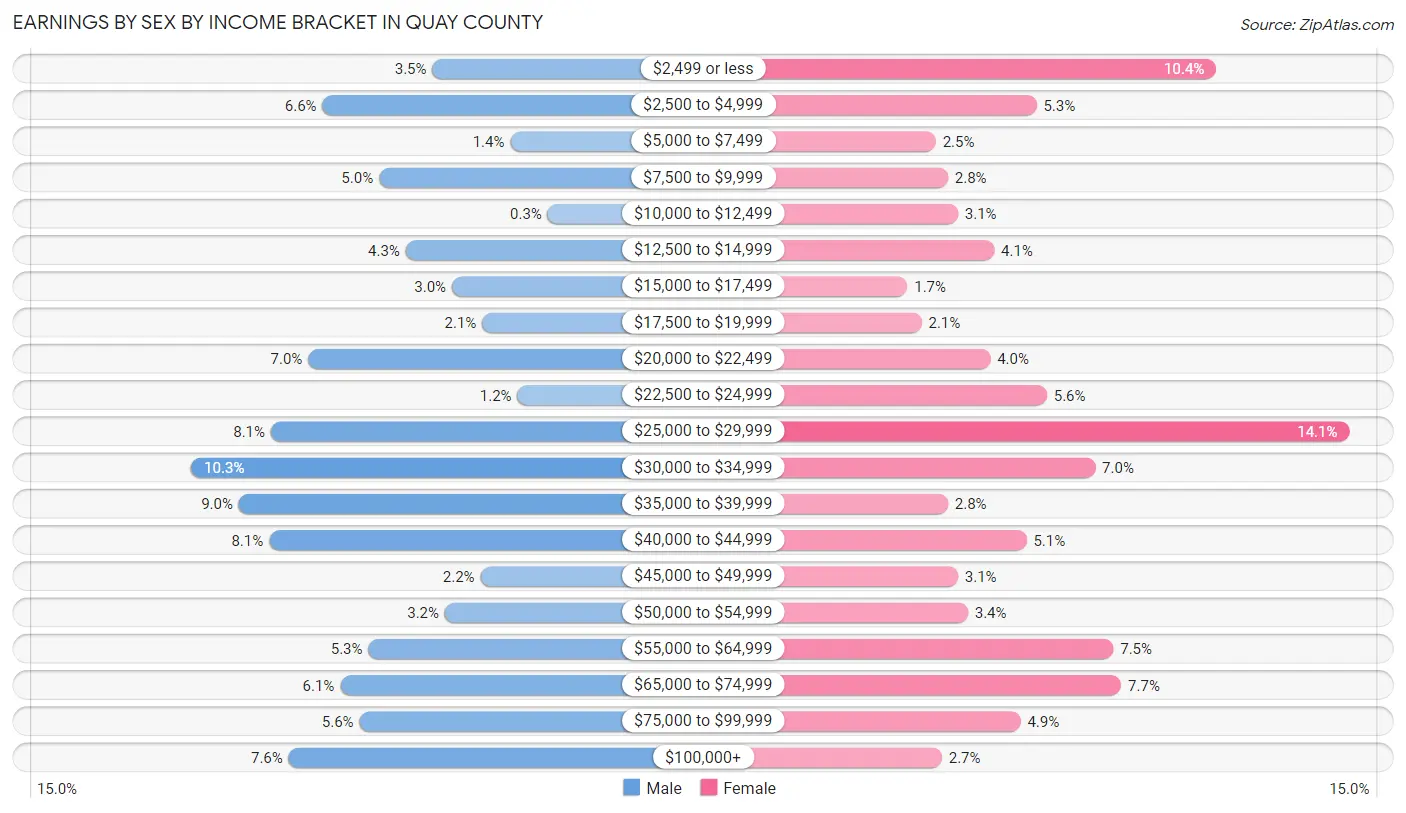
Earnings by Sex by Income Bracket in Quay County
The most common earnings brackets in Quay County are $30,000 to $34,999 for men (207 | 10.3%) and $25,000 to $29,999 for women (249 | 14.1%).
| Income | Male | Female |
| $2,499 or less | 71 (3.5%) | 183 (10.4%) |
| $2,500 to $4,999 | 133 (6.6%) | 94 (5.3%) |
| $5,000 to $7,499 | 27 (1.3%) | 44 (2.5%) |
| $7,500 to $9,999 | 101 (5.0%) | 50 (2.8%) |
| $10,000 to $12,499 | 6 (0.3%) | 55 (3.1%) |
| $12,500 to $14,999 | 86 (4.3%) | 73 (4.1%) |
| $15,000 to $17,499 | 60 (3.0%) | 30 (1.7%) |
| $17,500 to $19,999 | 43 (2.1%) | 37 (2.1%) |
| $20,000 to $22,499 | 141 (7.0%) | 71 (4.0%) |
| $22,500 to $24,999 | 23 (1.1%) | 99 (5.6%) |
| $25,000 to $29,999 | 162 (8.1%) | 249 (14.1%) |
| $30,000 to $34,999 | 207 (10.3%) | 123 (7.0%) |
| $35,000 to $39,999 | 180 (9.0%) | 50 (2.8%) |
| $40,000 to $44,999 | 163 (8.1%) | 89 (5.1%) |
| $45,000 to $49,999 | 44 (2.2%) | 55 (3.1%) |
| $50,000 to $54,999 | 64 (3.2%) | 60 (3.4%) |
| $55,000 to $64,999 | 107 (5.3%) | 132 (7.5%) |
| $65,000 to $74,999 | 123 (6.1%) | 136 (7.7%) |
| $75,000 to $99,999 | 112 (5.6%) | 86 (4.9%) |
| $100,000+ | 152 (7.6%) | 47 (2.7%) |
| Total | 2,005 (100.0%) | 1,763 (100.0%) |
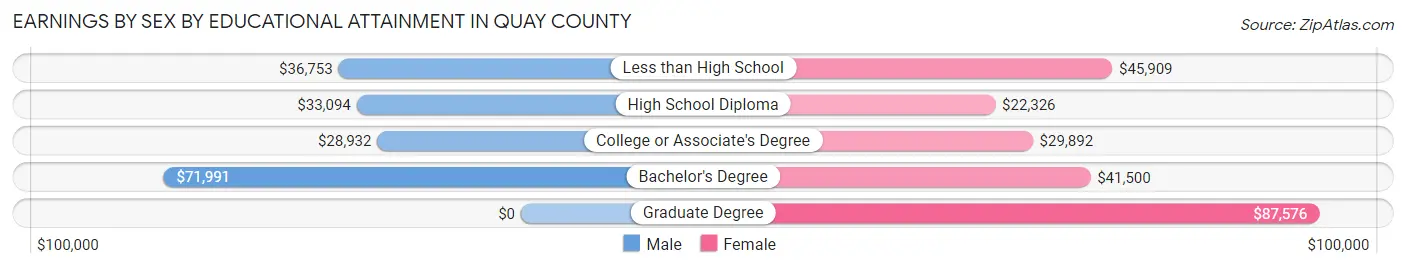
Earnings by Sex by Educational Attainment in Quay County
Average earnings in Quay County are $35,130 for men and $30,521 for women, a difference of 13.1%. Men with an educational attainment of bachelor's degree enjoy the highest average annual earnings of $71,991, while those with college or associate's degree education earn the least with $28,932. Women with an educational attainment of graduate degree earn the most with the average annual earnings of $87,576, while those with high school diploma education have the smallest earnings of $22,326.
| Educational Attainment | Male Income | Female Income |
| Less than High School | $36,753 | $45,909 |
| High School Diploma | $33,094 | $22,326 |
| College or Associate's Degree | $28,932 | $29,892 |
| Bachelor's Degree | $71,991 | $41,500 |
| Graduate Degree | - | - |
| Total | $35,130 | $30,521 |
Family Income in Quay County
Family Income Brackets in Quay County
According to the Quay County family income data, there are 300 families falling into the $35,000 to $49,999 income range, which is the most common income bracket and makes up 16.0% of all families. Conversely, the $200,000+ income bracket is the least frequent group with only 56 families (3.0%) belonging to this category.
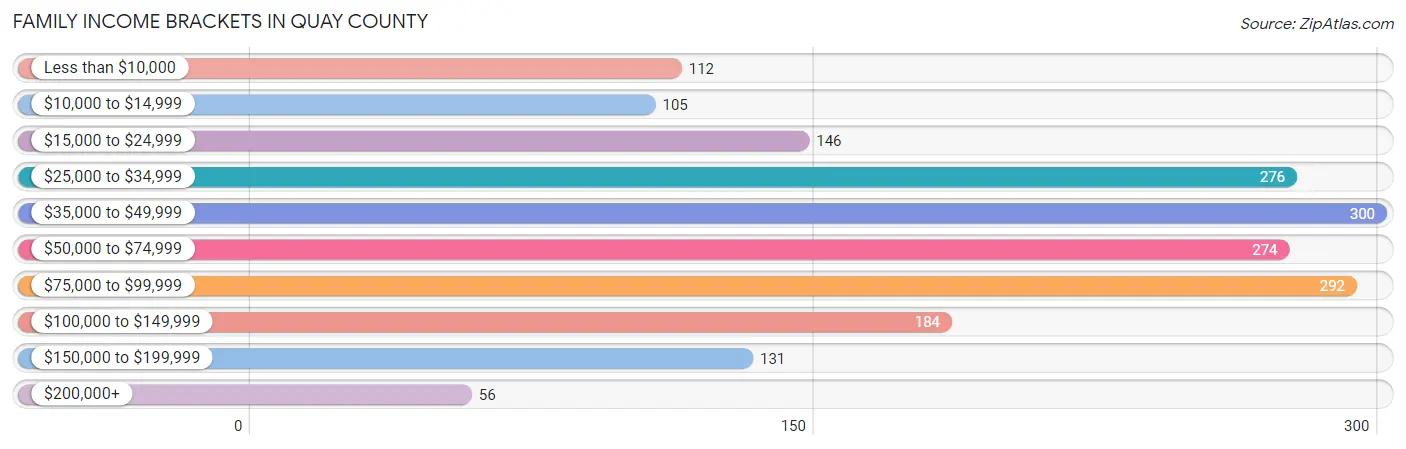
| Income Bracket | # Families | % Families |
| Less than $10,000 | 112 | 6.0% |
| $10,000 to $14,999 | 105 | 5.6% |
| $15,000 to $24,999 | 146 | 7.8% |
| $25,000 to $34,999 | 276 | 14.7% |
| $35,000 to $49,999 | 300 | 16.0% |
| $50,000 to $74,999 | 274 | 14.6% |
| $75,000 to $99,999 | 292 | 15.6% |
| $100,000 to $149,999 | 184 | 9.8% |
| $150,000 to $199,999 | 131 | 7.0% |
| $200,000+ | 56 | 3.0% |
Family Income by Famaliy Size in Quay County
3-person families (312 | 16.6%) account for the highest median family income in Quay County with $69,333 per family, while 2-person families (1,247 | 66.5%) have the highest median income of $26,654 per family member.
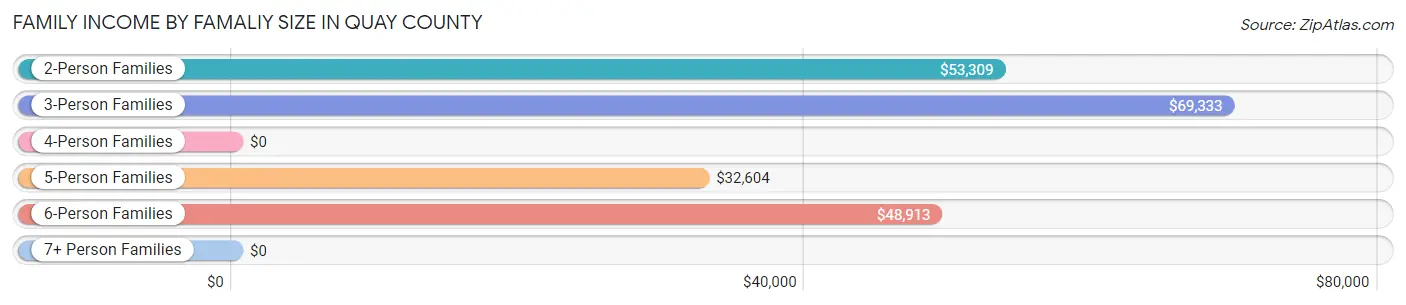
| Income Bracket | # Families | Median Income |
| 2-Person Families | 1,247 (66.5%) | $53,309 |
| 3-Person Families | 312 (16.6%) | $69,333 |
| 4-Person Families | 169 (9.0%) | $0 |
| 5-Person Families | 112 (6.0%) | $32,604 |
| 6-Person Families | 34 (1.8%) | $48,913 |
| 7+ Person Families | 1 (0.1%) | $0 |
| Total | 1,875 (100.0%) | $49,970 |
Family Income by Number of Earners in Quay County
The median family income in Quay County is $49,970, with families comprising 3+ earners (76) having the highest median family income of $115,769, while families with no earners (392) have the lowest median family income of $30,577, accounting for 4.1% and 20.9% of families, respectively.
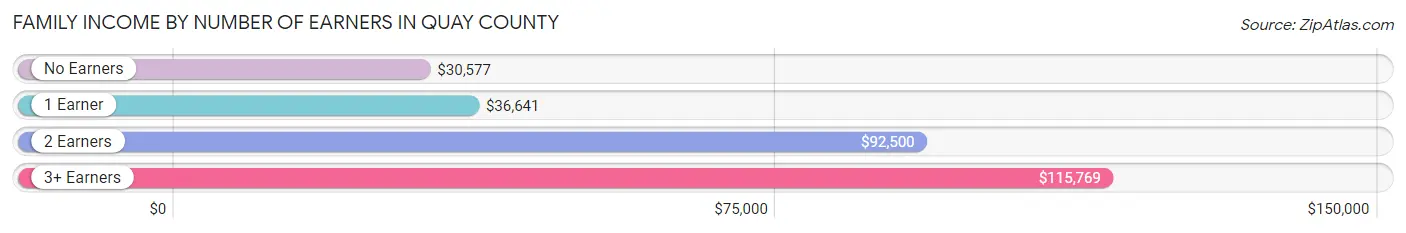
| Number of Earners | # Families | Median Income |
| No Earners | 392 (20.9%) | $30,577 |
| 1 Earner | 743 (39.6%) | $36,641 |
| 2 Earners | 664 (35.4%) | $92,500 |
| 3+ Earners | 76 (4.1%) | $115,769 |
| Total | 1,875 (100.0%) | $49,970 |
Household Income in Quay County
Household Income Brackets in Quay County
With 575 households falling in the category, the $35,000 to $49,999 income range is the most frequent in Quay County, accounting for 15.3% of all households. In contrast, only 79 households (2.1%) fall into the $200,000+ income bracket, making it the least populous group.
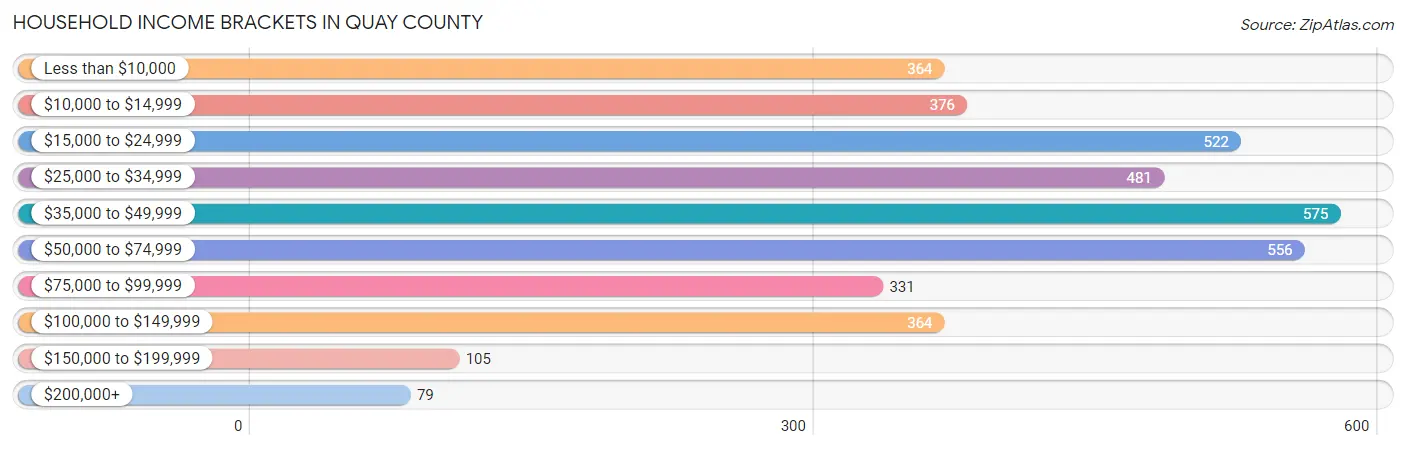
| Income Bracket | # Households | % Households |
| Less than $10,000 | 364 | 9.7% |
| $10,000 to $14,999 | 376 | 10.0% |
| $15,000 to $24,999 | 522 | 13.9% |
| $25,000 to $34,999 | 481 | 12.8% |
| $35,000 to $49,999 | 575 | 15.3% |
| $50,000 to $74,999 | 556 | 14.8% |
| $75,000 to $99,999 | 331 | 8.8% |
| $100,000 to $149,999 | 364 | 9.7% |
| $150,000 to $199,999 | 105 | 2.8% |
| $200,000+ | 79 | 2.1% |
Household Income by Householder Age in Quay County
The median household income in Quay County is $38,998, with the highest median household income of $53,315 found in the 45 to 64 years age bracket for the primary householder. A total of 1,249 households (33.2%) fall into this category. Meanwhile, the 15 to 24 years age bracket for the primary householder has the lowest median household income of $0, with 26 households (0.7%) in this group.
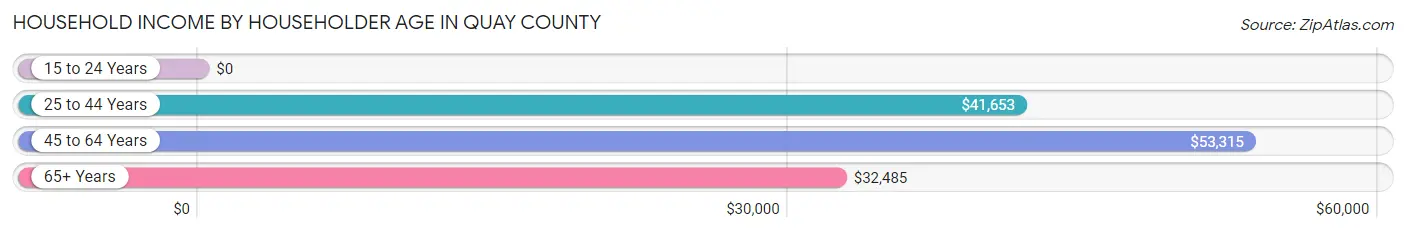
| Income Bracket | # Households | Median Income |
| 15 to 24 Years | 26 (0.7%) | $0 |
| 25 to 44 Years | 977 (26.0%) | $41,653 |
| 45 to 64 Years | 1,249 (33.2%) | $53,315 |
| 65+ Years | 1,505 (40.1%) | $32,485 |
| Total | 3,757 (100.0%) | $38,998 |
Poverty in Quay County
Income Below Poverty by Sex and Age in Quay County
With 21.4% poverty level for males and 28.2% for females among the residents of Quay County, 5 year old males and 15 year old females are the most vulnerable to poverty, with 47 males (74.6%) and 37 females (88.1%) in their respective age groups living below the poverty level.
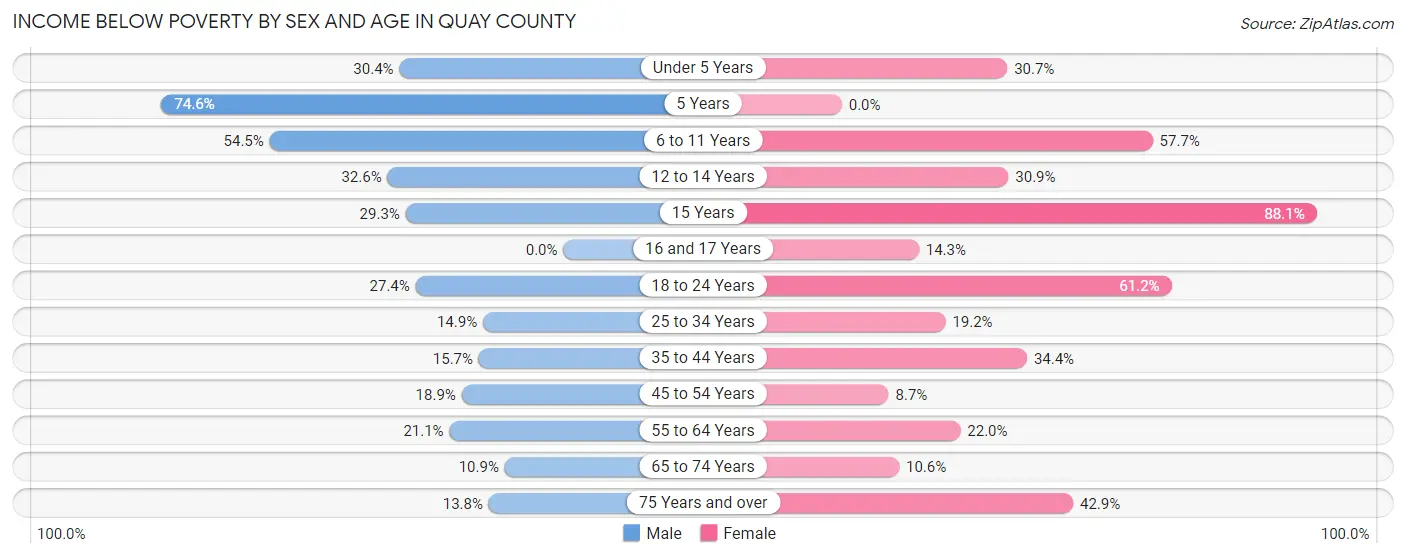
| Age Bracket | Male | Female |
| Under 5 Years | 7 (30.4%) | 66 (30.7%) |
| 5 Years | 47 (74.6%) | 0 (0.0%) |
| 6 to 11 Years | 205 (54.5%) | 206 (57.7%) |
| 12 to 14 Years | 63 (32.6%) | 64 (30.9%) |
| 15 Years | 12 (29.3%) | 37 (88.1%) |
| 16 and 17 Years | 0 (0.0%) | 7 (14.3%) |
| 18 to 24 Years | 34 (27.4%) | 145 (61.2%) |
| 25 to 34 Years | 57 (14.9%) | 96 (19.2%) |
| 35 to 44 Years | 98 (15.7%) | 144 (34.4%) |
| 45 to 54 Years | 91 (18.9%) | 40 (8.7%) |
| 55 to 64 Years | 133 (21.1%) | 151 (22.0%) |
| 65 to 74 Years | 67 (10.9%) | 69 (10.6%) |
| 75 Years and over | 58 (13.8%) | 197 (42.9%) |
| Total | 872 (21.4%) | 1,222 (28.2%) |
Income Above Poverty by Sex and Age in Quay County
According to the poverty statistics in Quay County, males aged 16 and 17 years and females aged 5 years are the age groups that are most secure financially, with 100.0% of males and 100.0% of females in these age groups living above the poverty line.
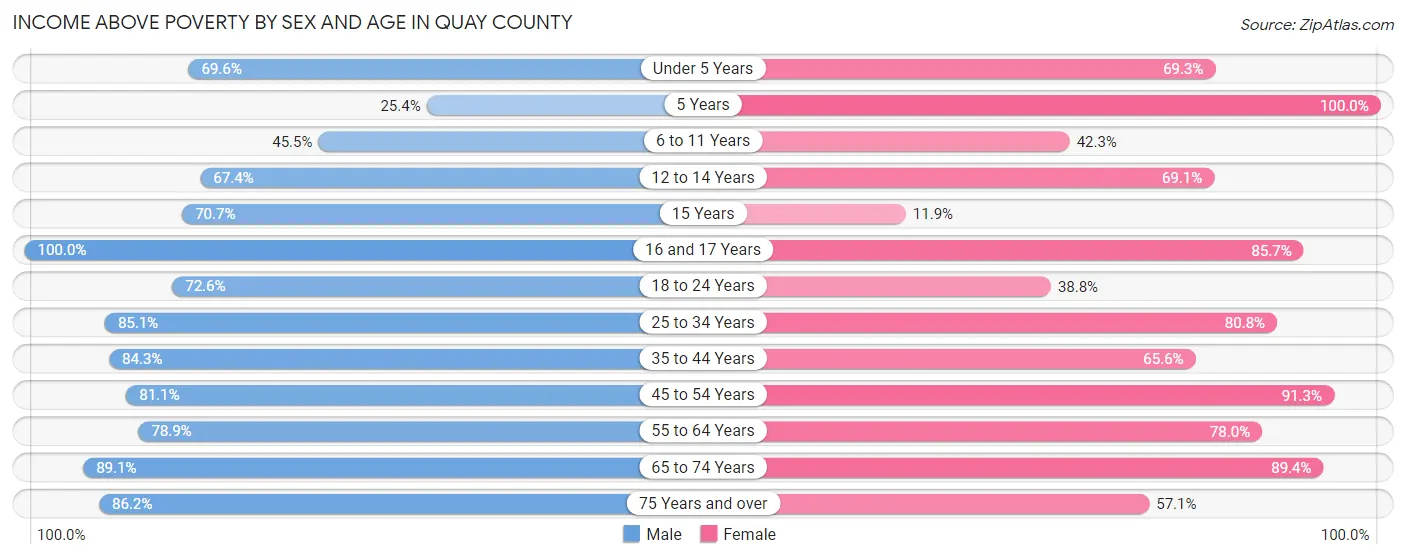
| Age Bracket | Male | Female |
| Under 5 Years | 16 (69.6%) | 149 (69.3%) |
| 5 Years | 16 (25.4%) | 56 (100.0%) |
| 6 to 11 Years | 171 (45.5%) | 151 (42.3%) |
| 12 to 14 Years | 130 (67.4%) | 143 (69.1%) |
| 15 Years | 29 (70.7%) | 5 (11.9%) |
| 16 and 17 Years | 103 (100.0%) | 42 (85.7%) |
| 18 to 24 Years | 90 (72.6%) | 92 (38.8%) |
| 25 to 34 Years | 325 (85.1%) | 403 (80.8%) |
| 35 to 44 Years | 527 (84.3%) | 275 (65.6%) |
| 45 to 54 Years | 391 (81.1%) | 421 (91.3%) |
| 55 to 64 Years | 496 (78.9%) | 535 (78.0%) |
| 65 to 74 Years | 549 (89.1%) | 581 (89.4%) |
| 75 Years and over | 361 (86.2%) | 262 (57.1%) |
| Total | 3,204 (78.6%) | 3,115 (71.8%) |
Income Below Poverty Among Married-Couple Families in Quay County
The poverty statistics for married-couple families in Quay County show that 12.2% or 149 of the total 1,224 families live below the poverty line. Families with 3 or 4 children have the highest poverty rate of 19.3%, comprising of 11 families. On the other hand, families with 1 or 2 children have the lowest poverty rate of 8.5%, which includes 20 families.
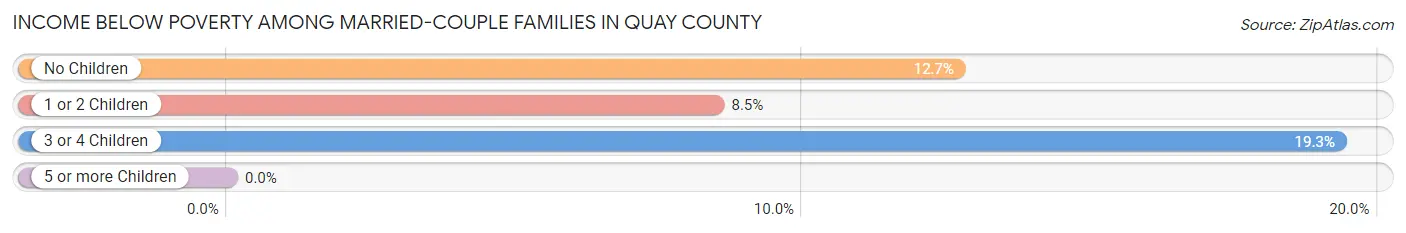
| Children | Above Poverty | Below Poverty |
| No Children | 813 (87.3%) | 118 (12.7%) |
| 1 or 2 Children | 216 (91.5%) | 20 (8.5%) |
| 3 or 4 Children | 46 (80.7%) | 11 (19.3%) |
| 5 or more Children | 0 (0.0%) | 0 (0.0%) |
| Total | 1,075 (87.8%) | 149 (12.2%) |
Income Below Poverty Among Single-Parent Households in Quay County
According to the poverty data in Quay County, 4.2% or 9 single-father households and 40.7% or 178 single-mother households are living below the poverty line. Among single-father households, those with 1 or 2 children have the highest poverty rate, with 4 households (16.7%) experiencing poverty. Likewise, among single-mother households, those with 3 or 4 children have the highest poverty rate, with 100 households (100.0%) falling below the poverty line.
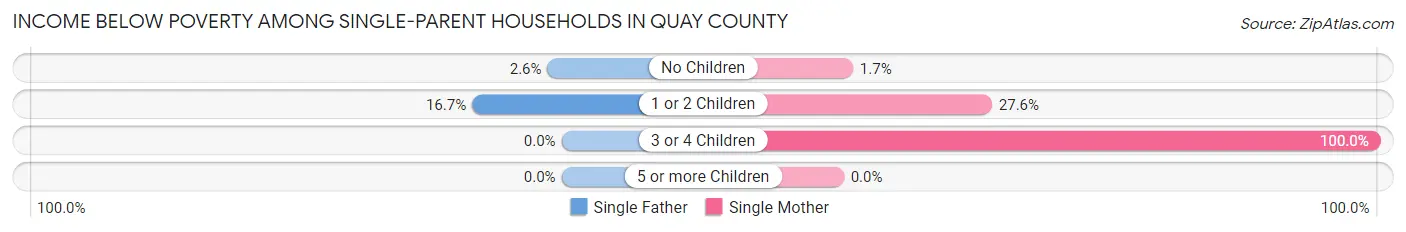
| Children | Single Father | Single Mother |
| No Children | 5 (2.6%) | 1 (1.7%) |
| 1 or 2 Children | 4 (16.7%) | 77 (27.6%) |
| 3 or 4 Children | 0 (0.0%) | 100 (100.0%) |
| 5 or more Children | 0 (0.0%) | 0 (0.0%) |
| Total | 9 (4.2%) | 178 (40.7%) |
Income Below Poverty Among Married-Couple vs Single-Parent Households in Quay County
The poverty data for Quay County shows that 149 of the married-couple family households (12.2%) and 187 of the single-parent households (28.7%) are living below the poverty level. Within the married-couple family households, those with 3 or 4 children have the highest poverty rate, with 11 households (19.3%) falling below the poverty line. Among the single-parent households, those with 3 or 4 children have the highest poverty rate, with 100 household (100.0%) living below poverty.
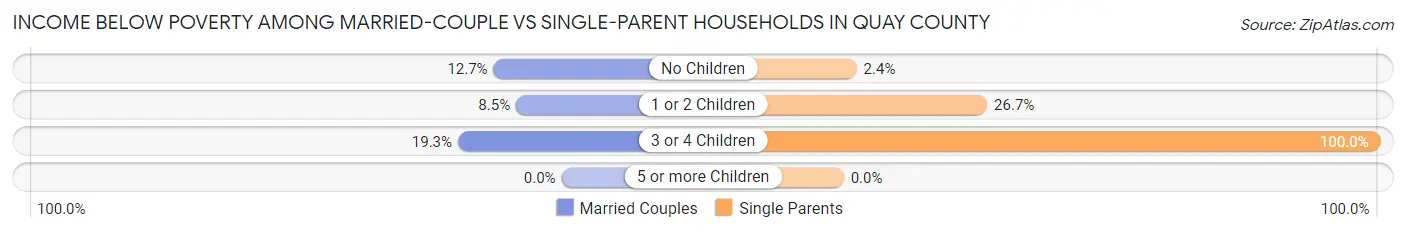
| Children | Married-Couple Families | Single-Parent Households |
| No Children | 118 (12.7%) | 6 (2.4%) |
| 1 or 2 Children | 20 (8.5%) | 81 (26.7%) |
| 3 or 4 Children | 11 (19.3%) | 100 (100.0%) |
| 5 or more Children | 0 (0.0%) | 0 (0.0%) |
| Total | 149 (12.2%) | 187 (28.7%) |
Race in Quay County
The most populous races in Quay County are White / Caucasian (6,265 | 72.5%), Hispanic or Latino (3,984 | 46.1%), and Two or more Races (1,092 | 12.6%).
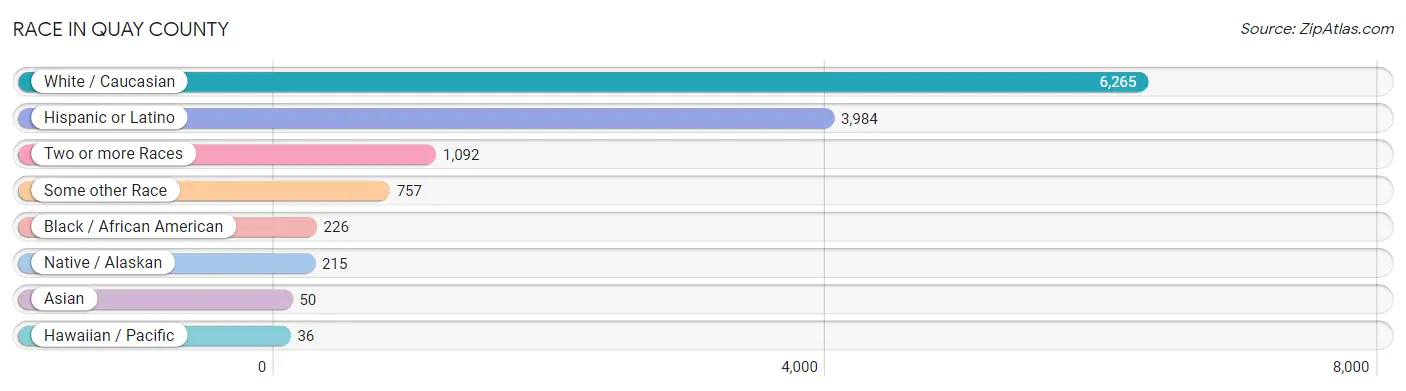
| Race | # Population | % Population |
| Asian | 50 | 0.6% |
| Black / African American | 226 | 2.6% |
| Hawaiian / Pacific | 36 | 0.4% |
| Hispanic or Latino | 3,984 | 46.1% |
| Native / Alaskan | 215 | 2.5% |
| White / Caucasian | 6,265 | 72.5% |
| Two or more Races | 1,092 | 12.6% |
| Some other Race | 757 | 8.8% |
| Total | 8,641 | 100.0% |
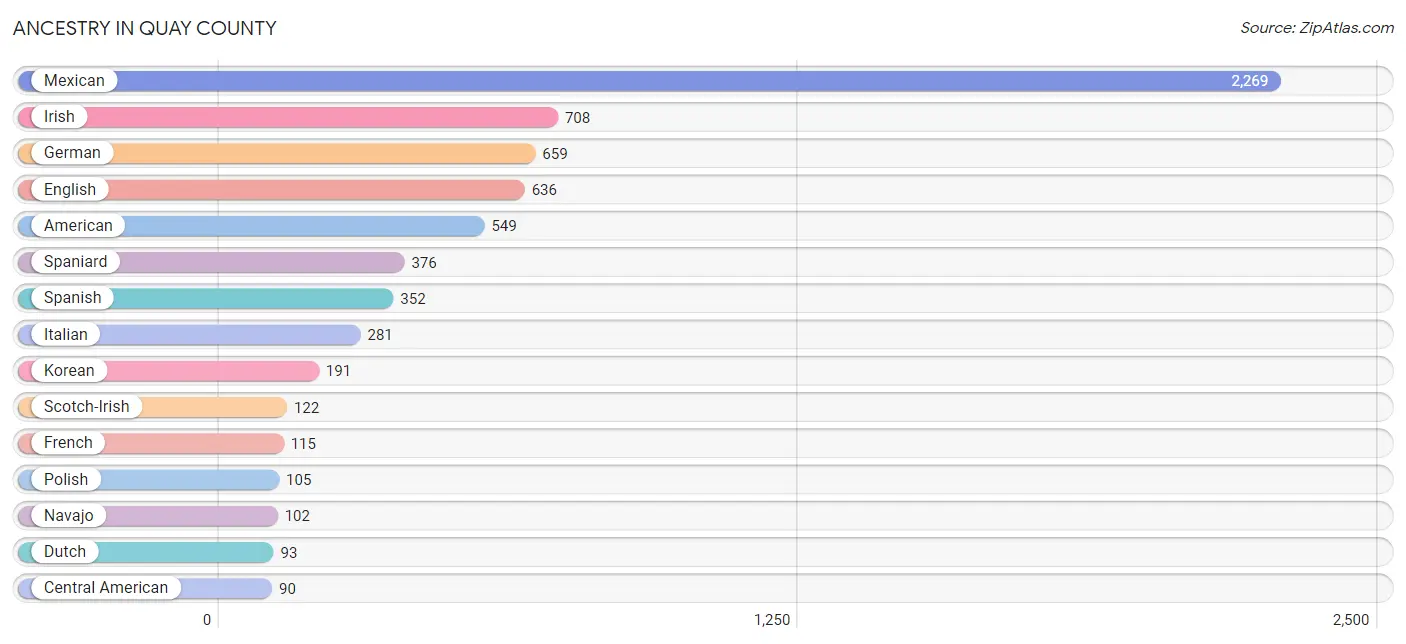
Ancestry in Quay County
The most populous ancestries reported in Quay County are Mexican (2,269 | 26.3%), Irish (708 | 8.2%), German (659 | 7.6%), English (636 | 7.4%), and American (549 | 6.4%), together accounting for 55.8% of all Quay County residents.
| Ancestry | # Population | % Population |
| African | 5 | 0.1% |
| American | 549 | 6.4% |
| Apache | 14 | 0.2% |
| Austrian | 9 | 0.1% |
| Blackfeet | 17 | 0.2% |
| British | 54 | 0.6% |
| Central American | 90 | 1.0% |
| Cherokee | 53 | 0.6% |
| Cheyenne | 15 | 0.2% |
| Comanche | 6 | 0.1% |
| Crow | 6 | 0.1% |
| Cuban | 14 | 0.2% |
| Czech | 3 | 0.0% |
| Czechoslovakian | 5 | 0.1% |
| Danish | 14 | 0.2% |
| Dutch | 93 | 1.1% |
| Dutch West Indian | 3 | 0.0% |
| Eastern European | 4 | 0.1% |
| English | 636 | 7.4% |
| European | 51 | 0.6% |
| Finnish | 5 | 0.1% |
| French | 115 | 1.3% |
| French Canadian | 18 | 0.2% |
| German | 659 | 7.6% |
| Irish | 708 | 8.2% |
| Italian | 281 | 3.3% |
| Korean | 191 | 2.2% |
| Mexican | 2,269 | 26.3% |
| Native Hawaiian | 7 | 0.1% |
| Navajo | 102 | 1.2% |
| Nicaraguan | 12 | 0.1% |
| Northern European | 63 | 0.7% |
| Norwegian | 14 | 0.2% |
| Pennsylvania German | 16 | 0.2% |
| Polish | 105 | 1.2% |
| Pueblo | 3 | 0.0% |
| Puerto Rican | 77 | 0.9% |
| Russian | 59 | 0.7% |
| Salvadoran | 78 | 0.9% |
| Samoan | 36 | 0.4% |
| Scandinavian | 46 | 0.5% |
| Scotch-Irish | 122 | 1.4% |
| Scottish | 80 | 0.9% |
| Seminole | 16 | 0.2% |
| South American | 5 | 0.1% |
| Spaniard | 376 | 4.3% |
| Spanish | 352 | 4.1% |
| Spanish American | 33 | 0.4% |
| Subsaharan African | 5 | 0.1% |
| Swedish | 43 | 0.5% |
| Swiss | 2 | 0.0% |
| Ukrainian | 11 | 0.1% |
| Venezuelan | 5 | 0.1% |
| Welsh | 67 | 0.8% | View All 54 Rows |
Immigrants in Quay County
The most numerous immigrant groups reported in Quay County came from Latin America (104 | 1.2%), Central America (99 | 1.1%), Mexico (99 | 1.1%), Asia (36 | 0.4%), and Philippines (36 | 0.4%), together accounting for 4.3% of all Quay County residents.
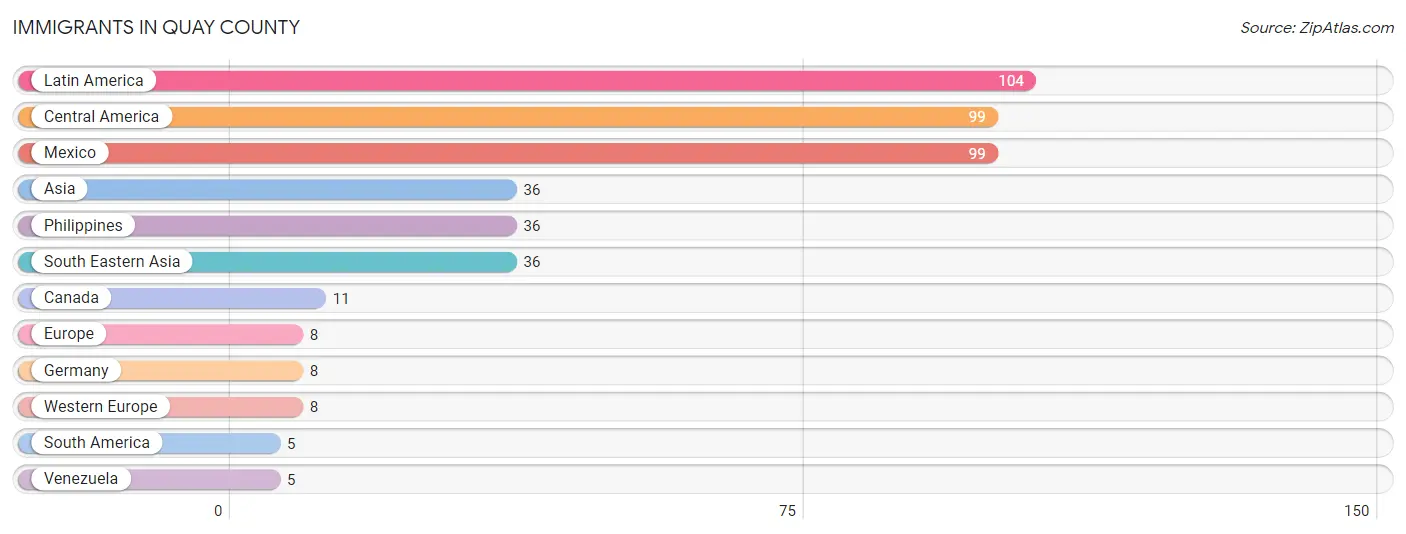
| Immigration Origin | # Population | % Population |
| Asia | 36 | 0.4% |
| Canada | 11 | 0.1% |
| Central America | 99 | 1.1% |
| Europe | 8 | 0.1% |
| Germany | 8 | 0.1% |
| Latin America | 104 | 1.2% |
| Mexico | 99 | 1.1% |
| Philippines | 36 | 0.4% |
| South America | 5 | 0.1% |
| South Eastern Asia | 36 | 0.4% |
| Venezuela | 5 | 0.1% |
| Western Europe | 8 | 0.1% | View All 12 Rows |
Sex and Age in Quay County
Sex and Age in Quay County
The most populous age groups in Quay County are 35 to 39 Years (468 | 11.1%) for men and 60 to 64 Years (388 | 8.7%) for women.
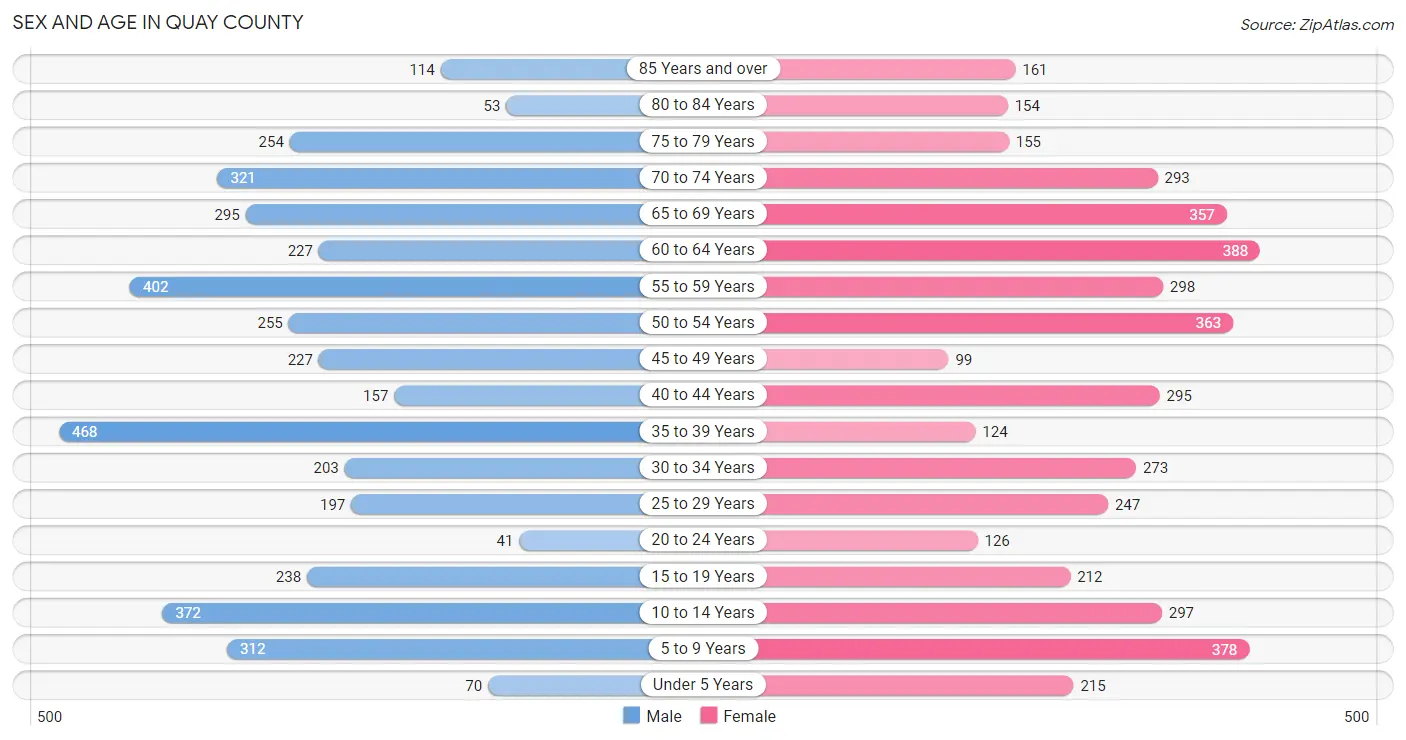
| Age Bracket | Male | Female |
| Under 5 Years | 70 (1.7%) | 215 (4.9%) |
| 5 to 9 Years | 312 (7.4%) | 378 (8.5%) |
| 10 to 14 Years | 372 (8.8%) | 297 (6.7%) |
| 15 to 19 Years | 238 (5.7%) | 212 (4.8%) |
| 20 to 24 Years | 41 (1.0%) | 126 (2.8%) |
| 25 to 29 Years | 197 (4.7%) | 247 (5.6%) |
| 30 to 34 Years | 203 (4.8%) | 273 (6.2%) |
| 35 to 39 Years | 468 (11.1%) | 124 (2.8%) |
| 40 to 44 Years | 157 (3.7%) | 295 (6.7%) |
| 45 to 49 Years | 227 (5.4%) | 99 (2.2%) |
| 50 to 54 Years | 255 (6.1%) | 363 (8.2%) |
| 55 to 59 Years | 402 (9.6%) | 298 (6.7%) |
| 60 to 64 Years | 227 (5.4%) | 388 (8.7%) |
| 65 to 69 Years | 295 (7.0%) | 357 (8.1%) |
| 70 to 74 Years | 321 (7.6%) | 293 (6.6%) |
| 75 to 79 Years | 254 (6.0%) | 155 (3.5%) |
| 80 to 84 Years | 53 (1.3%) | 154 (3.5%) |
| 85 Years and over | 114 (2.7%) | 161 (3.6%) |
| Total | 4,206 (100.0%) | 4,435 (100.0%) |
Families and Households in Quay County
Median Family Size in Quay County
The median family size in Quay County is 3.21 persons per family, with single female/mother families (437 | 23.3%) accounting for the largest median family size of 3.83 persons per family. On the other hand, married-couple families (1,224 | 65.3%) represent the smallest median family size with 2.95 persons per family.
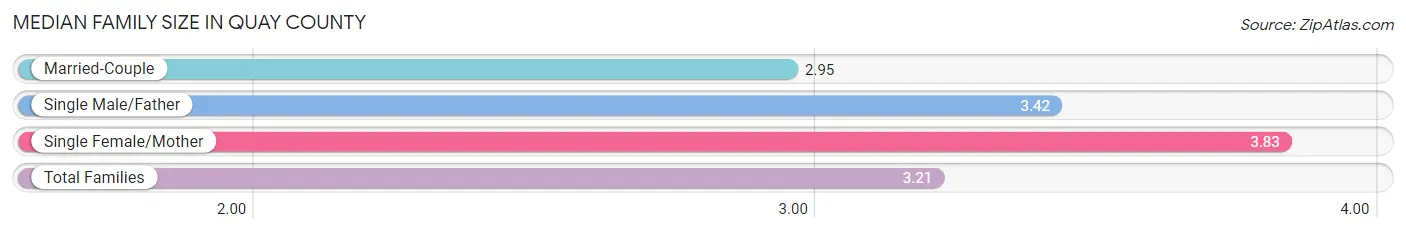
| Family Type | # Families | Family Size |
| Married-Couple | 1,224 (65.3%) | 2.95 |
| Single Male/Father | 214 (11.4%) | 3.42 |
| Single Female/Mother | 437 (23.3%) | 3.83 |
| Total Families | 1,875 (100.0%) | 3.21 |
Median Household Size in Quay County
The median household size in Quay County is 2.28 persons per household, with single male/father households (214 | 5.7%) accounting for the largest median household size of 4.23 persons per household. non-family households (1,882 | 50.1%) represent the smallest median household size with 1.15 persons per household.
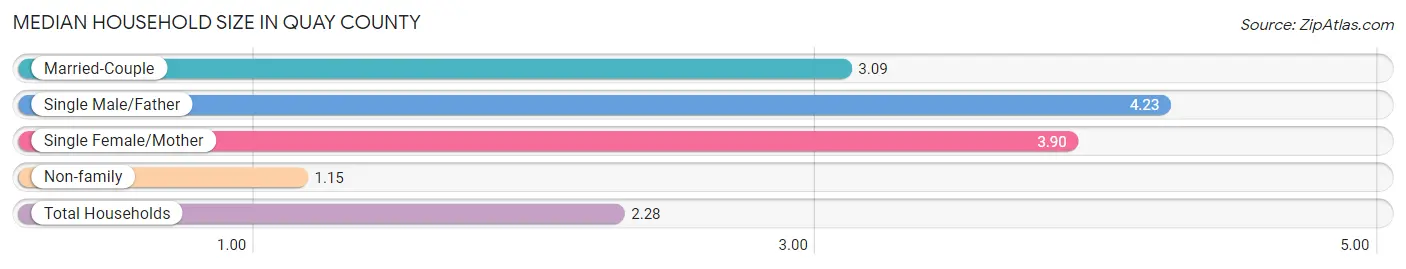
| Household Type | # Households | Household Size |
| Married-Couple | 1,224 (32.6%) | 3.09 |
| Single Male/Father | 214 (5.7%) | 4.23 |
| Single Female/Mother | 437 (11.6%) | 3.90 |
| Non-family | 1,882 (50.1%) | 1.15 |
| Total Households | 3,757 (100.0%) | 2.28 |
Household Size by Marriage Status in Quay County
Out of a total of 3,757 households in Quay County, 1,875 (49.9%) are family households, while 1,882 (50.1%) are nonfamily households. The most numerous type of family households are 2-person households, comprising 1,150, and the most common type of nonfamily households are 1-person households, comprising 1,658.
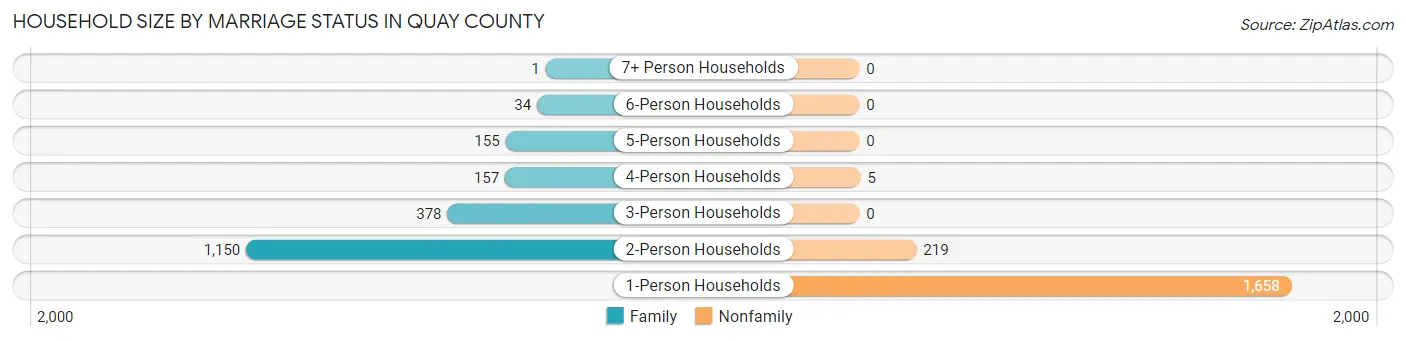
| Household Size | Family Households | Nonfamily Households |
| 1-Person Households | - | 1,658 (44.1%) |
| 2-Person Households | 1,150 (30.6%) | 219 (5.8%) |
| 3-Person Households | 378 (10.1%) | 0 (0.0%) |
| 4-Person Households | 157 (4.2%) | 5 (0.1%) |
| 5-Person Households | 155 (4.1%) | 0 (0.0%) |
| 6-Person Households | 34 (0.9%) | 0 (0.0%) |
| 7+ Person Households | 1 (0.0%) | 0 (0.0%) |
| Total | 1,875 (49.9%) | 1,882 (50.1%) |
Female Fertility in Quay County
Fertility by Age in Quay County
Average fertility rate in Quay County is 65.0 births per 1,000 women. Women in the age bracket of 20 to 34 years have the highest fertility rate with 142.0 births per 1,000 women. Women in the age bracket of 20 to 34 years acount for 100.0% of all women with births.
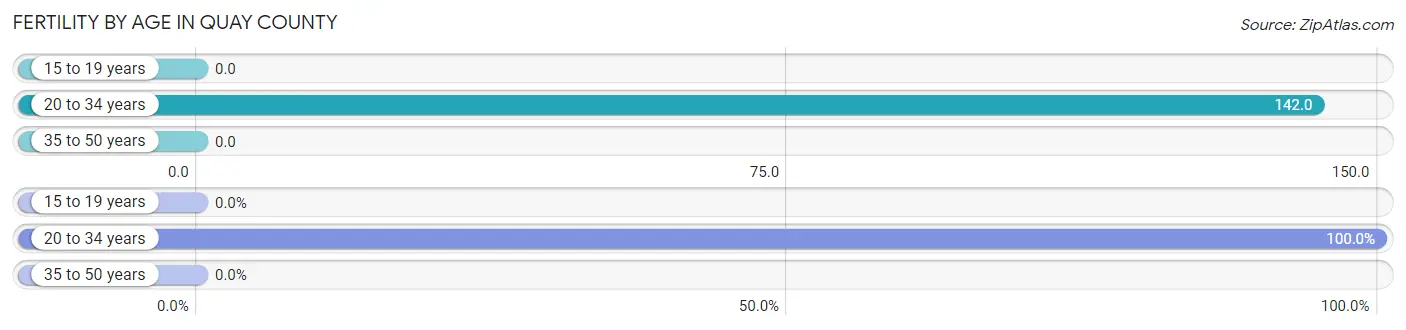
| Age Bracket | Women with Births | Births / 1,000 Women |
| 15 to 19 years | 0 (0.0%) | 0.0 |
| 20 to 34 years | 92 (100.0%) | 142.0 |
| 35 to 50 years | 0 (0.0%) | 0.0 |
| Total | 92 (100.0%) | 65.0 |
Fertility by Age by Marriage Status in Quay County
32.6% of women with births (92) in Quay County are married. The highest percentage of unmarried women with births falls into 20 to 34 years age bracket with 67.4% of them unmarried at the time of birth, while the lowest percentage of unmarried women with births belong to 20 to 34 years age bracket with 67.4% of them unmarried.
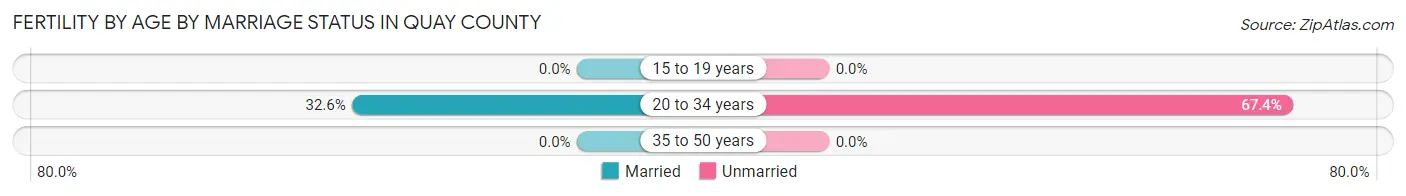
| Age Bracket | Married | Unmarried |
| 15 to 19 years | 0 (0.0%) | 0 (0.0%) |
| 20 to 34 years | 30 (32.6%) | 62 (67.4%) |
| 35 to 50 years | 0 (0.0%) | 0 (0.0%) |
| Total | 30 (32.6%) | 62 (67.4%) |
Fertility by Education in Quay County
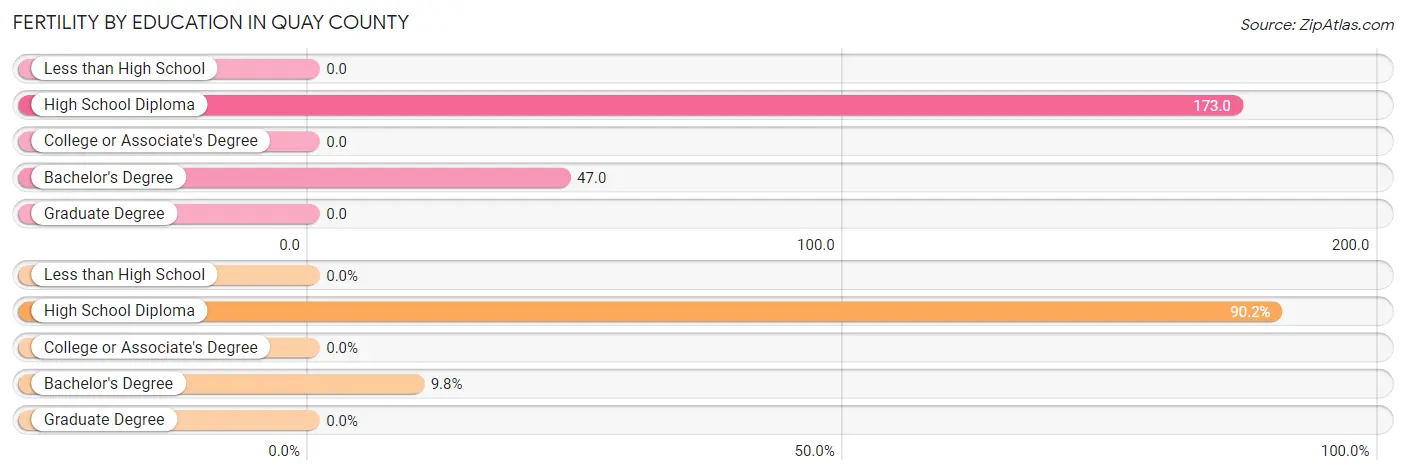
| Educational Attainment | Women with Births | Births / 1,000 Women |
| Less than High School | 0 (0.0%) | 0.0 |
| High School Diploma | 83 (90.2%) | 173.0 |
| College or Associate's Degree | 0 (0.0%) | 0.0 |
| Bachelor's Degree | 9 (9.8%) | 47.0 |
| Graduate Degree | 0 (0.0%) | 0.0 |
| Total | 92 (100.0%) | 65.0 |
Fertility by Education by Marriage Status in Quay County
67.4% of women with births in Quay County are unmarried. Women with the educational attainment of bachelor's degree are most likely to be married with 100.0% of them married at childbirth, while women with the educational attainment of high school diploma are least likely to be married with 74.7% of them unmarried at childbirth.
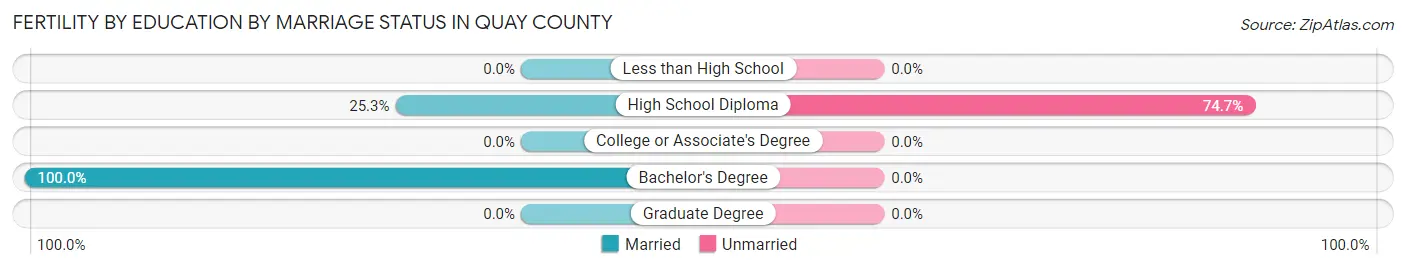
| Educational Attainment | Married | Unmarried |
| Less than High School | 0 (0.0%) | 0 (0.0%) |
| High School Diploma | 21 (25.3%) | 62 (74.7%) |
| College or Associate's Degree | 0 (0.0%) | 0 (0.0%) |
| Bachelor's Degree | 9 (100.0%) | 0 (0.0%) |
| Graduate Degree | 0 (0.0%) | 0 (0.0%) |
| Total | 30 (32.6%) | 62 (67.4%) |
Employment Characteristics in Quay County
Employment by Class of Employer in Quay County
Among the 3,422 employed individuals in Quay County, private company employees (2,017 | 58.9%), local government employees (464 | 13.6%), and state government employees (262 | 7.7%) make up the most common classes of employment.
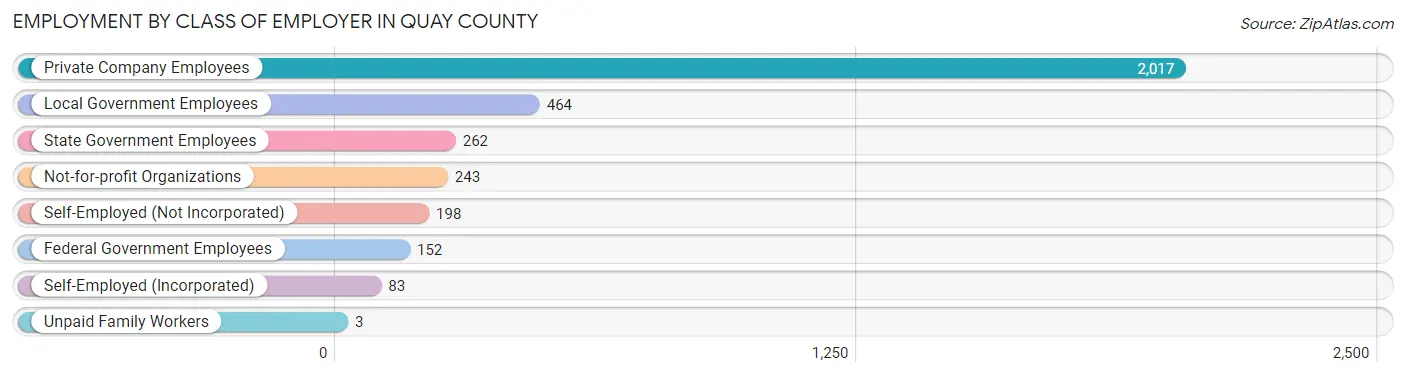
| Employer Class | # Employees | % Employees |
| Private Company Employees | 2,017 | 58.9% |
| Self-Employed (Incorporated) | 83 | 2.4% |
| Self-Employed (Not Incorporated) | 198 | 5.8% |
| Not-for-profit Organizations | 243 | 7.1% |
| Local Government Employees | 464 | 13.6% |
| State Government Employees | 262 | 7.7% |
| Federal Government Employees | 152 | 4.4% |
| Unpaid Family Workers | 3 | 0.1% |
| Total | 3,422 | 100.0% |
Employment Status by Age in Quay County
According to the labor force statistics for Quay County, out of the total population over 16 years of age (6,914), 52.9% or 3,658 individuals are in the labor force, with 4.8% or 176 of them unemployed. The age group with the highest labor force participation rate is 30 to 34 years, with 78.6% or 374 individuals in the labor force. Within the labor force, the 16 to 19 years age range has the highest percentage of unemployed individuals, with 33.8% or 74 of them being unemployed.
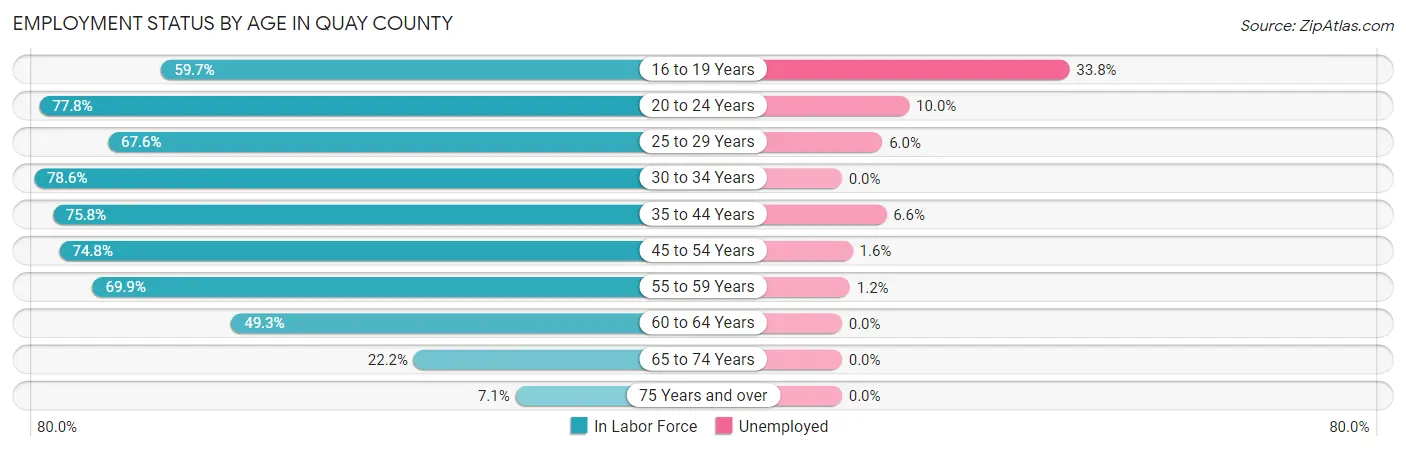
| Age Bracket | In Labor Force | Unemployed |
| 16 to 19 Years | 219 (59.7%) | 74 (33.8%) |
| 20 to 24 Years | 130 (77.8%) | 13 (10.0%) |
| 25 to 29 Years | 300 (67.6%) | 18 (6.0%) |
| 30 to 34 Years | 374 (78.6%) | 0 (0.0%) |
| 35 to 44 Years | 791 (75.8%) | 52 (6.6%) |
| 45 to 54 Years | 706 (74.8%) | 11 (1.6%) |
| 55 to 59 Years | 489 (69.9%) | 6 (1.2%) |
| 60 to 64 Years | 303 (49.3%) | 0 (0.0%) |
| 65 to 74 Years | 281 (22.2%) | 0 (0.0%) |
| 75 Years and over | 63 (7.1%) | 0 (0.0%) |
| Total | 3,658 (52.9%) | 176 (4.8%) |
Employment Status by Educational Attainment in Quay County
According to labor force statistics for Quay County, 70.2% of individuals (2,965) out of the total population between 25 and 64 years of age (4,223) are in the labor force, with 2.9% or 86 of them being unemployed. The group with the highest labor force participation rate are those with the educational attainment of bachelor's degree or higher, with 85.1% or 593 individuals in the labor force. Within the labor force, individuals with less than high school education have the highest percentage of unemployment, with 9.6% or 41 of them being unemployed.
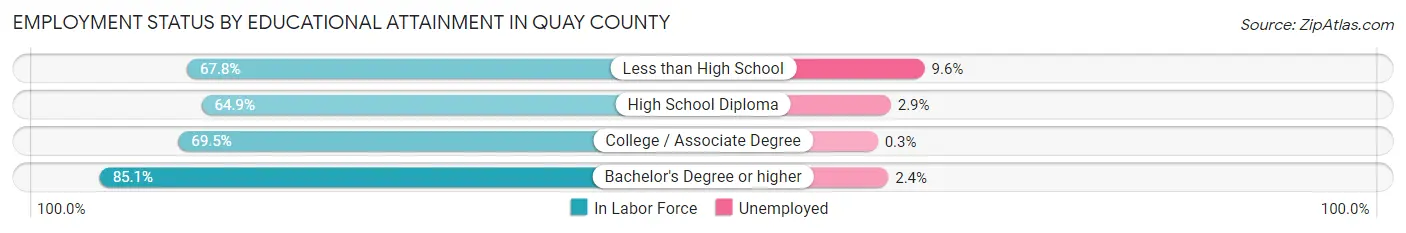
| Educational Attainment | In Labor Force | Unemployed |
| Less than High School | 425 (67.8%) | 60 (9.6%) |
| High School Diploma | 995 (64.9%) | 44 (2.9%) |
| College / Associate Degree | 949 (69.5%) | 4 (0.3%) |
| Bachelor's Degree or higher | 593 (85.1%) | 17 (2.4%) |
| Total | 2,965 (70.2%) | 122 (2.9%) |
Employment Occupations by Sex in Quay County
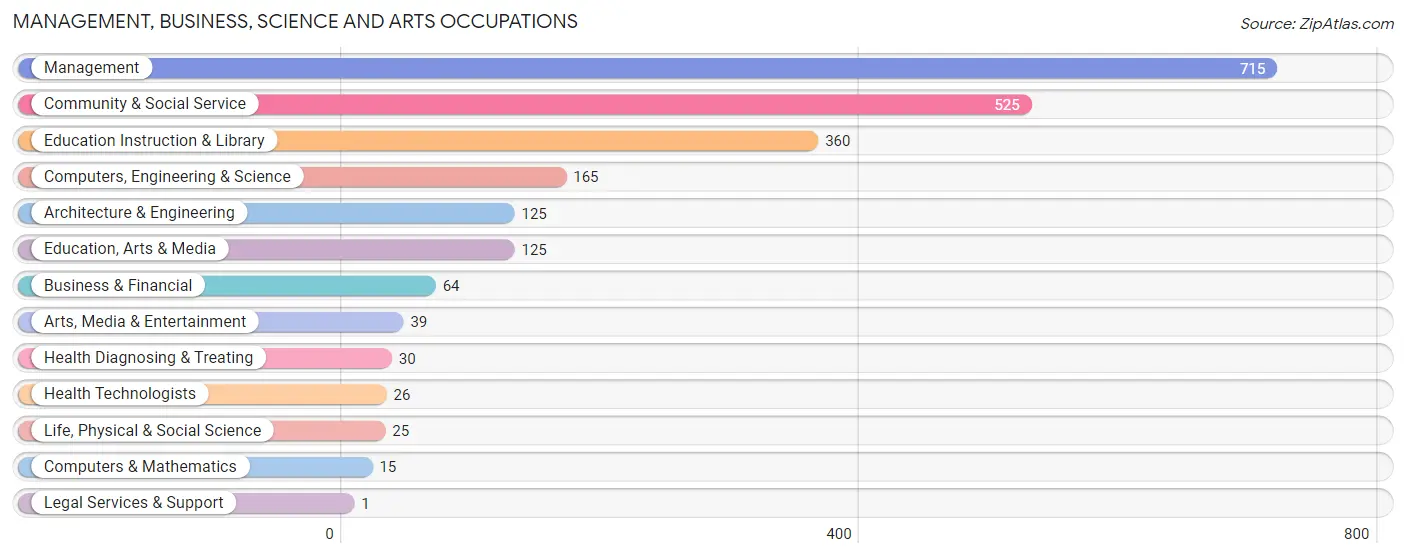
Management, Business, Science and Arts Occupations
The most common Management, Business, Science and Arts occupations in Quay County are Management (715 | 20.5%), Community & Social Service (525 | 15.1%), Education Instruction & Library (360 | 10.3%), Computers, Engineering & Science (165 | 4.7%), and Architecture & Engineering (125 | 3.6%).
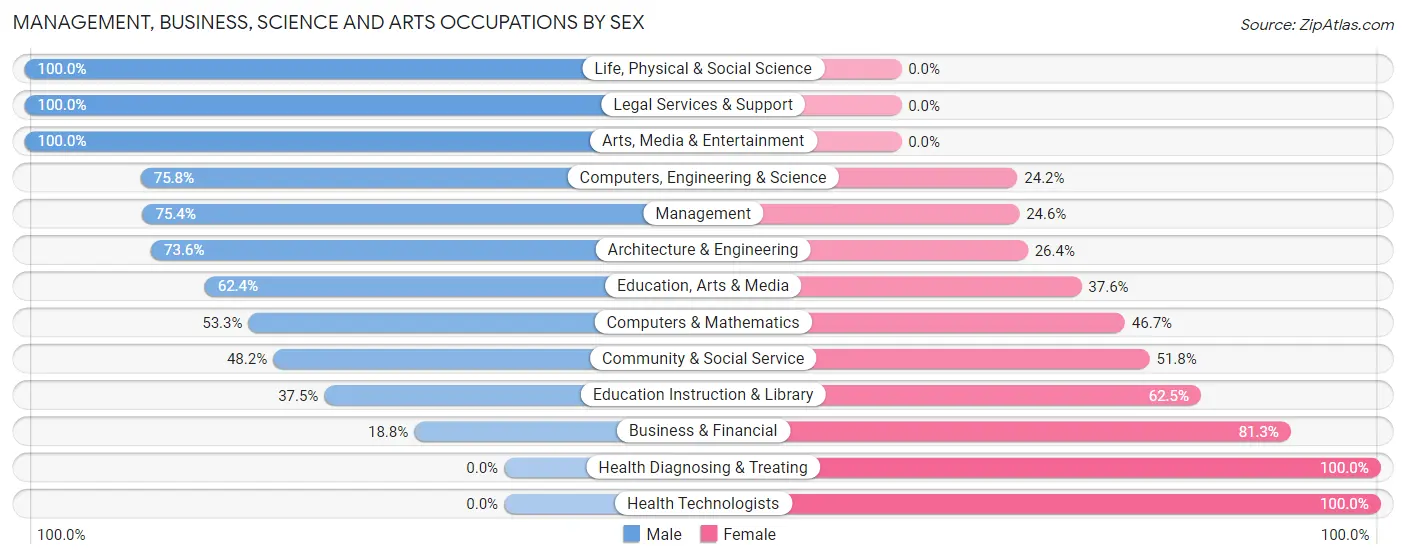
Management, Business, Science and Arts Occupations by Sex
Within the Management, Business, Science and Arts occupations in Quay County, the most male-oriented occupations are Life, Physical & Social Science (100.0%), Legal Services & Support (100.0%), and Arts, Media & Entertainment (100.0%), while the most female-oriented occupations are Health Diagnosing & Treating (100.0%), Health Technologists (100.0%), and Business & Financial (81.2%).
| Occupation | Male | Female |
| Management | 539 (75.4%) | 176 (24.6%) |
| Business & Financial | 12 (18.8%) | 52 (81.2%) |
| Computers, Engineering & Science | 125 (75.8%) | 40 (24.2%) |
| Computers & Mathematics | 8 (53.3%) | 7 (46.7%) |
| Architecture & Engineering | 92 (73.6%) | 33 (26.4%) |
| Life, Physical & Social Science | 25 (100.0%) | 0 (0.0%) |
| Community & Social Service | 253 (48.2%) | 272 (51.8%) |
| Education, Arts & Media | 78 (62.4%) | 47 (37.6%) |
| Legal Services & Support | 1 (100.0%) | 0 (0.0%) |
| Education Instruction & Library | 135 (37.5%) | 225 (62.5%) |
| Arts, Media & Entertainment | 39 (100.0%) | 0 (0.0%) |
| Health Diagnosing & Treating | 0 (0.0%) | 30 (100.0%) |
| Health Technologists | 0 (0.0%) | 26 (100.0%) |
| Total (Category) | 929 (62.0%) | 570 (38.0%) |
| Total (Overall) | 1,887 (54.2%) | 1,595 (45.8%) |
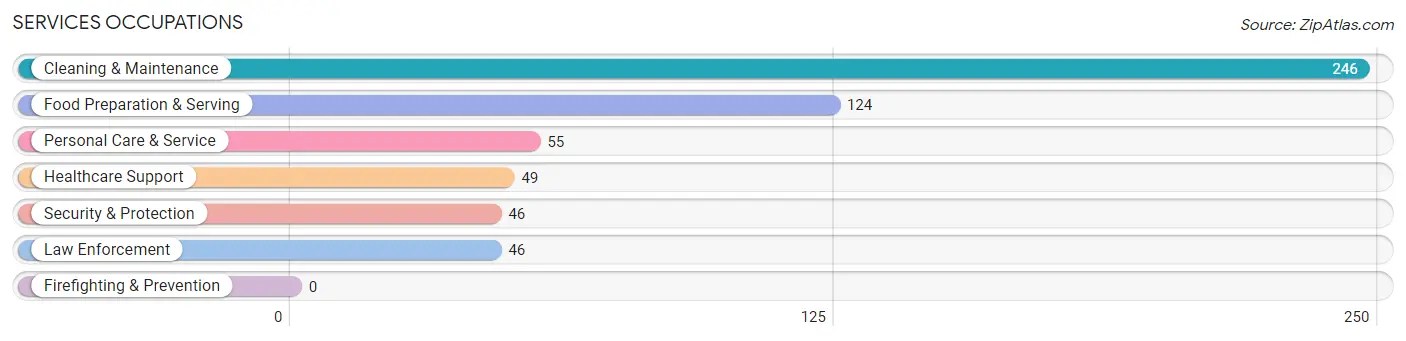
Services Occupations
The most common Services occupations in Quay County are Cleaning & Maintenance (246 | 7.1%), Food Preparation & Serving (124 | 3.6%), Personal Care & Service (55 | 1.6%), Healthcare Support (49 | 1.4%), and Security & Protection (46 | 1.3%).
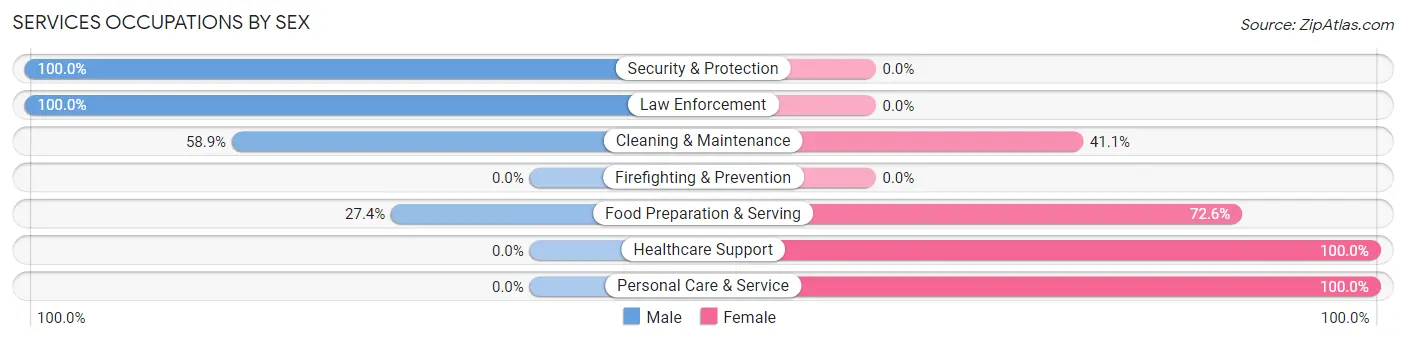
Services Occupations by Sex
Within the Services occupations in Quay County, the most male-oriented occupations are Security & Protection (100.0%), Law Enforcement (100.0%), and Cleaning & Maintenance (58.9%), while the most female-oriented occupations are Healthcare Support (100.0%), Personal Care & Service (100.0%), and Food Preparation & Serving (72.6%).
| Occupation | Male | Female |
| Healthcare Support | 0 (0.0%) | 49 (100.0%) |
| Security & Protection | 46 (100.0%) | 0 (0.0%) |
| Firefighting & Prevention | 0 (0.0%) | 0 (0.0%) |
| Law Enforcement | 46 (100.0%) | 0 (0.0%) |
| Food Preparation & Serving | 34 (27.4%) | 90 (72.6%) |
| Cleaning & Maintenance | 145 (58.9%) | 101 (41.1%) |
| Personal Care & Service | 0 (0.0%) | 55 (100.0%) |
| Total (Category) | 225 (43.3%) | 295 (56.7%) |
| Total (Overall) | 1,887 (54.2%) | 1,595 (45.8%) |
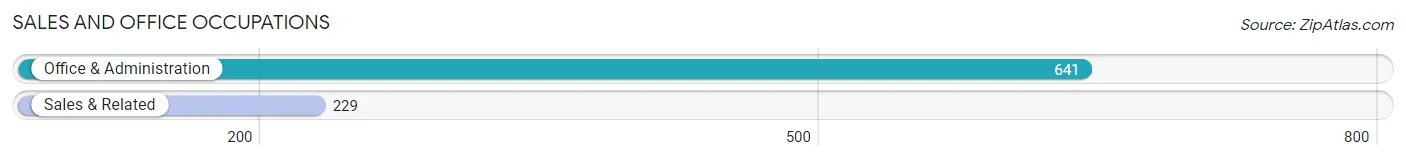
Sales and Office Occupations
The most common Sales and Office occupations in Quay County are Office & Administration (641 | 18.4%), and Sales & Related (229 | 6.6%).
Sales and Office Occupations by Sex
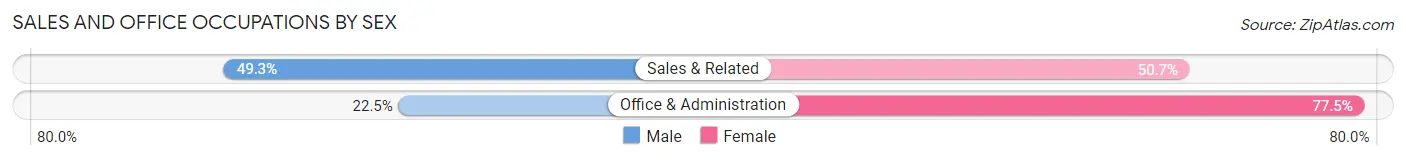
| Occupation | Male | Female |
| Sales & Related | 113 (49.3%) | 116 (50.7%) |
| Office & Administration | 144 (22.5%) | 497 (77.5%) |
| Total (Category) | 257 (29.5%) | 613 (70.5%) |
| Total (Overall) | 1,887 (54.2%) | 1,595 (45.8%) |
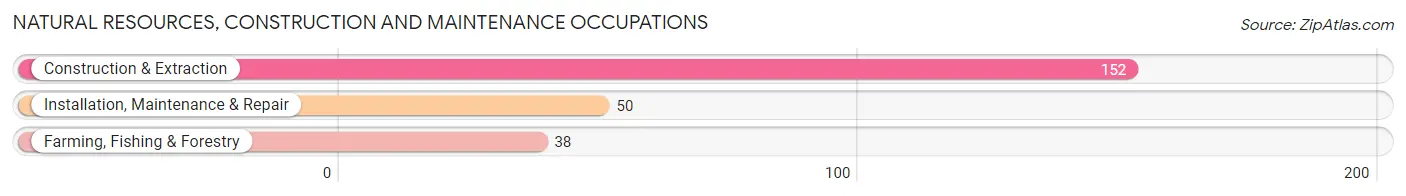
Natural Resources, Construction and Maintenance Occupations
The most common Natural Resources, Construction and Maintenance occupations in Quay County are Construction & Extraction (152 | 4.4%), Installation, Maintenance & Repair (50 | 1.4%), and Farming, Fishing & Forestry (38 | 1.1%).
Natural Resources, Construction and Maintenance Occupations by Sex
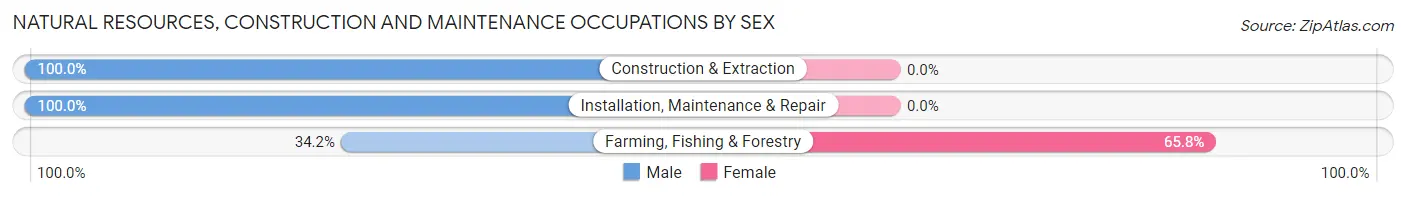
| Occupation | Male | Female |
| Farming, Fishing & Forestry | 13 (34.2%) | 25 (65.8%) |
| Construction & Extraction | 152 (100.0%) | 0 (0.0%) |
| Installation, Maintenance & Repair | 50 (100.0%) | 0 (0.0%) |
| Total (Category) | 215 (89.6%) | 25 (10.4%) |
| Total (Overall) | 1,887 (54.2%) | 1,595 (45.8%) |
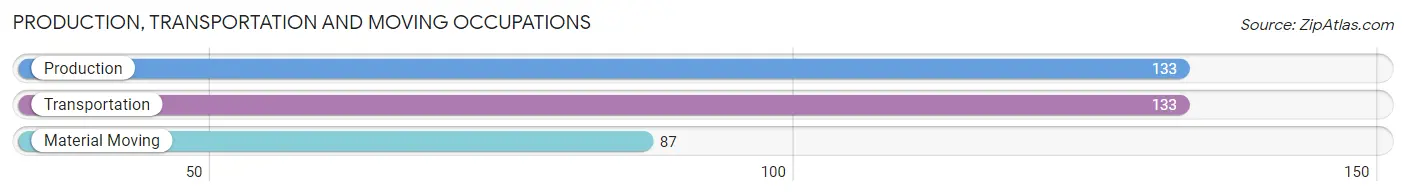
Production, Transportation and Moving Occupations
The most common Production, Transportation and Moving occupations in Quay County are Production (133 | 3.8%), Transportation (133 | 3.8%), and Material Moving (87 | 2.5%).
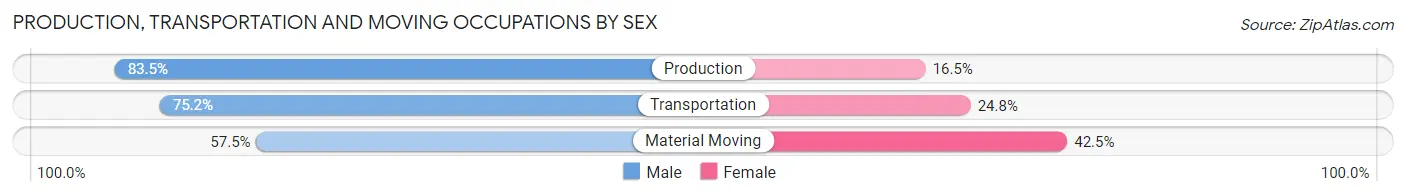
Production, Transportation and Moving Occupations by Sex
| Occupation | Male | Female |
| Production | 111 (83.5%) | 22 (16.5%) |
| Transportation | 100 (75.2%) | 33 (24.8%) |
| Material Moving | 50 (57.5%) | 37 (42.5%) |
| Total (Category) | 261 (73.9%) | 92 (26.1%) |
| Total (Overall) | 1,887 (54.2%) | 1,595 (45.8%) |
Employment Industries by Sex in Quay County
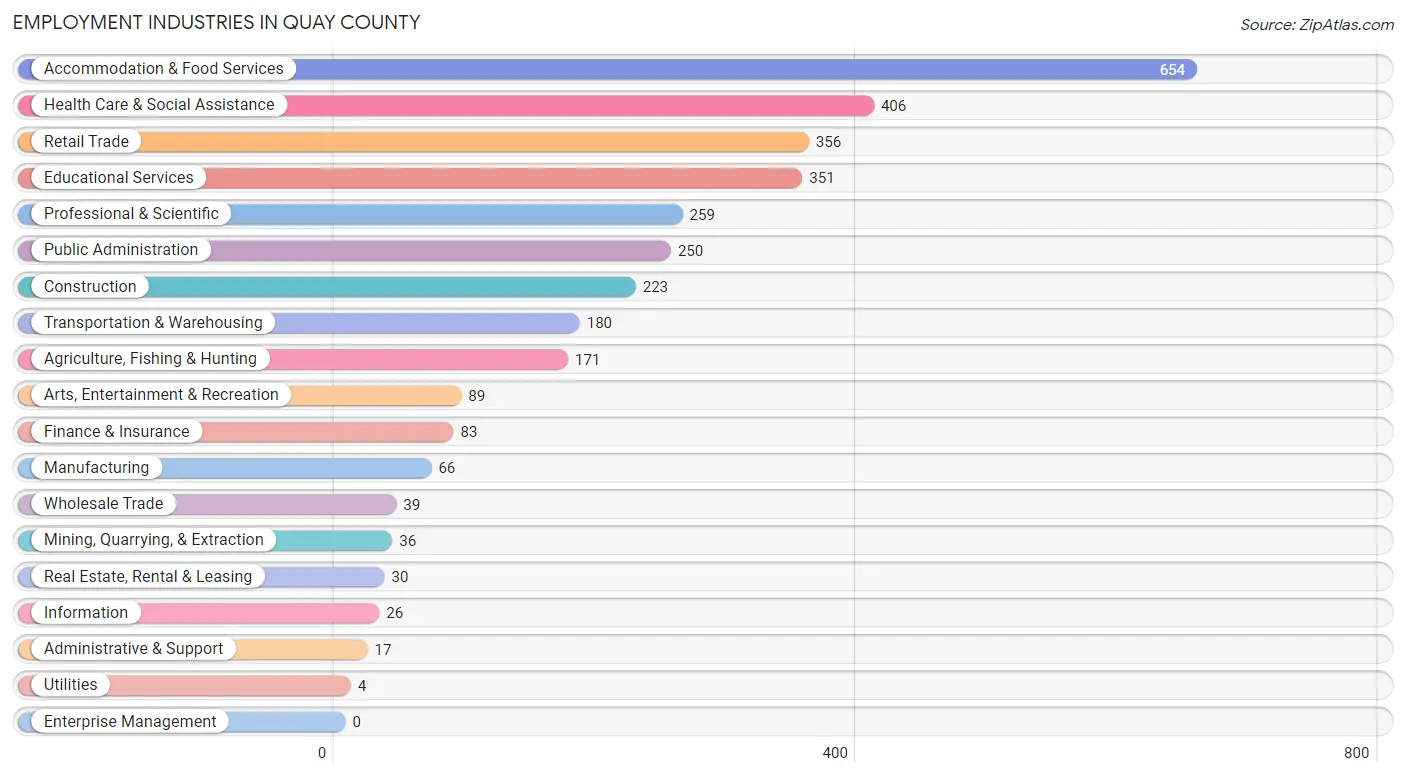
Employment Industries in Quay County
The major employment industries in Quay County include Accommodation & Food Services (654 | 18.8%), Health Care & Social Assistance (406 | 11.7%), Retail Trade (356 | 10.2%), Educational Services (351 | 10.1%), and Professional & Scientific (259 | 7.4%).
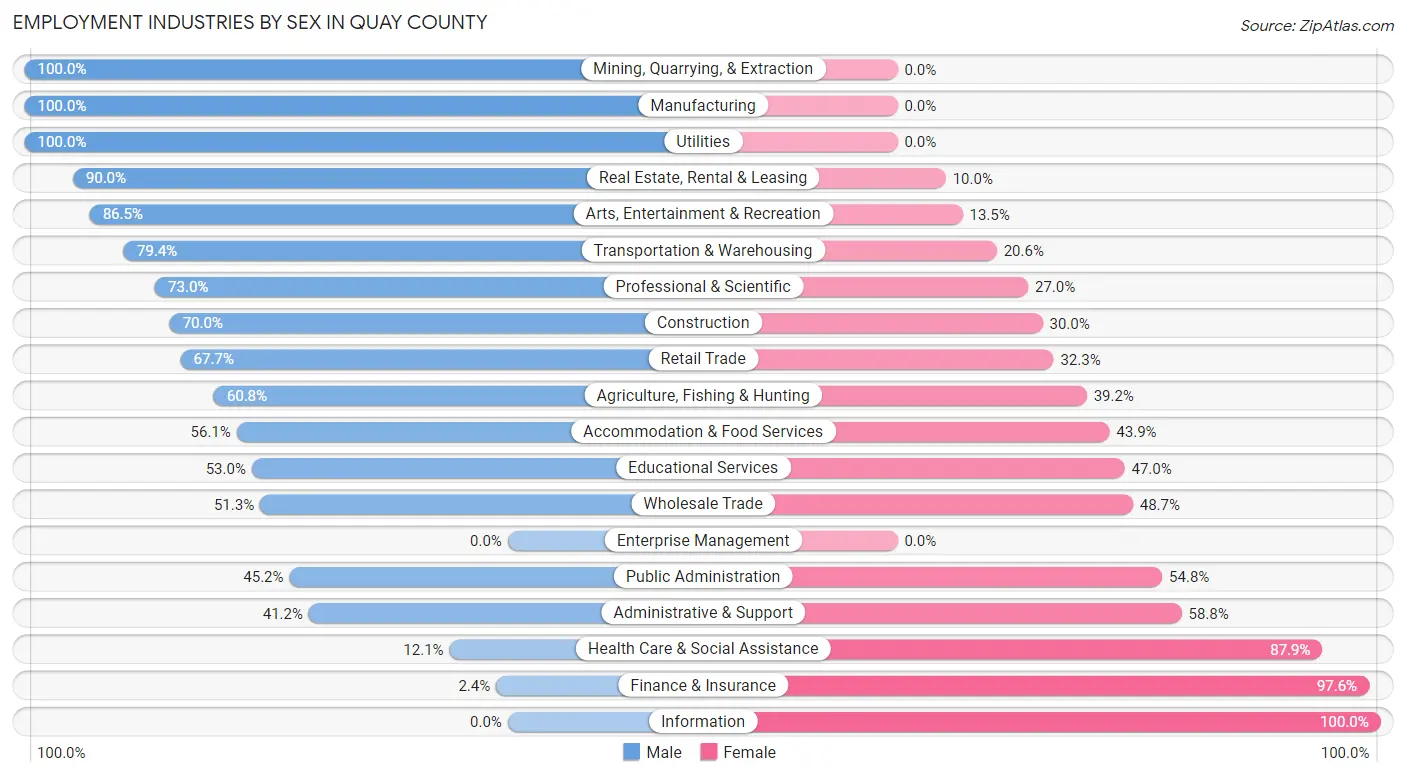
Employment Industries by Sex in Quay County
The Quay County industries that see more men than women are Mining, Quarrying, & Extraction (100.0%), Manufacturing (100.0%), and Utilities (100.0%), whereas the industries that tend to have a higher number of women are Information (100.0%), Finance & Insurance (97.6%), and Health Care & Social Assistance (87.9%).
| Industry | Male | Female |
| Agriculture, Fishing & Hunting | 104 (60.8%) | 67 (39.2%) |
| Mining, Quarrying, & Extraction | 36 (100.0%) | 0 (0.0%) |
| Construction | 156 (70.0%) | 67 (30.0%) |
| Manufacturing | 66 (100.0%) | 0 (0.0%) |
| Wholesale Trade | 20 (51.3%) | 19 (48.7%) |
| Retail Trade | 241 (67.7%) | 115 (32.3%) |
| Transportation & Warehousing | 143 (79.4%) | 37 (20.6%) |
| Utilities | 4 (100.0%) | 0 (0.0%) |
| Information | 0 (0.0%) | 26 (100.0%) |
| Finance & Insurance | 2 (2.4%) | 81 (97.6%) |
| Real Estate, Rental & Leasing | 27 (90.0%) | 3 (10.0%) |
| Professional & Scientific | 189 (73.0%) | 70 (27.0%) |
| Enterprise Management | 0 (0.0%) | 0 (0.0%) |
| Administrative & Support | 7 (41.2%) | 10 (58.8%) |
| Educational Services | 186 (53.0%) | 165 (47.0%) |
| Health Care & Social Assistance | 49 (12.1%) | 357 (87.9%) |
| Arts, Entertainment & Recreation | 77 (86.5%) | 12 (13.5%) |
| Accommodation & Food Services | 367 (56.1%) | 287 (43.9%) |
| Public Administration | 113 (45.2%) | 137 (54.8%) |
| Total | 1,887 (54.2%) | 1,595 (45.8%) |
Education in Quay County
School Enrollment in Quay County
The most common levels of schooling among the 2,037 students in Quay County are elementary school (684 | 33.6%), middle school (498 | 24.4%), and high school (342 | 16.8%).
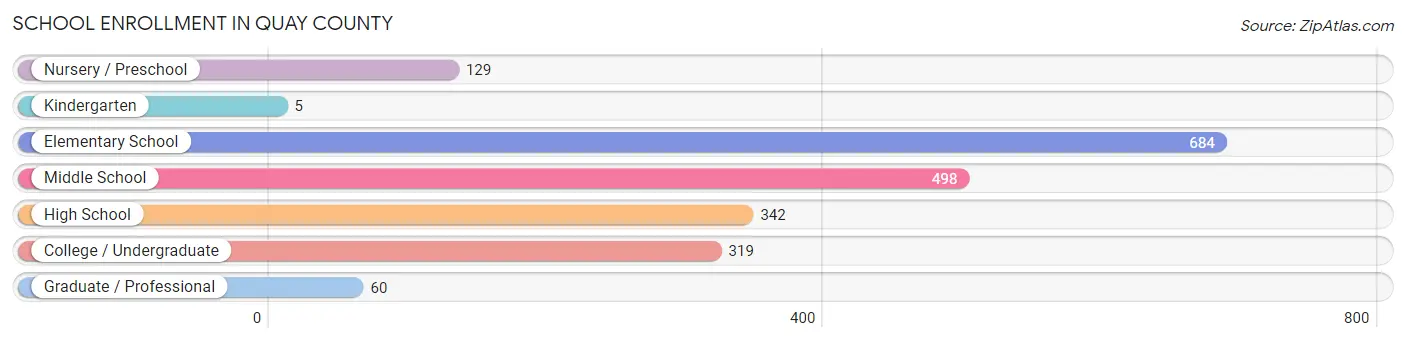
| School Level | # Students | % Students |
| Nursery / Preschool | 129 | 6.3% |
| Kindergarten | 5 | 0.3% |
| Elementary School | 684 | 33.6% |
| Middle School | 498 | 24.4% |
| High School | 342 | 16.8% |
| College / Undergraduate | 319 | 15.7% |
| Graduate / Professional | 60 | 2.9% |
| Total | 2,037 | 100.0% |
School Enrollment by Age by Funding Source in Quay County
Out of a total of 2,037 students who are enrolled in schools in Quay County, 110 (5.4%) attend a private institution, while the remaining 1,927 (94.6%) are enrolled in public schools. The age group of 35 years and over has the highest likelihood of being enrolled in private schools, with 39 (22.8% in the age bracket) enrolled. Conversely, the age group of 3 to 4 year olds has the lowest likelihood of being enrolled in a private school, with 13 (100.0% in the age bracket) attending a public institution.
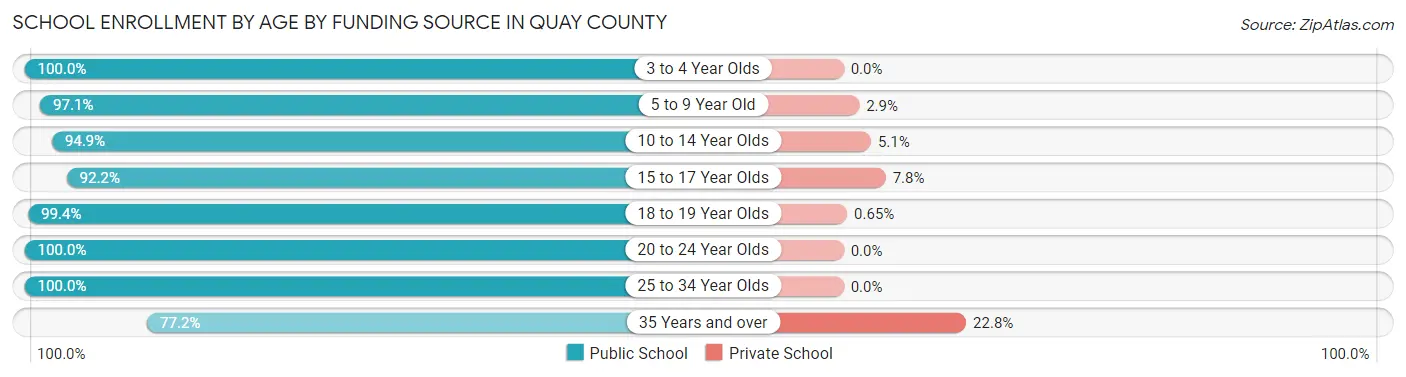
| Age Bracket | Public School | Private School |
| 3 to 4 Year Olds | 13 (100.0%) | 0 (0.0%) |
| 5 to 9 Year Old | 670 (97.1%) | 20 (2.9%) |
| 10 to 14 Year Olds | 635 (94.9%) | 34 (5.1%) |
| 15 to 17 Year Olds | 200 (92.2%) | 17 (7.8%) |
| 18 to 19 Year Olds | 153 (99.4%) | 1 (0.6%) |
| 20 to 24 Year Olds | 19 (100.0%) | 0 (0.0%) |
| 25 to 34 Year Olds | 104 (100.0%) | 0 (0.0%) |
| 35 Years and over | 132 (77.2%) | 39 (22.8%) |
| Total | 1,927 (94.6%) | 110 (5.4%) |
Educational Attainment by Field of Study in Quay County
Education (306 | 29.4%), business (176 | 16.9%), bio, nature & agricultural (94 | 9.0%), literature & languages (82 | 7.9%), and physical & health sciences (80 | 7.7%) are the most common fields of study among 1,041 individuals in Quay County who have obtained a bachelor's degree or higher.
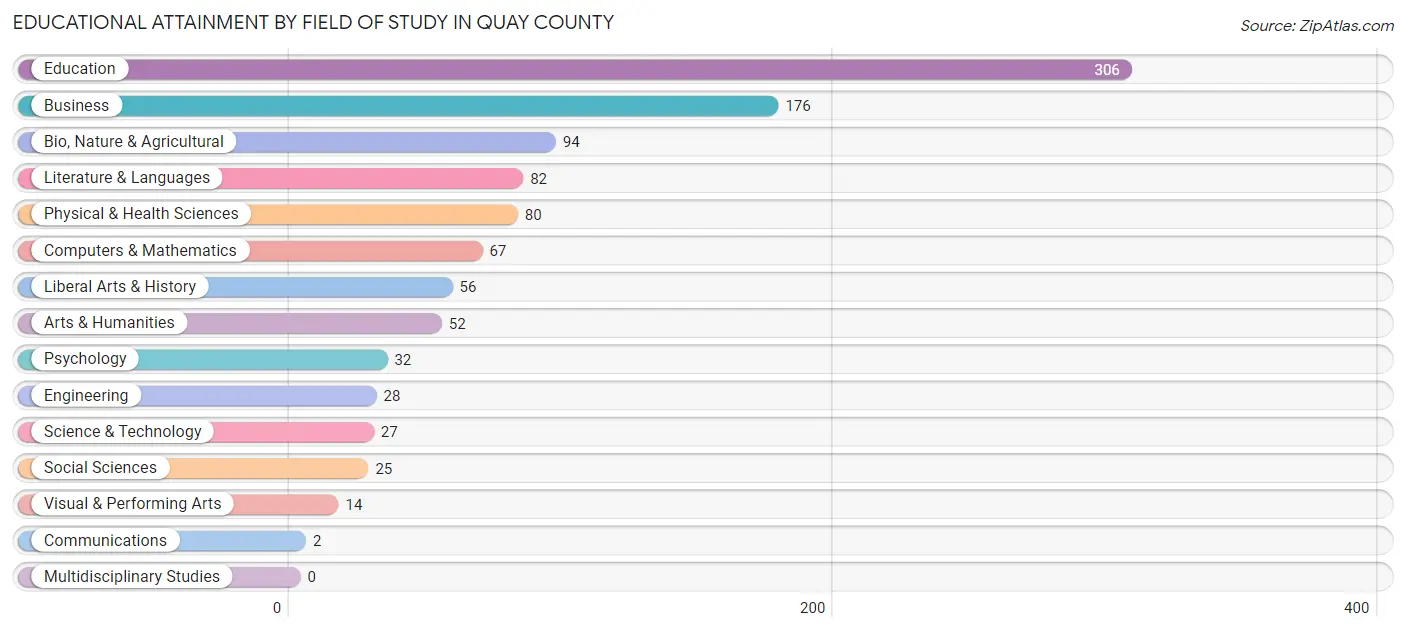
| Field of Study | # Graduates | % Graduates |
| Computers & Mathematics | 67 | 6.4% |
| Bio, Nature & Agricultural | 94 | 9.0% |
| Physical & Health Sciences | 80 | 7.7% |
| Psychology | 32 | 3.1% |
| Social Sciences | 25 | 2.4% |
| Engineering | 28 | 2.7% |
| Multidisciplinary Studies | 0 | 0.0% |
| Science & Technology | 27 | 2.6% |
| Business | 176 | 16.9% |
| Education | 306 | 29.4% |
| Literature & Languages | 82 | 7.9% |
| Liberal Arts & History | 56 | 5.4% |
| Visual & Performing Arts | 14 | 1.3% |
| Communications | 2 | 0.2% |
| Arts & Humanities | 52 | 5.0% |
| Total | 1,041 | 100.0% |
Transportation & Commute in Quay County
Vehicle Availability by Sex in Quay County
The most prevalent vehicle ownership categories in Quay County are males with 2 vehicles (706, accounting for 38.4%) and females with 2 vehicles (693, making up 44.9%).
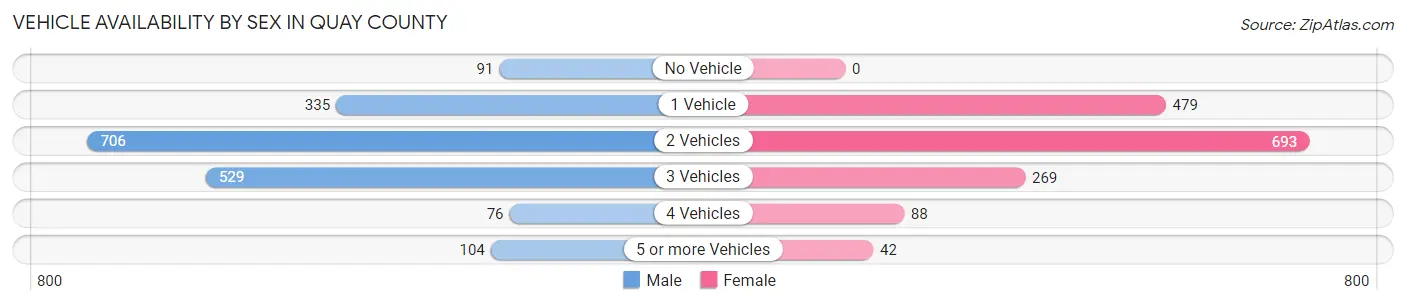
| Vehicles Available | Male | Female |
| No Vehicle | 91 (4.9%) | 0 (0.0%) |
| 1 Vehicle | 335 (18.2%) | 479 (30.5%) |
| 2 Vehicles | 706 (38.4%) | 693 (44.1%) |
| 3 Vehicles | 529 (28.7%) | 269 (17.1%) |
| 4 Vehicles | 76 (4.1%) | 88 (5.6%) |
| 5 or more Vehicles | 104 (5.7%) | 42 (2.7%) |
| Total | 1,841 (100.0%) | 1,571 (100.0%) |
Commute Time in Quay County
The most frequently occuring commute durations in Quay County are 5 to 9 minutes (1,200 commuters, 37.0%), less than 5 minutes (564 commuters, 17.4%), and 10 to 14 minutes (451 commuters, 13.9%).
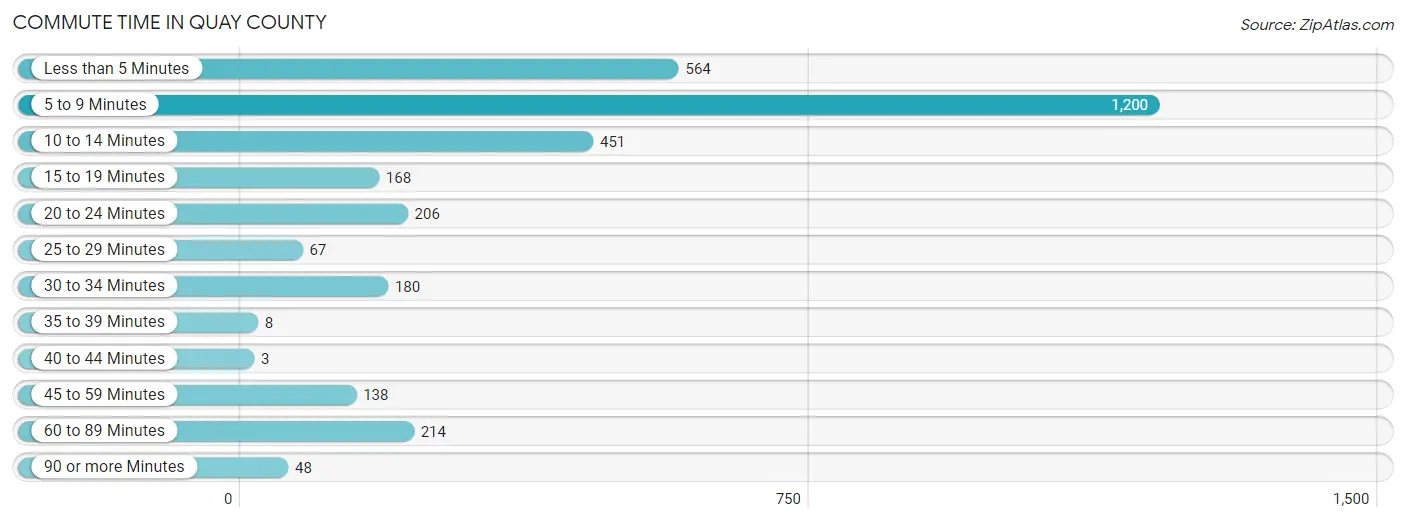
| Commute Time | # Commuters | % Commuters |
| Less than 5 Minutes | 564 | 17.4% |
| 5 to 9 Minutes | 1,200 | 37.0% |
| 10 to 14 Minutes | 451 | 13.9% |
| 15 to 19 Minutes | 168 | 5.2% |
| 20 to 24 Minutes | 206 | 6.3% |
| 25 to 29 Minutes | 67 | 2.1% |
| 30 to 34 Minutes | 180 | 5.5% |
| 35 to 39 Minutes | 8 | 0.3% |
| 40 to 44 Minutes | 3 | 0.1% |
| 45 to 59 Minutes | 138 | 4.3% |
| 60 to 89 Minutes | 214 | 6.6% |
| 90 or more Minutes | 48 | 1.5% |
Commute Time by Sex in Quay County
The most common commute times in Quay County are 5 to 9 minutes (614 commuters, 34.1%) for males and 5 to 9 minutes (586 commuters, 40.6%) for females.
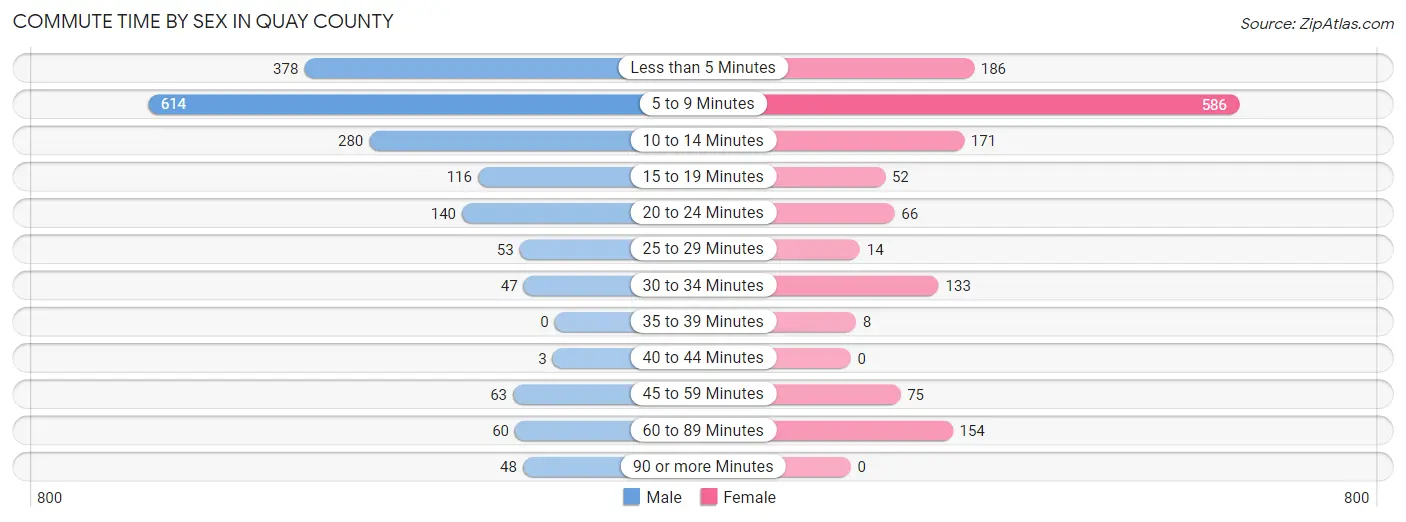
| Commute Time | Male | Female |
| Less than 5 Minutes | 378 (21.0%) | 186 (12.9%) |
| 5 to 9 Minutes | 614 (34.1%) | 586 (40.6%) |
| 10 to 14 Minutes | 280 (15.5%) | 171 (11.8%) |
| 15 to 19 Minutes | 116 (6.4%) | 52 (3.6%) |
| 20 to 24 Minutes | 140 (7.8%) | 66 (4.6%) |
| 25 to 29 Minutes | 53 (2.9%) | 14 (1.0%) |
| 30 to 34 Minutes | 47 (2.6%) | 133 (9.2%) |
| 35 to 39 Minutes | 0 (0.0%) | 8 (0.5%) |
| 40 to 44 Minutes | 3 (0.2%) | 0 (0.0%) |
| 45 to 59 Minutes | 63 (3.5%) | 75 (5.2%) |
| 60 to 89 Minutes | 60 (3.3%) | 154 (10.7%) |
| 90 or more Minutes | 48 (2.7%) | 0 (0.0%) |
Time of Departure to Work by Sex in Quay County
The most frequent times of departure to work in Quay County are 7:30 AM to 7:59 AM (364, 20.2%) for males and 7:30 AM to 7:59 AM (444, 30.7%) for females.
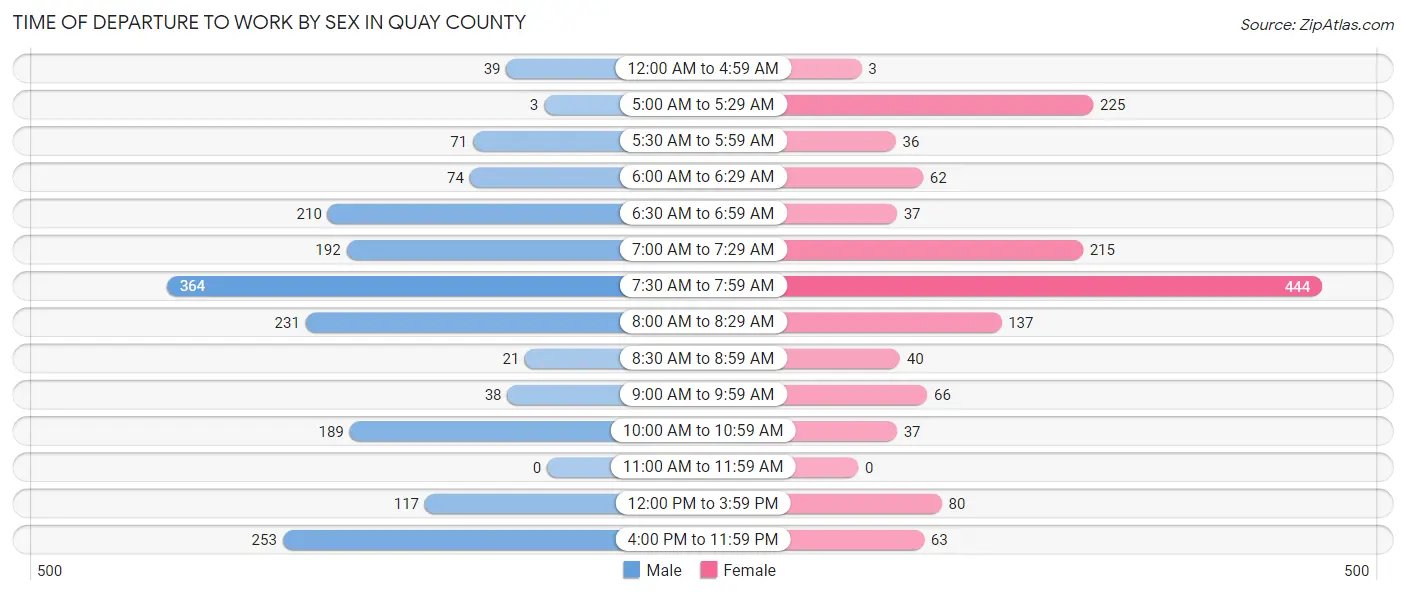
| Time of Departure | Male | Female |
| 12:00 AM to 4:59 AM | 39 (2.2%) | 3 (0.2%) |
| 5:00 AM to 5:29 AM | 3 (0.2%) | 225 (15.6%) |
| 5:30 AM to 5:59 AM | 71 (3.9%) | 36 (2.5%) |
| 6:00 AM to 6:29 AM | 74 (4.1%) | 62 (4.3%) |
| 6:30 AM to 6:59 AM | 210 (11.7%) | 37 (2.6%) |
| 7:00 AM to 7:29 AM | 192 (10.6%) | 215 (14.9%) |
| 7:30 AM to 7:59 AM | 364 (20.2%) | 444 (30.7%) |
| 8:00 AM to 8:29 AM | 231 (12.8%) | 137 (9.5%) |
| 8:30 AM to 8:59 AM | 21 (1.2%) | 40 (2.8%) |
| 9:00 AM to 9:59 AM | 38 (2.1%) | 66 (4.6%) |
| 10:00 AM to 10:59 AM | 189 (10.5%) | 37 (2.6%) |
| 11:00 AM to 11:59 AM | 0 (0.0%) | 0 (0.0%) |
| 12:00 PM to 3:59 PM | 117 (6.5%) | 80 (5.5%) |
| 4:00 PM to 11:59 PM | 253 (14.0%) | 63 (4.4%) |
| Total | 1,802 (100.0%) | 1,445 (100.0%) |
Housing Occupancy in Quay County
Occupancy by Ownership in Quay County
Of the total 3,757 dwellings in Quay County, owner-occupied units account for 2,565 (68.3%), while renter-occupied units make up 1,192 (31.7%).
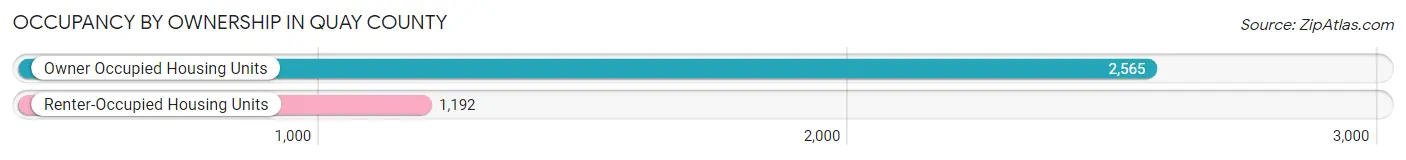
| Occupancy | # Housing Units | % Housing Units |
| Owner Occupied Housing Units | 2,565 | 68.3% |
| Renter-Occupied Housing Units | 1,192 | 31.7% |
| Total Occupied Housing Units | 3,757 | 100.0% |
Occupancy by Household Size in Quay County
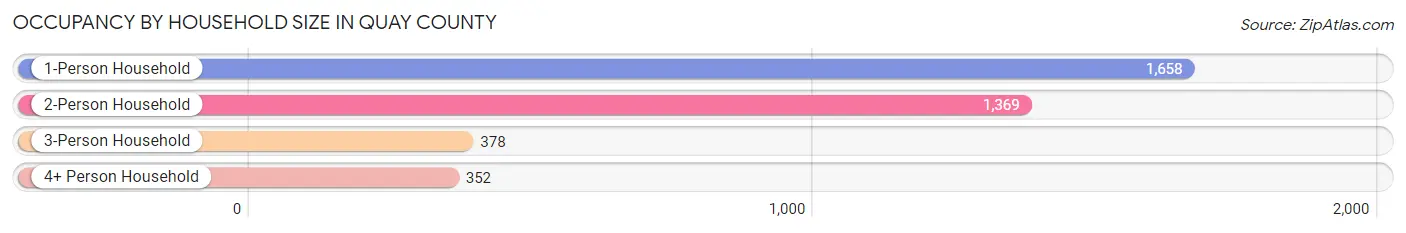
| Household Size | # Housing Units | % Housing Units |
| 1-Person Household | 1,658 | 44.1% |
| 2-Person Household | 1,369 | 36.4% |
| 3-Person Household | 378 | 10.1% |
| 4+ Person Household | 352 | 9.4% |
| Total Housing Units | 3,757 | 100.0% |
Occupancy by Ownership by Household Size in Quay County
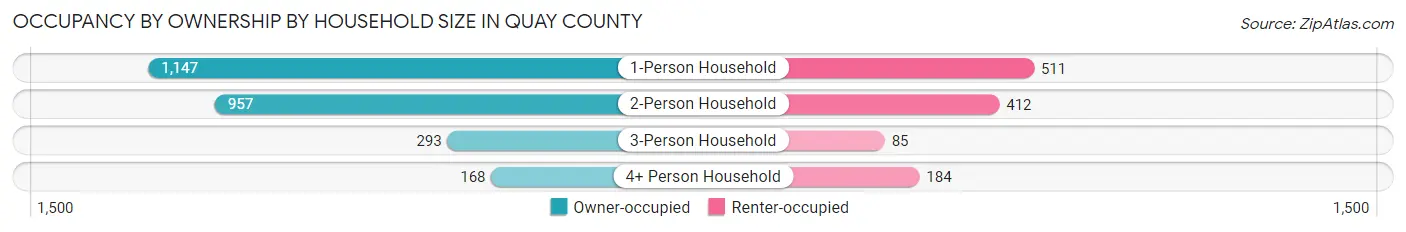
| Household Size | Owner-occupied | Renter-occupied |
| 1-Person Household | 1,147 (69.2%) | 511 (30.8%) |
| 2-Person Household | 957 (69.9%) | 412 (30.1%) |
| 3-Person Household | 293 (77.5%) | 85 (22.5%) |
| 4+ Person Household | 168 (47.7%) | 184 (52.3%) |
| Total Housing Units | 2,565 (68.3%) | 1,192 (31.7%) |
Occupancy by Educational Attainment in Quay County
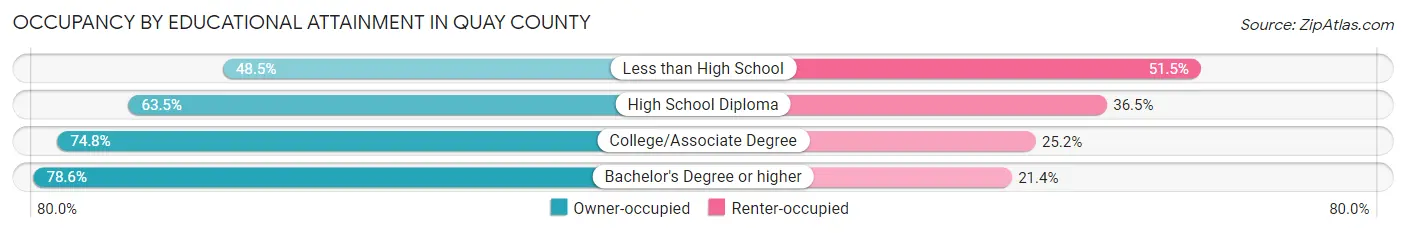
| Household Size | Owner-occupied | Renter-occupied |
| Less than High School | 248 (48.5%) | 263 (51.5%) |
| High School Diploma | 783 (63.5%) | 450 (36.5%) |
| College/Associate Degree | 947 (74.8%) | 319 (25.2%) |
| Bachelor's Degree or higher | 587 (78.6%) | 160 (21.4%) |
Occupancy by Age of Householder in Quay County
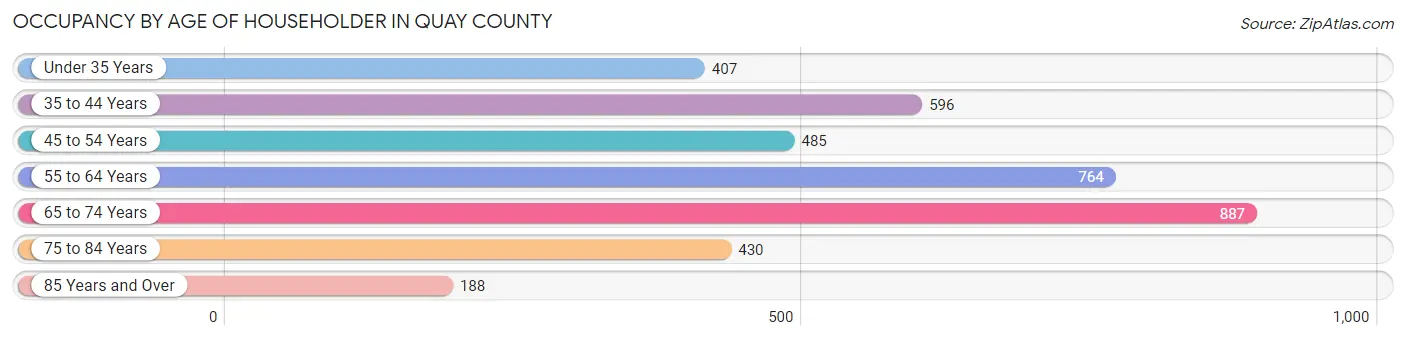
| Age Bracket | # Households | % Households |
| Under 35 Years | 407 | 10.8% |
| 35 to 44 Years | 596 | 15.9% |
| 45 to 54 Years | 485 | 12.9% |
| 55 to 64 Years | 764 | 20.3% |
| 65 to 74 Years | 887 | 23.6% |
| 75 to 84 Years | 430 | 11.5% |
| 85 Years and Over | 188 | 5.0% |
| Total | 3,757 | 100.0% |
Housing Finances in Quay County
Median Income by Occupancy in Quay County
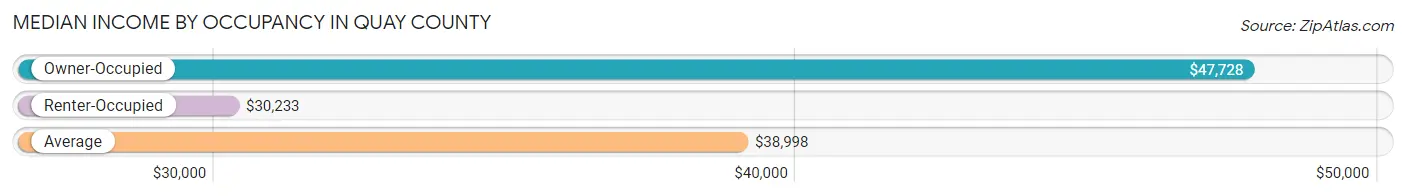
| Occupancy Type | # Households | Median Income |
| Owner-Occupied | 2,565 (68.3%) | $47,728 |
| Renter-Occupied | 1,192 (31.7%) | $30,233 |
| Average | 3,757 (100.0%) | $38,998 |
Occupancy by Householder Income Bracket in Quay County
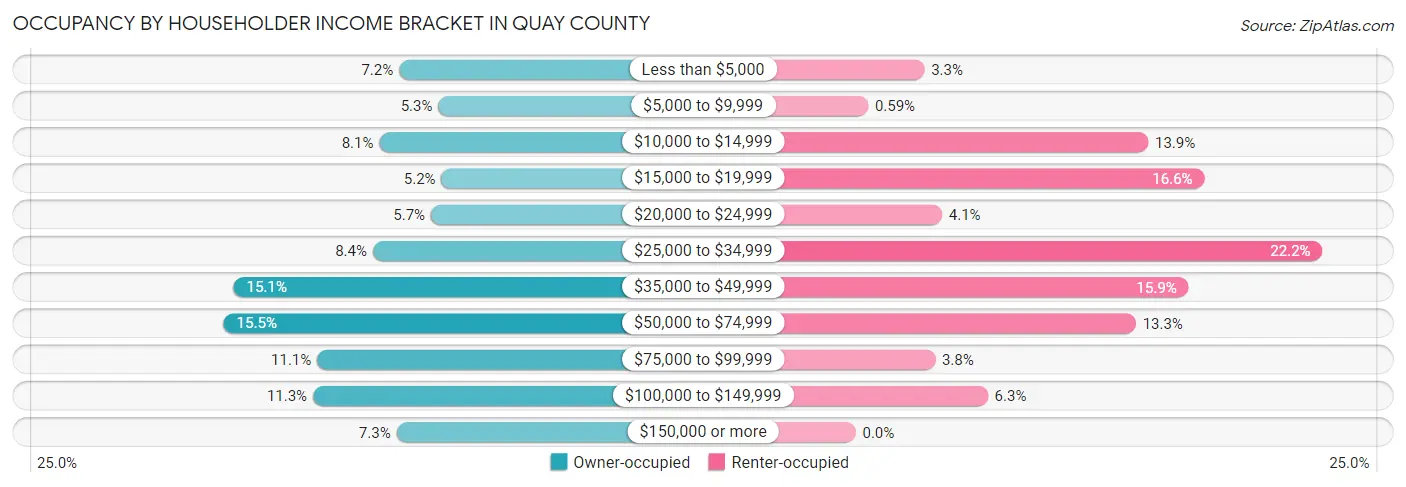
| Income Bracket | Owner-occupied | Renter-occupied |
| Less than $5,000 | 184 (7.2%) | 39 (3.3%) |
| $5,000 to $9,999 | 136 (5.3%) | 7 (0.6%) |
| $10,000 to $14,999 | 208 (8.1%) | 166 (13.9%) |
| $15,000 to $19,999 | 132 (5.1%) | 198 (16.6%) |
| $20,000 to $24,999 | 145 (5.7%) | 49 (4.1%) |
| $25,000 to $34,999 | 216 (8.4%) | 265 (22.2%) |
| $35,000 to $49,999 | 386 (15.0%) | 189 (15.9%) |
| $50,000 to $74,999 | 398 (15.5%) | 159 (13.3%) |
| $75,000 to $99,999 | 284 (11.1%) | 45 (3.8%) |
| $100,000 to $149,999 | 289 (11.3%) | 75 (6.3%) |
| $150,000 or more | 187 (7.3%) | 0 (0.0%) |
| Total | 2,565 (100.0%) | 1,192 (100.0%) |
Monthly Housing Cost Tiers in Quay County
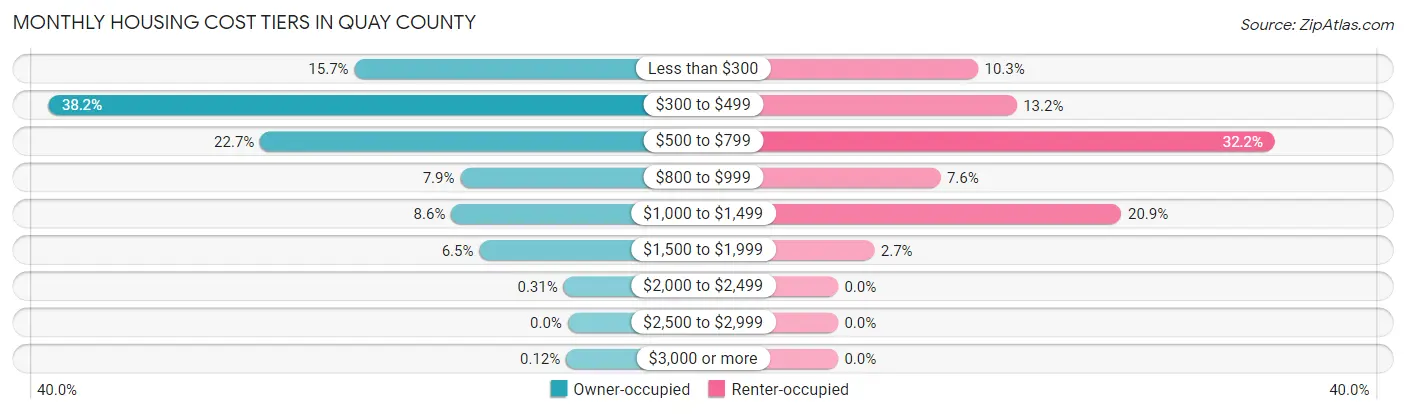
| Monthly Cost | Owner-occupied | Renter-occupied |
| Less than $300 | 403 (15.7%) | 123 (10.3%) |
| $300 to $499 | 980 (38.2%) | 157 (13.2%) |
| $500 to $799 | 581 (22.7%) | 384 (32.2%) |
| $800 to $999 | 203 (7.9%) | 90 (7.5%) |
| $1,000 to $1,499 | 220 (8.6%) | 249 (20.9%) |
| $1,500 to $1,999 | 167 (6.5%) | 32 (2.7%) |
| $2,000 to $2,499 | 8 (0.3%) | 0 (0.0%) |
| $2,500 to $2,999 | 0 (0.0%) | 0 (0.0%) |
| $3,000 or more | 3 (0.1%) | 0 (0.0%) |
| Total | 2,565 (100.0%) | 1,192 (100.0%) |
Physical Housing Characteristics in Quay County
Housing Structures in Quay County
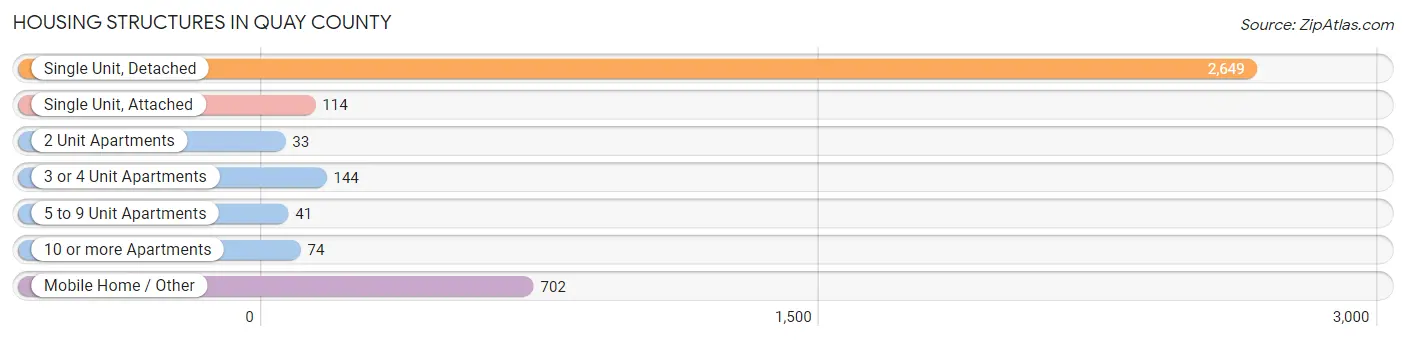
| Structure Type | # Housing Units | % Housing Units |
| Single Unit, Detached | 2,649 | 70.5% |
| Single Unit, Attached | 114 | 3.0% |
| 2 Unit Apartments | 33 | 0.9% |
| 3 or 4 Unit Apartments | 144 | 3.8% |
| 5 to 9 Unit Apartments | 41 | 1.1% |
| 10 or more Apartments | 74 | 2.0% |
| Mobile Home / Other | 702 | 18.7% |
| Total | 3,757 | 100.0% |
Housing Structures by Occupancy in Quay County
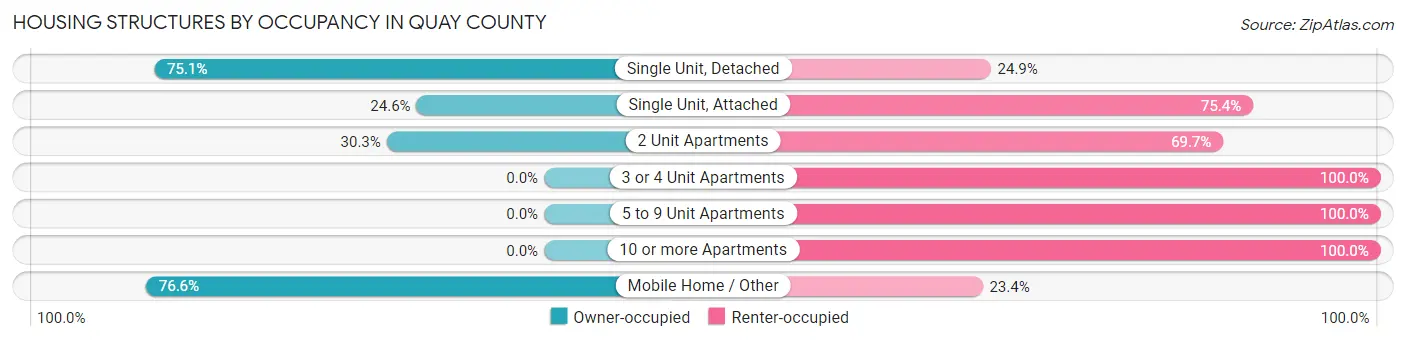
| Structure Type | Owner-occupied | Renter-occupied |
| Single Unit, Detached | 1,989 (75.1%) | 660 (24.9%) |
| Single Unit, Attached | 28 (24.6%) | 86 (75.4%) |
| 2 Unit Apartments | 10 (30.3%) | 23 (69.7%) |
| 3 or 4 Unit Apartments | 0 (0.0%) | 144 (100.0%) |
| 5 to 9 Unit Apartments | 0 (0.0%) | 41 (100.0%) |
| 10 or more Apartments | 0 (0.0%) | 74 (100.0%) |
| Mobile Home / Other | 538 (76.6%) | 164 (23.4%) |
| Total | 2,565 (68.3%) | 1,192 (31.7%) |
Housing Structures by Number of Rooms in Quay County
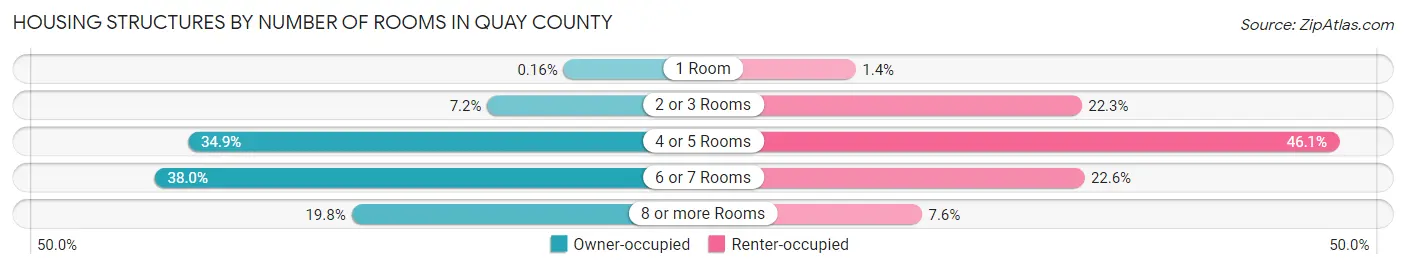
| Number of Rooms | Owner-occupied | Renter-occupied |
| 1 Room | 4 (0.2%) | 17 (1.4%) |
| 2 or 3 Rooms | 185 (7.2%) | 266 (22.3%) |
| 4 or 5 Rooms | 895 (34.9%) | 550 (46.1%) |
| 6 or 7 Rooms | 974 (38.0%) | 269 (22.6%) |
| 8 or more Rooms | 507 (19.8%) | 90 (7.5%) |
| Total | 2,565 (100.0%) | 1,192 (100.0%) |
Housing Structure by Heating Type in Quay County
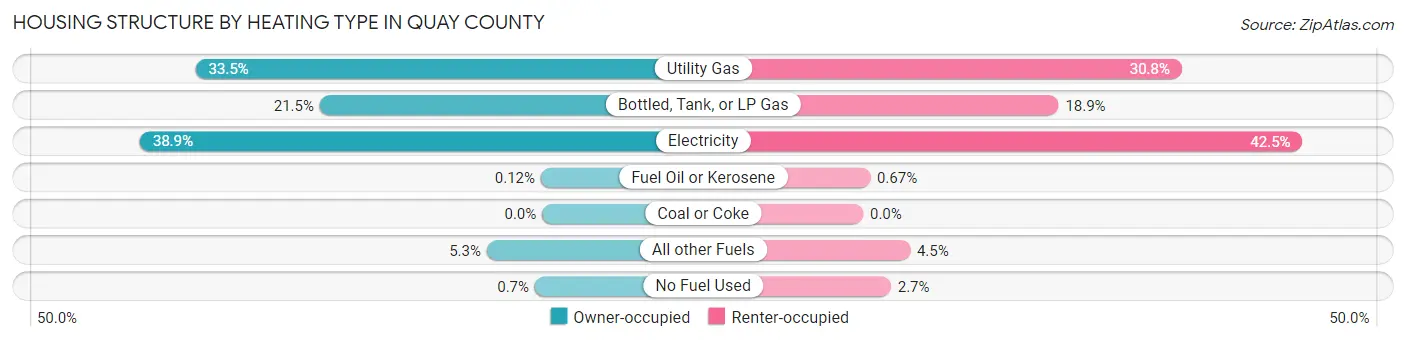
| Heating Type | Owner-occupied | Renter-occupied |
| Utility Gas | 859 (33.5%) | 367 (30.8%) |
| Bottled, Tank, or LP Gas | 551 (21.5%) | 225 (18.9%) |
| Electricity | 997 (38.9%) | 506 (42.4%) |
| Fuel Oil or Kerosene | 3 (0.1%) | 8 (0.7%) |
| Coal or Coke | 0 (0.0%) | 0 (0.0%) |
| All other Fuels | 137 (5.3%) | 54 (4.5%) |
| No Fuel Used | 18 (0.7%) | 32 (2.7%) |
| Total | 2,565 (100.0%) | 1,192 (100.0%) |
Household Vehicle Usage in Quay County
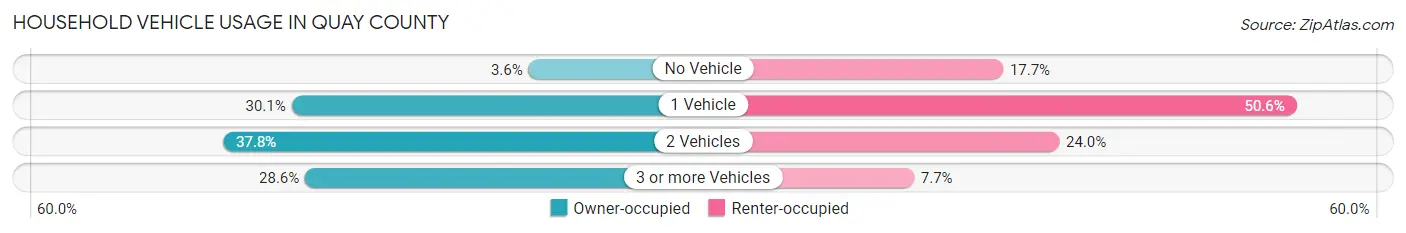
| Vehicles per Household | Owner-occupied | Renter-occupied |
| No Vehicle | 91 (3.5%) | 211 (17.7%) |
| 1 Vehicle | 772 (30.1%) | 603 (50.6%) |
| 2 Vehicles | 969 (37.8%) | 286 (24.0%) |
| 3 or more Vehicles | 733 (28.6%) | 92 (7.7%) |
| Total | 2,565 (100.0%) | 1,192 (100.0%) |
Real Estate & Mortgages in Quay County
Real Estate and Mortgage Overview in Quay County
| Characteristic | Without Mortgage | With Mortgage |
| Housing Units | 1,754 | 811 |
| Median Property Value | $82,200 | $68,000 |
| Median Household Income | $48,266 | $94 |
| Monthly Housing Costs | $378 | $3 |
| Real Estate Taxes | $407 | $115 |
Property Value by Mortgage Status in Quay County
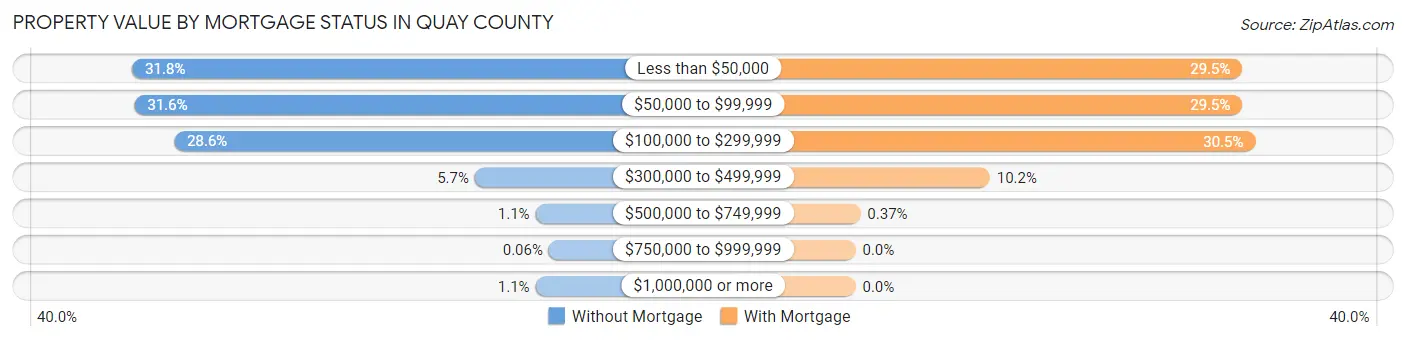
| Property Value | Without Mortgage | With Mortgage |
| Less than $50,000 | 558 (31.8%) | 239 (29.5%) |
| $50,000 to $99,999 | 555 (31.6%) | 239 (29.5%) |
| $100,000 to $299,999 | 502 (28.6%) | 247 (30.5%) |
| $300,000 to $499,999 | 100 (5.7%) | 83 (10.2%) |
| $500,000 to $749,999 | 19 (1.1%) | 3 (0.4%) |
| $750,000 to $999,999 | 1 (0.1%) | 0 (0.0%) |
| $1,000,000 or more | 19 (1.1%) | 0 (0.0%) |
| Total | 1,754 (100.0%) | 811 (100.0%) |
Household Income by Mortgage Status in Quay County
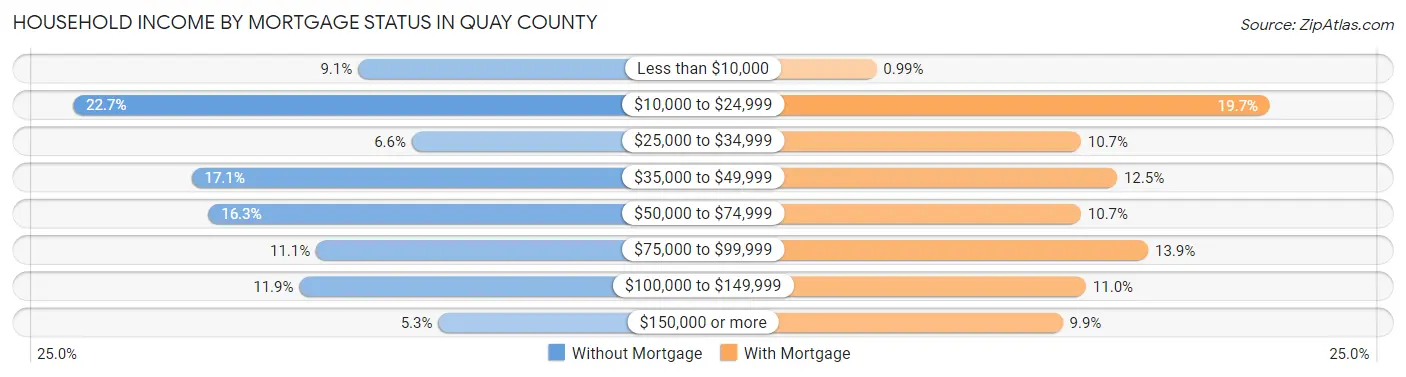
| Household Income | Without Mortgage | With Mortgage |
| Less than $10,000 | 160 (9.1%) | 8 (1.0%) |
| $10,000 to $24,999 | 398 (22.7%) | 160 (19.7%) |
| $25,000 to $34,999 | 115 (6.6%) | 87 (10.7%) |
| $35,000 to $49,999 | 299 (17.1%) | 101 (12.4%) |
| $50,000 to $74,999 | 285 (16.3%) | 87 (10.7%) |
| $75,000 to $99,999 | 195 (11.1%) | 113 (13.9%) |
| $100,000 to $149,999 | 209 (11.9%) | 89 (11.0%) |
| $150,000 or more | 93 (5.3%) | 80 (9.9%) |
| Total | 1,754 (100.0%) | 811 (100.0%) |
Property Value to Household Income Ratio in Quay County
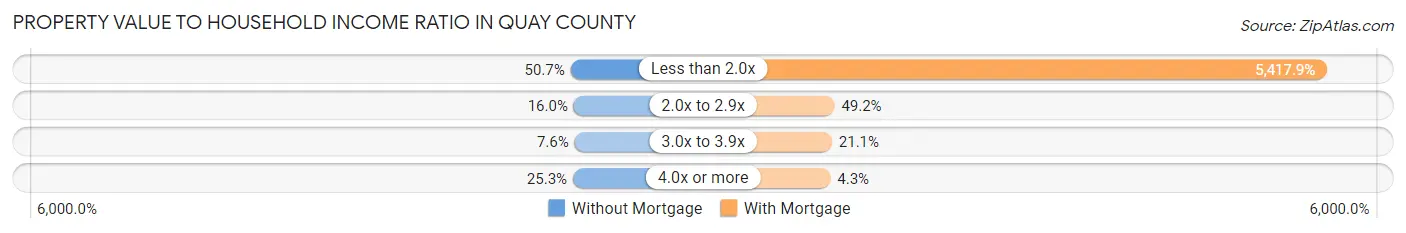
| Value-to-Income Ratio | Without Mortgage | With Mortgage |
| Less than 2.0x | 889 (50.7%) | 43,939 (5,417.9%) |
| 2.0x to 2.9x | 281 (16.0%) | 399 (49.2%) |
| 3.0x to 3.9x | 133 (7.6%) | 171 (21.1%) |
| 4.0x or more | 443 (25.3%) | 35 (4.3%) |
| Total | 1,754 (100.0%) | 811 (100.0%) |
Real Estate Taxes by Mortgage Status in Quay County
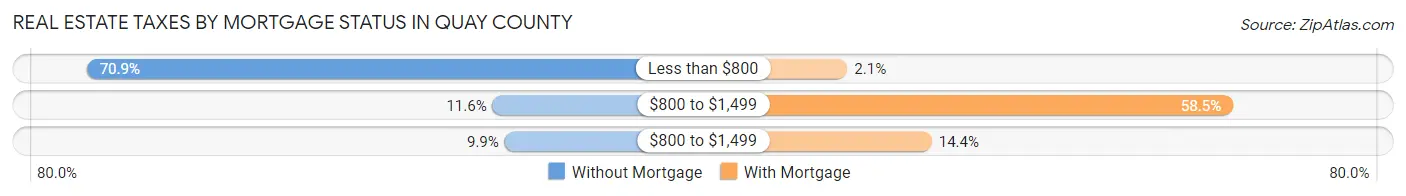
| Property Taxes | Without Mortgage | With Mortgage |
| Less than $800 | 1,244 (70.9%) | 17 (2.1%) |
| $800 to $1,499 | 204 (11.6%) | 474 (58.5%) |
| $800 to $1,499 | 173 (9.9%) | 117 (14.4%) |
| Total | 1,754 (100.0%) | 811 (100.0%) |
Health & Disability in Quay County
Health Insurance Coverage by Age in Quay County
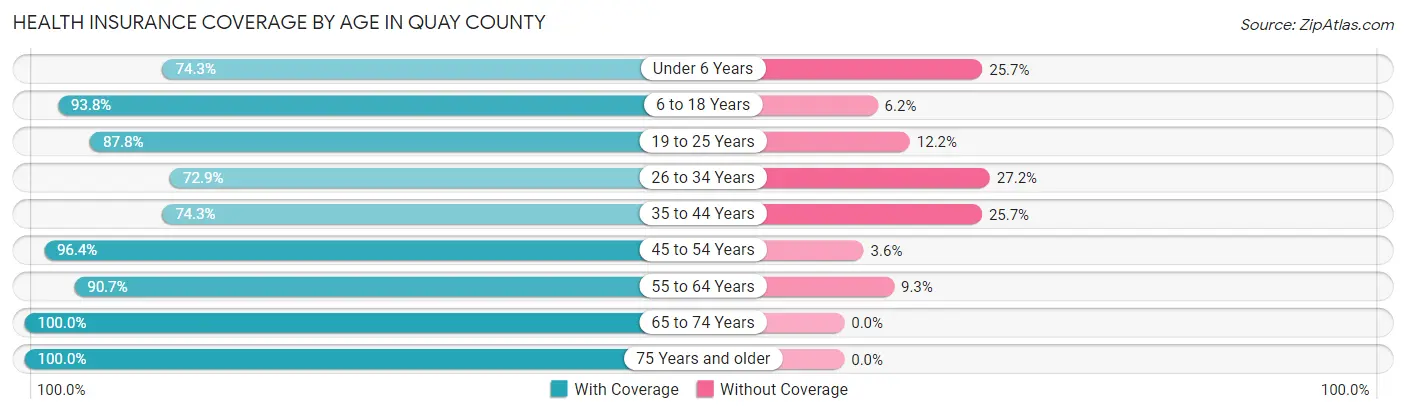
| Age Bracket | With Coverage | Without Coverage |
| Under 6 Years | 300 (74.3%) | 104 (25.7%) |
| 6 to 18 Years | 1,448 (93.8%) | 96 (6.2%) |
| 19 to 25 Years | 366 (87.8%) | 51 (12.2%) |
| 26 to 34 Years | 558 (72.9%) | 208 (27.2%) |
| 35 to 44 Years | 776 (74.3%) | 268 (25.7%) |
| 45 to 54 Years | 909 (96.4%) | 34 (3.6%) |
| 55 to 64 Years | 1,193 (90.7%) | 122 (9.3%) |
| 65 to 74 Years | 1,266 (100.0%) | 0 (0.0%) |
| 75 Years and older | 878 (100.0%) | 0 (0.0%) |
| Total | 7,694 (89.7%) | 883 (10.3%) |
Health Insurance Coverage by Citizenship Status in Quay County
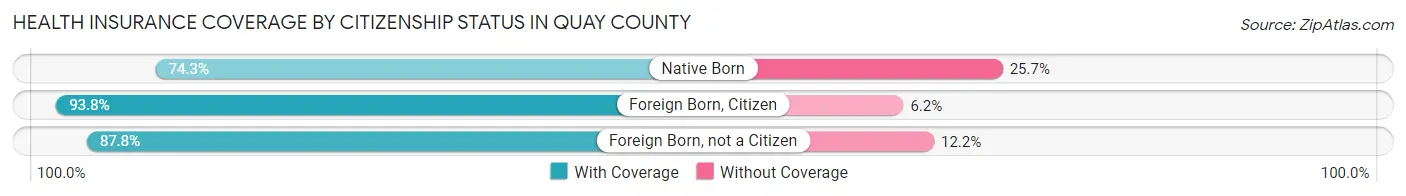
| Citizenship Status | With Coverage | Without Coverage |
| Native Born | 300 (74.3%) | 104 (25.7%) |
| Foreign Born, Citizen | 1,448 (93.8%) | 96 (6.2%) |
| Foreign Born, not a Citizen | 366 (87.8%) | 51 (12.2%) |
Health Insurance Coverage by Household Income in Quay County
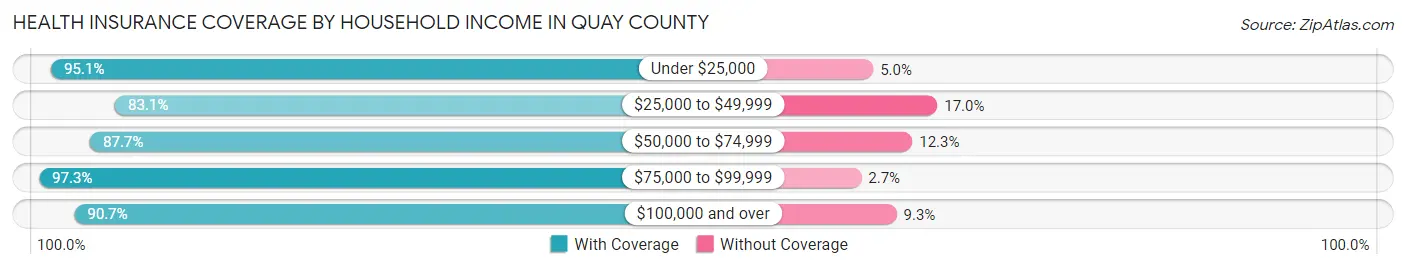
| Household Income | With Coverage | Without Coverage |
| Under $25,000 | 1,998 (95.1%) | 104 (5.0%) |
| $25,000 to $49,999 | 2,023 (83.1%) | 413 (17.0%) |
| $50,000 to $74,999 | 1,243 (87.7%) | 174 (12.3%) |
| $75,000 to $99,999 | 750 (97.3%) | 21 (2.7%) |
| $100,000 and over | 1,661 (90.7%) | 171 (9.3%) |
Public vs Private Health Insurance Coverage by Age in Quay County
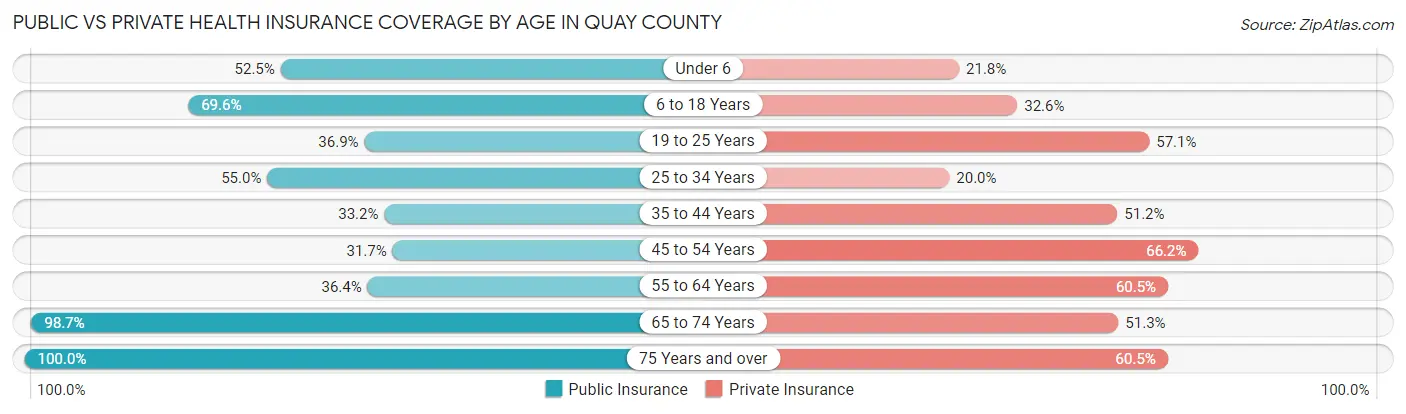
| Age Bracket | Public Insurance | Private Insurance |
| Under 6 | 212 (52.5%) | 88 (21.8%) |
| 6 to 18 Years | 1,075 (69.6%) | 503 (32.6%) |
| 19 to 25 Years | 154 (36.9%) | 238 (57.1%) |
| 25 to 34 Years | 421 (55.0%) | 153 (20.0%) |
| 35 to 44 Years | 347 (33.2%) | 534 (51.1%) |
| 45 to 54 Years | 299 (31.7%) | 624 (66.2%) |
| 55 to 64 Years | 478 (36.3%) | 796 (60.5%) |
| 65 to 74 Years | 1,250 (98.7%) | 650 (51.3%) |
| 75 Years and over | 878 (100.0%) | 531 (60.5%) |
| Total | 5,114 (59.6%) | 4,117 (48.0%) |
Disability Status by Sex by Age in Quay County
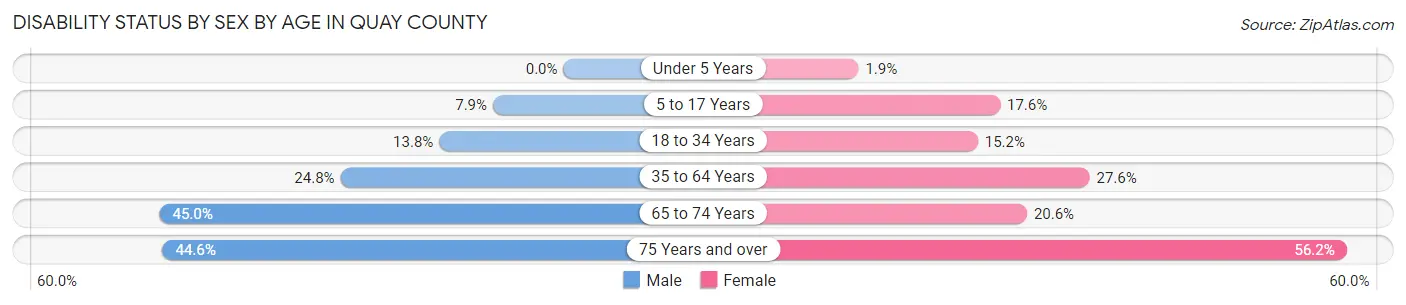
| Age Bracket | Male | Female |
| Under 5 Years | 0 (0.0%) | 4 (1.9%) |
| 5 to 17 Years | 65 (7.9%) | 135 (17.6%) |
| 18 to 34 Years | 70 (13.8%) | 113 (15.1%) |
| 35 to 64 Years | 431 (24.8%) | 432 (27.6%) |
| 65 to 74 Years | 277 (45.0%) | 134 (20.6%) |
| 75 Years and over | 187 (44.6%) | 258 (56.2%) |
Disability Class by Sex by Age in Quay County
Disability Class: Hearing Difficulty
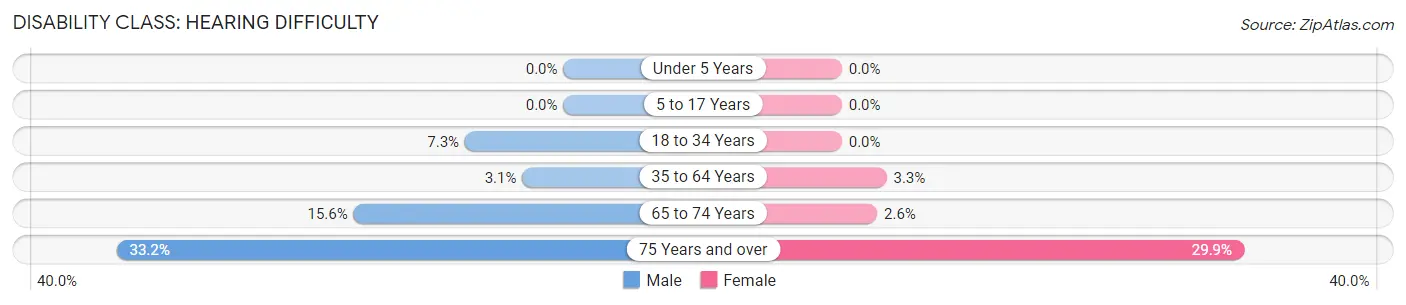
| Age Bracket | Male | Female |
| Under 5 Years | 0 (0.0%) | 0 (0.0%) |
| 5 to 17 Years | 0 (0.0%) | 0 (0.0%) |
| 18 to 34 Years | 37 (7.3%) | 0 (0.0%) |
| 35 to 64 Years | 53 (3.0%) | 52 (3.3%) |
| 65 to 74 Years | 96 (15.6%) | 17 (2.6%) |
| 75 Years and over | 139 (33.2%) | 137 (29.8%) |
Disability Class: Vision Difficulty
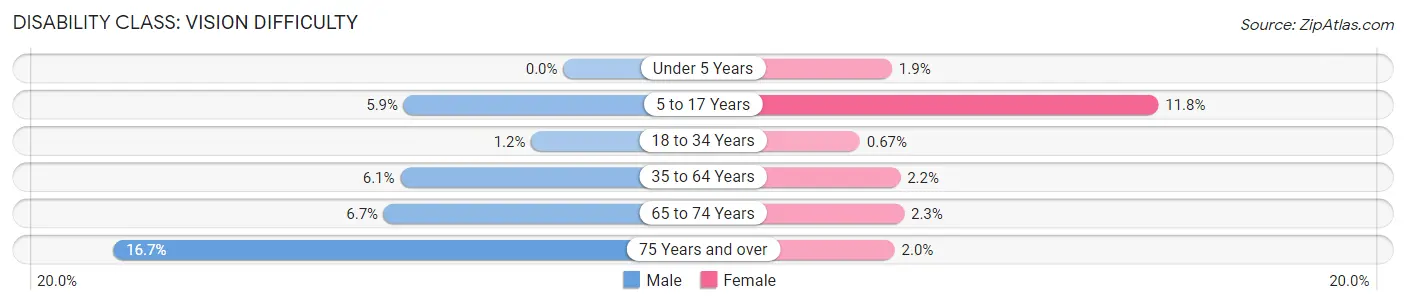
| Age Bracket | Male | Female |
| Under 5 Years | 0 (0.0%) | 4 (1.9%) |
| 5 to 17 Years | 49 (5.9%) | 90 (11.7%) |
| 18 to 34 Years | 6 (1.2%) | 5 (0.7%) |
| 35 to 64 Years | 105 (6.0%) | 34 (2.2%) |
| 65 to 74 Years | 41 (6.7%) | 15 (2.3%) |
| 75 Years and over | 70 (16.7%) | 9 (2.0%) |
Disability Class: Cognitive Difficulty
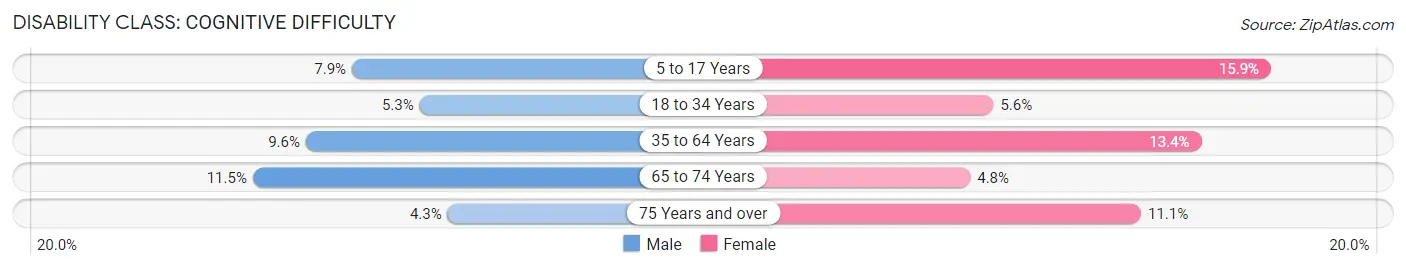
| Age Bracket | Male | Female |
| 5 to 17 Years | 65 (7.9%) | 122 (15.9%) |
| 18 to 34 Years | 27 (5.3%) | 42 (5.6%) |
| 35 to 64 Years | 166 (9.6%) | 209 (13.4%) |
| 65 to 74 Years | 71 (11.5%) | 31 (4.8%) |
| 75 Years and over | 18 (4.3%) | 51 (11.1%) |
Disability Class: Ambulatory Difficulty
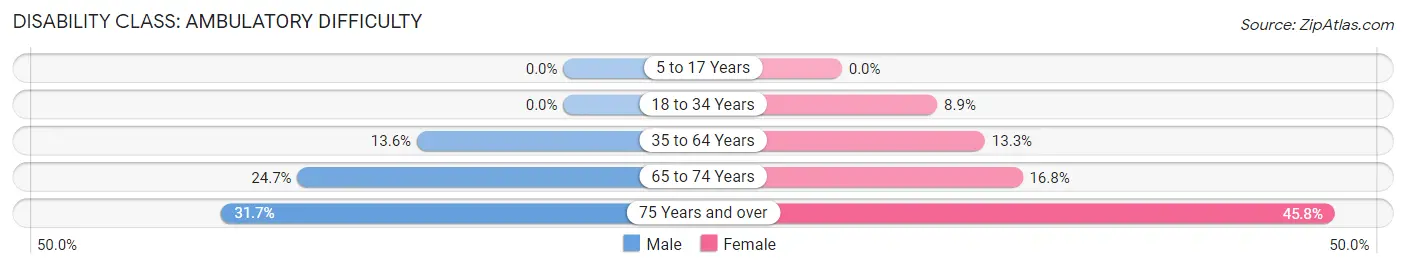
| Age Bracket | Male | Female |
| 5 to 17 Years | 0 (0.0%) | 0 (0.0%) |
| 18 to 34 Years | 0 (0.0%) | 66 (8.8%) |
| 35 to 64 Years | 236 (13.6%) | 208 (13.3%) |
| 65 to 74 Years | 152 (24.7%) | 109 (16.8%) |
| 75 Years and over | 133 (31.7%) | 210 (45.8%) |
Disability Class: Self-Care Difficulty
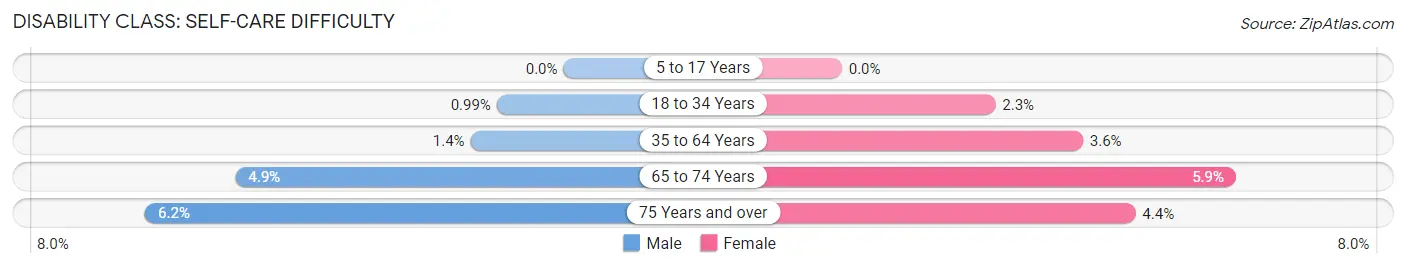
| Age Bracket | Male | Female |
| 5 to 17 Years | 0 (0.0%) | 0 (0.0%) |
| 18 to 34 Years | 5 (1.0%) | 17 (2.3%) |
| 35 to 64 Years | 24 (1.4%) | 56 (3.6%) |
| 65 to 74 Years | 30 (4.9%) | 38 (5.9%) |
| 75 Years and over | 26 (6.2%) | 20 (4.4%) |
Technology Access in Quay County
Computing Device Access in Quay County
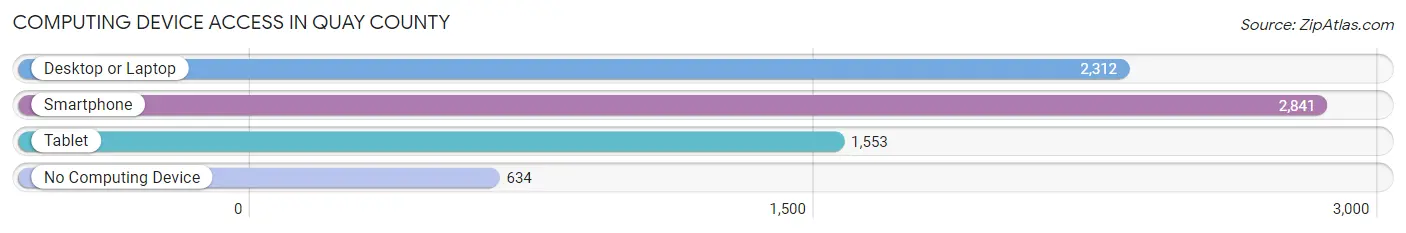
| Device Type | # Households | % Households |
| Desktop or Laptop | 2,312 | 61.5% |
| Smartphone | 2,841 | 75.6% |
| Tablet | 1,553 | 41.3% |
| No Computing Device | 634 | 16.9% |
| Total | 3,757 | 100.0% |
Internet Access in Quay County
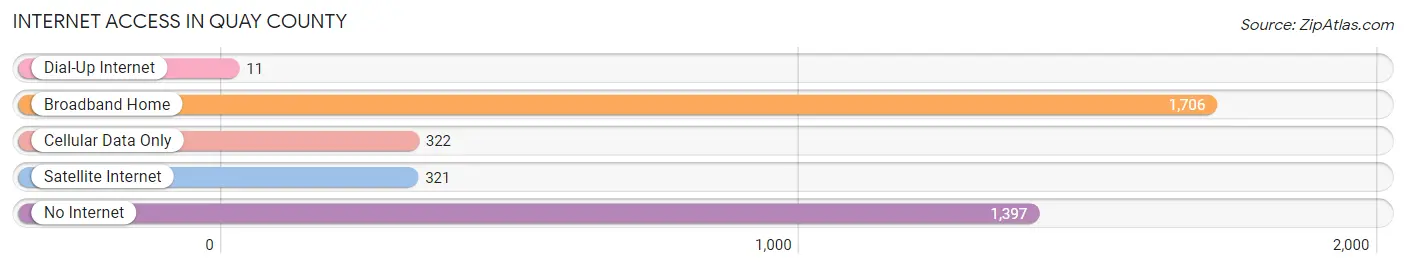
| Internet Type | # Households | % Households |
| Dial-Up Internet | 11 | 0.3% |
| Broadband Home | 1,706 | 45.4% |
| Cellular Data Only | 322 | 8.6% |
| Satellite Internet | 321 | 8.5% |
| No Internet | 1,397 | 37.2% |
| Total | 3,757 | 100.0% |
Quay County Summary
Quay County is located in the eastern part of the state of New Mexico, in the United States. It is bordered by Curry County to the north, Roosevelt County to the east, De Baca County to the south, and Guadalupe County to the west. The county seat is Tucumcari, and the largest city is also Tucumcari. The county was created in 1903 from the eastern part of Lincoln County.
Geography
Quay County covers an area of 2,945 square miles, making it the fourth-largest county in New Mexico. The county is located in the eastern part of the state, and is part of the Llano Estacado region. The county is mostly flat, with some rolling hills in the western part. The highest point in the county is the summit of Tucumcari Mountain, at an elevation of 5,979 feet. The county is drained by the Canadian River and its tributaries, including the Conchas River, the Ute Creek, and the North Canadian River.
The county is home to several protected areas, including the Conchas Lake State Park, the Ute Lake State Park, and the Ute Creek Wildlife Management Area. The county also contains the Quay Wildlife Refuge, which is managed by the U.S. Fish and Wildlife Service.
Economy
The economy of Quay County is largely based on agriculture and ranching. The county is home to several large cattle ranches, and the county is also a major producer of hay, wheat, and sorghum. The county is also home to several oil and gas fields, and the county is a major producer of oil and natural gas.
The county is also home to several manufacturing companies, including a large meatpacking plant in Tucumcari. The county is also home to several retail stores, including a Walmart Supercenter in Tucumcari.
Demographics
As of the 2010 census, the population of Quay County was 9,041. The population density was 3.1 people per square mile. The racial makeup of the county was 79.2% White, 0.7% African American, 1.2% Native American, 0.3% Asian, 0.1% Pacific Islander, 16.2% from other races, and 2.4% from two or more races. Hispanic or Latino of any race were 44.2% of the population.
The median income for a household in the county was $30,938, and the median income for a family was $35,938. The per capita income for the county was $15,938. About 17.2% of the population was below the poverty line.
The largest city in the county is Tucumcari, with a population of 5,989. Other cities in the county include Logan, San Jon, and House. The county is served by the Tucumcari Municipal Airport.
Common Questions
What is Per Capita Income in Quay County?
Per Capita income in Quay County is $25,348.
What is the Median Family Income in Quay County?
Median Family Income in Quay County is $49,970.
What is the Median Household income in Quay County?
Median Household Income in Quay County is $38,998.
What is Income or Wage Gap in Quay County?
Income or Wage Gap in Quay County is 16.3%.
Women in Quay County earn 83.7 cents for every dollar earned by a man.
What is Inequality or Gini Index in Quay County?
Inequality or Gini Index in Quay County is 0.46.
What is the Total Population of Quay County?
Total Population of Quay County is 8,641.
What is the Total Male Population of Quay County?
Total Male Population of Quay County is 4,206.
What is the Total Female Population of Quay County?
Total Female Population of Quay County is 4,435.
What is the Ratio of Males per 100 Females in Quay County?
There are 94.84 Males per 100 Females in Quay County.
What is the Ratio of Females per 100 Males in Quay County?
There are 105.44 Females per 100 Males in Quay County.
What is the Median Population Age in Quay County?
Median Population Age in Quay County is 46.6 Years.
What is the Average Family Size in Quay County
Average Family Size in Quay County is 3.2 People.
What is the Average Household Size in Quay County
Average Household Size in Quay County is 2.3 People.
How Large is the Labor Force in Quay County?
There are 3,658 People in the Labor Forcein in Quay County.
What is the Percentage of People in the Labor Force in Quay County?
52.9% of People are in the Labor Force in Quay County.
What is the Unemployment Rate in Quay County?
Unemployment Rate in Quay County is 4.8%.