Cibola County, NM Map & Demographics
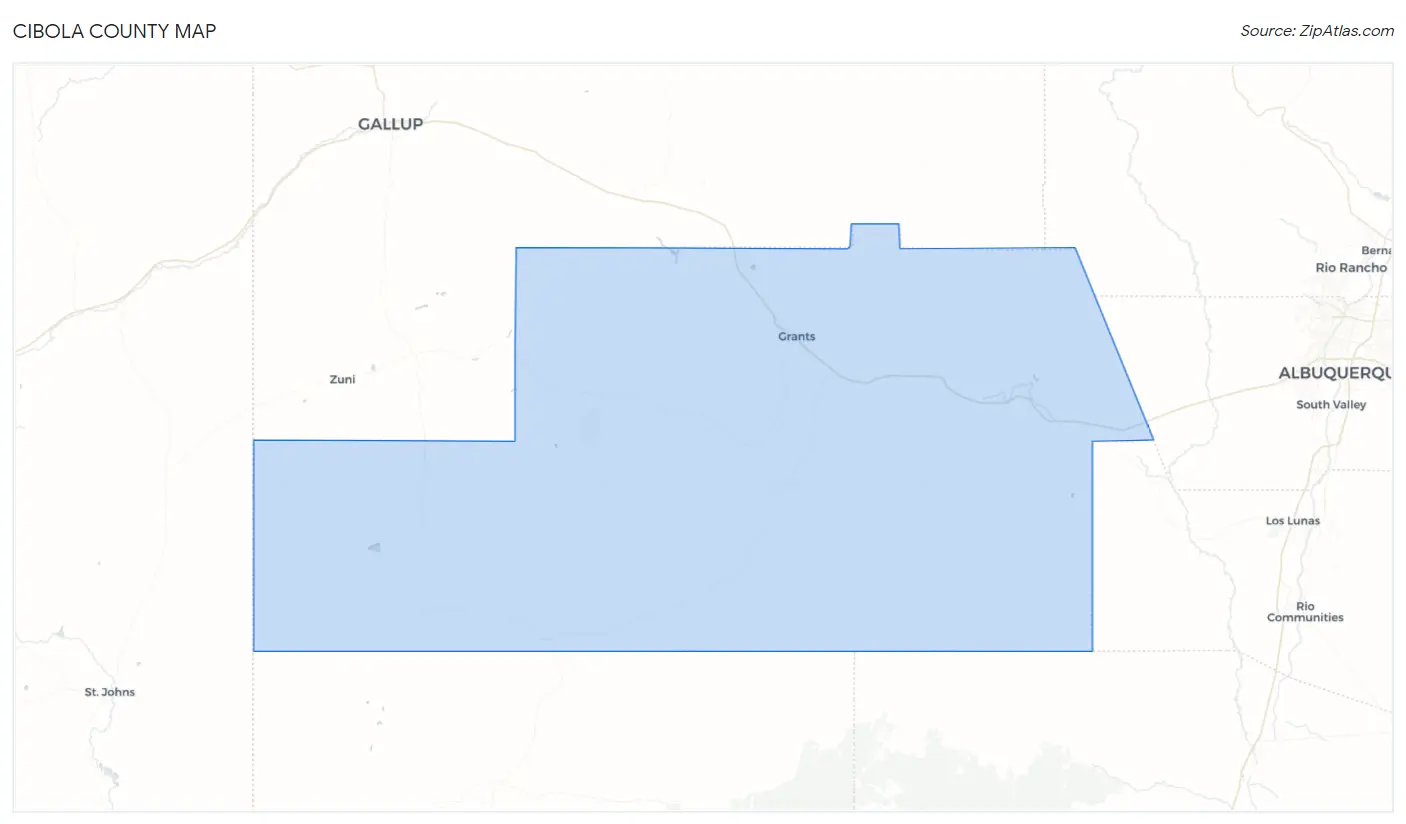
Cibola County Map
Cibola County Overview
$22,394
PER CAPITA INCOME
$61,609
AVG FAMILY INCOME
$49,866
AVG HOUSEHOLD INCOME
25.9%
WAGE / INCOME GAP [ % ]
74.1¢/ $1
WAGE / INCOME GAP [ $ ]
$9,082
FAMILY INCOME DEFICIT
0.43
INEQUALITY / GINI INDEX
27,211
TOTAL POPULATION
13,765
MALE POPULATION
13,446
FEMALE POPULATION
102.37
MALES / 100 FEMALES
97.68
FEMALES / 100 MALES
38.0
MEDIAN AGE
3.9
AVG FAMILY SIZE
3.2
AVG HOUSEHOLD SIZE
9,629
LABOR FORCE [ PEOPLE ]
45.1%
PERCENT IN LABOR FORCE
7.3%
UNEMPLOYMENT RATE
Cibola County Area Codes
Income in Cibola County
Income Overview in Cibola County
Per Capita Income in Cibola County is $22,394, while median incomes of families and households are $61,609 and $49,866 respectively.
| Characteristic | Number | Measure |
| Per Capita Income | 27,211 | $22,394 |
| Median Family Income | 5,571 | $61,609 |
| Mean Family Income | 5,571 | $71,520 |
| Median Household Income | 8,124 | $49,866 |
| Mean Household Income | 8,124 | $63,643 |
| Income Deficit | 5,571 | $9,082 |
| Wage / Income Gap (%) | 27,211 | 25.91% |
| Wage / Income Gap ($) | 27,211 | 74.09¢ per $1 |
| Gini / Inequality Index | 27,211 | 0.43 |
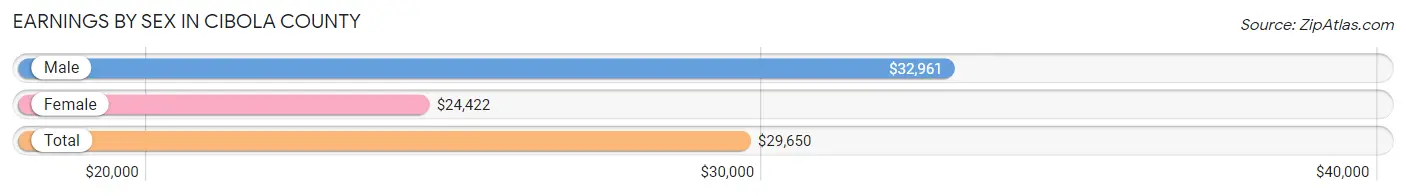
Earnings by Sex in Cibola County
Average Earnings in Cibola County are $29,650, $32,961 for men and $24,422 for women, a difference of 25.9%.
| Sex | Number | Average Earnings |
| Male | 6,239 (55.5%) | $32,961 |
| Female | 5,003 (44.5%) | $24,422 |
| Total | 11,242 (100.0%) | $29,650 |
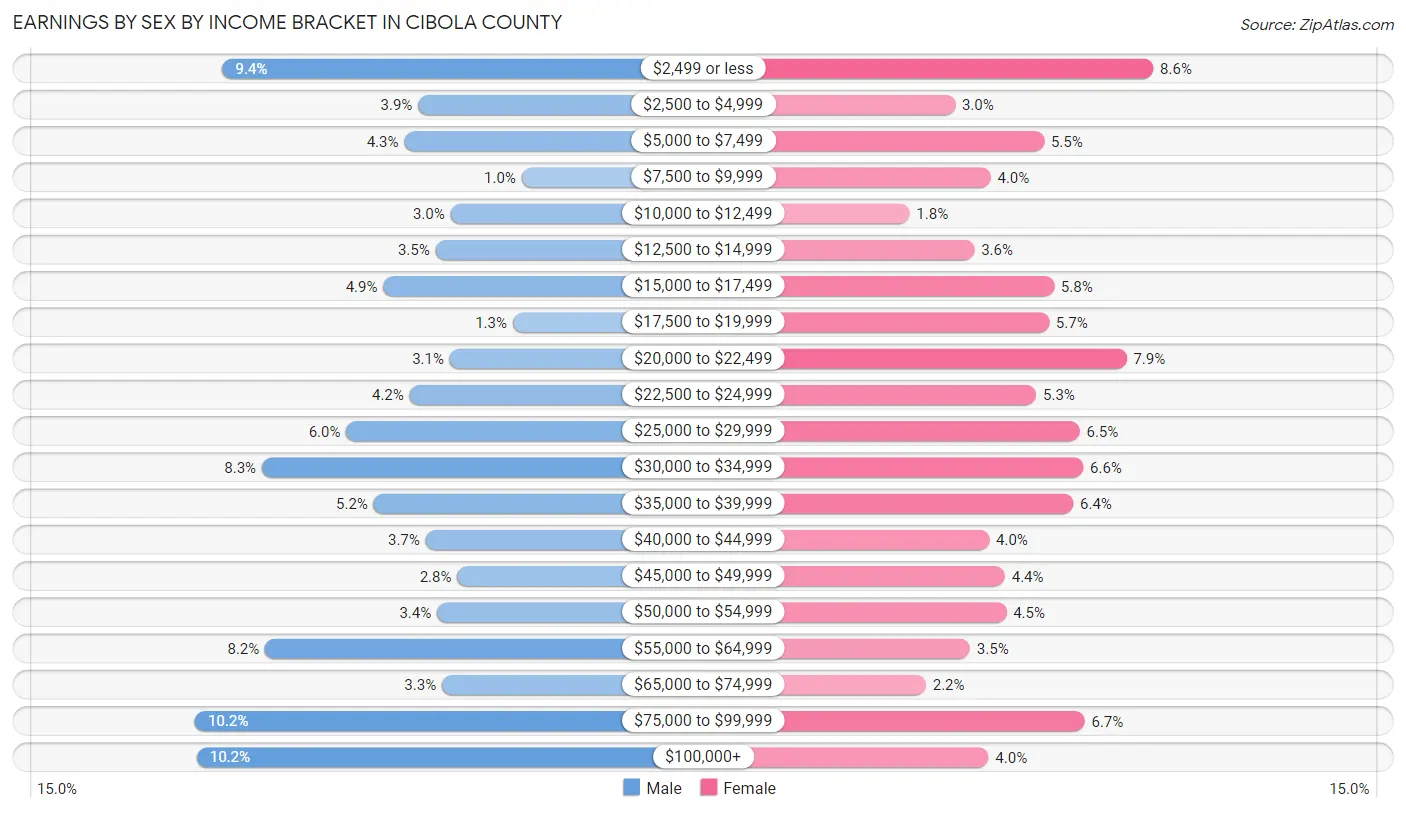
Earnings by Sex by Income Bracket in Cibola County
The most common earnings brackets in Cibola County are $75,000 to $99,999 for men (637 | 10.2%) and $2,499 or less for women (431 | 8.6%).
| Income | Male | Female |
| $2,499 or less | 589 (9.4%) | 431 (8.6%) |
| $2,500 to $4,999 | 246 (3.9%) | 152 (3.0%) |
| $5,000 to $7,499 | 270 (4.3%) | 277 (5.5%) |
| $7,500 to $9,999 | 64 (1.0%) | 202 (4.0%) |
| $10,000 to $12,499 | 189 (3.0%) | 88 (1.8%) |
| $12,500 to $14,999 | 215 (3.5%) | 179 (3.6%) |
| $15,000 to $17,499 | 307 (4.9%) | 291 (5.8%) |
| $17,500 to $19,999 | 80 (1.3%) | 284 (5.7%) |
| $20,000 to $22,499 | 190 (3.0%) | 393 (7.9%) |
| $22,500 to $24,999 | 261 (4.2%) | 266 (5.3%) |
| $25,000 to $29,999 | 372 (6.0%) | 327 (6.5%) |
| $30,000 to $34,999 | 520 (8.3%) | 332 (6.6%) |
| $35,000 to $39,999 | 324 (5.2%) | 318 (6.4%) |
| $40,000 to $44,999 | 233 (3.7%) | 200 (4.0%) |
| $45,000 to $49,999 | 177 (2.8%) | 222 (4.4%) |
| $50,000 to $54,999 | 213 (3.4%) | 224 (4.5%) |
| $55,000 to $64,999 | 514 (8.2%) | 173 (3.5%) |
| $65,000 to $74,999 | 204 (3.3%) | 111 (2.2%) |
| $75,000 to $99,999 | 637 (10.2%) | 334 (6.7%) |
| $100,000+ | 634 (10.2%) | 199 (4.0%) |
| Total | 6,239 (100.0%) | 5,003 (100.0%) |
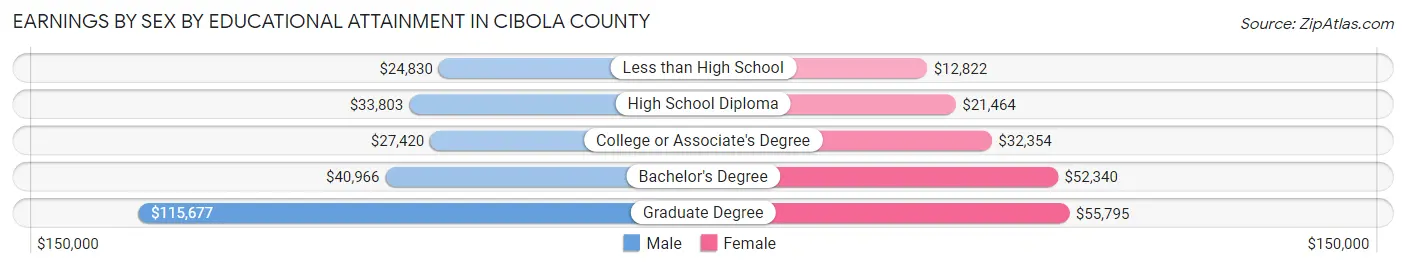
Earnings by Sex by Educational Attainment in Cibola County
Average earnings in Cibola County are $34,479 for men and $28,054 for women, a difference of 18.6%. Men with an educational attainment of graduate degree enjoy the highest average annual earnings of $115,677, while those with less than high school education earn the least with $24,830. Women with an educational attainment of graduate degree earn the most with the average annual earnings of $55,795, while those with less than high school education have the smallest earnings of $12,822.
| Educational Attainment | Male Income | Female Income |
| Less than High School | $24,830 | $12,822 |
| High School Diploma | $33,803 | $21,464 |
| College or Associate's Degree | $27,420 | $32,354 |
| Bachelor's Degree | $40,966 | $52,340 |
| Graduate Degree | $115,677 | $55,795 |
| Total | $34,479 | $28,054 |
Family Income in Cibola County
Family Income Brackets in Cibola County
According to the Cibola County family income data, there are 1,153 families falling into the $50,000 to $74,999 income range, which is the most common income bracket and makes up 20.7% of all families. Conversely, the $200,000+ income bracket is the least frequent group with only 111 families (2.0%) belonging to this category.
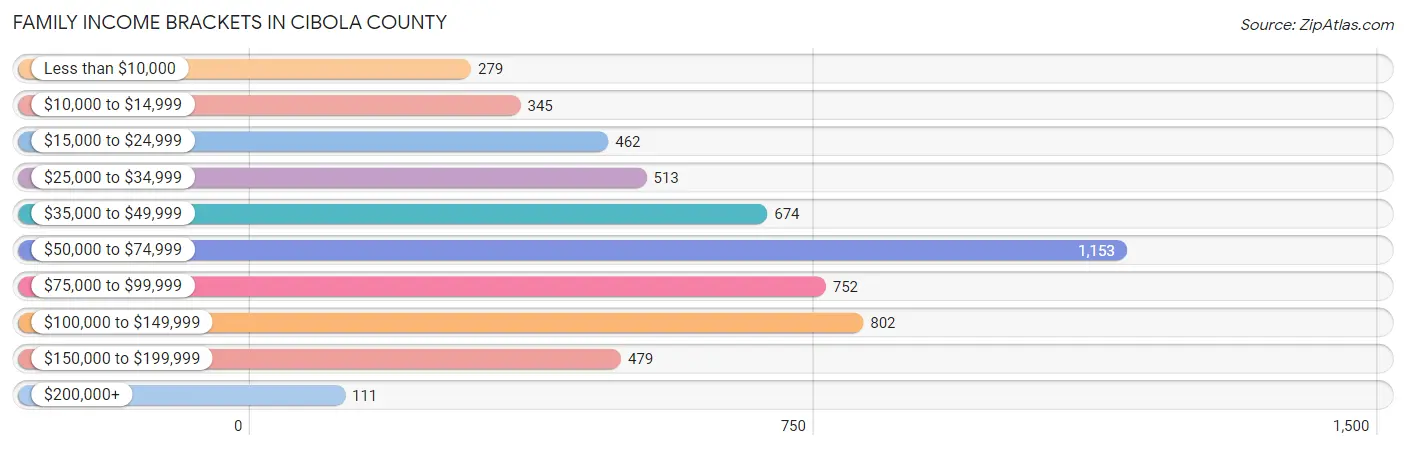
| Income Bracket | # Families | % Families |
| Less than $10,000 | 279 | 5.0% |
| $10,000 to $14,999 | 345 | 6.2% |
| $15,000 to $24,999 | 462 | 8.3% |
| $25,000 to $34,999 | 513 | 9.2% |
| $35,000 to $49,999 | 674 | 12.1% |
| $50,000 to $74,999 | 1,153 | 20.7% |
| $75,000 to $99,999 | 752 | 13.5% |
| $100,000 to $149,999 | 802 | 14.4% |
| $150,000 to $199,999 | 479 | 8.6% |
| $200,000+ | 111 | 2.0% |
Family Income by Famaliy Size in Cibola County
7+ person families (243 | 4.4%) account for the highest median family income in Cibola County with $81,406 per family, while 2-person families (2,843 | 51.0%) have the highest median income of $32,457 per family member.
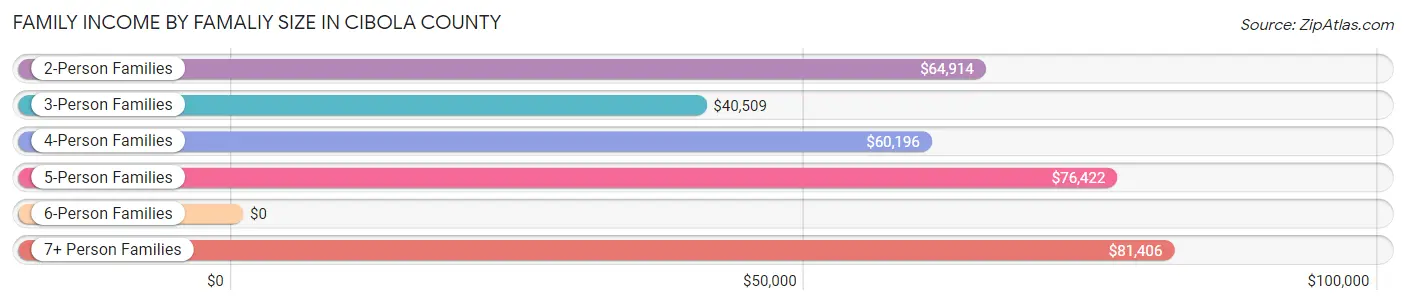
| Income Bracket | # Families | Median Income |
| 2-Person Families | 2,843 (51.0%) | $64,914 |
| 3-Person Families | 955 (17.1%) | $40,509 |
| 4-Person Families | 619 (11.1%) | $60,196 |
| 5-Person Families | 636 (11.4%) | $76,422 |
| 6-Person Families | 275 (4.9%) | $0 |
| 7+ Person Families | 243 (4.4%) | $81,406 |
| Total | 5,571 (100.0%) | $61,609 |
Family Income by Number of Earners in Cibola County
The median family income in Cibola County is $61,609, with families comprising 2 earners (1,650) having the highest median family income of $93,241, while families with no earners (1,406) have the lowest median family income of $28,864, accounting for 29.6% and 25.2% of families, respectively.
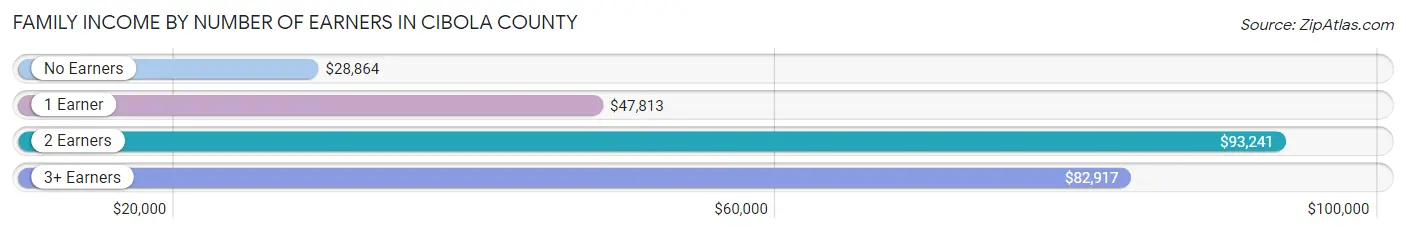
| Number of Earners | # Families | Median Income |
| No Earners | 1,406 (25.2%) | $28,864 |
| 1 Earner | 1,988 (35.7%) | $47,813 |
| 2 Earners | 1,650 (29.6%) | $93,241 |
| 3+ Earners | 527 (9.5%) | $82,917 |
| Total | 5,571 (100.0%) | $61,609 |
Household Income in Cibola County
Household Income Brackets in Cibola County
With 1,479 households falling in the category, the $50,000 to $74,999 income range is the most frequent in Cibola County, accounting for 18.2% of all households. In contrast, only 162 households (2.0%) fall into the $200,000+ income bracket, making it the least populous group.
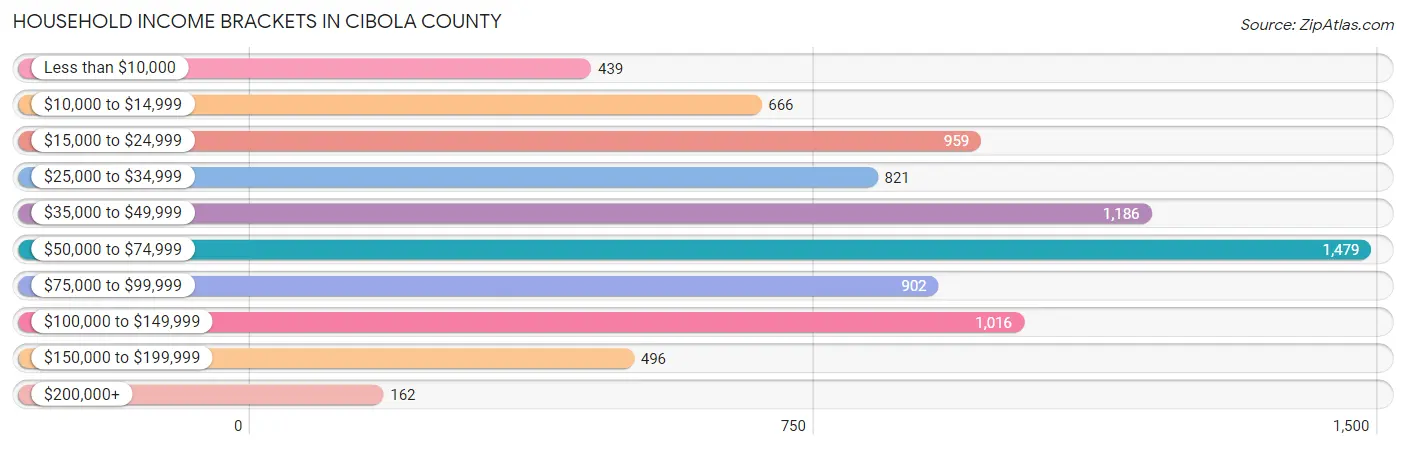
| Income Bracket | # Households | % Households |
| Less than $10,000 | 439 | 5.4% |
| $10,000 to $14,999 | 666 | 8.2% |
| $15,000 to $24,999 | 959 | 11.8% |
| $25,000 to $34,999 | 821 | 10.1% |
| $35,000 to $49,999 | 1,186 | 14.6% |
| $50,000 to $74,999 | 1,479 | 18.2% |
| $75,000 to $99,999 | 902 | 11.1% |
| $100,000 to $149,999 | 1,016 | 12.5% |
| $150,000 to $199,999 | 496 | 6.1% |
| $200,000+ | 162 | 2.0% |
Household Income by Householder Age in Cibola County
The median household income in Cibola County is $49,866, with the highest median household income of $72,845 found in the 25 to 44 years age bracket for the primary householder. A total of 1,953 households (24.0%) fall into this category. Meanwhile, the 15 to 24 years age bracket for the primary householder has the lowest median household income of $23,672, with 191 households (2.4%) in this group.
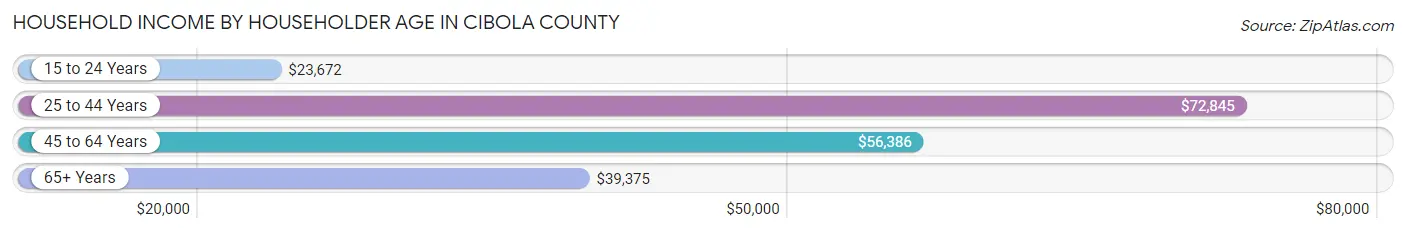
| Income Bracket | # Households | Median Income |
| 15 to 24 Years | 191 (2.4%) | $23,672 |
| 25 to 44 Years | 1,953 (24.0%) | $72,845 |
| 45 to 64 Years | 3,213 (39.6%) | $56,386 |
| 65+ Years | 2,767 (34.1%) | $39,375 |
| Total | 8,124 (100.0%) | $49,866 |
Poverty in Cibola County
Income Below Poverty by Sex and Age in Cibola County
With 26.8% poverty level for males and 27.8% for females among the residents of Cibola County, 16 and 17 year old males and 16 and 17 year old females are the most vulnerable to poverty, with 179 males (69.4%) and 186 females (57.1%) in their respective age groups living below the poverty level.
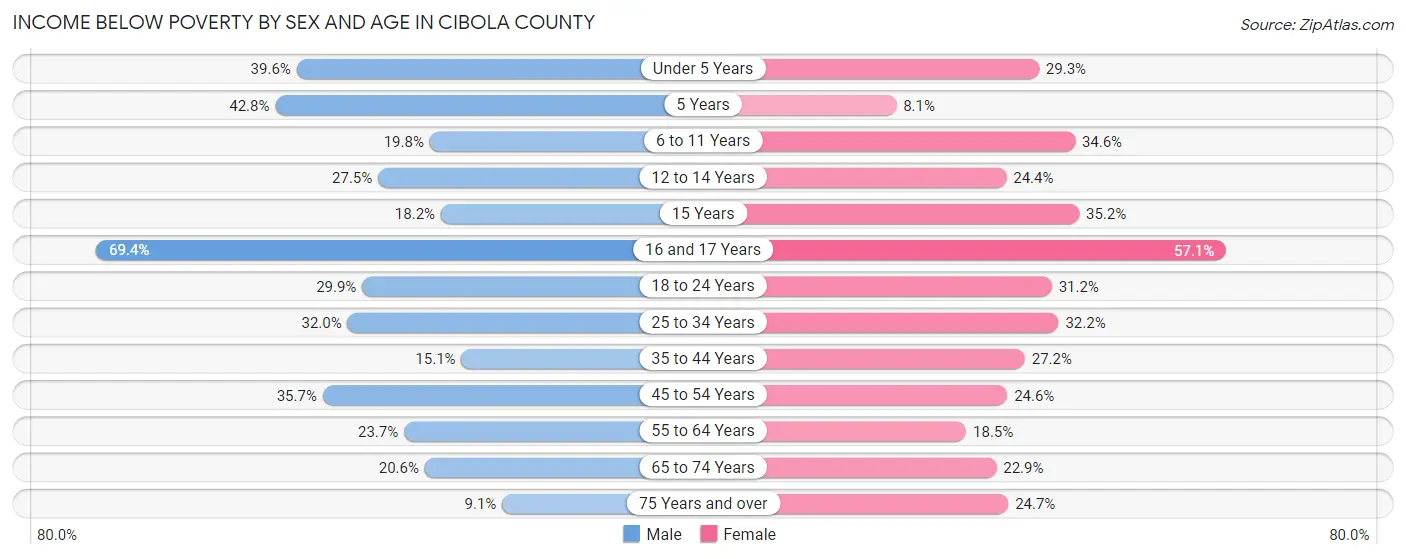
| Age Bracket | Male | Female |
| Under 5 Years | 394 (39.6%) | 214 (29.3%) |
| 5 Years | 71 (42.8%) | 8 (8.1%) |
| 6 to 11 Years | 230 (19.8%) | 557 (34.6%) |
| 12 to 14 Years | 115 (27.5%) | 94 (24.4%) |
| 15 Years | 16 (18.2%) | 68 (35.2%) |
| 16 and 17 Years | 179 (69.4%) | 186 (57.1%) |
| 18 to 24 Years | 333 (29.9%) | 355 (31.2%) |
| 25 to 34 Years | 610 (32.0%) | 540 (32.2%) |
| 35 to 44 Years | 224 (15.1%) | 403 (27.2%) |
| 45 to 54 Years | 501 (35.7%) | 351 (24.6%) |
| 55 to 64 Years | 385 (23.7%) | 314 (18.5%) |
| 65 to 74 Years | 259 (20.6%) | 326 (22.9%) |
| 75 Years and over | 72 (9.1%) | 258 (24.7%) |
| Total | 3,389 (26.8%) | 3,674 (27.8%) |
Income Above Poverty by Sex and Age in Cibola County
According to the poverty statistics in Cibola County, males aged 75 years and over and females aged 5 years are the age groups that are most secure financially, with 90.9% of males and 91.9% of females in these age groups living above the poverty line.
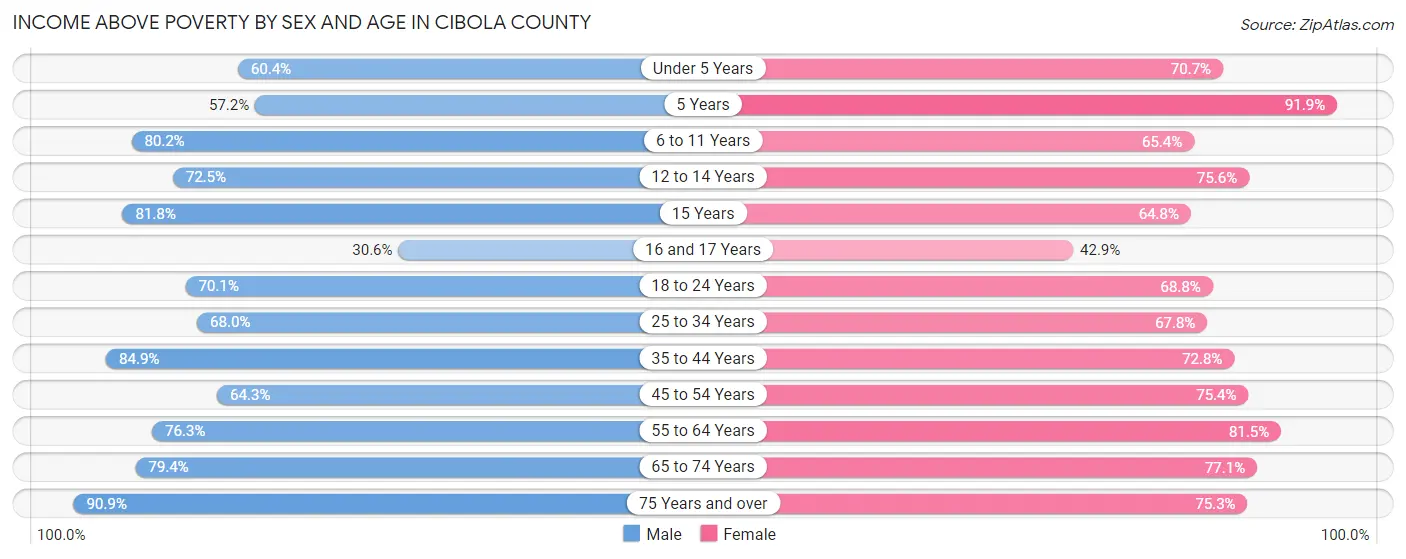
| Age Bracket | Male | Female |
| Under 5 Years | 601 (60.4%) | 517 (70.7%) |
| 5 Years | 95 (57.2%) | 91 (91.9%) |
| 6 to 11 Years | 929 (80.2%) | 1,052 (65.4%) |
| 12 to 14 Years | 303 (72.5%) | 291 (75.6%) |
| 15 Years | 72 (81.8%) | 125 (64.8%) |
| 16 and 17 Years | 79 (30.6%) | 140 (42.9%) |
| 18 to 24 Years | 782 (70.1%) | 784 (68.8%) |
| 25 to 34 Years | 1,294 (68.0%) | 1,138 (67.8%) |
| 35 to 44 Years | 1,256 (84.9%) | 1,080 (72.8%) |
| 45 to 54 Years | 901 (64.3%) | 1,078 (75.4%) |
| 55 to 64 Years | 1,242 (76.3%) | 1,387 (81.5%) |
| 65 to 74 Years | 1,000 (79.4%) | 1,095 (77.1%) |
| 75 Years and over | 721 (90.9%) | 786 (75.3%) |
| Total | 9,275 (73.2%) | 9,564 (72.3%) |
Income Below Poverty Among Married-Couple Families in Cibola County
The poverty statistics for married-couple families in Cibola County show that 13.7% or 501 of the total 3,648 families live below the poverty line. Families with 3 or 4 children have the highest poverty rate of 39.4%, comprising of 157 families. On the other hand, families with 1 or 2 children have the lowest poverty rate of 9.0%, which includes 76 families.
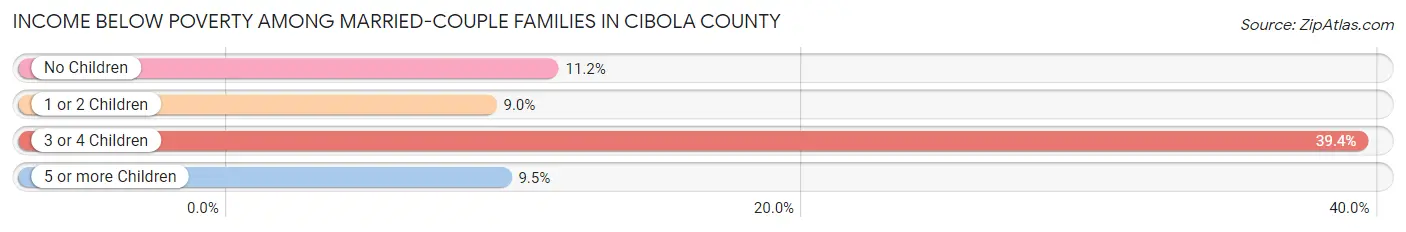
| Children | Above Poverty | Below Poverty |
| No Children | 2,118 (88.8%) | 266 (11.2%) |
| 1 or 2 Children | 768 (91.0%) | 76 (9.0%) |
| 3 or 4 Children | 242 (60.7%) | 157 (39.4%) |
| 5 or more Children | 19 (90.5%) | 2 (9.5%) |
| Total | 3,147 (86.3%) | 501 (13.7%) |
Income Below Poverty Among Single-Parent Households in Cibola County
According to the poverty data in Cibola County, 29.1% or 190 single-father households and 49.0% or 623 single-mother households are living below the poverty line. Among single-father households, those with 3 or 4 children have the highest poverty rate, with 50 households (45.9%) experiencing poverty. Likewise, among single-mother households, those with 3 or 4 children have the highest poverty rate, with 132 households (91.7%) falling below the poverty line.
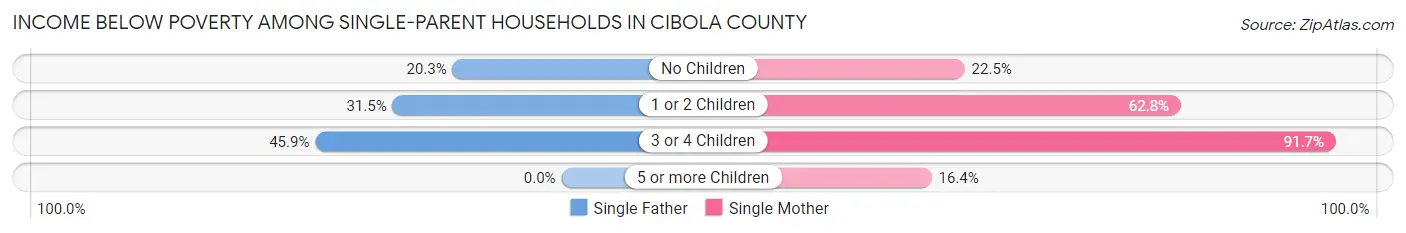
| Children | Single Father | Single Mother |
| No Children | 56 (20.3%) | 107 (22.5%) |
| 1 or 2 Children | 84 (31.5%) | 375 (62.8%) |
| 3 or 4 Children | 50 (45.9%) | 132 (91.7%) |
| 5 or more Children | 0 (0.0%) | 9 (16.4%) |
| Total | 190 (29.1%) | 623 (49.0%) |
Income Below Poverty Among Married-Couple vs Single-Parent Households in Cibola County
The poverty data for Cibola County shows that 501 of the married-couple family households (13.7%) and 813 of the single-parent households (42.3%) are living below the poverty level. Within the married-couple family households, those with 3 or 4 children have the highest poverty rate, with 157 households (39.4%) falling below the poverty line. Among the single-parent households, those with 3 or 4 children have the highest poverty rate, with 182 household (71.9%) living below poverty.
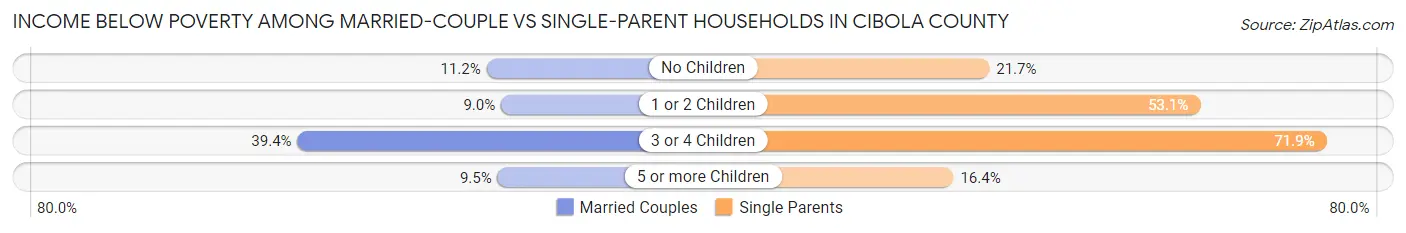
| Children | Married-Couple Families | Single-Parent Households |
| No Children | 266 (11.2%) | 163 (21.7%) |
| 1 or 2 Children | 76 (9.0%) | 459 (53.1%) |
| 3 or 4 Children | 157 (39.4%) | 182 (71.9%) |
| 5 or more Children | 2 (9.5%) | 9 (16.4%) |
| Total | 501 (13.7%) | 813 (42.3%) |
Race in Cibola County
The most populous races in Cibola County are White / Caucasian (11,620 | 42.7%), Native / Alaskan (11,353 | 41.7%), and Hispanic or Latino (10,461 | 38.4%).
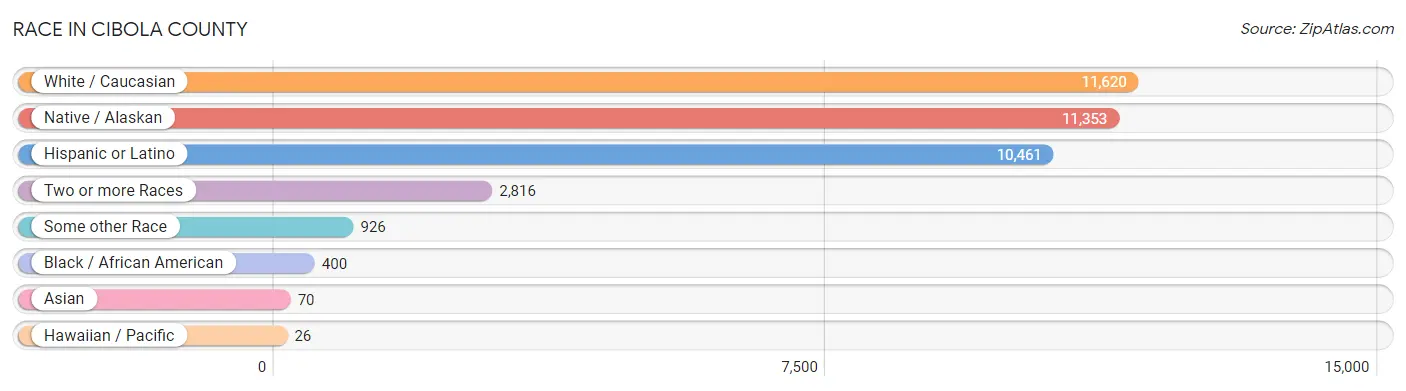
| Race | # Population | % Population |
| Asian | 70 | 0.3% |
| Black / African American | 400 | 1.5% |
| Hawaiian / Pacific | 26 | 0.1% |
| Hispanic or Latino | 10,461 | 38.4% |
| Native / Alaskan | 11,353 | 41.7% |
| White / Caucasian | 11,620 | 42.7% |
| Two or more Races | 2,816 | 10.3% |
| Some other Race | 926 | 3.4% |
| Total | 27,211 | 100.0% |
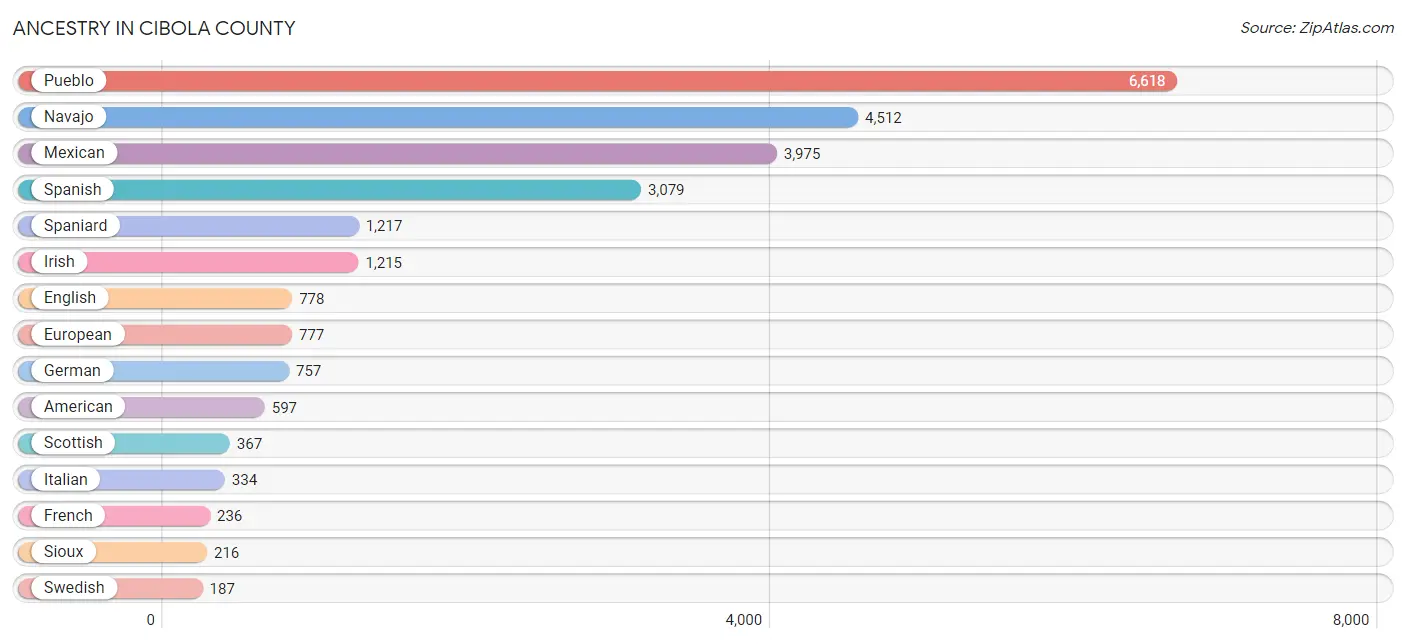
Ancestry in Cibola County
The most populous ancestries reported in Cibola County are Pueblo (6,618 | 24.3%), Navajo (4,512 | 16.6%), Mexican (3,975 | 14.6%), Spanish (3,079 | 11.3%), and Spaniard (1,217 | 4.5%), together accounting for 71.3% of all Cibola County residents.
| Ancestry | # Population | % Population |
| African | 19 | 0.1% |
| American | 597 | 2.2% |
| Apache | 141 | 0.5% |
| Arab | 26 | 0.1% |
| Arapaho | 22 | 0.1% |
| Bhutanese | 11 | 0.0% |
| British | 97 | 0.4% |
| Burmese | 11 | 0.0% |
| Canadian | 11 | 0.0% |
| Central American | 64 | 0.2% |
| Central American Indian | 87 | 0.3% |
| Cherokee | 118 | 0.4% |
| Cheyenne | 19 | 0.1% |
| Chippewa | 6 | 0.0% |
| Choctaw | 64 | 0.2% |
| Creek | 18 | 0.1% |
| Cuban | 16 | 0.1% |
| Czech | 19 | 0.1% |
| Czechoslovakian | 10 | 0.0% |
| Danish | 88 | 0.3% |
| Dutch | 136 | 0.5% |
| Eastern European | 45 | 0.2% |
| English | 778 | 2.9% |
| European | 777 | 2.9% |
| Finnish | 10 | 0.0% |
| French | 236 | 0.9% |
| French Canadian | 13 | 0.1% |
| German | 757 | 2.8% |
| Greek | 82 | 0.3% |
| Haitian | 8 | 0.0% |
| Honduran | 64 | 0.2% |
| Hopi | 117 | 0.4% |
| Hungarian | 19 | 0.1% |
| Indian (Asian) | 12 | 0.0% |
| Irish | 1,215 | 4.5% |
| Italian | 334 | 1.2% |
| Jamaican | 9 | 0.0% |
| Korean | 53 | 0.2% |
| Lebanese | 24 | 0.1% |
| Menominee | 4 | 0.0% |
| Mexican | 3,975 | 14.6% |
| Native Hawaiian | 6 | 0.0% |
| Navajo | 4,512 | 16.6% |
| Northern European | 12 | 0.0% |
| Norwegian | 81 | 0.3% |
| Paiute | 8 | 0.0% |
| Peruvian | 15 | 0.1% |
| Pima | 156 | 0.6% |
| Polish | 90 | 0.3% |
| Portuguese | 11 | 0.0% |
| Pueblo | 6,618 | 24.3% |
| Puerto Rican | 41 | 0.2% |
| Russian | 12 | 0.0% |
| Samoan | 14 | 0.1% |
| Scandinavian | 74 | 0.3% |
| Scotch-Irish | 66 | 0.2% |
| Scottish | 367 | 1.3% |
| Sioux | 216 | 0.8% |
| Slavic | 11 | 0.0% |
| Slovak | 7 | 0.0% |
| South American | 15 | 0.1% |
| Spaniard | 1,217 | 4.5% |
| Spanish | 3,079 | 11.3% |
| Spanish American | 108 | 0.4% |
| Sri Lankan | 44 | 0.2% |
| Subsaharan African | 19 | 0.1% |
| Swedish | 187 | 0.7% |
| Swiss | 133 | 0.5% |
| Tohono O'Odham | 90 | 0.3% |
| Ute | 131 | 0.5% |
| Welsh | 58 | 0.2% | View All 71 Rows |
Immigrants in Cibola County
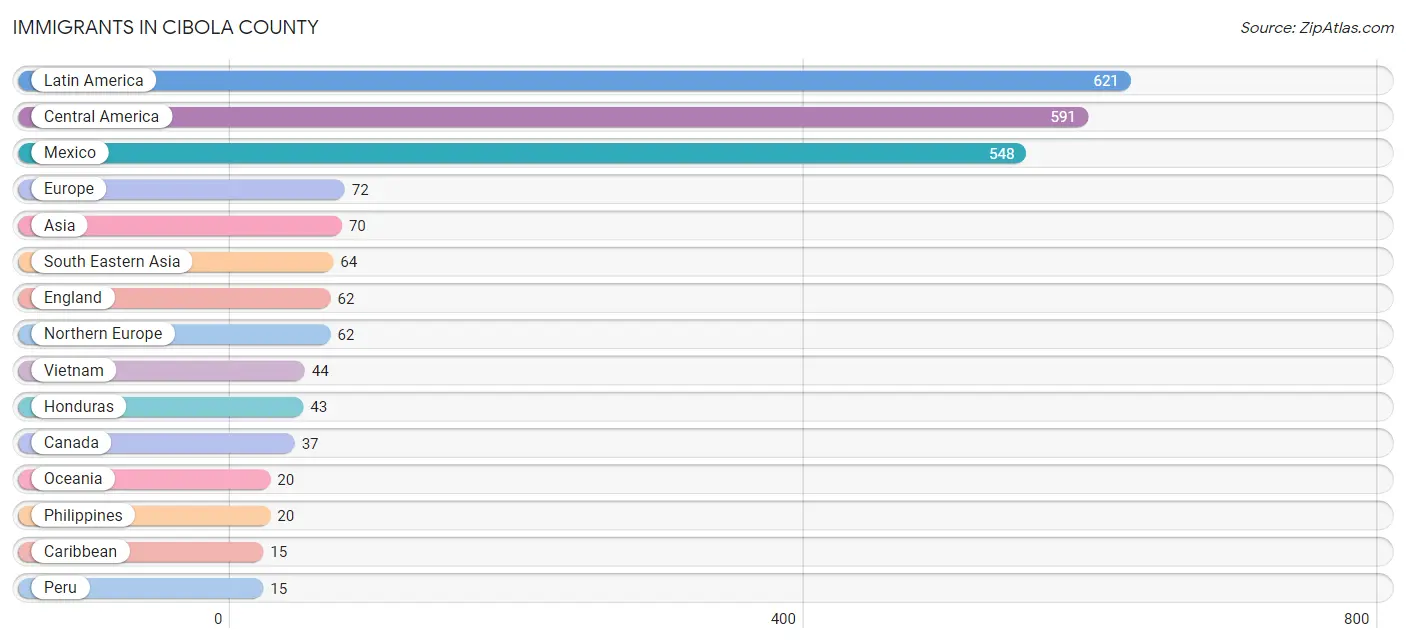
The most numerous immigrant groups reported in Cibola County came from Latin America (621 | 2.3%), Central America (591 | 2.2%), Mexico (548 | 2.0%), Europe (72 | 0.3%), and Asia (70 | 0.3%), together accounting for 7.0% of all Cibola County residents.
| Immigration Origin | # Population | % Population |
| Asia | 70 | 0.3% |
| Azores | 10 | 0.0% |
| Canada | 37 | 0.1% |
| Caribbean | 15 | 0.1% |
| Central America | 591 | 2.2% |
| China | 1 | 0.0% |
| Cuba | 7 | 0.0% |
| Eastern Asia | 6 | 0.0% |
| England | 62 | 0.2% |
| Europe | 72 | 0.3% |
| Haiti | 8 | 0.0% |
| Honduras | 43 | 0.2% |
| Japan | 5 | 0.0% |
| Latin America | 621 | 2.3% |
| Mexico | 548 | 2.0% |
| Micronesia | 6 | 0.0% |
| Northern Europe | 62 | 0.2% |
| Oceania | 20 | 0.1% |
| Peru | 15 | 0.1% |
| Philippines | 20 | 0.1% |
| Portugal | 10 | 0.0% |
| South America | 15 | 0.1% |
| South Eastern Asia | 64 | 0.2% |
| Southern Europe | 10 | 0.0% |
| Vietnam | 44 | 0.2% | View All 25 Rows |
Sex and Age in Cibola County
Sex and Age in Cibola County
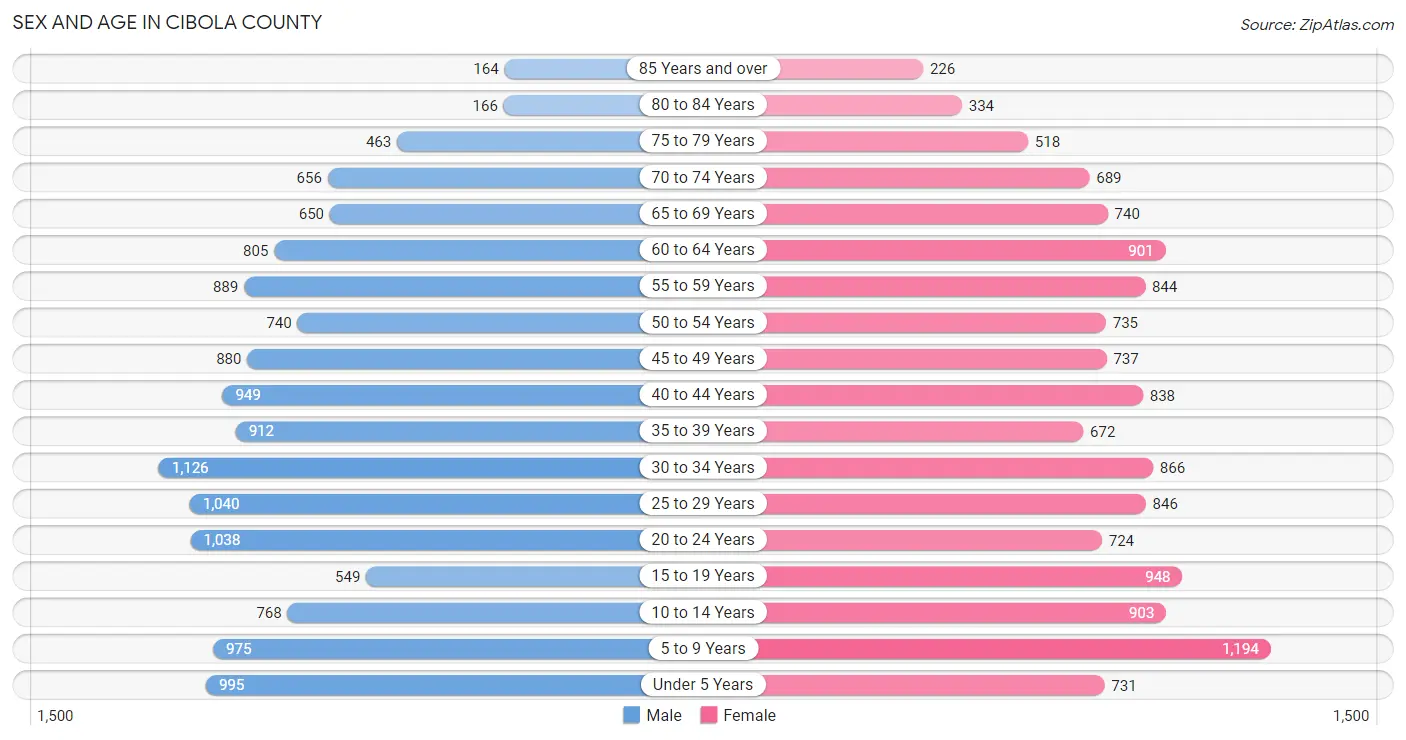
The most populous age groups in Cibola County are 30 to 34 Years (1,126 | 8.2%) for men and 5 to 9 Years (1,194 | 8.9%) for women.
| Age Bracket | Male | Female |
| Under 5 Years | 995 (7.2%) | 731 (5.4%) |
| 5 to 9 Years | 975 (7.1%) | 1,194 (8.9%) |
| 10 to 14 Years | 768 (5.6%) | 903 (6.7%) |
| 15 to 19 Years | 549 (4.0%) | 948 (7.0%) |
| 20 to 24 Years | 1,038 (7.5%) | 724 (5.4%) |
| 25 to 29 Years | 1,040 (7.6%) | 846 (6.3%) |
| 30 to 34 Years | 1,126 (8.2%) | 866 (6.4%) |
| 35 to 39 Years | 912 (6.6%) | 672 (5.0%) |
| 40 to 44 Years | 949 (6.9%) | 838 (6.2%) |
| 45 to 49 Years | 880 (6.4%) | 737 (5.5%) |
| 50 to 54 Years | 740 (5.4%) | 735 (5.5%) |
| 55 to 59 Years | 889 (6.5%) | 844 (6.3%) |
| 60 to 64 Years | 805 (5.9%) | 901 (6.7%) |
| 65 to 69 Years | 650 (4.7%) | 740 (5.5%) |
| 70 to 74 Years | 656 (4.8%) | 689 (5.1%) |
| 75 to 79 Years | 463 (3.4%) | 518 (3.8%) |
| 80 to 84 Years | 166 (1.2%) | 334 (2.5%) |
| 85 Years and over | 164 (1.2%) | 226 (1.7%) |
| Total | 13,765 (100.0%) | 13,446 (100.0%) |
Families and Households in Cibola County
Median Family Size in Cibola County
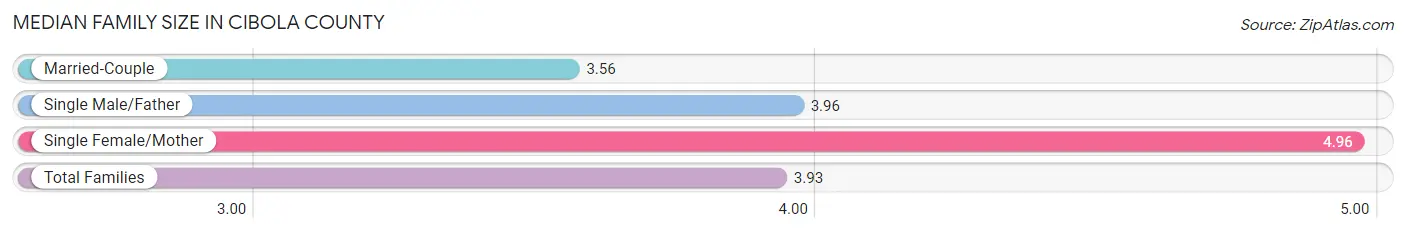
The median family size in Cibola County is 3.93 persons per family, with single female/mother families (1,271 | 22.8%) accounting for the largest median family size of 4.96 persons per family. On the other hand, married-couple families (3,648 | 65.5%) represent the smallest median family size with 3.56 persons per family.
| Family Type | # Families | Family Size |
| Married-Couple | 3,648 (65.5%) | 3.56 |
| Single Male/Father | 652 (11.7%) | 3.96 |
| Single Female/Mother | 1,271 (22.8%) | 4.96 |
| Total Families | 5,571 (100.0%) | 3.93 |
Median Household Size in Cibola County
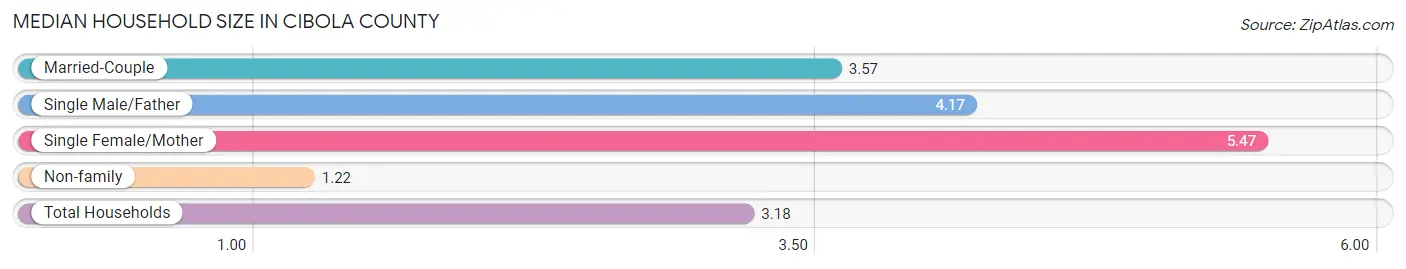
The median household size in Cibola County is 3.18 persons per household, with single female/mother households (1,271 | 15.7%) accounting for the largest median household size of 5.47 persons per household. non-family households (2,553 | 31.4%) represent the smallest median household size with 1.22 persons per household.
| Household Type | # Households | Household Size |
| Married-Couple | 3,648 (44.9%) | 3.57 |
| Single Male/Father | 652 (8.0%) | 4.17 |
| Single Female/Mother | 1,271 (15.7%) | 5.47 |
| Non-family | 2,553 (31.4%) | 1.22 |
| Total Households | 8,124 (100.0%) | 3.18 |
Household Size by Marriage Status in Cibola County
Out of a total of 8,124 households in Cibola County, 5,571 (68.6%) are family households, while 2,553 (31.4%) are nonfamily households. The most numerous type of family households are 2-person households, comprising 2,633, and the most common type of nonfamily households are 1-person households, comprising 2,078.
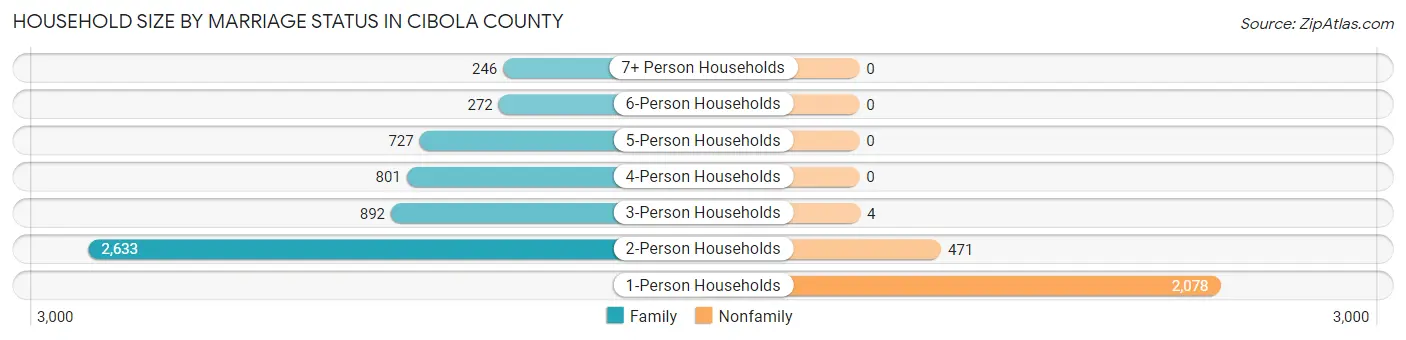
| Household Size | Family Households | Nonfamily Households |
| 1-Person Households | - | 2,078 (25.6%) |
| 2-Person Households | 2,633 (32.4%) | 471 (5.8%) |
| 3-Person Households | 892 (11.0%) | 4 (0.1%) |
| 4-Person Households | 801 (9.9%) | 0 (0.0%) |
| 5-Person Households | 727 (8.9%) | 0 (0.0%) |
| 6-Person Households | 272 (3.4%) | 0 (0.0%) |
| 7+ Person Households | 246 (3.0%) | 0 (0.0%) |
| Total | 5,571 (68.6%) | 2,553 (31.4%) |
Female Fertility in Cibola County
Fertility by Age in Cibola County
Average fertility rate in Cibola County is 45.0 births per 1,000 women. Women in the age bracket of 20 to 34 years have the highest fertility rate with 84.0 births per 1,000 women. Women in the age bracket of 20 to 34 years acount for 79.4% of all women with births.
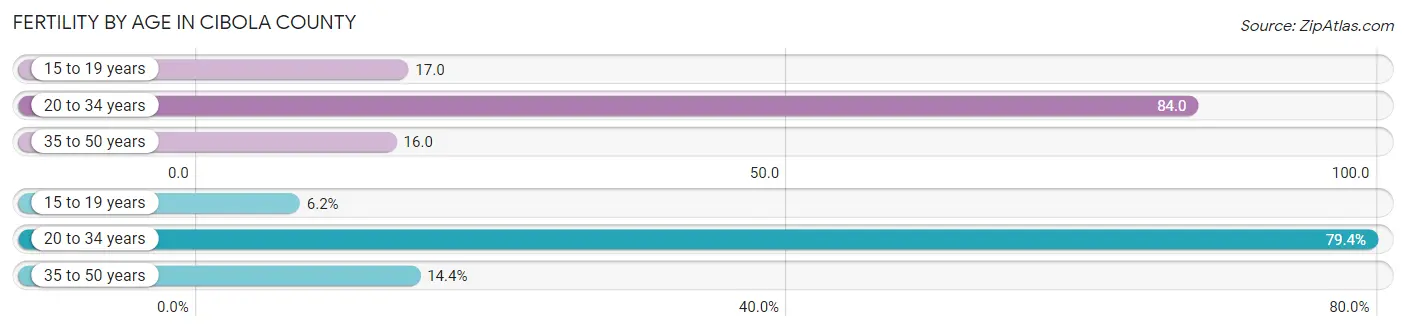
| Age Bracket | Women with Births | Births / 1,000 Women |
| 15 to 19 years | 16 (6.2%) | 17.0 |
| 20 to 34 years | 204 (79.4%) | 84.0 |
| 35 to 50 years | 37 (14.4%) | 16.0 |
| Total | 257 (100.0%) | 45.0 |
Fertility by Age by Marriage Status in Cibola County
35.4% of women with births (257) in Cibola County are married. The highest percentage of unmarried women with births falls into 15 to 19 years age bracket with 100.0% of them unmarried at the time of birth, while the lowest percentage of unmarried women with births belong to 20 to 34 years age bracket with 55.4% of them unmarried.
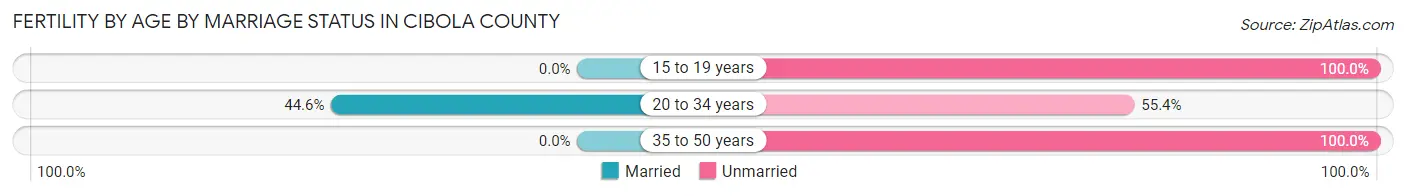
| Age Bracket | Married | Unmarried |
| 15 to 19 years | 0 (0.0%) | 16 (100.0%) |
| 20 to 34 years | 91 (44.6%) | 113 (55.4%) |
| 35 to 50 years | 0 (0.0%) | 37 (100.0%) |
| Total | 91 (35.4%) | 166 (64.6%) |
Fertility by Education in Cibola County
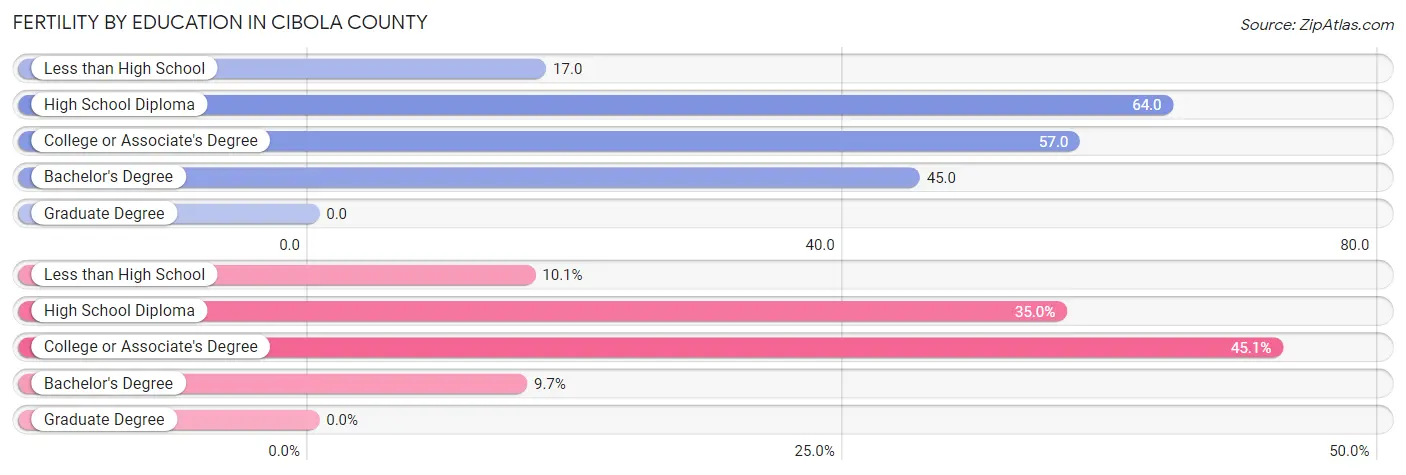
| Educational Attainment | Women with Births | Births / 1,000 Women |
| Less than High School | 26 (10.1%) | 17.0 |
| High School Diploma | 90 (35.0%) | 64.0 |
| College or Associate's Degree | 116 (45.1%) | 57.0 |
| Bachelor's Degree | 25 (9.7%) | 45.0 |
| Graduate Degree | 0 (0.0%) | 0.0 |
| Total | 257 (100.0%) | 45.0 |
Fertility by Education by Marriage Status in Cibola County
64.6% of women with births in Cibola County are unmarried. Women with the educational attainment of bachelor's degree are most likely to be married with 100.0% of them married at childbirth, while women with the educational attainment of less than high school are least likely to be married with 100.0% of them unmarried at childbirth.
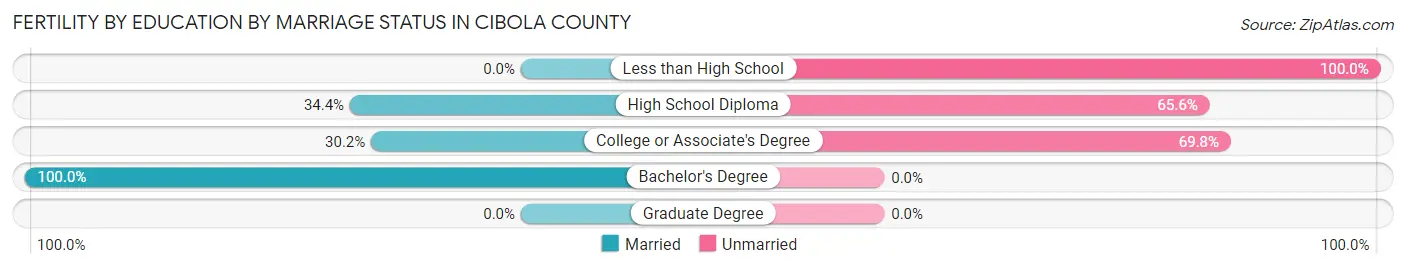
| Educational Attainment | Married | Unmarried |
| Less than High School | 0 (0.0%) | 26 (100.0%) |
| High School Diploma | 31 (34.4%) | 59 (65.6%) |
| College or Associate's Degree | 35 (30.2%) | 81 (69.8%) |
| Bachelor's Degree | 25 (100.0%) | 0 (0.0%) |
| Graduate Degree | 0 (0.0%) | 0 (0.0%) |
| Total | 91 (35.4%) | 166 (64.6%) |
Employment Characteristics in Cibola County
Employment by Class of Employer in Cibola County
Among the 8,842 employed individuals in Cibola County, private company employees (4,588 | 51.9%), local government employees (1,311 | 14.8%), and federal government employees (1,093 | 12.4%) make up the most common classes of employment.
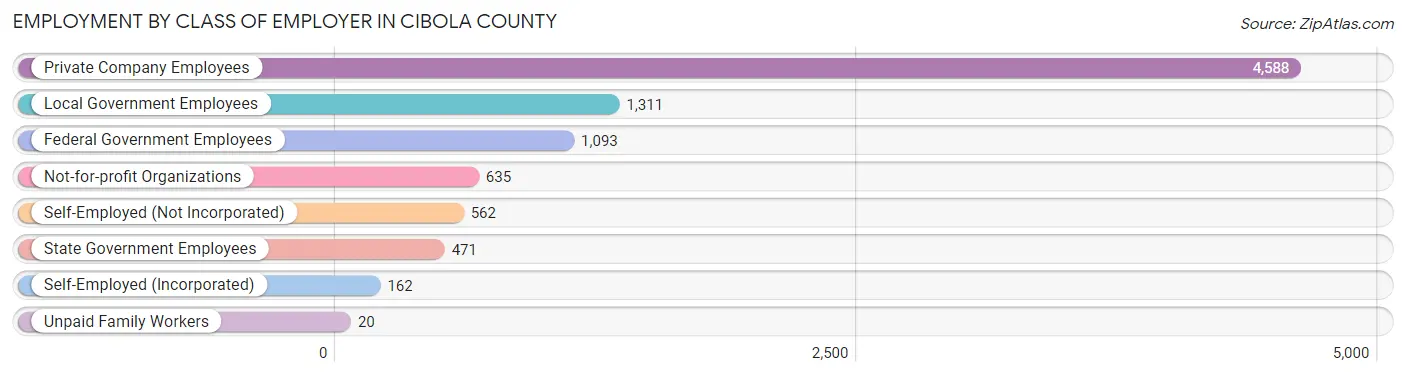
| Employer Class | # Employees | % Employees |
| Private Company Employees | 4,588 | 51.9% |
| Self-Employed (Incorporated) | 162 | 1.8% |
| Self-Employed (Not Incorporated) | 562 | 6.4% |
| Not-for-profit Organizations | 635 | 7.2% |
| Local Government Employees | 1,311 | 14.8% |
| State Government Employees | 471 | 5.3% |
| Federal Government Employees | 1,093 | 12.4% |
| Unpaid Family Workers | 20 | 0.2% |
| Total | 8,842 | 100.0% |
Employment Status by Age in Cibola County
According to the labor force statistics for Cibola County, out of the total population over 16 years of age (21,350), 45.1% or 9,629 individuals are in the labor force, with 7.3% or 703 of them unemployed. The age group with the highest labor force participation rate is 30 to 34 years, with 66.5% or 1,325 individuals in the labor force. Within the labor force, the 16 to 19 years age range has the highest percentage of unemployed individuals, with 25.0% or 111 of them being unemployed.
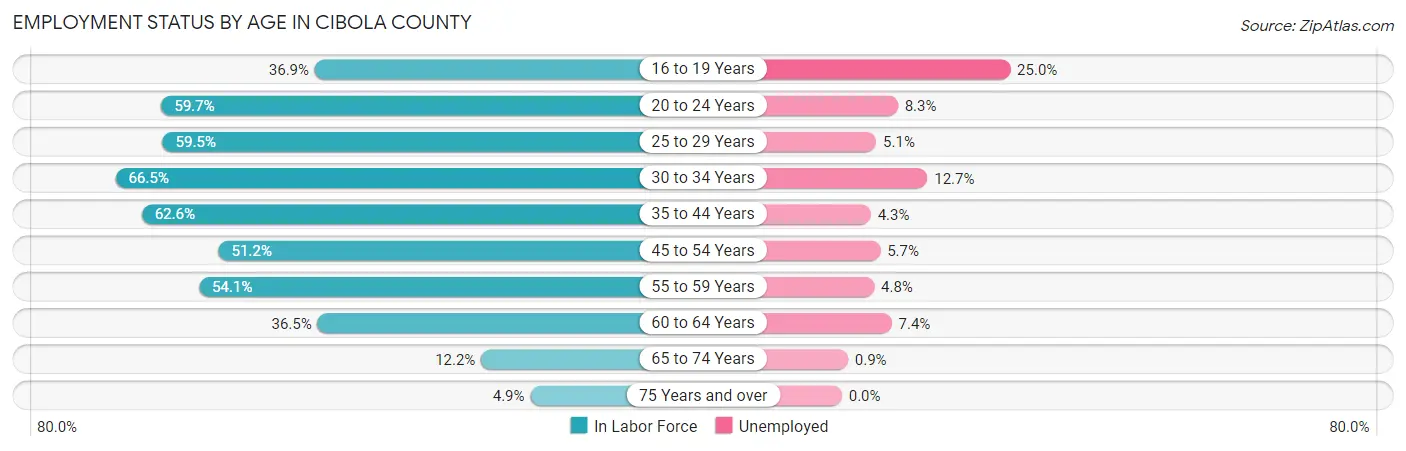
| Age Bracket | In Labor Force | Unemployed |
| 16 to 19 Years | 444 (36.9%) | 111 (25.0%) |
| 20 to 24 Years | 1,052 (59.7%) | 87 (8.3%) |
| 25 to 29 Years | 1,122 (59.5%) | 57 (5.1%) |
| 30 to 34 Years | 1,325 (66.5%) | 168 (12.7%) |
| 35 to 44 Years | 2,110 (62.6%) | 91 (4.3%) |
| 45 to 54 Years | 1,583 (51.2%) | 90 (5.7%) |
| 55 to 59 Years | 938 (54.1%) | 45 (4.8%) |
| 60 to 64 Years | 623 (36.5%) | 46 (7.4%) |
| 65 to 74 Years | 334 (12.2%) | 3 (0.9%) |
| 75 Years and over | 92 (4.9%) | 0 (0.0%) |
| Total | 9,629 (45.1%) | 703 (7.3%) |
Employment Status by Educational Attainment in Cibola County
According to labor force statistics for Cibola County, 55.9% of individuals (7,703) out of the total population between 25 and 64 years of age (13,780) are in the labor force, with 6.5% or 501 of them being unemployed. The group with the highest labor force participation rate are those with the educational attainment of bachelor's degree or higher, with 75.9% or 1,457 individuals in the labor force. Within the labor force, individuals with less than high school education have the highest percentage of unemployment, with 12.4% or 89 of them being unemployed.
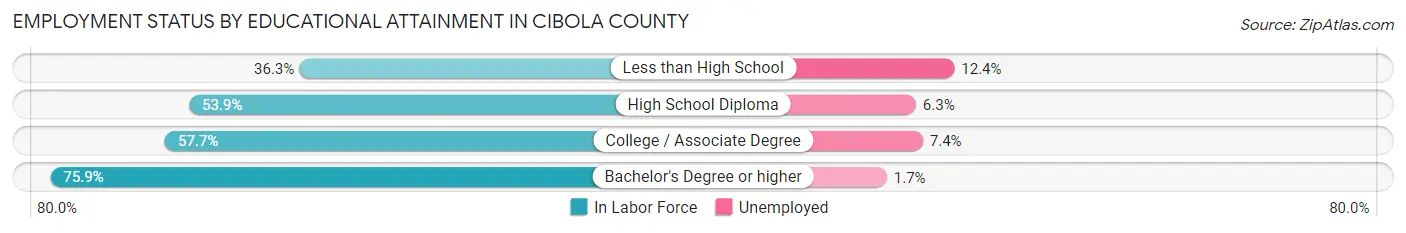
| Educational Attainment | In Labor Force | Unemployed |
| Less than High School | 718 (36.3%) | 245 (12.4%) |
| High School Diploma | 2,476 (53.9%) | 289 (6.3%) |
| College / Associate Degree | 3,051 (57.7%) | 391 (7.4%) |
| Bachelor's Degree or higher | 1,457 (75.9%) | 33 (1.7%) |
| Total | 7,703 (55.9%) | 896 (6.5%) |
Employment Occupations by Sex in Cibola County
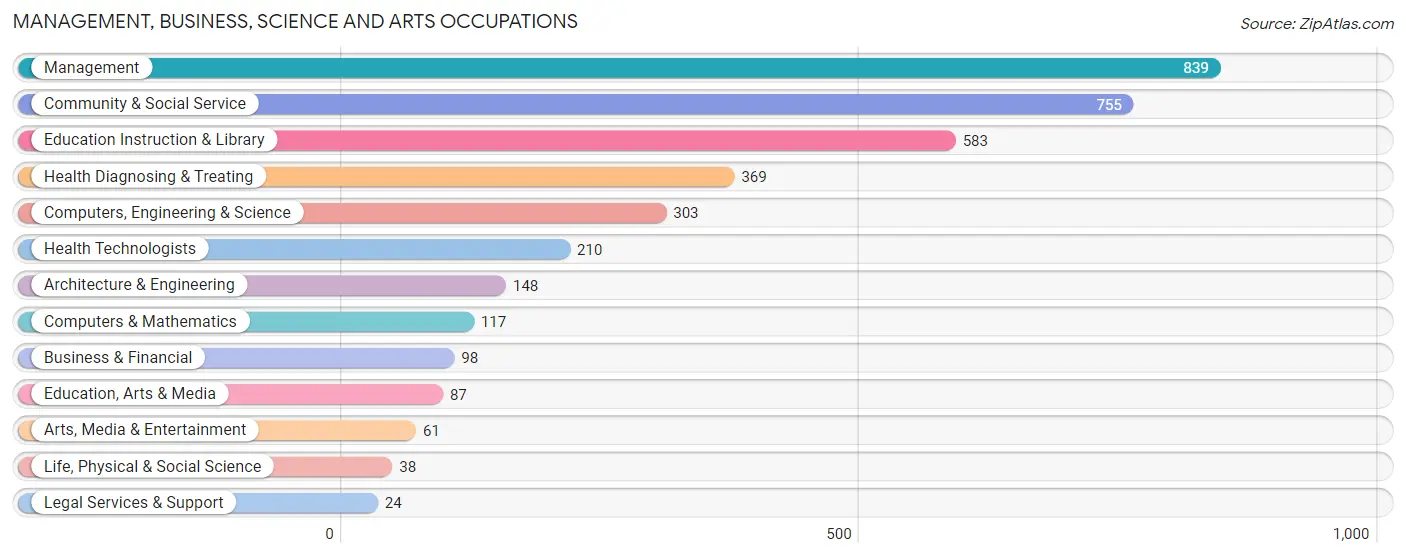
Management, Business, Science and Arts Occupations
The most common Management, Business, Science and Arts occupations in Cibola County are Management (839 | 9.4%), Community & Social Service (755 | 8.5%), Education Instruction & Library (583 | 6.5%), Health Diagnosing & Treating (369 | 4.1%), and Computers, Engineering & Science (303 | 3.4%).
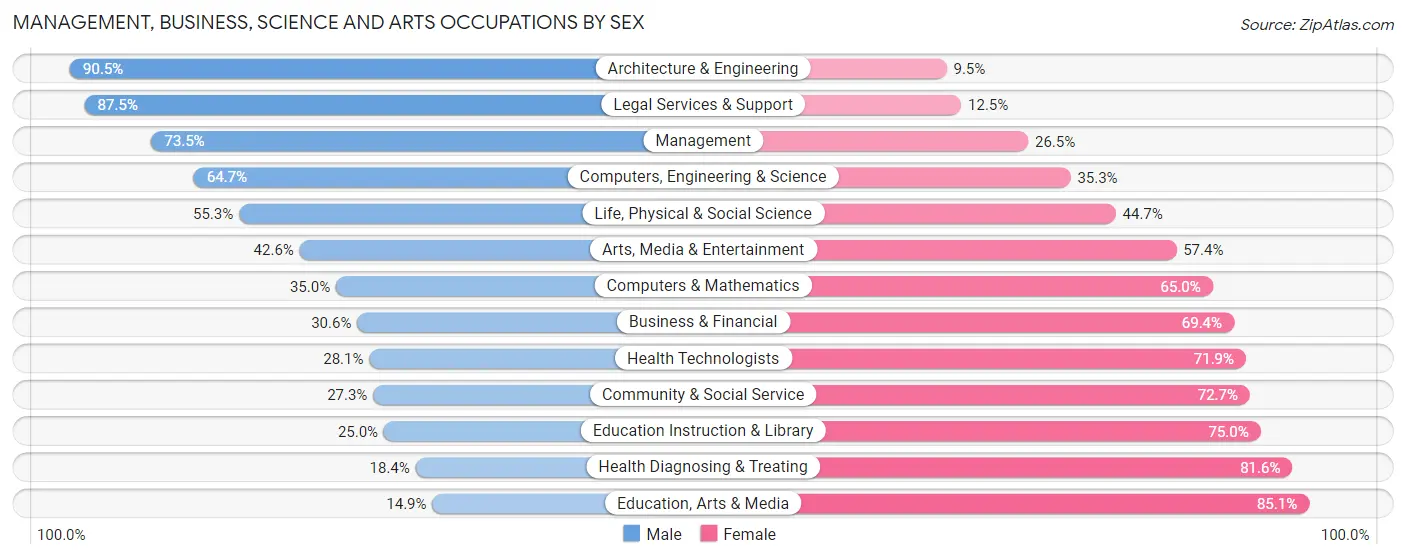
Management, Business, Science and Arts Occupations by Sex
Within the Management, Business, Science and Arts occupations in Cibola County, the most male-oriented occupations are Architecture & Engineering (90.5%), Legal Services & Support (87.5%), and Management (73.5%), while the most female-oriented occupations are Education, Arts & Media (85.1%), Health Diagnosing & Treating (81.6%), and Education Instruction & Library (75.0%).
| Occupation | Male | Female |
| Management | 617 (73.5%) | 222 (26.5%) |
| Business & Financial | 30 (30.6%) | 68 (69.4%) |
| Computers, Engineering & Science | 196 (64.7%) | 107 (35.3%) |
| Computers & Mathematics | 41 (35.0%) | 76 (65.0%) |
| Architecture & Engineering | 134 (90.5%) | 14 (9.5%) |
| Life, Physical & Social Science | 21 (55.3%) | 17 (44.7%) |
| Community & Social Service | 206 (27.3%) | 549 (72.7%) |
| Education, Arts & Media | 13 (14.9%) | 74 (85.1%) |
| Legal Services & Support | 21 (87.5%) | 3 (12.5%) |
| Education Instruction & Library | 146 (25.0%) | 437 (75.0%) |
| Arts, Media & Entertainment | 26 (42.6%) | 35 (57.4%) |
| Health Diagnosing & Treating | 68 (18.4%) | 301 (81.6%) |
| Health Technologists | 59 (28.1%) | 151 (71.9%) |
| Total (Category) | 1,117 (47.2%) | 1,247 (52.7%) |
| Total (Overall) | 4,605 (51.7%) | 4,307 (48.3%) |
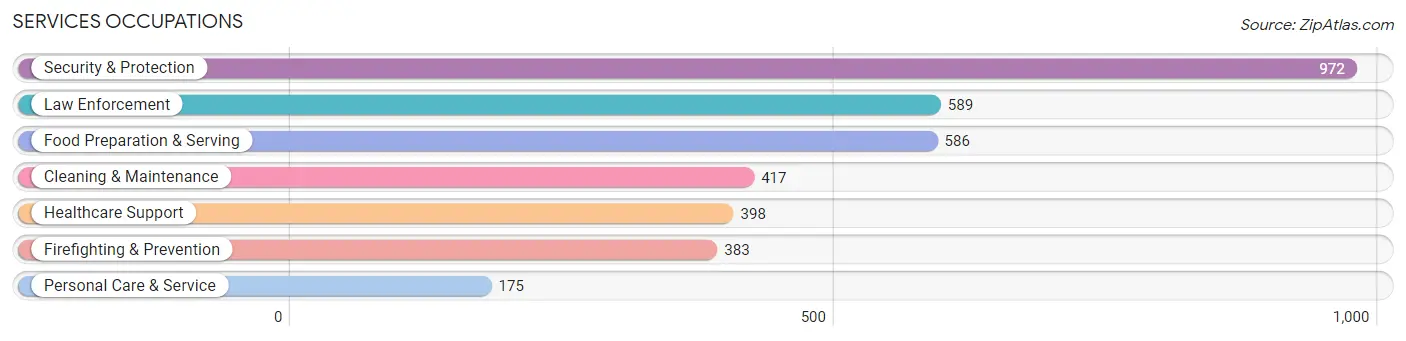
Services Occupations
The most common Services occupations in Cibola County are Security & Protection (972 | 10.9%), Law Enforcement (589 | 6.6%), Food Preparation & Serving (586 | 6.6%), Cleaning & Maintenance (417 | 4.7%), and Healthcare Support (398 | 4.5%).
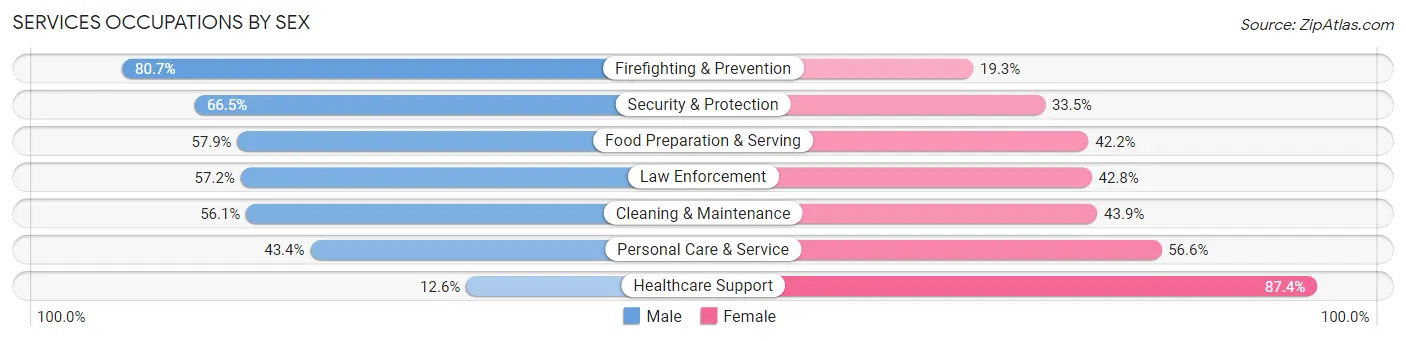
Services Occupations by Sex
Within the Services occupations in Cibola County, the most male-oriented occupations are Firefighting & Prevention (80.7%), Security & Protection (66.5%), and Food Preparation & Serving (57.9%), while the most female-oriented occupations are Healthcare Support (87.4%), Personal Care & Service (56.6%), and Cleaning & Maintenance (43.9%).
| Occupation | Male | Female |
| Healthcare Support | 50 (12.6%) | 348 (87.4%) |
| Security & Protection | 646 (66.5%) | 326 (33.5%) |
| Firefighting & Prevention | 309 (80.7%) | 74 (19.3%) |
| Law Enforcement | 337 (57.2%) | 252 (42.8%) |
| Food Preparation & Serving | 339 (57.9%) | 247 (42.1%) |
| Cleaning & Maintenance | 234 (56.1%) | 183 (43.9%) |
| Personal Care & Service | 76 (43.4%) | 99 (56.6%) |
| Total (Category) | 1,345 (52.8%) | 1,203 (47.2%) |
| Total (Overall) | 4,605 (51.7%) | 4,307 (48.3%) |
Sales and Office Occupations
The most common Sales and Office occupations in Cibola County are Office & Administration (1,228 | 13.8%), and Sales & Related (955 | 10.7%).
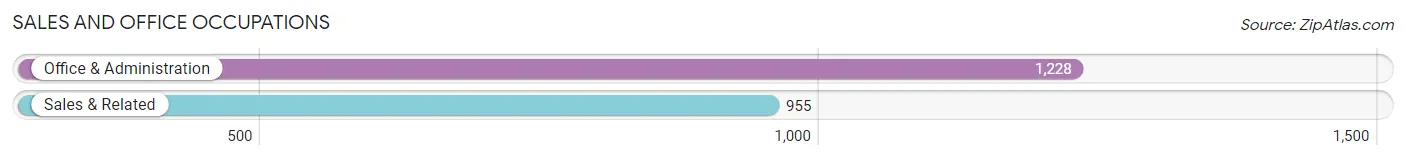
Sales and Office Occupations by Sex
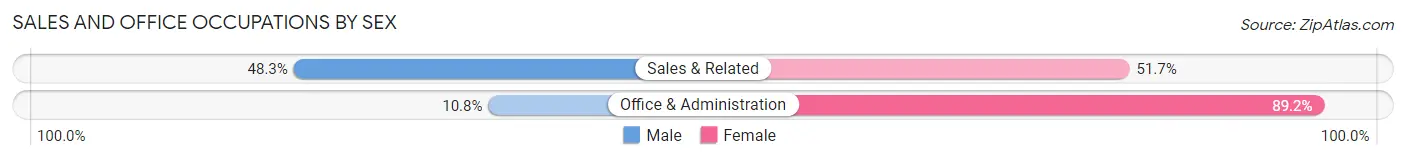
| Occupation | Male | Female |
| Sales & Related | 461 (48.3%) | 494 (51.7%) |
| Office & Administration | 133 (10.8%) | 1,095 (89.2%) |
| Total (Category) | 594 (27.2%) | 1,589 (72.8%) |
| Total (Overall) | 4,605 (51.7%) | 4,307 (48.3%) |
Natural Resources, Construction and Maintenance Occupations
The most common Natural Resources, Construction and Maintenance occupations in Cibola County are Construction & Extraction (686 | 7.7%), Installation, Maintenance & Repair (302 | 3.4%), and Farming, Fishing & Forestry (195 | 2.2%).
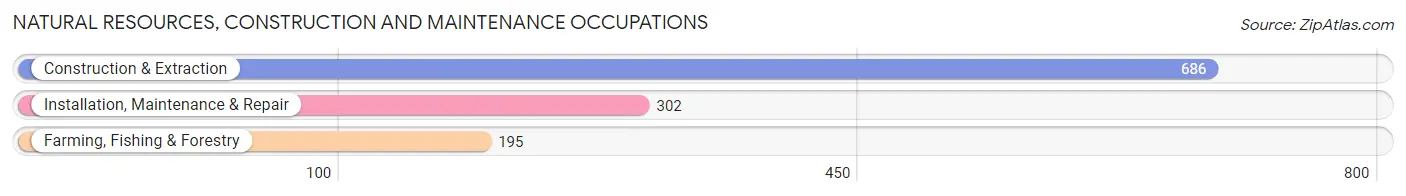
Natural Resources, Construction and Maintenance Occupations by Sex
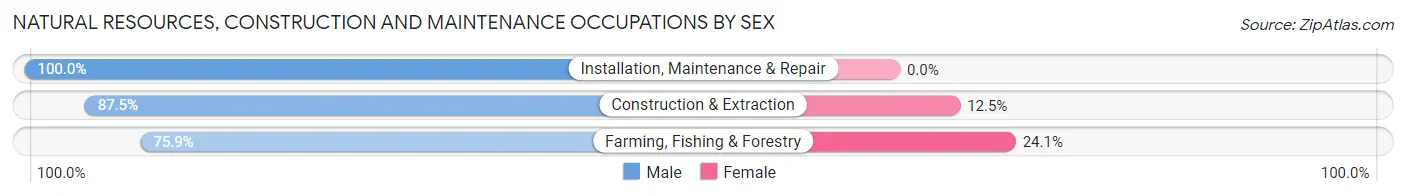
| Occupation | Male | Female |
| Farming, Fishing & Forestry | 148 (75.9%) | 47 (24.1%) |
| Construction & Extraction | 600 (87.5%) | 86 (12.5%) |
| Installation, Maintenance & Repair | 302 (100.0%) | 0 (0.0%) |
| Total (Category) | 1,050 (88.8%) | 133 (11.2%) |
| Total (Overall) | 4,605 (51.7%) | 4,307 (48.3%) |
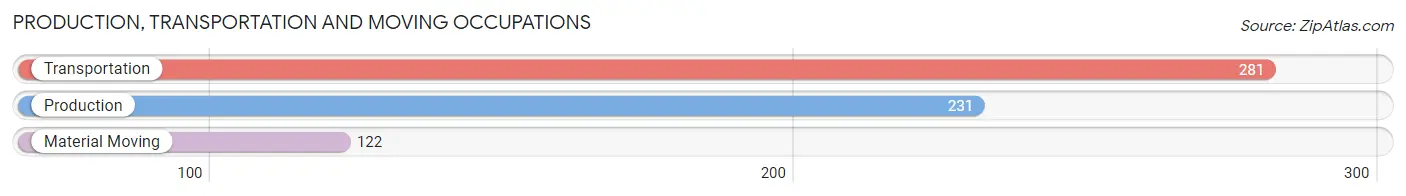
Production, Transportation and Moving Occupations
The most common Production, Transportation and Moving occupations in Cibola County are Transportation (281 | 3.2%), Production (231 | 2.6%), and Material Moving (122 | 1.4%).
Production, Transportation and Moving Occupations by Sex
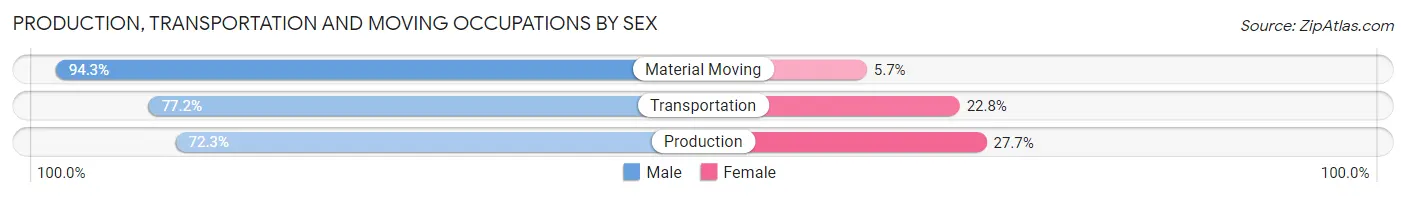
| Occupation | Male | Female |
| Production | 167 (72.3%) | 64 (27.7%) |
| Transportation | 217 (77.2%) | 64 (22.8%) |
| Material Moving | 115 (94.3%) | 7 (5.7%) |
| Total (Category) | 499 (78.7%) | 135 (21.3%) |
| Total (Overall) | 4,605 (51.7%) | 4,307 (48.3%) |
Employment Industries by Sex in Cibola County
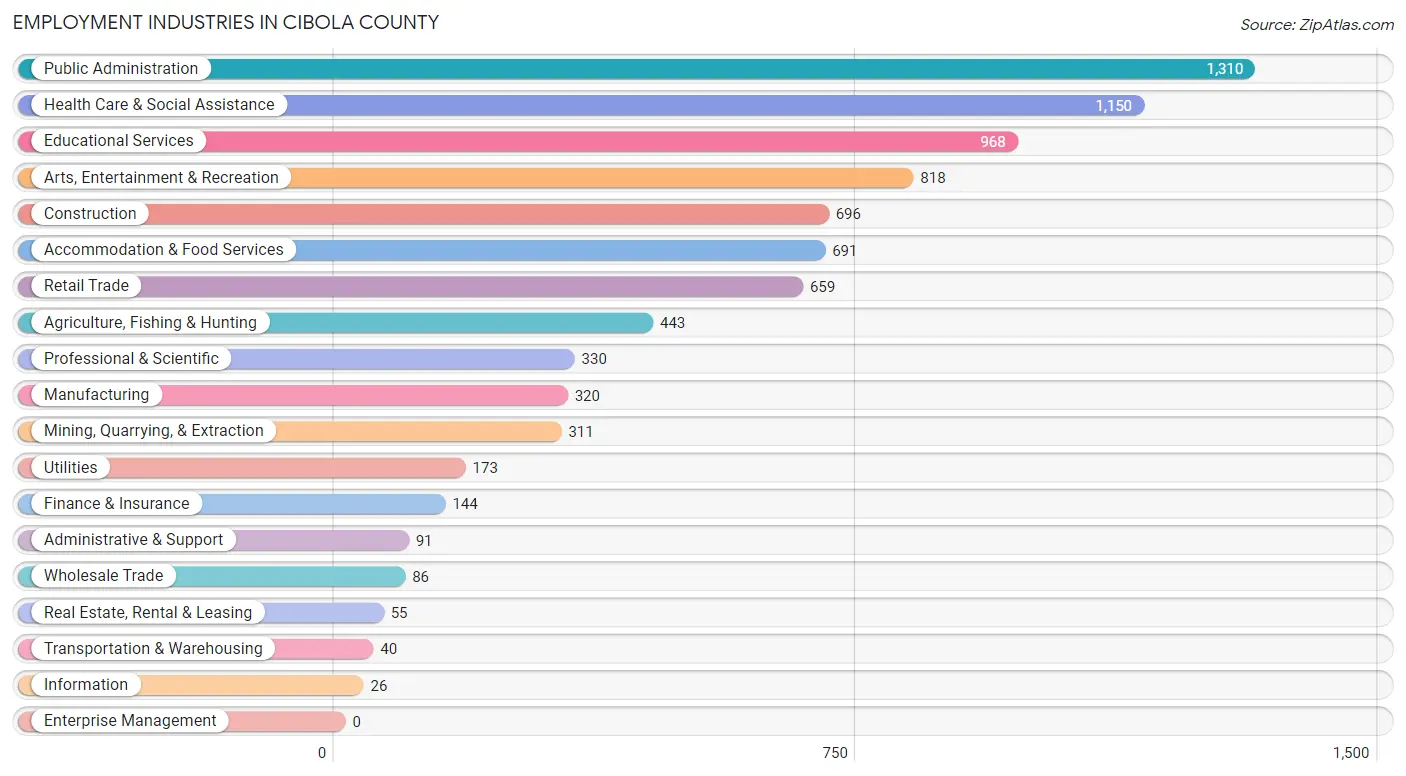
Employment Industries in Cibola County
The major employment industries in Cibola County include Public Administration (1,310 | 14.7%), Health Care & Social Assistance (1,150 | 12.9%), Educational Services (968 | 10.9%), Arts, Entertainment & Recreation (818 | 9.2%), and Construction (696 | 7.8%).
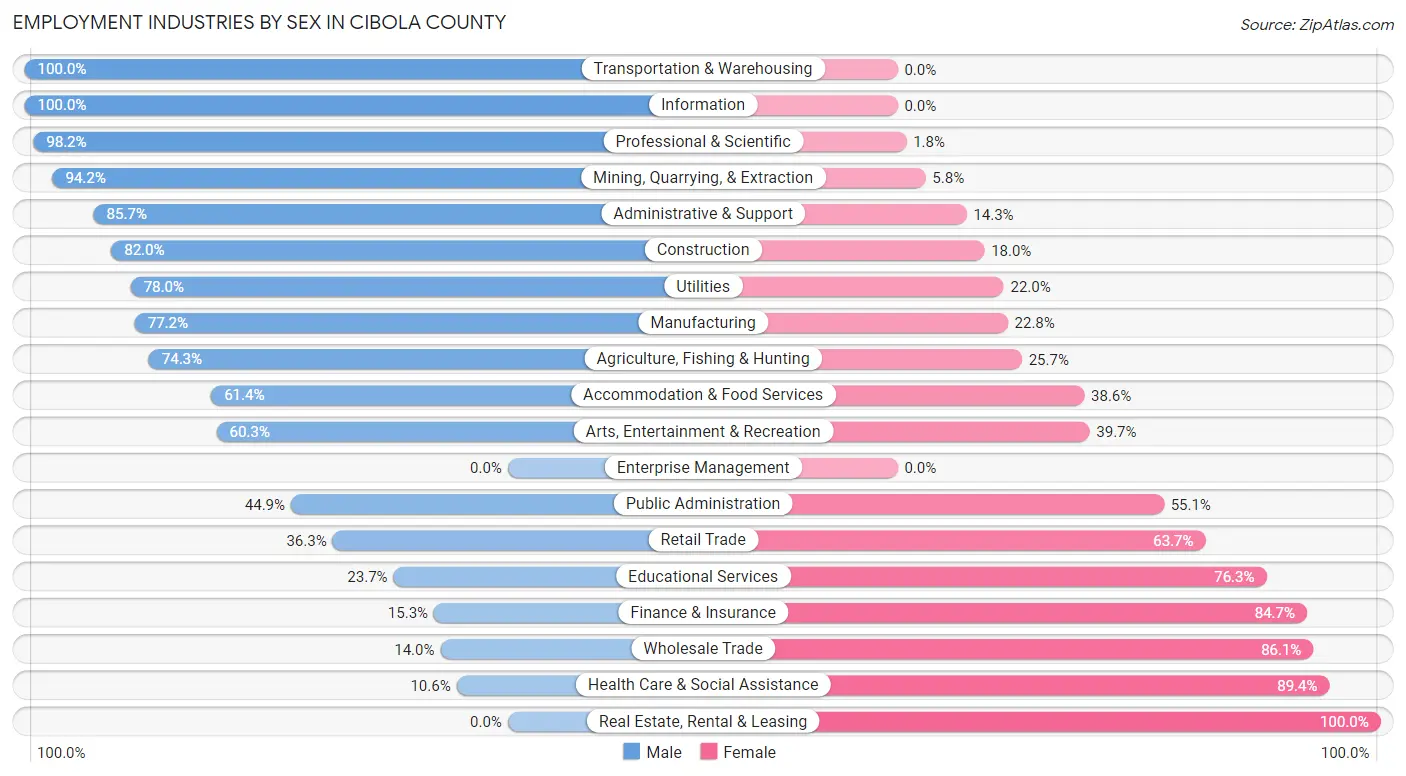
Employment Industries by Sex in Cibola County
The Cibola County industries that see more men than women are Transportation & Warehousing (100.0%), Information (100.0%), and Professional & Scientific (98.2%), whereas the industries that tend to have a higher number of women are Real Estate, Rental & Leasing (100.0%), Health Care & Social Assistance (89.4%), and Wholesale Trade (86.1%).
| Industry | Male | Female |
| Agriculture, Fishing & Hunting | 329 (74.3%) | 114 (25.7%) |
| Mining, Quarrying, & Extraction | 293 (94.2%) | 18 (5.8%) |
| Construction | 571 (82.0%) | 125 (18.0%) |
| Manufacturing | 247 (77.2%) | 73 (22.8%) |
| Wholesale Trade | 12 (14.0%) | 74 (86.1%) |
| Retail Trade | 239 (36.3%) | 420 (63.7%) |
| Transportation & Warehousing | 40 (100.0%) | 0 (0.0%) |
| Utilities | 135 (78.0%) | 38 (22.0%) |
| Information | 26 (100.0%) | 0 (0.0%) |
| Finance & Insurance | 22 (15.3%) | 122 (84.7%) |
| Real Estate, Rental & Leasing | 0 (0.0%) | 55 (100.0%) |
| Professional & Scientific | 324 (98.2%) | 6 (1.8%) |
| Enterprise Management | 0 (0.0%) | 0 (0.0%) |
| Administrative & Support | 78 (85.7%) | 13 (14.3%) |
| Educational Services | 229 (23.7%) | 739 (76.3%) |
| Health Care & Social Assistance | 122 (10.6%) | 1,028 (89.4%) |
| Arts, Entertainment & Recreation | 493 (60.3%) | 325 (39.7%) |
| Accommodation & Food Services | 424 (61.4%) | 267 (38.6%) |
| Public Administration | 588 (44.9%) | 722 (55.1%) |
| Total | 4,605 (51.7%) | 4,307 (48.3%) |
Education in Cibola County
School Enrollment in Cibola County
The most common levels of schooling among the 6,280 students in Cibola County are elementary school (1,548 | 24.6%), middle school (1,497 | 23.8%), and high school (1,240 | 19.8%).
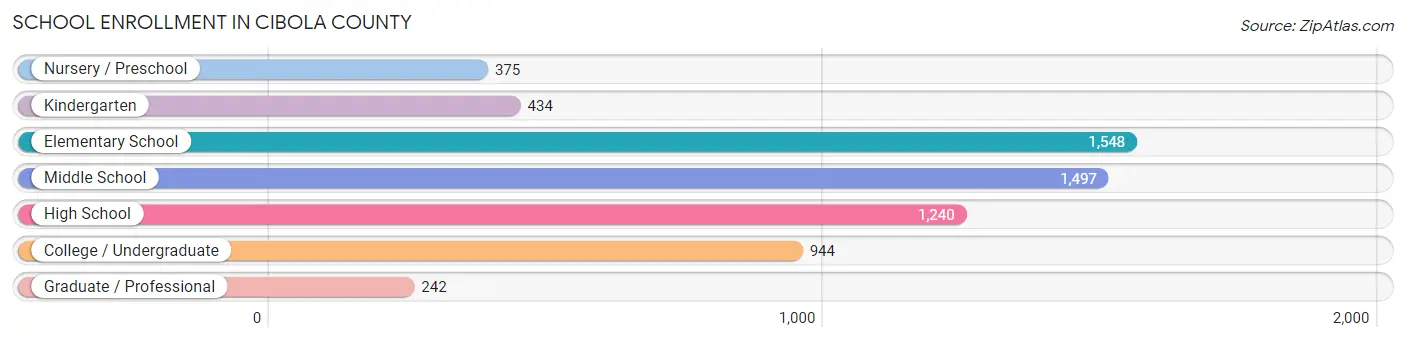
| School Level | # Students | % Students |
| Nursery / Preschool | 375 | 6.0% |
| Kindergarten | 434 | 6.9% |
| Elementary School | 1,548 | 24.6% |
| Middle School | 1,497 | 23.8% |
| High School | 1,240 | 19.8% |
| College / Undergraduate | 944 | 15.0% |
| Graduate / Professional | 242 | 3.8% |
| Total | 6,280 | 100.0% |
School Enrollment by Age by Funding Source in Cibola County
Out of a total of 6,280 students who are enrolled in schools in Cibola County, 377 (6.0%) attend a private institution, while the remaining 5,903 (94.0%) are enrolled in public schools. The age group of 25 to 34 year olds has the highest likelihood of being enrolled in private schools, with 118 (38.4% in the age bracket) enrolled. Conversely, the age group of 3 to 4 year olds has the lowest likelihood of being enrolled in a private school, with 341 (100.0% in the age bracket) attending a public institution.
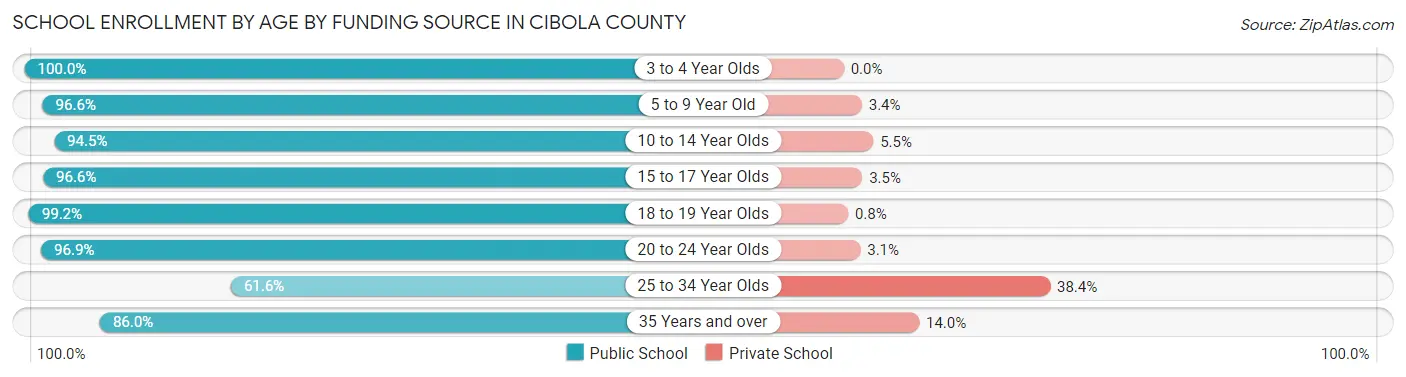
| Age Bracket | Public School | Private School |
| 3 to 4 Year Olds | 341 (100.0%) | 0 (0.0%) |
| 5 to 9 Year Old | 1,836 (96.6%) | 64 (3.4%) |
| 10 to 14 Year Olds | 1,560 (94.5%) | 91 (5.5%) |
| 15 to 17 Year Olds | 840 (96.6%) | 30 (3.5%) |
| 18 to 19 Year Olds | 374 (99.2%) | 3 (0.8%) |
| 20 to 24 Year Olds | 408 (96.9%) | 13 (3.1%) |
| 25 to 34 Year Olds | 189 (61.6%) | 118 (38.4%) |
| 35 Years and over | 355 (86.0%) | 58 (14.0%) |
| Total | 5,903 (94.0%) | 377 (6.0%) |
Educational Attainment by Field of Study in Cibola County
Business (645 | 21.5%), education (559 | 18.6%), science & technology (340 | 11.3%), arts & humanities (308 | 10.3%), and liberal arts & history (285 | 9.5%) are the most common fields of study among 2,999 individuals in Cibola County who have obtained a bachelor's degree or higher.
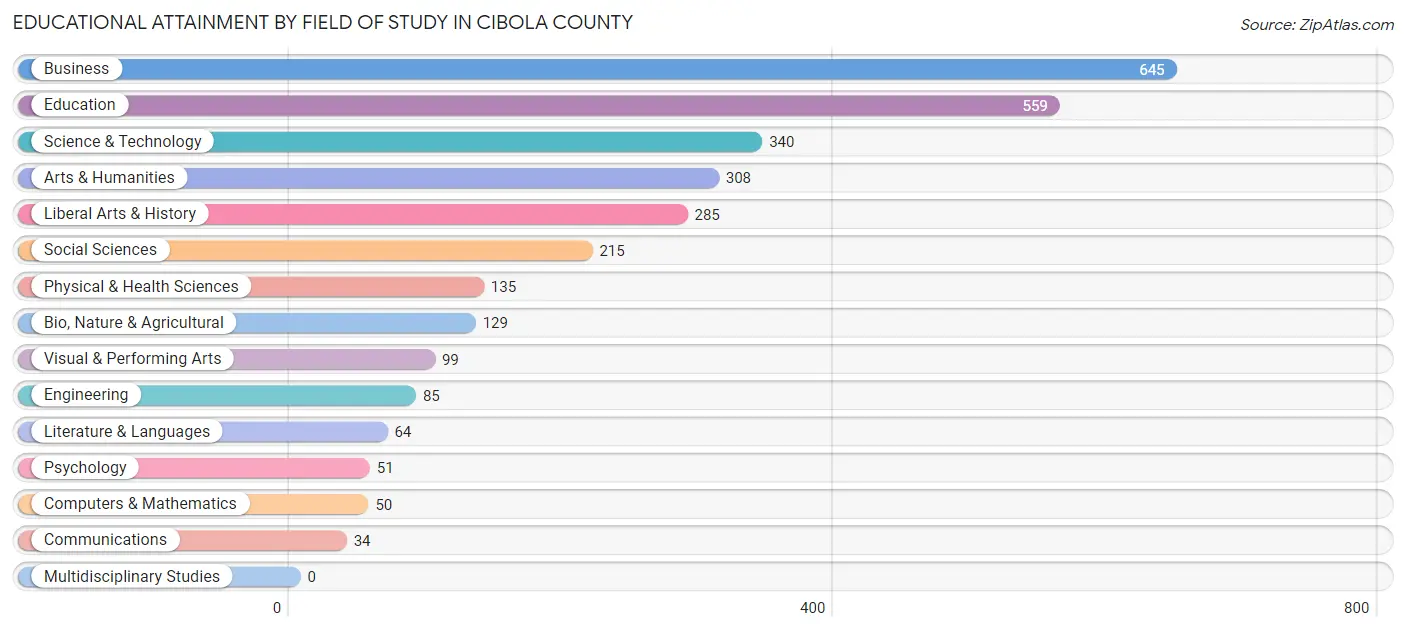
| Field of Study | # Graduates | % Graduates |
| Computers & Mathematics | 50 | 1.7% |
| Bio, Nature & Agricultural | 129 | 4.3% |
| Physical & Health Sciences | 135 | 4.5% |
| Psychology | 51 | 1.7% |
| Social Sciences | 215 | 7.2% |
| Engineering | 85 | 2.8% |
| Multidisciplinary Studies | 0 | 0.0% |
| Science & Technology | 340 | 11.3% |
| Business | 645 | 21.5% |
| Education | 559 | 18.6% |
| Literature & Languages | 64 | 2.1% |
| Liberal Arts & History | 285 | 9.5% |
| Visual & Performing Arts | 99 | 3.3% |
| Communications | 34 | 1.1% |
| Arts & Humanities | 308 | 10.3% |
| Total | 2,999 | 100.0% |
Transportation & Commute in Cibola County
Vehicle Availability by Sex in Cibola County
The most prevalent vehicle ownership categories in Cibola County are males with 2 vehicles (1,502, accounting for 33.0%) and females with 2 vehicles (1,298, making up 35.4%).
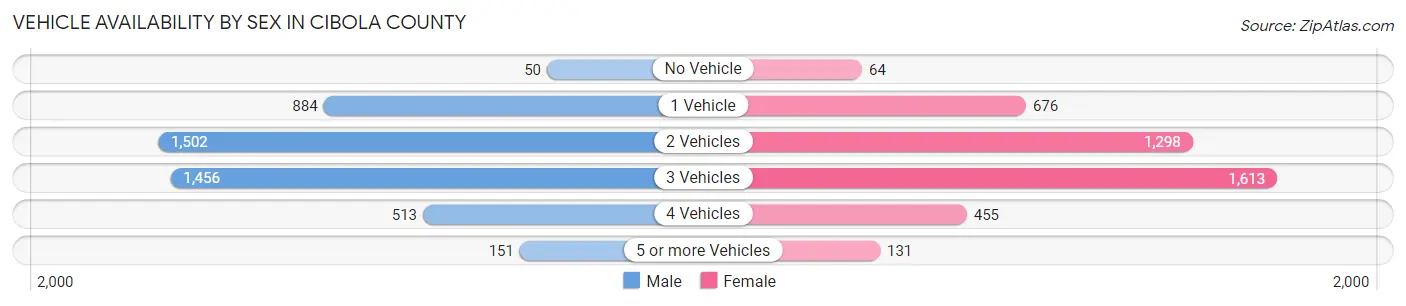
| Vehicles Available | Male | Female |
| No Vehicle | 50 (1.1%) | 64 (1.5%) |
| 1 Vehicle | 884 (19.4%) | 676 (16.0%) |
| 2 Vehicles | 1,502 (33.0%) | 1,298 (30.6%) |
| 3 Vehicles | 1,456 (32.0%) | 1,613 (38.1%) |
| 4 Vehicles | 513 (11.3%) | 455 (10.7%) |
| 5 or more Vehicles | 151 (3.3%) | 131 (3.1%) |
| Total | 4,556 (100.0%) | 4,237 (100.0%) |
Commute Time in Cibola County
The most frequently occuring commute durations in Cibola County are 5 to 9 minutes (1,840 commuters, 22.7%), 10 to 14 minutes (1,146 commuters, 14.1%), and 15 to 19 minutes (1,097 commuters, 13.5%).
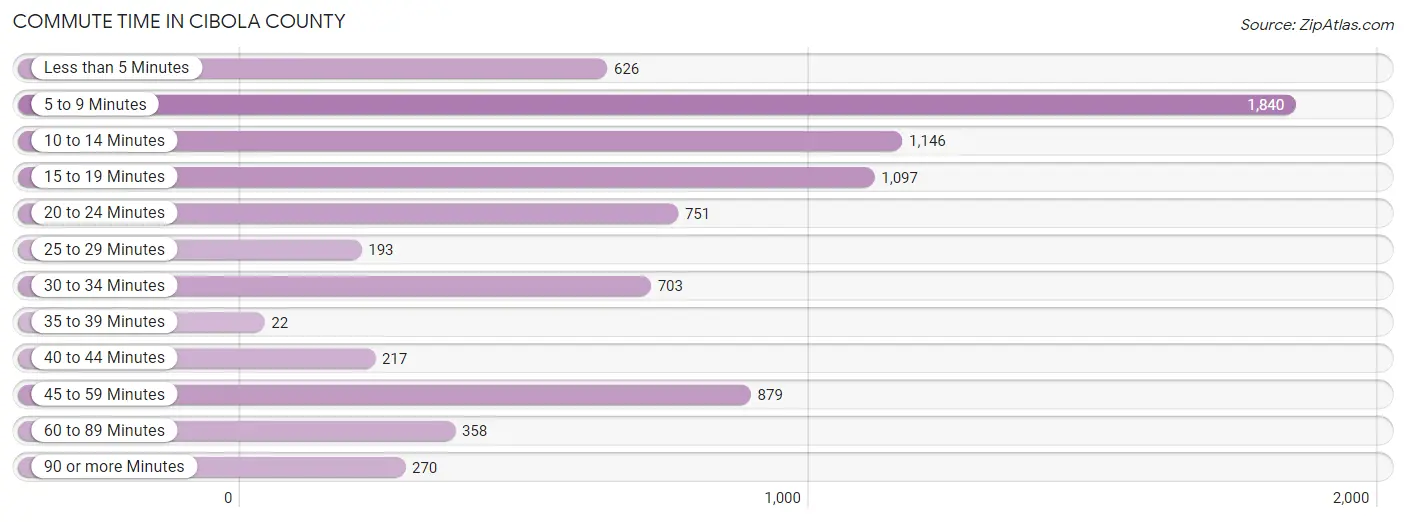
| Commute Time | # Commuters | % Commuters |
| Less than 5 Minutes | 626 | 7.7% |
| 5 to 9 Minutes | 1,840 | 22.7% |
| 10 to 14 Minutes | 1,146 | 14.1% |
| 15 to 19 Minutes | 1,097 | 13.5% |
| 20 to 24 Minutes | 751 | 9.3% |
| 25 to 29 Minutes | 193 | 2.4% |
| 30 to 34 Minutes | 703 | 8.7% |
| 35 to 39 Minutes | 22 | 0.3% |
| 40 to 44 Minutes | 217 | 2.7% |
| 45 to 59 Minutes | 879 | 10.8% |
| 60 to 89 Minutes | 358 | 4.4% |
| 90 or more Minutes | 270 | 3.3% |
Commute Time by Sex in Cibola County
The most common commute times in Cibola County are 5 to 9 minutes (811 commuters, 18.7%) for males and 5 to 9 minutes (1,029 commuters, 27.3%) for females.
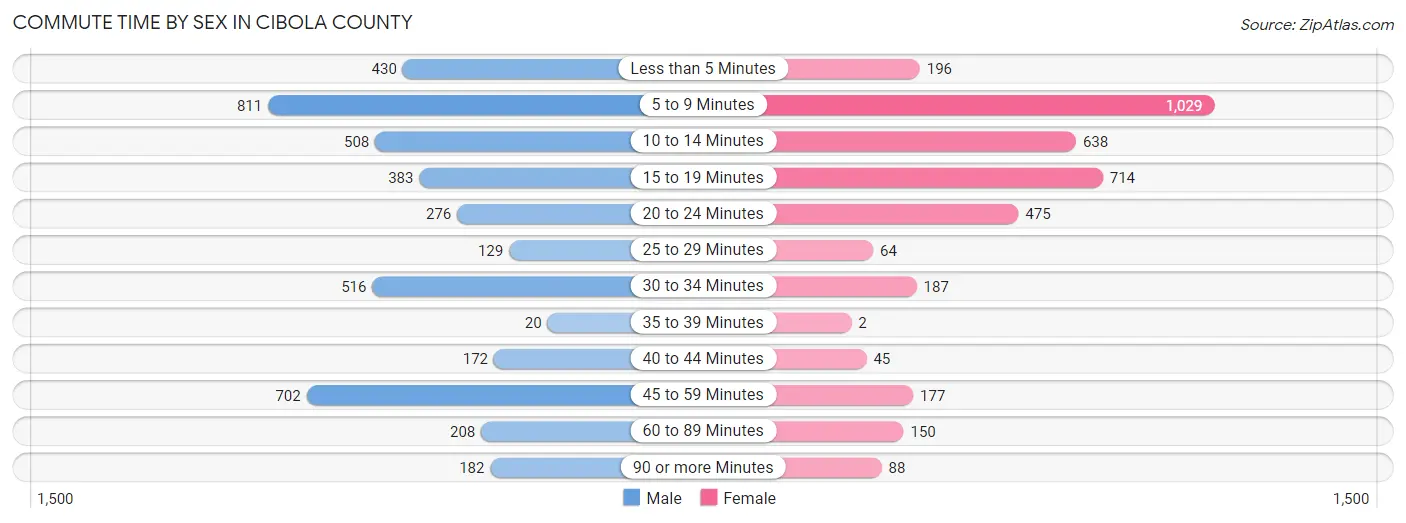
| Commute Time | Male | Female |
| Less than 5 Minutes | 430 (9.9%) | 196 (5.2%) |
| 5 to 9 Minutes | 811 (18.7%) | 1,029 (27.3%) |
| 10 to 14 Minutes | 508 (11.7%) | 638 (17.0%) |
| 15 to 19 Minutes | 383 (8.8%) | 714 (19.0%) |
| 20 to 24 Minutes | 276 (6.4%) | 475 (12.6%) |
| 25 to 29 Minutes | 129 (3.0%) | 64 (1.7%) |
| 30 to 34 Minutes | 516 (11.9%) | 187 (5.0%) |
| 35 to 39 Minutes | 20 (0.5%) | 2 (0.1%) |
| 40 to 44 Minutes | 172 (4.0%) | 45 (1.2%) |
| 45 to 59 Minutes | 702 (16.2%) | 177 (4.7%) |
| 60 to 89 Minutes | 208 (4.8%) | 150 (4.0%) |
| 90 or more Minutes | 182 (4.2%) | 88 (2.3%) |
Time of Departure to Work by Sex in Cibola County
The most frequent times of departure to work in Cibola County are 4:00 PM to 11:59 PM (783, 18.0%) for males and 7:30 AM to 7:59 AM (802, 21.3%) for females.
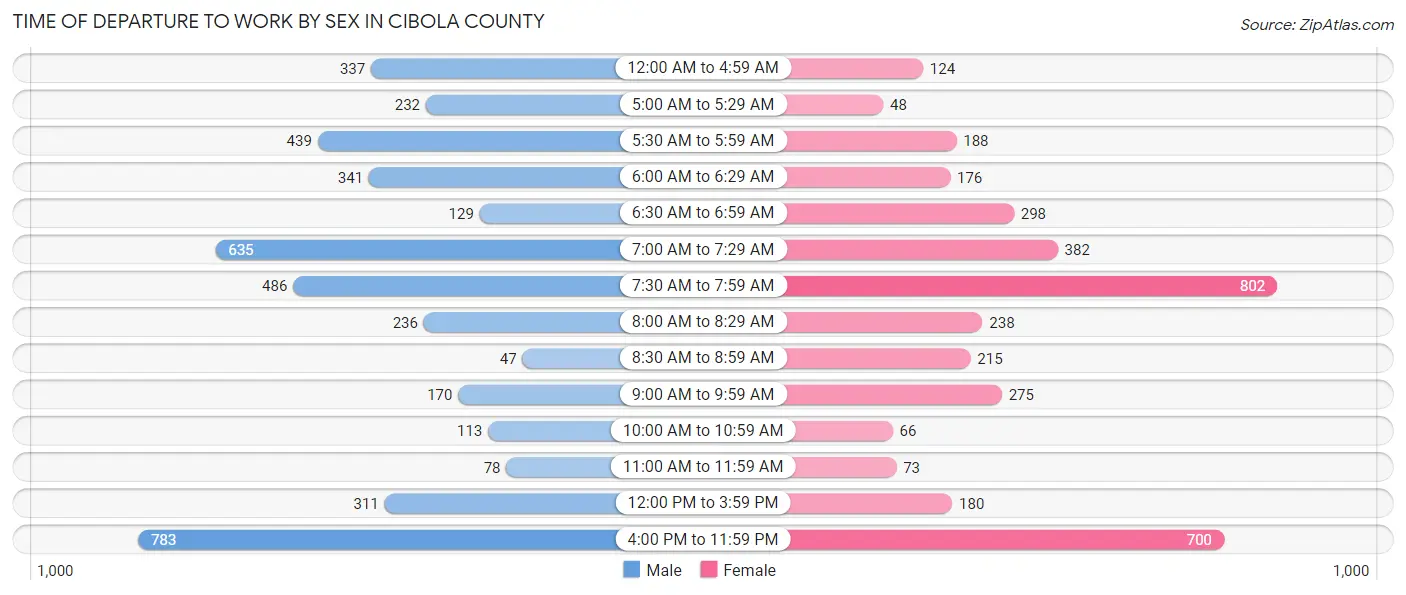
| Time of Departure | Male | Female |
| 12:00 AM to 4:59 AM | 337 (7.8%) | 124 (3.3%) |
| 5:00 AM to 5:29 AM | 232 (5.3%) | 48 (1.3%) |
| 5:30 AM to 5:59 AM | 439 (10.1%) | 188 (5.0%) |
| 6:00 AM to 6:29 AM | 341 (7.9%) | 176 (4.7%) |
| 6:30 AM to 6:59 AM | 129 (3.0%) | 298 (7.9%) |
| 7:00 AM to 7:29 AM | 635 (14.6%) | 382 (10.2%) |
| 7:30 AM to 7:59 AM | 486 (11.2%) | 802 (21.3%) |
| 8:00 AM to 8:29 AM | 236 (5.4%) | 238 (6.3%) |
| 8:30 AM to 8:59 AM | 47 (1.1%) | 215 (5.7%) |
| 9:00 AM to 9:59 AM | 170 (3.9%) | 275 (7.3%) |
| 10:00 AM to 10:59 AM | 113 (2.6%) | 66 (1.8%) |
| 11:00 AM to 11:59 AM | 78 (1.8%) | 73 (1.9%) |
| 12:00 PM to 3:59 PM | 311 (7.2%) | 180 (4.8%) |
| 4:00 PM to 11:59 PM | 783 (18.0%) | 700 (18.6%) |
| Total | 4,337 (100.0%) | 3,765 (100.0%) |
Housing Occupancy in Cibola County
Occupancy by Ownership in Cibola County
Of the total 8,124 dwellings in Cibola County, owner-occupied units account for 5,773 (71.1%), while renter-occupied units make up 2,351 (28.9%).
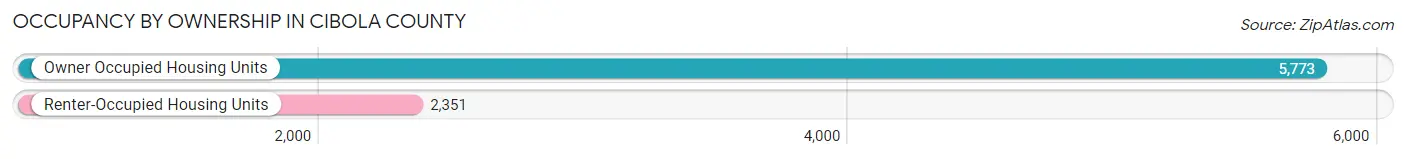
| Occupancy | # Housing Units | % Housing Units |
| Owner Occupied Housing Units | 5,773 | 71.1% |
| Renter-Occupied Housing Units | 2,351 | 28.9% |
| Total Occupied Housing Units | 8,124 | 100.0% |
Occupancy by Household Size in Cibola County
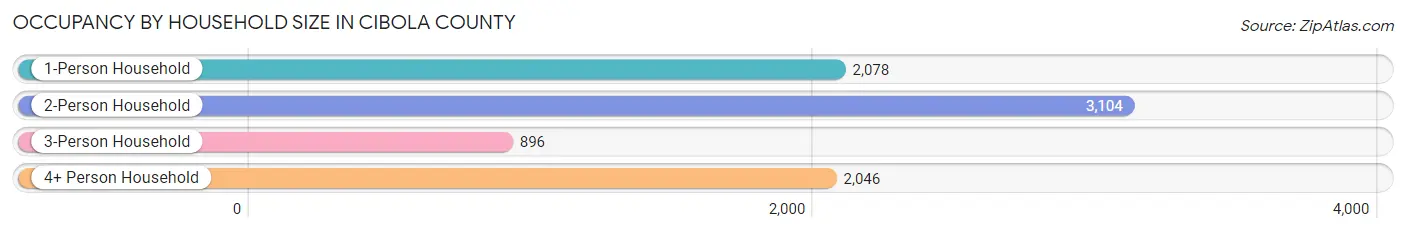
| Household Size | # Housing Units | % Housing Units |
| 1-Person Household | 2,078 | 25.6% |
| 2-Person Household | 3,104 | 38.2% |
| 3-Person Household | 896 | 11.0% |
| 4+ Person Household | 2,046 | 25.2% |
| Total Housing Units | 8,124 | 100.0% |
Occupancy by Ownership by Household Size in Cibola County
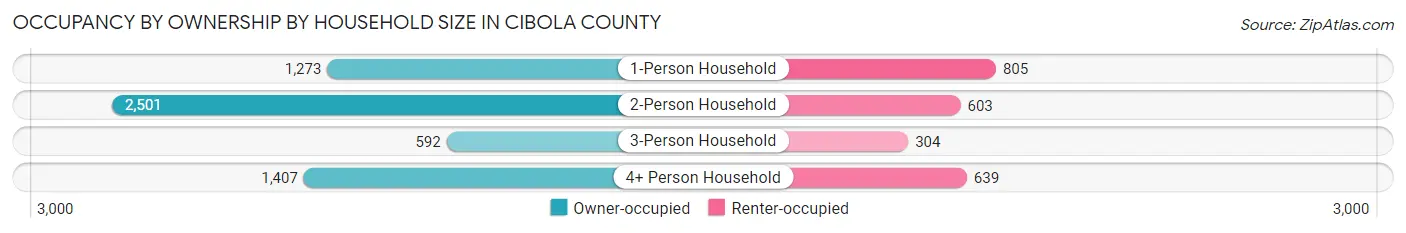
| Household Size | Owner-occupied | Renter-occupied |
| 1-Person Household | 1,273 (61.3%) | 805 (38.7%) |
| 2-Person Household | 2,501 (80.6%) | 603 (19.4%) |
| 3-Person Household | 592 (66.1%) | 304 (33.9%) |
| 4+ Person Household | 1,407 (68.8%) | 639 (31.2%) |
| Total Housing Units | 5,773 (71.1%) | 2,351 (28.9%) |
Occupancy by Educational Attainment in Cibola County
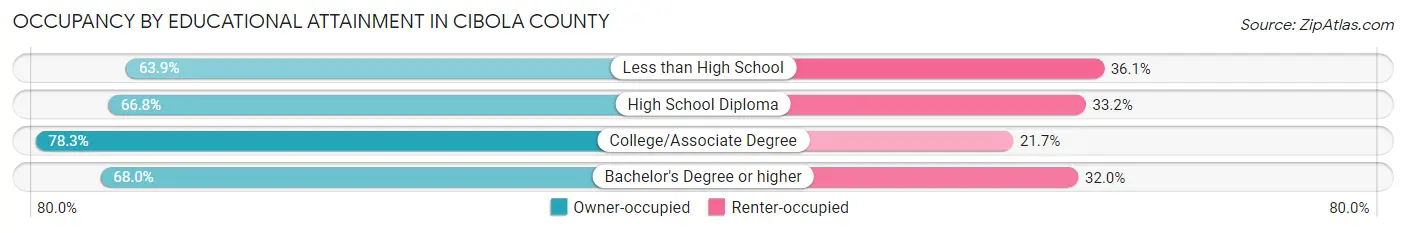
| Household Size | Owner-occupied | Renter-occupied |
| Less than High School | 650 (63.9%) | 367 (36.1%) |
| High School Diploma | 1,615 (66.8%) | 803 (33.2%) |
| College/Associate Degree | 2,434 (78.3%) | 675 (21.7%) |
| Bachelor's Degree or higher | 1,074 (68.0%) | 506 (32.0%) |
Occupancy by Age of Householder in Cibola County
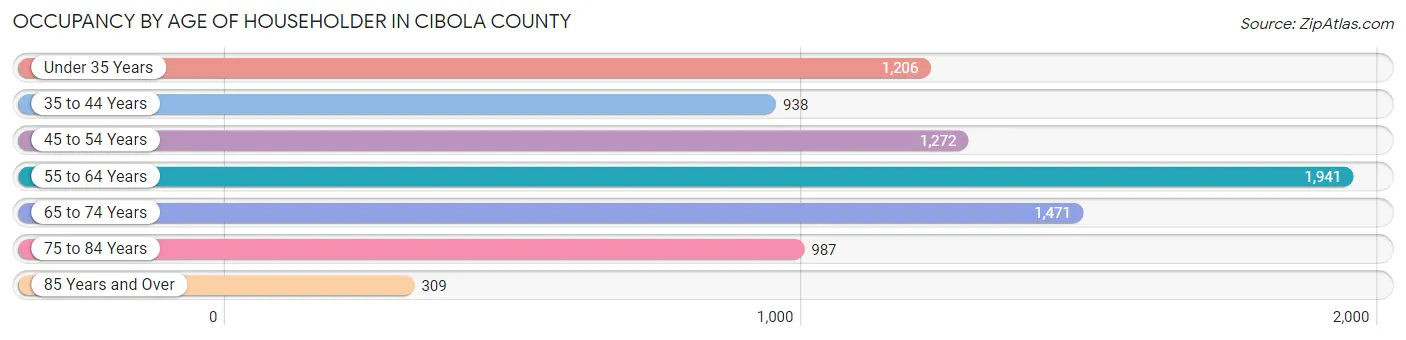
| Age Bracket | # Households | % Households |
| Under 35 Years | 1,206 | 14.8% |
| 35 to 44 Years | 938 | 11.6% |
| 45 to 54 Years | 1,272 | 15.7% |
| 55 to 64 Years | 1,941 | 23.9% |
| 65 to 74 Years | 1,471 | 18.1% |
| 75 to 84 Years | 987 | 12.1% |
| 85 Years and Over | 309 | 3.8% |
| Total | 8,124 | 100.0% |
Housing Finances in Cibola County
Median Income by Occupancy in Cibola County
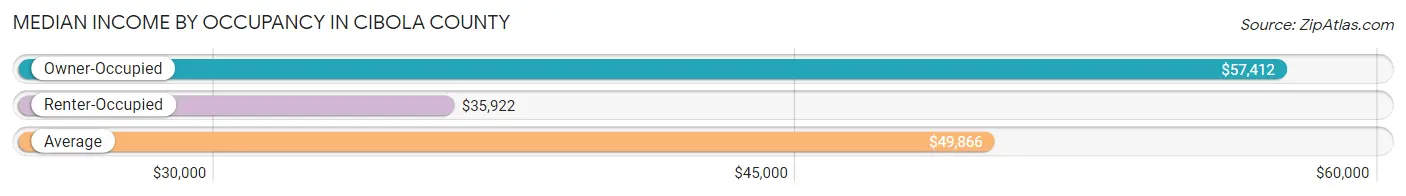
| Occupancy Type | # Households | Median Income |
| Owner-Occupied | 5,773 (71.1%) | $57,412 |
| Renter-Occupied | 2,351 (28.9%) | $35,922 |
| Average | 8,124 (100.0%) | $49,866 |
Occupancy by Householder Income Bracket in Cibola County
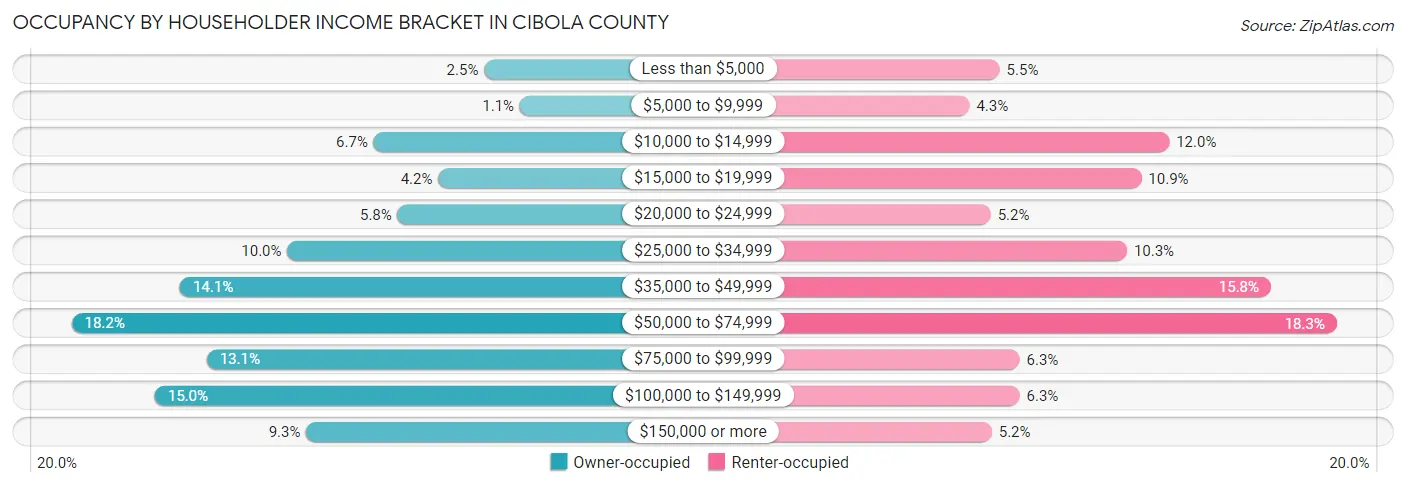
| Income Bracket | Owner-occupied | Renter-occupied |
| Less than $5,000 | 144 (2.5%) | 129 (5.5%) |
| $5,000 to $9,999 | 65 (1.1%) | 102 (4.3%) |
| $10,000 to $14,999 | 387 (6.7%) | 281 (11.9%) |
| $15,000 to $19,999 | 245 (4.2%) | 256 (10.9%) |
| $20,000 to $24,999 | 334 (5.8%) | 121 (5.1%) |
| $25,000 to $34,999 | 577 (10.0%) | 243 (10.3%) |
| $35,000 to $49,999 | 813 (14.1%) | 372 (15.8%) |
| $50,000 to $74,999 | 1,051 (18.2%) | 431 (18.3%) |
| $75,000 to $99,999 | 754 (13.1%) | 147 (6.2%) |
| $100,000 to $149,999 | 868 (15.0%) | 147 (6.2%) |
| $150,000 or more | 535 (9.3%) | 122 (5.2%) |
| Total | 5,773 (100.0%) | 2,351 (100.0%) |
Monthly Housing Cost Tiers in Cibola County
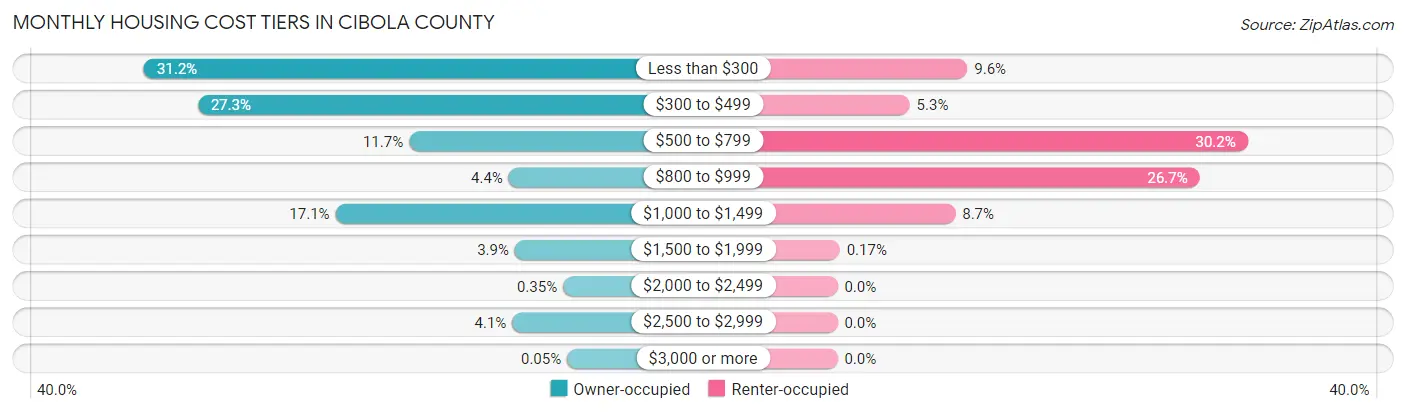
| Monthly Cost | Owner-occupied | Renter-occupied |
| Less than $300 | 1,802 (31.2%) | 225 (9.6%) |
| $300 to $499 | 1,573 (27.3%) | 125 (5.3%) |
| $500 to $799 | 675 (11.7%) | 710 (30.2%) |
| $800 to $999 | 251 (4.3%) | 627 (26.7%) |
| $1,000 to $1,499 | 988 (17.1%) | 204 (8.7%) |
| $1,500 to $1,999 | 225 (3.9%) | 4 (0.2%) |
| $2,000 to $2,499 | 20 (0.4%) | 0 (0.0%) |
| $2,500 to $2,999 | 236 (4.1%) | 0 (0.0%) |
| $3,000 or more | 3 (0.1%) | 0 (0.0%) |
| Total | 5,773 (100.0%) | 2,351 (100.0%) |
Physical Housing Characteristics in Cibola County
Housing Structures in Cibola County
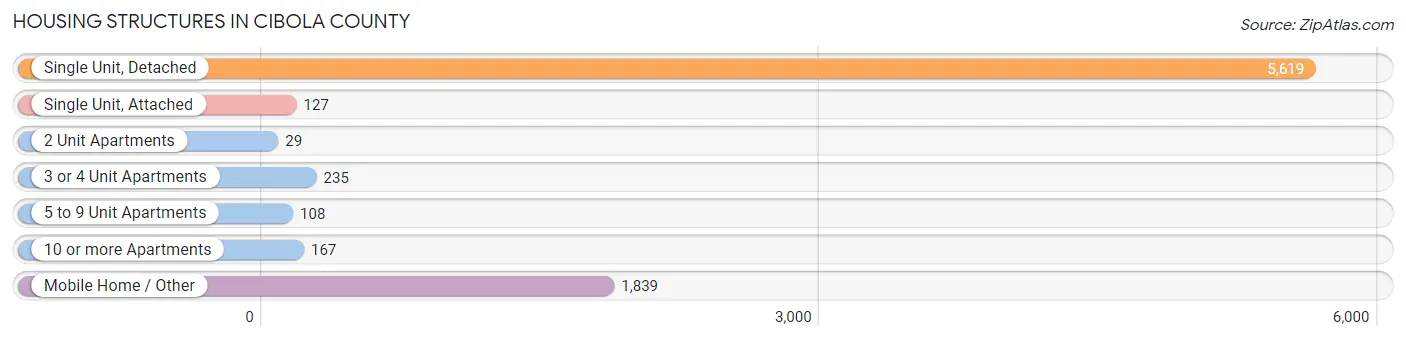
| Structure Type | # Housing Units | % Housing Units |
| Single Unit, Detached | 5,619 | 69.2% |
| Single Unit, Attached | 127 | 1.6% |
| 2 Unit Apartments | 29 | 0.4% |
| 3 or 4 Unit Apartments | 235 | 2.9% |
| 5 to 9 Unit Apartments | 108 | 1.3% |
| 10 or more Apartments | 167 | 2.1% |
| Mobile Home / Other | 1,839 | 22.6% |
| Total | 8,124 | 100.0% |
Housing Structures by Occupancy in Cibola County
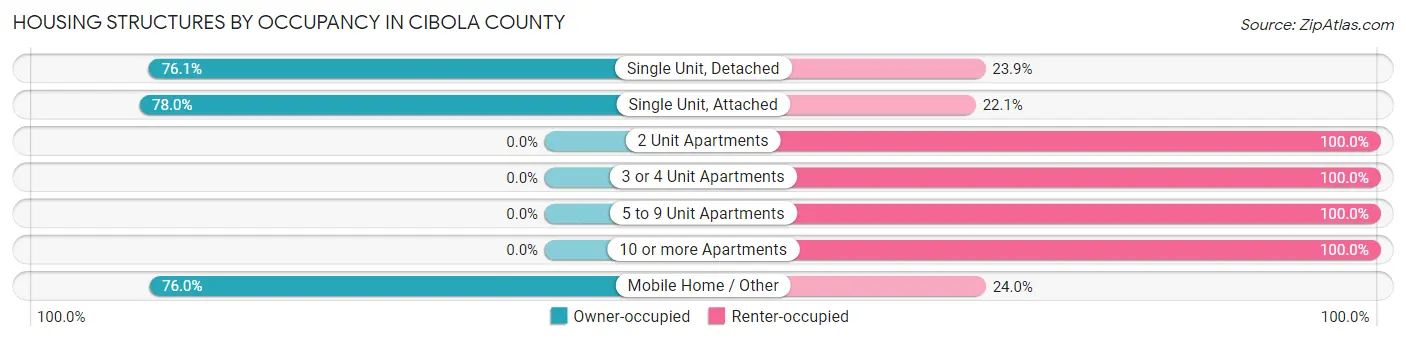
| Structure Type | Owner-occupied | Renter-occupied |
| Single Unit, Detached | 4,276 (76.1%) | 1,343 (23.9%) |
| Single Unit, Attached | 99 (77.9%) | 28 (22.1%) |
| 2 Unit Apartments | 0 (0.0%) | 29 (100.0%) |
| 3 or 4 Unit Apartments | 0 (0.0%) | 235 (100.0%) |
| 5 to 9 Unit Apartments | 0 (0.0%) | 108 (100.0%) |
| 10 or more Apartments | 0 (0.0%) | 167 (100.0%) |
| Mobile Home / Other | 1,398 (76.0%) | 441 (24.0%) |
| Total | 5,773 (71.1%) | 2,351 (28.9%) |
Housing Structures by Number of Rooms in Cibola County
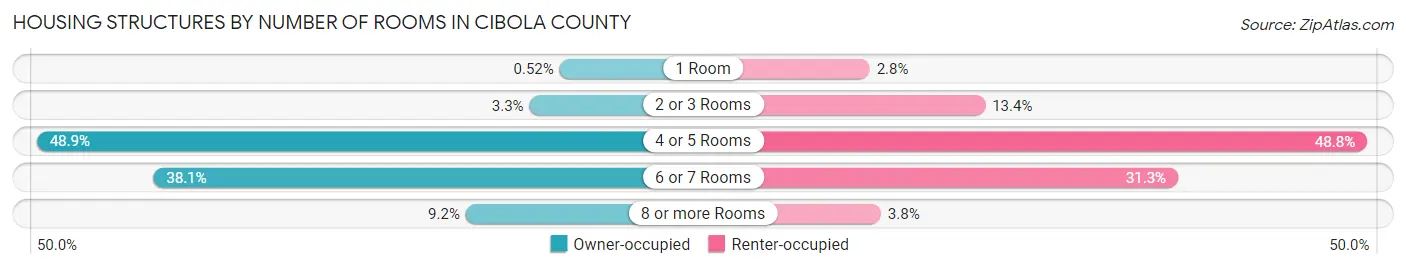
| Number of Rooms | Owner-occupied | Renter-occupied |
| 1 Room | 30 (0.5%) | 65 (2.8%) |
| 2 or 3 Rooms | 191 (3.3%) | 316 (13.4%) |
| 4 or 5 Rooms | 2,822 (48.9%) | 1,146 (48.7%) |
| 6 or 7 Rooms | 2,199 (38.1%) | 735 (31.3%) |
| 8 or more Rooms | 531 (9.2%) | 89 (3.8%) |
| Total | 5,773 (100.0%) | 2,351 (100.0%) |
Housing Structure by Heating Type in Cibola County
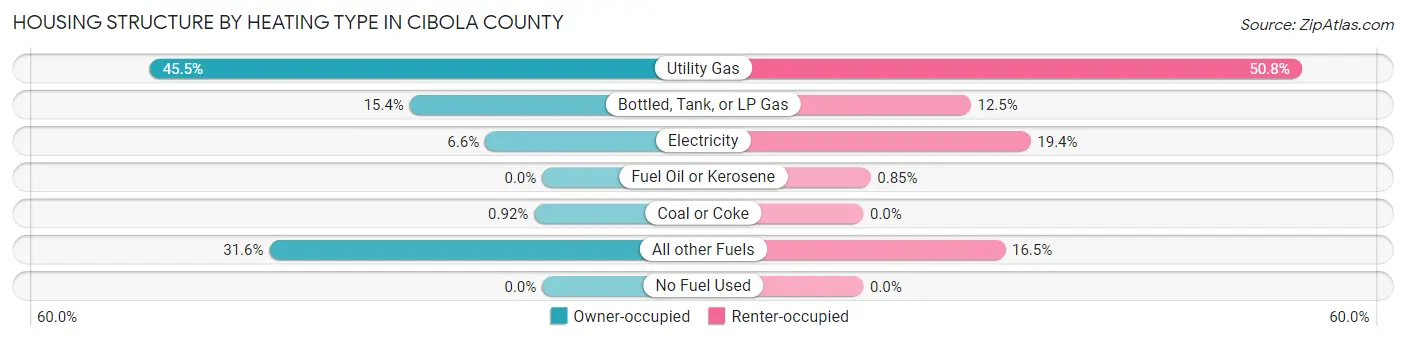
| Heating Type | Owner-occupied | Renter-occupied |
| Utility Gas | 2,626 (45.5%) | 1,195 (50.8%) |
| Bottled, Tank, or LP Gas | 886 (15.3%) | 293 (12.5%) |
| Electricity | 382 (6.6%) | 456 (19.4%) |
| Fuel Oil or Kerosene | 0 (0.0%) | 20 (0.9%) |
| Coal or Coke | 53 (0.9%) | 0 (0.0%) |
| All other Fuels | 1,826 (31.6%) | 387 (16.5%) |
| No Fuel Used | 0 (0.0%) | 0 (0.0%) |
| Total | 5,773 (100.0%) | 2,351 (100.0%) |
Household Vehicle Usage in Cibola County
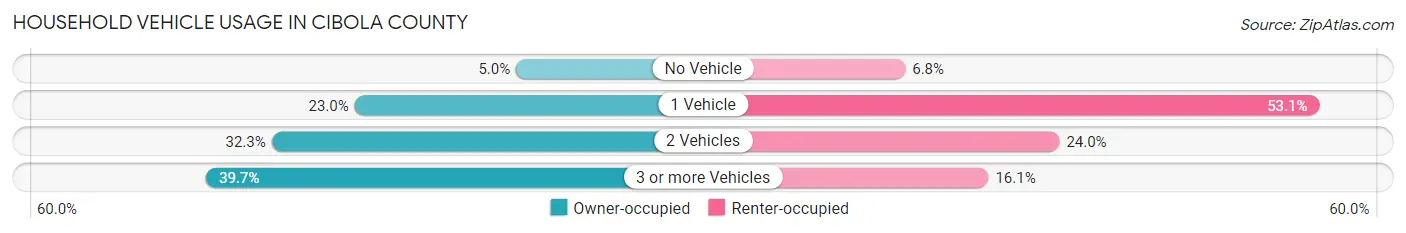
| Vehicles per Household | Owner-occupied | Renter-occupied |
| No Vehicle | 286 (5.0%) | 159 (6.8%) |
| 1 Vehicle | 1,330 (23.0%) | 1,249 (53.1%) |
| 2 Vehicles | 1,867 (32.3%) | 565 (24.0%) |
| 3 or more Vehicles | 2,290 (39.7%) | 378 (16.1%) |
| Total | 5,773 (100.0%) | 2,351 (100.0%) |
Real Estate & Mortgages in Cibola County
Real Estate and Mortgage Overview in Cibola County
| Characteristic | Without Mortgage | With Mortgage |
| Housing Units | 3,859 | 1,914 |
| Median Property Value | $80,600 | $148,000 |
| Median Household Income | $44,777 | $383 |
| Monthly Housing Costs | $310 | $3 |
| Real Estate Taxes | $543 | $266 |
Property Value by Mortgage Status in Cibola County
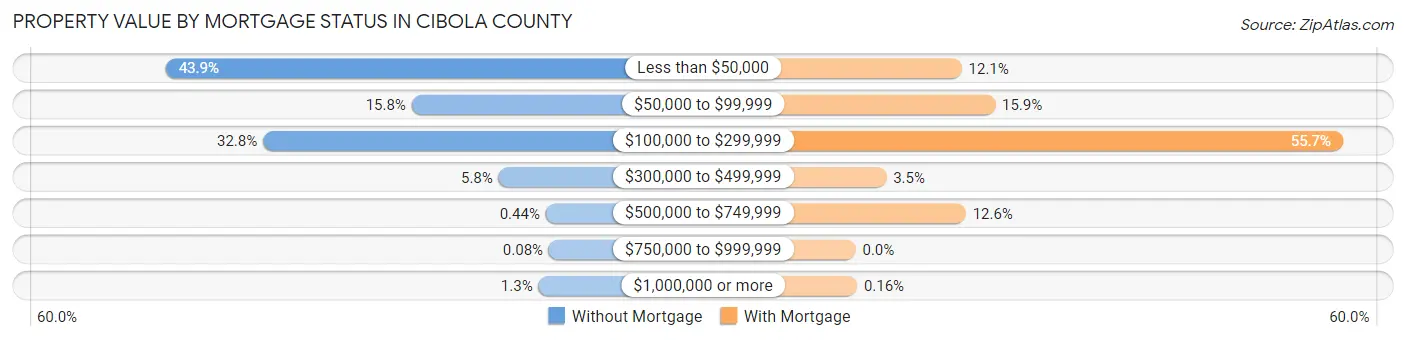
| Property Value | Without Mortgage | With Mortgage |
| Less than $50,000 | 1,693 (43.9%) | 232 (12.1%) |
| $50,000 to $99,999 | 608 (15.8%) | 305 (15.9%) |
| $100,000 to $299,999 | 1,264 (32.8%) | 1,066 (55.7%) |
| $300,000 to $499,999 | 225 (5.8%) | 67 (3.5%) |
| $500,000 to $749,999 | 17 (0.4%) | 241 (12.6%) |
| $750,000 to $999,999 | 3 (0.1%) | 0 (0.0%) |
| $1,000,000 or more | 49 (1.3%) | 3 (0.2%) |
| Total | 3,859 (100.0%) | 1,914 (100.0%) |
Household Income by Mortgage Status in Cibola County
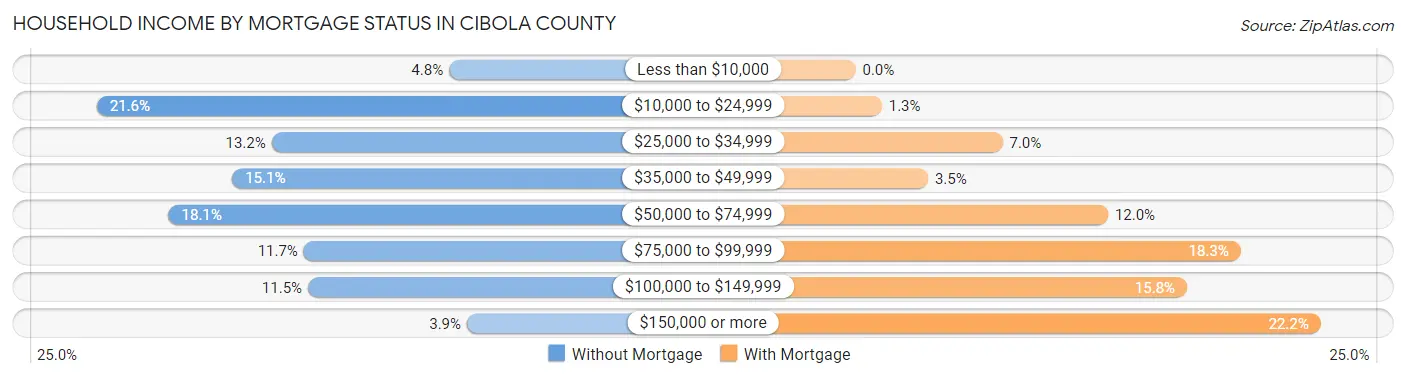
| Household Income | Without Mortgage | With Mortgage |
| Less than $10,000 | 185 (4.8%) | 0 (0.0%) |
| $10,000 to $24,999 | 832 (21.6%) | 24 (1.3%) |
| $25,000 to $34,999 | 511 (13.2%) | 134 (7.0%) |
| $35,000 to $49,999 | 583 (15.1%) | 66 (3.5%) |
| $50,000 to $74,999 | 700 (18.1%) | 230 (12.0%) |
| $75,000 to $99,999 | 452 (11.7%) | 351 (18.3%) |
| $100,000 to $149,999 | 444 (11.5%) | 302 (15.8%) |
| $150,000 or more | 152 (3.9%) | 424 (22.2%) |
| Total | 3,859 (100.0%) | 1,914 (100.0%) |
Property Value to Household Income Ratio in Cibola County
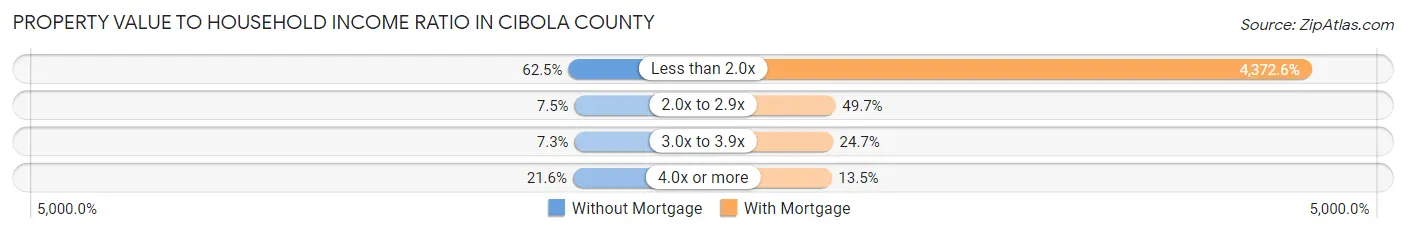
| Value-to-Income Ratio | Without Mortgage | With Mortgage |
| Less than 2.0x | 2,413 (62.5%) | 83,692 (4,372.6%) |
| 2.0x to 2.9x | 289 (7.5%) | 952 (49.7%) |
| 3.0x to 3.9x | 283 (7.3%) | 472 (24.7%) |
| 4.0x or more | 835 (21.6%) | 259 (13.5%) |
| Total | 3,859 (100.0%) | 1,914 (100.0%) |
Real Estate Taxes by Mortgage Status in Cibola County
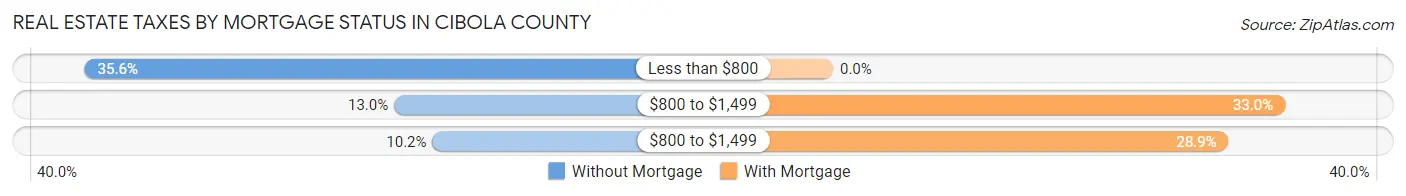
| Property Taxes | Without Mortgage | With Mortgage |
| Less than $800 | 1,374 (35.6%) | 0 (0.0%) |
| $800 to $1,499 | 502 (13.0%) | 632 (33.0%) |
| $800 to $1,499 | 394 (10.2%) | 553 (28.9%) |
| Total | 3,859 (100.0%) | 1,914 (100.0%) |
Health & Disability in Cibola County
Health Insurance Coverage by Age in Cibola County
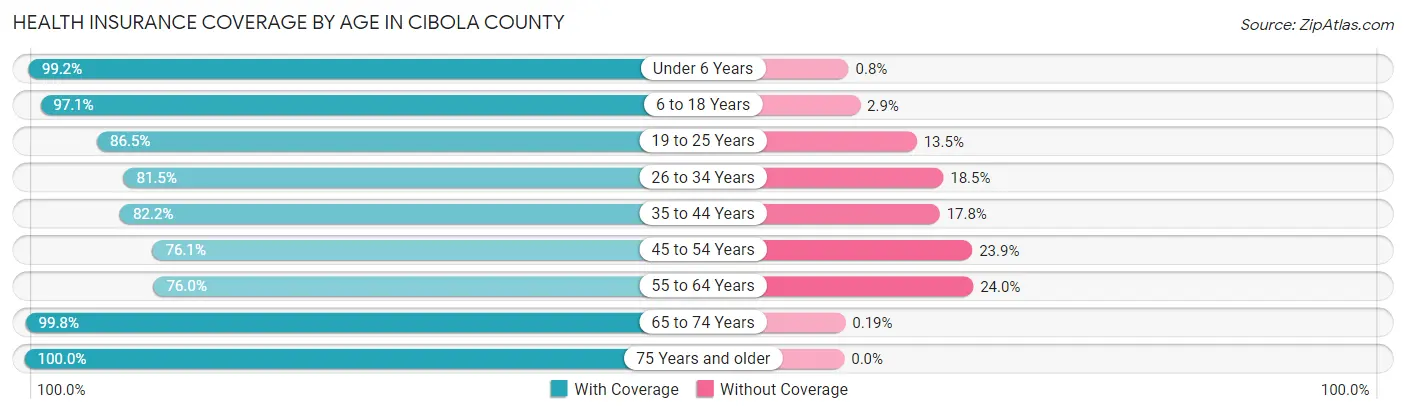
| Age Bracket | With Coverage | Without Coverage |
| Under 6 Years | 1,975 (99.2%) | 16 (0.8%) |
| 6 to 18 Years | 4,693 (97.1%) | 142 (2.9%) |
| 19 to 25 Years | 1,965 (86.5%) | 307 (13.5%) |
| 26 to 34 Years | 2,584 (81.5%) | 585 (18.5%) |
| 35 to 44 Years | 2,436 (82.2%) | 527 (17.8%) |
| 45 to 54 Years | 2,144 (76.1%) | 672 (23.9%) |
| 55 to 64 Years | 2,528 (76.0%) | 800 (24.0%) |
| 65 to 74 Years | 2,675 (99.8%) | 5 (0.2%) |
| 75 Years and older | 1,837 (100.0%) | 0 (0.0%) |
| Total | 22,837 (88.2%) | 3,054 (11.8%) |
Health Insurance Coverage by Citizenship Status in Cibola County
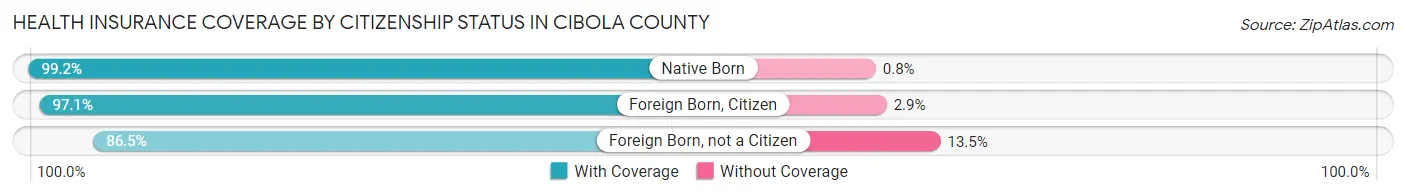
| Citizenship Status | With Coverage | Without Coverage |
| Native Born | 1,975 (99.2%) | 16 (0.8%) |
| Foreign Born, Citizen | 4,693 (97.1%) | 142 (2.9%) |
| Foreign Born, not a Citizen | 1,965 (86.5%) | 307 (13.5%) |
Health Insurance Coverage by Household Income in Cibola County
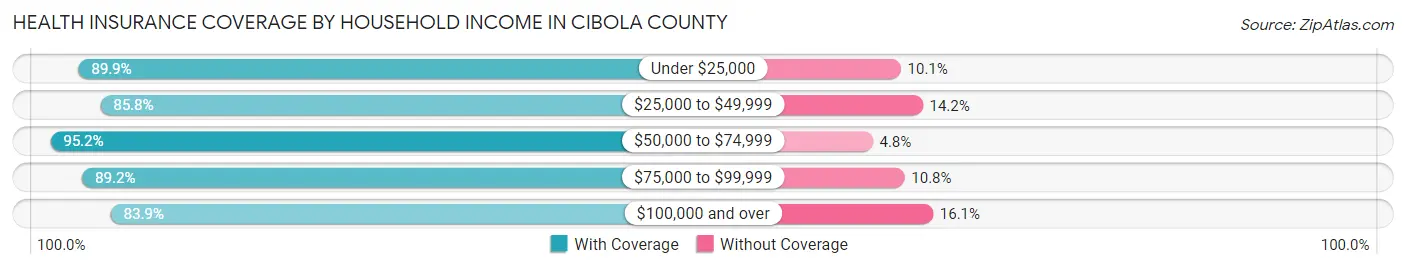
| Household Income | With Coverage | Without Coverage |
| Under $25,000 | 4,139 (89.9%) | 464 (10.1%) |
| $25,000 to $49,999 | 5,239 (85.8%) | 866 (14.2%) |
| $50,000 to $74,999 | 3,932 (95.2%) | 199 (4.8%) |
| $75,000 to $99,999 | 4,061 (89.2%) | 491 (10.8%) |
| $100,000 and over | 5,381 (83.9%) | 1,034 (16.1%) |
Public vs Private Health Insurance Coverage by Age in Cibola County
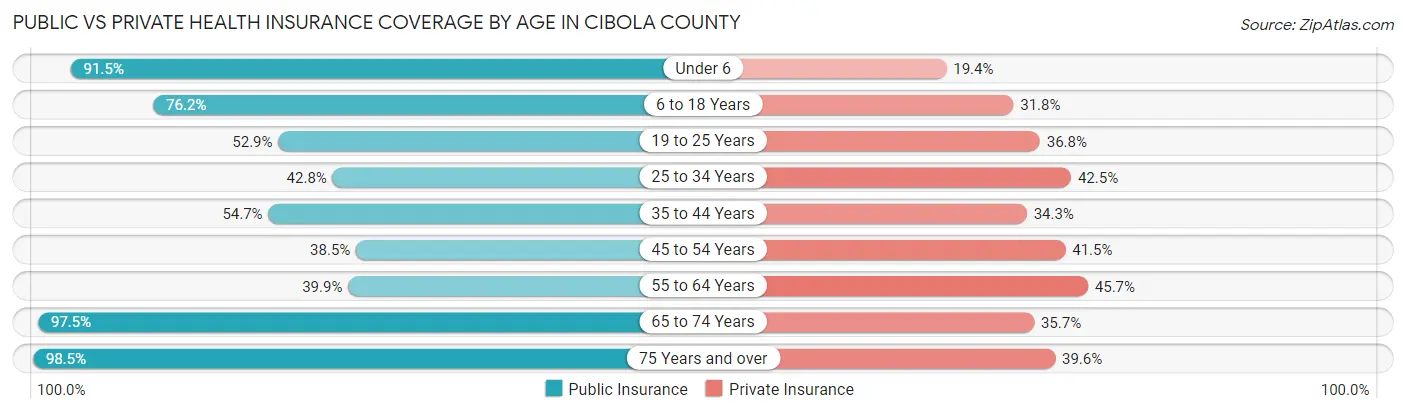
| Age Bracket | Public Insurance | Private Insurance |
| Under 6 | 1,821 (91.5%) | 386 (19.4%) |
| 6 to 18 Years | 3,682 (76.1%) | 1,539 (31.8%) |
| 19 to 25 Years | 1,202 (52.9%) | 835 (36.7%) |
| 25 to 34 Years | 1,357 (42.8%) | 1,348 (42.5%) |
| 35 to 44 Years | 1,622 (54.7%) | 1,017 (34.3%) |
| 45 to 54 Years | 1,083 (38.5%) | 1,168 (41.5%) |
| 55 to 64 Years | 1,329 (39.9%) | 1,520 (45.7%) |
| 65 to 74 Years | 2,614 (97.5%) | 956 (35.7%) |
| 75 Years and over | 1,809 (98.5%) | 727 (39.6%) |
| Total | 16,519 (63.8%) | 9,496 (36.7%) |
Disability Status by Sex by Age in Cibola County
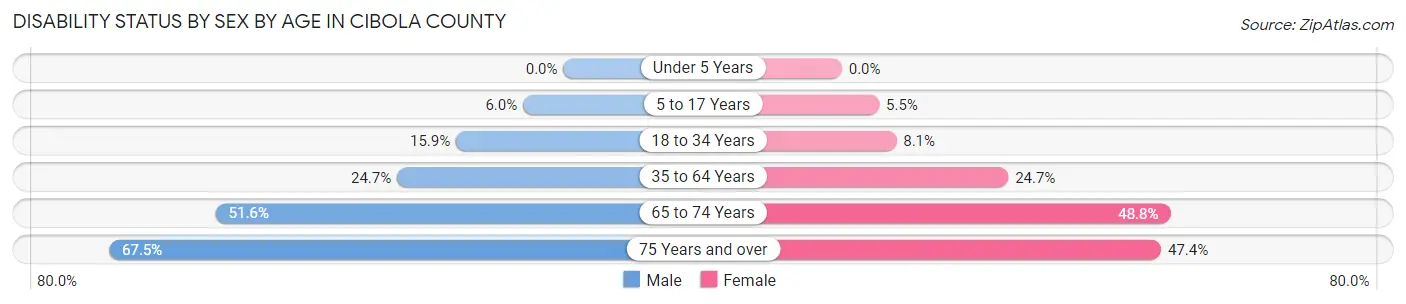
| Age Bracket | Male | Female |
| Under 5 Years | 0 (0.0%) | 0 (0.0%) |
| 5 to 17 Years | 125 (6.0%) | 145 (5.5%) |
| 18 to 34 Years | 481 (15.9%) | 228 (8.1%) |
| 35 to 64 Years | 1,110 (24.7%) | 1,140 (24.7%) |
| 65 to 74 Years | 650 (51.6%) | 693 (48.8%) |
| 75 Years and over | 535 (67.5%) | 495 (47.4%) |
Disability Class by Sex by Age in Cibola County
Disability Class: Hearing Difficulty
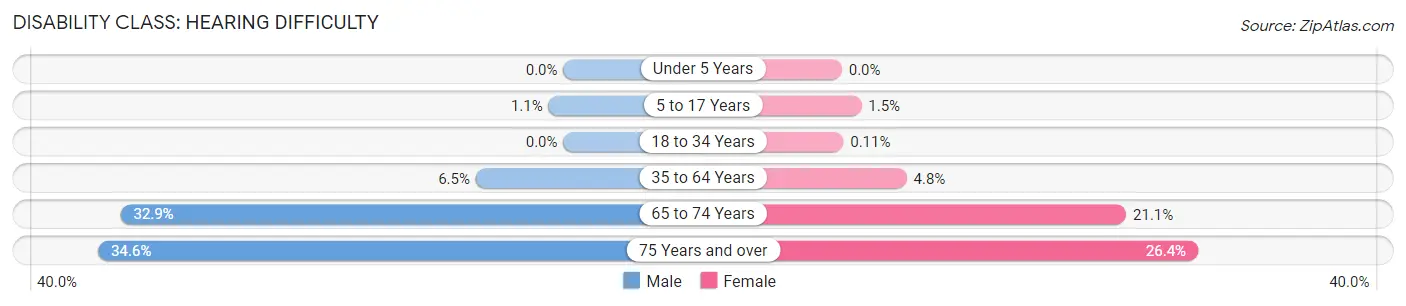
| Age Bracket | Male | Female |
| Under 5 Years | 0 (0.0%) | 0 (0.0%) |
| 5 to 17 Years | 23 (1.1%) | 38 (1.5%) |
| 18 to 34 Years | 0 (0.0%) | 3 (0.1%) |
| 35 to 64 Years | 292 (6.5%) | 222 (4.8%) |
| 65 to 74 Years | 414 (32.9%) | 300 (21.1%) |
| 75 Years and over | 274 (34.5%) | 276 (26.4%) |
Disability Class: Vision Difficulty
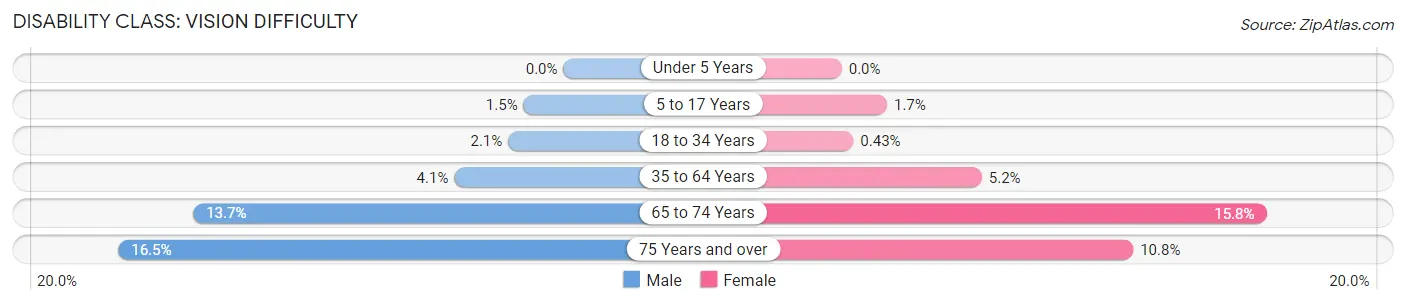
| Age Bracket | Male | Female |
| Under 5 Years | 0 (0.0%) | 0 (0.0%) |
| 5 to 17 Years | 31 (1.5%) | 44 (1.7%) |
| 18 to 34 Years | 62 (2.1%) | 12 (0.4%) |
| 35 to 64 Years | 182 (4.1%) | 240 (5.2%) |
| 65 to 74 Years | 173 (13.7%) | 224 (15.8%) |
| 75 Years and over | 131 (16.5%) | 113 (10.8%) |
Disability Class: Cognitive Difficulty
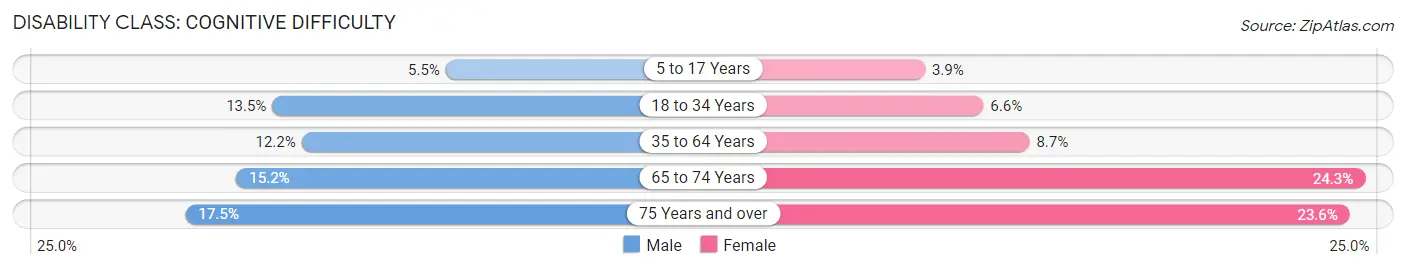
| Age Bracket | Male | Female |
| 5 to 17 Years | 114 (5.5%) | 101 (3.9%) |
| 18 to 34 Years | 408 (13.5%) | 185 (6.6%) |
| 35 to 64 Years | 546 (12.1%) | 402 (8.7%) |
| 65 to 74 Years | 191 (15.2%) | 345 (24.3%) |
| 75 Years and over | 139 (17.5%) | 246 (23.6%) |
Disability Class: Ambulatory Difficulty
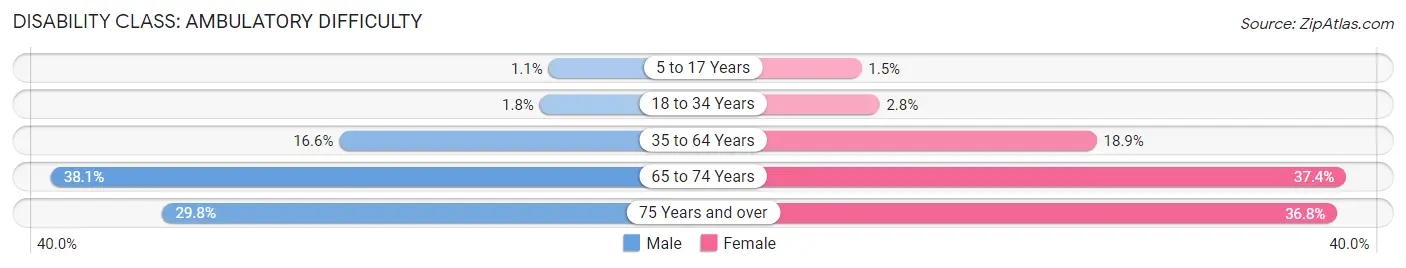
| Age Bracket | Male | Female |
| 5 to 17 Years | 23 (1.1%) | 38 (1.5%) |
| 18 to 34 Years | 53 (1.8%) | 79 (2.8%) |
| 35 to 64 Years | 748 (16.6%) | 873 (18.9%) |
| 65 to 74 Years | 479 (38.1%) | 532 (37.4%) |
| 75 Years and over | 236 (29.8%) | 384 (36.8%) |
Disability Class: Self-Care Difficulty
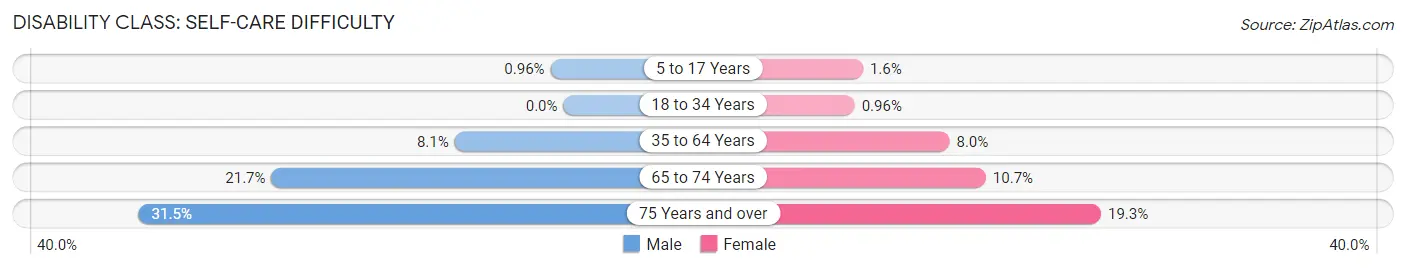
| Age Bracket | Male | Female |
| 5 to 17 Years | 20 (1.0%) | 41 (1.6%) |
| 18 to 34 Years | 0 (0.0%) | 27 (1.0%) |
| 35 to 64 Years | 363 (8.1%) | 369 (8.0%) |
| 65 to 74 Years | 273 (21.7%) | 152 (10.7%) |
| 75 Years and over | 250 (31.5%) | 201 (19.3%) |
Technology Access in Cibola County
Computing Device Access in Cibola County
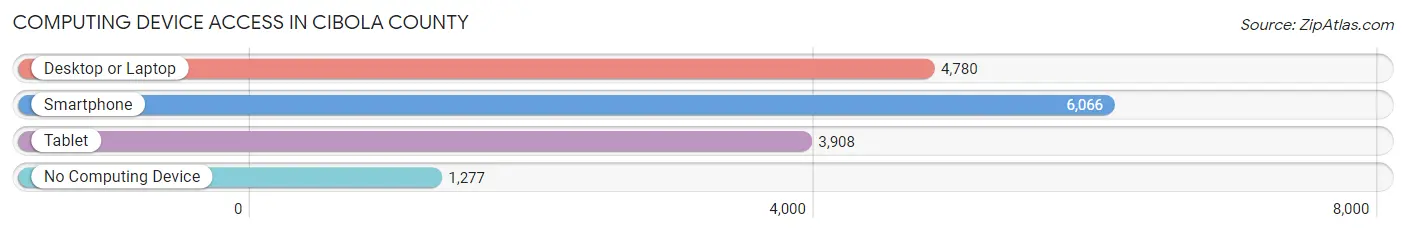
| Device Type | # Households | % Households |
| Desktop or Laptop | 4,780 | 58.8% |
| Smartphone | 6,066 | 74.7% |
| Tablet | 3,908 | 48.1% |
| No Computing Device | 1,277 | 15.7% |
| Total | 8,124 | 100.0% |
Internet Access in Cibola County
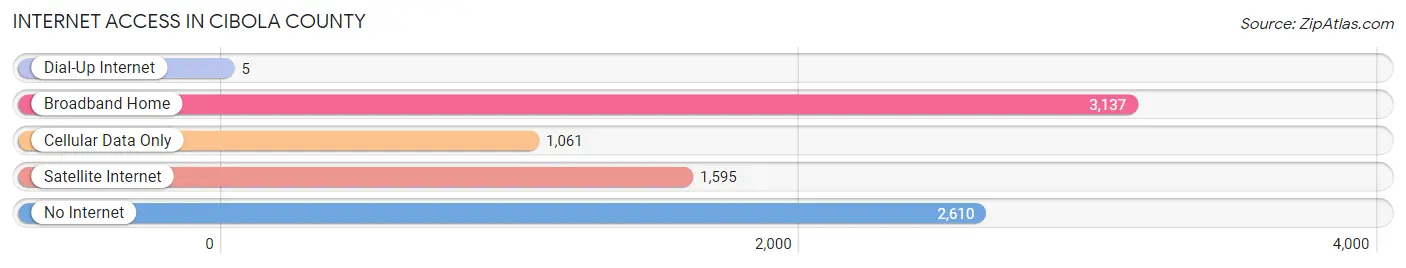
| Internet Type | # Households | % Households |
| Dial-Up Internet | 5 | 0.1% |
| Broadband Home | 3,137 | 38.6% |
| Cellular Data Only | 1,061 | 13.1% |
| Satellite Internet | 1,595 | 19.6% |
| No Internet | 2,610 | 32.1% |
| Total | 8,124 | 100.0% |
Cibola County Summary
Cibola County is located in the western part of the state of New Mexico, in the United States. It is bordered by McKinley County to the north, Sandoval County to the east, Valencia County to the south, and Apache County, Arizona to the west. The county seat is Grants, and the largest city is Milan. The county has a total area of 5,541 square miles, making it the fourth-largest county in New Mexico.
History
The area that is now Cibola County was originally inhabited by the Ancestral Puebloans, who lived in the area from around 1000 AD to 1300 AD. The area was later inhabited by the Navajo, Apache, and Ute tribes. The first Europeans to explore the area were Spanish explorers in the late 1500s. The area was part of the Spanish province of New Mexico until 1821, when Mexico gained independence from Spain. After the Mexican-American War, the area became part of the United States in 1848.
In 1876, the area was organized as part of the newly created Apache County, Arizona Territory. In 1893, the area was split off to form Cibola County, New Mexico Territory. The county was named after the legendary Seven Cities of Cibola, which were said to be located in the area.
Geography
Cibola County is located in the western part of the state of New Mexico. It is bordered by McKinley County to the north, Sandoval County to the east, Valencia County to the south, and Apache County, Arizona to the west. The county has a total area of 5,541 square miles, making it the fourth-largest county in New Mexico.
The county is mostly made up of flat desert terrain, with some rolling hills in the northern part of the county. The highest point in the county is the summit of Mount Taylor, which has an elevation of 11,301 feet. The county is home to several rivers, including the San Juan River, the Rio Puerco, and the Rio San Jose.
Economy
Cibola County has a diverse economy, with a mix of agriculture, manufacturing, and tourism. The county is home to several large agricultural operations, including cattle ranches, dairy farms, and vegetable farms. The county is also home to several manufacturing companies, including a large paper mill in Grants.
Tourism is an important part of the county's economy, with visitors coming to the area to explore the nearby national parks and monuments, such as El Malpais National Monument and El Morro National Monument. The county is also home to several casinos, which attract visitors from around the region.
Demographics
As of the 2010 census, Cibola County had a population of 27,213. The population was 53.3% Hispanic or Latino, 37.2% Native American, 5.2% White, and 4.3% other. The median household income was $35,945, and the median family income was $41,945. The per capita income was $17,845.
The largest city in the county is Milan, with a population of 4,945. Other cities in the county include Grants, with a population of 9,182, and Bluewater, with a population of 1,845. The county seat is Grants.
Common Questions
What is Per Capita Income in Cibola County?
Per Capita income in Cibola County is $22,394.
What is the Median Family Income in Cibola County?
Median Family Income in Cibola County is $61,609.
What is the Median Household income in Cibola County?
Median Household Income in Cibola County is $49,866.
What is Income or Wage Gap in Cibola County?
Income or Wage Gap in Cibola County is 25.9%.
Women in Cibola County earn 74.1 cents for every dollar earned by a man.
What is Family Income Deficit in Cibola County?
Family Income Deficit in Cibola County is $9,082.
Families that are below poverty line in Cibola County earn $9,082 less on average than the poverty threshold level.
What is Inequality or Gini Index in Cibola County?
Inequality or Gini Index in Cibola County is 0.43.
What is the Total Population of Cibola County?
Total Population of Cibola County is 27,211.
What is the Total Male Population of Cibola County?
Total Male Population of Cibola County is 13,765.
What is the Total Female Population of Cibola County?
Total Female Population of Cibola County is 13,446.
What is the Ratio of Males per 100 Females in Cibola County?
There are 102.37 Males per 100 Females in Cibola County.
What is the Ratio of Females per 100 Males in Cibola County?
There are 97.68 Females per 100 Males in Cibola County.
What is the Median Population Age in Cibola County?
Median Population Age in Cibola County is 38.0 Years.
What is the Average Family Size in Cibola County
Average Family Size in Cibola County is 3.9 People.
What is the Average Household Size in Cibola County
Average Household Size in Cibola County is 3.2 People.
How Large is the Labor Force in Cibola County?
There are 9,629 People in the Labor Forcein in Cibola County.
What is the Percentage of People in the Labor Force in Cibola County?
45.1% of People are in the Labor Force in Cibola County.
What is the Unemployment Rate in Cibola County?
Unemployment Rate in Cibola County is 7.3%.