Santa Fe County, NM Map & Demographics
Santa Fe County Map
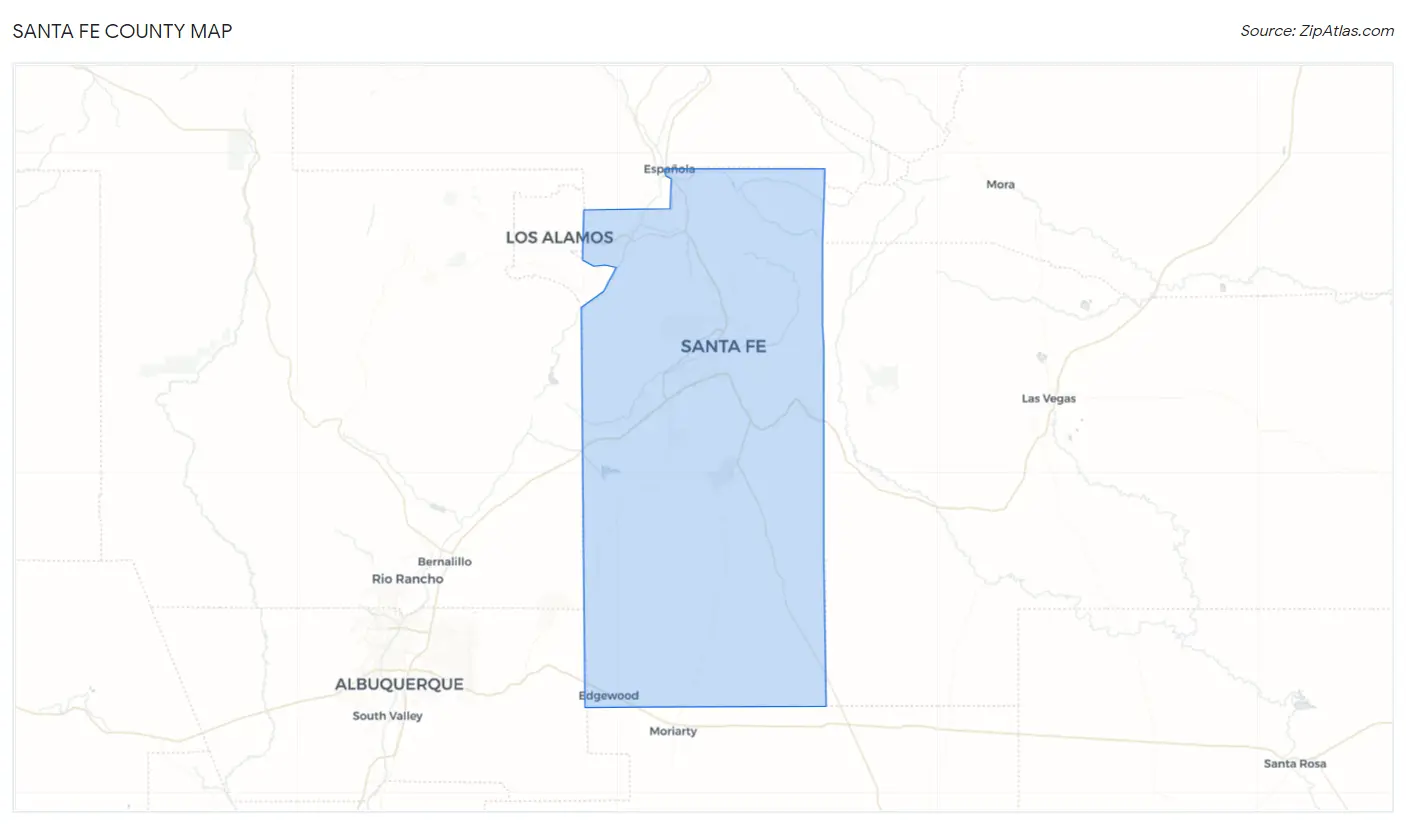
Santa Fe County Overview
$45,402
PER CAPITA INCOME
$84,058
AVG FAMILY INCOME
$70,522
AVG HOUSEHOLD INCOME
22.4%
WAGE / INCOME GAP [ % ]
77.6¢/ $1
WAGE / INCOME GAP [ $ ]
$9,615
FAMILY INCOME DEFICIT
0.49
INEQUALITY / GINI INDEX
154,481
TOTAL POPULATION
75,375
MALE POPULATION
79,106
FEMALE POPULATION
95.28
MALES / 100 FEMALES
104.95
FEMALES / 100 MALES
47.7
MEDIAN AGE
2.9
AVG FAMILY SIZE
2.2
AVG HOUSEHOLD SIZE
75,829
LABOR FORCE [ PEOPLE ]
57.7%
PERCENT IN LABOR FORCE
5.4%
UNEMPLOYMENT RATE
Income in Santa Fe County
Income Overview in Santa Fe County
Per Capita Income in Santa Fe County is $45,402, while median incomes of families and households are $84,058 and $70,522 respectively.
| Characteristic | Number | Measure |
| Per Capita Income | 154,481 | $45,402 |
| Median Family Income | 39,258 | $84,058 |
| Mean Family Income | 39,258 | $119,354 |
| Median Household Income | 67,866 | $70,522 |
| Mean Household Income | 67,866 | $99,932 |
| Income Deficit | 39,258 | $9,615 |
| Wage / Income Gap (%) | 154,481 | 22.42% |
| Wage / Income Gap ($) | 154,481 | 77.58¢ per $1 |
| Gini / Inequality Index | 154,481 | 0.49 |
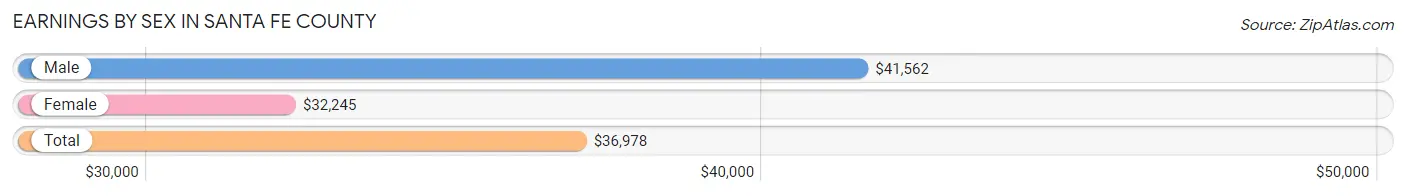
Earnings by Sex in Santa Fe County
Average Earnings in Santa Fe County are $36,978, $41,562 for men and $32,245 for women, a difference of 22.4%.
| Sex | Number | Average Earnings |
| Male | 41,253 (51.6%) | $41,562 |
| Female | 38,736 (48.4%) | $32,245 |
| Total | 79,989 (100.0%) | $36,978 |
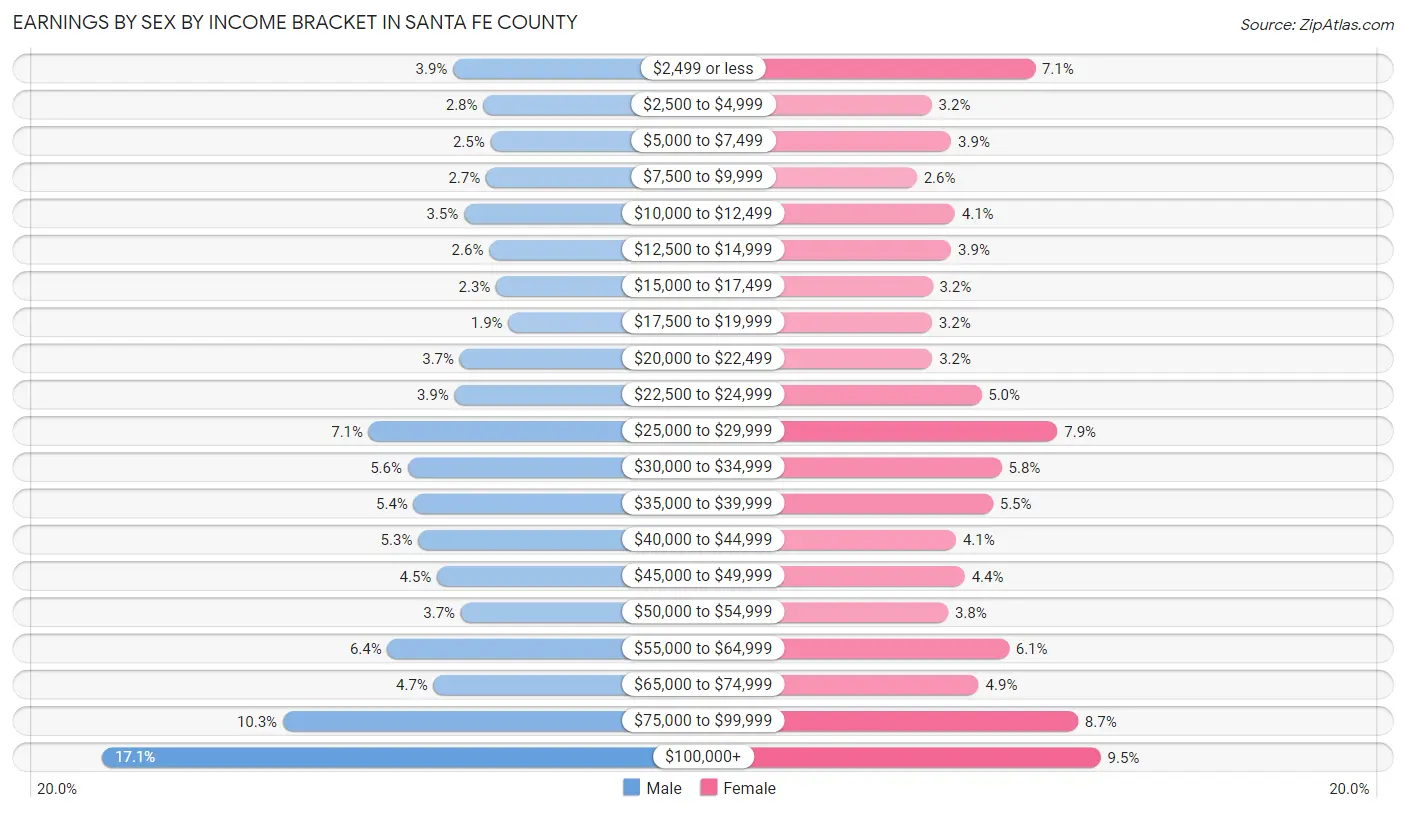
Earnings by Sex by Income Bracket in Santa Fe County
The most common earnings brackets in Santa Fe County are $100,000+ for men (7,055 | 17.1%) and $100,000+ for women (3,685 | 9.5%).
| Income | Male | Female |
| $2,499 or less | 1,626 (3.9%) | 2,732 (7.0%) |
| $2,500 to $4,999 | 1,161 (2.8%) | 1,231 (3.2%) |
| $5,000 to $7,499 | 1,047 (2.5%) | 1,515 (3.9%) |
| $7,500 to $9,999 | 1,120 (2.7%) | 1,013 (2.6%) |
| $10,000 to $12,499 | 1,455 (3.5%) | 1,567 (4.1%) |
| $12,500 to $14,999 | 1,069 (2.6%) | 1,513 (3.9%) |
| $15,000 to $17,499 | 963 (2.3%) | 1,243 (3.2%) |
| $17,500 to $19,999 | 772 (1.9%) | 1,236 (3.2%) |
| $20,000 to $22,499 | 1,523 (3.7%) | 1,240 (3.2%) |
| $22,500 to $24,999 | 1,603 (3.9%) | 1,954 (5.0%) |
| $25,000 to $29,999 | 2,927 (7.1%) | 3,058 (7.9%) |
| $30,000 to $34,999 | 2,327 (5.6%) | 2,247 (5.8%) |
| $35,000 to $39,999 | 2,235 (5.4%) | 2,117 (5.5%) |
| $40,000 to $44,999 | 2,167 (5.2%) | 1,586 (4.1%) |
| $45,000 to $49,999 | 1,873 (4.5%) | 1,713 (4.4%) |
| $50,000 to $54,999 | 1,506 (3.6%) | 1,468 (3.8%) |
| $55,000 to $64,999 | 2,639 (6.4%) | 2,352 (6.1%) |
| $65,000 to $74,999 | 1,928 (4.7%) | 1,913 (4.9%) |
| $75,000 to $99,999 | 4,257 (10.3%) | 3,353 (8.7%) |
| $100,000+ | 7,055 (17.1%) | 3,685 (9.5%) |
| Total | 41,253 (100.0%) | 38,736 (100.0%) |
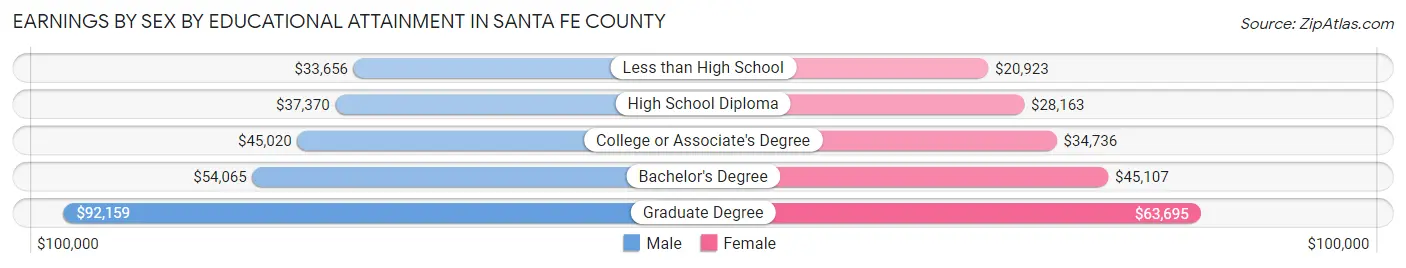
Earnings by Sex by Educational Attainment in Santa Fe County
Average earnings in Santa Fe County are $46,452 for men and $36,516 for women, a difference of 21.4%. Men with an educational attainment of graduate degree enjoy the highest average annual earnings of $92,159, while those with less than high school education earn the least with $33,656. Women with an educational attainment of graduate degree earn the most with the average annual earnings of $63,695, while those with less than high school education have the smallest earnings of $20,923.
| Educational Attainment | Male Income | Female Income |
| Less than High School | $33,656 | $20,923 |
| High School Diploma | $37,370 | $28,163 |
| College or Associate's Degree | $45,020 | $34,736 |
| Bachelor's Degree | $54,065 | $45,107 |
| Graduate Degree | $92,159 | $63,695 |
| Total | $46,452 | $36,516 |
Family Income in Santa Fe County
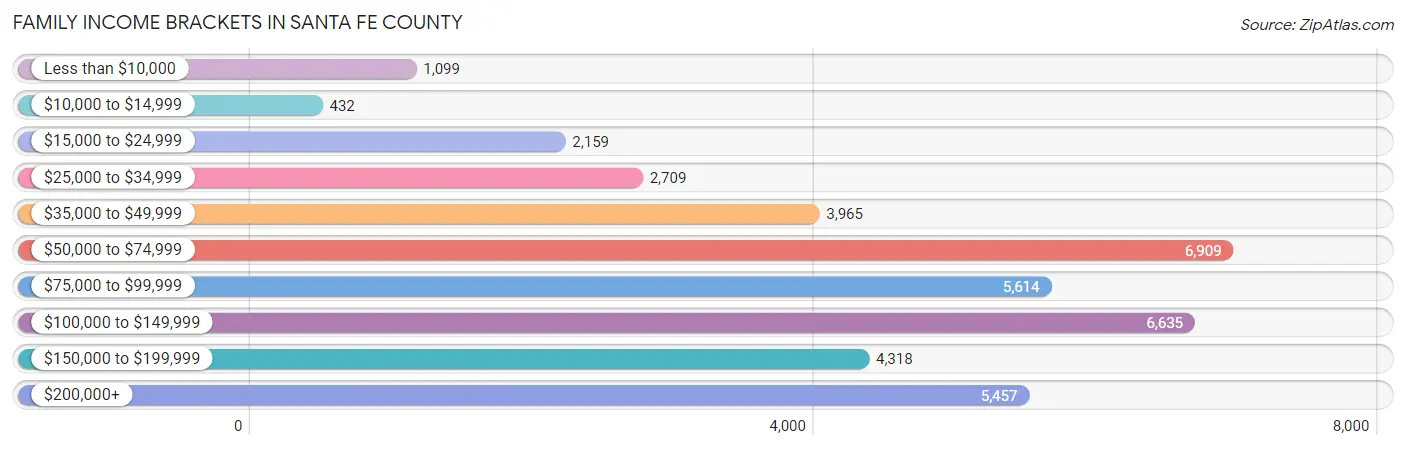
Family Income Brackets in Santa Fe County
According to the Santa Fe County family income data, there are 6,909 families falling into the $50,000 to $74,999 income range, which is the most common income bracket and makes up 17.6% of all families. Conversely, the $10,000 to $14,999 income bracket is the least frequent group with only 432 families (1.1%) belonging to this category.
| Income Bracket | # Families | % Families |
| Less than $10,000 | 1,099 | 2.8% |
| $10,000 to $14,999 | 432 | 1.1% |
| $15,000 to $24,999 | 2,159 | 5.5% |
| $25,000 to $34,999 | 2,709 | 6.9% |
| $35,000 to $49,999 | 3,965 | 10.1% |
| $50,000 to $74,999 | 6,909 | 17.6% |
| $75,000 to $99,999 | 5,614 | 14.3% |
| $100,000 to $149,999 | 6,635 | 16.9% |
| $150,000 to $199,999 | 4,318 | 11.0% |
| $200,000+ | 5,457 | 13.9% |
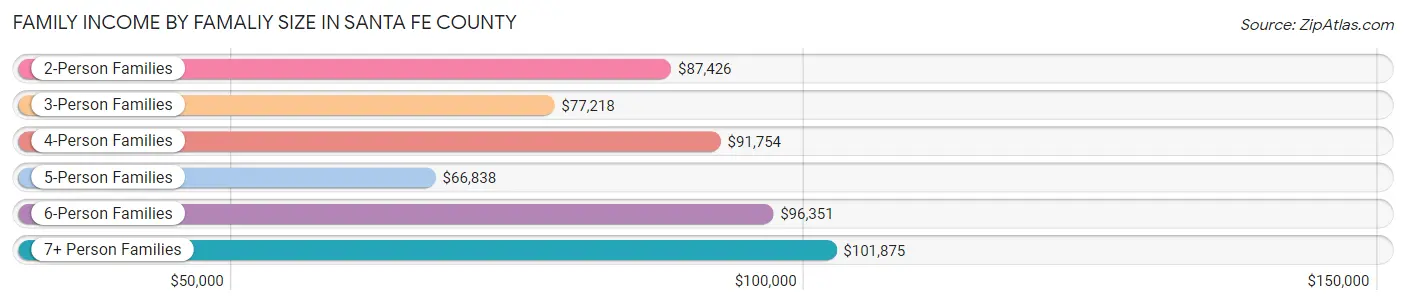
Family Income by Famaliy Size in Santa Fe County
7+ person families (437 | 1.1%) account for the highest median family income in Santa Fe County with $101,875 per family, while 2-person families (22,569 | 57.5%) have the highest median income of $43,713 per family member.
| Income Bracket | # Families | Median Income |
| 2-Person Families | 22,569 (57.5%) | $87,426 |
| 3-Person Families | 8,023 (20.4%) | $77,218 |
| 4-Person Families | 5,190 (13.2%) | $91,754 |
| 5-Person Families | 2,127 (5.4%) | $66,838 |
| 6-Person Families | 912 (2.3%) | $96,351 |
| 7+ Person Families | 437 (1.1%) | $101,875 |
| Total | 39,258 (100.0%) | $84,058 |
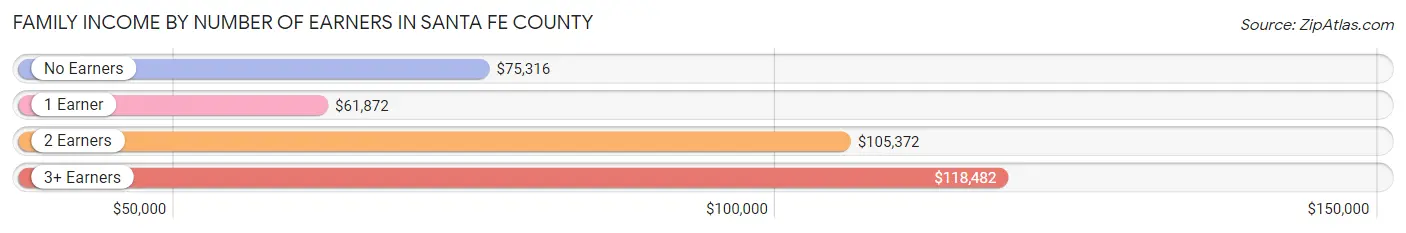
Family Income by Number of Earners in Santa Fe County
The median family income in Santa Fe County is $84,058, with families comprising 3+ earners (2,694) having the highest median family income of $118,482, while families with 1 earner (13,279) have the lowest median family income of $61,872, accounting for 6.9% and 33.8% of families, respectively.
| Number of Earners | # Families | Median Income |
| No Earners | 8,221 (20.9%) | $75,316 |
| 1 Earner | 13,279 (33.8%) | $61,872 |
| 2 Earners | 15,064 (38.4%) | $105,372 |
| 3+ Earners | 2,694 (6.9%) | $118,482 |
| Total | 39,258 (100.0%) | $84,058 |
Household Income in Santa Fe County
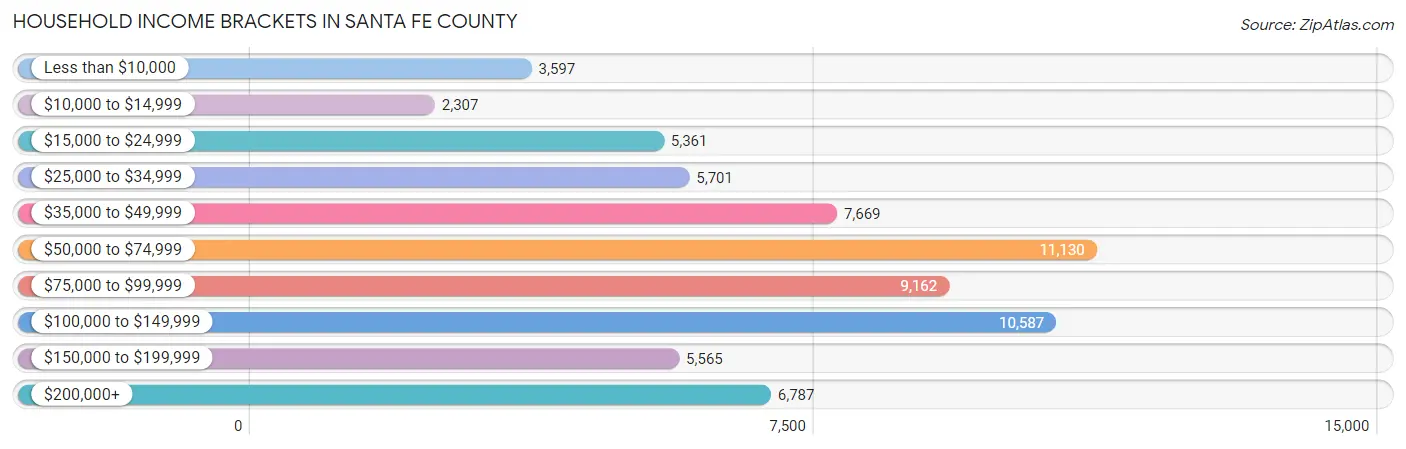
Household Income Brackets in Santa Fe County
With 11,130 households falling in the category, the $50,000 to $74,999 income range is the most frequent in Santa Fe County, accounting for 16.4% of all households. In contrast, only 2,307 households (3.4%) fall into the $10,000 to $14,999 income bracket, making it the least populous group.
| Income Bracket | # Households | % Households |
| Less than $10,000 | 3,597 | 5.3% |
| $10,000 to $14,999 | 2,307 | 3.4% |
| $15,000 to $24,999 | 5,361 | 7.9% |
| $25,000 to $34,999 | 5,701 | 8.4% |
| $35,000 to $49,999 | 7,669 | 11.3% |
| $50,000 to $74,999 | 11,130 | 16.4% |
| $75,000 to $99,999 | 9,162 | 13.5% |
| $100,000 to $149,999 | 10,587 | 15.6% |
| $150,000 to $199,999 | 5,565 | 8.2% |
| $200,000+ | 6,787 | 10.0% |
Household Income by Householder Age in Santa Fe County
The median household income in Santa Fe County is $70,522, with the highest median household income of $79,154 found in the 45 to 64 years age bracket for the primary householder. A total of 23,485 households (34.6%) fall into this category. Meanwhile, the 15 to 24 years age bracket for the primary householder has the lowest median household income of $36,919, with 1,566 households (2.3%) in this group.
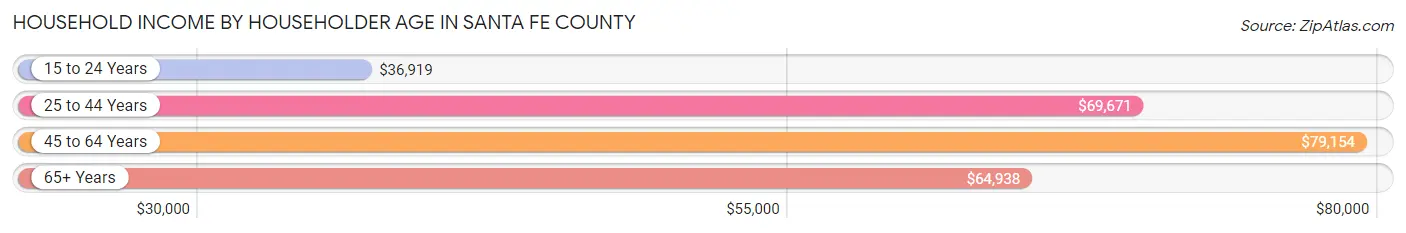
| Income Bracket | # Households | Median Income |
| 15 to 24 Years | 1,566 (2.3%) | $36,919 |
| 25 to 44 Years | 16,405 (24.2%) | $69,671 |
| 45 to 64 Years | 23,485 (34.6%) | $79,154 |
| 65+ Years | 26,410 (38.9%) | $64,938 |
| Total | 67,866 (100.0%) | $70,522 |
Poverty in Santa Fe County
Income Below Poverty by Sex and Age in Santa Fe County
With 11.7% poverty level for males and 12.9% for females among the residents of Santa Fe County, under 5 year old males and 15 year old females are the most vulnerable to poverty, with 760 males (25.3%) and 225 females (28.2%) in their respective age groups living below the poverty level.
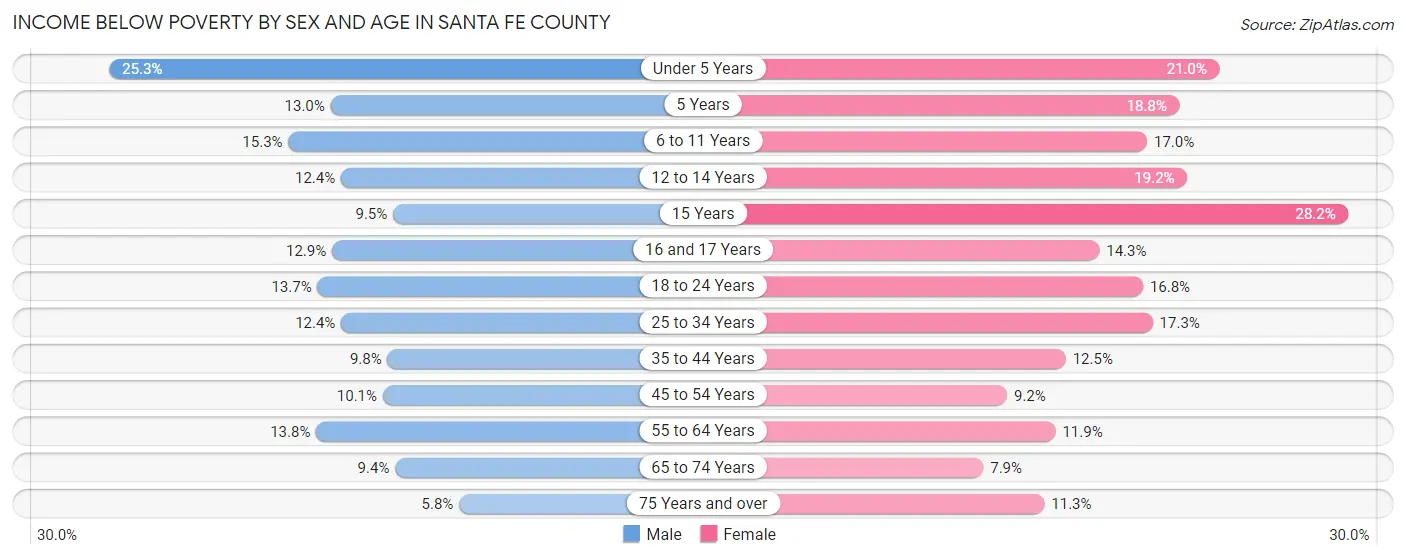
| Age Bracket | Male | Female |
| Under 5 Years | 760 (25.3%) | 605 (21.0%) |
| 5 Years | 98 (13.0%) | 115 (18.8%) |
| 6 to 11 Years | 684 (15.3%) | 735 (17.0%) |
| 12 to 14 Years | 286 (12.4%) | 504 (19.2%) |
| 15 Years | 86 (9.5%) | 225 (28.2%) |
| 16 and 17 Years | 204 (12.9%) | 259 (14.3%) |
| 18 to 24 Years | 749 (13.7%) | 870 (16.8%) |
| 25 to 34 Years | 1,009 (12.4%) | 1,422 (17.3%) |
| 35 to 44 Years | 872 (9.8%) | 1,114 (12.5%) |
| 45 to 54 Years | 910 (10.1%) | 836 (9.2%) |
| 55 to 64 Years | 1,494 (13.8%) | 1,463 (11.9%) |
| 65 to 74 Years | 1,083 (9.4%) | 1,052 (7.9%) |
| 75 Years and over | 384 (5.8%) | 932 (11.3%) |
| Total | 8,619 (11.7%) | 10,132 (12.9%) |
Income Above Poverty by Sex and Age in Santa Fe County
According to the poverty statistics in Santa Fe County, males aged 75 years and over and females aged 65 to 74 years are the age groups that are most secure financially, with 94.2% of males and 92.1% of females in these age groups living above the poverty line.
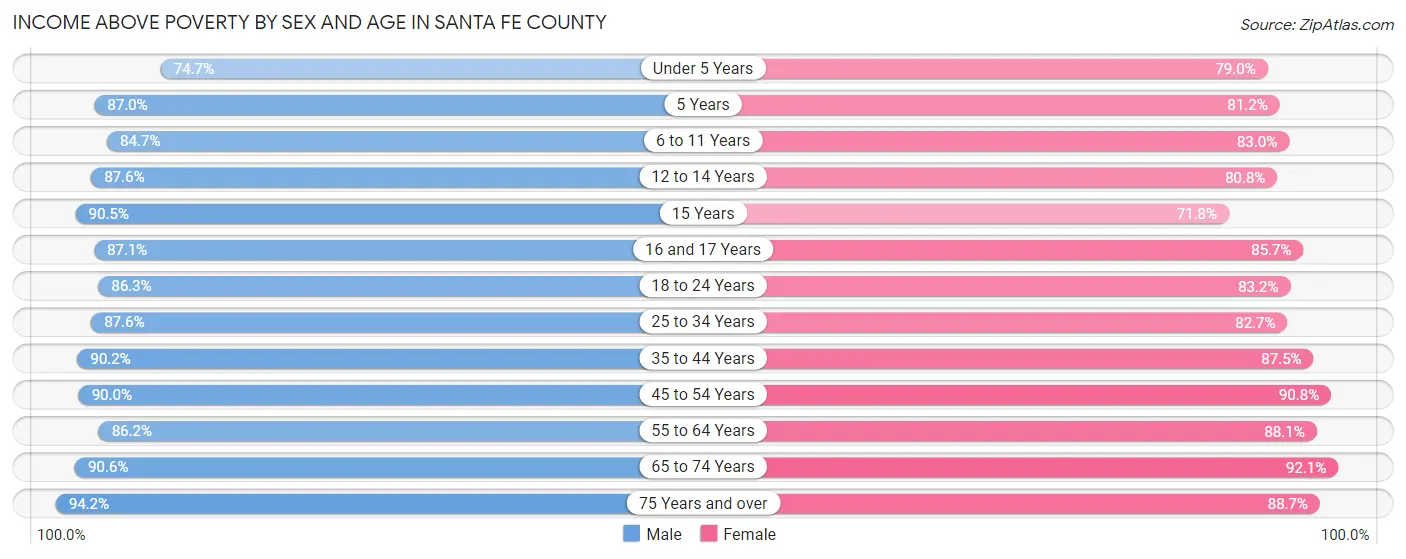
| Age Bracket | Male | Female |
| Under 5 Years | 2,245 (74.7%) | 2,277 (79.0%) |
| 5 Years | 658 (87.0%) | 498 (81.2%) |
| 6 to 11 Years | 3,784 (84.7%) | 3,588 (83.0%) |
| 12 to 14 Years | 2,025 (87.6%) | 2,123 (80.8%) |
| 15 Years | 821 (90.5%) | 574 (71.8%) |
| 16 and 17 Years | 1,380 (87.1%) | 1,547 (85.7%) |
| 18 to 24 Years | 4,723 (86.3%) | 4,318 (83.2%) |
| 25 to 34 Years | 7,147 (87.6%) | 6,793 (82.7%) |
| 35 to 44 Years | 8,039 (90.2%) | 7,817 (87.5%) |
| 45 to 54 Years | 8,142 (89.9%) | 8,255 (90.8%) |
| 55 to 64 Years | 9,364 (86.2%) | 10,830 (88.1%) |
| 65 to 74 Years | 10,492 (90.6%) | 12,300 (92.1%) |
| 75 Years and over | 6,241 (94.2%) | 7,332 (88.7%) |
| Total | 65,061 (88.3%) | 68,252 (87.1%) |
Income Below Poverty Among Married-Couple Families in Santa Fe County
The poverty statistics for married-couple families in Santa Fe County show that 6.5% or 1,869 of the total 28,677 families live below the poverty line. Families with 5 or more children have the highest poverty rate of 47.7%, comprising of 85 families. On the other hand, families with no children have the lowest poverty rate of 3.6%, which includes 716 families.
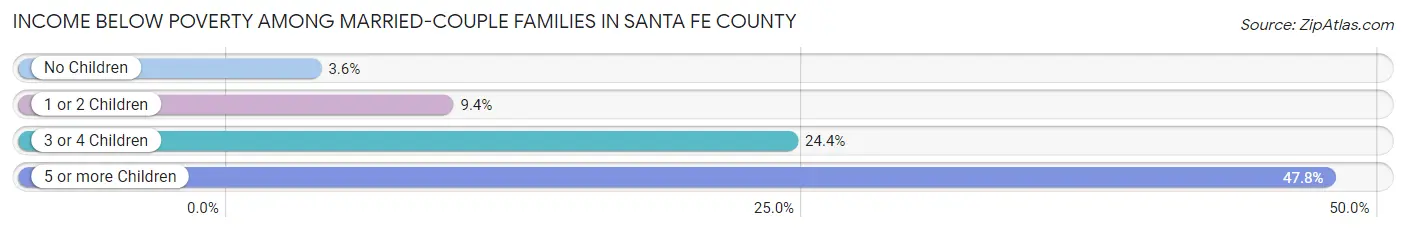
| Children | Above Poverty | Below Poverty |
| No Children | 19,023 (96.4%) | 716 (3.6%) |
| 1 or 2 Children | 6,451 (90.6%) | 668 (9.4%) |
| 3 or 4 Children | 1,241 (75.6%) | 400 (24.4%) |
| 5 or more Children | 93 (52.2%) | 85 (47.7%) |
| Total | 26,808 (93.5%) | 1,869 (6.5%) |
Income Below Poverty Among Single-Parent Households in Santa Fe County
According to the poverty data in Santa Fe County, 6.1% or 194 single-father households and 18.1% or 1,342 single-mother households are living below the poverty line. Among single-father households, those with 3 or 4 children have the highest poverty rate, with 12 households (12.2%) experiencing poverty. Likewise, among single-mother households, those with 3 or 4 children have the highest poverty rate, with 330 households (54.5%) falling below the poverty line.
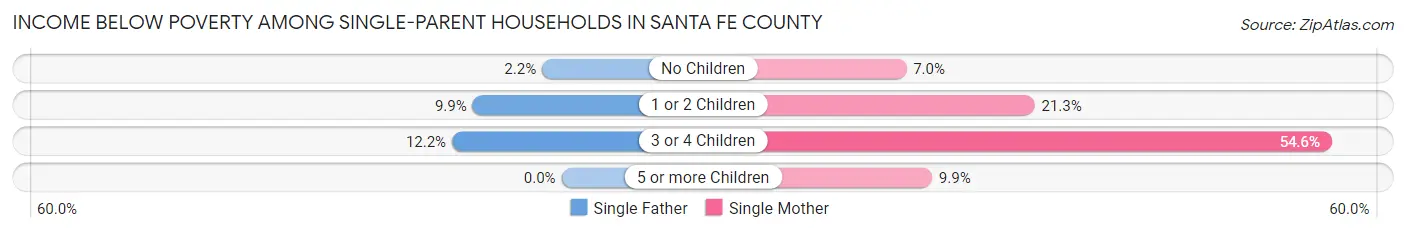
| Children | Single Father | Single Mother |
| No Children | 35 (2.2%) | 209 (7.0%) |
| 1 or 2 Children | 147 (9.9%) | 796 (21.3%) |
| 3 or 4 Children | 12 (12.2%) | 330 (54.5%) |
| 5 or more Children | 0 (0.0%) | 7 (9.9%) |
| Total | 194 (6.1%) | 1,342 (18.1%) |
Income Below Poverty Among Married-Couple vs Single-Parent Households in Santa Fe County
The poverty data for Santa Fe County shows that 1,869 of the married-couple family households (6.5%) and 1,536 of the single-parent households (14.5%) are living below the poverty level. Within the married-couple family households, those with 5 or more children have the highest poverty rate, with 85 households (47.7%) falling below the poverty line. Among the single-parent households, those with 3 or 4 children have the highest poverty rate, with 342 household (48.6%) living below poverty.
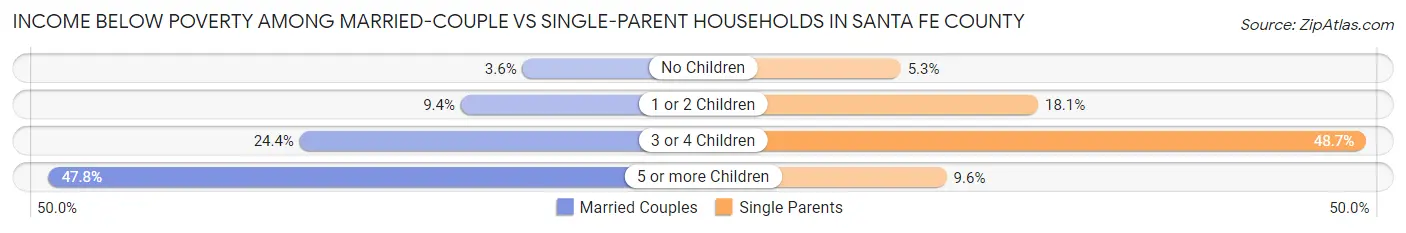
| Children | Married-Couple Families | Single-Parent Households |
| No Children | 716 (3.6%) | 244 (5.3%) |
| 1 or 2 Children | 668 (9.4%) | 943 (18.1%) |
| 3 or 4 Children | 400 (24.4%) | 342 (48.6%) |
| 5 or more Children | 85 (47.7%) | 7 (9.6%) |
| Total | 1,869 (6.5%) | 1,536 (14.5%) |
Race in Santa Fe County
The most populous races in Santa Fe County are White / Caucasian (104,066 | 67.4%), Hispanic or Latino (78,479 | 50.8%), and Two or more Races (23,743 | 15.4%).
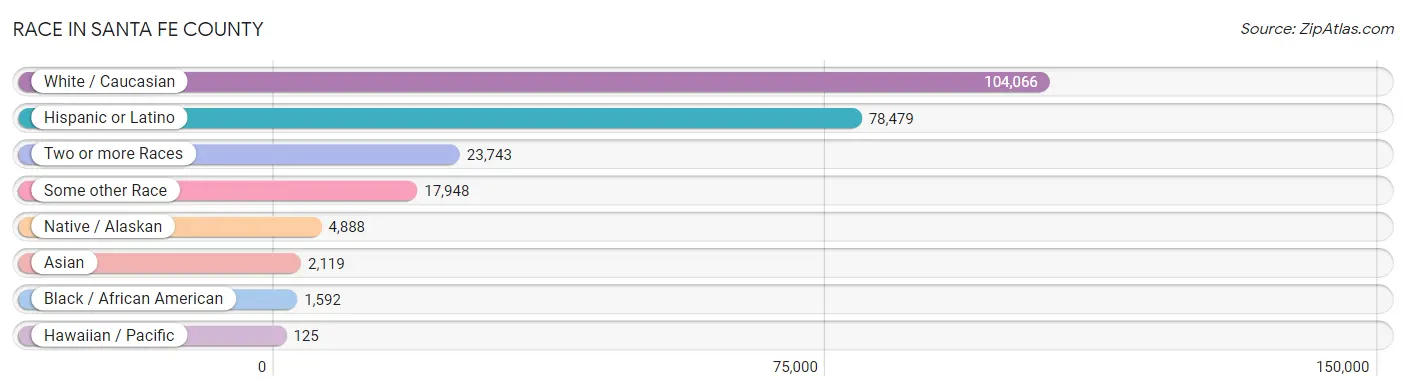
| Race | # Population | % Population |
| Asian | 2,119 | 1.4% |
| Black / African American | 1,592 | 1.0% |
| Hawaiian / Pacific | 125 | 0.1% |
| Hispanic or Latino | 78,479 | 50.8% |
| Native / Alaskan | 4,888 | 3.2% |
| White / Caucasian | 104,066 | 67.4% |
| Two or more Races | 23,743 | 15.4% |
| Some other Race | 17,948 | 11.6% |
| Total | 154,481 | 100.0% |
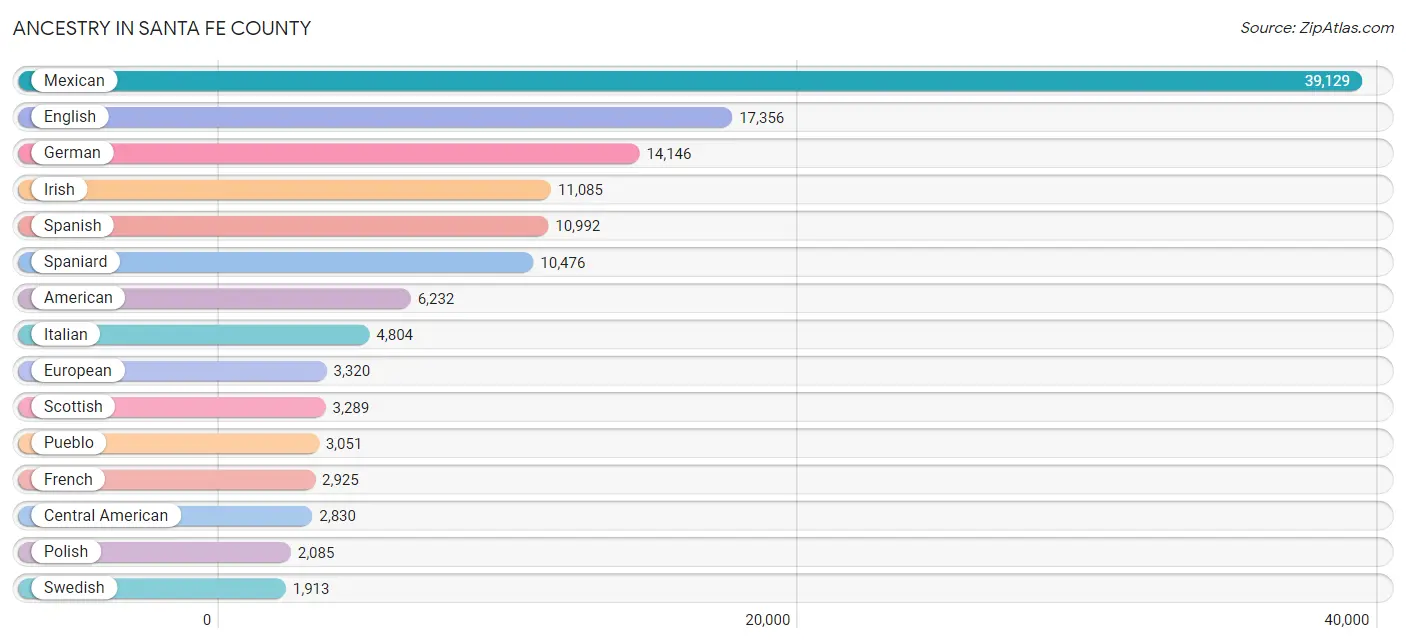
Ancestry in Santa Fe County
The most populous ancestries reported in Santa Fe County are Mexican (39,129 | 25.3%), English (17,356 | 11.2%), German (14,146 | 9.2%), Irish (11,085 | 7.2%), and Spanish (10,992 | 7.1%), together accounting for 60.0% of all Santa Fe County residents.
| Ancestry | # Population | % Population |
| Afghan | 18 | 0.0% |
| African | 102 | 0.1% |
| Alaska Native | 13 | 0.0% |
| Albanian | 58 | 0.0% |
| Aleut | 16 | 0.0% |
| Alsatian | 14 | 0.0% |
| American | 6,232 | 4.0% |
| Apache | 283 | 0.2% |
| Arab | 233 | 0.2% |
| Arapaho | 10 | 0.0% |
| Argentinean | 94 | 0.1% |
| Armenian | 23 | 0.0% |
| Australian | 86 | 0.1% |
| Austrian | 302 | 0.2% |
| Bangladeshi | 3 | 0.0% |
| Basque | 134 | 0.1% |
| Belgian | 144 | 0.1% |
| Belizean | 9 | 0.0% |
| Bhutanese | 401 | 0.3% |
| Blackfeet | 56 | 0.0% |
| Bolivian | 13 | 0.0% |
| Brazilian | 52 | 0.0% |
| British | 1,469 | 0.9% |
| Bulgarian | 17 | 0.0% |
| Burmese | 224 | 0.2% |
| Cajun | 129 | 0.1% |
| Cambodian | 8 | 0.0% |
| Canadian | 209 | 0.1% |
| Celtic | 114 | 0.1% |
| Central American | 2,830 | 1.8% |
| Central American Indian | 257 | 0.2% |
| Cherokee | 305 | 0.2% |
| Cheyenne | 10 | 0.0% |
| Chickasaw | 58 | 0.0% |
| Chilean | 163 | 0.1% |
| Chippewa | 19 | 0.0% |
| Choctaw | 50 | 0.0% |
| Colombian | 305 | 0.2% |
| Comanche | 29 | 0.0% |
| Costa Rican | 52 | 0.0% |
| Cree | 19 | 0.0% |
| Creek | 56 | 0.0% |
| Croatian | 177 | 0.1% |
| Cuban | 319 | 0.2% |
| Cypriot | 1 | 0.0% |
| Czech | 563 | 0.4% |
| Czechoslovakian | 52 | 0.0% |
| Danish | 562 | 0.4% |
| Delaware | 15 | 0.0% |
| Dominican | 115 | 0.1% |
| Dutch | 1,478 | 1.0% |
| Dutch West Indian | 22 | 0.0% |
| Eastern European | 934 | 0.6% |
| Ecuadorian | 84 | 0.1% |
| English | 17,356 | 11.2% |
| Estonian | 120 | 0.1% |
| Ethiopian | 18 | 0.0% |
| European | 3,320 | 2.1% |
| Filipino | 59 | 0.0% |
| Finnish | 421 | 0.3% |
| French | 2,925 | 1.9% |
| French American Indian | 25 | 0.0% |
| French Canadian | 487 | 0.3% |
| German | 14,146 | 9.2% |
| Greek | 502 | 0.3% |
| Guamanian / Chamorro | 52 | 0.0% |
| Guatemalan | 1,508 | 1.0% |
| Honduran | 175 | 0.1% |
| Hopi | 35 | 0.0% |
| Hungarian | 395 | 0.3% |
| Indian (Asian) | 783 | 0.5% |
| Indonesian | 1 | 0.0% |
| Inupiat | 40 | 0.0% |
| Iranian | 84 | 0.1% |
| Iraqi | 9 | 0.0% |
| Irish | 11,085 | 7.2% |
| Iroquois | 93 | 0.1% |
| Israeli | 3 | 0.0% |
| Italian | 4,804 | 3.1% |
| Jamaican | 40 | 0.0% |
| Japanese | 4 | 0.0% |
| Kenyan | 126 | 0.1% |
| Kiowa | 2 | 0.0% |
| Korean | 743 | 0.5% |
| Laotian | 27 | 0.0% |
| Latvian | 71 | 0.1% |
| Lebanese | 90 | 0.1% |
| Lithuanian | 188 | 0.1% |
| Luxembourger | 12 | 0.0% |
| Macedonian | 16 | 0.0% |
| Malaysian | 2 | 0.0% |
| Maltese | 1 | 0.0% |
| Mexican | 39,129 | 25.3% |
| Mexican American Indian | 230 | 0.2% |
| Native Hawaiian | 98 | 0.1% |
| Navajo | 874 | 0.6% |
| New Zealander | 11 | 0.0% |
| Nicaraguan | 12 | 0.0% |
| Nigerian | 16 | 0.0% |
| Northern European | 788 | 0.5% |
| Norwegian | 1,827 | 1.2% |
| Pakistani | 323 | 0.2% |
| Panamanian | 26 | 0.0% |
| Paraguayan | 36 | 0.0% |
| Pennsylvania German | 56 | 0.0% |
| Peruvian | 216 | 0.1% |
| Polish | 2,085 | 1.3% |
| Portuguese | 268 | 0.2% |
| Pueblo | 3,051 | 2.0% |
| Puerto Rican | 772 | 0.5% |
| Puget Sound Salish | 1 | 0.0% |
| Romanian | 86 | 0.1% |
| Russian | 1,413 | 0.9% |
| Salvadoran | 1,057 | 0.7% |
| Samoan | 75 | 0.1% |
| Scandinavian | 570 | 0.4% |
| Scotch-Irish | 1,728 | 1.1% |
| Scottish | 3,289 | 2.1% |
| Seminole | 137 | 0.1% |
| Serbian | 306 | 0.2% |
| Shoshone | 54 | 0.0% |
| Sioux | 139 | 0.1% |
| Slavic | 75 | 0.1% |
| Slovak | 190 | 0.1% |
| Slovene | 2 | 0.0% |
| South African | 40 | 0.0% |
| South American | 1,125 | 0.7% |
| South American Indian | 9 | 0.0% |
| Spaniard | 10,476 | 6.8% |
| Spanish | 10,992 | 7.1% |
| Spanish American | 896 | 0.6% |
| Spanish American Indian | 279 | 0.2% |
| Sri Lankan | 80 | 0.1% |
| Subsaharan African | 345 | 0.2% |
| Swedish | 1,913 | 1.2% |
| Swiss | 740 | 0.5% |
| Syrian | 41 | 0.0% |
| Thai | 471 | 0.3% |
| Tohono O'Odham | 7 | 0.0% |
| Trinidadian and Tobagonian | 7 | 0.0% |
| Turkish | 40 | 0.0% |
| Ukrainian | 322 | 0.2% |
| Uruguayan | 65 | 0.0% |
| Ute | 132 | 0.1% |
| Venezuelan | 138 | 0.1% |
| Welsh | 1,338 | 0.9% |
| Yakama | 9 | 0.0% |
| Yaqui | 47 | 0.0% |
| Yugoslavian | 14 | 0.0% | View All 149 Rows |
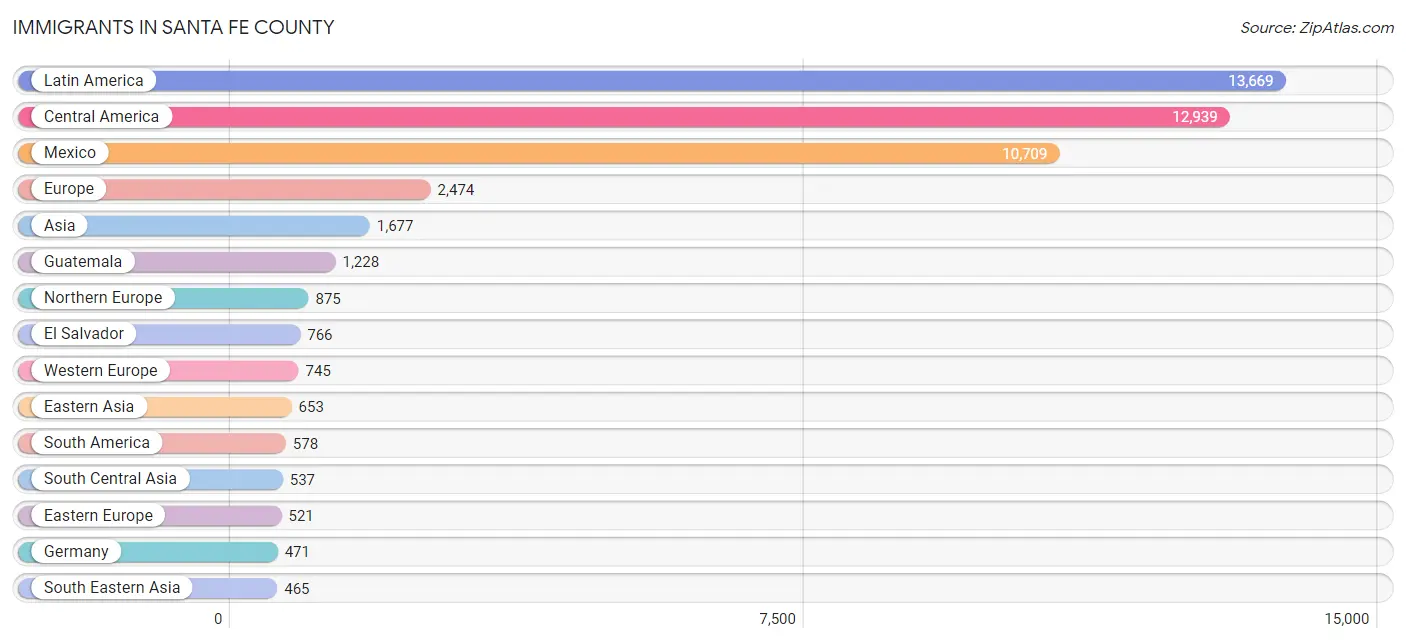
Immigrants in Santa Fe County
The most numerous immigrant groups reported in Santa Fe County came from Latin America (13,669 | 8.8%), Central America (12,939 | 8.4%), Mexico (10,709 | 6.9%), Europe (2,474 | 1.6%), and Asia (1,677 | 1.1%), together accounting for 26.9% of all Santa Fe County residents.
| Immigration Origin | # Population | % Population |
| Afghanistan | 9 | 0.0% |
| Africa | 353 | 0.2% |
| Albania | 34 | 0.0% |
| Argentina | 101 | 0.1% |
| Asia | 1,677 | 1.1% |
| Australia | 54 | 0.0% |
| Austria | 45 | 0.0% |
| Belarus | 1 | 0.0% |
| Belgium | 19 | 0.0% |
| Brazil | 36 | 0.0% |
| Canada | 423 | 0.3% |
| Caribbean | 152 | 0.1% |
| Central America | 12,939 | 8.4% |
| Chile | 172 | 0.1% |
| China | 433 | 0.3% |
| Colombia | 42 | 0.0% |
| Costa Rica | 21 | 0.0% |
| Croatia | 1 | 0.0% |
| Cuba | 112 | 0.1% |
| Czechoslovakia | 37 | 0.0% |
| Denmark | 2 | 0.0% |
| Dominican Republic | 21 | 0.0% |
| Eastern Africa | 185 | 0.1% |
| Eastern Asia | 653 | 0.4% |
| Eastern Europe | 521 | 0.3% |
| Ecuador | 26 | 0.0% |
| Egypt | 4 | 0.0% |
| El Salvador | 766 | 0.5% |
| England | 335 | 0.2% |
| Ethiopia | 15 | 0.0% |
| Europe | 2,474 | 1.6% |
| France | 147 | 0.1% |
| Germany | 471 | 0.3% |
| Ghana | 20 | 0.0% |
| Greece | 17 | 0.0% |
| Guatemala | 1,228 | 0.8% |
| Honduras | 188 | 0.1% |
| Hong Kong | 2 | 0.0% |
| Hungary | 10 | 0.0% |
| India | 334 | 0.2% |
| Indonesia | 68 | 0.0% |
| Iran | 90 | 0.1% |
| Iraq | 10 | 0.0% |
| Ireland | 59 | 0.0% |
| Italy | 216 | 0.1% |
| Jamaica | 19 | 0.0% |
| Japan | 73 | 0.1% |
| Kenya | 137 | 0.1% |
| Korea | 147 | 0.1% |
| Latin America | 13,669 | 8.8% |
| Lithuania | 8 | 0.0% |
| Mexico | 10,709 | 6.9% |
| Nepal | 20 | 0.0% |
| Netherlands | 33 | 0.0% |
| Nicaragua | 15 | 0.0% |
| Northern Africa | 6 | 0.0% |
| Northern Europe | 875 | 0.6% |
| Norway | 25 | 0.0% |
| Oceania | 81 | 0.1% |
| Pakistan | 71 | 0.1% |
| Panama | 12 | 0.0% |
| Peru | 60 | 0.0% |
| Philippines | 259 | 0.2% |
| Poland | 91 | 0.1% |
| Portugal | 3 | 0.0% |
| Romania | 18 | 0.0% |
| Russia | 52 | 0.0% |
| Scotland | 26 | 0.0% |
| Serbia | 191 | 0.1% |
| Singapore | 9 | 0.0% |
| South Africa | 95 | 0.1% |
| South America | 578 | 0.4% |
| South Central Asia | 537 | 0.4% |
| South Eastern Asia | 465 | 0.3% |
| Southern Europe | 333 | 0.2% |
| Spain | 96 | 0.1% |
| Sri Lanka | 13 | 0.0% |
| Sweden | 30 | 0.0% |
| Switzerland | 30 | 0.0% |
| Taiwan | 12 | 0.0% |
| Thailand | 82 | 0.1% |
| Turkey | 12 | 0.0% |
| Ukraine | 17 | 0.0% |
| Uruguay | 11 | 0.0% |
| Venezuela | 104 | 0.1% |
| Vietnam | 47 | 0.0% |
| Western Africa | 67 | 0.0% |
| Western Asia | 22 | 0.0% |
| Western Europe | 745 | 0.5% |
| Zimbabwe | 9 | 0.0% | View All 90 Rows |
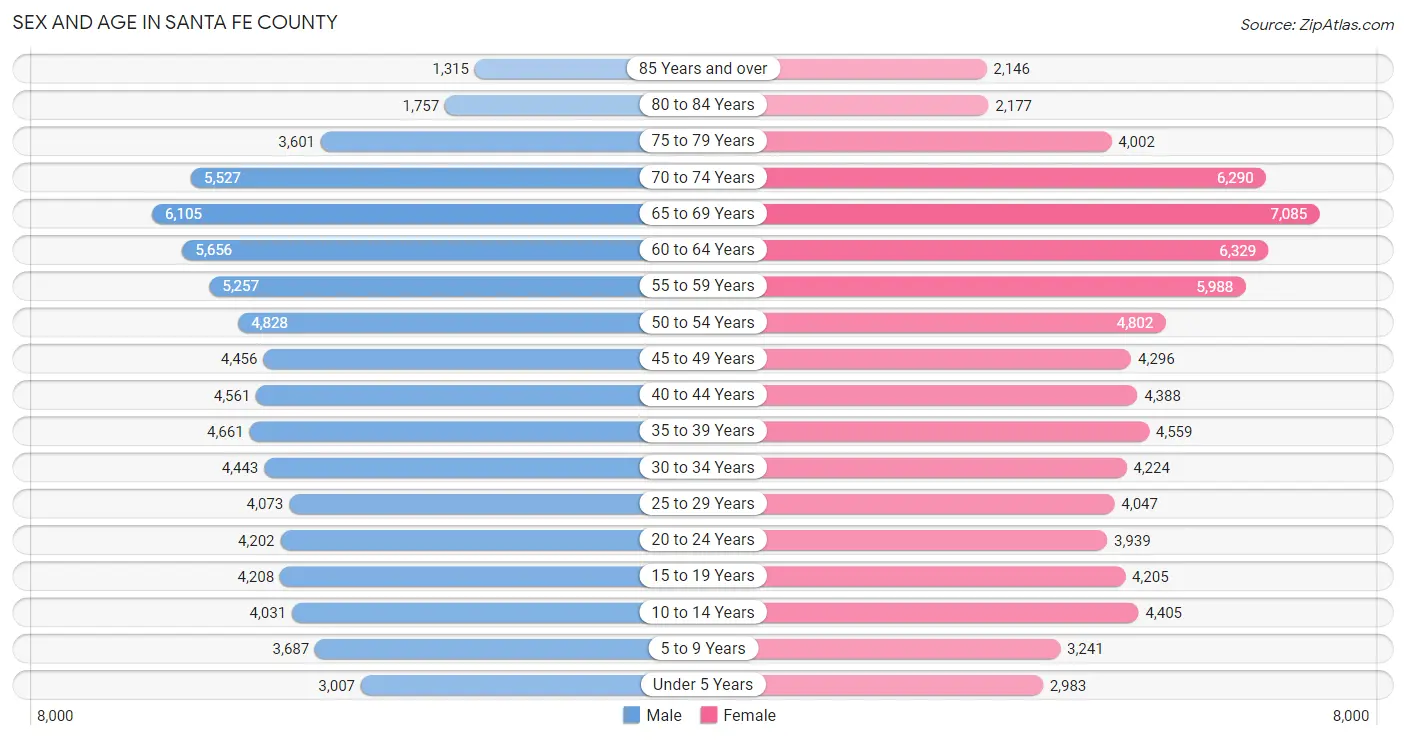
Sex and Age in Santa Fe County
Sex and Age in Santa Fe County
The most populous age groups in Santa Fe County are 65 to 69 Years (6,105 | 8.1%) for men and 65 to 69 Years (7,085 | 9.0%) for women.
| Age Bracket | Male | Female |
| Under 5 Years | 3,007 (4.0%) | 2,983 (3.8%) |
| 5 to 9 Years | 3,687 (4.9%) | 3,241 (4.1%) |
| 10 to 14 Years | 4,031 (5.3%) | 4,405 (5.6%) |
| 15 to 19 Years | 4,208 (5.6%) | 4,205 (5.3%) |
| 20 to 24 Years | 4,202 (5.6%) | 3,939 (5.0%) |
| 25 to 29 Years | 4,073 (5.4%) | 4,047 (5.1%) |
| 30 to 34 Years | 4,443 (5.9%) | 4,224 (5.3%) |
| 35 to 39 Years | 4,661 (6.2%) | 4,559 (5.8%) |
| 40 to 44 Years | 4,561 (6.0%) | 4,388 (5.6%) |
| 45 to 49 Years | 4,456 (5.9%) | 4,296 (5.4%) |
| 50 to 54 Years | 4,828 (6.4%) | 4,802 (6.1%) |
| 55 to 59 Years | 5,257 (7.0%) | 5,988 (7.6%) |
| 60 to 64 Years | 5,656 (7.5%) | 6,329 (8.0%) |
| 65 to 69 Years | 6,105 (8.1%) | 7,085 (9.0%) |
| 70 to 74 Years | 5,527 (7.3%) | 6,290 (8.0%) |
| 75 to 79 Years | 3,601 (4.8%) | 4,002 (5.1%) |
| 80 to 84 Years | 1,757 (2.3%) | 2,177 (2.8%) |
| 85 Years and over | 1,315 (1.7%) | 2,146 (2.7%) |
| Total | 75,375 (100.0%) | 79,106 (100.0%) |
Families and Households in Santa Fe County
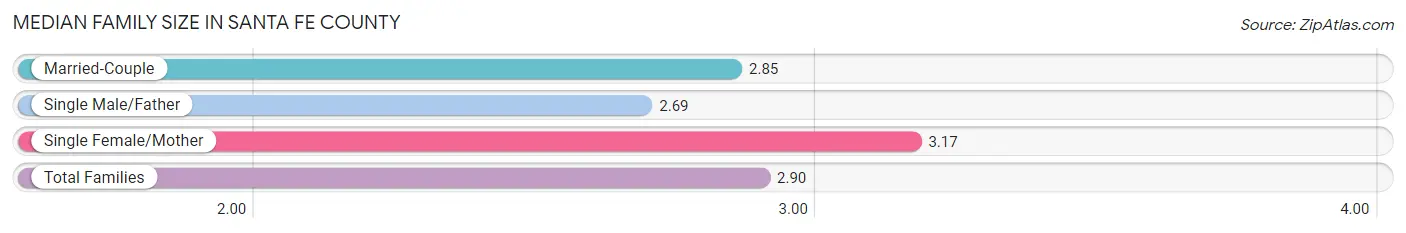
Median Family Size in Santa Fe County
The median family size in Santa Fe County is 2.90 persons per family, with single female/mother families (7,399 | 18.9%) accounting for the largest median family size of 3.17 persons per family. On the other hand, single male/father families (3,182 | 8.1%) represent the smallest median family size with 2.69 persons per family.
| Family Type | # Families | Family Size |
| Married-Couple | 28,677 (73.1%) | 2.85 |
| Single Male/Father | 3,182 (8.1%) | 2.69 |
| Single Female/Mother | 7,399 (18.9%) | 3.17 |
| Total Families | 39,258 (100.0%) | 2.90 |
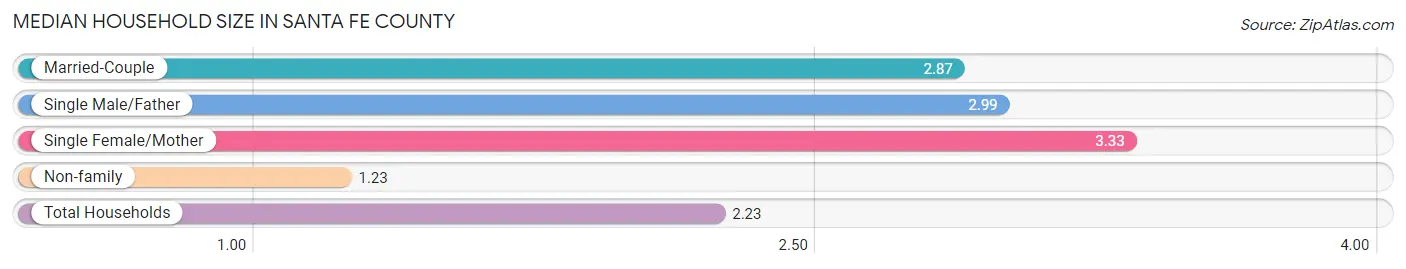
Median Household Size in Santa Fe County
The median household size in Santa Fe County is 2.23 persons per household, with single female/mother households (7,399 | 10.9%) accounting for the largest median household size of 3.33 persons per household. non-family households (28,608 | 42.1%) represent the smallest median household size with 1.23 persons per household.
| Household Type | # Households | Household Size |
| Married-Couple | 28,677 (42.3%) | 2.87 |
| Single Male/Father | 3,182 (4.7%) | 2.99 |
| Single Female/Mother | 7,399 (10.9%) | 3.33 |
| Non-family | 28,608 (42.1%) | 1.23 |
| Total Households | 67,866 (100.0%) | 2.23 |
Household Size by Marriage Status in Santa Fe County
Out of a total of 67,866 households in Santa Fe County, 39,258 (57.9%) are family households, while 28,608 (42.1%) are nonfamily households. The most numerous type of family households are 2-person households, comprising 21,396, and the most common type of nonfamily households are 1-person households, comprising 23,529.
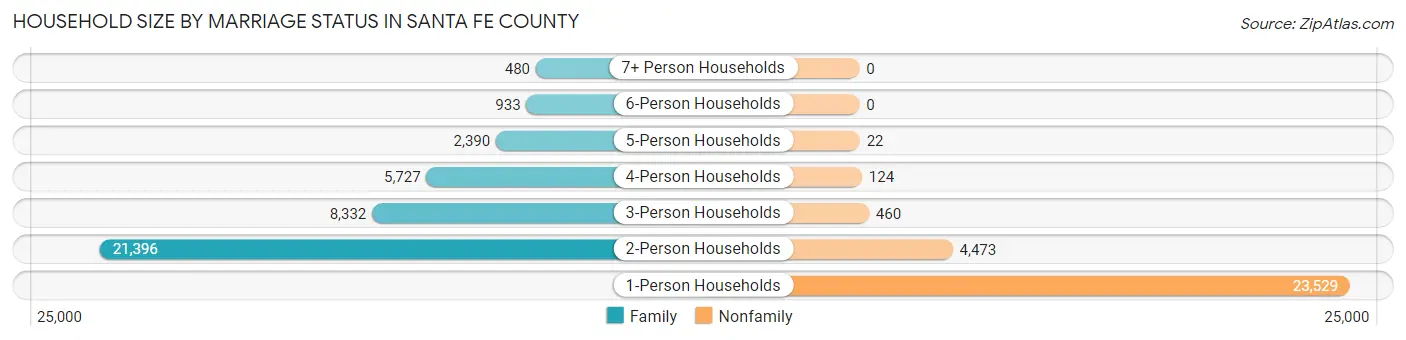
| Household Size | Family Households | Nonfamily Households |
| 1-Person Households | - | 23,529 (34.7%) |
| 2-Person Households | 21,396 (31.5%) | 4,473 (6.6%) |
| 3-Person Households | 8,332 (12.3%) | 460 (0.7%) |
| 4-Person Households | 5,727 (8.4%) | 124 (0.2%) |
| 5-Person Households | 2,390 (3.5%) | 22 (0.0%) |
| 6-Person Households | 933 (1.4%) | 0 (0.0%) |
| 7+ Person Households | 480 (0.7%) | 0 (0.0%) |
| Total | 39,258 (57.9%) | 28,608 (42.1%) |
Female Fertility in Santa Fe County
Fertility by Age in Santa Fe County
Average fertility rate in Santa Fe County is 44.0 births per 1,000 women. Women in the age bracket of 20 to 34 years have the highest fertility rate with 68.0 births per 1,000 women. Women in the age bracket of 20 to 34 years acount for 62.1% of all women with births.
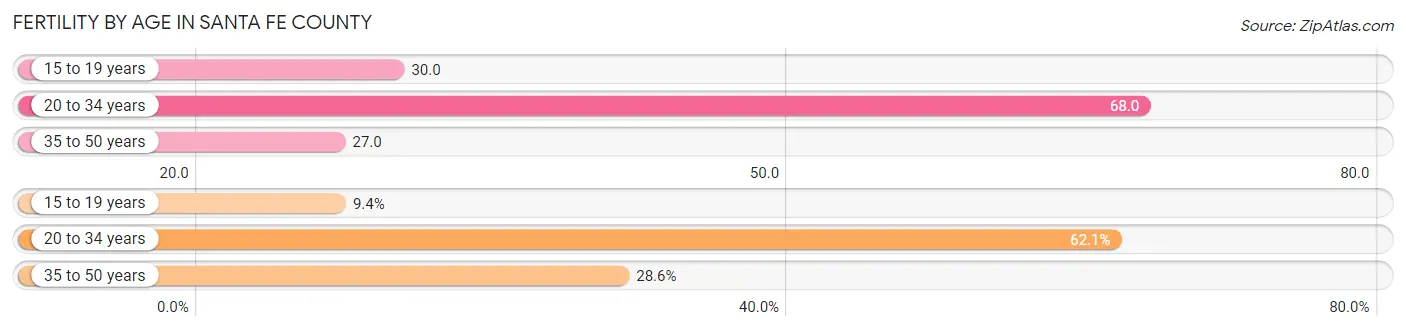
| Age Bracket | Women with Births | Births / 1,000 Women |
| 15 to 19 years | 125 (9.4%) | 30.0 |
| 20 to 34 years | 829 (62.1%) | 68.0 |
| 35 to 50 years | 382 (28.6%) | 27.0 |
| Total | 1,336 (100.0%) | 44.0 |
Fertility by Age by Marriage Status in Santa Fe County
54.6% of women with births (1,336) in Santa Fe County are married. The highest percentage of unmarried women with births falls into 15 to 19 years age bracket with 100.0% of them unmarried at the time of birth, while the lowest percentage of unmarried women with births belong to 35 to 50 years age bracket with 9.2% of them unmarried.
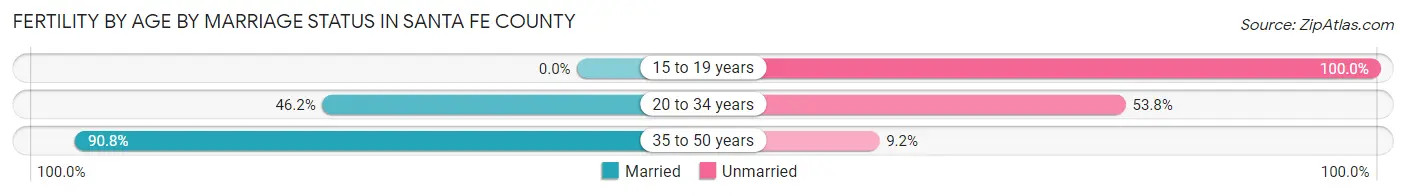
| Age Bracket | Married | Unmarried |
| 15 to 19 years | 0 (0.0%) | 125 (100.0%) |
| 20 to 34 years | 383 (46.2%) | 446 (53.8%) |
| 35 to 50 years | 347 (90.8%) | 35 (9.2%) |
| Total | 729 (54.6%) | 607 (45.4%) |
Fertility by Education in Santa Fe County
Average fertility rate in Santa Fe County is 44.0 births per 1,000 women. Women with the education attainment of high school diploma have the highest fertility rate of 67.0 births per 1,000 women, while women with the education attainment of less than high school have the lowest fertility at 28.0 births per 1,000 women. Women with the education attainment of college or associate's degree represent 35.5% of all women with births.
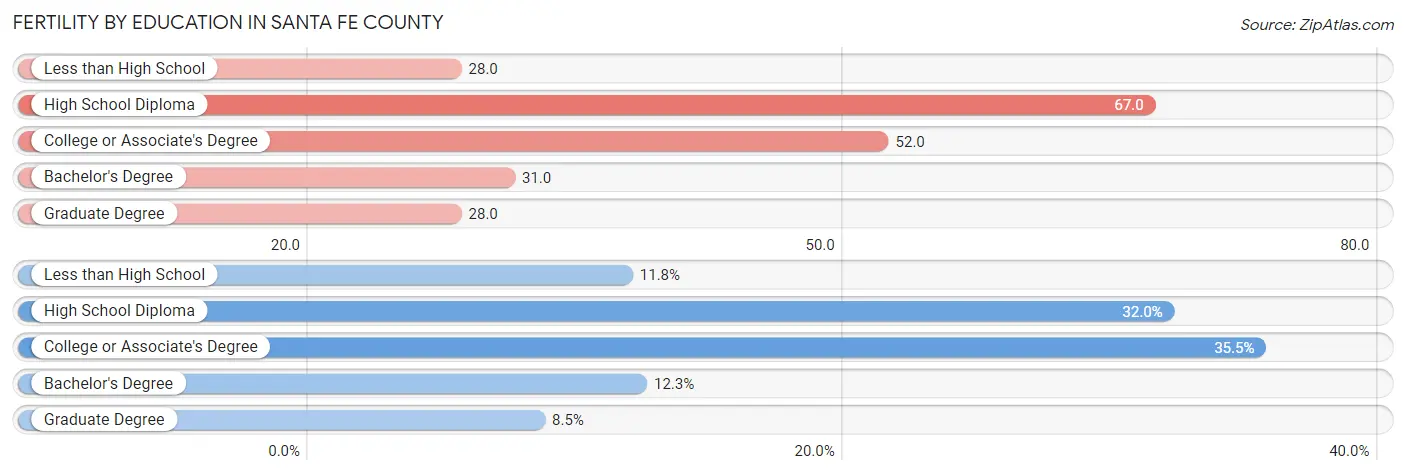
| Educational Attainment | Women with Births | Births / 1,000 Women |
| Less than High School | 157 (11.7%) | 28.0 |
| High School Diploma | 428 (32.0%) | 67.0 |
| College or Associate's Degree | 474 (35.5%) | 52.0 |
| Bachelor's Degree | 164 (12.3%) | 31.0 |
| Graduate Degree | 113 (8.5%) | 28.0 |
| Total | 1,336 (100.0%) | 44.0 |
Fertility by Education by Marriage Status in Santa Fe County
45.4% of women with births in Santa Fe County are unmarried. Women with the educational attainment of graduate degree are most likely to be married with 100.0% of them married at childbirth, while women with the educational attainment of less than high school are least likely to be married with 89.2% of them unmarried at childbirth.
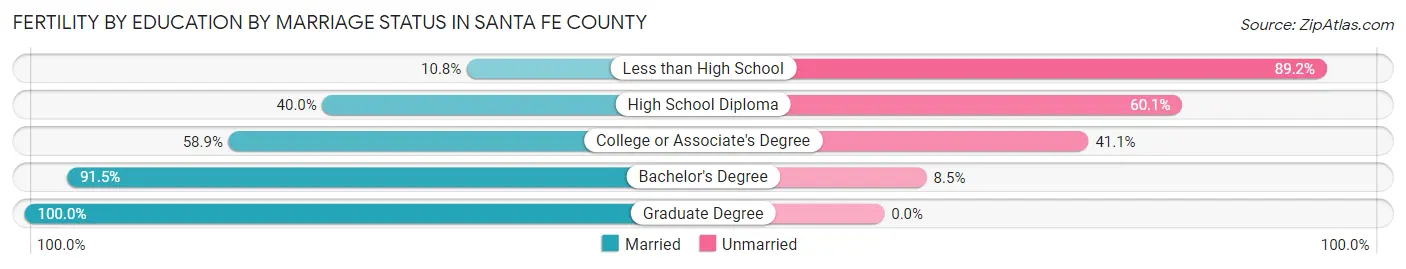
| Educational Attainment | Married | Unmarried |
| Less than High School | 17 (10.8%) | 140 (89.2%) |
| High School Diploma | 171 (40.0%) | 257 (60.1%) |
| College or Associate's Degree | 279 (58.9%) | 195 (41.1%) |
| Bachelor's Degree | 150 (91.5%) | 14 (8.5%) |
| Graduate Degree | 113 (100.0%) | 0 (0.0%) |
| Total | 729 (54.6%) | 607 (45.4%) |
Employment Characteristics in Santa Fe County
Employment by Class of Employer in Santa Fe County
Among the 70,746 employed individuals in Santa Fe County, private company employees (35,977 | 50.8%), self-employed (not incorporated) (7,448 | 10.5%), and not-for-profit organizations (7,139 | 10.1%) make up the most common classes of employment.
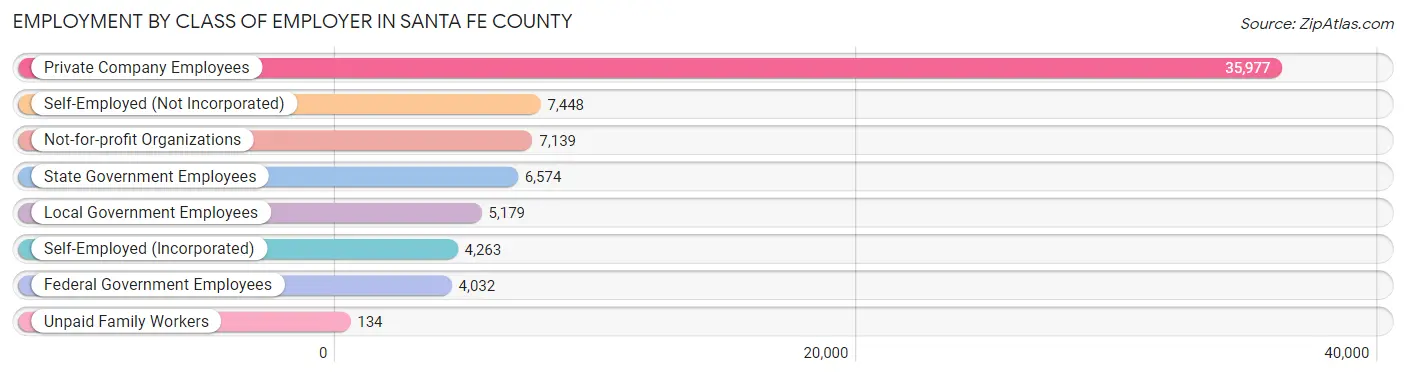
| Employer Class | # Employees | % Employees |
| Private Company Employees | 35,977 | 50.8% |
| Self-Employed (Incorporated) | 4,263 | 6.0% |
| Self-Employed (Not Incorporated) | 7,448 | 10.5% |
| Not-for-profit Organizations | 7,139 | 10.1% |
| Local Government Employees | 5,179 | 7.3% |
| State Government Employees | 6,574 | 9.3% |
| Federal Government Employees | 4,032 | 5.7% |
| Unpaid Family Workers | 134 | 0.2% |
| Total | 70,746 | 100.0% |
Employment Status by Age in Santa Fe County
According to the labor force statistics for Santa Fe County, out of the total population over 16 years of age (131,419), 57.7% or 75,829 individuals are in the labor force, with 5.4% or 4,095 of them unemployed. The age group with the highest labor force participation rate is 35 to 44 years, with 83.6% or 15,189 individuals in the labor force. Within the labor force, the 16 to 19 years age range has the highest percentage of unemployed individuals, with 17.3% or 429 of them being unemployed.
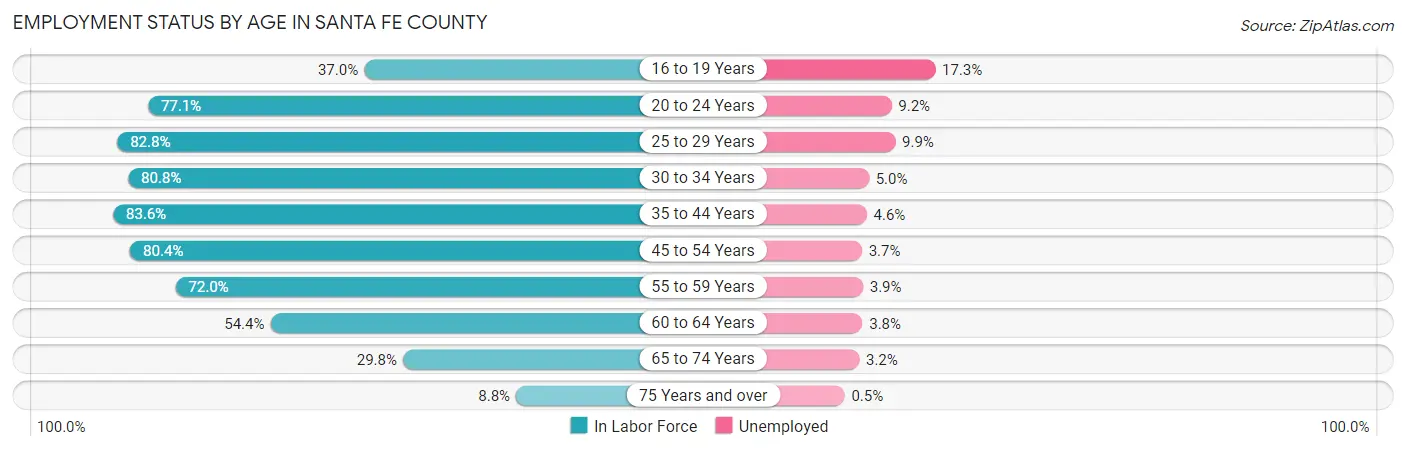
| Age Bracket | In Labor Force | Unemployed |
| 16 to 19 Years | 2,481 (37.0%) | 429 (17.3%) |
| 20 to 24 Years | 6,277 (77.1%) | 577 (9.2%) |
| 25 to 29 Years | 6,723 (82.8%) | 666 (9.9%) |
| 30 to 34 Years | 7,003 (80.8%) | 350 (5.0%) |
| 35 to 44 Years | 15,189 (83.6%) | 699 (4.6%) |
| 45 to 54 Years | 14,779 (80.4%) | 547 (3.7%) |
| 55 to 59 Years | 8,096 (72.0%) | 316 (3.9%) |
| 60 to 64 Years | 6,520 (54.4%) | 248 (3.8%) |
| 65 to 74 Years | 7,452 (29.8%) | 238 (3.2%) |
| 75 Years and over | 1,320 (8.8%) | 7 (0.5%) |
| Total | 75,829 (57.7%) | 4,095 (5.4%) |
Employment Status by Educational Attainment in Santa Fe County
According to labor force statistics for Santa Fe County, 76.1% of individuals (58,268) out of the total population between 25 and 64 years of age (76,568) are in the labor force, with 4.9% or 2,855 of them being unemployed. The group with the highest labor force participation rate are those with the educational attainment of bachelor's degree or higher, with 82.0% or 23,438 individuals in the labor force. Within the labor force, individuals with high school diploma education have the highest percentage of unemployment, with 6.8% or 806 of them being unemployed.
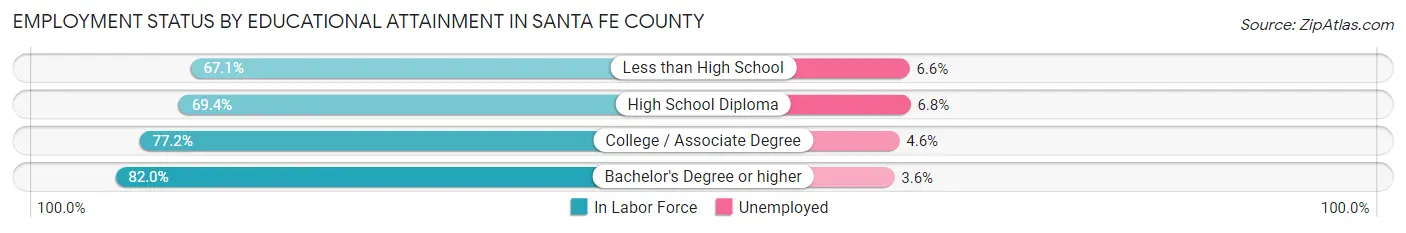
| Educational Attainment | In Labor Force | Unemployed |
| Less than High School | 5,690 (67.1%) | 560 (6.6%) |
| High School Diploma | 11,852 (69.4%) | 1,161 (6.8%) |
| College / Associate Degree | 17,314 (77.2%) | 1,032 (4.6%) |
| Bachelor's Degree or higher | 23,438 (82.0%) | 1,029 (3.6%) |
| Total | 58,268 (76.1%) | 3,752 (4.9%) |
Employment Occupations by Sex in Santa Fe County
Management, Business, Science and Arts Occupations
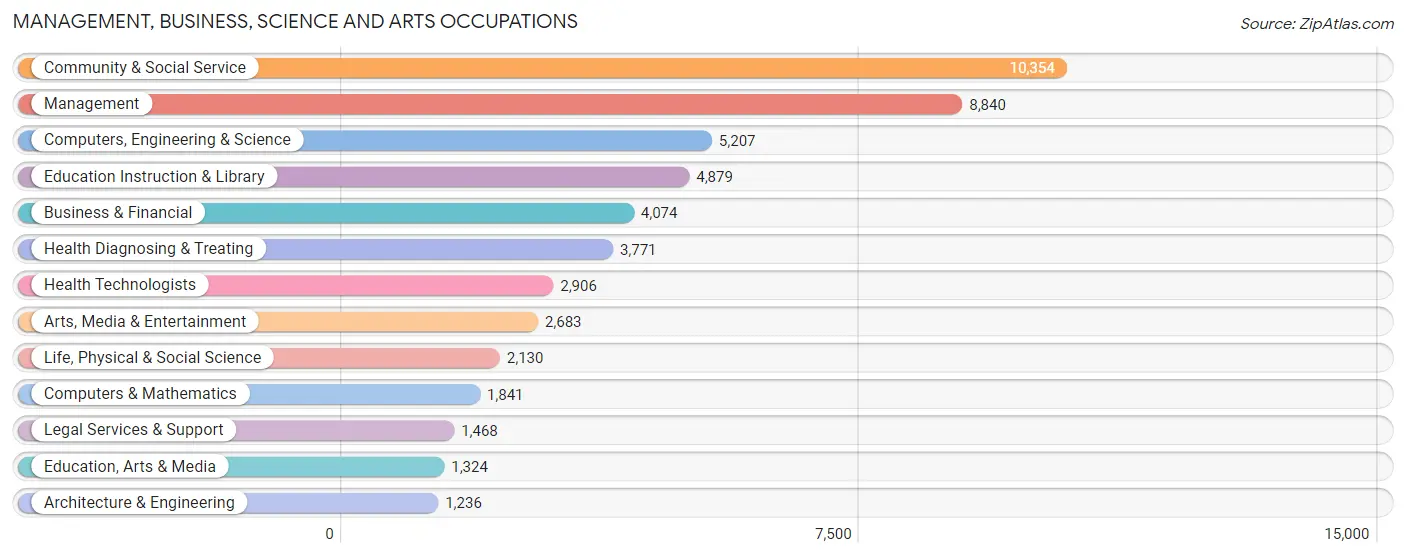
The most common Management, Business, Science and Arts occupations in Santa Fe County are Community & Social Service (10,354 | 14.5%), Management (8,840 | 12.4%), Computers, Engineering & Science (5,207 | 7.3%), Education Instruction & Library (4,879 | 6.8%), and Business & Financial (4,074 | 5.7%).
Management, Business, Science and Arts Occupations by Sex
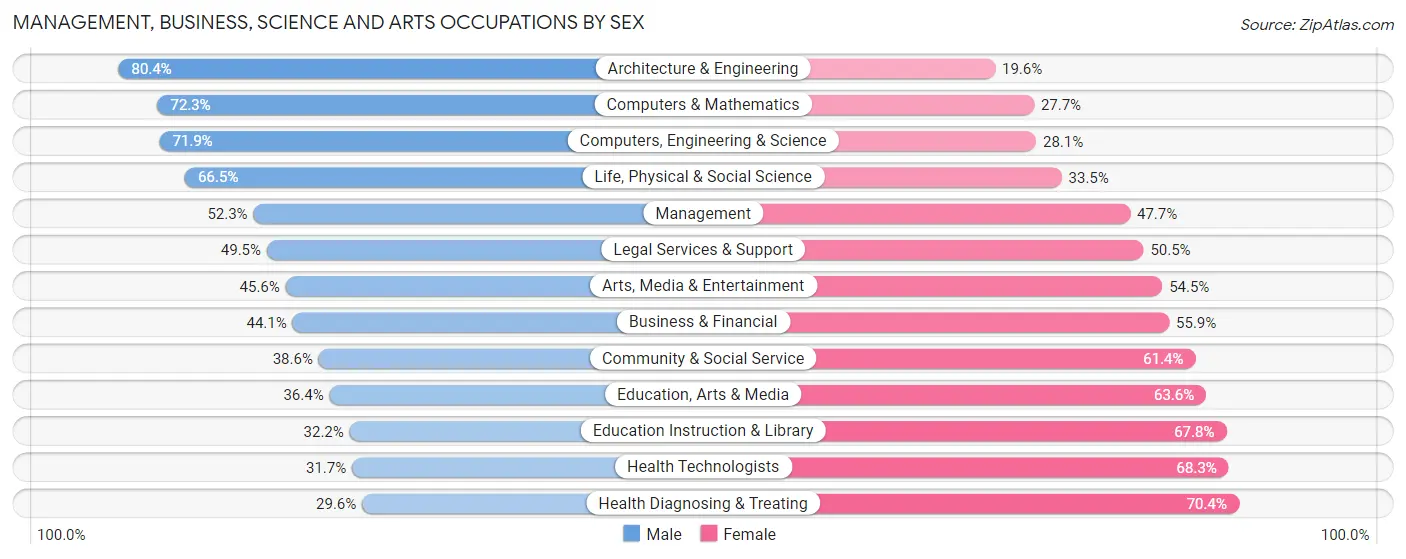
Within the Management, Business, Science and Arts occupations in Santa Fe County, the most male-oriented occupations are Architecture & Engineering (80.4%), Computers & Mathematics (72.3%), and Computers, Engineering & Science (71.9%), while the most female-oriented occupations are Health Diagnosing & Treating (70.4%), Health Technologists (68.3%), and Education Instruction & Library (67.8%).
| Occupation | Male | Female |
| Management | 4,620 (52.3%) | 4,220 (47.7%) |
| Business & Financial | 1,797 (44.1%) | 2,277 (55.9%) |
| Computers, Engineering & Science | 3,742 (71.9%) | 1,465 (28.1%) |
| Computers & Mathematics | 1,331 (72.3%) | 510 (27.7%) |
| Architecture & Engineering | 994 (80.4%) | 242 (19.6%) |
| Life, Physical & Social Science | 1,417 (66.5%) | 713 (33.5%) |
| Community & Social Service | 4,001 (38.6%) | 6,353 (61.4%) |
| Education, Arts & Media | 482 (36.4%) | 842 (63.6%) |
| Legal Services & Support | 726 (49.5%) | 742 (50.5%) |
| Education Instruction & Library | 1,571 (32.2%) | 3,308 (67.8%) |
| Arts, Media & Entertainment | 1,222 (45.6%) | 1,461 (54.4%) |
| Health Diagnosing & Treating | 1,116 (29.6%) | 2,655 (70.4%) |
| Health Technologists | 921 (31.7%) | 1,985 (68.3%) |
| Total (Category) | 15,276 (47.4%) | 16,970 (52.6%) |
| Total (Overall) | 36,796 (51.5%) | 34,681 (48.5%) |
Services Occupations
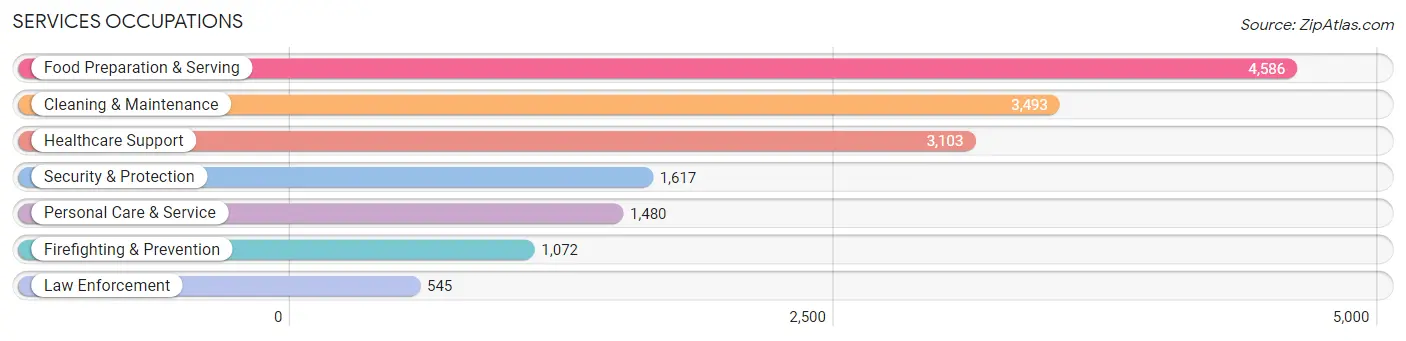
The most common Services occupations in Santa Fe County are Food Preparation & Serving (4,586 | 6.4%), Cleaning & Maintenance (3,493 | 4.9%), Healthcare Support (3,103 | 4.3%), Security & Protection (1,617 | 2.3%), and Personal Care & Service (1,480 | 2.1%).
Services Occupations by Sex
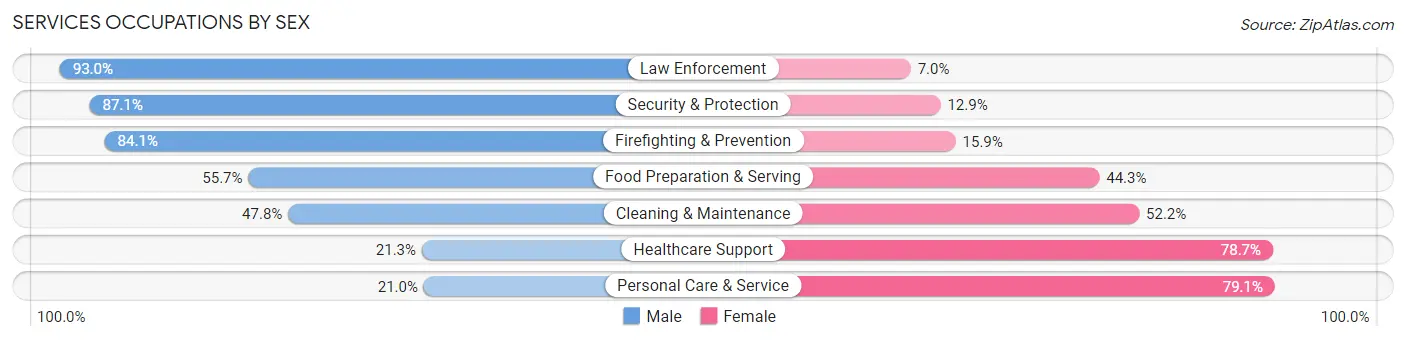
Within the Services occupations in Santa Fe County, the most male-oriented occupations are Law Enforcement (93.0%), Security & Protection (87.1%), and Firefighting & Prevention (84.1%), while the most female-oriented occupations are Personal Care & Service (79.0%), Healthcare Support (78.7%), and Cleaning & Maintenance (52.2%).
| Occupation | Male | Female |
| Healthcare Support | 662 (21.3%) | 2,441 (78.7%) |
| Security & Protection | 1,409 (87.1%) | 208 (12.9%) |
| Firefighting & Prevention | 902 (84.1%) | 170 (15.9%) |
| Law Enforcement | 507 (93.0%) | 38 (7.0%) |
| Food Preparation & Serving | 2,554 (55.7%) | 2,032 (44.3%) |
| Cleaning & Maintenance | 1,670 (47.8%) | 1,823 (52.2%) |
| Personal Care & Service | 310 (20.9%) | 1,170 (79.0%) |
| Total (Category) | 6,605 (46.3%) | 7,674 (53.7%) |
| Total (Overall) | 36,796 (51.5%) | 34,681 (48.5%) |
Sales and Office Occupations
The most common Sales and Office occupations in Santa Fe County are Office & Administration (7,027 | 9.8%), and Sales & Related (6,329 | 8.8%).

Sales and Office Occupations by Sex
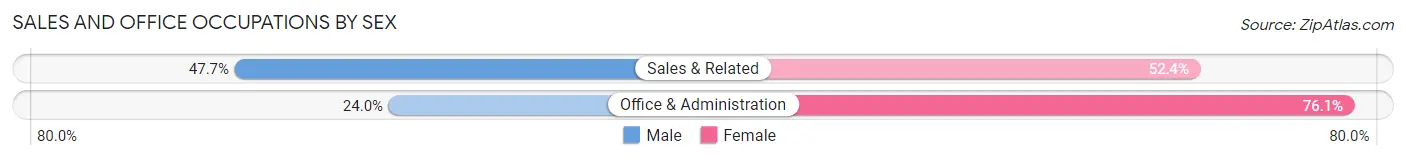
| Occupation | Male | Female |
| Sales & Related | 3,016 (47.6%) | 3,313 (52.3%) |
| Office & Administration | 1,683 (23.9%) | 5,344 (76.0%) |
| Total (Category) | 4,699 (35.2%) | 8,657 (64.8%) |
| Total (Overall) | 36,796 (51.5%) | 34,681 (48.5%) |
Natural Resources, Construction and Maintenance Occupations
The most common Natural Resources, Construction and Maintenance occupations in Santa Fe County are Construction & Extraction (4,042 | 5.7%), Installation, Maintenance & Repair (2,523 | 3.5%), and Farming, Fishing & Forestry (227 | 0.3%).

Natural Resources, Construction and Maintenance Occupations by Sex
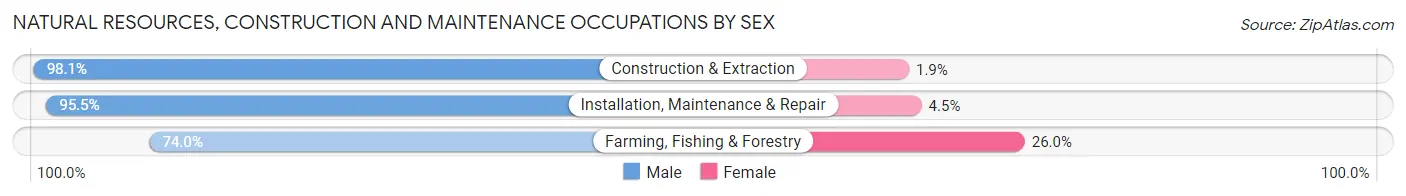
| Occupation | Male | Female |
| Farming, Fishing & Forestry | 168 (74.0%) | 59 (26.0%) |
| Construction & Extraction | 3,965 (98.1%) | 77 (1.9%) |
| Installation, Maintenance & Repair | 2,409 (95.5%) | 114 (4.5%) |
| Total (Category) | 6,542 (96.3%) | 250 (3.7%) |
| Total (Overall) | 36,796 (51.5%) | 34,681 (48.5%) |
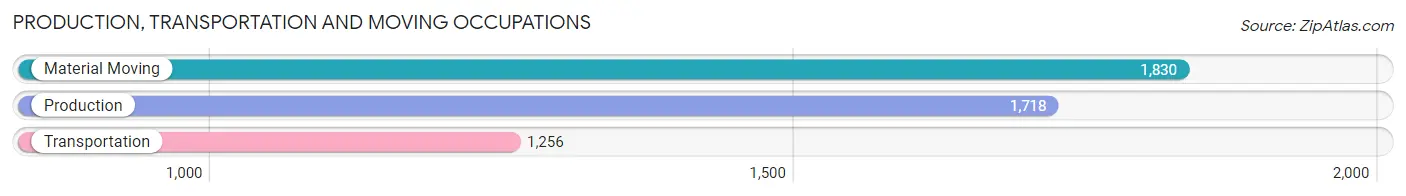
Production, Transportation and Moving Occupations
The most common Production, Transportation and Moving occupations in Santa Fe County are Material Moving (1,830 | 2.6%), Production (1,718 | 2.4%), and Transportation (1,256 | 1.8%).
Production, Transportation and Moving Occupations by Sex
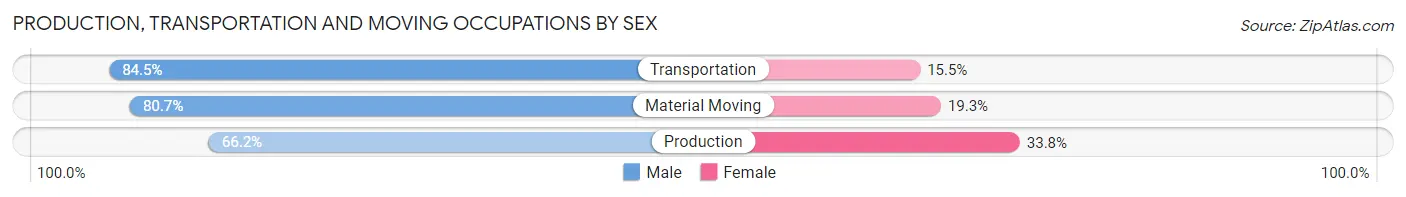
| Occupation | Male | Female |
| Production | 1,137 (66.2%) | 581 (33.8%) |
| Transportation | 1,061 (84.5%) | 195 (15.5%) |
| Material Moving | 1,476 (80.7%) | 354 (19.3%) |
| Total (Category) | 3,674 (76.5%) | 1,130 (23.5%) |
| Total (Overall) | 36,796 (51.5%) | 34,681 (48.5%) |
Employment Industries by Sex in Santa Fe County
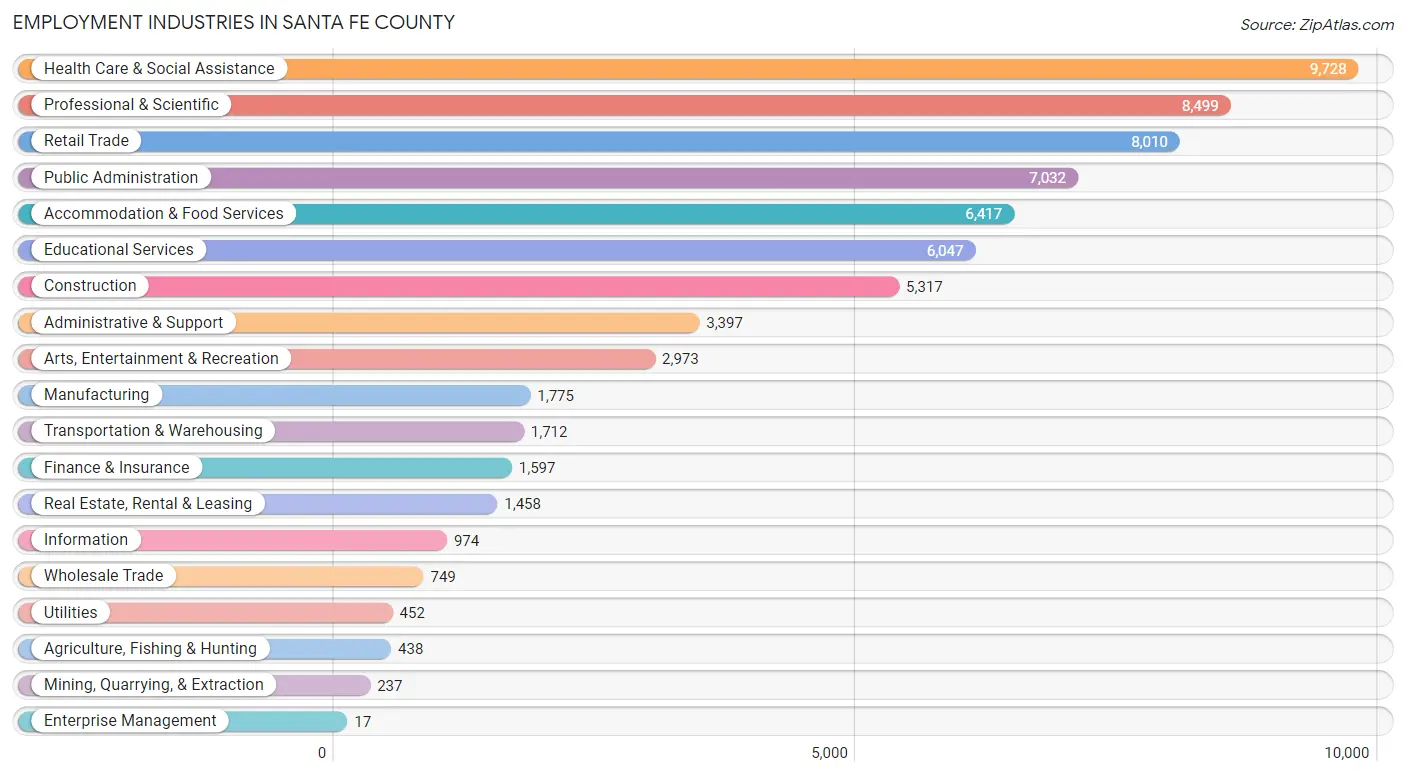
Employment Industries in Santa Fe County
The major employment industries in Santa Fe County include Health Care & Social Assistance (9,728 | 13.6%), Professional & Scientific (8,499 | 11.9%), Retail Trade (8,010 | 11.2%), Public Administration (7,032 | 9.8%), and Accommodation & Food Services (6,417 | 9.0%).
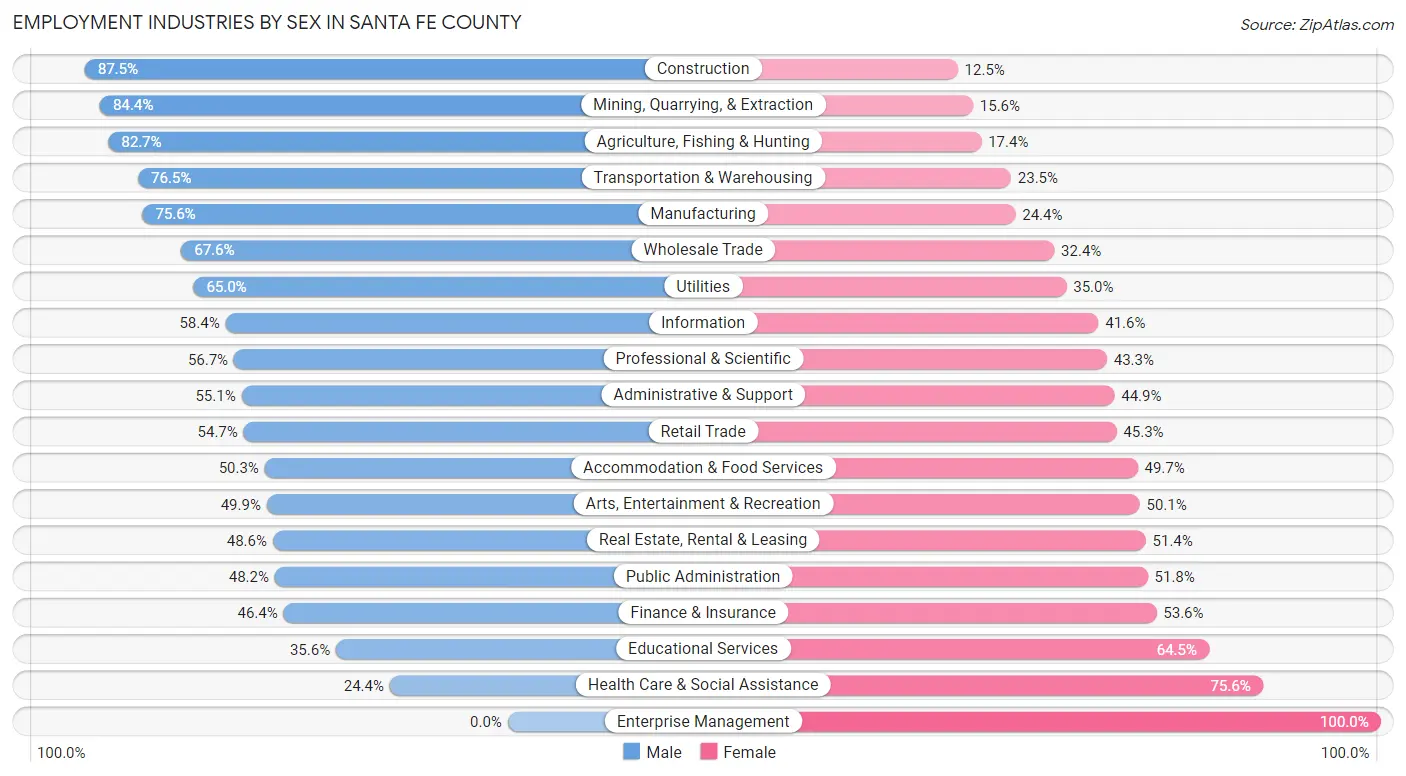
Employment Industries by Sex in Santa Fe County
The Santa Fe County industries that see more men than women are Construction (87.5%), Mining, Quarrying, & Extraction (84.4%), and Agriculture, Fishing & Hunting (82.7%), whereas the industries that tend to have a higher number of women are Enterprise Management (100.0%), Health Care & Social Assistance (75.6%), and Educational Services (64.4%).
| Industry | Male | Female |
| Agriculture, Fishing & Hunting | 362 (82.7%) | 76 (17.3%) |
| Mining, Quarrying, & Extraction | 200 (84.4%) | 37 (15.6%) |
| Construction | 4,654 (87.5%) | 663 (12.5%) |
| Manufacturing | 1,342 (75.6%) | 433 (24.4%) |
| Wholesale Trade | 506 (67.6%) | 243 (32.4%) |
| Retail Trade | 4,379 (54.7%) | 3,631 (45.3%) |
| Transportation & Warehousing | 1,310 (76.5%) | 402 (23.5%) |
| Utilities | 294 (65.0%) | 158 (35.0%) |
| Information | 569 (58.4%) | 405 (41.6%) |
| Finance & Insurance | 741 (46.4%) | 856 (53.6%) |
| Real Estate, Rental & Leasing | 709 (48.6%) | 749 (51.4%) |
| Professional & Scientific | 4,816 (56.7%) | 3,683 (43.3%) |
| Enterprise Management | 0 (0.0%) | 17 (100.0%) |
| Administrative & Support | 1,872 (55.1%) | 1,525 (44.9%) |
| Educational Services | 2,150 (35.5%) | 3,897 (64.4%) |
| Health Care & Social Assistance | 2,375 (24.4%) | 7,353 (75.6%) |
| Arts, Entertainment & Recreation | 1,483 (49.9%) | 1,490 (50.1%) |
| Accommodation & Food Services | 3,228 (50.3%) | 3,189 (49.7%) |
| Public Administration | 3,390 (48.2%) | 3,642 (51.8%) |
| Total | 36,796 (51.5%) | 34,681 (48.5%) |
Education in Santa Fe County
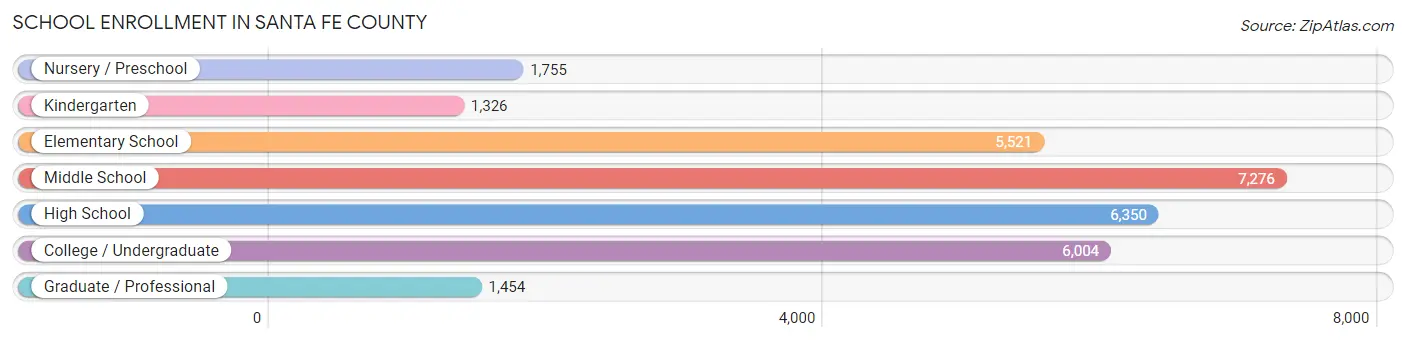
School Enrollment in Santa Fe County
The most common levels of schooling among the 29,686 students in Santa Fe County are middle school (7,276 | 24.5%), high school (6,350 | 21.4%), and college / undergraduate (6,004 | 20.2%).
| School Level | # Students | % Students |
| Nursery / Preschool | 1,755 | 5.9% |
| Kindergarten | 1,326 | 4.5% |
| Elementary School | 5,521 | 18.6% |
| Middle School | 7,276 | 24.5% |
| High School | 6,350 | 21.4% |
| College / Undergraduate | 6,004 | 20.2% |
| Graduate / Professional | 1,454 | 4.9% |
| Total | 29,686 | 100.0% |
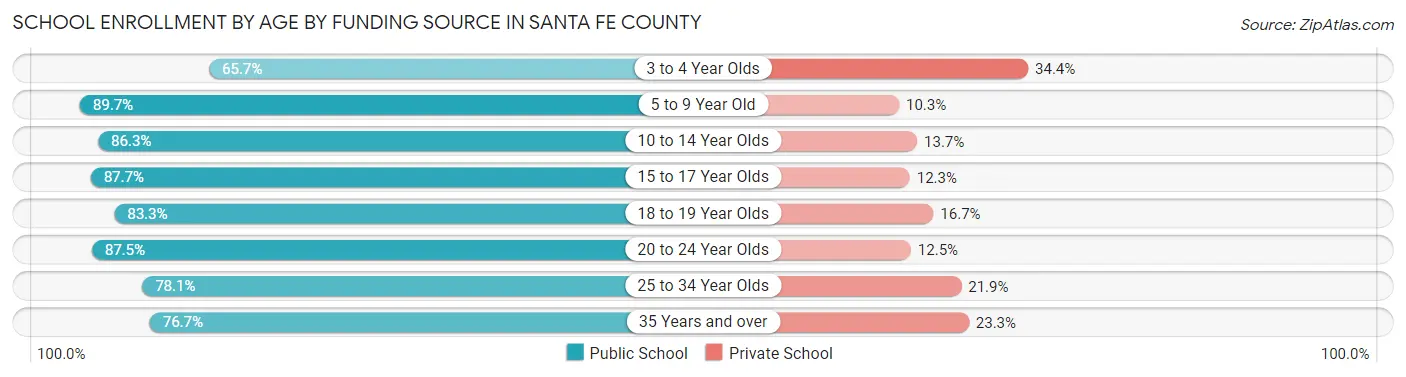
School Enrollment by Age by Funding Source in Santa Fe County
Out of a total of 29,686 students who are enrolled in schools in Santa Fe County, 4,453 (15.0%) attend a private institution, while the remaining 25,233 (85.0%) are enrolled in public schools. The age group of 3 to 4 year olds has the highest likelihood of being enrolled in private schools, with 462 (34.4% in the age bracket) enrolled. Conversely, the age group of 5 to 9 year old has the lowest likelihood of being enrolled in a private school, with 5,940 (89.7% in the age bracket) attending a public institution.
| Age Bracket | Public School | Private School |
| 3 to 4 Year Olds | 883 (65.6%) | 462 (34.4%) |
| 5 to 9 Year Old | 5,940 (89.7%) | 683 (10.3%) |
| 10 to 14 Year Olds | 7,102 (86.3%) | 1,126 (13.7%) |
| 15 to 17 Year Olds | 4,236 (87.7%) | 595 (12.3%) |
| 18 to 19 Year Olds | 1,932 (83.3%) | 388 (16.7%) |
| 20 to 24 Year Olds | 1,943 (87.5%) | 278 (12.5%) |
| 25 to 34 Year Olds | 1,454 (78.1%) | 408 (21.9%) |
| 35 Years and over | 1,730 (76.7%) | 526 (23.3%) |
| Total | 25,233 (85.0%) | 4,453 (15.0%) |
Educational Attainment by Field of Study in Santa Fe County
Business (6,572 | 12.0%), visual & performing arts (5,639 | 10.3%), social sciences (5,553 | 10.1%), education (5,068 | 9.2%), and literature & languages (4,772 | 8.7%) are the most common fields of study among 54,788 individuals in Santa Fe County who have obtained a bachelor's degree or higher.
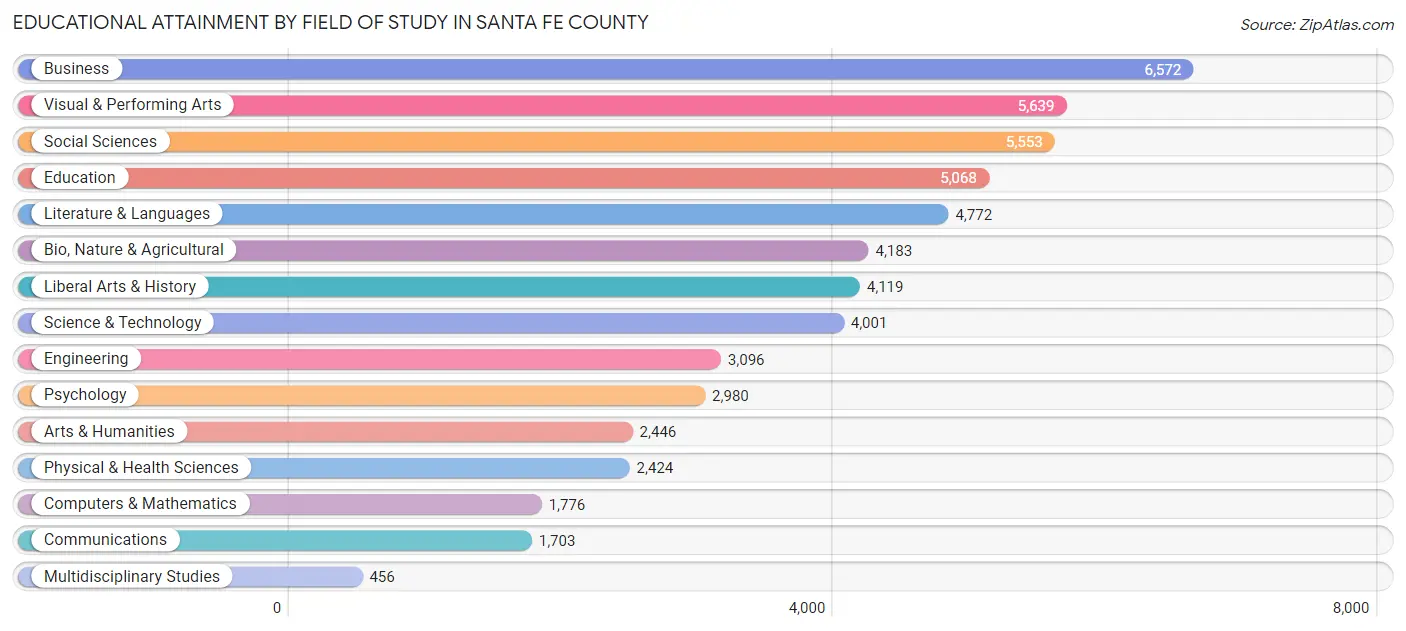
| Field of Study | # Graduates | % Graduates |
| Computers & Mathematics | 1,776 | 3.2% |
| Bio, Nature & Agricultural | 4,183 | 7.6% |
| Physical & Health Sciences | 2,424 | 4.4% |
| Psychology | 2,980 | 5.4% |
| Social Sciences | 5,553 | 10.1% |
| Engineering | 3,096 | 5.7% |
| Multidisciplinary Studies | 456 | 0.8% |
| Science & Technology | 4,001 | 7.3% |
| Business | 6,572 | 12.0% |
| Education | 5,068 | 9.2% |
| Literature & Languages | 4,772 | 8.7% |
| Liberal Arts & History | 4,119 | 7.5% |
| Visual & Performing Arts | 5,639 | 10.3% |
| Communications | 1,703 | 3.1% |
| Arts & Humanities | 2,446 | 4.5% |
| Total | 54,788 | 100.0% |
Transportation & Commute in Santa Fe County
Vehicle Availability by Sex in Santa Fe County
The most prevalent vehicle ownership categories in Santa Fe County are males with 2 vehicles (15,120, accounting for 41.5%) and females with 2 vehicles (13,351, making up 44.6%).
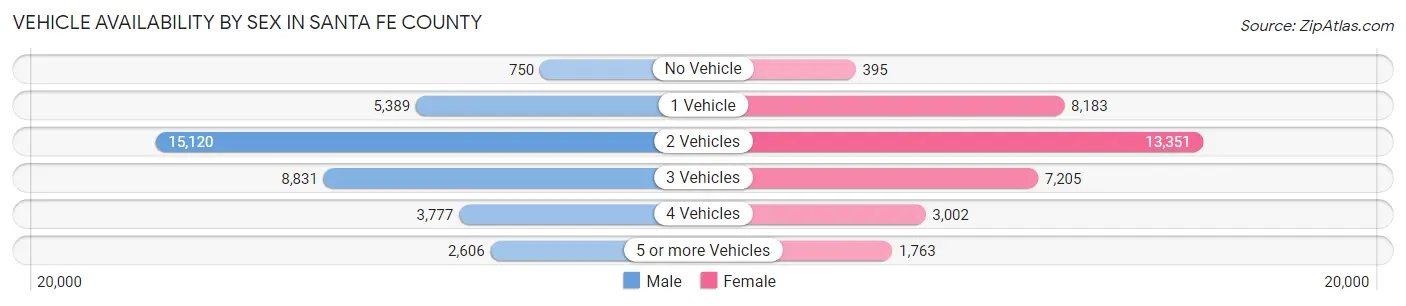
| Vehicles Available | Male | Female |
| No Vehicle | 750 (2.1%) | 395 (1.2%) |
| 1 Vehicle | 5,389 (14.8%) | 8,183 (24.1%) |
| 2 Vehicles | 15,120 (41.5%) | 13,351 (39.4%) |
| 3 Vehicles | 8,831 (24.2%) | 7,205 (21.2%) |
| 4 Vehicles | 3,777 (10.4%) | 3,002 (8.9%) |
| 5 or more Vehicles | 2,606 (7.1%) | 1,763 (5.2%) |
| Total | 36,473 (100.0%) | 33,899 (100.0%) |
Commute Time in Santa Fe County
The most frequently occuring commute durations in Santa Fe County are 15 to 19 minutes (11,745 commuters, 19.5%), 20 to 24 minutes (10,268 commuters, 17.1%), and 10 to 14 minutes (9,121 commuters, 15.2%).
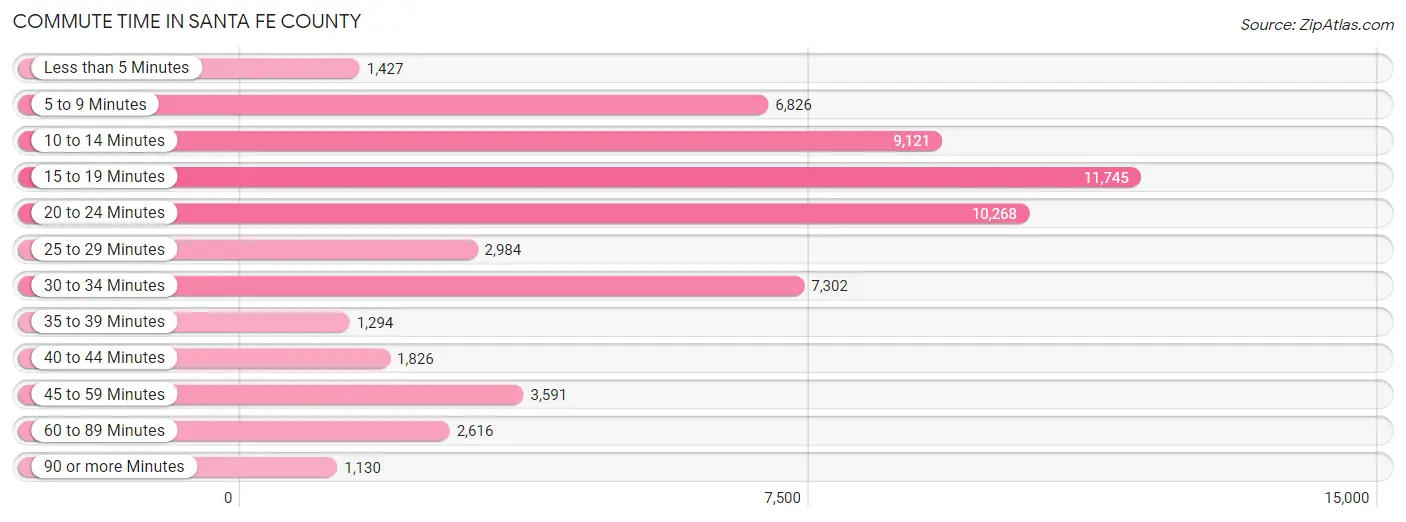
| Commute Time | # Commuters | % Commuters |
| Less than 5 Minutes | 1,427 | 2.4% |
| 5 to 9 Minutes | 6,826 | 11.4% |
| 10 to 14 Minutes | 9,121 | 15.2% |
| 15 to 19 Minutes | 11,745 | 19.5% |
| 20 to 24 Minutes | 10,268 | 17.1% |
| 25 to 29 Minutes | 2,984 | 5.0% |
| 30 to 34 Minutes | 7,302 | 12.1% |
| 35 to 39 Minutes | 1,294 | 2.1% |
| 40 to 44 Minutes | 1,826 | 3.0% |
| 45 to 59 Minutes | 3,591 | 6.0% |
| 60 to 89 Minutes | 2,616 | 4.3% |
| 90 or more Minutes | 1,130 | 1.9% |
Commute Time by Sex in Santa Fe County
The most common commute times in Santa Fe County are 15 to 19 minutes (6,022 commuters, 18.9%) for males and 15 to 19 minutes (5,723 commuters, 20.3%) for females.
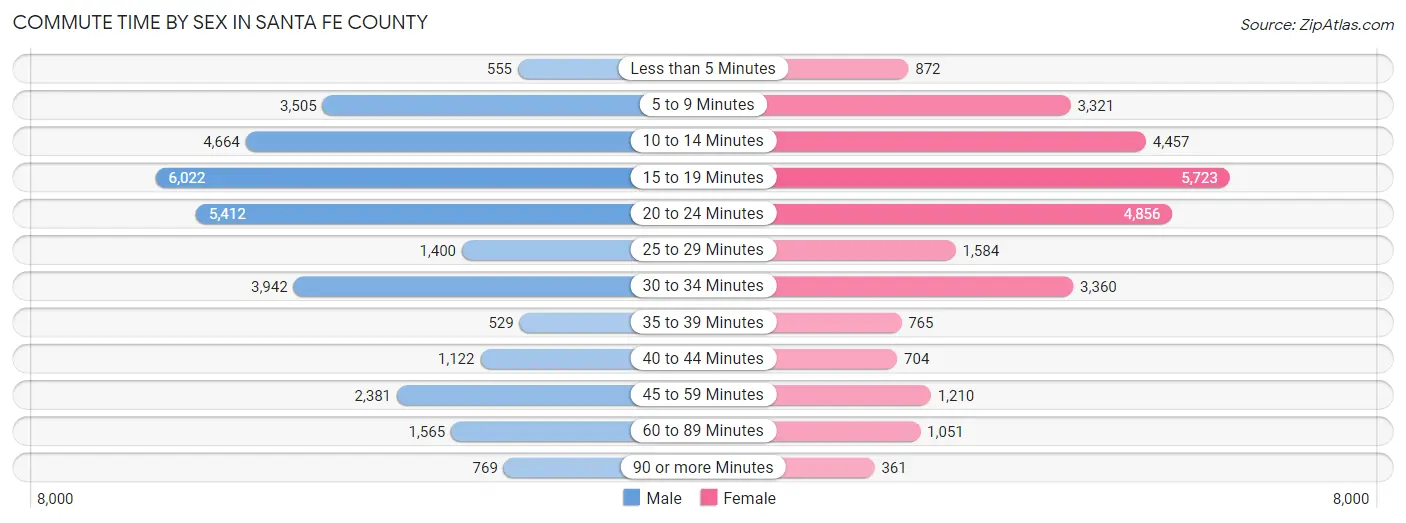
| Commute Time | Male | Female |
| Less than 5 Minutes | 555 (1.7%) | 872 (3.1%) |
| 5 to 9 Minutes | 3,505 (11.0%) | 3,321 (11.7%) |
| 10 to 14 Minutes | 4,664 (14.6%) | 4,457 (15.8%) |
| 15 to 19 Minutes | 6,022 (18.9%) | 5,723 (20.3%) |
| 20 to 24 Minutes | 5,412 (17.0%) | 4,856 (17.2%) |
| 25 to 29 Minutes | 1,400 (4.4%) | 1,584 (5.6%) |
| 30 to 34 Minutes | 3,942 (12.4%) | 3,360 (11.9%) |
| 35 to 39 Minutes | 529 (1.7%) | 765 (2.7%) |
| 40 to 44 Minutes | 1,122 (3.5%) | 704 (2.5%) |
| 45 to 59 Minutes | 2,381 (7.5%) | 1,210 (4.3%) |
| 60 to 89 Minutes | 1,565 (4.9%) | 1,051 (3.7%) |
| 90 or more Minutes | 769 (2.4%) | 361 (1.3%) |
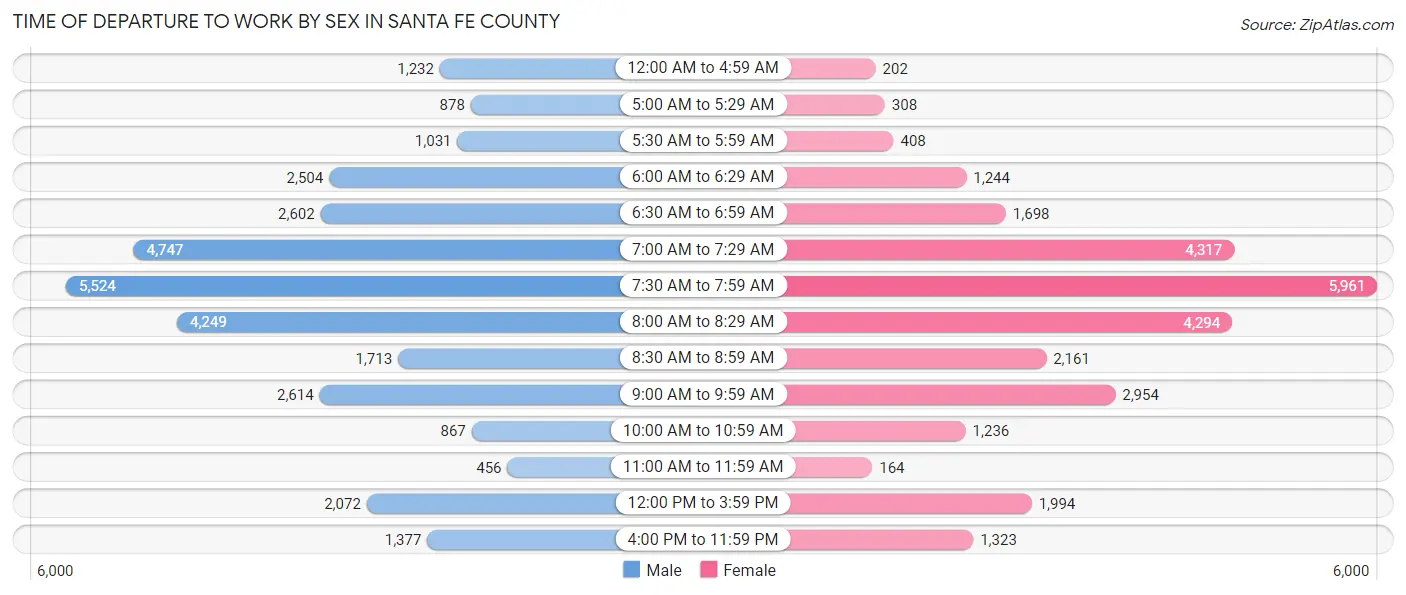
Time of Departure to Work by Sex in Santa Fe County
The most frequent times of departure to work in Santa Fe County are 7:30 AM to 7:59 AM (5,524, 17.3%) for males and 7:30 AM to 7:59 AM (5,961, 21.1%) for females.
| Time of Departure | Male | Female |
| 12:00 AM to 4:59 AM | 1,232 (3.9%) | 202 (0.7%) |
| 5:00 AM to 5:29 AM | 878 (2.8%) | 308 (1.1%) |
| 5:30 AM to 5:59 AM | 1,031 (3.2%) | 408 (1.4%) |
| 6:00 AM to 6:29 AM | 2,504 (7.9%) | 1,244 (4.4%) |
| 6:30 AM to 6:59 AM | 2,602 (8.2%) | 1,698 (6.0%) |
| 7:00 AM to 7:29 AM | 4,747 (14.9%) | 4,317 (15.3%) |
| 7:30 AM to 7:59 AM | 5,524 (17.3%) | 5,961 (21.1%) |
| 8:00 AM to 8:29 AM | 4,249 (13.3%) | 4,294 (15.2%) |
| 8:30 AM to 8:59 AM | 1,713 (5.4%) | 2,161 (7.6%) |
| 9:00 AM to 9:59 AM | 2,614 (8.2%) | 2,954 (10.4%) |
| 10:00 AM to 10:59 AM | 867 (2.7%) | 1,236 (4.4%) |
| 11:00 AM to 11:59 AM | 456 (1.4%) | 164 (0.6%) |
| 12:00 PM to 3:59 PM | 2,072 (6.5%) | 1,994 (7.0%) |
| 4:00 PM to 11:59 PM | 1,377 (4.3%) | 1,323 (4.7%) |
| Total | 31,866 (100.0%) | 28,264 (100.0%) |
Housing Occupancy in Santa Fe County
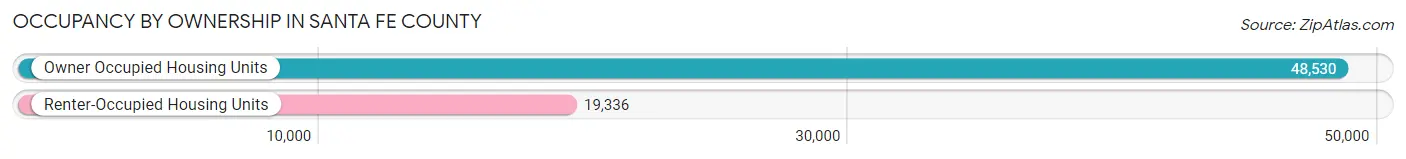
Occupancy by Ownership in Santa Fe County
Of the total 67,866 dwellings in Santa Fe County, owner-occupied units account for 48,530 (71.5%), while renter-occupied units make up 19,336 (28.5%).
| Occupancy | # Housing Units | % Housing Units |
| Owner Occupied Housing Units | 48,530 | 71.5% |
| Renter-Occupied Housing Units | 19,336 | 28.5% |
| Total Occupied Housing Units | 67,866 | 100.0% |
Occupancy by Household Size in Santa Fe County
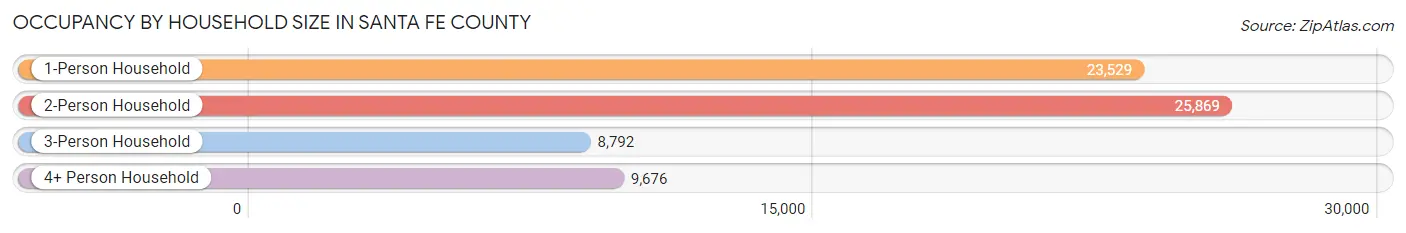
| Household Size | # Housing Units | % Housing Units |
| 1-Person Household | 23,529 | 34.7% |
| 2-Person Household | 25,869 | 38.1% |
| 3-Person Household | 8,792 | 13.0% |
| 4+ Person Household | 9,676 | 14.3% |
| Total Housing Units | 67,866 | 100.0% |
Occupancy by Ownership by Household Size in Santa Fe County
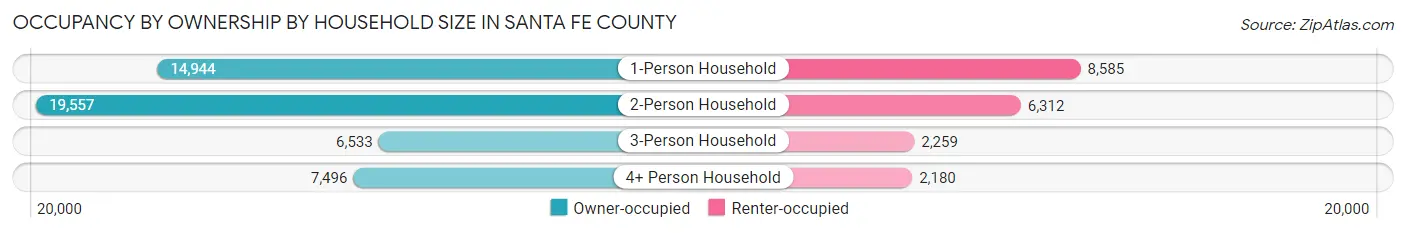
| Household Size | Owner-occupied | Renter-occupied |
| 1-Person Household | 14,944 (63.5%) | 8,585 (36.5%) |
| 2-Person Household | 19,557 (75.6%) | 6,312 (24.4%) |
| 3-Person Household | 6,533 (74.3%) | 2,259 (25.7%) |
| 4+ Person Household | 7,496 (77.5%) | 2,180 (22.5%) |
| Total Housing Units | 48,530 (71.5%) | 19,336 (28.5%) |
Occupancy by Educational Attainment in Santa Fe County
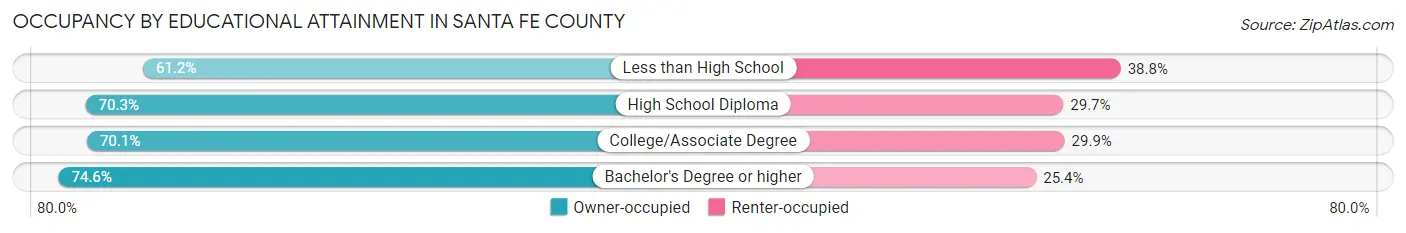
| Household Size | Owner-occupied | Renter-occupied |
| Less than High School | 3,266 (61.2%) | 2,070 (38.8%) |
| High School Diploma | 8,555 (70.3%) | 3,613 (29.7%) |
| College/Associate Degree | 13,424 (70.1%) | 5,726 (29.9%) |
| Bachelor's Degree or higher | 23,285 (74.6%) | 7,927 (25.4%) |
Occupancy by Age of Householder in Santa Fe County
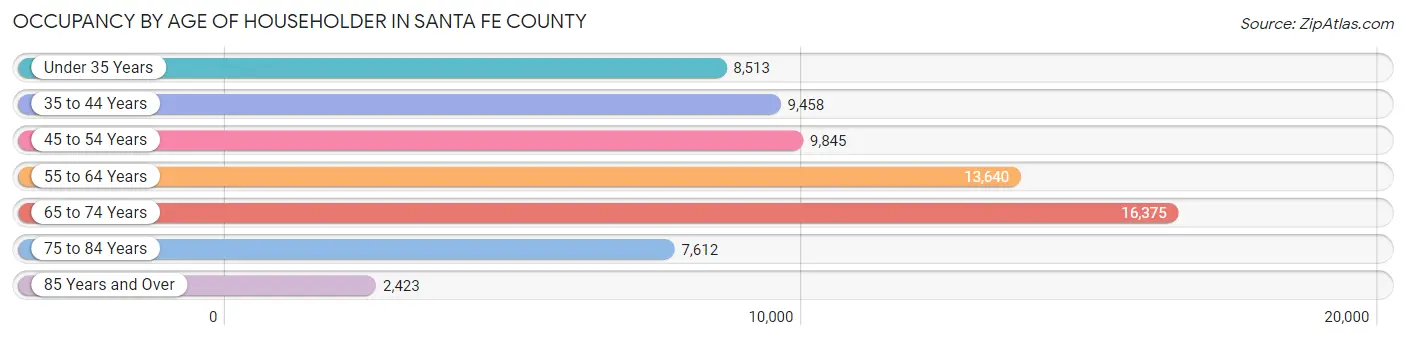
| Age Bracket | # Households | % Households |
| Under 35 Years | 8,513 | 12.5% |
| 35 to 44 Years | 9,458 | 13.9% |
| 45 to 54 Years | 9,845 | 14.5% |
| 55 to 64 Years | 13,640 | 20.1% |
| 65 to 74 Years | 16,375 | 24.1% |
| 75 to 84 Years | 7,612 | 11.2% |
| 85 Years and Over | 2,423 | 3.6% |
| Total | 67,866 | 100.0% |
Housing Finances in Santa Fe County
Median Income by Occupancy in Santa Fe County
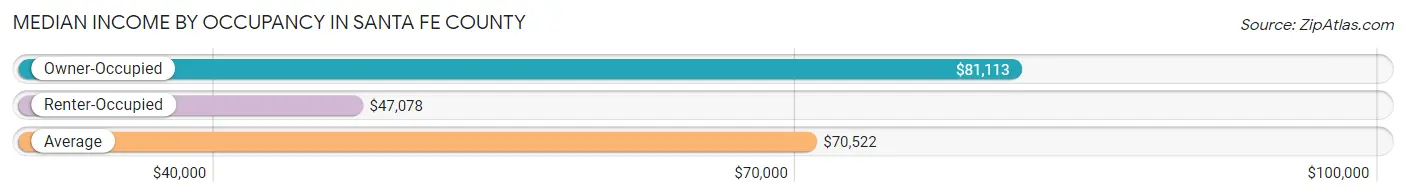
| Occupancy Type | # Households | Median Income |
| Owner-Occupied | 48,530 (71.5%) | $81,113 |
| Renter-Occupied | 19,336 (28.5%) | $47,078 |
| Average | 67,866 (100.0%) | $70,522 |
Occupancy by Householder Income Bracket in Santa Fe County
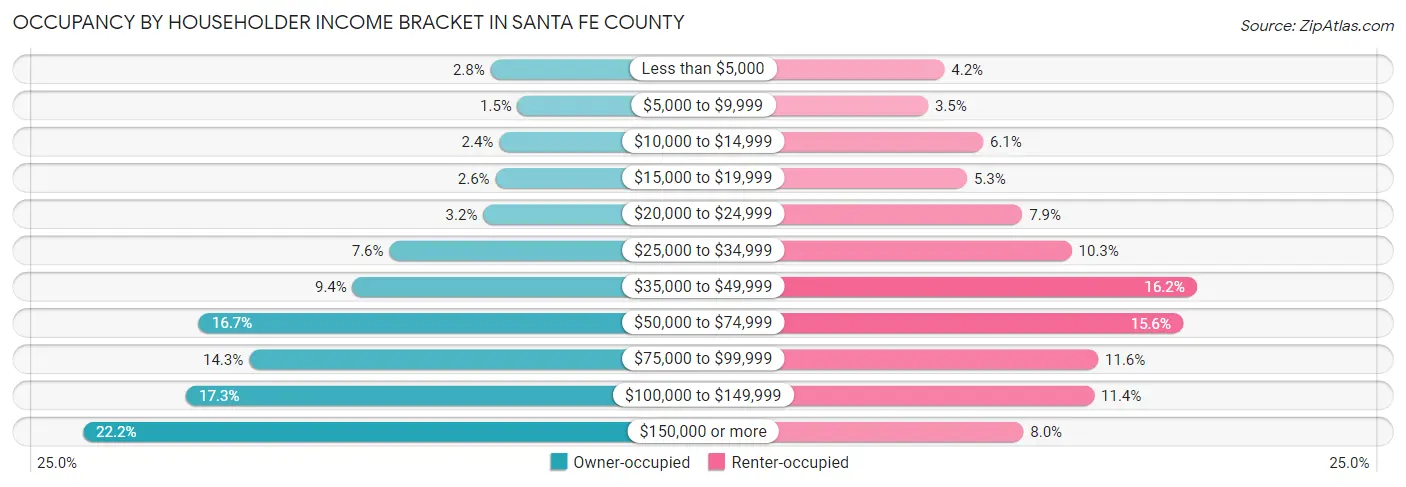
| Income Bracket | Owner-occupied | Renter-occupied |
| Less than $5,000 | 1,363 (2.8%) | 817 (4.2%) |
| $5,000 to $9,999 | 737 (1.5%) | 668 (3.5%) |
| $10,000 to $14,999 | 1,164 (2.4%) | 1,173 (6.1%) |
| $15,000 to $19,999 | 1,251 (2.6%) | 1,026 (5.3%) |
| $20,000 to $24,999 | 1,533 (3.2%) | 1,535 (7.9%) |
| $25,000 to $34,999 | 3,701 (7.6%) | 1,990 (10.3%) |
| $35,000 to $49,999 | 4,553 (9.4%) | 3,141 (16.2%) |
| $50,000 to $74,999 | 8,106 (16.7%) | 3,012 (15.6%) |
| $75,000 to $99,999 | 6,945 (14.3%) | 2,234 (11.6%) |
| $100,000 to $149,999 | 8,400 (17.3%) | 2,196 (11.4%) |
| $150,000 or more | 10,777 (22.2%) | 1,544 (8.0%) |
| Total | 48,530 (100.0%) | 19,336 (100.0%) |
Monthly Housing Cost Tiers in Santa Fe County
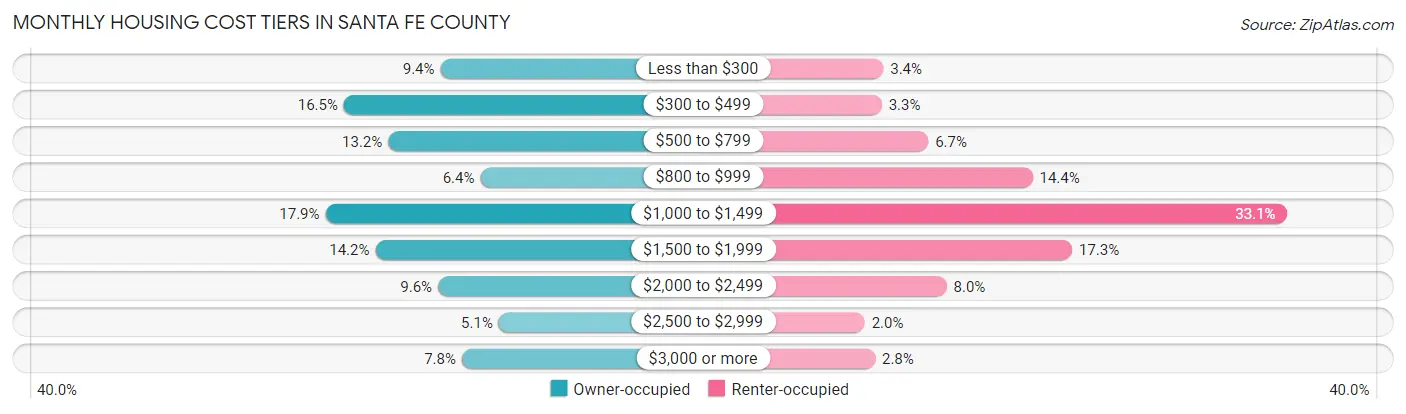
| Monthly Cost | Owner-occupied | Renter-occupied |
| Less than $300 | 4,551 (9.4%) | 653 (3.4%) |
| $300 to $499 | 8,004 (16.5%) | 631 (3.3%) |
| $500 to $799 | 6,422 (13.2%) | 1,294 (6.7%) |
| $800 to $999 | 3,127 (6.4%) | 2,778 (14.4%) |
| $1,000 to $1,499 | 8,664 (17.8%) | 6,407 (33.1%) |
| $1,500 to $1,999 | 6,875 (14.2%) | 3,342 (17.3%) |
| $2,000 to $2,499 | 4,639 (9.6%) | 1,555 (8.0%) |
| $2,500 to $2,999 | 2,464 (5.1%) | 388 (2.0%) |
| $3,000 or more | 3,784 (7.8%) | 536 (2.8%) |
| Total | 48,530 (100.0%) | 19,336 (100.0%) |
Physical Housing Characteristics in Santa Fe County
Housing Structures in Santa Fe County
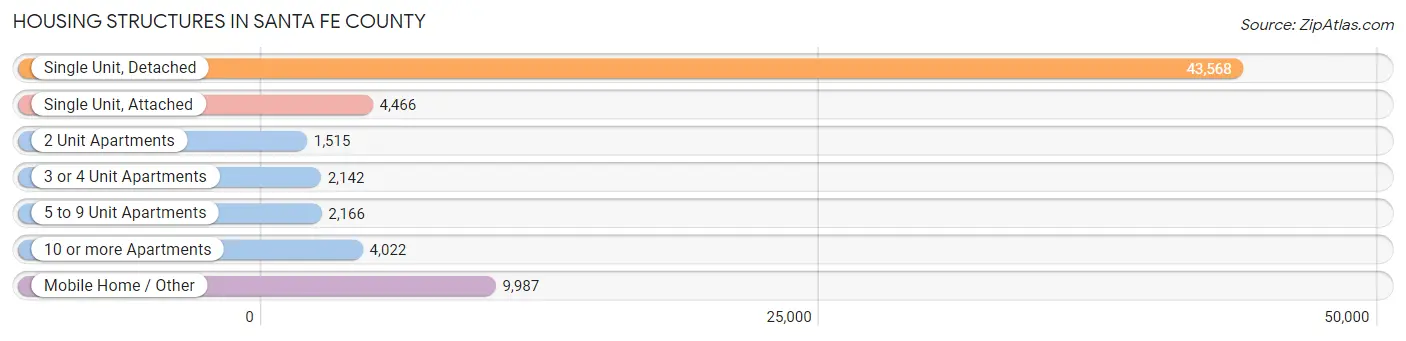
| Structure Type | # Housing Units | % Housing Units |
| Single Unit, Detached | 43,568 | 64.2% |
| Single Unit, Attached | 4,466 | 6.6% |
| 2 Unit Apartments | 1,515 | 2.2% |
| 3 or 4 Unit Apartments | 2,142 | 3.2% |
| 5 to 9 Unit Apartments | 2,166 | 3.2% |
| 10 or more Apartments | 4,022 | 5.9% |
| Mobile Home / Other | 9,987 | 14.7% |
| Total | 67,866 | 100.0% |
Housing Structures by Occupancy in Santa Fe County
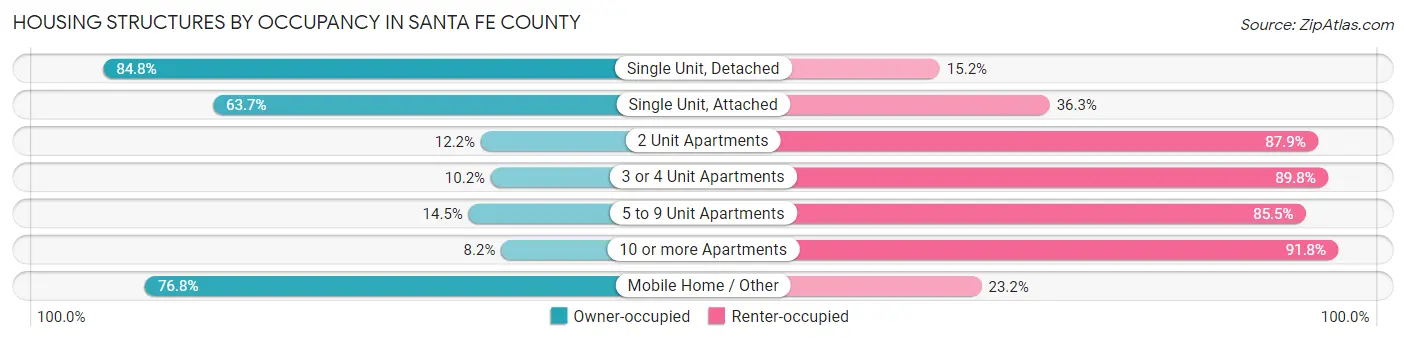
| Structure Type | Owner-occupied | Renter-occupied |
| Single Unit, Detached | 36,965 (84.8%) | 6,603 (15.2%) |
| Single Unit, Attached | 2,845 (63.7%) | 1,621 (36.3%) |
| 2 Unit Apartments | 184 (12.1%) | 1,331 (87.8%) |
| 3 or 4 Unit Apartments | 219 (10.2%) | 1,923 (89.8%) |
| 5 to 9 Unit Apartments | 314 (14.5%) | 1,852 (85.5%) |
| 10 or more Apartments | 331 (8.2%) | 3,691 (91.8%) |
| Mobile Home / Other | 7,672 (76.8%) | 2,315 (23.2%) |
| Total | 48,530 (71.5%) | 19,336 (28.5%) |
Housing Structures by Number of Rooms in Santa Fe County
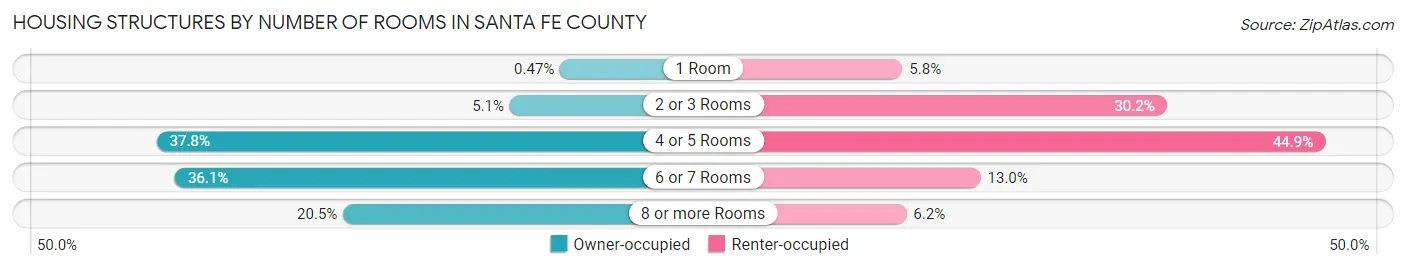
| Number of Rooms | Owner-occupied | Renter-occupied |
| 1 Room | 228 (0.5%) | 1,117 (5.8%) |
| 2 or 3 Rooms | 2,483 (5.1%) | 5,840 (30.2%) |
| 4 or 5 Rooms | 18,339 (37.8%) | 8,675 (44.9%) |
| 6 or 7 Rooms | 17,514 (36.1%) | 2,515 (13.0%) |
| 8 or more Rooms | 9,966 (20.5%) | 1,189 (6.1%) |
| Total | 48,530 (100.0%) | 19,336 (100.0%) |
Housing Structure by Heating Type in Santa Fe County
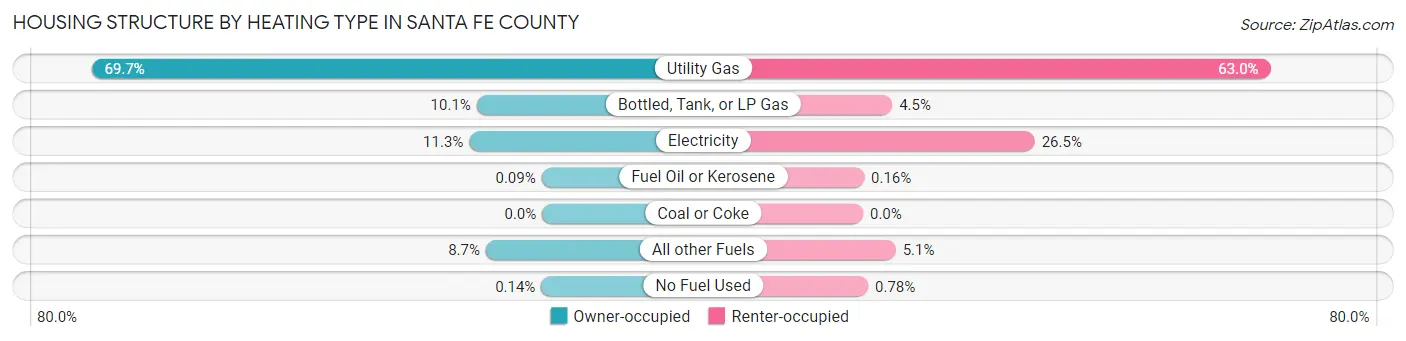
| Heating Type | Owner-occupied | Renter-occupied |
| Utility Gas | 33,804 (69.7%) | 12,175 (63.0%) |
| Bottled, Tank, or LP Gas | 4,912 (10.1%) | 873 (4.5%) |
| Electricity | 5,474 (11.3%) | 5,131 (26.5%) |
| Fuel Oil or Kerosene | 43 (0.1%) | 30 (0.2%) |
| Coal or Coke | 0 (0.0%) | 0 (0.0%) |
| All other Fuels | 4,228 (8.7%) | 976 (5.1%) |
| No Fuel Used | 69 (0.1%) | 151 (0.8%) |
| Total | 48,530 (100.0%) | 19,336 (100.0%) |
Household Vehicle Usage in Santa Fe County
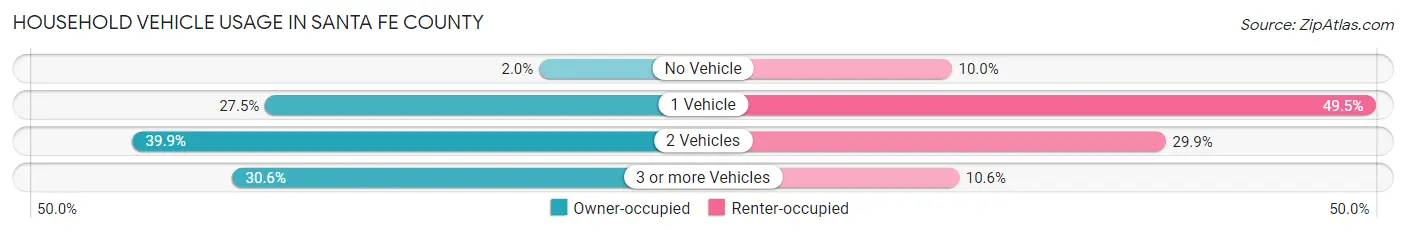
| Vehicles per Household | Owner-occupied | Renter-occupied |
| No Vehicle | 958 (2.0%) | 1,924 (10.0%) |
| 1 Vehicle | 13,364 (27.5%) | 9,569 (49.5%) |
| 2 Vehicles | 19,367 (39.9%) | 5,787 (29.9%) |
| 3 or more Vehicles | 14,841 (30.6%) | 2,056 (10.6%) |
| Total | 48,530 (100.0%) | 19,336 (100.0%) |
Real Estate & Mortgages in Santa Fe County
Real Estate and Mortgage Overview in Santa Fe County
| Characteristic | Without Mortgage | With Mortgage |
| Housing Units | 22,586 | 25,944 |
| Median Property Value | $343,100 | $392,300 |
| Median Household Income | $65,683 | $6,997 |
| Monthly Housing Costs | $472 | $3,586 |
| Real Estate Taxes | $1,825 | $1,408 |
Property Value by Mortgage Status in Santa Fe County
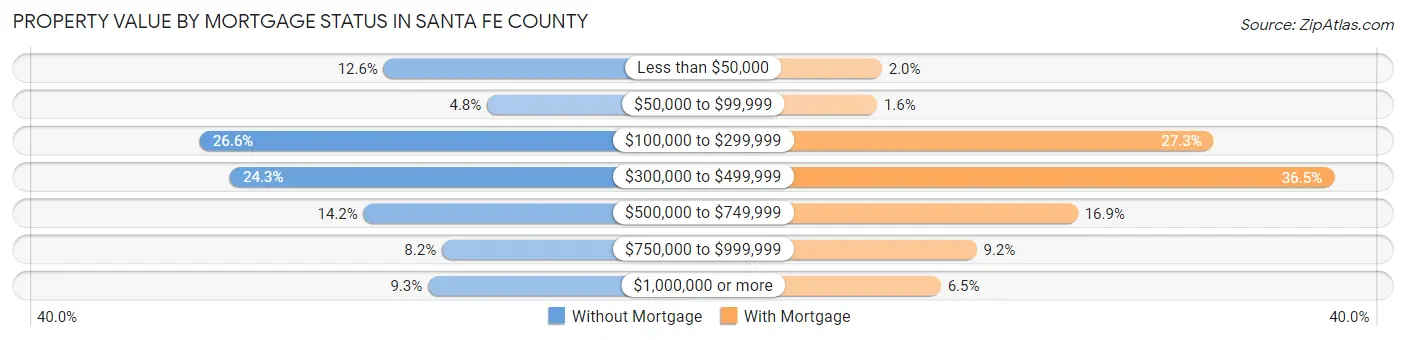
| Property Value | Without Mortgage | With Mortgage |
| Less than $50,000 | 2,855 (12.6%) | 519 (2.0%) |
| $50,000 to $99,999 | 1,074 (4.8%) | 422 (1.6%) |
| $100,000 to $299,999 | 6,016 (26.6%) | 7,077 (27.3%) |
| $300,000 to $499,999 | 5,497 (24.3%) | 9,457 (36.4%) |
| $500,000 to $749,999 | 3,200 (14.2%) | 4,392 (16.9%) |
| $750,000 to $999,999 | 1,853 (8.2%) | 2,393 (9.2%) |
| $1,000,000 or more | 2,091 (9.3%) | 1,684 (6.5%) |
| Total | 22,586 (100.0%) | 25,944 (100.0%) |
Household Income by Mortgage Status in Santa Fe County
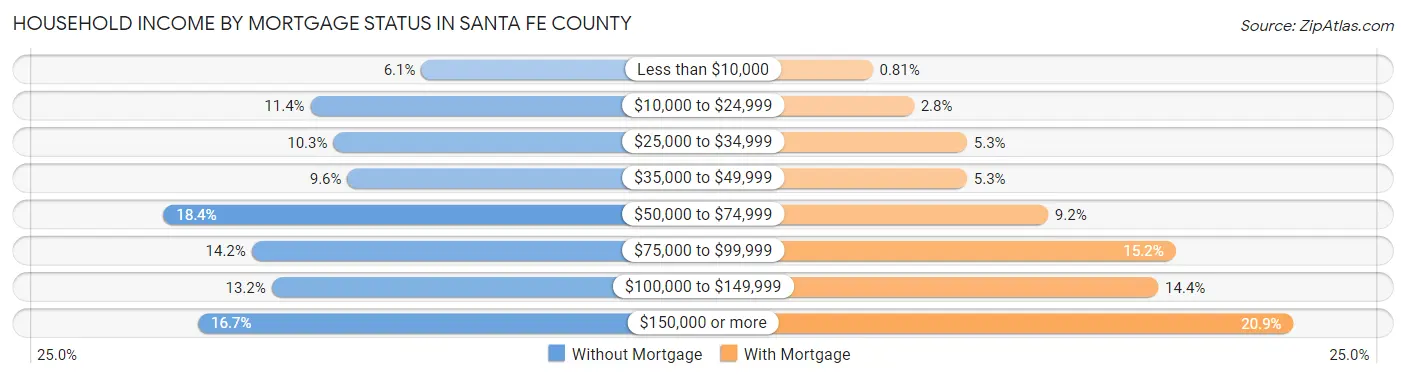
| Household Income | Without Mortgage | With Mortgage |
| Less than $10,000 | 1,381 (6.1%) | 210 (0.8%) |
| $10,000 to $24,999 | 2,572 (11.4%) | 719 (2.8%) |
| $25,000 to $34,999 | 2,327 (10.3%) | 1,376 (5.3%) |
| $35,000 to $49,999 | 2,176 (9.6%) | 1,374 (5.3%) |
| $50,000 to $74,999 | 4,153 (18.4%) | 2,377 (9.2%) |
| $75,000 to $99,999 | 3,206 (14.2%) | 3,953 (15.2%) |
| $100,000 to $149,999 | 2,991 (13.2%) | 3,739 (14.4%) |
| $150,000 or more | 3,780 (16.7%) | 5,409 (20.8%) |
| Total | 22,586 (100.0%) | 25,944 (100.0%) |
Property Value to Household Income Ratio in Santa Fe County
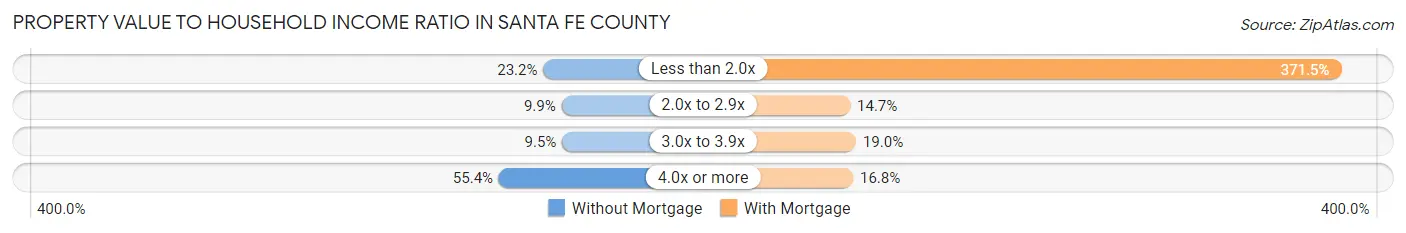
| Value-to-Income Ratio | Without Mortgage | With Mortgage |
| Less than 2.0x | 5,238 (23.2%) | 96,380 (371.5%) |
| 2.0x to 2.9x | 2,243 (9.9%) | 3,805 (14.7%) |
| 3.0x to 3.9x | 2,138 (9.5%) | 4,917 (19.0%) |
| 4.0x or more | 12,519 (55.4%) | 4,353 (16.8%) |
| Total | 22,586 (100.0%) | 25,944 (100.0%) |
Real Estate Taxes by Mortgage Status in Santa Fe County
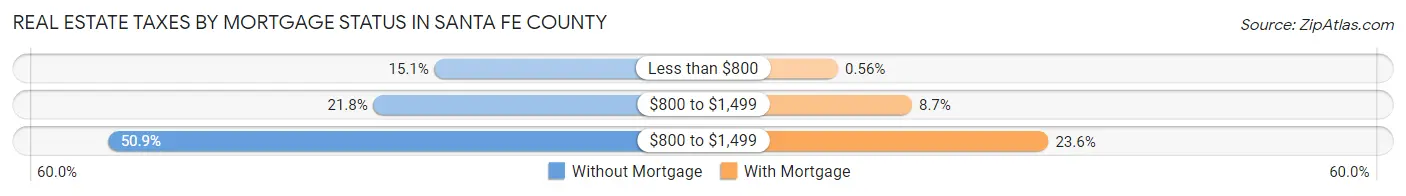
| Property Taxes | Without Mortgage | With Mortgage |
| Less than $800 | 3,403 (15.1%) | 145 (0.6%) |
| $800 to $1,499 | 4,914 (21.8%) | 2,248 (8.7%) |
| $800 to $1,499 | 11,495 (50.9%) | 6,125 (23.6%) |
| Total | 22,586 (100.0%) | 25,944 (100.0%) |
Health & Disability in Santa Fe County
Health Insurance Coverage by Age in Santa Fe County
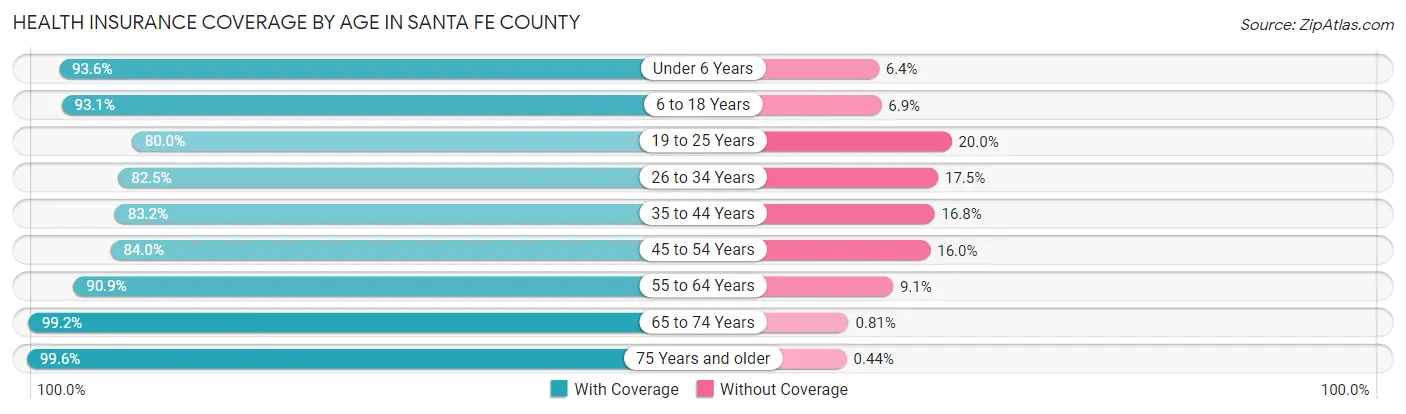
| Age Bracket | With Coverage | Without Coverage |
| Under 6 Years | 6,909 (93.6%) | 475 (6.4%) |
| 6 to 18 Years | 19,280 (93.1%) | 1,432 (6.9%) |
| 19 to 25 Years | 8,889 (80.0%) | 2,221 (20.0%) |
| 26 to 34 Years | 12,328 (82.5%) | 2,611 (17.5%) |
| 35 to 44 Years | 14,788 (83.2%) | 2,993 (16.8%) |
| 45 to 54 Years | 15,165 (84.0%) | 2,898 (16.0%) |
| 55 to 64 Years | 21,049 (90.9%) | 2,102 (9.1%) |
| 65 to 74 Years | 24,726 (99.2%) | 201 (0.8%) |
| 75 Years and older | 14,824 (99.6%) | 65 (0.4%) |
| Total | 137,958 (90.2%) | 14,998 (9.8%) |
Health Insurance Coverage by Citizenship Status in Santa Fe County
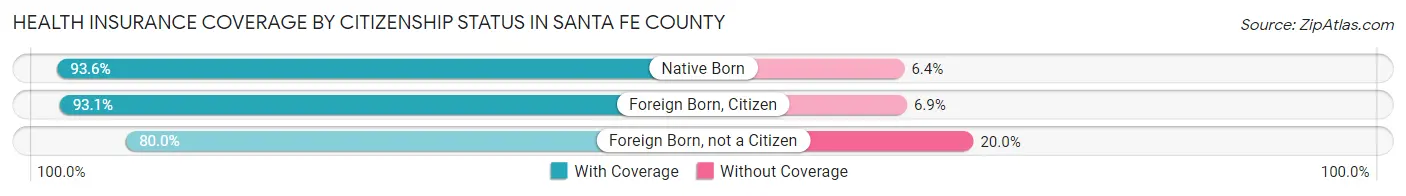
| Citizenship Status | With Coverage | Without Coverage |
| Native Born | 6,909 (93.6%) | 475 (6.4%) |
| Foreign Born, Citizen | 19,280 (93.1%) | 1,432 (6.9%) |
| Foreign Born, not a Citizen | 8,889 (80.0%) | 2,221 (20.0%) |
Health Insurance Coverage by Household Income in Santa Fe County
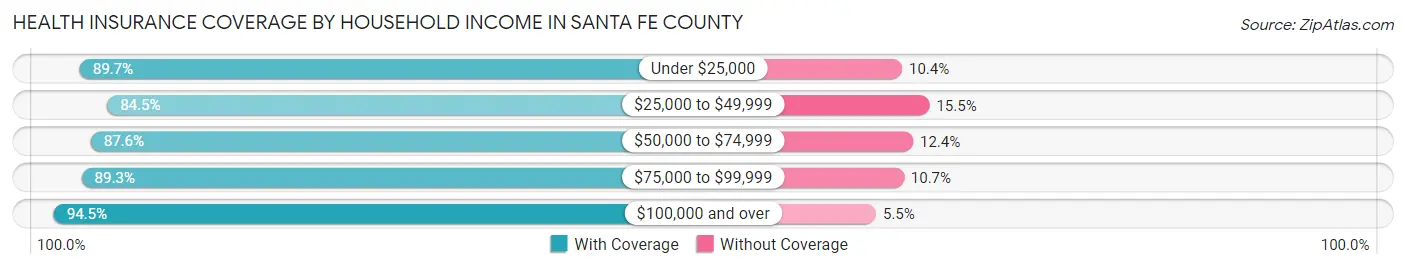
| Household Income | With Coverage | Without Coverage |
| Under $25,000 | 15,950 (89.6%) | 1,841 (10.3%) |
| $25,000 to $49,999 | 22,648 (84.5%) | 4,150 (15.5%) |
| $50,000 to $74,999 | 22,202 (87.6%) | 3,147 (12.4%) |
| $75,000 to $99,999 | 19,985 (89.3%) | 2,392 (10.7%) |
| $100,000 and over | 55,816 (94.5%) | 3,237 (5.5%) |
Public vs Private Health Insurance Coverage by Age in Santa Fe County
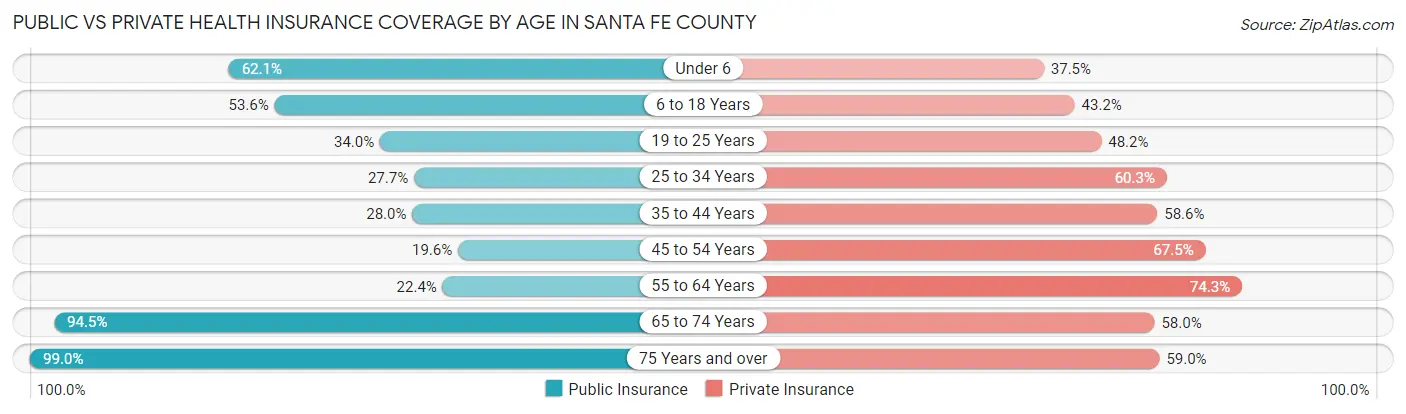
| Age Bracket | Public Insurance | Private Insurance |
| Under 6 | 4,586 (62.1%) | 2,769 (37.5%) |
| 6 to 18 Years | 11,102 (53.6%) | 8,952 (43.2%) |
| 19 to 25 Years | 3,780 (34.0%) | 5,351 (48.2%) |
| 25 to 34 Years | 4,141 (27.7%) | 9,009 (60.3%) |
| 35 to 44 Years | 4,986 (28.0%) | 10,414 (58.6%) |
| 45 to 54 Years | 3,532 (19.6%) | 12,192 (67.5%) |
| 55 to 64 Years | 5,185 (22.4%) | 17,200 (74.3%) |
| 65 to 74 Years | 23,562 (94.5%) | 14,467 (58.0%) |
| 75 Years and over | 14,735 (99.0%) | 8,779 (59.0%) |
| Total | 75,609 (49.4%) | 89,133 (58.3%) |
Disability Status by Sex by Age in Santa Fe County
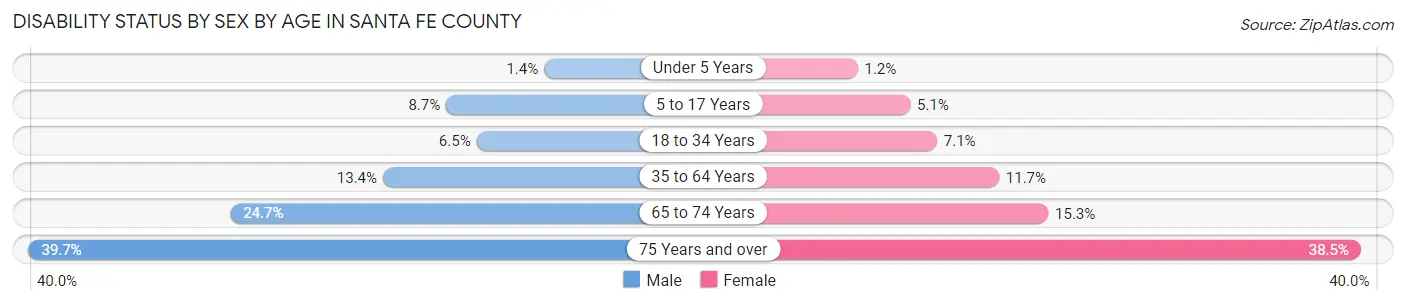
| Age Bracket | Male | Female |
| Under 5 Years | 43 (1.4%) | 35 (1.2%) |
| 5 to 17 Years | 891 (8.7%) | 520 (5.1%) |
| 18 to 34 Years | 894 (6.5%) | 975 (7.1%) |
| 35 to 64 Years | 3,842 (13.4%) | 3,536 (11.7%) |
| 65 to 74 Years | 2,862 (24.7%) | 2,045 (15.3%) |
| 75 Years and over | 2,631 (39.7%) | 3,184 (38.5%) |
Disability Class by Sex by Age in Santa Fe County
Disability Class: Hearing Difficulty
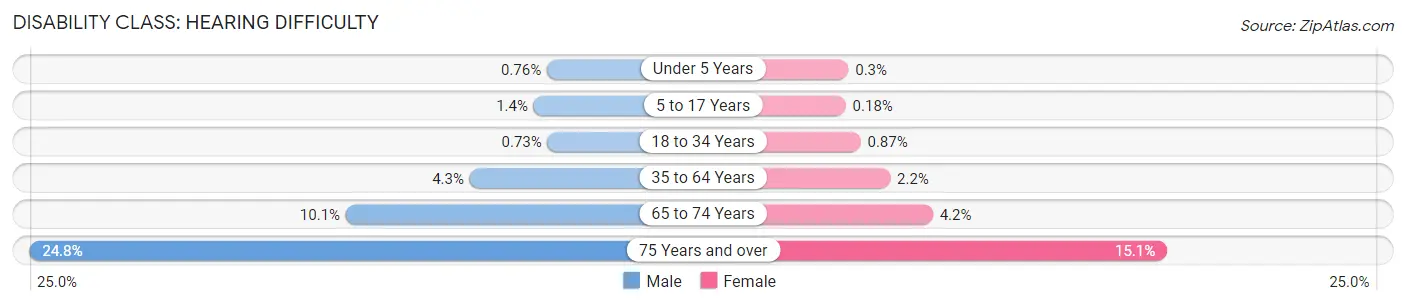
| Age Bracket | Male | Female |
| Under 5 Years | 23 (0.8%) | 9 (0.3%) |
| 5 to 17 Years | 140 (1.4%) | 18 (0.2%) |
| 18 to 34 Years | 101 (0.7%) | 120 (0.9%) |
| 35 to 64 Years | 1,246 (4.3%) | 679 (2.2%) |
| 65 to 74 Years | 1,168 (10.1%) | 564 (4.2%) |
| 75 Years and over | 1,642 (24.8%) | 1,247 (15.1%) |
Disability Class: Vision Difficulty
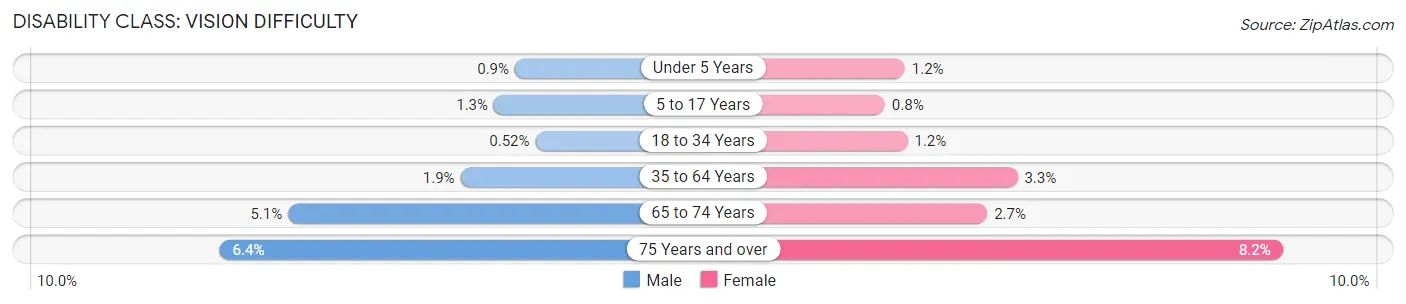
| Age Bracket | Male | Female |
| Under 5 Years | 27 (0.9%) | 35 (1.2%) |
| 5 to 17 Years | 132 (1.3%) | 82 (0.8%) |
| 18 to 34 Years | 72 (0.5%) | 169 (1.2%) |
| 35 to 64 Years | 548 (1.9%) | 988 (3.3%) |
| 65 to 74 Years | 592 (5.1%) | 361 (2.7%) |
| 75 Years and over | 423 (6.4%) | 676 (8.2%) |
Disability Class: Cognitive Difficulty
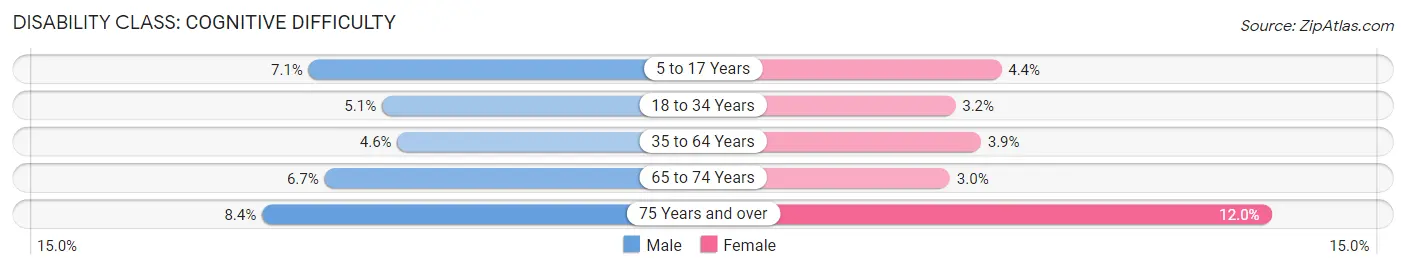
| Age Bracket | Male | Female |
| 5 to 17 Years | 725 (7.1%) | 455 (4.4%) |
| 18 to 34 Years | 700 (5.1%) | 436 (3.2%) |
| 35 to 64 Years | 1,325 (4.6%) | 1,172 (3.9%) |
| 65 to 74 Years | 770 (6.7%) | 402 (3.0%) |
| 75 Years and over | 556 (8.4%) | 988 (12.0%) |
Disability Class: Ambulatory Difficulty
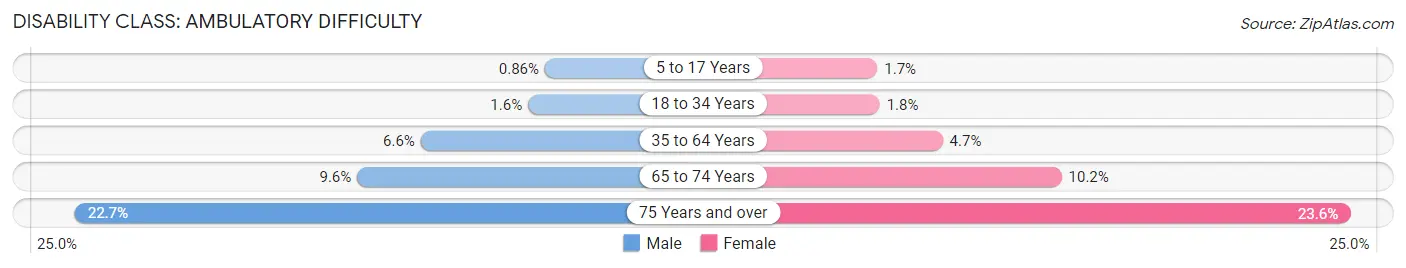
| Age Bracket | Male | Female |
| 5 to 17 Years | 88 (0.9%) | 169 (1.7%) |
| 18 to 34 Years | 227 (1.6%) | 243 (1.8%) |
| 35 to 64 Years | 1,900 (6.6%) | 1,418 (4.7%) |
| 65 to 74 Years | 1,108 (9.6%) | 1,362 (10.2%) |
| 75 Years and over | 1,502 (22.7%) | 1,949 (23.6%) |
Disability Class: Self-Care Difficulty
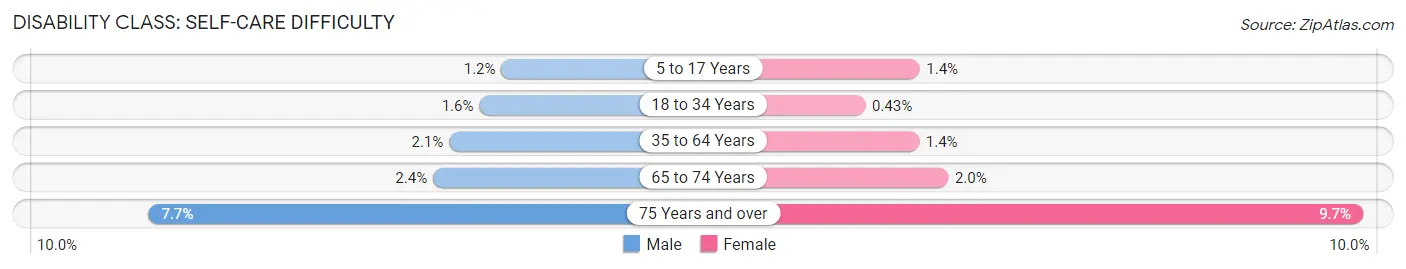
| Age Bracket | Male | Female |
| 5 to 17 Years | 118 (1.1%) | 148 (1.4%) |
| 18 to 34 Years | 216 (1.6%) | 60 (0.4%) |
| 35 to 64 Years | 608 (2.1%) | 433 (1.4%) |
| 65 to 74 Years | 280 (2.4%) | 263 (2.0%) |
| 75 Years and over | 510 (7.7%) | 799 (9.7%) |
Technology Access in Santa Fe County
Computing Device Access in Santa Fe County
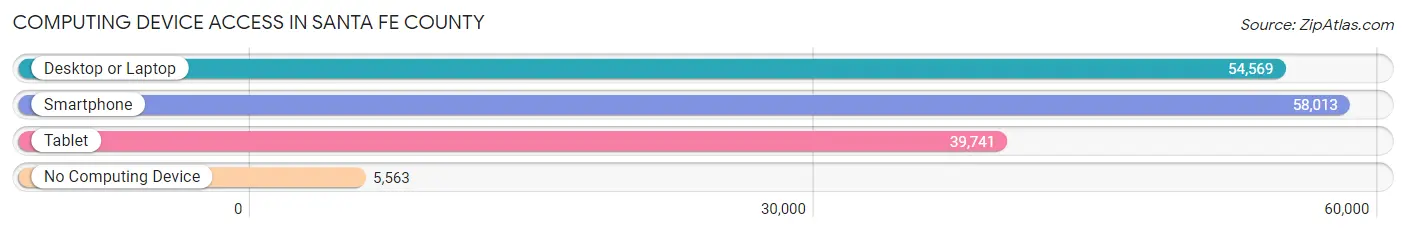
| Device Type | # Households | % Households |
| Desktop or Laptop | 54,569 | 80.4% |
| Smartphone | 58,013 | 85.5% |
| Tablet | 39,741 | 58.6% |
| No Computing Device | 5,563 | 8.2% |
| Total | 67,866 | 100.0% |
Internet Access in Santa Fe County
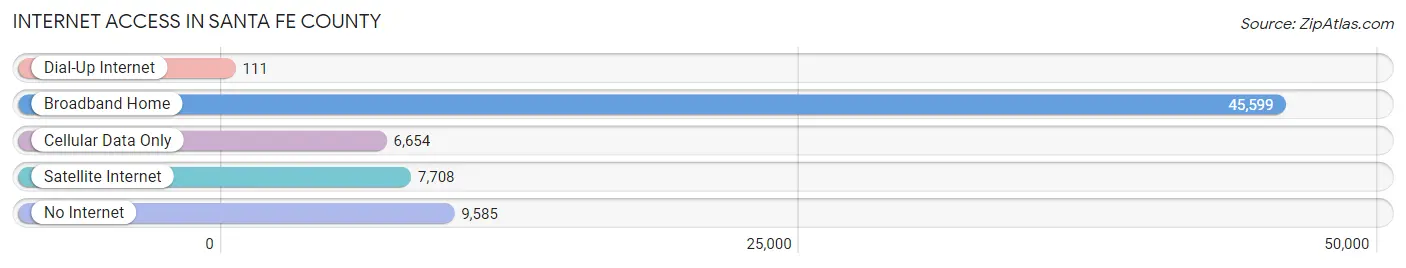
| Internet Type | # Households | % Households |
| Dial-Up Internet | 111 | 0.2% |
| Broadband Home | 45,599 | 67.2% |
| Cellular Data Only | 6,654 | 9.8% |
| Satellite Internet | 7,708 | 11.4% |
| No Internet | 9,585 | 14.1% |
| Total | 67,866 | 100.0% |
Santa Fe County Summary
Santa Fe County, New Mexico is located in the north-central part of the state and is the fourth most populous county in the state. It is bordered by Rio Arriba County to the north, Sandoval County to the east, Los Alamos County to the south, and San Miguel County to the west. The county seat is Santa Fe, the state capital.
Geography
Santa Fe County covers an area of 2,569 square miles, making it the fourth largest county in New Mexico. The county is located in the northern part of the state and is bordered by Rio Arriba County to the north, Sandoval County to the east, Los Alamos County to the south, and San Miguel County to the west. The county is located in the Sangre de Cristo Mountains and is home to the Santa Fe National Forest. The highest point in the county is the summit of Santa Fe Baldy, which has an elevation of 12,622 feet. The county also contains the Santa Fe Ski Basin, which is a popular ski resort.
The county is divided into two distinct regions: the high desert and the mountain region. The high desert region is located in the eastern part of the county and is characterized by rolling hills and wide open spaces. The mountain region is located in the western part of the county and is characterized by steep mountains and deep canyons.
Climate
Santa Fe County has a semi-arid climate, with hot summers and cold winters. The average annual temperature is 54°F, with an average high of 79°F in July and an average low of 28°F in January. The average annual precipitation is 12.5 inches, with most of the precipitation occurring in the summer months.
Demographics
As of the 2010 census, Santa Fe County had a population of 144,170. The population was 54.3% White, 2.3% African American, 1.2% Native American, 1.2% Asian, 0.1% Pacific Islander, 37.2% from other races, and 4.7% from two or more races. Hispanic or Latino of any race were 68.3% of the population.
The median household income in the county was $45,945, and the median family income was $51,817. The per capita income was $25,945. About 16.2% of the population was below the poverty line.
Economy
Santa Fe County is home to a diverse economy, with a mix of industries including tourism, government, education, healthcare, and manufacturing. The county is home to several major employers, including the Santa Fe Public Schools, the City of Santa Fe, the Santa Fe County Government, the Santa Fe National Forest, and the Santa Fe Ski Basin.
Tourism is a major industry in the county, with visitors drawn to the area for its cultural attractions, outdoor recreation, and scenic beauty. The Santa Fe National Forest is a popular destination for camping, hiking, and fishing. The Santa Fe Ski Basin is a popular ski resort, and the city of Santa Fe is home to numerous art galleries, museums, and other cultural attractions.
The county is also home to several major manufacturing companies, including Intel, Hewlett Packard, and Lockheed Martin. These companies provide a significant number of jobs to the local economy.
Conclusion
Santa Fe County, New Mexico is a diverse and vibrant county located in the northern part of the state. The county is home to a mix of industries, including tourism, government, education, healthcare, and manufacturing. The county is also home to numerous cultural attractions, outdoor recreation, and scenic beauty. The county has a semi-arid climate, with hot summers and cold winters. As of the 2010 census, the county had a population of 144,170, with a median household income of $45,945 and a median family income of $51,817.
Common Questions
What is Per Capita Income in Santa Fe County?
Per Capita income in Santa Fe County is $45,402.
What is the Median Family Income in Santa Fe County?
Median Family Income in Santa Fe County is $84,058.
What is the Median Household income in Santa Fe County?
Median Household Income in Santa Fe County is $70,522.
What is Income or Wage Gap in Santa Fe County?
Income or Wage Gap in Santa Fe County is 22.4%.
Women in Santa Fe County earn 77.6 cents for every dollar earned by a man.
What is Family Income Deficit in Santa Fe County?
Family Income Deficit in Santa Fe County is $9,615.
Families that are below poverty line in Santa Fe County earn $9,615 less on average than the poverty threshold level.
What is Inequality or Gini Index in Santa Fe County?
Inequality or Gini Index in Santa Fe County is 0.49.
What is the Total Population of Santa Fe County?
Total Population of Santa Fe County is 154,481.
What is the Total Male Population of Santa Fe County?
Total Male Population of Santa Fe County is 75,375.
What is the Total Female Population of Santa Fe County?
Total Female Population of Santa Fe County is 79,106.
What is the Ratio of Males per 100 Females in Santa Fe County?
There are 95.28 Males per 100 Females in Santa Fe County.
What is the Ratio of Females per 100 Males in Santa Fe County?
There are 104.95 Females per 100 Males in Santa Fe County.
What is the Median Population Age in Santa Fe County?
Median Population Age in Santa Fe County is 47.7 Years.
What is the Average Family Size in Santa Fe County
Average Family Size in Santa Fe County is 2.9 People.
What is the Average Household Size in Santa Fe County
Average Household Size in Santa Fe County is 2.2 People.
How Large is the Labor Force in Santa Fe County?
There are 75,829 People in the Labor Forcein in Santa Fe County.
What is the Percentage of People in the Labor Force in Santa Fe County?
57.7% of People are in the Labor Force in Santa Fe County.
What is the Unemployment Rate in Santa Fe County?
Unemployment Rate in Santa Fe County is 5.4%.