Socorro County, NM Map & Demographics
Socorro County Map
Socorro County Overview
$21,792
PER CAPITA INCOME
$51,789
AVG FAMILY INCOME
$40,699
AVG HOUSEHOLD INCOME
21.7%
WAGE / INCOME GAP [ % ]
78.3¢/ $1
WAGE / INCOME GAP [ $ ]
$9,535
FAMILY INCOME DEFICIT
0.48
INEQUALITY / GINI INDEX
16,453
TOTAL POPULATION
8,366
MALE POPULATION
8,087
FEMALE POPULATION
103.45
MALES / 100 FEMALES
96.67
FEMALES / 100 MALES
39.6
MEDIAN AGE
4.0
AVG FAMILY SIZE
3.2
AVG HOUSEHOLD SIZE
5,373
LABOR FORCE [ PEOPLE ]
40.8%
PERCENT IN LABOR FORCE
4.4%
UNEMPLOYMENT RATE
Income in Socorro County
Income Overview in Socorro County
Per Capita Income in Socorro County is $21,792, while median incomes of families and households are $51,789 and $40,699 respectively.
| Characteristic | Number | Measure |
| Per Capita Income | 16,453 | $21,792 |
| Median Family Income | 3,091 | $51,789 |
| Mean Family Income | 3,091 | $72,457 |
| Median Household Income | 4,953 | $40,699 |
| Mean Household Income | 4,953 | $60,919 |
| Income Deficit | 3,091 | $9,535 |
| Wage / Income Gap (%) | 16,453 | 21.74% |
| Wage / Income Gap ($) | 16,453 | 78.26¢ per $1 |
| Gini / Inequality Index | 16,453 | 0.48 |
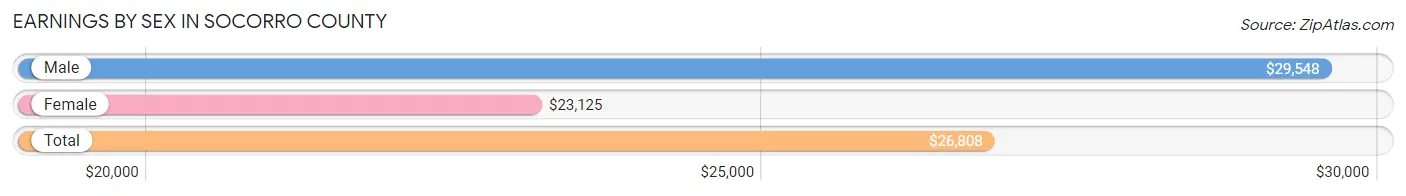
Earnings by Sex in Socorro County
Average Earnings in Socorro County are $26,808, $29,548 for men and $23,125 for women, a difference of 21.7%.
| Sex | Number | Average Earnings |
| Male | 3,246 (53.0%) | $29,548 |
| Female | 2,880 (47.0%) | $23,125 |
| Total | 6,126 (100.0%) | $26,808 |
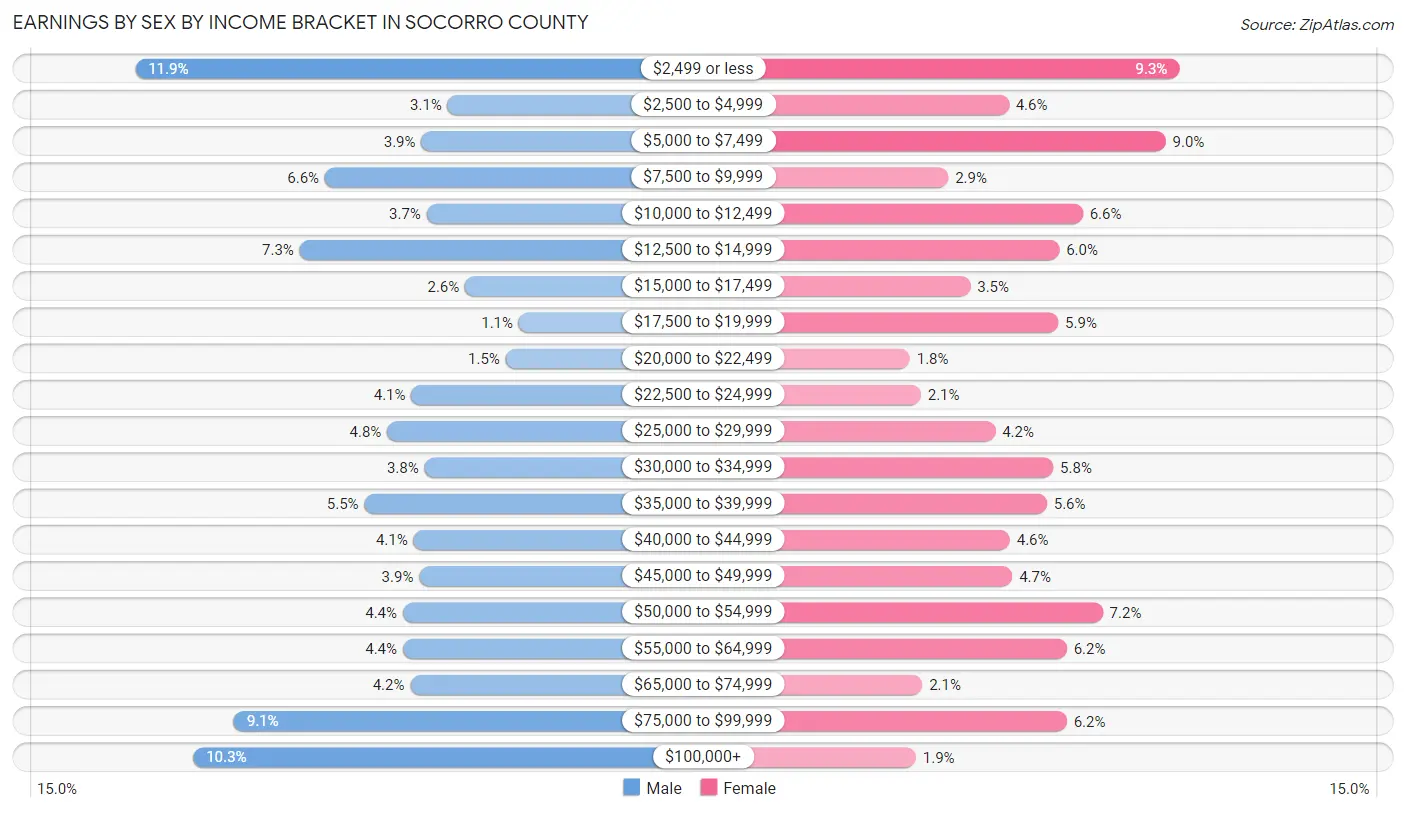
Earnings by Sex by Income Bracket in Socorro County
The most common earnings brackets in Socorro County are $2,499 or less for men (386 | 11.9%) and $2,499 or less for women (269 | 9.3%).
| Income | Male | Female |
| $2,499 or less | 386 (11.9%) | 269 (9.3%) |
| $2,500 to $4,999 | 101 (3.1%) | 131 (4.5%) |
| $5,000 to $7,499 | 125 (3.8%) | 258 (9.0%) |
| $7,500 to $9,999 | 213 (6.6%) | 82 (2.9%) |
| $10,000 to $12,499 | 120 (3.7%) | 191 (6.6%) |
| $12,500 to $14,999 | 236 (7.3%) | 172 (6.0%) |
| $15,000 to $17,499 | 85 (2.6%) | 100 (3.5%) |
| $17,500 to $19,999 | 36 (1.1%) | 171 (5.9%) |
| $20,000 to $22,499 | 48 (1.5%) | 51 (1.8%) |
| $22,500 to $24,999 | 134 (4.1%) | 60 (2.1%) |
| $25,000 to $29,999 | 156 (4.8%) | 120 (4.2%) |
| $30,000 to $34,999 | 122 (3.8%) | 167 (5.8%) |
| $35,000 to $39,999 | 177 (5.4%) | 162 (5.6%) |
| $40,000 to $44,999 | 132 (4.1%) | 132 (4.6%) |
| $45,000 to $49,999 | 127 (3.9%) | 134 (4.6%) |
| $50,000 to $54,999 | 142 (4.4%) | 207 (7.2%) |
| $55,000 to $64,999 | 142 (4.4%) | 178 (6.2%) |
| $65,000 to $74,999 | 135 (4.2%) | 61 (2.1%) |
| $75,000 to $99,999 | 296 (9.1%) | 178 (6.2%) |
| $100,000+ | 333 (10.3%) | 56 (1.9%) |
| Total | 3,246 (100.0%) | 2,880 (100.0%) |
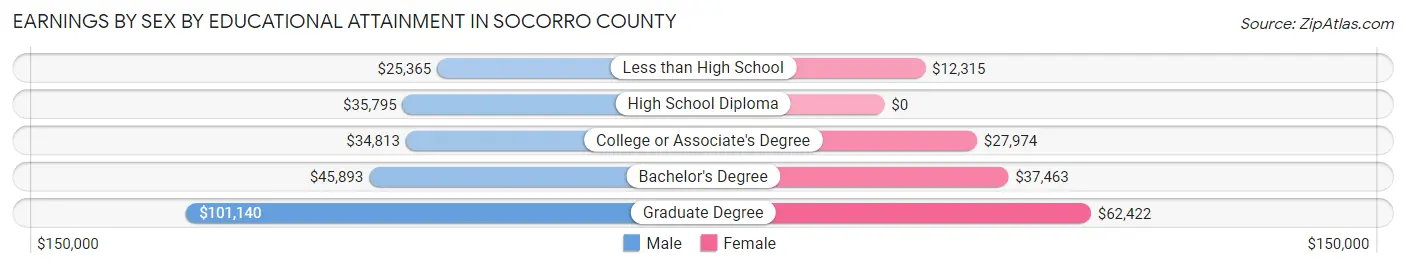
Earnings by Sex by Educational Attainment in Socorro County
Average earnings in Socorro County are $41,883 for men and $34,566 for women, a difference of 17.5%. Men with an educational attainment of graduate degree enjoy the highest average annual earnings of $101,140, while those with less than high school education earn the least with $25,365. Women with an educational attainment of graduate degree earn the most with the average annual earnings of $62,422, while those with less than high school education have the smallest earnings of $12,315.
| Educational Attainment | Male Income | Female Income |
| Less than High School | $25,365 | $12,315 |
| High School Diploma | $35,795 | $0 |
| College or Associate's Degree | $34,813 | $27,974 |
| Bachelor's Degree | $45,893 | $37,463 |
| Graduate Degree | $101,140 | $62,422 |
| Total | $41,883 | $34,566 |
Family Income in Socorro County
Family Income Brackets in Socorro County
According to the Socorro County family income data, there are 454 families falling into the $50,000 to $74,999 income range, which is the most common income bracket and makes up 14.7% of all families. Conversely, the $200,000+ income bracket is the least frequent group with only 130 families (4.2%) belonging to this category.
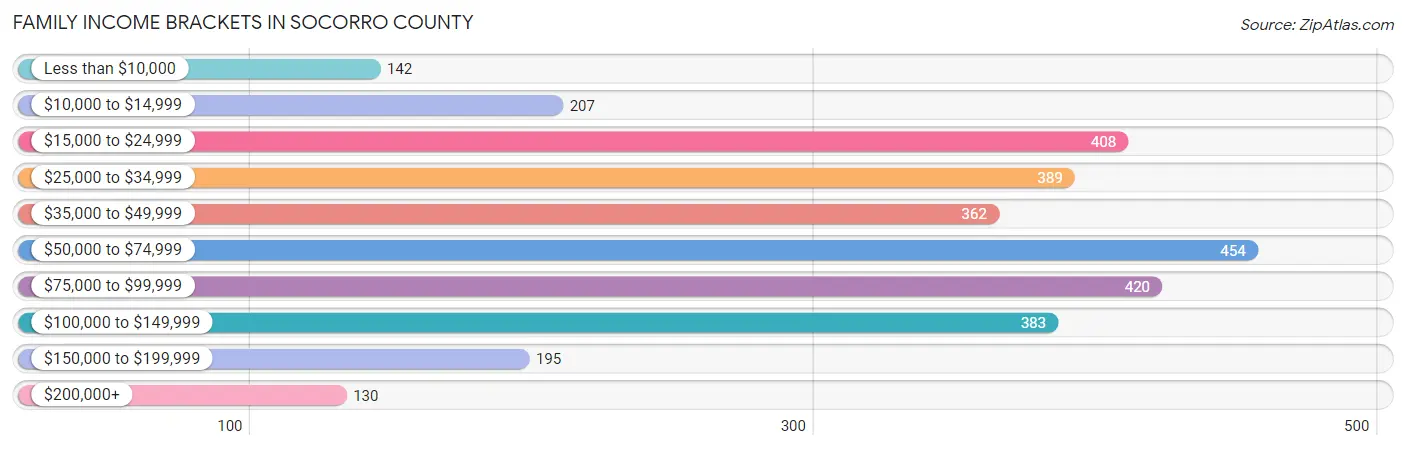
| Income Bracket | # Families | % Families |
| Less than $10,000 | 142 | 4.6% |
| $10,000 to $14,999 | 207 | 6.7% |
| $15,000 to $24,999 | 408 | 13.2% |
| $25,000 to $34,999 | 389 | 12.6% |
| $35,000 to $49,999 | 362 | 11.7% |
| $50,000 to $74,999 | 454 | 14.7% |
| $75,000 to $99,999 | 420 | 13.6% |
| $100,000 to $149,999 | 383 | 12.4% |
| $150,000 to $199,999 | 195 | 6.3% |
| $200,000+ | 130 | 4.2% |
Family Income by Famaliy Size in Socorro County
5-person families (263 | 8.5%) account for the highest median family income in Socorro County with $64,471 per family, while 2-person families (1,674 | 54.2%) have the highest median income of $23,077 per family member.
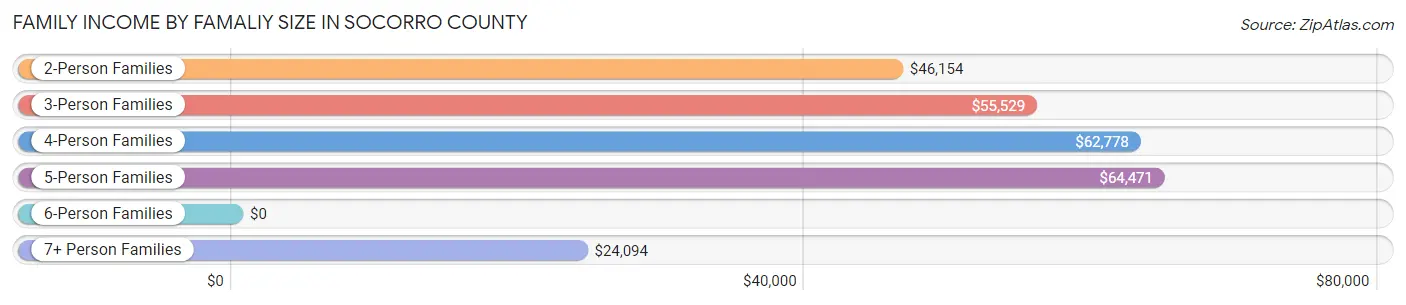
| Income Bracket | # Families | Median Income |
| 2-Person Families | 1,674 (54.2%) | $46,154 |
| 3-Person Families | 557 (18.0%) | $55,529 |
| 4-Person Families | 416 (13.5%) | $62,778 |
| 5-Person Families | 263 (8.5%) | $64,471 |
| 6-Person Families | 79 (2.6%) | $0 |
| 7+ Person Families | 102 (3.3%) | $24,094 |
| Total | 3,091 (100.0%) | $51,789 |
Family Income by Number of Earners in Socorro County
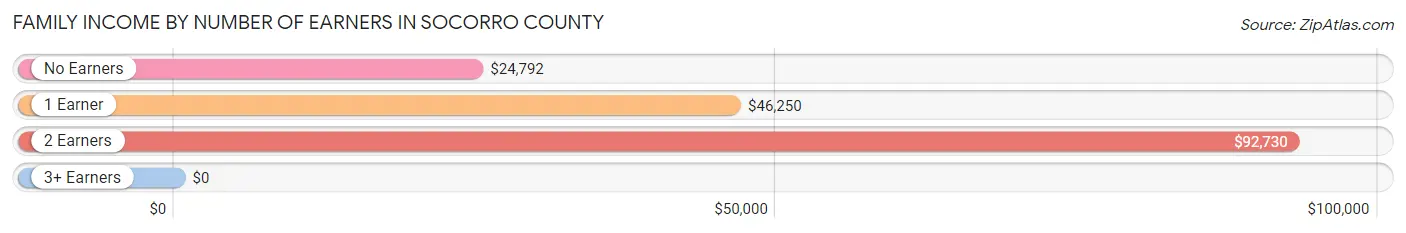
| Number of Earners | # Families | Median Income |
| No Earners | 925 (29.9%) | $24,792 |
| 1 Earner | 1,070 (34.6%) | $46,250 |
| 2 Earners | 981 (31.7%) | $92,730 |
| 3+ Earners | 115 (3.7%) | $0 |
| Total | 3,091 (100.0%) | $51,789 |
Household Income in Socorro County
Household Income Brackets in Socorro County
With 723 households falling in the category, the $50,000 to $74,999 income range is the most frequent in Socorro County, accounting for 14.6% of all households. In contrast, only 168 households (3.4%) fall into the $200,000+ income bracket, making it the least populous group.
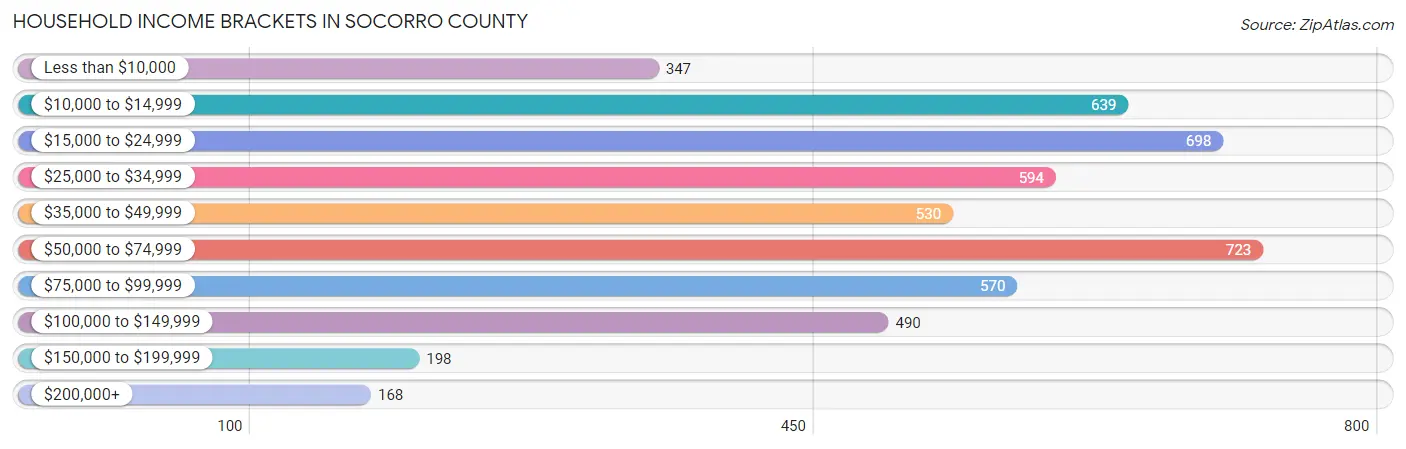
| Income Bracket | # Households | % Households |
| Less than $10,000 | 347 | 7.0% |
| $10,000 to $14,999 | 639 | 12.9% |
| $15,000 to $24,999 | 698 | 14.1% |
| $25,000 to $34,999 | 594 | 12.0% |
| $35,000 to $49,999 | 530 | 10.7% |
| $50,000 to $74,999 | 723 | 14.6% |
| $75,000 to $99,999 | 570 | 11.5% |
| $100,000 to $149,999 | 490 | 9.9% |
| $150,000 to $199,999 | 198 | 4.0% |
| $200,000+ | 168 | 3.4% |
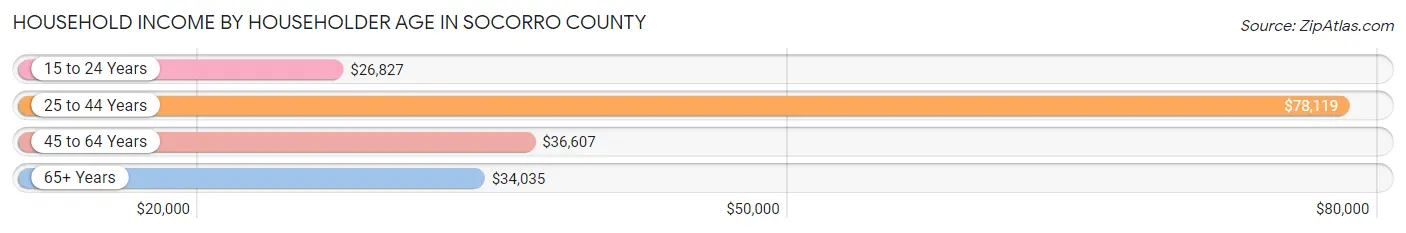
Household Income by Householder Age in Socorro County
The median household income in Socorro County is $40,699, with the highest median household income of $78,119 found in the 25 to 44 years age bracket for the primary householder. A total of 1,017 households (20.5%) fall into this category. Meanwhile, the 15 to 24 years age bracket for the primary householder has the lowest median household income of $26,827, with 129 households (2.6%) in this group.
| Income Bracket | # Households | Median Income |
| 15 to 24 Years | 129 (2.6%) | $26,827 |
| 25 to 44 Years | 1,017 (20.5%) | $78,119 |
| 45 to 64 Years | 2,019 (40.8%) | $36,607 |
| 65+ Years | 1,788 (36.1%) | $34,035 |
| Total | 4,953 (100.0%) | $40,699 |
Poverty in Socorro County
Income Below Poverty by Sex and Age in Socorro County
With 31.8% poverty level for males and 29.2% for females among the residents of Socorro County, 5 year old males and under 5 year old females are the most vulnerable to poverty, with 128 males (83.1%) and 235 females (61.7%) in their respective age groups living below the poverty level.
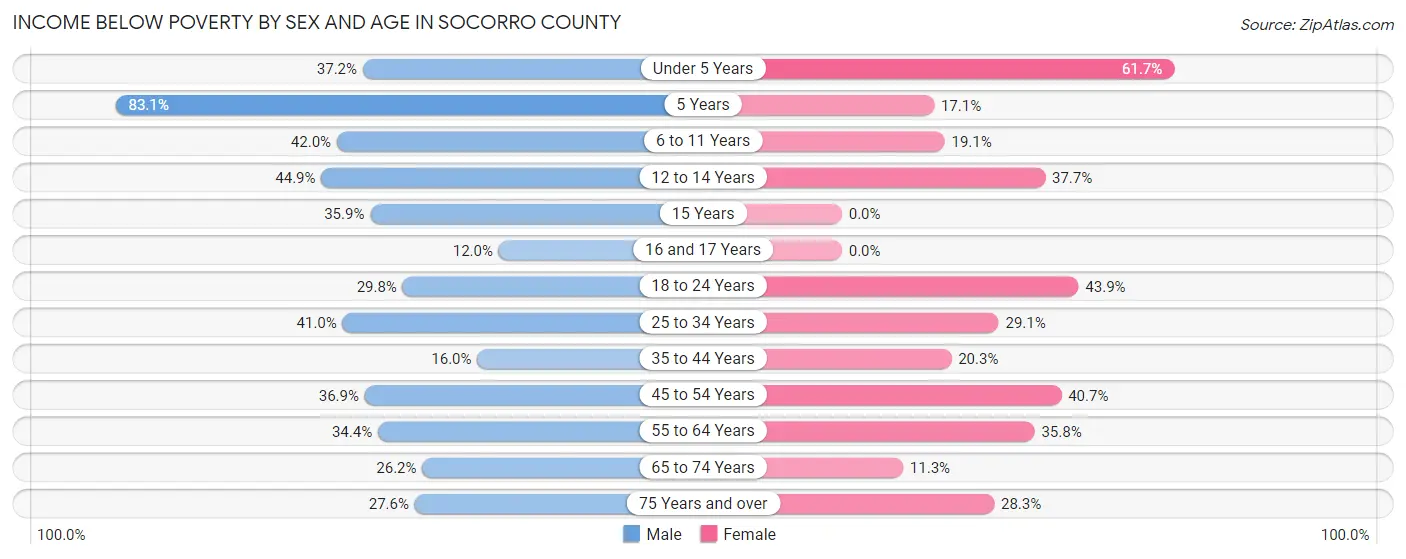
| Age Bracket | Male | Female |
| Under 5 Years | 160 (37.2%) | 235 (61.7%) |
| 5 Years | 128 (83.1%) | 32 (17.1%) |
| 6 to 11 Years | 290 (42.0%) | 144 (19.1%) |
| 12 to 14 Years | 84 (44.9%) | 83 (37.7%) |
| 15 Years | 19 (35.8%) | 0 (0.0%) |
| 16 and 17 Years | 23 (12.0%) | 0 (0.0%) |
| 18 to 24 Years | 328 (29.8%) | 278 (43.9%) |
| 25 to 34 Years | 227 (41.0%) | 231 (29.1%) |
| 35 to 44 Years | 181 (16.0%) | 170 (20.3%) |
| 45 to 54 Years | 339 (36.8%) | 391 (40.7%) |
| 55 to 64 Years | 351 (34.4%) | 387 (35.8%) |
| 65 to 74 Years | 263 (26.2%) | 114 (11.3%) |
| 75 Years and over | 161 (27.6%) | 193 (28.3%) |
| Total | 2,554 (31.8%) | 2,258 (29.2%) |
Income Above Poverty by Sex and Age in Socorro County
According to the poverty statistics in Socorro County, males aged 16 and 17 years and females aged 15 years are the age groups that are most secure financially, with 88.0% of males and 100.0% of females in these age groups living above the poverty line.
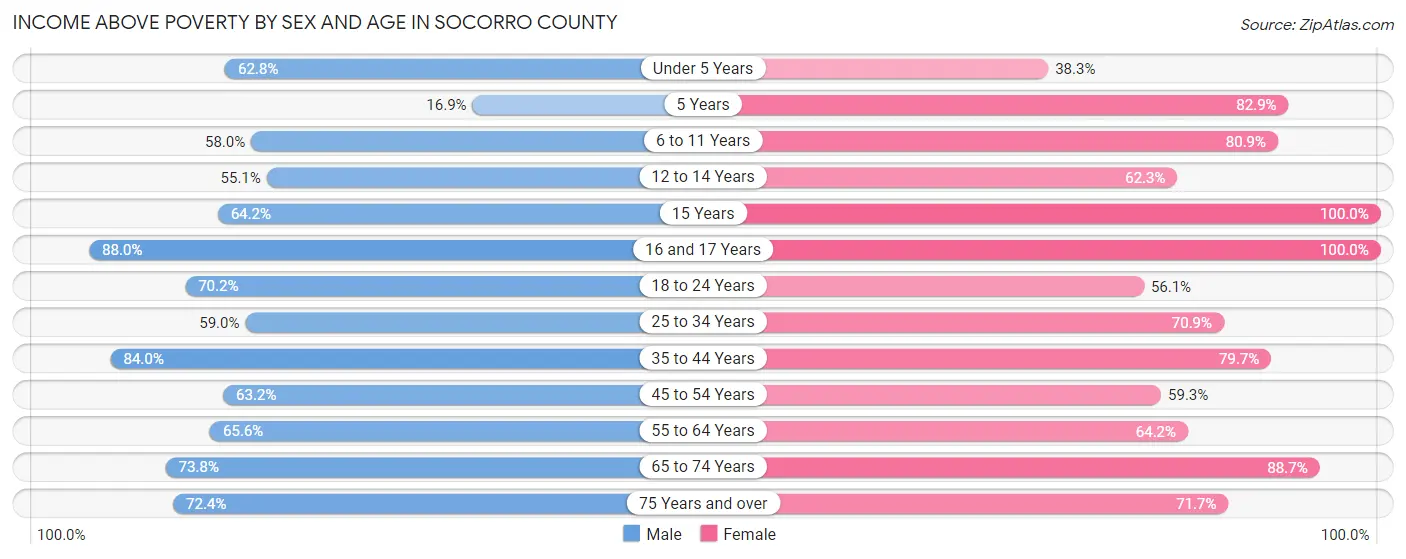
| Age Bracket | Male | Female |
| Under 5 Years | 270 (62.8%) | 146 (38.3%) |
| 5 Years | 26 (16.9%) | 155 (82.9%) |
| 6 to 11 Years | 400 (58.0%) | 611 (80.9%) |
| 12 to 14 Years | 103 (55.1%) | 137 (62.3%) |
| 15 Years | 34 (64.1%) | 129 (100.0%) |
| 16 and 17 Years | 169 (88.0%) | 70 (100.0%) |
| 18 to 24 Years | 772 (70.2%) | 355 (56.1%) |
| 25 to 34 Years | 327 (59.0%) | 563 (70.9%) |
| 35 to 44 Years | 953 (84.0%) | 667 (79.7%) |
| 45 to 54 Years | 581 (63.1%) | 569 (59.3%) |
| 55 to 64 Years | 669 (65.6%) | 695 (64.2%) |
| 65 to 74 Years | 742 (73.8%) | 891 (88.7%) |
| 75 Years and over | 423 (72.4%) | 490 (71.7%) |
| Total | 5,469 (68.2%) | 5,478 (70.8%) |
Income Below Poverty Among Married-Couple Families in Socorro County
The poverty statistics for married-couple families in Socorro County show that 14.5% or 322 of the total 2,225 families live below the poverty line. Families with 5 or more children have the highest poverty rate of 100.0%, comprising of 18 families. On the other hand, families with 1 or 2 children have the lowest poverty rate of 4.4%, which includes 26 families.
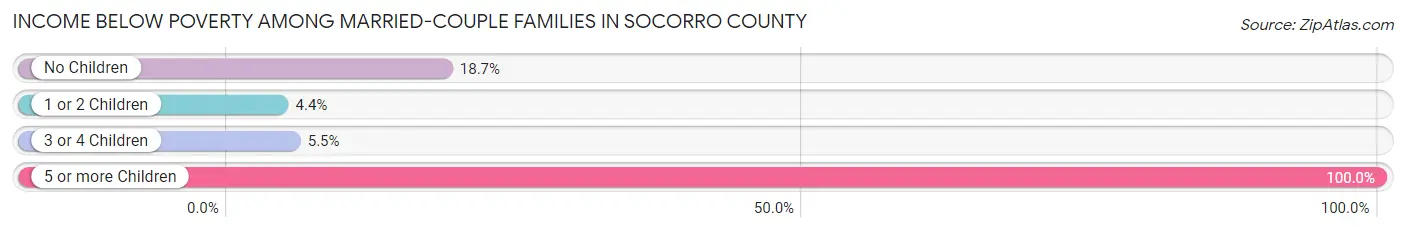
| Children | Above Poverty | Below Poverty |
| No Children | 1,165 (81.3%) | 268 (18.7%) |
| 1 or 2 Children | 565 (95.6%) | 26 (4.4%) |
| 3 or 4 Children | 173 (94.5%) | 10 (5.5%) |
| 5 or more Children | 0 (0.0%) | 18 (100.0%) |
| Total | 1,903 (85.5%) | 322 (14.5%) |
Income Below Poverty Among Single-Parent Households in Socorro County
According to the poverty data in Socorro County, 48.5% or 184 single-father households and 30.0% or 146 single-mother households are living below the poverty line. Among single-father households, those with 5 or more children have the highest poverty rate, with 68 households (100.0%) experiencing poverty. Likewise, among single-mother households, those with 3 or 4 children have the highest poverty rate, with 47 households (35.6%) falling below the poverty line.
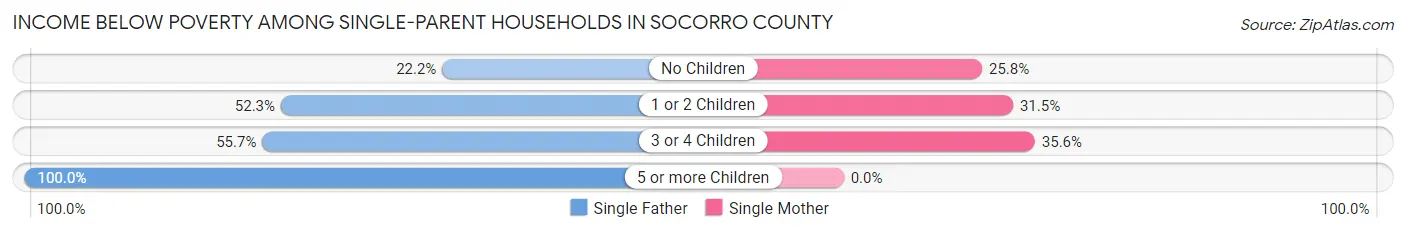
| Children | Single Father | Single Mother |
| No Children | 36 (22.2%) | 58 (25.8%) |
| 1 or 2 Children | 46 (52.3%) | 41 (31.5%) |
| 3 or 4 Children | 34 (55.7%) | 47 (35.6%) |
| 5 or more Children | 68 (100.0%) | 0 (0.0%) |
| Total | 184 (48.5%) | 146 (30.0%) |
Income Below Poverty Among Married-Couple vs Single-Parent Households in Socorro County
The poverty data for Socorro County shows that 322 of the married-couple family households (14.5%) and 330 of the single-parent households (38.1%) are living below the poverty level. Within the married-couple family households, those with 5 or more children have the highest poverty rate, with 18 households (100.0%) falling below the poverty line. Among the single-parent households, those with 5 or more children have the highest poverty rate, with 68 household (100.0%) living below poverty.
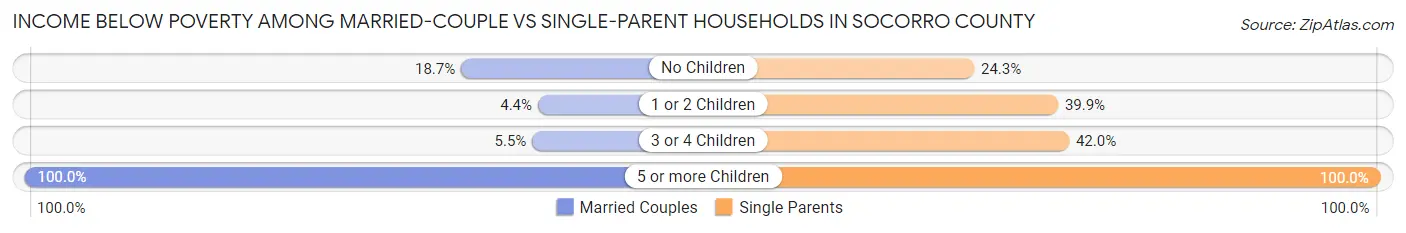
| Children | Married-Couple Families | Single-Parent Households |
| No Children | 268 (18.7%) | 94 (24.3%) |
| 1 or 2 Children | 26 (4.4%) | 87 (39.9%) |
| 3 or 4 Children | 10 (5.5%) | 81 (42.0%) |
| 5 or more Children | 18 (100.0%) | 68 (100.0%) |
| Total | 322 (14.5%) | 330 (38.1%) |
Race in Socorro County
The most populous races in Socorro County are White / Caucasian (10,072 | 61.2%), Hispanic or Latino (8,278 | 50.3%), and Two or more Races (3,196 | 19.4%).
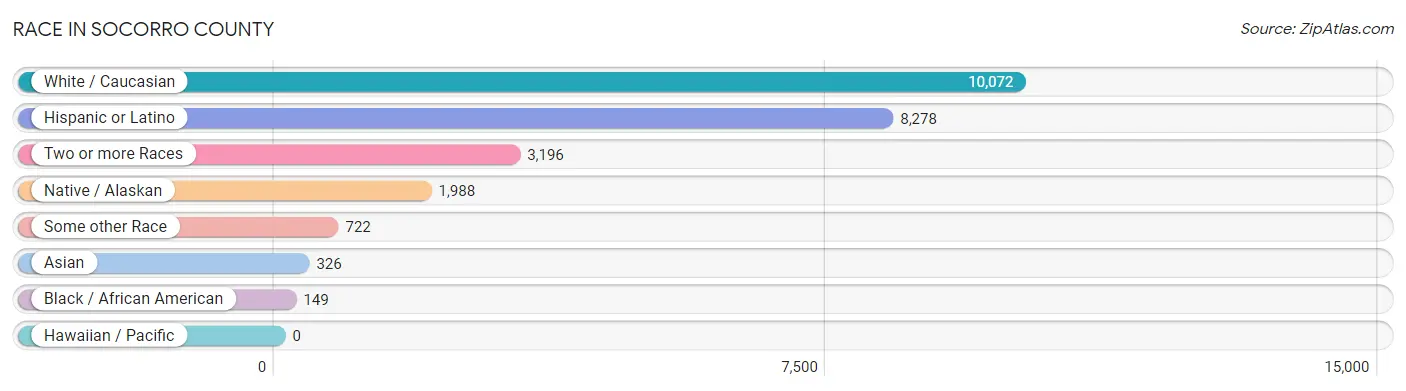
| Race | # Population | % Population |
| Asian | 326 | 2.0% |
| Black / African American | 149 | 0.9% |
| Hawaiian / Pacific | 0 | 0.0% |
| Hispanic or Latino | 8,278 | 50.3% |
| Native / Alaskan | 1,988 | 12.1% |
| White / Caucasian | 10,072 | 61.2% |
| Two or more Races | 3,196 | 19.4% |
| Some other Race | 722 | 4.4% |
| Total | 16,453 | 100.0% |
Ancestry in Socorro County
The most populous ancestries reported in Socorro County are American (2,614 | 15.9%), Mexican (2,410 | 14.6%), Navajo (1,860 | 11.3%), German (1,153 | 7.0%), and English (911 | 5.5%), together accounting for 54.4% of all Socorro County residents.
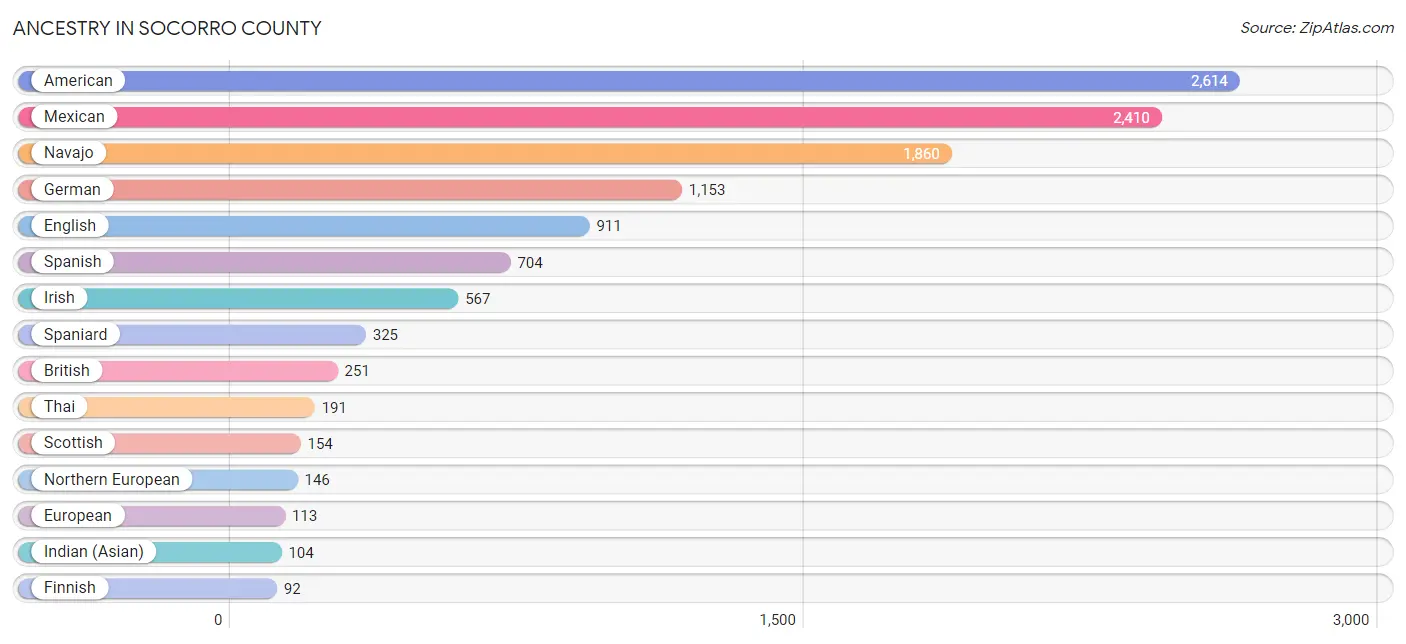
| Ancestry | # Population | % Population |
| American | 2,614 | 15.9% |
| Apache | 6 | 0.0% |
| Arab | 11 | 0.1% |
| Australian | 11 | 0.1% |
| Basque | 6 | 0.0% |
| Bhutanese | 18 | 0.1% |
| Brazilian | 23 | 0.1% |
| British | 251 | 1.5% |
| Burmese | 24 | 0.2% |
| Canadian | 23 | 0.1% |
| Cherokee | 7 | 0.0% |
| Choctaw | 64 | 0.4% |
| Colombian | 35 | 0.2% |
| Croatian | 6 | 0.0% |
| Cuban | 6 | 0.0% |
| Czechoslovakian | 67 | 0.4% |
| Danish | 18 | 0.1% |
| Dutch | 31 | 0.2% |
| Eastern European | 49 | 0.3% |
| English | 911 | 5.5% |
| European | 113 | 0.7% |
| Finnish | 92 | 0.6% |
| French | 73 | 0.4% |
| French Canadian | 11 | 0.1% |
| German | 1,153 | 7.0% |
| Hungarian | 6 | 0.0% |
| Indian (Asian) | 104 | 0.6% |
| Iranian | 7 | 0.0% |
| Irish | 567 | 3.5% |
| Italian | 85 | 0.5% |
| Lithuanian | 10 | 0.1% |
| Mexican | 2,410 | 14.6% |
| Moroccan | 11 | 0.1% |
| Navajo | 1,860 | 11.3% |
| Northern European | 146 | 0.9% |
| Norwegian | 73 | 0.4% |
| Polish | 29 | 0.2% |
| Portuguese | 15 | 0.1% |
| Pueblo | 53 | 0.3% |
| Puerto Rican | 67 | 0.4% |
| Romanian | 38 | 0.2% |
| Russian | 38 | 0.2% |
| Scandinavian | 18 | 0.1% |
| Scotch-Irish | 32 | 0.2% |
| Scottish | 154 | 0.9% |
| Slovak | 5 | 0.0% |
| South American | 35 | 0.2% |
| Spaniard | 325 | 2.0% |
| Spanish | 704 | 4.3% |
| Sri Lankan | 53 | 0.3% |
| Swedish | 53 | 0.3% |
| Swiss | 14 | 0.1% |
| Thai | 191 | 1.2% |
| Turkish | 9 | 0.1% |
| Welsh | 60 | 0.4% | View All 55 Rows |
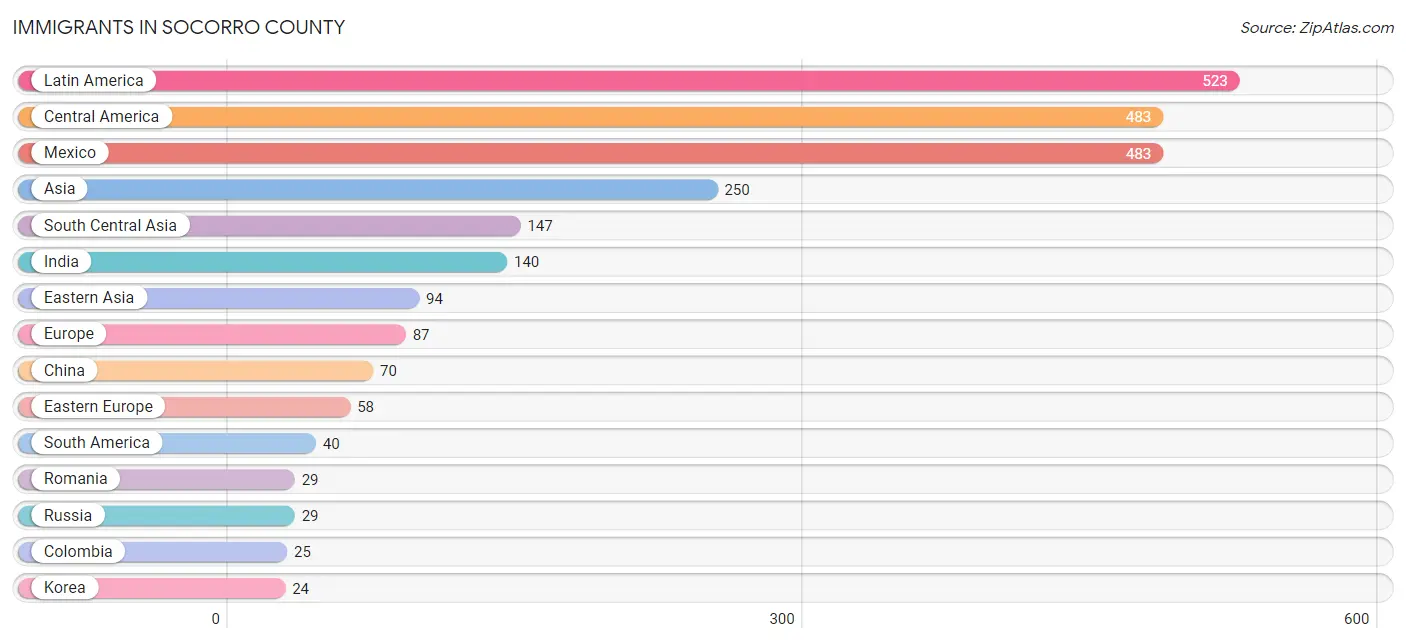
Immigrants in Socorro County
The most numerous immigrant groups reported in Socorro County came from Latin America (523 | 3.2%), Central America (483 | 2.9%), Mexico (483 | 2.9%), Asia (250 | 1.5%), and South Central Asia (147 | 0.9%), together accounting for 11.5% of all Socorro County residents.
| Immigration Origin | # Population | % Population |
| Africa | 17 | 0.1% |
| Asia | 250 | 1.5% |
| Australia | 11 | 0.1% |
| Brazil | 15 | 0.1% |
| Canada | 16 | 0.1% |
| Central America | 483 | 2.9% |
| China | 70 | 0.4% |
| Colombia | 25 | 0.2% |
| Eastern Africa | 6 | 0.0% |
| Eastern Asia | 94 | 0.6% |
| Eastern Europe | 58 | 0.4% |
| England | 7 | 0.0% |
| Europe | 87 | 0.5% |
| France | 14 | 0.1% |
| Germany | 8 | 0.1% |
| India | 140 | 0.9% |
| Iran | 7 | 0.0% |
| Korea | 24 | 0.2% |
| Latin America | 523 | 3.2% |
| Mexico | 483 | 2.9% |
| Morocco | 11 | 0.1% |
| Northern Africa | 11 | 0.1% |
| Northern Europe | 7 | 0.0% |
| Oceania | 11 | 0.1% |
| Romania | 29 | 0.2% |
| Russia | 29 | 0.2% |
| South America | 40 | 0.2% |
| South Central Asia | 147 | 0.9% |
| Taiwan | 6 | 0.0% |
| Turkey | 9 | 0.1% |
| Western Asia | 9 | 0.1% |
| Western Europe | 22 | 0.1% |
| Zimbabwe | 6 | 0.0% | View All 33 Rows |
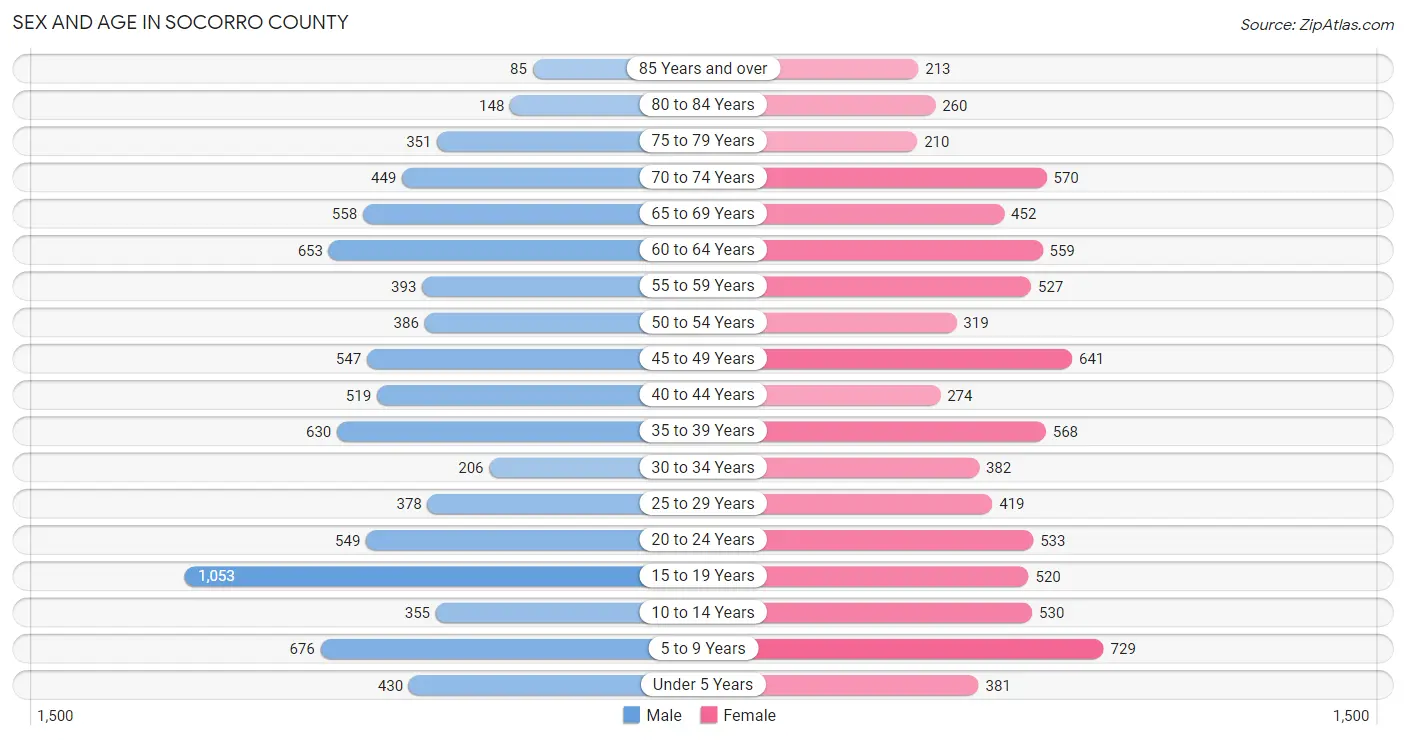
Sex and Age in Socorro County
Sex and Age in Socorro County
The most populous age groups in Socorro County are 15 to 19 Years (1,053 | 12.6%) for men and 5 to 9 Years (729 | 9.0%) for women.
| Age Bracket | Male | Female |
| Under 5 Years | 430 (5.1%) | 381 (4.7%) |
| 5 to 9 Years | 676 (8.1%) | 729 (9.0%) |
| 10 to 14 Years | 355 (4.2%) | 530 (6.6%) |
| 15 to 19 Years | 1,053 (12.6%) | 520 (6.4%) |
| 20 to 24 Years | 549 (6.6%) | 533 (6.6%) |
| 25 to 29 Years | 378 (4.5%) | 419 (5.2%) |
| 30 to 34 Years | 206 (2.5%) | 382 (4.7%) |
| 35 to 39 Years | 630 (7.5%) | 568 (7.0%) |
| 40 to 44 Years | 519 (6.2%) | 274 (3.4%) |
| 45 to 49 Years | 547 (6.5%) | 641 (7.9%) |
| 50 to 54 Years | 386 (4.6%) | 319 (3.9%) |
| 55 to 59 Years | 393 (4.7%) | 527 (6.5%) |
| 60 to 64 Years | 653 (7.8%) | 559 (6.9%) |
| 65 to 69 Years | 558 (6.7%) | 452 (5.6%) |
| 70 to 74 Years | 449 (5.4%) | 570 (7.0%) |
| 75 to 79 Years | 351 (4.2%) | 210 (2.6%) |
| 80 to 84 Years | 148 (1.8%) | 260 (3.2%) |
| 85 Years and over | 85 (1.0%) | 213 (2.6%) |
| Total | 8,366 (100.0%) | 8,087 (100.0%) |
Families and Households in Socorro County
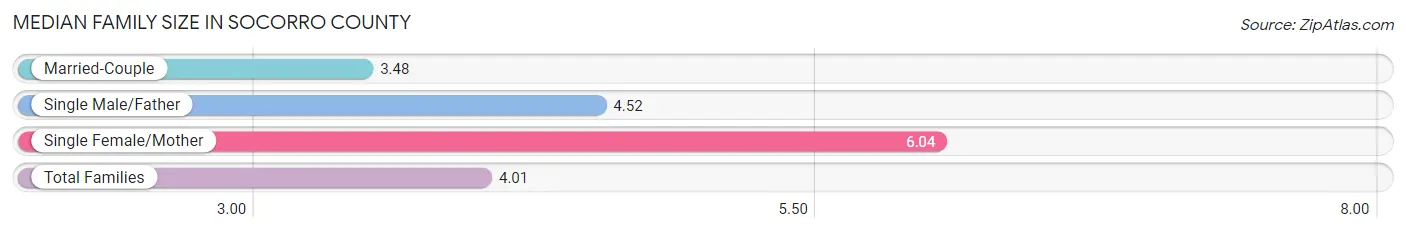
Median Family Size in Socorro County
The median family size in Socorro County is 4.01 persons per family, with single female/mother families (487 | 15.8%) accounting for the largest median family size of 6.04 persons per family. On the other hand, married-couple families (2,225 | 72.0%) represent the smallest median family size with 3.48 persons per family.
| Family Type | # Families | Family Size |
| Married-Couple | 2,225 (72.0%) | 3.48 |
| Single Male/Father | 379 (12.3%) | 4.52 |
| Single Female/Mother | 487 (15.8%) | 6.04 |
| Total Families | 3,091 (100.0%) | 4.01 |
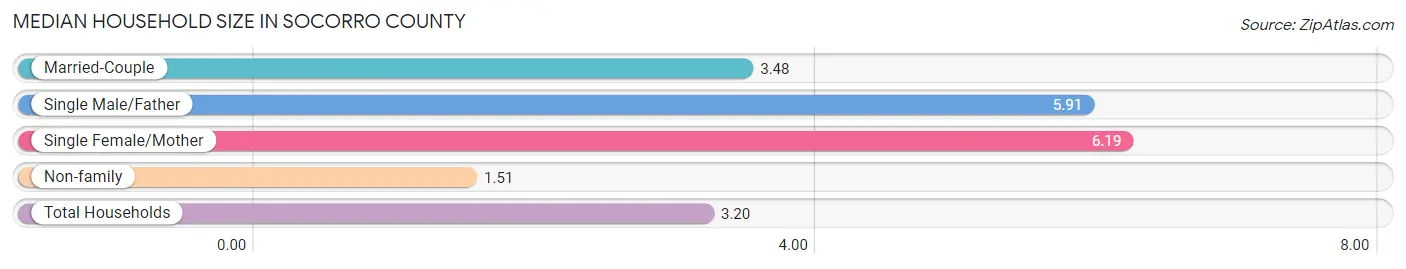
Median Household Size in Socorro County
The median household size in Socorro County is 3.20 persons per household, with single female/mother households (487 | 9.8%) accounting for the largest median household size of 6.19 persons per household. non-family households (1,862 | 37.6%) represent the smallest median household size with 1.51 persons per household.
| Household Type | # Households | Household Size |
| Married-Couple | 2,225 (44.9%) | 3.48 |
| Single Male/Father | 379 (7.6%) | 5.91 |
| Single Female/Mother | 487 (9.8%) | 6.19 |
| Non-family | 1,862 (37.6%) | 1.51 |
| Total Households | 4,953 (100.0%) | 3.20 |
Household Size by Marriage Status in Socorro County
Out of a total of 4,953 households in Socorro County, 3,091 (62.4%) are family households, while 1,862 (37.6%) are nonfamily households. The most numerous type of family households are 2-person households, comprising 1,619, and the most common type of nonfamily households are 1-person households, comprising 1,560.
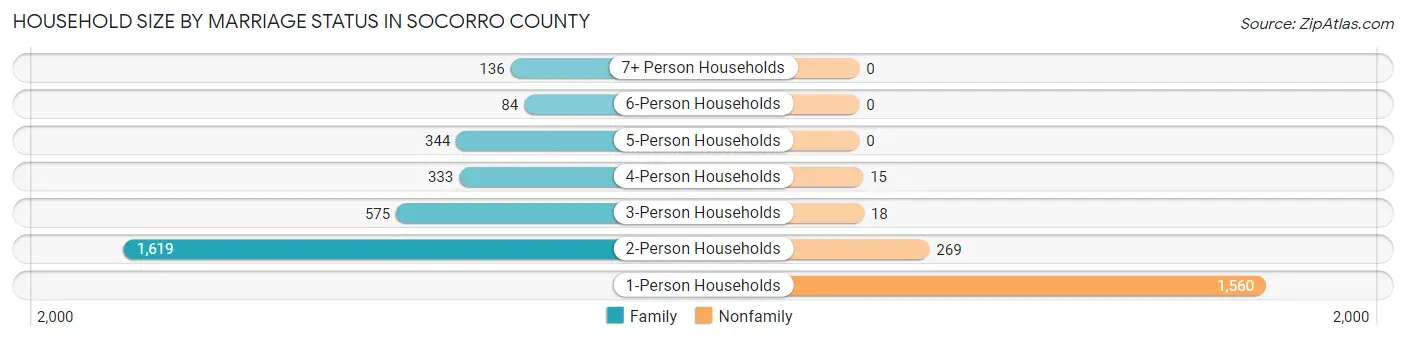
| Household Size | Family Households | Nonfamily Households |
| 1-Person Households | - | 1,560 (31.5%) |
| 2-Person Households | 1,619 (32.7%) | 269 (5.4%) |
| 3-Person Households | 575 (11.6%) | 18 (0.4%) |
| 4-Person Households | 333 (6.7%) | 15 (0.3%) |
| 5-Person Households | 344 (7.0%) | 0 (0.0%) |
| 6-Person Households | 84 (1.7%) | 0 (0.0%) |
| 7+ Person Households | 136 (2.8%) | 0 (0.0%) |
| Total | 3,091 (62.4%) | 1,862 (37.6%) |
Female Fertility in Socorro County
Fertility by Age in Socorro County
Average fertility rate in Socorro County is 61.0 births per 1,000 women. Women in the age bracket of 35 to 50 years have the highest fertility rate with 93.0 births per 1,000 women. Women in the age bracket of 35 to 50 years acount for 69.1% of all women with births.
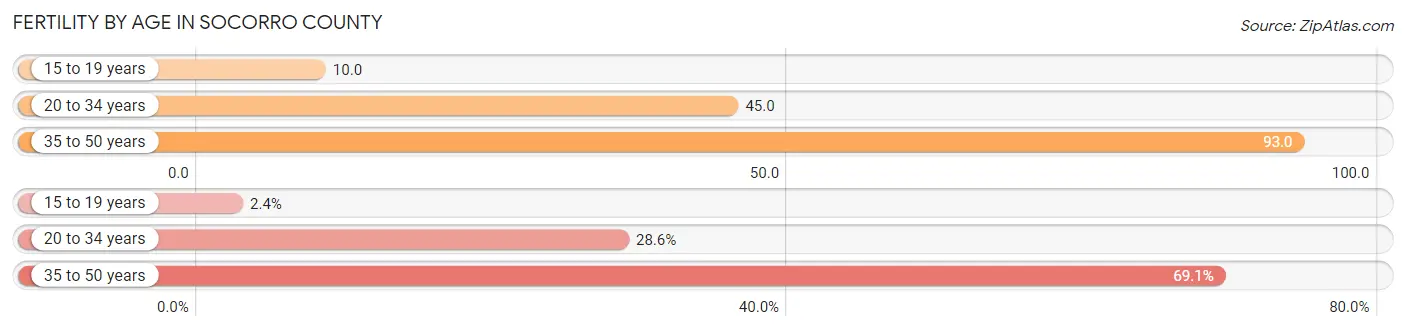
| Age Bracket | Women with Births | Births / 1,000 Women |
| 15 to 19 years | 5 (2.4%) | 10.0 |
| 20 to 34 years | 60 (28.6%) | 45.0 |
| 35 to 50 years | 145 (69.1%) | 93.0 |
| Total | 210 (100.0%) | 61.0 |
Fertility by Age by Marriage Status in Socorro County
71.9% of women with births (210) in Socorro County are married. The highest percentage of unmarried women with births falls into 15 to 19 years age bracket with 100.0% of them unmarried at the time of birth, while the lowest percentage of unmarried women with births belong to 35 to 50 years age bracket with 9.0% of them unmarried.
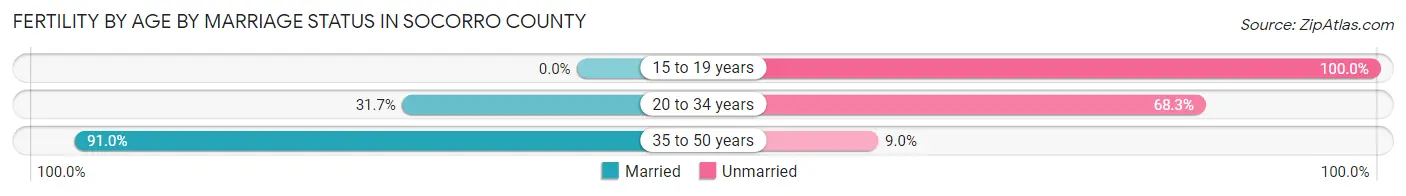
| Age Bracket | Married | Unmarried |
| 15 to 19 years | 0 (0.0%) | 5 (100.0%) |
| 20 to 34 years | 19 (31.7%) | 41 (68.3%) |
| 35 to 50 years | 132 (91.0%) | 13 (9.0%) |
| Total | 151 (71.9%) | 59 (28.1%) |
Fertility by Education in Socorro County
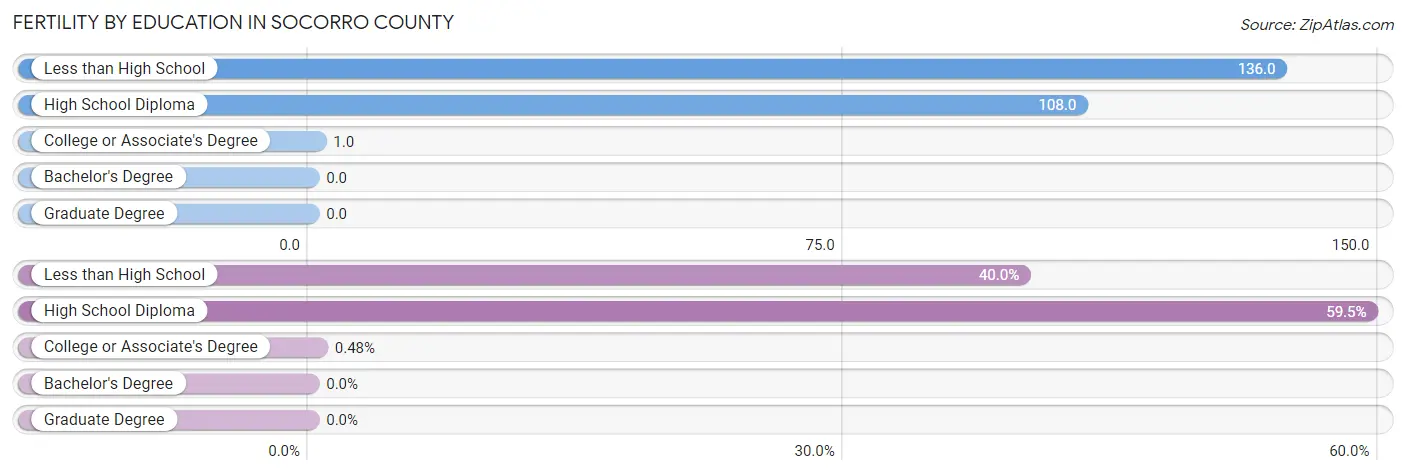
| Educational Attainment | Women with Births | Births / 1,000 Women |
| Less than High School | 84 (40.0%) | 136.0 |
| High School Diploma | 125 (59.5%) | 108.0 |
| College or Associate's Degree | 1 (0.5%) | 1.0 |
| Bachelor's Degree | 0 (0.0%) | 0.0 |
| Graduate Degree | 0 (0.0%) | 0.0 |
| Total | 210 (100.0%) | 61.0 |
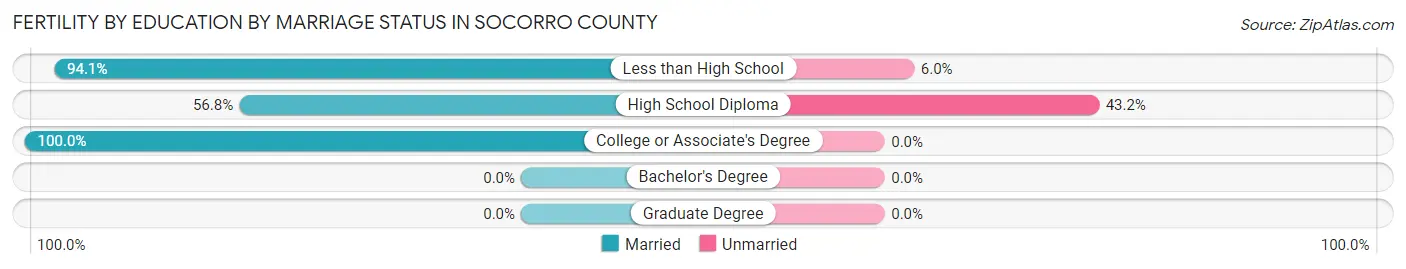
Fertility by Education by Marriage Status in Socorro County
28.1% of women with births in Socorro County are unmarried. Women with the educational attainment of college or associate's degree are most likely to be married with 100.0% of them married at childbirth, while women with the educational attainment of high school diploma are least likely to be married with 43.2% of them unmarried at childbirth.
| Educational Attainment | Married | Unmarried |
| Less than High School | 79 (94.1%) | 5 (5.9%) |
| High School Diploma | 71 (56.8%) | 54 (43.2%) |
| College or Associate's Degree | 1 (100.0%) | 0 (0.0%) |
| Bachelor's Degree | 0 (0.0%) | 0 (0.0%) |
| Graduate Degree | 0 (0.0%) | 0 (0.0%) |
| Total | 151 (71.9%) | 59 (28.1%) |
Employment Characteristics in Socorro County
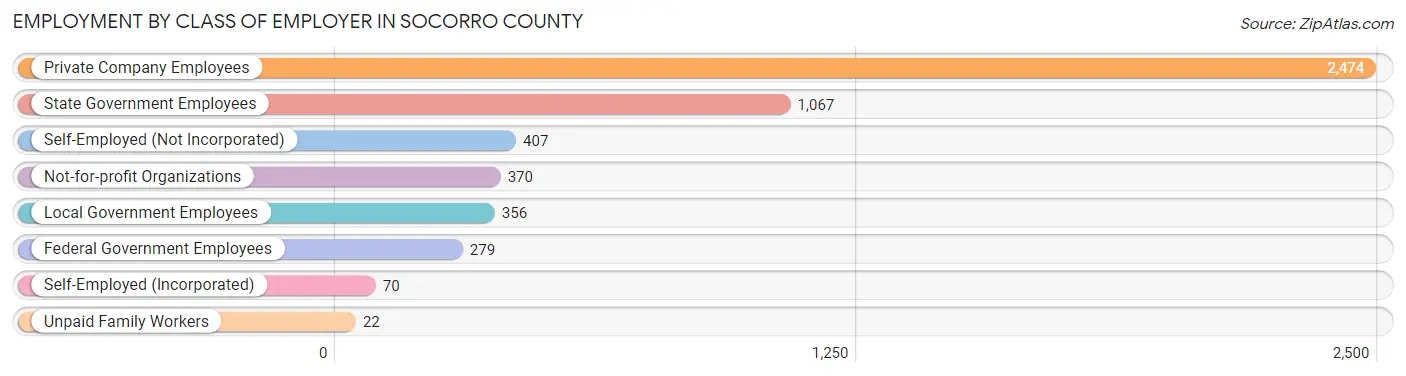
Employment by Class of Employer in Socorro County
Among the 5,045 employed individuals in Socorro County, private company employees (2,474 | 49.0%), state government employees (1,067 | 21.1%), and self-employed (not incorporated) (407 | 8.1%) make up the most common classes of employment.
| Employer Class | # Employees | % Employees |
| Private Company Employees | 2,474 | 49.0% |
| Self-Employed (Incorporated) | 70 | 1.4% |
| Self-Employed (Not Incorporated) | 407 | 8.1% |
| Not-for-profit Organizations | 370 | 7.3% |
| Local Government Employees | 356 | 7.1% |
| State Government Employees | 1,067 | 21.1% |
| Federal Government Employees | 279 | 5.5% |
| Unpaid Family Workers | 22 | 0.4% |
| Total | 5,045 | 100.0% |
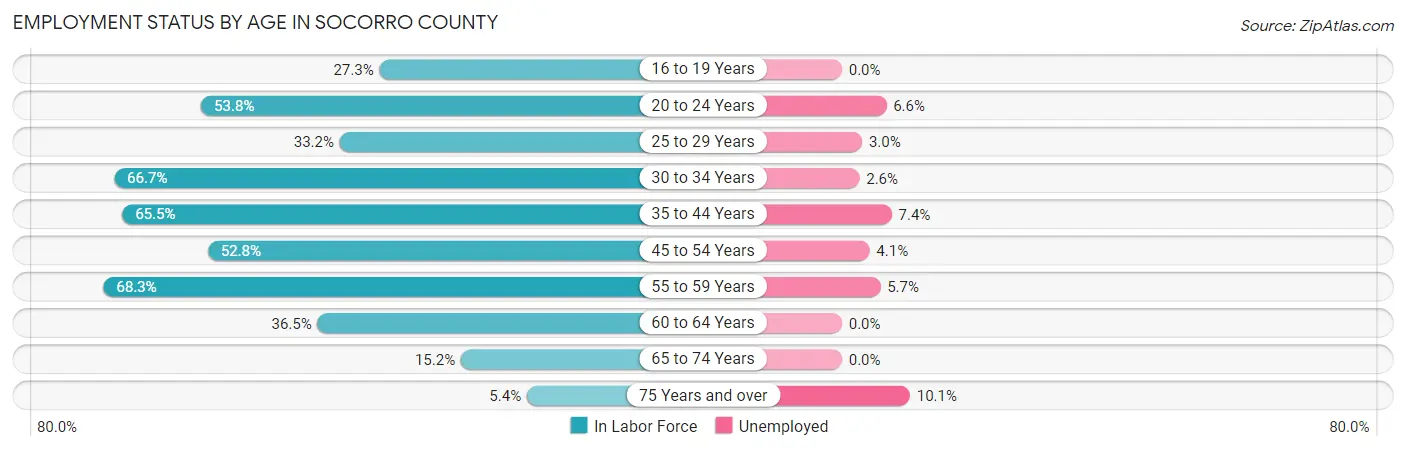
Employment Status by Age in Socorro County
According to the labor force statistics for Socorro County, out of the total population over 16 years of age (13,170), 40.8% or 5,373 individuals are in the labor force, with 4.4% or 236 of them unemployed. The age group with the highest labor force participation rate is 55 to 59 years, with 68.3% or 628 individuals in the labor force. Within the labor force, the 75 years and over age range has the highest percentage of unemployed individuals, with 10.1% or 7 of them being unemployed.
| Age Bracket | In Labor Force | Unemployed |
| 16 to 19 Years | 380 (27.3%) | 0 (0.0%) |
| 20 to 24 Years | 582 (53.8%) | 38 (6.6%) |
| 25 to 29 Years | 265 (33.2%) | 8 (3.0%) |
| 30 to 34 Years | 392 (66.7%) | 10 (2.6%) |
| 35 to 44 Years | 1,304 (65.5%) | 96 (7.4%) |
| 45 to 54 Years | 1,000 (52.8%) | 41 (4.1%) |
| 55 to 59 Years | 628 (68.3%) | 36 (5.7%) |
| 60 to 64 Years | 442 (36.5%) | 0 (0.0%) |
| 65 to 74 Years | 308 (15.2%) | 0 (0.0%) |
| 75 Years and over | 68 (5.4%) | 7 (10.1%) |
| Total | 5,373 (40.8%) | 236 (4.4%) |
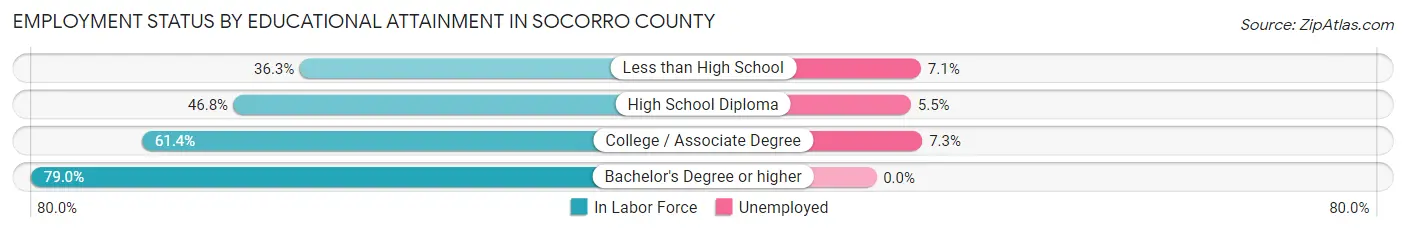
Employment Status by Educational Attainment in Socorro County
According to labor force statistics for Socorro County, 54.5% of individuals (4,034) out of the total population between 25 and 64 years of age (7,401) are in the labor force, with 4.8% or 194 of them being unemployed. The group with the highest labor force participation rate are those with the educational attainment of bachelor's degree or higher, with 79.0% or 995 individuals in the labor force. Within the labor force, individuals with college / associate degree education have the highest percentage of unemployment, with 7.3% or 80 of them being unemployed.
| Educational Attainment | In Labor Force | Unemployed |
| Less than High School | 339 (36.3%) | 66 (7.1%) |
| High School Diploma | 1,601 (46.8%) | 188 (5.5%) |
| College / Associate Degree | 1,097 (61.4%) | 130 (7.3%) |
| Bachelor's Degree or higher | 995 (79.0%) | 0 (0.0%) |
| Total | 4,034 (54.5%) | 355 (4.8%) |
Employment Occupations by Sex in Socorro County
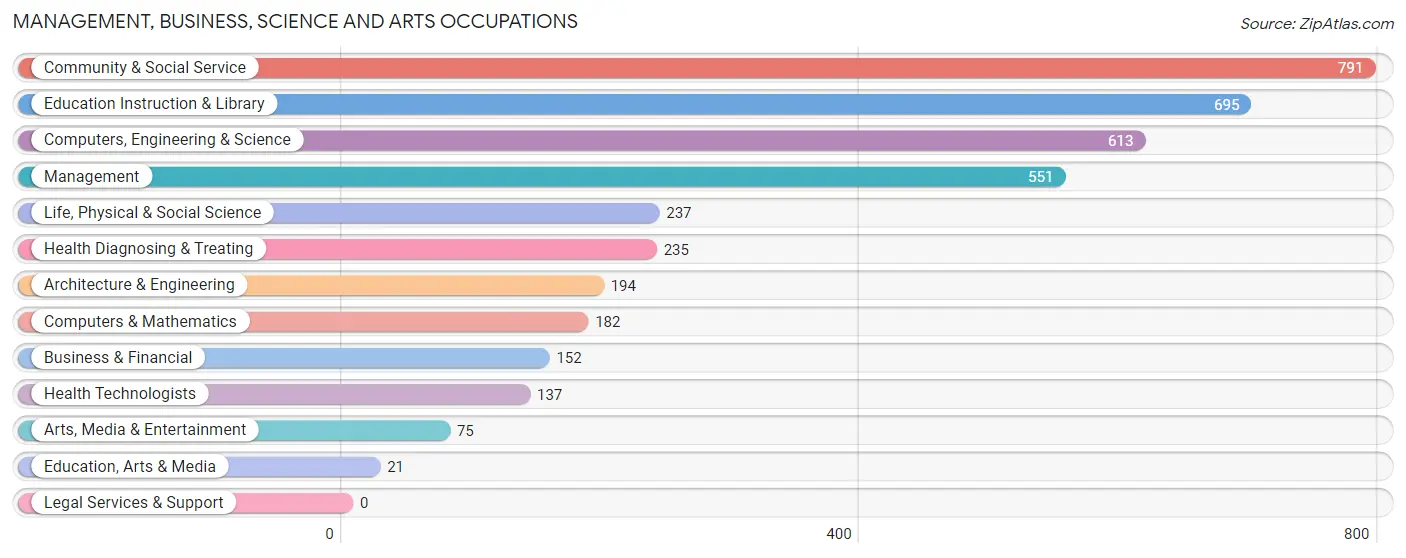
Management, Business, Science and Arts Occupations
The most common Management, Business, Science and Arts occupations in Socorro County are Community & Social Service (791 | 15.4%), Education Instruction & Library (695 | 13.6%), Computers, Engineering & Science (613 | 12.0%), Management (551 | 10.8%), and Life, Physical & Social Science (237 | 4.6%).
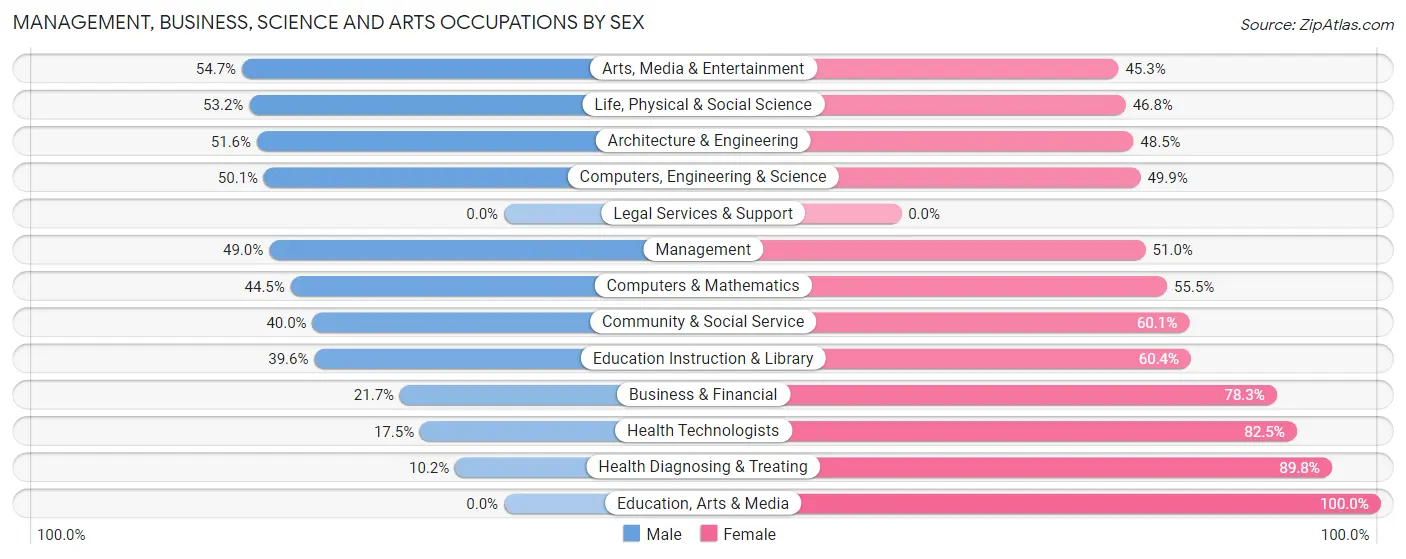
Management, Business, Science and Arts Occupations by Sex
Within the Management, Business, Science and Arts occupations in Socorro County, the most male-oriented occupations are Arts, Media & Entertainment (54.7%), Life, Physical & Social Science (53.2%), and Architecture & Engineering (51.5%), while the most female-oriented occupations are Education, Arts & Media (100.0%), Health Diagnosing & Treating (89.8%), and Health Technologists (82.5%).
| Occupation | Male | Female |
| Management | 270 (49.0%) | 281 (51.0%) |
| Business & Financial | 33 (21.7%) | 119 (78.3%) |
| Computers, Engineering & Science | 307 (50.1%) | 306 (49.9%) |
| Computers & Mathematics | 81 (44.5%) | 101 (55.5%) |
| Architecture & Engineering | 100 (51.5%) | 94 (48.4%) |
| Life, Physical & Social Science | 126 (53.2%) | 111 (46.8%) |
| Community & Social Service | 316 (40.0%) | 475 (60.1%) |
| Education, Arts & Media | 0 (0.0%) | 21 (100.0%) |
| Legal Services & Support | 0 (0.0%) | 0 (0.0%) |
| Education Instruction & Library | 275 (39.6%) | 420 (60.4%) |
| Arts, Media & Entertainment | 41 (54.7%) | 34 (45.3%) |
| Health Diagnosing & Treating | 24 (10.2%) | 211 (89.8%) |
| Health Technologists | 24 (17.5%) | 113 (82.5%) |
| Total (Category) | 950 (40.6%) | 1,392 (59.4%) |
| Total (Overall) | 2,631 (51.4%) | 2,488 (48.6%) |
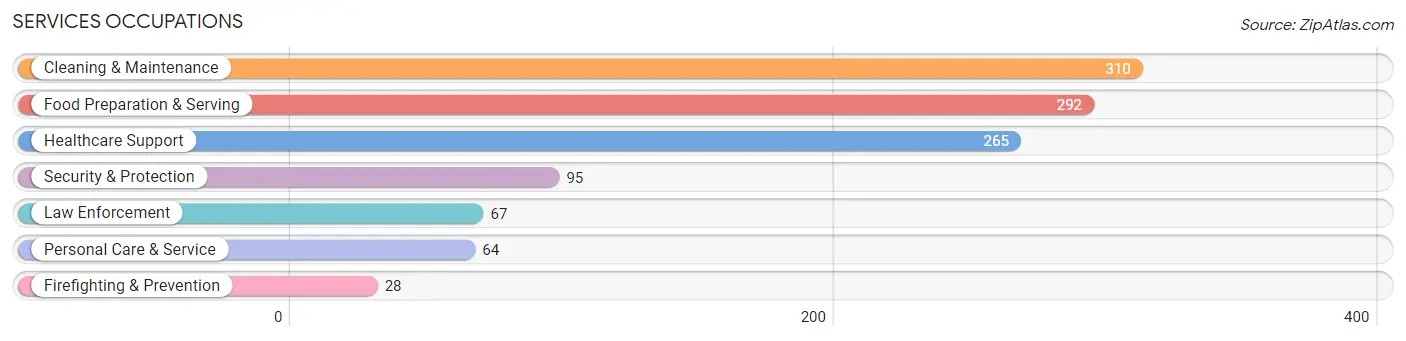
Services Occupations
The most common Services occupations in Socorro County are Cleaning & Maintenance (310 | 6.1%), Food Preparation & Serving (292 | 5.7%), Healthcare Support (265 | 5.2%), Security & Protection (95 | 1.9%), and Law Enforcement (67 | 1.3%).
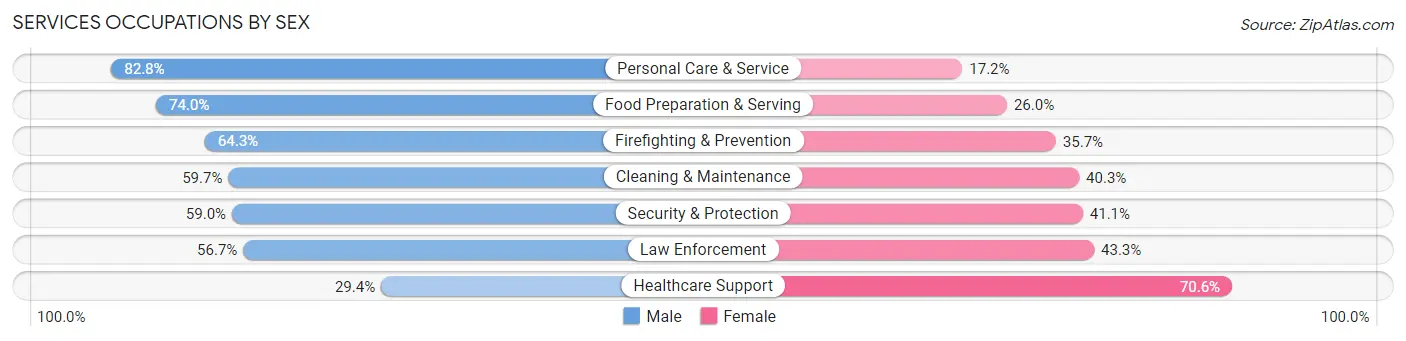
Services Occupations by Sex
Within the Services occupations in Socorro County, the most male-oriented occupations are Personal Care & Service (82.8%), Food Preparation & Serving (74.0%), and Firefighting & Prevention (64.3%), while the most female-oriented occupations are Healthcare Support (70.6%), Law Enforcement (43.3%), and Security & Protection (41.0%).
| Occupation | Male | Female |
| Healthcare Support | 78 (29.4%) | 187 (70.6%) |
| Security & Protection | 56 (59.0%) | 39 (41.0%) |
| Firefighting & Prevention | 18 (64.3%) | 10 (35.7%) |
| Law Enforcement | 38 (56.7%) | 29 (43.3%) |
| Food Preparation & Serving | 216 (74.0%) | 76 (26.0%) |
| Cleaning & Maintenance | 185 (59.7%) | 125 (40.3%) |
| Personal Care & Service | 53 (82.8%) | 11 (17.2%) |
| Total (Category) | 588 (57.3%) | 438 (42.7%) |
| Total (Overall) | 2,631 (51.4%) | 2,488 (48.6%) |
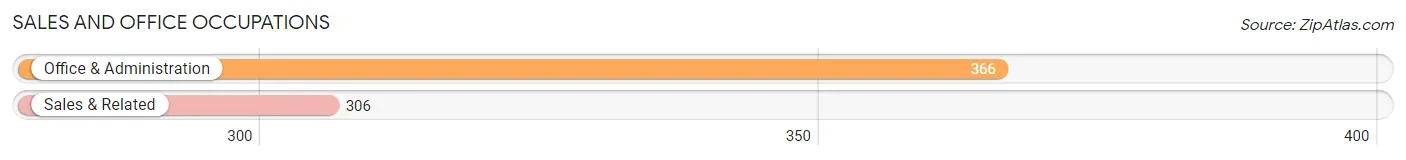
Sales and Office Occupations
The most common Sales and Office occupations in Socorro County are Office & Administration (366 | 7.1%), and Sales & Related (306 | 6.0%).
Sales and Office Occupations by Sex
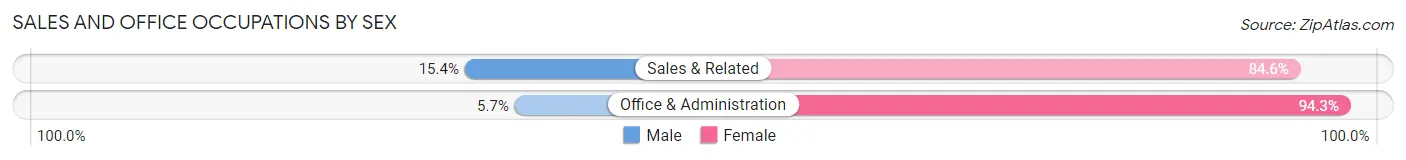
| Occupation | Male | Female |
| Sales & Related | 47 (15.4%) | 259 (84.6%) |
| Office & Administration | 21 (5.7%) | 345 (94.3%) |
| Total (Category) | 68 (10.1%) | 604 (89.9%) |
| Total (Overall) | 2,631 (51.4%) | 2,488 (48.6%) |
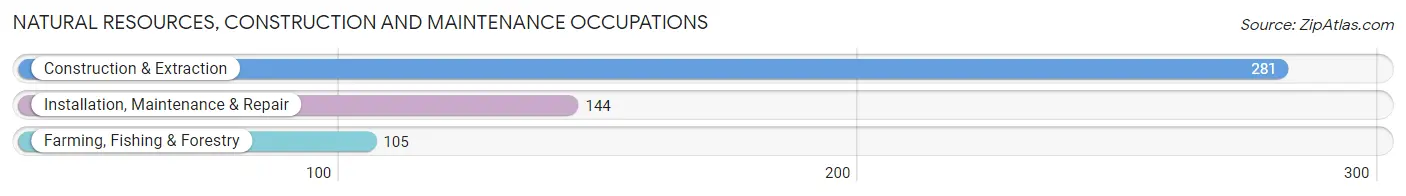
Natural Resources, Construction and Maintenance Occupations
The most common Natural Resources, Construction and Maintenance occupations in Socorro County are Construction & Extraction (281 | 5.5%), Installation, Maintenance & Repair (144 | 2.8%), and Farming, Fishing & Forestry (105 | 2.1%).
Natural Resources, Construction and Maintenance Occupations by Sex
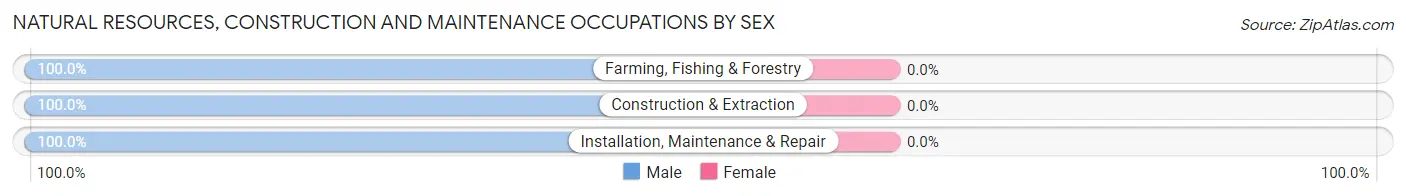
| Occupation | Male | Female |
| Farming, Fishing & Forestry | 105 (100.0%) | 0 (0.0%) |
| Construction & Extraction | 281 (100.0%) | 0 (0.0%) |
| Installation, Maintenance & Repair | 144 (100.0%) | 0 (0.0%) |
| Total (Category) | 530 (100.0%) | 0 (0.0%) |
| Total (Overall) | 2,631 (51.4%) | 2,488 (48.6%) |
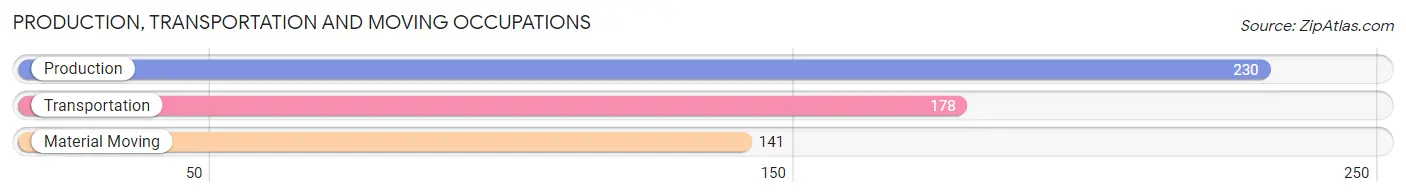
Production, Transportation and Moving Occupations
The most common Production, Transportation and Moving occupations in Socorro County are Production (230 | 4.5%), Transportation (178 | 3.5%), and Material Moving (141 | 2.8%).
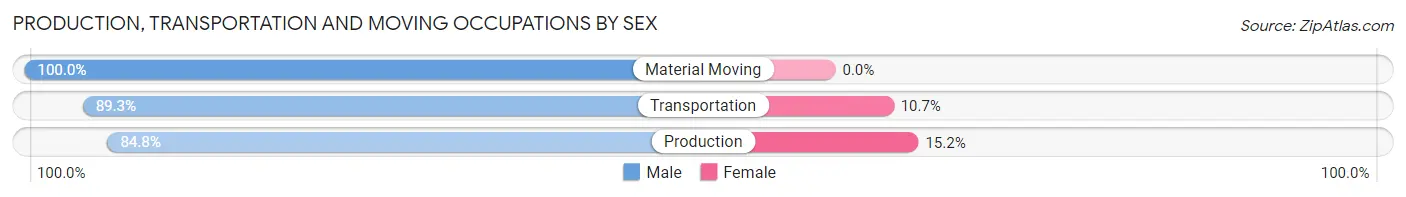
Production, Transportation and Moving Occupations by Sex
| Occupation | Male | Female |
| Production | 195 (84.8%) | 35 (15.2%) |
| Transportation | 159 (89.3%) | 19 (10.7%) |
| Material Moving | 141 (100.0%) | 0 (0.0%) |
| Total (Category) | 495 (90.2%) | 54 (9.8%) |
| Total (Overall) | 2,631 (51.4%) | 2,488 (48.6%) |
Employment Industries by Sex in Socorro County
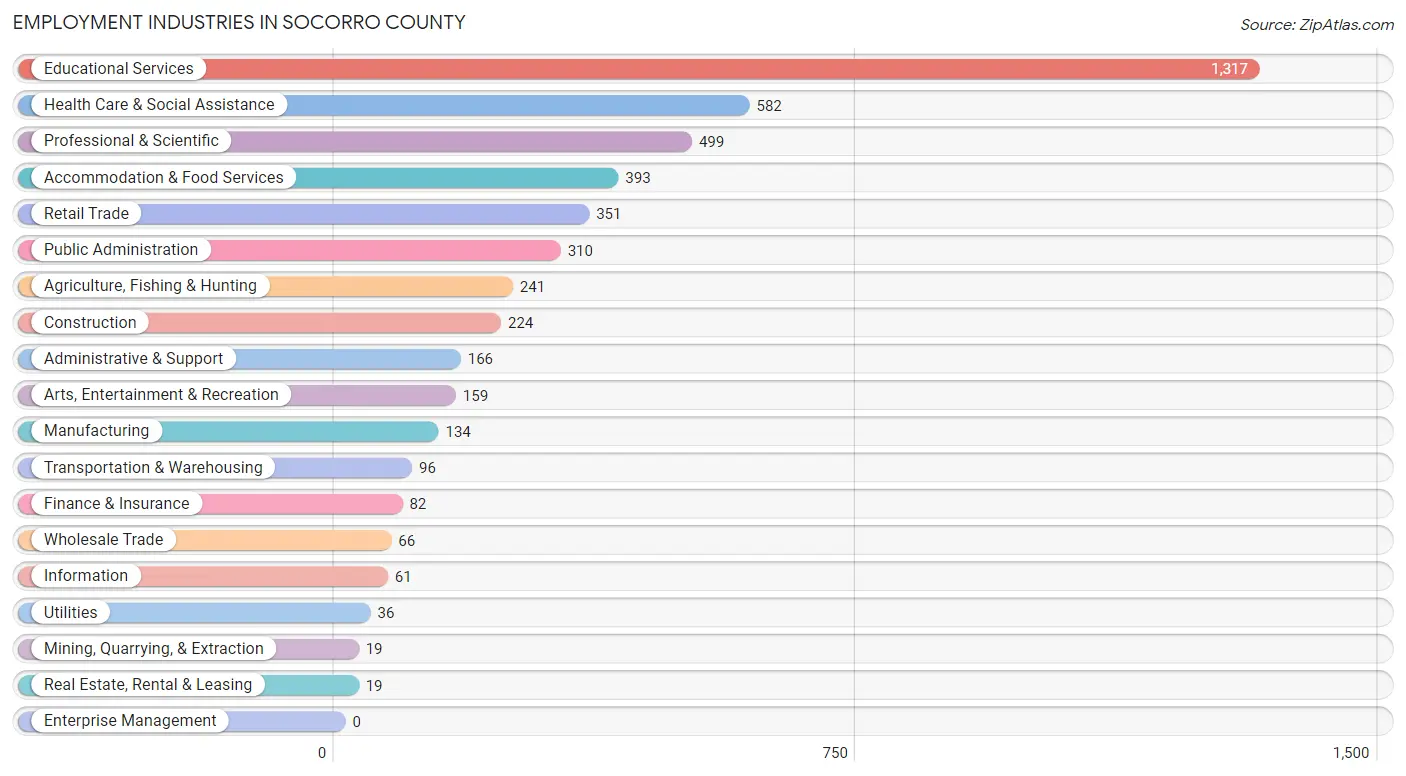
Employment Industries in Socorro County
The major employment industries in Socorro County include Educational Services (1,317 | 25.7%), Health Care & Social Assistance (582 | 11.4%), Professional & Scientific (499 | 9.8%), Accommodation & Food Services (393 | 7.7%), and Retail Trade (351 | 6.9%).
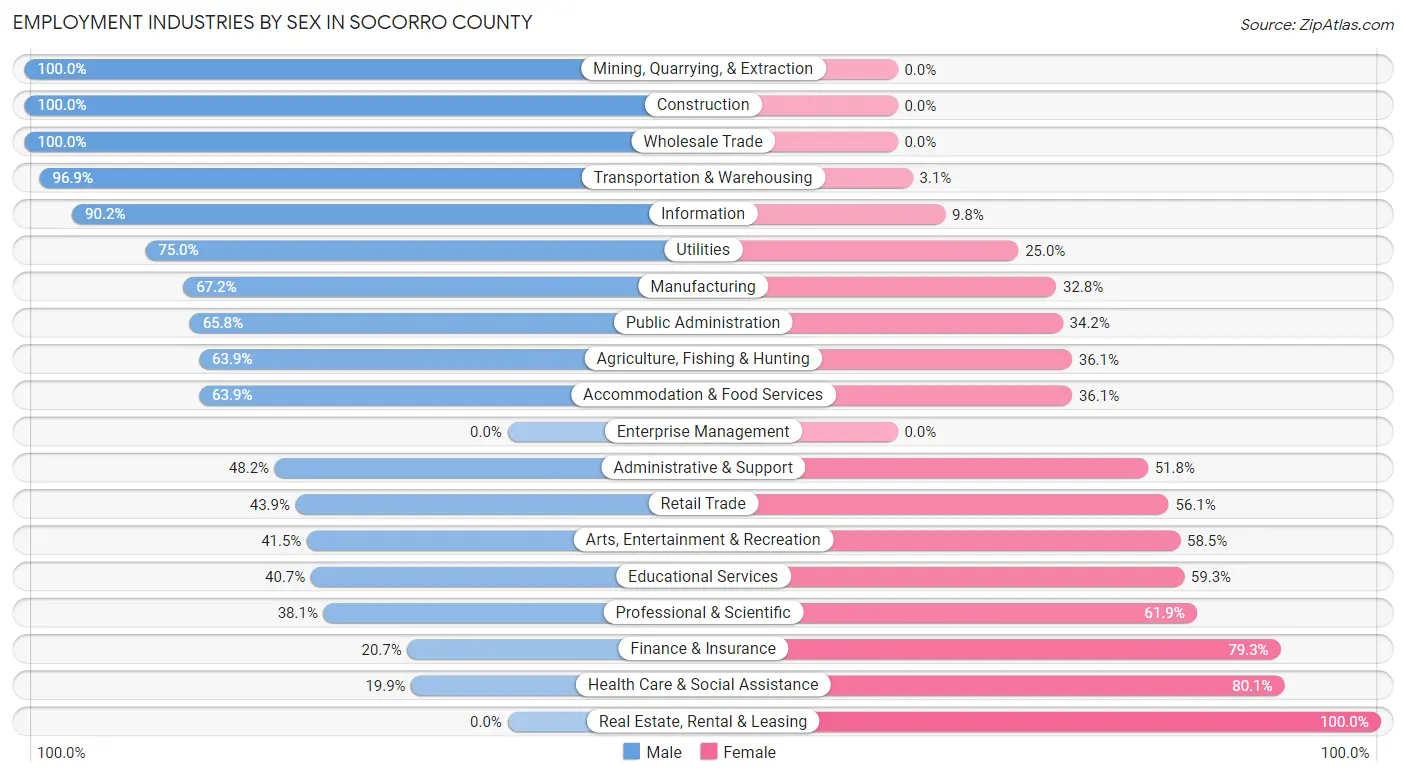
Employment Industries by Sex in Socorro County
The Socorro County industries that see more men than women are Mining, Quarrying, & Extraction (100.0%), Construction (100.0%), and Wholesale Trade (100.0%), whereas the industries that tend to have a higher number of women are Real Estate, Rental & Leasing (100.0%), Health Care & Social Assistance (80.1%), and Finance & Insurance (79.3%).
| Industry | Male | Female |
| Agriculture, Fishing & Hunting | 154 (63.9%) | 87 (36.1%) |
| Mining, Quarrying, & Extraction | 19 (100.0%) | 0 (0.0%) |
| Construction | 224 (100.0%) | 0 (0.0%) |
| Manufacturing | 90 (67.2%) | 44 (32.8%) |
| Wholesale Trade | 66 (100.0%) | 0 (0.0%) |
| Retail Trade | 154 (43.9%) | 197 (56.1%) |
| Transportation & Warehousing | 93 (96.9%) | 3 (3.1%) |
| Utilities | 27 (75.0%) | 9 (25.0%) |
| Information | 55 (90.2%) | 6 (9.8%) |
| Finance & Insurance | 17 (20.7%) | 65 (79.3%) |
| Real Estate, Rental & Leasing | 0 (0.0%) | 19 (100.0%) |
| Professional & Scientific | 190 (38.1%) | 309 (61.9%) |
| Enterprise Management | 0 (0.0%) | 0 (0.0%) |
| Administrative & Support | 80 (48.2%) | 86 (51.8%) |
| Educational Services | 536 (40.7%) | 781 (59.3%) |
| Health Care & Social Assistance | 116 (19.9%) | 466 (80.1%) |
| Arts, Entertainment & Recreation | 66 (41.5%) | 93 (58.5%) |
| Accommodation & Food Services | 251 (63.9%) | 142 (36.1%) |
| Public Administration | 204 (65.8%) | 106 (34.2%) |
| Total | 2,631 (51.4%) | 2,488 (48.6%) |
Education in Socorro County
School Enrollment in Socorro County
The most common levels of schooling among the 4,367 students in Socorro County are college / undergraduate (1,487 | 34.1%), elementary school (1,125 | 25.8%), and high school (720 | 16.5%).
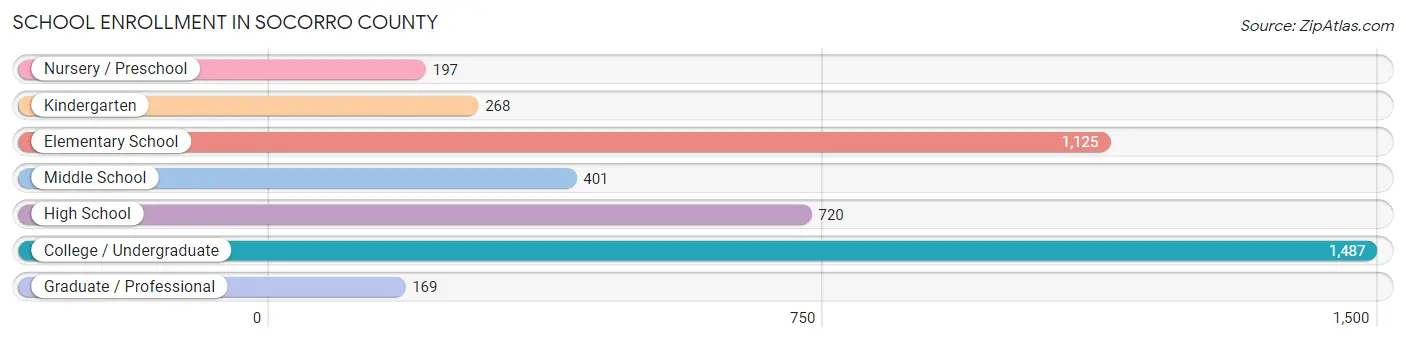
| School Level | # Students | % Students |
| Nursery / Preschool | 197 | 4.5% |
| Kindergarten | 268 | 6.1% |
| Elementary School | 1,125 | 25.8% |
| Middle School | 401 | 9.2% |
| High School | 720 | 16.5% |
| College / Undergraduate | 1,487 | 34.1% |
| Graduate / Professional | 169 | 3.9% |
| Total | 4,367 | 100.0% |
School Enrollment by Age by Funding Source in Socorro County
Out of a total of 4,367 students who are enrolled in schools in Socorro County, 100 (2.3%) attend a private institution, while the remaining 4,267 (97.7%) are enrolled in public schools. The age group of 5 to 9 year old has the highest likelihood of being enrolled in private schools, with 44 (3.6% in the age bracket) enrolled. Conversely, the age group of 3 to 4 year olds has the lowest likelihood of being enrolled in a private school, with 109 (100.0% in the age bracket) attending a public institution.
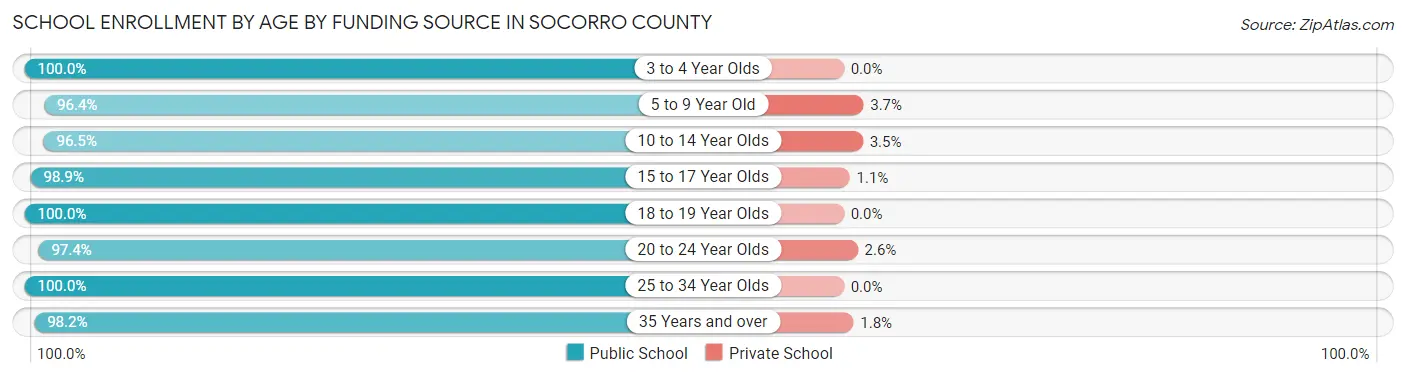
| Age Bracket | Public School | Private School |
| 3 to 4 Year Olds | 109 (100.0%) | 0 (0.0%) |
| 5 to 9 Year Old | 1,163 (96.4%) | 44 (3.6%) |
| 10 to 14 Year Olds | 817 (96.5%) | 30 (3.5%) |
| 15 to 17 Year Olds | 449 (98.9%) | 5 (1.1%) |
| 18 to 19 Year Olds | 800 (100.0%) | 0 (0.0%) |
| 20 to 24 Year Olds | 677 (97.4%) | 18 (2.6%) |
| 25 to 34 Year Olds | 88 (100.0%) | 0 (0.0%) |
| 35 Years and over | 164 (98.2%) | 3 (1.8%) |
| Total | 4,267 (97.7%) | 100 (2.3%) |
Educational Attainment by Field of Study in Socorro County
Physical & health sciences (403 | 21.1%), business (276 | 14.5%), bio, nature & agricultural (237 | 12.4%), education (232 | 12.2%), and visual & performing arts (122 | 6.4%) are the most common fields of study among 1,906 individuals in Socorro County who have obtained a bachelor's degree or higher.
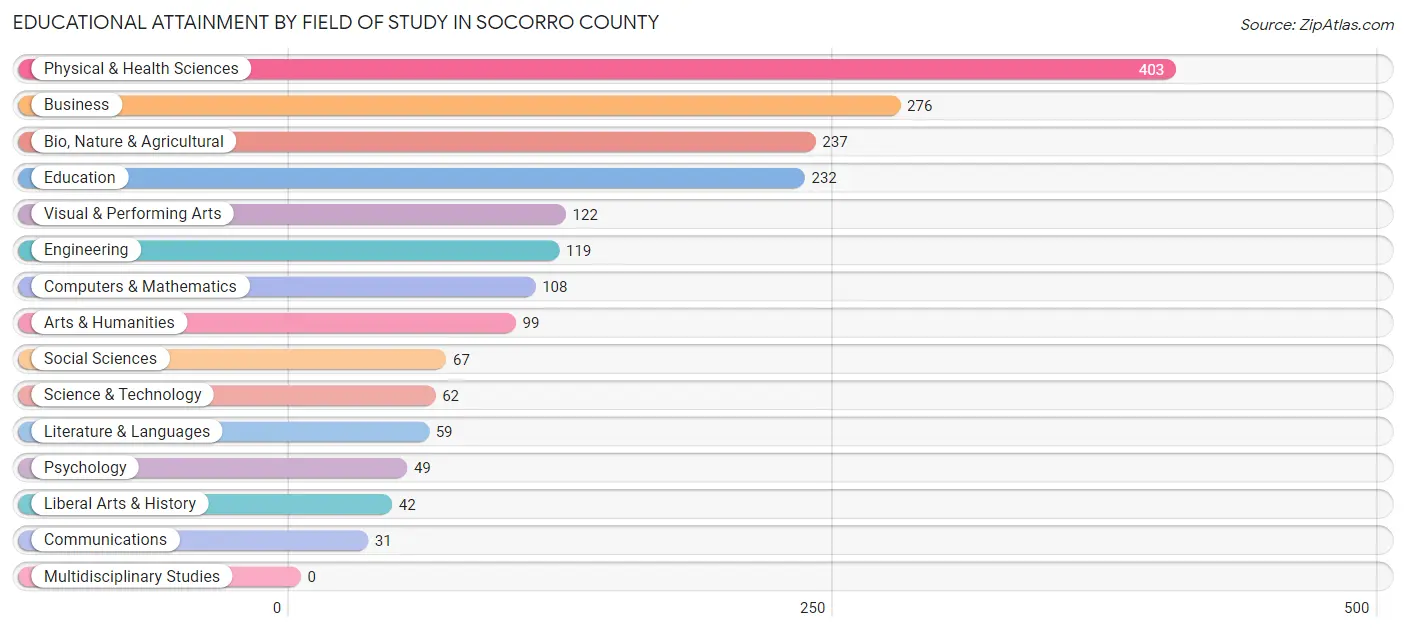
| Field of Study | # Graduates | % Graduates |
| Computers & Mathematics | 108 | 5.7% |
| Bio, Nature & Agricultural | 237 | 12.4% |
| Physical & Health Sciences | 403 | 21.1% |
| Psychology | 49 | 2.6% |
| Social Sciences | 67 | 3.5% |
| Engineering | 119 | 6.2% |
| Multidisciplinary Studies | 0 | 0.0% |
| Science & Technology | 62 | 3.3% |
| Business | 276 | 14.5% |
| Education | 232 | 12.2% |
| Literature & Languages | 59 | 3.1% |
| Liberal Arts & History | 42 | 2.2% |
| Visual & Performing Arts | 122 | 6.4% |
| Communications | 31 | 1.6% |
| Arts & Humanities | 99 | 5.2% |
| Total | 1,906 | 100.0% |
Transportation & Commute in Socorro County
Vehicle Availability by Sex in Socorro County
The most prevalent vehicle ownership categories in Socorro County are males with 2 vehicles (921, accounting for 36.1%) and females with 2 vehicles (859, making up 39.4%).
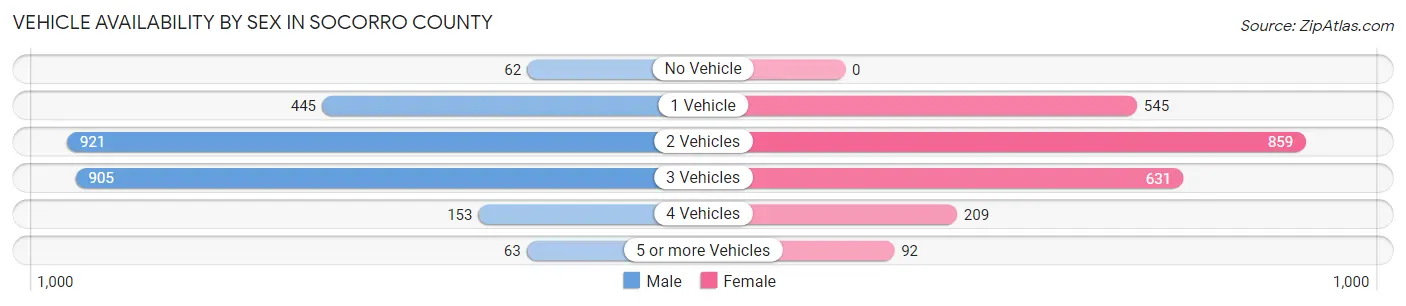
| Vehicles Available | Male | Female |
| No Vehicle | 62 (2.4%) | 0 (0.0%) |
| 1 Vehicle | 445 (17.5%) | 545 (23.3%) |
| 2 Vehicles | 921 (36.1%) | 859 (36.8%) |
| 3 Vehicles | 905 (35.5%) | 631 (27.0%) |
| 4 Vehicles | 153 (6.0%) | 209 (8.9%) |
| 5 or more Vehicles | 63 (2.5%) | 92 (3.9%) |
| Total | 2,549 (100.0%) | 2,336 (100.0%) |
Commute Time in Socorro County
The most frequently occuring commute durations in Socorro County are 5 to 9 minutes (1,834 commuters, 43.9%), 10 to 14 minutes (729 commuters, 17.5%), and 20 to 24 minutes (357 commuters, 8.6%).
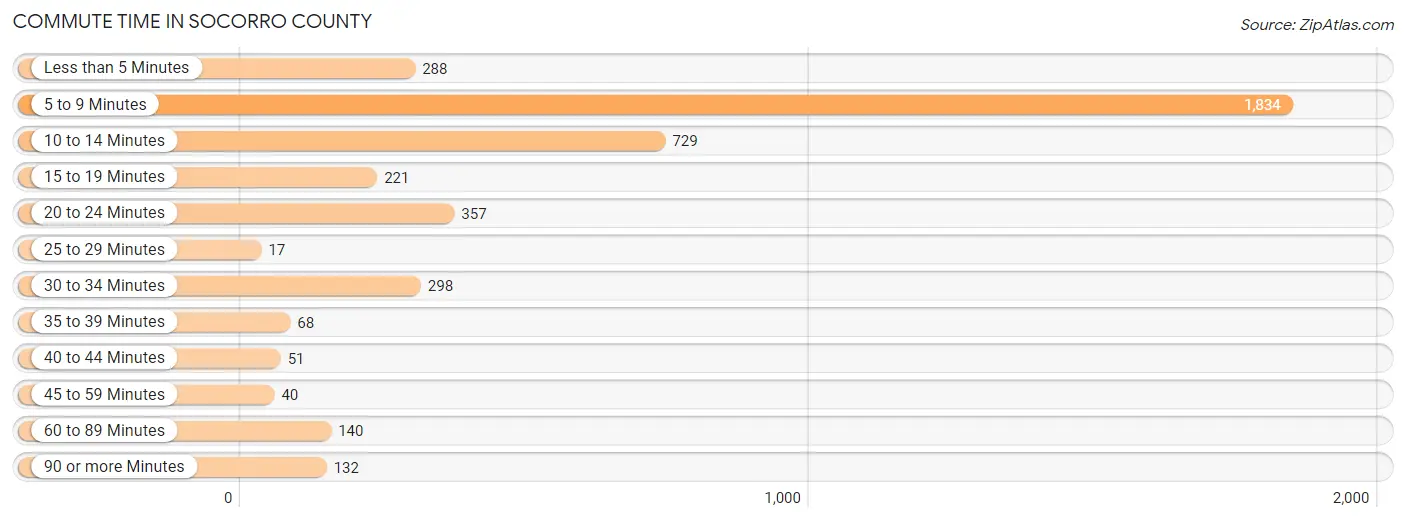
| Commute Time | # Commuters | % Commuters |
| Less than 5 Minutes | 288 | 6.9% |
| 5 to 9 Minutes | 1,834 | 43.9% |
| 10 to 14 Minutes | 729 | 17.5% |
| 15 to 19 Minutes | 221 | 5.3% |
| 20 to 24 Minutes | 357 | 8.6% |
| 25 to 29 Minutes | 17 | 0.4% |
| 30 to 34 Minutes | 298 | 7.1% |
| 35 to 39 Minutes | 68 | 1.6% |
| 40 to 44 Minutes | 51 | 1.2% |
| 45 to 59 Minutes | 40 | 1.0% |
| 60 to 89 Minutes | 140 | 3.4% |
| 90 or more Minutes | 132 | 3.2% |
Commute Time by Sex in Socorro County
The most common commute times in Socorro County are 5 to 9 minutes (855 commuters, 39.3%) for males and 5 to 9 minutes (979 commuters, 49.0%) for females.
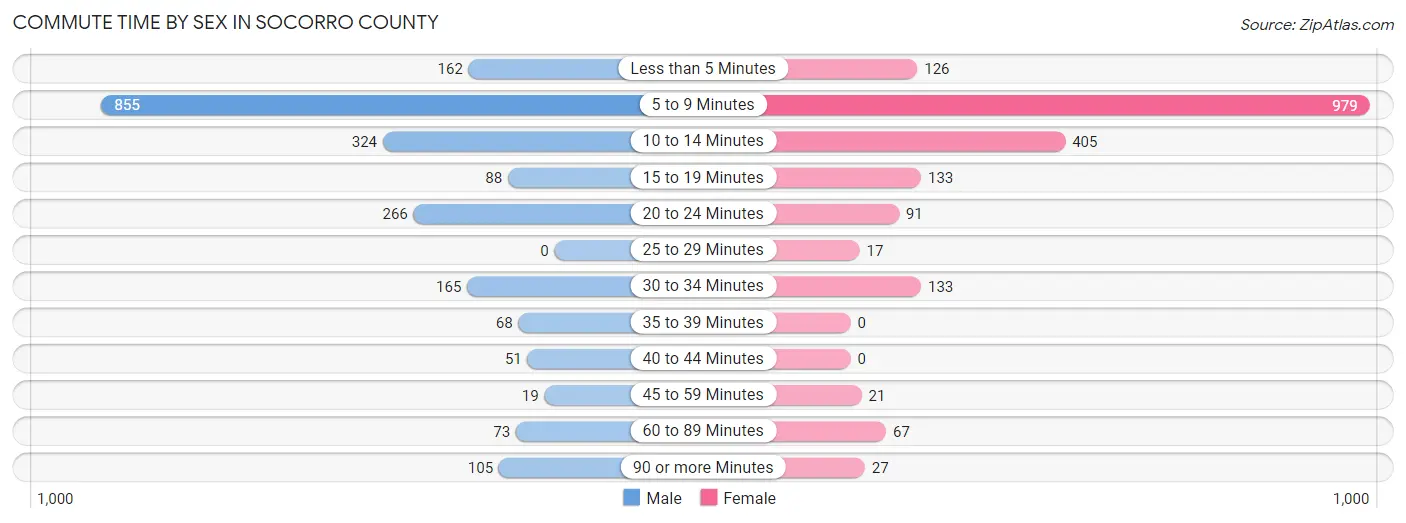
| Commute Time | Male | Female |
| Less than 5 Minutes | 162 (7.4%) | 126 (6.3%) |
| 5 to 9 Minutes | 855 (39.3%) | 979 (49.0%) |
| 10 to 14 Minutes | 324 (14.9%) | 405 (20.3%) |
| 15 to 19 Minutes | 88 (4.0%) | 133 (6.7%) |
| 20 to 24 Minutes | 266 (12.2%) | 91 (4.5%) |
| 25 to 29 Minutes | 0 (0.0%) | 17 (0.9%) |
| 30 to 34 Minutes | 165 (7.6%) | 133 (6.7%) |
| 35 to 39 Minutes | 68 (3.1%) | 0 (0.0%) |
| 40 to 44 Minutes | 51 (2.3%) | 0 (0.0%) |
| 45 to 59 Minutes | 19 (0.9%) | 21 (1.1%) |
| 60 to 89 Minutes | 73 (3.4%) | 67 (3.4%) |
| 90 or more Minutes | 105 (4.8%) | 27 (1.3%) |
Time of Departure to Work by Sex in Socorro County
The most frequent times of departure to work in Socorro County are 6:00 AM to 6:29 AM (403, 18.5%) for males and 7:30 AM to 7:59 AM (533, 26.7%) for females.
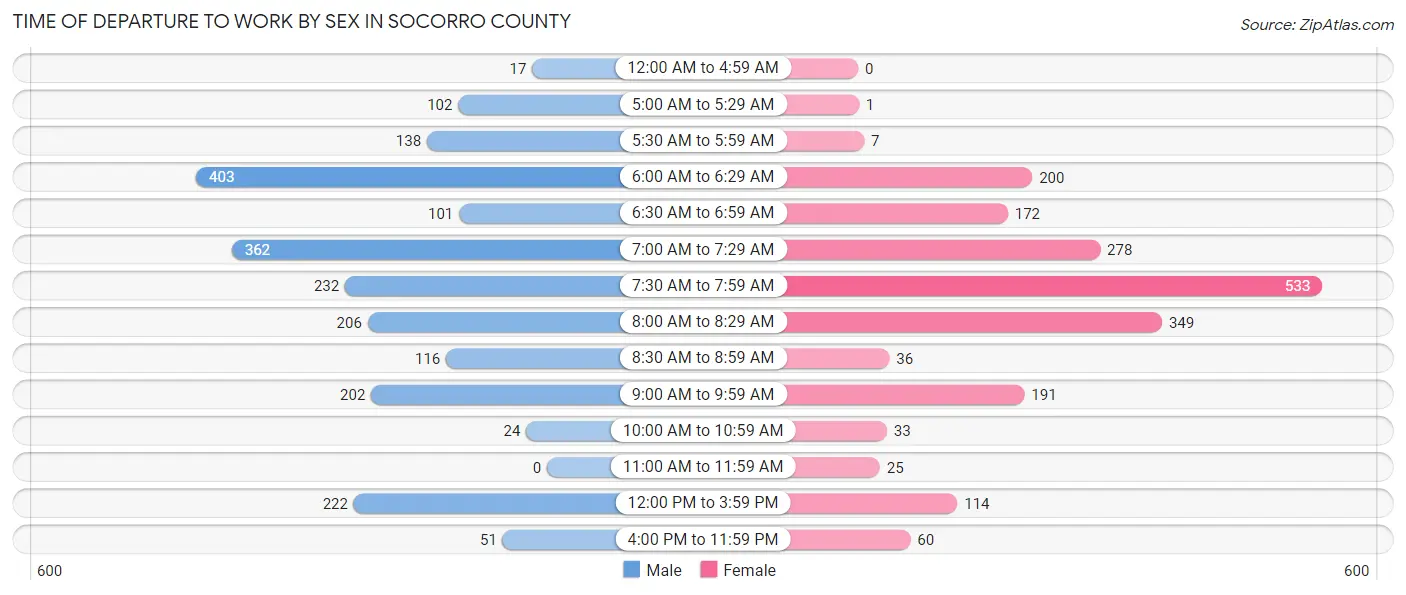
| Time of Departure | Male | Female |
| 12:00 AM to 4:59 AM | 17 (0.8%) | 0 (0.0%) |
| 5:00 AM to 5:29 AM | 102 (4.7%) | 1 (0.1%) |
| 5:30 AM to 5:59 AM | 138 (6.3%) | 7 (0.4%) |
| 6:00 AM to 6:29 AM | 403 (18.5%) | 200 (10.0%) |
| 6:30 AM to 6:59 AM | 101 (4.6%) | 172 (8.6%) |
| 7:00 AM to 7:29 AM | 362 (16.6%) | 278 (13.9%) |
| 7:30 AM to 7:59 AM | 232 (10.7%) | 533 (26.7%) |
| 8:00 AM to 8:29 AM | 206 (9.5%) | 349 (17.5%) |
| 8:30 AM to 8:59 AM | 116 (5.3%) | 36 (1.8%) |
| 9:00 AM to 9:59 AM | 202 (9.3%) | 191 (9.6%) |
| 10:00 AM to 10:59 AM | 24 (1.1%) | 33 (1.7%) |
| 11:00 AM to 11:59 AM | 0 (0.0%) | 25 (1.3%) |
| 12:00 PM to 3:59 PM | 222 (10.2%) | 114 (5.7%) |
| 4:00 PM to 11:59 PM | 51 (2.3%) | 60 (3.0%) |
| Total | 2,176 (100.0%) | 1,999 (100.0%) |
Housing Occupancy in Socorro County
Occupancy by Ownership in Socorro County
Of the total 4,953 dwellings in Socorro County, owner-occupied units account for 3,712 (74.9%), while renter-occupied units make up 1,241 (25.1%).
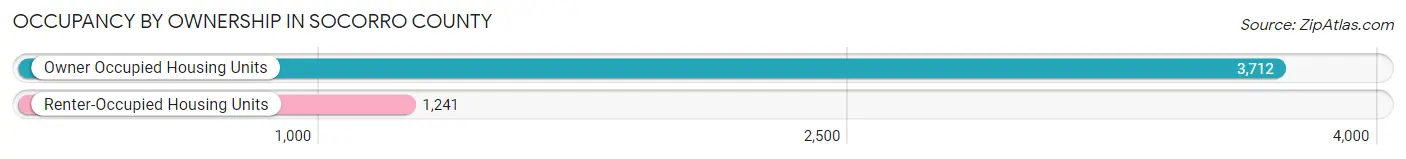
| Occupancy | # Housing Units | % Housing Units |
| Owner Occupied Housing Units | 3,712 | 74.9% |
| Renter-Occupied Housing Units | 1,241 | 25.1% |
| Total Occupied Housing Units | 4,953 | 100.0% |
Occupancy by Household Size in Socorro County
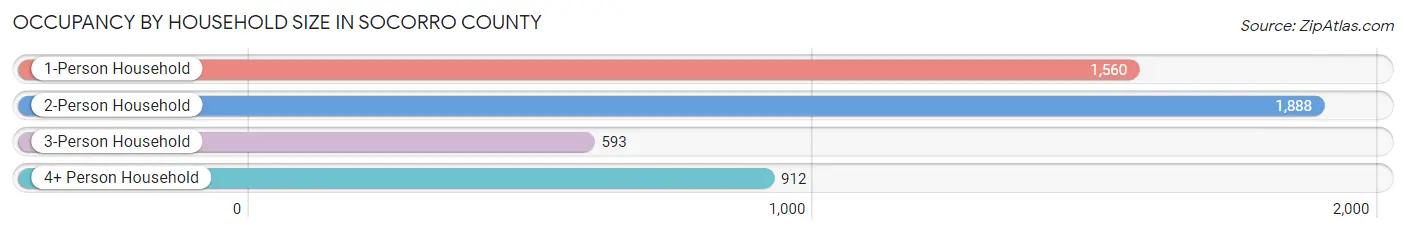
| Household Size | # Housing Units | % Housing Units |
| 1-Person Household | 1,560 | 31.5% |
| 2-Person Household | 1,888 | 38.1% |
| 3-Person Household | 593 | 12.0% |
| 4+ Person Household | 912 | 18.4% |
| Total Housing Units | 4,953 | 100.0% |
Occupancy by Ownership by Household Size in Socorro County
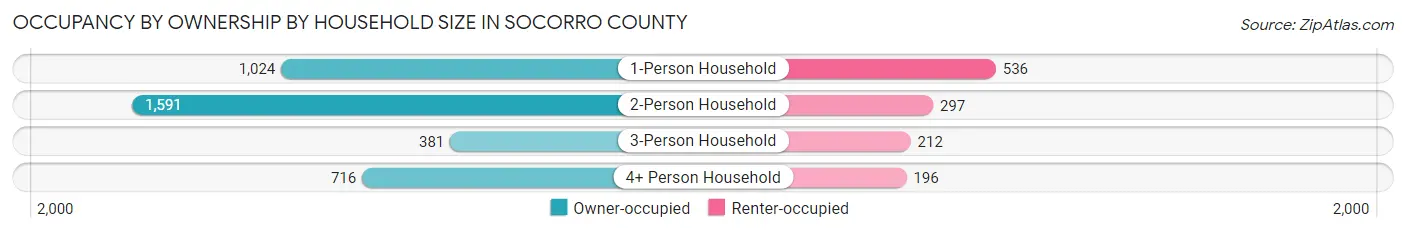
| Household Size | Owner-occupied | Renter-occupied |
| 1-Person Household | 1,024 (65.6%) | 536 (34.4%) |
| 2-Person Household | 1,591 (84.3%) | 297 (15.7%) |
| 3-Person Household | 381 (64.2%) | 212 (35.7%) |
| 4+ Person Household | 716 (78.5%) | 196 (21.5%) |
| Total Housing Units | 3,712 (74.9%) | 1,241 (25.1%) |
Occupancy by Educational Attainment in Socorro County
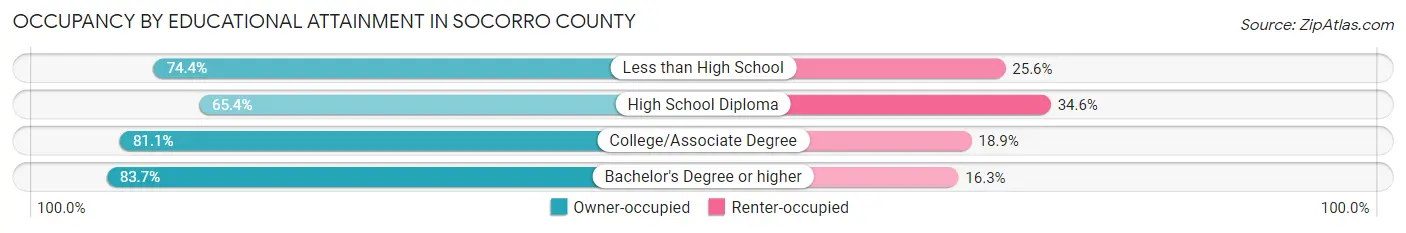
| Household Size | Owner-occupied | Renter-occupied |
| Less than High School | 491 (74.4%) | 169 (25.6%) |
| High School Diploma | 1,191 (65.4%) | 630 (34.6%) |
| College/Associate Degree | 1,204 (81.1%) | 281 (18.9%) |
| Bachelor's Degree or higher | 826 (83.7%) | 161 (16.3%) |
Occupancy by Age of Householder in Socorro County
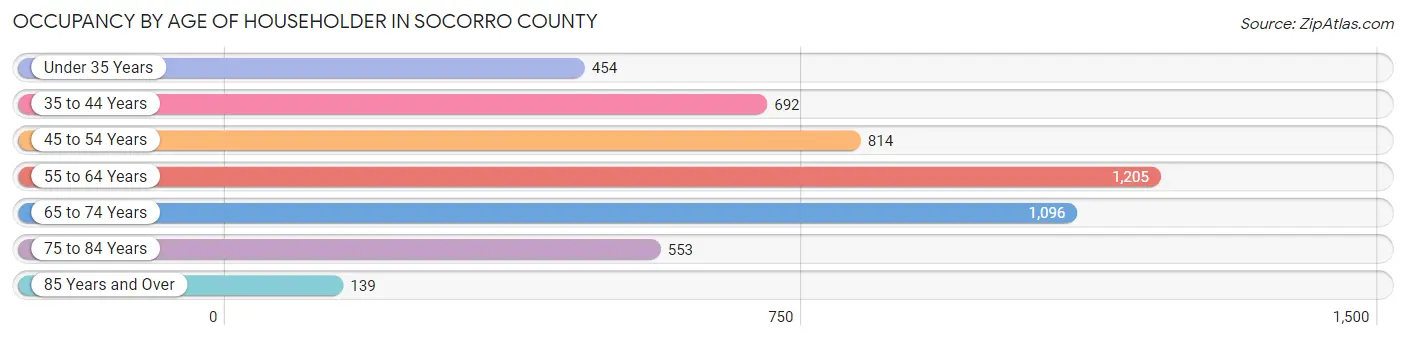
| Age Bracket | # Households | % Households |
| Under 35 Years | 454 | 9.2% |
| 35 to 44 Years | 692 | 14.0% |
| 45 to 54 Years | 814 | 16.4% |
| 55 to 64 Years | 1,205 | 24.3% |
| 65 to 74 Years | 1,096 | 22.1% |
| 75 to 84 Years | 553 | 11.2% |
| 85 Years and Over | 139 | 2.8% |
| Total | 4,953 | 100.0% |
Housing Finances in Socorro County
Median Income by Occupancy in Socorro County
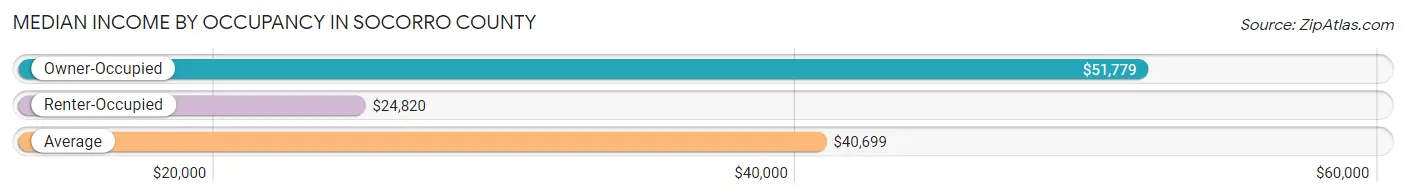
| Occupancy Type | # Households | Median Income |
| Owner-Occupied | 3,712 (74.9%) | $51,779 |
| Renter-Occupied | 1,241 (25.1%) | $24,820 |
| Average | 4,953 (100.0%) | $40,699 |
Occupancy by Householder Income Bracket in Socorro County
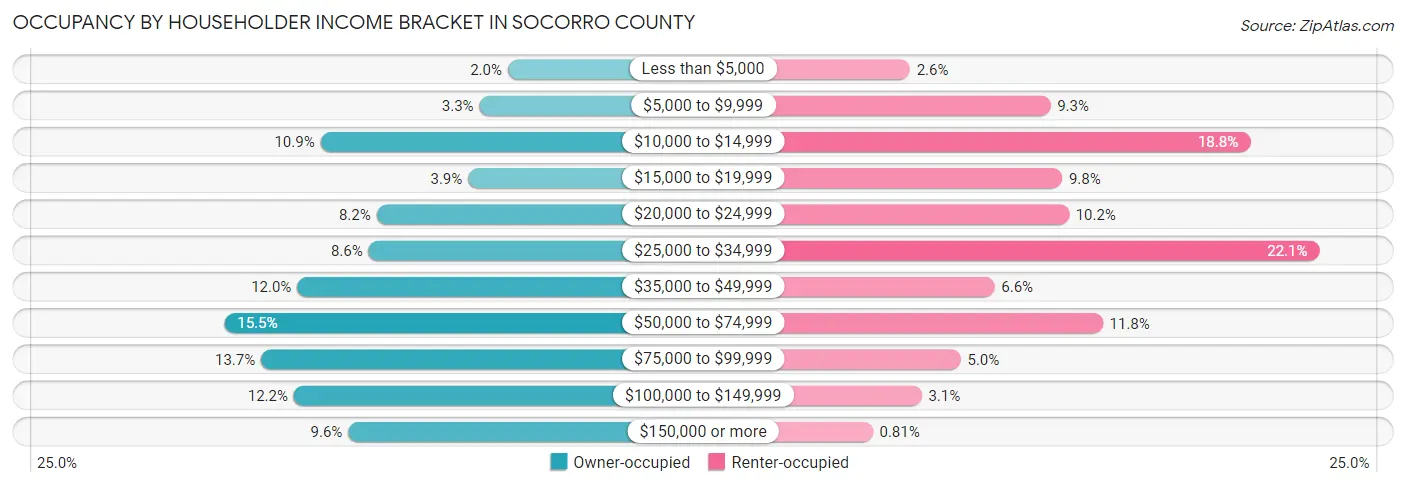
| Income Bracket | Owner-occupied | Renter-occupied |
| Less than $5,000 | 74 (2.0%) | 32 (2.6%) |
| $5,000 to $9,999 | 124 (3.3%) | 115 (9.3%) |
| $10,000 to $14,999 | 405 (10.9%) | 233 (18.8%) |
| $15,000 to $19,999 | 144 (3.9%) | 122 (9.8%) |
| $20,000 to $24,999 | 306 (8.2%) | 126 (10.2%) |
| $25,000 to $34,999 | 320 (8.6%) | 274 (22.1%) |
| $35,000 to $49,999 | 446 (12.0%) | 82 (6.6%) |
| $50,000 to $74,999 | 575 (15.5%) | 146 (11.8%) |
| $75,000 to $99,999 | 510 (13.7%) | 62 (5.0%) |
| $100,000 to $149,999 | 452 (12.2%) | 39 (3.1%) |
| $150,000 or more | 356 (9.6%) | 10 (0.8%) |
| Total | 3,712 (100.0%) | 1,241 (100.0%) |
Monthly Housing Cost Tiers in Socorro County
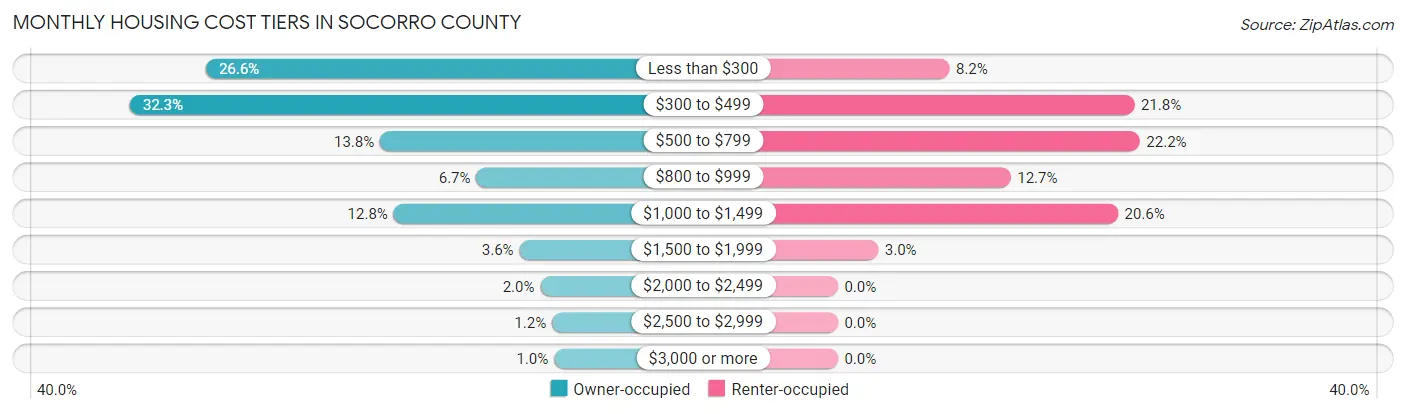
| Monthly Cost | Owner-occupied | Renter-occupied |
| Less than $300 | 989 (26.6%) | 102 (8.2%) |
| $300 to $499 | 1,197 (32.3%) | 271 (21.8%) |
| $500 to $799 | 513 (13.8%) | 276 (22.2%) |
| $800 to $999 | 250 (6.7%) | 158 (12.7%) |
| $1,000 to $1,499 | 476 (12.8%) | 256 (20.6%) |
| $1,500 to $1,999 | 132 (3.6%) | 37 (3.0%) |
| $2,000 to $2,499 | 75 (2.0%) | 0 (0.0%) |
| $2,500 to $2,999 | 43 (1.2%) | 0 (0.0%) |
| $3,000 or more | 37 (1.0%) | 0 (0.0%) |
| Total | 3,712 (100.0%) | 1,241 (100.0%) |
Physical Housing Characteristics in Socorro County
Housing Structures in Socorro County
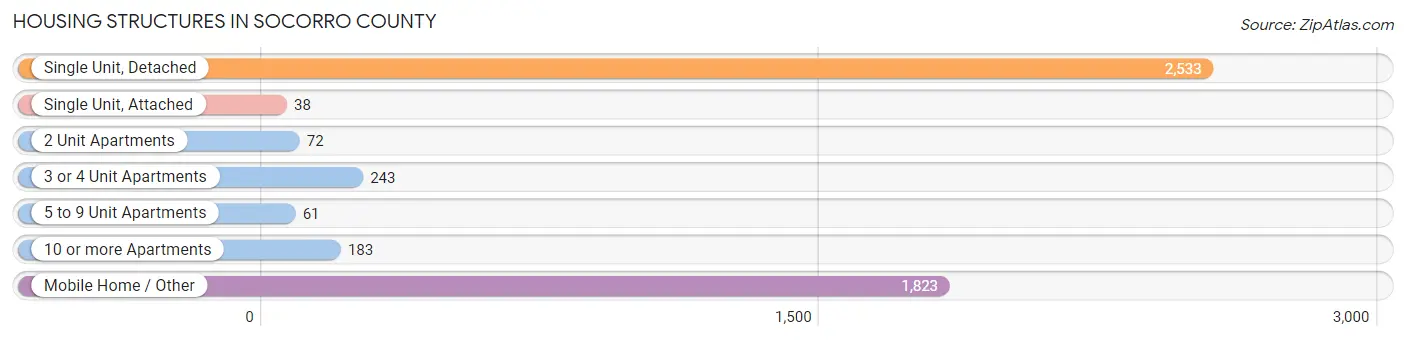
| Structure Type | # Housing Units | % Housing Units |
| Single Unit, Detached | 2,533 | 51.1% |
| Single Unit, Attached | 38 | 0.8% |
| 2 Unit Apartments | 72 | 1.5% |
| 3 or 4 Unit Apartments | 243 | 4.9% |
| 5 to 9 Unit Apartments | 61 | 1.2% |
| 10 or more Apartments | 183 | 3.7% |
| Mobile Home / Other | 1,823 | 36.8% |
| Total | 4,953 | 100.0% |
Housing Structures by Occupancy in Socorro County
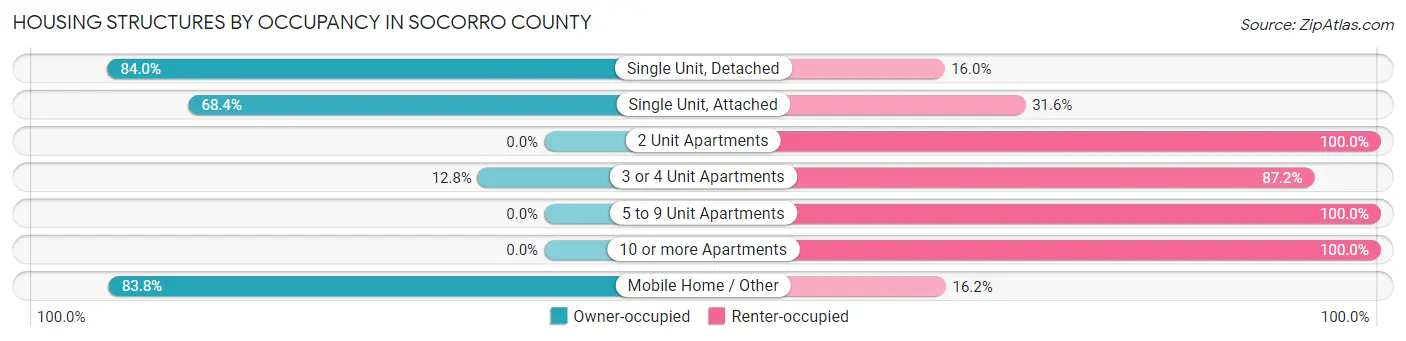
| Structure Type | Owner-occupied | Renter-occupied |
| Single Unit, Detached | 2,128 (84.0%) | 405 (16.0%) |
| Single Unit, Attached | 26 (68.4%) | 12 (31.6%) |
| 2 Unit Apartments | 0 (0.0%) | 72 (100.0%) |
| 3 or 4 Unit Apartments | 31 (12.8%) | 212 (87.2%) |
| 5 to 9 Unit Apartments | 0 (0.0%) | 61 (100.0%) |
| 10 or more Apartments | 0 (0.0%) | 183 (100.0%) |
| Mobile Home / Other | 1,527 (83.8%) | 296 (16.2%) |
| Total | 3,712 (74.9%) | 1,241 (25.1%) |
Housing Structures by Number of Rooms in Socorro County
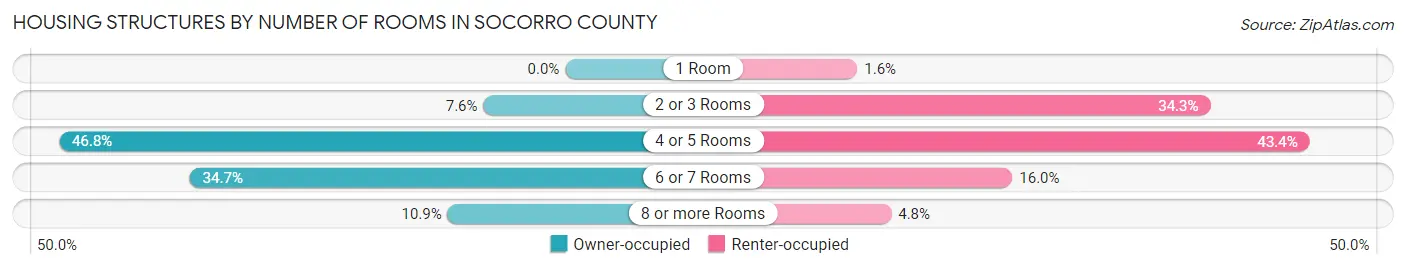
| Number of Rooms | Owner-occupied | Renter-occupied |
| 1 Room | 0 (0.0%) | 20 (1.6%) |
| 2 or 3 Rooms | 281 (7.6%) | 425 (34.3%) |
| 4 or 5 Rooms | 1,738 (46.8%) | 539 (43.4%) |
| 6 or 7 Rooms | 1,289 (34.7%) | 198 (16.0%) |
| 8 or more Rooms | 404 (10.9%) | 59 (4.8%) |
| Total | 3,712 (100.0%) | 1,241 (100.0%) |
Housing Structure by Heating Type in Socorro County
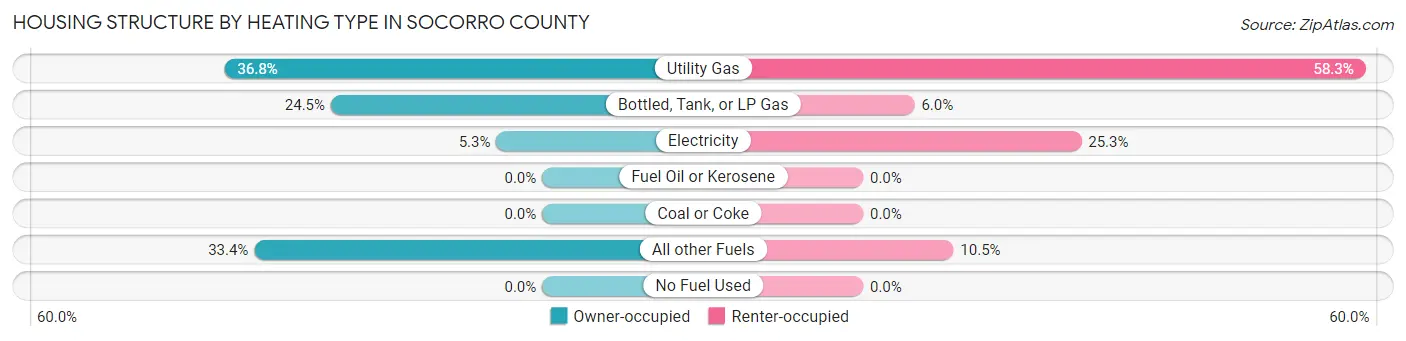
| Heating Type | Owner-occupied | Renter-occupied |
| Utility Gas | 1,367 (36.8%) | 723 (58.3%) |
| Bottled, Tank, or LP Gas | 909 (24.5%) | 74 (6.0%) |
| Electricity | 197 (5.3%) | 314 (25.3%) |
| Fuel Oil or Kerosene | 0 (0.0%) | 0 (0.0%) |
| Coal or Coke | 0 (0.0%) | 0 (0.0%) |
| All other Fuels | 1,239 (33.4%) | 130 (10.5%) |
| No Fuel Used | 0 (0.0%) | 0 (0.0%) |
| Total | 3,712 (100.0%) | 1,241 (100.0%) |
Household Vehicle Usage in Socorro County
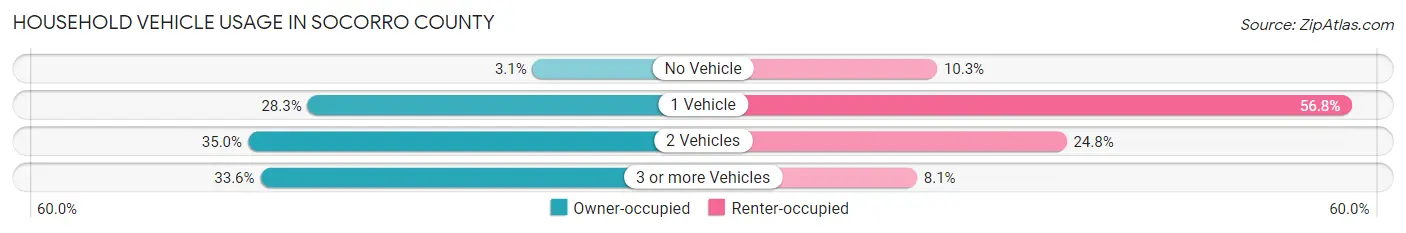
| Vehicles per Household | Owner-occupied | Renter-occupied |
| No Vehicle | 115 (3.1%) | 128 (10.3%) |
| 1 Vehicle | 1,051 (28.3%) | 705 (56.8%) |
| 2 Vehicles | 1,299 (35.0%) | 308 (24.8%) |
| 3 or more Vehicles | 1,247 (33.6%) | 100 (8.1%) |
| Total | 3,712 (100.0%) | 1,241 (100.0%) |
Real Estate & Mortgages in Socorro County
Real Estate and Mortgage Overview in Socorro County
| Characteristic | Without Mortgage | With Mortgage |
| Housing Units | 2,712 | 1,000 |
| Median Property Value | $111,500 | $166,000 |
| Median Household Income | $39,271 | $158 |
| Monthly Housing Costs | $358 | $20 |
| Real Estate Taxes | $560 | $10 |
Property Value by Mortgage Status in Socorro County
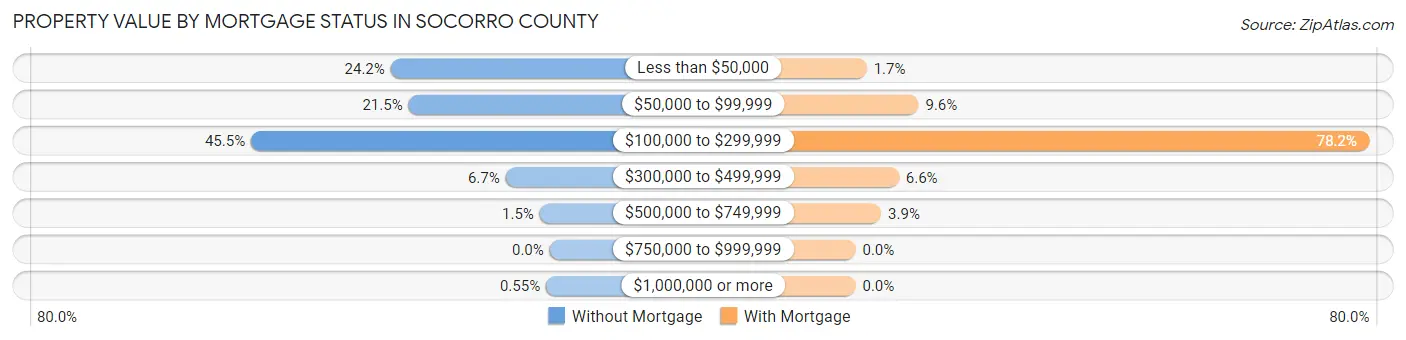
| Property Value | Without Mortgage | With Mortgage |
| Less than $50,000 | 657 (24.2%) | 17 (1.7%) |
| $50,000 to $99,999 | 583 (21.5%) | 96 (9.6%) |
| $100,000 to $299,999 | 1,234 (45.5%) | 782 (78.2%) |
| $300,000 to $499,999 | 182 (6.7%) | 66 (6.6%) |
| $500,000 to $749,999 | 41 (1.5%) | 39 (3.9%) |
| $750,000 to $999,999 | 0 (0.0%) | 0 (0.0%) |
| $1,000,000 or more | 15 (0.5%) | 0 (0.0%) |
| Total | 2,712 (100.0%) | 1,000 (100.0%) |
Household Income by Mortgage Status in Socorro County
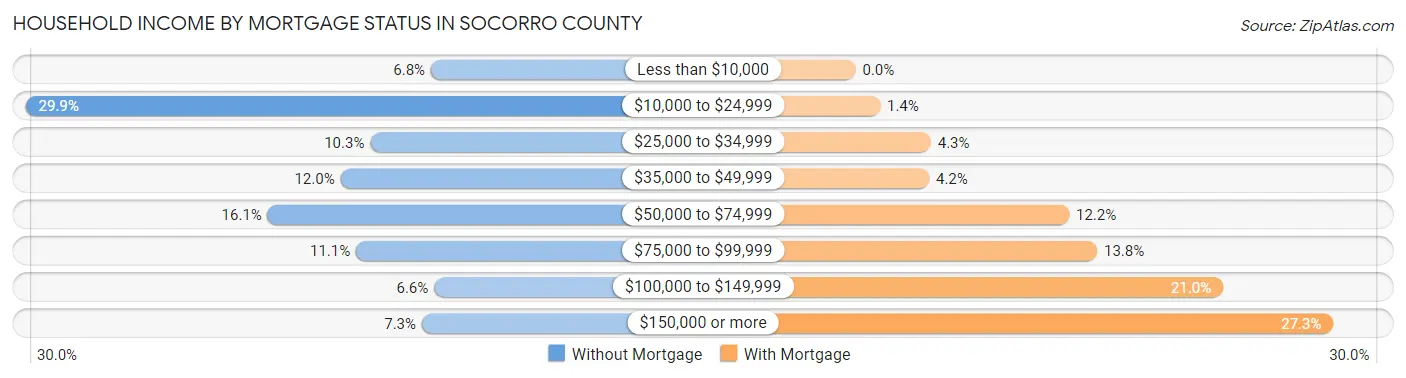
| Household Income | Without Mortgage | With Mortgage |
| Less than $10,000 | 184 (6.8%) | 0 (0.0%) |
| $10,000 to $24,999 | 812 (29.9%) | 14 (1.4%) |
| $25,000 to $34,999 | 278 (10.2%) | 43 (4.3%) |
| $35,000 to $49,999 | 324 (11.9%) | 42 (4.2%) |
| $50,000 to $74,999 | 437 (16.1%) | 122 (12.2%) |
| $75,000 to $99,999 | 300 (11.1%) | 138 (13.8%) |
| $100,000 to $149,999 | 179 (6.6%) | 210 (21.0%) |
| $150,000 or more | 198 (7.3%) | 273 (27.3%) |
| Total | 2,712 (100.0%) | 1,000 (100.0%) |
Property Value to Household Income Ratio in Socorro County
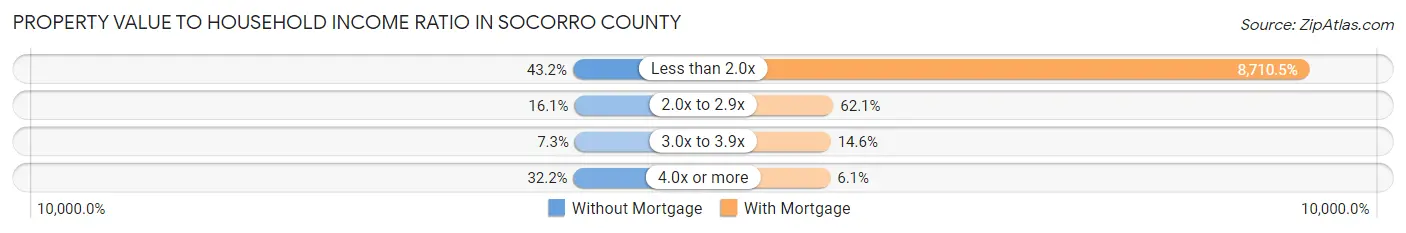
| Value-to-Income Ratio | Without Mortgage | With Mortgage |
| Less than 2.0x | 1,172 (43.2%) | 87,105 (8,710.5%) |
| 2.0x to 2.9x | 436 (16.1%) | 621 (62.1%) |
| 3.0x to 3.9x | 199 (7.3%) | 146 (14.6%) |
| 4.0x or more | 873 (32.2%) | 61 (6.1%) |
| Total | 2,712 (100.0%) | 1,000 (100.0%) |
Real Estate Taxes by Mortgage Status in Socorro County
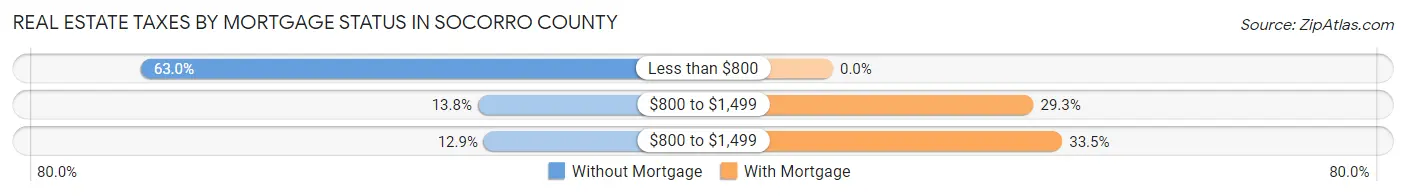
| Property Taxes | Without Mortgage | With Mortgage |
| Less than $800 | 1,709 (63.0%) | 0 (0.0%) |
| $800 to $1,499 | 374 (13.8%) | 293 (29.3%) |
| $800 to $1,499 | 350 (12.9%) | 335 (33.5%) |
| Total | 2,712 (100.0%) | 1,000 (100.0%) |
Health & Disability in Socorro County
Health Insurance Coverage by Age in Socorro County
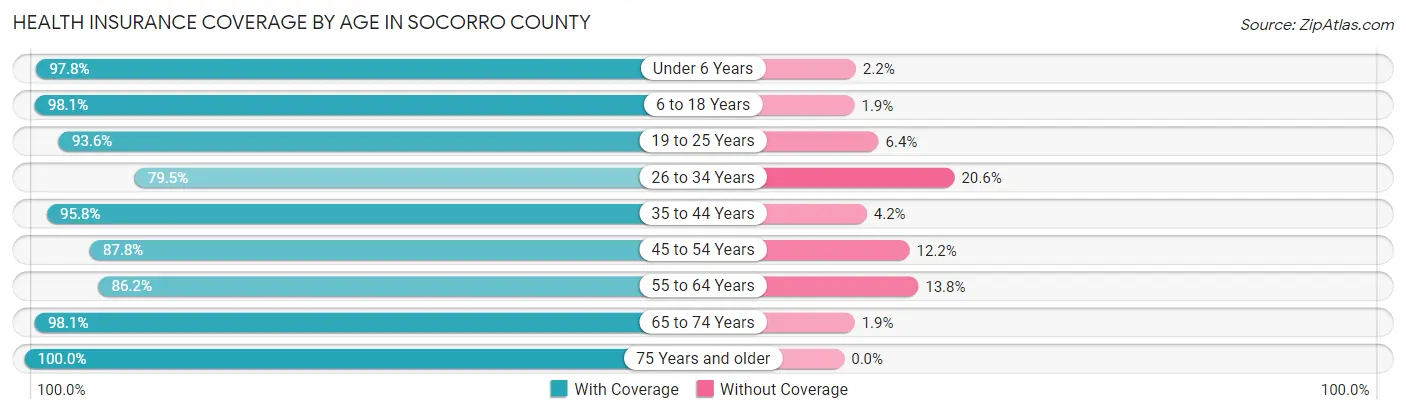
| Age Bracket | With Coverage | Without Coverage |
| Under 6 Years | 1,127 (97.8%) | 25 (2.2%) |
| 6 to 18 Years | 2,870 (98.1%) | 56 (1.9%) |
| 19 to 25 Years | 1,623 (93.6%) | 111 (6.4%) |
| 26 to 34 Years | 974 (79.4%) | 252 (20.5%) |
| 35 to 44 Years | 1,890 (95.8%) | 83 (4.2%) |
| 45 to 54 Years | 1,651 (87.8%) | 229 (12.2%) |
| 55 to 64 Years | 1,812 (86.2%) | 290 (13.8%) |
| 65 to 74 Years | 1,971 (98.1%) | 39 (1.9%) |
| 75 Years and older | 1,267 (100.0%) | 0 (0.0%) |
| Total | 15,185 (93.3%) | 1,085 (6.7%) |
Health Insurance Coverage by Citizenship Status in Socorro County
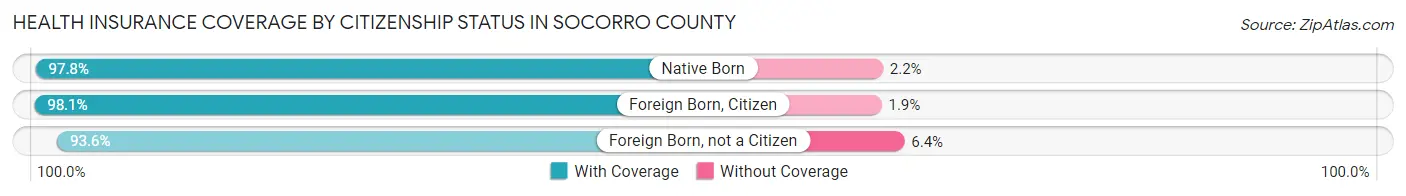
| Citizenship Status | With Coverage | Without Coverage |
| Native Born | 1,127 (97.8%) | 25 (2.2%) |
| Foreign Born, Citizen | 2,870 (98.1%) | 56 (1.9%) |
| Foreign Born, not a Citizen | 1,623 (93.6%) | 111 (6.4%) |
Health Insurance Coverage by Household Income in Socorro County
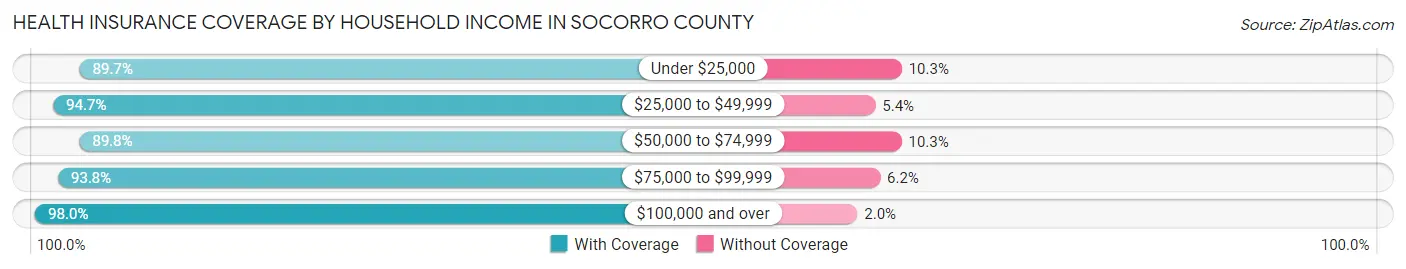
| Household Income | With Coverage | Without Coverage |
| Under $25,000 | 3,627 (89.7%) | 416 (10.3%) |
| $25,000 to $49,999 | 3,399 (94.7%) | 192 (5.3%) |
| $50,000 to $74,999 | 2,426 (89.7%) | 277 (10.2%) |
| $75,000 to $99,999 | 2,013 (93.8%) | 134 (6.2%) |
| $100,000 and over | 3,278 (98.0%) | 66 (2.0%) |
Public vs Private Health Insurance Coverage by Age in Socorro County
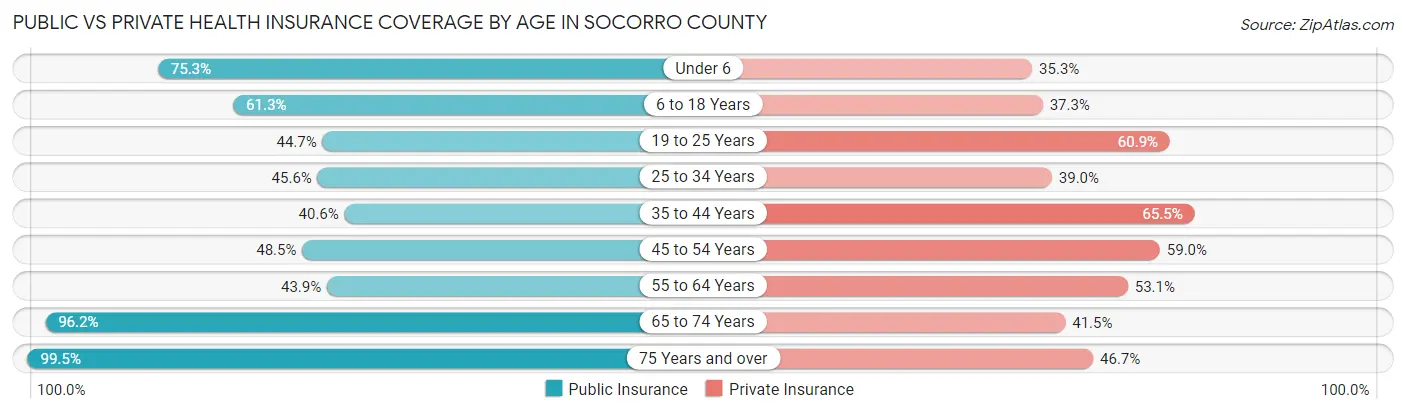
| Age Bracket | Public Insurance | Private Insurance |
| Under 6 | 867 (75.3%) | 407 (35.3%) |
| 6 to 18 Years | 1,793 (61.3%) | 1,091 (37.3%) |
| 19 to 25 Years | 775 (44.7%) | 1,056 (60.9%) |
| 25 to 34 Years | 559 (45.6%) | 478 (39.0%) |
| 35 to 44 Years | 801 (40.6%) | 1,292 (65.5%) |
| 45 to 54 Years | 911 (48.5%) | 1,110 (59.0%) |
| 55 to 64 Years | 922 (43.9%) | 1,116 (53.1%) |
| 65 to 74 Years | 1,933 (96.2%) | 834 (41.5%) |
| 75 Years and over | 1,260 (99.5%) | 591 (46.7%) |
| Total | 9,821 (60.4%) | 7,975 (49.0%) |
Disability Status by Sex by Age in Socorro County
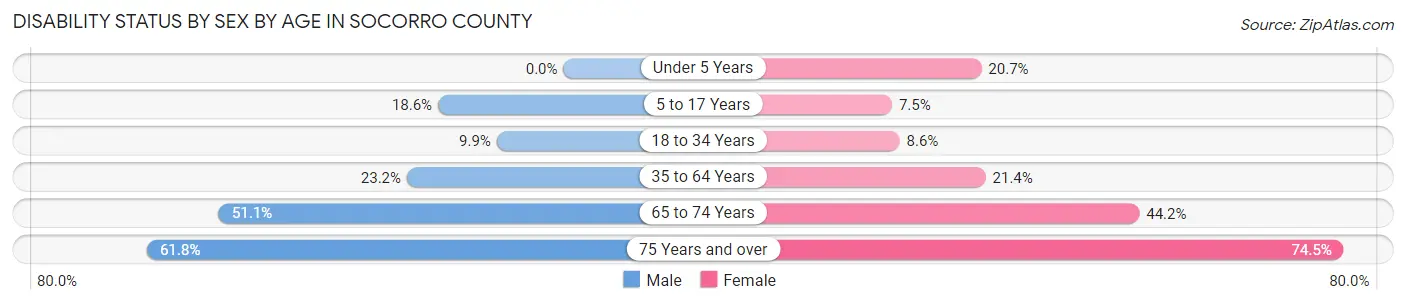
| Age Bracket | Male | Female |
| Under 5 Years | 0 (0.0%) | 79 (20.7%) |
| 5 to 17 Years | 238 (18.6%) | 108 (7.4%) |
| 18 to 34 Years | 185 (9.9%) | 140 (8.6%) |
| 35 to 64 Years | 715 (23.2%) | 615 (21.4%) |
| 65 to 74 Years | 514 (51.1%) | 444 (44.2%) |
| 75 Years and over | 361 (61.8%) | 509 (74.5%) |
Disability Class by Sex by Age in Socorro County
Disability Class: Hearing Difficulty
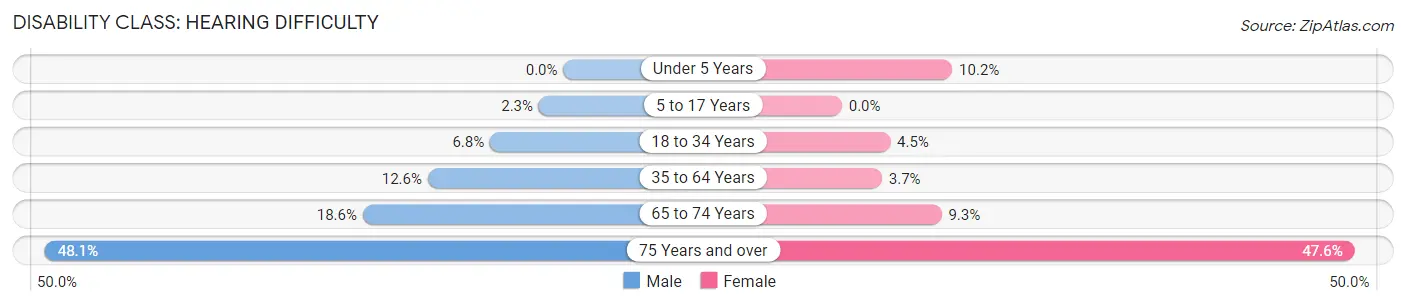
| Age Bracket | Male | Female |
| Under 5 Years | 0 (0.0%) | 39 (10.2%) |
| 5 to 17 Years | 29 (2.3%) | 0 (0.0%) |
| 18 to 34 Years | 127 (6.8%) | 73 (4.5%) |
| 35 to 64 Years | 387 (12.6%) | 107 (3.7%) |
| 65 to 74 Years | 187 (18.6%) | 93 (9.2%) |
| 75 Years and over | 281 (48.1%) | 325 (47.6%) |
Disability Class: Vision Difficulty
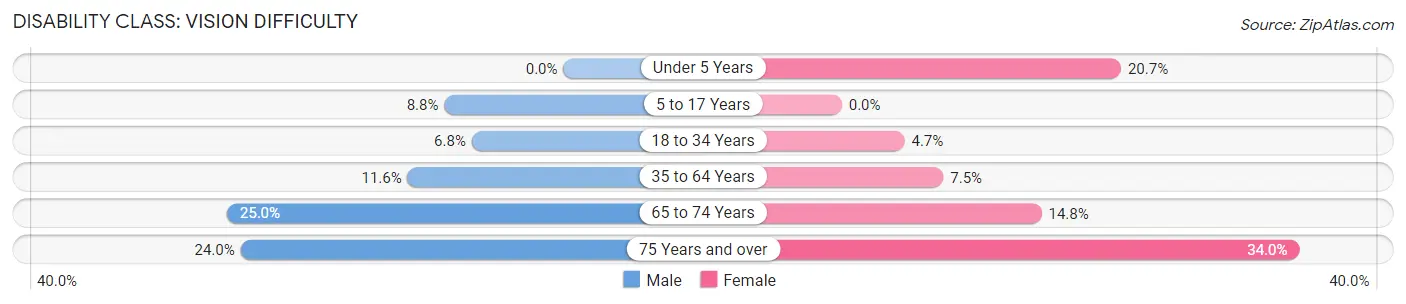
| Age Bracket | Male | Female |
| Under 5 Years | 0 (0.0%) | 79 (20.7%) |
| 5 to 17 Years | 113 (8.8%) | 0 (0.0%) |
| 18 to 34 Years | 127 (6.8%) | 76 (4.7%) |
| 35 to 64 Years | 356 (11.6%) | 217 (7.5%) |
| 65 to 74 Years | 251 (25.0%) | 149 (14.8%) |
| 75 Years and over | 140 (24.0%) | 232 (34.0%) |
Disability Class: Cognitive Difficulty
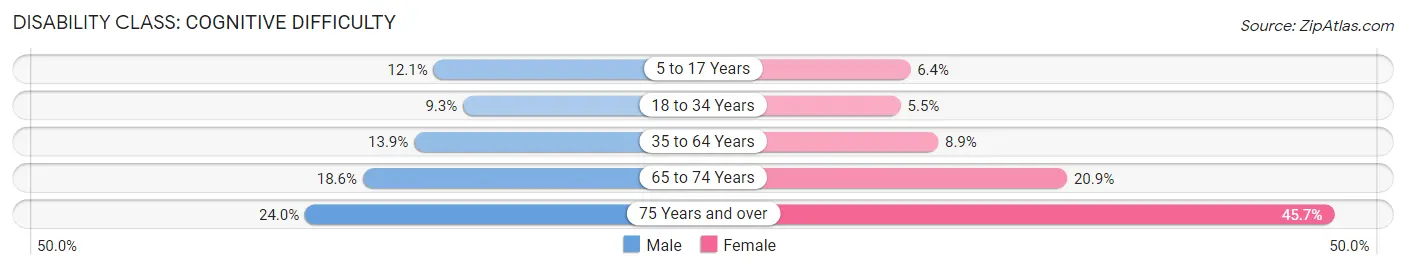
| Age Bracket | Male | Female |
| 5 to 17 Years | 154 (12.0%) | 92 (6.4%) |
| 18 to 34 Years | 174 (9.3%) | 89 (5.5%) |
| 35 to 64 Years | 426 (13.9%) | 257 (8.9%) |
| 65 to 74 Years | 187 (18.6%) | 210 (20.9%) |
| 75 Years and over | 140 (24.0%) | 312 (45.7%) |
Disability Class: Ambulatory Difficulty
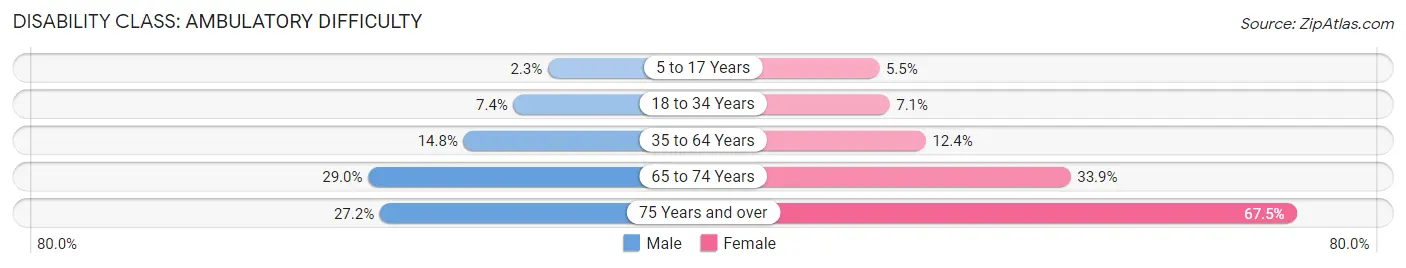
| Age Bracket | Male | Female |
| 5 to 17 Years | 29 (2.3%) | 80 (5.5%) |
| 18 to 34 Years | 138 (7.4%) | 115 (7.0%) |
| 35 to 64 Years | 455 (14.8%) | 358 (12.4%) |
| 65 to 74 Years | 291 (29.0%) | 341 (33.9%) |
| 75 Years and over | 159 (27.2%) | 461 (67.5%) |
Disability Class: Self-Care Difficulty
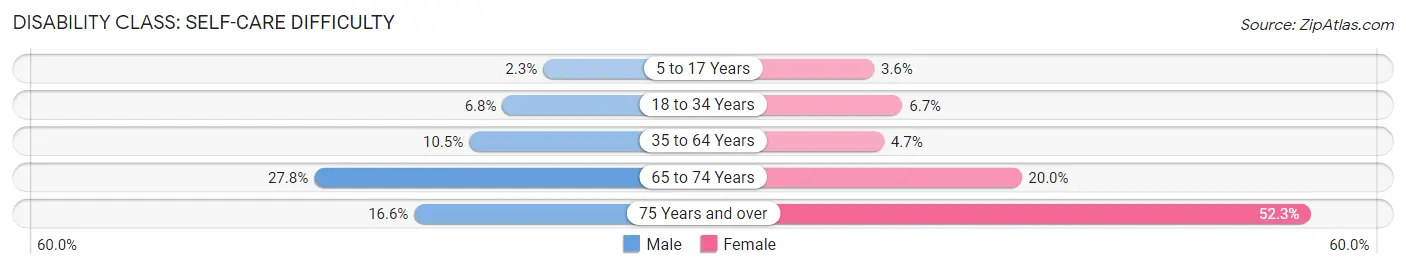
| Age Bracket | Male | Female |
| 5 to 17 Years | 29 (2.3%) | 52 (3.6%) |
| 18 to 34 Years | 127 (6.8%) | 110 (6.7%) |
| 35 to 64 Years | 323 (10.5%) | 135 (4.7%) |
| 65 to 74 Years | 279 (27.8%) | 201 (20.0%) |
| 75 Years and over | 97 (16.6%) | 357 (52.3%) |
Technology Access in Socorro County
Computing Device Access in Socorro County
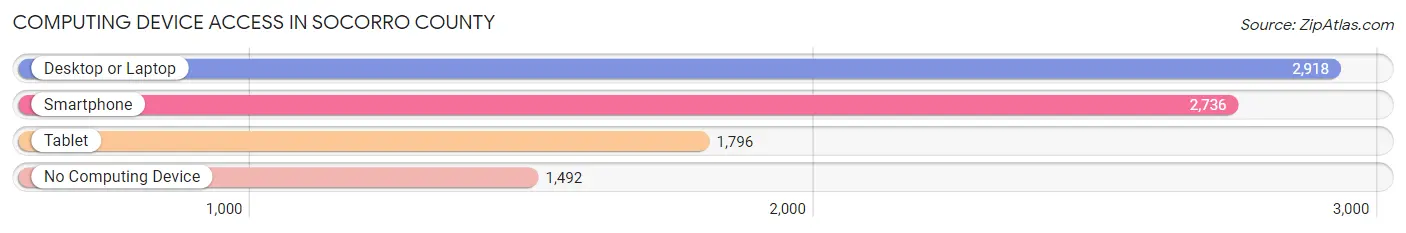
| Device Type | # Households | % Households |
| Desktop or Laptop | 2,918 | 58.9% |
| Smartphone | 2,736 | 55.2% |
| Tablet | 1,796 | 36.3% |
| No Computing Device | 1,492 | 30.1% |
| Total | 4,953 | 100.0% |
Internet Access in Socorro County
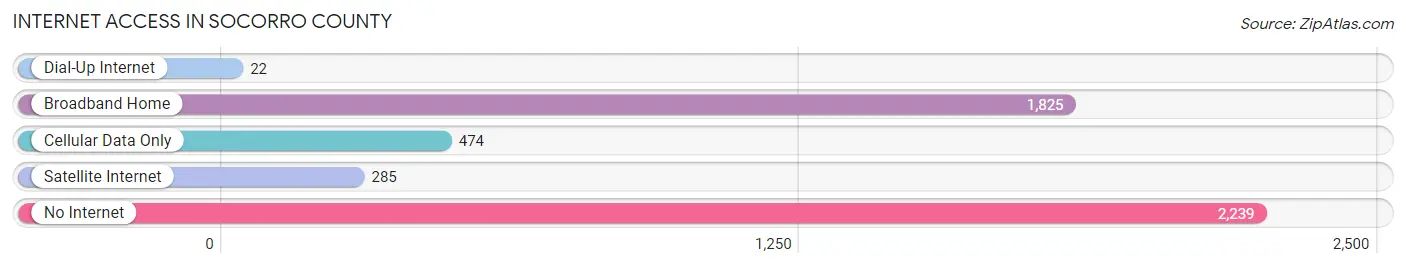
| Internet Type | # Households | % Households |
| Dial-Up Internet | 22 | 0.4% |
| Broadband Home | 1,825 | 36.8% |
| Cellular Data Only | 474 | 9.6% |
| Satellite Internet | 285 | 5.8% |
| No Internet | 2,239 | 45.2% |
| Total | 4,953 | 100.0% |
Socorro County Summary
Socorro County is located in the south-central region of New Mexico, and is bordered by Catron, Sierra, and Valencia counties. The county seat is the city of Socorro, and the county has a total area of 5,569 square miles. As of the 2010 census, the population of Socorro County was 17,866.
History
The area that is now Socorro County was originally inhabited by the Jornada Mogollon people, who were a semi-nomadic hunter-gatherer culture. The first Europeans to explore the area were Spanish explorers in the late 16th century. The area was part of the Spanish province of Nuevo Mexico, and was later part of the Mexican state of Chihuahua.
In 1848, the Treaty of Guadalupe Hidalgo ended the Mexican-American War and ceded the area to the United States. The area was then part of the New Mexico Territory, and in 1863, Socorro County was established. The county was named after the city of Socorro, which was founded in 1854.
Geography
Socorro County is located in the south-central region of New Mexico, and is bordered by Catron, Sierra, and Valencia counties. The county has a total area of 5,569 square miles, and is the fourth-largest county in the state. The county is mostly mountainous, with the San Mateo Mountains to the west and the Magdalena Mountains to the east. The Rio Grande flows through the county, and the county also contains the Sevilleta National Wildlife Refuge.
Economy
The economy of Socorro County is largely based on agriculture and mining. The county is home to several large farms, and the main crops grown in the county are alfalfa, cotton, and chile peppers. The county is also home to several large mining operations, including copper, gold, and uranium mines.
The county is also home to several large employers, including the National Radio Astronomy Observatory, the New Mexico Institute of Mining and Technology, and the White Sands Missile Range. The county is also home to several tourist attractions, including the Bosque del Apache National Wildlife Refuge and the Very Large Array.
Demographics
As of the 2010 census, the population of Socorro County was 17,866. The population is largely Hispanic, with 73.3% of the population identifying as Hispanic or Latino. The median household income in the county is $37,845, and the median age is 37.7 years. The county has a poverty rate of 22.3%, and the unemployment rate is 6.2%.
Conclusion
Socorro County is located in the south-central region of New Mexico, and is bordered by Catron, Sierra, and Valencia counties. The county has a total area of 5,569 square miles, and is the fourth-largest county in the state. The economy of Socorro County is largely based on agriculture and mining, and the county is home to several large employers. As of the 2010 census, the population of Socorro County was 17,866, and the population is largely Hispanic.
Common Questions
What is Per Capita Income in Socorro County?
Per Capita income in Socorro County is $21,792.
What is the Median Family Income in Socorro County?
Median Family Income in Socorro County is $51,789.
What is the Median Household income in Socorro County?
Median Household Income in Socorro County is $40,699.
What is Income or Wage Gap in Socorro County?
Income or Wage Gap in Socorro County is 21.7%.
Women in Socorro County earn 78.3 cents for every dollar earned by a man.
What is Family Income Deficit in Socorro County?
Family Income Deficit in Socorro County is $9,535.
Families that are below poverty line in Socorro County earn $9,535 less on average than the poverty threshold level.
What is Inequality or Gini Index in Socorro County?
Inequality or Gini Index in Socorro County is 0.48.
What is the Total Population of Socorro County?
Total Population of Socorro County is 16,453.
What is the Total Male Population of Socorro County?
Total Male Population of Socorro County is 8,366.
What is the Total Female Population of Socorro County?
Total Female Population of Socorro County is 8,087.
What is the Ratio of Males per 100 Females in Socorro County?
There are 103.45 Males per 100 Females in Socorro County.
What is the Ratio of Females per 100 Males in Socorro County?
There are 96.67 Females per 100 Males in Socorro County.
What is the Median Population Age in Socorro County?
Median Population Age in Socorro County is 39.6 Years.
What is the Average Family Size in Socorro County
Average Family Size in Socorro County is 4.0 People.
What is the Average Household Size in Socorro County
Average Household Size in Socorro County is 3.2 People.
How Large is the Labor Force in Socorro County?
There are 5,373 People in the Labor Forcein in Socorro County.
What is the Percentage of People in the Labor Force in Socorro County?
40.8% of People are in the Labor Force in Socorro County.
What is the Unemployment Rate in Socorro County?
Unemployment Rate in Socorro County is 4.4%.