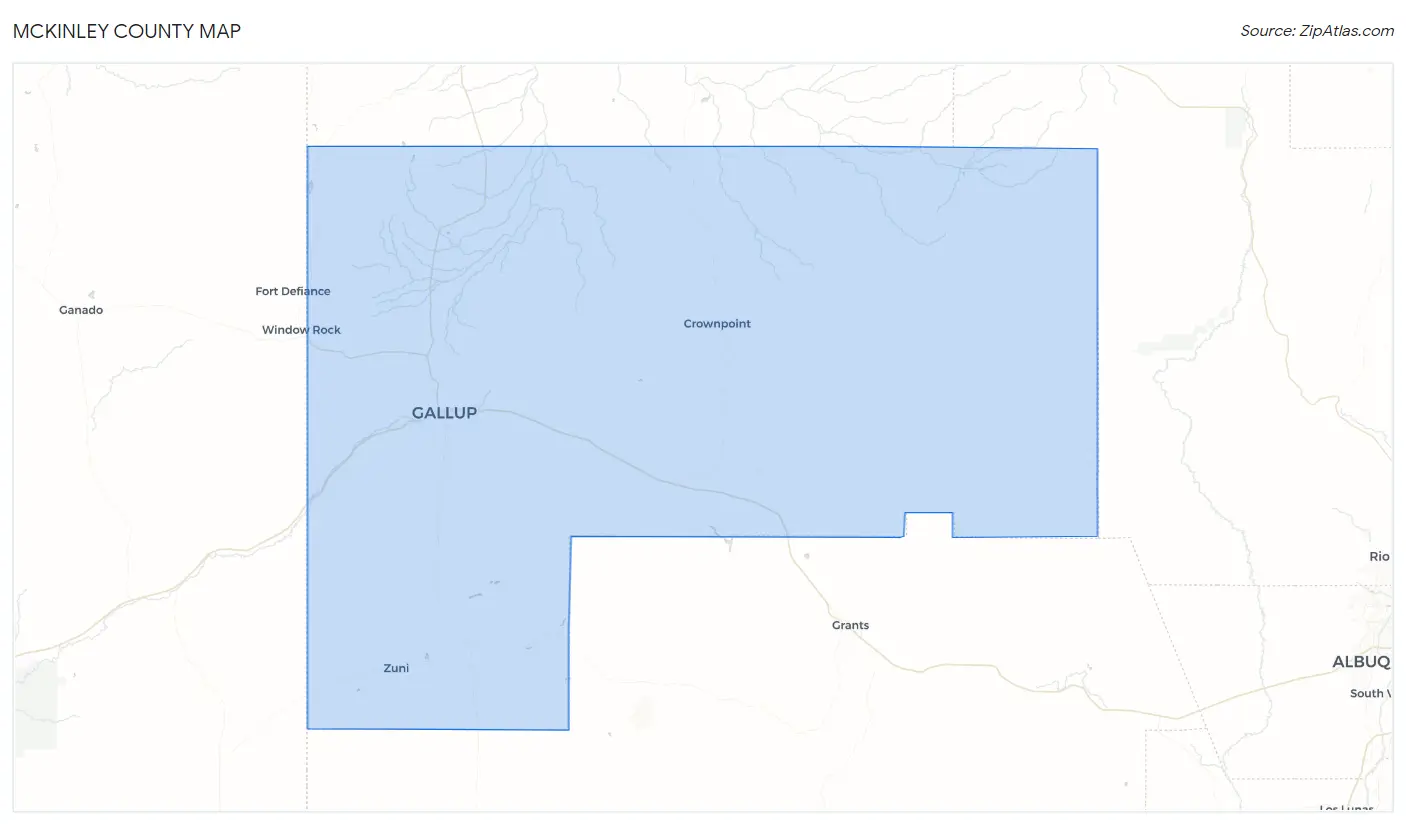
McKinley County, NM Map & Demographics
McKinley County Map
McKinley County Overview
$19,188
PER CAPITA INCOME
$49,616
AVG FAMILY INCOME
$44,029
AVG HOUSEHOLD INCOME
16.3%
WAGE / INCOME GAP [ % ]
83.7¢/ $1
WAGE / INCOME GAP [ $ ]
$15,189
FAMILY INCOME DEFICIT
0.50
INEQUALITY / GINI INDEX
72,073
TOTAL POPULATION
35,101
MALE POPULATION
36,972
FEMALE POPULATION
94.94
MALES / 100 FEMALES
105.33
FEMALES / 100 MALES
33.6
MEDIAN AGE
4.1
AVG FAMILY SIZE
3.4
AVG HOUSEHOLD SIZE
26,387
LABOR FORCE [ PEOPLE ]
48.5%
PERCENT IN LABOR FORCE
9.6%
UNEMPLOYMENT RATE
McKinley County Area Codes
Income in McKinley County
Income Overview in McKinley County
Per Capita Income in McKinley County is $19,188, while median incomes of families and households are $49,616 and $44,029 respectively.
| Characteristic | Number | Measure |
| Per Capita Income | 72,073 | $19,188 |
| Median Family Income | 15,006 | $49,616 |
| Mean Family Income | 15,006 | $65,033 |
| Median Household Income | 20,913 | $44,029 |
| Mean Household Income | 20,913 | $60,105 |
| Income Deficit | 15,006 | $15,189 |
| Wage / Income Gap (%) | 72,073 | 16.26% |
| Wage / Income Gap ($) | 72,073 | 83.74¢ per $1 |
| Gini / Inequality Index | 72,073 | 0.50 |
Earnings by Sex in McKinley County
Average Earnings in McKinley County are $30,677, $33,390 for men and $27,961 for women, a difference of 16.3%.
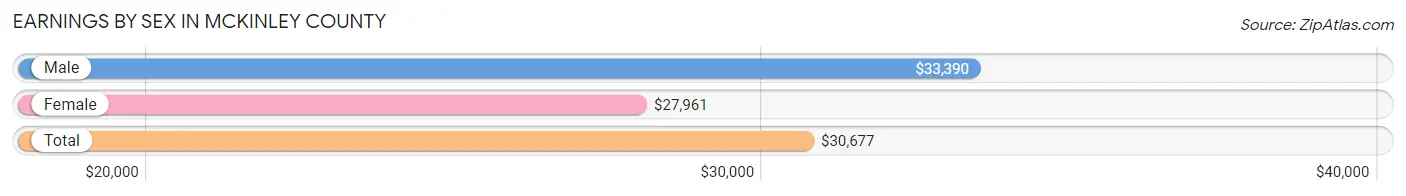
| Sex | Number | Average Earnings |
| Male | 12,972 (48.1%) | $33,390 |
| Female | 13,969 (51.8%) | $27,961 |
| Total | 26,941 (100.0%) | $30,677 |
Earnings by Sex by Income Bracket in McKinley County
The most common earnings brackets in McKinley County are $55,000 to $64,999 for men (1,223 | 9.4%) and $75,000 to $99,999 for women (1,014 | 7.3%).
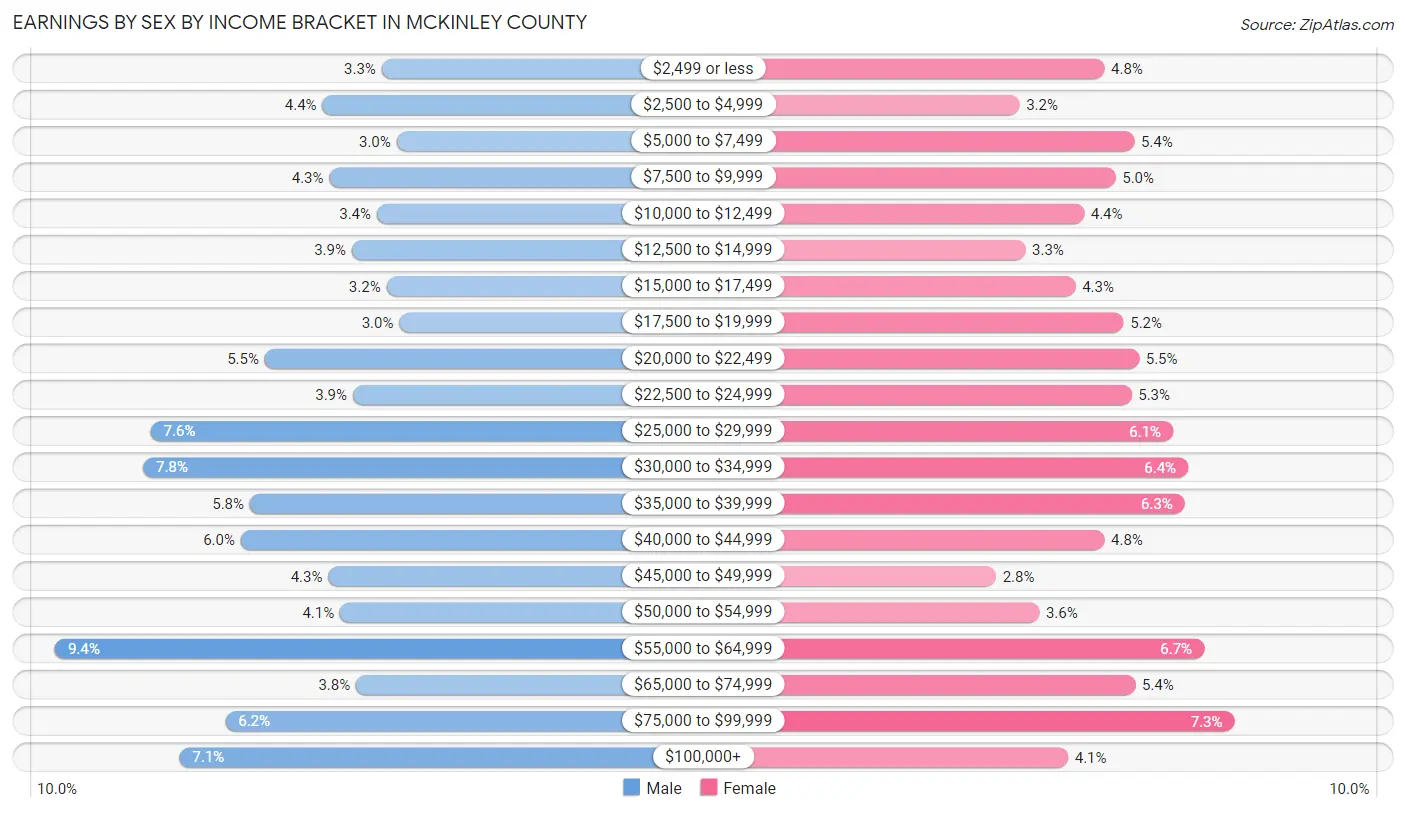
| Income | Male | Female |
| $2,499 or less | 430 (3.3%) | 673 (4.8%) |
| $2,500 to $4,999 | 574 (4.4%) | 451 (3.2%) |
| $5,000 to $7,499 | 393 (3.0%) | 751 (5.4%) |
| $7,500 to $9,999 | 557 (4.3%) | 702 (5.0%) |
| $10,000 to $12,499 | 441 (3.4%) | 620 (4.4%) |
| $12,500 to $14,999 | 502 (3.9%) | 466 (3.3%) |
| $15,000 to $17,499 | 418 (3.2%) | 598 (4.3%) |
| $17,500 to $19,999 | 387 (3.0%) | 723 (5.2%) |
| $20,000 to $22,499 | 713 (5.5%) | 764 (5.5%) |
| $22,500 to $24,999 | 500 (3.8%) | 744 (5.3%) |
| $25,000 to $29,999 | 991 (7.6%) | 853 (6.1%) |
| $30,000 to $34,999 | 1,009 (7.8%) | 892 (6.4%) |
| $35,000 to $39,999 | 750 (5.8%) | 884 (6.3%) |
| $40,000 to $44,999 | 772 (5.9%) | 673 (4.8%) |
| $45,000 to $49,999 | 559 (4.3%) | 390 (2.8%) |
| $50,000 to $54,999 | 530 (4.1%) | 503 (3.6%) |
| $55,000 to $64,999 | 1,223 (9.4%) | 935 (6.7%) |
| $65,000 to $74,999 | 492 (3.8%) | 755 (5.4%) |
| $75,000 to $99,999 | 810 (6.2%) | 1,014 (7.3%) |
| $100,000+ | 921 (7.1%) | 578 (4.1%) |
| Total | 12,972 (100.0%) | 13,969 (100.0%) |
Earnings by Sex by Educational Attainment in McKinley County
Average earnings in McKinley County are $35,492 for men and $30,985 for women, a difference of 12.7%. Men with an educational attainment of graduate degree enjoy the highest average annual earnings of $86,744, while those with less than high school education earn the least with $24,133. Women with an educational attainment of graduate degree earn the most with the average annual earnings of $69,338, while those with less than high school education have the smallest earnings of $18,091.
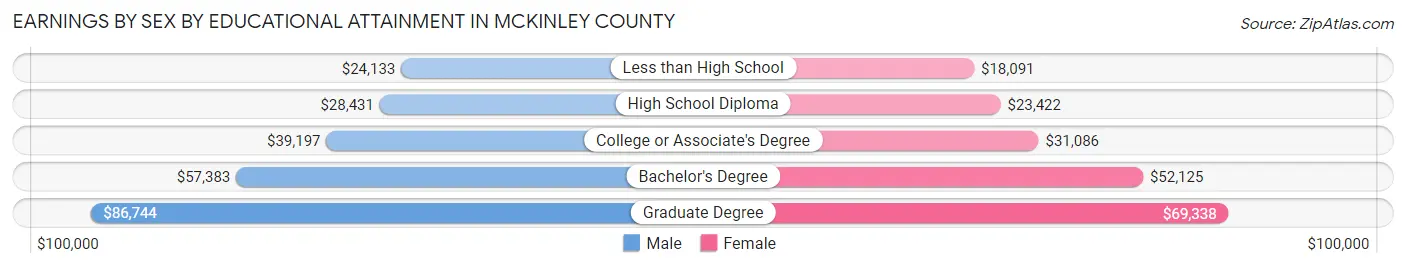
| Educational Attainment | Male Income | Female Income |
| Less than High School | $24,133 | $18,091 |
| High School Diploma | $28,431 | $23,422 |
| College or Associate's Degree | $39,197 | $31,086 |
| Bachelor's Degree | $57,383 | $52,125 |
| Graduate Degree | $86,744 | $69,338 |
| Total | $35,492 | $30,985 |
Family Income in McKinley County
Family Income Brackets in McKinley County
According to the McKinley County family income data, there are 2,641 families falling into the $50,000 to $74,999 income range, which is the most common income bracket and makes up 17.6% of all families. Conversely, the $150,000 to $199,999 income bracket is the least frequent group with only 555 families (3.7%) belonging to this category.
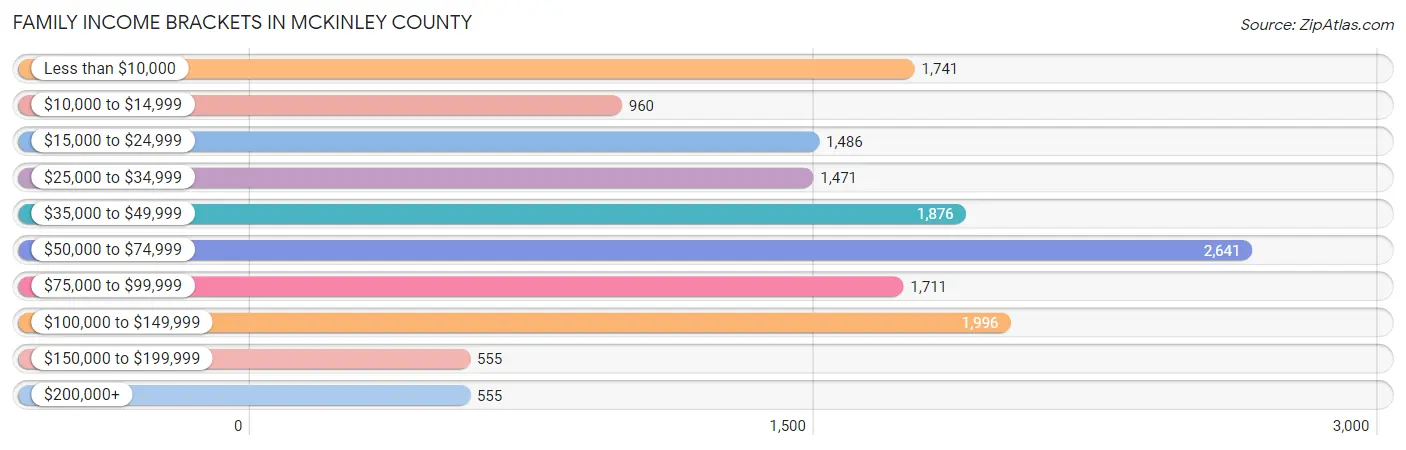
| Income Bracket | # Families | % Families |
| Less than $10,000 | 1,741 | 11.6% |
| $10,000 to $14,999 | 960 | 6.4% |
| $15,000 to $24,999 | 1,486 | 9.9% |
| $25,000 to $34,999 | 1,471 | 9.8% |
| $35,000 to $49,999 | 1,876 | 12.5% |
| $50,000 to $74,999 | 2,641 | 17.6% |
| $75,000 to $99,999 | 1,711 | 11.4% |
| $100,000 to $149,999 | 1,996 | 13.3% |
| $150,000 to $199,999 | 555 | 3.7% |
| $200,000+ | 555 | 3.7% |
Family Income by Famaliy Size in McKinley County
7+ person families (958 | 6.4%) account for the highest median family income in McKinley County with $61,667 per family, while 2-person families (5,724 | 38.1%) have the highest median income of $24,828 per family member.
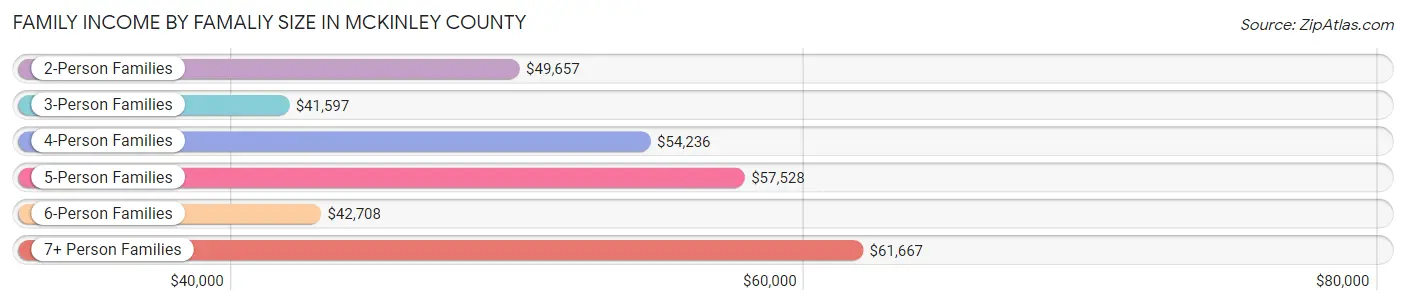
| Income Bracket | # Families | Median Income |
| 2-Person Families | 5,724 (38.1%) | $49,657 |
| 3-Person Families | 3,049 (20.3%) | $41,597 |
| 4-Person Families | 2,844 (19.0%) | $54,236 |
| 5-Person Families | 1,291 (8.6%) | $57,528 |
| 6-Person Families | 1,140 (7.6%) | $42,708 |
| 7+ Person Families | 958 (6.4%) | $61,667 |
| Total | 15,006 (100.0%) | $49,616 |
Family Income by Number of Earners in McKinley County
The median family income in McKinley County is $49,616, with families comprising 3+ earners (1,338) having the highest median family income of $116,250, while families with no earners (3,522) have the lowest median family income of $17,518, accounting for 8.9% and 23.5% of families, respectively.
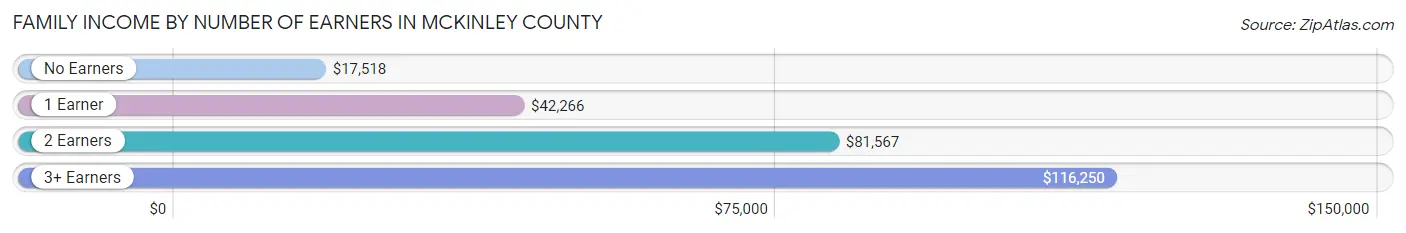
| Number of Earners | # Families | Median Income |
| No Earners | 3,522 (23.5%) | $17,518 |
| 1 Earner | 5,892 (39.3%) | $42,266 |
| 2 Earners | 4,254 (28.3%) | $81,567 |
| 3+ Earners | 1,338 (8.9%) | $116,250 |
| Total | 15,006 (100.0%) | $49,616 |
Household Income in McKinley County
Household Income Brackets in McKinley County
With 3,492 households falling in the category, the $50,000 to $74,999 income range is the most frequent in McKinley County, accounting for 16.7% of all households. In contrast, only 690 households (3.3%) fall into the $150,000 to $199,999 income bracket, making it the least populous group.
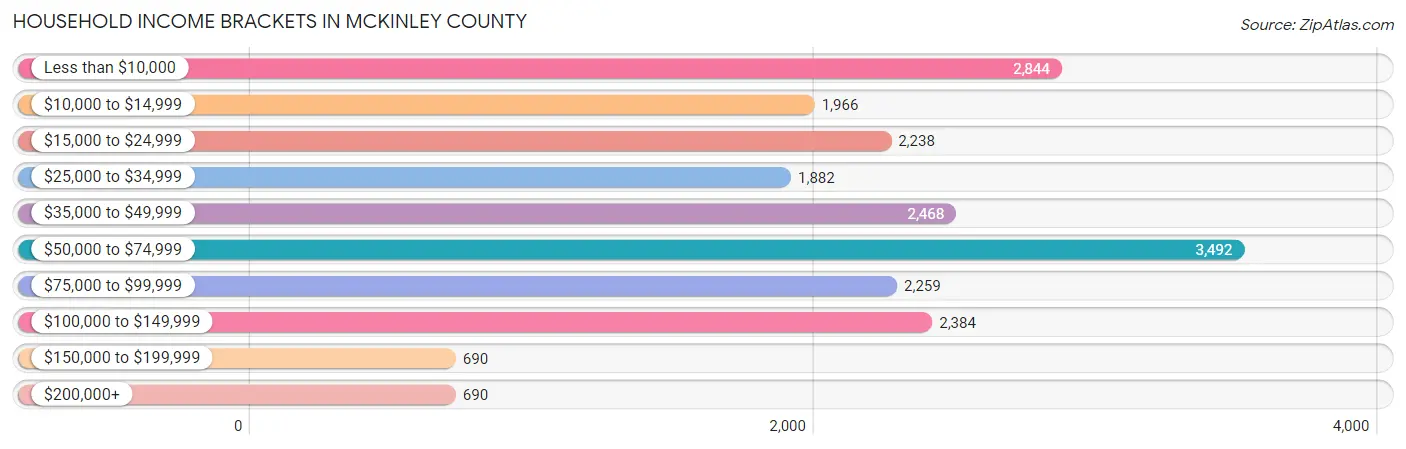
| Income Bracket | # Households | % Households |
| Less than $10,000 | 2,844 | 13.6% |
| $10,000 to $14,999 | 1,966 | 9.4% |
| $15,000 to $24,999 | 2,238 | 10.7% |
| $25,000 to $34,999 | 1,882 | 9.0% |
| $35,000 to $49,999 | 2,468 | 11.8% |
| $50,000 to $74,999 | 3,492 | 16.7% |
| $75,000 to $99,999 | 2,259 | 10.8% |
| $100,000 to $149,999 | 2,384 | 11.4% |
| $150,000 to $199,999 | 690 | 3.3% |
| $200,000+ | 690 | 3.3% |
Household Income by Householder Age in McKinley County
The median household income in McKinley County is $44,029, with the highest median household income of $50,660 found in the 25 to 44 years age bracket for the primary householder. A total of 6,092 households (29.1%) fall into this category. Meanwhile, the 15 to 24 years age bracket for the primary householder has the lowest median household income of $24,250, with 402 households (1.9%) in this group.
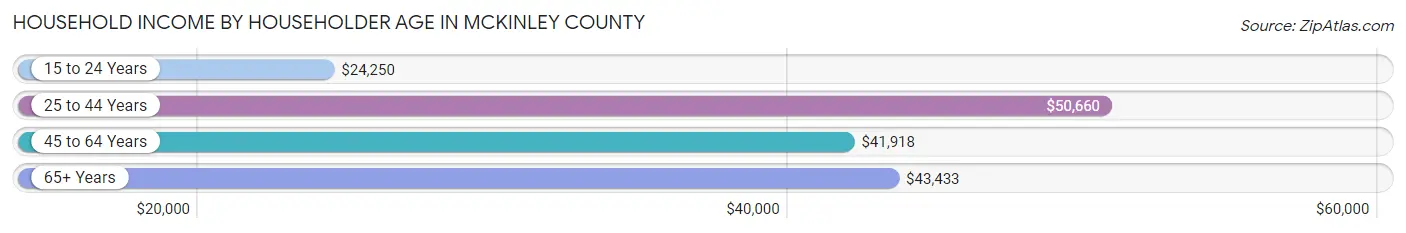
| Income Bracket | # Households | Median Income |
| 15 to 24 Years | 402 (1.9%) | $24,250 |
| 25 to 44 Years | 6,092 (29.1%) | $50,660 |
| 45 to 64 Years | 8,529 (40.8%) | $41,918 |
| 65+ Years | 5,890 (28.2%) | $43,433 |
| Total | 20,913 (100.0%) | $44,029 |
Poverty in McKinley County
Income Below Poverty by Sex and Age in McKinley County
With 32.2% poverty level for males and 34.9% for females among the residents of McKinley County, 5 year old males and 16 and 17 year old females are the most vulnerable to poverty, with 281 males (49.8%) and 636 females (51.8%) in their respective age groups living below the poverty level.
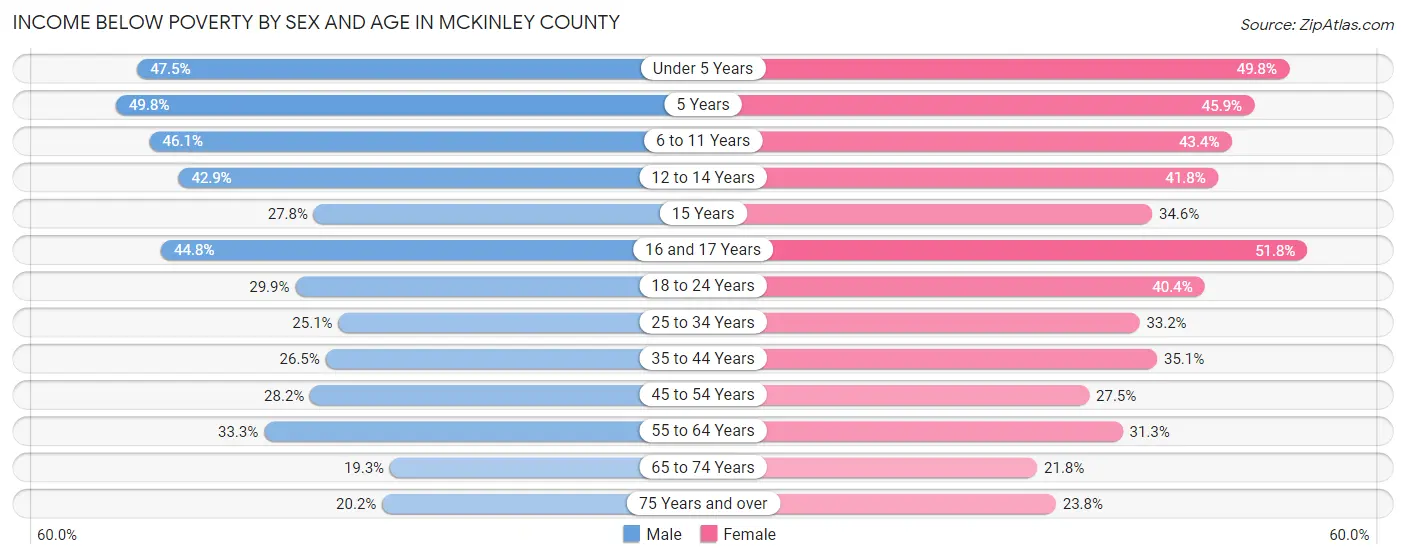
| Age Bracket | Male | Female |
| Under 5 Years | 1,062 (47.4%) | 1,107 (49.8%) |
| 5 Years | 281 (49.8%) | 318 (45.9%) |
| 6 to 11 Years | 1,717 (46.1%) | 1,451 (43.4%) |
| 12 to 14 Years | 765 (42.9%) | 746 (41.8%) |
| 15 Years | 162 (27.8%) | 142 (34.5%) |
| 16 and 17 Years | 577 (44.8%) | 636 (51.8%) |
| 18 to 24 Years | 980 (29.8%) | 1,363 (40.4%) |
| 25 to 34 Years | 1,350 (25.1%) | 1,781 (33.2%) |
| 35 to 44 Years | 1,146 (26.5%) | 1,534 (35.1%) |
| 45 to 54 Years | 1,086 (28.2%) | 1,141 (27.5%) |
| 55 to 64 Years | 1,296 (33.3%) | 1,374 (31.3%) |
| 65 to 74 Years | 461 (19.3%) | 703 (21.7%) |
| 75 Years and over | 269 (20.2%) | 502 (23.8%) |
| Total | 11,152 (32.2%) | 12,798 (34.9%) |
Income Above Poverty by Sex and Age in McKinley County
According to the poverty statistics in McKinley County, males aged 65 to 74 years and females aged 65 to 74 years are the age groups that are most secure financially, with 80.7% of males and 78.2% of females in these age groups living above the poverty line.
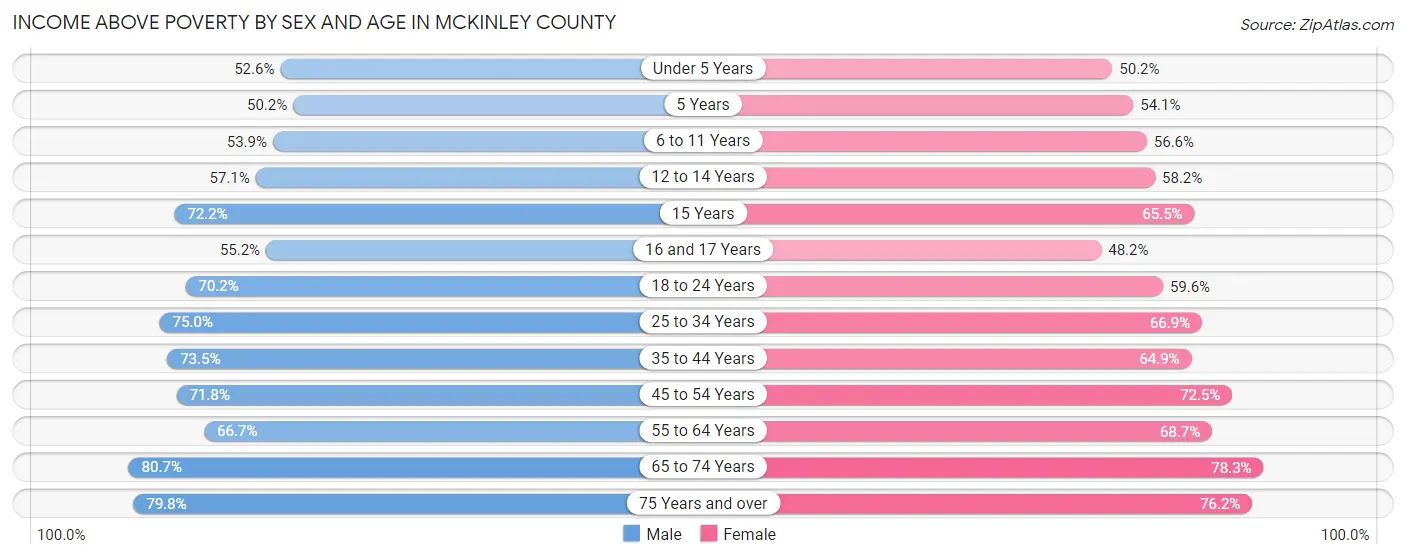
| Age Bracket | Male | Female |
| Under 5 Years | 1,176 (52.5%) | 1,117 (50.2%) |
| 5 Years | 283 (50.2%) | 375 (54.1%) |
| 6 to 11 Years | 2,010 (53.9%) | 1,895 (56.6%) |
| 12 to 14 Years | 1,020 (57.1%) | 1,037 (58.2%) |
| 15 Years | 421 (72.2%) | 269 (65.4%) |
| 16 and 17 Years | 711 (55.2%) | 591 (48.2%) |
| 18 to 24 Years | 2,303 (70.2%) | 2,012 (59.6%) |
| 25 to 34 Years | 4,039 (75.0%) | 3,591 (66.8%) |
| 35 to 44 Years | 3,182 (73.5%) | 2,835 (64.9%) |
| 45 to 54 Years | 2,765 (71.8%) | 3,002 (72.5%) |
| 55 to 64 Years | 2,592 (66.7%) | 3,020 (68.7%) |
| 65 to 74 Years | 1,926 (80.7%) | 2,529 (78.2%) |
| 75 Years and over | 1,064 (79.8%) | 1,605 (76.2%) |
| Total | 23,492 (67.8%) | 23,878 (65.1%) |
Income Below Poverty Among Married-Couple Families in McKinley County
The poverty statistics for married-couple families in McKinley County show that 17.2% or 1,224 of the total 7,109 families live below the poverty line. Families with 5 or more children have the highest poverty rate of 52.1%, comprising of 85 families. On the other hand, families with no children have the lowest poverty rate of 10.7%, which includes 450 families.
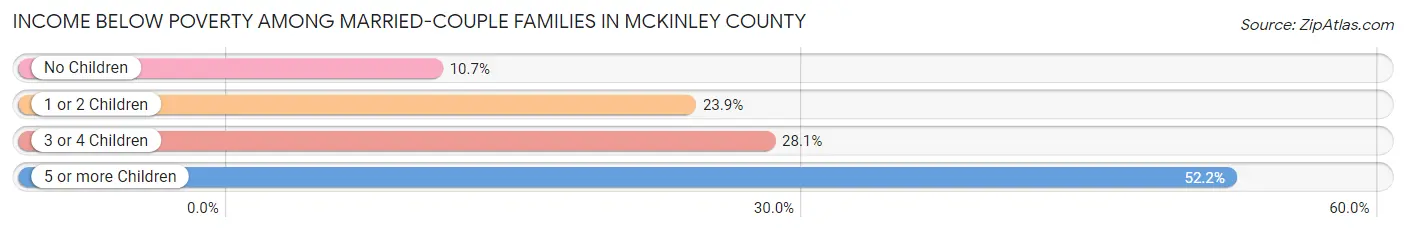
| Children | Above Poverty | Below Poverty |
| No Children | 3,761 (89.3%) | 450 (10.7%) |
| 1 or 2 Children | 1,438 (76.1%) | 452 (23.9%) |
| 3 or 4 Children | 608 (72.0%) | 237 (28.1%) |
| 5 or more Children | 78 (47.8%) | 85 (52.1%) |
| Total | 5,885 (82.8%) | 1,224 (17.2%) |
Income Below Poverty Among Single-Parent Households in McKinley County
According to the poverty data in McKinley County, 34.9% or 732 single-father households and 39.7% or 2,302 single-mother households are living below the poverty line. Among single-father households, those with 5 or more children have the highest poverty rate, with 46 households (76.7%) experiencing poverty. Likewise, among single-mother households, those with 5 or more children have the highest poverty rate, with 310 households (89.3%) falling below the poverty line.
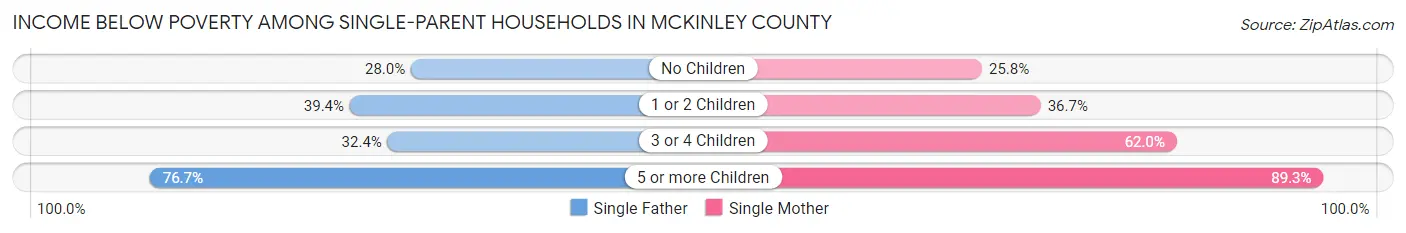
| Children | Single Father | Single Mother |
| No Children | 241 (28.0%) | 527 (25.8%) |
| 1 or 2 Children | 354 (39.4%) | 939 (36.7%) |
| 3 or 4 Children | 91 (32.4%) | 526 (62.0%) |
| 5 or more Children | 46 (76.7%) | 310 (89.3%) |
| Total | 732 (34.9%) | 2,302 (39.7%) |
Income Below Poverty Among Married-Couple vs Single-Parent Households in McKinley County
The poverty data for McKinley County shows that 1,224 of the married-couple family households (17.2%) and 3,034 of the single-parent households (38.4%) are living below the poverty level. Within the married-couple family households, those with 5 or more children have the highest poverty rate, with 85 households (52.1%) falling below the poverty line. Among the single-parent households, those with 5 or more children have the highest poverty rate, with 356 household (87.5%) living below poverty.
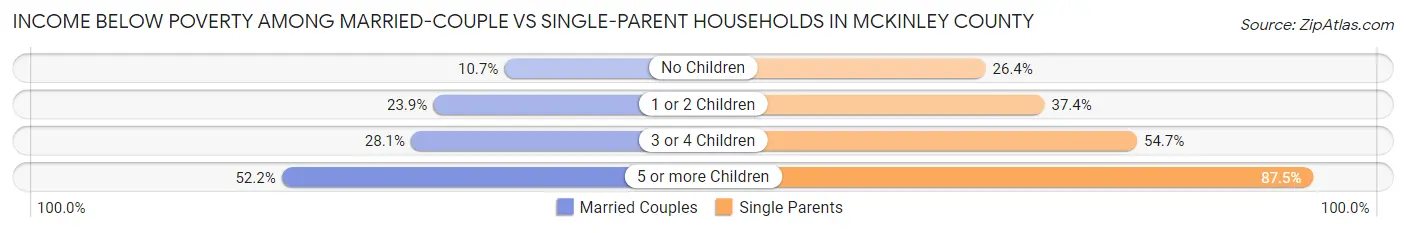
| Children | Married-Couple Families | Single-Parent Households |
| No Children | 450 (10.7%) | 768 (26.4%) |
| 1 or 2 Children | 452 (23.9%) | 1,293 (37.4%) |
| 3 or 4 Children | 237 (28.1%) | 617 (54.6%) |
| 5 or more Children | 85 (52.1%) | 356 (87.5%) |
| Total | 1,224 (17.2%) | 3,034 (38.4%) |
Race in McKinley County
The most populous races in McKinley County are Native / Alaskan (55,049 | 76.4%), Hispanic or Latino (10,559 | 14.6%), and White / Caucasian (7,477 | 10.4%).
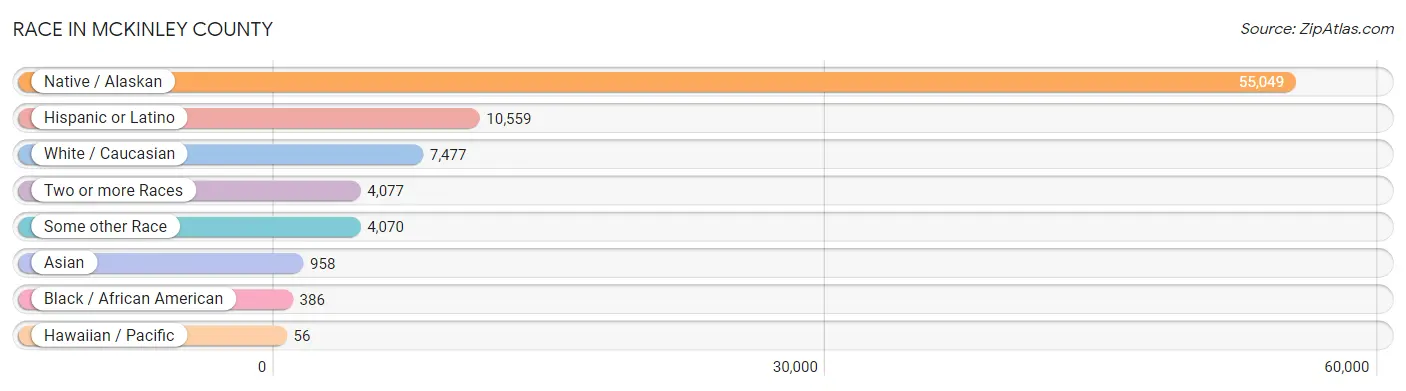
| Race | # Population | % Population |
| Asian | 958 | 1.3% |
| Black / African American | 386 | 0.5% |
| Hawaiian / Pacific | 56 | 0.1% |
| Hispanic or Latino | 10,559 | 14.6% |
| Native / Alaskan | 55,049 | 76.4% |
| White / Caucasian | 7,477 | 10.4% |
| Two or more Races | 4,077 | 5.7% |
| Some other Race | 4,070 | 5.7% |
| Total | 72,073 | 100.0% |
Ancestry in McKinley County
The most populous ancestries reported in McKinley County are Navajo (47,777 | 66.3%), Pueblo (9,282 | 12.9%), Mexican (8,031 | 11.1%), German (1,086 | 1.5%), and English (1,065 | 1.5%), together accounting for 93.3% of all McKinley County residents.
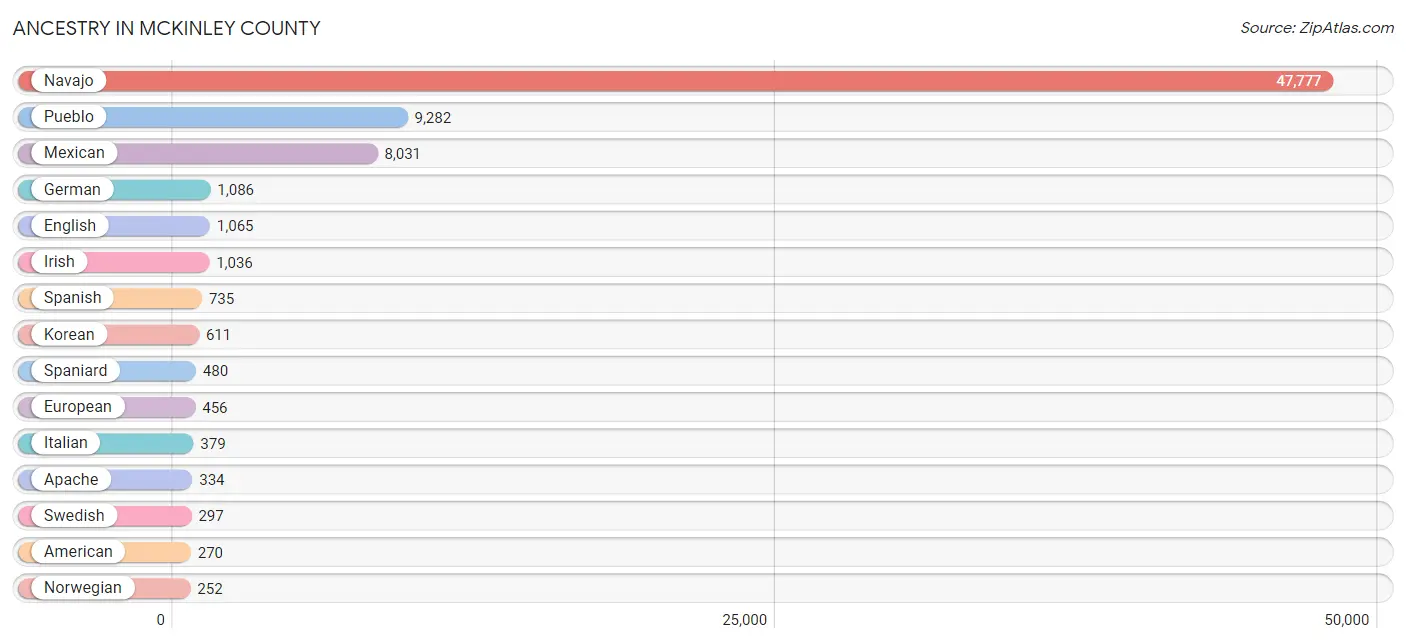
| Ancestry | # Population | % Population |
| African | 102 | 0.1% |
| Alaska Native | 3 | 0.0% |
| Aleut | 17 | 0.0% |
| American | 270 | 0.4% |
| Apache | 334 | 0.5% |
| Arab | 168 | 0.2% |
| Argentinean | 31 | 0.0% |
| Austrian | 18 | 0.0% |
| Bhutanese | 79 | 0.1% |
| Blackfeet | 8 | 0.0% |
| Brazilian | 26 | 0.0% |
| Burmese | 87 | 0.1% |
| Celtic | 18 | 0.0% |
| Central American | 195 | 0.3% |
| Cherokee | 128 | 0.2% |
| Cheyenne | 40 | 0.1% |
| Chippewa | 26 | 0.0% |
| Choctaw | 113 | 0.2% |
| Cree | 27 | 0.0% |
| Creek | 5 | 0.0% |
| Croatian | 37 | 0.1% |
| Crow | 9 | 0.0% |
| Cuban | 15 | 0.0% |
| Danish | 46 | 0.1% |
| Dominican | 88 | 0.1% |
| Dutch | 236 | 0.3% |
| Eastern European | 18 | 0.0% |
| Egyptian | 50 | 0.1% |
| English | 1,065 | 1.5% |
| European | 456 | 0.6% |
| Finnish | 4 | 0.0% |
| French | 236 | 0.3% |
| French Canadian | 3 | 0.0% |
| German | 1,086 | 1.5% |
| Greek | 15 | 0.0% |
| Guamanian / Chamorro | 45 | 0.1% |
| Guatemalan | 7 | 0.0% |
| Hopi | 140 | 0.2% |
| Hungarian | 123 | 0.2% |
| Irish | 1,036 | 1.4% |
| Iroquois | 37 | 0.1% |
| Italian | 379 | 0.5% |
| Jamaican | 85 | 0.1% |
| Kiowa | 2 | 0.0% |
| Korean | 611 | 0.9% |
| Lebanese | 7 | 0.0% |
| Lithuanian | 19 | 0.0% |
| Lumbee | 4 | 0.0% |
| Mexican | 8,031 | 11.1% |
| Mexican American Indian | 26 | 0.0% |
| Native Hawaiian | 25 | 0.0% |
| Navajo | 47,777 | 66.3% |
| Nicaraguan | 188 | 0.3% |
| Nigerian | 21 | 0.0% |
| Northern European | 25 | 0.0% |
| Norwegian | 252 | 0.4% |
| Palestinian | 73 | 0.1% |
| Pima | 46 | 0.1% |
| Polish | 144 | 0.2% |
| Portuguese | 40 | 0.1% |
| Pueblo | 9,282 | 12.9% |
| Puerto Rican | 69 | 0.1% |
| Romanian | 15 | 0.0% |
| Russian | 23 | 0.0% |
| Samoan | 22 | 0.0% |
| Scandinavian | 20 | 0.0% |
| Scotch-Irish | 58 | 0.1% |
| Scottish | 87 | 0.1% |
| Seminole | 45 | 0.1% |
| Sioux | 70 | 0.1% |
| Slavic | 41 | 0.1% |
| Slovak | 5 | 0.0% |
| South American | 31 | 0.0% |
| Spaniard | 480 | 0.7% |
| Spanish | 735 | 1.0% |
| Spanish American | 4 | 0.0% |
| Sri Lankan | 13 | 0.0% |
| Subsaharan African | 132 | 0.2% |
| Swedish | 297 | 0.4% |
| Swiss | 54 | 0.1% |
| Thai | 63 | 0.1% |
| Tlingit-Haida | 12 | 0.0% |
| Ukrainian | 19 | 0.0% |
| Ute | 42 | 0.1% |
| Welsh | 30 | 0.0% |
| Yaqui | 13 | 0.0% |
| Yuman | 33 | 0.1% | View All 87 Rows |
Immigrants in McKinley County
The most numerous immigrant groups reported in McKinley County came from Latin America (1,232 | 1.7%), Central America (1,122 | 1.6%), Mexico (1,117 | 1.5%), Asia (696 | 1.0%), and Philippines (476 | 0.7%), together accounting for 6.5% of all McKinley County residents.
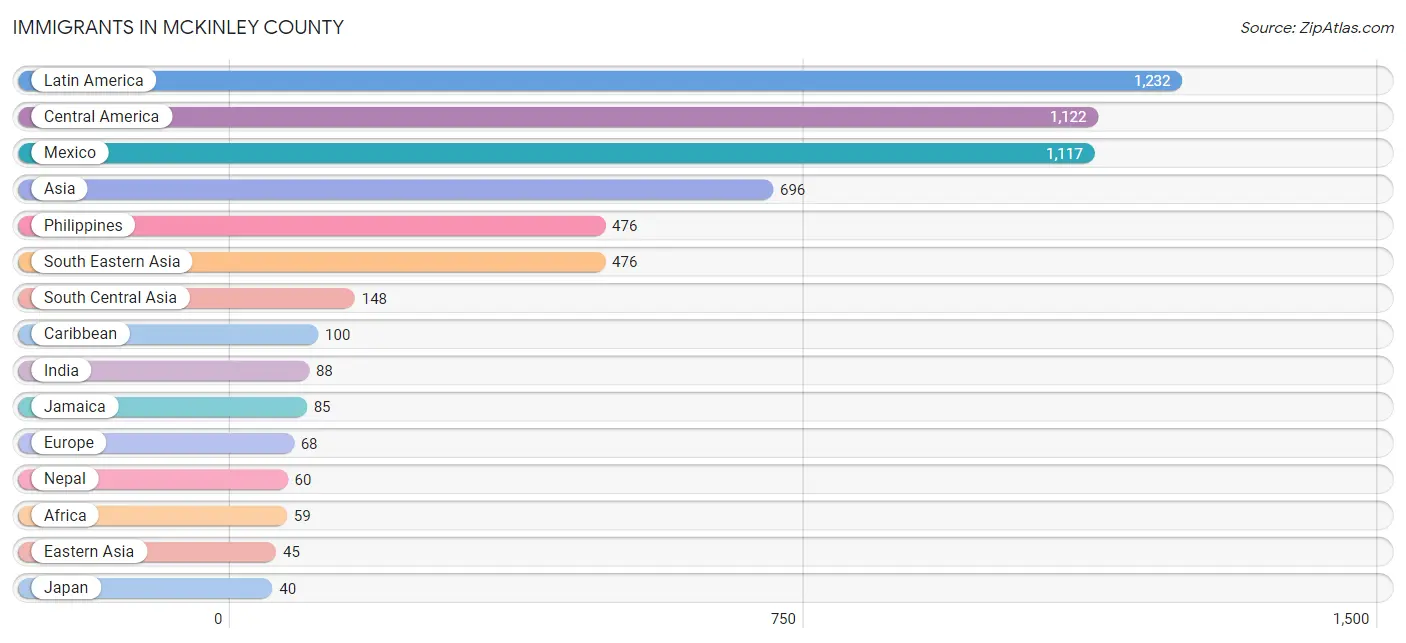
| Immigration Origin | # Population | % Population |
| Africa | 59 | 0.1% |
| Asia | 696 | 1.0% |
| Belarus | 7 | 0.0% |
| Brazil | 10 | 0.0% |
| Canada | 13 | 0.0% |
| Caribbean | 100 | 0.1% |
| Central America | 1,122 | 1.6% |
| China | 5 | 0.0% |
| Cuba | 15 | 0.0% |
| Eastern Asia | 45 | 0.1% |
| Eastern Europe | 26 | 0.0% |
| Europe | 68 | 0.1% |
| Germany | 30 | 0.0% |
| Guatemala | 5 | 0.0% |
| India | 88 | 0.1% |
| Italy | 9 | 0.0% |
| Jamaica | 85 | 0.1% |
| Japan | 40 | 0.1% |
| Latin America | 1,232 | 1.7% |
| Mexico | 1,117 | 1.5% |
| Morocco | 4 | 0.0% |
| Nepal | 60 | 0.1% |
| Nigeria | 21 | 0.0% |
| Northern Africa | 4 | 0.0% |
| Northern Europe | 3 | 0.0% |
| Philippines | 476 | 0.7% |
| Romania | 15 | 0.0% |
| Russia | 4 | 0.0% |
| South America | 10 | 0.0% |
| South Central Asia | 148 | 0.2% |
| South Eastern Asia | 476 | 0.7% |
| Southern Europe | 9 | 0.0% |
| Western Africa | 21 | 0.0% |
| Western Europe | 30 | 0.0% | View All 34 Rows |
Sex and Age in McKinley County
Sex and Age in McKinley County
The most populous age groups in McKinley County are 10 to 14 Years (3,151 | 9.0%) for men and 10 to 14 Years (3,247 | 8.8%) for women.
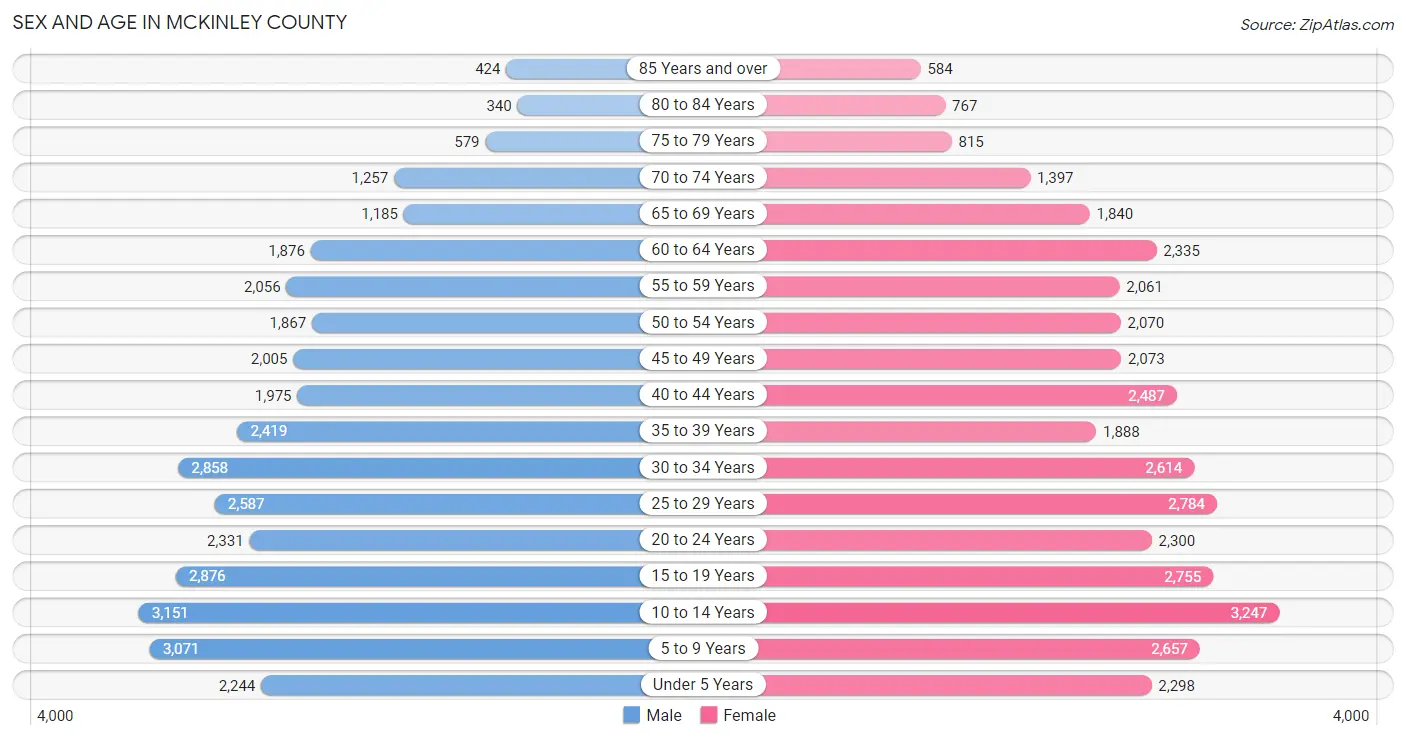
| Age Bracket | Male | Female |
| Under 5 Years | 2,244 (6.4%) | 2,298 (6.2%) |
| 5 to 9 Years | 3,071 (8.7%) | 2,657 (7.2%) |
| 10 to 14 Years | 3,151 (9.0%) | 3,247 (8.8%) |
| 15 to 19 Years | 2,876 (8.2%) | 2,755 (7.4%) |
| 20 to 24 Years | 2,331 (6.6%) | 2,300 (6.2%) |
| 25 to 29 Years | 2,587 (7.4%) | 2,784 (7.5%) |
| 30 to 34 Years | 2,858 (8.1%) | 2,614 (7.1%) |
| 35 to 39 Years | 2,419 (6.9%) | 1,888 (5.1%) |
| 40 to 44 Years | 1,975 (5.6%) | 2,487 (6.7%) |
| 45 to 49 Years | 2,005 (5.7%) | 2,073 (5.6%) |
| 50 to 54 Years | 1,867 (5.3%) | 2,070 (5.6%) |
| 55 to 59 Years | 2,056 (5.9%) | 2,061 (5.6%) |
| 60 to 64 Years | 1,876 (5.3%) | 2,335 (6.3%) |
| 65 to 69 Years | 1,185 (3.4%) | 1,840 (5.0%) |
| 70 to 74 Years | 1,257 (3.6%) | 1,397 (3.8%) |
| 75 to 79 Years | 579 (1.7%) | 815 (2.2%) |
| 80 to 84 Years | 340 (1.0%) | 767 (2.1%) |
| 85 Years and over | 424 (1.2%) | 584 (1.6%) |
| Total | 35,101 (100.0%) | 36,972 (100.0%) |
Families and Households in McKinley County
Median Family Size in McKinley County
The median family size in McKinley County is 4.12 persons per family, with single female/mother families (5,798 | 38.6%) accounting for the largest median family size of 4.63 persons per family. On the other hand, single male/father families (2,099 | 14.0%) represent the smallest median family size with 3.60 persons per family.
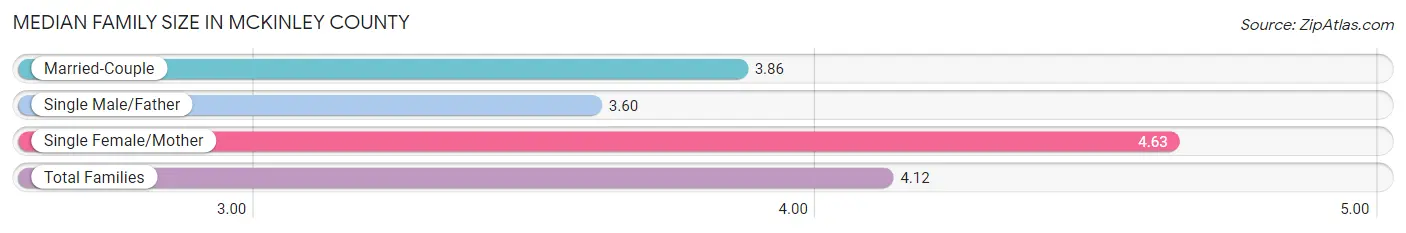
| Family Type | # Families | Family Size |
| Married-Couple | 7,109 (47.4%) | 3.86 |
| Single Male/Father | 2,099 (14.0%) | 3.60 |
| Single Female/Mother | 5,798 (38.6%) | 4.63 |
| Total Families | 15,006 (100.0%) | 4.12 |
Median Household Size in McKinley County
The median household size in McKinley County is 3.40 persons per household, with single female/mother households (5,798 | 27.7%) accounting for the largest median household size of 4.83 persons per household. non-family households (5,907 | 28.2%) represent the smallest median household size with 1.22 persons per household.
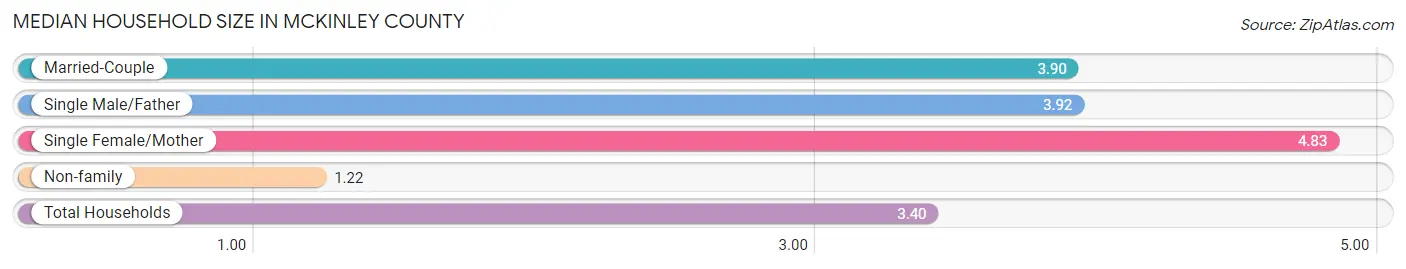
| Household Type | # Households | Household Size |
| Married-Couple | 7,109 (34.0%) | 3.90 |
| Single Male/Father | 2,099 (10.0%) | 3.92 |
| Single Female/Mother | 5,798 (27.7%) | 4.83 |
| Non-family | 5,907 (28.2%) | 1.22 |
| Total Households | 20,913 (100.0%) | 3.40 |
Household Size by Marriage Status in McKinley County
Out of a total of 20,913 households in McKinley County, 15,006 (71.8%) are family households, while 5,907 (28.2%) are nonfamily households. The most numerous type of family households are 2-person households, comprising 5,257, and the most common type of nonfamily households are 1-person households, comprising 4,943.
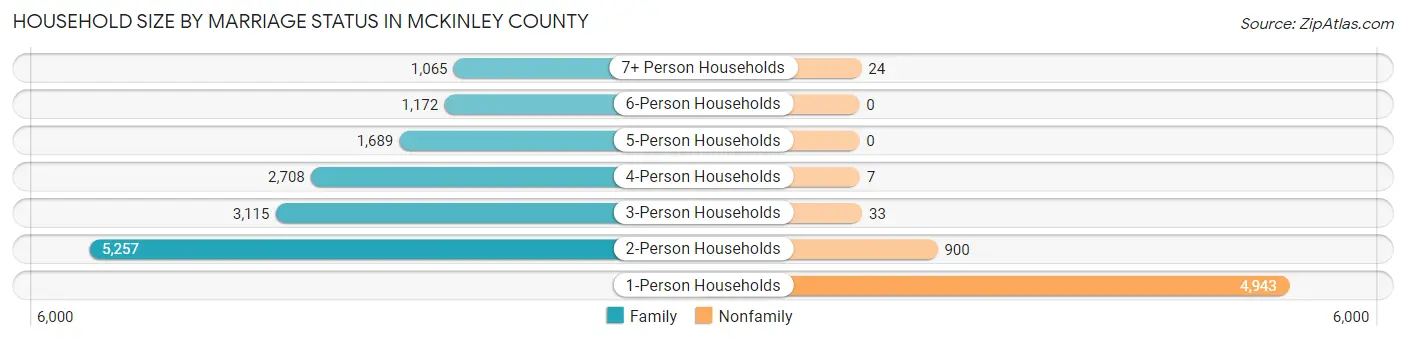
| Household Size | Family Households | Nonfamily Households |
| 1-Person Households | - | 4,943 (23.6%) |
| 2-Person Households | 5,257 (25.1%) | 900 (4.3%) |
| 3-Person Households | 3,115 (14.9%) | 33 (0.2%) |
| 4-Person Households | 2,708 (13.0%) | 7 (0.0%) |
| 5-Person Households | 1,689 (8.1%) | 0 (0.0%) |
| 6-Person Households | 1,172 (5.6%) | 0 (0.0%) |
| 7+ Person Households | 1,065 (5.1%) | 24 (0.1%) |
| Total | 15,006 (71.8%) | 5,907 (28.2%) |
Female Fertility in McKinley County
Fertility by Age in McKinley County
Average fertility rate in McKinley County is 52.0 births per 1,000 women. Women in the age bracket of 20 to 34 years have the highest fertility rate with 90.0 births per 1,000 women. Women in the age bracket of 20 to 34 years acount for 76.7% of all women with births.
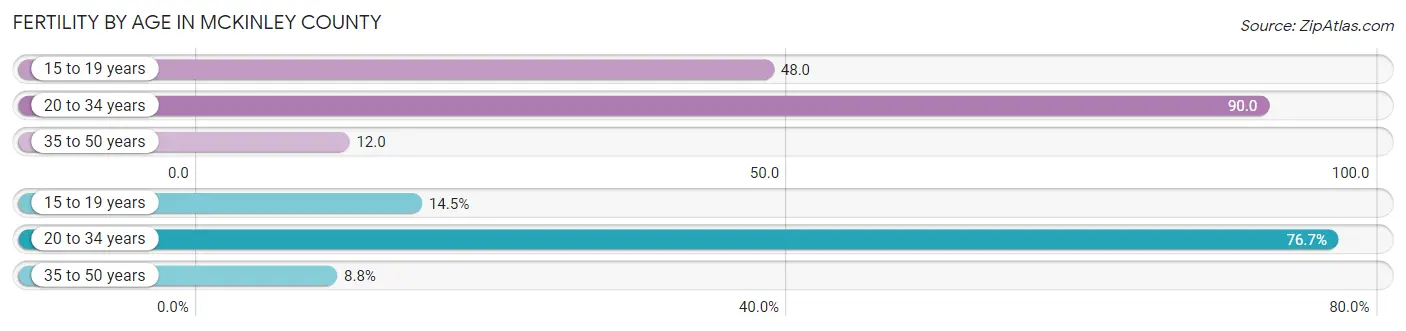
| Age Bracket | Women with Births | Births / 1,000 Women |
| 15 to 19 years | 131 (14.5%) | 48.0 |
| 20 to 34 years | 692 (76.7%) | 90.0 |
| 35 to 50 years | 79 (8.8%) | 12.0 |
| Total | 902 (100.0%) | 52.0 |
Fertility by Age by Marriage Status in McKinley County
23.3% of women with births (902) in McKinley County are married. The highest percentage of unmarried women with births falls into 15 to 19 years age bracket with 100.0% of them unmarried at the time of birth, while the lowest percentage of unmarried women with births belong to 35 to 50 years age bracket with 35.4% of them unmarried.
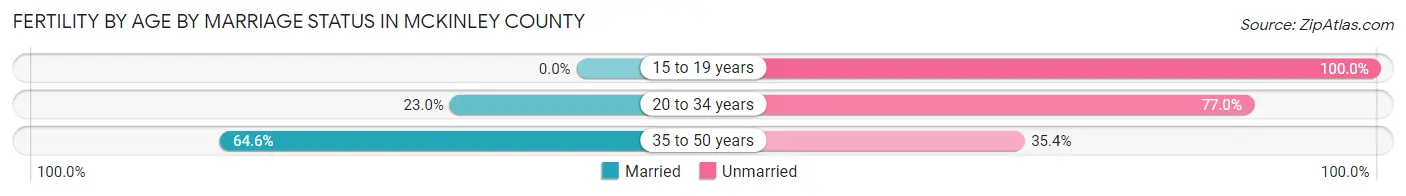
| Age Bracket | Married | Unmarried |
| 15 to 19 years | 0 (0.0%) | 131 (100.0%) |
| 20 to 34 years | 159 (23.0%) | 533 (77.0%) |
| 35 to 50 years | 51 (64.6%) | 28 (35.4%) |
| Total | 210 (23.3%) | 692 (76.7%) |
Fertility by Education in McKinley County
Average fertility rate in McKinley County is 52.0 births per 1,000 women. Women with the education attainment of bachelor's degree have the highest fertility rate of 58.0 births per 1,000 women, while women with the education attainment of graduate degree have the lowest fertility at 17.0 births per 1,000 women. Women with the education attainment of college or associate's degree represent 38.1% of all women with births.
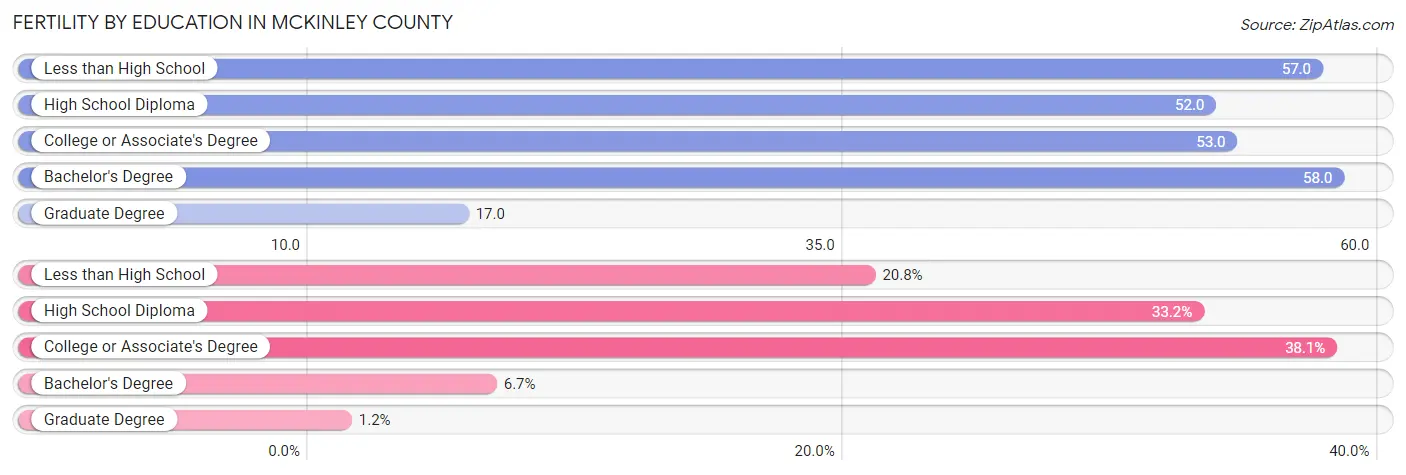
| Educational Attainment | Women with Births | Births / 1,000 Women |
| Less than High School | 188 (20.8%) | 57.0 |
| High School Diploma | 299 (33.2%) | 52.0 |
| College or Associate's Degree | 344 (38.1%) | 53.0 |
| Bachelor's Degree | 60 (6.7%) | 58.0 |
| Graduate Degree | 11 (1.2%) | 17.0 |
| Total | 902 (100.0%) | 52.0 |
Fertility by Education by Marriage Status in McKinley County
76.7% of women with births in McKinley County are unmarried. Women with the educational attainment of graduate degree are most likely to be married with 100.0% of them married at childbirth, while women with the educational attainment of less than high school are least likely to be married with 84.6% of them unmarried at childbirth.
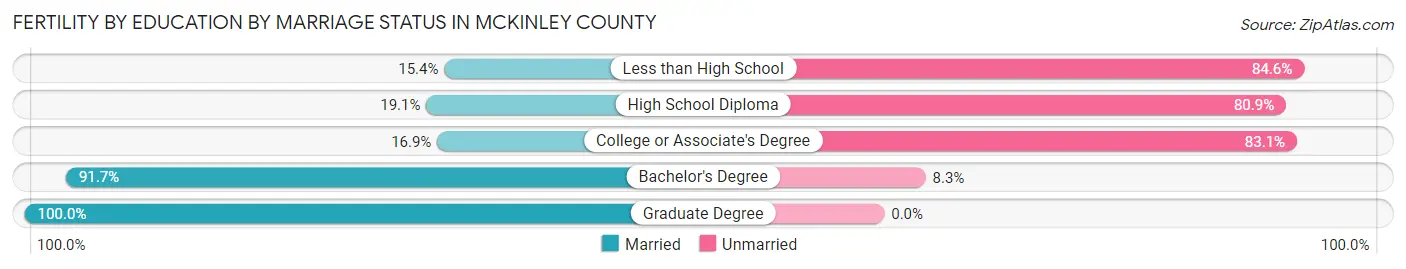
| Educational Attainment | Married | Unmarried |
| Less than High School | 29 (15.4%) | 159 (84.6%) |
| High School Diploma | 57 (19.1%) | 242 (80.9%) |
| College or Associate's Degree | 58 (16.9%) | 286 (83.1%) |
| Bachelor's Degree | 55 (91.7%) | 5 (8.3%) |
| Graduate Degree | 11 (100.0%) | 0 (0.0%) |
| Total | 210 (23.3%) | 692 (76.7%) |
Employment Characteristics in McKinley County
Employment by Class of Employer in McKinley County
Among the 23,701 employed individuals in McKinley County, private company employees (13,244 | 55.9%), local government employees (3,011 | 12.7%), and federal government employees (2,808 | 11.8%) make up the most common classes of employment.
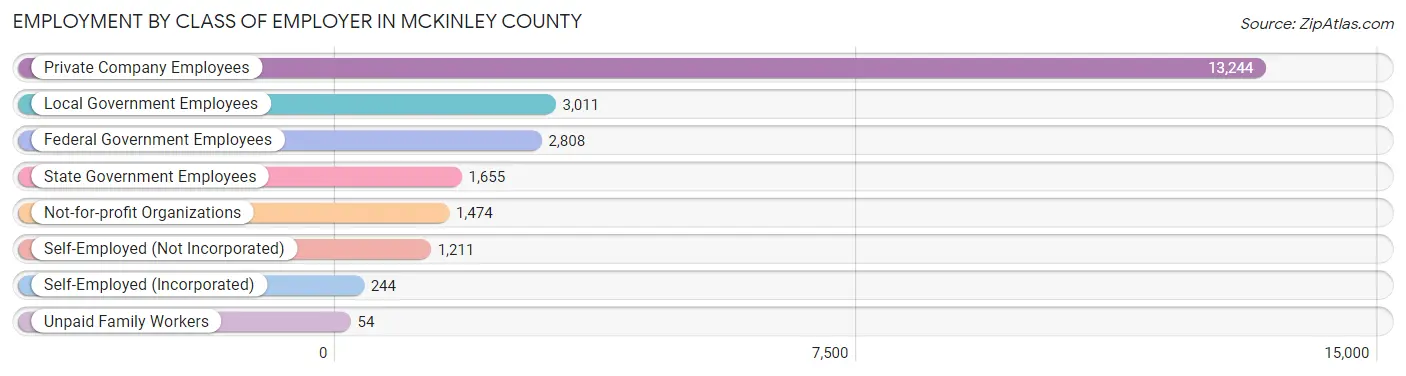
| Employer Class | # Employees | % Employees |
| Private Company Employees | 13,244 | 55.9% |
| Self-Employed (Incorporated) | 244 | 1.0% |
| Self-Employed (Not Incorporated) | 1,211 | 5.1% |
| Not-for-profit Organizations | 1,474 | 6.2% |
| Local Government Employees | 3,011 | 12.7% |
| State Government Employees | 1,655 | 7.0% |
| Federal Government Employees | 2,808 | 11.8% |
| Unpaid Family Workers | 54 | 0.2% |
| Total | 23,701 | 100.0% |
Employment Status by Age in McKinley County
According to the labor force statistics for McKinley County, out of the total population over 16 years of age (54,407), 48.5% or 26,387 individuals are in the labor force, with 9.6% or 2,533 of them unemployed. The age group with the highest labor force participation rate is 35 to 44 years, with 67.7% or 5,937 individuals in the labor force. Within the labor force, the 16 to 19 years age range has the highest percentage of unemployed individuals, with 27.4% or 188 of them being unemployed.
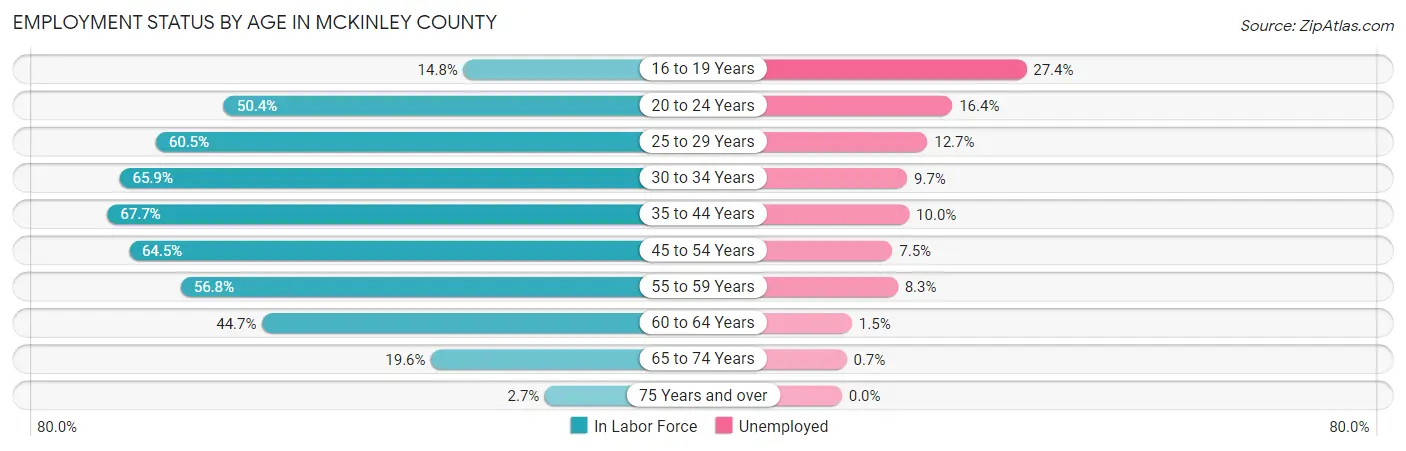
| Age Bracket | In Labor Force | Unemployed |
| 16 to 19 Years | 686 (14.8%) | 188 (27.4%) |
| 20 to 24 Years | 2,334 (50.4%) | 383 (16.4%) |
| 25 to 29 Years | 3,249 (60.5%) | 413 (12.7%) |
| 30 to 34 Years | 3,606 (65.9%) | 350 (9.7%) |
| 35 to 44 Years | 5,937 (67.7%) | 594 (10.0%) |
| 45 to 54 Years | 5,170 (64.5%) | 388 (7.5%) |
| 55 to 59 Years | 2,338 (56.8%) | 194 (8.3%) |
| 60 to 64 Years | 1,882 (44.7%) | 28 (1.5%) |
| 65 to 74 Years | 1,113 (19.6%) | 8 (0.7%) |
| 75 Years and over | 95 (2.7%) | 0 (0.0%) |
| Total | 26,387 (48.5%) | 2,533 (9.6%) |
Employment Status by Educational Attainment in McKinley County
According to labor force statistics for McKinley County, 61.7% of individuals (22,184) out of the total population between 25 and 64 years of age (35,955) are in the labor force, with 8.9% or 1,974 of them being unemployed. The group with the highest labor force participation rate are those with the educational attainment of bachelor's degree or higher, with 88.3% or 3,975 individuals in the labor force. Within the labor force, individuals with less than high school education have the highest percentage of unemployment, with 19.1% or 486 of them being unemployed.
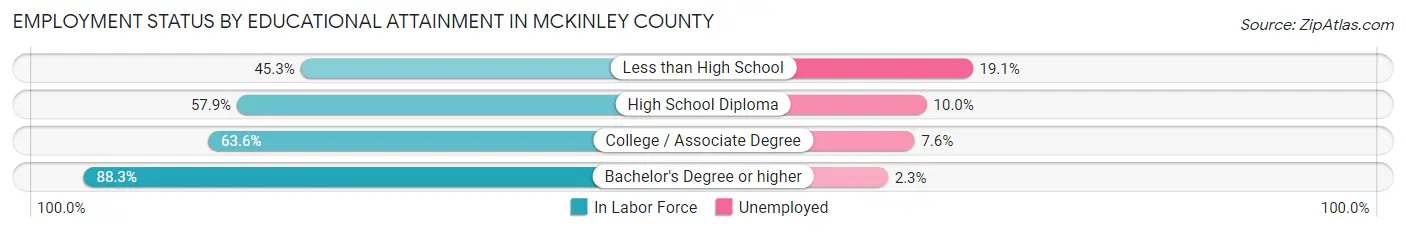
| Educational Attainment | In Labor Force | Unemployed |
| Less than High School | 2,547 (45.3%) | 1,074 (19.1%) |
| High School Diploma | 7,837 (57.9%) | 1,354 (10.0%) |
| College / Associate Degree | 7,820 (63.6%) | 934 (7.6%) |
| Bachelor's Degree or higher | 3,975 (88.3%) | 104 (2.3%) |
| Total | 22,184 (61.7%) | 3,200 (8.9%) |
Employment Occupations by Sex in McKinley County
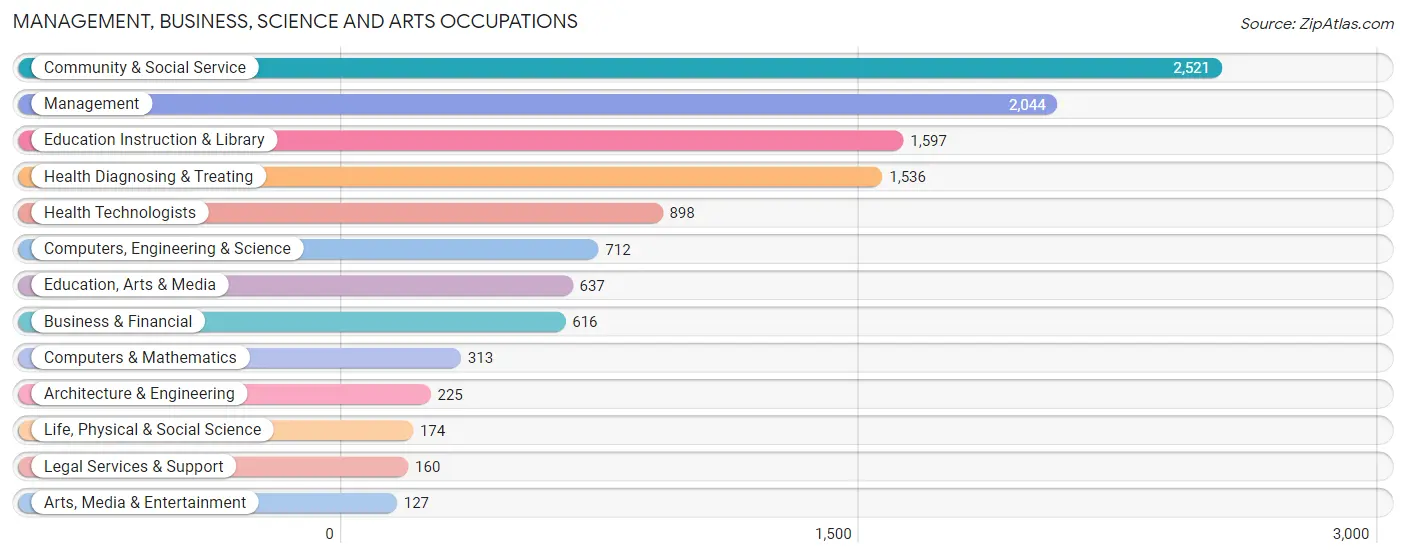
Management, Business, Science and Arts Occupations
The most common Management, Business, Science and Arts occupations in McKinley County are Community & Social Service (2,521 | 10.6%), Management (2,044 | 8.6%), Education Instruction & Library (1,597 | 6.7%), Health Diagnosing & Treating (1,536 | 6.5%), and Health Technologists (898 | 3.8%).
Management, Business, Science and Arts Occupations by Sex
Within the Management, Business, Science and Arts occupations in McKinley County, the most male-oriented occupations are Life, Physical & Social Science (79.3%), Computers & Mathematics (74.4%), and Computers, Engineering & Science (74.2%), while the most female-oriented occupations are Legal Services & Support (86.9%), Health Technologists (79.4%), and Education Instruction & Library (78.6%).
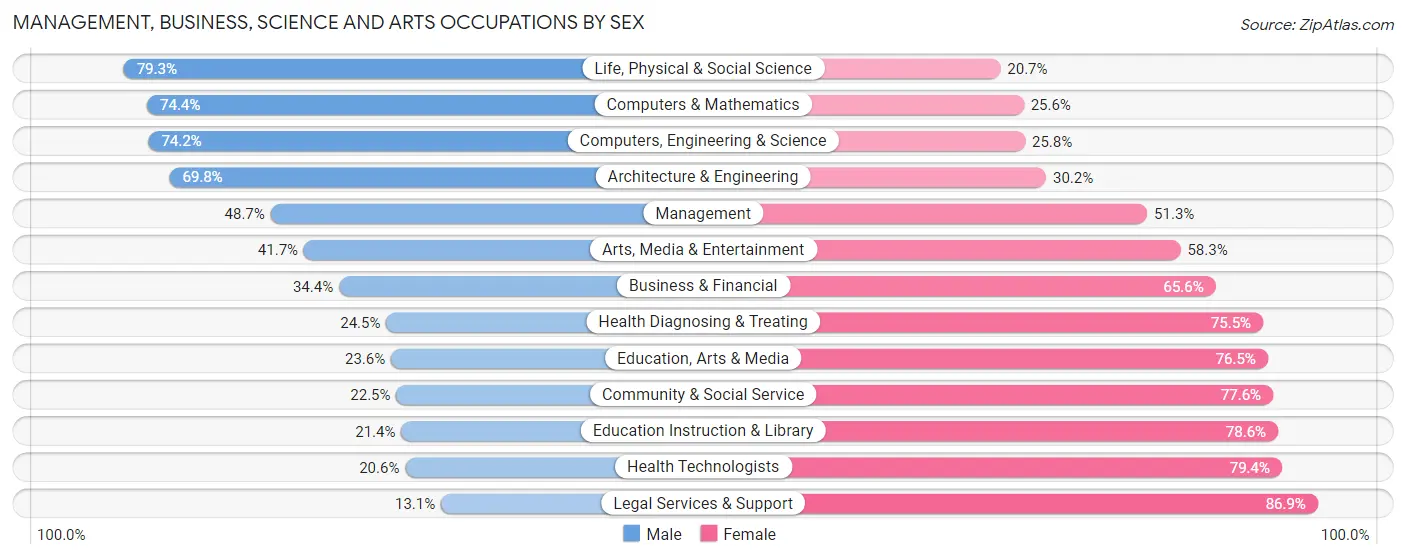
| Occupation | Male | Female |
| Management | 995 (48.7%) | 1,049 (51.3%) |
| Business & Financial | 212 (34.4%) | 404 (65.6%) |
| Computers, Engineering & Science | 528 (74.2%) | 184 (25.8%) |
| Computers & Mathematics | 233 (74.4%) | 80 (25.6%) |
| Architecture & Engineering | 157 (69.8%) | 68 (30.2%) |
| Life, Physical & Social Science | 138 (79.3%) | 36 (20.7%) |
| Community & Social Service | 566 (22.5%) | 1,955 (77.5%) |
| Education, Arts & Media | 150 (23.5%) | 487 (76.4%) |
| Legal Services & Support | 21 (13.1%) | 139 (86.9%) |
| Education Instruction & Library | 342 (21.4%) | 1,255 (78.6%) |
| Arts, Media & Entertainment | 53 (41.7%) | 74 (58.3%) |
| Health Diagnosing & Treating | 377 (24.5%) | 1,159 (75.5%) |
| Health Technologists | 185 (20.6%) | 713 (79.4%) |
| Total (Category) | 2,678 (36.0%) | 4,751 (63.9%) |
| Total (Overall) | 11,196 (47.2%) | 12,535 (52.8%) |
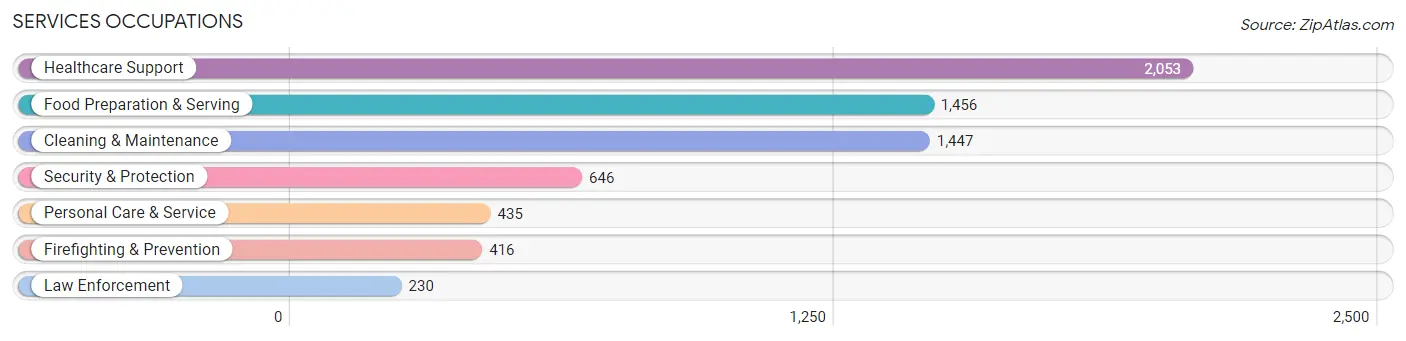
Services Occupations
The most common Services occupations in McKinley County are Healthcare Support (2,053 | 8.6%), Food Preparation & Serving (1,456 | 6.1%), Cleaning & Maintenance (1,447 | 6.1%), Security & Protection (646 | 2.7%), and Personal Care & Service (435 | 1.8%).
Services Occupations by Sex
Within the Services occupations in McKinley County, the most male-oriented occupations are Firefighting & Prevention (89.9%), Security & Protection (82.7%), and Law Enforcement (69.6%), while the most female-oriented occupations are Personal Care & Service (80.0%), Healthcare Support (76.0%), and Food Preparation & Serving (58.6%).
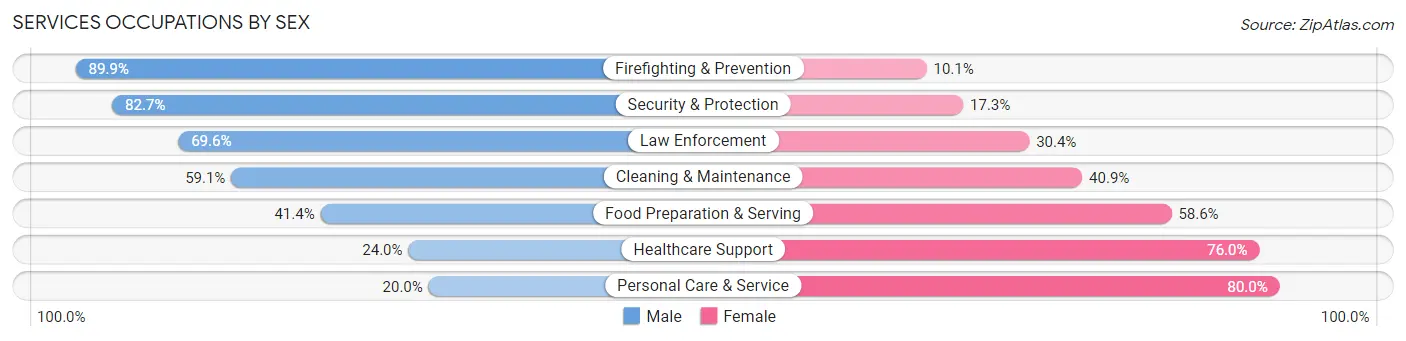
| Occupation | Male | Female |
| Healthcare Support | 493 (24.0%) | 1,560 (76.0%) |
| Security & Protection | 534 (82.7%) | 112 (17.3%) |
| Firefighting & Prevention | 374 (89.9%) | 42 (10.1%) |
| Law Enforcement | 160 (69.6%) | 70 (30.4%) |
| Food Preparation & Serving | 603 (41.4%) | 853 (58.6%) |
| Cleaning & Maintenance | 855 (59.1%) | 592 (40.9%) |
| Personal Care & Service | 87 (20.0%) | 348 (80.0%) |
| Total (Category) | 2,572 (42.6%) | 3,465 (57.4%) |
| Total (Overall) | 11,196 (47.2%) | 12,535 (52.8%) |
Sales and Office Occupations
The most common Sales and Office occupations in McKinley County are Sales & Related (2,686 | 11.3%), and Office & Administration (2,481 | 10.4%).

Sales and Office Occupations by Sex
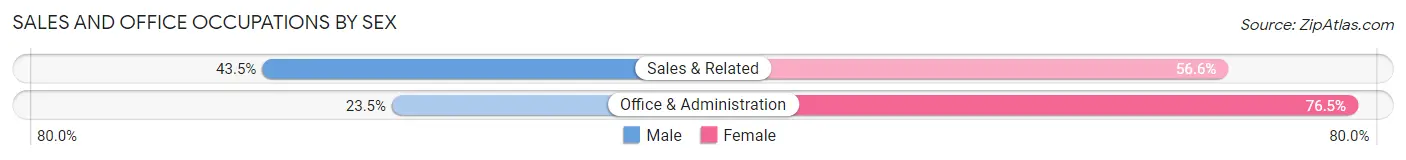
| Occupation | Male | Female |
| Sales & Related | 1,167 (43.4%) | 1,519 (56.6%) |
| Office & Administration | 583 (23.5%) | 1,898 (76.5%) |
| Total (Category) | 1,750 (33.9%) | 3,417 (66.1%) |
| Total (Overall) | 11,196 (47.2%) | 12,535 (52.8%) |
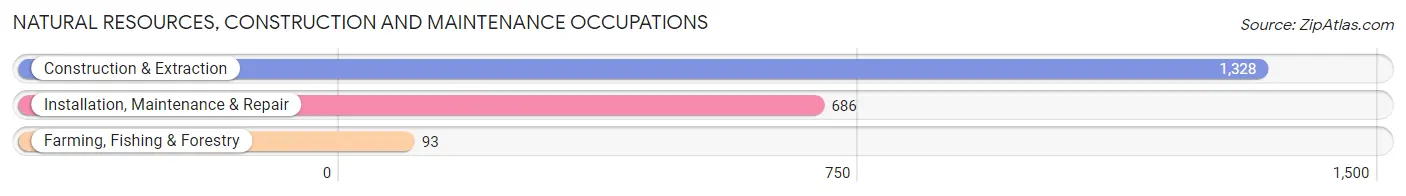
Natural Resources, Construction and Maintenance Occupations
The most common Natural Resources, Construction and Maintenance occupations in McKinley County are Construction & Extraction (1,328 | 5.6%), Installation, Maintenance & Repair (686 | 2.9%), and Farming, Fishing & Forestry (93 | 0.4%).
Natural Resources, Construction and Maintenance Occupations by Sex
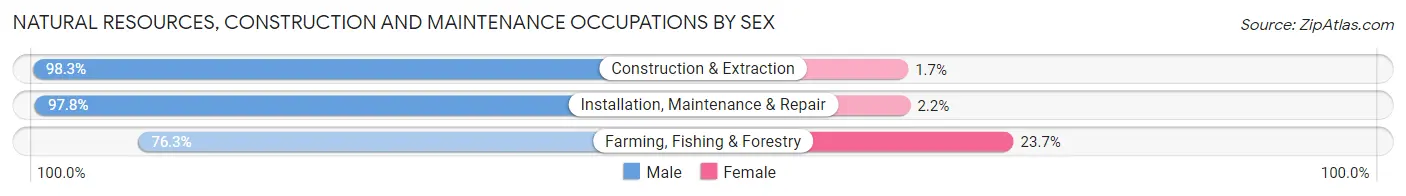
| Occupation | Male | Female |
| Farming, Fishing & Forestry | 71 (76.3%) | 22 (23.7%) |
| Construction & Extraction | 1,305 (98.3%) | 23 (1.7%) |
| Installation, Maintenance & Repair | 671 (97.8%) | 15 (2.2%) |
| Total (Category) | 2,047 (97.2%) | 60 (2.9%) |
| Total (Overall) | 11,196 (47.2%) | 12,535 (52.8%) |
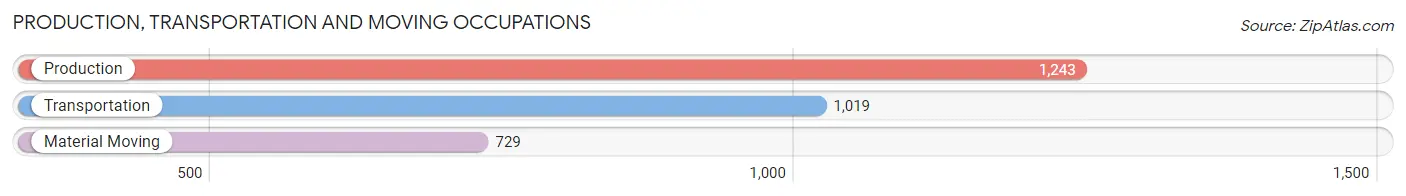
Production, Transportation and Moving Occupations
The most common Production, Transportation and Moving occupations in McKinley County are Production (1,243 | 5.2%), Transportation (1,019 | 4.3%), and Material Moving (729 | 3.1%).
Production, Transportation and Moving Occupations by Sex
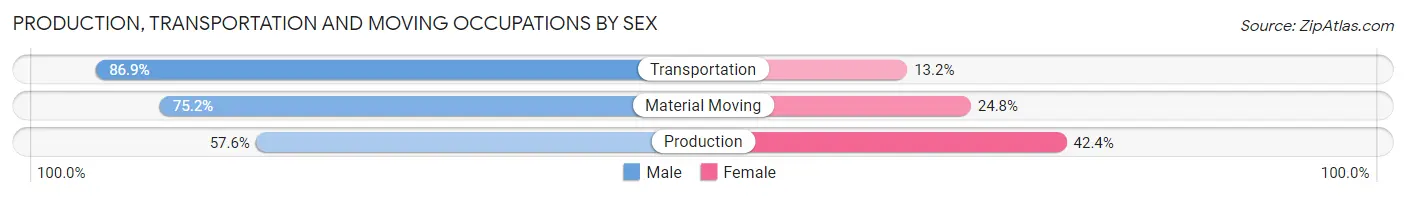
| Occupation | Male | Female |
| Production | 716 (57.6%) | 527 (42.4%) |
| Transportation | 885 (86.9%) | 134 (13.2%) |
| Material Moving | 548 (75.2%) | 181 (24.8%) |
| Total (Category) | 2,149 (71.9%) | 842 (28.1%) |
| Total (Overall) | 11,196 (47.2%) | 12,535 (52.8%) |
Employment Industries by Sex in McKinley County
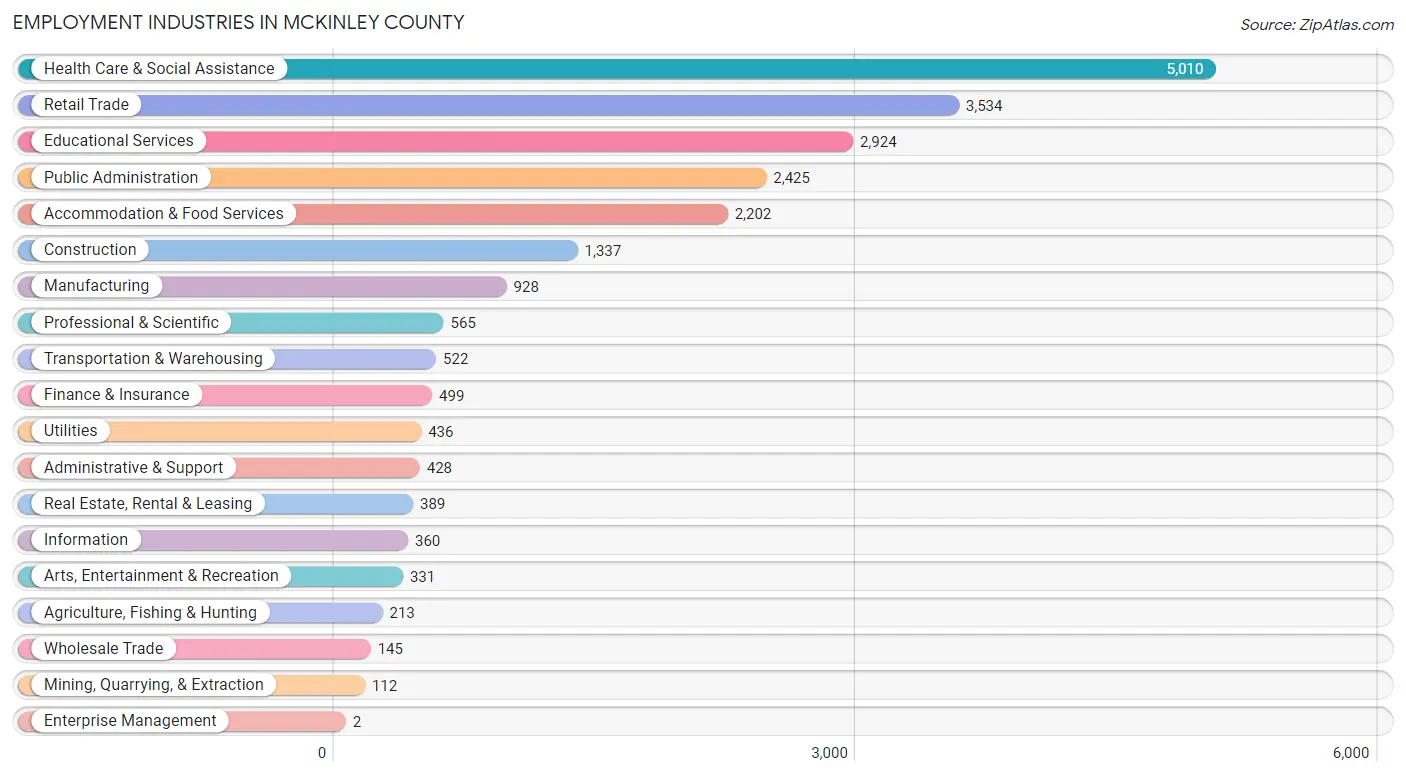
Employment Industries in McKinley County
The major employment industries in McKinley County include Health Care & Social Assistance (5,010 | 21.1%), Retail Trade (3,534 | 14.9%), Educational Services (2,924 | 12.3%), Public Administration (2,425 | 10.2%), and Accommodation & Food Services (2,202 | 9.3%).
Employment Industries by Sex in McKinley County
The McKinley County industries that see more men than women are Enterprise Management (100.0%), Construction (95.4%), and Mining, Quarrying, & Extraction (80.4%), whereas the industries that tend to have a higher number of women are Finance & Insurance (80.8%), Health Care & Social Assistance (71.3%), and Educational Services (67.0%).
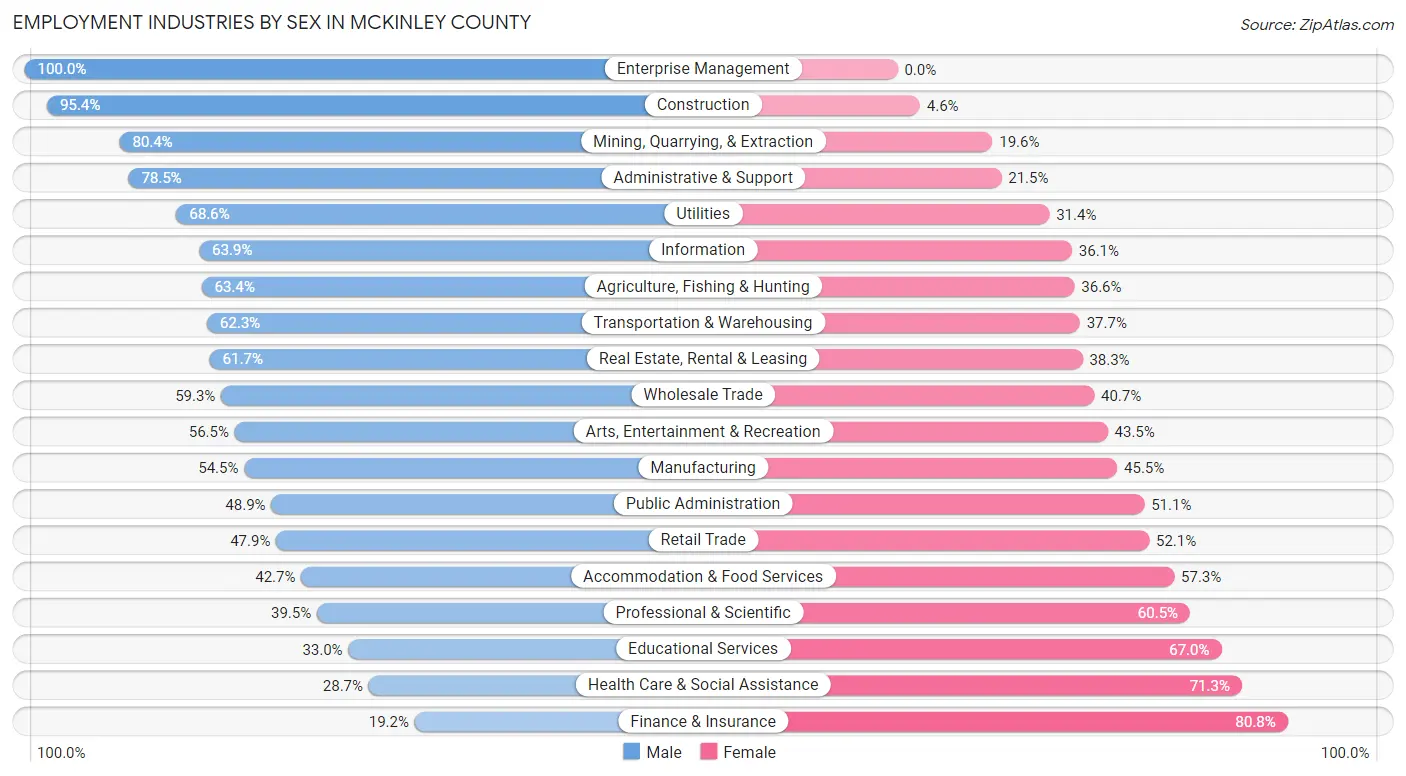
| Industry | Male | Female |
| Agriculture, Fishing & Hunting | 135 (63.4%) | 78 (36.6%) |
| Mining, Quarrying, & Extraction | 90 (80.4%) | 22 (19.6%) |
| Construction | 1,275 (95.4%) | 62 (4.6%) |
| Manufacturing | 506 (54.5%) | 422 (45.5%) |
| Wholesale Trade | 86 (59.3%) | 59 (40.7%) |
| Retail Trade | 1,693 (47.9%) | 1,841 (52.1%) |
| Transportation & Warehousing | 325 (62.3%) | 197 (37.7%) |
| Utilities | 299 (68.6%) | 137 (31.4%) |
| Information | 230 (63.9%) | 130 (36.1%) |
| Finance & Insurance | 96 (19.2%) | 403 (80.8%) |
| Real Estate, Rental & Leasing | 240 (61.7%) | 149 (38.3%) |
| Professional & Scientific | 223 (39.5%) | 342 (60.5%) |
| Enterprise Management | 2 (100.0%) | 0 (0.0%) |
| Administrative & Support | 336 (78.5%) | 92 (21.5%) |
| Educational Services | 964 (33.0%) | 1,960 (67.0%) |
| Health Care & Social Assistance | 1,440 (28.7%) | 3,570 (71.3%) |
| Arts, Entertainment & Recreation | 187 (56.5%) | 144 (43.5%) |
| Accommodation & Food Services | 941 (42.7%) | 1,261 (57.3%) |
| Public Administration | 1,186 (48.9%) | 1,239 (51.1%) |
| Total | 11,196 (47.2%) | 12,535 (52.8%) |
Education in McKinley County
School Enrollment in McKinley County
The most common levels of schooling among the 19,521 students in McKinley County are middle school (5,318 | 27.2%), elementary school (4,465 | 22.9%), and high school (4,322 | 22.1%).
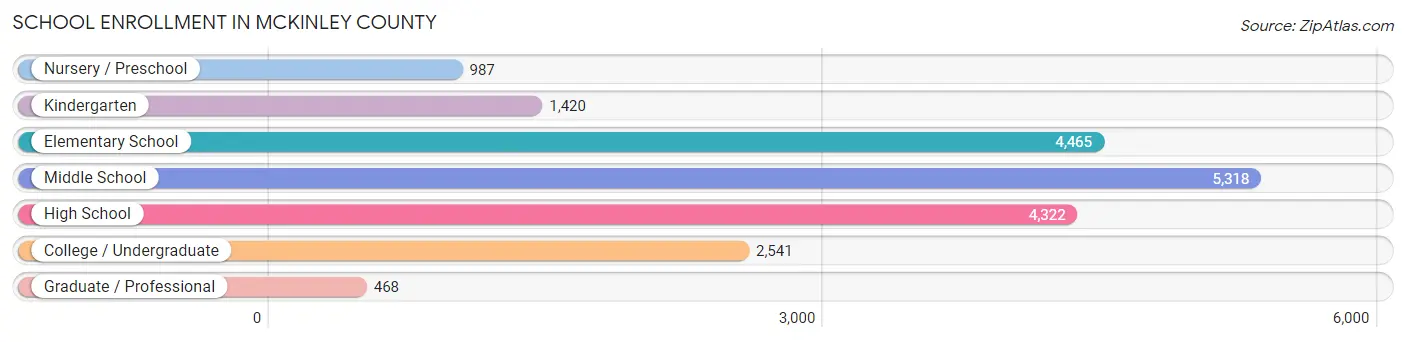
| School Level | # Students | % Students |
| Nursery / Preschool | 987 | 5.1% |
| Kindergarten | 1,420 | 7.3% |
| Elementary School | 4,465 | 22.9% |
| Middle School | 5,318 | 27.2% |
| High School | 4,322 | 22.1% |
| College / Undergraduate | 2,541 | 13.0% |
| Graduate / Professional | 468 | 2.4% |
| Total | 19,521 | 100.0% |
School Enrollment by Age by Funding Source in McKinley County
Out of a total of 19,521 students who are enrolled in schools in McKinley County, 722 (3.7%) attend a private institution, while the remaining 18,799 (96.3%) are enrolled in public schools. The age group of 35 years and over has the highest likelihood of being enrolled in private schools, with 131 (16.0% in the age bracket) enrolled. Conversely, the age group of 15 to 17 year olds has the lowest likelihood of being enrolled in a private school, with 3,251 (98.3% in the age bracket) attending a public institution.
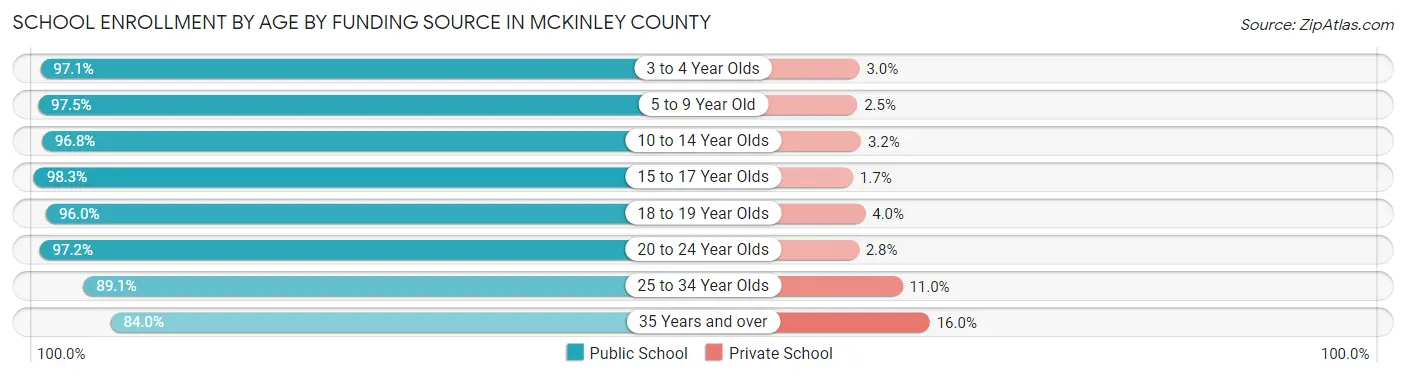
| Age Bracket | Public School | Private School |
| 3 to 4 Year Olds | 921 (97.1%) | 28 (2.9%) |
| 5 to 9 Year Old | 5,284 (97.5%) | 137 (2.5%) |
| 10 to 14 Year Olds | 5,902 (96.8%) | 197 (3.2%) |
| 15 to 17 Year Olds | 3,251 (98.3%) | 57 (1.7%) |
| 18 to 19 Year Olds | 980 (96.0%) | 41 (4.0%) |
| 20 to 24 Year Olds | 832 (97.2%) | 24 (2.8%) |
| 25 to 34 Year Olds | 935 (89.0%) | 115 (11.0%) |
| 35 Years and over | 686 (84.0%) | 131 (16.0%) |
| Total | 18,799 (96.3%) | 722 (3.7%) |
Educational Attainment by Field of Study in McKinley County
Business (1,172 | 19.2%), education (1,133 | 18.6%), science & technology (798 | 13.1%), bio, nature & agricultural (532 | 8.7%), and arts & humanities (443 | 7.3%) are the most common fields of study among 6,094 individuals in McKinley County who have obtained a bachelor's degree or higher.
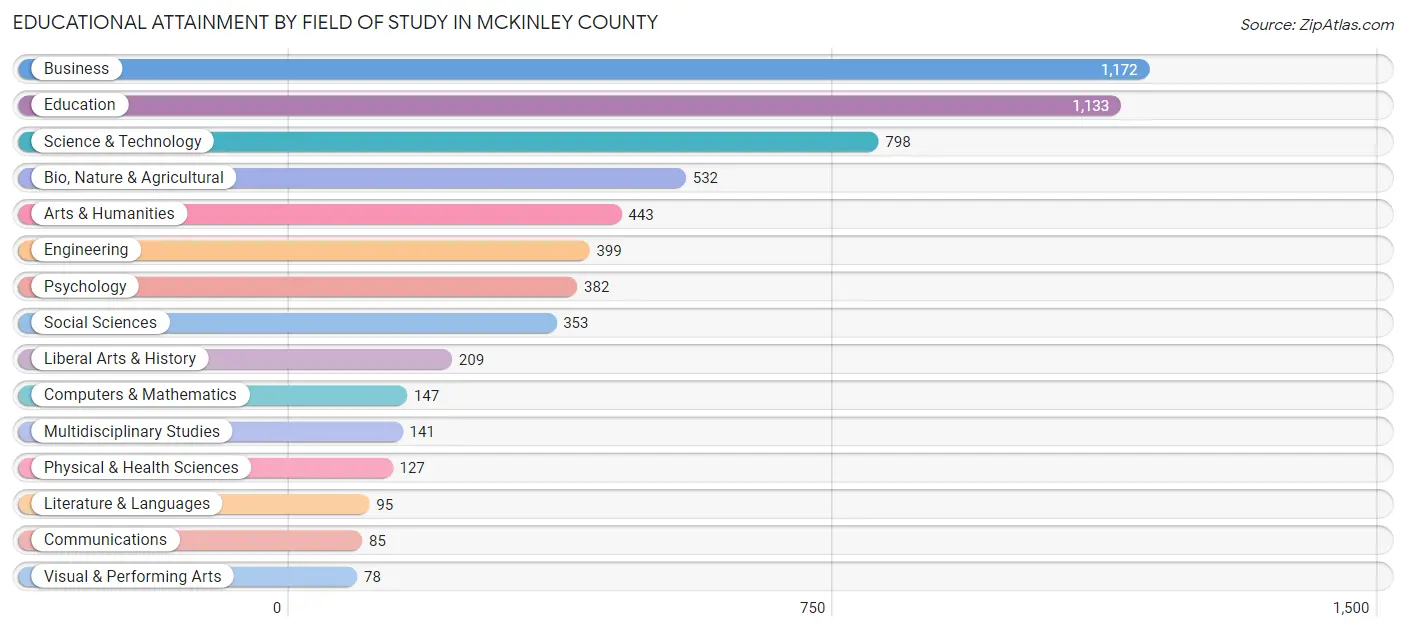
| Field of Study | # Graduates | % Graduates |
| Computers & Mathematics | 147 | 2.4% |
| Bio, Nature & Agricultural | 532 | 8.7% |
| Physical & Health Sciences | 127 | 2.1% |
| Psychology | 382 | 6.3% |
| Social Sciences | 353 | 5.8% |
| Engineering | 399 | 6.6% |
| Multidisciplinary Studies | 141 | 2.3% |
| Science & Technology | 798 | 13.1% |
| Business | 1,172 | 19.2% |
| Education | 1,133 | 18.6% |
| Literature & Languages | 95 | 1.6% |
| Liberal Arts & History | 209 | 3.4% |
| Visual & Performing Arts | 78 | 1.3% |
| Communications | 85 | 1.4% |
| Arts & Humanities | 443 | 7.3% |
| Total | 6,094 | 100.0% |
Transportation & Commute in McKinley County
Vehicle Availability by Sex in McKinley County
The most prevalent vehicle ownership categories in McKinley County are males with 2 vehicles (3,961, accounting for 35.3%) and females with 2 vehicles (4,320, making up 32.1%).
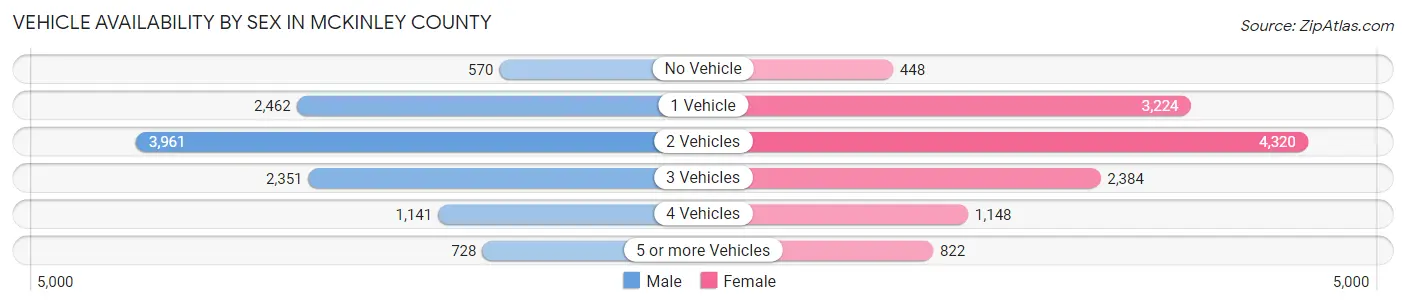
| Vehicles Available | Male | Female |
| No Vehicle | 570 (5.1%) | 448 (3.6%) |
| 1 Vehicle | 2,462 (22.0%) | 3,224 (26.1%) |
| 2 Vehicles | 3,961 (35.3%) | 4,320 (35.0%) |
| 3 Vehicles | 2,351 (21.0%) | 2,384 (19.3%) |
| 4 Vehicles | 1,141 (10.2%) | 1,148 (9.3%) |
| 5 or more Vehicles | 728 (6.5%) | 822 (6.7%) |
| Total | 11,213 (100.0%) | 12,346 (100.0%) |
Commute Time in McKinley County
The most frequently occuring commute durations in McKinley County are 5 to 9 minutes (3,469 commuters, 16.3%), 30 to 34 minutes (3,248 commuters, 15.3%), and 10 to 14 minutes (3,221 commuters, 15.2%).
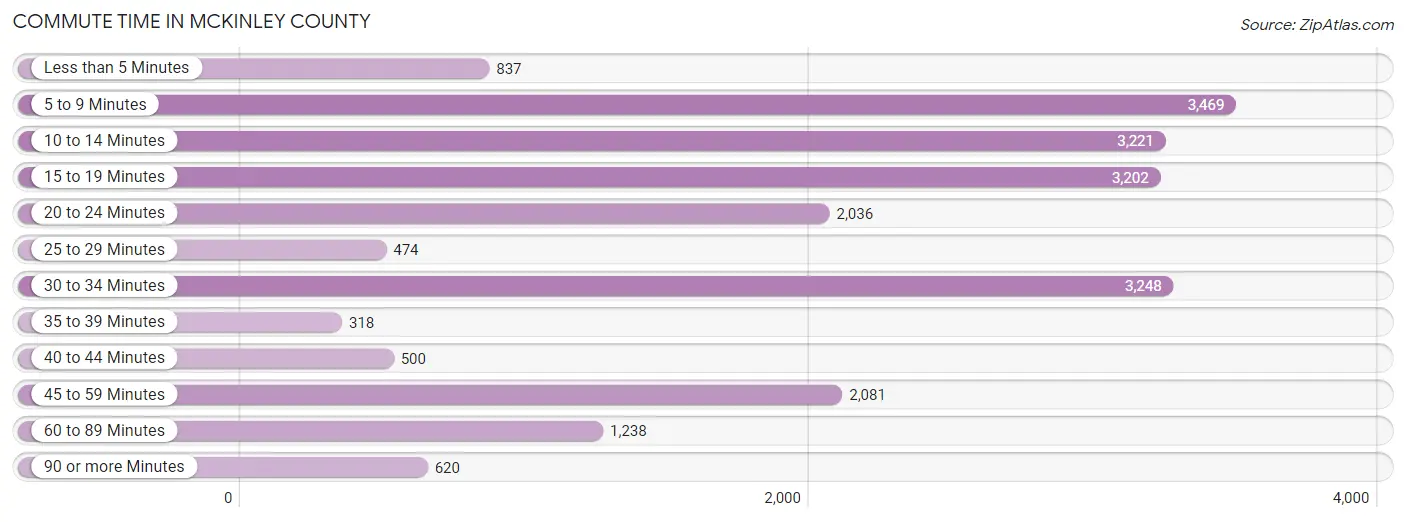
| Commute Time | # Commuters | % Commuters |
| Less than 5 Minutes | 837 | 3.9% |
| 5 to 9 Minutes | 3,469 | 16.3% |
| 10 to 14 Minutes | 3,221 | 15.2% |
| 15 to 19 Minutes | 3,202 | 15.1% |
| 20 to 24 Minutes | 2,036 | 9.6% |
| 25 to 29 Minutes | 474 | 2.2% |
| 30 to 34 Minutes | 3,248 | 15.3% |
| 35 to 39 Minutes | 318 | 1.5% |
| 40 to 44 Minutes | 500 | 2.4% |
| 45 to 59 Minutes | 2,081 | 9.8% |
| 60 to 89 Minutes | 1,238 | 5.8% |
| 90 or more Minutes | 620 | 2.9% |
Commute Time by Sex in McKinley County
The most common commute times in McKinley County are 5 to 9 minutes (1,753 commuters, 16.9%) for males and 15 to 19 minutes (1,901 commuters, 17.5%) for females.
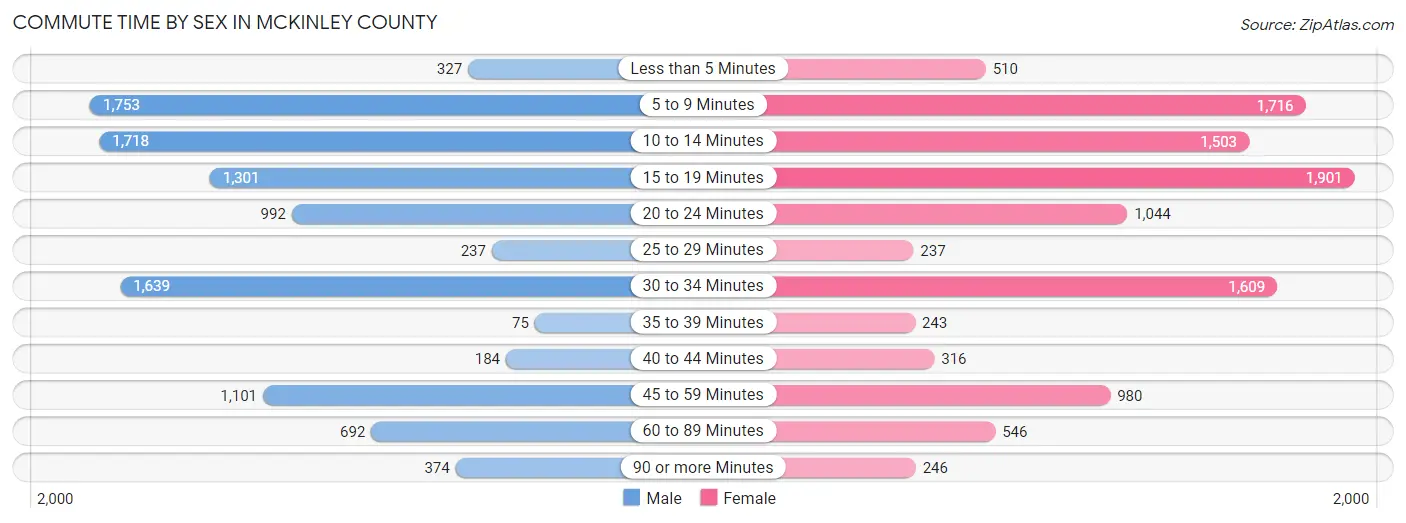
| Commute Time | Male | Female |
| Less than 5 Minutes | 327 (3.2%) | 510 (4.7%) |
| 5 to 9 Minutes | 1,753 (16.9%) | 1,716 (15.8%) |
| 10 to 14 Minutes | 1,718 (16.5%) | 1,503 (13.9%) |
| 15 to 19 Minutes | 1,301 (12.5%) | 1,901 (17.5%) |
| 20 to 24 Minutes | 992 (9.5%) | 1,044 (9.6%) |
| 25 to 29 Minutes | 237 (2.3%) | 237 (2.2%) |
| 30 to 34 Minutes | 1,639 (15.8%) | 1,609 (14.8%) |
| 35 to 39 Minutes | 75 (0.7%) | 243 (2.2%) |
| 40 to 44 Minutes | 184 (1.8%) | 316 (2.9%) |
| 45 to 59 Minutes | 1,101 (10.6%) | 980 (9.0%) |
| 60 to 89 Minutes | 692 (6.7%) | 546 (5.0%) |
| 90 or more Minutes | 374 (3.6%) | 246 (2.3%) |
Time of Departure to Work by Sex in McKinley County
The most frequent times of departure to work in McKinley County are 7:30 AM to 7:59 AM (2,133, 20.5%) for males and 7:00 AM to 7:29 AM (2,338, 21.5%) for females.
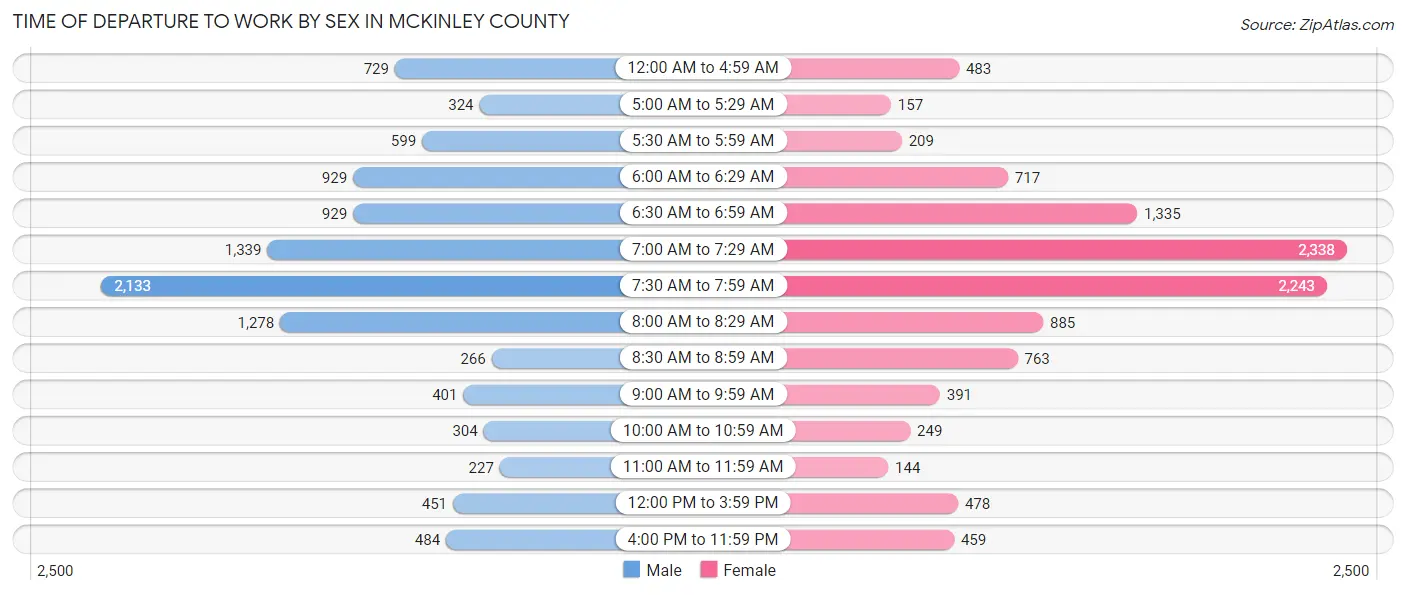
| Time of Departure | Male | Female |
| 12:00 AM to 4:59 AM | 729 (7.0%) | 483 (4.4%) |
| 5:00 AM to 5:29 AM | 324 (3.1%) | 157 (1.5%) |
| 5:30 AM to 5:59 AM | 599 (5.8%) | 209 (1.9%) |
| 6:00 AM to 6:29 AM | 929 (8.9%) | 717 (6.6%) |
| 6:30 AM to 6:59 AM | 929 (8.9%) | 1,335 (12.3%) |
| 7:00 AM to 7:29 AM | 1,339 (12.9%) | 2,338 (21.5%) |
| 7:30 AM to 7:59 AM | 2,133 (20.5%) | 2,243 (20.7%) |
| 8:00 AM to 8:29 AM | 1,278 (12.3%) | 885 (8.2%) |
| 8:30 AM to 8:59 AM | 266 (2.6%) | 763 (7.0%) |
| 9:00 AM to 9:59 AM | 401 (3.9%) | 391 (3.6%) |
| 10:00 AM to 10:59 AM | 304 (2.9%) | 249 (2.3%) |
| 11:00 AM to 11:59 AM | 227 (2.2%) | 144 (1.3%) |
| 12:00 PM to 3:59 PM | 451 (4.3%) | 478 (4.4%) |
| 4:00 PM to 11:59 PM | 484 (4.7%) | 459 (4.2%) |
| Total | 10,393 (100.0%) | 10,851 (100.0%) |
Housing Occupancy in McKinley County
Occupancy by Ownership in McKinley County
Of the total 20,913 dwellings in McKinley County, owner-occupied units account for 15,034 (71.9%), while renter-occupied units make up 5,879 (28.1%).
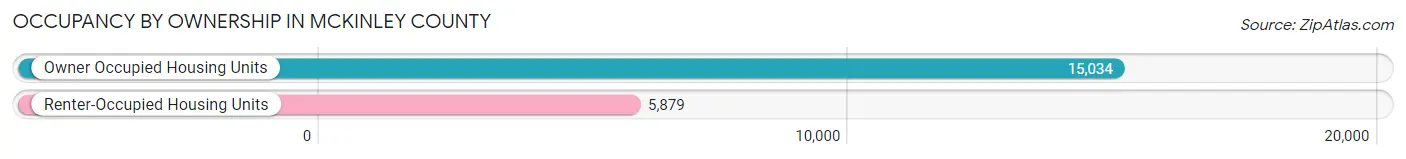
| Occupancy | # Housing Units | % Housing Units |
| Owner Occupied Housing Units | 15,034 | 71.9% |
| Renter-Occupied Housing Units | 5,879 | 28.1% |
| Total Occupied Housing Units | 20,913 | 100.0% |
Occupancy by Household Size in McKinley County
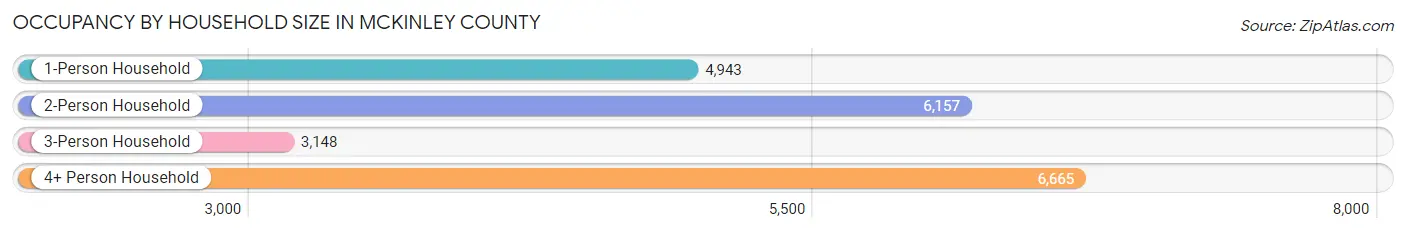
| Household Size | # Housing Units | % Housing Units |
| 1-Person Household | 4,943 | 23.6% |
| 2-Person Household | 6,157 | 29.4% |
| 3-Person Household | 3,148 | 15.0% |
| 4+ Person Household | 6,665 | 31.9% |
| Total Housing Units | 20,913 | 100.0% |
Occupancy by Ownership by Household Size in McKinley County
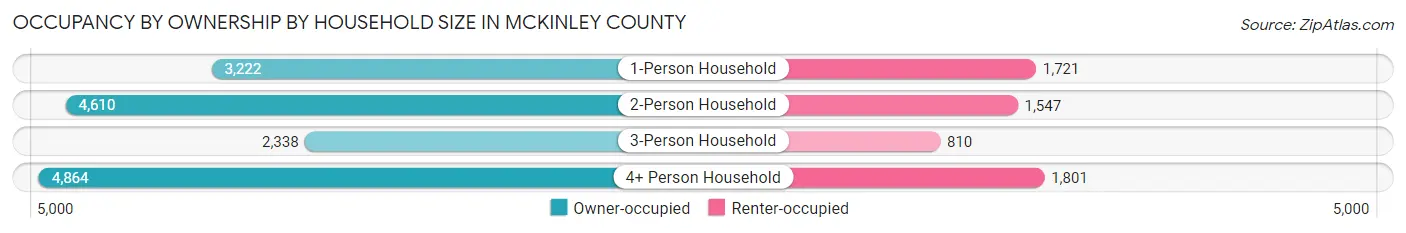
| Household Size | Owner-occupied | Renter-occupied |
| 1-Person Household | 3,222 (65.2%) | 1,721 (34.8%) |
| 2-Person Household | 4,610 (74.9%) | 1,547 (25.1%) |
| 3-Person Household | 2,338 (74.3%) | 810 (25.7%) |
| 4+ Person Household | 4,864 (73.0%) | 1,801 (27.0%) |
| Total Housing Units | 15,034 (71.9%) | 5,879 (28.1%) |
Occupancy by Educational Attainment in McKinley County
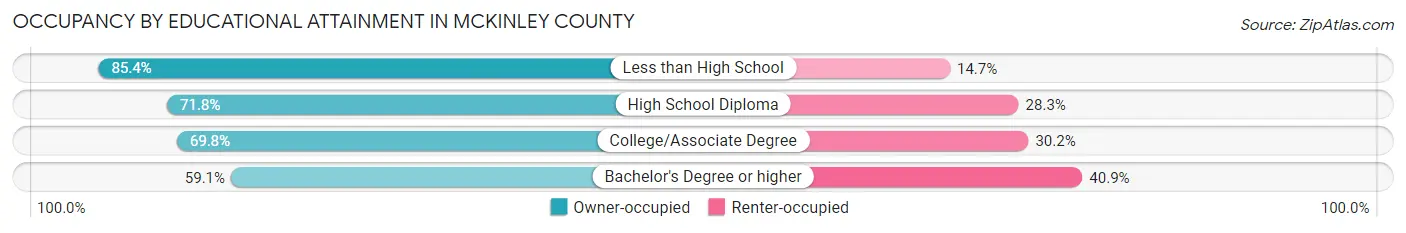
| Household Size | Owner-occupied | Renter-occupied |
| Less than High School | 3,449 (85.4%) | 592 (14.6%) |
| High School Diploma | 4,930 (71.8%) | 1,941 (28.2%) |
| College/Associate Degree | 4,852 (69.8%) | 2,099 (30.2%) |
| Bachelor's Degree or higher | 1,803 (59.1%) | 1,247 (40.9%) |
Occupancy by Age of Householder in McKinley County
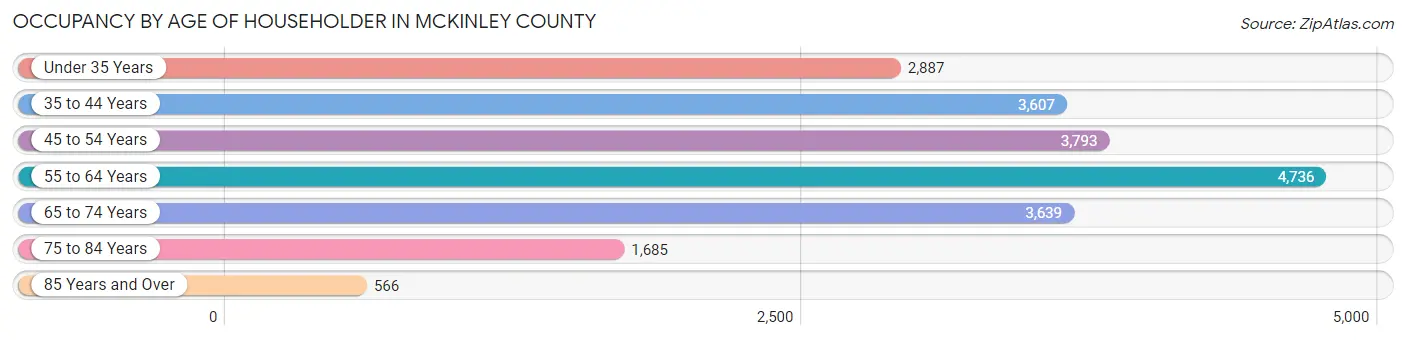
| Age Bracket | # Households | % Households |
| Under 35 Years | 2,887 | 13.8% |
| 35 to 44 Years | 3,607 | 17.2% |
| 45 to 54 Years | 3,793 | 18.1% |
| 55 to 64 Years | 4,736 | 22.7% |
| 65 to 74 Years | 3,639 | 17.4% |
| 75 to 84 Years | 1,685 | 8.1% |
| 85 Years and Over | 566 | 2.7% |
| Total | 20,913 | 100.0% |
Housing Finances in McKinley County
Median Income by Occupancy in McKinley County
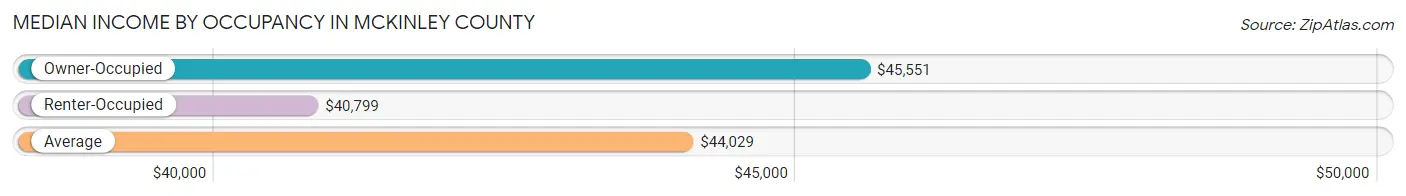
| Occupancy Type | # Households | Median Income |
| Owner-Occupied | 15,034 (71.9%) | $45,551 |
| Renter-Occupied | 5,879 (28.1%) | $40,799 |
| Average | 20,913 (100.0%) | $44,029 |
Occupancy by Householder Income Bracket in McKinley County

| Income Bracket | Owner-occupied | Renter-occupied |
| Less than $5,000 | 1,305 (8.7%) | 487 (8.3%) |
| $5,000 to $9,999 | 667 (4.4%) | 385 (6.6%) |
| $10,000 to $14,999 | 1,301 (8.6%) | 665 (11.3%) |
| $15,000 to $19,999 | 937 (6.2%) | 306 (5.2%) |
| $20,000 to $24,999 | 688 (4.6%) | 301 (5.1%) |
| $25,000 to $34,999 | 1,341 (8.9%) | 547 (9.3%) |
| $35,000 to $49,999 | 1,815 (12.1%) | 656 (11.2%) |
| $50,000 to $74,999 | 2,376 (15.8%) | 1,107 (18.8%) |
| $75,000 to $99,999 | 1,576 (10.5%) | 691 (11.7%) |
| $100,000 to $149,999 | 1,940 (12.9%) | 450 (7.6%) |
| $150,000 or more | 1,088 (7.2%) | 284 (4.8%) |
| Total | 15,034 (100.0%) | 5,879 (100.0%) |
Monthly Housing Cost Tiers in McKinley County
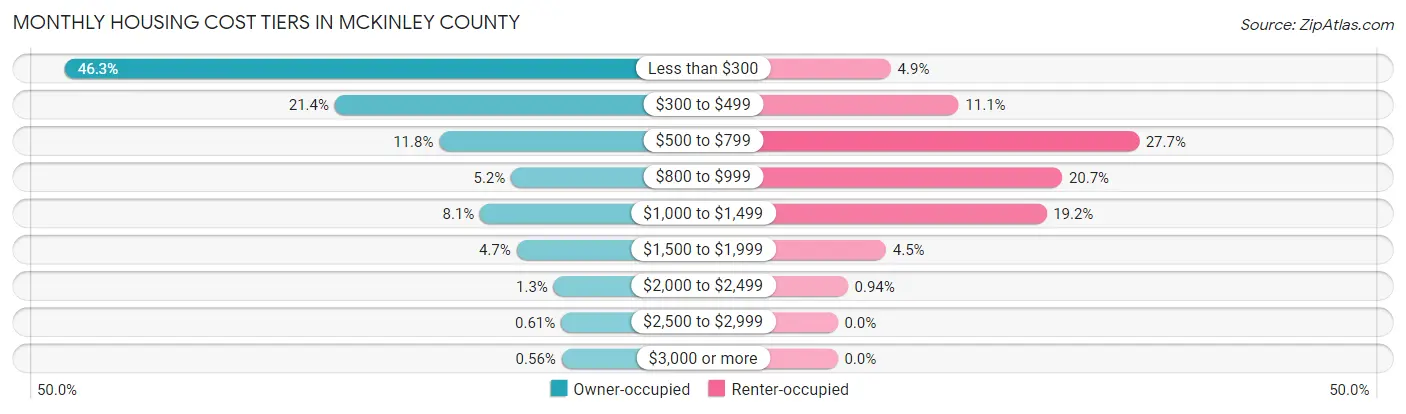
| Monthly Cost | Owner-occupied | Renter-occupied |
| Less than $300 | 6,959 (46.3%) | 288 (4.9%) |
| $300 to $499 | 3,224 (21.4%) | 655 (11.1%) |
| $500 to $799 | 1,778 (11.8%) | 1,631 (27.7%) |
| $800 to $999 | 784 (5.2%) | 1,215 (20.7%) |
| $1,000 to $1,499 | 1,212 (8.1%) | 1,130 (19.2%) |
| $1,500 to $1,999 | 708 (4.7%) | 262 (4.5%) |
| $2,000 to $2,499 | 194 (1.3%) | 55 (0.9%) |
| $2,500 to $2,999 | 91 (0.6%) | 0 (0.0%) |
| $3,000 or more | 84 (0.6%) | 0 (0.0%) |
| Total | 15,034 (100.0%) | 5,879 (100.0%) |
Physical Housing Characteristics in McKinley County
Housing Structures in McKinley County
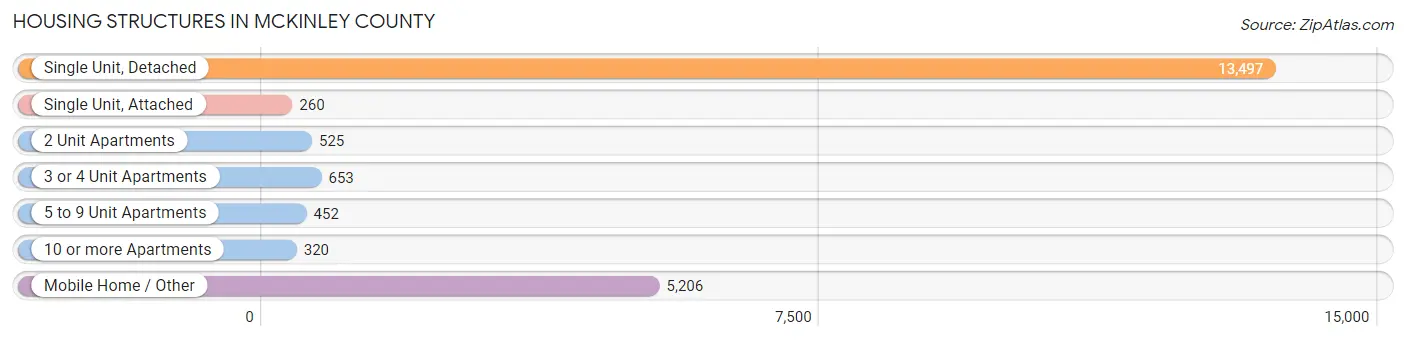
| Structure Type | # Housing Units | % Housing Units |
| Single Unit, Detached | 13,497 | 64.5% |
| Single Unit, Attached | 260 | 1.2% |
| 2 Unit Apartments | 525 | 2.5% |
| 3 or 4 Unit Apartments | 653 | 3.1% |
| 5 to 9 Unit Apartments | 452 | 2.2% |
| 10 or more Apartments | 320 | 1.5% |
| Mobile Home / Other | 5,206 | 24.9% |
| Total | 20,913 | 100.0% |
Housing Structures by Occupancy in McKinley County
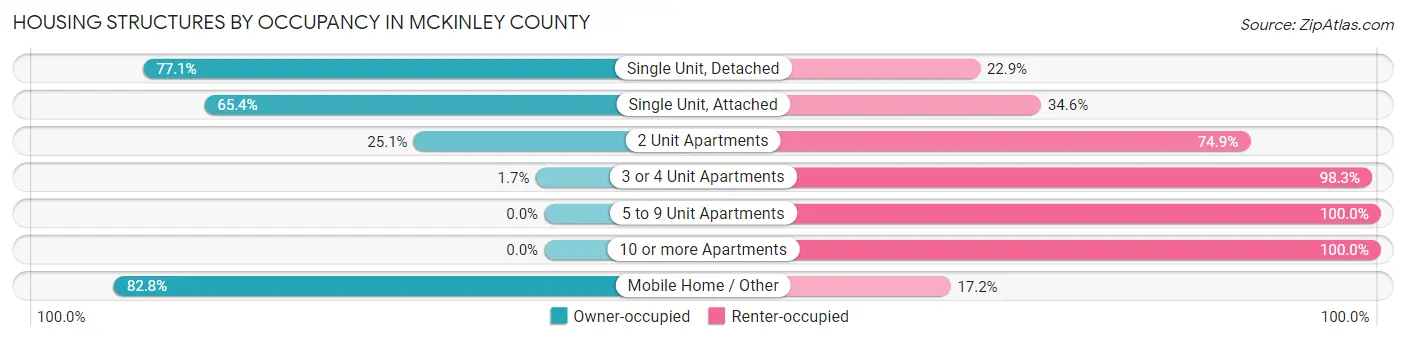
| Structure Type | Owner-occupied | Renter-occupied |
| Single Unit, Detached | 10,410 (77.1%) | 3,087 (22.9%) |
| Single Unit, Attached | 170 (65.4%) | 90 (34.6%) |
| 2 Unit Apartments | 132 (25.1%) | 393 (74.9%) |
| 3 or 4 Unit Apartments | 11 (1.7%) | 642 (98.3%) |
| 5 to 9 Unit Apartments | 0 (0.0%) | 452 (100.0%) |
| 10 or more Apartments | 0 (0.0%) | 320 (100.0%) |
| Mobile Home / Other | 4,311 (82.8%) | 895 (17.2%) |
| Total | 15,034 (71.9%) | 5,879 (28.1%) |
Housing Structures by Number of Rooms in McKinley County
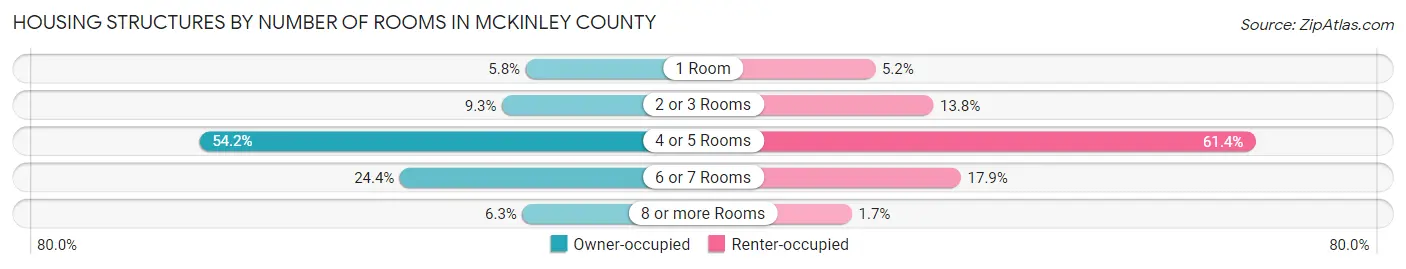
| Number of Rooms | Owner-occupied | Renter-occupied |
| 1 Room | 874 (5.8%) | 305 (5.2%) |
| 2 or 3 Rooms | 1,398 (9.3%) | 810 (13.8%) |
| 4 or 5 Rooms | 8,143 (54.2%) | 3,612 (61.4%) |
| 6 or 7 Rooms | 3,672 (24.4%) | 1,050 (17.9%) |
| 8 or more Rooms | 947 (6.3%) | 102 (1.7%) |
| Total | 15,034 (100.0%) | 5,879 (100.0%) |
Housing Structure by Heating Type in McKinley County
| Heating Type | Owner-occupied | Renter-occupied |
| Utility Gas | 4,430 (29.5%) | 3,787 (64.4%) |
| Bottled, Tank, or LP Gas | 1,063 (7.1%) | 487 (8.3%) |
| Electricity | 918 (6.1%) | 845 (14.4%) |
| Fuel Oil or Kerosene | 15 (0.1%) | 0 (0.0%) |
| Coal or Coke | 22 (0.2%) | 4 (0.1%) |
| All other Fuels | 8,380 (55.7%) | 733 (12.5%) |
| No Fuel Used | 206 (1.4%) | 23 (0.4%) |
| Total | 15,034 (100.0%) | 5,879 (100.0%) |
Household Vehicle Usage in McKinley County
| Vehicles per Household | Owner-occupied | Renter-occupied |
| No Vehicle | 1,747 (11.6%) | 730 (12.4%) |
| 1 Vehicle | 4,478 (29.8%) | 2,947 (50.1%) |
| 2 Vehicles | 4,804 (32.0%) | 1,566 (26.6%) |
| 3 or more Vehicles | 4,005 (26.6%) | 636 (10.8%) |
| Total | 15,034 (100.0%) | 5,879 (100.0%) |
Real Estate & Mortgages in McKinley County
Real Estate and Mortgage Overview in McKinley County
| Characteristic | Without Mortgage | With Mortgage |
| Housing Units | 11,435 | 3,599 |
| Median Property Value | $55,800 | $131,500 |
| Median Household Income | $37,953 | $456 |
| Monthly Housing Costs | $254 | $84 |
| Real Estate Taxes | $1,078 | $1,439 |
Property Value by Mortgage Status in McKinley County
| Property Value | Without Mortgage | With Mortgage |
| Less than $50,000 | 5,191 (45.4%) | 535 (14.9%) |
| $50,000 to $99,999 | 3,277 (28.7%) | 777 (21.6%) |
| $100,000 to $299,999 | 2,277 (19.9%) | 1,929 (53.6%) |
| $300,000 to $499,999 | 569 (5.0%) | 281 (7.8%) |
| $500,000 to $749,999 | 83 (0.7%) | 56 (1.6%) |
| $750,000 to $999,999 | 33 (0.3%) | 21 (0.6%) |
| $1,000,000 or more | 5 (0.0%) | 0 (0.0%) |
| Total | 11,435 (100.0%) | 3,599 (100.0%) |
Household Income by Mortgage Status in McKinley County
| Household Income | Without Mortgage | With Mortgage |
| Less than $10,000 | 1,702 (14.9%) | 0 (0.0%) |
| $10,000 to $24,999 | 2,670 (23.4%) | 270 (7.5%) |
| $25,000 to $34,999 | 1,050 (9.2%) | 256 (7.1%) |
| $35,000 to $49,999 | 1,507 (13.2%) | 291 (8.1%) |
| $50,000 to $74,999 | 1,687 (14.7%) | 308 (8.6%) |
| $75,000 to $99,999 | 836 (7.3%) | 689 (19.1%) |
| $100,000 to $149,999 | 1,351 (11.8%) | 740 (20.6%) |
| $150,000 or more | 632 (5.5%) | 589 (16.4%) |
| Total | 11,435 (100.0%) | 3,599 (100.0%) |
Property Value to Household Income Ratio in McKinley County
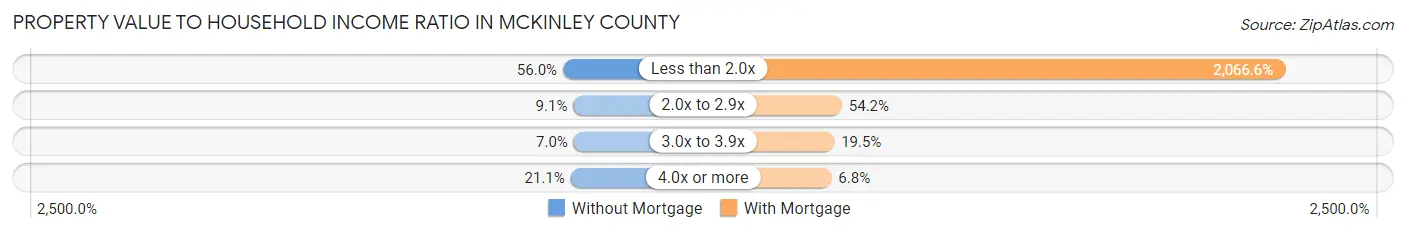
| Value-to-Income Ratio | Without Mortgage | With Mortgage |
| Less than 2.0x | 6,405 (56.0%) | 74,375 (2,066.6%) |
| 2.0x to 2.9x | 1,041 (9.1%) | 1,950 (54.2%) |
| 3.0x to 3.9x | 798 (7.0%) | 701 (19.5%) |
| 4.0x or more | 2,413 (21.1%) | 244 (6.8%) |
| Total | 11,435 (100.0%) | 3,599 (100.0%) |
Real Estate Taxes by Mortgage Status in McKinley County
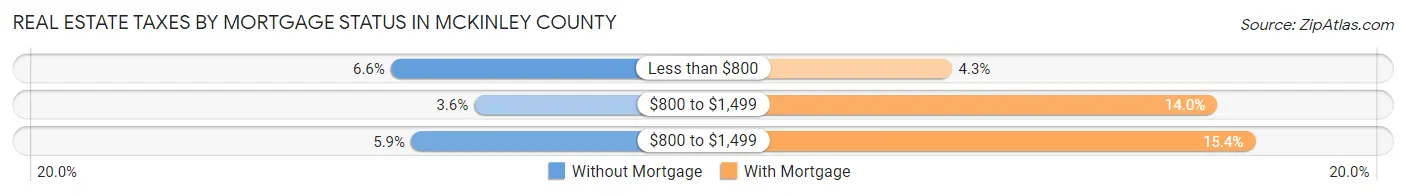
| Property Taxes | Without Mortgage | With Mortgage |
| Less than $800 | 758 (6.6%) | 156 (4.3%) |
| $800 to $1,499 | 409 (3.6%) | 505 (14.0%) |
| $800 to $1,499 | 673 (5.9%) | 555 (15.4%) |
| Total | 11,435 (100.0%) | 3,599 (100.0%) |
Health & Disability in McKinley County
Health Insurance Coverage by Age in McKinley County
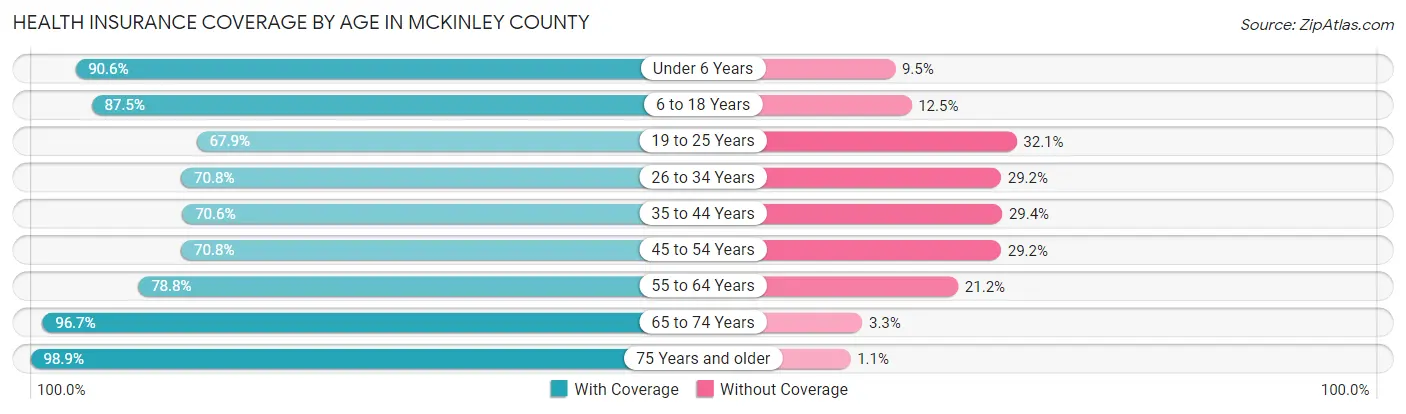
| Age Bracket | With Coverage | Without Coverage |
| Under 6 Years | 5,251 (90.5%) | 548 (9.5%) |
| 6 to 18 Years | 13,645 (87.5%) | 1,945 (12.5%) |
| 19 to 25 Years | 4,411 (67.9%) | 2,084 (32.1%) |
| 26 to 34 Years | 6,823 (70.8%) | 2,812 (29.2%) |
| 35 to 44 Years | 6,137 (70.6%) | 2,556 (29.4%) |
| 45 to 54 Years | 5,661 (70.8%) | 2,333 (29.2%) |
| 55 to 64 Years | 6,527 (78.8%) | 1,755 (21.2%) |
| 65 to 74 Years | 5,433 (96.7%) | 186 (3.3%) |
| 75 Years and older | 3,402 (98.9%) | 38 (1.1%) |
| Total | 57,290 (80.1%) | 14,257 (19.9%) |
Health Insurance Coverage by Citizenship Status in McKinley County
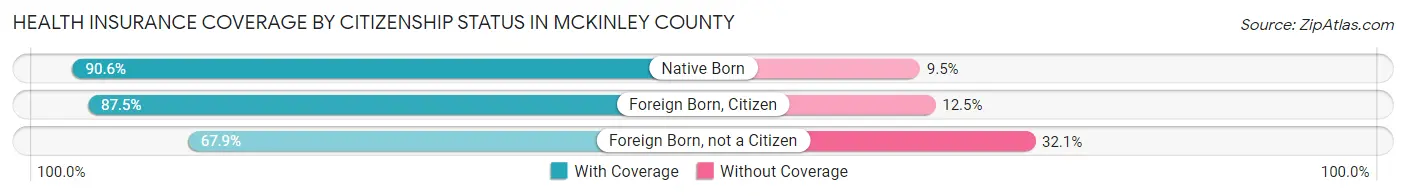
| Citizenship Status | With Coverage | Without Coverage |
| Native Born | 5,251 (90.5%) | 548 (9.5%) |
| Foreign Born, Citizen | 13,645 (87.5%) | 1,945 (12.5%) |
| Foreign Born, not a Citizen | 4,411 (67.9%) | 2,084 (32.1%) |
Health Insurance Coverage by Household Income in McKinley County
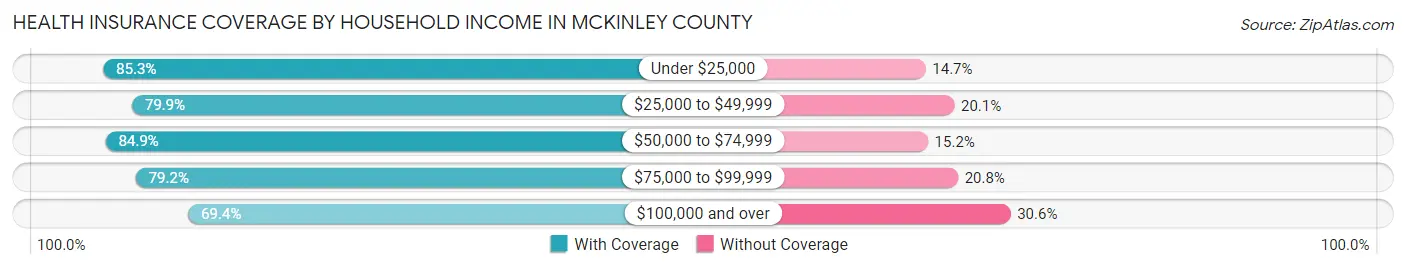
| Household Income | With Coverage | Without Coverage |
| Under $25,000 | 16,791 (85.3%) | 2,899 (14.7%) |
| $25,000 to $49,999 | 12,071 (79.9%) | 3,035 (20.1%) |
| $50,000 to $74,999 | 10,886 (84.9%) | 1,943 (15.1%) |
| $75,000 to $99,999 | 6,500 (79.2%) | 1,705 (20.8%) |
| $100,000 and over | 10,515 (69.4%) | 4,641 (30.6%) |
Public vs Private Health Insurance Coverage by Age in McKinley County
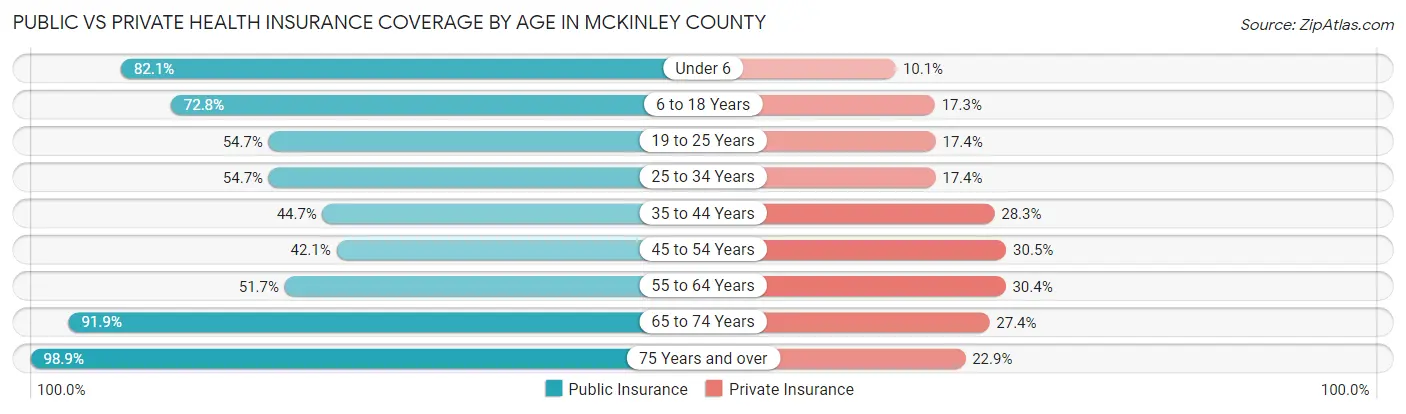
| Age Bracket | Public Insurance | Private Insurance |
| Under 6 | 4,762 (82.1%) | 583 (10.1%) |
| 6 to 18 Years | 11,356 (72.8%) | 2,690 (17.2%) |
| 19 to 25 Years | 3,552 (54.7%) | 1,130 (17.4%) |
| 25 to 34 Years | 5,266 (54.6%) | 1,672 (17.3%) |
| 35 to 44 Years | 3,883 (44.7%) | 2,461 (28.3%) |
| 45 to 54 Years | 3,365 (42.1%) | 2,439 (30.5%) |
| 55 to 64 Years | 4,283 (51.7%) | 2,516 (30.4%) |
| 65 to 74 Years | 5,161 (91.8%) | 1,539 (27.4%) |
| 75 Years and over | 3,402 (98.9%) | 788 (22.9%) |
| Total | 45,030 (62.9%) | 15,818 (22.1%) |
Disability Status by Sex by Age in McKinley County
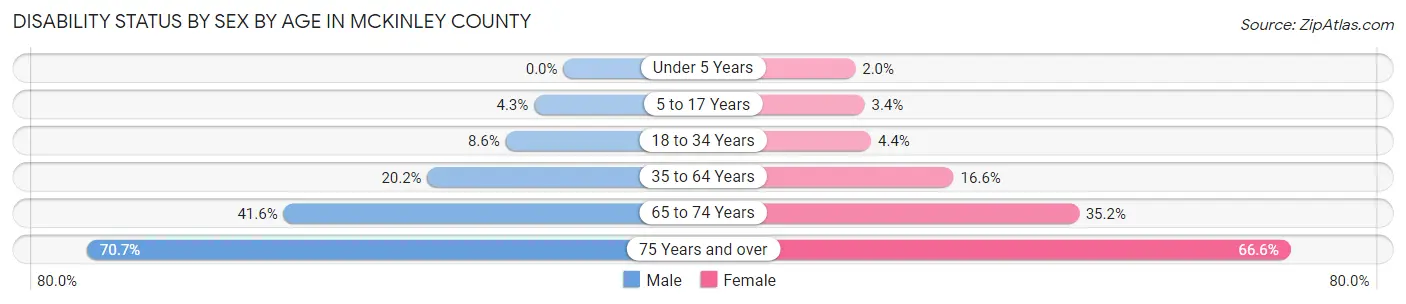
| Age Bracket | Male | Female |
| Under 5 Years | 0 (0.0%) | 46 (2.0%) |
| 5 to 17 Years | 351 (4.3%) | 255 (3.4%) |
| 18 to 34 Years | 734 (8.6%) | 382 (4.3%) |
| 35 to 64 Years | 2,435 (20.2%) | 2,143 (16.6%) |
| 65 to 74 Years | 992 (41.6%) | 1,137 (35.2%) |
| 75 Years and over | 943 (70.7%) | 1,404 (66.6%) |
Disability Class by Sex by Age in McKinley County
Disability Class: Hearing Difficulty
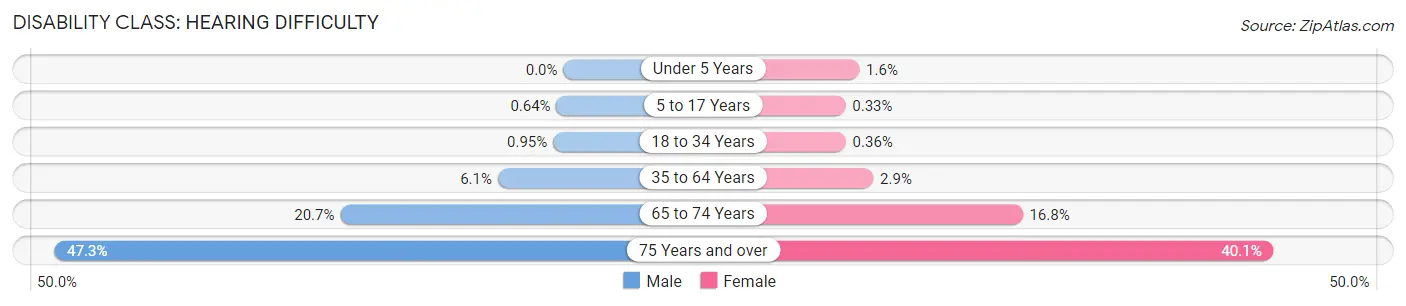
| Age Bracket | Male | Female |
| Under 5 Years | 0 (0.0%) | 37 (1.6%) |
| 5 to 17 Years | 52 (0.6%) | 25 (0.3%) |
| 18 to 34 Years | 81 (0.9%) | 32 (0.4%) |
| 35 to 64 Years | 734 (6.1%) | 375 (2.9%) |
| 65 to 74 Years | 494 (20.7%) | 542 (16.8%) |
| 75 Years and over | 630 (47.3%) | 844 (40.1%) |
Disability Class: Vision Difficulty
| Age Bracket | Male | Female |
| Under 5 Years | 0 (0.0%) | 19 (0.8%) |
| 5 to 17 Years | 8 (0.1%) | 65 (0.9%) |
| 18 to 34 Years | 146 (1.7%) | 106 (1.2%) |
| 35 to 64 Years | 497 (4.1%) | 490 (3.8%) |
| 65 to 74 Years | 264 (11.1%) | 282 (8.7%) |
| 75 Years and over | 253 (19.0%) | 446 (21.2%) |
Disability Class: Cognitive Difficulty
| Age Bracket | Male | Female |
| 5 to 17 Years | 274 (3.4%) | 227 (3.0%) |
| 18 to 34 Years | 478 (5.6%) | 186 (2.1%) |
| 35 to 64 Years | 902 (7.5%) | 560 (4.3%) |
| 65 to 74 Years | 301 (12.6%) | 369 (11.4%) |
| 75 Years and over | 250 (18.8%) | 425 (20.2%) |
Disability Class: Ambulatory Difficulty
| Age Bracket | Male | Female |
| 5 to 17 Years | 27 (0.3%) | 66 (0.9%) |
| 18 to 34 Years | 323 (3.8%) | 90 (1.0%) |
| 35 to 64 Years | 1,361 (11.3%) | 1,286 (10.0%) |
| 65 to 74 Years | 561 (23.5%) | 558 (17.3%) |
| 75 Years and over | 448 (33.6%) | 1,039 (49.3%) |
Disability Class: Self-Care Difficulty
| Age Bracket | Male | Female |
| 5 to 17 Years | 46 (0.6%) | 102 (1.3%) |
| 18 to 34 Years | 350 (4.1%) | 73 (0.8%) |
| 35 to 64 Years | 496 (4.1%) | 442 (3.4%) |
| 65 to 74 Years | 113 (4.7%) | 122 (3.8%) |
| 75 Years and over | 195 (14.6%) | 404 (19.2%) |
Technology Access in McKinley County
Computing Device Access in McKinley County
| Device Type | # Households | % Households |
| Desktop or Laptop | 10,587 | 50.6% |
| Smartphone | 14,016 | 67.0% |
| Tablet | 8,902 | 42.6% |
| No Computing Device | 5,548 | 26.5% |
| Total | 20,913 | 100.0% |
Internet Access in McKinley County
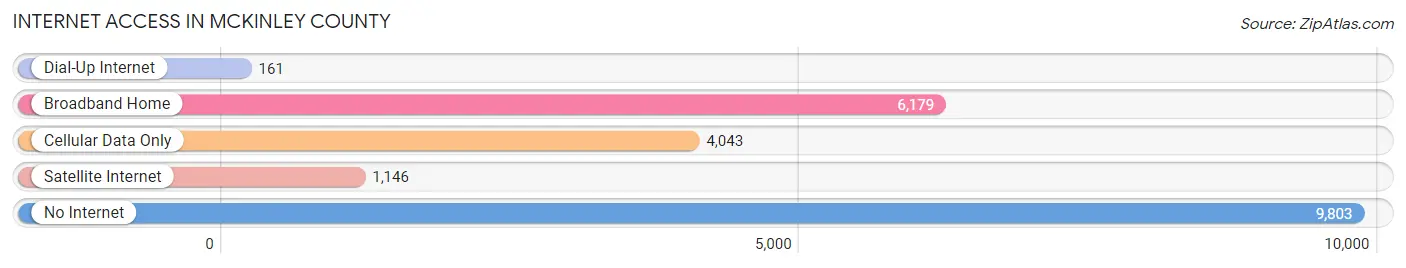
| Internet Type | # Households | % Households |
| Dial-Up Internet | 161 | 0.8% |
| Broadband Home | 6,179 | 29.5% |
| Cellular Data Only | 4,043 | 19.3% |
| Satellite Internet | 1,146 | 5.5% |
| No Internet | 9,803 | 46.9% |
| Total | 20,913 | 100.0% |
McKinley County Summary
Mckinley County is located in the northwestern part of New Mexico and is the largest county in the state. It is bordered by San Juan County to the north, Rio Arriba County to the east, Sandoval County to the south, and Apache County, Arizona to the west. The county seat is Gallup, and the largest city is Gallup. The county was named after President William McKinley.
Geography
Mckinley County covers an area of 7,425 square miles, making it the largest county in New Mexico. It is located in the northwestern part of the state and is bordered by San Juan County to the north, Rio Arriba County to the east, Sandoval County to the south, and Apache County, Arizona to the west. The county is mostly mountainous, with the Chuska Mountains to the north and the Zuni Mountains to the south. The Continental Divide passes through the county, and the highest point is Mount Taylor, which has an elevation of 11,301 feet. The county also contains several rivers, including the San Juan River, the Puerco River, and the Little Colorado River.
Demographics
As of the 2010 census, Mckinley County had a population of 71,492. The population was 48.2% Native American, 43.3% White, 2.2% Hispanic or Latino, 1.2% Asian, 0.2% Black or African American, and 0.1% Pacific Islander. The median household income was $35,945, and the median family income was $41,919. The per capita income was $17,845.
Economy
Mckinley County's economy is largely based on tourism, agriculture, and mining. The county is home to the Navajo Nation, which is the largest Native American reservation in the United States. The Navajo Nation is a major employer in the county, and it operates several businesses, including a casino, a hotel, and a retail store. The county is also home to several large coal mines, which provide jobs for many of the county's residents. Agriculture is also an important part of the county's economy, with cattle ranching and farming being the main agricultural activities.
The county is also home to several tourist attractions, including the Gallup Cultural Center, the El Morro National Monument, and the Navajo Nation Zoo. The county is also home to several museums, including the Gallup Indian Arts Museum and the Navajo Nation Museum.
Conclusion
Mckinley County is located in the northwestern part of New Mexico and is the largest county in the state. It is bordered by San Juan County to the north, Rio Arriba County to the east, Sandoval County to the south, and Apache County, Arizona to the west. The county has a population of 71,492, and the median household income is $35,945. The county's economy is largely based on tourism, agriculture, and mining. The county is home to the Navajo Nation, which is the largest Native American reservation in the United States, and it is also home to several tourist attractions, including the Gallup Cultural Center, the El Morro National Monument, and the Navajo Nation Zoo.
Common Questions
What is Per Capita Income in McKinley County?
Per Capita income in McKinley County is $19,188.
What is the Median Family Income in McKinley County?
Median Family Income in McKinley County is $49,616.
What is the Median Household income in McKinley County?
Median Household Income in McKinley County is $44,029.
What is Income or Wage Gap in McKinley County?
Income or Wage Gap in McKinley County is 16.3%.
Women in McKinley County earn 83.7 cents for every dollar earned by a man.
What is Family Income Deficit in McKinley County?
Family Income Deficit in McKinley County is $15,189.
Families that are below poverty line in McKinley County earn $15,189 less on average than the poverty threshold level.
What is Inequality or Gini Index in McKinley County?
Inequality or Gini Index in McKinley County is 0.50.
What is the Total Population of McKinley County?
Total Population of McKinley County is 72,073.
What is the Total Male Population of McKinley County?
Total Male Population of McKinley County is 35,101.
What is the Total Female Population of McKinley County?
Total Female Population of McKinley County is 36,972.
What is the Ratio of Males per 100 Females in McKinley County?
There are 94.94 Males per 100 Females in McKinley County.
What is the Ratio of Females per 100 Males in McKinley County?
There are 105.33 Females per 100 Males in McKinley County.
What is the Median Population Age in McKinley County?
Median Population Age in McKinley County is 33.6 Years.
What is the Average Family Size in McKinley County
Average Family Size in McKinley County is 4.1 People.
What is the Average Household Size in McKinley County
Average Household Size in McKinley County is 3.4 People.
How Large is the Labor Force in McKinley County?
There are 26,387 People in the Labor Forcein in McKinley County.
What is the Percentage of People in the Labor Force in McKinley County?
48.5% of People are in the Labor Force in McKinley County.
What is the Unemployment Rate in McKinley County?
Unemployment Rate in McKinley County is 9.6%.