Ferguson, KY Map & Demographics
Ferguson Map
Ferguson Overview
$22,052
PER CAPITA INCOME
$37,125
AVG FAMILY INCOME
$32,500
AVG HOUSEHOLD INCOME
35.6%
WAGE / INCOME GAP [ % ]
64.4¢/ $1
WAGE / INCOME GAP [ $ ]
0.47
INEQUALITY / GINI INDEX
827
TOTAL POPULATION
491
MALE POPULATION
336
FEMALE POPULATION
146.13
MALES / 100 FEMALES
68.43
FEMALES / 100 MALES
47.8
MEDIAN AGE
3.1
AVG FAMILY SIZE
2.5
AVG HOUSEHOLD SIZE
298
LABOR FORCE [ PEOPLE ]
41.6%
PERCENT IN LABOR FORCE
7.4%
UNEMPLOYMENT RATE
Ferguson Zip Codes
Ferguson Area Codes
Income in Ferguson
Income Overview in Ferguson
Per Capita Income in Ferguson is $22,052, while median incomes of families and households are $37,125 and $32,500 respectively.
| Characteristic | Number | Measure |
| Per Capita Income | 827 | $22,052 |
| Median Family Income | 187 | $37,125 |
| Mean Family Income | 187 | $57,979 |
| Median Household Income | 336 | $32,500 |
| Mean Household Income | 336 | $51,551 |
| Income Deficit | 187 | $0 |
| Wage / Income Gap (%) | 827 | 35.56% |
| Wage / Income Gap ($) | 827 | 64.44¢ per $1 |
| Gini / Inequality Index | 827 | 0.47 |
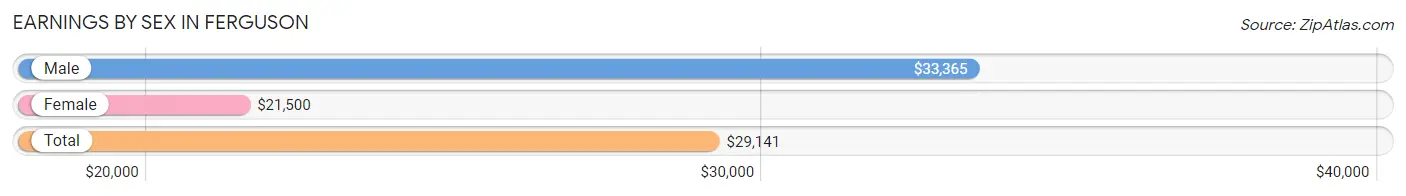
Earnings by Sex in Ferguson
Average Earnings in Ferguson are $29,141, $33,365 for men and $21,500 for women, a difference of 35.6%.
| Sex | Number | Average Earnings |
| Male | 187 (58.6%) | $33,365 |
| Female | 132 (41.4%) | $21,500 |
| Total | 319 (100.0%) | $29,141 |
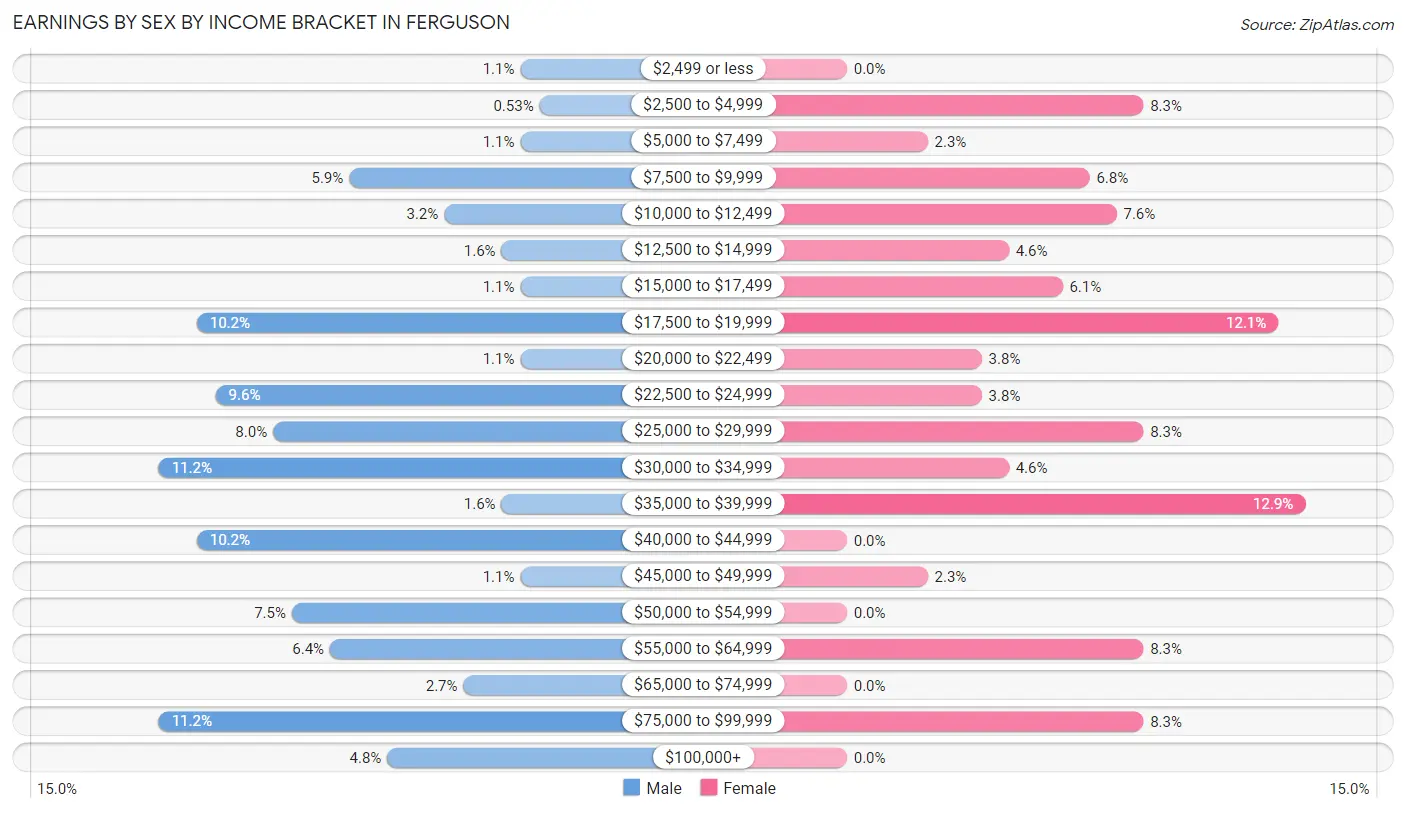
Earnings by Sex by Income Bracket in Ferguson
The most common earnings brackets in Ferguson are $30,000 to $34,999 for men (21 | 11.2%) and $35,000 to $39,999 for women (17 | 12.9%).
| Income | Male | Female |
| $2,499 or less | 2 (1.1%) | 0 (0.0%) |
| $2,500 to $4,999 | 1 (0.5%) | 11 (8.3%) |
| $5,000 to $7,499 | 2 (1.1%) | 3 (2.3%) |
| $7,500 to $9,999 | 11 (5.9%) | 9 (6.8%) |
| $10,000 to $12,499 | 6 (3.2%) | 10 (7.6%) |
| $12,500 to $14,999 | 3 (1.6%) | 6 (4.5%) |
| $15,000 to $17,499 | 2 (1.1%) | 8 (6.1%) |
| $17,500 to $19,999 | 19 (10.2%) | 16 (12.1%) |
| $20,000 to $22,499 | 2 (1.1%) | 5 (3.8%) |
| $22,500 to $24,999 | 18 (9.6%) | 5 (3.8%) |
| $25,000 to $29,999 | 15 (8.0%) | 11 (8.3%) |
| $30,000 to $34,999 | 21 (11.2%) | 6 (4.5%) |
| $35,000 to $39,999 | 3 (1.6%) | 17 (12.9%) |
| $40,000 to $44,999 | 19 (10.2%) | 0 (0.0%) |
| $45,000 to $49,999 | 2 (1.1%) | 3 (2.3%) |
| $50,000 to $54,999 | 14 (7.5%) | 0 (0.0%) |
| $55,000 to $64,999 | 12 (6.4%) | 11 (8.3%) |
| $65,000 to $74,999 | 5 (2.7%) | 0 (0.0%) |
| $75,000 to $99,999 | 21 (11.2%) | 11 (8.3%) |
| $100,000+ | 9 (4.8%) | 0 (0.0%) |
| Total | 187 (100.0%) | 132 (100.0%) |
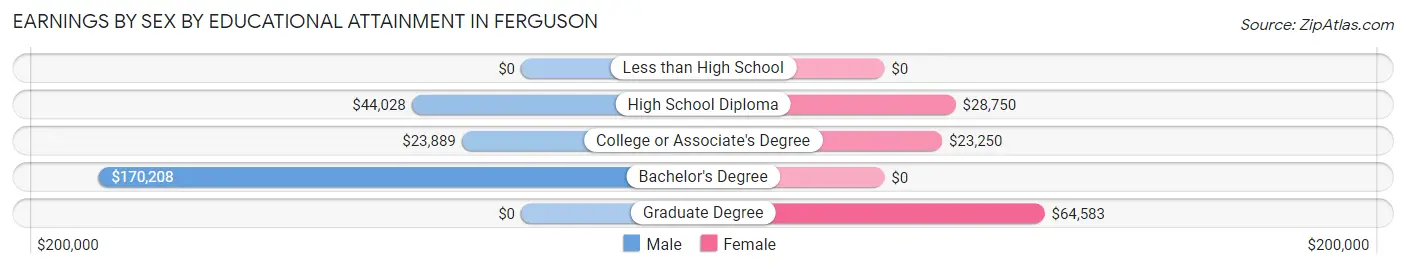
Earnings by Sex by Educational Attainment in Ferguson
Average earnings in Ferguson are $34,423 for men and $27,083 for women, a difference of 21.3%. Men with an educational attainment of bachelor's degree enjoy the highest average annual earnings of $170,208, while those with college or associate's degree education earn the least with $23,889. Women with an educational attainment of graduate degree earn the most with the average annual earnings of $64,583, while those with college or associate's degree education have the smallest earnings of $23,250.
| Educational Attainment | Male Income | Female Income |
| Less than High School | - | - |
| High School Diploma | $44,028 | $28,750 |
| College or Associate's Degree | $23,889 | $23,250 |
| Bachelor's Degree | $170,208 | $0 |
| Graduate Degree | - | - |
| Total | $34,423 | $27,083 |
Family Income in Ferguson
Family Income Brackets in Ferguson
According to the Ferguson family income data, there are 27 families falling into the less than $10,000 income range, which is the most common income bracket and makes up 14.4% of all families.
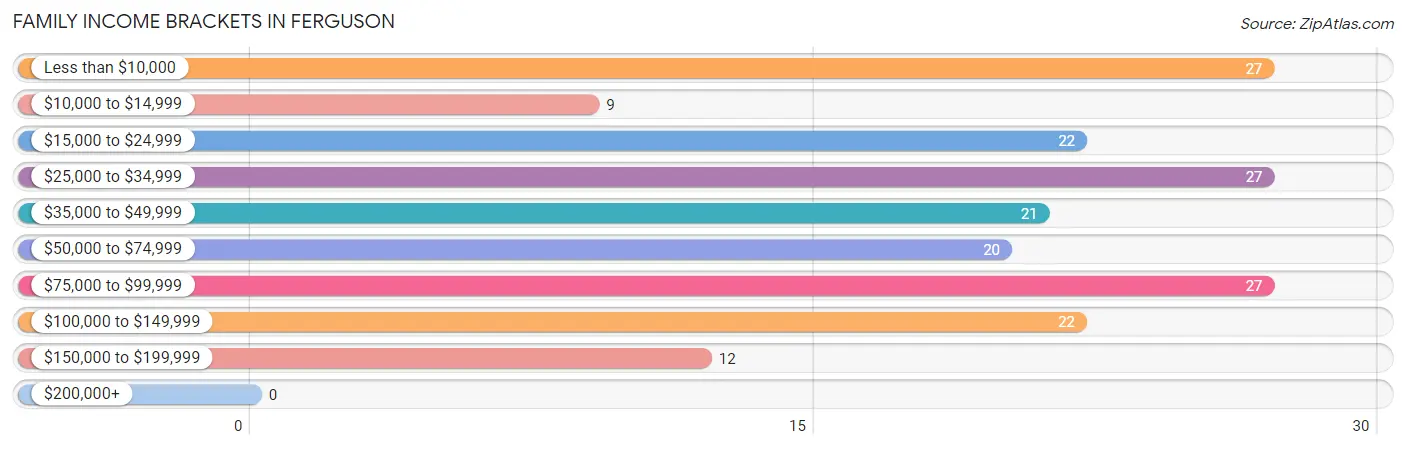
| Income Bracket | # Families | % Families |
| Less than $10,000 | 27 | 14.4% |
| $10,000 to $14,999 | 9 | 4.8% |
| $15,000 to $24,999 | 22 | 11.8% |
| $25,000 to $34,999 | 27 | 14.4% |
| $35,000 to $49,999 | 21 | 11.2% |
| $50,000 to $74,999 | 20 | 10.7% |
| $75,000 to $99,999 | 27 | 14.4% |
| $100,000 to $149,999 | 22 | 11.8% |
| $150,000 to $199,999 | 12 | 6.4% |
| $200,000+ | 0 | 0.0% |
Family Income by Famaliy Size in Ferguson
4-person families (12 | 6.4%) account for the highest median family income in Ferguson with $101,250 per family, while 4-person families (12 | 6.4%) have the highest median income of $25,312 per family member.
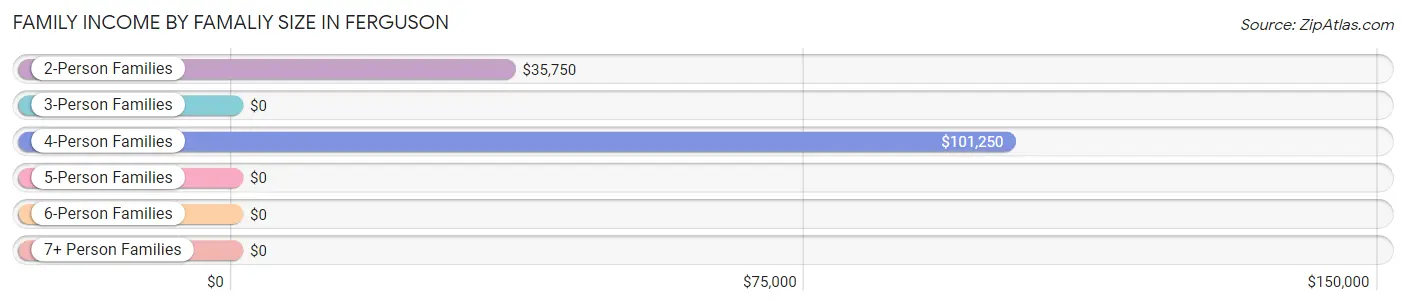
| Income Bracket | # Families | Median Income |
| 2-Person Families | 112 (59.9%) | $35,750 |
| 3-Person Families | 53 (28.3%) | $0 |
| 4-Person Families | 12 (6.4%) | $101,250 |
| 5-Person Families | 3 (1.6%) | $0 |
| 6-Person Families | 4 (2.1%) | $0 |
| 7+ Person Families | 3 (1.6%) | $0 |
| Total | 187 (100.0%) | $37,125 |
Family Income by Number of Earners in Ferguson
The median family income in Ferguson is $37,125, with families comprising 3+ earners (14) having the highest median family income of $106,667, while families with no earners (54) have the lowest median family income of $23,636, accounting for 7.5% and 28.9% of families, respectively.
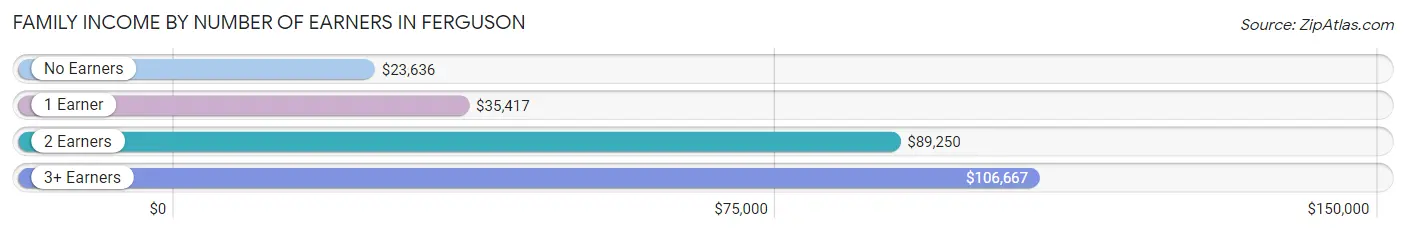
| Number of Earners | # Families | Median Income |
| No Earners | 54 (28.9%) | $23,636 |
| 1 Earner | 71 (38.0%) | $35,417 |
| 2 Earners | 48 (25.7%) | $89,250 |
| 3+ Earners | 14 (7.5%) | $106,667 |
| Total | 187 (100.0%) | $37,125 |
Household Income in Ferguson
Household Income Brackets in Ferguson
With 55 households falling in the category, the $15,000 to $24,999 income range is the most frequent in Ferguson, accounting for 16.4% of all households.
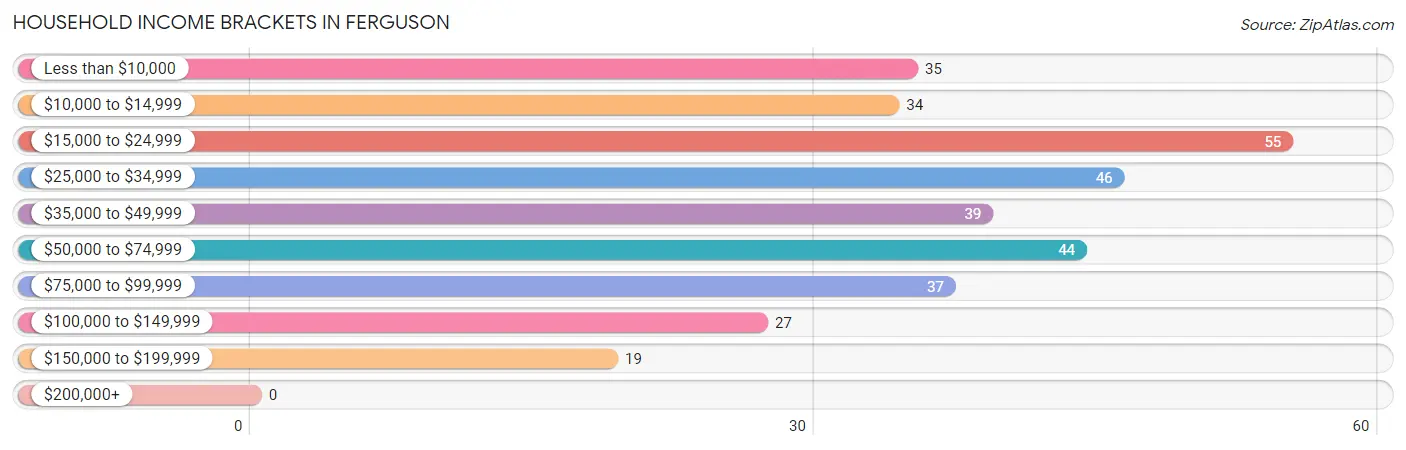
| Income Bracket | # Households | % Households |
| Less than $10,000 | 35 | 10.4% |
| $10,000 to $14,999 | 34 | 10.1% |
| $15,000 to $24,999 | 55 | 16.4% |
| $25,000 to $34,999 | 46 | 13.7% |
| $35,000 to $49,999 | 39 | 11.6% |
| $50,000 to $74,999 | 44 | 13.1% |
| $75,000 to $99,999 | 37 | 11.0% |
| $100,000 to $149,999 | 27 | 8.0% |
| $150,000 to $199,999 | 19 | 5.7% |
| $200,000+ | 0 | 0.0% |
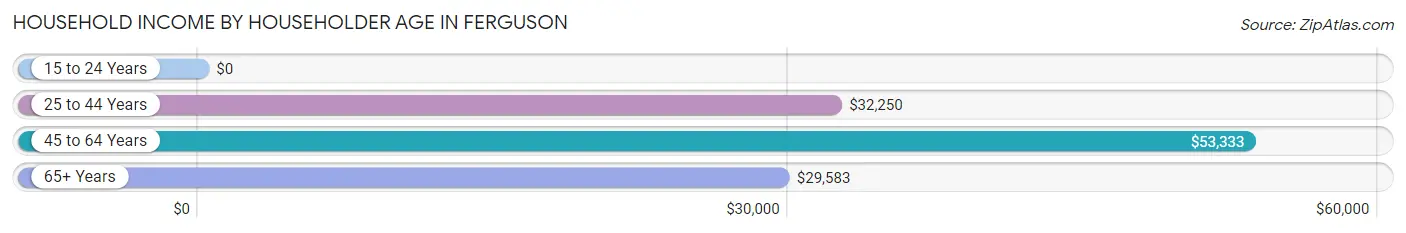
Household Income by Householder Age in Ferguson
The median household income in Ferguson is $32,500, with the highest median household income of $53,333 found in the 45 to 64 years age bracket for the primary householder. A total of 140 households (41.7%) fall into this category. Meanwhile, the 15 to 24 years age bracket for the primary householder has the lowest median household income of $0, with 9 households (2.7%) in this group.
| Income Bracket | # Households | Median Income |
| 15 to 24 Years | 9 (2.7%) | $0 |
| 25 to 44 Years | 73 (21.7%) | $32,250 |
| 45 to 64 Years | 140 (41.7%) | $53,333 |
| 65+ Years | 114 (33.9%) | $29,583 |
| Total | 336 (100.0%) | $32,500 |
Poverty in Ferguson
Income Below Poverty by Sex and Age in Ferguson
With 42.1% poverty level for males and 33.8% for females among the residents of Ferguson, 6 to 11 year old males and 6 to 11 year old females are the most vulnerable to poverty, with 2 males (100.0%) and 2 females (100.0%) in their respective age groups living below the poverty level.
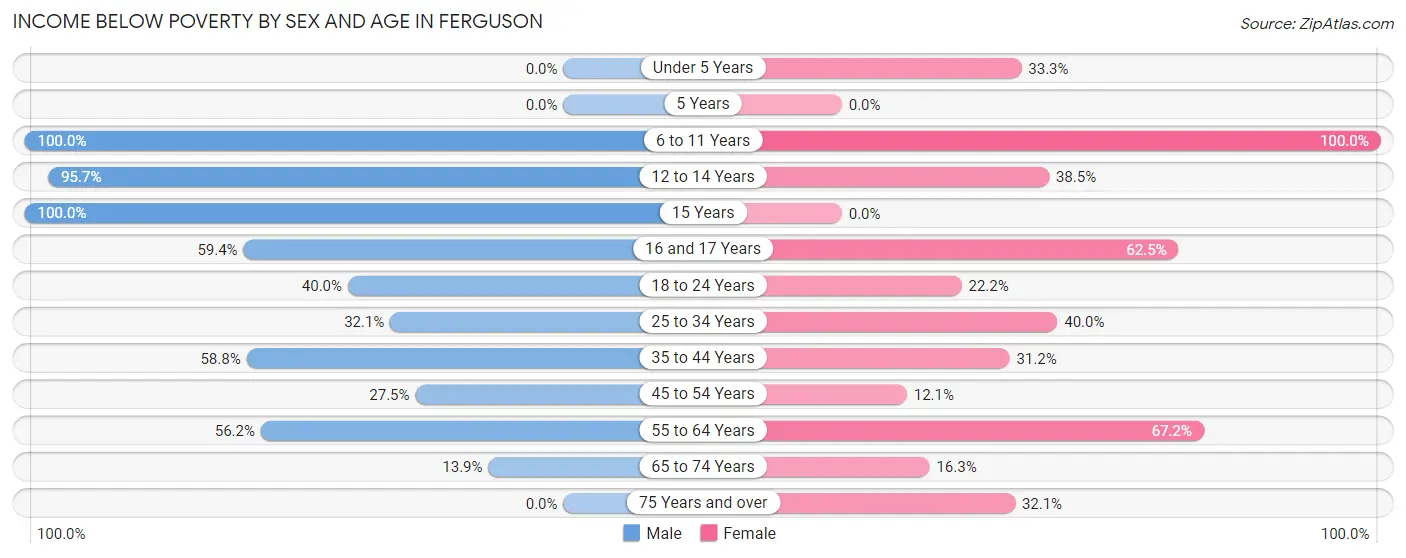
| Age Bracket | Male | Female |
| Under 5 Years | 0 (0.0%) | 3 (33.3%) |
| 5 Years | 0 (0.0%) | 0 (0.0%) |
| 6 to 11 Years | 2 (100.0%) | 2 (100.0%) |
| 12 to 14 Years | 44 (95.7%) | 5 (38.5%) |
| 15 Years | 16 (100.0%) | 0 (0.0%) |
| 16 and 17 Years | 19 (59.4%) | 5 (62.5%) |
| 18 to 24 Years | 6 (40.0%) | 4 (22.2%) |
| 25 to 34 Years | 18 (32.1%) | 8 (40.0%) |
| 35 to 44 Years | 20 (58.8%) | 19 (31.1%) |
| 45 to 54 Years | 25 (27.5%) | 7 (12.1%) |
| 55 to 64 Years | 41 (56.2%) | 43 (67.2%) |
| 65 to 74 Years | 11 (13.9%) | 7 (16.3%) |
| 75 Years and over | 0 (0.0%) | 9 (32.1%) |
| Total | 202 (42.1%) | 112 (33.8%) |
Income Above Poverty by Sex and Age in Ferguson
According to the poverty statistics in Ferguson, males aged 75 years and over and females aged 5 years are the age groups that are most secure financially, with 100.0% of males and 100.0% of females in these age groups living above the poverty line.
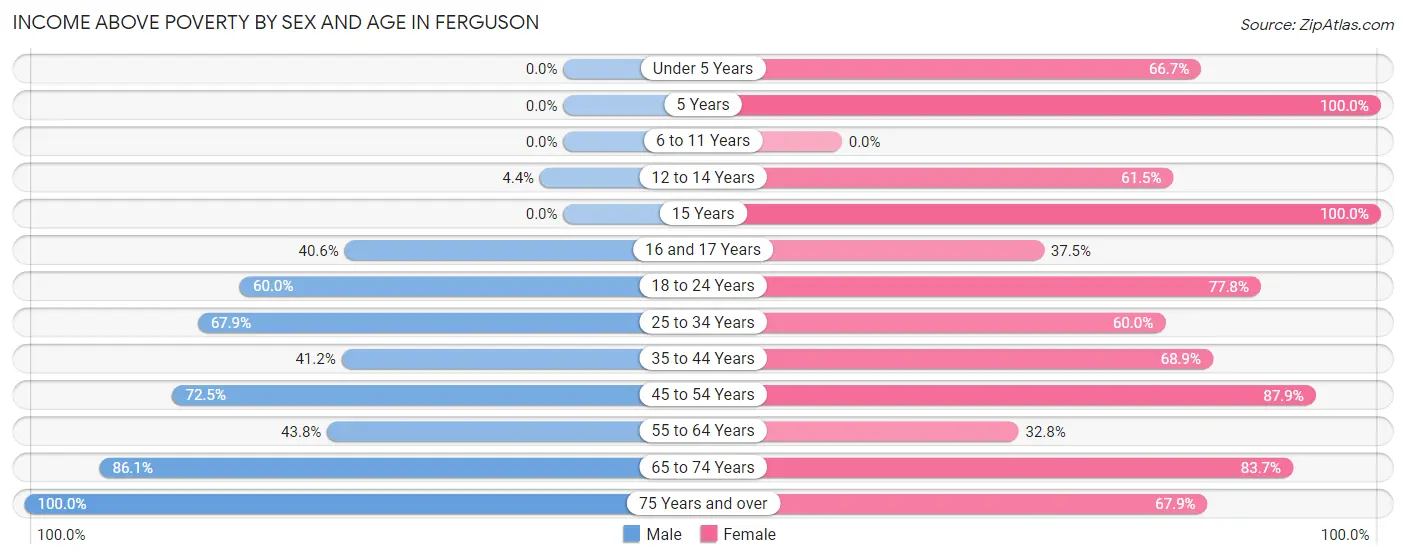
| Age Bracket | Male | Female |
| Under 5 Years | 0 (0.0%) | 6 (66.7%) |
| 5 Years | 0 (0.0%) | 3 (100.0%) |
| 6 to 11 Years | 0 (0.0%) | 0 (0.0%) |
| 12 to 14 Years | 2 (4.3%) | 8 (61.5%) |
| 15 Years | 0 (0.0%) | 4 (100.0%) |
| 16 and 17 Years | 13 (40.6%) | 3 (37.5%) |
| 18 to 24 Years | 9 (60.0%) | 14 (77.8%) |
| 25 to 34 Years | 38 (67.9%) | 12 (60.0%) |
| 35 to 44 Years | 14 (41.2%) | 42 (68.9%) |
| 45 to 54 Years | 66 (72.5%) | 51 (87.9%) |
| 55 to 64 Years | 32 (43.8%) | 21 (32.8%) |
| 65 to 74 Years | 68 (86.1%) | 36 (83.7%) |
| 75 Years and over | 36 (100.0%) | 19 (67.9%) |
| Total | 278 (57.9%) | 219 (66.2%) |
Income Below Poverty Among Married-Couple Families in Ferguson
The poverty statistics for married-couple families in Ferguson show that 22.1% or 31 of the total 140 families live below the poverty line. Families with 3 or 4 children have the highest poverty rate of 100.0%, comprising of 6 families. On the other hand, families with 1 or 2 children have the lowest poverty rate of 17.4%, which includes 4 families.
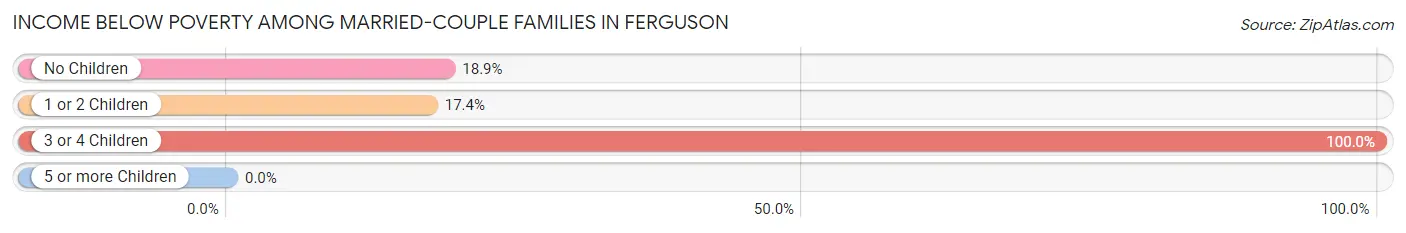
| Children | Above Poverty | Below Poverty |
| No Children | 90 (81.1%) | 21 (18.9%) |
| 1 or 2 Children | 19 (82.6%) | 4 (17.4%) |
| 3 or 4 Children | 0 (0.0%) | 6 (100.0%) |
| 5 or more Children | 0 (0.0%) | 0 (0.0%) |
| Total | 109 (77.9%) | 31 (22.1%) |
Income Below Poverty Among Single-Parent Households in Ferguson
According to the poverty data in Ferguson, 46.2% or 6 single-father households and 35.3% or 12 single-mother households are living below the poverty line. Among single-father households, those with no children have the highest poverty rate, with 6 households (60.0%) experiencing poverty. Likewise, among single-mother households, those with 3 or 4 children have the highest poverty rate, with 4 households (100.0%) falling below the poverty line.
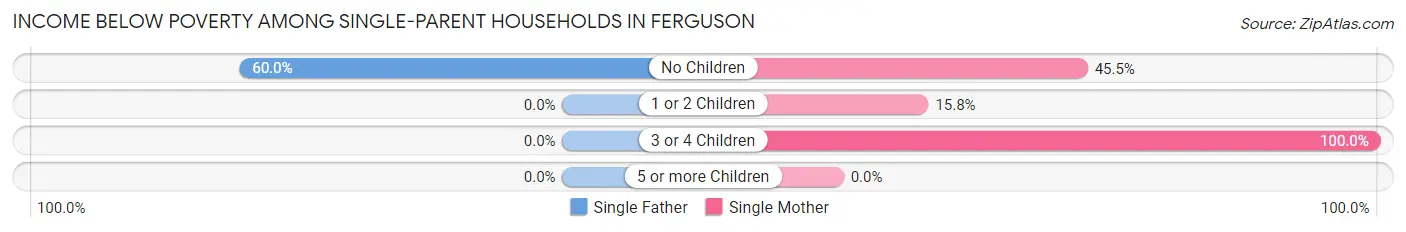
| Children | Single Father | Single Mother |
| No Children | 6 (60.0%) | 5 (45.5%) |
| 1 or 2 Children | 0 (0.0%) | 3 (15.8%) |
| 3 or 4 Children | 0 (0.0%) | 4 (100.0%) |
| 5 or more Children | 0 (0.0%) | 0 (0.0%) |
| Total | 6 (46.2%) | 12 (35.3%) |
Income Below Poverty Among Married-Couple vs Single-Parent Households in Ferguson
The poverty data for Ferguson shows that 31 of the married-couple family households (22.1%) and 18 of the single-parent households (38.3%) are living below the poverty level. Within the married-couple family households, those with 3 or 4 children have the highest poverty rate, with 6 households (100.0%) falling below the poverty line. Among the single-parent households, those with 3 or 4 children have the highest poverty rate, with 4 household (100.0%) living below poverty.
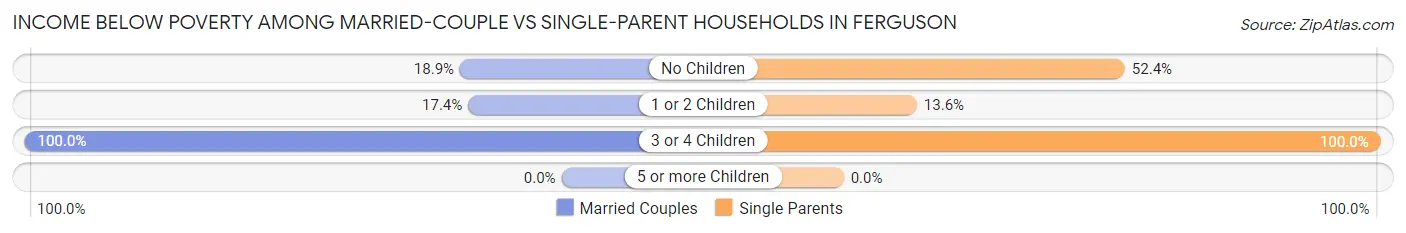
| Children | Married-Couple Families | Single-Parent Households |
| No Children | 21 (18.9%) | 11 (52.4%) |
| 1 or 2 Children | 4 (17.4%) | 3 (13.6%) |
| 3 or 4 Children | 6 (100.0%) | 4 (100.0%) |
| 5 or more Children | 0 (0.0%) | 0 (0.0%) |
| Total | 31 (22.1%) | 18 (38.3%) |
Race in Ferguson
The most populous races in Ferguson are White / Caucasian (740 | 89.5%), Two or more Races (78 | 9.4%), and Hispanic or Latino (41 | 5.0%).
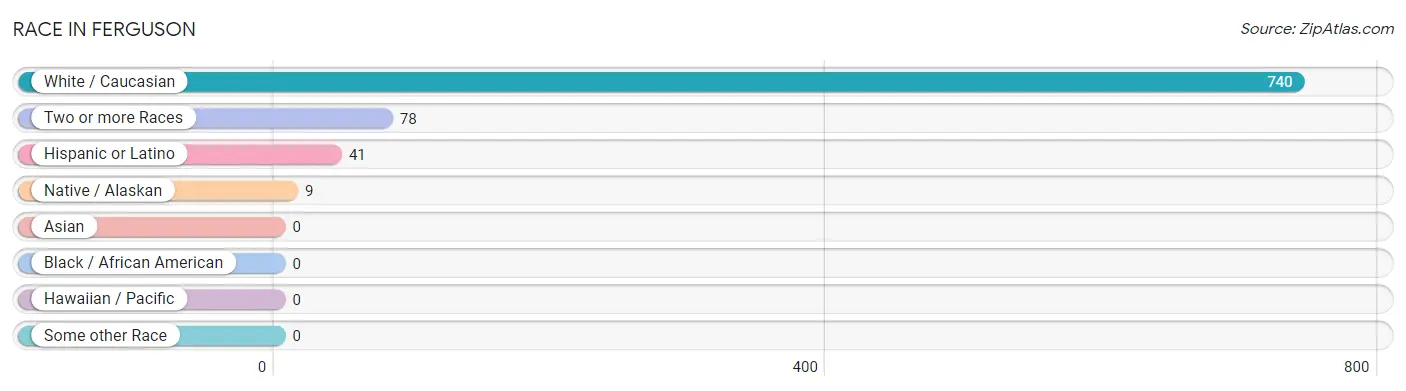
| Race | # Population | % Population |
| Asian | 0 | 0.0% |
| Black / African American | 0 | 0.0% |
| Hawaiian / Pacific | 0 | 0.0% |
| Hispanic or Latino | 41 | 5.0% |
| Native / Alaskan | 9 | 1.1% |
| White / Caucasian | 740 | 89.5% |
| Two or more Races | 78 | 9.4% |
| Some other Race | 0 | 0.0% |
| Total | 827 | 100.0% |
Ancestry in Ferguson
The most populous ancestries reported in Ferguson are Irish (84 | 10.2%), English (68 | 8.2%), American (56 | 6.8%), Burmese (53 | 6.4%), and German (52 | 6.3%), together accounting for 37.9% of all Ferguson residents.
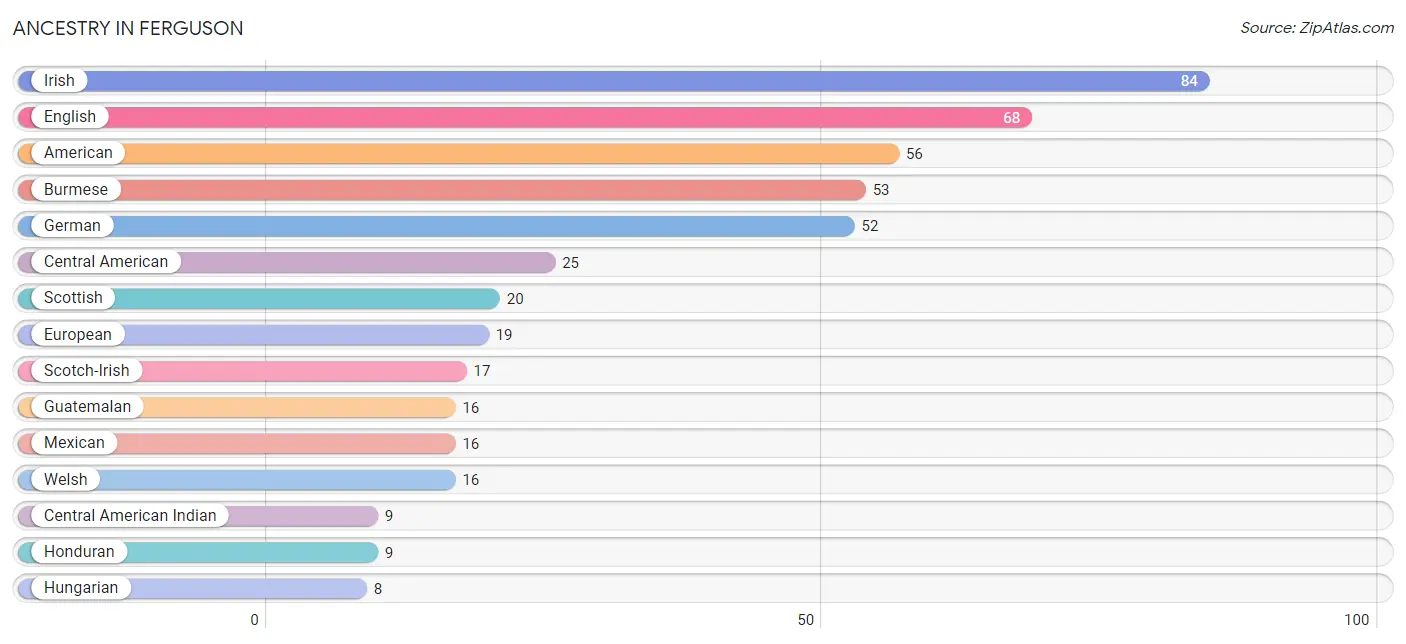
| Ancestry | # Population | % Population |
| American | 56 | 6.8% |
| Burmese | 53 | 6.4% |
| Central American | 25 | 3.0% |
| Central American Indian | 9 | 1.1% |
| Cherokee | 1 | 0.1% |
| Croatian | 3 | 0.4% |
| English | 68 | 8.2% |
| European | 19 | 2.3% |
| French | 2 | 0.2% |
| German | 52 | 6.3% |
| Guatemalan | 16 | 1.9% |
| Honduran | 9 | 1.1% |
| Hungarian | 8 | 1.0% |
| Irish | 84 | 10.2% |
| Italian | 7 | 0.9% |
| Mexican | 16 | 1.9% |
| Northern European | 5 | 0.6% |
| Polish | 2 | 0.2% |
| Russian | 2 | 0.2% |
| Scotch-Irish | 17 | 2.1% |
| Scottish | 20 | 2.4% |
| Swedish | 3 | 0.4% |
| Welsh | 16 | 1.9% | View All 23 Rows |
Immigrants in Ferguson
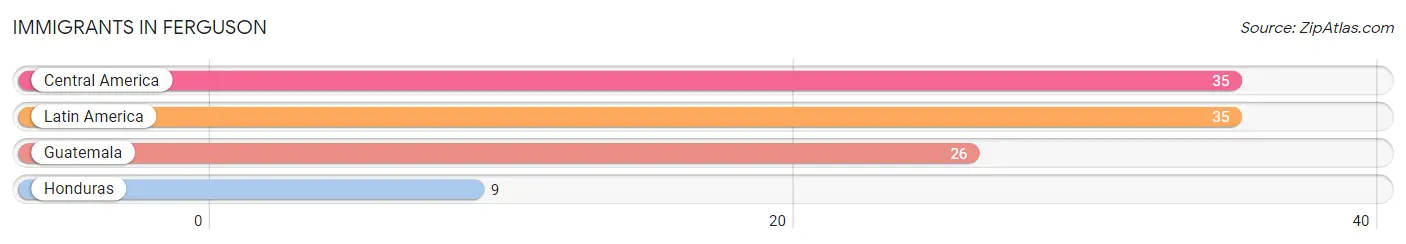
The most numerous immigrant groups reported in Ferguson came from Central America (35 | 4.2%), Latin America (35 | 4.2%), Guatemala (26 | 3.1%), and Honduras (9 | 1.1%), together accounting for 12.7% of all Ferguson residents.
| Immigration Origin | # Population | % Population |
| Central America | 35 | 4.2% |
| Guatemala | 26 | 3.1% |
| Honduras | 9 | 1.1% |
| Latin America | 35 | 4.2% | View All 4 Rows |
Sex and Age in Ferguson
Sex and Age in Ferguson
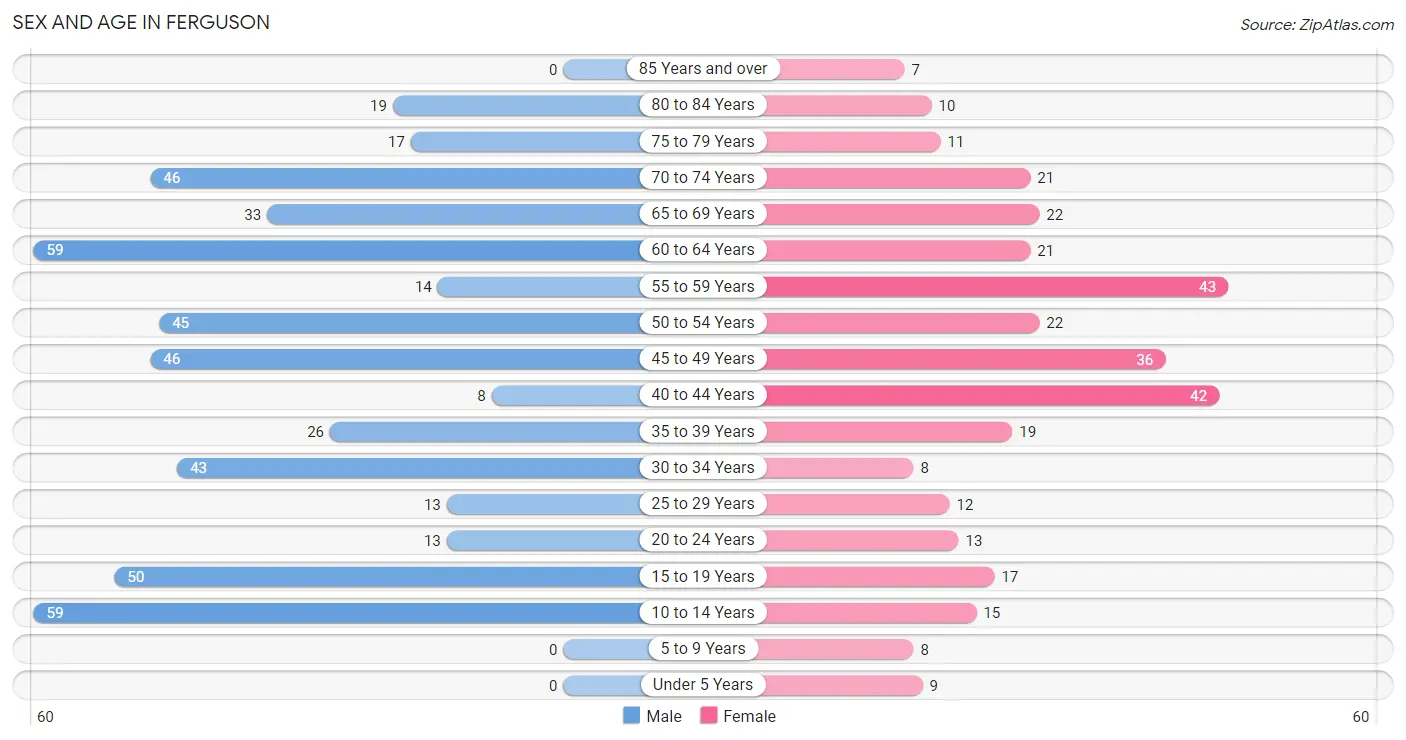
The most populous age groups in Ferguson are 10 to 14 Years (59 | 12.0%) for men and 55 to 59 Years (43 | 12.8%) for women.
| Age Bracket | Male | Female |
| Under 5 Years | 0 (0.0%) | 9 (2.7%) |
| 5 to 9 Years | 0 (0.0%) | 8 (2.4%) |
| 10 to 14 Years | 59 (12.0%) | 15 (4.5%) |
| 15 to 19 Years | 50 (10.2%) | 17 (5.1%) |
| 20 to 24 Years | 13 (2.6%) | 13 (3.9%) |
| 25 to 29 Years | 13 (2.6%) | 12 (3.6%) |
| 30 to 34 Years | 43 (8.8%) | 8 (2.4%) |
| 35 to 39 Years | 26 (5.3%) | 19 (5.7%) |
| 40 to 44 Years | 8 (1.6%) | 42 (12.5%) |
| 45 to 49 Years | 46 (9.4%) | 36 (10.7%) |
| 50 to 54 Years | 45 (9.2%) | 22 (6.6%) |
| 55 to 59 Years | 14 (2.9%) | 43 (12.8%) |
| 60 to 64 Years | 59 (12.0%) | 21 (6.2%) |
| 65 to 69 Years | 33 (6.7%) | 22 (6.6%) |
| 70 to 74 Years | 46 (9.4%) | 21 (6.2%) |
| 75 to 79 Years | 17 (3.5%) | 11 (3.3%) |
| 80 to 84 Years | 19 (3.9%) | 10 (3.0%) |
| 85 Years and over | 0 (0.0%) | 7 (2.1%) |
| Total | 491 (100.0%) | 336 (100.0%) |
Families and Households in Ferguson
Median Family Size in Ferguson
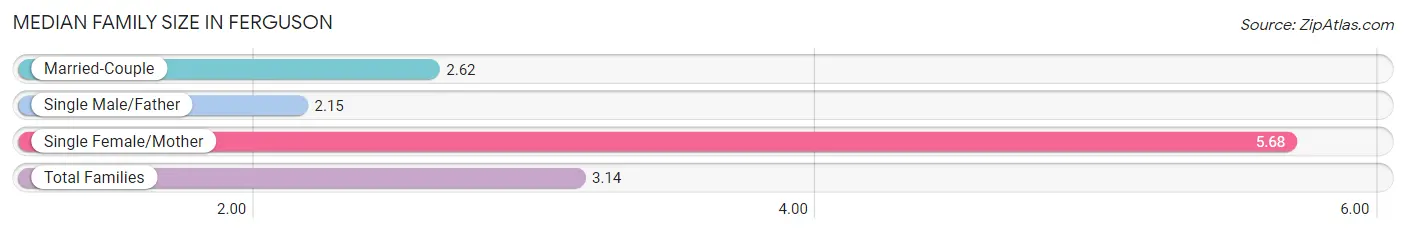
The median family size in Ferguson is 3.14 persons per family, with single female/mother families (34 | 18.2%) accounting for the largest median family size of 5.68 persons per family. On the other hand, single male/father families (13 | 7.0%) represent the smallest median family size with 2.15 persons per family.
| Family Type | # Families | Family Size |
| Married-Couple | 140 (74.9%) | 2.62 |
| Single Male/Father | 13 (7.0%) | 2.15 |
| Single Female/Mother | 34 (18.2%) | 5.68 |
| Total Families | 187 (100.0%) | 3.14 |
Median Household Size in Ferguson
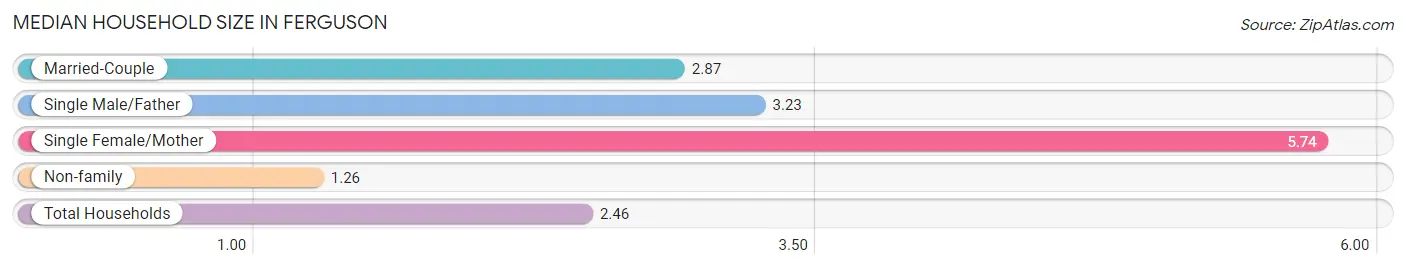
The median household size in Ferguson is 2.46 persons per household, with single female/mother households (34 | 10.1%) accounting for the largest median household size of 5.74 persons per household. non-family households (149 | 44.4%) represent the smallest median household size with 1.26 persons per household.
| Household Type | # Households | Household Size |
| Married-Couple | 140 (41.7%) | 2.87 |
| Single Male/Father | 13 (3.9%) | 3.23 |
| Single Female/Mother | 34 (10.1%) | 5.74 |
| Non-family | 149 (44.4%) | 1.26 |
| Total Households | 336 (100.0%) | 2.46 |
Household Size by Marriage Status in Ferguson
Out of a total of 336 households in Ferguson, 187 (55.6%) are family households, while 149 (44.4%) are nonfamily households. The most numerous type of family households are 2-person households, comprising 98, and the most common type of nonfamily households are 1-person households, comprising 119.
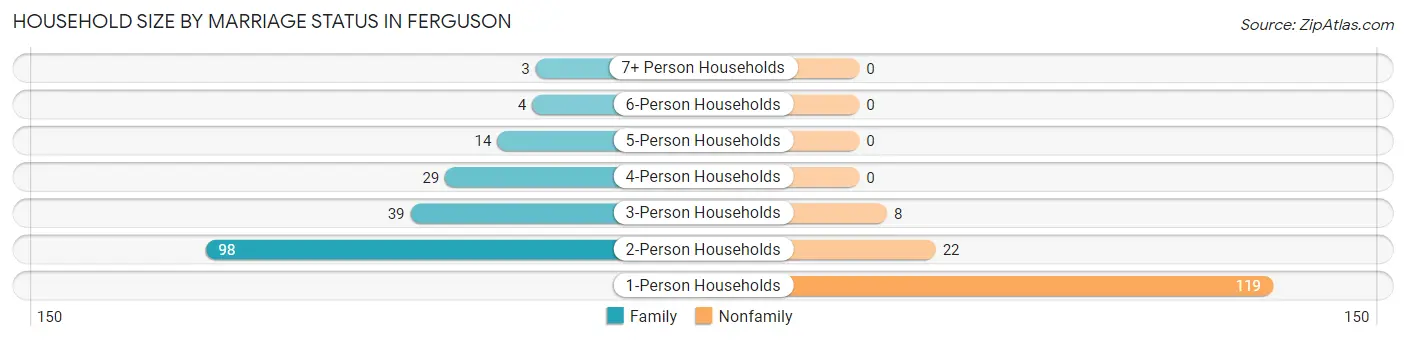
| Household Size | Family Households | Nonfamily Households |
| 1-Person Households | - | 119 (35.4%) |
| 2-Person Households | 98 (29.2%) | 22 (6.6%) |
| 3-Person Households | 39 (11.6%) | 8 (2.4%) |
| 4-Person Households | 29 (8.6%) | 0 (0.0%) |
| 5-Person Households | 14 (4.2%) | 0 (0.0%) |
| 6-Person Households | 4 (1.2%) | 0 (0.0%) |
| 7+ Person Households | 3 (0.9%) | 0 (0.0%) |
| Total | 187 (55.6%) | 149 (44.4%) |
Female Fertility in Ferguson
Fertility by Age in Ferguson
| Age Bracket | Women with Births | Births / 1,000 Women |
| 15 to 19 years | 0 (0.0%) | 0.0 |
| 20 to 34 years | 0 (0.0%) | 0.0 |
| 35 to 50 years | 0 (0.0%) | 0.0 |
| Total | 0 (0.0%) | 0.0 |
Fertility by Age by Marriage Status in Ferguson
| Age Bracket | Married | Unmarried |
| 15 to 19 years | 0 (0.0%) | 0 (0.0%) |
| 20 to 34 years | 0 (0.0%) | 0 (0.0%) |
| 35 to 50 years | 0 (0.0%) | 0 (0.0%) |
| Total | 0 (0.0%) | 0 (0.0%) |
Fertility by Education in Ferguson
| Educational Attainment | Women with Births | Births / 1,000 Women |
| Less than High School | 0 (0.0%) | 0.0 |
| High School Diploma | 0 (0.0%) | 0.0 |
| College or Associate's Degree | 0 (0.0%) | 0.0 |
| Bachelor's Degree | 0 (0.0%) | 0.0 |
| Graduate Degree | 0 (0.0%) | 0.0 |
| Total | 0 (0.0%) | 0.0 |
Fertility by Education by Marriage Status in Ferguson
| Educational Attainment | Married | Unmarried |
| Less than High School | 0 (0.0%) | 0 (0.0%) |
| High School Diploma | 0 (0.0%) | 0 (0.0%) |
| College or Associate's Degree | 0 (0.0%) | 0 (0.0%) |
| Bachelor's Degree | 0 (0.0%) | 0 (0.0%) |
| Graduate Degree | 0 (0.0%) | 0 (0.0%) |
| Total | 0 (0.0%) | 0 (0.0%) |
Employment Characteristics in Ferguson
Employment by Class of Employer in Ferguson
Among the 272 employed individuals in Ferguson, private company employees (154 | 56.6%), local government employees (42 | 15.4%), and self-employed (not incorporated) (29 | 10.7%) make up the most common classes of employment.
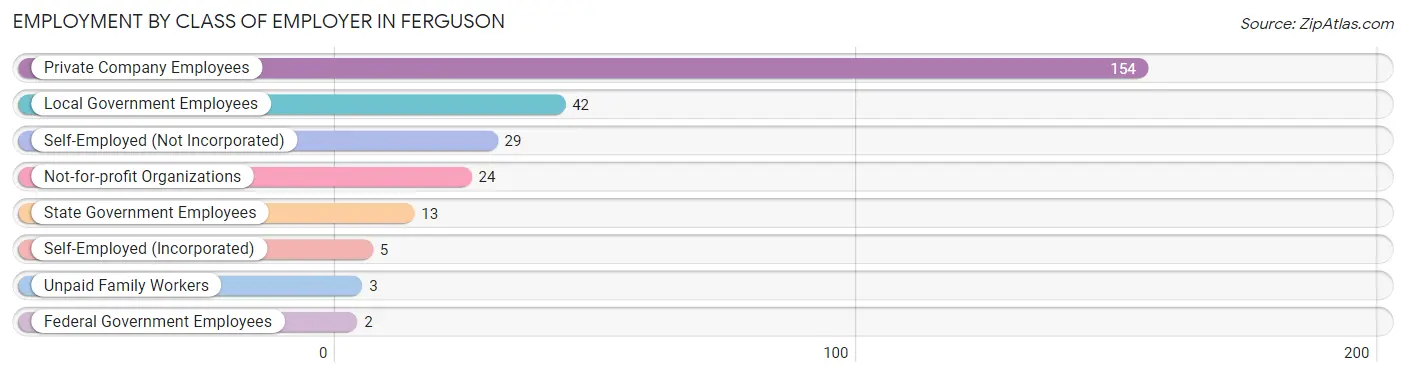
| Employer Class | # Employees | % Employees |
| Private Company Employees | 154 | 56.6% |
| Self-Employed (Incorporated) | 5 | 1.8% |
| Self-Employed (Not Incorporated) | 29 | 10.7% |
| Not-for-profit Organizations | 24 | 8.8% |
| Local Government Employees | 42 | 15.4% |
| State Government Employees | 13 | 4.8% |
| Federal Government Employees | 2 | 0.7% |
| Unpaid Family Workers | 3 | 1.1% |
| Total | 272 | 100.0% |
Employment Status by Age in Ferguson
According to the labor force statistics for Ferguson, out of the total population over 16 years of age (716), 41.6% or 298 individuals are in the labor force, with 7.4% or 22 of them unemployed. The age group with the highest labor force participation rate is 30 to 34 years, with 80.4% or 41 individuals in the labor force. Within the labor force, the 55 to 59 years age range has the highest percentage of unemployed individuals, with 35.0% or 7 of them being unemployed.
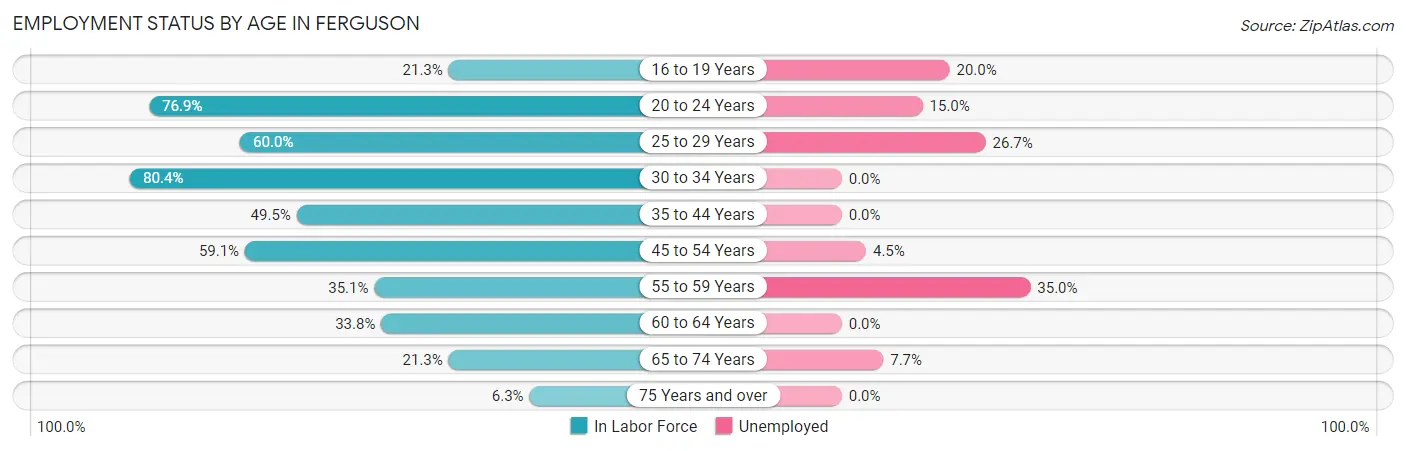
| Age Bracket | In Labor Force | Unemployed |
| 16 to 19 Years | 10 (21.3%) | 2 (20.0%) |
| 20 to 24 Years | 20 (76.9%) | 3 (15.0%) |
| 25 to 29 Years | 15 (60.0%) | 4 (26.7%) |
| 30 to 34 Years | 41 (80.4%) | 0 (0.0%) |
| 35 to 44 Years | 47 (49.5%) | 0 (0.0%) |
| 45 to 54 Years | 88 (59.1%) | 4 (4.5%) |
| 55 to 59 Years | 20 (35.1%) | 7 (35.0%) |
| 60 to 64 Years | 27 (33.8%) | 0 (0.0%) |
| 65 to 74 Years | 26 (21.3%) | 2 (7.7%) |
| 75 Years and over | 4 (6.3%) | 0 (0.0%) |
| Total | 298 (41.6%) | 22 (7.4%) |
Employment Status by Educational Attainment in Ferguson
According to labor force statistics for Ferguson, 52.1% of individuals (238) out of the total population between 25 and 64 years of age (457) are in the labor force, with 6.3% or 15 of them being unemployed. The group with the highest labor force participation rate are those with the educational attainment of college / associate degree, with 78.4% or 91 individuals in the labor force. Within the labor force, individuals with less than high school education have the highest percentage of unemployment, with 38.9% or 7 of them being unemployed.
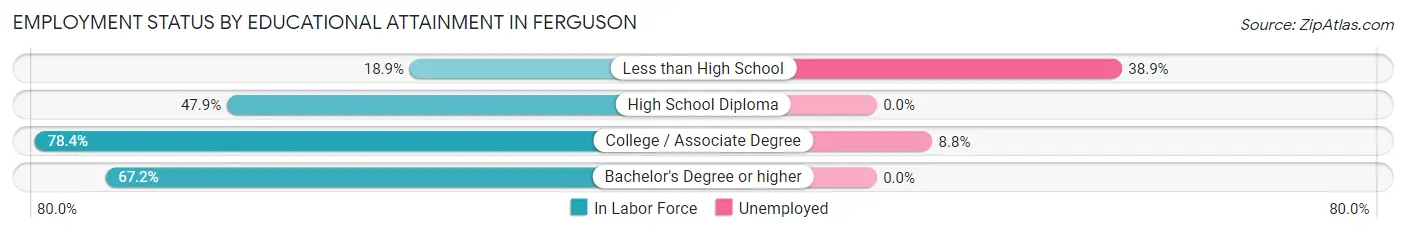
| Educational Attainment | In Labor Force | Unemployed |
| Less than High School | 18 (18.9%) | 37 (38.9%) |
| High School Diploma | 90 (47.9%) | 0 (0.0%) |
| College / Associate Degree | 91 (78.4%) | 10 (8.8%) |
| Bachelor's Degree or higher | 39 (67.2%) | 0 (0.0%) |
| Total | 238 (52.1%) | 29 (6.3%) |
Employment Occupations by Sex in Ferguson
Management, Business, Science and Arts Occupations
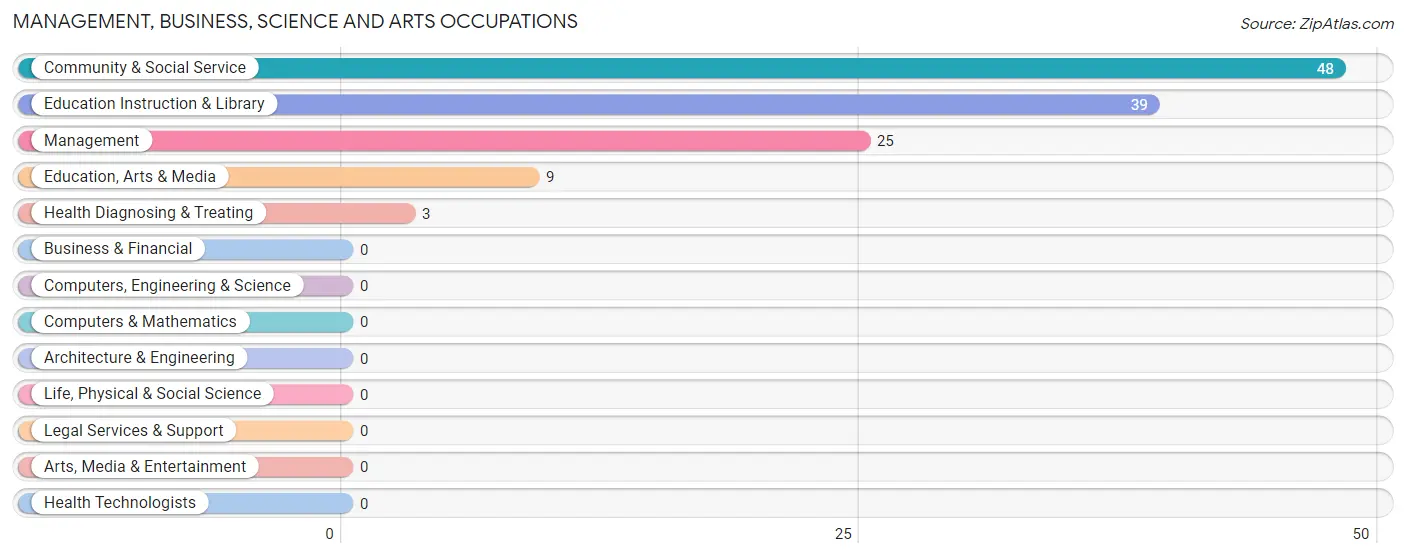
The most common Management, Business, Science and Arts occupations in Ferguson are Community & Social Service (48 | 17.4%), Education Instruction & Library (39 | 14.1%), Management (25 | 9.1%), Education, Arts & Media (9 | 3.3%), and Health Diagnosing & Treating (3 | 1.1%).
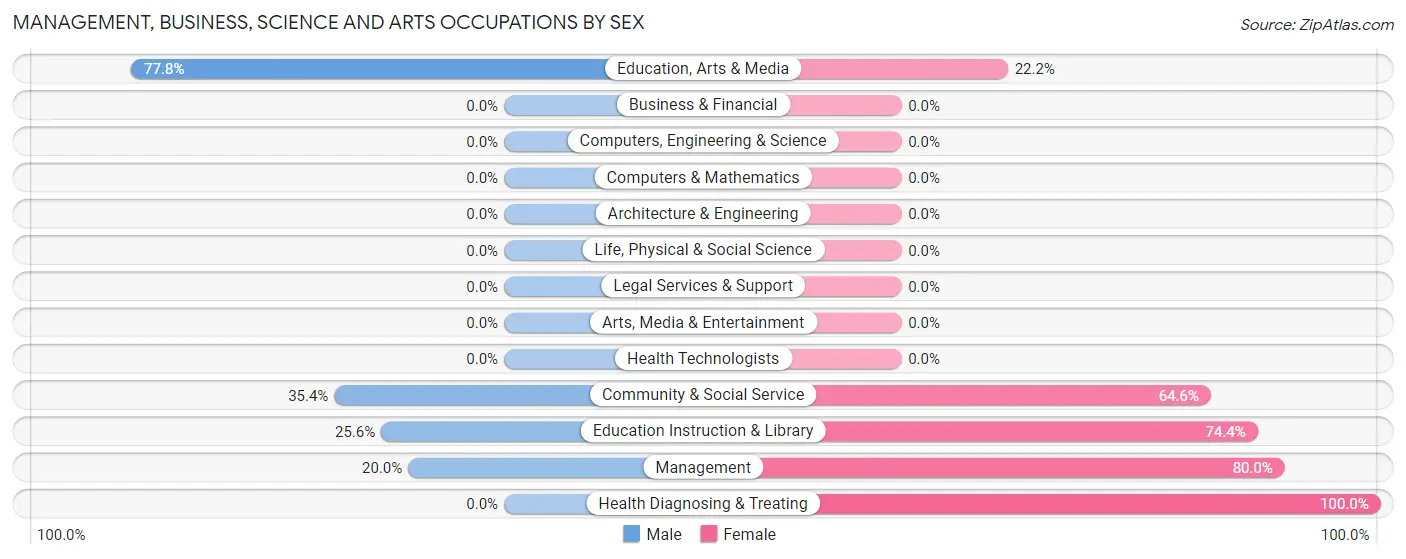
Management, Business, Science and Arts Occupations by Sex
Within the Management, Business, Science and Arts occupations in Ferguson, the most male-oriented occupations are Education, Arts & Media (77.8%), Community & Social Service (35.4%), and Education Instruction & Library (25.6%), while the most female-oriented occupations are Health Diagnosing & Treating (100.0%), Management (80.0%), and Education Instruction & Library (74.4%).
| Occupation | Male | Female |
| Management | 5 (20.0%) | 20 (80.0%) |
| Business & Financial | 0 (0.0%) | 0 (0.0%) |
| Computers, Engineering & Science | 0 (0.0%) | 0 (0.0%) |
| Computers & Mathematics | 0 (0.0%) | 0 (0.0%) |
| Architecture & Engineering | 0 (0.0%) | 0 (0.0%) |
| Life, Physical & Social Science | 0 (0.0%) | 0 (0.0%) |
| Community & Social Service | 17 (35.4%) | 31 (64.6%) |
| Education, Arts & Media | 7 (77.8%) | 2 (22.2%) |
| Legal Services & Support | 0 (0.0%) | 0 (0.0%) |
| Education Instruction & Library | 10 (25.6%) | 29 (74.4%) |
| Arts, Media & Entertainment | 0 (0.0%) | 0 (0.0%) |
| Health Diagnosing & Treating | 0 (0.0%) | 3 (100.0%) |
| Health Technologists | 0 (0.0%) | 0 (0.0%) |
| Total (Category) | 22 (28.9%) | 54 (71.1%) |
| Total (Overall) | 150 (54.3%) | 126 (45.7%) |
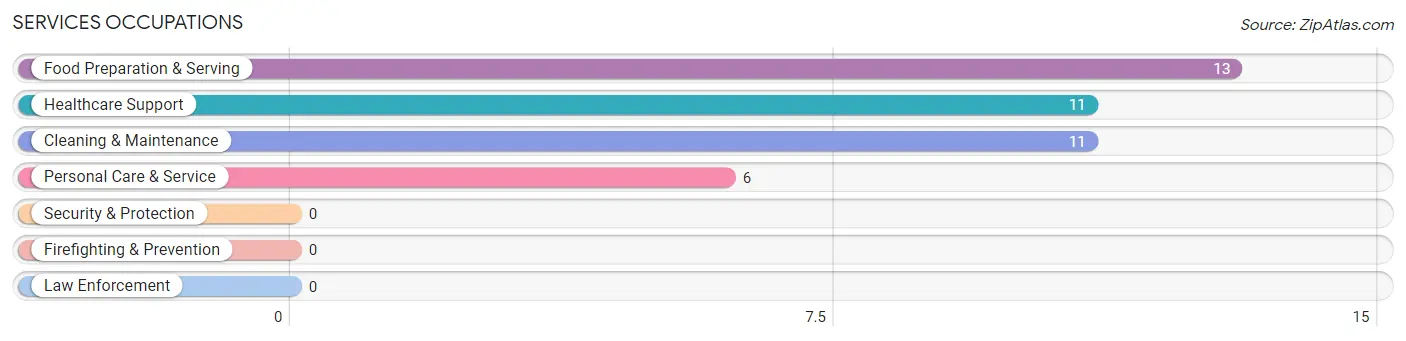
Services Occupations
The most common Services occupations in Ferguson are Food Preparation & Serving (13 | 4.7%), Healthcare Support (11 | 4.0%), Cleaning & Maintenance (11 | 4.0%), and Personal Care & Service (6 | 2.2%).
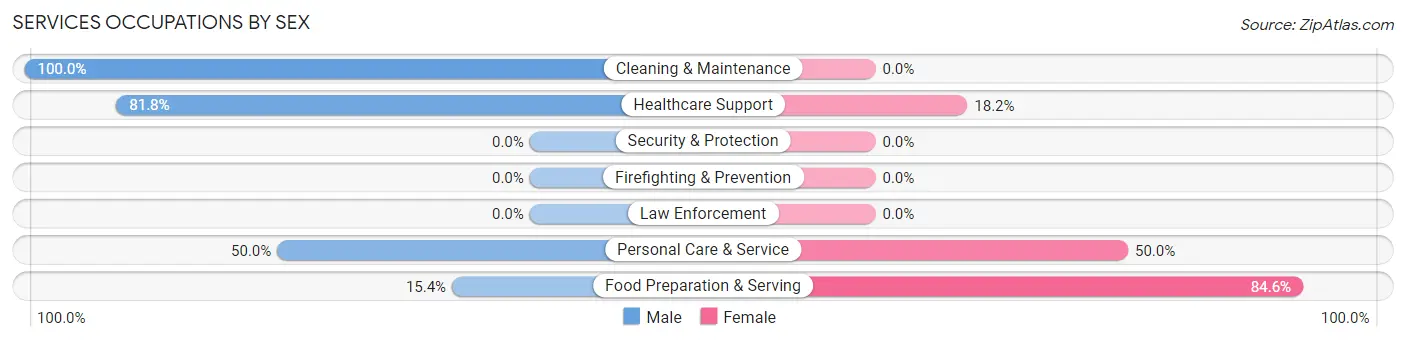
Services Occupations by Sex
Within the Services occupations in Ferguson, the most male-oriented occupations are Cleaning & Maintenance (100.0%), Healthcare Support (81.8%), and Personal Care & Service (50.0%), while the most female-oriented occupations are Food Preparation & Serving (84.6%), Personal Care & Service (50.0%), and Healthcare Support (18.2%).
| Occupation | Male | Female |
| Healthcare Support | 9 (81.8%) | 2 (18.2%) |
| Security & Protection | 0 (0.0%) | 0 (0.0%) |
| Firefighting & Prevention | 0 (0.0%) | 0 (0.0%) |
| Law Enforcement | 0 (0.0%) | 0 (0.0%) |
| Food Preparation & Serving | 2 (15.4%) | 11 (84.6%) |
| Cleaning & Maintenance | 11 (100.0%) | 0 (0.0%) |
| Personal Care & Service | 3 (50.0%) | 3 (50.0%) |
| Total (Category) | 25 (61.0%) | 16 (39.0%) |
| Total (Overall) | 150 (54.3%) | 126 (45.7%) |
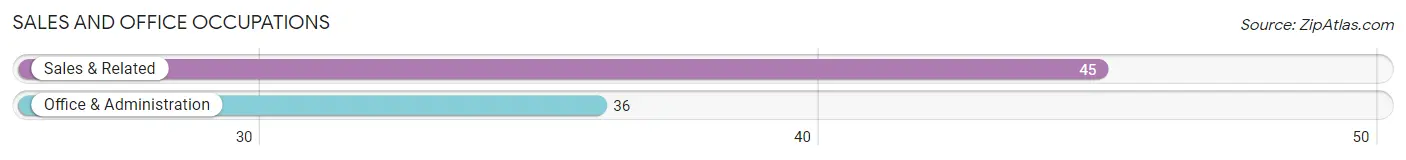
Sales and Office Occupations
The most common Sales and Office occupations in Ferguson are Sales & Related (45 | 16.3%), and Office & Administration (36 | 13.0%).
Sales and Office Occupations by Sex
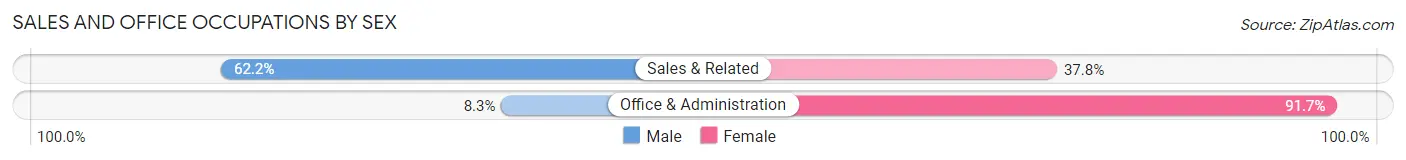
| Occupation | Male | Female |
| Sales & Related | 28 (62.2%) | 17 (37.8%) |
| Office & Administration | 3 (8.3%) | 33 (91.7%) |
| Total (Category) | 31 (38.3%) | 50 (61.7%) |
| Total (Overall) | 150 (54.3%) | 126 (45.7%) |
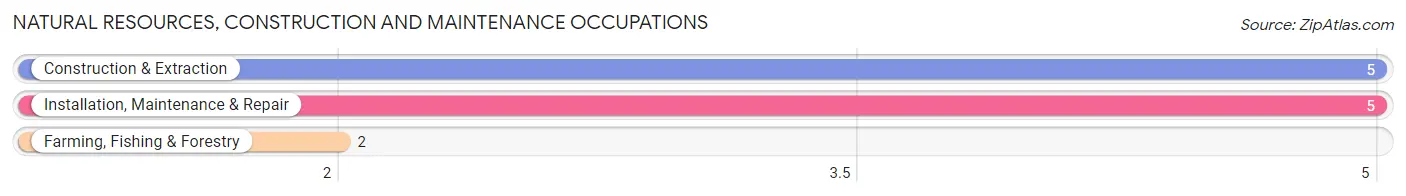
Natural Resources, Construction and Maintenance Occupations
The most common Natural Resources, Construction and Maintenance occupations in Ferguson are Construction & Extraction (5 | 1.8%), Installation, Maintenance & Repair (5 | 1.8%), and Farming, Fishing & Forestry (2 | 0.7%).
Natural Resources, Construction and Maintenance Occupations by Sex
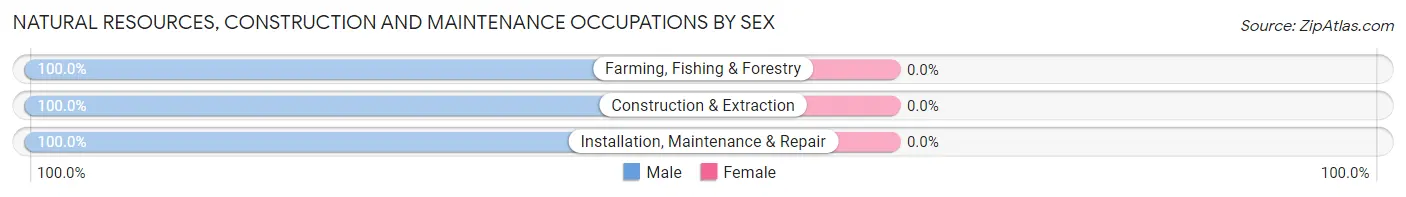
| Occupation | Male | Female |
| Farming, Fishing & Forestry | 2 (100.0%) | 0 (0.0%) |
| Construction & Extraction | 5 (100.0%) | 0 (0.0%) |
| Installation, Maintenance & Repair | 5 (100.0%) | 0 (0.0%) |
| Total (Category) | 12 (100.0%) | 0 (0.0%) |
| Total (Overall) | 150 (54.3%) | 126 (45.7%) |
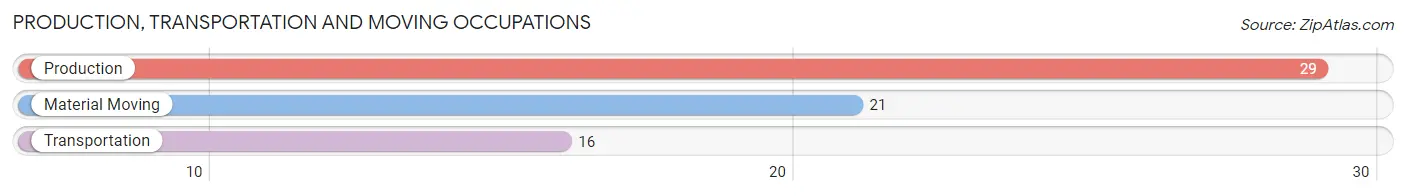
Production, Transportation and Moving Occupations
The most common Production, Transportation and Moving occupations in Ferguson are Production (29 | 10.5%), Material Moving (21 | 7.6%), and Transportation (16 | 5.8%).
Production, Transportation and Moving Occupations by Sex
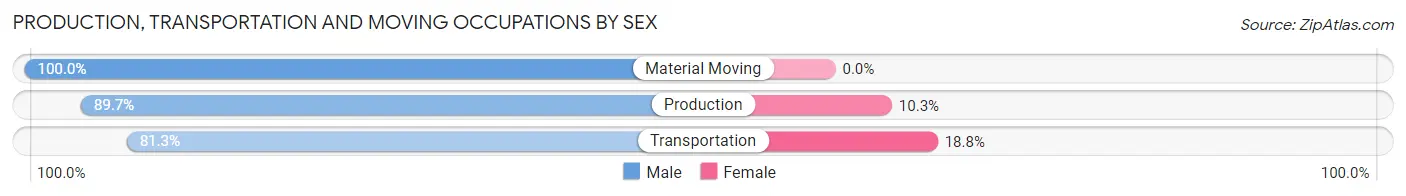
| Occupation | Male | Female |
| Production | 26 (89.7%) | 3 (10.3%) |
| Transportation | 13 (81.2%) | 3 (18.8%) |
| Material Moving | 21 (100.0%) | 0 (0.0%) |
| Total (Category) | 60 (90.9%) | 6 (9.1%) |
| Total (Overall) | 150 (54.3%) | 126 (45.7%) |
Employment Industries by Sex in Ferguson
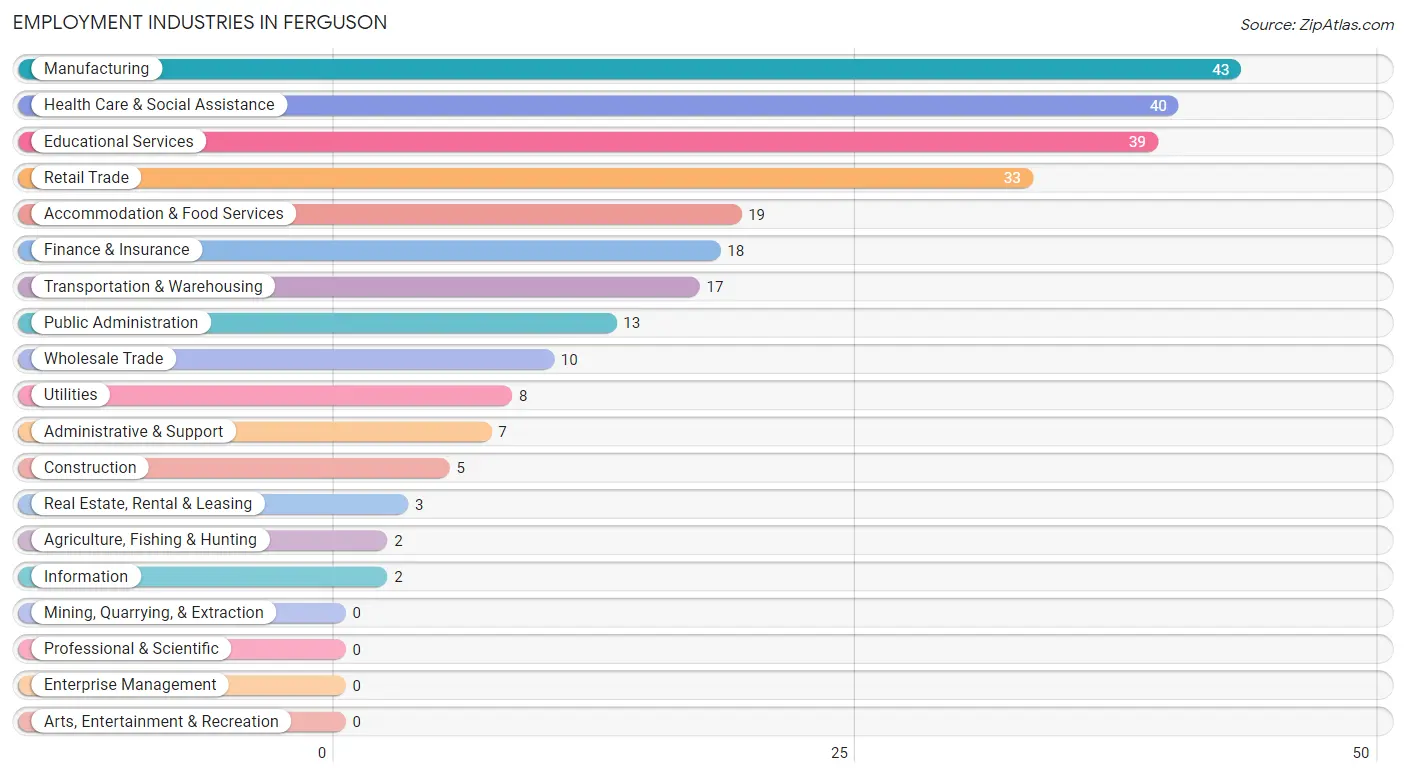
Employment Industries in Ferguson
The major employment industries in Ferguson include Manufacturing (43 | 15.6%), Health Care & Social Assistance (40 | 14.5%), Educational Services (39 | 14.1%), Retail Trade (33 | 12.0%), and Accommodation & Food Services (19 | 6.9%).
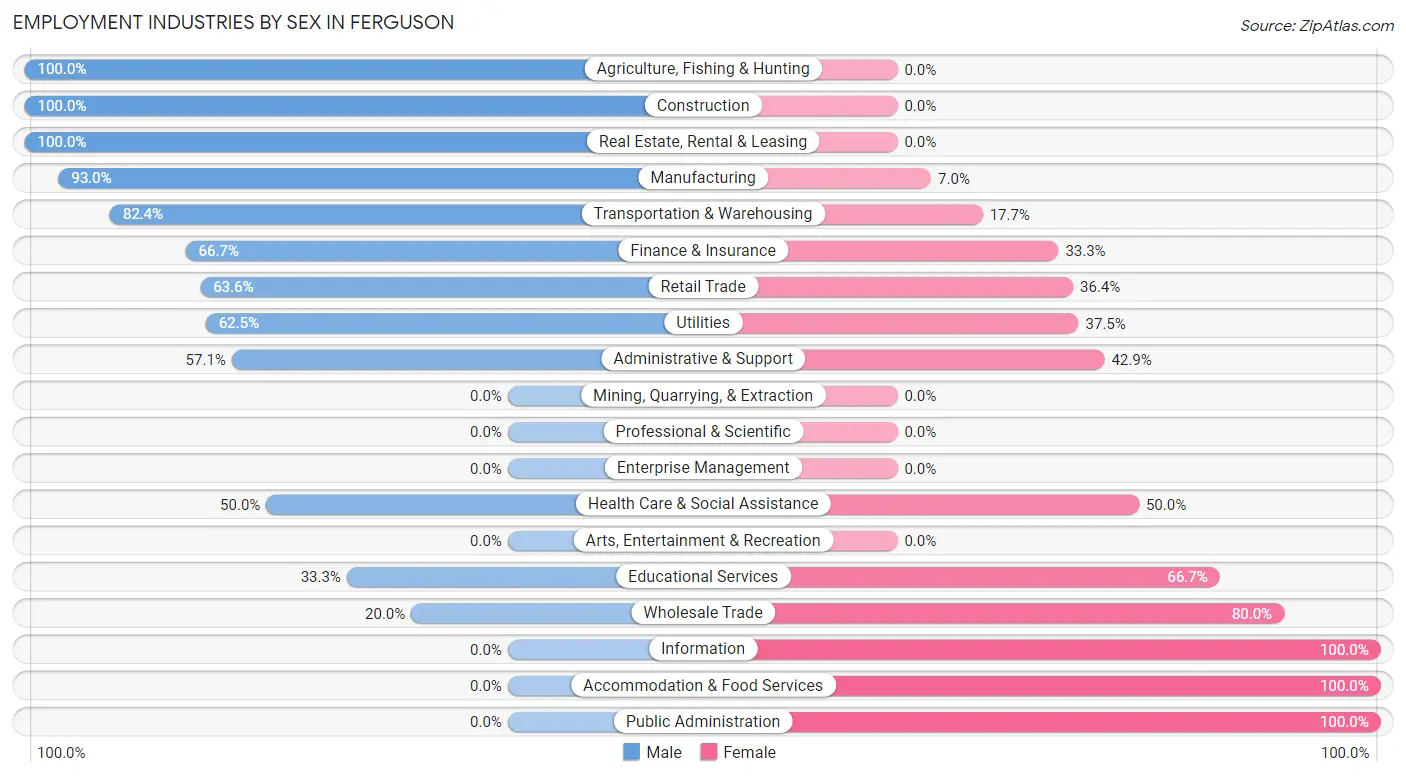
Employment Industries by Sex in Ferguson
The Ferguson industries that see more men than women are Agriculture, Fishing & Hunting (100.0%), Construction (100.0%), and Real Estate, Rental & Leasing (100.0%), whereas the industries that tend to have a higher number of women are Information (100.0%), Accommodation & Food Services (100.0%), and Public Administration (100.0%).
| Industry | Male | Female |
| Agriculture, Fishing & Hunting | 2 (100.0%) | 0 (0.0%) |
| Mining, Quarrying, & Extraction | 0 (0.0%) | 0 (0.0%) |
| Construction | 5 (100.0%) | 0 (0.0%) |
| Manufacturing | 40 (93.0%) | 3 (7.0%) |
| Wholesale Trade | 2 (20.0%) | 8 (80.0%) |
| Retail Trade | 21 (63.6%) | 12 (36.4%) |
| Transportation & Warehousing | 14 (82.4%) | 3 (17.6%) |
| Utilities | 5 (62.5%) | 3 (37.5%) |
| Information | 0 (0.0%) | 2 (100.0%) |
| Finance & Insurance | 12 (66.7%) | 6 (33.3%) |
| Real Estate, Rental & Leasing | 3 (100.0%) | 0 (0.0%) |
| Professional & Scientific | 0 (0.0%) | 0 (0.0%) |
| Enterprise Management | 0 (0.0%) | 0 (0.0%) |
| Administrative & Support | 4 (57.1%) | 3 (42.9%) |
| Educational Services | 13 (33.3%) | 26 (66.7%) |
| Health Care & Social Assistance | 20 (50.0%) | 20 (50.0%) |
| Arts, Entertainment & Recreation | 0 (0.0%) | 0 (0.0%) |
| Accommodation & Food Services | 0 (0.0%) | 19 (100.0%) |
| Public Administration | 0 (0.0%) | 13 (100.0%) |
| Total | 150 (54.3%) | 126 (45.7%) |
Education in Ferguson
School Enrollment in Ferguson
The most common levels of schooling among the 138 students in Ferguson are high school (65 | 47.1%), college / undergraduate (39 | 28.3%), and middle school (24 | 17.4%).
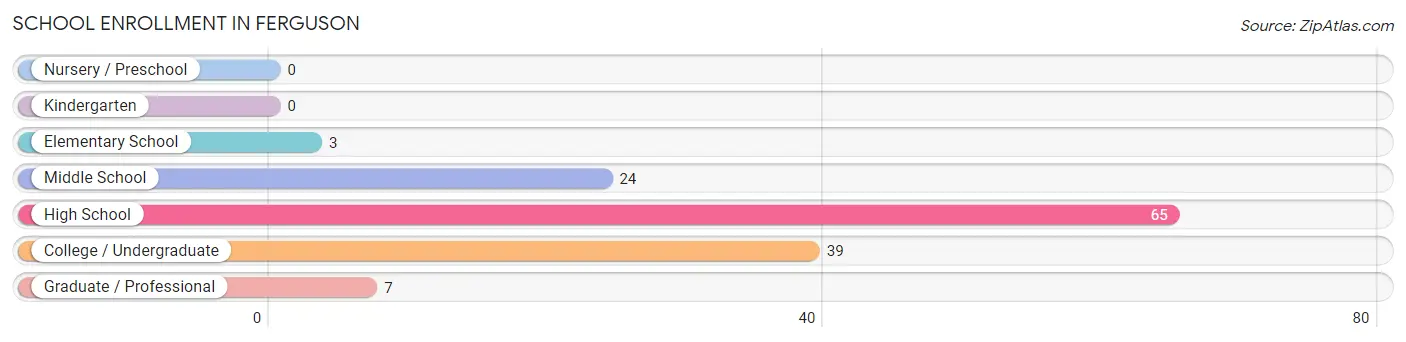
| School Level | # Students | % Students |
| Nursery / Preschool | 0 | 0.0% |
| Kindergarten | 0 | 0.0% |
| Elementary School | 3 | 2.2% |
| Middle School | 24 | 17.4% |
| High School | 65 | 47.1% |
| College / Undergraduate | 39 | 28.3% |
| Graduate / Professional | 7 | 5.1% |
| Total | 138 | 100.0% |
School Enrollment by Age by Funding Source in Ferguson
Out of a total of 138 students who are enrolled in schools in Ferguson, 32 (23.2%) attend a private institution, while the remaining 106 (76.8%) are enrolled in public schools. The age group of 10 to 14 year olds has the highest likelihood of being enrolled in private schools, with 12 (41.4% in the age bracket) enrolled. Conversely, the age group of 5 to 9 year old has the lowest likelihood of being enrolled in a private school, with 3 (100.0% in the age bracket) attending a public institution.
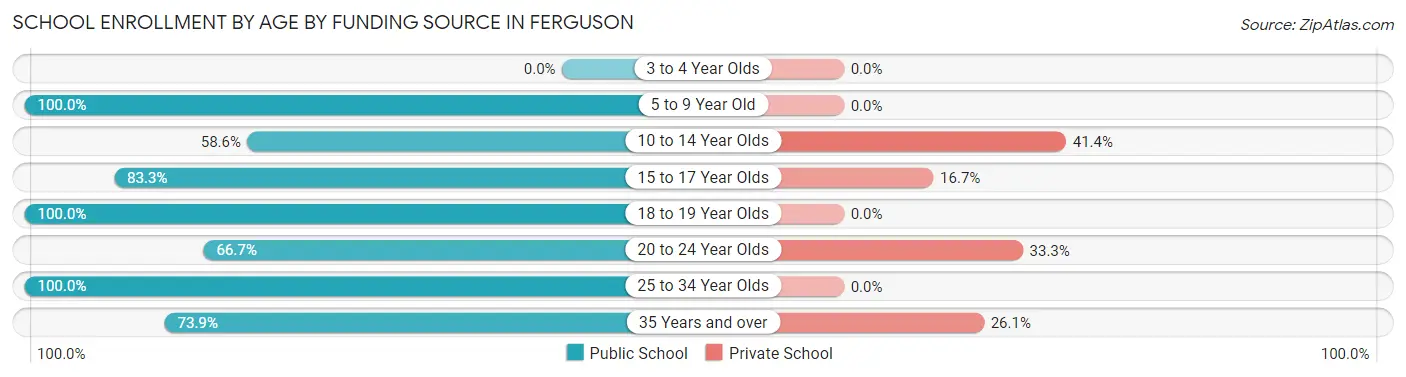
| Age Bracket | Public School | Private School |
| 3 to 4 Year Olds | 0 (0.0%) | 0 (0.0%) |
| 5 to 9 Year Old | 3 (100.0%) | 0 (0.0%) |
| 10 to 14 Year Olds | 17 (58.6%) | 12 (41.4%) |
| 15 to 17 Year Olds | 50 (83.3%) | 10 (16.7%) |
| 18 to 19 Year Olds | 2 (100.0%) | 0 (0.0%) |
| 20 to 24 Year Olds | 8 (66.7%) | 4 (33.3%) |
| 25 to 34 Year Olds | 9 (100.0%) | 0 (0.0%) |
| 35 Years and over | 17 (73.9%) | 6 (26.1%) |
| Total | 106 (76.8%) | 32 (23.2%) |
Educational Attainment by Field of Study in Ferguson
Science & technology (37 | 45.1%), education (24 | 29.3%), arts & humanities (11 | 13.4%), engineering (6 | 7.3%), and computers & mathematics (2 | 2.4%) are the most common fields of study among 82 individuals in Ferguson who have obtained a bachelor's degree or higher.
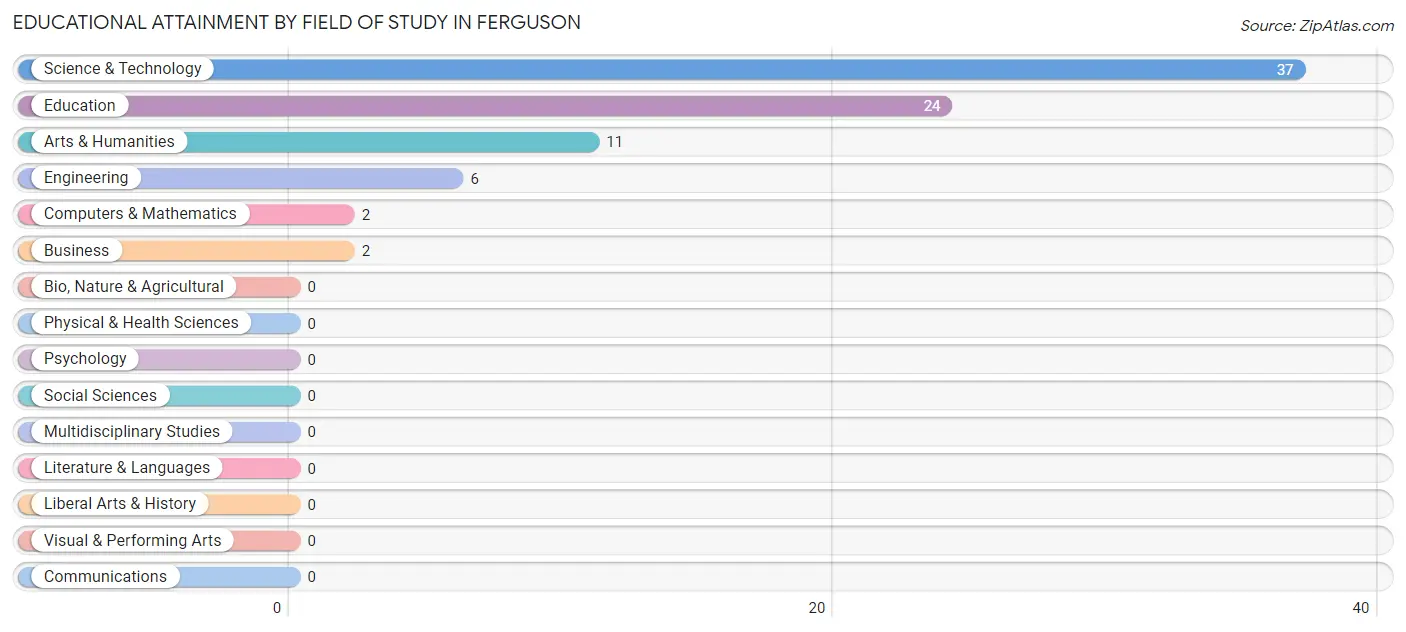
| Field of Study | # Graduates | % Graduates |
| Computers & Mathematics | 2 | 2.4% |
| Bio, Nature & Agricultural | 0 | 0.0% |
| Physical & Health Sciences | 0 | 0.0% |
| Psychology | 0 | 0.0% |
| Social Sciences | 0 | 0.0% |
| Engineering | 6 | 7.3% |
| Multidisciplinary Studies | 0 | 0.0% |
| Science & Technology | 37 | 45.1% |
| Business | 2 | 2.4% |
| Education | 24 | 29.3% |
| Literature & Languages | 0 | 0.0% |
| Liberal Arts & History | 0 | 0.0% |
| Visual & Performing Arts | 0 | 0.0% |
| Communications | 0 | 0.0% |
| Arts & Humanities | 11 | 13.4% |
| Total | 82 | 100.0% |
Transportation & Commute in Ferguson
Vehicle Availability by Sex in Ferguson
The most prevalent vehicle ownership categories in Ferguson are males with 2 vehicles (58, accounting for 39.2%) and females with 2 vehicles (41, making up 46.8%).
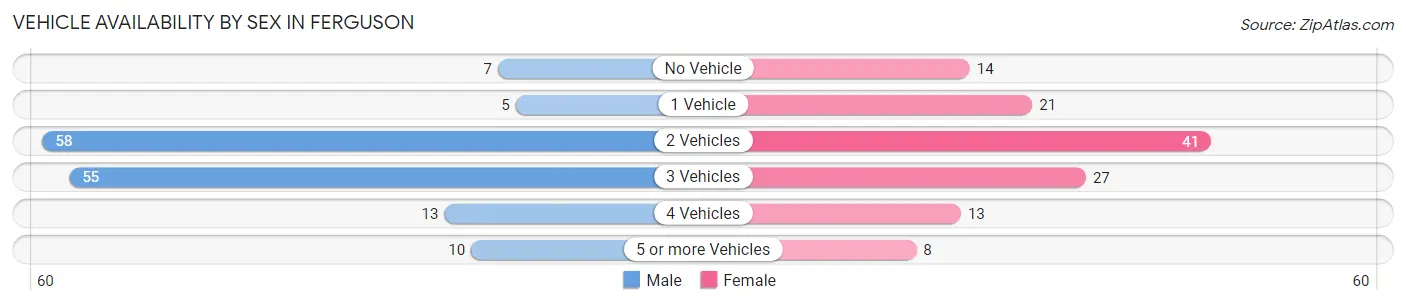
| Vehicles Available | Male | Female |
| No Vehicle | 7 (4.7%) | 14 (11.3%) |
| 1 Vehicle | 5 (3.4%) | 21 (16.9%) |
| 2 Vehicles | 58 (39.2%) | 41 (33.1%) |
| 3 Vehicles | 55 (37.2%) | 27 (21.8%) |
| 4 Vehicles | 13 (8.8%) | 13 (10.5%) |
| 5 or more Vehicles | 10 (6.8%) | 8 (6.5%) |
| Total | 148 (100.0%) | 124 (100.0%) |
Commute Time in Ferguson
The most frequently occuring commute durations in Ferguson are 10 to 14 minutes (114 commuters, 42.4%), 5 to 9 minutes (62 commuters, 23.1%), and 15 to 19 minutes (33 commuters, 12.3%).
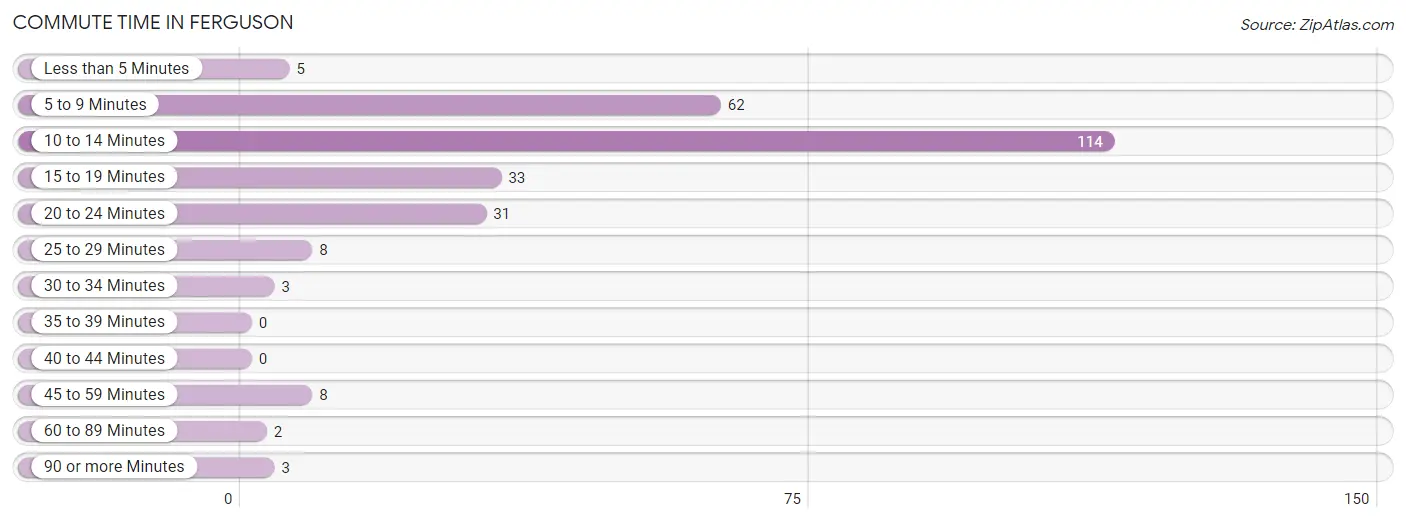
| Commute Time | # Commuters | % Commuters |
| Less than 5 Minutes | 5 | 1.9% |
| 5 to 9 Minutes | 62 | 23.1% |
| 10 to 14 Minutes | 114 | 42.4% |
| 15 to 19 Minutes | 33 | 12.3% |
| 20 to 24 Minutes | 31 | 11.5% |
| 25 to 29 Minutes | 8 | 3.0% |
| 30 to 34 Minutes | 3 | 1.1% |
| 35 to 39 Minutes | 0 | 0.0% |
| 40 to 44 Minutes | 0 | 0.0% |
| 45 to 59 Minutes | 8 | 3.0% |
| 60 to 89 Minutes | 2 | 0.7% |
| 90 or more Minutes | 3 | 1.1% |
Commute Time by Sex in Ferguson
The most common commute times in Ferguson are 10 to 14 minutes (64 commuters, 43.2%) for males and 10 to 14 minutes (50 commuters, 41.3%) for females.
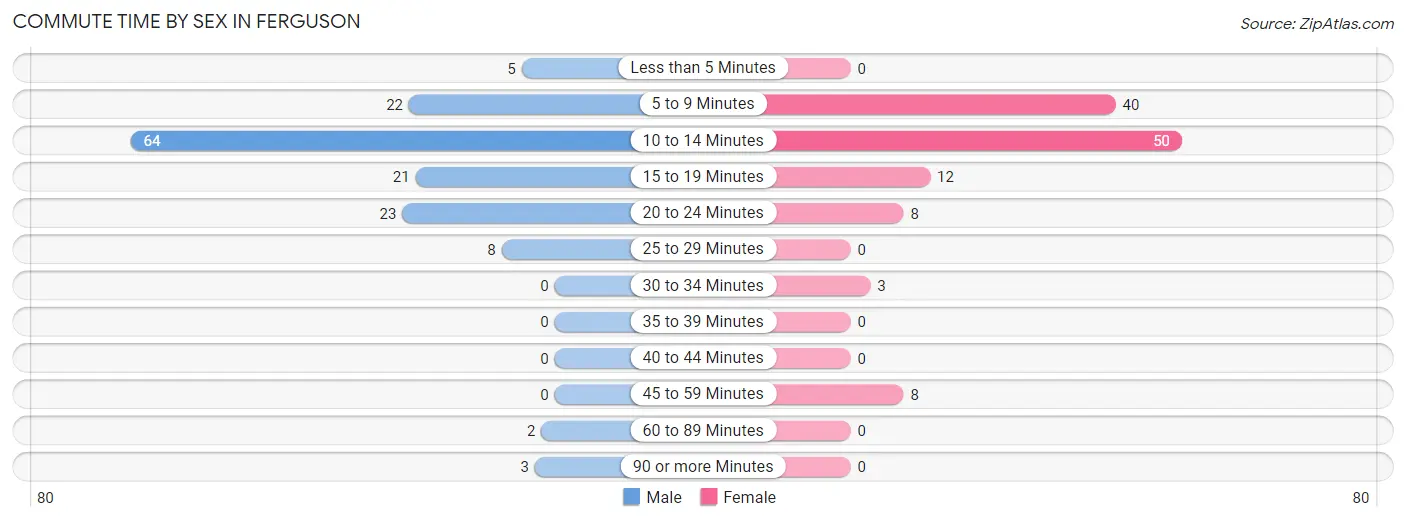
| Commute Time | Male | Female |
| Less than 5 Minutes | 5 (3.4%) | 0 (0.0%) |
| 5 to 9 Minutes | 22 (14.9%) | 40 (33.1%) |
| 10 to 14 Minutes | 64 (43.2%) | 50 (41.3%) |
| 15 to 19 Minutes | 21 (14.2%) | 12 (9.9%) |
| 20 to 24 Minutes | 23 (15.5%) | 8 (6.6%) |
| 25 to 29 Minutes | 8 (5.4%) | 0 (0.0%) |
| 30 to 34 Minutes | 0 (0.0%) | 3 (2.5%) |
| 35 to 39 Minutes | 0 (0.0%) | 0 (0.0%) |
| 40 to 44 Minutes | 0 (0.0%) | 0 (0.0%) |
| 45 to 59 Minutes | 0 (0.0%) | 8 (6.6%) |
| 60 to 89 Minutes | 2 (1.3%) | 0 (0.0%) |
| 90 or more Minutes | 3 (2.0%) | 0 (0.0%) |
Time of Departure to Work by Sex in Ferguson
The most frequent times of departure to work in Ferguson are 5:00 AM to 5:29 AM (30, 20.3%) for males and 7:30 AM to 7:59 AM (45, 37.2%) for females.
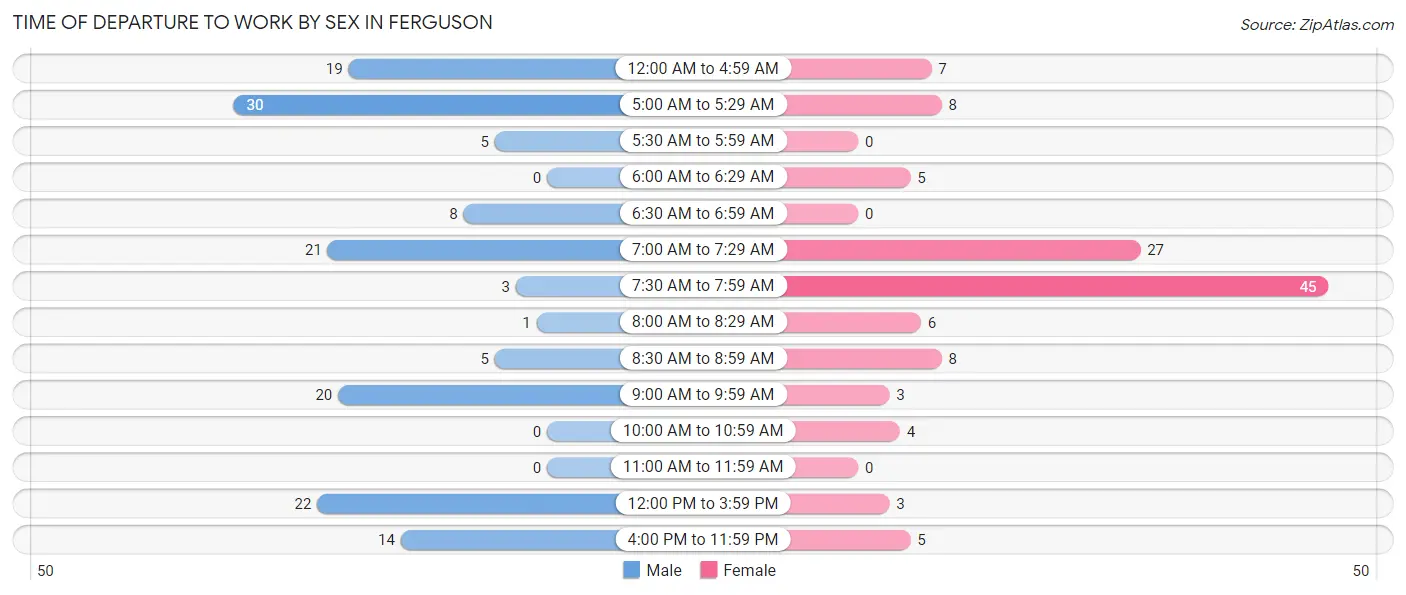
| Time of Departure | Male | Female |
| 12:00 AM to 4:59 AM | 19 (12.8%) | 7 (5.8%) |
| 5:00 AM to 5:29 AM | 30 (20.3%) | 8 (6.6%) |
| 5:30 AM to 5:59 AM | 5 (3.4%) | 0 (0.0%) |
| 6:00 AM to 6:29 AM | 0 (0.0%) | 5 (4.1%) |
| 6:30 AM to 6:59 AM | 8 (5.4%) | 0 (0.0%) |
| 7:00 AM to 7:29 AM | 21 (14.2%) | 27 (22.3%) |
| 7:30 AM to 7:59 AM | 3 (2.0%) | 45 (37.2%) |
| 8:00 AM to 8:29 AM | 1 (0.7%) | 6 (5.0%) |
| 8:30 AM to 8:59 AM | 5 (3.4%) | 8 (6.6%) |
| 9:00 AM to 9:59 AM | 20 (13.5%) | 3 (2.5%) |
| 10:00 AM to 10:59 AM | 0 (0.0%) | 4 (3.3%) |
| 11:00 AM to 11:59 AM | 0 (0.0%) | 0 (0.0%) |
| 12:00 PM to 3:59 PM | 22 (14.9%) | 3 (2.5%) |
| 4:00 PM to 11:59 PM | 14 (9.5%) | 5 (4.1%) |
| Total | 148 (100.0%) | 121 (100.0%) |
Housing Occupancy in Ferguson
Occupancy by Ownership in Ferguson
Of the total 336 dwellings in Ferguson, owner-occupied units account for 215 (64.0%), while renter-occupied units make up 121 (36.0%).
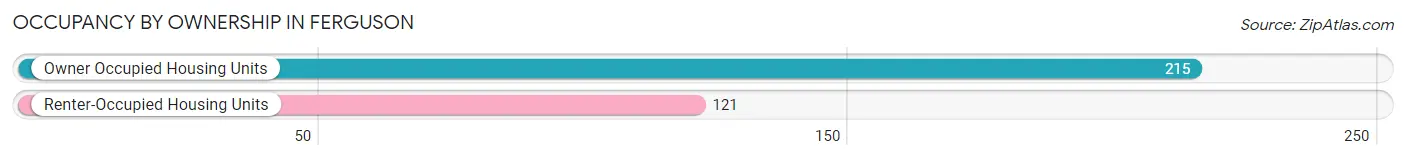
| Occupancy | # Housing Units | % Housing Units |
| Owner Occupied Housing Units | 215 | 64.0% |
| Renter-Occupied Housing Units | 121 | 36.0% |
| Total Occupied Housing Units | 336 | 100.0% |
Occupancy by Household Size in Ferguson
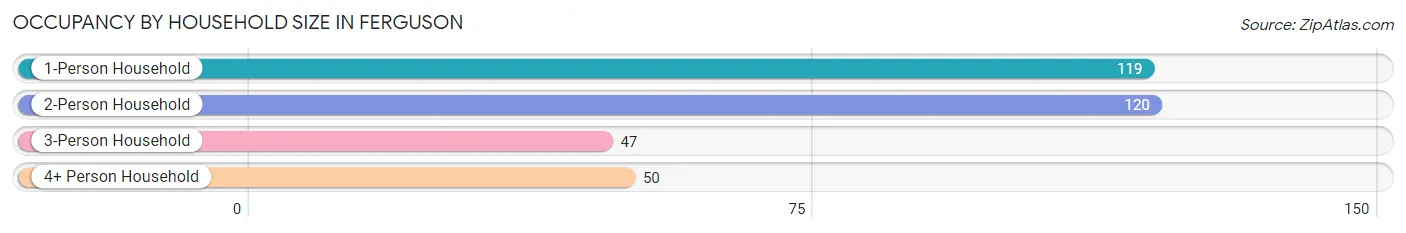
| Household Size | # Housing Units | % Housing Units |
| 1-Person Household | 119 | 35.4% |
| 2-Person Household | 120 | 35.7% |
| 3-Person Household | 47 | 14.0% |
| 4+ Person Household | 50 | 14.9% |
| Total Housing Units | 336 | 100.0% |
Occupancy by Ownership by Household Size in Ferguson
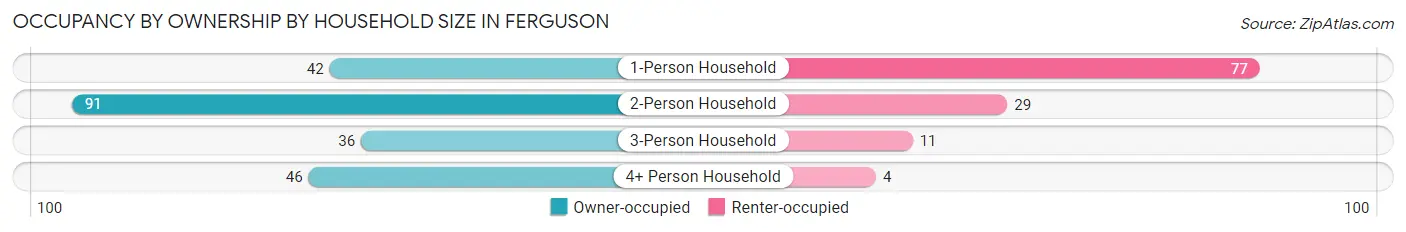
| Household Size | Owner-occupied | Renter-occupied |
| 1-Person Household | 42 (35.3%) | 77 (64.7%) |
| 2-Person Household | 91 (75.8%) | 29 (24.2%) |
| 3-Person Household | 36 (76.6%) | 11 (23.4%) |
| 4+ Person Household | 46 (92.0%) | 4 (8.0%) |
| Total Housing Units | 215 (64.0%) | 121 (36.0%) |
Occupancy by Educational Attainment in Ferguson
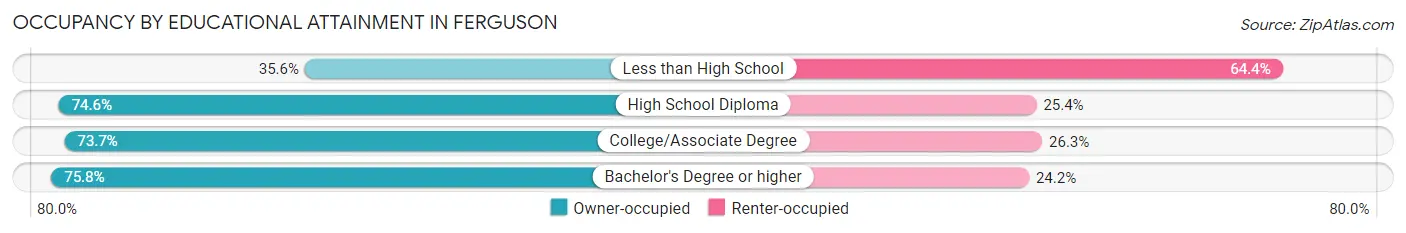
| Household Size | Owner-occupied | Renter-occupied |
| Less than High School | 32 (35.6%) | 58 (64.4%) |
| High School Diploma | 88 (74.6%) | 30 (25.4%) |
| College/Associate Degree | 70 (73.7%) | 25 (26.3%) |
| Bachelor's Degree or higher | 25 (75.8%) | 8 (24.2%) |
Occupancy by Age of Householder in Ferguson
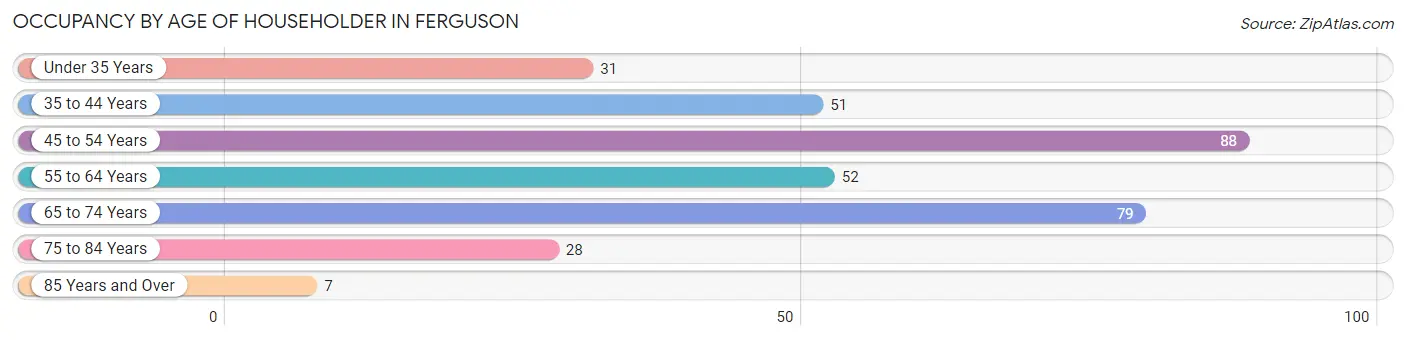
| Age Bracket | # Households | % Households |
| Under 35 Years | 31 | 9.2% |
| 35 to 44 Years | 51 | 15.2% |
| 45 to 54 Years | 88 | 26.2% |
| 55 to 64 Years | 52 | 15.5% |
| 65 to 74 Years | 79 | 23.5% |
| 75 to 84 Years | 28 | 8.3% |
| 85 Years and Over | 7 | 2.1% |
| Total | 336 | 100.0% |
Housing Finances in Ferguson
Median Income by Occupancy in Ferguson
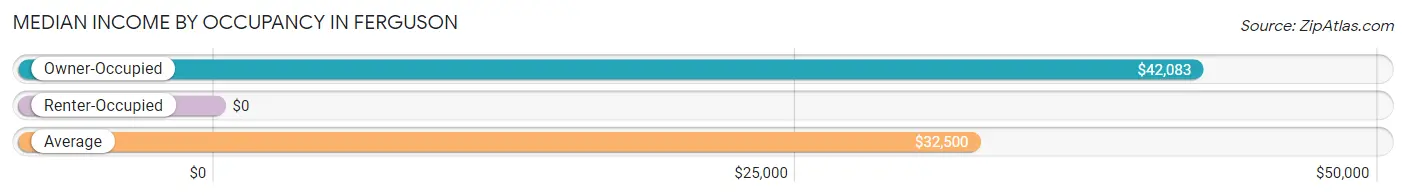
| Occupancy Type | # Households | Median Income |
| Owner-Occupied | 215 (64.0%) | $42,083 |
| Renter-Occupied | 121 (36.0%) | $0 |
| Average | 336 (100.0%) | $32,500 |
Occupancy by Householder Income Bracket in Ferguson
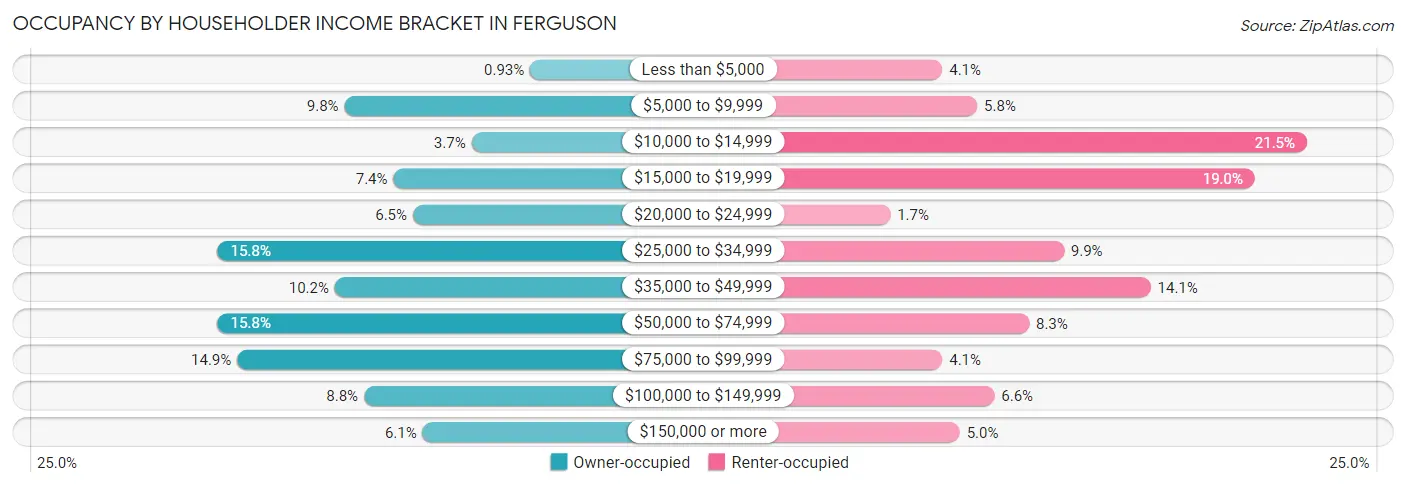
| Income Bracket | Owner-occupied | Renter-occupied |
| Less than $5,000 | 2 (0.9%) | 5 (4.1%) |
| $5,000 to $9,999 | 21 (9.8%) | 7 (5.8%) |
| $10,000 to $14,999 | 8 (3.7%) | 26 (21.5%) |
| $15,000 to $19,999 | 16 (7.4%) | 23 (19.0%) |
| $20,000 to $24,999 | 14 (6.5%) | 2 (1.7%) |
| $25,000 to $34,999 | 34 (15.8%) | 12 (9.9%) |
| $35,000 to $49,999 | 22 (10.2%) | 17 (14.1%) |
| $50,000 to $74,999 | 34 (15.8%) | 10 (8.3%) |
| $75,000 to $99,999 | 32 (14.9%) | 5 (4.1%) |
| $100,000 to $149,999 | 19 (8.8%) | 8 (6.6%) |
| $150,000 or more | 13 (6.0%) | 6 (5.0%) |
| Total | 215 (100.0%) | 121 (100.0%) |
Monthly Housing Cost Tiers in Ferguson
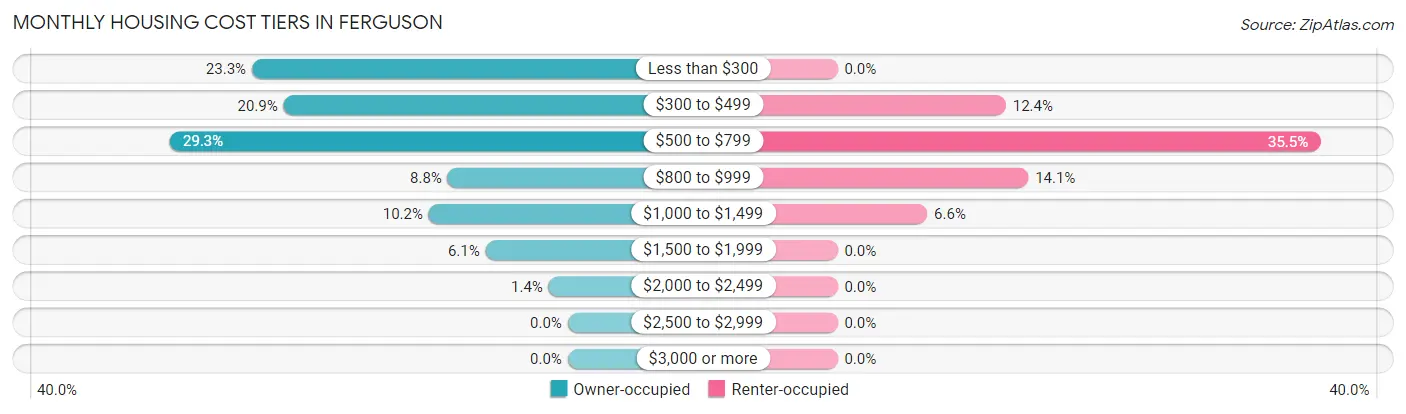
| Monthly Cost | Owner-occupied | Renter-occupied |
| Less than $300 | 50 (23.3%) | 0 (0.0%) |
| $300 to $499 | 45 (20.9%) | 15 (12.4%) |
| $500 to $799 | 63 (29.3%) | 43 (35.5%) |
| $800 to $999 | 19 (8.8%) | 17 (14.1%) |
| $1,000 to $1,499 | 22 (10.2%) | 8 (6.6%) |
| $1,500 to $1,999 | 13 (6.0%) | 0 (0.0%) |
| $2,000 to $2,499 | 3 (1.4%) | 0 (0.0%) |
| $2,500 to $2,999 | 0 (0.0%) | 0 (0.0%) |
| $3,000 or more | 0 (0.0%) | 0 (0.0%) |
| Total | 215 (100.0%) | 121 (100.0%) |
Physical Housing Characteristics in Ferguson
Housing Structures in Ferguson
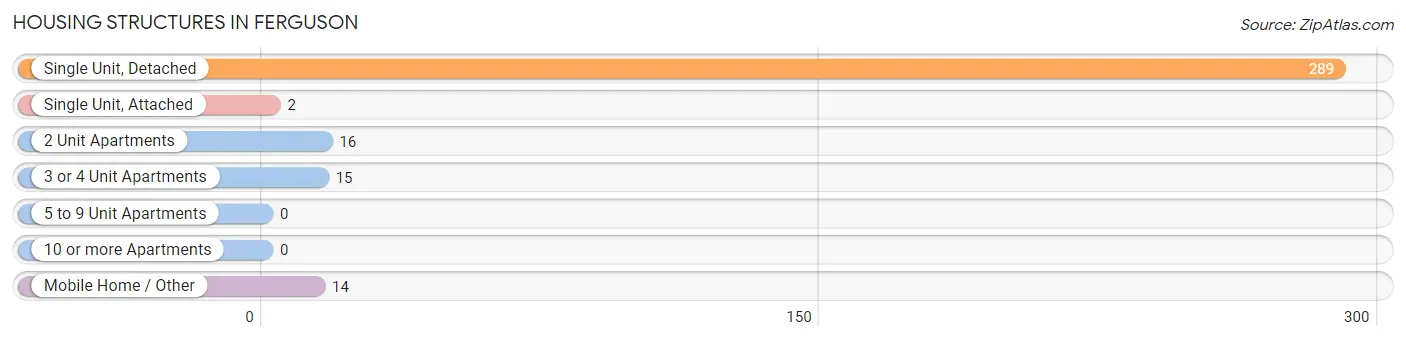
| Structure Type | # Housing Units | % Housing Units |
| Single Unit, Detached | 289 | 86.0% |
| Single Unit, Attached | 2 | 0.6% |
| 2 Unit Apartments | 16 | 4.8% |
| 3 or 4 Unit Apartments | 15 | 4.5% |
| 5 to 9 Unit Apartments | 0 | 0.0% |
| 10 or more Apartments | 0 | 0.0% |
| Mobile Home / Other | 14 | 4.2% |
| Total | 336 | 100.0% |
Housing Structures by Occupancy in Ferguson
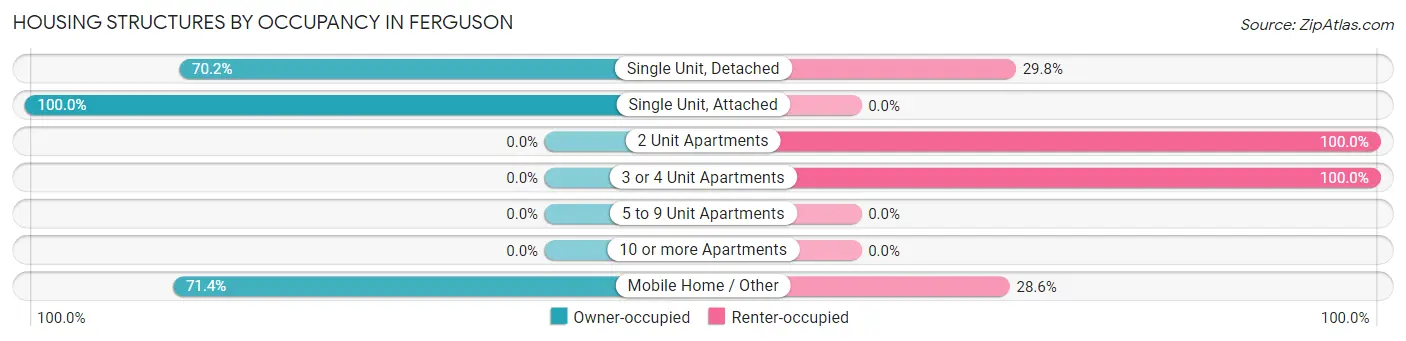
| Structure Type | Owner-occupied | Renter-occupied |
| Single Unit, Detached | 203 (70.2%) | 86 (29.8%) |
| Single Unit, Attached | 2 (100.0%) | 0 (0.0%) |
| 2 Unit Apartments | 0 (0.0%) | 16 (100.0%) |
| 3 or 4 Unit Apartments | 0 (0.0%) | 15 (100.0%) |
| 5 to 9 Unit Apartments | 0 (0.0%) | 0 (0.0%) |
| 10 or more Apartments | 0 (0.0%) | 0 (0.0%) |
| Mobile Home / Other | 10 (71.4%) | 4 (28.6%) |
| Total | 215 (64.0%) | 121 (36.0%) |
Housing Structures by Number of Rooms in Ferguson
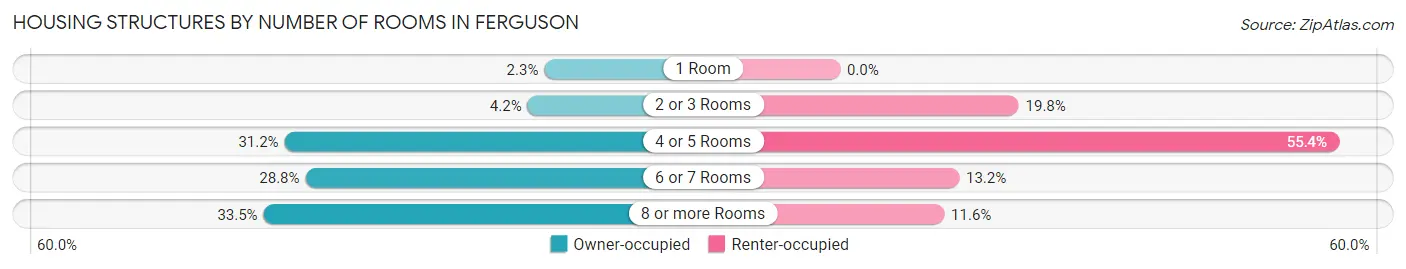
| Number of Rooms | Owner-occupied | Renter-occupied |
| 1 Room | 5 (2.3%) | 0 (0.0%) |
| 2 or 3 Rooms | 9 (4.2%) | 24 (19.8%) |
| 4 or 5 Rooms | 67 (31.2%) | 67 (55.4%) |
| 6 or 7 Rooms | 62 (28.8%) | 16 (13.2%) |
| 8 or more Rooms | 72 (33.5%) | 14 (11.6%) |
| Total | 215 (100.0%) | 121 (100.0%) |
Housing Structure by Heating Type in Ferguson
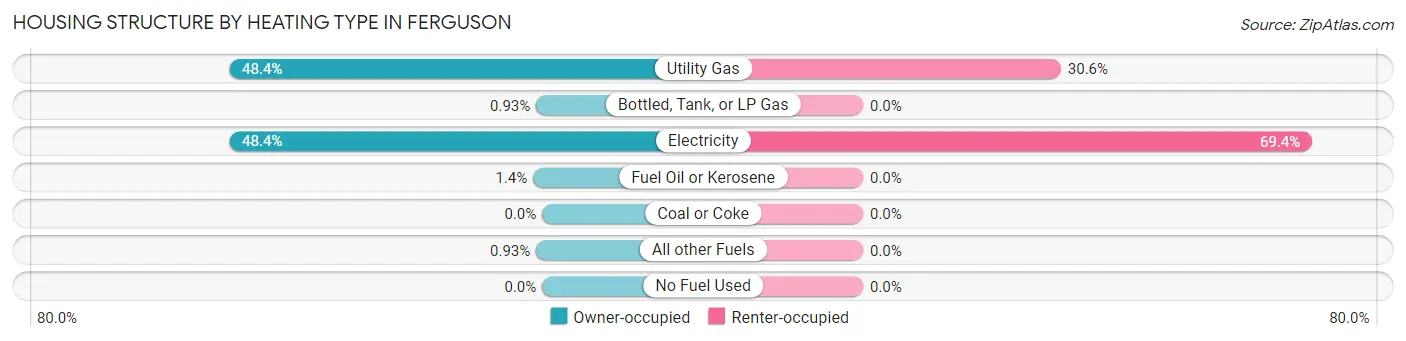
| Heating Type | Owner-occupied | Renter-occupied |
| Utility Gas | 104 (48.4%) | 37 (30.6%) |
| Bottled, Tank, or LP Gas | 2 (0.9%) | 0 (0.0%) |
| Electricity | 104 (48.4%) | 84 (69.4%) |
| Fuel Oil or Kerosene | 3 (1.4%) | 0 (0.0%) |
| Coal or Coke | 0 (0.0%) | 0 (0.0%) |
| All other Fuels | 2 (0.9%) | 0 (0.0%) |
| No Fuel Used | 0 (0.0%) | 0 (0.0%) |
| Total | 215 (100.0%) | 121 (100.0%) |
Household Vehicle Usage in Ferguson
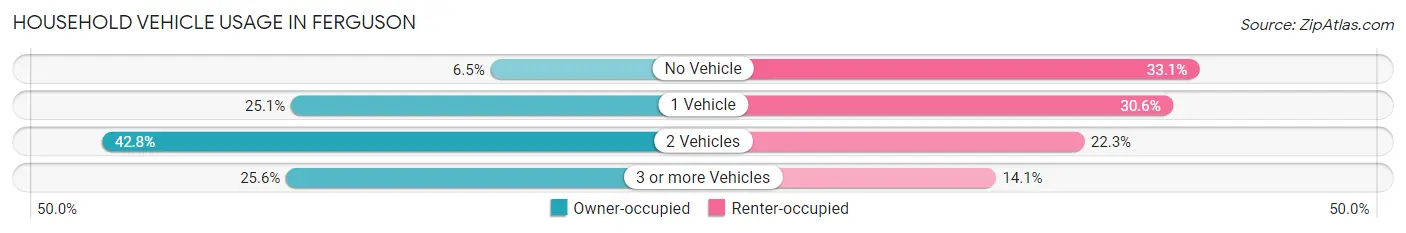
| Vehicles per Household | Owner-occupied | Renter-occupied |
| No Vehicle | 14 (6.5%) | 40 (33.1%) |
| 1 Vehicle | 54 (25.1%) | 37 (30.6%) |
| 2 Vehicles | 92 (42.8%) | 27 (22.3%) |
| 3 or more Vehicles | 55 (25.6%) | 17 (14.1%) |
| Total | 215 (100.0%) | 121 (100.0%) |
Real Estate & Mortgages in Ferguson
Real Estate and Mortgage Overview in Ferguson
| Characteristic | Without Mortgage | With Mortgage |
| Housing Units | 116 | 99 |
| Median Property Value | $92,100 | $143,500 |
| Median Household Income | $30,833 | $7 |
| Monthly Housing Costs | $321 | $0 |
| Real Estate Taxes | $605 | $0 |
Property Value by Mortgage Status in Ferguson
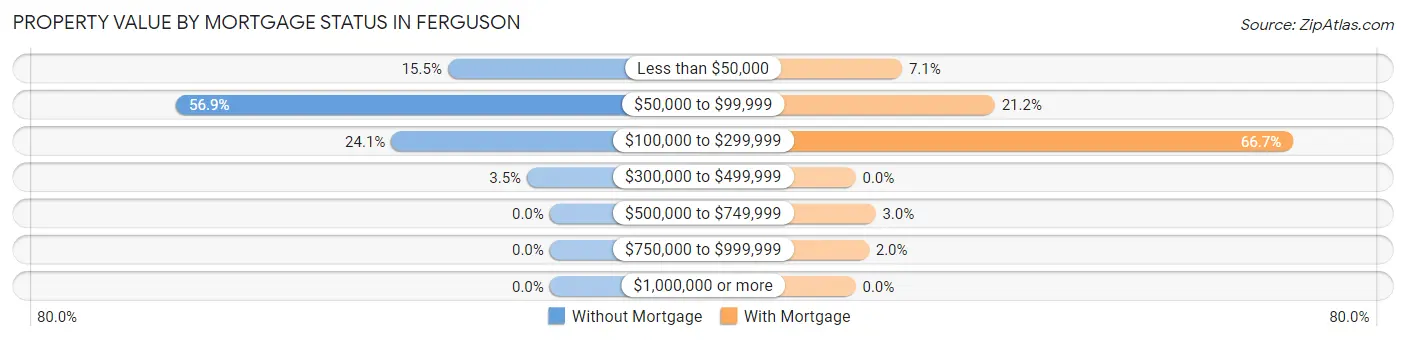
| Property Value | Without Mortgage | With Mortgage |
| Less than $50,000 | 18 (15.5%) | 7 (7.1%) |
| $50,000 to $99,999 | 66 (56.9%) | 21 (21.2%) |
| $100,000 to $299,999 | 28 (24.1%) | 66 (66.7%) |
| $300,000 to $499,999 | 4 (3.5%) | 0 (0.0%) |
| $500,000 to $749,999 | 0 (0.0%) | 3 (3.0%) |
| $750,000 to $999,999 | 0 (0.0%) | 2 (2.0%) |
| $1,000,000 or more | 0 (0.0%) | 0 (0.0%) |
| Total | 116 (100.0%) | 99 (100.0%) |
Household Income by Mortgage Status in Ferguson
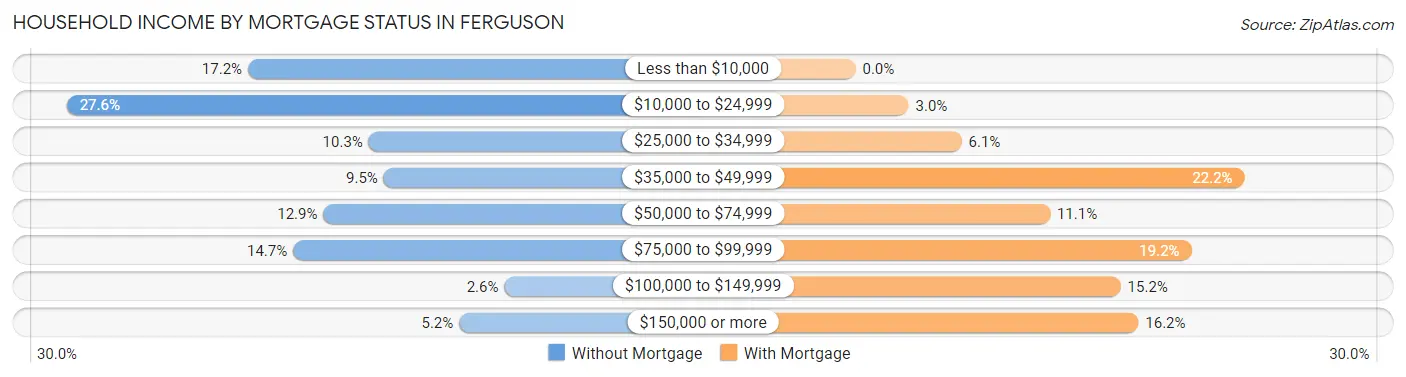
| Household Income | Without Mortgage | With Mortgage |
| Less than $10,000 | 20 (17.2%) | 0 (0.0%) |
| $10,000 to $24,999 | 32 (27.6%) | 3 (3.0%) |
| $25,000 to $34,999 | 12 (10.3%) | 6 (6.1%) |
| $35,000 to $49,999 | 11 (9.5%) | 22 (22.2%) |
| $50,000 to $74,999 | 15 (12.9%) | 11 (11.1%) |
| $75,000 to $99,999 | 17 (14.7%) | 19 (19.2%) |
| $100,000 to $149,999 | 3 (2.6%) | 15 (15.1%) |
| $150,000 or more | 6 (5.2%) | 16 (16.2%) |
| Total | 116 (100.0%) | 99 (100.0%) |
Property Value to Household Income Ratio in Ferguson
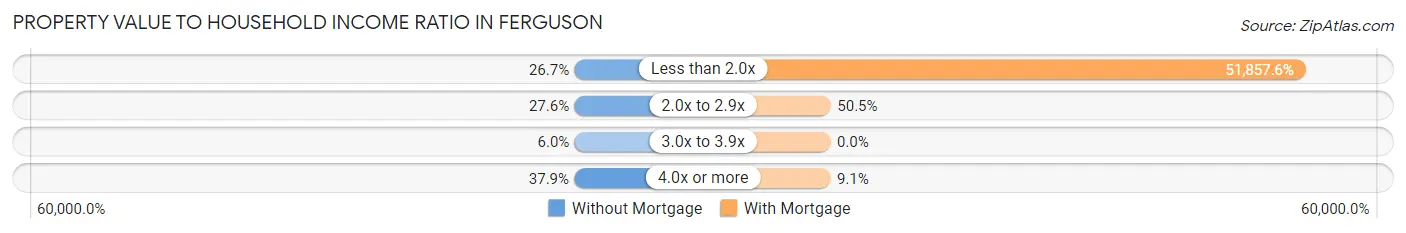
| Value-to-Income Ratio | Without Mortgage | With Mortgage |
| Less than 2.0x | 31 (26.7%) | 51,339 (51,857.6%) |
| 2.0x to 2.9x | 32 (27.6%) | 50 (50.5%) |
| 3.0x to 3.9x | 7 (6.0%) | 0 (0.0%) |
| 4.0x or more | 44 (37.9%) | 9 (9.1%) |
| Total | 116 (100.0%) | 99 (100.0%) |
Real Estate Taxes by Mortgage Status in Ferguson
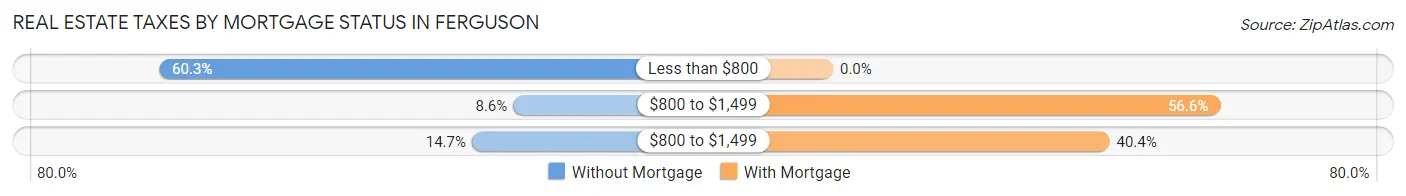
| Property Taxes | Without Mortgage | With Mortgage |
| Less than $800 | 70 (60.3%) | 0 (0.0%) |
| $800 to $1,499 | 10 (8.6%) | 56 (56.6%) |
| $800 to $1,499 | 17 (14.7%) | 40 (40.4%) |
| Total | 116 (100.0%) | 99 (100.0%) |
Health & Disability in Ferguson
Health Insurance Coverage by Age in Ferguson
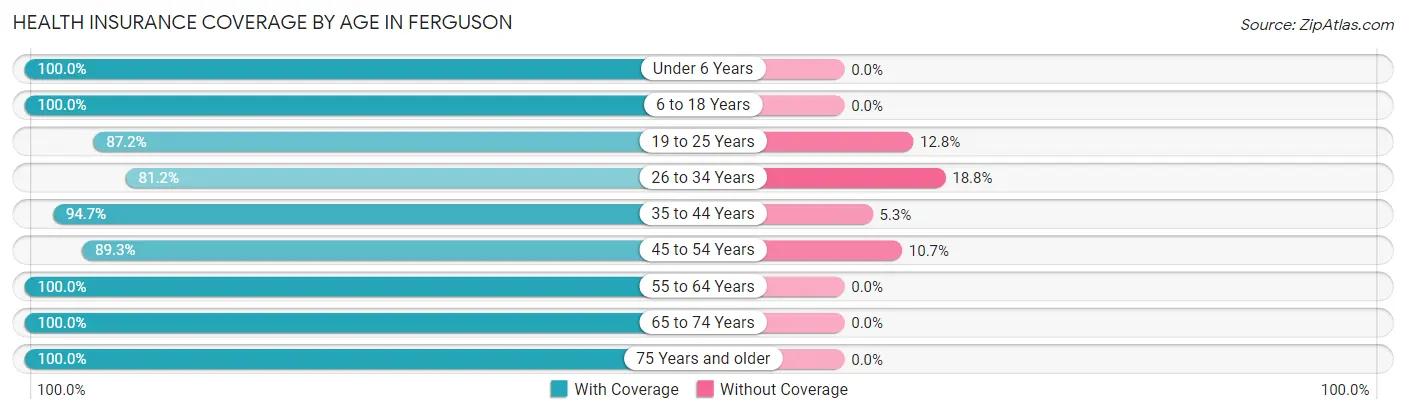
| Age Bracket | With Coverage | Without Coverage |
| Under 6 Years | 12 (100.0%) | 0 (0.0%) |
| 6 to 18 Years | 140 (100.0%) | 0 (0.0%) |
| 19 to 25 Years | 34 (87.2%) | 5 (12.8%) |
| 26 to 34 Years | 56 (81.2%) | 13 (18.8%) |
| 35 to 44 Years | 90 (94.7%) | 5 (5.3%) |
| 45 to 54 Years | 133 (89.3%) | 16 (10.7%) |
| 55 to 64 Years | 137 (100.0%) | 0 (0.0%) |
| 65 to 74 Years | 122 (100.0%) | 0 (0.0%) |
| 75 Years and older | 64 (100.0%) | 0 (0.0%) |
| Total | 788 (95.3%) | 39 (4.7%) |
Health Insurance Coverage by Citizenship Status in Ferguson
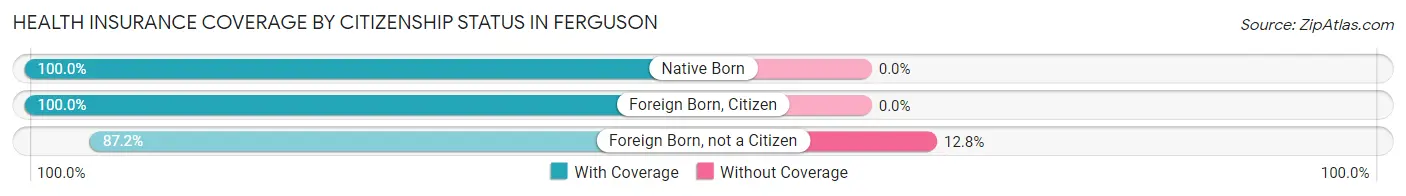
| Citizenship Status | With Coverage | Without Coverage |
| Native Born | 12 (100.0%) | 0 (0.0%) |
| Foreign Born, Citizen | 140 (100.0%) | 0 (0.0%) |
| Foreign Born, not a Citizen | 34 (87.2%) | 5 (12.8%) |
Health Insurance Coverage by Household Income in Ferguson
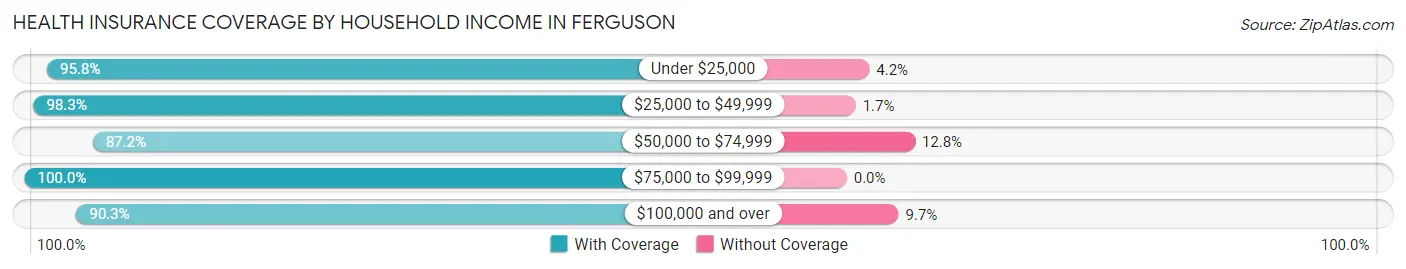
| Household Income | With Coverage | Without Coverage |
| Under $25,000 | 204 (95.8%) | 9 (4.2%) |
| $25,000 to $49,999 | 295 (98.3%) | 5 (1.7%) |
| $50,000 to $74,999 | 82 (87.2%) | 12 (12.8%) |
| $75,000 to $99,999 | 85 (100.0%) | 0 (0.0%) |
| $100,000 and over | 121 (90.3%) | 13 (9.7%) |
Public vs Private Health Insurance Coverage by Age in Ferguson
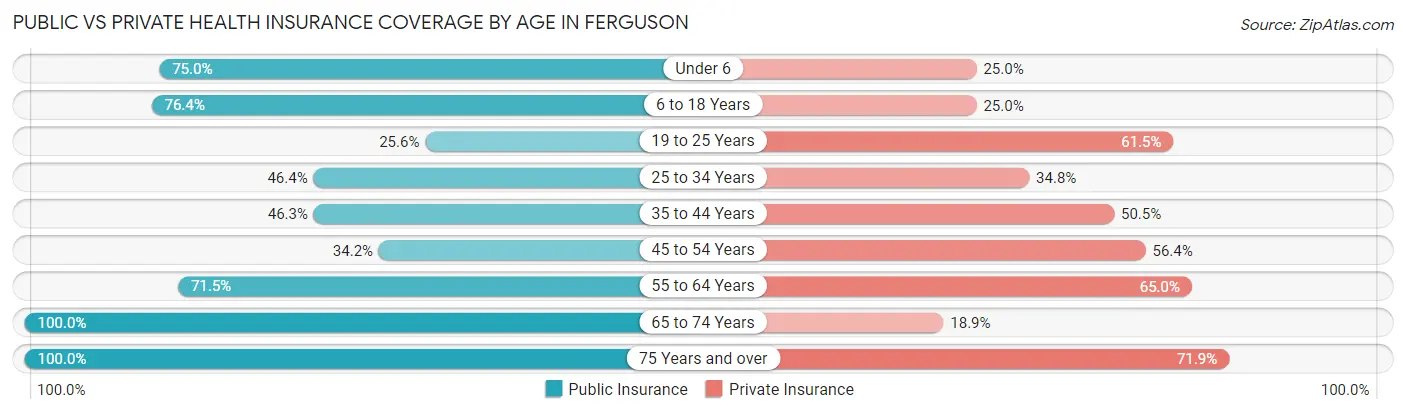
| Age Bracket | Public Insurance | Private Insurance |
| Under 6 | 9 (75.0%) | 3 (25.0%) |
| 6 to 18 Years | 107 (76.4%) | 35 (25.0%) |
| 19 to 25 Years | 10 (25.6%) | 24 (61.5%) |
| 25 to 34 Years | 32 (46.4%) | 24 (34.8%) |
| 35 to 44 Years | 44 (46.3%) | 48 (50.5%) |
| 45 to 54 Years | 51 (34.2%) | 84 (56.4%) |
| 55 to 64 Years | 98 (71.5%) | 89 (65.0%) |
| 65 to 74 Years | 122 (100.0%) | 23 (18.9%) |
| 75 Years and over | 64 (100.0%) | 46 (71.9%) |
| Total | 537 (64.9%) | 376 (45.5%) |
Disability Status by Sex by Age in Ferguson
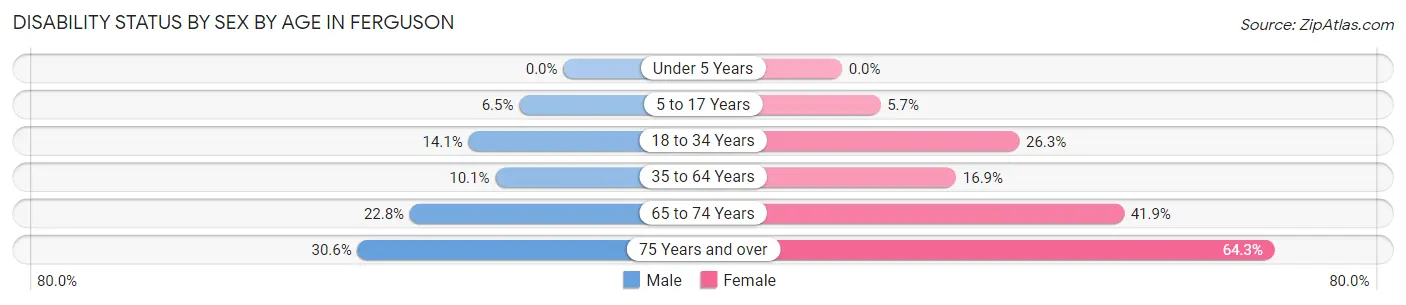
| Age Bracket | Male | Female |
| Under 5 Years | 0 (0.0%) | 0 (0.0%) |
| 5 to 17 Years | 7 (6.5%) | 2 (5.7%) |
| 18 to 34 Years | 10 (14.1%) | 10 (26.3%) |
| 35 to 64 Years | 20 (10.1%) | 31 (16.9%) |
| 65 to 74 Years | 18 (22.8%) | 18 (41.9%) |
| 75 Years and over | 11 (30.6%) | 18 (64.3%) |
Disability Class by Sex by Age in Ferguson
Disability Class: Hearing Difficulty
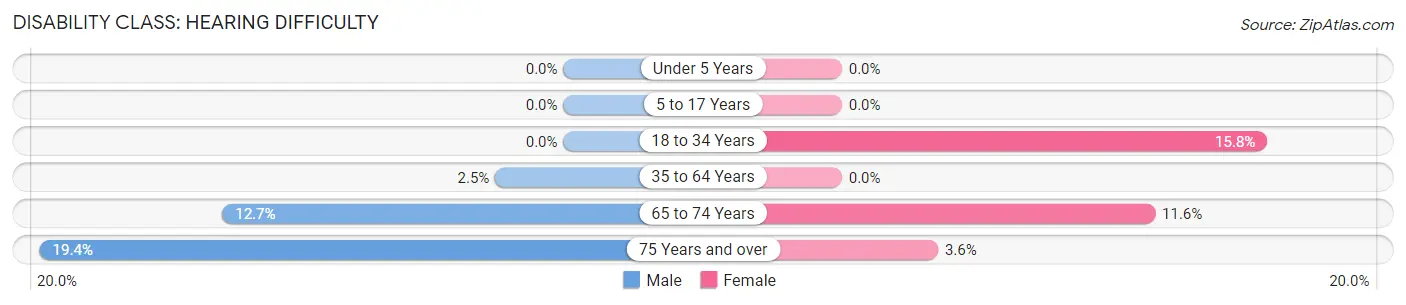
| Age Bracket | Male | Female |
| Under 5 Years | 0 (0.0%) | 0 (0.0%) |
| 5 to 17 Years | 0 (0.0%) | 0 (0.0%) |
| 18 to 34 Years | 0 (0.0%) | 6 (15.8%) |
| 35 to 64 Years | 5 (2.5%) | 0 (0.0%) |
| 65 to 74 Years | 10 (12.7%) | 5 (11.6%) |
| 75 Years and over | 7 (19.4%) | 1 (3.6%) |
Disability Class: Vision Difficulty
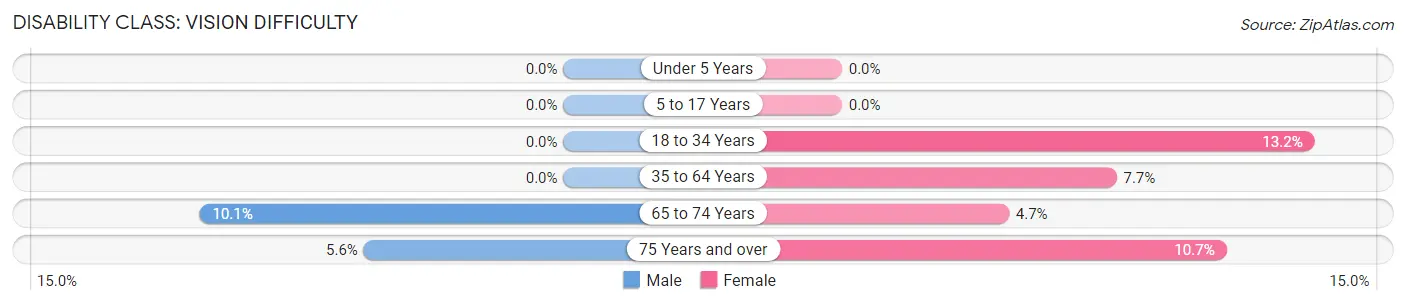
| Age Bracket | Male | Female |
| Under 5 Years | 0 (0.0%) | 0 (0.0%) |
| 5 to 17 Years | 0 (0.0%) | 0 (0.0%) |
| 18 to 34 Years | 0 (0.0%) | 5 (13.2%) |
| 35 to 64 Years | 0 (0.0%) | 14 (7.6%) |
| 65 to 74 Years | 8 (10.1%) | 2 (4.6%) |
| 75 Years and over | 2 (5.6%) | 3 (10.7%) |
Disability Class: Cognitive Difficulty
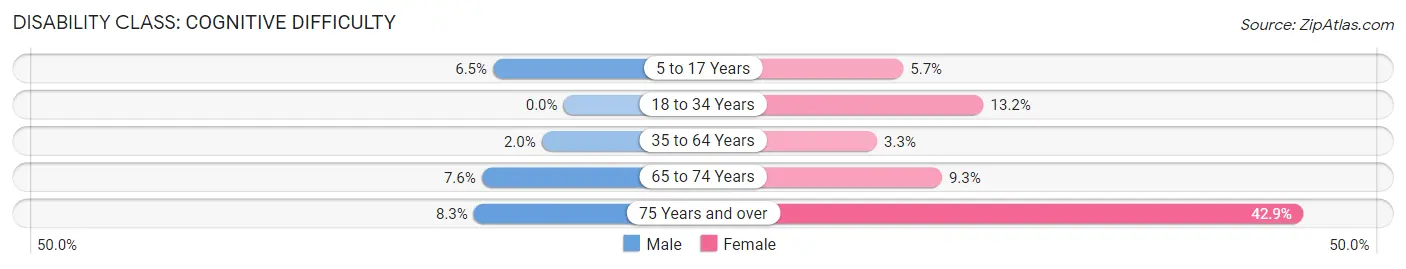
| Age Bracket | Male | Female |
| 5 to 17 Years | 7 (6.5%) | 2 (5.7%) |
| 18 to 34 Years | 0 (0.0%) | 5 (13.2%) |
| 35 to 64 Years | 4 (2.0%) | 6 (3.3%) |
| 65 to 74 Years | 6 (7.6%) | 4 (9.3%) |
| 75 Years and over | 3 (8.3%) | 12 (42.9%) |
Disability Class: Ambulatory Difficulty
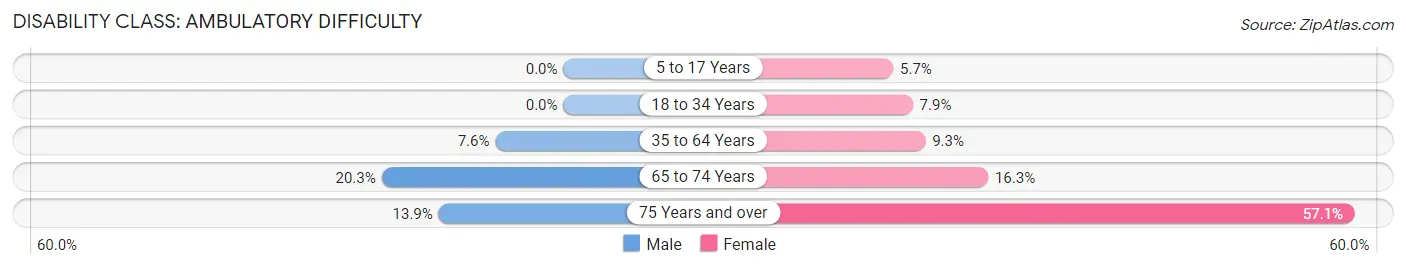
| Age Bracket | Male | Female |
| 5 to 17 Years | 0 (0.0%) | 2 (5.7%) |
| 18 to 34 Years | 0 (0.0%) | 3 (7.9%) |
| 35 to 64 Years | 15 (7.6%) | 17 (9.3%) |
| 65 to 74 Years | 16 (20.3%) | 7 (16.3%) |
| 75 Years and over | 5 (13.9%) | 16 (57.1%) |
Disability Class: Self-Care Difficulty
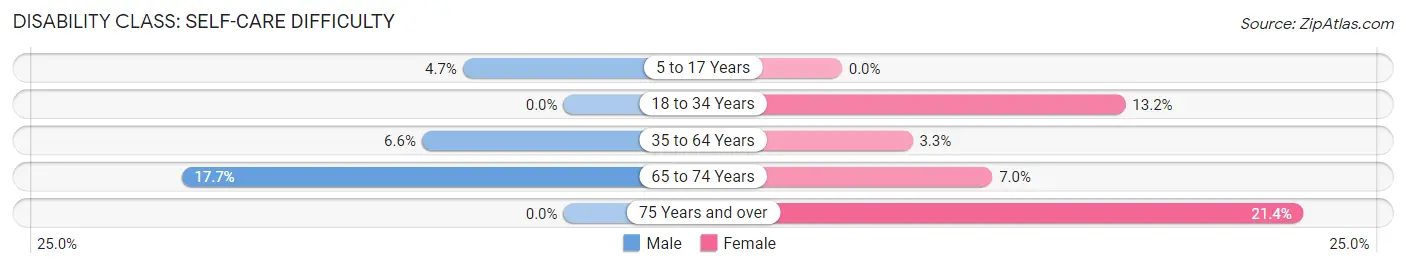
| Age Bracket | Male | Female |
| 5 to 17 Years | 5 (4.7%) | 0 (0.0%) |
| 18 to 34 Years | 0 (0.0%) | 5 (13.2%) |
| 35 to 64 Years | 13 (6.6%) | 6 (3.3%) |
| 65 to 74 Years | 14 (17.7%) | 3 (7.0%) |
| 75 Years and over | 0 (0.0%) | 6 (21.4%) |
Technology Access in Ferguson
Computing Device Access in Ferguson
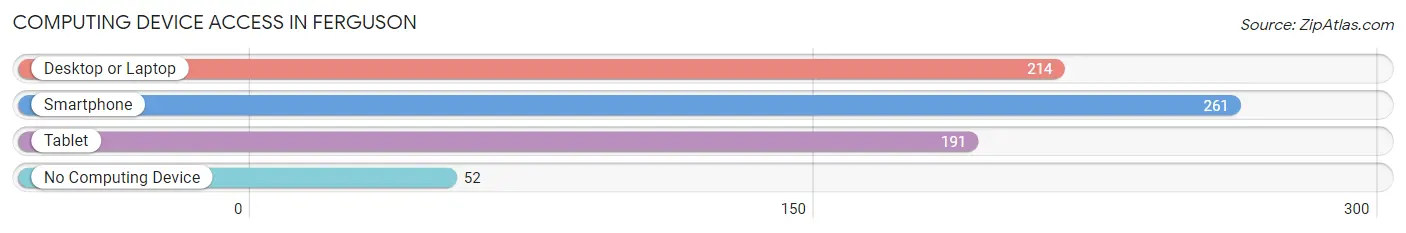
| Device Type | # Households | % Households |
| Desktop or Laptop | 214 | 63.7% |
| Smartphone | 261 | 77.7% |
| Tablet | 191 | 56.9% |
| No Computing Device | 52 | 15.5% |
| Total | 336 | 100.0% |
Internet Access in Ferguson
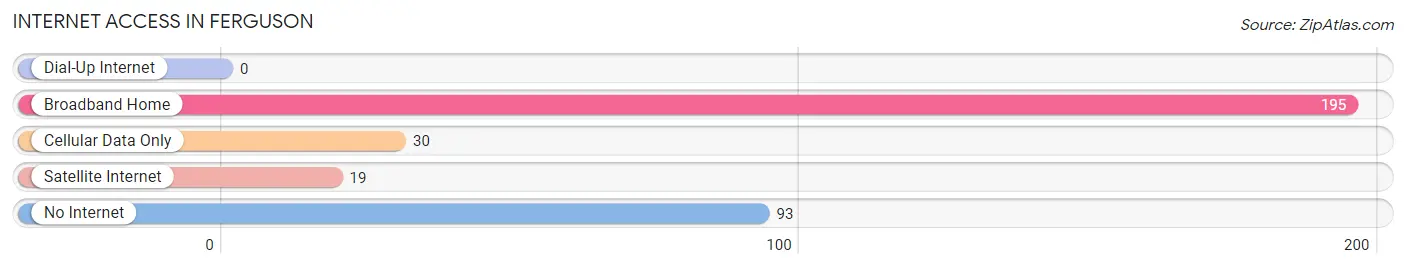
| Internet Type | # Households | % Households |
| Dial-Up Internet | 0 | 0.0% |
| Broadband Home | 195 | 58.0% |
| Cellular Data Only | 30 | 8.9% |
| Satellite Internet | 19 | 5.7% |
| No Internet | 93 | 27.7% |
| Total | 336 | 100.0% |
Ferguson Summary
Ferguson, Kentucky is a small town located in the Appalachian Mountains of Eastern Kentucky. It is situated in the foothills of the Cumberland Plateau, and is part of the larger Harlan County. The town has a population of just over 1,000 people, and is known for its rural charm and friendly atmosphere.
History
Ferguson was founded in 1883 by a group of settlers from the nearby town of Harlan. The town was named after a local doctor, Dr. William Ferguson, who had a large influence on the development of the area. The town was originally a small farming community, but soon grew to include a variety of businesses, including a sawmill, a gristmill, and a general store.
In the early 1900s, Ferguson began to experience a period of growth and prosperity. The town was home to several coal mines, and the population grew to over 1,000 people. The town also had a thriving business district, with several stores, restaurants, and other businesses.
In the 1950s, the coal industry began to decline, and the population of Ferguson began to decline as well. The town was hit hard by the Great Depression, and many of the businesses closed. However, the town was able to survive, and the population began to slowly increase again.
Geography
Ferguson is located in the Appalachian Mountains of Eastern Kentucky. It is situated in the foothills of the Cumberland Plateau, and is part of the larger Harlan County. The town is located at the intersection of US Route 421 and Kentucky Route 38. The town is surrounded by rolling hills and forests, and is home to several small creeks and streams.
Economy
Ferguson’s economy is largely based on agriculture and tourism. The town is home to several small farms, and the surrounding area is known for its production of tobacco, corn, and hay. The town also has several small businesses, including a general store, a hardware store, and a few restaurants.
Tourism is also an important part of the local economy. The town is home to several historic sites, including the Harlan County Courthouse and the Harlan County Museum. The town also has several outdoor recreation areas, including the nearby Pine Mountain State Park.
Demographics
As of the 2010 census, the population of Ferguson was 1,072. The town is predominantly white, with a small African American population. The median household income is $25,000, and the median age is 42. The town has a high rate of poverty, with nearly 30% of the population living below the poverty line.
Ferguson is a small town with a rich history and a friendly atmosphere. The town is home to several small businesses, and the surrounding area is known for its production of tobacco, corn, and hay. The town also has several outdoor recreation areas, and is home to several historic sites. The town has a population of just over 1,000 people, and is known for its rural charm and friendly atmosphere.
Common Questions
What is Per Capita Income in Ferguson?
Per Capita income in Ferguson is $22,052.
What is the Median Family Income in Ferguson?
Median Family Income in Ferguson is $37,125.
What is the Median Household income in Ferguson?
Median Household Income in Ferguson is $32,500.
What is Income or Wage Gap in Ferguson?
Income or Wage Gap in Ferguson is 35.6%.
Women in Ferguson earn 64.4 cents for every dollar earned by a man.
What is Inequality or Gini Index in Ferguson?
Inequality or Gini Index in Ferguson is 0.47.
What is the Total Population of Ferguson?
Total Population of Ferguson is 827.
What is the Total Male Population of Ferguson?
Total Male Population of Ferguson is 491.
What is the Total Female Population of Ferguson?
Total Female Population of Ferguson is 336.
What is the Ratio of Males per 100 Females in Ferguson?
There are 146.13 Males per 100 Females in Ferguson.
What is the Ratio of Females per 100 Males in Ferguson?
There are 68.43 Females per 100 Males in Ferguson.
What is the Median Population Age in Ferguson?
Median Population Age in Ferguson is 47.8 Years.
What is the Average Family Size in Ferguson
Average Family Size in Ferguson is 3.1 People.
What is the Average Household Size in Ferguson
Average Household Size in Ferguson is 2.5 People.
How Large is the Labor Force in Ferguson?
There are 298 People in the Labor Forcein in Ferguson.
What is the Percentage of People in the Labor Force in Ferguson?
41.6% of People are in the Labor Force in Ferguson.
What is the Unemployment Rate in Ferguson?
Unemployment Rate in Ferguson is 7.4%.