Camargo, KY Map & Demographics
Camargo Map
Camargo Overview
$19,325
PER CAPITA INCOME
$51,389
AVG FAMILY INCOME
$42,262
AVG HOUSEHOLD INCOME
43.8%
WAGE / INCOME GAP [ % ]
56.2¢/ $1
WAGE / INCOME GAP [ $ ]
0.47
INEQUALITY / GINI INDEX
1,018
TOTAL POPULATION
469
MALE POPULATION
549
FEMALE POPULATION
85.43
MALES / 100 FEMALES
117.06
FEMALES / 100 MALES
31.9
MEDIAN AGE
3.5
AVG FAMILY SIZE
3.1
AVG HOUSEHOLD SIZE
335
LABOR FORCE [ PEOPLE ]
48.7%
PERCENT IN LABOR FORCE
6.9%
UNEMPLOYMENT RATE
Income in Camargo
Income Overview in Camargo
Per Capita Income in Camargo is $19,325, while median incomes of families and households are $51,389 and $42,262 respectively.
| Characteristic | Number | Measure |
| Per Capita Income | 1,018 | $19,325 |
| Median Family Income | 244 | $51,389 |
| Mean Family Income | 244 | $65,241 |
| Median Household Income | 330 | $42,262 |
| Mean Household Income | 330 | $56,352 |
| Income Deficit | 244 | $0 |
| Wage / Income Gap (%) | 1,018 | 43.84% |
| Wage / Income Gap ($) | 1,018 | 56.16¢ per $1 |
| Gini / Inequality Index | 1,018 | 0.47 |
Earnings by Sex in Camargo
Average Earnings in Camargo are $33,897, $47,750 for men and $26,818 for women, a difference of 43.8%.
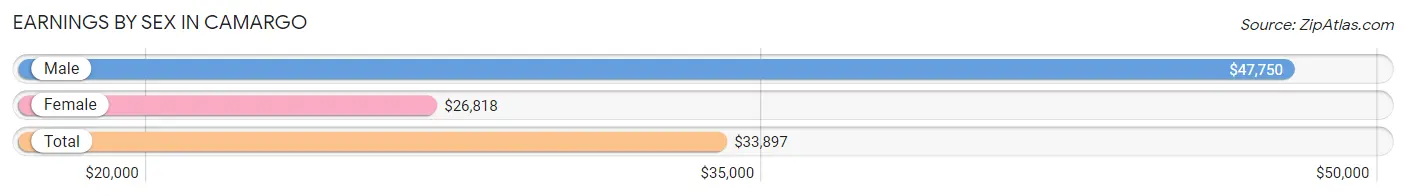
| Sex | Number | Average Earnings |
| Male | 171 (46.9%) | $47,750 |
| Female | 194 (53.1%) | $26,818 |
| Total | 365 (100.0%) | $33,897 |
Earnings by Sex by Income Bracket in Camargo
The most common earnings brackets in Camargo are $45,000 to $49,999 for men (26 | 15.2%) and $30,000 to $34,999 for women (30 | 15.5%).
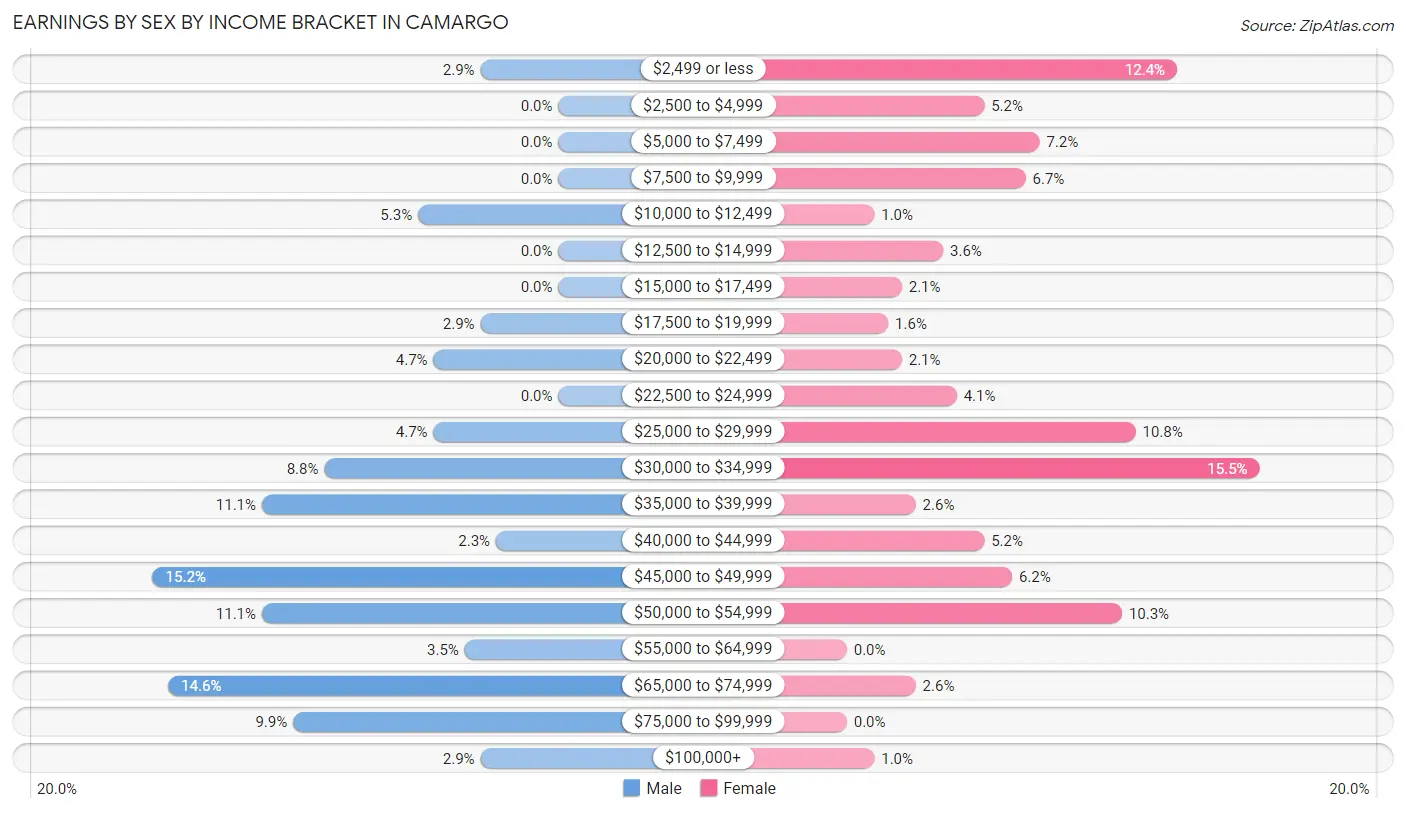
| Income | Male | Female |
| $2,499 or less | 5 (2.9%) | 24 (12.4%) |
| $2,500 to $4,999 | 0 (0.0%) | 10 (5.1%) |
| $5,000 to $7,499 | 0 (0.0%) | 14 (7.2%) |
| $7,500 to $9,999 | 0 (0.0%) | 13 (6.7%) |
| $10,000 to $12,499 | 9 (5.3%) | 2 (1.0%) |
| $12,500 to $14,999 | 0 (0.0%) | 7 (3.6%) |
| $15,000 to $17,499 | 0 (0.0%) | 4 (2.1%) |
| $17,500 to $19,999 | 5 (2.9%) | 3 (1.5%) |
| $20,000 to $22,499 | 8 (4.7%) | 4 (2.1%) |
| $22,500 to $24,999 | 0 (0.0%) | 8 (4.1%) |
| $25,000 to $29,999 | 8 (4.7%) | 21 (10.8%) |
| $30,000 to $34,999 | 15 (8.8%) | 30 (15.5%) |
| $35,000 to $39,999 | 19 (11.1%) | 5 (2.6%) |
| $40,000 to $44,999 | 4 (2.3%) | 10 (5.1%) |
| $45,000 to $49,999 | 26 (15.2%) | 12 (6.2%) |
| $50,000 to $54,999 | 19 (11.1%) | 20 (10.3%) |
| $55,000 to $64,999 | 6 (3.5%) | 0 (0.0%) |
| $65,000 to $74,999 | 25 (14.6%) | 5 (2.6%) |
| $75,000 to $99,999 | 17 (9.9%) | 0 (0.0%) |
| $100,000+ | 5 (2.9%) | 2 (1.0%) |
| Total | 171 (100.0%) | 194 (100.0%) |
Earnings by Sex by Educational Attainment in Camargo
Average earnings in Camargo are $48,583 for men and $29,000 for women, a difference of 40.3%. Men with an educational attainment of college or associate's degree enjoy the highest average annual earnings of $50,417, while those with less than high school education earn the least with $31,563. Women with an educational attainment of graduate degree earn the most with the average annual earnings of $49,688, while those with college or associate's degree education have the smallest earnings of $26,563.
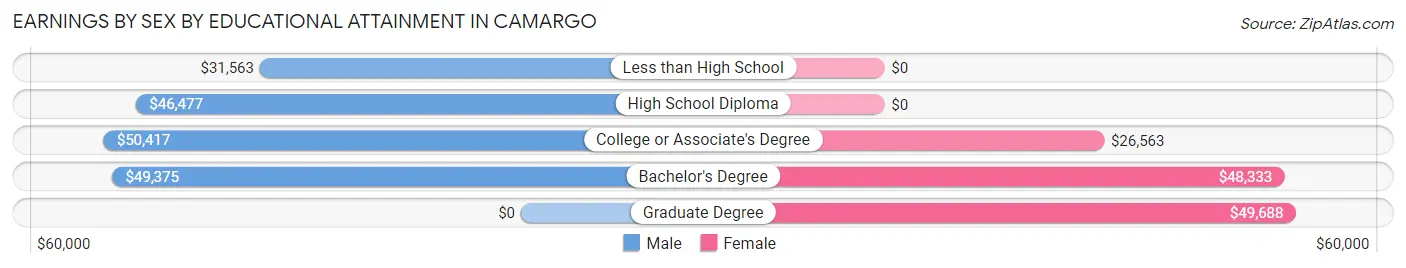
| Educational Attainment | Male Income | Female Income |
| Less than High School | $31,563 | $0 |
| High School Diploma | $46,477 | $0 |
| College or Associate's Degree | $50,417 | $26,563 |
| Bachelor's Degree | $49,375 | $48,333 |
| Graduate Degree | - | - |
| Total | $48,583 | $29,000 |
Family Income in Camargo
Family Income Brackets in Camargo
According to the Camargo family income data, there are 46 families falling into the $100,000 to $149,999 income range, which is the most common income bracket and makes up 18.9% of all families. Conversely, the $150,000 to $199,999 income bracket is the least frequent group with only 3 families (1.2%) belonging to this category.
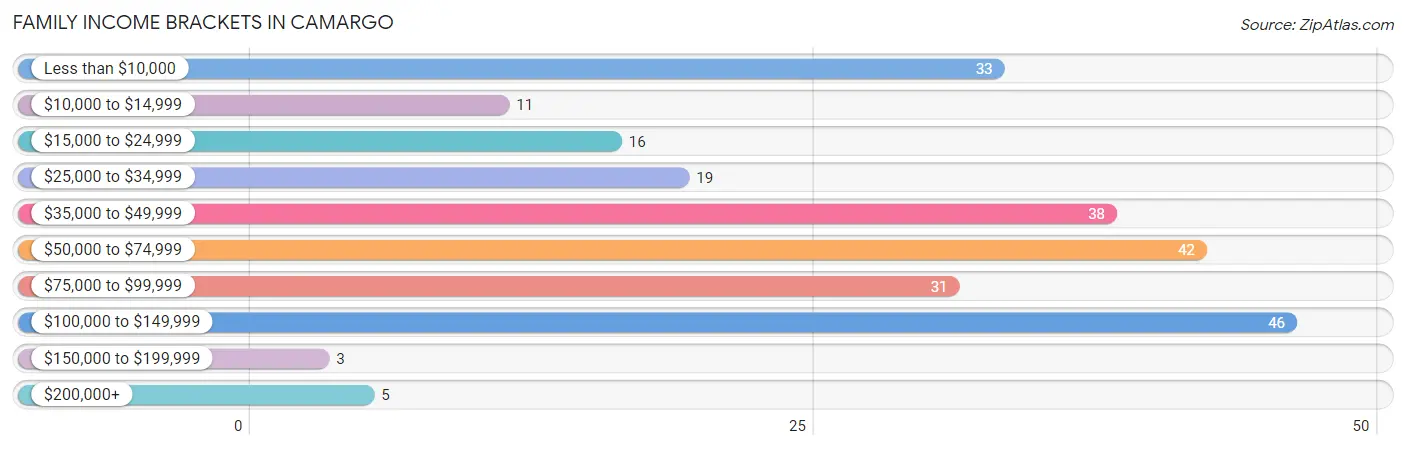
| Income Bracket | # Families | % Families |
| Less than $10,000 | 33 | 13.5% |
| $10,000 to $14,999 | 11 | 4.5% |
| $15,000 to $24,999 | 16 | 6.6% |
| $25,000 to $34,999 | 19 | 7.8% |
| $35,000 to $49,999 | 38 | 15.6% |
| $50,000 to $74,999 | 42 | 17.2% |
| $75,000 to $99,999 | 31 | 12.7% |
| $100,000 to $149,999 | 46 | 18.9% |
| $150,000 to $199,999 | 3 | 1.2% |
| $200,000+ | 5 | 2.0% |
Family Income by Famaliy Size in Camargo
4-person families (48 | 19.7%) account for the highest median family income in Camargo with $81,667 per family, while 2-person families (100 | 41.0%) have the highest median income of $25,000 per family member.
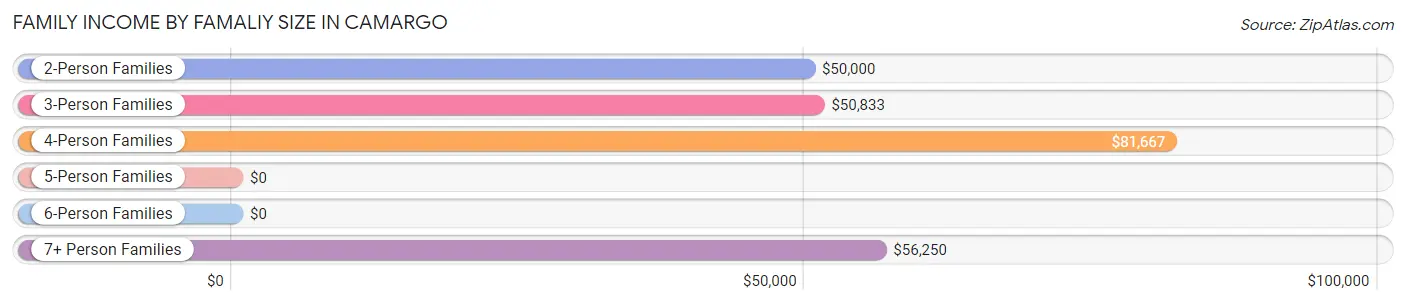
| Income Bracket | # Families | Median Income |
| 2-Person Families | 100 (41.0%) | $50,000 |
| 3-Person Families | 54 (22.1%) | $50,833 |
| 4-Person Families | 48 (19.7%) | $81,667 |
| 5-Person Families | 26 (10.7%) | $0 |
| 6-Person Families | 6 (2.5%) | $0 |
| 7+ Person Families | 10 (4.1%) | $56,250 |
| Total | 244 (100.0%) | $51,389 |
Family Income by Number of Earners in Camargo
The median family income in Camargo is $51,389, with families comprising 3+ earners (18) having the highest median family income of $104,167, while families with no earners (62) have the lowest median family income of $21,250, accounting for 7.4% and 25.4% of families, respectively.
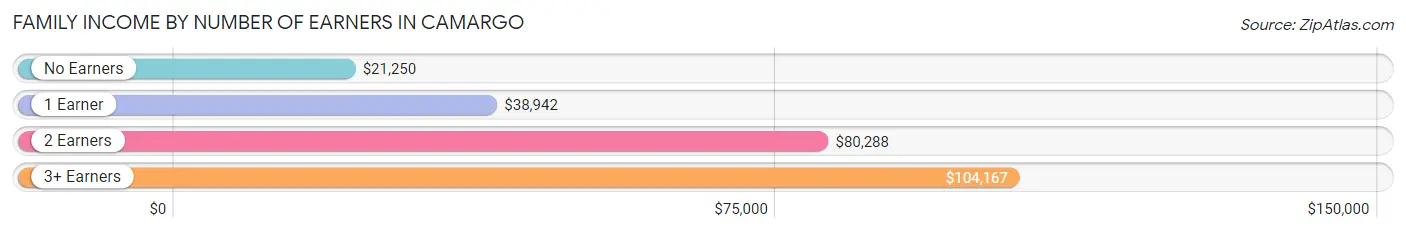
| Number of Earners | # Families | Median Income |
| No Earners | 62 (25.4%) | $21,250 |
| 1 Earner | 85 (34.8%) | $38,942 |
| 2 Earners | 79 (32.4%) | $80,288 |
| 3+ Earners | 18 (7.4%) | $104,167 |
| Total | 244 (100.0%) | $51,389 |
Household Income in Camargo
Household Income Brackets in Camargo
With 57 households falling in the category, the $35,000 to $49,999 income range is the most frequent in Camargo, accounting for 17.3% of all households. In contrast, only 3 households (0.9%) fall into the $150,000 to $199,999 income bracket, making it the least populous group.
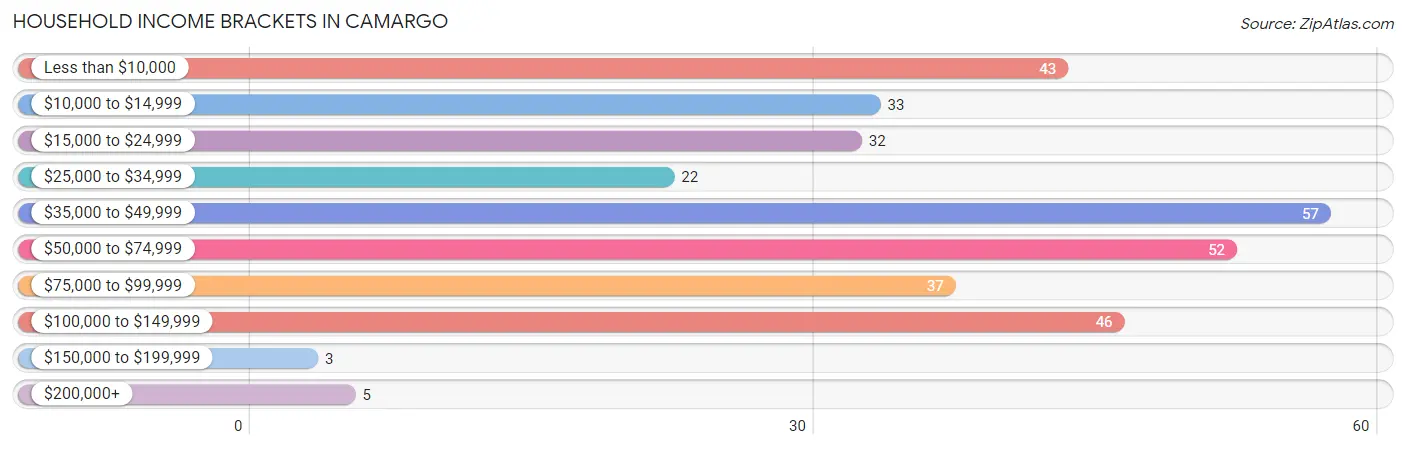
| Income Bracket | # Households | % Households |
| Less than $10,000 | 43 | 13.0% |
| $10,000 to $14,999 | 33 | 10.0% |
| $15,000 to $24,999 | 32 | 9.7% |
| $25,000 to $34,999 | 22 | 6.7% |
| $35,000 to $49,999 | 57 | 17.3% |
| $50,000 to $74,999 | 52 | 15.8% |
| $75,000 to $99,999 | 37 | 11.2% |
| $100,000 to $149,999 | 46 | 13.9% |
| $150,000 to $199,999 | 3 | 0.9% |
| $200,000+ | 5 | 1.5% |
Household Income by Householder Age in Camargo
The median household income in Camargo is $42,262, with the highest median household income of $48,250 found in the 25 to 44 years age bracket for the primary householder. A total of 119 households (36.1%) fall into this category. Meanwhile, the 65+ years age bracket for the primary householder has the lowest median household income of $0, with 108 households (32.7%) in this group.
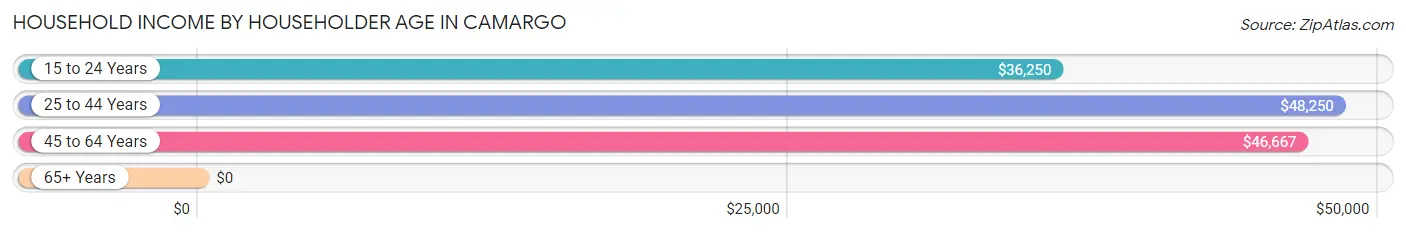
| Income Bracket | # Households | Median Income |
| 15 to 24 Years | 7 (2.1%) | $36,250 |
| 25 to 44 Years | 119 (36.1%) | $48,250 |
| 45 to 64 Years | 96 (29.1%) | $46,667 |
| 65+ Years | 108 (32.7%) | $0 |
| Total | 330 (100.0%) | $42,262 |
Poverty in Camargo
Income Below Poverty by Sex and Age in Camargo
With 22.8% poverty level for males and 28.2% for females among the residents of Camargo, 5 year old males and 5 year old females are the most vulnerable to poverty, with 11 males (78.6%) and 3 females (100.0%) in their respective age groups living below the poverty level.
| Age Bracket | Male | Female |
| Under 5 Years | 13 (35.1%) | 21 (42.9%) |
| 5 Years | 11 (78.6%) | 3 (100.0%) |
| 6 to 11 Years | 19 (25.7%) | 8 (11.4%) |
| 12 to 14 Years | 4 (14.8%) | 0 (0.0%) |
| 15 Years | 0 (0.0%) | 6 (66.7%) |
| 16 and 17 Years | 0 (0.0%) | 9 (50.0%) |
| 18 to 24 Years | 8 (40.0%) | 16 (42.1%) |
| 25 to 34 Years | 8 (21.0%) | 28 (30.1%) |
| 35 to 44 Years | 11 (15.7%) | 0 (0.0%) |
| 45 to 54 Years | 0 (0.0%) | 22 (38.6%) |
| 55 to 64 Years | 9 (20.0%) | 26 (41.3%) |
| 65 to 74 Years | 10 (25.6%) | 4 (9.1%) |
| 75 Years and over | 14 (41.2%) | 11 (30.6%) |
| Total | 107 (22.8%) | 154 (28.2%) |
Income Above Poverty by Sex and Age in Camargo
According to the poverty statistics in Camargo, males aged 15 years and females aged 12 to 14 years are the age groups that are most secure financially, with 100.0% of males and 100.0% of females in these age groups living above the poverty line.
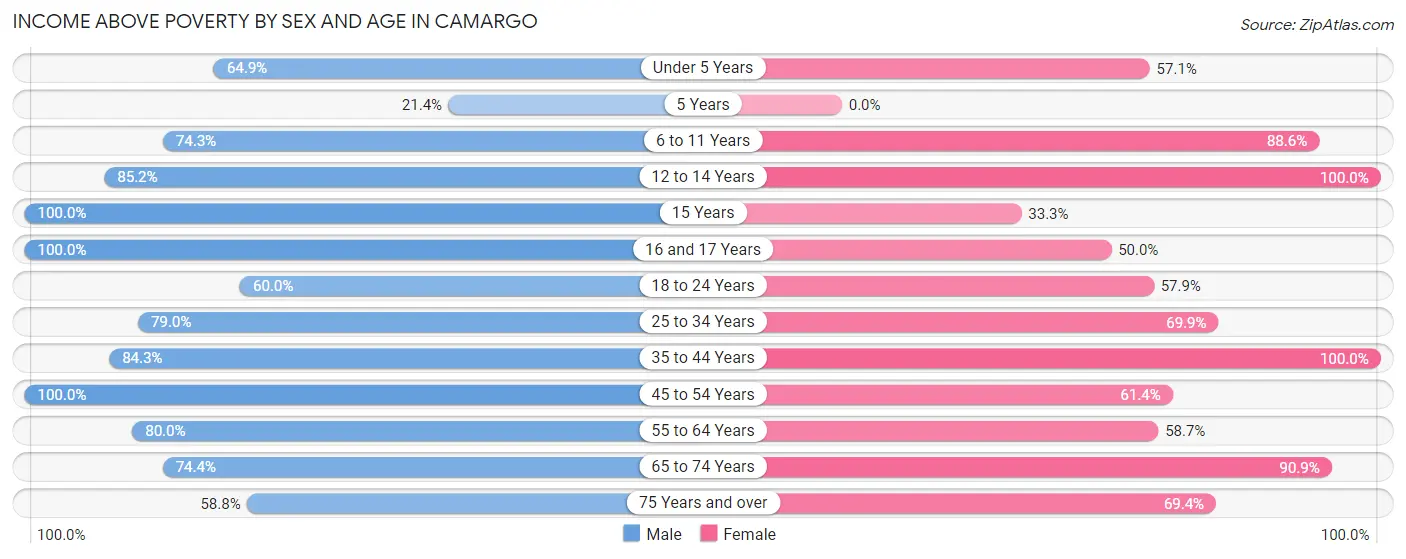
| Age Bracket | Male | Female |
| Under 5 Years | 24 (64.9%) | 28 (57.1%) |
| 5 Years | 3 (21.4%) | 0 (0.0%) |
| 6 to 11 Years | 55 (74.3%) | 62 (88.6%) |
| 12 to 14 Years | 23 (85.2%) | 27 (100.0%) |
| 15 Years | 17 (100.0%) | 3 (33.3%) |
| 16 and 17 Years | 3 (100.0%) | 9 (50.0%) |
| 18 to 24 Years | 12 (60.0%) | 22 (57.9%) |
| 25 to 34 Years | 30 (78.9%) | 65 (69.9%) |
| 35 to 44 Years | 59 (84.3%) | 39 (100.0%) |
| 45 to 54 Years | 51 (100.0%) | 35 (61.4%) |
| 55 to 64 Years | 36 (80.0%) | 37 (58.7%) |
| 65 to 74 Years | 29 (74.4%) | 40 (90.9%) |
| 75 Years and over | 20 (58.8%) | 25 (69.4%) |
| Total | 362 (77.2%) | 392 (71.8%) |
Income Below Poverty Among Married-Couple Families in Camargo
The poverty statistics for married-couple families in Camargo show that 7.7% or 11 of the total 143 families live below the poverty line. Families with no children have the highest poverty rate of 10.6%, comprising of 7 families. On the other hand, families with 3 or 4 children have the lowest poverty rate of 0.0%, which includes 0 families.
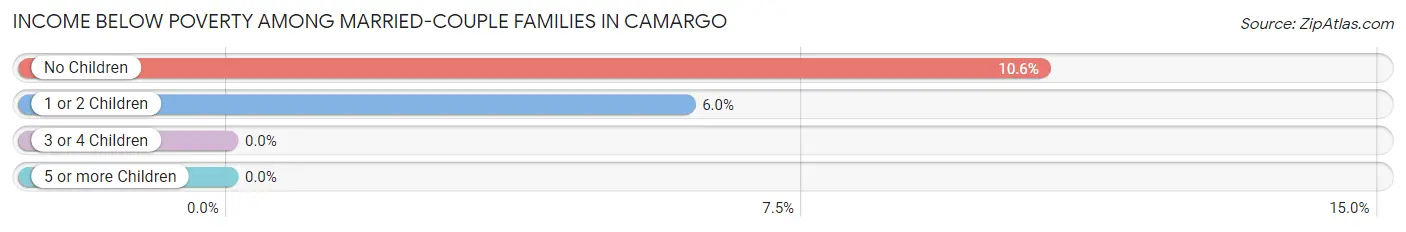
| Children | Above Poverty | Below Poverty |
| No Children | 59 (89.4%) | 7 (10.6%) |
| 1 or 2 Children | 63 (94.0%) | 4 (6.0%) |
| 3 or 4 Children | 5 (100.0%) | 0 (0.0%) |
| 5 or more Children | 5 (100.0%) | 0 (0.0%) |
| Total | 132 (92.3%) | 11 (7.7%) |
Income Below Poverty Among Single-Parent Households in Camargo
According to the poverty data in Camargo, 33.3% or 11 single-father households and 47.1% or 32 single-mother households are living below the poverty line. Among single-father households, those with 3 or 4 children have the highest poverty rate, with 11 households (100.0%) experiencing poverty. Likewise, among single-mother households, those with 3 or 4 children have the highest poverty rate, with 10 households (100.0%) falling below the poverty line.
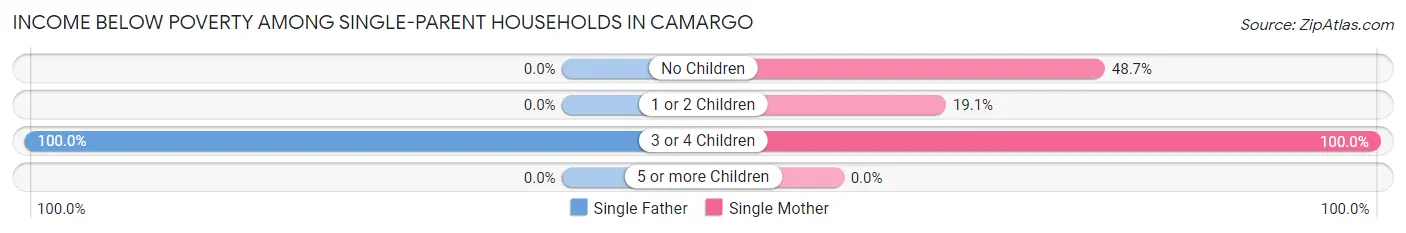
| Children | Single Father | Single Mother |
| No Children | 0 (0.0%) | 18 (48.6%) |
| 1 or 2 Children | 0 (0.0%) | 4 (19.1%) |
| 3 or 4 Children | 11 (100.0%) | 10 (100.0%) |
| 5 or more Children | 0 (0.0%) | 0 (0.0%) |
| Total | 11 (33.3%) | 32 (47.1%) |
Income Below Poverty Among Married-Couple vs Single-Parent Households in Camargo
The poverty data for Camargo shows that 11 of the married-couple family households (7.7%) and 43 of the single-parent households (42.6%) are living below the poverty level. Within the married-couple family households, those with no children have the highest poverty rate, with 7 households (10.6%) falling below the poverty line. Among the single-parent households, those with 3 or 4 children have the highest poverty rate, with 21 household (100.0%) living below poverty.
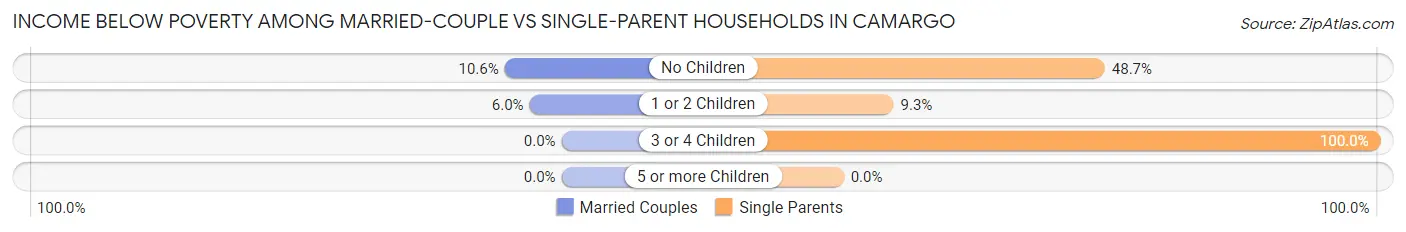
| Children | Married-Couple Families | Single-Parent Households |
| No Children | 7 (10.6%) | 18 (48.6%) |
| 1 or 2 Children | 4 (6.0%) | 4 (9.3%) |
| 3 or 4 Children | 0 (0.0%) | 21 (100.0%) |
| 5 or more Children | 0 (0.0%) | 0 (0.0%) |
| Total | 11 (7.7%) | 43 (42.6%) |
Race in Camargo
The most populous races in Camargo are White / Caucasian (953 | 93.6%), Hispanic or Latino (69 | 6.8%), and Black / African American (41 | 4.0%).
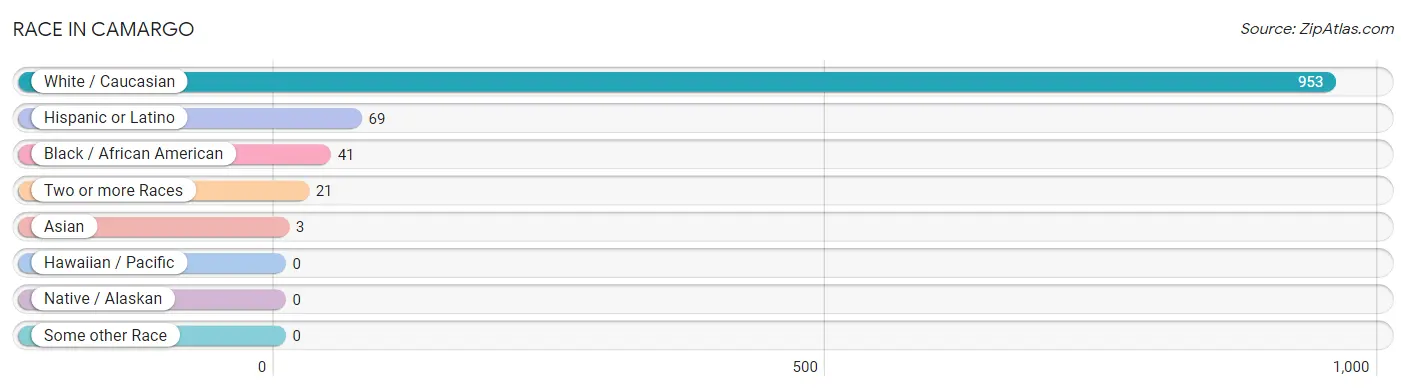
| Race | # Population | % Population |
| Asian | 3 | 0.3% |
| Black / African American | 41 | 4.0% |
| Hawaiian / Pacific | 0 | 0.0% |
| Hispanic or Latino | 69 | 6.8% |
| Native / Alaskan | 0 | 0.0% |
| White / Caucasian | 953 | 93.6% |
| Two or more Races | 21 | 2.1% |
| Some other Race | 0 | 0.0% |
| Total | 1,018 | 100.0% |
Ancestry in Camargo
The most populous ancestries reported in Camargo are American (260 | 25.5%), Irish (91 | 8.9%), English (63 | 6.2%), Mexican (57 | 5.6%), and German (47 | 4.6%), together accounting for 50.9% of all Camargo residents.
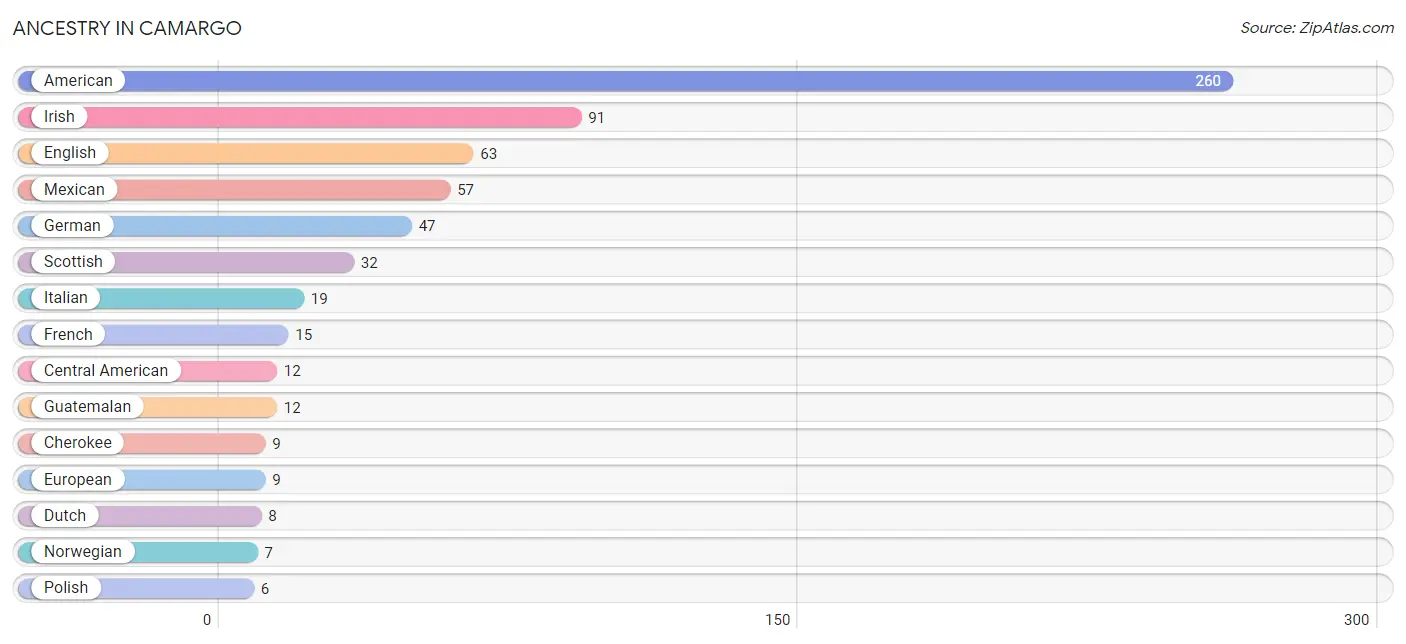
| Ancestry | # Population | % Population |
| African | 3 | 0.3% |
| American | 260 | 25.5% |
| Blackfeet | 1 | 0.1% |
| British | 4 | 0.4% |
| Central American | 12 | 1.2% |
| Cherokee | 9 | 0.9% |
| Dutch | 8 | 0.8% |
| English | 63 | 6.2% |
| European | 9 | 0.9% |
| French | 15 | 1.5% |
| German | 47 | 4.6% |
| Guatemalan | 12 | 1.2% |
| Irish | 91 | 8.9% |
| Italian | 19 | 1.9% |
| Korean | 3 | 0.3% |
| Mexican | 57 | 5.6% |
| Norwegian | 7 | 0.7% |
| Polish | 6 | 0.6% |
| Scandinavian | 6 | 0.6% |
| Scotch-Irish | 4 | 0.4% |
| Scottish | 32 | 3.1% |
| Subsaharan African | 3 | 0.3% | View All 22 Rows |
Immigrants in Camargo
The most numerous immigrant groups reported in Camargo came from Central America (12 | 1.2%), Latin America (12 | 1.2%), Mexico (12 | 1.2%), Asia (3 | 0.3%), and Philippines (3 | 0.3%), together accounting for 4.1% of all Camargo residents.
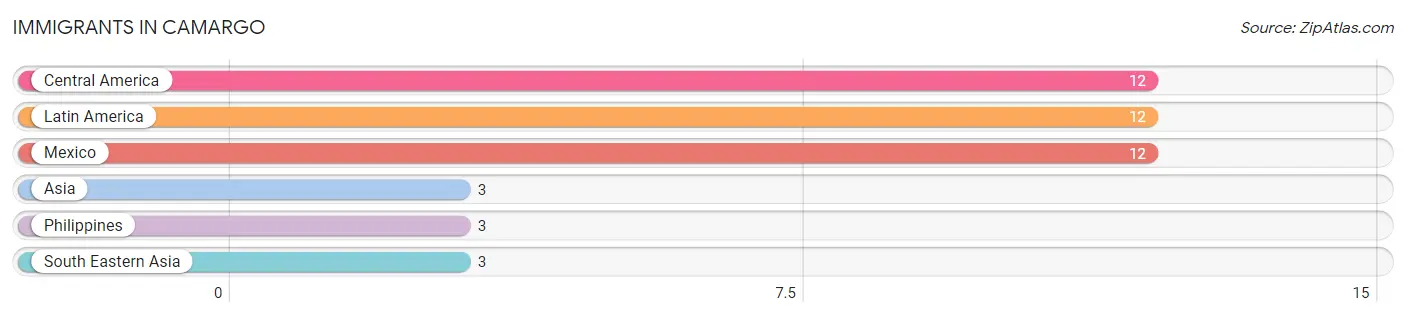
| Immigration Origin | # Population | % Population |
| Asia | 3 | 0.3% |
| Central America | 12 | 1.2% |
| Latin America | 12 | 1.2% |
| Mexico | 12 | 1.2% |
| Philippines | 3 | 0.3% |
| South Eastern Asia | 3 | 0.3% | View All 6 Rows |
Sex and Age in Camargo
Sex and Age in Camargo
The most populous age groups in Camargo are 5 to 9 Years (68 | 14.5%) for men and 5 to 9 Years (56 | 10.2%) for women.
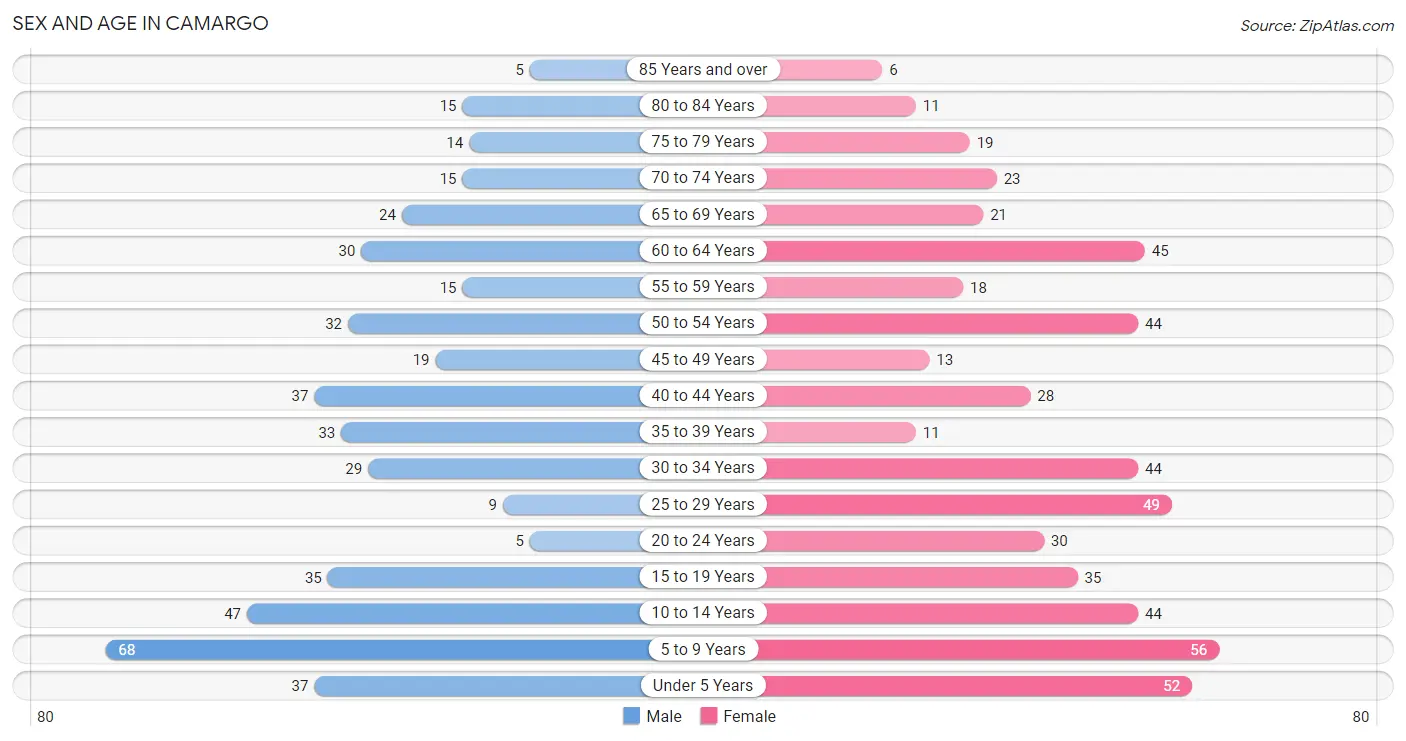
| Age Bracket | Male | Female |
| Under 5 Years | 37 (7.9%) | 52 (9.5%) |
| 5 to 9 Years | 68 (14.5%) | 56 (10.2%) |
| 10 to 14 Years | 47 (10.0%) | 44 (8.0%) |
| 15 to 19 Years | 35 (7.5%) | 35 (6.4%) |
| 20 to 24 Years | 5 (1.1%) | 30 (5.5%) |
| 25 to 29 Years | 9 (1.9%) | 49 (8.9%) |
| 30 to 34 Years | 29 (6.2%) | 44 (8.0%) |
| 35 to 39 Years | 33 (7.0%) | 11 (2.0%) |
| 40 to 44 Years | 37 (7.9%) | 28 (5.1%) |
| 45 to 49 Years | 19 (4.1%) | 13 (2.4%) |
| 50 to 54 Years | 32 (6.8%) | 44 (8.0%) |
| 55 to 59 Years | 15 (3.2%) | 18 (3.3%) |
| 60 to 64 Years | 30 (6.4%) | 45 (8.2%) |
| 65 to 69 Years | 24 (5.1%) | 21 (3.8%) |
| 70 to 74 Years | 15 (3.2%) | 23 (4.2%) |
| 75 to 79 Years | 14 (3.0%) | 19 (3.5%) |
| 80 to 84 Years | 15 (3.2%) | 11 (2.0%) |
| 85 Years and over | 5 (1.1%) | 6 (1.1%) |
| Total | 469 (100.0%) | 549 (100.0%) |
Families and Households in Camargo
Median Family Size in Camargo
The median family size in Camargo is 3.53 persons per family, with single male/father families (33 | 13.5%) accounting for the largest median family size of 3.94 persons per family. On the other hand, single female/mother families (68 | 27.9%) represent the smallest median family size with 2.78 persons per family.
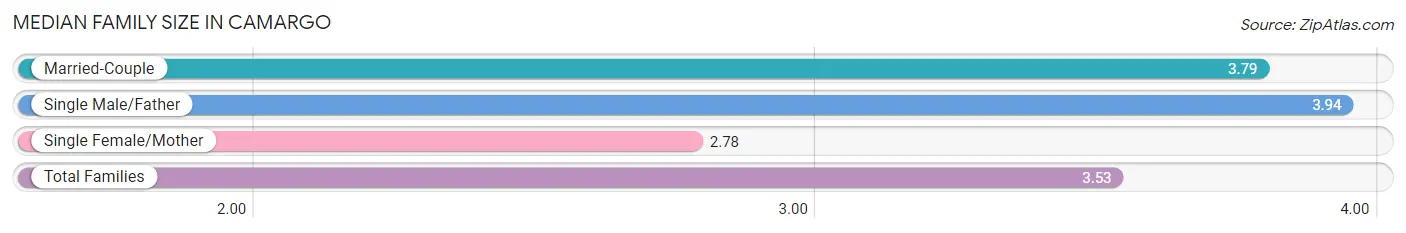
| Family Type | # Families | Family Size |
| Married-Couple | 143 (58.6%) | 3.79 |
| Single Male/Father | 33 (13.5%) | 3.94 |
| Single Female/Mother | 68 (27.9%) | 2.78 |
| Total Families | 244 (100.0%) | 3.53 |
Median Household Size in Camargo
The median household size in Camargo is 3.08 persons per household, with single male/father households (33 | 10.0%) accounting for the largest median household size of 4.88 persons per household. non-family households (86 | 26.1%) represent the smallest median household size with 1.17 persons per household.
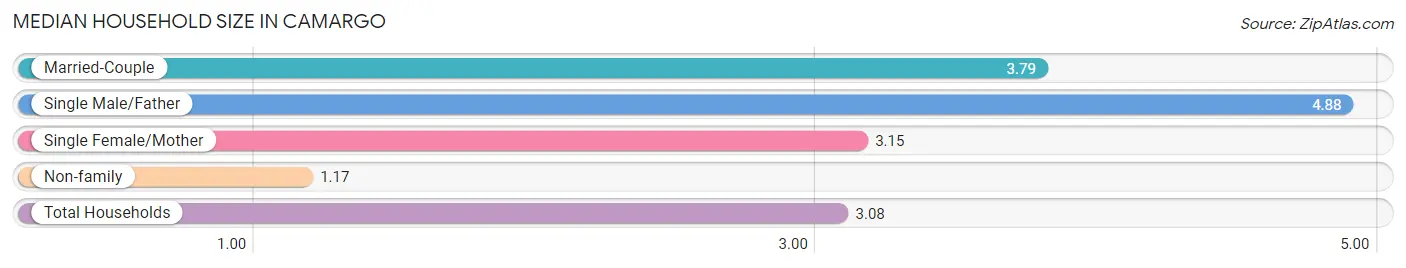
| Household Type | # Households | Household Size |
| Married-Couple | 143 (43.3%) | 3.79 |
| Single Male/Father | 33 (10.0%) | 4.88 |
| Single Female/Mother | 68 (20.6%) | 3.15 |
| Non-family | 86 (26.1%) | 1.17 |
| Total Households | 330 (100.0%) | 3.08 |
Household Size by Marriage Status in Camargo
Out of a total of 330 households in Camargo, 244 (73.9%) are family households, while 86 (26.1%) are nonfamily households. The most numerous type of family households are 2-person households, comprising 87, and the most common type of nonfamily households are 1-person households, comprising 76.
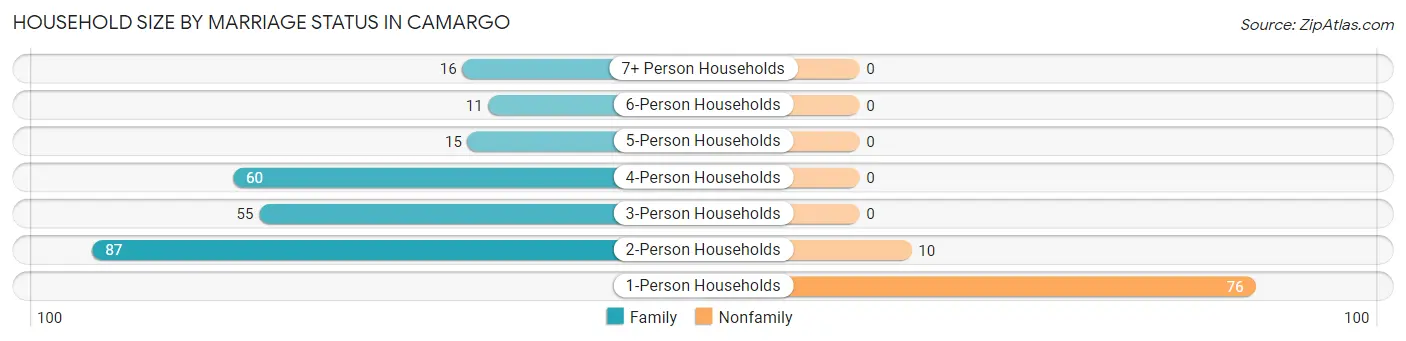
| Household Size | Family Households | Nonfamily Households |
| 1-Person Households | - | 76 (23.0%) |
| 2-Person Households | 87 (26.4%) | 10 (3.0%) |
| 3-Person Households | 55 (16.7%) | 0 (0.0%) |
| 4-Person Households | 60 (18.2%) | 0 (0.0%) |
| 5-Person Households | 15 (4.5%) | 0 (0.0%) |
| 6-Person Households | 11 (3.3%) | 0 (0.0%) |
| 7+ Person Households | 16 (4.9%) | 0 (0.0%) |
| Total | 244 (73.9%) | 86 (26.1%) |
Female Fertility in Camargo
Fertility by Age in Camargo
Average fertility rate in Camargo is 73.0 births per 1,000 women. Women in the age bracket of 20 to 34 years have the highest fertility rate with 130.0 births per 1,000 women. Women in the age bracket of 20 to 34 years acount for 100.0% of all women with births.
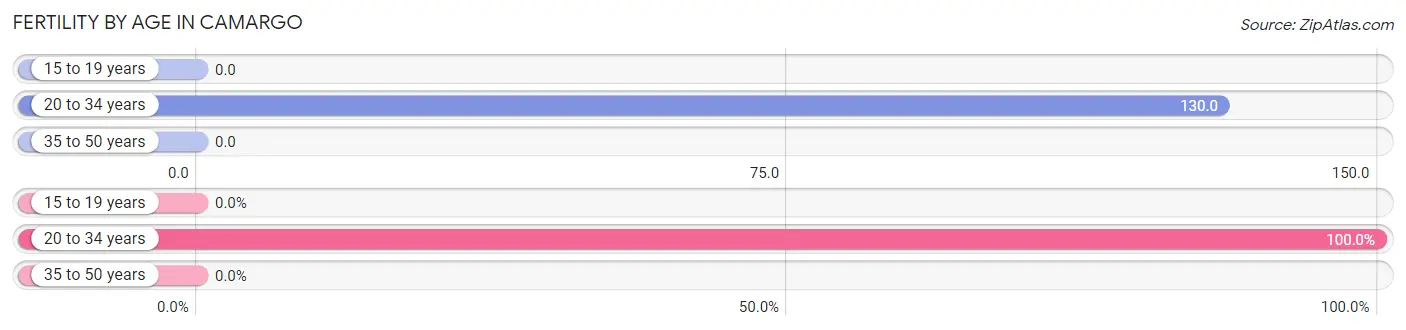
| Age Bracket | Women with Births | Births / 1,000 Women |
| 15 to 19 years | 0 (0.0%) | 0.0 |
| 20 to 34 years | 16 (100.0%) | 130.0 |
| 35 to 50 years | 0 (0.0%) | 0.0 |
| Total | 16 (100.0%) | 73.0 |
Fertility by Age by Marriage Status in Camargo
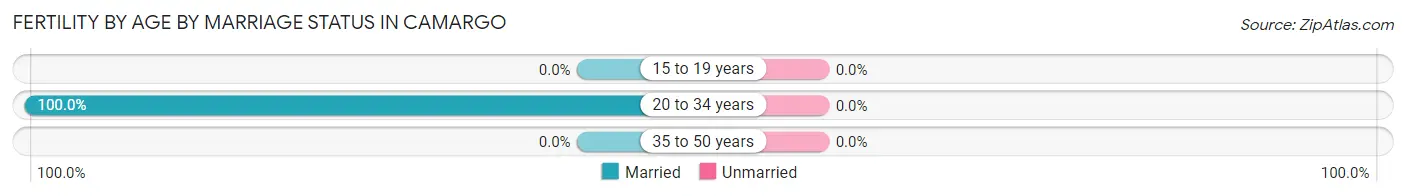
| Age Bracket | Married | Unmarried |
| 15 to 19 years | 0 (0.0%) | 0 (0.0%) |
| 20 to 34 years | 16 (100.0%) | 0 (0.0%) |
| 35 to 50 years | 0 (0.0%) | 0 (0.0%) |
| Total | 16 (100.0%) | 0 (0.0%) |
Fertility by Education in Camargo
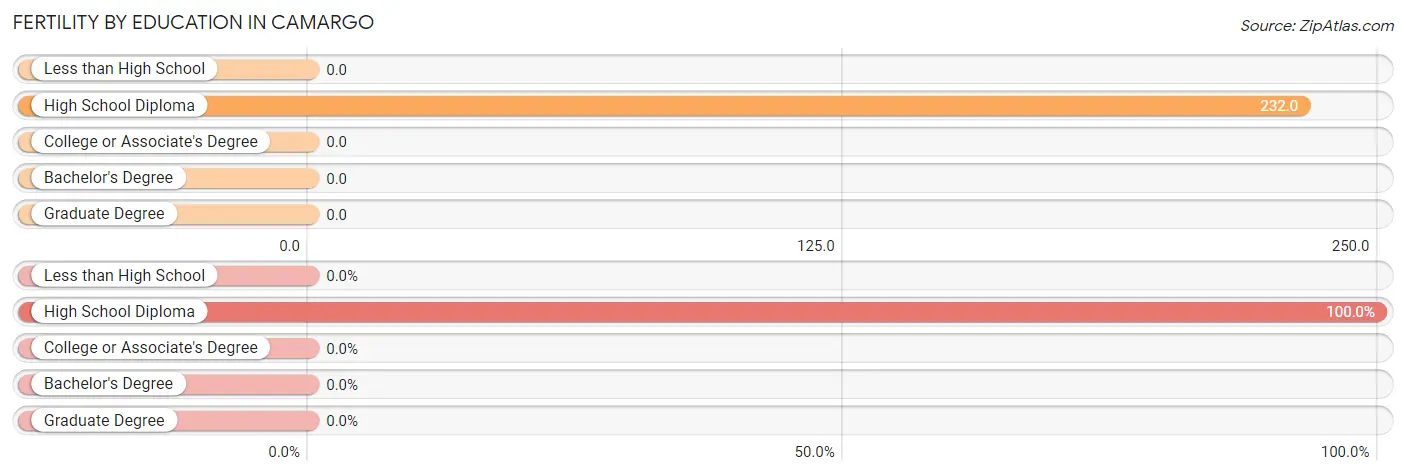
| Educational Attainment | Women with Births | Births / 1,000 Women |
| Less than High School | 0 (0.0%) | 0.0 |
| High School Diploma | 16 (100.0%) | 232.0 |
| College or Associate's Degree | 0 (0.0%) | 0.0 |
| Bachelor's Degree | 0 (0.0%) | 0.0 |
| Graduate Degree | 0 (0.0%) | 0.0 |
| Total | 16 (100.0%) | 73.0 |
Fertility by Education by Marriage Status in Camargo
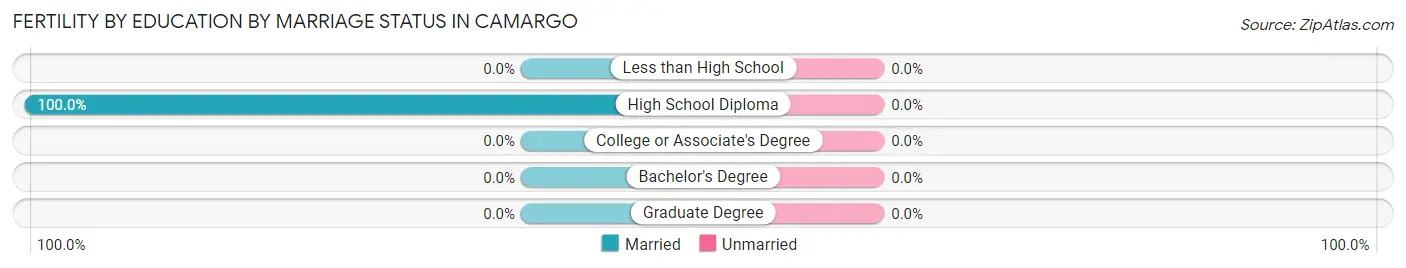
| Educational Attainment | Married | Unmarried |
| Less than High School | 0 (0.0%) | 0 (0.0%) |
| High School Diploma | 16 (100.0%) | 0 (0.0%) |
| College or Associate's Degree | 0 (0.0%) | 0 (0.0%) |
| Bachelor's Degree | 0 (0.0%) | 0 (0.0%) |
| Graduate Degree | 0 (0.0%) | 0 (0.0%) |
| Total | 16 (100.0%) | 0 (0.0%) |
Employment Characteristics in Camargo
Employment by Class of Employer in Camargo
Among the 310 employed individuals in Camargo, private company employees (251 | 81.0%), local government employees (31 | 10.0%), and not-for-profit organizations (7 | 2.3%) make up the most common classes of employment.
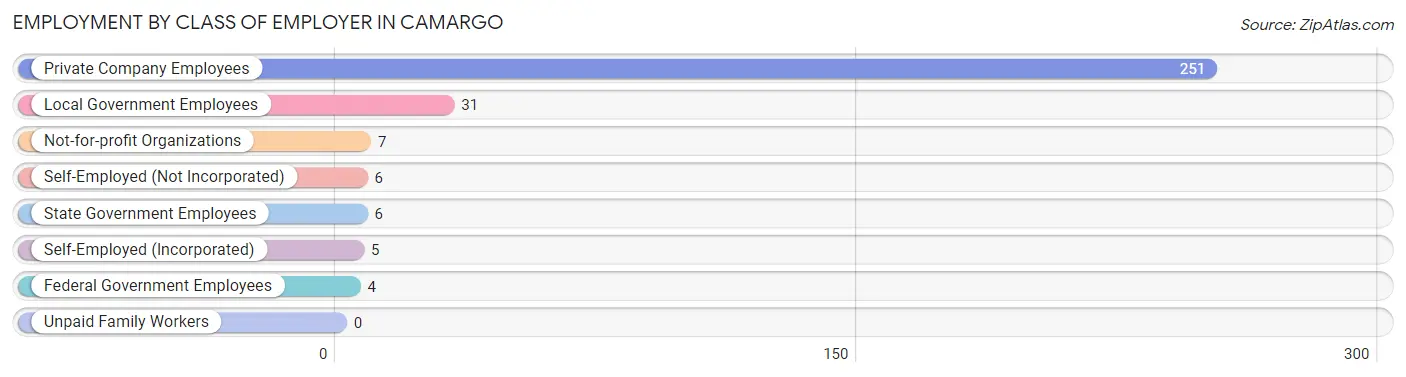
| Employer Class | # Employees | % Employees |
| Private Company Employees | 251 | 81.0% |
| Self-Employed (Incorporated) | 5 | 1.6% |
| Self-Employed (Not Incorporated) | 6 | 1.9% |
| Not-for-profit Organizations | 7 | 2.3% |
| Local Government Employees | 31 | 10.0% |
| State Government Employees | 6 | 1.9% |
| Federal Government Employees | 4 | 1.3% |
| Unpaid Family Workers | 0 | 0.0% |
| Total | 310 | 100.0% |
Employment Status by Age in Camargo
According to the labor force statistics for Camargo, out of the total population over 16 years of age (688), 48.7% or 335 individuals are in the labor force, with 6.9% or 23 of them unemployed. The age group with the highest labor force participation rate is 35 to 44 years, with 77.1% or 84 individuals in the labor force. Within the labor force, the 45 to 54 years age range has the highest percentage of unemployed individuals, with 18.3% or 15 of them being unemployed.
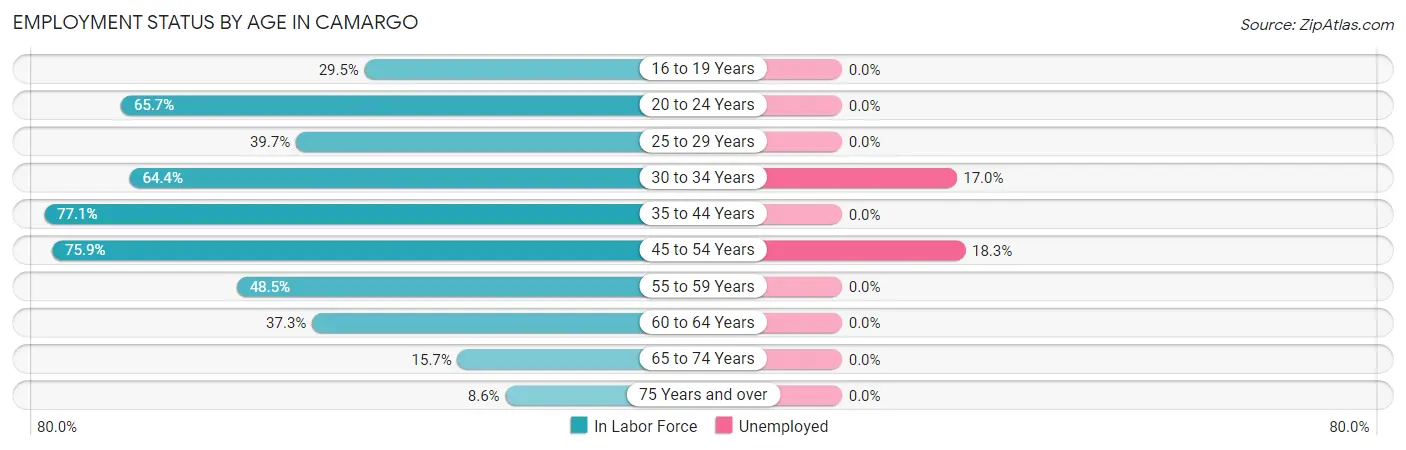
| Age Bracket | In Labor Force | Unemployed |
| 16 to 19 Years | 13 (29.5%) | 0 (0.0%) |
| 20 to 24 Years | 23 (65.7%) | 0 (0.0%) |
| 25 to 29 Years | 23 (39.7%) | 0 (0.0%) |
| 30 to 34 Years | 47 (64.4%) | 8 (17.0%) |
| 35 to 44 Years | 84 (77.1%) | 0 (0.0%) |
| 45 to 54 Years | 82 (75.9%) | 15 (18.3%) |
| 55 to 59 Years | 16 (48.5%) | 0 (0.0%) |
| 60 to 64 Years | 28 (37.3%) | 0 (0.0%) |
| 65 to 74 Years | 13 (15.7%) | 0 (0.0%) |
| 75 Years and over | 6 (8.6%) | 0 (0.0%) |
| Total | 335 (48.7%) | 23 (6.9%) |
Employment Status by Educational Attainment in Camargo
According to labor force statistics for Camargo, 61.4% of individuals (280) out of the total population between 25 and 64 years of age (456) are in the labor force, with 8.2% or 23 of them being unemployed. The group with the highest labor force participation rate are those with the educational attainment of college / associate degree, with 80.8% or 105 individuals in the labor force. Within the labor force, individuals with less than high school education have the highest percentage of unemployment, with 50.0% or 8 of them being unemployed.
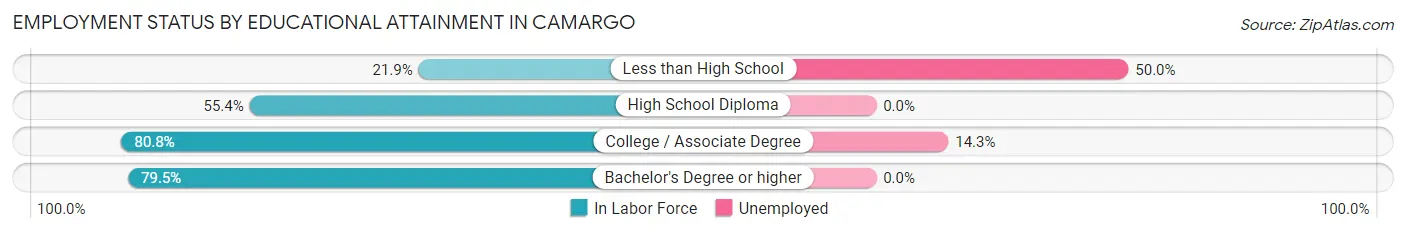
| Educational Attainment | In Labor Force | Unemployed |
| Less than High School | 16 (21.9%) | 36 (50.0%) |
| High School Diploma | 97 (55.4%) | 0 (0.0%) |
| College / Associate Degree | 105 (80.8%) | 19 (14.3%) |
| Bachelor's Degree or higher | 62 (79.5%) | 0 (0.0%) |
| Total | 280 (61.4%) | 37 (8.2%) |
Employment Occupations by Sex in Camargo
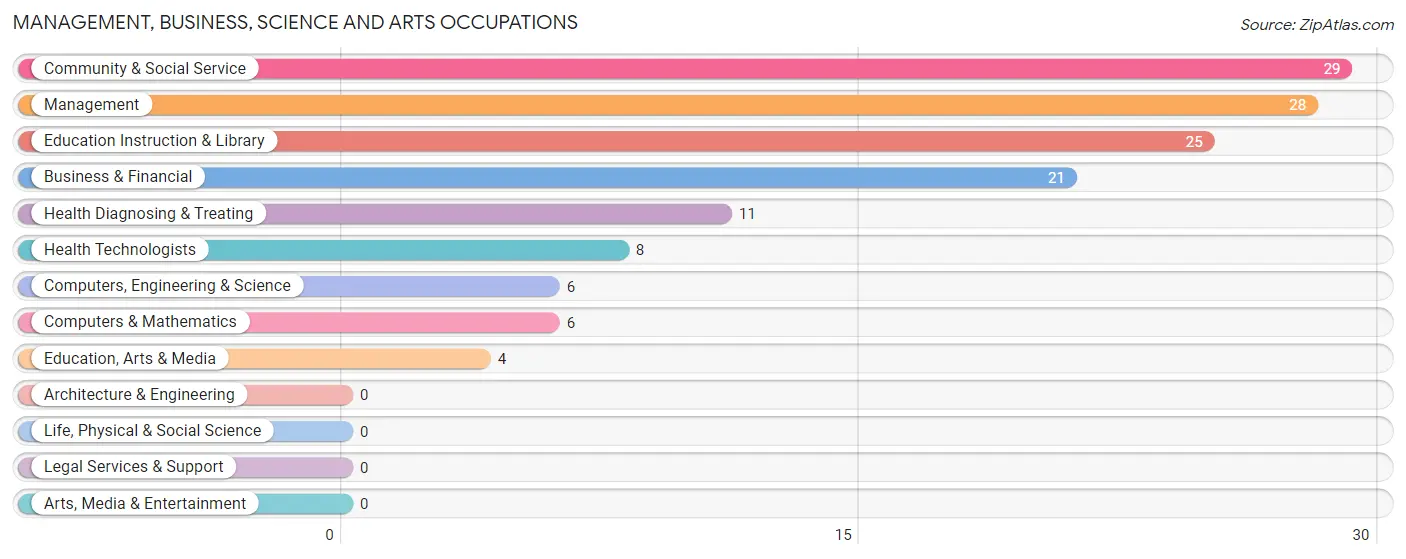
Management, Business, Science and Arts Occupations
The most common Management, Business, Science and Arts occupations in Camargo are Community & Social Service (29 | 9.3%), Management (28 | 9.0%), Education Instruction & Library (25 | 8.0%), Business & Financial (21 | 6.7%), and Health Diagnosing & Treating (11 | 3.5%).
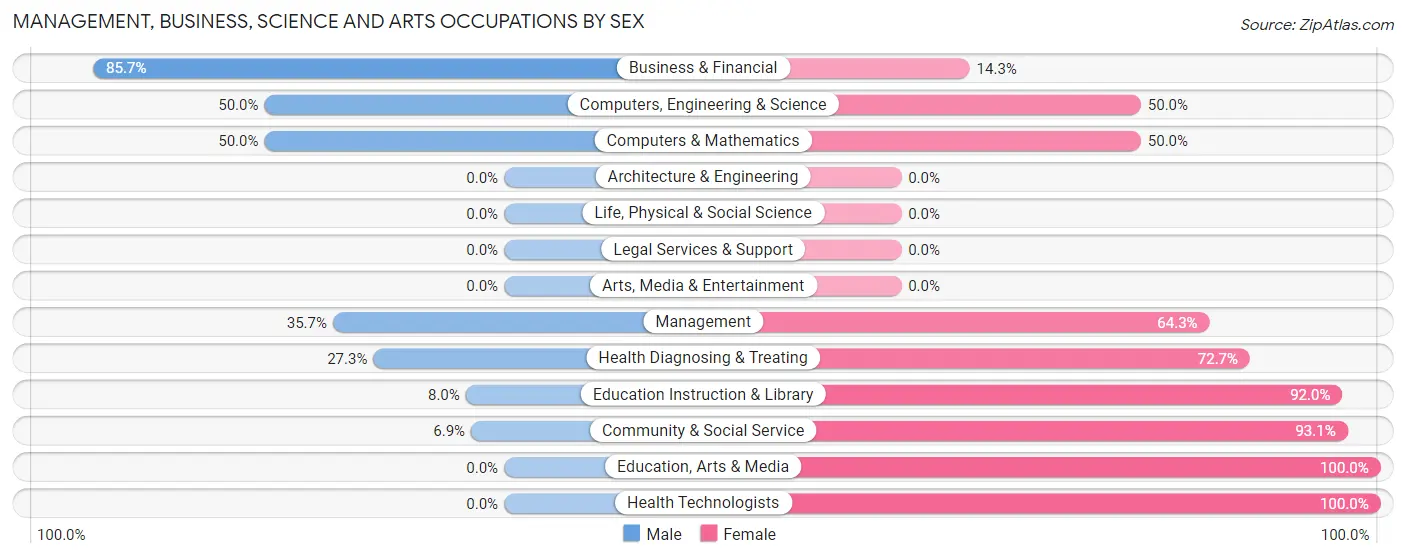
Management, Business, Science and Arts Occupations by Sex
Within the Management, Business, Science and Arts occupations in Camargo, the most male-oriented occupations are Business & Financial (85.7%), Computers, Engineering & Science (50.0%), and Computers & Mathematics (50.0%), while the most female-oriented occupations are Education, Arts & Media (100.0%), Health Technologists (100.0%), and Community & Social Service (93.1%).
| Occupation | Male | Female |
| Management | 10 (35.7%) | 18 (64.3%) |
| Business & Financial | 18 (85.7%) | 3 (14.3%) |
| Computers, Engineering & Science | 3 (50.0%) | 3 (50.0%) |
| Computers & Mathematics | 3 (50.0%) | 3 (50.0%) |
| Architecture & Engineering | 0 (0.0%) | 0 (0.0%) |
| Life, Physical & Social Science | 0 (0.0%) | 0 (0.0%) |
| Community & Social Service | 2 (6.9%) | 27 (93.1%) |
| Education, Arts & Media | 0 (0.0%) | 4 (100.0%) |
| Legal Services & Support | 0 (0.0%) | 0 (0.0%) |
| Education Instruction & Library | 2 (8.0%) | 23 (92.0%) |
| Arts, Media & Entertainment | 0 (0.0%) | 0 (0.0%) |
| Health Diagnosing & Treating | 3 (27.3%) | 8 (72.7%) |
| Health Technologists | 0 (0.0%) | 8 (100.0%) |
| Total (Category) | 36 (37.9%) | 59 (62.1%) |
| Total (Overall) | 157 (50.3%) | 155 (49.7%) |
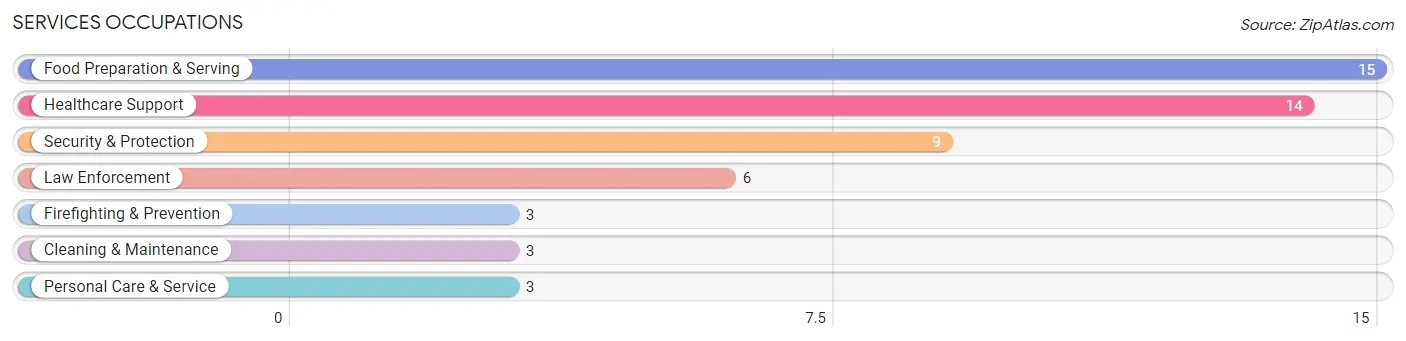
Services Occupations
The most common Services occupations in Camargo are Food Preparation & Serving (15 | 4.8%), Healthcare Support (14 | 4.5%), Security & Protection (9 | 2.9%), Law Enforcement (6 | 1.9%), and Firefighting & Prevention (3 | 1.0%).
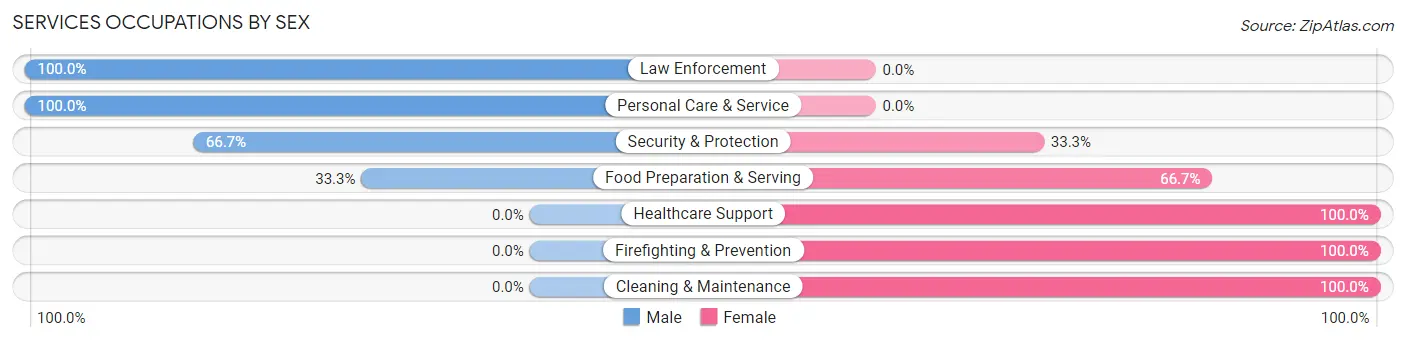
Services Occupations by Sex
Within the Services occupations in Camargo, the most male-oriented occupations are Law Enforcement (100.0%), Personal Care & Service (100.0%), and Security & Protection (66.7%), while the most female-oriented occupations are Healthcare Support (100.0%), Firefighting & Prevention (100.0%), and Cleaning & Maintenance (100.0%).
| Occupation | Male | Female |
| Healthcare Support | 0 (0.0%) | 14 (100.0%) |
| Security & Protection | 6 (66.7%) | 3 (33.3%) |
| Firefighting & Prevention | 0 (0.0%) | 3 (100.0%) |
| Law Enforcement | 6 (100.0%) | 0 (0.0%) |
| Food Preparation & Serving | 5 (33.3%) | 10 (66.7%) |
| Cleaning & Maintenance | 0 (0.0%) | 3 (100.0%) |
| Personal Care & Service | 3 (100.0%) | 0 (0.0%) |
| Total (Category) | 14 (31.8%) | 30 (68.2%) |
| Total (Overall) | 157 (50.3%) | 155 (49.7%) |
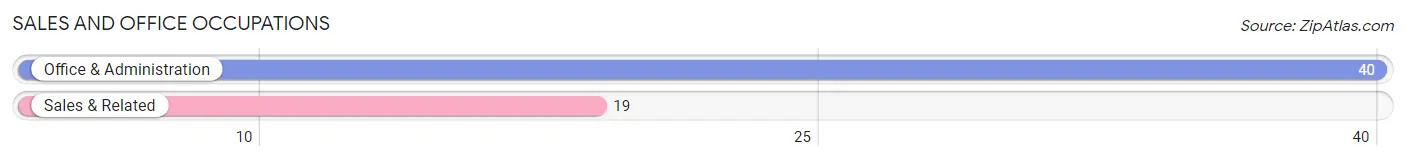
Sales and Office Occupations
The most common Sales and Office occupations in Camargo are Office & Administration (40 | 12.8%), and Sales & Related (19 | 6.1%).
Sales and Office Occupations by Sex
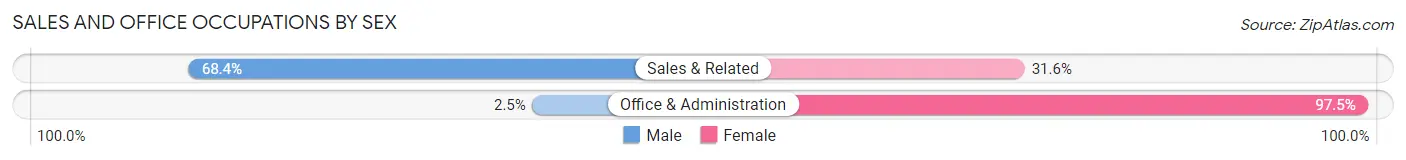
| Occupation | Male | Female |
| Sales & Related | 13 (68.4%) | 6 (31.6%) |
| Office & Administration | 1 (2.5%) | 39 (97.5%) |
| Total (Category) | 14 (23.7%) | 45 (76.3%) |
| Total (Overall) | 157 (50.3%) | 155 (49.7%) |
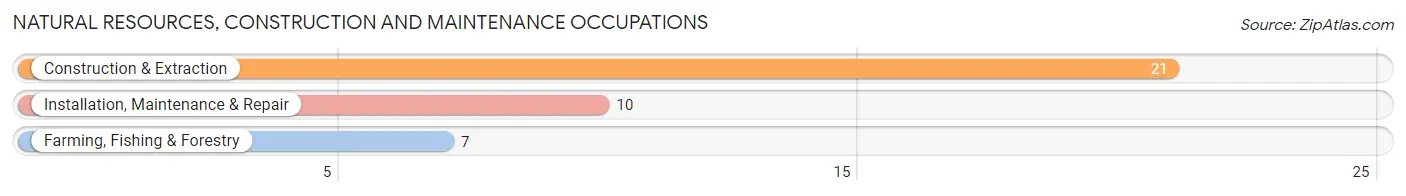
Natural Resources, Construction and Maintenance Occupations
The most common Natural Resources, Construction and Maintenance occupations in Camargo are Construction & Extraction (21 | 6.7%), Installation, Maintenance & Repair (10 | 3.2%), and Farming, Fishing & Forestry (7 | 2.2%).
Natural Resources, Construction and Maintenance Occupations by Sex
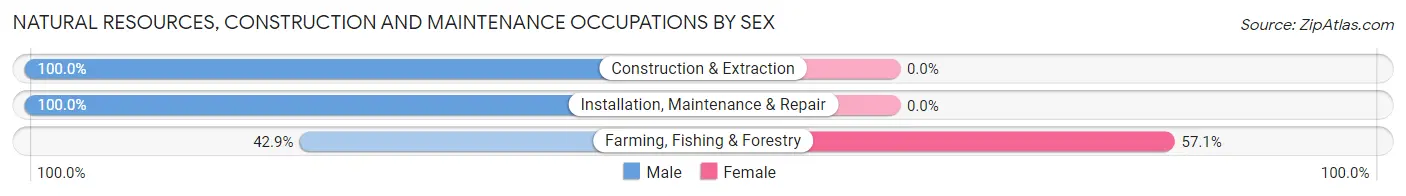
| Occupation | Male | Female |
| Farming, Fishing & Forestry | 3 (42.9%) | 4 (57.1%) |
| Construction & Extraction | 21 (100.0%) | 0 (0.0%) |
| Installation, Maintenance & Repair | 10 (100.0%) | 0 (0.0%) |
| Total (Category) | 34 (89.5%) | 4 (10.5%) |
| Total (Overall) | 157 (50.3%) | 155 (49.7%) |
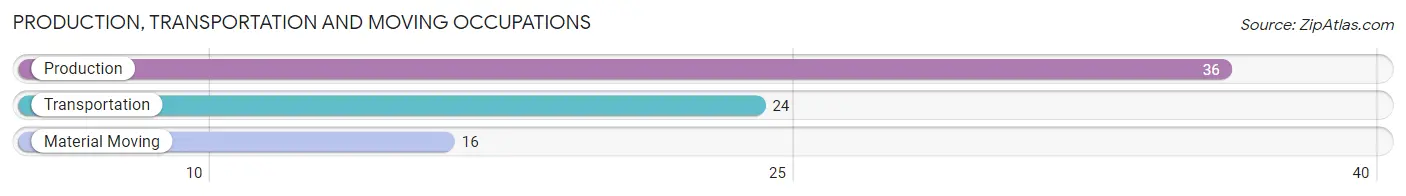
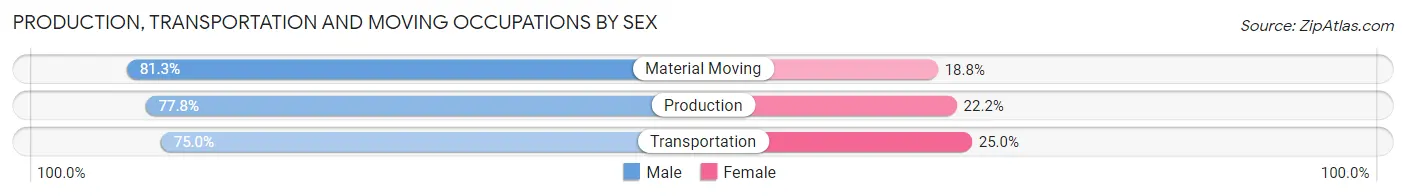
Production, Transportation and Moving Occupations
The most common Production, Transportation and Moving occupations in Camargo are Production (36 | 11.5%), Transportation (24 | 7.7%), and Material Moving (16 | 5.1%).
Production, Transportation and Moving Occupations by Sex
| Occupation | Male | Female |
| Production | 28 (77.8%) | 8 (22.2%) |
| Transportation | 18 (75.0%) | 6 (25.0%) |
| Material Moving | 13 (81.2%) | 3 (18.8%) |
| Total (Category) | 59 (77.6%) | 17 (22.4%) |
| Total (Overall) | 157 (50.3%) | 155 (49.7%) |
Employment Industries by Sex in Camargo
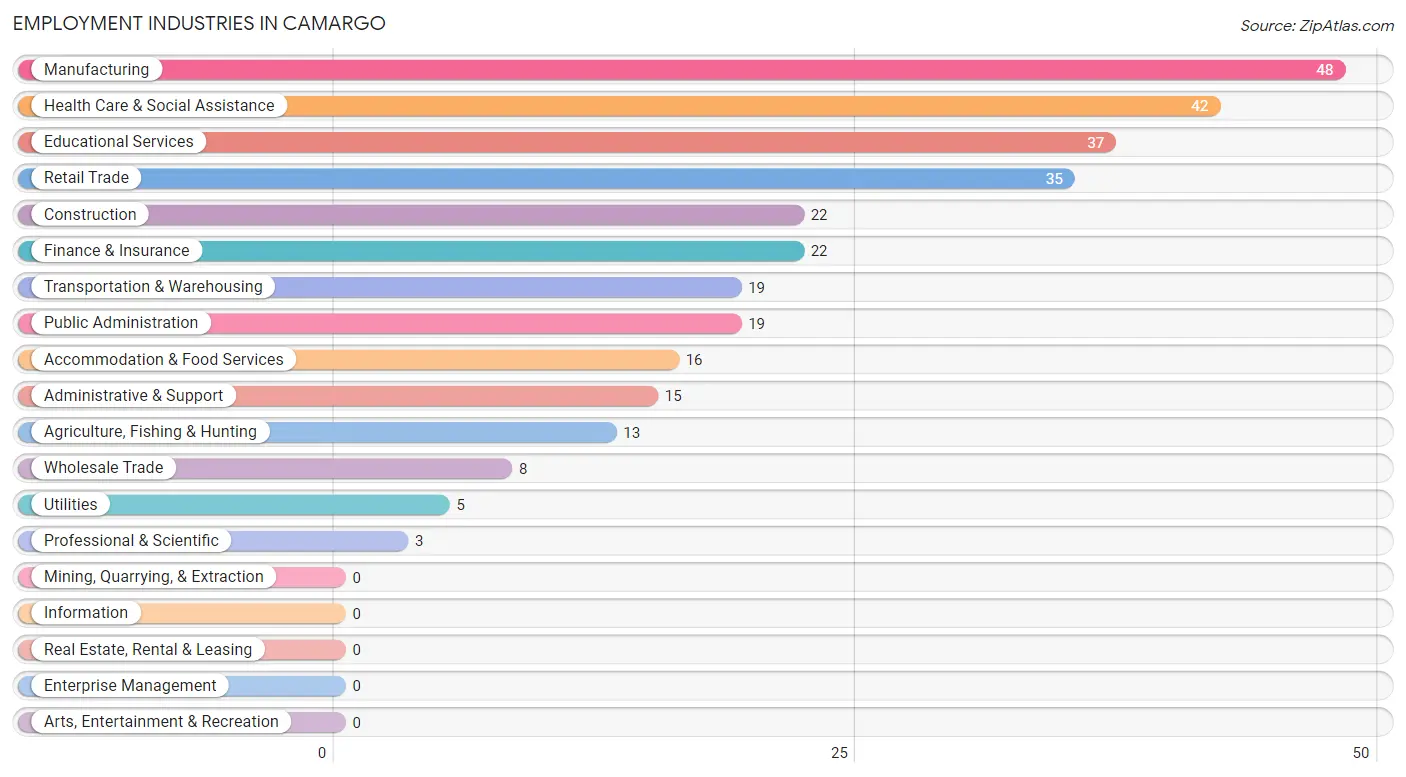
Employment Industries in Camargo
The major employment industries in Camargo include Manufacturing (48 | 15.4%), Health Care & Social Assistance (42 | 13.5%), Educational Services (37 | 11.9%), Retail Trade (35 | 11.2%), and Construction (22 | 7.0%).
Employment Industries by Sex in Camargo
The Camargo industries that see more men than women are Construction (100.0%), Wholesale Trade (100.0%), and Manufacturing (77.1%), whereas the industries that tend to have a higher number of women are Professional & Scientific (100.0%), Accommodation & Food Services (100.0%), and Health Care & Social Assistance (92.9%).
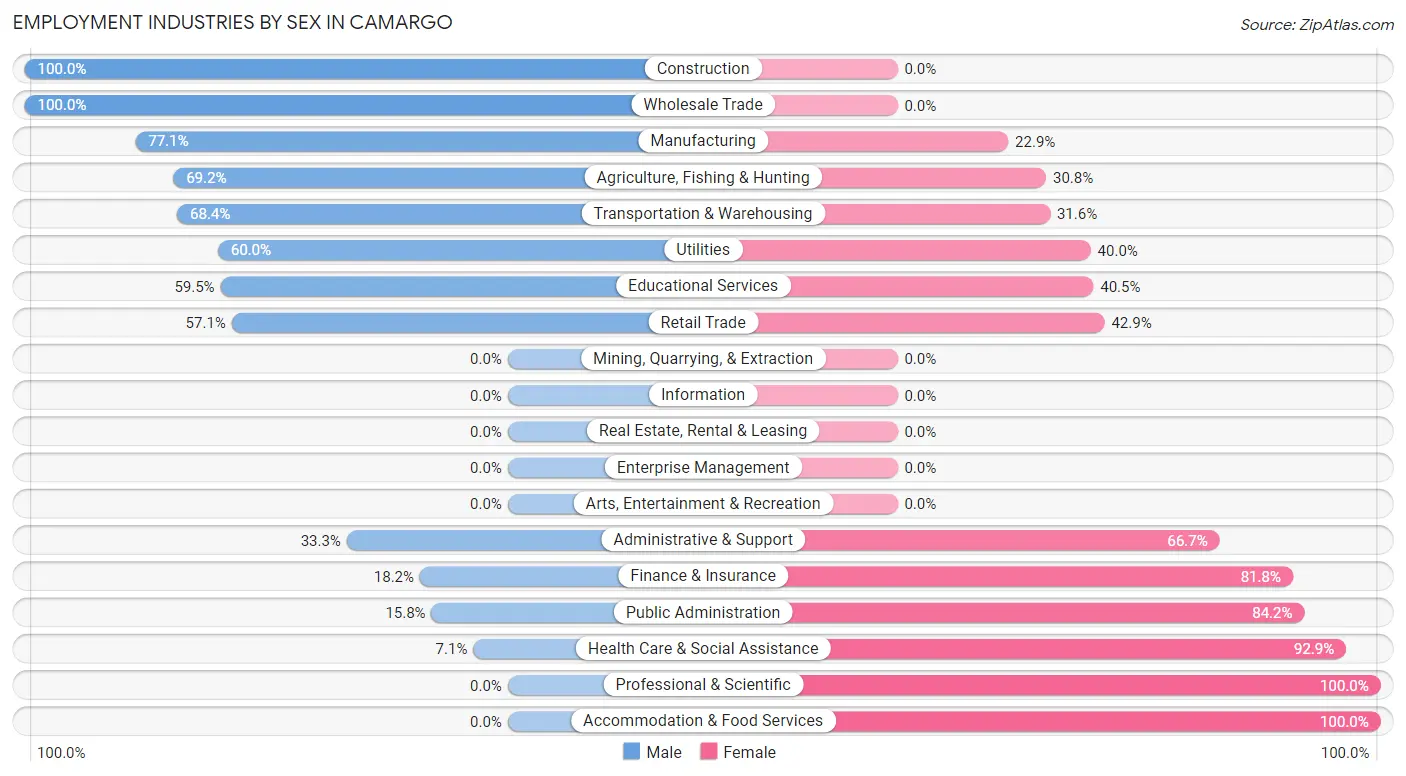
| Industry | Male | Female |
| Agriculture, Fishing & Hunting | 9 (69.2%) | 4 (30.8%) |
| Mining, Quarrying, & Extraction | 0 (0.0%) | 0 (0.0%) |
| Construction | 22 (100.0%) | 0 (0.0%) |
| Manufacturing | 37 (77.1%) | 11 (22.9%) |
| Wholesale Trade | 8 (100.0%) | 0 (0.0%) |
| Retail Trade | 20 (57.1%) | 15 (42.9%) |
| Transportation & Warehousing | 13 (68.4%) | 6 (31.6%) |
| Utilities | 3 (60.0%) | 2 (40.0%) |
| Information | 0 (0.0%) | 0 (0.0%) |
| Finance & Insurance | 4 (18.2%) | 18 (81.8%) |
| Real Estate, Rental & Leasing | 0 (0.0%) | 0 (0.0%) |
| Professional & Scientific | 0 (0.0%) | 3 (100.0%) |
| Enterprise Management | 0 (0.0%) | 0 (0.0%) |
| Administrative & Support | 5 (33.3%) | 10 (66.7%) |
| Educational Services | 22 (59.5%) | 15 (40.5%) |
| Health Care & Social Assistance | 3 (7.1%) | 39 (92.9%) |
| Arts, Entertainment & Recreation | 0 (0.0%) | 0 (0.0%) |
| Accommodation & Food Services | 0 (0.0%) | 16 (100.0%) |
| Public Administration | 3 (15.8%) | 16 (84.2%) |
| Total | 157 (50.3%) | 155 (49.7%) |
Education in Camargo
School Enrollment in Camargo
The most common levels of schooling among the 310 students in Camargo are elementary school (111 | 35.8%), middle school (77 | 24.8%), and high school (54 | 17.4%).
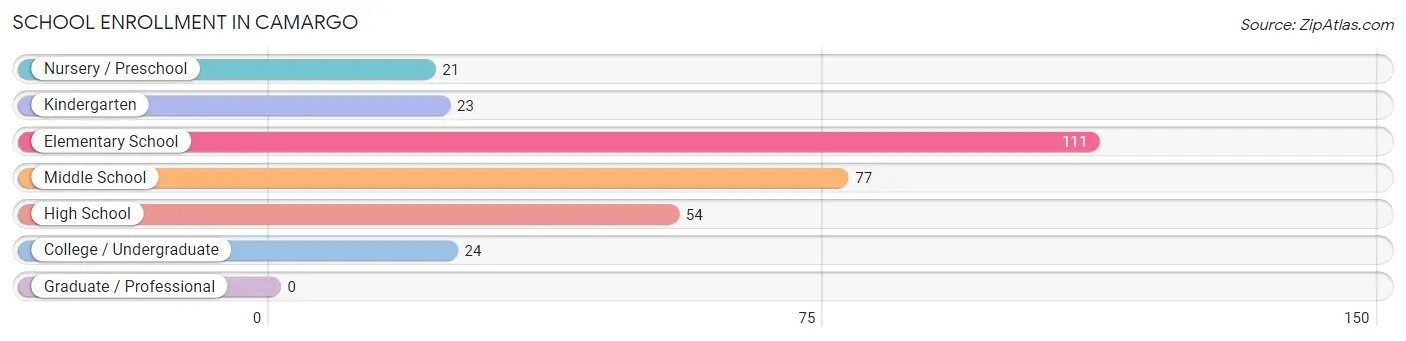
| School Level | # Students | % Students |
| Nursery / Preschool | 21 | 6.8% |
| Kindergarten | 23 | 7.4% |
| Elementary School | 111 | 35.8% |
| Middle School | 77 | 24.8% |
| High School | 54 | 17.4% |
| College / Undergraduate | 24 | 7.7% |
| Graduate / Professional | 0 | 0.0% |
| Total | 310 | 100.0% |
School Enrollment by Age by Funding Source in Camargo
Out of a total of 310 students who are enrolled in schools in Camargo, 26 (8.4%) attend a private institution, while the remaining 284 (91.6%) are enrolled in public schools. The age group of 3 to 4 year olds has the highest likelihood of being enrolled in private schools, with 7 (33.3% in the age bracket) enrolled. Conversely, the age group of 5 to 9 year old has the lowest likelihood of being enrolled in a private school, with 124 (100.0% in the age bracket) attending a public institution.
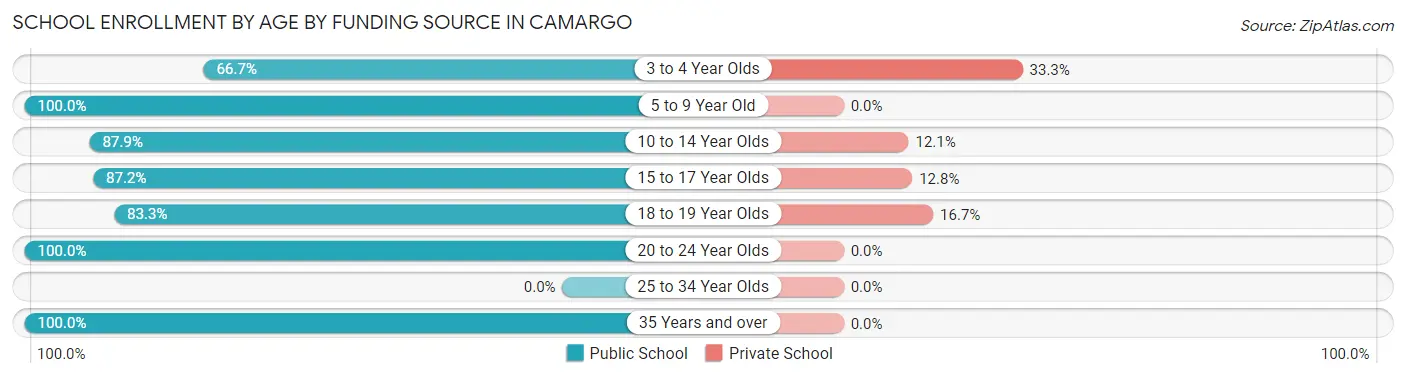
| Age Bracket | Public School | Private School |
| 3 to 4 Year Olds | 14 (66.7%) | 7 (33.3%) |
| 5 to 9 Year Old | 124 (100.0%) | 0 (0.0%) |
| 10 to 14 Year Olds | 80 (87.9%) | 11 (12.1%) |
| 15 to 17 Year Olds | 41 (87.2%) | 6 (12.8%) |
| 18 to 19 Year Olds | 10 (83.3%) | 2 (16.7%) |
| 20 to 24 Year Olds | 12 (100.0%) | 0 (0.0%) |
| 25 to 34 Year Olds | 0 (0.0%) | 0 (0.0%) |
| 35 Years and over | 3 (100.0%) | 0 (0.0%) |
| Total | 284 (91.6%) | 26 (8.4%) |
Educational Attainment by Field of Study in Camargo
Business (31 | 31.6%), social sciences (12 | 12.2%), bio, nature & agricultural (10 | 10.2%), science & technology (9 | 9.2%), and communications (8 | 8.2%) are the most common fields of study among 98 individuals in Camargo who have obtained a bachelor's degree or higher.
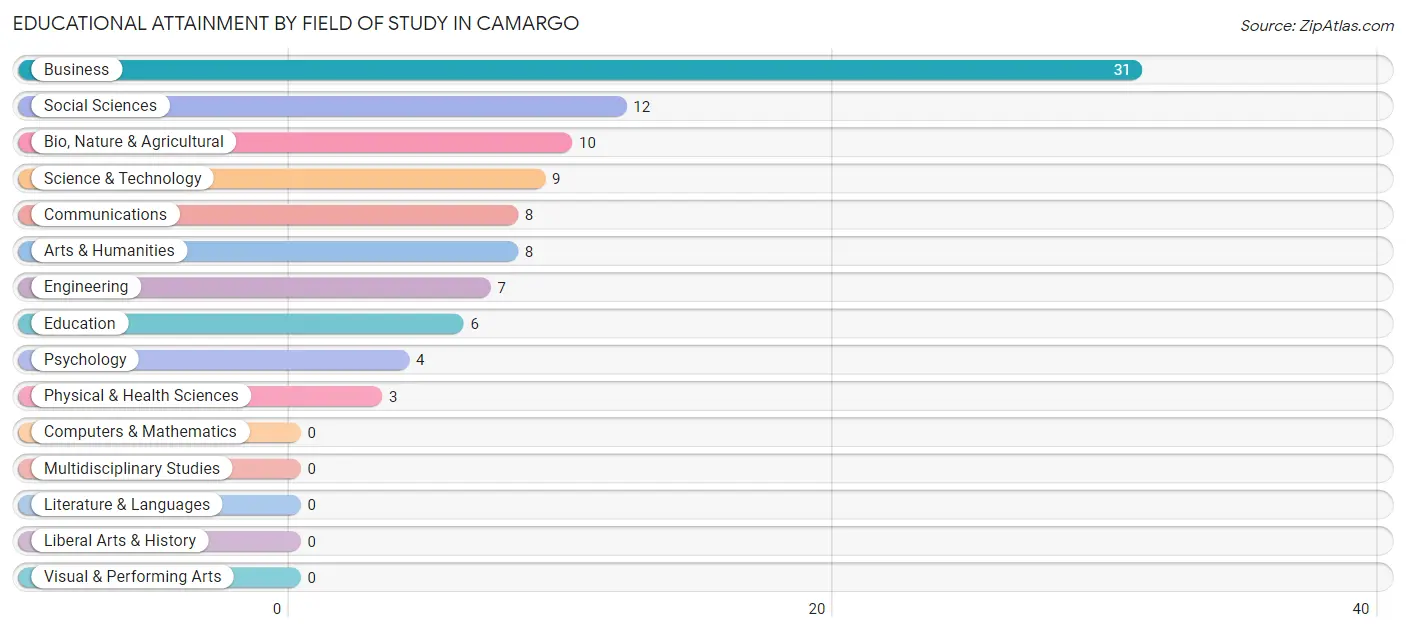
| Field of Study | # Graduates | % Graduates |
| Computers & Mathematics | 0 | 0.0% |
| Bio, Nature & Agricultural | 10 | 10.2% |
| Physical & Health Sciences | 3 | 3.1% |
| Psychology | 4 | 4.1% |
| Social Sciences | 12 | 12.2% |
| Engineering | 7 | 7.1% |
| Multidisciplinary Studies | 0 | 0.0% |
| Science & Technology | 9 | 9.2% |
| Business | 31 | 31.6% |
| Education | 6 | 6.1% |
| Literature & Languages | 0 | 0.0% |
| Liberal Arts & History | 0 | 0.0% |
| Visual & Performing Arts | 0 | 0.0% |
| Communications | 8 | 8.2% |
| Arts & Humanities | 8 | 8.2% |
| Total | 98 | 100.0% |
Transportation & Commute in Camargo
Vehicle Availability by Sex in Camargo
The most prevalent vehicle ownership categories in Camargo are males with 2 vehicles (70, accounting for 44.6%) and females with 2 vehicles (46, making up 45.8%).
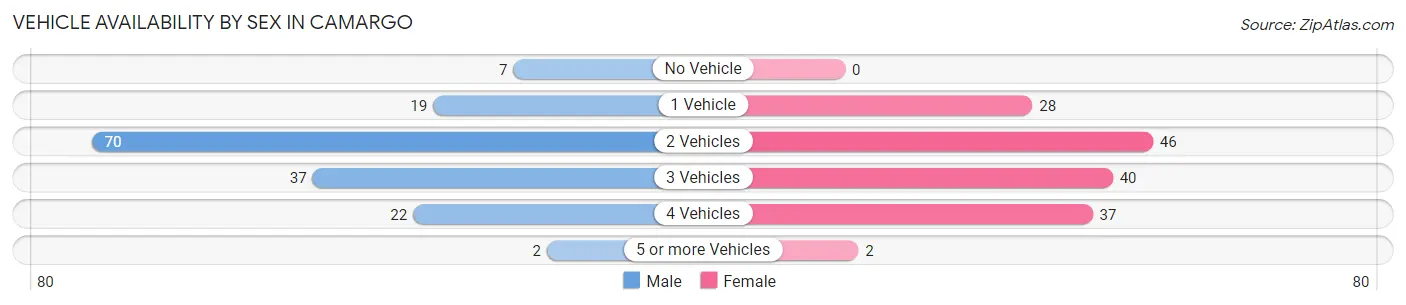
| Vehicles Available | Male | Female |
| No Vehicle | 7 (4.5%) | 0 (0.0%) |
| 1 Vehicle | 19 (12.1%) | 28 (18.3%) |
| 2 Vehicles | 70 (44.6%) | 46 (30.1%) |
| 3 Vehicles | 37 (23.6%) | 40 (26.1%) |
| 4 Vehicles | 22 (14.0%) | 37 (24.2%) |
| 5 or more Vehicles | 2 (1.3%) | 2 (1.3%) |
| Total | 157 (100.0%) | 153 (100.0%) |
Commute Time in Camargo
The most frequently occuring commute durations in Camargo are 10 to 14 minutes (48 commuters, 15.8%), less than 5 minutes (43 commuters, 14.1%), and 15 to 19 minutes (43 commuters, 14.1%).
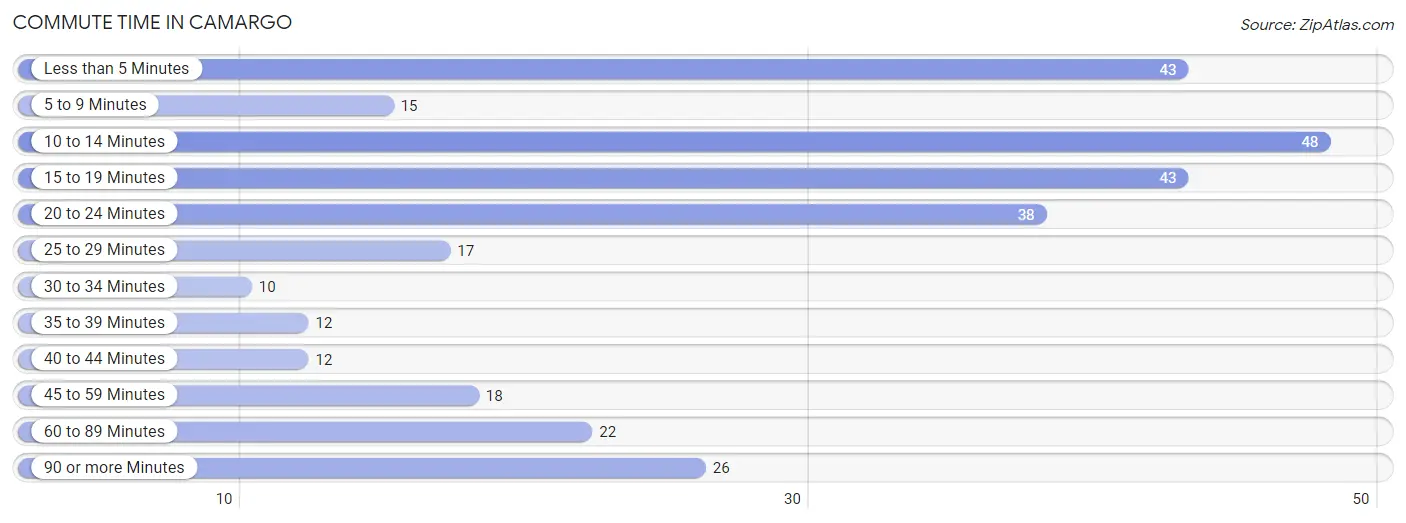
| Commute Time | # Commuters | % Commuters |
| Less than 5 Minutes | 43 | 14.1% |
| 5 to 9 Minutes | 15 | 4.9% |
| 10 to 14 Minutes | 48 | 15.8% |
| 15 to 19 Minutes | 43 | 14.1% |
| 20 to 24 Minutes | 38 | 12.5% |
| 25 to 29 Minutes | 17 | 5.6% |
| 30 to 34 Minutes | 10 | 3.3% |
| 35 to 39 Minutes | 12 | 4.0% |
| 40 to 44 Minutes | 12 | 4.0% |
| 45 to 59 Minutes | 18 | 5.9% |
| 60 to 89 Minutes | 22 | 7.2% |
| 90 or more Minutes | 26 | 8.6% |
Commute Time by Sex in Camargo
The most common commute times in Camargo are less than 5 minutes (29 commuters, 18.8%) for males and 10 to 14 minutes (34 commuters, 22.7%) for females.
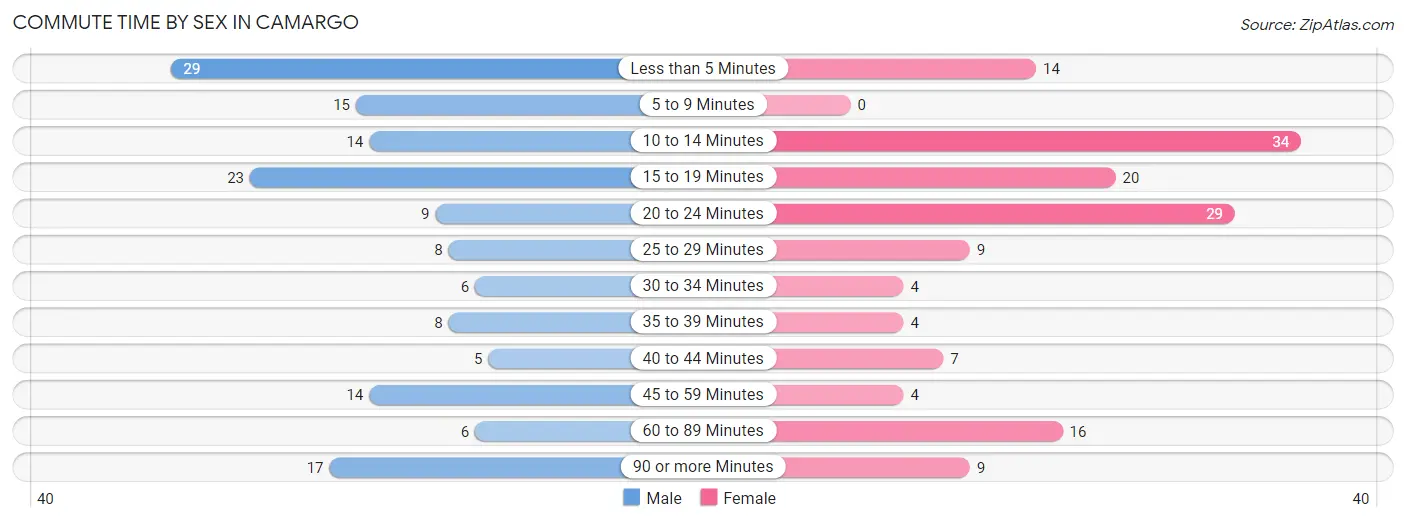
| Commute Time | Male | Female |
| Less than 5 Minutes | 29 (18.8%) | 14 (9.3%) |
| 5 to 9 Minutes | 15 (9.7%) | 0 (0.0%) |
| 10 to 14 Minutes | 14 (9.1%) | 34 (22.7%) |
| 15 to 19 Minutes | 23 (14.9%) | 20 (13.3%) |
| 20 to 24 Minutes | 9 (5.8%) | 29 (19.3%) |
| 25 to 29 Minutes | 8 (5.2%) | 9 (6.0%) |
| 30 to 34 Minutes | 6 (3.9%) | 4 (2.7%) |
| 35 to 39 Minutes | 8 (5.2%) | 4 (2.7%) |
| 40 to 44 Minutes | 5 (3.3%) | 7 (4.7%) |
| 45 to 59 Minutes | 14 (9.1%) | 4 (2.7%) |
| 60 to 89 Minutes | 6 (3.9%) | 16 (10.7%) |
| 90 or more Minutes | 17 (11.0%) | 9 (6.0%) |
Time of Departure to Work by Sex in Camargo
The most frequent times of departure to work in Camargo are 7:30 AM to 7:59 AM (32, 20.8%) for males and 4:00 PM to 11:59 PM (29, 19.3%) for females.
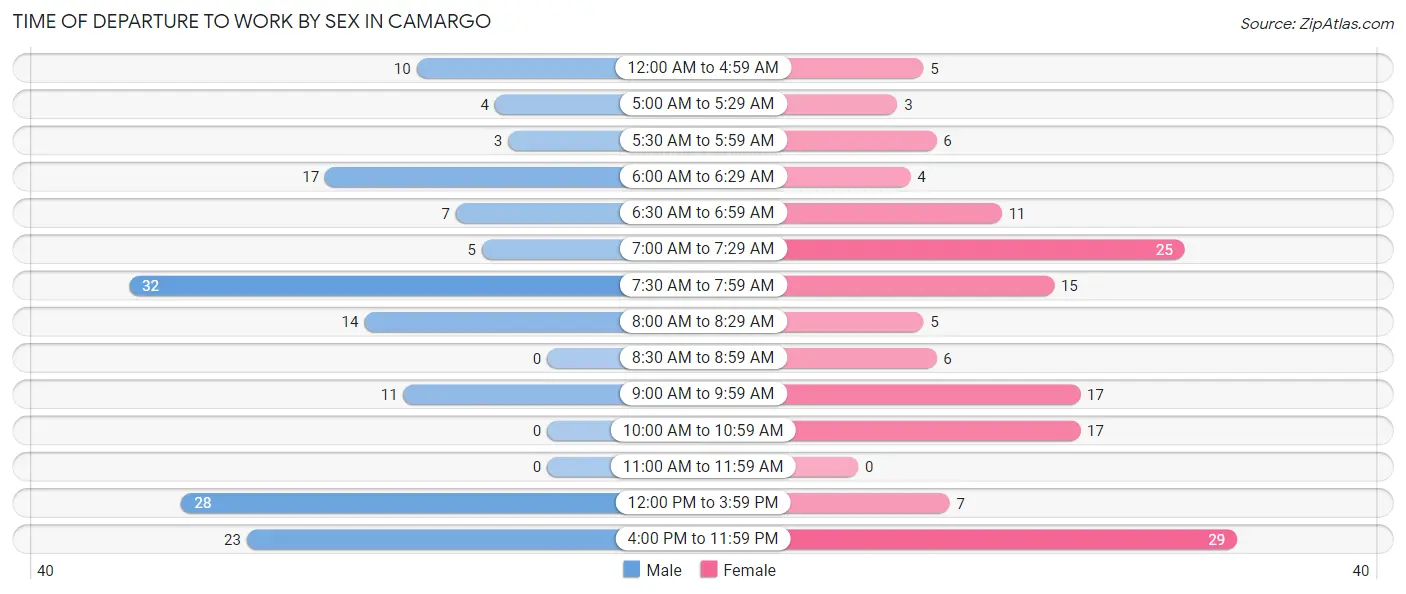
| Time of Departure | Male | Female |
| 12:00 AM to 4:59 AM | 10 (6.5%) | 5 (3.3%) |
| 5:00 AM to 5:29 AM | 4 (2.6%) | 3 (2.0%) |
| 5:30 AM to 5:59 AM | 3 (1.9%) | 6 (4.0%) |
| 6:00 AM to 6:29 AM | 17 (11.0%) | 4 (2.7%) |
| 6:30 AM to 6:59 AM | 7 (4.5%) | 11 (7.3%) |
| 7:00 AM to 7:29 AM | 5 (3.3%) | 25 (16.7%) |
| 7:30 AM to 7:59 AM | 32 (20.8%) | 15 (10.0%) |
| 8:00 AM to 8:29 AM | 14 (9.1%) | 5 (3.3%) |
| 8:30 AM to 8:59 AM | 0 (0.0%) | 6 (4.0%) |
| 9:00 AM to 9:59 AM | 11 (7.1%) | 17 (11.3%) |
| 10:00 AM to 10:59 AM | 0 (0.0%) | 17 (11.3%) |
| 11:00 AM to 11:59 AM | 0 (0.0%) | 0 (0.0%) |
| 12:00 PM to 3:59 PM | 28 (18.2%) | 7 (4.7%) |
| 4:00 PM to 11:59 PM | 23 (14.9%) | 29 (19.3%) |
| Total | 154 (100.0%) | 150 (100.0%) |
Housing Occupancy in Camargo
Occupancy by Ownership in Camargo
Of the total 330 dwellings in Camargo, owner-occupied units account for 238 (72.1%), while renter-occupied units make up 92 (27.9%).
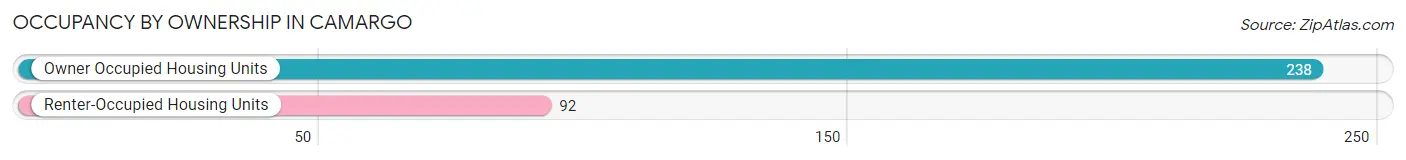
| Occupancy | # Housing Units | % Housing Units |
| Owner Occupied Housing Units | 238 | 72.1% |
| Renter-Occupied Housing Units | 92 | 27.9% |
| Total Occupied Housing Units | 330 | 100.0% |
Occupancy by Household Size in Camargo
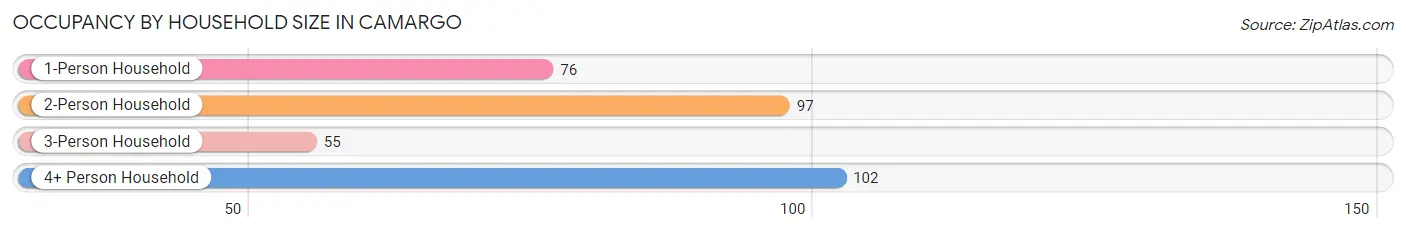
| Household Size | # Housing Units | % Housing Units |
| 1-Person Household | 76 | 23.0% |
| 2-Person Household | 97 | 29.4% |
| 3-Person Household | 55 | 16.7% |
| 4+ Person Household | 102 | 30.9% |
| Total Housing Units | 330 | 100.0% |
Occupancy by Ownership by Household Size in Camargo
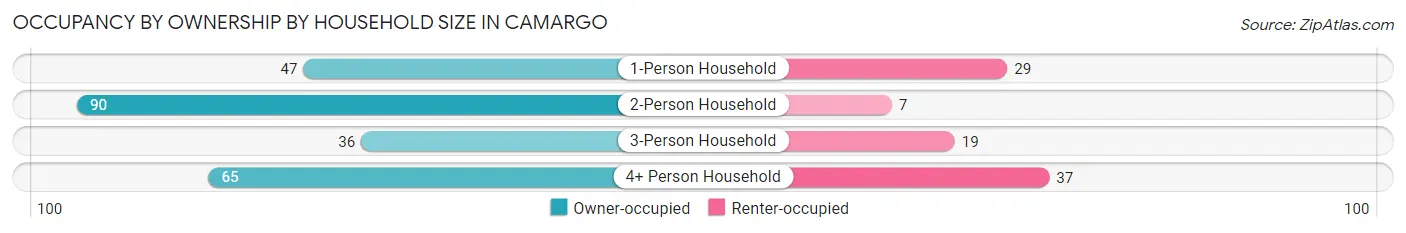
| Household Size | Owner-occupied | Renter-occupied |
| 1-Person Household | 47 (61.8%) | 29 (38.2%) |
| 2-Person Household | 90 (92.8%) | 7 (7.2%) |
| 3-Person Household | 36 (65.4%) | 19 (34.5%) |
| 4+ Person Household | 65 (63.7%) | 37 (36.3%) |
| Total Housing Units | 238 (72.1%) | 92 (27.9%) |
Occupancy by Educational Attainment in Camargo
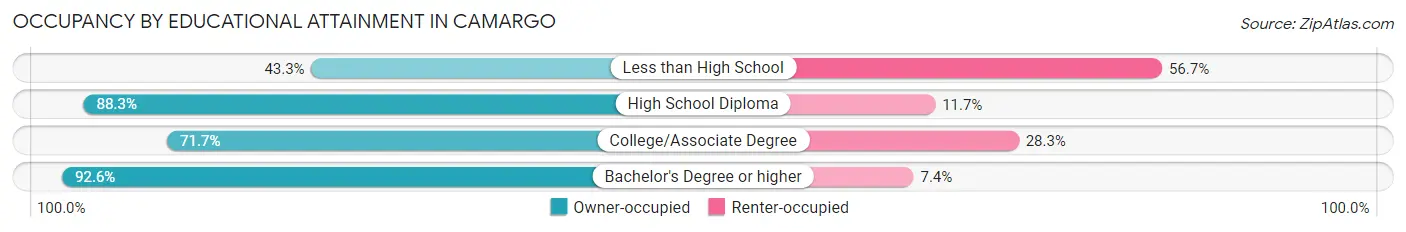
| Household Size | Owner-occupied | Renter-occupied |
| Less than High School | 39 (43.3%) | 51 (56.7%) |
| High School Diploma | 83 (88.3%) | 11 (11.7%) |
| College/Associate Degree | 66 (71.7%) | 26 (28.3%) |
| Bachelor's Degree or higher | 50 (92.6%) | 4 (7.4%) |
Occupancy by Age of Householder in Camargo
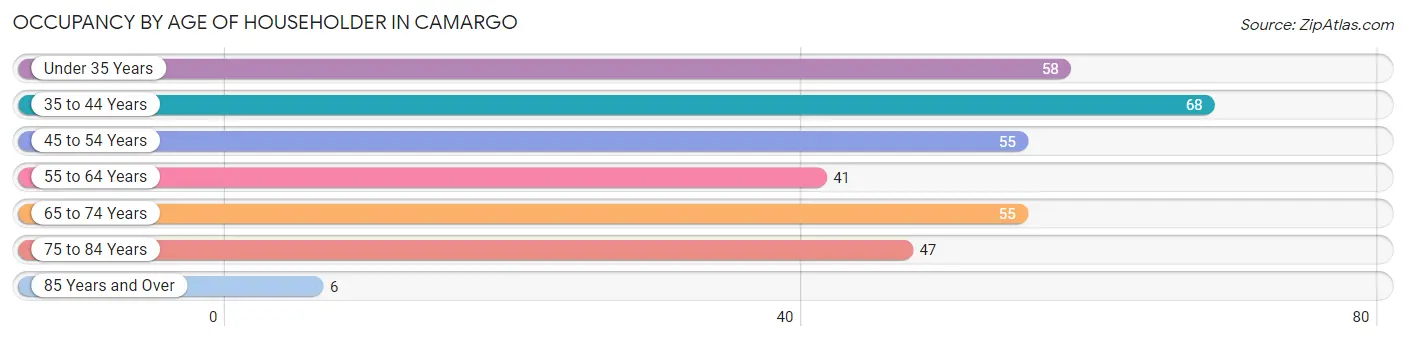
| Age Bracket | # Households | % Households |
| Under 35 Years | 58 | 17.6% |
| 35 to 44 Years | 68 | 20.6% |
| 45 to 54 Years | 55 | 16.7% |
| 55 to 64 Years | 41 | 12.4% |
| 65 to 74 Years | 55 | 16.7% |
| 75 to 84 Years | 47 | 14.2% |
| 85 Years and Over | 6 | 1.8% |
| Total | 330 | 100.0% |
Housing Finances in Camargo
Median Income by Occupancy in Camargo
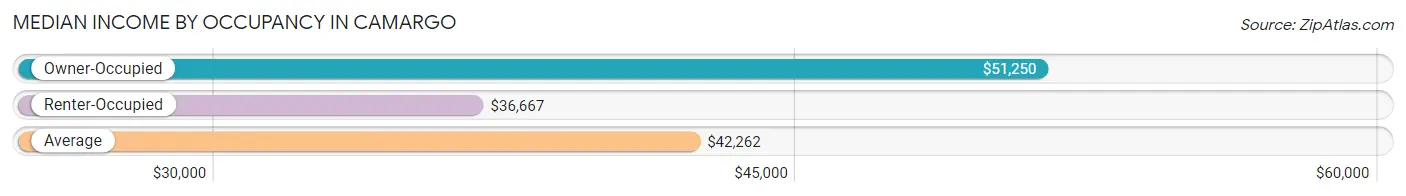
| Occupancy Type | # Households | Median Income |
| Owner-Occupied | 238 (72.1%) | $51,250 |
| Renter-Occupied | 92 (27.9%) | $36,667 |
| Average | 330 (100.0%) | $42,262 |
Occupancy by Householder Income Bracket in Camargo
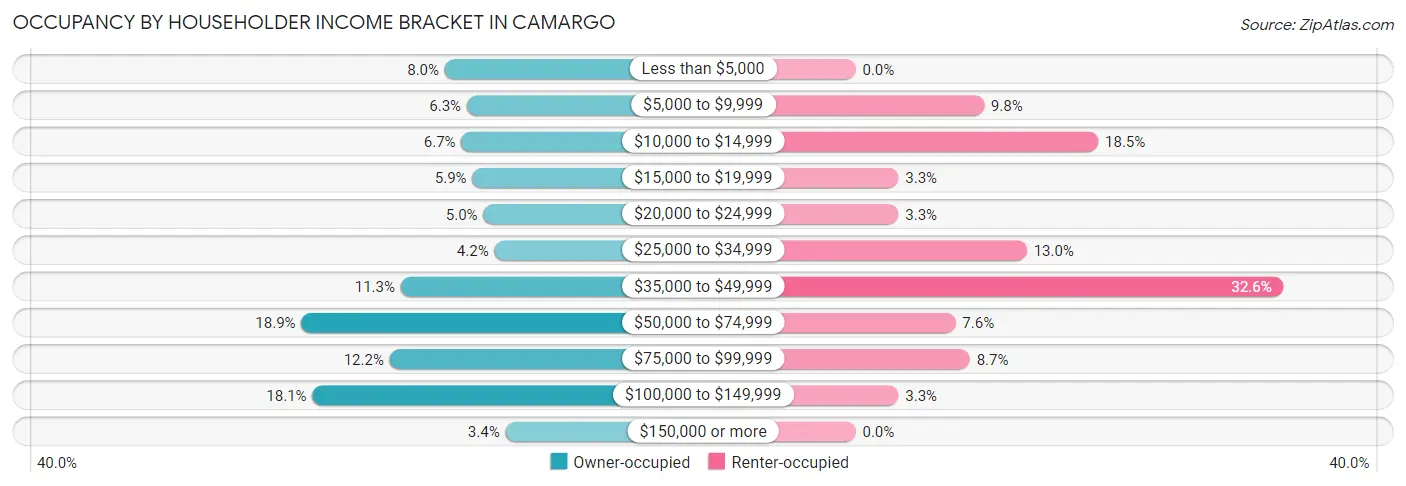
| Income Bracket | Owner-occupied | Renter-occupied |
| Less than $5,000 | 19 (8.0%) | 0 (0.0%) |
| $5,000 to $9,999 | 15 (6.3%) | 9 (9.8%) |
| $10,000 to $14,999 | 16 (6.7%) | 17 (18.5%) |
| $15,000 to $19,999 | 14 (5.9%) | 3 (3.3%) |
| $20,000 to $24,999 | 12 (5.0%) | 3 (3.3%) |
| $25,000 to $34,999 | 10 (4.2%) | 12 (13.0%) |
| $35,000 to $49,999 | 27 (11.3%) | 30 (32.6%) |
| $50,000 to $74,999 | 45 (18.9%) | 7 (7.6%) |
| $75,000 to $99,999 | 29 (12.2%) | 8 (8.7%) |
| $100,000 to $149,999 | 43 (18.1%) | 3 (3.3%) |
| $150,000 or more | 8 (3.4%) | 0 (0.0%) |
| Total | 238 (100.0%) | 92 (100.0%) |
Monthly Housing Cost Tiers in Camargo
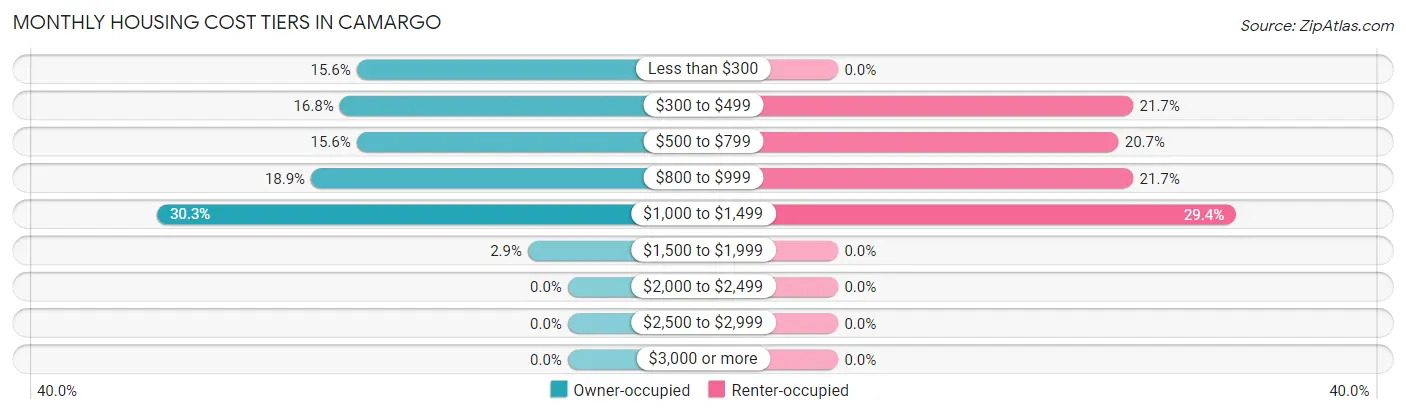
| Monthly Cost | Owner-occupied | Renter-occupied |
| Less than $300 | 37 (15.5%) | 0 (0.0%) |
| $300 to $499 | 40 (16.8%) | 20 (21.7%) |
| $500 to $799 | 37 (15.5%) | 19 (20.6%) |
| $800 to $999 | 45 (18.9%) | 20 (21.7%) |
| $1,000 to $1,499 | 72 (30.2%) | 27 (29.3%) |
| $1,500 to $1,999 | 7 (2.9%) | 0 (0.0%) |
| $2,000 to $2,499 | 0 (0.0%) | 0 (0.0%) |
| $2,500 to $2,999 | 0 (0.0%) | 0 (0.0%) |
| $3,000 or more | 0 (0.0%) | 0 (0.0%) |
| Total | 238 (100.0%) | 92 (100.0%) |
Physical Housing Characteristics in Camargo
Housing Structures in Camargo
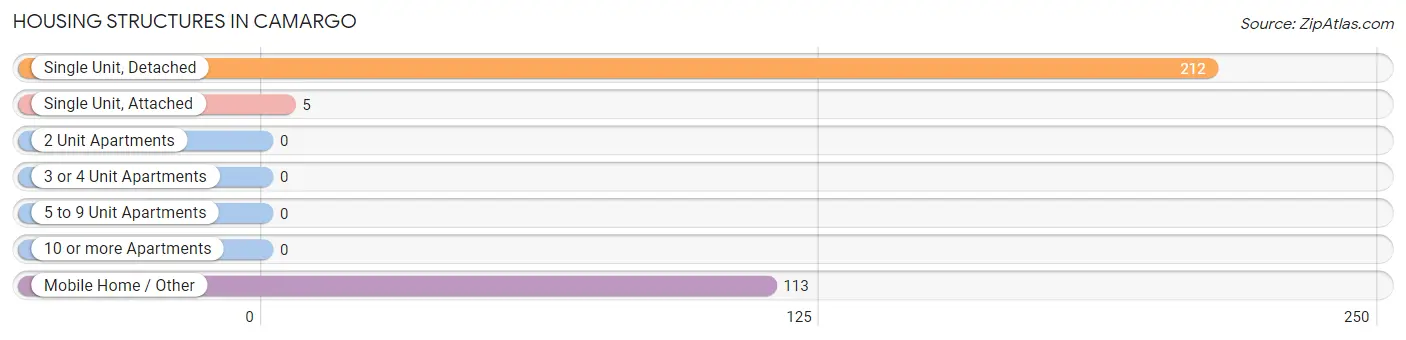
| Structure Type | # Housing Units | % Housing Units |
| Single Unit, Detached | 212 | 64.2% |
| Single Unit, Attached | 5 | 1.5% |
| 2 Unit Apartments | 0 | 0.0% |
| 3 or 4 Unit Apartments | 0 | 0.0% |
| 5 to 9 Unit Apartments | 0 | 0.0% |
| 10 or more Apartments | 0 | 0.0% |
| Mobile Home / Other | 113 | 34.2% |
| Total | 330 | 100.0% |
Housing Structures by Occupancy in Camargo
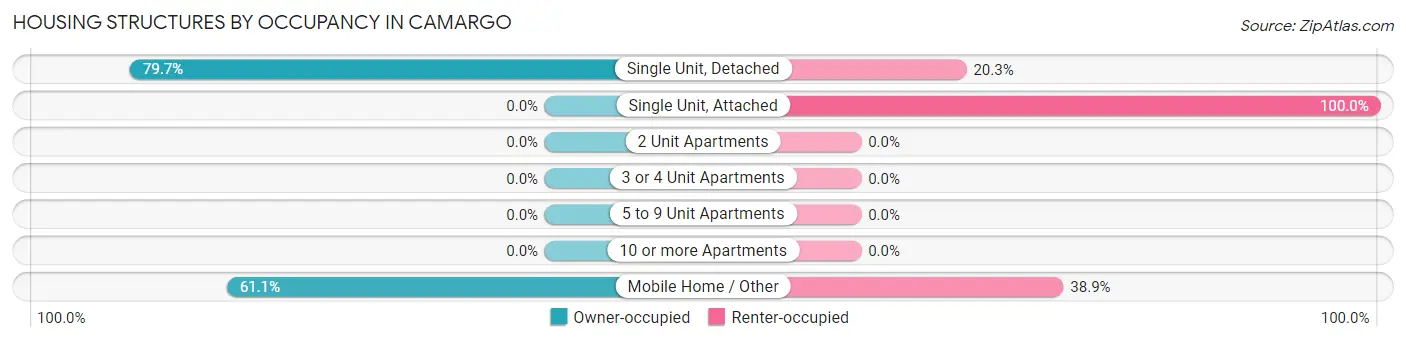
| Structure Type | Owner-occupied | Renter-occupied |
| Single Unit, Detached | 169 (79.7%) | 43 (20.3%) |
| Single Unit, Attached | 0 (0.0%) | 5 (100.0%) |
| 2 Unit Apartments | 0 (0.0%) | 0 (0.0%) |
| 3 or 4 Unit Apartments | 0 (0.0%) | 0 (0.0%) |
| 5 to 9 Unit Apartments | 0 (0.0%) | 0 (0.0%) |
| 10 or more Apartments | 0 (0.0%) | 0 (0.0%) |
| Mobile Home / Other | 69 (61.1%) | 44 (38.9%) |
| Total | 238 (72.1%) | 92 (27.9%) |
Housing Structures by Number of Rooms in Camargo
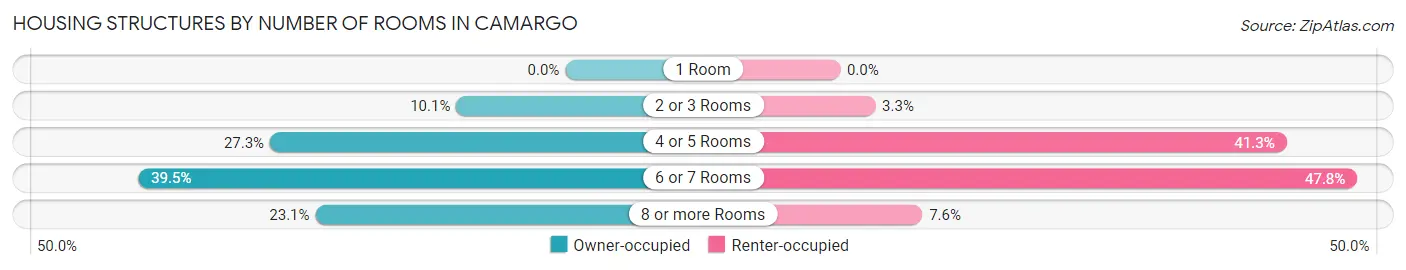
| Number of Rooms | Owner-occupied | Renter-occupied |
| 1 Room | 0 (0.0%) | 0 (0.0%) |
| 2 or 3 Rooms | 24 (10.1%) | 3 (3.3%) |
| 4 or 5 Rooms | 65 (27.3%) | 38 (41.3%) |
| 6 or 7 Rooms | 94 (39.5%) | 44 (47.8%) |
| 8 or more Rooms | 55 (23.1%) | 7 (7.6%) |
| Total | 238 (100.0%) | 92 (100.0%) |
Housing Structure by Heating Type in Camargo
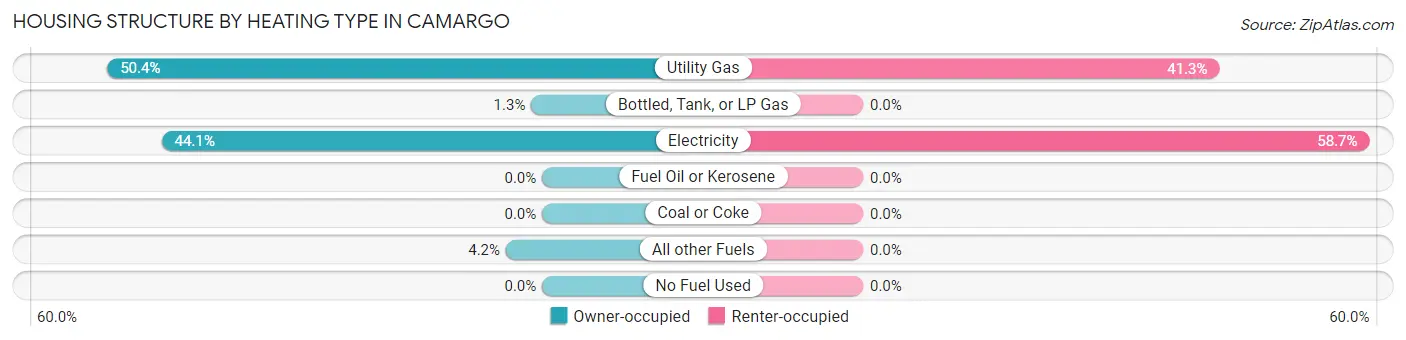
| Heating Type | Owner-occupied | Renter-occupied |
| Utility Gas | 120 (50.4%) | 38 (41.3%) |
| Bottled, Tank, or LP Gas | 3 (1.3%) | 0 (0.0%) |
| Electricity | 105 (44.1%) | 54 (58.7%) |
| Fuel Oil or Kerosene | 0 (0.0%) | 0 (0.0%) |
| Coal or Coke | 0 (0.0%) | 0 (0.0%) |
| All other Fuels | 10 (4.2%) | 0 (0.0%) |
| No Fuel Used | 0 (0.0%) | 0 (0.0%) |
| Total | 238 (100.0%) | 92 (100.0%) |
Household Vehicle Usage in Camargo
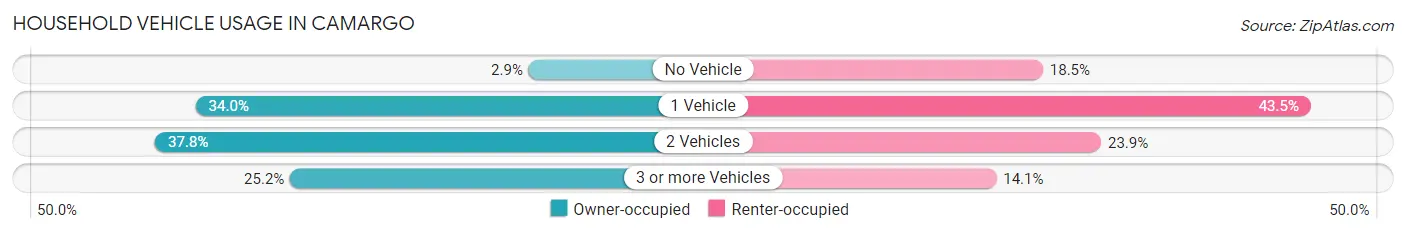
| Vehicles per Household | Owner-occupied | Renter-occupied |
| No Vehicle | 7 (2.9%) | 17 (18.5%) |
| 1 Vehicle | 81 (34.0%) | 40 (43.5%) |
| 2 Vehicles | 90 (37.8%) | 22 (23.9%) |
| 3 or more Vehicles | 60 (25.2%) | 13 (14.1%) |
| Total | 238 (100.0%) | 92 (100.0%) |
Real Estate & Mortgages in Camargo
Real Estate and Mortgage Overview in Camargo
| Characteristic | Without Mortgage | With Mortgage |
| Housing Units | 124 | 114 |
| Median Property Value | $75,500 | $137,500 |
| Median Household Income | - | - |
| Monthly Housing Costs | $425 | $0 |
| Real Estate Taxes | $565 | $15 |
Property Value by Mortgage Status in Camargo
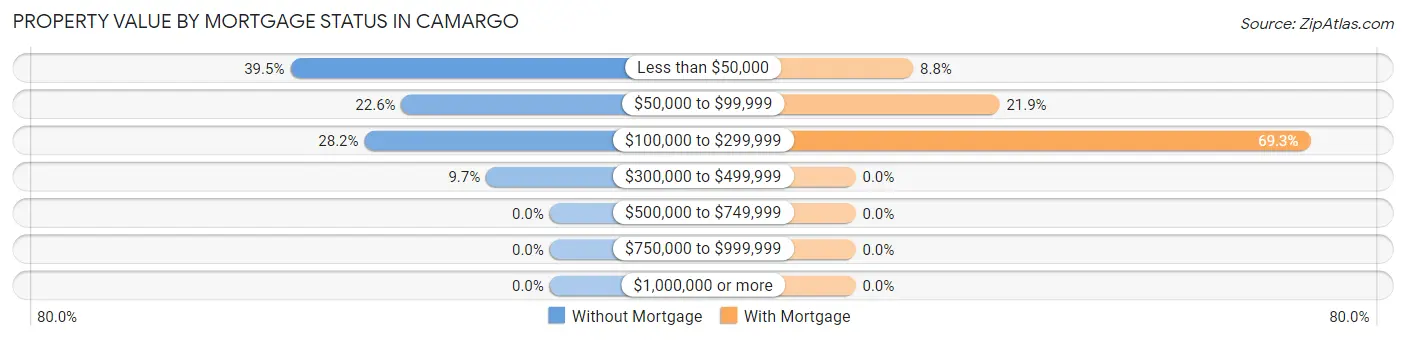
| Property Value | Without Mortgage | With Mortgage |
| Less than $50,000 | 49 (39.5%) | 10 (8.8%) |
| $50,000 to $99,999 | 28 (22.6%) | 25 (21.9%) |
| $100,000 to $299,999 | 35 (28.2%) | 79 (69.3%) |
| $300,000 to $499,999 | 12 (9.7%) | 0 (0.0%) |
| $500,000 to $749,999 | 0 (0.0%) | 0 (0.0%) |
| $750,000 to $999,999 | 0 (0.0%) | 0 (0.0%) |
| $1,000,000 or more | 0 (0.0%) | 0 (0.0%) |
| Total | 124 (100.0%) | 114 (100.0%) |
Household Income by Mortgage Status in Camargo
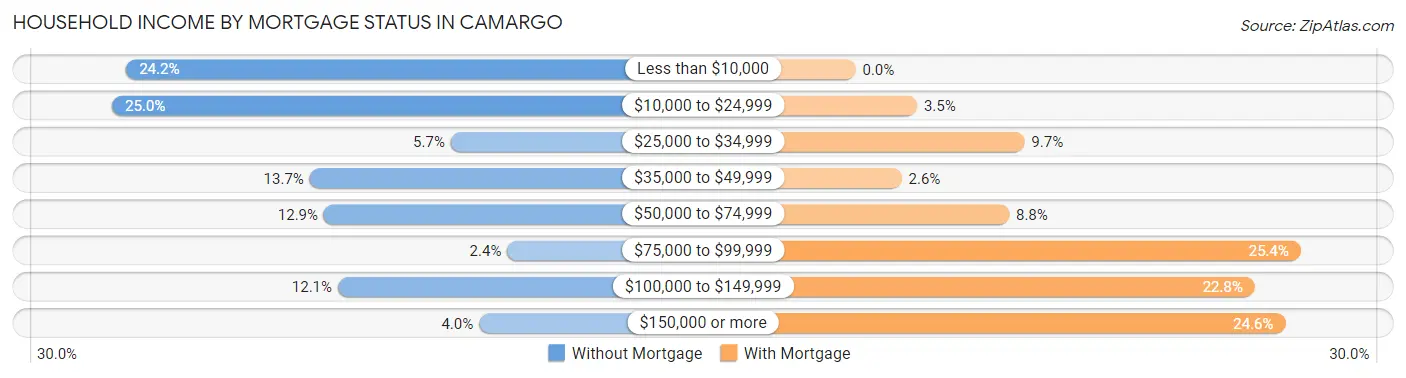
| Household Income | Without Mortgage | With Mortgage |
| Less than $10,000 | 30 (24.2%) | 0 (0.0%) |
| $10,000 to $24,999 | 31 (25.0%) | 4 (3.5%) |
| $25,000 to $34,999 | 7 (5.7%) | 11 (9.7%) |
| $35,000 to $49,999 | 17 (13.7%) | 3 (2.6%) |
| $50,000 to $74,999 | 16 (12.9%) | 10 (8.8%) |
| $75,000 to $99,999 | 3 (2.4%) | 29 (25.4%) |
| $100,000 to $149,999 | 15 (12.1%) | 26 (22.8%) |
| $150,000 or more | 5 (4.0%) | 28 (24.6%) |
| Total | 124 (100.0%) | 114 (100.0%) |
Property Value to Household Income Ratio in Camargo
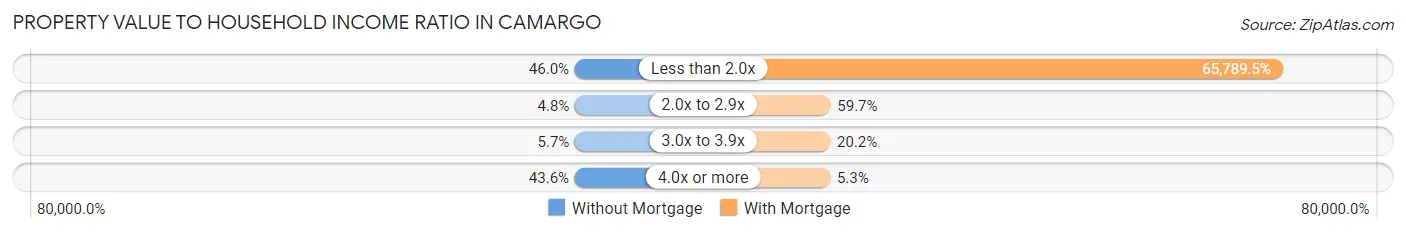
| Value-to-Income Ratio | Without Mortgage | With Mortgage |
| Less than 2.0x | 57 (46.0%) | 75,000 (65,789.5%) |
| 2.0x to 2.9x | 6 (4.8%) | 68 (59.7%) |
| 3.0x to 3.9x | 7 (5.7%) | 23 (20.2%) |
| 4.0x or more | 54 (43.5%) | 6 (5.3%) |
| Total | 124 (100.0%) | 114 (100.0%) |
Real Estate Taxes by Mortgage Status in Camargo
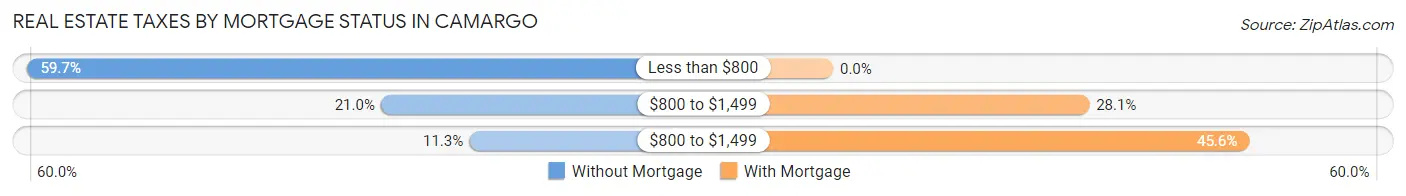
| Property Taxes | Without Mortgage | With Mortgage |
| Less than $800 | 74 (59.7%) | 0 (0.0%) |
| $800 to $1,499 | 26 (21.0%) | 32 (28.1%) |
| $800 to $1,499 | 14 (11.3%) | 52 (45.6%) |
| Total | 124 (100.0%) | 114 (100.0%) |
Health & Disability in Camargo
Health Insurance Coverage by Age in Camargo
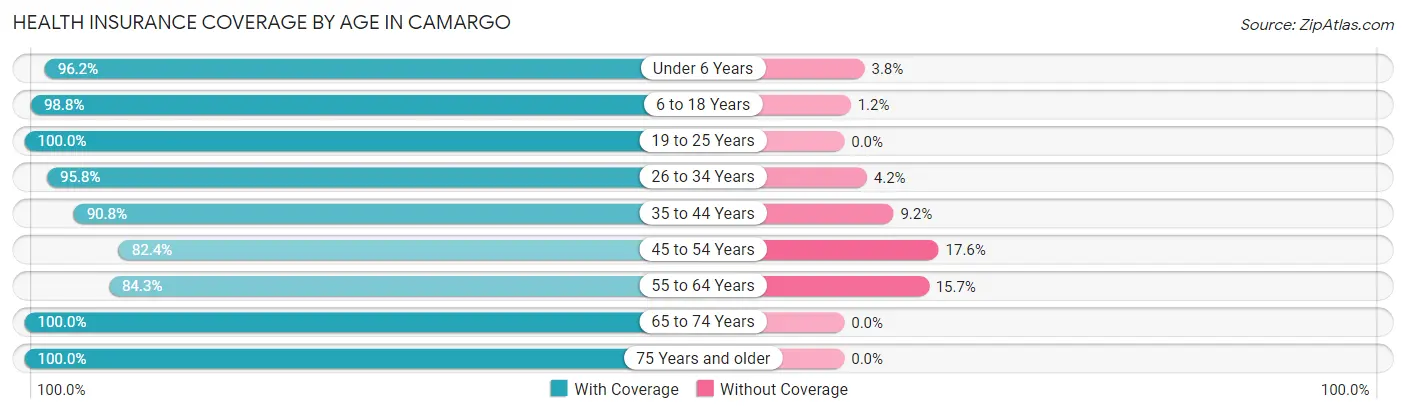
| Age Bracket | With Coverage | Without Coverage |
| Under 6 Years | 102 (96.2%) | 4 (3.8%) |
| 6 to 18 Years | 246 (98.8%) | 3 (1.2%) |
| 19 to 25 Years | 66 (100.0%) | 0 (0.0%) |
| 26 to 34 Years | 114 (95.8%) | 5 (4.2%) |
| 35 to 44 Years | 99 (90.8%) | 10 (9.2%) |
| 45 to 54 Years | 89 (82.4%) | 19 (17.6%) |
| 55 to 64 Years | 91 (84.3%) | 17 (15.7%) |
| 65 to 74 Years | 83 (100.0%) | 0 (0.0%) |
| 75 Years and older | 70 (100.0%) | 0 (0.0%) |
| Total | 960 (94.3%) | 58 (5.7%) |
Health Insurance Coverage by Citizenship Status in Camargo
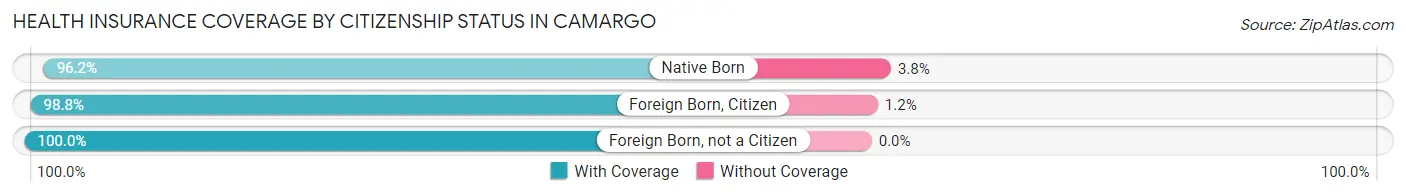
| Citizenship Status | With Coverage | Without Coverage |
| Native Born | 102 (96.2%) | 4 (3.8%) |
| Foreign Born, Citizen | 246 (98.8%) | 3 (1.2%) |
| Foreign Born, not a Citizen | 66 (100.0%) | 0 (0.0%) |
Health Insurance Coverage by Household Income in Camargo
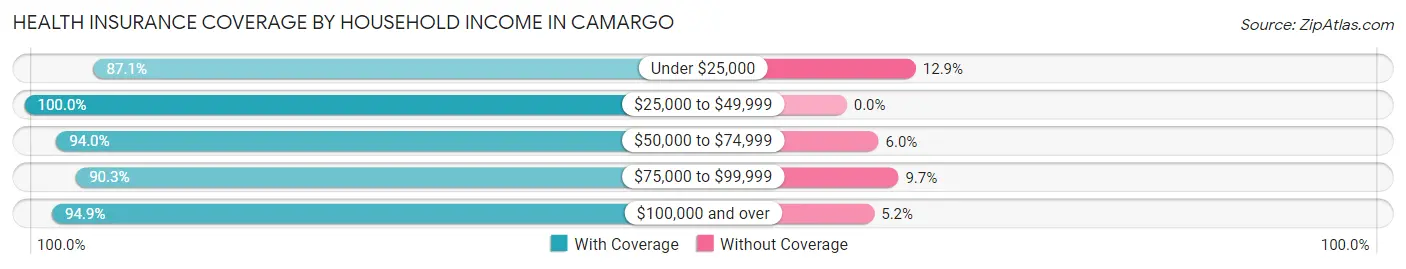
| Household Income | With Coverage | Without Coverage |
| Under $25,000 | 148 (87.1%) | 22 (12.9%) |
| $25,000 to $49,999 | 309 (100.0%) | 0 (0.0%) |
| $50,000 to $74,999 | 142 (94.0%) | 9 (6.0%) |
| $75,000 to $99,999 | 140 (90.3%) | 15 (9.7%) |
| $100,000 and over | 221 (94.9%) | 12 (5.1%) |
Public vs Private Health Insurance Coverage by Age in Camargo
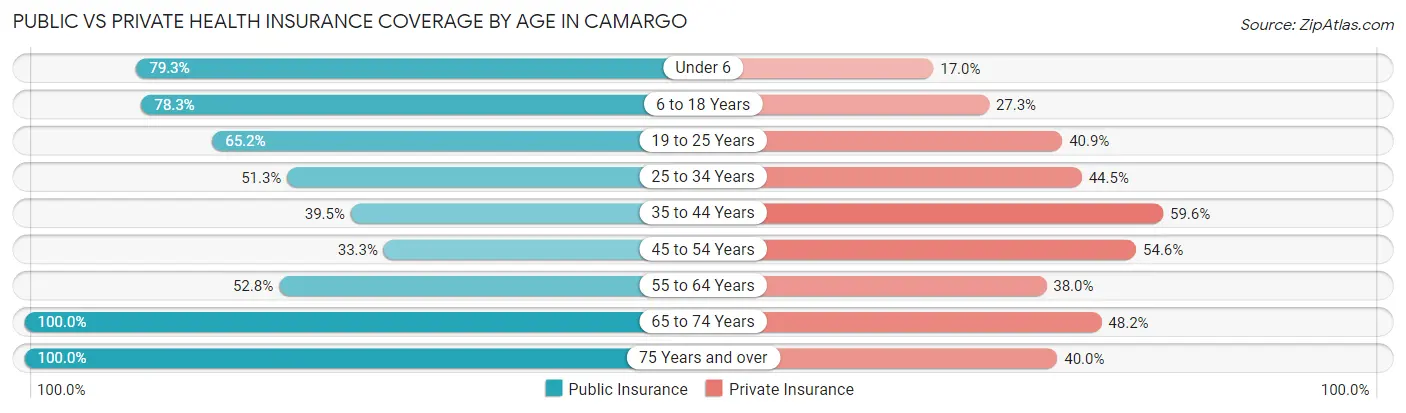
| Age Bracket | Public Insurance | Private Insurance |
| Under 6 | 84 (79.2%) | 18 (17.0%) |
| 6 to 18 Years | 195 (78.3%) | 68 (27.3%) |
| 19 to 25 Years | 43 (65.1%) | 27 (40.9%) |
| 25 to 34 Years | 61 (51.3%) | 53 (44.5%) |
| 35 to 44 Years | 43 (39.5%) | 65 (59.6%) |
| 45 to 54 Years | 36 (33.3%) | 59 (54.6%) |
| 55 to 64 Years | 57 (52.8%) | 41 (38.0%) |
| 65 to 74 Years | 83 (100.0%) | 40 (48.2%) |
| 75 Years and over | 70 (100.0%) | 28 (40.0%) |
| Total | 672 (66.0%) | 399 (39.2%) |
Disability Status by Sex by Age in Camargo
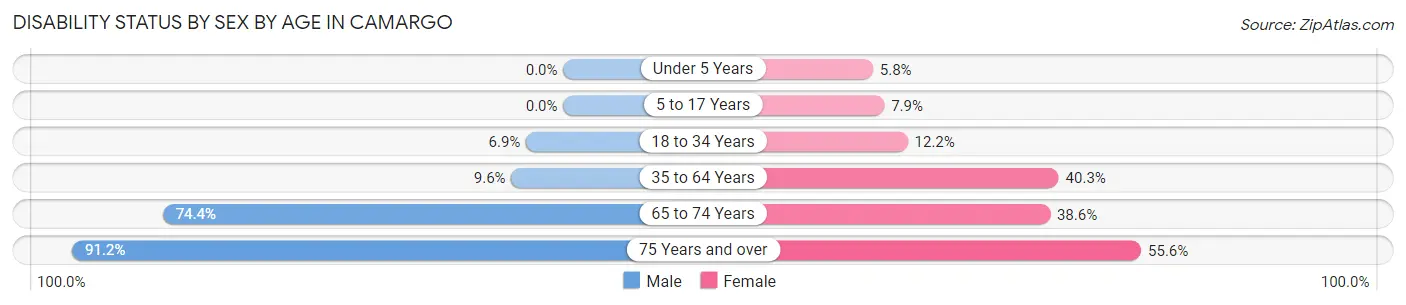
| Age Bracket | Male | Female |
| Under 5 Years | 0 (0.0%) | 3 (5.8%) |
| 5 to 17 Years | 0 (0.0%) | 10 (7.9%) |
| 18 to 34 Years | 4 (6.9%) | 16 (12.2%) |
| 35 to 64 Years | 16 (9.6%) | 64 (40.3%) |
| 65 to 74 Years | 29 (74.4%) | 17 (38.6%) |
| 75 Years and over | 31 (91.2%) | 20 (55.6%) |
Disability Class by Sex by Age in Camargo
Disability Class: Hearing Difficulty
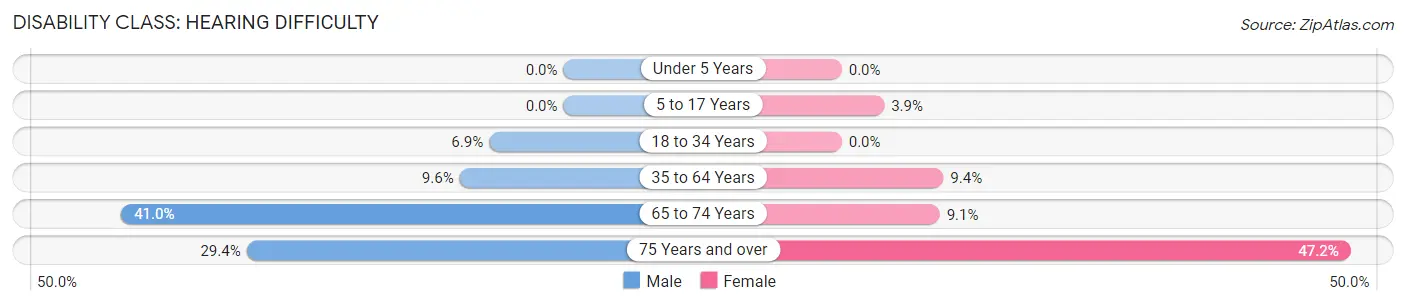
| Age Bracket | Male | Female |
| Under 5 Years | 0 (0.0%) | 0 (0.0%) |
| 5 to 17 Years | 0 (0.0%) | 5 (3.9%) |
| 18 to 34 Years | 4 (6.9%) | 0 (0.0%) |
| 35 to 64 Years | 16 (9.6%) | 15 (9.4%) |
| 65 to 74 Years | 16 (41.0%) | 4 (9.1%) |
| 75 Years and over | 10 (29.4%) | 17 (47.2%) |
Disability Class: Vision Difficulty
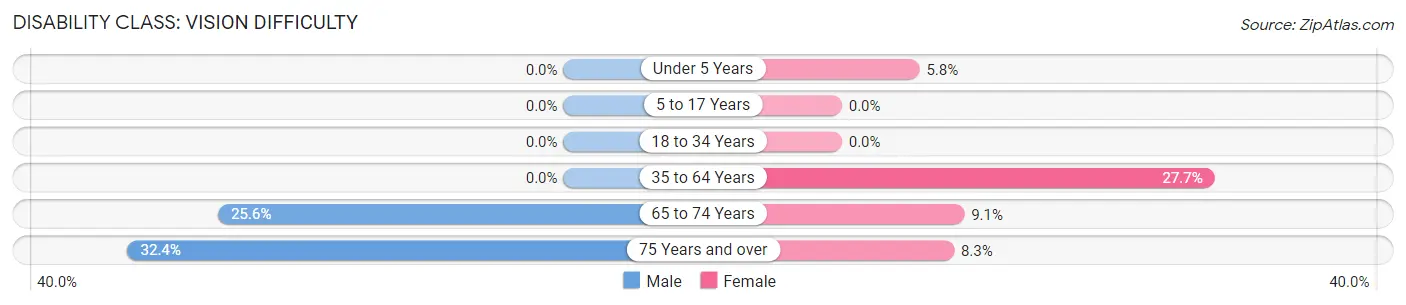
| Age Bracket | Male | Female |
| Under 5 Years | 0 (0.0%) | 3 (5.8%) |
| 5 to 17 Years | 0 (0.0%) | 0 (0.0%) |
| 18 to 34 Years | 0 (0.0%) | 0 (0.0%) |
| 35 to 64 Years | 0 (0.0%) | 44 (27.7%) |
| 65 to 74 Years | 10 (25.6%) | 4 (9.1%) |
| 75 Years and over | 11 (32.4%) | 3 (8.3%) |
Disability Class: Cognitive Difficulty
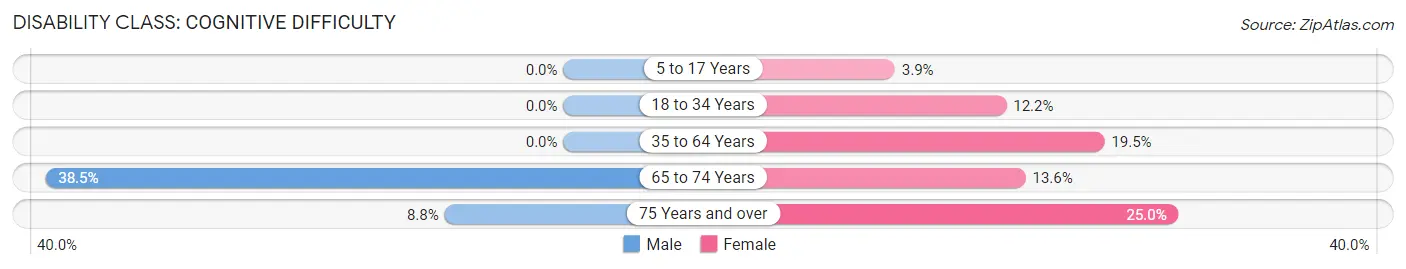
| Age Bracket | Male | Female |
| 5 to 17 Years | 0 (0.0%) | 5 (3.9%) |
| 18 to 34 Years | 0 (0.0%) | 16 (12.2%) |
| 35 to 64 Years | 0 (0.0%) | 31 (19.5%) |
| 65 to 74 Years | 15 (38.5%) | 6 (13.6%) |
| 75 Years and over | 3 (8.8%) | 9 (25.0%) |
Disability Class: Ambulatory Difficulty
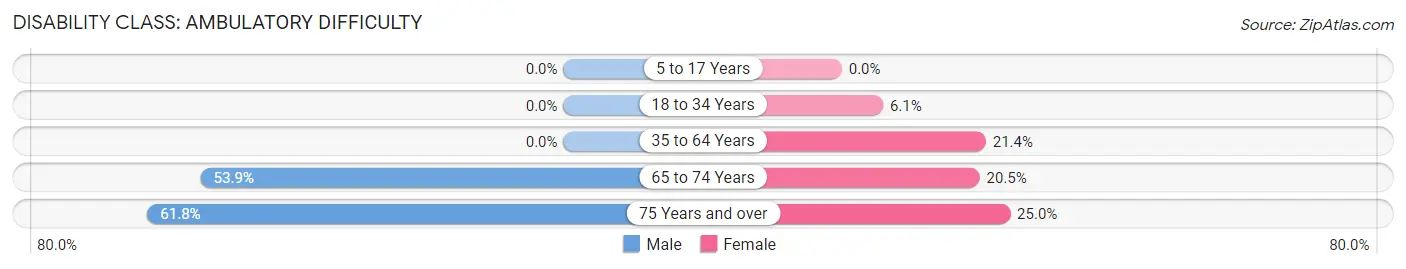
| Age Bracket | Male | Female |
| 5 to 17 Years | 0 (0.0%) | 0 (0.0%) |
| 18 to 34 Years | 0 (0.0%) | 8 (6.1%) |
| 35 to 64 Years | 0 (0.0%) | 34 (21.4%) |
| 65 to 74 Years | 21 (53.8%) | 9 (20.4%) |
| 75 Years and over | 21 (61.8%) | 9 (25.0%) |
Disability Class: Self-Care Difficulty
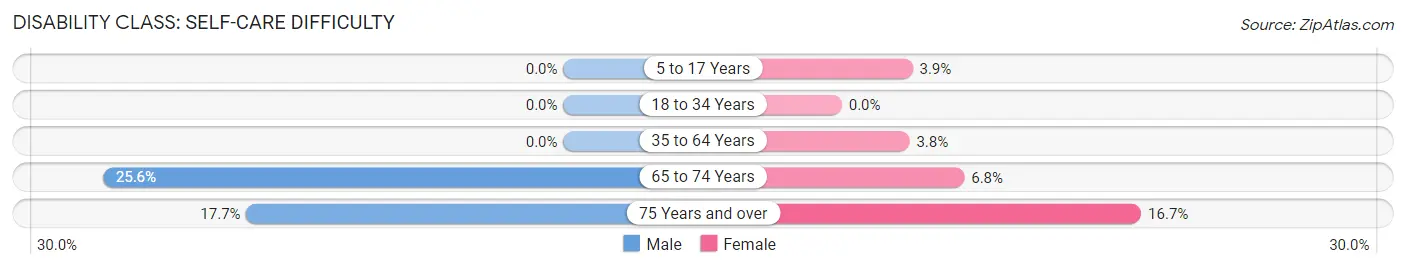
| Age Bracket | Male | Female |
| 5 to 17 Years | 0 (0.0%) | 5 (3.9%) |
| 18 to 34 Years | 0 (0.0%) | 0 (0.0%) |
| 35 to 64 Years | 0 (0.0%) | 6 (3.8%) |
| 65 to 74 Years | 10 (25.6%) | 3 (6.8%) |
| 75 Years and over | 6 (17.6%) | 6 (16.7%) |
Technology Access in Camargo
Computing Device Access in Camargo
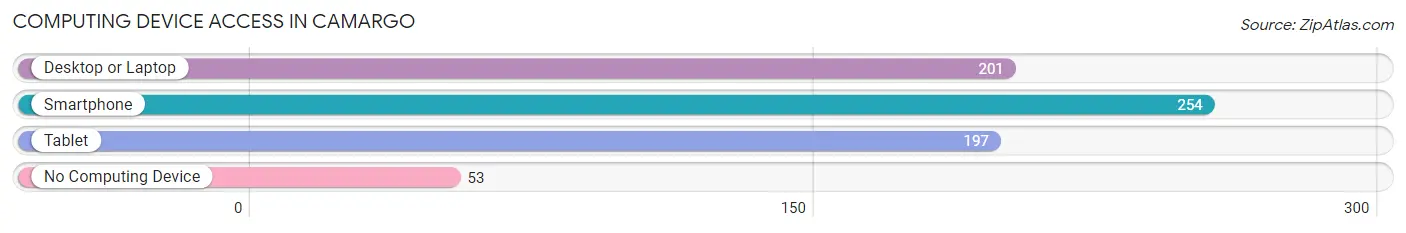
| Device Type | # Households | % Households |
| Desktop or Laptop | 201 | 60.9% |
| Smartphone | 254 | 77.0% |
| Tablet | 197 | 59.7% |
| No Computing Device | 53 | 16.1% |
| Total | 330 | 100.0% |
Internet Access in Camargo
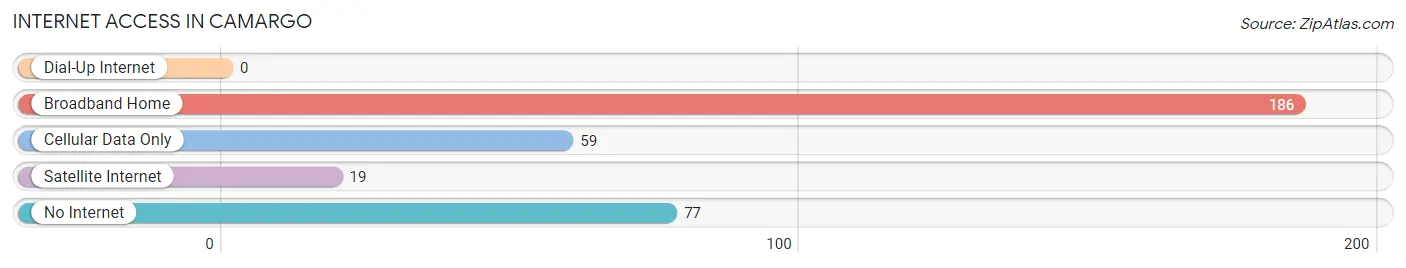
| Internet Type | # Households | % Households |
| Dial-Up Internet | 0 | 0.0% |
| Broadband Home | 186 | 56.4% |
| Cellular Data Only | 59 | 17.9% |
| Satellite Internet | 19 | 5.8% |
| No Internet | 77 | 23.3% |
| Total | 330 | 100.0% |
Camargo Summary
The small town of Camargo, Kentucky is located in the eastern part of the state, in Montgomery County. It is situated on the banks of the Kentucky River, and is surrounded by rolling hills and lush forests. The town has a population of just over 1,000 people, and is known for its small-town charm and friendly atmosphere.
History
The area that is now Camargo was first settled in the early 1800s by a group of settlers from Virginia. The town was originally known as “Cumberland”, and was named after the nearby Cumberland River. The town was officially incorporated in 1837, and the name was changed to Camargo in 1845.
The town was an important stop on the Louisville and Nashville Railroad, and was a popular destination for travelers. The town was also home to a number of businesses, including a sawmill, a gristmill, and a blacksmith shop.
Geography
Camargo is located in the eastern part of Kentucky, in Montgomery County. It is situated on the banks of the Kentucky River, and is surrounded by rolling hills and lush forests. The town is located about 25 miles east of Lexington, and is about an hour’s drive from Louisville.
The climate in Camargo is generally mild, with hot summers and cold winters. The average temperature in the summer is around 80 degrees Fahrenheit, and the average temperature in the winter is around 40 degrees Fahrenheit.
Economy
The economy of Camargo is largely based on agriculture and tourism. The town is home to a number of farms, and the surrounding area is known for its production of tobacco, corn, and soybeans. The town is also home to a number of small businesses, including restaurants, shops, and a few small manufacturing companies.
Tourism is also an important part of the local economy. The town is home to a number of historic sites, including the Camargo Historic District, which is listed on the National Register of Historic Places. The town is also home to a number of outdoor recreation areas, including the Camargo State Park.
Demographics
As of the 2010 census, the population of Camargo was 1,072. The racial makeup of the town was 95.3% White, 1.2% African American, 0.3% Native American, 0.2% Asian, 0.1% Pacific Islander, and 2.9% from other races. The median household income in the town was $31,250, and the median family income was $37,500.
Camargo is a small town with a friendly atmosphere and a rich history. The town is home to a number of farms and businesses, and is a popular destination for tourists. The town is also home to a number of historic sites, and is surrounded by rolling hills and lush forests. The town is a great place to live, work, and visit.
Common Questions
What is Per Capita Income in Camargo?
Per Capita income in Camargo is $19,325.
What is the Median Family Income in Camargo?
Median Family Income in Camargo is $51,389.
What is the Median Household income in Camargo?
Median Household Income in Camargo is $42,262.
What is Income or Wage Gap in Camargo?
Income or Wage Gap in Camargo is 43.8%.
Women in Camargo earn 56.2 cents for every dollar earned by a man.
What is Inequality or Gini Index in Camargo?
Inequality or Gini Index in Camargo is 0.47.
What is the Total Population of Camargo?
Total Population of Camargo is 1,018.
What is the Total Male Population of Camargo?
Total Male Population of Camargo is 469.
What is the Total Female Population of Camargo?
Total Female Population of Camargo is 549.
What is the Ratio of Males per 100 Females in Camargo?
There are 85.43 Males per 100 Females in Camargo.
What is the Ratio of Females per 100 Males in Camargo?
There are 117.06 Females per 100 Males in Camargo.
What is the Median Population Age in Camargo?
Median Population Age in Camargo is 31.9 Years.
What is the Average Family Size in Camargo
Average Family Size in Camargo is 3.5 People.
What is the Average Household Size in Camargo
Average Household Size in Camargo is 3.1 People.
How Large is the Labor Force in Camargo?
There are 335 People in the Labor Forcein in Camargo.
What is the Percentage of People in the Labor Force in Camargo?
48.7% of People are in the Labor Force in Camargo.
What is the Unemployment Rate in Camargo?
Unemployment Rate in Camargo is 6.9%.