Hebron, KY Map & Demographics
Hebron Map
Hebron Overview
$36,135
PER CAPITA INCOME
$99,649
AVG FAMILY INCOME
$99,257
AVG HOUSEHOLD INCOME
43.1%
WAGE / INCOME GAP [ % ]
56.9¢/ $1
WAGE / INCOME GAP [ $ ]
0.33
INEQUALITY / GINI INDEX
6,607
TOTAL POPULATION
3,309
MALE POPULATION
3,298
FEMALE POPULATION
100.33
MALES / 100 FEMALES
99.67
FEMALES / 100 MALES
31.3
MEDIAN AGE
3.8
AVG FAMILY SIZE
3.4
AVG HOUSEHOLD SIZE
4,033
LABOR FORCE [ PEOPLE ]
83.6%
PERCENT IN LABOR FORCE
1.7%
UNEMPLOYMENT RATE
Hebron Zip Codes
Hebron Area Codes
Income in Hebron
Income Overview in Hebron
Per Capita Income in Hebron is $36,135, while median incomes of families and households are $99,649 and $99,257 respectively.
| Characteristic | Number | Measure |
| Per Capita Income | 6,607 | $36,135 |
| Median Family Income | 1,555 | $99,649 |
| Mean Family Income | 1,555 | $122,160 |
| Median Household Income | 1,934 | $99,257 |
| Mean Household Income | 1,934 | $117,071 |
| Income Deficit | 1,555 | $0 |
| Wage / Income Gap (%) | 6,607 | 43.06% |
| Wage / Income Gap ($) | 6,607 | 56.94¢ per $1 |
| Gini / Inequality Index | 6,607 | 0.33 |
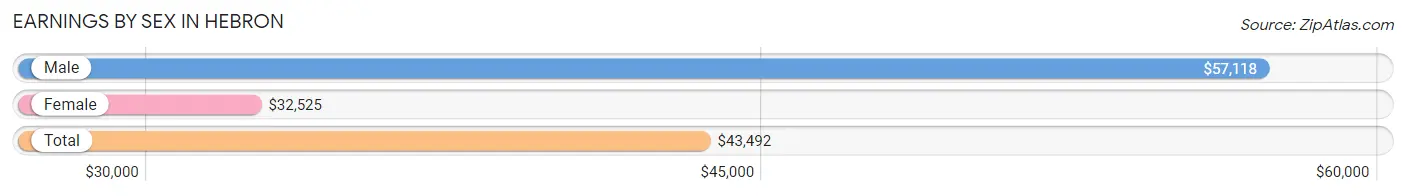
Earnings by Sex in Hebron
Average Earnings in Hebron are $43,492, $57,118 for men and $32,525 for women, a difference of 43.1%.
| Sex | Number | Average Earnings |
| Male | 2,001 (48.2%) | $57,118 |
| Female | 2,154 (51.8%) | $32,525 |
| Total | 4,155 (100.0%) | $43,492 |
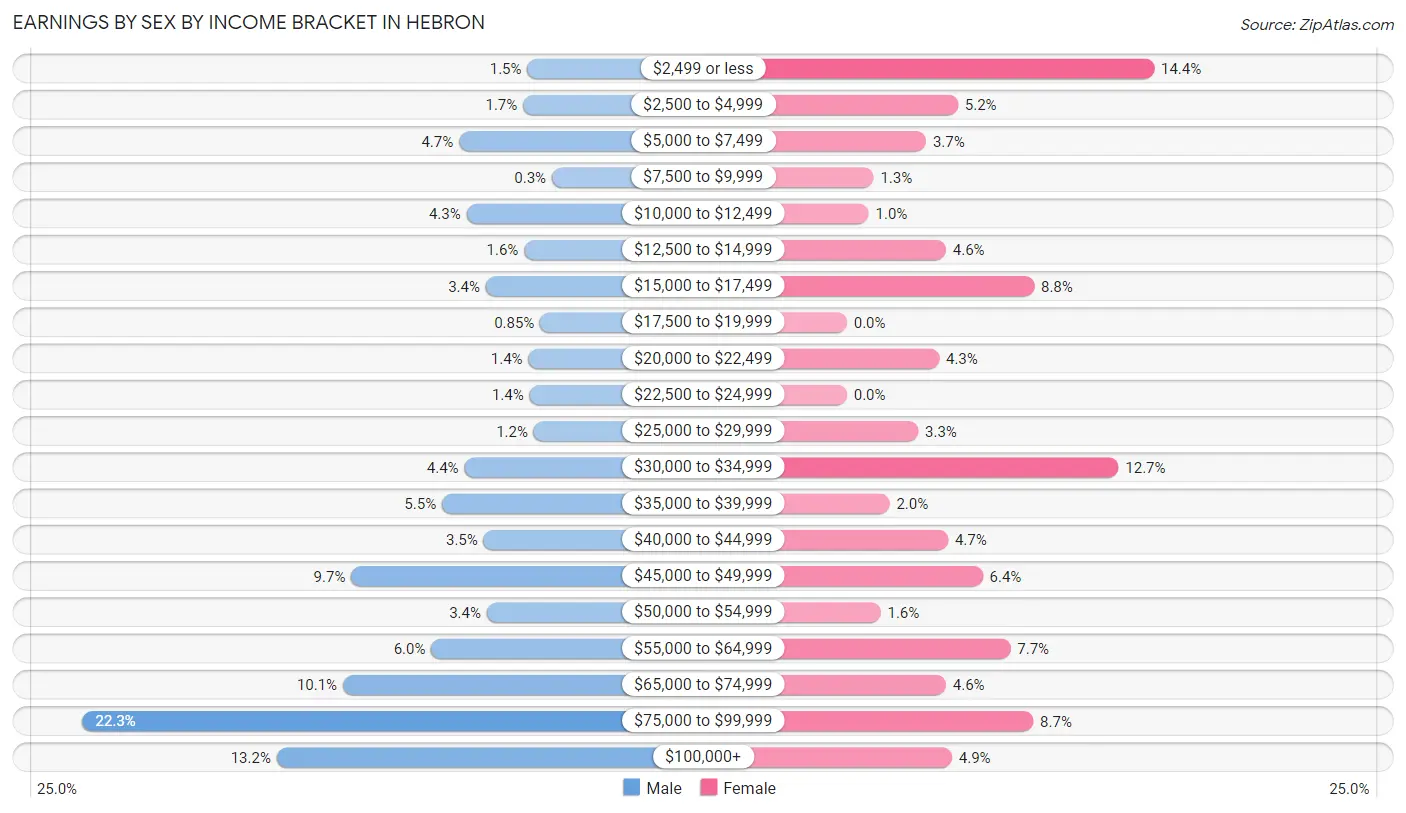
Earnings by Sex by Income Bracket in Hebron
The most common earnings brackets in Hebron are $75,000 to $99,999 for men (446 | 22.3%) and $2,499 or less for women (310 | 14.4%).
| Income | Male | Female |
| $2,499 or less | 29 (1.5%) | 310 (14.4%) |
| $2,500 to $4,999 | 33 (1.7%) | 112 (5.2%) |
| $5,000 to $7,499 | 93 (4.6%) | 80 (3.7%) |
| $7,500 to $9,999 | 6 (0.3%) | 27 (1.3%) |
| $10,000 to $12,499 | 86 (4.3%) | 22 (1.0%) |
| $12,500 to $14,999 | 32 (1.6%) | 100 (4.6%) |
| $15,000 to $17,499 | 68 (3.4%) | 189 (8.8%) |
| $17,500 to $19,999 | 17 (0.9%) | 0 (0.0%) |
| $20,000 to $22,499 | 28 (1.4%) | 93 (4.3%) |
| $22,500 to $24,999 | 27 (1.3%) | 0 (0.0%) |
| $25,000 to $29,999 | 23 (1.1%) | 72 (3.3%) |
| $30,000 to $34,999 | 88 (4.4%) | 274 (12.7%) |
| $35,000 to $39,999 | 109 (5.4%) | 43 (2.0%) |
| $40,000 to $44,999 | 70 (3.5%) | 102 (4.7%) |
| $45,000 to $49,999 | 194 (9.7%) | 137 (6.4%) |
| $50,000 to $54,999 | 67 (3.4%) | 34 (1.6%) |
| $55,000 to $64,999 | 119 (5.9%) | 165 (7.7%) |
| $65,000 to $74,999 | 202 (10.1%) | 100 (4.6%) |
| $75,000 to $99,999 | 446 (22.3%) | 188 (8.7%) |
| $100,000+ | 264 (13.2%) | 106 (4.9%) |
| Total | 2,001 (100.0%) | 2,154 (100.0%) |
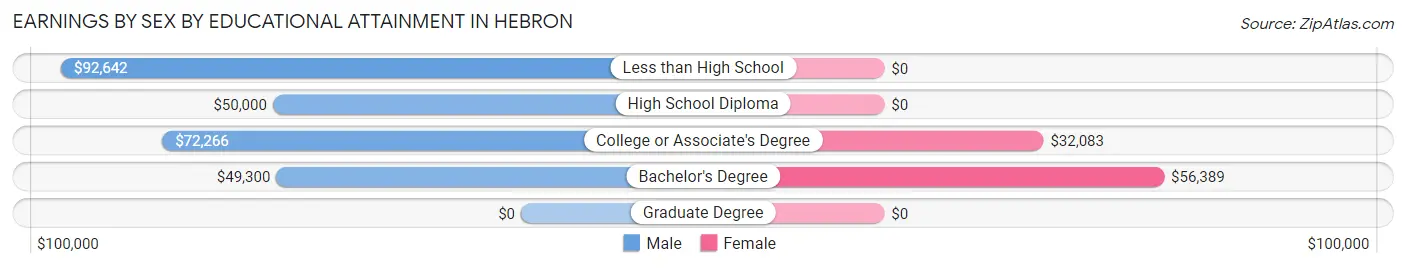
Earnings by Sex by Educational Attainment in Hebron
Average earnings in Hebron are $67,545 for men and $39,622 for women, a difference of 41.3%. Men with an educational attainment of less than high school enjoy the highest average annual earnings of $92,642, while those with bachelor's degree education earn the least with $49,300. Women with an educational attainment of bachelor's degree earn the most with the average annual earnings of $56,389, while those with college or associate's degree education have the smallest earnings of $32,083.
| Educational Attainment | Male Income | Female Income |
| Less than High School | $92,642 | $0 |
| High School Diploma | $50,000 | $0 |
| College or Associate's Degree | $72,266 | $32,083 |
| Bachelor's Degree | $49,300 | $56,389 |
| Graduate Degree | - | - |
| Total | $67,545 | $39,622 |
Family Income in Hebron
Family Income Brackets in Hebron
According to the Hebron family income data, there are 386 families falling into the $75,000 to $99,999 income range, which is the most common income bracket and makes up 24.8% of all families.
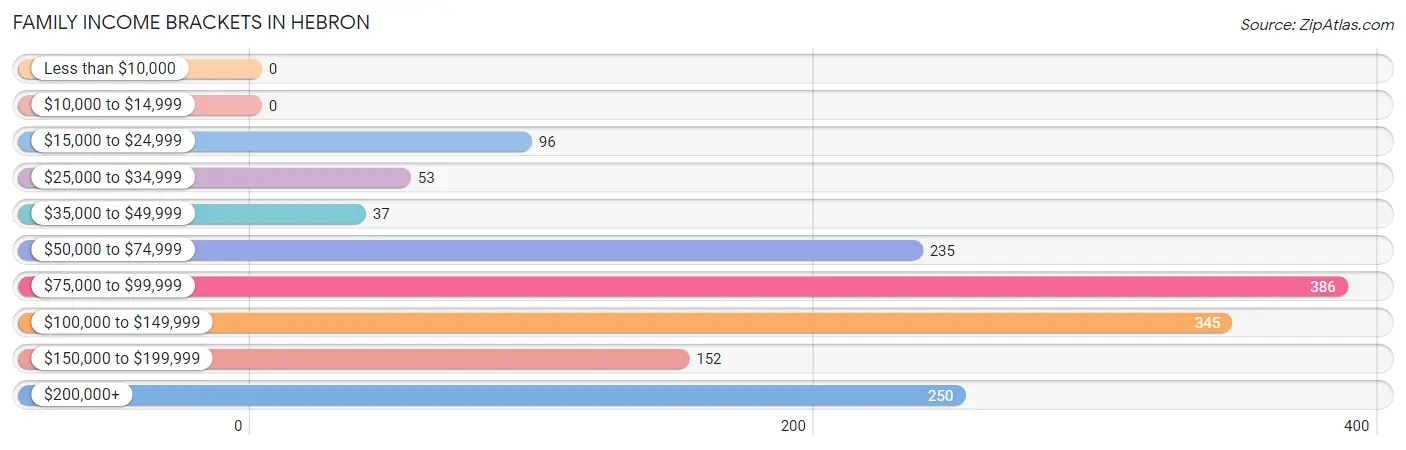
| Income Bracket | # Families | % Families |
| Less than $10,000 | 0 | 0.0% |
| $10,000 to $14,999 | 0 | 0.0% |
| $15,000 to $24,999 | 96 | 6.2% |
| $25,000 to $34,999 | 53 | 3.4% |
| $35,000 to $49,999 | 37 | 2.4% |
| $50,000 to $74,999 | 235 | 15.1% |
| $75,000 to $99,999 | 386 | 24.8% |
| $100,000 to $149,999 | 345 | 22.2% |
| $150,000 to $199,999 | 152 | 9.8% |
| $200,000+ | 250 | 16.1% |
Family Income by Famaliy Size in Hebron
5-person families (186 | 12.0%) account for the highest median family income in Hebron with $176,276 per family, while 2-person families (527 | 33.9%) have the highest median income of $49,338 per family member.
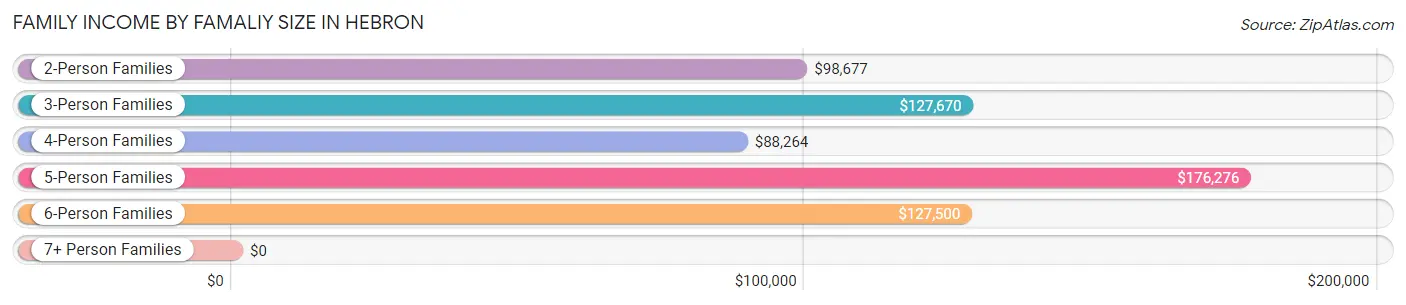
| Income Bracket | # Families | Median Income |
| 2-Person Families | 527 (33.9%) | $98,677 |
| 3-Person Families | 311 (20.0%) | $127,670 |
| 4-Person Families | 405 (26.1%) | $88,264 |
| 5-Person Families | 186 (12.0%) | $176,276 |
| 6-Person Families | 68 (4.4%) | $127,500 |
| 7+ Person Families | 58 (3.7%) | $0 |
| Total | 1,555 (100.0%) | $99,649 |
Family Income by Number of Earners in Hebron
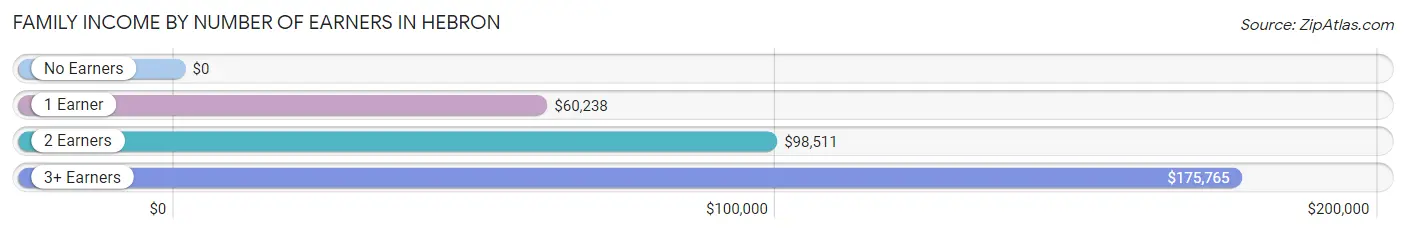
| Number of Earners | # Families | Median Income |
| No Earners | 57 (3.7%) | $0 |
| 1 Earner | 318 (20.4%) | $60,238 |
| 2 Earners | 824 (53.0%) | $98,511 |
| 3+ Earners | 356 (22.9%) | $175,765 |
| Total | 1,555 (100.0%) | $99,649 |
Household Income in Hebron
Household Income Brackets in Hebron
With 420 households falling in the category, the $100,000 to $149,999 income range is the most frequent in Hebron, accounting for 21.7% of all households.
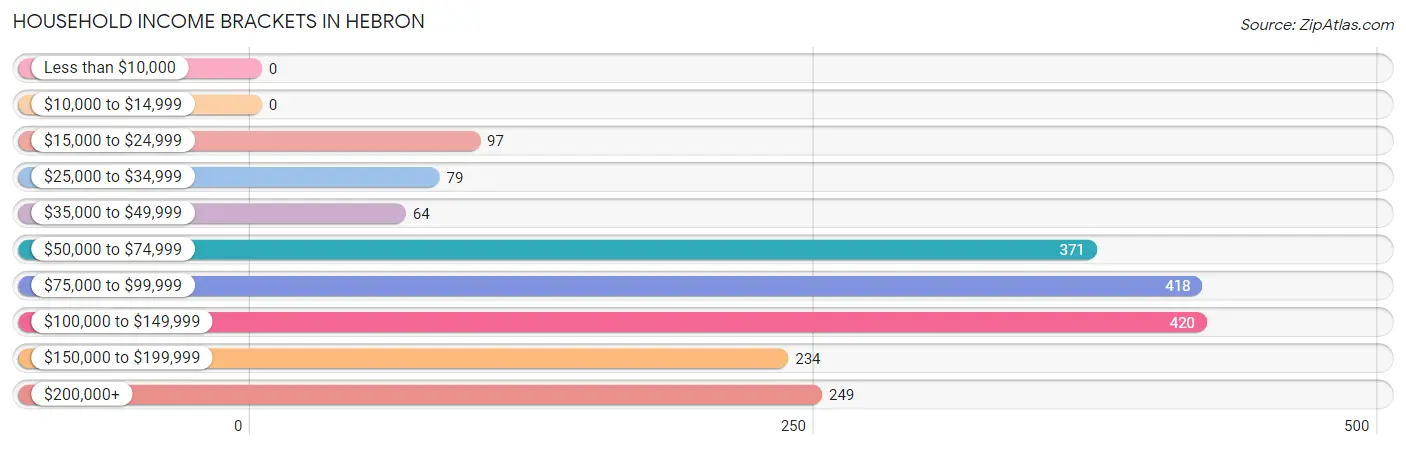
| Income Bracket | # Households | % Households |
| Less than $10,000 | 0 | 0.0% |
| $10,000 to $14,999 | 0 | 0.0% |
| $15,000 to $24,999 | 97 | 5.0% |
| $25,000 to $34,999 | 79 | 4.1% |
| $35,000 to $49,999 | 64 | 3.3% |
| $50,000 to $74,999 | 371 | 19.2% |
| $75,000 to $99,999 | 418 | 21.6% |
| $100,000 to $149,999 | 420 | 21.7% |
| $150,000 to $199,999 | 234 | 12.1% |
| $200,000+ | 249 | 12.9% |
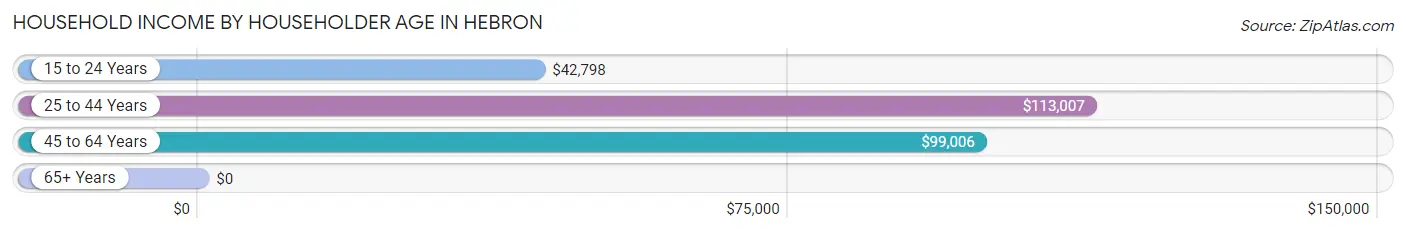
Household Income by Householder Age in Hebron
The median household income in Hebron is $99,257, with the highest median household income of $113,007 found in the 25 to 44 years age bracket for the primary householder. A total of 760 households (39.3%) fall into this category. Meanwhile, the 65+ years age bracket for the primary householder has the lowest median household income of $0, with 183 households (9.5%) in this group.
| Income Bracket | # Households | Median Income |
| 15 to 24 Years | 37 (1.9%) | $42,798 |
| 25 to 44 Years | 760 (39.3%) | $113,007 |
| 45 to 64 Years | 954 (49.3%) | $99,006 |
| 65+ Years | 183 (9.5%) | $0 |
| Total | 1,934 (100.0%) | $99,257 |
Poverty in Hebron
Income Below Poverty by Sex and Age in Hebron
With 3.8% poverty level for males and 13.0% for females among the residents of Hebron, 15 year old males and 25 to 34 year old females are the most vulnerable to poverty, with 12 males (16.7%) and 208 females (33.7%) in their respective age groups living below the poverty level.
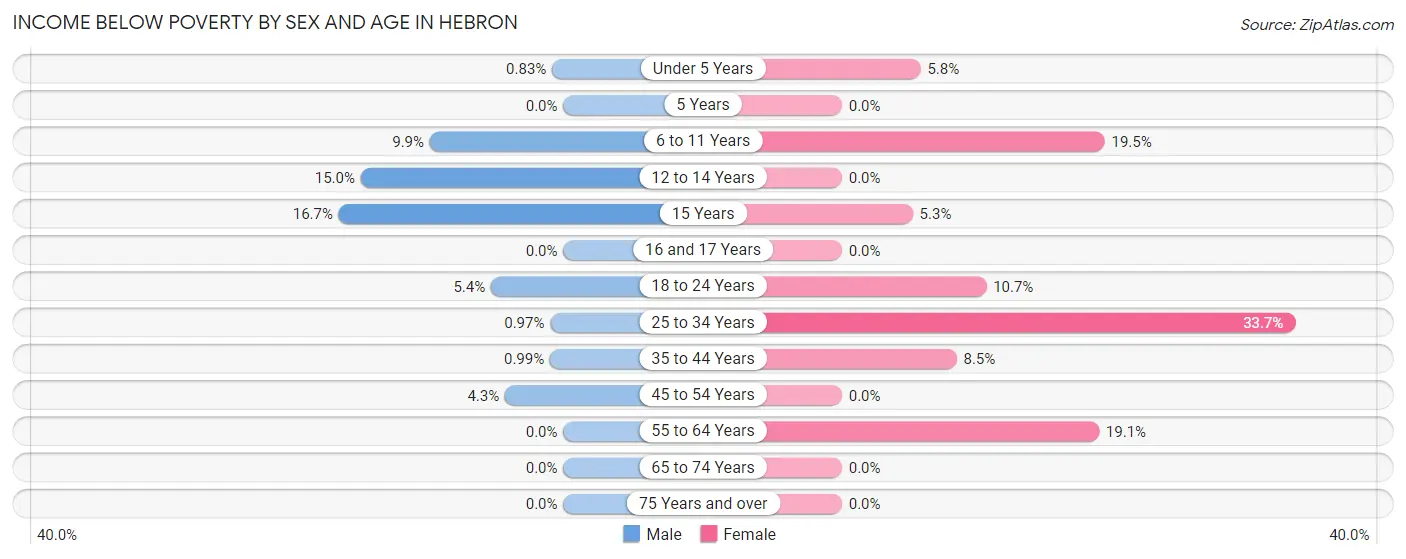
| Age Bracket | Male | Female |
| Under 5 Years | 3 (0.8%) | 8 (5.8%) |
| 5 Years | 0 (0.0%) | 0 (0.0%) |
| 6 to 11 Years | 32 (9.9%) | 56 (19.5%) |
| 12 to 14 Years | 37 (15.0%) | 0 (0.0%) |
| 15 Years | 12 (16.7%) | 4 (5.3%) |
| 16 and 17 Years | 0 (0.0%) | 0 (0.0%) |
| 18 to 24 Years | 13 (5.4%) | 43 (10.7%) |
| 25 to 34 Years | 3 (1.0%) | 208 (33.7%) |
| 35 to 44 Years | 6 (1.0%) | 42 (8.5%) |
| 45 to 54 Years | 20 (4.3%) | 0 (0.0%) |
| 55 to 64 Years | 0 (0.0%) | 67 (19.1%) |
| 65 to 74 Years | 0 (0.0%) | 0 (0.0%) |
| 75 Years and over | 0 (0.0%) | 0 (0.0%) |
| Total | 126 (3.8%) | 428 (13.0%) |
Income Above Poverty by Sex and Age in Hebron
According to the poverty statistics in Hebron, males aged 5 years and females aged 5 years are the age groups that are most secure financially, with 100.0% of males and 100.0% of females in these age groups living above the poverty line.
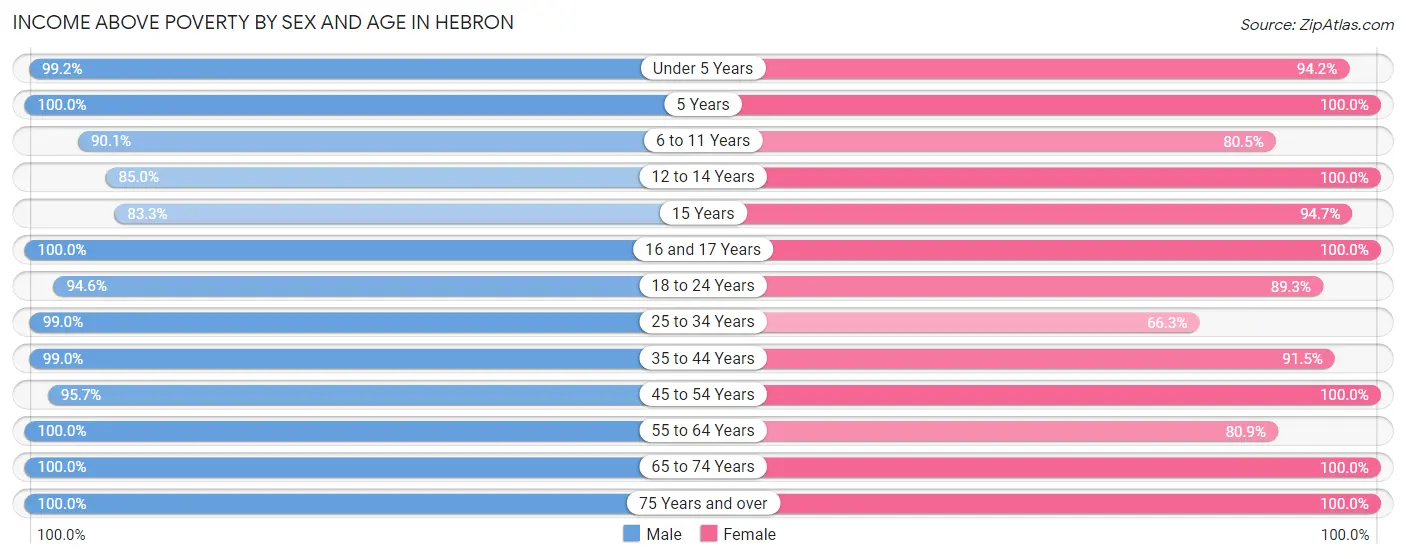
| Age Bracket | Male | Female |
| Under 5 Years | 360 (99.2%) | 129 (94.2%) |
| 5 Years | 121 (100.0%) | 21 (100.0%) |
| 6 to 11 Years | 291 (90.1%) | 231 (80.5%) |
| 12 to 14 Years | 209 (85.0%) | 125 (100.0%) |
| 15 Years | 60 (83.3%) | 72 (94.7%) |
| 16 and 17 Years | 15 (100.0%) | 197 (100.0%) |
| 18 to 24 Years | 229 (94.6%) | 358 (89.3%) |
| 25 to 34 Years | 307 (99.0%) | 410 (66.3%) |
| 35 to 44 Years | 600 (99.0%) | 451 (91.5%) |
| 45 to 54 Years | 442 (95.7%) | 378 (100.0%) |
| 55 to 64 Years | 426 (100.0%) | 284 (80.9%) |
| 65 to 74 Years | 54 (100.0%) | 137 (100.0%) |
| 75 Years and over | 69 (100.0%) | 65 (100.0%) |
| Total | 3,183 (96.2%) | 2,858 (87.0%) |
Income Below Poverty Among Married-Couple Families in Hebron
The poverty statistics for married-couple families in Hebron show that 2.0% or 23 of the total 1,156 families live below the poverty line. Families with no children have the highest poverty rate of 4.3%, comprising of 20 families. On the other hand, families with 1 or 2 children have the lowest poverty rate of 0.0%, which includes 0 families.
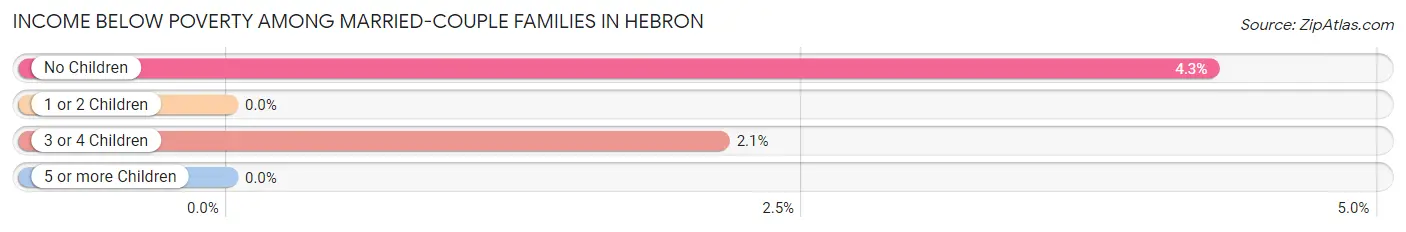
| Children | Above Poverty | Below Poverty |
| No Children | 448 (95.7%) | 20 (4.3%) |
| 1 or 2 Children | 548 (100.0%) | 0 (0.0%) |
| 3 or 4 Children | 137 (97.9%) | 3 (2.1%) |
| 5 or more Children | 0 (0.0%) | 0 (0.0%) |
| Total | 1,133 (98.0%) | 23 (2.0%) |
Income Below Poverty Among Single-Parent Households in Hebron
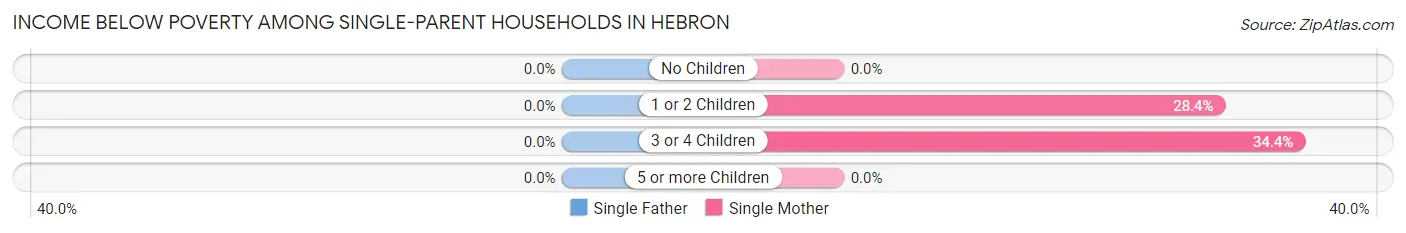
| Children | Single Father | Single Mother |
| No Children | 0 (0.0%) | 0 (0.0%) |
| 1 or 2 Children | 0 (0.0%) | 29 (28.4%) |
| 3 or 4 Children | 0 (0.0%) | 22 (34.4%) |
| 5 or more Children | 0 (0.0%) | 0 (0.0%) |
| Total | 0 (0.0%) | 51 (21.7%) |
Income Below Poverty Among Married-Couple vs Single-Parent Households in Hebron
The poverty data for Hebron shows that 23 of the married-couple family households (2.0%) and 51 of the single-parent households (12.8%) are living below the poverty level. Within the married-couple family households, those with no children have the highest poverty rate, with 20 households (4.3%) falling below the poverty line. Among the single-parent households, those with 3 or 4 children have the highest poverty rate, with 22 household (34.4%) living below poverty.
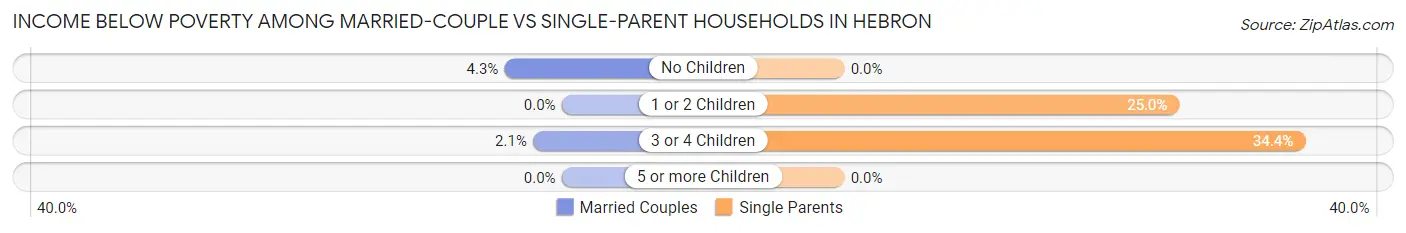
| Children | Married-Couple Families | Single-Parent Households |
| No Children | 20 (4.3%) | 0 (0.0%) |
| 1 or 2 Children | 0 (0.0%) | 29 (25.0%) |
| 3 or 4 Children | 3 (2.1%) | 22 (34.4%) |
| 5 or more Children | 0 (0.0%) | 0 (0.0%) |
| Total | 23 (2.0%) | 51 (12.8%) |
Race in Hebron
The most populous races in Hebron are White / Caucasian (6,023 | 91.2%), Hispanic or Latino (936 | 14.2%), and Two or more Races (452 | 6.8%).
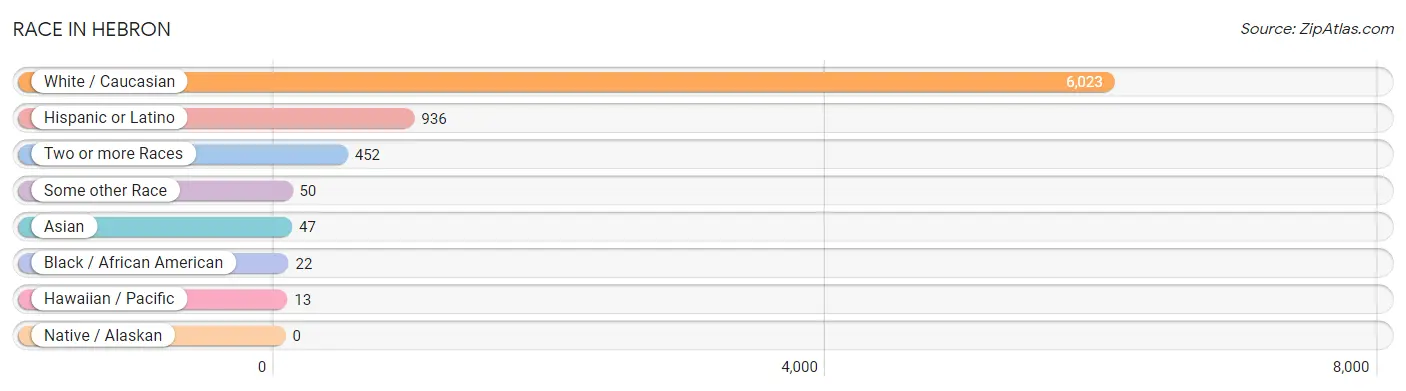
| Race | # Population | % Population |
| Asian | 47 | 0.7% |
| Black / African American | 22 | 0.3% |
| Hawaiian / Pacific | 13 | 0.2% |
| Hispanic or Latino | 936 | 14.2% |
| Native / Alaskan | 0 | 0.0% |
| White / Caucasian | 6,023 | 91.2% |
| Two or more Races | 452 | 6.8% |
| Some other Race | 50 | 0.8% |
| Total | 6,607 | 100.0% |
Ancestry in Hebron
The most populous ancestries reported in Hebron are German (1,390 | 21.0%), English (805 | 12.2%), Irish (767 | 11.6%), American (474 | 7.2%), and Mexican (422 | 6.4%), together accounting for 58.4% of all Hebron residents.
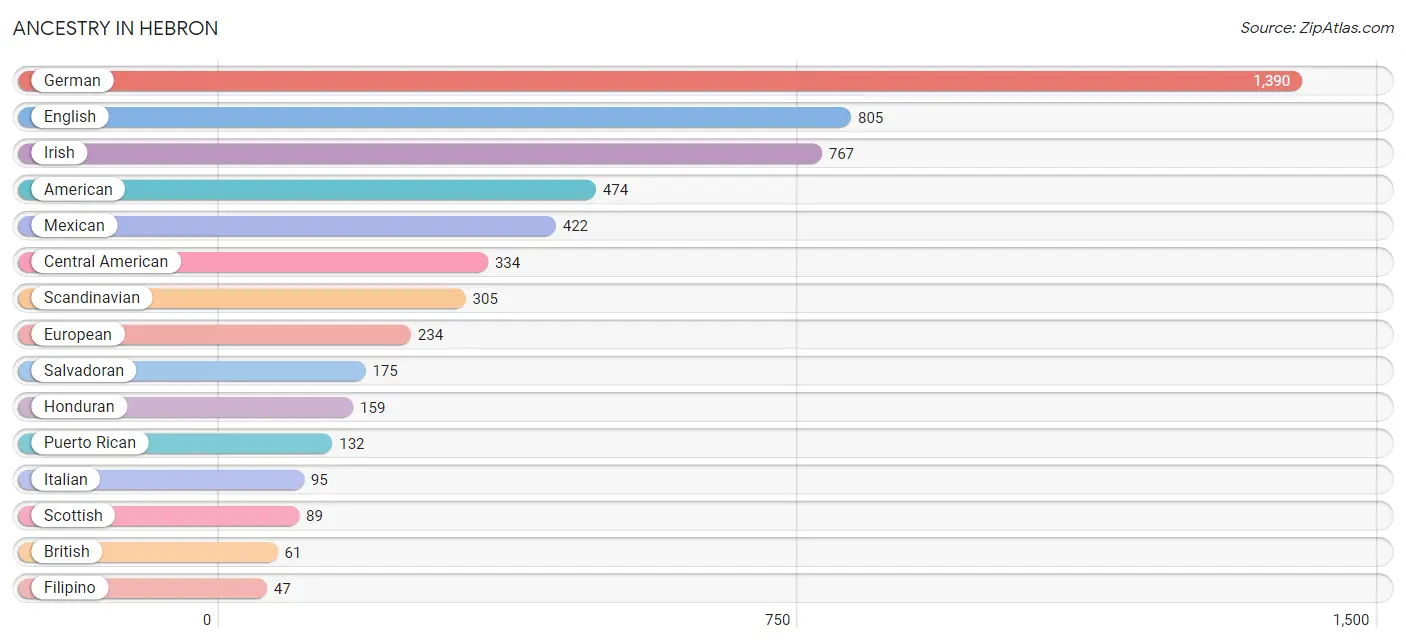
| Ancestry | # Population | % Population |
| Afghan | 21 | 0.3% |
| African | 25 | 0.4% |
| American | 474 | 7.2% |
| Arab | 20 | 0.3% |
| Australian | 5 | 0.1% |
| Brazilian | 23 | 0.4% |
| British | 61 | 0.9% |
| Central American | 334 | 5.1% |
| Cherokee | 20 | 0.3% |
| Czech | 30 | 0.4% |
| Danish | 30 | 0.4% |
| Dutch | 14 | 0.2% |
| English | 805 | 12.2% |
| European | 234 | 3.5% |
| Filipino | 47 | 0.7% |
| Finnish | 17 | 0.3% |
| French | 32 | 0.5% |
| French American Indian | 10 | 0.2% |
| French Canadian | 9 | 0.1% |
| German | 1,390 | 21.0% |
| Honduran | 159 | 2.4% |
| Hungarian | 24 | 0.4% |
| Irish | 767 | 11.6% |
| Italian | 95 | 1.4% |
| Jordanian | 20 | 0.3% |
| Lumbee | 4 | 0.1% |
| Mexican | 422 | 6.4% |
| Native Hawaiian | 8 | 0.1% |
| Nigerian | 22 | 0.3% |
| Norwegian | 11 | 0.2% |
| Peruvian | 13 | 0.2% |
| Puerto Rican | 132 | 2.0% |
| Russian | 11 | 0.2% |
| Salvadoran | 175 | 2.6% |
| Scandinavian | 305 | 4.6% |
| Scotch-Irish | 6 | 0.1% |
| Scottish | 89 | 1.3% |
| South American | 13 | 0.2% |
| Subsaharan African | 47 | 0.7% |
| Swedish | 11 | 0.2% |
| Ukrainian | 28 | 0.4% |
| Welsh | 38 | 0.6% | View All 42 Rows |
Immigrants in Hebron
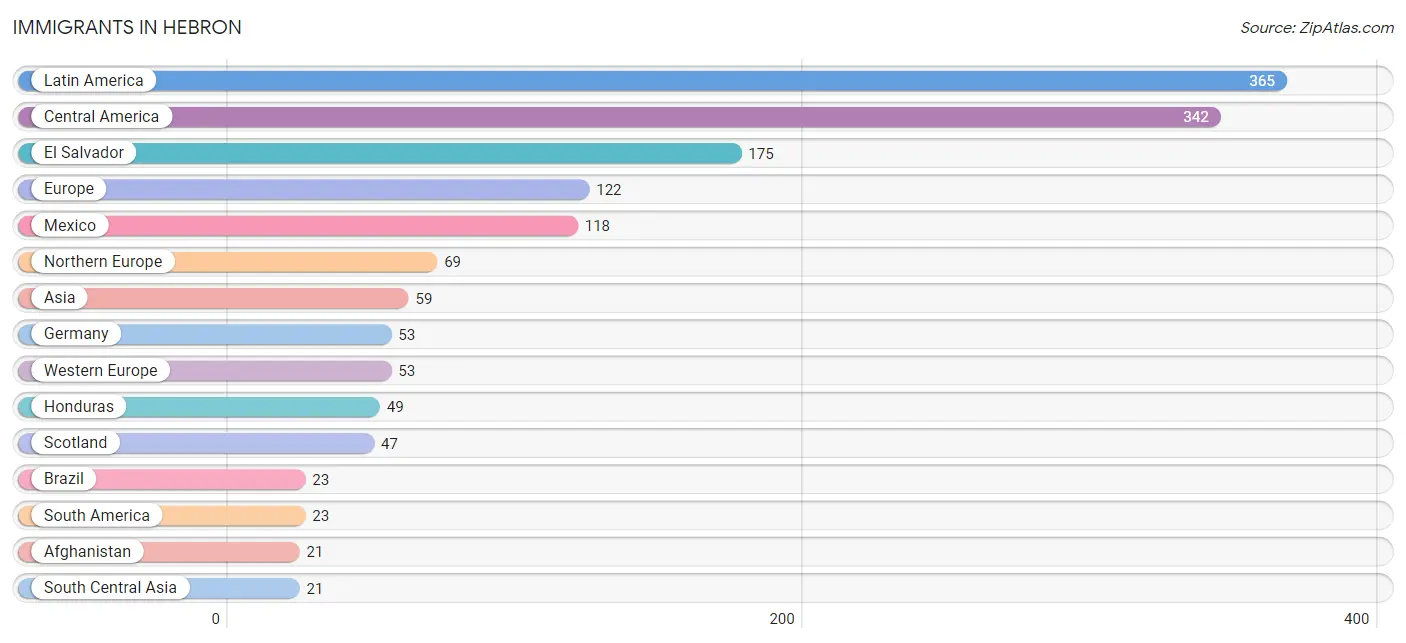
The most numerous immigrant groups reported in Hebron came from Latin America (365 | 5.5%), Central America (342 | 5.2%), El Salvador (175 | 2.6%), Europe (122 | 1.8%), and Mexico (118 | 1.8%), together accounting for 17.0% of all Hebron residents.
| Immigration Origin | # Population | % Population |
| Afghanistan | 21 | 0.3% |
| Asia | 59 | 0.9% |
| Australia | 5 | 0.1% |
| Brazil | 23 | 0.4% |
| Central America | 342 | 5.2% |
| China | 18 | 0.3% |
| Eastern Asia | 18 | 0.3% |
| El Salvador | 175 | 2.6% |
| Europe | 122 | 1.8% |
| Germany | 53 | 0.8% |
| Honduras | 49 | 0.7% |
| Jordan | 20 | 0.3% |
| Latin America | 365 | 5.5% |
| Mexico | 118 | 1.8% |
| Micronesia | 4 | 0.1% |
| Northern Europe | 69 | 1.0% |
| Oceania | 9 | 0.1% |
| Scotland | 47 | 0.7% |
| South America | 23 | 0.4% |
| South Central Asia | 21 | 0.3% |
| Taiwan | 18 | 0.3% |
| Western Asia | 20 | 0.3% |
| Western Europe | 53 | 0.8% | View All 23 Rows |
Sex and Age in Hebron
Sex and Age in Hebron
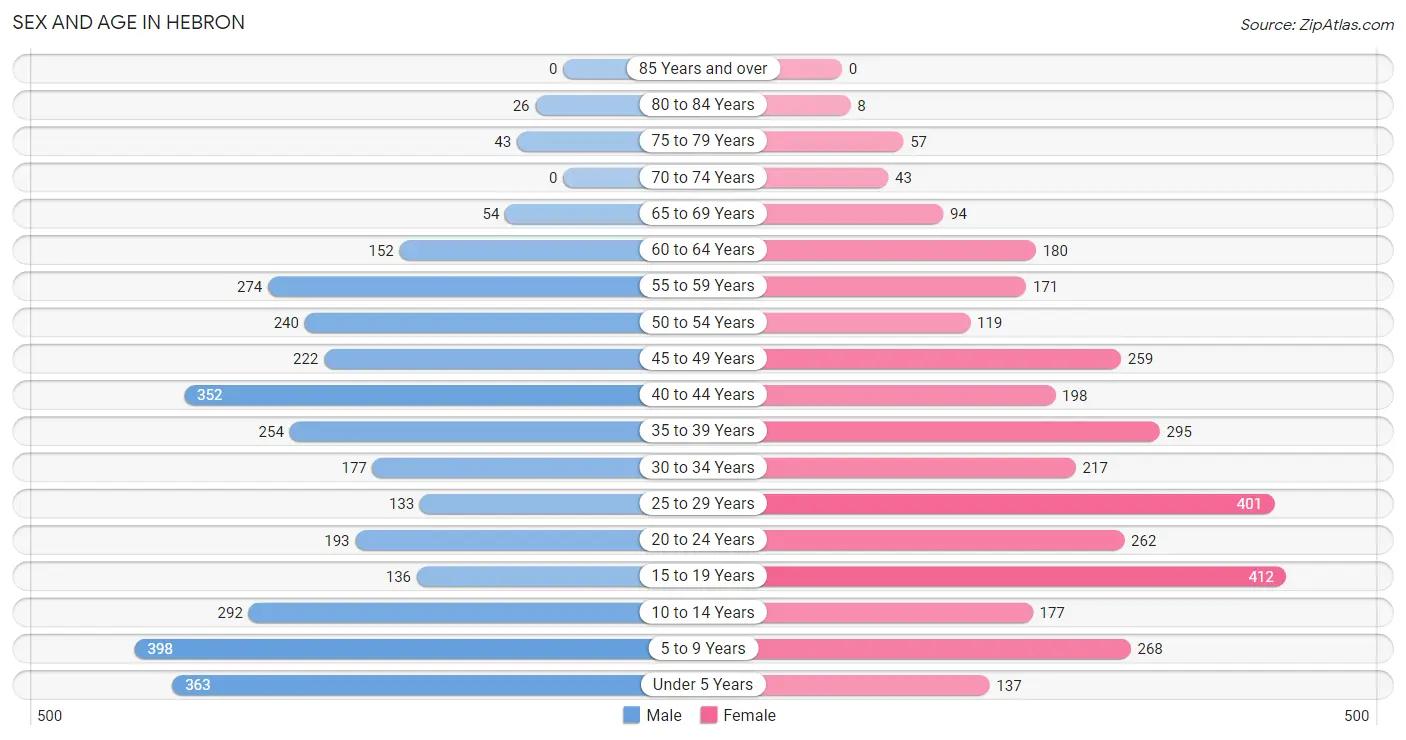
The most populous age groups in Hebron are 5 to 9 Years (398 | 12.0%) for men and 15 to 19 Years (412 | 12.5%) for women.
| Age Bracket | Male | Female |
| Under 5 Years | 363 (11.0%) | 137 (4.2%) |
| 5 to 9 Years | 398 (12.0%) | 268 (8.1%) |
| 10 to 14 Years | 292 (8.8%) | 177 (5.4%) |
| 15 to 19 Years | 136 (4.1%) | 412 (12.5%) |
| 20 to 24 Years | 193 (5.8%) | 262 (7.9%) |
| 25 to 29 Years | 133 (4.0%) | 401 (12.2%) |
| 30 to 34 Years | 177 (5.3%) | 217 (6.6%) |
| 35 to 39 Years | 254 (7.7%) | 295 (8.9%) |
| 40 to 44 Years | 352 (10.6%) | 198 (6.0%) |
| 45 to 49 Years | 222 (6.7%) | 259 (7.9%) |
| 50 to 54 Years | 240 (7.2%) | 119 (3.6%) |
| 55 to 59 Years | 274 (8.3%) | 171 (5.2%) |
| 60 to 64 Years | 152 (4.6%) | 180 (5.5%) |
| 65 to 69 Years | 54 (1.6%) | 94 (2.9%) |
| 70 to 74 Years | 0 (0.0%) | 43 (1.3%) |
| 75 to 79 Years | 43 (1.3%) | 57 (1.7%) |
| 80 to 84 Years | 26 (0.8%) | 8 (0.2%) |
| 85 Years and over | 0 (0.0%) | 0 (0.0%) |
| Total | 3,309 (100.0%) | 3,298 (100.0%) |
Families and Households in Hebron
Median Family Size in Hebron
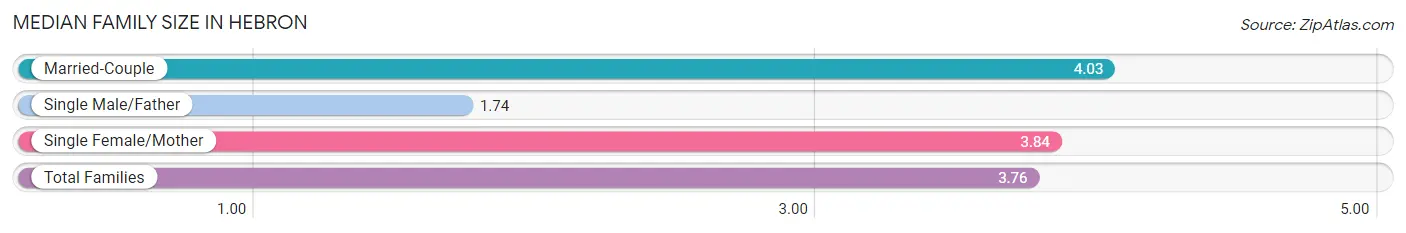
The median family size in Hebron is 3.76 persons per family, with married-couple families (1,156 | 74.3%) accounting for the largest median family size of 4.03 persons per family. On the other hand, single male/father families (164 | 10.5%) represent the smallest median family size with 1.74 persons per family.
| Family Type | # Families | Family Size |
| Married-Couple | 1,156 (74.3%) | 4.03 |
| Single Male/Father | 164 (10.5%) | 1.74 |
| Single Female/Mother | 235 (15.1%) | 3.84 |
| Total Families | 1,555 (100.0%) | 3.76 |
Median Household Size in Hebron
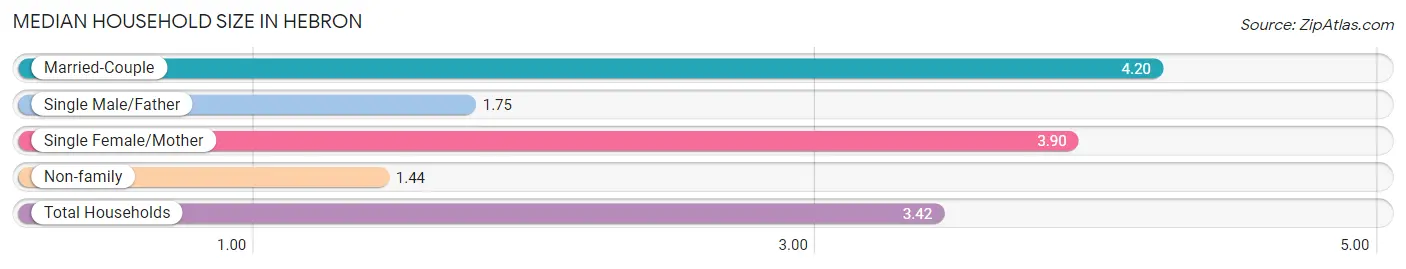
The median household size in Hebron is 3.42 persons per household, with married-couple households (1,156 | 59.8%) accounting for the largest median household size of 4.2 persons per household. non-family households (379 | 19.6%) represent the smallest median household size with 1.44 persons per household.
| Household Type | # Households | Household Size |
| Married-Couple | 1,156 (59.8%) | 4.20 |
| Single Male/Father | 164 (8.5%) | 1.75 |
| Single Female/Mother | 235 (12.1%) | 3.90 |
| Non-family | 379 (19.6%) | 1.44 |
| Total Households | 1,934 (100.0%) | 3.42 |
Household Size by Marriage Status in Hebron
Out of a total of 1,934 households in Hebron, 1,555 (80.4%) are family households, while 379 (19.6%) are nonfamily households. The most numerous type of family households are 2-person households, comprising 527, and the most common type of nonfamily households are 1-person households, comprising 262.
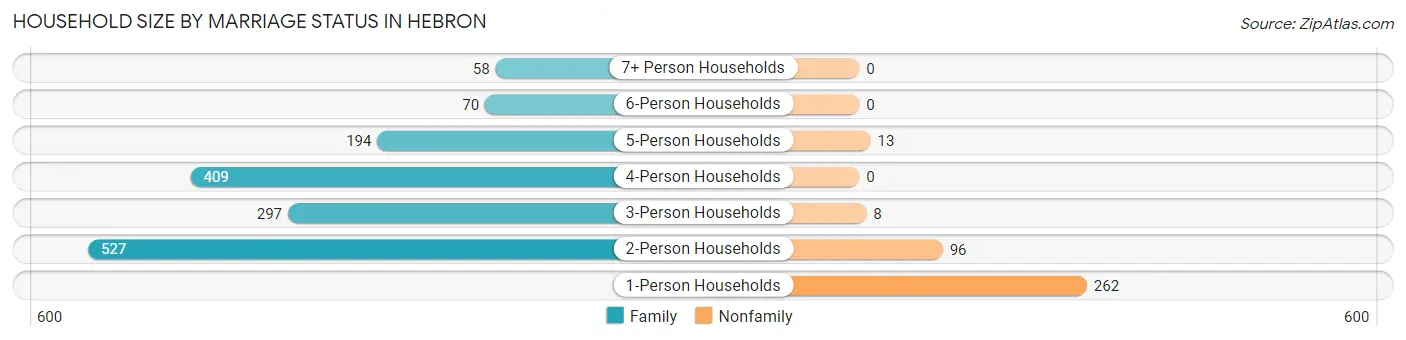
| Household Size | Family Households | Nonfamily Households |
| 1-Person Households | - | 262 (13.6%) |
| 2-Person Households | 527 (27.3%) | 96 (5.0%) |
| 3-Person Households | 297 (15.4%) | 8 (0.4%) |
| 4-Person Households | 409 (21.1%) | 0 (0.0%) |
| 5-Person Households | 194 (10.0%) | 13 (0.7%) |
| 6-Person Households | 70 (3.6%) | 0 (0.0%) |
| 7+ Person Households | 58 (3.0%) | 0 (0.0%) |
| Total | 1,555 (80.4%) | 379 (19.6%) |
Female Fertility in Hebron
Fertility by Age in Hebron
Average fertility rate in Hebron is 15.0 births per 1,000 women. Women in the age bracket of 20 to 34 years have the highest fertility rate with 23.0 births per 1,000 women. Women in the age bracket of 20 to 34 years acount for 64.5% of all women with births.
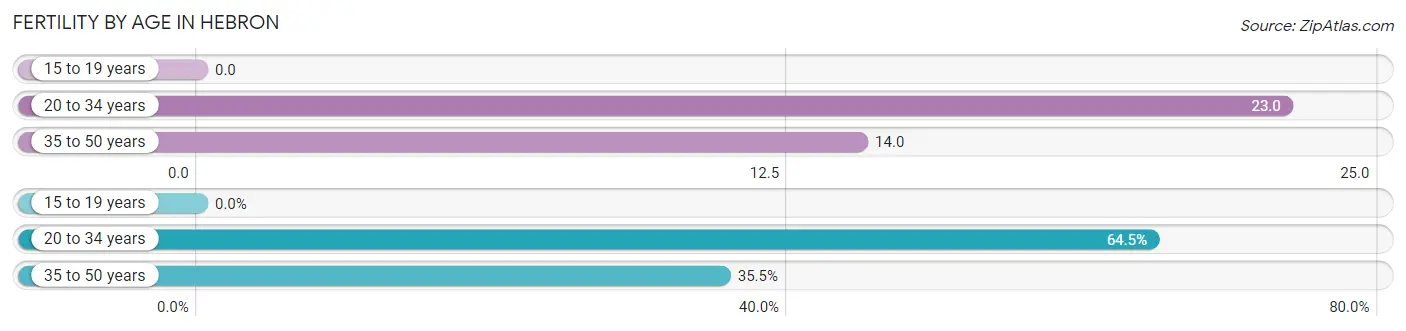
| Age Bracket | Women with Births | Births / 1,000 Women |
| 15 to 19 years | 0 (0.0%) | 0.0 |
| 20 to 34 years | 20 (64.5%) | 23.0 |
| 35 to 50 years | 11 (35.5%) | 14.0 |
| Total | 31 (100.0%) | 15.0 |
Fertility by Age by Marriage Status in Hebron
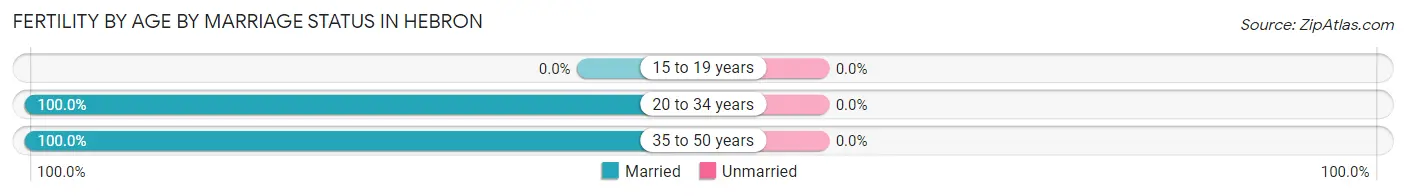
| Age Bracket | Married | Unmarried |
| 15 to 19 years | 0 (0.0%) | 0 (0.0%) |
| 20 to 34 years | 20 (100.0%) | 0 (0.0%) |
| 35 to 50 years | 11 (100.0%) | 0 (0.0%) |
| Total | 31 (100.0%) | 0 (0.0%) |
Fertility by Education in Hebron
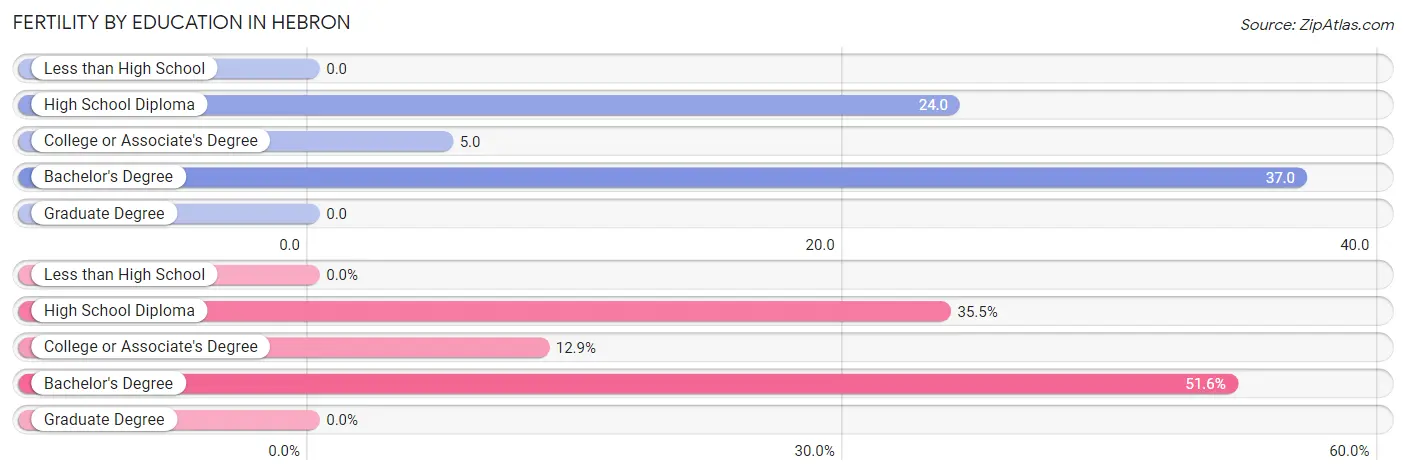
| Educational Attainment | Women with Births | Births / 1,000 Women |
| Less than High School | 0 (0.0%) | 0.0 |
| High School Diploma | 11 (35.5%) | 24.0 |
| College or Associate's Degree | 4 (12.9%) | 5.0 |
| Bachelor's Degree | 16 (51.6%) | 37.0 |
| Graduate Degree | 0 (0.0%) | 0.0 |
| Total | 31 (100.0%) | 15.0 |
Fertility by Education by Marriage Status in Hebron
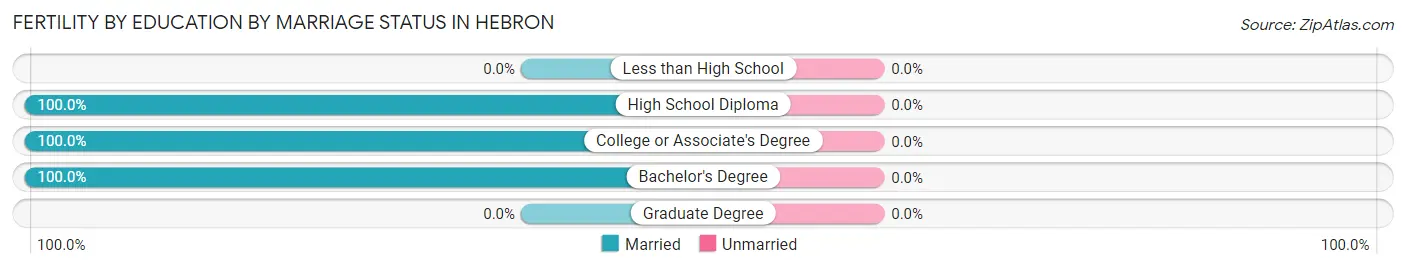
| Educational Attainment | Married | Unmarried |
| Less than High School | 0 (0.0%) | 0 (0.0%) |
| High School Diploma | 11 (100.0%) | 0 (0.0%) |
| College or Associate's Degree | 4 (100.0%) | 0 (0.0%) |
| Bachelor's Degree | 16 (100.0%) | 0 (0.0%) |
| Graduate Degree | 0 (0.0%) | 0 (0.0%) |
| Total | 31 (100.0%) | 0 (0.0%) |
Employment Characteristics in Hebron
Employment by Class of Employer in Hebron
Among the 3,789 employed individuals in Hebron, private company employees (3,003 | 79.3%), local government employees (233 | 6.1%), and federal government employees (199 | 5.2%) make up the most common classes of employment.
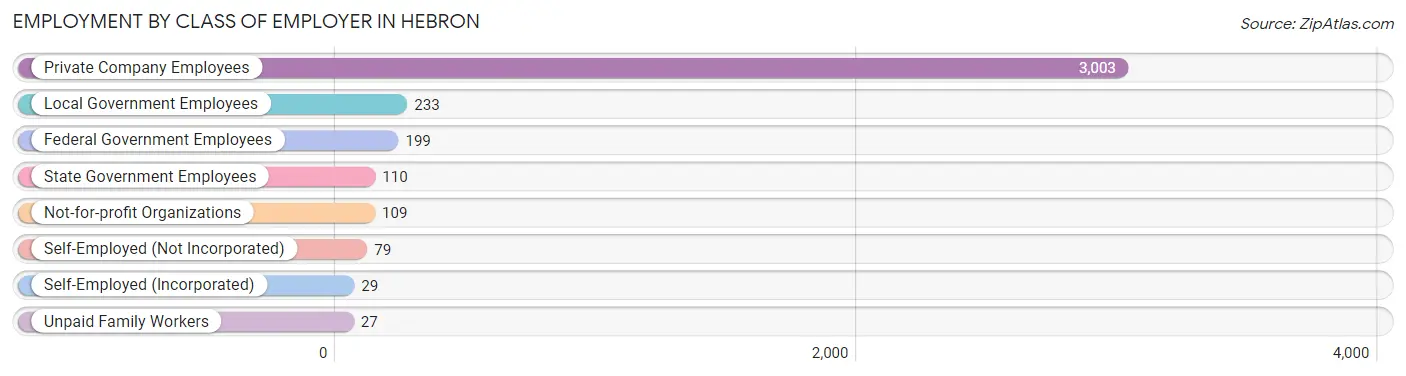
| Employer Class | # Employees | % Employees |
| Private Company Employees | 3,003 | 79.3% |
| Self-Employed (Incorporated) | 29 | 0.8% |
| Self-Employed (Not Incorporated) | 79 | 2.1% |
| Not-for-profit Organizations | 109 | 2.9% |
| Local Government Employees | 233 | 6.1% |
| State Government Employees | 110 | 2.9% |
| Federal Government Employees | 199 | 5.2% |
| Unpaid Family Workers | 27 | 0.7% |
| Total | 3,789 | 100.0% |
Employment Status by Age in Hebron
According to the labor force statistics for Hebron, out of the total population over 16 years of age (4,824), 83.6% or 4,033 individuals are in the labor force, with 1.7% or 69 of them unemployed. The age group with the highest labor force participation rate is 30 to 34 years, with 100.0% or 394 individuals in the labor force. Within the labor force, the 16 to 19 years age range has the highest percentage of unemployed individuals, with 17.0% or 57 of them being unemployed.
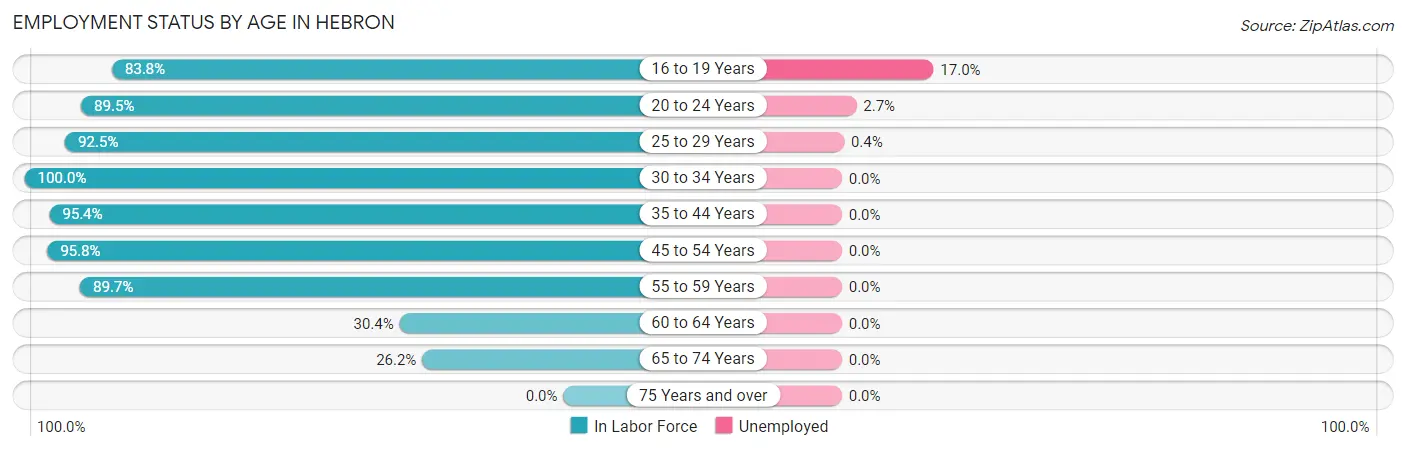
| Age Bracket | In Labor Force | Unemployed |
| 16 to 19 Years | 335 (83.8%) | 57 (17.0%) |
| 20 to 24 Years | 407 (89.5%) | 11 (2.7%) |
| 25 to 29 Years | 494 (92.5%) | 2 (0.4%) |
| 30 to 34 Years | 394 (100.0%) | 0 (0.0%) |
| 35 to 44 Years | 1,048 (95.4%) | 0 (0.0%) |
| 45 to 54 Years | 805 (95.8%) | 0 (0.0%) |
| 55 to 59 Years | 399 (89.7%) | 0 (0.0%) |
| 60 to 64 Years | 101 (30.4%) | 0 (0.0%) |
| 65 to 74 Years | 50 (26.2%) | 0 (0.0%) |
| 75 Years and over | 0 (0.0%) | 0 (0.0%) |
| Total | 4,033 (83.6%) | 69 (1.7%) |
Employment Status by Educational Attainment in Hebron
According to labor force statistics for Hebron, 88.9% of individuals (3,240) out of the total population between 25 and 64 years of age (3,644) are in the labor force, with 0.1% or 3 of them being unemployed. The group with the highest labor force participation rate are those with the educational attainment of bachelor's degree or higher, with 93.6% or 940 individuals in the labor force. Within the labor force, individuals with high school diploma education have the highest percentage of unemployment, with 0.3% or 2 of them being unemployed.
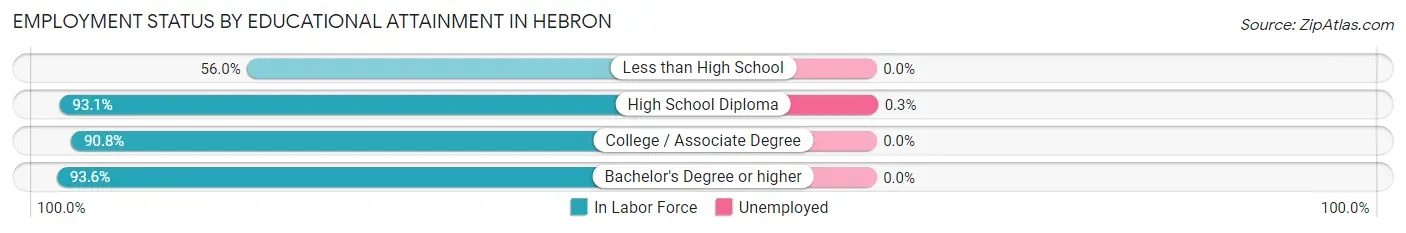
| Educational Attainment | In Labor Force | Unemployed |
| Less than High School | 187 (56.0%) | 0 (0.0%) |
| High School Diploma | 784 (93.1%) | 3 (0.3%) |
| College / Associate Degree | 1,329 (90.8%) | 0 (0.0%) |
| Bachelor's Degree or higher | 940 (93.6%) | 0 (0.0%) |
| Total | 3,240 (88.9%) | 4 (0.1%) |
Employment Occupations by Sex in Hebron
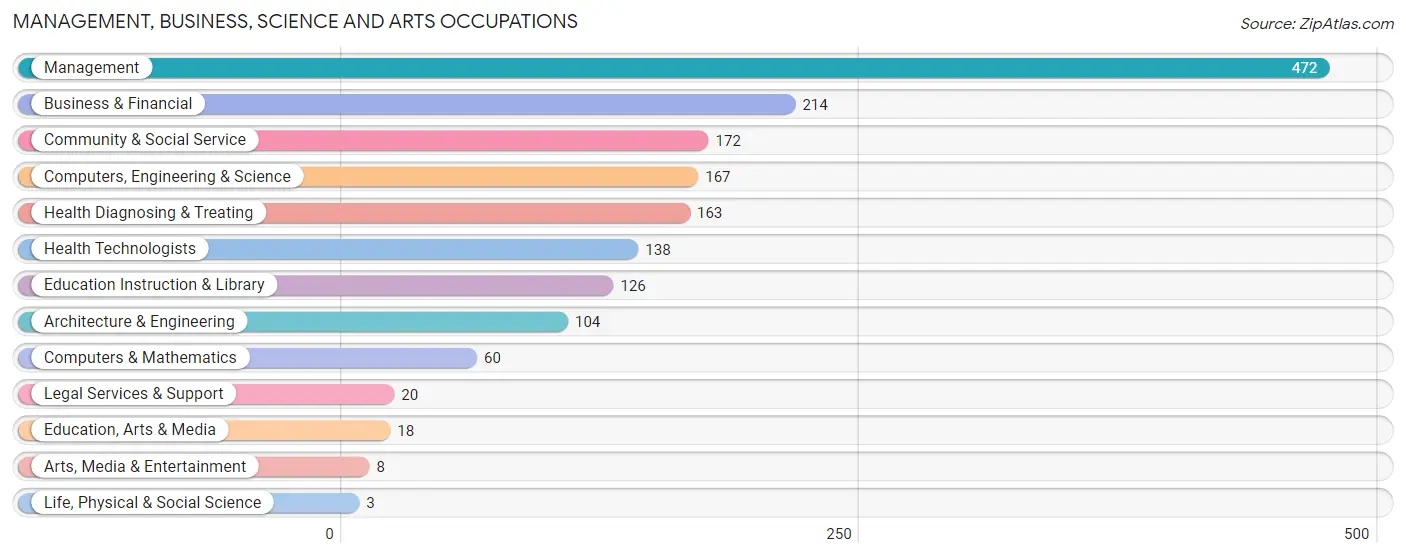
Management, Business, Science and Arts Occupations
The most common Management, Business, Science and Arts occupations in Hebron are Management (472 | 12.0%), Business & Financial (214 | 5.4%), Community & Social Service (172 | 4.4%), Computers, Engineering & Science (167 | 4.2%), and Health Diagnosing & Treating (163 | 4.1%).
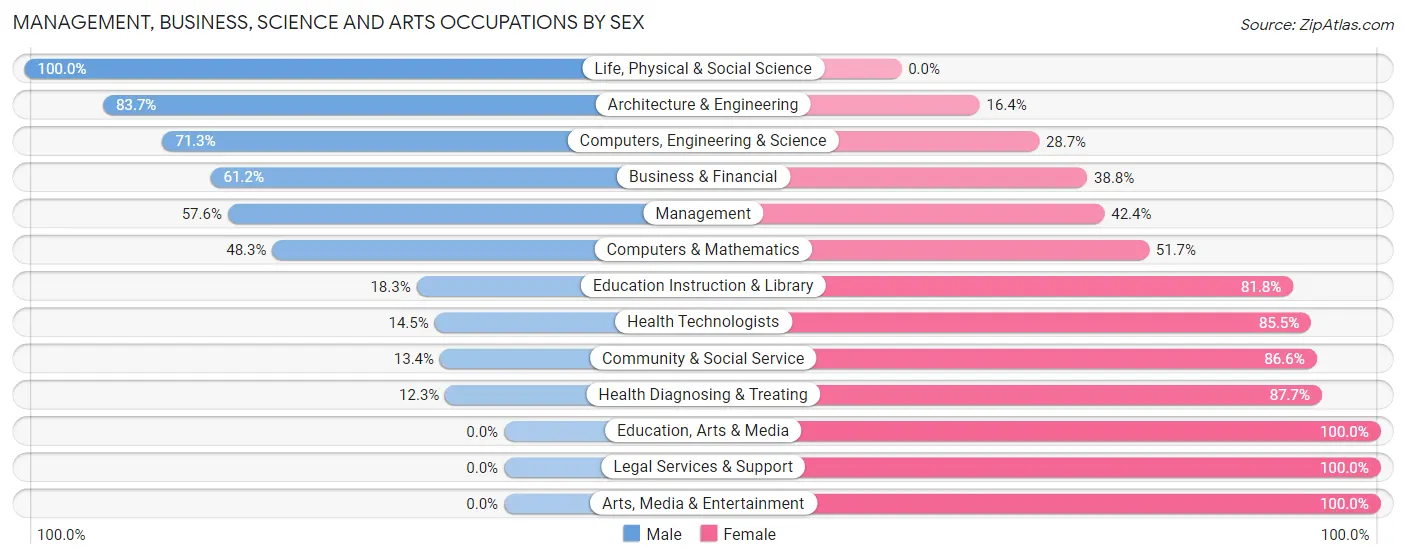
Management, Business, Science and Arts Occupations by Sex
Within the Management, Business, Science and Arts occupations in Hebron, the most male-oriented occupations are Life, Physical & Social Science (100.0%), Architecture & Engineering (83.7%), and Computers, Engineering & Science (71.3%), while the most female-oriented occupations are Education, Arts & Media (100.0%), Legal Services & Support (100.0%), and Arts, Media & Entertainment (100.0%).
| Occupation | Male | Female |
| Management | 272 (57.6%) | 200 (42.4%) |
| Business & Financial | 131 (61.2%) | 83 (38.8%) |
| Computers, Engineering & Science | 119 (71.3%) | 48 (28.7%) |
| Computers & Mathematics | 29 (48.3%) | 31 (51.7%) |
| Architecture & Engineering | 87 (83.7%) | 17 (16.4%) |
| Life, Physical & Social Science | 3 (100.0%) | 0 (0.0%) |
| Community & Social Service | 23 (13.4%) | 149 (86.6%) |
| Education, Arts & Media | 0 (0.0%) | 18 (100.0%) |
| Legal Services & Support | 0 (0.0%) | 20 (100.0%) |
| Education Instruction & Library | 23 (18.2%) | 103 (81.8%) |
| Arts, Media & Entertainment | 0 (0.0%) | 8 (100.0%) |
| Health Diagnosing & Treating | 20 (12.3%) | 143 (87.7%) |
| Health Technologists | 20 (14.5%) | 118 (85.5%) |
| Total (Category) | 565 (47.6%) | 623 (52.4%) |
| Total (Overall) | 1,922 (48.7%) | 2,023 (51.3%) |
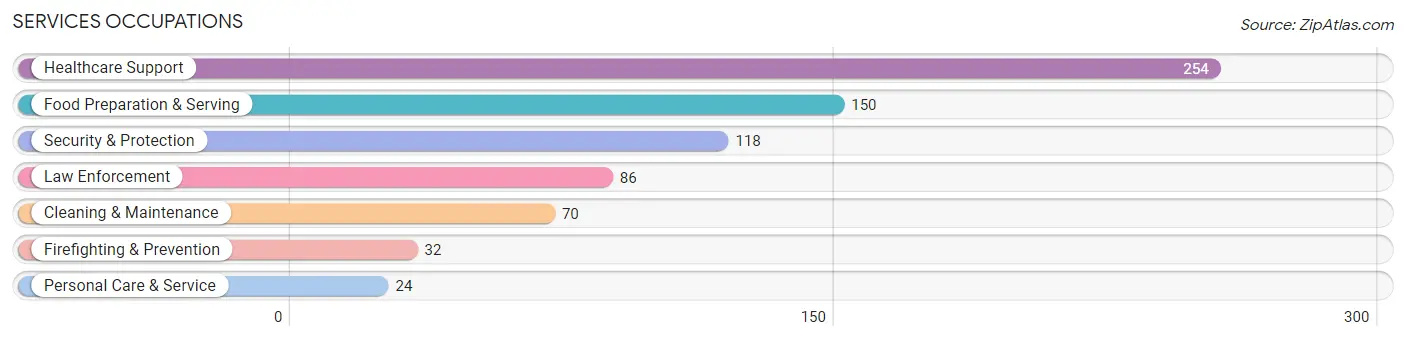
Services Occupations
The most common Services occupations in Hebron are Healthcare Support (254 | 6.4%), Food Preparation & Serving (150 | 3.8%), Security & Protection (118 | 3.0%), Law Enforcement (86 | 2.2%), and Cleaning & Maintenance (70 | 1.8%).
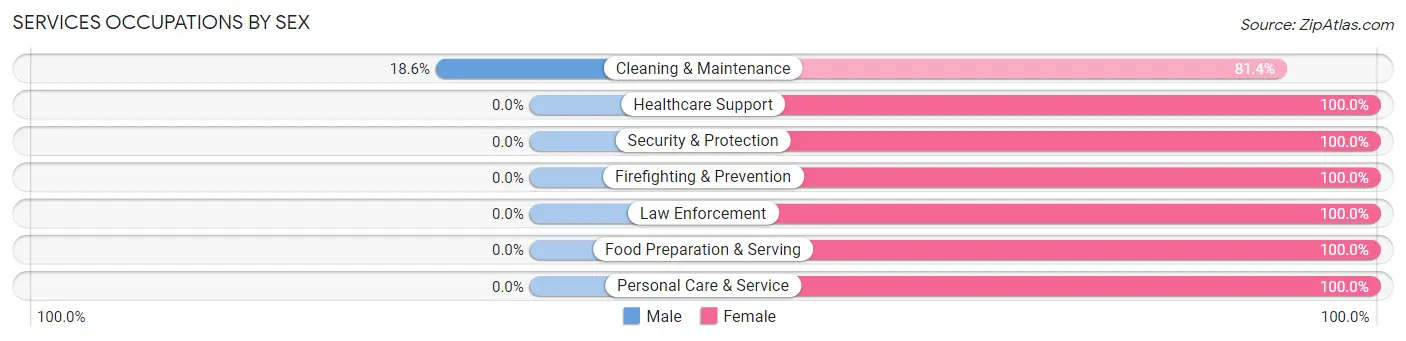
Services Occupations by Sex
| Occupation | Male | Female |
| Healthcare Support | 0 (0.0%) | 254 (100.0%) |
| Security & Protection | 0 (0.0%) | 118 (100.0%) |
| Firefighting & Prevention | 0 (0.0%) | 32 (100.0%) |
| Law Enforcement | 0 (0.0%) | 86 (100.0%) |
| Food Preparation & Serving | 0 (0.0%) | 150 (100.0%) |
| Cleaning & Maintenance | 13 (18.6%) | 57 (81.4%) |
| Personal Care & Service | 0 (0.0%) | 24 (100.0%) |
| Total (Category) | 13 (2.1%) | 603 (97.9%) |
| Total (Overall) | 1,922 (48.7%) | 2,023 (51.3%) |
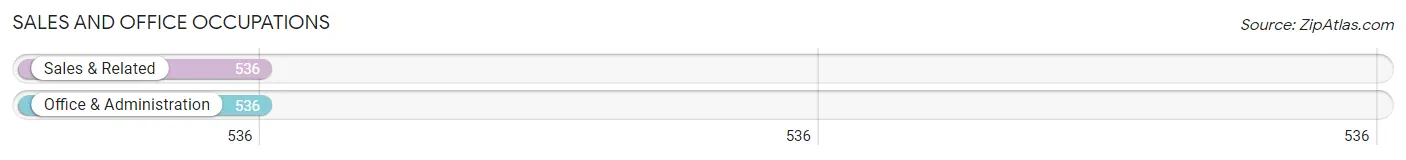
Sales and Office Occupations
The most common Sales and Office occupations in Hebron are Sales & Related (536 | 13.6%), and Office & Administration (536 | 13.6%).
Sales and Office Occupations by Sex
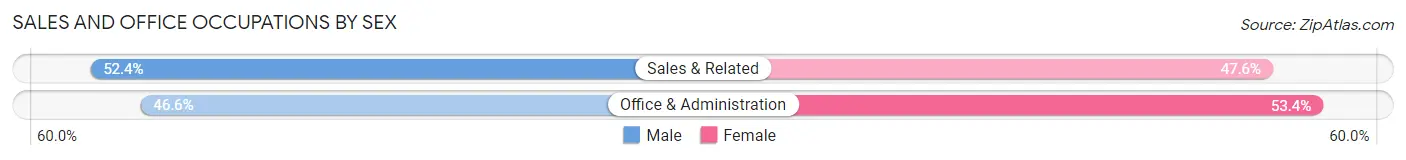
| Occupation | Male | Female |
| Sales & Related | 281 (52.4%) | 255 (47.6%) |
| Office & Administration | 250 (46.6%) | 286 (53.4%) |
| Total (Category) | 531 (49.5%) | 541 (50.5%) |
| Total (Overall) | 1,922 (48.7%) | 2,023 (51.3%) |
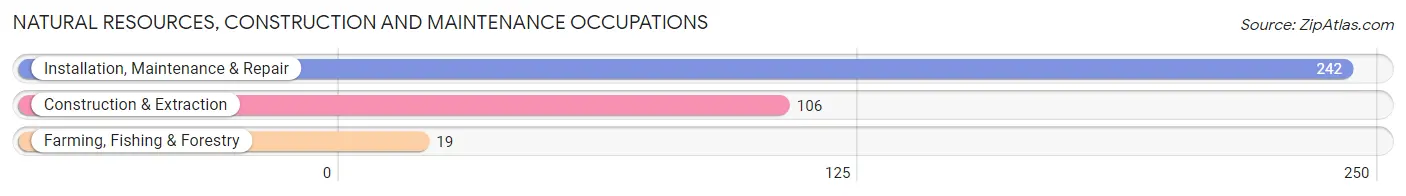
Natural Resources, Construction and Maintenance Occupations
The most common Natural Resources, Construction and Maintenance occupations in Hebron are Installation, Maintenance & Repair (242 | 6.1%), Construction & Extraction (106 | 2.7%), and Farming, Fishing & Forestry (19 | 0.5%).
Natural Resources, Construction and Maintenance Occupations by Sex
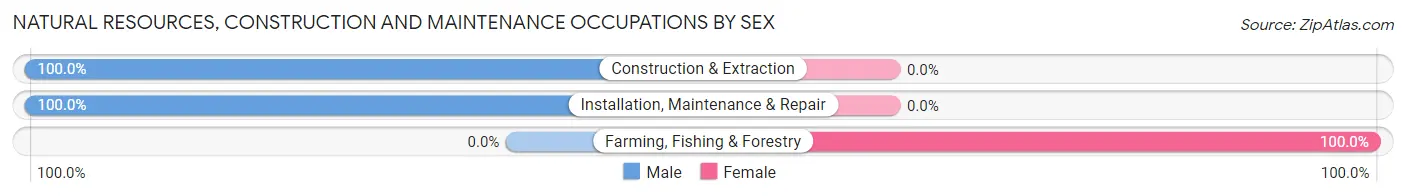
| Occupation | Male | Female |
| Farming, Fishing & Forestry | 0 (0.0%) | 19 (100.0%) |
| Construction & Extraction | 106 (100.0%) | 0 (0.0%) |
| Installation, Maintenance & Repair | 242 (100.0%) | 0 (0.0%) |
| Total (Category) | 348 (94.8%) | 19 (5.2%) |
| Total (Overall) | 1,922 (48.7%) | 2,023 (51.3%) |
Production, Transportation and Moving Occupations
The most common Production, Transportation and Moving occupations in Hebron are Transportation (345 | 8.7%), Production (205 | 5.2%), and Material Moving (152 | 3.8%).

Production, Transportation and Moving Occupations by Sex
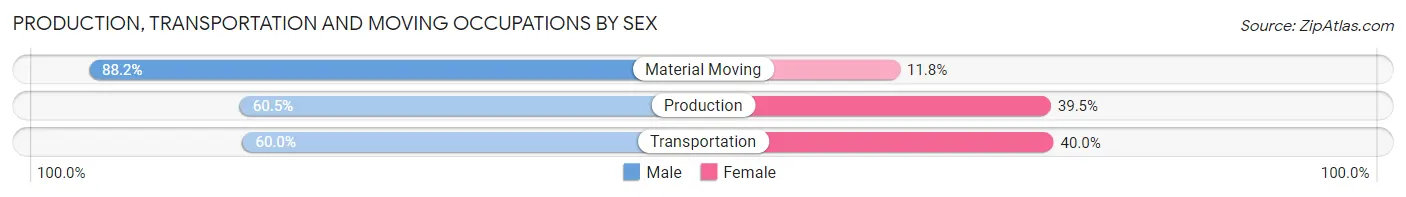
| Occupation | Male | Female |
| Production | 124 (60.5%) | 81 (39.5%) |
| Transportation | 207 (60.0%) | 138 (40.0%) |
| Material Moving | 134 (88.2%) | 18 (11.8%) |
| Total (Category) | 465 (66.2%) | 237 (33.8%) |
| Total (Overall) | 1,922 (48.7%) | 2,023 (51.3%) |
Employment Industries by Sex in Hebron
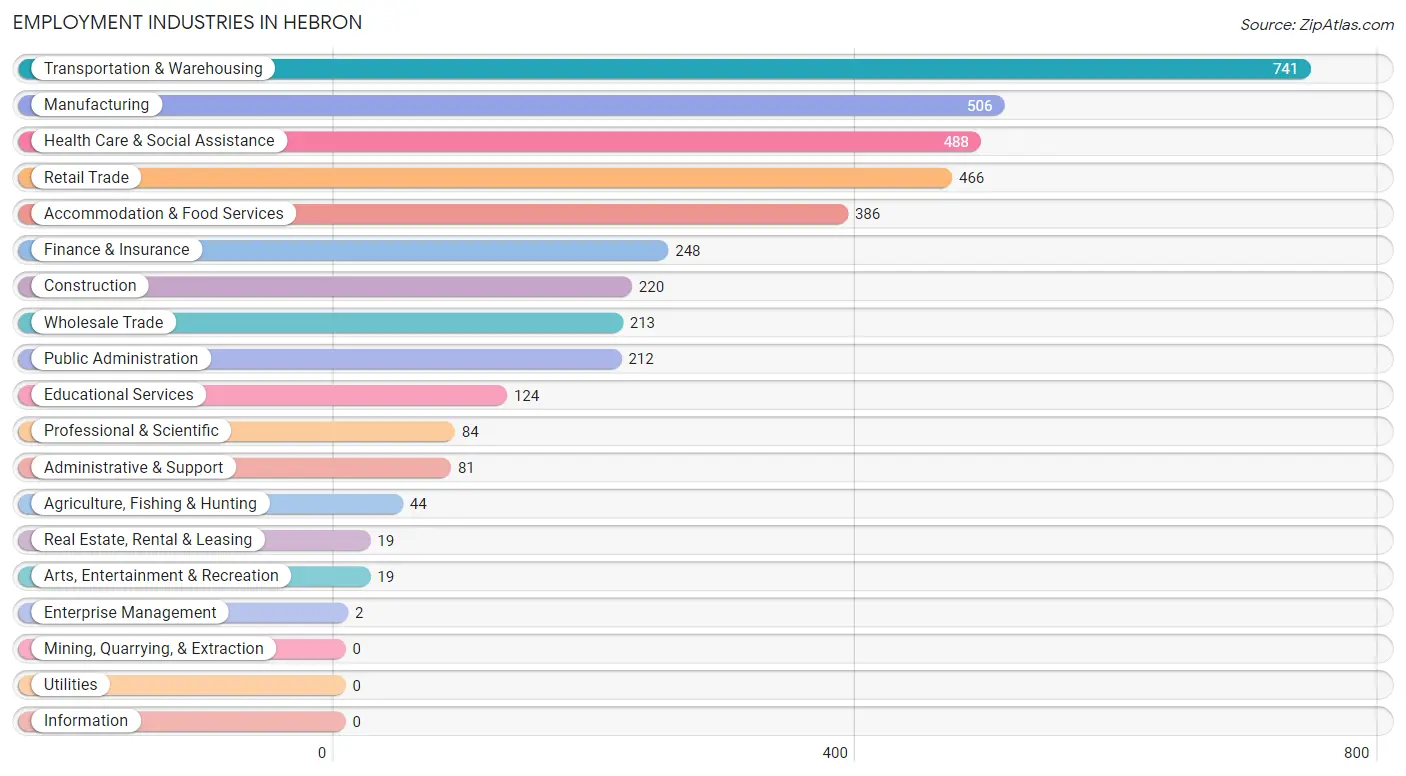
Employment Industries in Hebron
The major employment industries in Hebron include Transportation & Warehousing (741 | 18.8%), Manufacturing (506 | 12.8%), Health Care & Social Assistance (488 | 12.4%), Retail Trade (466 | 11.8%), and Accommodation & Food Services (386 | 9.8%).
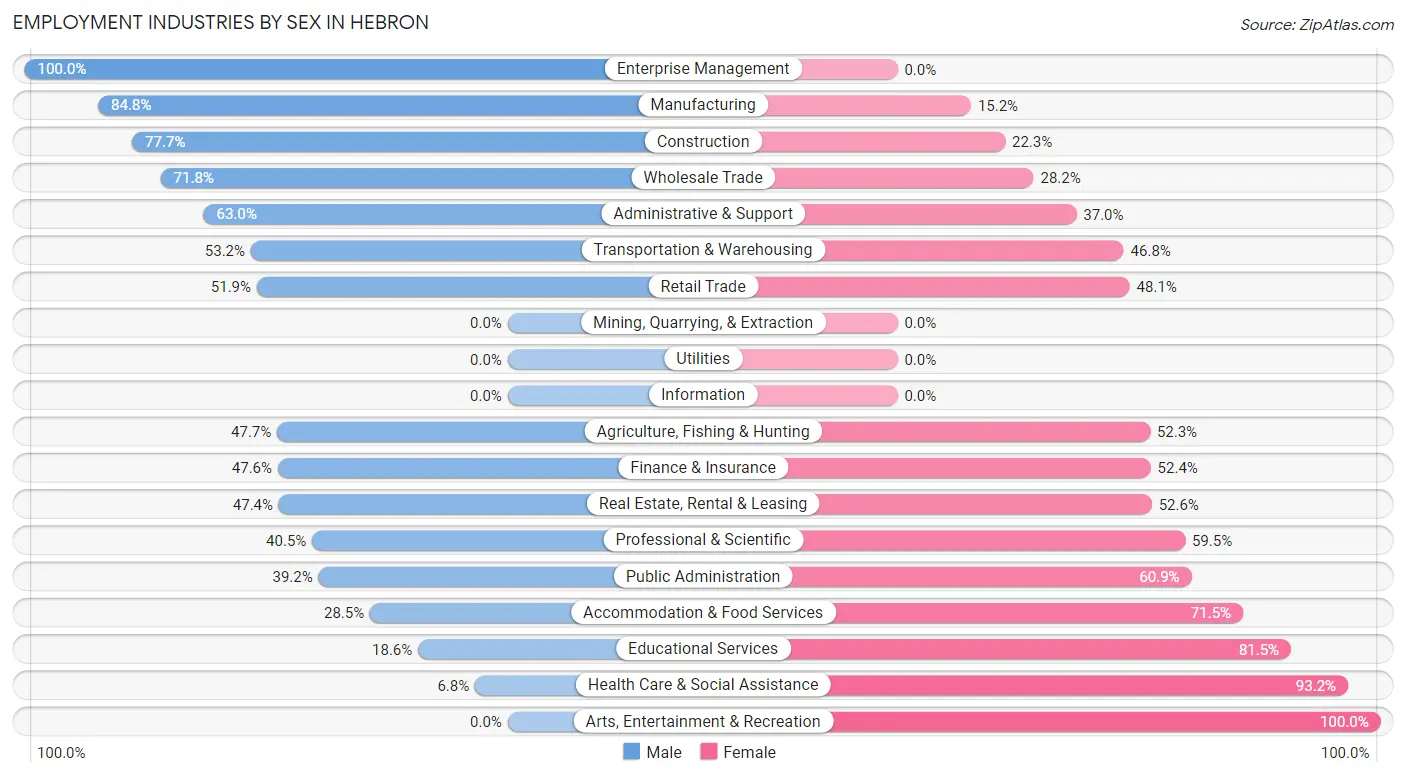
Employment Industries by Sex in Hebron
The Hebron industries that see more men than women are Enterprise Management (100.0%), Manufacturing (84.8%), and Construction (77.7%), whereas the industries that tend to have a higher number of women are Arts, Entertainment & Recreation (100.0%), Health Care & Social Assistance (93.2%), and Educational Services (81.5%).
| Industry | Male | Female |
| Agriculture, Fishing & Hunting | 21 (47.7%) | 23 (52.3%) |
| Mining, Quarrying, & Extraction | 0 (0.0%) | 0 (0.0%) |
| Construction | 171 (77.7%) | 49 (22.3%) |
| Manufacturing | 429 (84.8%) | 77 (15.2%) |
| Wholesale Trade | 153 (71.8%) | 60 (28.2%) |
| Retail Trade | 242 (51.9%) | 224 (48.1%) |
| Transportation & Warehousing | 394 (53.2%) | 347 (46.8%) |
| Utilities | 0 (0.0%) | 0 (0.0%) |
| Information | 0 (0.0%) | 0 (0.0%) |
| Finance & Insurance | 118 (47.6%) | 130 (52.4%) |
| Real Estate, Rental & Leasing | 9 (47.4%) | 10 (52.6%) |
| Professional & Scientific | 34 (40.5%) | 50 (59.5%) |
| Enterprise Management | 2 (100.0%) | 0 (0.0%) |
| Administrative & Support | 51 (63.0%) | 30 (37.0%) |
| Educational Services | 23 (18.5%) | 101 (81.5%) |
| Health Care & Social Assistance | 33 (6.8%) | 455 (93.2%) |
| Arts, Entertainment & Recreation | 0 (0.0%) | 19 (100.0%) |
| Accommodation & Food Services | 110 (28.5%) | 276 (71.5%) |
| Public Administration | 83 (39.2%) | 129 (60.9%) |
| Total | 1,922 (48.7%) | 2,023 (51.3%) |
Education in Hebron
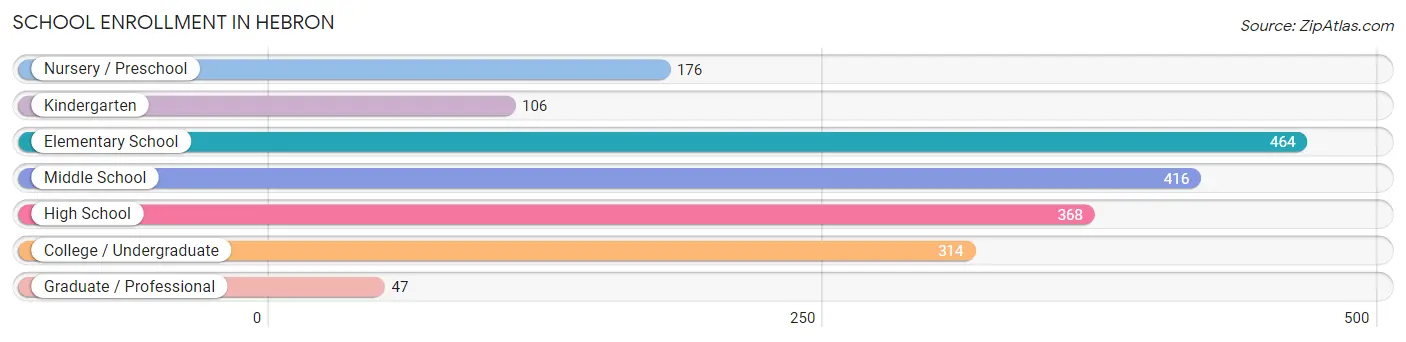
School Enrollment in Hebron
The most common levels of schooling among the 1,891 students in Hebron are elementary school (464 | 24.5%), middle school (416 | 22.0%), and high school (368 | 19.5%).
| School Level | # Students | % Students |
| Nursery / Preschool | 176 | 9.3% |
| Kindergarten | 106 | 5.6% |
| Elementary School | 464 | 24.5% |
| Middle School | 416 | 22.0% |
| High School | 368 | 19.5% |
| College / Undergraduate | 314 | 16.6% |
| Graduate / Professional | 47 | 2.5% |
| Total | 1,891 | 100.0% |
School Enrollment by Age by Funding Source in Hebron
Out of a total of 1,891 students who are enrolled in schools in Hebron, 233 (12.3%) attend a private institution, while the remaining 1,658 (87.7%) are enrolled in public schools. The age group of 35 years and over has the highest likelihood of being enrolled in private schools, with 21 (41.2% in the age bracket) enrolled. Conversely, the age group of 15 to 17 year olds has the lowest likelihood of being enrolled in a private school, with 360 (100.0% in the age bracket) attending a public institution.
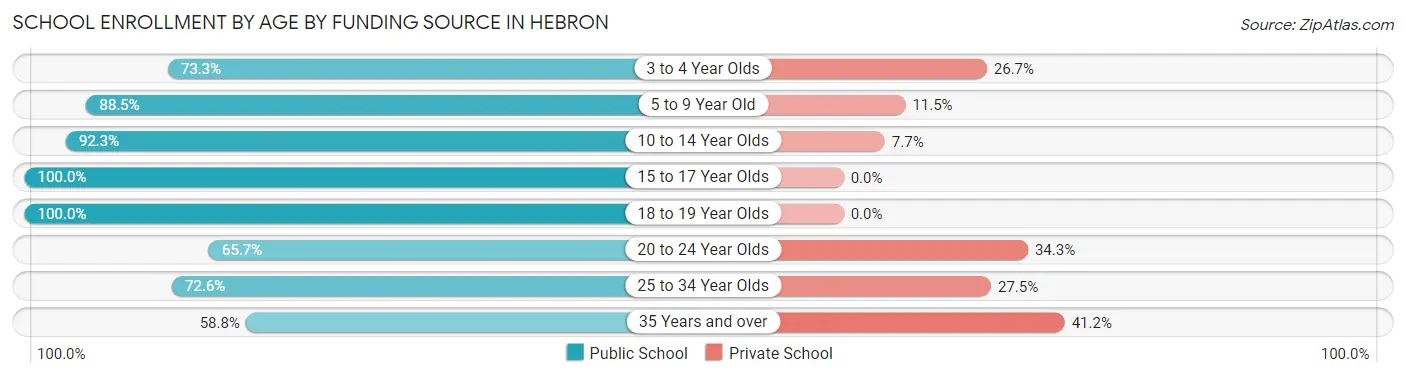
| Age Bracket | Public School | Private School |
| 3 to 4 Year Olds | 66 (73.3%) | 24 (26.7%) |
| 5 to 9 Year Old | 523 (88.5%) | 68 (11.5%) |
| 10 to 14 Year Olds | 433 (92.3%) | 36 (7.7%) |
| 15 to 17 Year Olds | 360 (100.0%) | 0 (0.0%) |
| 18 to 19 Year Olds | 78 (100.0%) | 0 (0.0%) |
| 20 to 24 Year Olds | 132 (65.7%) | 69 (34.3%) |
| 25 to 34 Year Olds | 37 (72.6%) | 14 (27.5%) |
| 35 Years and over | 30 (58.8%) | 21 (41.2%) |
| Total | 1,658 (87.7%) | 233 (12.3%) |
Educational Attainment by Field of Study in Hebron
Business (225 | 18.9%), arts & humanities (224 | 18.8%), science & technology (178 | 15.0%), education (121 | 10.2%), and engineering (80 | 6.7%) are the most common fields of study among 1,190 individuals in Hebron who have obtained a bachelor's degree or higher.
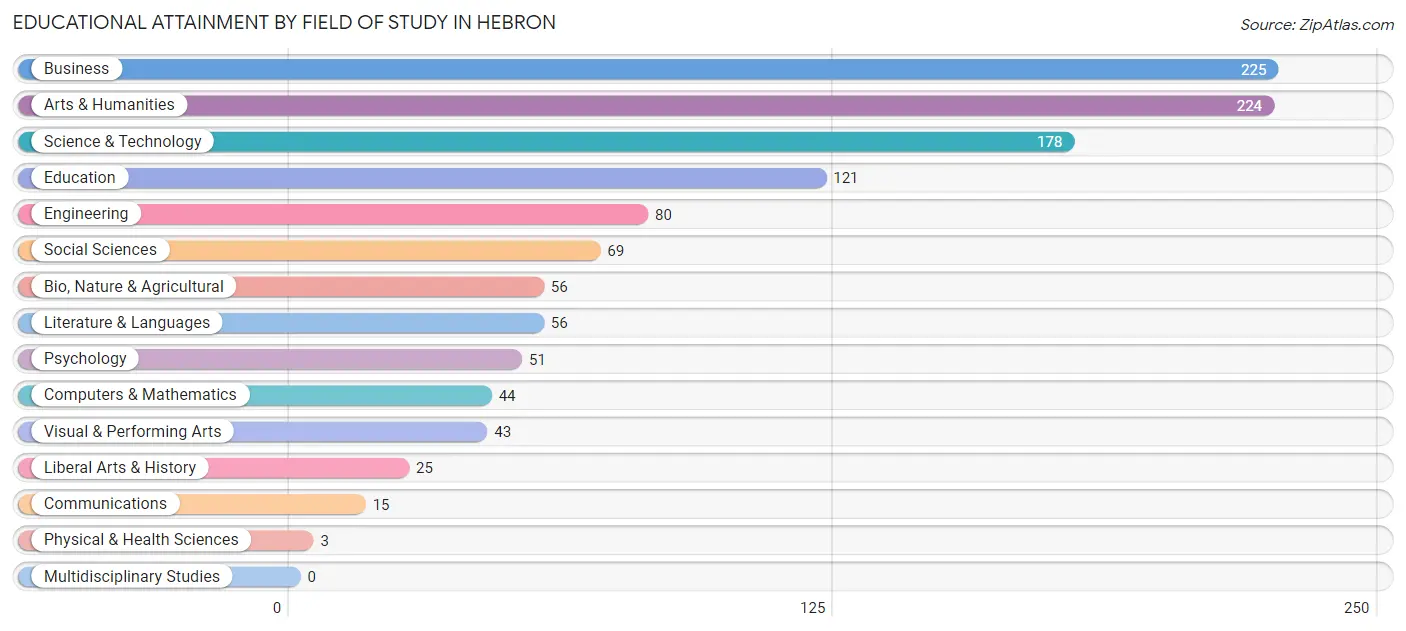
| Field of Study | # Graduates | % Graduates |
| Computers & Mathematics | 44 | 3.7% |
| Bio, Nature & Agricultural | 56 | 4.7% |
| Physical & Health Sciences | 3 | 0.3% |
| Psychology | 51 | 4.3% |
| Social Sciences | 69 | 5.8% |
| Engineering | 80 | 6.7% |
| Multidisciplinary Studies | 0 | 0.0% |
| Science & Technology | 178 | 15.0% |
| Business | 225 | 18.9% |
| Education | 121 | 10.2% |
| Literature & Languages | 56 | 4.7% |
| Liberal Arts & History | 25 | 2.1% |
| Visual & Performing Arts | 43 | 3.6% |
| Communications | 15 | 1.3% |
| Arts & Humanities | 224 | 18.8% |
| Total | 1,190 | 100.0% |
Transportation & Commute in Hebron
Vehicle Availability by Sex in Hebron
The most prevalent vehicle ownership categories in Hebron are males with 2 vehicles (762, accounting for 41.0%) and females with 2 vehicles (571, making up 39.5%).
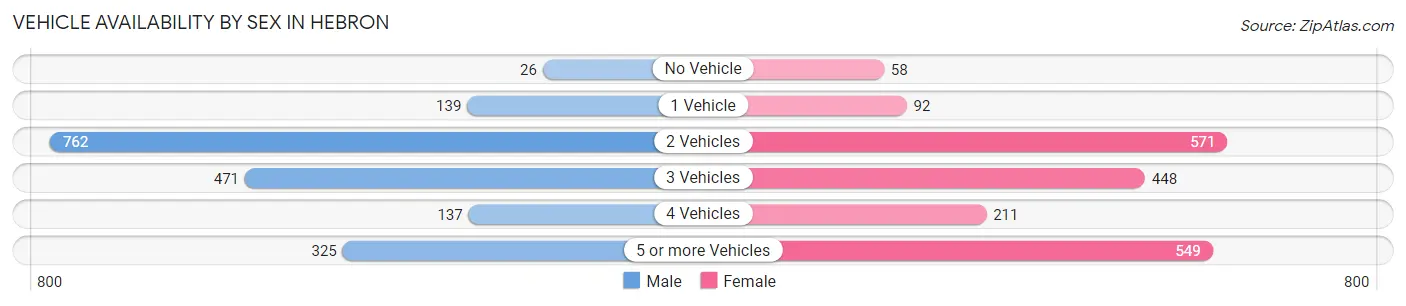
| Vehicles Available | Male | Female |
| No Vehicle | 26 (1.4%) | 58 (3.0%) |
| 1 Vehicle | 139 (7.5%) | 92 (4.8%) |
| 2 Vehicles | 762 (41.0%) | 571 (29.6%) |
| 3 Vehicles | 471 (25.3%) | 448 (23.2%) |
| 4 Vehicles | 137 (7.4%) | 211 (10.9%) |
| 5 or more Vehicles | 325 (17.5%) | 549 (28.5%) |
| Total | 1,860 (100.0%) | 1,929 (100.0%) |
Commute Time in Hebron
The most frequently occuring commute durations in Hebron are 5 to 9 minutes (836 commuters, 23.7%), 15 to 19 minutes (702 commuters, 19.9%), and 20 to 24 minutes (645 commuters, 18.3%).
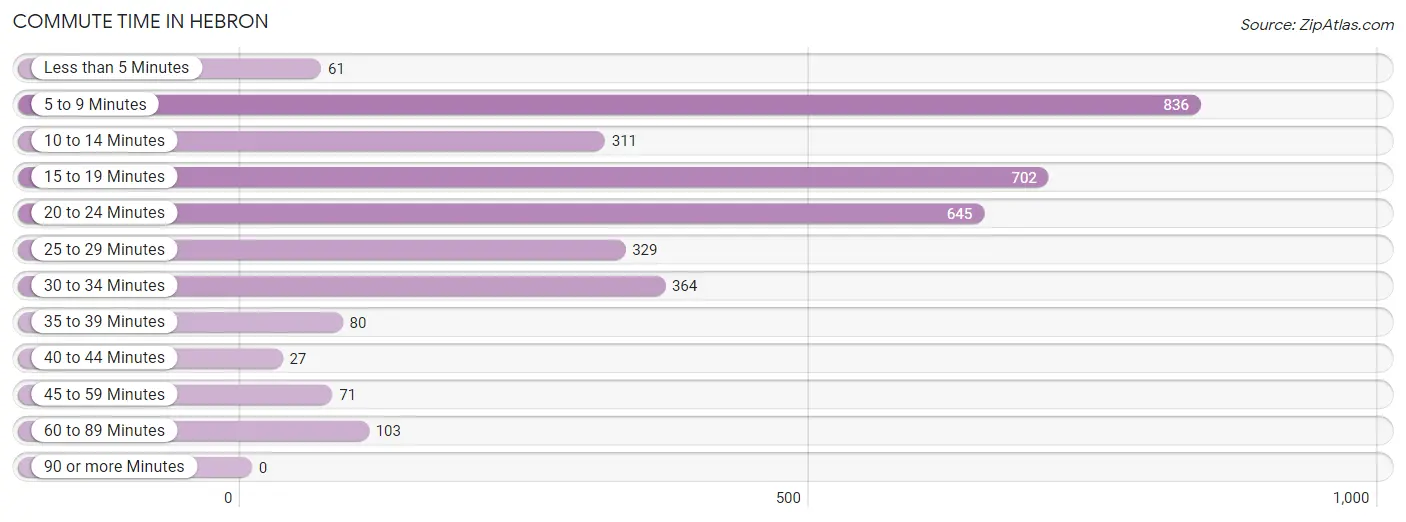
| Commute Time | # Commuters | % Commuters |
| Less than 5 Minutes | 61 | 1.7% |
| 5 to 9 Minutes | 836 | 23.7% |
| 10 to 14 Minutes | 311 | 8.8% |
| 15 to 19 Minutes | 702 | 19.9% |
| 20 to 24 Minutes | 645 | 18.3% |
| 25 to 29 Minutes | 329 | 9.3% |
| 30 to 34 Minutes | 364 | 10.3% |
| 35 to 39 Minutes | 80 | 2.3% |
| 40 to 44 Minutes | 27 | 0.8% |
| 45 to 59 Minutes | 71 | 2.0% |
| 60 to 89 Minutes | 103 | 2.9% |
| 90 or more Minutes | 0 | 0.0% |
Commute Time by Sex in Hebron
The most common commute times in Hebron are 5 to 9 minutes (405 commuters, 23.1%) for males and 20 to 24 minutes (477 commuters, 26.9%) for females.
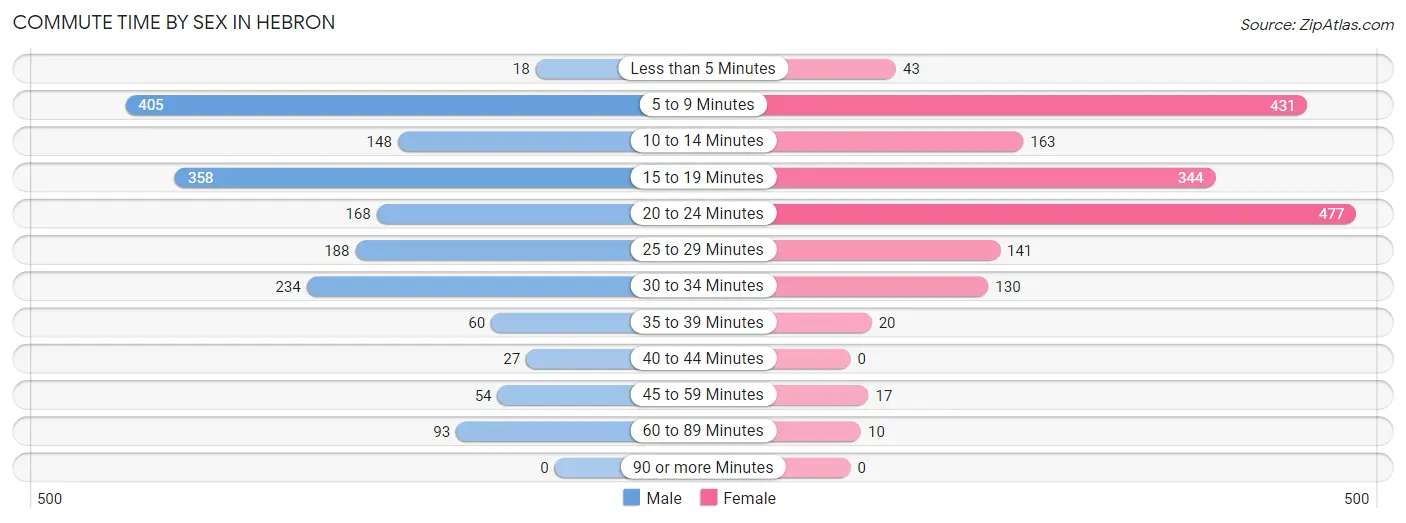
| Commute Time | Male | Female |
| Less than 5 Minutes | 18 (1.0%) | 43 (2.4%) |
| 5 to 9 Minutes | 405 (23.1%) | 431 (24.3%) |
| 10 to 14 Minutes | 148 (8.4%) | 163 (9.2%) |
| 15 to 19 Minutes | 358 (20.4%) | 344 (19.4%) |
| 20 to 24 Minutes | 168 (9.6%) | 477 (26.9%) |
| 25 to 29 Minutes | 188 (10.7%) | 141 (7.9%) |
| 30 to 34 Minutes | 234 (13.4%) | 130 (7.3%) |
| 35 to 39 Minutes | 60 (3.4%) | 20 (1.1%) |
| 40 to 44 Minutes | 27 (1.5%) | 0 (0.0%) |
| 45 to 59 Minutes | 54 (3.1%) | 17 (1.0%) |
| 60 to 89 Minutes | 93 (5.3%) | 10 (0.6%) |
| 90 or more Minutes | 0 (0.0%) | 0 (0.0%) |
Time of Departure to Work by Sex in Hebron
The most frequent times of departure to work in Hebron are 4:00 PM to 11:59 PM (410, 23.4%) for males and 7:00 AM to 7:29 AM (448, 25.2%) for females.
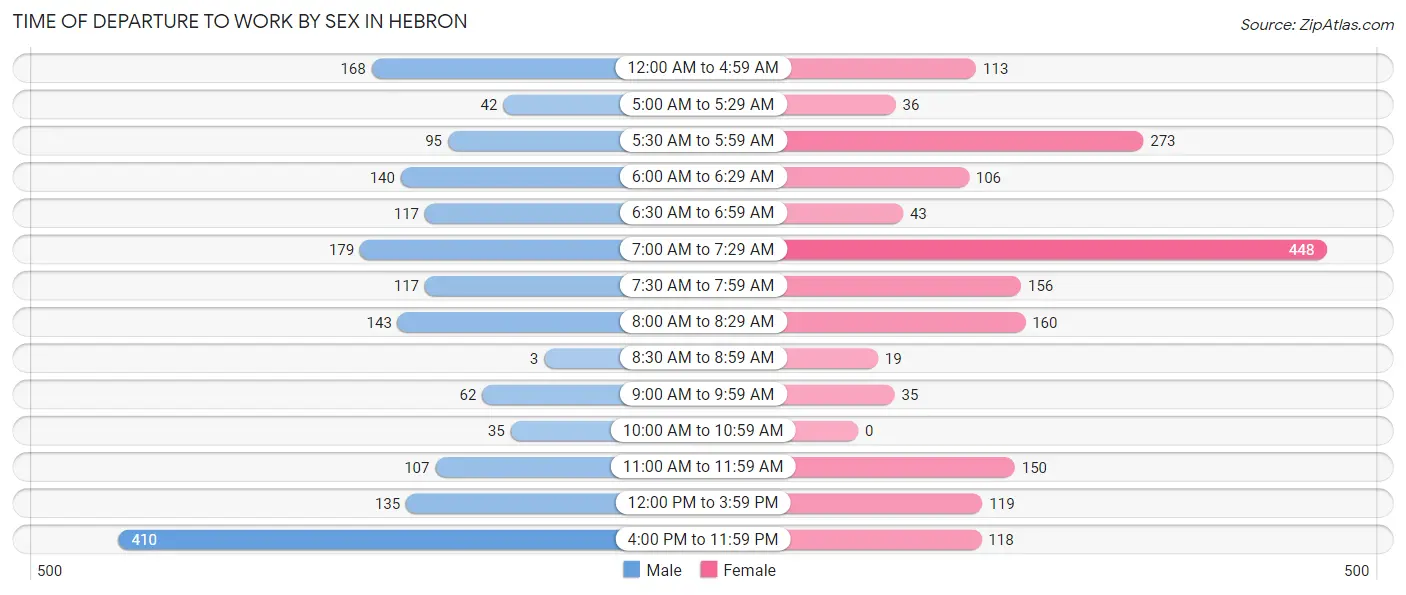
| Time of Departure | Male | Female |
| 12:00 AM to 4:59 AM | 168 (9.6%) | 113 (6.4%) |
| 5:00 AM to 5:29 AM | 42 (2.4%) | 36 (2.0%) |
| 5:30 AM to 5:59 AM | 95 (5.4%) | 273 (15.4%) |
| 6:00 AM to 6:29 AM | 140 (8.0%) | 106 (6.0%) |
| 6:30 AM to 6:59 AM | 117 (6.7%) | 43 (2.4%) |
| 7:00 AM to 7:29 AM | 179 (10.2%) | 448 (25.2%) |
| 7:30 AM to 7:59 AM | 117 (6.7%) | 156 (8.8%) |
| 8:00 AM to 8:29 AM | 143 (8.2%) | 160 (9.0%) |
| 8:30 AM to 8:59 AM | 3 (0.2%) | 19 (1.1%) |
| 9:00 AM to 9:59 AM | 62 (3.5%) | 35 (2.0%) |
| 10:00 AM to 10:59 AM | 35 (2.0%) | 0 (0.0%) |
| 11:00 AM to 11:59 AM | 107 (6.1%) | 150 (8.5%) |
| 12:00 PM to 3:59 PM | 135 (7.7%) | 119 (6.7%) |
| 4:00 PM to 11:59 PM | 410 (23.4%) | 118 (6.6%) |
| Total | 1,753 (100.0%) | 1,776 (100.0%) |
Housing Occupancy in Hebron
Occupancy by Ownership in Hebron
Of the total 1,934 dwellings in Hebron, owner-occupied units account for 1,576 (81.5%), while renter-occupied units make up 358 (18.5%).
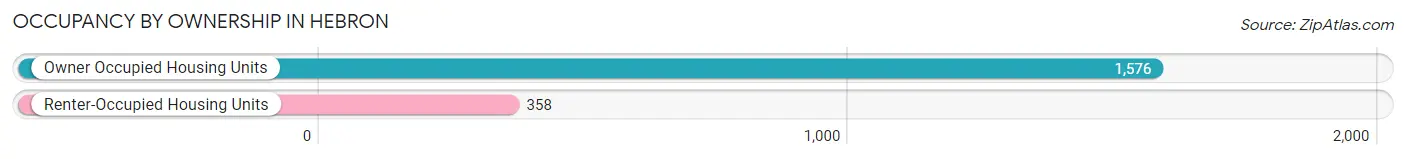
| Occupancy | # Housing Units | % Housing Units |
| Owner Occupied Housing Units | 1,576 | 81.5% |
| Renter-Occupied Housing Units | 358 | 18.5% |
| Total Occupied Housing Units | 1,934 | 100.0% |
Occupancy by Household Size in Hebron
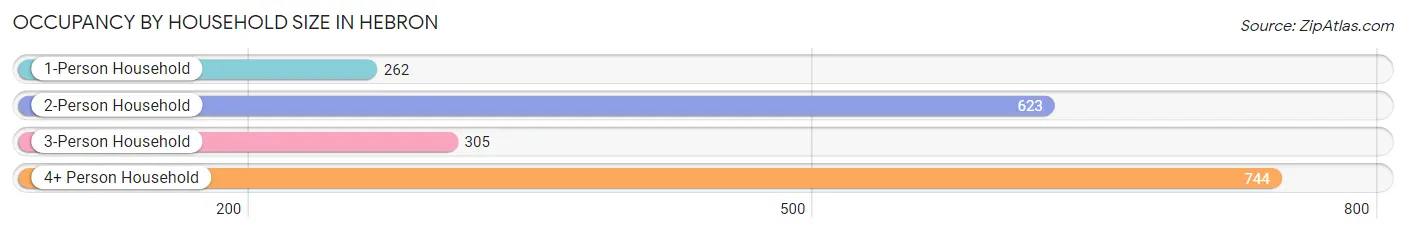
| Household Size | # Housing Units | % Housing Units |
| 1-Person Household | 262 | 13.6% |
| 2-Person Household | 623 | 32.2% |
| 3-Person Household | 305 | 15.8% |
| 4+ Person Household | 744 | 38.5% |
| Total Housing Units | 1,934 | 100.0% |
Occupancy by Ownership by Household Size in Hebron
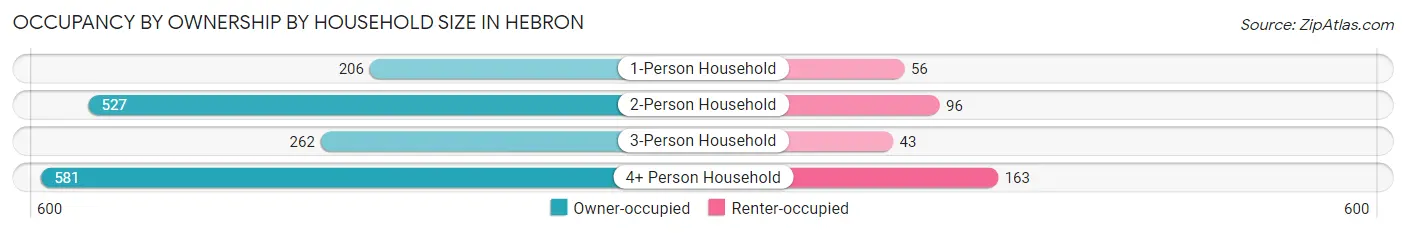
| Household Size | Owner-occupied | Renter-occupied |
| 1-Person Household | 206 (78.6%) | 56 (21.4%) |
| 2-Person Household | 527 (84.6%) | 96 (15.4%) |
| 3-Person Household | 262 (85.9%) | 43 (14.1%) |
| 4+ Person Household | 581 (78.1%) | 163 (21.9%) |
| Total Housing Units | 1,576 (81.5%) | 358 (18.5%) |
Occupancy by Educational Attainment in Hebron
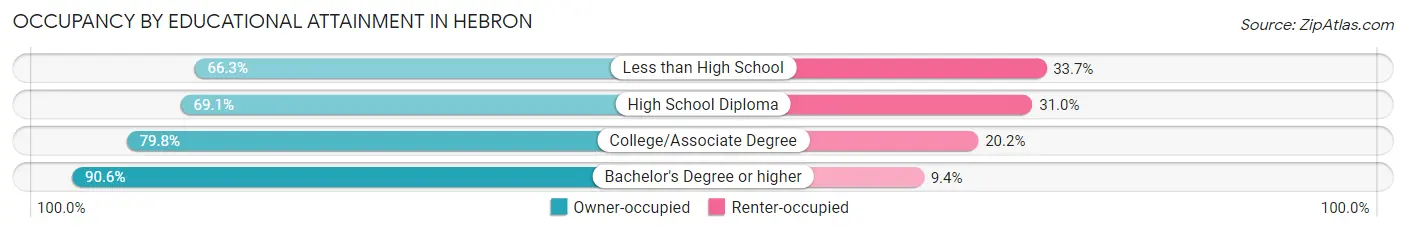
| Household Size | Owner-occupied | Renter-occupied |
| Less than High School | 59 (66.3%) | 30 (33.7%) |
| High School Diploma | 232 (69.1%) | 104 (30.9%) |
| College/Associate Degree | 603 (79.8%) | 153 (20.2%) |
| Bachelor's Degree or higher | 682 (90.6%) | 71 (9.4%) |
Occupancy by Age of Householder in Hebron
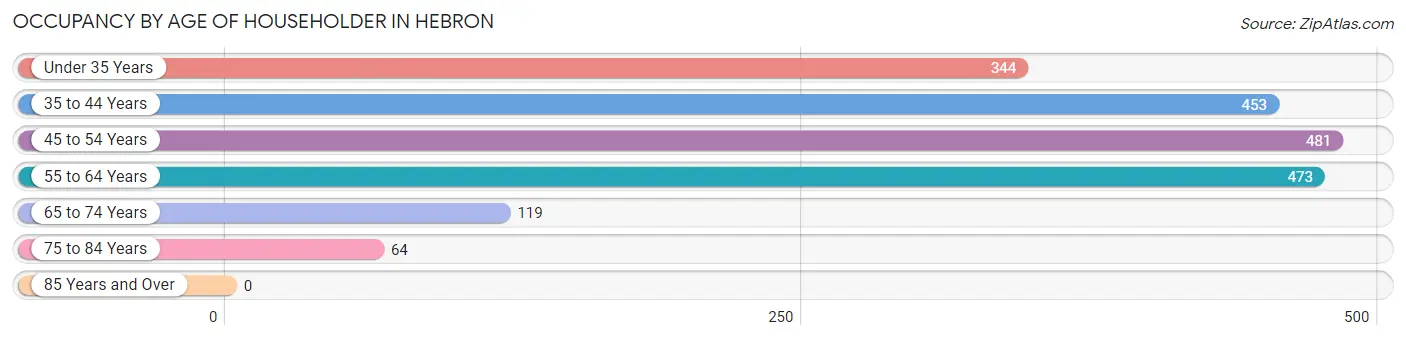
| Age Bracket | # Households | % Households |
| Under 35 Years | 344 | 17.8% |
| 35 to 44 Years | 453 | 23.4% |
| 45 to 54 Years | 481 | 24.9% |
| 55 to 64 Years | 473 | 24.5% |
| 65 to 74 Years | 119 | 6.1% |
| 75 to 84 Years | 64 | 3.3% |
| 85 Years and Over | 0 | 0.0% |
| Total | 1,934 | 100.0% |
Housing Finances in Hebron
Median Income by Occupancy in Hebron
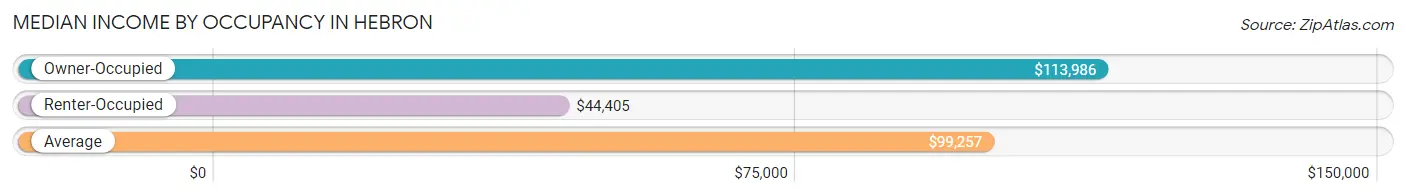
| Occupancy Type | # Households | Median Income |
| Owner-Occupied | 1,576 (81.5%) | $113,986 |
| Renter-Occupied | 358 (18.5%) | $44,405 |
| Average | 1,934 (100.0%) | $99,257 |
Occupancy by Householder Income Bracket in Hebron
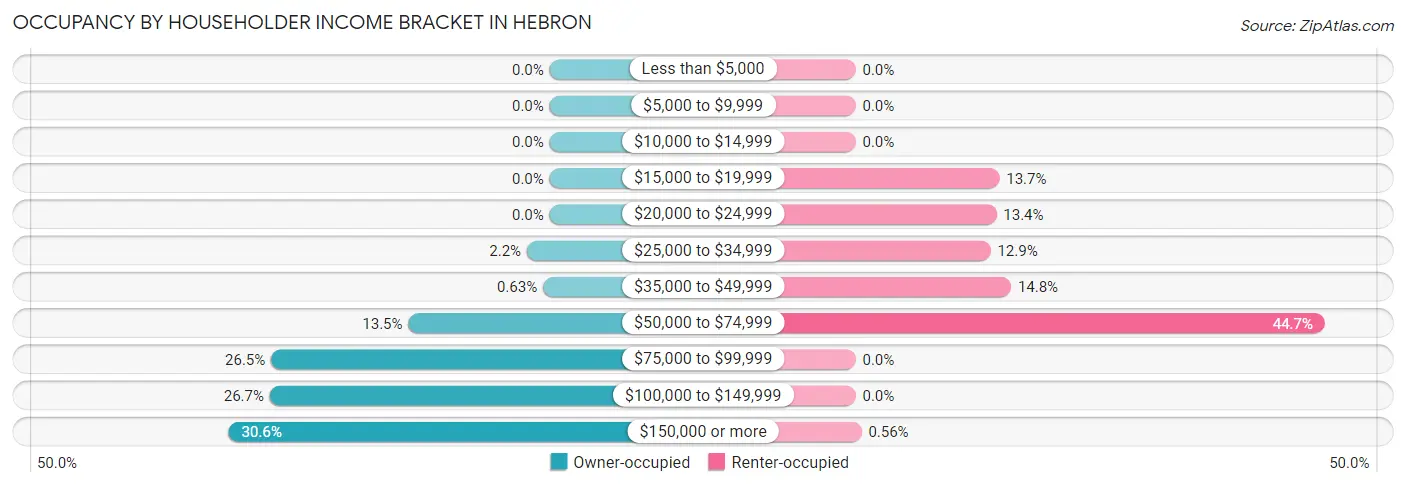
| Income Bracket | Owner-occupied | Renter-occupied |
| Less than $5,000 | 0 (0.0%) | 0 (0.0%) |
| $5,000 to $9,999 | 0 (0.0%) | 0 (0.0%) |
| $10,000 to $14,999 | 0 (0.0%) | 0 (0.0%) |
| $15,000 to $19,999 | 0 (0.0%) | 49 (13.7%) |
| $20,000 to $24,999 | 0 (0.0%) | 48 (13.4%) |
| $25,000 to $34,999 | 34 (2.2%) | 46 (12.9%) |
| $35,000 to $49,999 | 10 (0.6%) | 53 (14.8%) |
| $50,000 to $74,999 | 212 (13.5%) | 160 (44.7%) |
| $75,000 to $99,999 | 418 (26.5%) | 0 (0.0%) |
| $100,000 to $149,999 | 420 (26.7%) | 0 (0.0%) |
| $150,000 or more | 482 (30.6%) | 2 (0.6%) |
| Total | 1,576 (100.0%) | 358 (100.0%) |
Monthly Housing Cost Tiers in Hebron
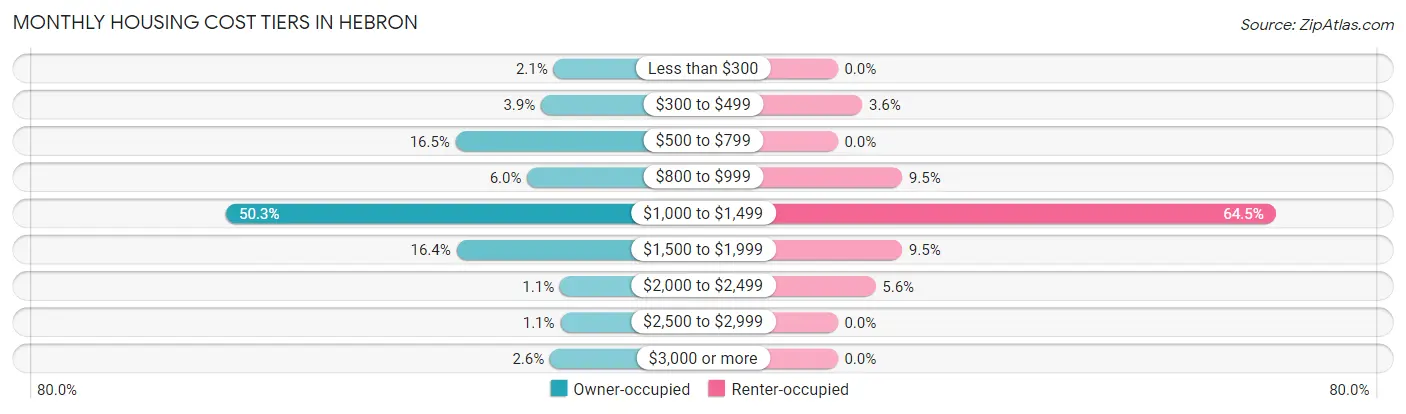
| Monthly Cost | Owner-occupied | Renter-occupied |
| Less than $300 | 33 (2.1%) | 0 (0.0%) |
| $300 to $499 | 62 (3.9%) | 13 (3.6%) |
| $500 to $799 | 260 (16.5%) | 0 (0.0%) |
| $800 to $999 | 94 (6.0%) | 34 (9.5%) |
| $1,000 to $1,499 | 793 (50.3%) | 231 (64.5%) |
| $1,500 to $1,999 | 258 (16.4%) | 34 (9.5%) |
| $2,000 to $2,499 | 18 (1.1%) | 20 (5.6%) |
| $2,500 to $2,999 | 17 (1.1%) | 0 (0.0%) |
| $3,000 or more | 41 (2.6%) | 0 (0.0%) |
| Total | 1,576 (100.0%) | 358 (100.0%) |
Physical Housing Characteristics in Hebron
Housing Structures in Hebron
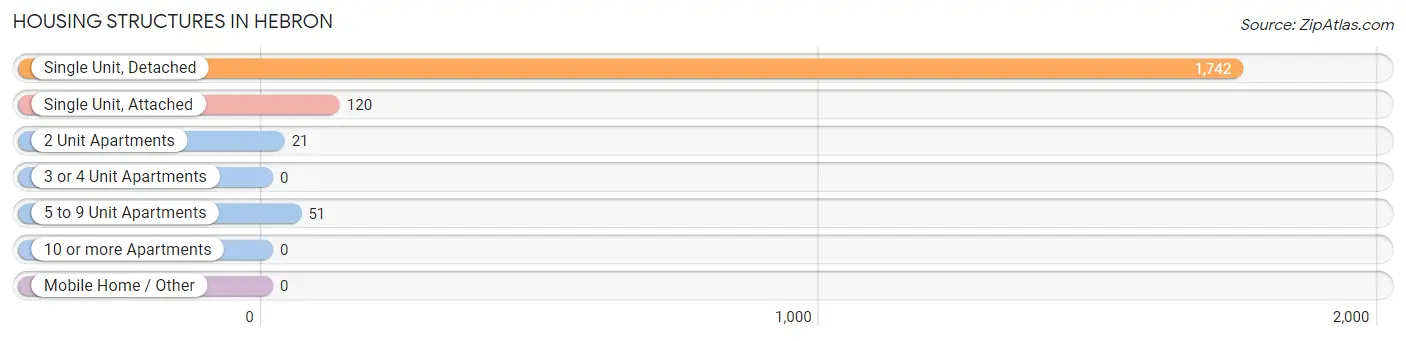
| Structure Type | # Housing Units | % Housing Units |
| Single Unit, Detached | 1,742 | 90.1% |
| Single Unit, Attached | 120 | 6.2% |
| 2 Unit Apartments | 21 | 1.1% |
| 3 or 4 Unit Apartments | 0 | 0.0% |
| 5 to 9 Unit Apartments | 51 | 2.6% |
| 10 or more Apartments | 0 | 0.0% |
| Mobile Home / Other | 0 | 0.0% |
| Total | 1,934 | 100.0% |
Housing Structures by Occupancy in Hebron
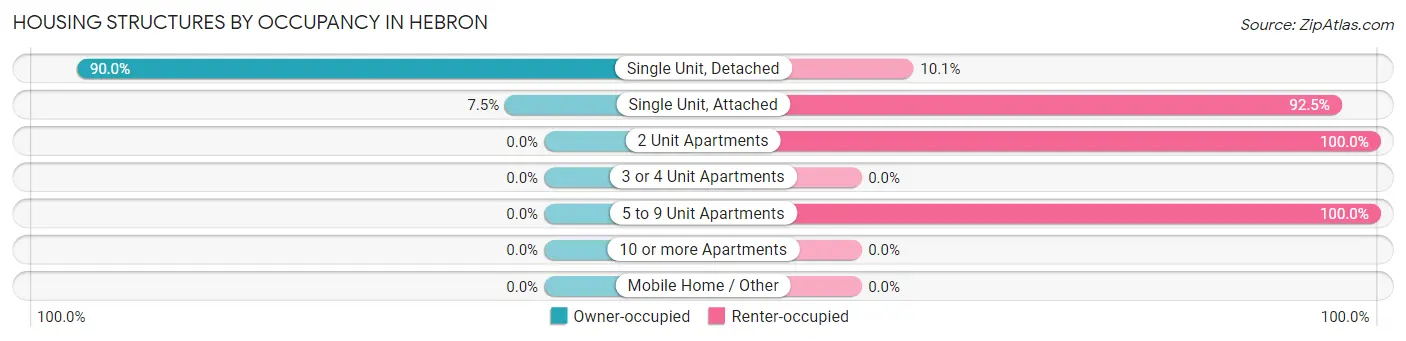
| Structure Type | Owner-occupied | Renter-occupied |
| Single Unit, Detached | 1,567 (89.9%) | 175 (10.1%) |
| Single Unit, Attached | 9 (7.5%) | 111 (92.5%) |
| 2 Unit Apartments | 0 (0.0%) | 21 (100.0%) |
| 3 or 4 Unit Apartments | 0 (0.0%) | 0 (0.0%) |
| 5 to 9 Unit Apartments | 0 (0.0%) | 51 (100.0%) |
| 10 or more Apartments | 0 (0.0%) | 0 (0.0%) |
| Mobile Home / Other | 0 (0.0%) | 0 (0.0%) |
| Total | 1,576 (81.5%) | 358 (18.5%) |
Housing Structures by Number of Rooms in Hebron
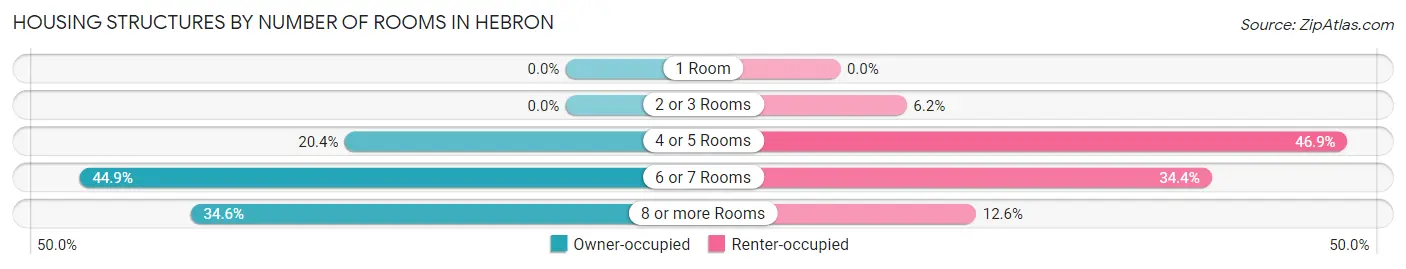
| Number of Rooms | Owner-occupied | Renter-occupied |
| 1 Room | 0 (0.0%) | 0 (0.0%) |
| 2 or 3 Rooms | 0 (0.0%) | 22 (6.1%) |
| 4 or 5 Rooms | 322 (20.4%) | 168 (46.9%) |
| 6 or 7 Rooms | 708 (44.9%) | 123 (34.4%) |
| 8 or more Rooms | 546 (34.6%) | 45 (12.6%) |
| Total | 1,576 (100.0%) | 358 (100.0%) |
Housing Structure by Heating Type in Hebron
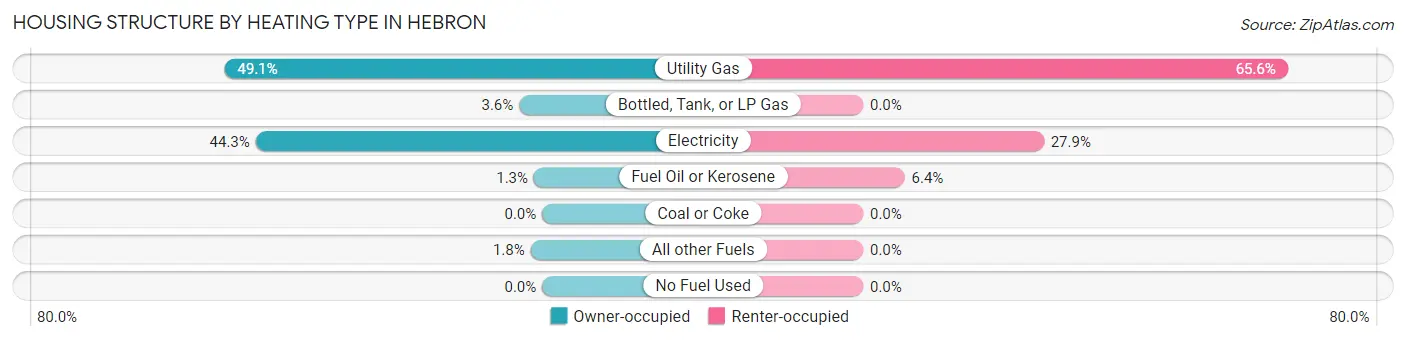
| Heating Type | Owner-occupied | Renter-occupied |
| Utility Gas | 774 (49.1%) | 235 (65.6%) |
| Bottled, Tank, or LP Gas | 56 (3.5%) | 0 (0.0%) |
| Electricity | 698 (44.3%) | 100 (27.9%) |
| Fuel Oil or Kerosene | 20 (1.3%) | 23 (6.4%) |
| Coal or Coke | 0 (0.0%) | 0 (0.0%) |
| All other Fuels | 28 (1.8%) | 0 (0.0%) |
| No Fuel Used | 0 (0.0%) | 0 (0.0%) |
| Total | 1,576 (100.0%) | 358 (100.0%) |
Household Vehicle Usage in Hebron
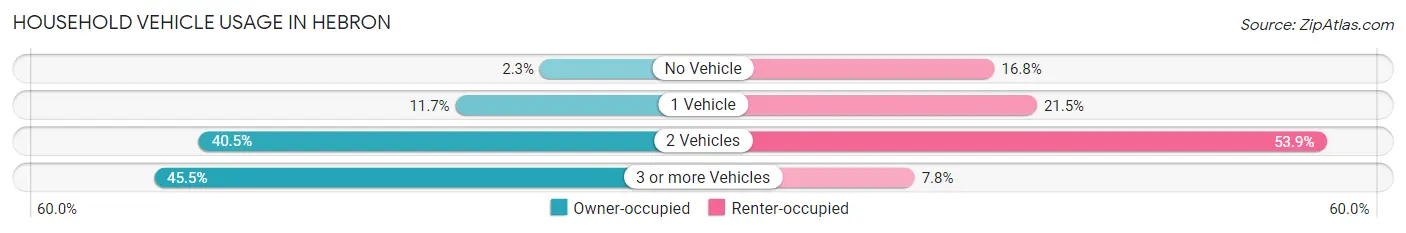
| Vehicles per Household | Owner-occupied | Renter-occupied |
| No Vehicle | 36 (2.3%) | 60 (16.8%) |
| 1 Vehicle | 185 (11.7%) | 77 (21.5%) |
| 2 Vehicles | 638 (40.5%) | 193 (53.9%) |
| 3 or more Vehicles | 717 (45.5%) | 28 (7.8%) |
| Total | 1,576 (100.0%) | 358 (100.0%) |
Real Estate & Mortgages in Hebron
Real Estate and Mortgage Overview in Hebron
| Characteristic | Without Mortgage | With Mortgage |
| Housing Units | 321 | 1,255 |
| Median Property Value | $166,900 | $203,300 |
| Median Household Income | $98,342 | $464 |
| Monthly Housing Costs | $538 | $41 |
| Real Estate Taxes | $1,721 | $8 |
Property Value by Mortgage Status in Hebron
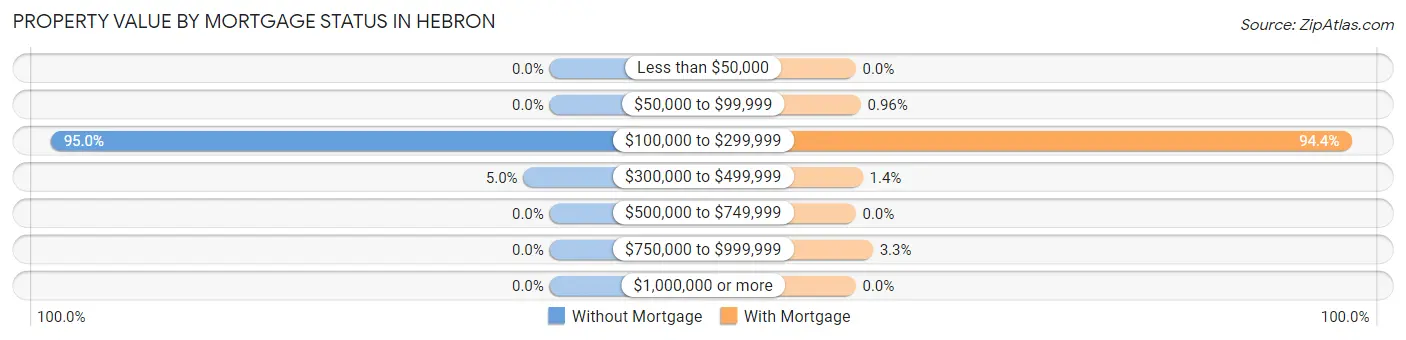
| Property Value | Without Mortgage | With Mortgage |
| Less than $50,000 | 0 (0.0%) | 0 (0.0%) |
| $50,000 to $99,999 | 0 (0.0%) | 12 (1.0%) |
| $100,000 to $299,999 | 305 (95.0%) | 1,185 (94.4%) |
| $300,000 to $499,999 | 16 (5.0%) | 17 (1.3%) |
| $500,000 to $749,999 | 0 (0.0%) | 0 (0.0%) |
| $750,000 to $999,999 | 0 (0.0%) | 41 (3.3%) |
| $1,000,000 or more | 0 (0.0%) | 0 (0.0%) |
| Total | 321 (100.0%) | 1,255 (100.0%) |
Household Income by Mortgage Status in Hebron
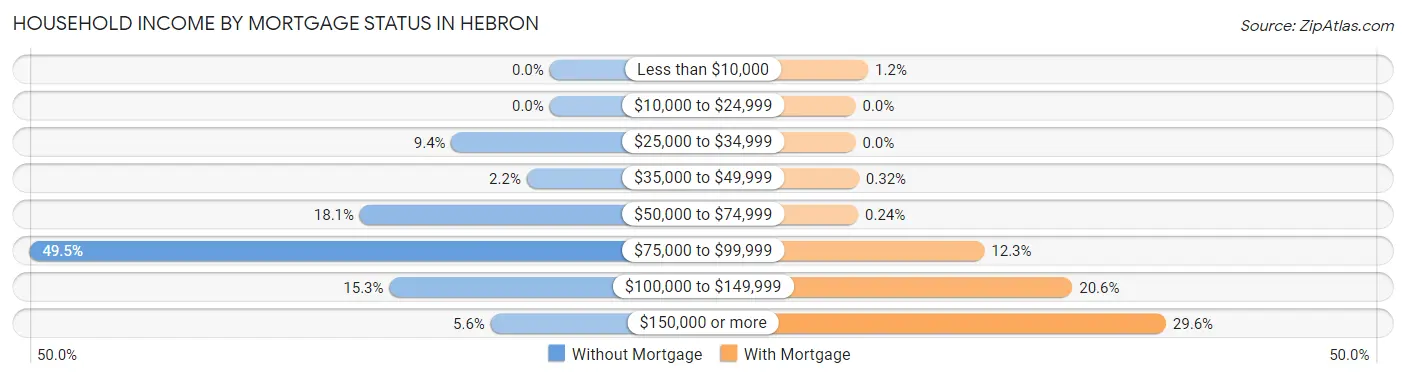
| Household Income | Without Mortgage | With Mortgage |
| Less than $10,000 | 0 (0.0%) | 15 (1.2%) |
| $10,000 to $24,999 | 0 (0.0%) | 0 (0.0%) |
| $25,000 to $34,999 | 30 (9.3%) | 0 (0.0%) |
| $35,000 to $49,999 | 7 (2.2%) | 4 (0.3%) |
| $50,000 to $74,999 | 58 (18.1%) | 3 (0.2%) |
| $75,000 to $99,999 | 159 (49.5%) | 154 (12.3%) |
| $100,000 to $149,999 | 49 (15.3%) | 259 (20.6%) |
| $150,000 or more | 18 (5.6%) | 371 (29.6%) |
| Total | 321 (100.0%) | 1,255 (100.0%) |
Property Value to Household Income Ratio in Hebron
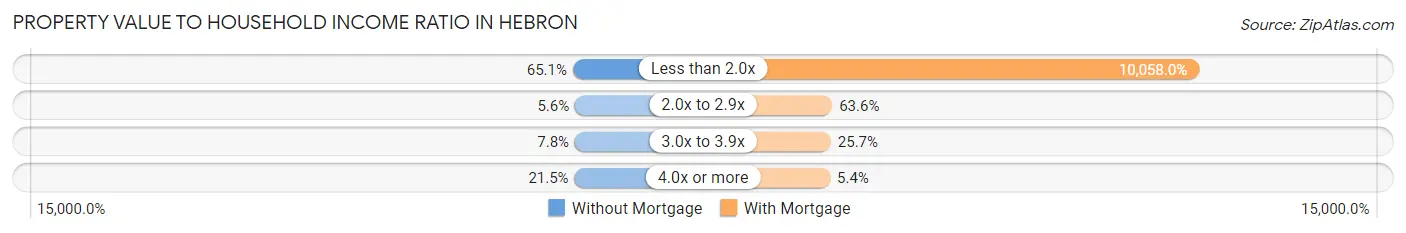
| Value-to-Income Ratio | Without Mortgage | With Mortgage |
| Less than 2.0x | 209 (65.1%) | 126,228 (10,058.0%) |
| 2.0x to 2.9x | 18 (5.6%) | 798 (63.6%) |
| 3.0x to 3.9x | 25 (7.8%) | 322 (25.7%) |
| 4.0x or more | 69 (21.5%) | 68 (5.4%) |
| Total | 321 (100.0%) | 1,255 (100.0%) |
Real Estate Taxes by Mortgage Status in Hebron
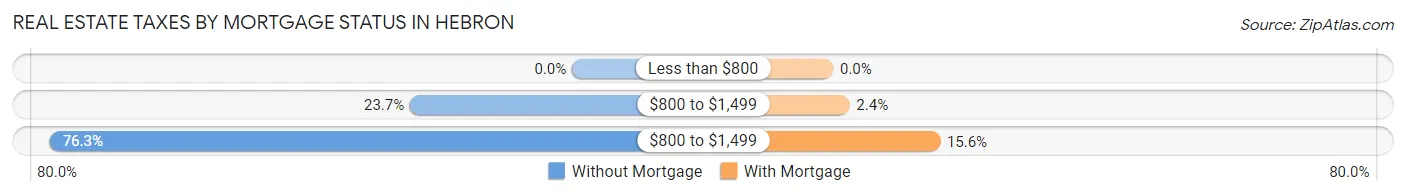
| Property Taxes | Without Mortgage | With Mortgage |
| Less than $800 | 0 (0.0%) | 0 (0.0%) |
| $800 to $1,499 | 76 (23.7%) | 30 (2.4%) |
| $800 to $1,499 | 245 (76.3%) | 196 (15.6%) |
| Total | 321 (100.0%) | 1,255 (100.0%) |
Health & Disability in Hebron
Health Insurance Coverage by Age in Hebron
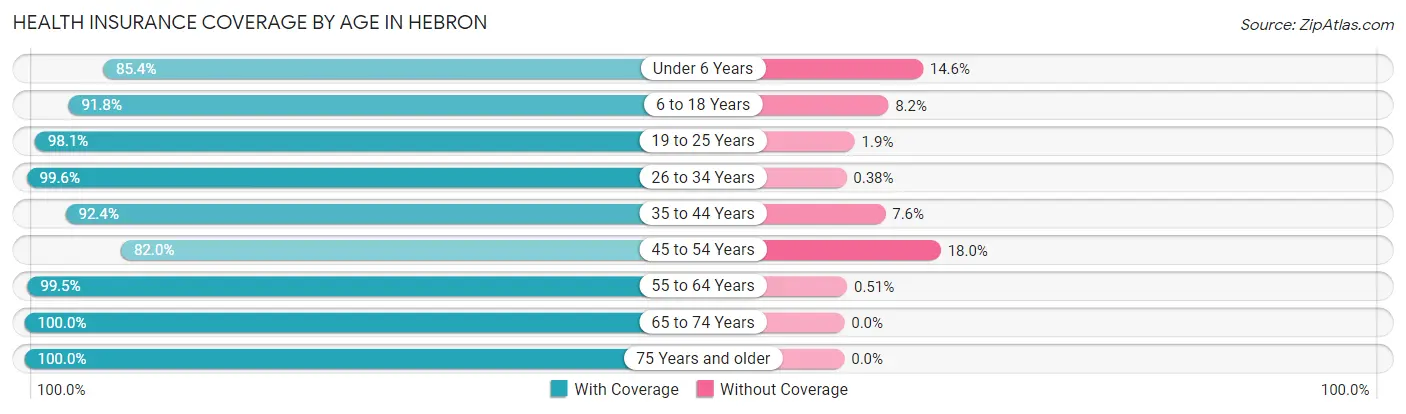
| Age Bracket | With Coverage | Without Coverage |
| Under 6 Years | 548 (85.4%) | 94 (14.6%) |
| 6 to 18 Years | 1,412 (91.8%) | 126 (8.2%) |
| 19 to 25 Years | 559 (98.1%) | 11 (1.9%) |
| 26 to 34 Years | 795 (99.6%) | 3 (0.4%) |
| 35 to 44 Years | 1,015 (92.4%) | 84 (7.6%) |
| 45 to 54 Years | 689 (82.0%) | 151 (18.0%) |
| 55 to 64 Years | 773 (99.5%) | 4 (0.5%) |
| 65 to 74 Years | 191 (100.0%) | 0 (0.0%) |
| 75 Years and older | 134 (100.0%) | 0 (0.0%) |
| Total | 6,116 (92.8%) | 473 (7.2%) |
Health Insurance Coverage by Citizenship Status in Hebron
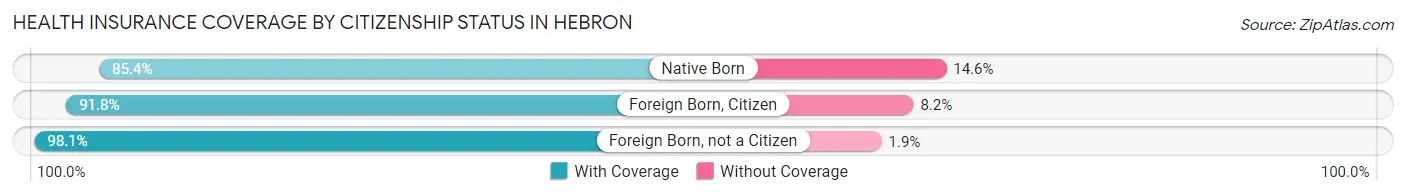
| Citizenship Status | With Coverage | Without Coverage |
| Native Born | 548 (85.4%) | 94 (14.6%) |
| Foreign Born, Citizen | 1,412 (91.8%) | 126 (8.2%) |
| Foreign Born, not a Citizen | 559 (98.1%) | 11 (1.9%) |
Health Insurance Coverage by Household Income in Hebron
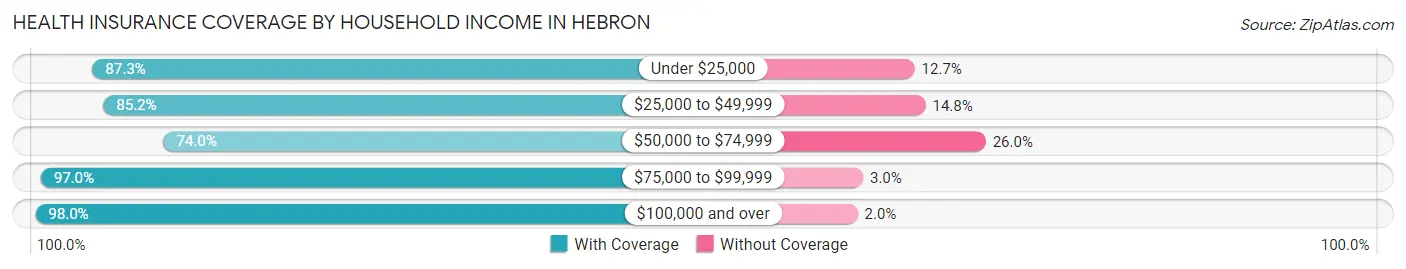
| Household Income | With Coverage | Without Coverage |
| Under $25,000 | 316 (87.3%) | 46 (12.7%) |
| $25,000 to $49,999 | 306 (85.2%) | 53 (14.8%) |
| $50,000 to $74,999 | 753 (74.0%) | 265 (26.0%) |
| $75,000 to $99,999 | 1,019 (97.0%) | 32 (3.0%) |
| $100,000 and over | 3,722 (98.0%) | 77 (2.0%) |
Public vs Private Health Insurance Coverage by Age in Hebron
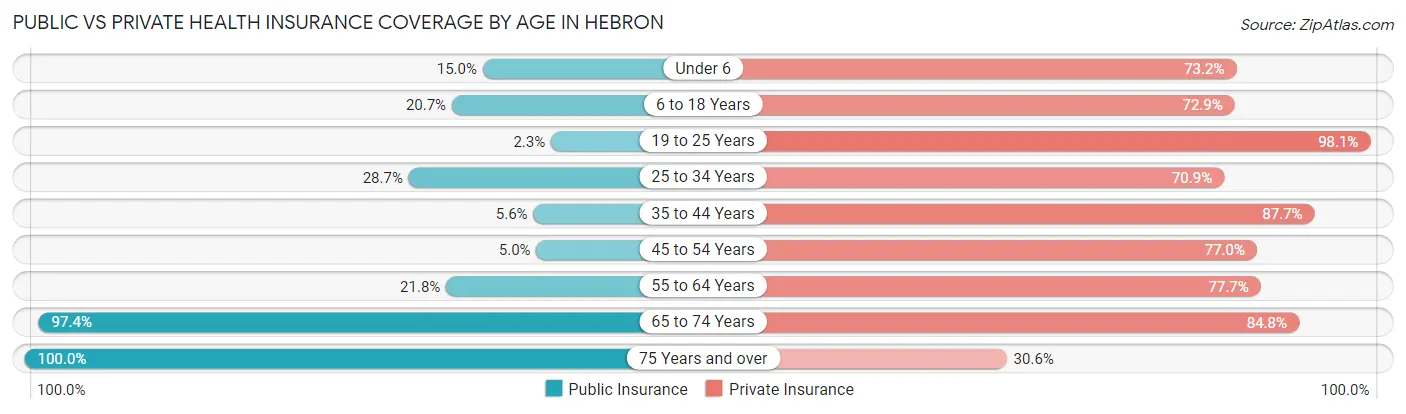
| Age Bracket | Public Insurance | Private Insurance |
| Under 6 | 96 (14.9%) | 470 (73.2%) |
| 6 to 18 Years | 318 (20.7%) | 1,121 (72.9%) |
| 19 to 25 Years | 13 (2.3%) | 559 (98.1%) |
| 25 to 34 Years | 229 (28.7%) | 566 (70.9%) |
| 35 to 44 Years | 61 (5.6%) | 964 (87.7%) |
| 45 to 54 Years | 42 (5.0%) | 647 (77.0%) |
| 55 to 64 Years | 169 (21.7%) | 604 (77.7%) |
| 65 to 74 Years | 186 (97.4%) | 162 (84.8%) |
| 75 Years and over | 134 (100.0%) | 41 (30.6%) |
| Total | 1,248 (18.9%) | 5,134 (77.9%) |
Disability Status by Sex by Age in Hebron
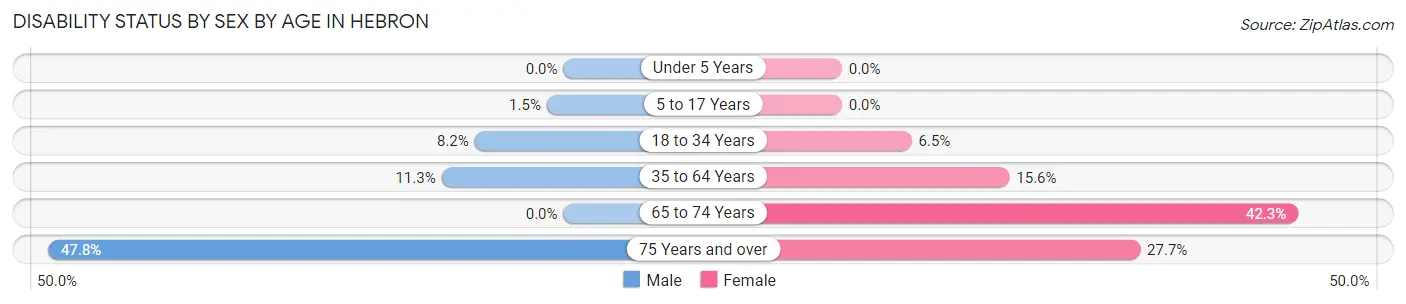
| Age Bracket | Male | Female |
| Under 5 Years | 0 (0.0%) | 0 (0.0%) |
| 5 to 17 Years | 12 (1.5%) | 0 (0.0%) |
| 18 to 34 Years | 44 (8.2%) | 66 (6.5%) |
| 35 to 64 Years | 169 (11.3%) | 190 (15.5%) |
| 65 to 74 Years | 0 (0.0%) | 58 (42.3%) |
| 75 Years and over | 33 (47.8%) | 18 (27.7%) |
Disability Class by Sex by Age in Hebron
Disability Class: Hearing Difficulty
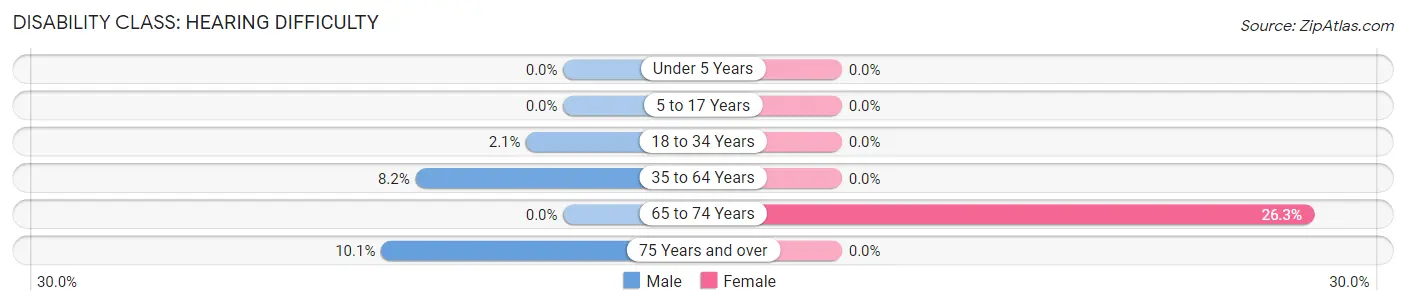
| Age Bracket | Male | Female |
| Under 5 Years | 0 (0.0%) | 0 (0.0%) |
| 5 to 17 Years | 0 (0.0%) | 0 (0.0%) |
| 18 to 34 Years | 11 (2.1%) | 0 (0.0%) |
| 35 to 64 Years | 123 (8.2%) | 0 (0.0%) |
| 65 to 74 Years | 0 (0.0%) | 36 (26.3%) |
| 75 Years and over | 7 (10.1%) | 0 (0.0%) |
Disability Class: Vision Difficulty
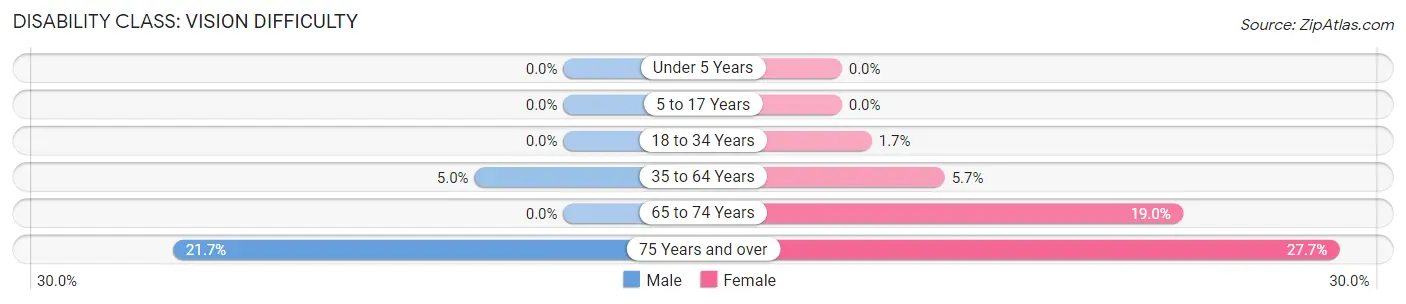
| Age Bracket | Male | Female |
| Under 5 Years | 0 (0.0%) | 0 (0.0%) |
| 5 to 17 Years | 0 (0.0%) | 0 (0.0%) |
| 18 to 34 Years | 0 (0.0%) | 17 (1.7%) |
| 35 to 64 Years | 74 (5.0%) | 70 (5.7%) |
| 65 to 74 Years | 0 (0.0%) | 26 (19.0%) |
| 75 Years and over | 15 (21.7%) | 18 (27.7%) |
Disability Class: Cognitive Difficulty
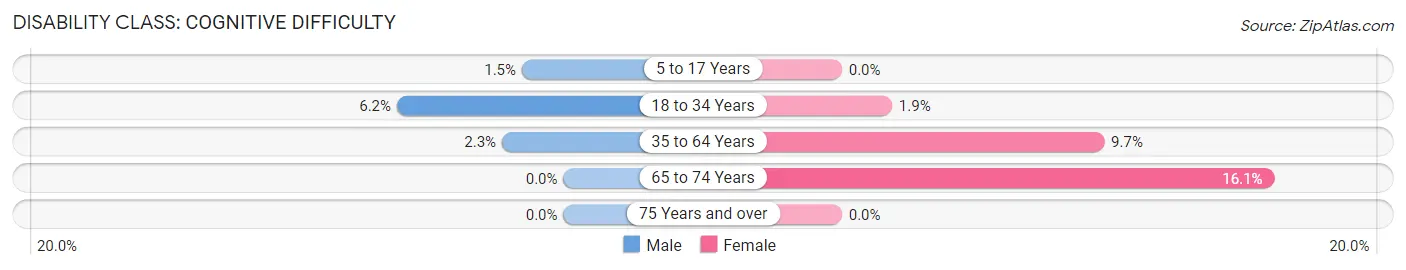
| Age Bracket | Male | Female |
| 5 to 17 Years | 12 (1.5%) | 0 (0.0%) |
| 18 to 34 Years | 33 (6.2%) | 19 (1.9%) |
| 35 to 64 Years | 34 (2.3%) | 119 (9.7%) |
| 65 to 74 Years | 0 (0.0%) | 22 (16.1%) |
| 75 Years and over | 0 (0.0%) | 0 (0.0%) |
Disability Class: Ambulatory Difficulty
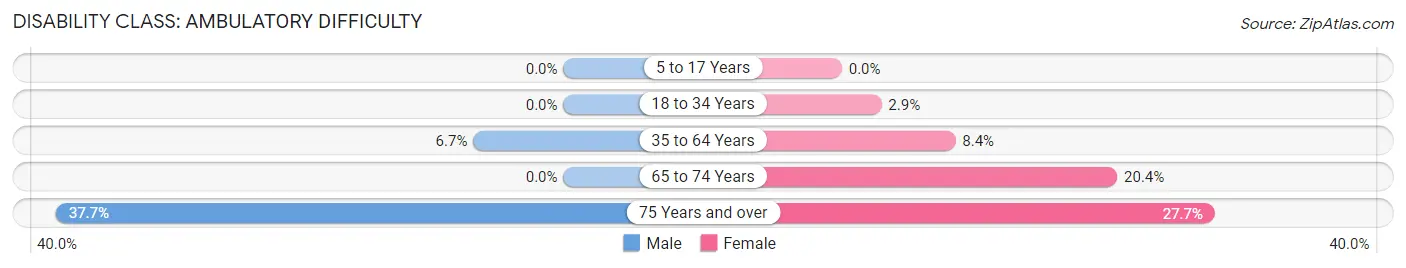
| Age Bracket | Male | Female |
| 5 to 17 Years | 0 (0.0%) | 0 (0.0%) |
| 18 to 34 Years | 0 (0.0%) | 30 (2.9%) |
| 35 to 64 Years | 100 (6.7%) | 103 (8.4%) |
| 65 to 74 Years | 0 (0.0%) | 28 (20.4%) |
| 75 Years and over | 26 (37.7%) | 18 (27.7%) |
Disability Class: Self-Care Difficulty
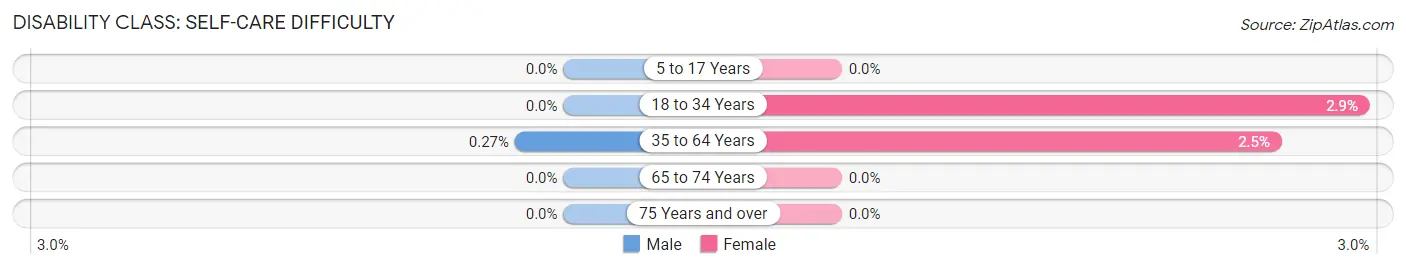
| Age Bracket | Male | Female |
| 5 to 17 Years | 0 (0.0%) | 0 (0.0%) |
| 18 to 34 Years | 0 (0.0%) | 30 (2.9%) |
| 35 to 64 Years | 4 (0.3%) | 30 (2.5%) |
| 65 to 74 Years | 0 (0.0%) | 0 (0.0%) |
| 75 Years and over | 0 (0.0%) | 0 (0.0%) |
Technology Access in Hebron
Computing Device Access in Hebron
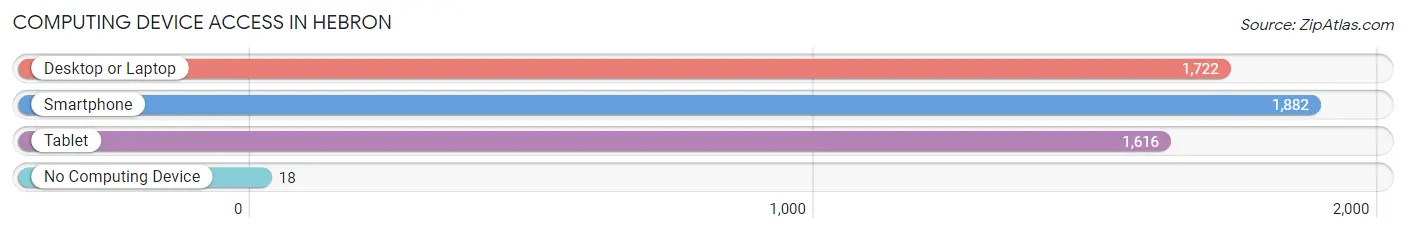
| Device Type | # Households | % Households |
| Desktop or Laptop | 1,722 | 89.0% |
| Smartphone | 1,882 | 97.3% |
| Tablet | 1,616 | 83.6% |
| No Computing Device | 18 | 0.9% |
| Total | 1,934 | 100.0% |
Internet Access in Hebron
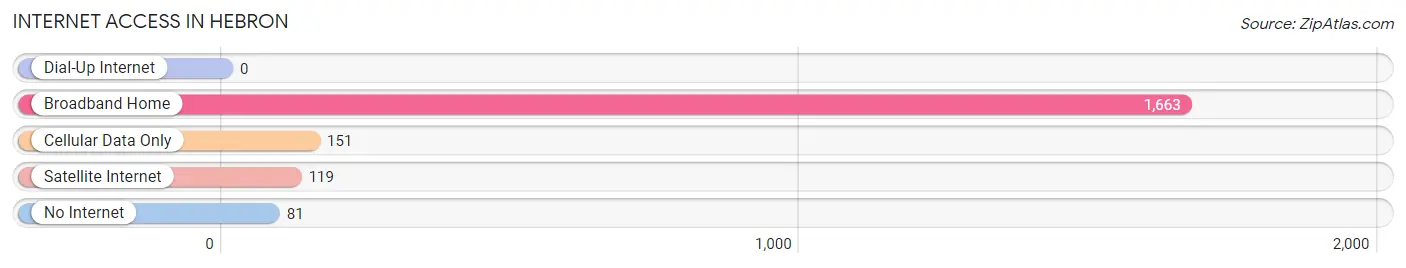
| Internet Type | # Households | % Households |
| Dial-Up Internet | 0 | 0.0% |
| Broadband Home | 1,663 | 86.0% |
| Cellular Data Only | 151 | 7.8% |
| Satellite Internet | 119 | 6.1% |
| No Internet | 81 | 4.2% |
| Total | 1,934 | 100.0% |
Hebron Summary
Hebron, Kentucky is a small city located in Boone County, Kentucky, United States. It is situated on the banks of the Ohio River, approximately 20 miles south of Cincinnati, Ohio. The city has a population of approximately 8,000 people and is part of the Cincinnati metropolitan area.
History
Hebron was founded in 1815 by a group of settlers from Pennsylvania. The town was named after the biblical city of Hebron, which is located in the West Bank. The settlers were attracted to the area due to its fertile soil and abundant natural resources. The town quickly grew and by 1820, it had become a thriving community with a population of over 500 people.
In 1845, the Cincinnati, Hamilton and Dayton Railroad was built through Hebron, connecting the town to Cincinnati and other cities in the region. This allowed for increased trade and commerce, and Hebron soon became a major hub for the region.
In the late 19th century, Hebron experienced a period of growth and prosperity. The town was home to several factories, including a flour mill, a sawmill, and a brickyard. The town also had a number of stores, churches, and other businesses.
Geography
Hebron is located in Boone County, Kentucky, approximately 20 miles south of Cincinnati, Ohio. The city is situated on the banks of the Ohio River, and is surrounded by rolling hills and farmland. The city has a total area of 4.2 square miles, all of which is land.
The climate in Hebron is humid subtropical, with hot, humid summers and cold, wet winters. The average temperature in the summer is around 80 degrees Fahrenheit, and the average temperature in the winter is around 40 degrees Fahrenheit.
Economy
Hebron’s economy is largely based on agriculture and manufacturing. The city is home to several factories, including a flour mill, a sawmill, and a brickyard. The city also has a number of stores, churches, and other businesses.
The city is also home to several large employers, including the Hebron-based company, Cintas Corporation, which is a provider of uniforms and other services to businesses. Other major employers in the city include the Boone County Public Schools, the Boone County Health Department, and the Hebron-based company, Cintas Corporation.
Demographics
As of the 2010 census, the population of Hebron was 8,000 people. The racial makeup of the city was 94.3% White, 2.2% African American, 0.3% Native American, 0.7% Asian, 0.1% Pacific Islander, and 2.4% from other races. The median household income in Hebron was $50,000, and the median family income was $60,000.
Hebron is home to a number of churches, including the Hebron Christian Church, the Hebron Baptist Church, and the Hebron United Methodist Church. The city also has a number of schools, including the Hebron Elementary School, the Hebron Middle School, and the Hebron High School.
Conclusion
Hebron, Kentucky is a small city located in Boone County, Kentucky, United States. It is situated on the banks of the Ohio River, approximately 20 miles south of Cincinnati, Ohio. The city has a population of approximately 8,000 people and is part of the Cincinnati metropolitan area. Hebron’s economy is largely based on agriculture and manufacturing, and the city is home to several large employers. The racial makeup of the city is 94.3% White, 2.2% African American, 0.3% Native American, 0.7% Asian, 0.1% Pacific Islander, and 2.4% from other races. The median household income in Hebron was $50,000, and the median family income was $60,000. Hebron is home to a number of churches, schools, and other businesses.
Common Questions
What is Per Capita Income in Hebron?
Per Capita income in Hebron is $36,135.
What is the Median Family Income in Hebron?
Median Family Income in Hebron is $99,649.
What is the Median Household income in Hebron?
Median Household Income in Hebron is $99,257.
What is Income or Wage Gap in Hebron?
Income or Wage Gap in Hebron is 43.1%.
Women in Hebron earn 56.9 cents for every dollar earned by a man.
What is Inequality or Gini Index in Hebron?
Inequality or Gini Index in Hebron is 0.33.
What is the Total Population of Hebron?
Total Population of Hebron is 6,607.
What is the Total Male Population of Hebron?
Total Male Population of Hebron is 3,309.
What is the Total Female Population of Hebron?
Total Female Population of Hebron is 3,298.
What is the Ratio of Males per 100 Females in Hebron?
There are 100.33 Males per 100 Females in Hebron.
What is the Ratio of Females per 100 Males in Hebron?
There are 99.67 Females per 100 Males in Hebron.
What is the Median Population Age in Hebron?
Median Population Age in Hebron is 31.3 Years.
What is the Average Family Size in Hebron
Average Family Size in Hebron is 3.8 People.
What is the Average Household Size in Hebron
Average Household Size in Hebron is 3.4 People.
How Large is the Labor Force in Hebron?
There are 4,033 People in the Labor Forcein in Hebron.
What is the Percentage of People in the Labor Force in Hebron?
83.6% of People are in the Labor Force in Hebron.
What is the Unemployment Rate in Hebron?
Unemployment Rate in Hebron is 1.7%.