Trenton, KY Map & Demographics
Trenton Map
Trenton Overview
$35,354
PER CAPITA INCOME
$93,125
AVG FAMILY INCOME
$76,250
AVG HOUSEHOLD INCOME
29.4%
WAGE / INCOME GAP [ % ]
70.6¢/ $1
WAGE / INCOME GAP [ $ ]
0.34
INEQUALITY / GINI INDEX
286
TOTAL POPULATION
142
MALE POPULATION
144
FEMALE POPULATION
98.61
MALES / 100 FEMALES
101.41
FEMALES / 100 MALES
44.3
MEDIAN AGE
2.5
AVG FAMILY SIZE
2.2
AVG HOUSEHOLD SIZE
159
LABOR FORCE [ PEOPLE ]
64.4%
PERCENT IN LABOR FORCE
Trenton Zip Codes
Trenton Area Codes
Income in Trenton
Income Overview in Trenton
Per Capita Income in Trenton is $35,354, while median incomes of families and households are $93,125 and $76,250 respectively.
| Characteristic | Number | Measure |
| Per Capita Income | 286 | $35,354 |
| Median Family Income | 87 | $93,125 |
| Mean Family Income | 87 | $92,311 |
| Median Household Income | 127 | $76,250 |
| Mean Household Income | 127 | $83,276 |
| Income Deficit | 87 | $0 |
| Wage / Income Gap (%) | 286 | 29.40% |
| Wage / Income Gap ($) | 286 | 70.60¢ per $1 |
| Gini / Inequality Index | 286 | 0.34 |
Earnings by Sex in Trenton
Average Earnings in Trenton are $37,305, $51,250 for men and $36,181 for women, a difference of 29.4%.
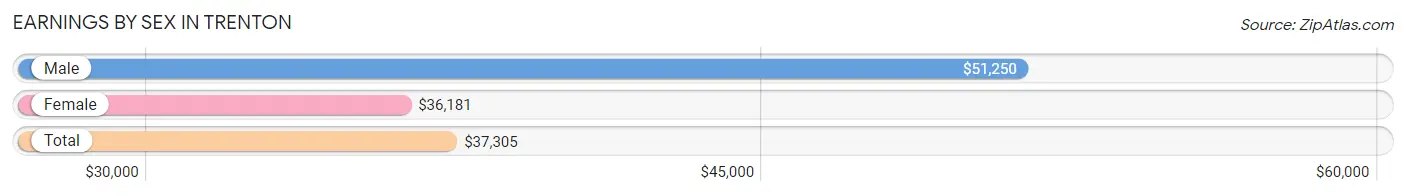
| Sex | Number | Average Earnings |
| Male | 82 (49.7%) | $51,250 |
| Female | 83 (50.3%) | $36,181 |
| Total | 165 (100.0%) | $37,305 |
Earnings by Sex by Income Bracket in Trenton
The most common earnings brackets in Trenton are $35,000 to $39,999 for men (15 | 18.3%) and $35,000 to $39,999 for women (21 | 25.3%).
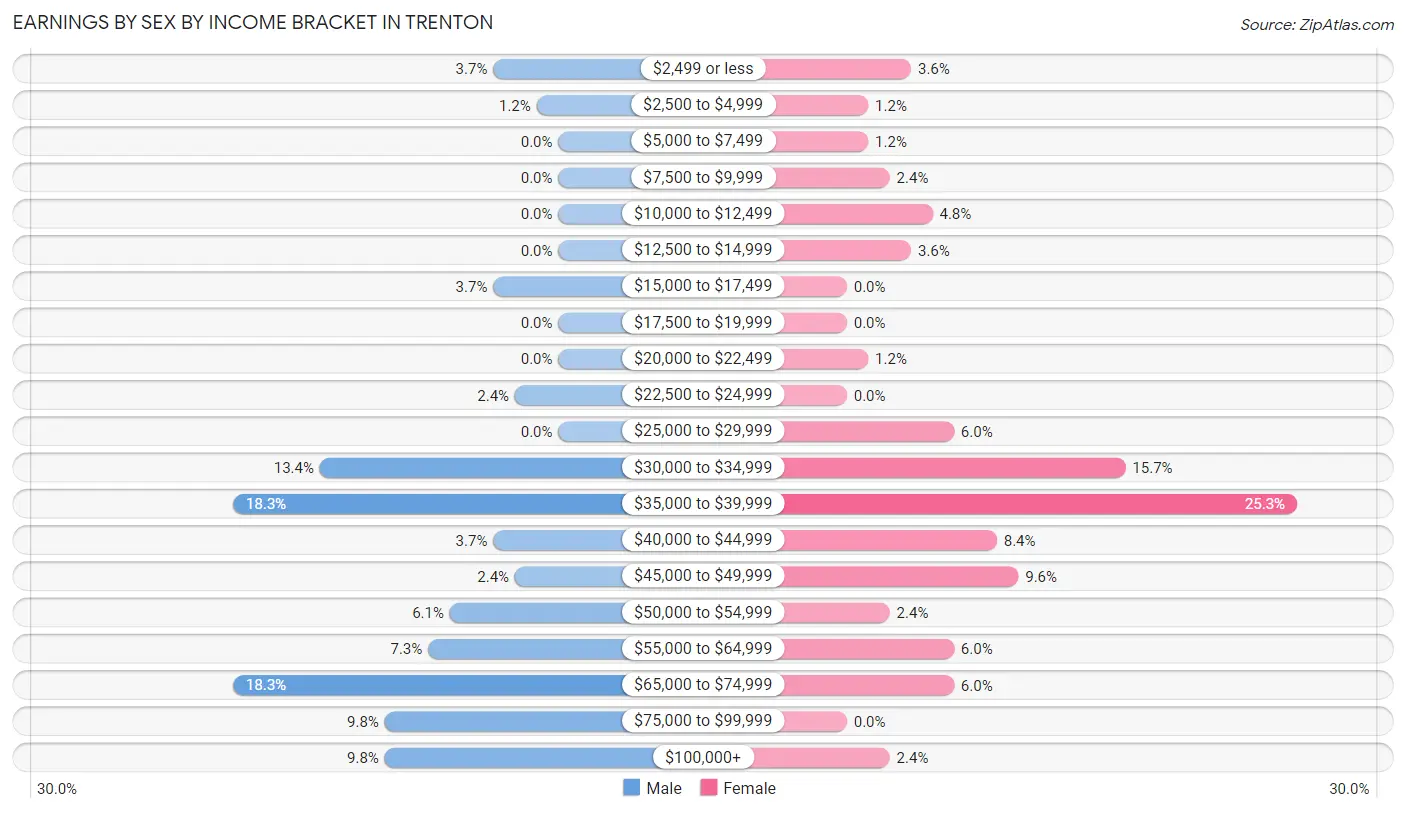
| Income | Male | Female |
| $2,499 or less | 3 (3.7%) | 3 (3.6%) |
| $2,500 to $4,999 | 1 (1.2%) | 1 (1.2%) |
| $5,000 to $7,499 | 0 (0.0%) | 1 (1.2%) |
| $7,500 to $9,999 | 0 (0.0%) | 2 (2.4%) |
| $10,000 to $12,499 | 0 (0.0%) | 4 (4.8%) |
| $12,500 to $14,999 | 0 (0.0%) | 3 (3.6%) |
| $15,000 to $17,499 | 3 (3.7%) | 0 (0.0%) |
| $17,500 to $19,999 | 0 (0.0%) | 0 (0.0%) |
| $20,000 to $22,499 | 0 (0.0%) | 1 (1.2%) |
| $22,500 to $24,999 | 2 (2.4%) | 0 (0.0%) |
| $25,000 to $29,999 | 0 (0.0%) | 5 (6.0%) |
| $30,000 to $34,999 | 11 (13.4%) | 13 (15.7%) |
| $35,000 to $39,999 | 15 (18.3%) | 21 (25.3%) |
| $40,000 to $44,999 | 3 (3.7%) | 7 (8.4%) |
| $45,000 to $49,999 | 2 (2.4%) | 8 (9.6%) |
| $50,000 to $54,999 | 5 (6.1%) | 2 (2.4%) |
| $55,000 to $64,999 | 6 (7.3%) | 5 (6.0%) |
| $65,000 to $74,999 | 15 (18.3%) | 5 (6.0%) |
| $75,000 to $99,999 | 8 (9.8%) | 0 (0.0%) |
| $100,000+ | 8 (9.8%) | 2 (2.4%) |
| Total | 82 (100.0%) | 83 (100.0%) |
Earnings by Sex by Educational Attainment in Trenton
Average earnings in Trenton are $50,625 for men and $36,375 for women, a difference of 28.1%. Men with an educational attainment of college or associate's degree enjoy the highest average annual earnings of $69,375, while those with high school diploma education earn the least with $36,500. Women with an educational attainment of bachelor's degree earn the most with the average annual earnings of $45,000, while those with high school diploma education have the smallest earnings of $33,750.
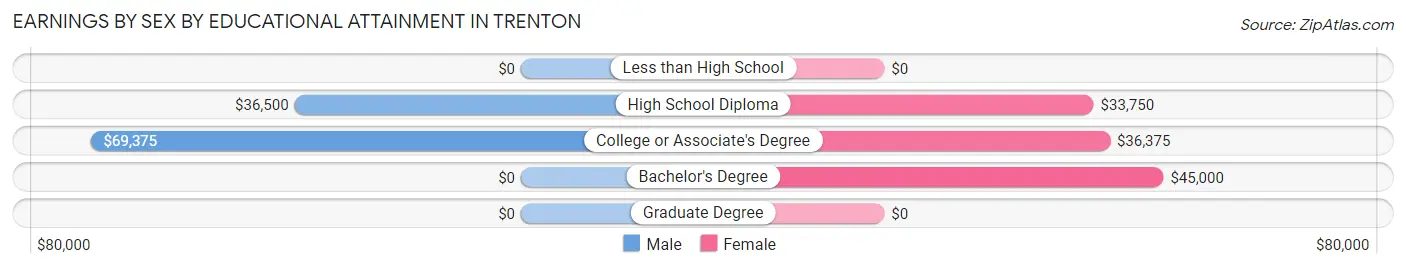
| Educational Attainment | Male Income | Female Income |
| Less than High School | - | - |
| High School Diploma | $36,500 | $33,750 |
| College or Associate's Degree | $69,375 | $36,375 |
| Bachelor's Degree | - | - |
| Graduate Degree | - | - |
| Total | $50,625 | $36,375 |
Family Income in Trenton
Family Income Brackets in Trenton
According to the Trenton family income data, there are 30 families falling into the $100,000 to $149,999 income range, which is the most common income bracket and makes up 34.5% of all families.
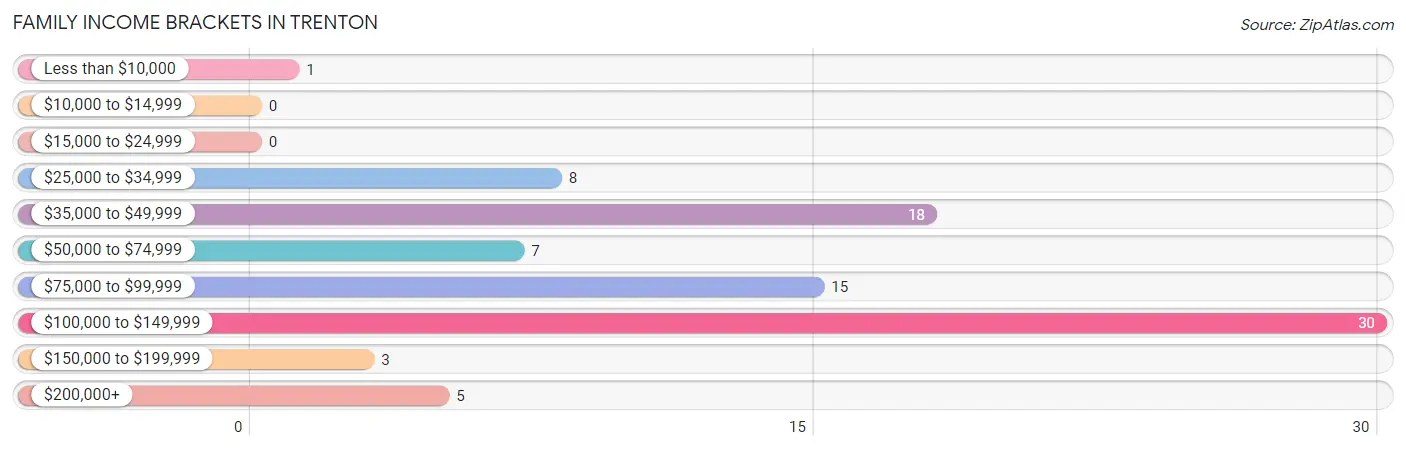
| Income Bracket | # Families | % Families |
| Less than $10,000 | 1 | 1.1% |
| $10,000 to $14,999 | 0 | 0.0% |
| $15,000 to $24,999 | 0 | 0.0% |
| $25,000 to $34,999 | 8 | 9.2% |
| $35,000 to $49,999 | 18 | 20.7% |
| $50,000 to $74,999 | 7 | 8.0% |
| $75,000 to $99,999 | 15 | 17.2% |
| $100,000 to $149,999 | 30 | 34.5% |
| $150,000 to $199,999 | 3 | 3.4% |
| $200,000+ | 5 | 5.7% |
Family Income by Famaliy Size in Trenton
3-person families (22 | 25.3%) account for the highest median family income in Trenton with $103,333 per family, while 3-person families (22 | 25.3%) have the highest median income of $34,444 per family member.
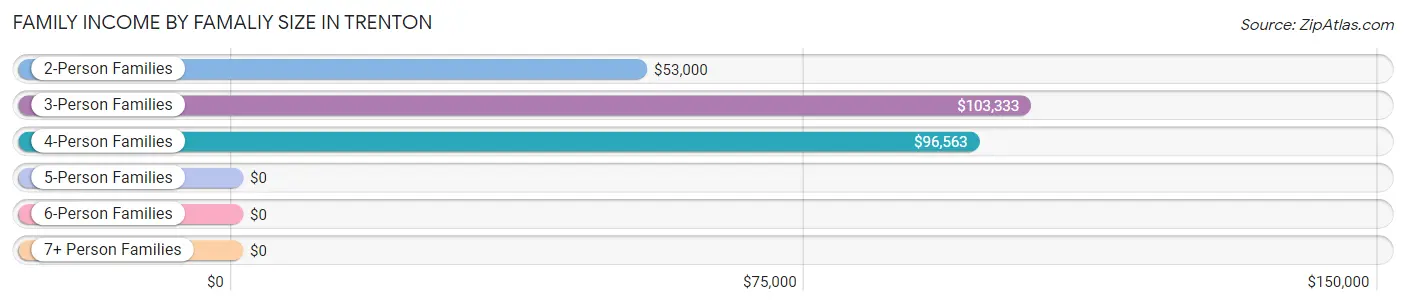
| Income Bracket | # Families | Median Income |
| 2-Person Families | 50 (57.5%) | $53,000 |
| 3-Person Families | 22 (25.3%) | $103,333 |
| 4-Person Families | 15 (17.2%) | $96,563 |
| 5-Person Families | 0 (0.0%) | $0 |
| 6-Person Families | 0 (0.0%) | $0 |
| 7+ Person Families | 0 (0.0%) | $0 |
| Total | 87 (100.0%) | $93,125 |
Family Income by Number of Earners in Trenton
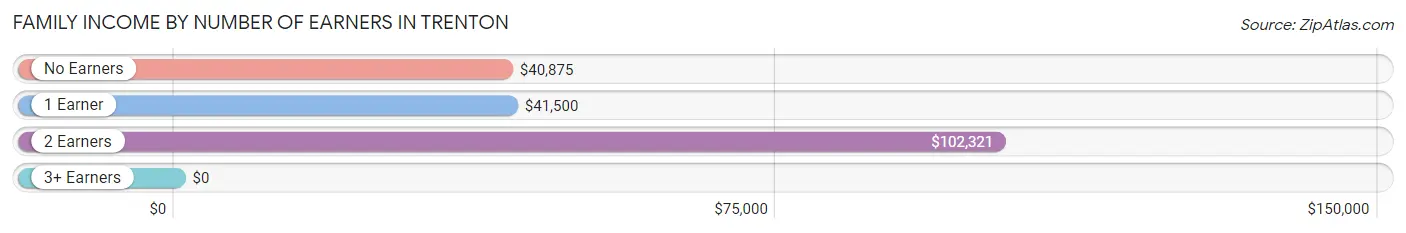
| Number of Earners | # Families | Median Income |
| No Earners | 17 (19.5%) | $40,875 |
| 1 Earner | 20 (23.0%) | $41,500 |
| 2 Earners | 45 (51.7%) | $102,321 |
| 3+ Earners | 5 (5.8%) | $0 |
| Total | 87 (100.0%) | $93,125 |
Household Income in Trenton
Household Income Brackets in Trenton
With 43 households falling in the category, the $100,000 to $149,999 income range is the most frequent in Trenton, accounting for 33.9% of all households. In contrast, only 1 households (0.8%) fall into the less than $10,000 income bracket, making it the least populous group.
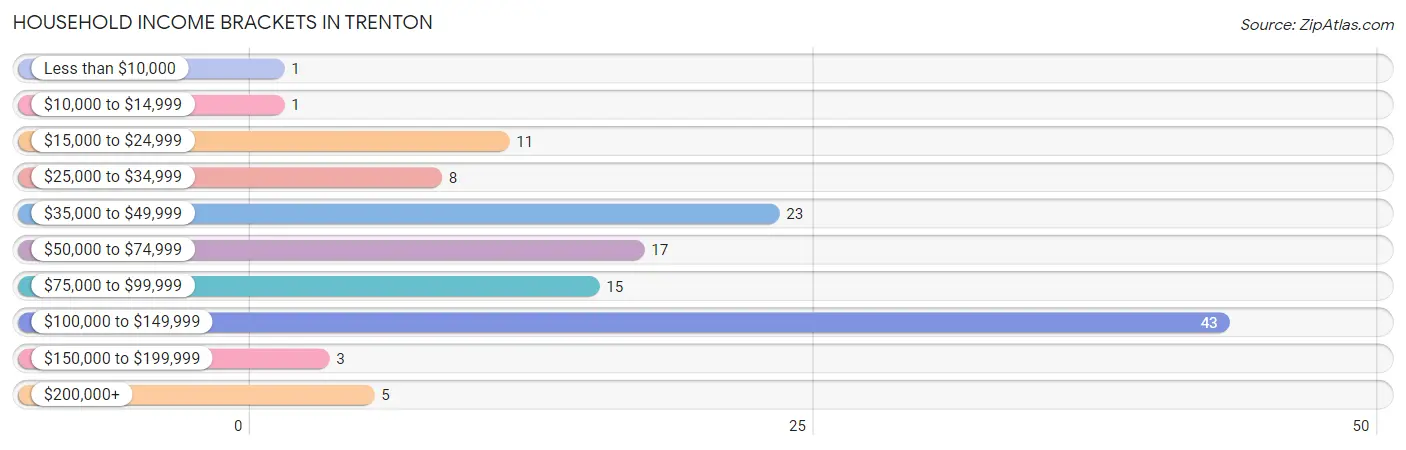
| Income Bracket | # Households | % Households |
| Less than $10,000 | 1 | 0.8% |
| $10,000 to $14,999 | 1 | 0.8% |
| $15,000 to $24,999 | 11 | 8.7% |
| $25,000 to $34,999 | 8 | 6.3% |
| $35,000 to $49,999 | 23 | 18.1% |
| $50,000 to $74,999 | 17 | 13.4% |
| $75,000 to $99,999 | 15 | 11.8% |
| $100,000 to $149,999 | 43 | 33.9% |
| $150,000 to $199,999 | 3 | 2.4% |
| $200,000+ | 5 | 3.9% |
Household Income by Householder Age in Trenton
The median household income in Trenton is $76,250, with the highest median household income of $101,500 found in the 25 to 44 years age bracket for the primary householder. A total of 38 households (29.9%) fall into this category. Meanwhile, the 15 to 24 years age bracket for the primary householder has the lowest median household income of $0, with 1 households (0.8%) in this group.
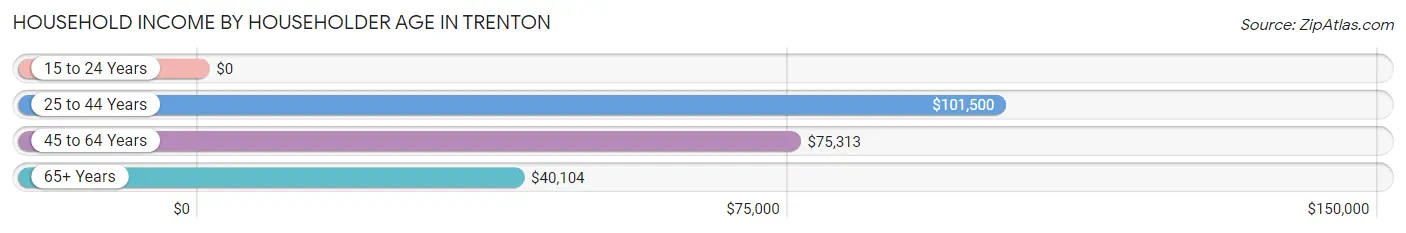
| Income Bracket | # Households | Median Income |
| 15 to 24 Years | 1 (0.8%) | $0 |
| 25 to 44 Years | 38 (29.9%) | $101,500 |
| 45 to 64 Years | 61 (48.0%) | $75,313 |
| 65+ Years | 27 (21.3%) | $40,104 |
| Total | 127 (100.0%) | $76,250 |
Poverty in Trenton
Income Below Poverty by Sex and Age in Trenton
With 8.5% poverty level for males and 1.4% for females among the residents of Trenton, 15 year old males and 65 to 74 year old females are the most vulnerable to poverty, with 1 males (100.0%) and 1 females (7.1%) in their respective age groups living below the poverty level.
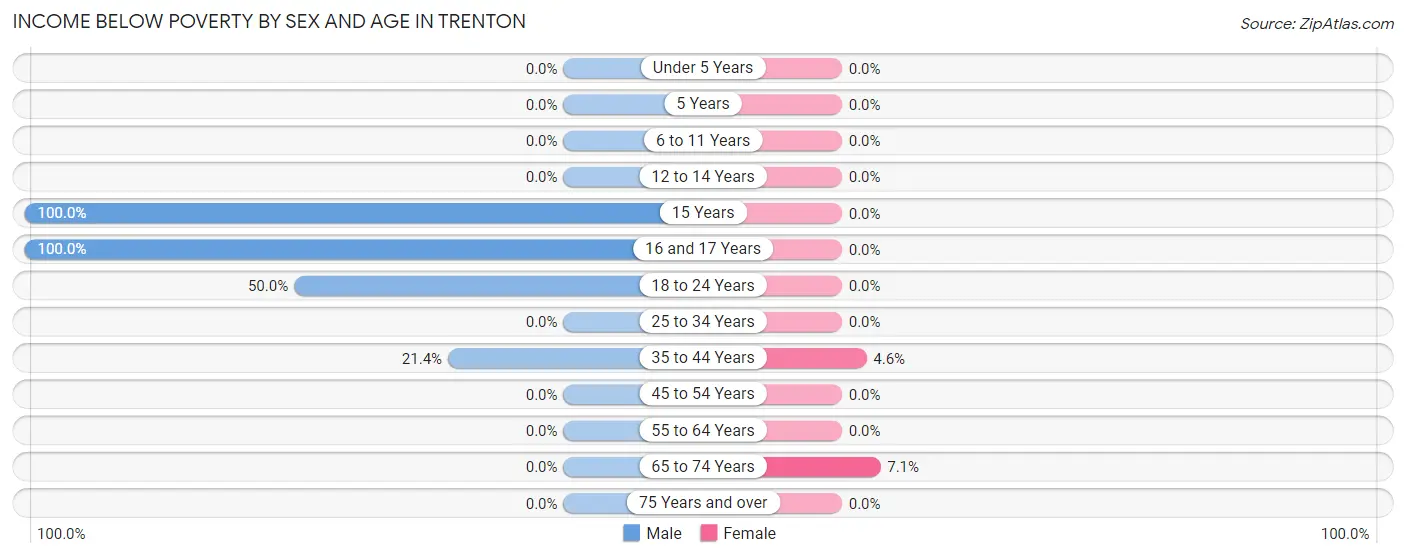
| Age Bracket | Male | Female |
| Under 5 Years | 0 (0.0%) | 0 (0.0%) |
| 5 Years | 0 (0.0%) | 0 (0.0%) |
| 6 to 11 Years | 0 (0.0%) | 0 (0.0%) |
| 12 to 14 Years | 0 (0.0%) | 0 (0.0%) |
| 15 Years | 1 (100.0%) | 0 (0.0%) |
| 16 and 17 Years | 1 (100.0%) | 0 (0.0%) |
| 18 to 24 Years | 7 (50.0%) | 0 (0.0%) |
| 25 to 34 Years | 0 (0.0%) | 0 (0.0%) |
| 35 to 44 Years | 3 (21.4%) | 1 (4.5%) |
| 45 to 54 Years | 0 (0.0%) | 0 (0.0%) |
| 55 to 64 Years | 0 (0.0%) | 0 (0.0%) |
| 65 to 74 Years | 0 (0.0%) | 1 (7.1%) |
| 75 Years and over | 0 (0.0%) | 0 (0.0%) |
| Total | 12 (8.5%) | 2 (1.4%) |
Income Above Poverty by Sex and Age in Trenton
According to the poverty statistics in Trenton, males aged under 5 years and females aged under 5 years are the age groups that are most secure financially, with 100.0% of males and 100.0% of females in these age groups living above the poverty line.
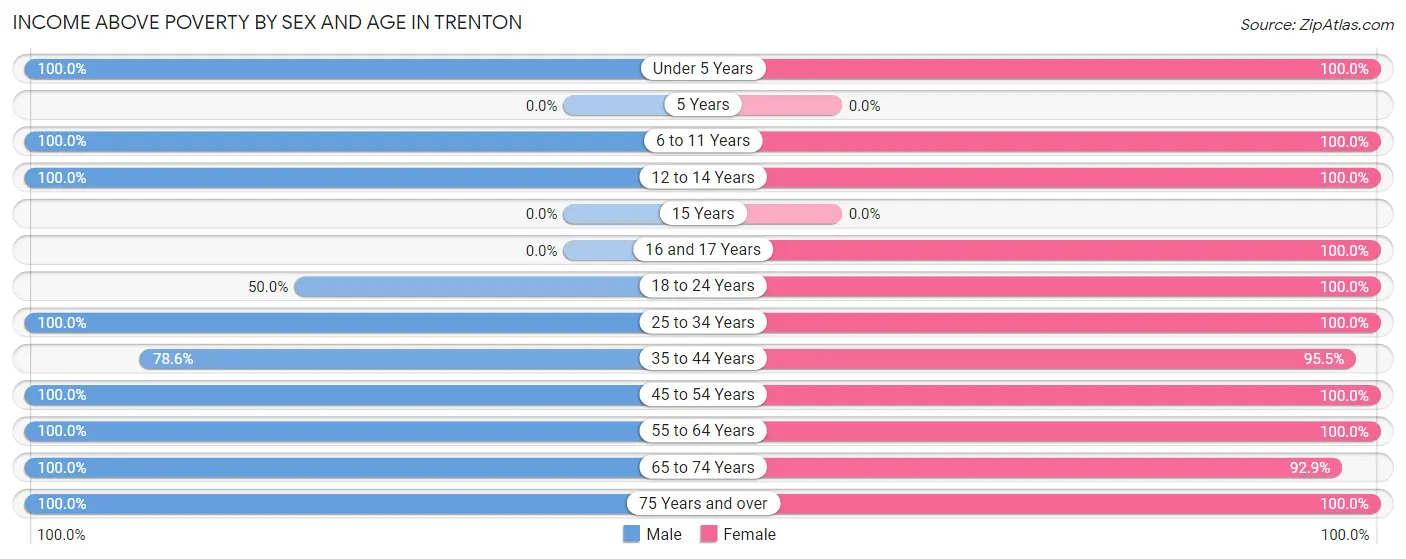
| Age Bracket | Male | Female |
| Under 5 Years | 16 (100.0%) | 8 (100.0%) |
| 5 Years | 0 (0.0%) | 0 (0.0%) |
| 6 to 11 Years | 3 (100.0%) | 8 (100.0%) |
| 12 to 14 Years | 1 (100.0%) | 2 (100.0%) |
| 15 Years | 0 (0.0%) | 0 (0.0%) |
| 16 and 17 Years | 0 (0.0%) | 5 (100.0%) |
| 18 to 24 Years | 7 (50.0%) | 12 (100.0%) |
| 25 to 34 Years | 25 (100.0%) | 16 (100.0%) |
| 35 to 44 Years | 11 (78.6%) | 21 (95.5%) |
| 45 to 54 Years | 23 (100.0%) | 18 (100.0%) |
| 55 to 64 Years | 32 (100.0%) | 22 (100.0%) |
| 65 to 74 Years | 2 (100.0%) | 13 (92.9%) |
| 75 Years and over | 10 (100.0%) | 17 (100.0%) |
| Total | 130 (91.5%) | 142 (98.6%) |
Income Below Poverty Among Married-Couple Families in Trenton
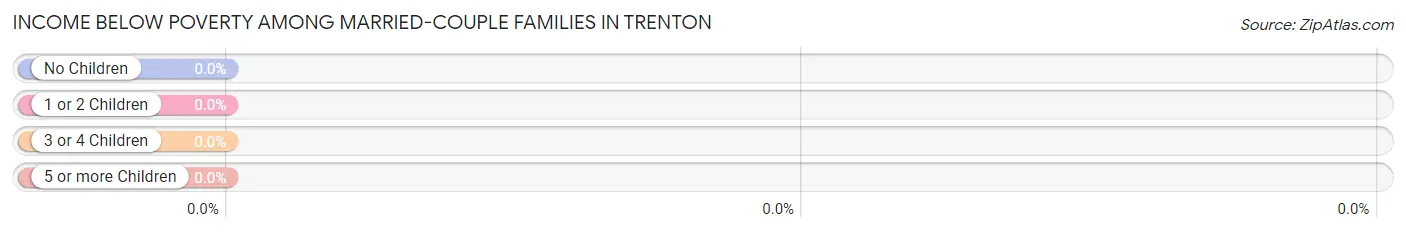
| Children | Above Poverty | Below Poverty |
| No Children | 41 (100.0%) | 0 (0.0%) |
| 1 or 2 Children | 21 (100.0%) | 0 (0.0%) |
| 3 or 4 Children | 0 (0.0%) | 0 (0.0%) |
| 5 or more Children | 0 (0.0%) | 0 (0.0%) |
| Total | 62 (100.0%) | 0 (0.0%) |
Income Below Poverty Among Single-Parent Households in Trenton
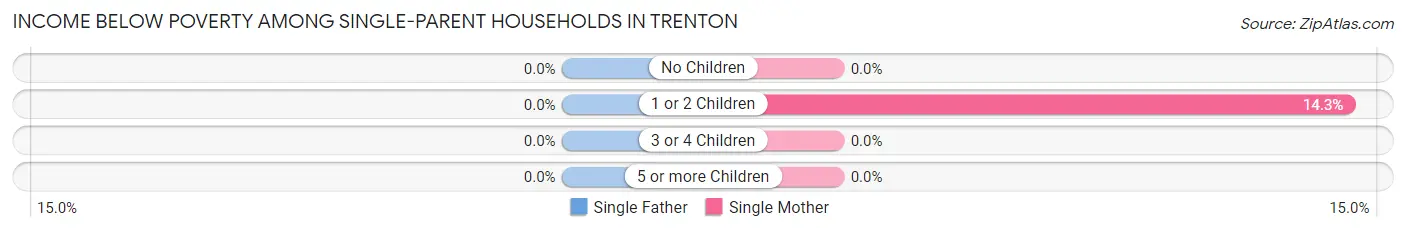
| Children | Single Father | Single Mother |
| No Children | 0 (0.0%) | 0 (0.0%) |
| 1 or 2 Children | 0 (0.0%) | 1 (14.3%) |
| 3 or 4 Children | 0 (0.0%) | 0 (0.0%) |
| 5 or more Children | 0 (0.0%) | 0 (0.0%) |
| Total | 0 (0.0%) | 1 (4.8%) |
Income Below Poverty Among Married-Couple vs Single-Parent Households in Trenton
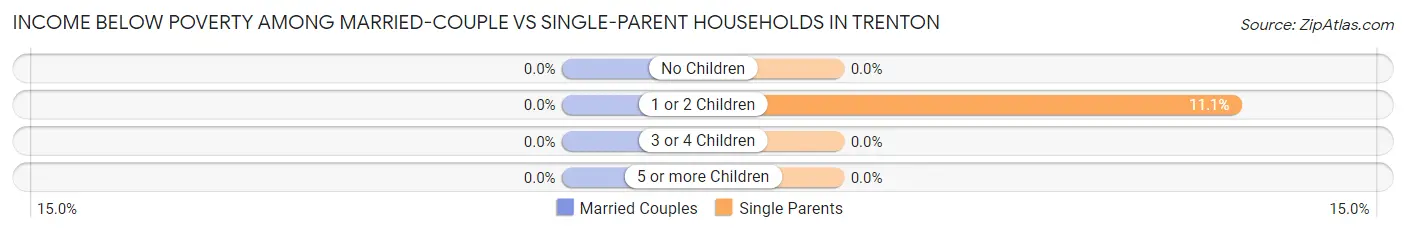
| Children | Married-Couple Families | Single-Parent Households |
| No Children | 0 (0.0%) | 0 (0.0%) |
| 1 or 2 Children | 0 (0.0%) | 1 (11.1%) |
| 3 or 4 Children | 0 (0.0%) | 0 (0.0%) |
| 5 or more Children | 0 (0.0%) | 0 (0.0%) |
| Total | 0 (0.0%) | 1 (4.0%) |
Race in Trenton
The most populous races in Trenton are White / Caucasian (267 | 93.4%), Black / African American (17 | 5.9%), and Two or more Races (2 | 0.7%).
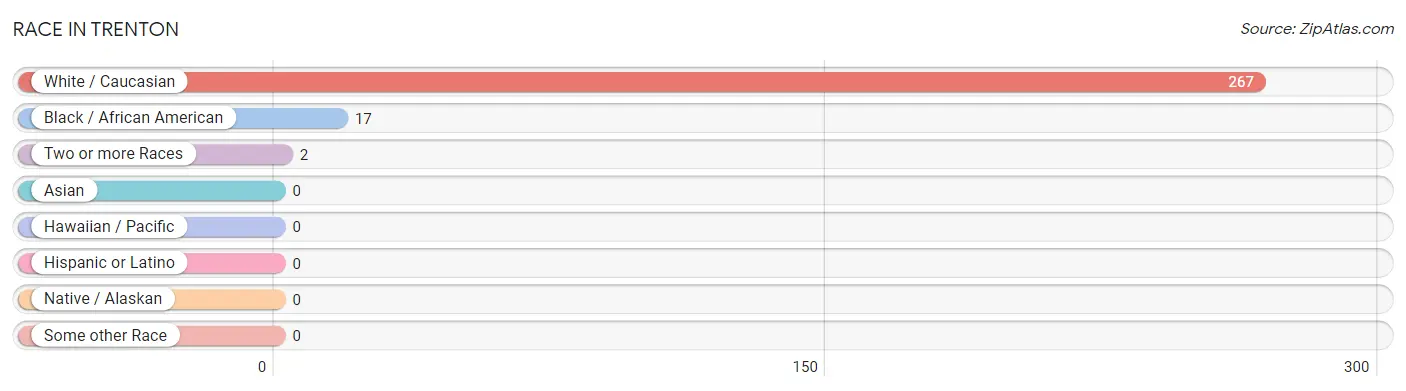
| Race | # Population | % Population |
| Asian | 0 | 0.0% |
| Black / African American | 17 | 5.9% |
| Hawaiian / Pacific | 0 | 0.0% |
| Hispanic or Latino | 0 | 0.0% |
| Native / Alaskan | 0 | 0.0% |
| White / Caucasian | 267 | 93.4% |
| Two or more Races | 2 | 0.7% |
| Some other Race | 0 | 0.0% |
| Total | 286 | 100.0% |
Ancestry in Trenton
The most populous ancestries reported in Trenton are English (74 | 25.9%), Irish (23 | 8.0%), German (18 | 6.3%), American (16 | 5.6%), and Scotch-Irish (14 | 4.9%), together accounting for 50.7% of all Trenton residents.
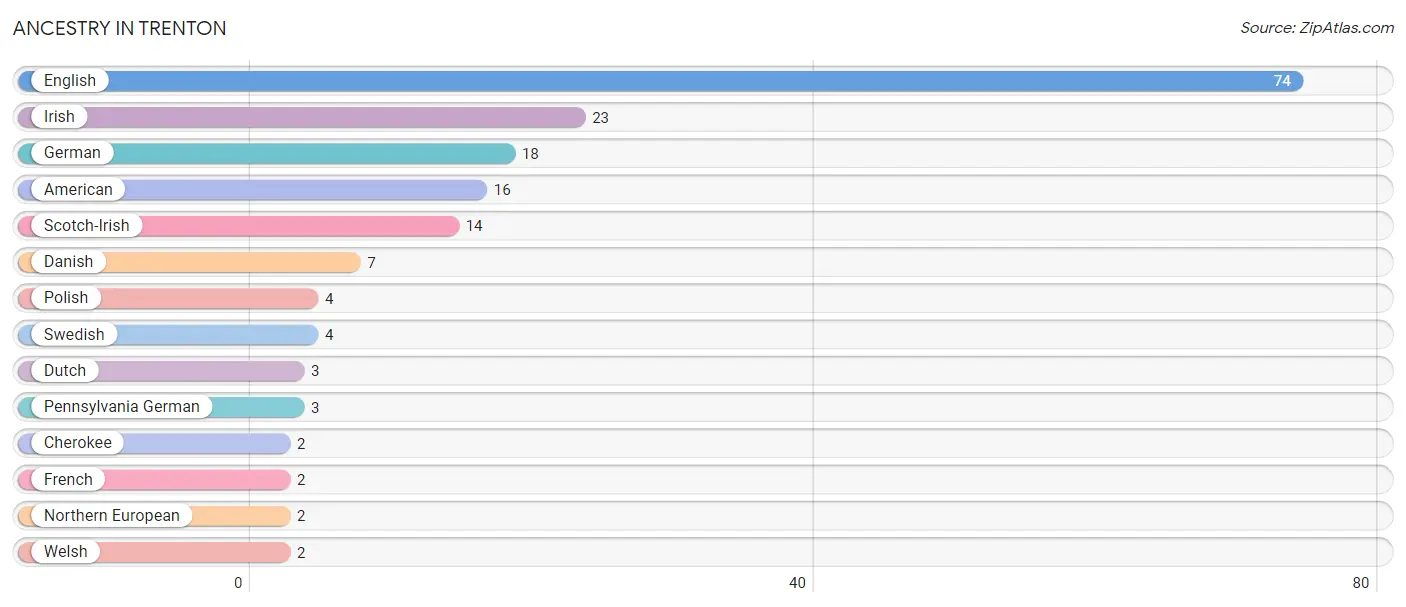
| Ancestry | # Population | % Population |
| American | 16 | 5.6% |
| Cherokee | 2 | 0.7% |
| Danish | 7 | 2.5% |
| Dutch | 3 | 1.1% |
| English | 74 | 25.9% |
| French | 2 | 0.7% |
| German | 18 | 6.3% |
| Irish | 23 | 8.0% |
| Northern European | 2 | 0.7% |
| Pennsylvania German | 3 | 1.1% |
| Polish | 4 | 1.4% |
| Scotch-Irish | 14 | 4.9% |
| Swedish | 4 | 1.4% |
| Welsh | 2 | 0.7% | View All 14 Rows |
Immigrants in Trenton

| Immigration Origin | # Population | % Population | View All 0 Rows |
Sex and Age in Trenton
Sex and Age in Trenton
The most populous age groups in Trenton are 60 to 64 Years (19 | 13.4%) for men and 55 to 59 Years (17 | 11.8%) for women.
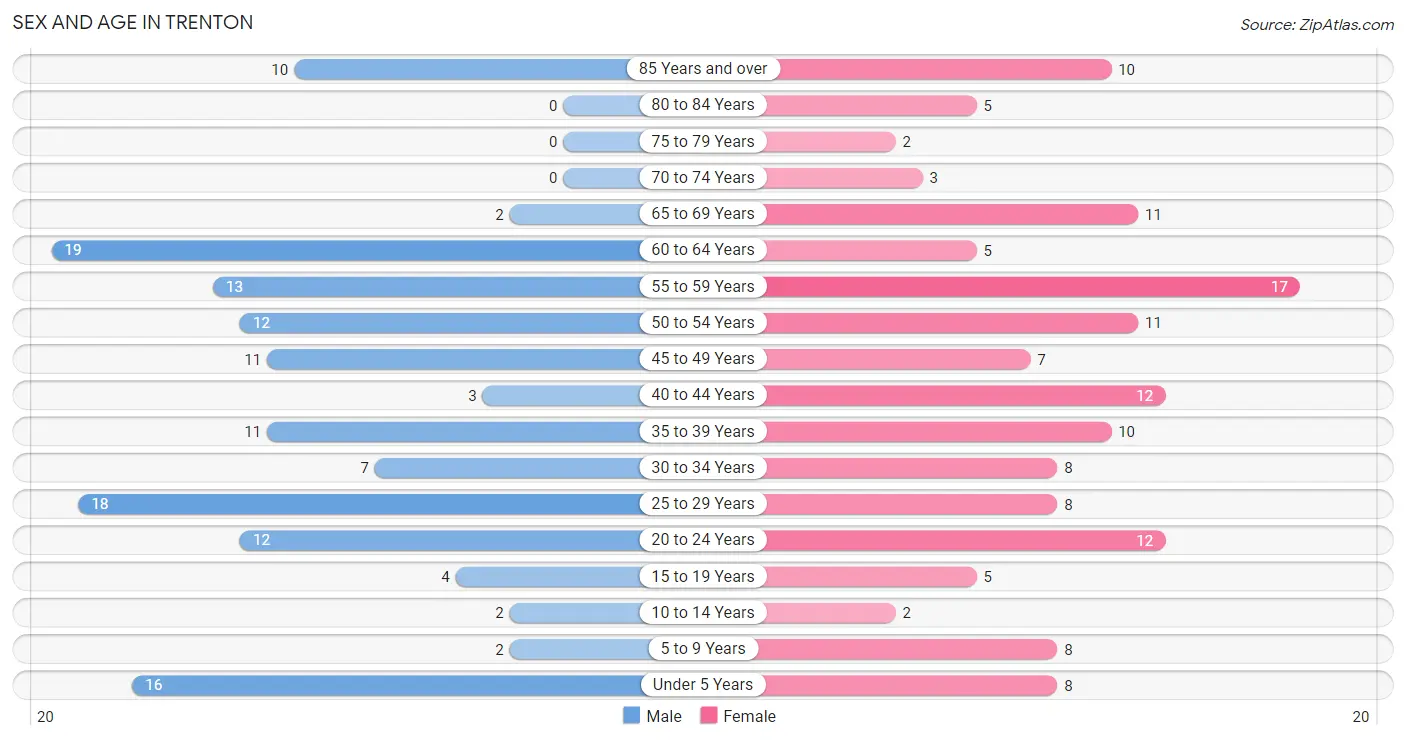
| Age Bracket | Male | Female |
| Under 5 Years | 16 (11.3%) | 8 (5.6%) |
| 5 to 9 Years | 2 (1.4%) | 8 (5.6%) |
| 10 to 14 Years | 2 (1.4%) | 2 (1.4%) |
| 15 to 19 Years | 4 (2.8%) | 5 (3.5%) |
| 20 to 24 Years | 12 (8.5%) | 12 (8.3%) |
| 25 to 29 Years | 18 (12.7%) | 8 (5.6%) |
| 30 to 34 Years | 7 (4.9%) | 8 (5.6%) |
| 35 to 39 Years | 11 (7.7%) | 10 (6.9%) |
| 40 to 44 Years | 3 (2.1%) | 12 (8.3%) |
| 45 to 49 Years | 11 (7.7%) | 7 (4.9%) |
| 50 to 54 Years | 12 (8.5%) | 11 (7.6%) |
| 55 to 59 Years | 13 (9.1%) | 17 (11.8%) |
| 60 to 64 Years | 19 (13.4%) | 5 (3.5%) |
| 65 to 69 Years | 2 (1.4%) | 11 (7.6%) |
| 70 to 74 Years | 0 (0.0%) | 3 (2.1%) |
| 75 to 79 Years | 0 (0.0%) | 2 (1.4%) |
| 80 to 84 Years | 0 (0.0%) | 5 (3.5%) |
| 85 Years and over | 10 (7.0%) | 10 (6.9%) |
| Total | 142 (100.0%) | 144 (100.0%) |
Families and Households in Trenton
Median Family Size in Trenton
The median family size in Trenton is 2.51 persons per family, with married-couple families (62 | 71.3%) accounting for the largest median family size of 2.69 persons per family. On the other hand, single male/father families (4 | 4.6%) represent the smallest median family size with 1.50 persons per family.
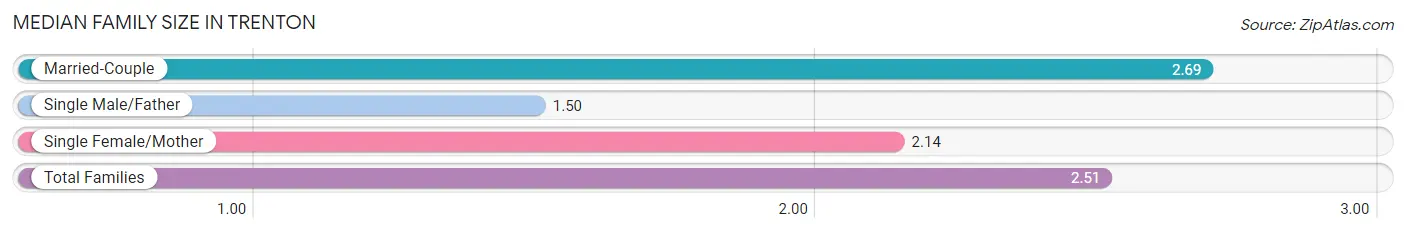
| Family Type | # Families | Family Size |
| Married-Couple | 62 (71.3%) | 2.69 |
| Single Male/Father | 4 (4.6%) | 1.50 |
| Single Female/Mother | 21 (24.1%) | 2.14 |
| Total Families | 87 (100.0%) | 2.51 |
Median Household Size in Trenton
The median household size in Trenton is 2.25 persons per household, with married-couple households (62 | 48.8%) accounting for the largest median household size of 2.81 persons per household. non-family households (40 | 31.5%) represent the smallest median household size with 1.38 persons per household.
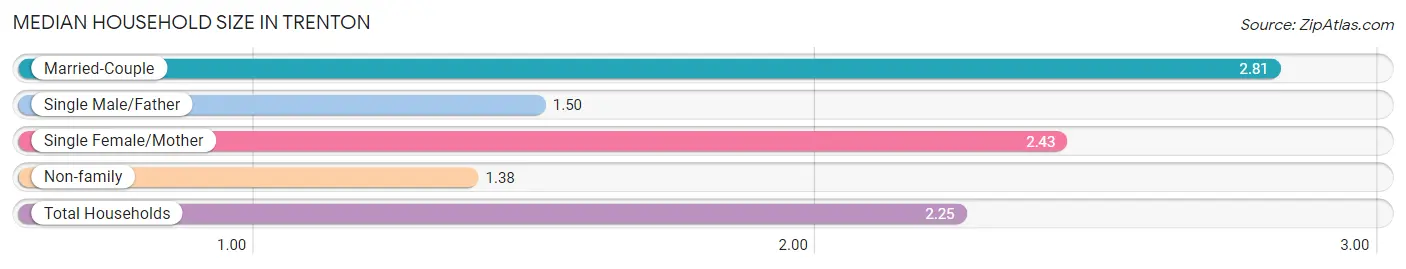
| Household Type | # Households | Household Size |
| Married-Couple | 62 (48.8%) | 2.81 |
| Single Male/Father | 4 (3.2%) | 1.50 |
| Single Female/Mother | 21 (16.5%) | 2.43 |
| Non-family | 40 (31.5%) | 1.38 |
| Total Households | 127 (100.0%) | 2.25 |
Household Size by Marriage Status in Trenton
Out of a total of 127 households in Trenton, 87 (68.5%) are family households, while 40 (31.5%) are nonfamily households. The most numerous type of family households are 2-person households, comprising 45, and the most common type of nonfamily households are 1-person households, comprising 20.
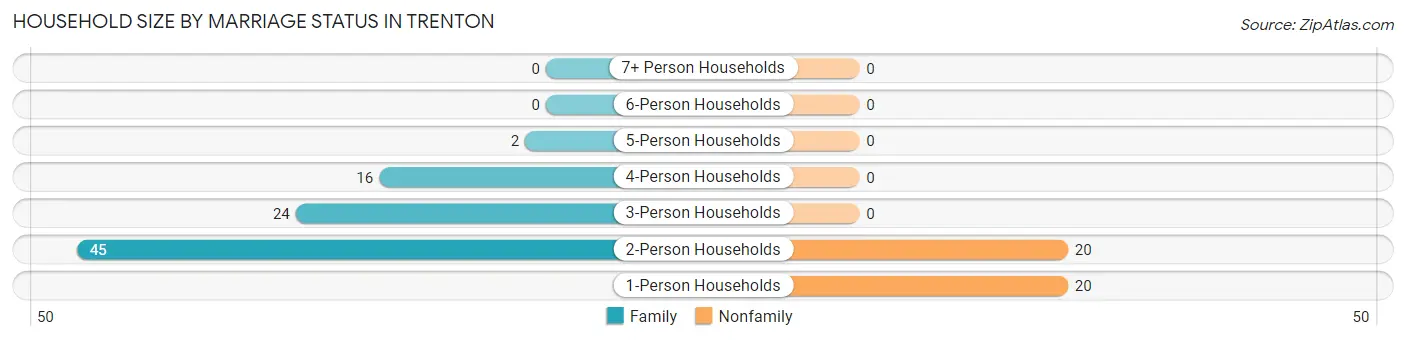
| Household Size | Family Households | Nonfamily Households |
| 1-Person Households | - | 20 (15.8%) |
| 2-Person Households | 45 (35.4%) | 20 (15.8%) |
| 3-Person Households | 24 (18.9%) | 0 (0.0%) |
| 4-Person Households | 16 (12.6%) | 0 (0.0%) |
| 5-Person Households | 2 (1.6%) | 0 (0.0%) |
| 6-Person Households | 0 (0.0%) | 0 (0.0%) |
| 7+ Person Households | 0 (0.0%) | 0 (0.0%) |
| Total | 87 (68.5%) | 40 (31.5%) |
Female Fertility in Trenton
Fertility by Age in Trenton
Average fertility rate in Trenton is 63.0 births per 1,000 women. Women in the age bracket of 20 to 34 years have the highest fertility rate with 143.0 births per 1,000 women. Women in the age bracket of 20 to 34 years acount for 100.0% of all women with births.
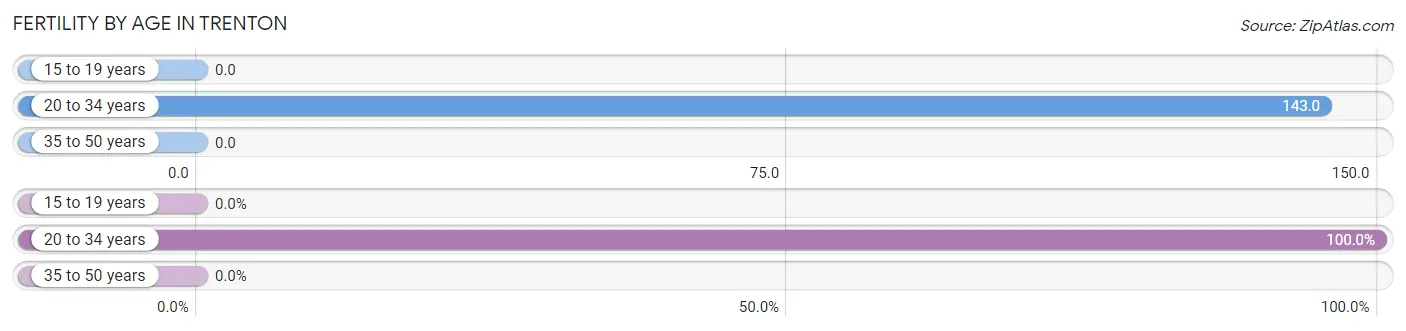
| Age Bracket | Women with Births | Births / 1,000 Women |
| 15 to 19 years | 0 (0.0%) | 0.0 |
| 20 to 34 years | 4 (100.0%) | 143.0 |
| 35 to 50 years | 0 (0.0%) | 0.0 |
| Total | 4 (100.0%) | 63.0 |
Fertility by Age by Marriage Status in Trenton
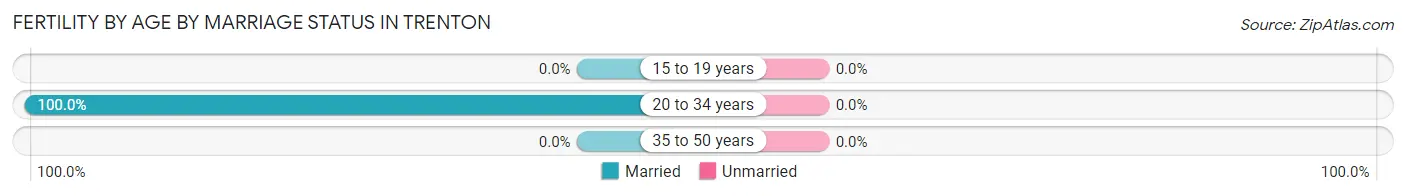
| Age Bracket | Married | Unmarried |
| 15 to 19 years | 0 (0.0%) | 0 (0.0%) |
| 20 to 34 years | 4 (100.0%) | 0 (0.0%) |
| 35 to 50 years | 0 (0.0%) | 0 (0.0%) |
| Total | 4 (100.0%) | 0 (0.0%) |
Fertility by Education in Trenton
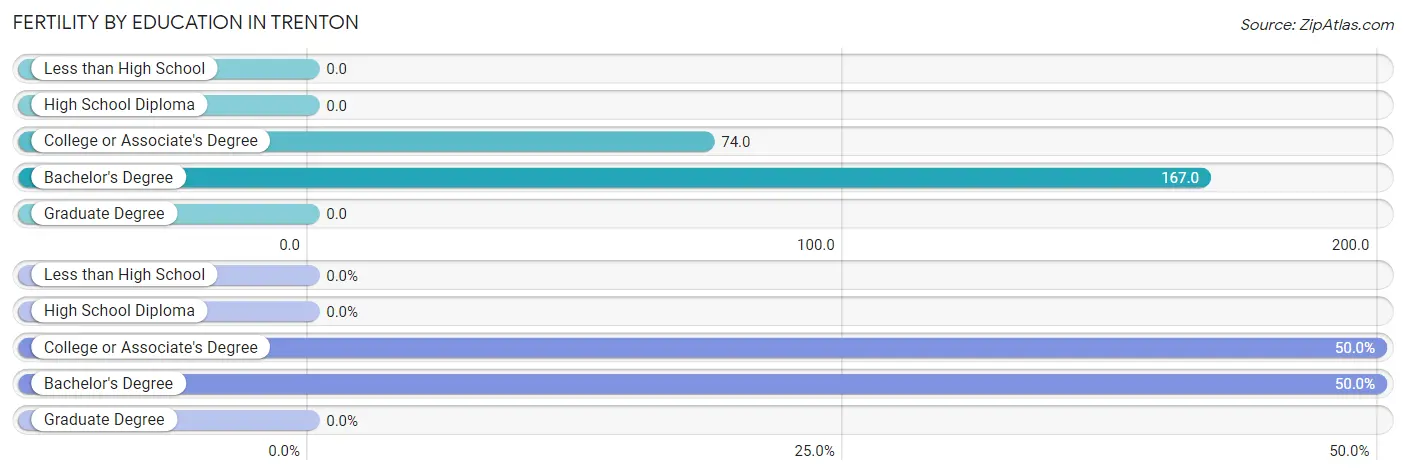
| Educational Attainment | Women with Births | Births / 1,000 Women |
| Less than High School | 0 (0.0%) | 0.0 |
| High School Diploma | 0 (0.0%) | 0.0 |
| College or Associate's Degree | 2 (50.0%) | 74.0 |
| Bachelor's Degree | 2 (50.0%) | 167.0 |
| Graduate Degree | 0 (0.0%) | 0.0 |
| Total | 4 (100.0%) | 63.0 |
Fertility by Education by Marriage Status in Trenton
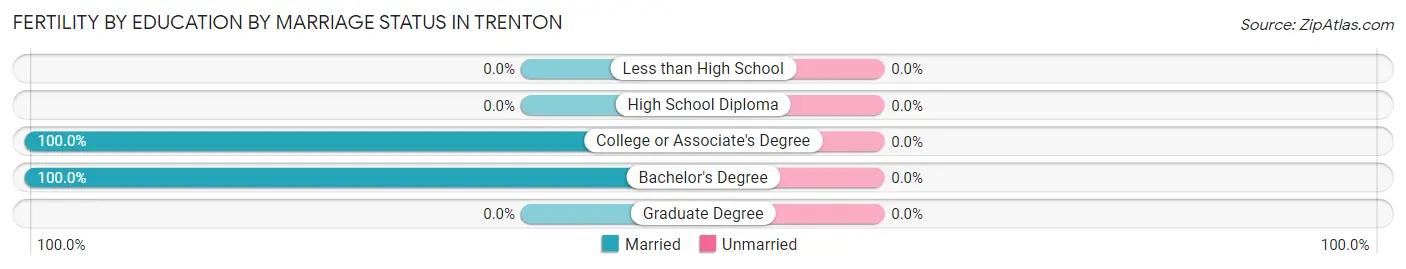
| Educational Attainment | Married | Unmarried |
| Less than High School | 0 (0.0%) | 0 (0.0%) |
| High School Diploma | 0 (0.0%) | 0 (0.0%) |
| College or Associate's Degree | 2 (100.0%) | 0 (0.0%) |
| Bachelor's Degree | 2 (100.0%) | 0 (0.0%) |
| Graduate Degree | 0 (0.0%) | 0 (0.0%) |
| Total | 4 (100.0%) | 0 (0.0%) |
Employment Characteristics in Trenton
Employment by Class of Employer in Trenton
Among the 157 employed individuals in Trenton, private company employees (92 | 58.6%), self-employed (not incorporated) (38 | 24.2%), and state government employees (8 | 5.1%) make up the most common classes of employment.
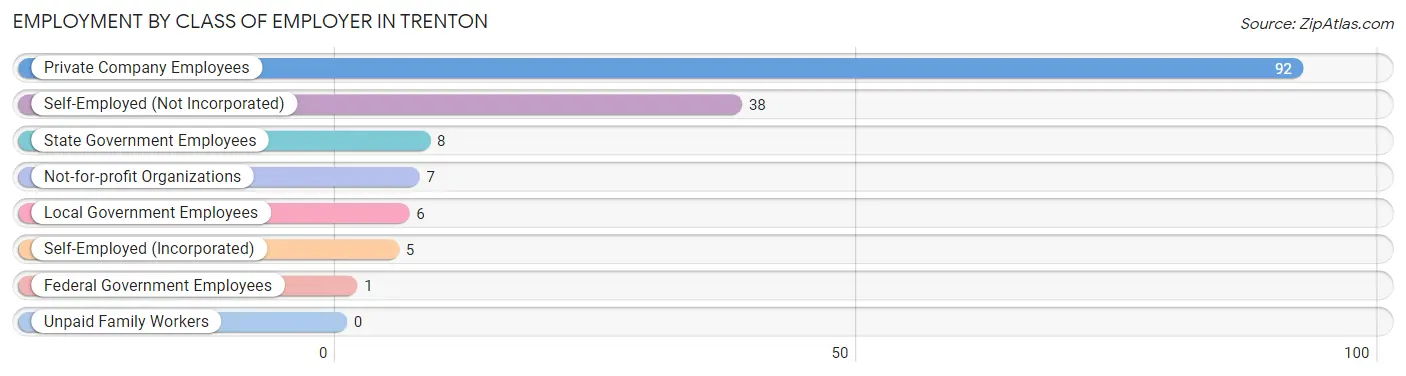
| Employer Class | # Employees | % Employees |
| Private Company Employees | 92 | 58.6% |
| Self-Employed (Incorporated) | 5 | 3.2% |
| Self-Employed (Not Incorporated) | 38 | 24.2% |
| Not-for-profit Organizations | 7 | 4.5% |
| Local Government Employees | 6 | 3.8% |
| State Government Employees | 8 | 5.1% |
| Federal Government Employees | 1 | 0.6% |
| Unpaid Family Workers | 0 | 0.0% |
| Total | 157 | 100.0% |
Employment Status by Age in Trenton
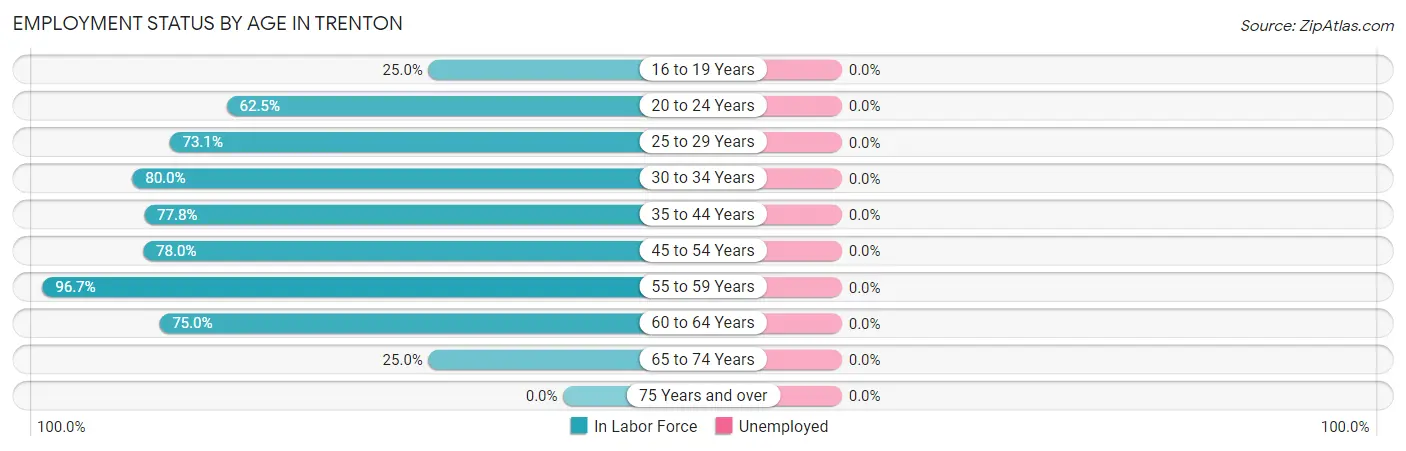
| Age Bracket | In Labor Force | Unemployed |
| 16 to 19 Years | 2 (25.0%) | 0 (0.0%) |
| 20 to 24 Years | 15 (62.5%) | 0 (0.0%) |
| 25 to 29 Years | 19 (73.1%) | 0 (0.0%) |
| 30 to 34 Years | 12 (80.0%) | 0 (0.0%) |
| 35 to 44 Years | 28 (77.8%) | 0 (0.0%) |
| 45 to 54 Years | 32 (78.0%) | 0 (0.0%) |
| 55 to 59 Years | 29 (96.7%) | 0 (0.0%) |
| 60 to 64 Years | 18 (75.0%) | 0 (0.0%) |
| 65 to 74 Years | 4 (25.0%) | 0 (0.0%) |
| 75 Years and over | 0 (0.0%) | 0 (0.0%) |
| Total | 159 (64.4%) | 0 (0.0%) |
Employment Status by Educational Attainment in Trenton
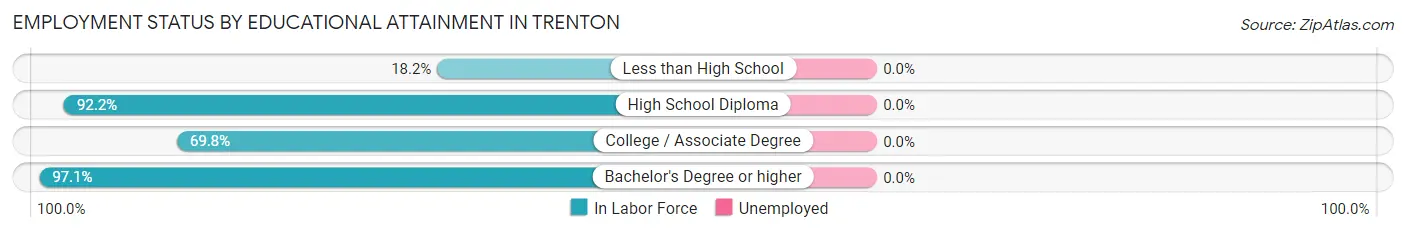
| Educational Attainment | In Labor Force | Unemployed |
| Less than High School | 2 (18.2%) | 0 (0.0%) |
| High School Diploma | 59 (92.2%) | 0 (0.0%) |
| College / Associate Degree | 44 (69.8%) | 0 (0.0%) |
| Bachelor's Degree or higher | 33 (97.1%) | 0 (0.0%) |
| Total | 138 (80.2%) | 0 (0.0%) |
Employment Occupations by Sex in Trenton
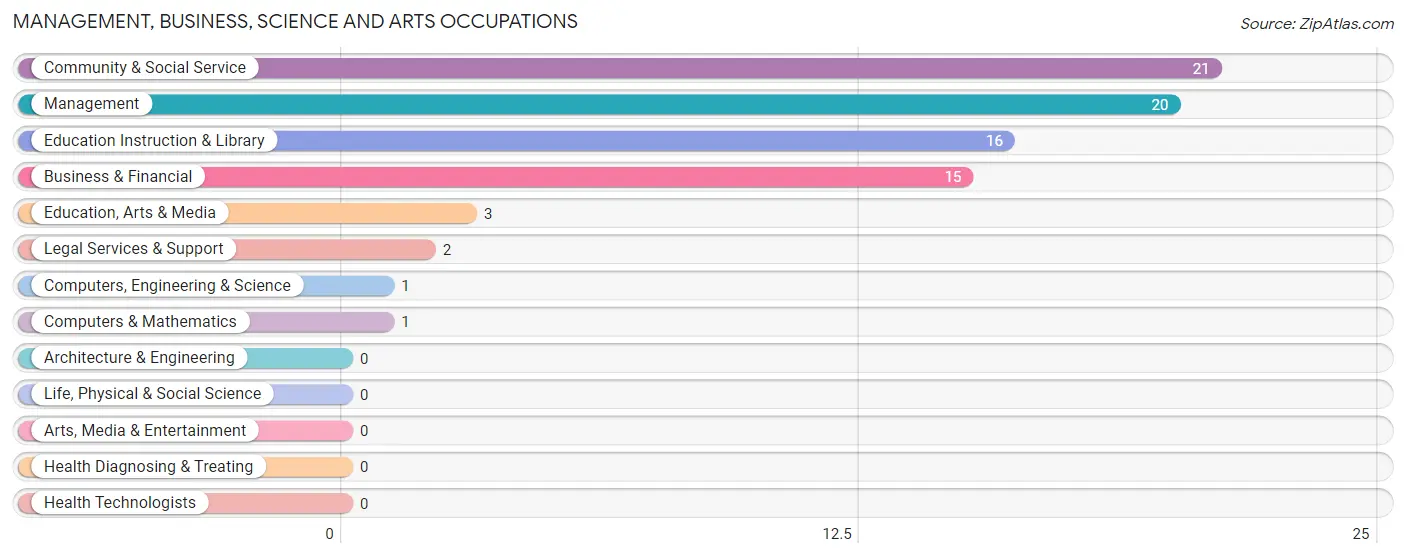
Management, Business, Science and Arts Occupations
The most common Management, Business, Science and Arts occupations in Trenton are Community & Social Service (21 | 13.2%), Management (20 | 12.6%), Education Instruction & Library (16 | 10.1%), Business & Financial (15 | 9.4%), and Education, Arts & Media (3 | 1.9%).
Management, Business, Science and Arts Occupations by Sex
Within the Management, Business, Science and Arts occupations in Trenton, the most male-oriented occupations are Computers, Engineering & Science (100.0%), Computers & Mathematics (100.0%), and Management (75.0%), while the most female-oriented occupations are Business & Financial (100.0%), Education, Arts & Media (100.0%), and Legal Services & Support (100.0%).
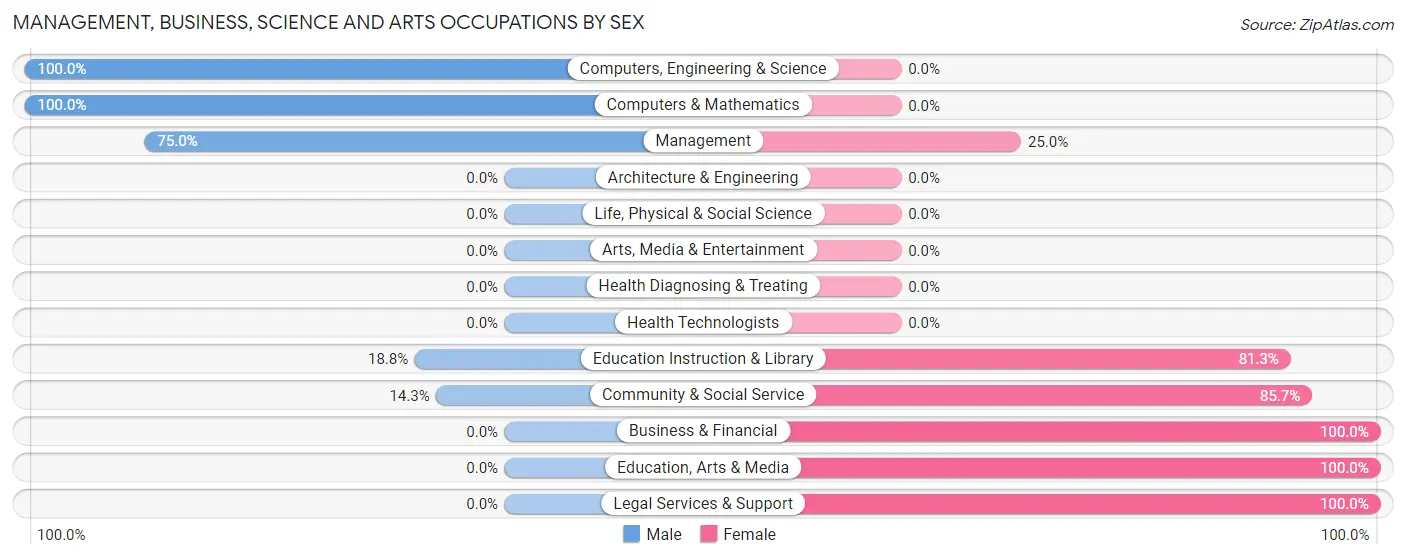
| Occupation | Male | Female |
| Management | 15 (75.0%) | 5 (25.0%) |
| Business & Financial | 0 (0.0%) | 15 (100.0%) |
| Computers, Engineering & Science | 1 (100.0%) | 0 (0.0%) |
| Computers & Mathematics | 1 (100.0%) | 0 (0.0%) |
| Architecture & Engineering | 0 (0.0%) | 0 (0.0%) |
| Life, Physical & Social Science | 0 (0.0%) | 0 (0.0%) |
| Community & Social Service | 3 (14.3%) | 18 (85.7%) |
| Education, Arts & Media | 0 (0.0%) | 3 (100.0%) |
| Legal Services & Support | 0 (0.0%) | 2 (100.0%) |
| Education Instruction & Library | 3 (18.8%) | 13 (81.2%) |
| Arts, Media & Entertainment | 0 (0.0%) | 0 (0.0%) |
| Health Diagnosing & Treating | 0 (0.0%) | 0 (0.0%) |
| Health Technologists | 0 (0.0%) | 0 (0.0%) |
| Total (Category) | 19 (33.3%) | 38 (66.7%) |
| Total (Overall) | 79 (49.7%) | 80 (50.3%) |
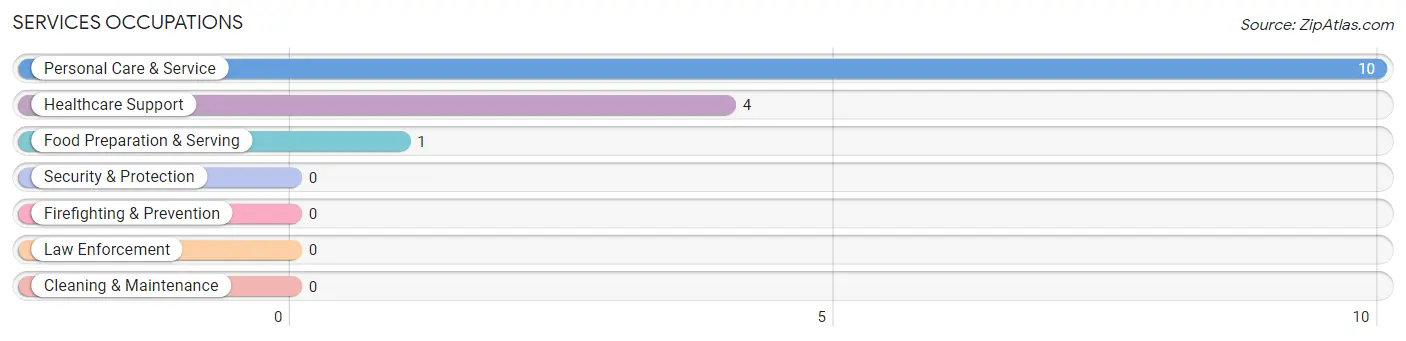
Services Occupations
The most common Services occupations in Trenton are Personal Care & Service (10 | 6.3%), Healthcare Support (4 | 2.5%), and Food Preparation & Serving (1 | 0.6%).
Services Occupations by Sex
Within the Services occupations in Trenton, the most male-oriented occupations are Food Preparation & Serving (100.0%), and Personal Care & Service (30.0%), while the most female-oriented occupations are Healthcare Support (100.0%), and Personal Care & Service (70.0%).
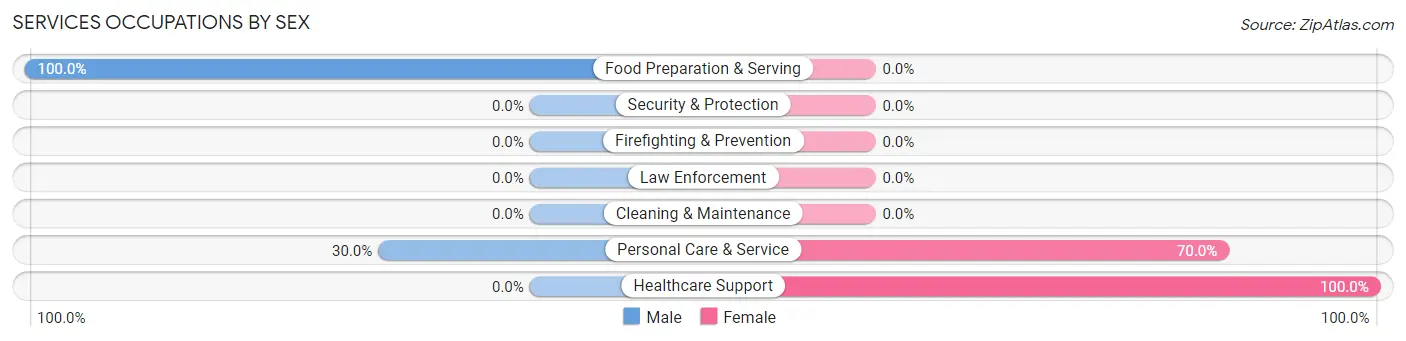
| Occupation | Male | Female |
| Healthcare Support | 0 (0.0%) | 4 (100.0%) |
| Security & Protection | 0 (0.0%) | 0 (0.0%) |
| Firefighting & Prevention | 0 (0.0%) | 0 (0.0%) |
| Law Enforcement | 0 (0.0%) | 0 (0.0%) |
| Food Preparation & Serving | 1 (100.0%) | 0 (0.0%) |
| Cleaning & Maintenance | 0 (0.0%) | 0 (0.0%) |
| Personal Care & Service | 3 (30.0%) | 7 (70.0%) |
| Total (Category) | 4 (26.7%) | 11 (73.3%) |
| Total (Overall) | 79 (49.7%) | 80 (50.3%) |
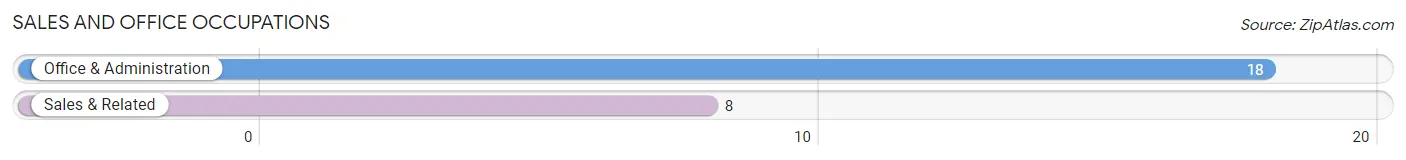
Sales and Office Occupations
The most common Sales and Office occupations in Trenton are Office & Administration (18 | 11.3%), and Sales & Related (8 | 5.0%).
Sales and Office Occupations by Sex
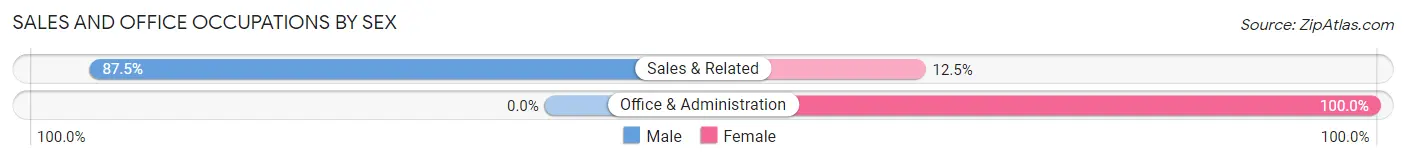
| Occupation | Male | Female |
| Sales & Related | 7 (87.5%) | 1 (12.5%) |
| Office & Administration | 0 (0.0%) | 18 (100.0%) |
| Total (Category) | 7 (26.9%) | 19 (73.1%) |
| Total (Overall) | 79 (49.7%) | 80 (50.3%) |
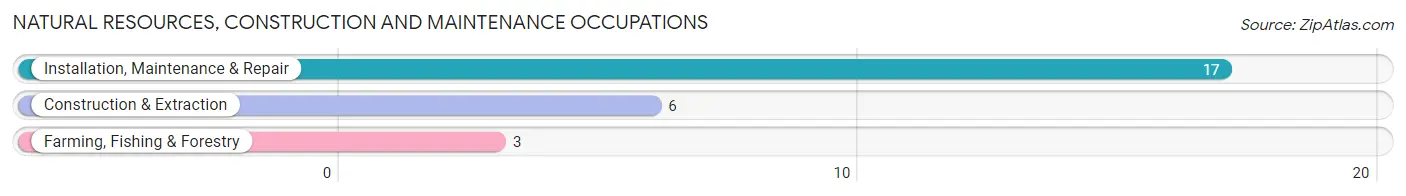
Natural Resources, Construction and Maintenance Occupations
The most common Natural Resources, Construction and Maintenance occupations in Trenton are Installation, Maintenance & Repair (17 | 10.7%), Construction & Extraction (6 | 3.8%), and Farming, Fishing & Forestry (3 | 1.9%).
Natural Resources, Construction and Maintenance Occupations by Sex
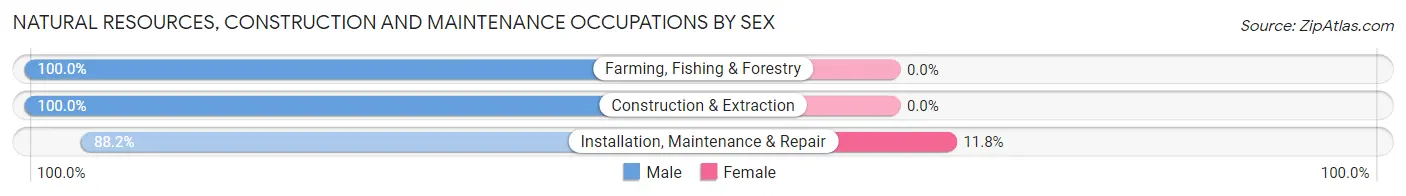
| Occupation | Male | Female |
| Farming, Fishing & Forestry | 3 (100.0%) | 0 (0.0%) |
| Construction & Extraction | 6 (100.0%) | 0 (0.0%) |
| Installation, Maintenance & Repair | 15 (88.2%) | 2 (11.8%) |
| Total (Category) | 24 (92.3%) | 2 (7.7%) |
| Total (Overall) | 79 (49.7%) | 80 (50.3%) |
Production, Transportation and Moving Occupations
The most common Production, Transportation and Moving occupations in Trenton are Production (18 | 11.3%), Transportation (11 | 6.9%), and Material Moving (6 | 3.8%).
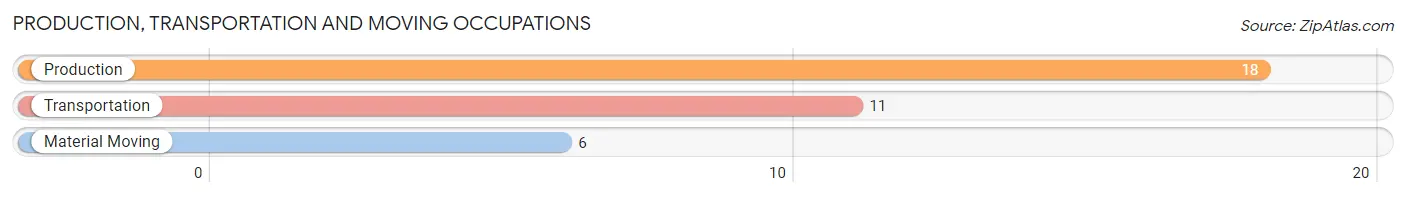
Production, Transportation and Moving Occupations by Sex
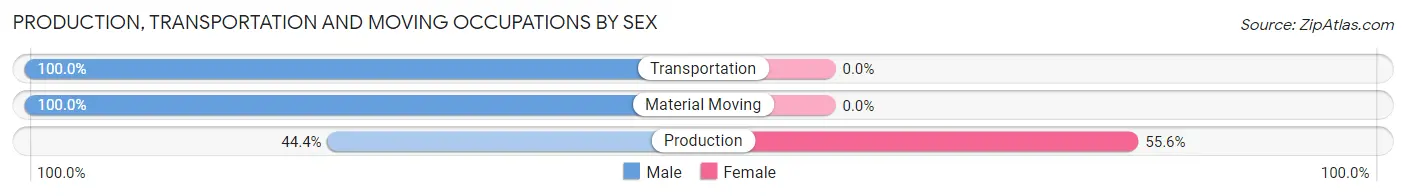
| Occupation | Male | Female |
| Production | 8 (44.4%) | 10 (55.6%) |
| Transportation | 11 (100.0%) | 0 (0.0%) |
| Material Moving | 6 (100.0%) | 0 (0.0%) |
| Total (Category) | 25 (71.4%) | 10 (28.6%) |
| Total (Overall) | 79 (49.7%) | 80 (50.3%) |
Employment Industries by Sex in Trenton
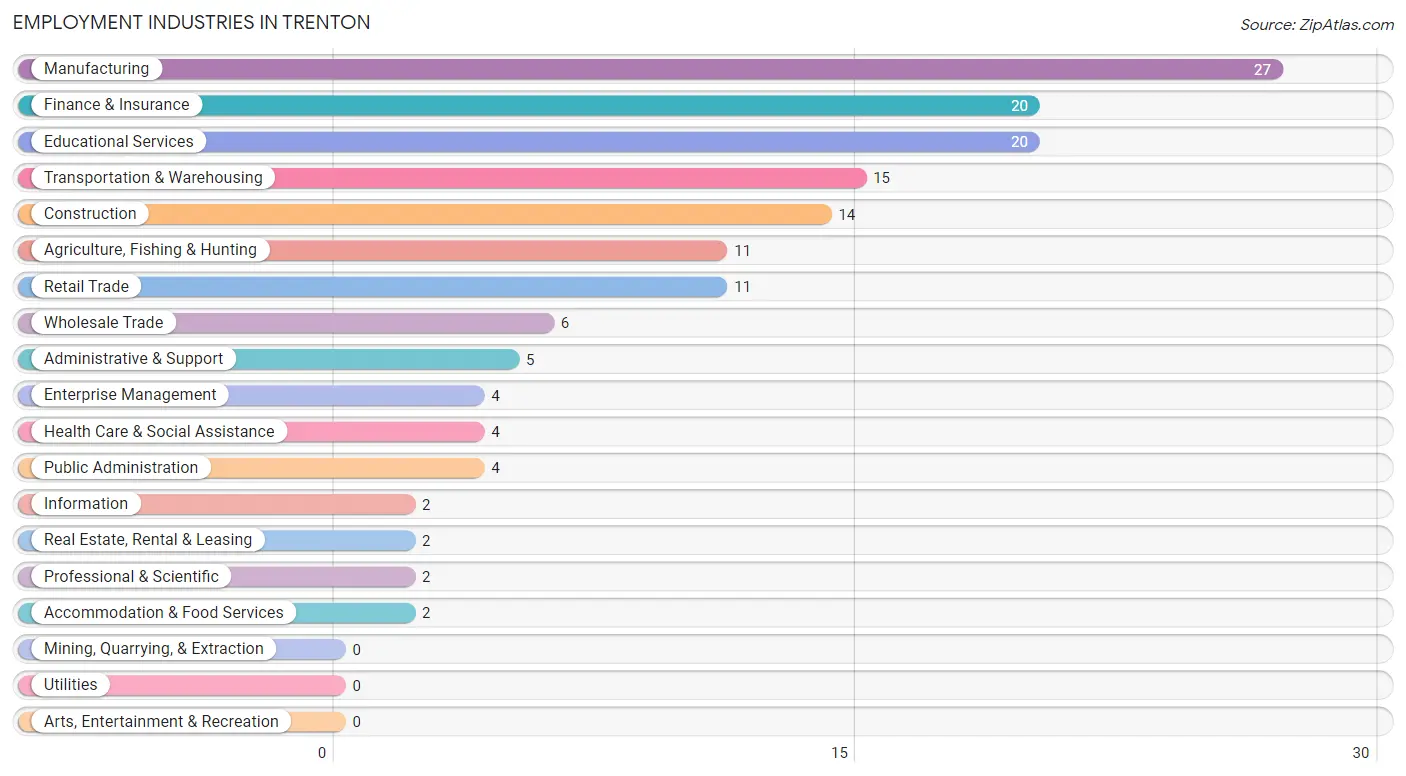
Employment Industries in Trenton
The major employment industries in Trenton include Manufacturing (27 | 17.0%), Finance & Insurance (20 | 12.6%), Educational Services (20 | 12.6%), Transportation & Warehousing (15 | 9.4%), and Construction (14 | 8.8%).
Employment Industries by Sex in Trenton
The Trenton industries that see more men than women are Agriculture, Fishing & Hunting (100.0%), Transportation & Warehousing (100.0%), and Enterprise Management (100.0%), whereas the industries that tend to have a higher number of women are Information (100.0%), Finance & Insurance (100.0%), and Real Estate, Rental & Leasing (100.0%).
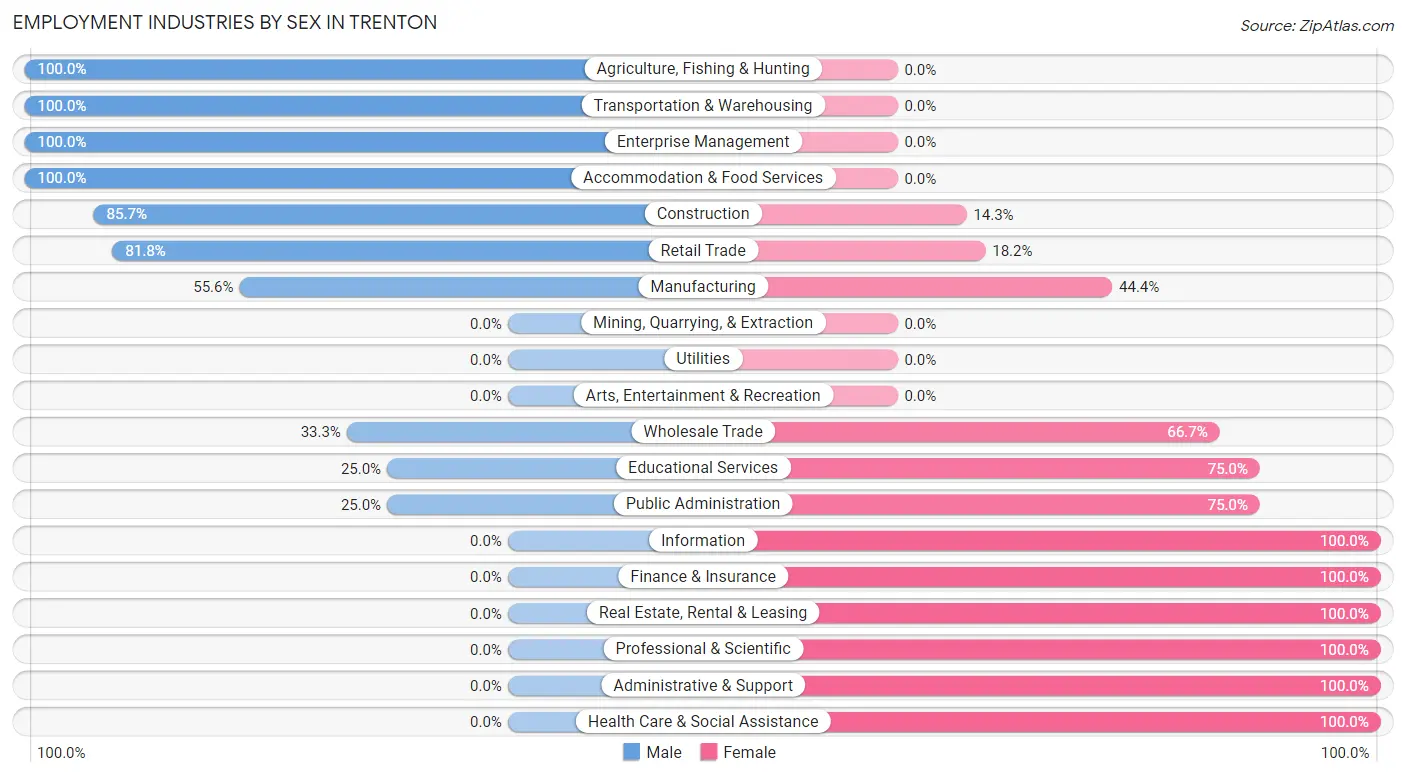
| Industry | Male | Female |
| Agriculture, Fishing & Hunting | 11 (100.0%) | 0 (0.0%) |
| Mining, Quarrying, & Extraction | 0 (0.0%) | 0 (0.0%) |
| Construction | 12 (85.7%) | 2 (14.3%) |
| Manufacturing | 15 (55.6%) | 12 (44.4%) |
| Wholesale Trade | 2 (33.3%) | 4 (66.7%) |
| Retail Trade | 9 (81.8%) | 2 (18.2%) |
| Transportation & Warehousing | 15 (100.0%) | 0 (0.0%) |
| Utilities | 0 (0.0%) | 0 (0.0%) |
| Information | 0 (0.0%) | 2 (100.0%) |
| Finance & Insurance | 0 (0.0%) | 20 (100.0%) |
| Real Estate, Rental & Leasing | 0 (0.0%) | 2 (100.0%) |
| Professional & Scientific | 0 (0.0%) | 2 (100.0%) |
| Enterprise Management | 4 (100.0%) | 0 (0.0%) |
| Administrative & Support | 0 (0.0%) | 5 (100.0%) |
| Educational Services | 5 (25.0%) | 15 (75.0%) |
| Health Care & Social Assistance | 0 (0.0%) | 4 (100.0%) |
| Arts, Entertainment & Recreation | 0 (0.0%) | 0 (0.0%) |
| Accommodation & Food Services | 2 (100.0%) | 0 (0.0%) |
| Public Administration | 1 (25.0%) | 3 (75.0%) |
| Total | 79 (49.7%) | 80 (50.3%) |
Education in Trenton
School Enrollment in Trenton
The most common levels of schooling among the 33 students in Trenton are elementary school (8 | 24.2%), high school (8 | 24.2%), and college / undergraduate (5 | 15.1%).
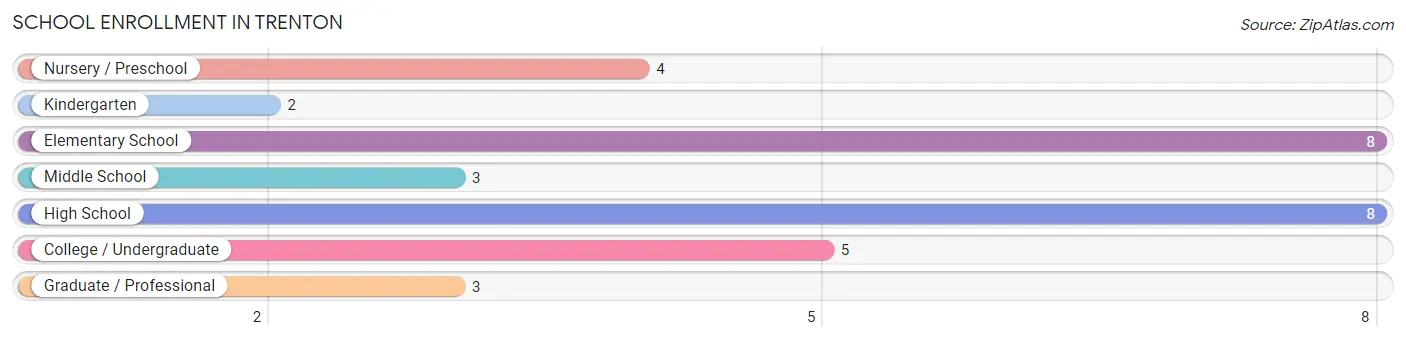
| School Level | # Students | % Students |
| Nursery / Preschool | 4 | 12.1% |
| Kindergarten | 2 | 6.1% |
| Elementary School | 8 | 24.2% |
| Middle School | 3 | 9.1% |
| High School | 8 | 24.2% |
| College / Undergraduate | 5 | 15.1% |
| Graduate / Professional | 3 | 9.1% |
| Total | 33 | 100.0% |
School Enrollment by Age by Funding Source in Trenton
Out of a total of 33 students who are enrolled in schools in Trenton, 4 (12.1%) attend a private institution, while the remaining 29 (87.9%) are enrolled in public schools. The age group of 3 to 4 year olds has the highest likelihood of being enrolled in private schools, with 3 (75.0% in the age bracket) enrolled. Conversely, the age group of 10 to 14 year olds has the lowest likelihood of being enrolled in a private school, with 4 (100.0% in the age bracket) attending a public institution.
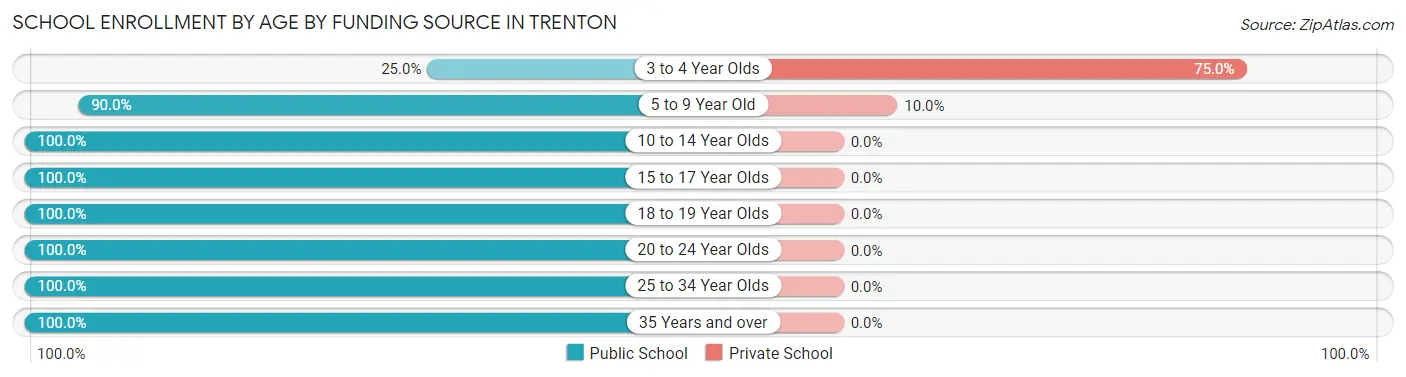
| Age Bracket | Public School | Private School |
| 3 to 4 Year Olds | 1 (25.0%) | 3 (75.0%) |
| 5 to 9 Year Old | 9 (90.0%) | 1 (10.0%) |
| 10 to 14 Year Olds | 4 (100.0%) | 0 (0.0%) |
| 15 to 17 Year Olds | 7 (100.0%) | 0 (0.0%) |
| 18 to 19 Year Olds | 1 (100.0%) | 0 (0.0%) |
| 20 to 24 Year Olds | 4 (100.0%) | 0 (0.0%) |
| 25 to 34 Year Olds | 2 (100.0%) | 0 (0.0%) |
| 35 Years and over | 1 (100.0%) | 0 (0.0%) |
| Total | 29 (87.9%) | 4 (12.1%) |
Educational Attainment by Field of Study in Trenton
Education (13 | 32.5%), business (7 | 17.5%), bio, nature & agricultural (6 | 15.0%), arts & humanities (5 | 12.5%), and engineering (4 | 10.0%) are the most common fields of study among 40 individuals in Trenton who have obtained a bachelor's degree or higher.
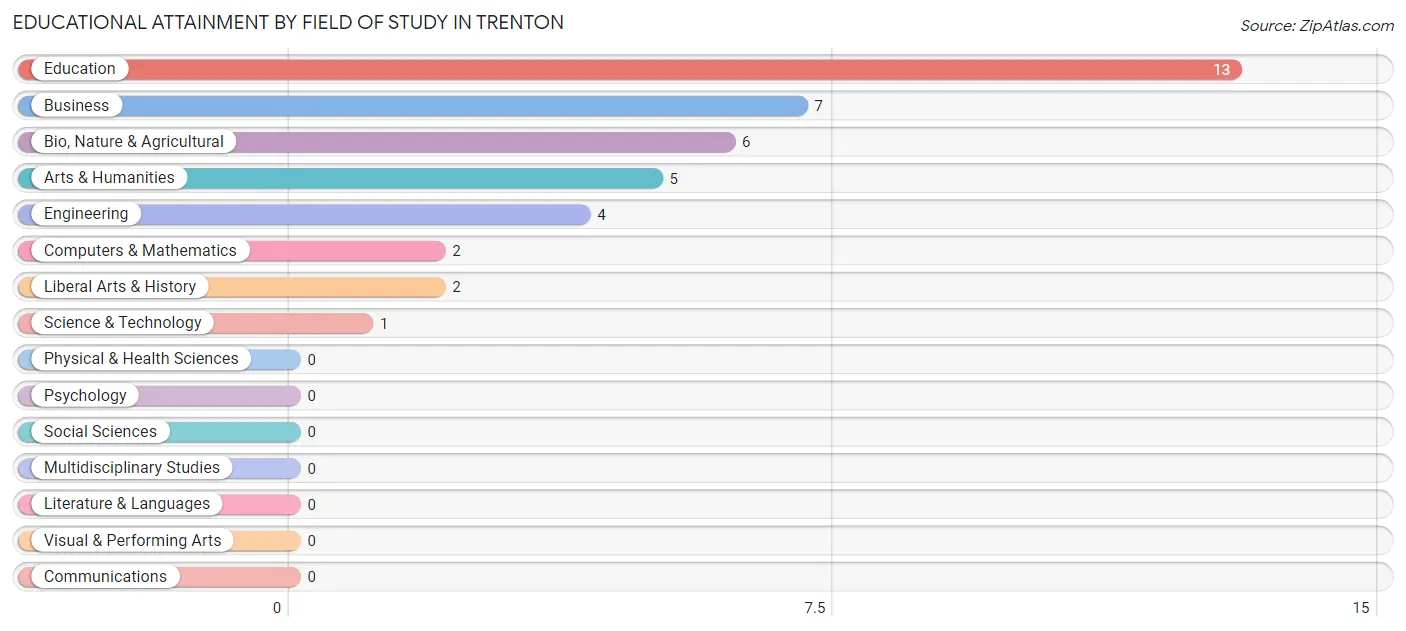
| Field of Study | # Graduates | % Graduates |
| Computers & Mathematics | 2 | 5.0% |
| Bio, Nature & Agricultural | 6 | 15.0% |
| Physical & Health Sciences | 0 | 0.0% |
| Psychology | 0 | 0.0% |
| Social Sciences | 0 | 0.0% |
| Engineering | 4 | 10.0% |
| Multidisciplinary Studies | 0 | 0.0% |
| Science & Technology | 1 | 2.5% |
| Business | 7 | 17.5% |
| Education | 13 | 32.5% |
| Literature & Languages | 0 | 0.0% |
| Liberal Arts & History | 2 | 5.0% |
| Visual & Performing Arts | 0 | 0.0% |
| Communications | 0 | 0.0% |
| Arts & Humanities | 5 | 12.5% |
| Total | 40 | 100.0% |
Transportation & Commute in Trenton
Vehicle Availability by Sex in Trenton
The most prevalent vehicle ownership categories in Trenton are males with 3 vehicles (34, accounting for 43.0%) and females with 3 vehicles (34, making up 43.6%).
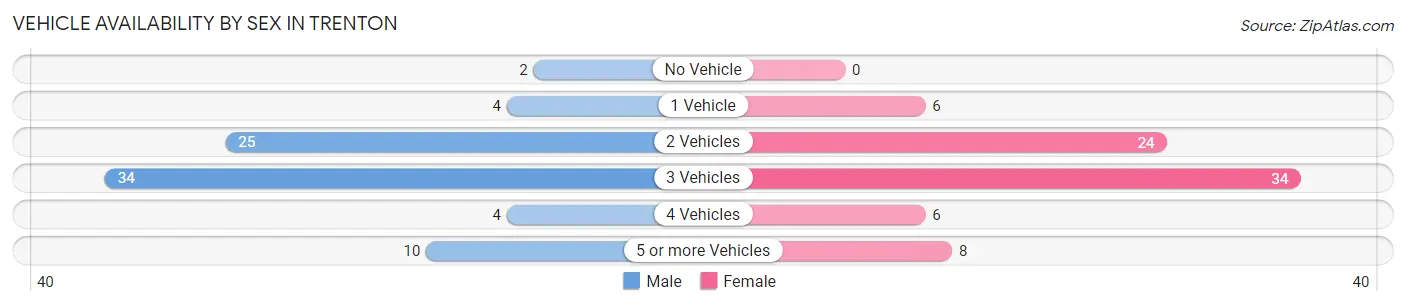
| Vehicles Available | Male | Female |
| No Vehicle | 2 (2.5%) | 0 (0.0%) |
| 1 Vehicle | 4 (5.1%) | 6 (7.7%) |
| 2 Vehicles | 25 (31.7%) | 24 (30.8%) |
| 3 Vehicles | 34 (43.0%) | 34 (43.6%) |
| 4 Vehicles | 4 (5.1%) | 6 (7.7%) |
| 5 or more Vehicles | 10 (12.7%) | 8 (10.3%) |
| Total | 79 (100.0%) | 78 (100.0%) |
Commute Time in Trenton
The most frequently occuring commute durations in Trenton are 15 to 19 minutes (61 commuters, 41.2%), 30 to 34 minutes (24 commuters, 16.2%), and 20 to 24 minutes (21 commuters, 14.2%).
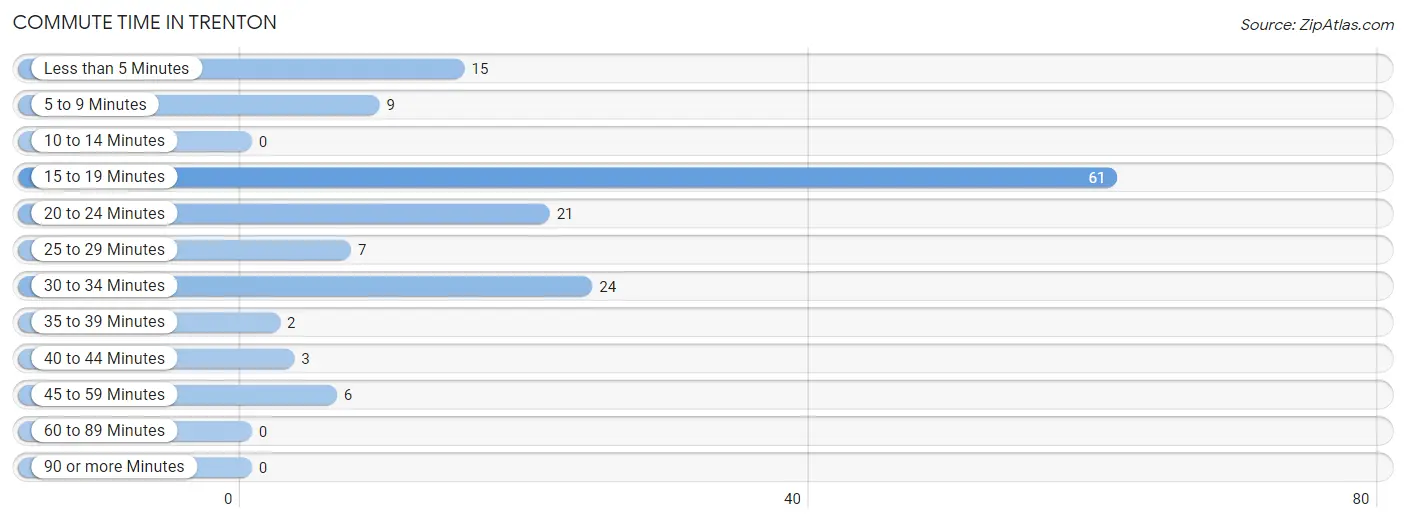
| Commute Time | # Commuters | % Commuters |
| Less than 5 Minutes | 15 | 10.1% |
| 5 to 9 Minutes | 9 | 6.1% |
| 10 to 14 Minutes | 0 | 0.0% |
| 15 to 19 Minutes | 61 | 41.2% |
| 20 to 24 Minutes | 21 | 14.2% |
| 25 to 29 Minutes | 7 | 4.7% |
| 30 to 34 Minutes | 24 | 16.2% |
| 35 to 39 Minutes | 2 | 1.3% |
| 40 to 44 Minutes | 3 | 2.0% |
| 45 to 59 Minutes | 6 | 4.1% |
| 60 to 89 Minutes | 0 | 0.0% |
| 90 or more Minutes | 0 | 0.0% |
Commute Time by Sex in Trenton
The most common commute times in Trenton are 15 to 19 minutes (21 commuters, 28.0%) for males and 15 to 19 minutes (40 commuters, 54.8%) for females.
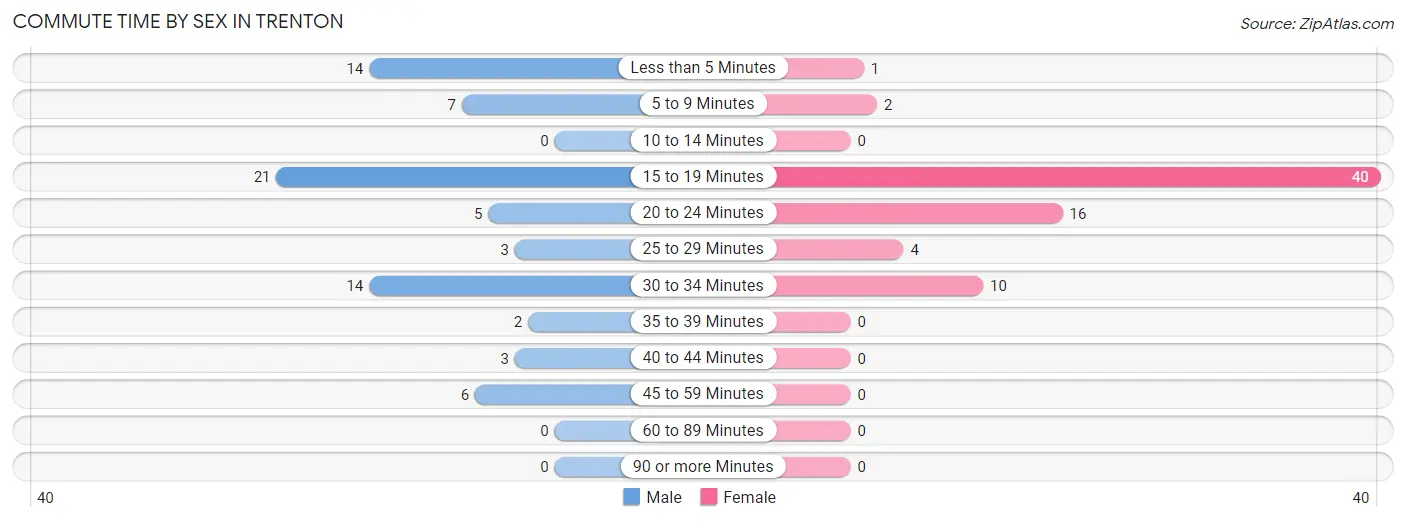
| Commute Time | Male | Female |
| Less than 5 Minutes | 14 (18.7%) | 1 (1.4%) |
| 5 to 9 Minutes | 7 (9.3%) | 2 (2.7%) |
| 10 to 14 Minutes | 0 (0.0%) | 0 (0.0%) |
| 15 to 19 Minutes | 21 (28.0%) | 40 (54.8%) |
| 20 to 24 Minutes | 5 (6.7%) | 16 (21.9%) |
| 25 to 29 Minutes | 3 (4.0%) | 4 (5.5%) |
| 30 to 34 Minutes | 14 (18.7%) | 10 (13.7%) |
| 35 to 39 Minutes | 2 (2.7%) | 0 (0.0%) |
| 40 to 44 Minutes | 3 (4.0%) | 0 (0.0%) |
| 45 to 59 Minutes | 6 (8.0%) | 0 (0.0%) |
| 60 to 89 Minutes | 0 (0.0%) | 0 (0.0%) |
| 90 or more Minutes | 0 (0.0%) | 0 (0.0%) |
Time of Departure to Work by Sex in Trenton
The most frequent times of departure to work in Trenton are 8:00 AM to 8:29 AM (18, 24.0%) for males and 7:30 AM to 7:59 AM (24, 32.9%) for females.
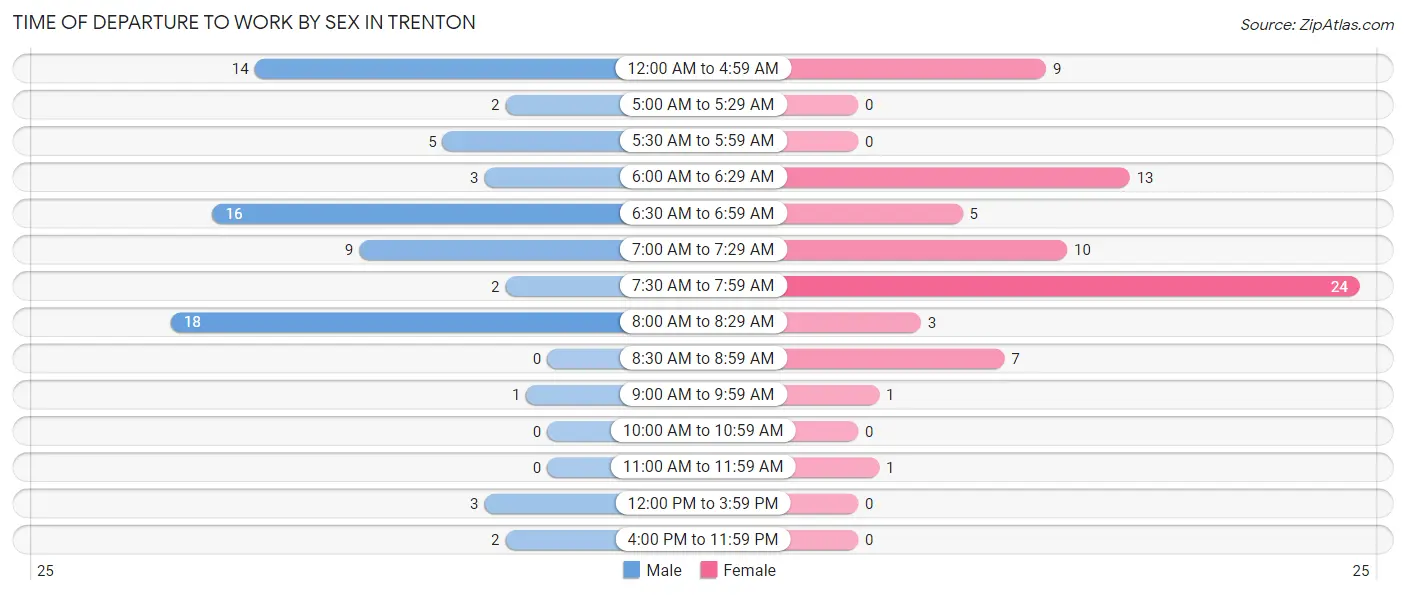
| Time of Departure | Male | Female |
| 12:00 AM to 4:59 AM | 14 (18.7%) | 9 (12.3%) |
| 5:00 AM to 5:29 AM | 2 (2.7%) | 0 (0.0%) |
| 5:30 AM to 5:59 AM | 5 (6.7%) | 0 (0.0%) |
| 6:00 AM to 6:29 AM | 3 (4.0%) | 13 (17.8%) |
| 6:30 AM to 6:59 AM | 16 (21.3%) | 5 (6.9%) |
| 7:00 AM to 7:29 AM | 9 (12.0%) | 10 (13.7%) |
| 7:30 AM to 7:59 AM | 2 (2.7%) | 24 (32.9%) |
| 8:00 AM to 8:29 AM | 18 (24.0%) | 3 (4.1%) |
| 8:30 AM to 8:59 AM | 0 (0.0%) | 7 (9.6%) |
| 9:00 AM to 9:59 AM | 1 (1.3%) | 1 (1.4%) |
| 10:00 AM to 10:59 AM | 0 (0.0%) | 0 (0.0%) |
| 11:00 AM to 11:59 AM | 0 (0.0%) | 1 (1.4%) |
| 12:00 PM to 3:59 PM | 3 (4.0%) | 0 (0.0%) |
| 4:00 PM to 11:59 PM | 2 (2.7%) | 0 (0.0%) |
| Total | 75 (100.0%) | 73 (100.0%) |
Housing Occupancy in Trenton
Occupancy by Ownership in Trenton
Of the total 127 dwellings in Trenton, owner-occupied units account for 104 (81.9%), while renter-occupied units make up 23 (18.1%).
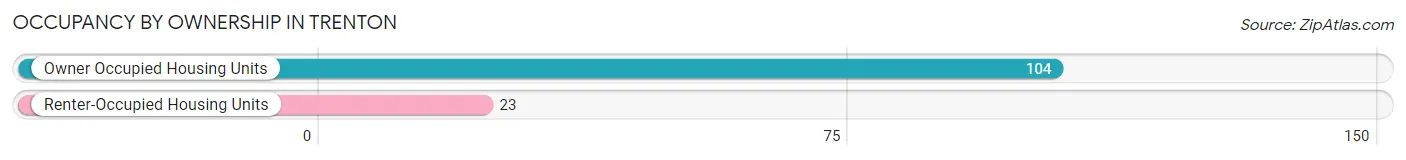
| Occupancy | # Housing Units | % Housing Units |
| Owner Occupied Housing Units | 104 | 81.9% |
| Renter-Occupied Housing Units | 23 | 18.1% |
| Total Occupied Housing Units | 127 | 100.0% |
Occupancy by Household Size in Trenton
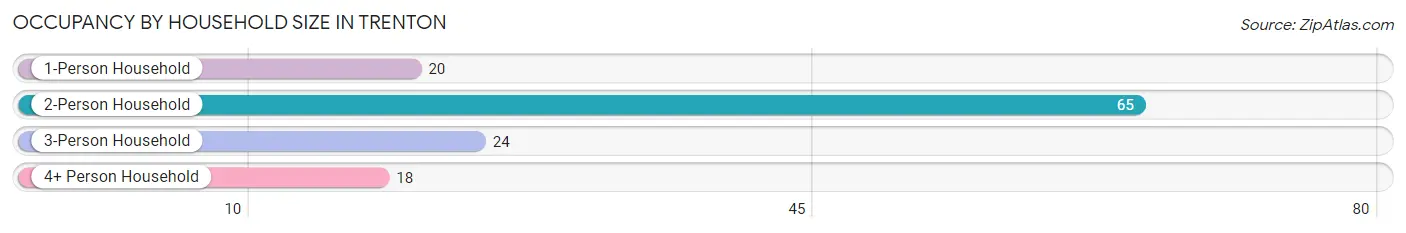
| Household Size | # Housing Units | % Housing Units |
| 1-Person Household | 20 | 15.8% |
| 2-Person Household | 65 | 51.2% |
| 3-Person Household | 24 | 18.9% |
| 4+ Person Household | 18 | 14.2% |
| Total Housing Units | 127 | 100.0% |
Occupancy by Ownership by Household Size in Trenton
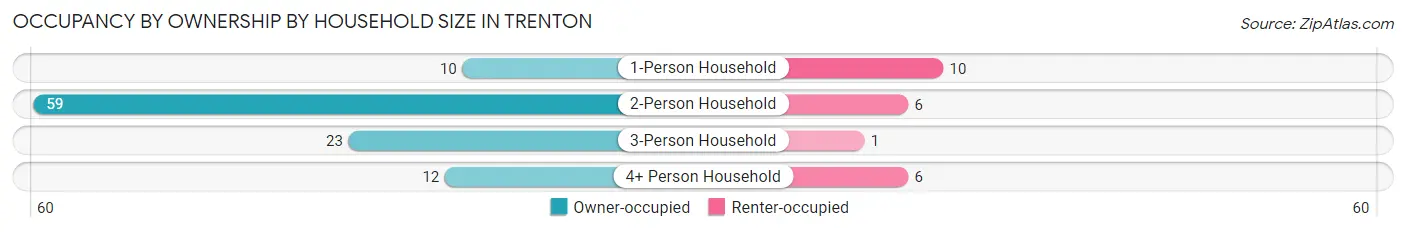
| Household Size | Owner-occupied | Renter-occupied |
| 1-Person Household | 10 (50.0%) | 10 (50.0%) |
| 2-Person Household | 59 (90.8%) | 6 (9.2%) |
| 3-Person Household | 23 (95.8%) | 1 (4.2%) |
| 4+ Person Household | 12 (66.7%) | 6 (33.3%) |
| Total Housing Units | 104 (81.9%) | 23 (18.1%) |
Occupancy by Educational Attainment in Trenton
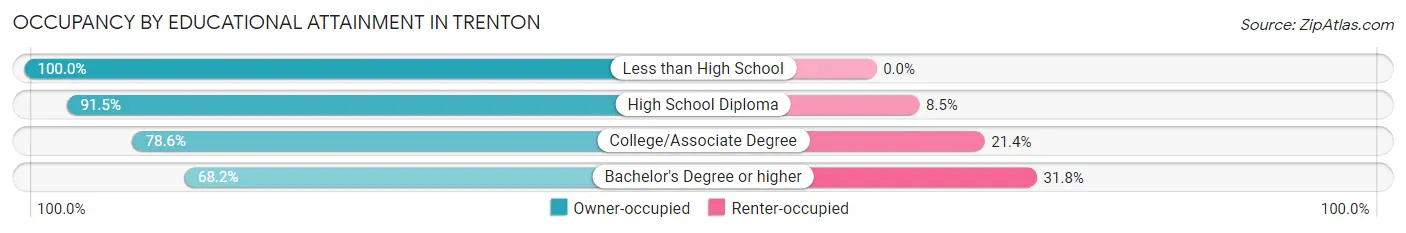
| Household Size | Owner-occupied | Renter-occupied |
| Less than High School | 2 (100.0%) | 0 (0.0%) |
| High School Diploma | 43 (91.5%) | 4 (8.5%) |
| College/Associate Degree | 44 (78.6%) | 12 (21.4%) |
| Bachelor's Degree or higher | 15 (68.2%) | 7 (31.8%) |
Occupancy by Age of Householder in Trenton
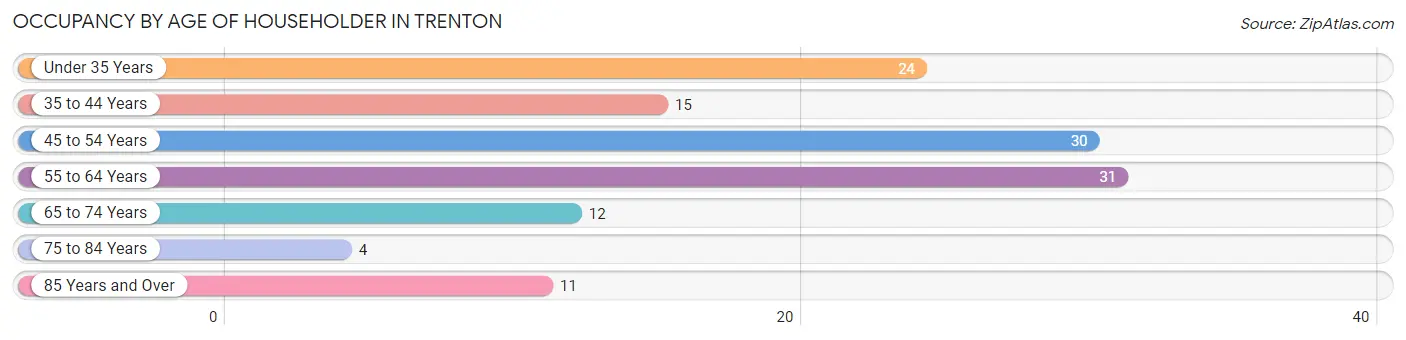
| Age Bracket | # Households | % Households |
| Under 35 Years | 24 | 18.9% |
| 35 to 44 Years | 15 | 11.8% |
| 45 to 54 Years | 30 | 23.6% |
| 55 to 64 Years | 31 | 24.4% |
| 65 to 74 Years | 12 | 9.5% |
| 75 to 84 Years | 4 | 3.2% |
| 85 Years and Over | 11 | 8.7% |
| Total | 127 | 100.0% |
Housing Finances in Trenton
Median Income by Occupancy in Trenton
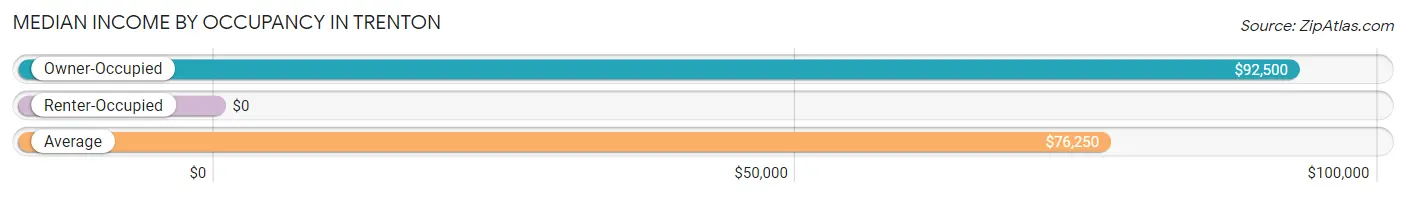
| Occupancy Type | # Households | Median Income |
| Owner-Occupied | 104 (81.9%) | $92,500 |
| Renter-Occupied | 23 (18.1%) | $0 |
| Average | 127 (100.0%) | $76,250 |
Occupancy by Householder Income Bracket in Trenton
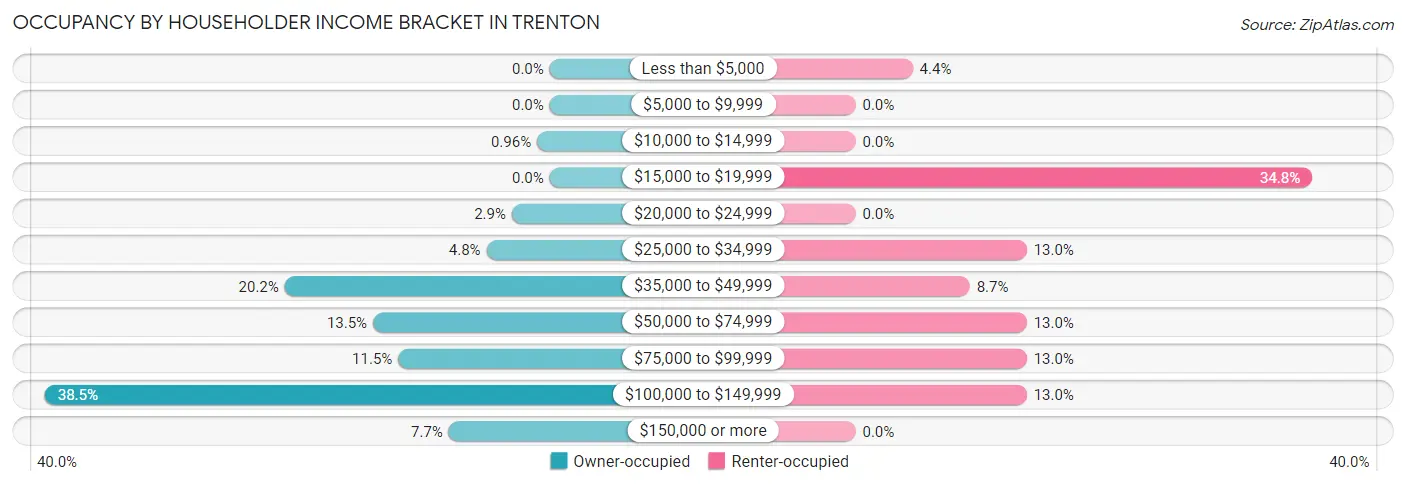
| Income Bracket | Owner-occupied | Renter-occupied |
| Less than $5,000 | 0 (0.0%) | 1 (4.3%) |
| $5,000 to $9,999 | 0 (0.0%) | 0 (0.0%) |
| $10,000 to $14,999 | 1 (1.0%) | 0 (0.0%) |
| $15,000 to $19,999 | 0 (0.0%) | 8 (34.8%) |
| $20,000 to $24,999 | 3 (2.9%) | 0 (0.0%) |
| $25,000 to $34,999 | 5 (4.8%) | 3 (13.0%) |
| $35,000 to $49,999 | 21 (20.2%) | 2 (8.7%) |
| $50,000 to $74,999 | 14 (13.5%) | 3 (13.0%) |
| $75,000 to $99,999 | 12 (11.5%) | 3 (13.0%) |
| $100,000 to $149,999 | 40 (38.5%) | 3 (13.0%) |
| $150,000 or more | 8 (7.7%) | 0 (0.0%) |
| Total | 104 (100.0%) | 23 (100.0%) |
Monthly Housing Cost Tiers in Trenton
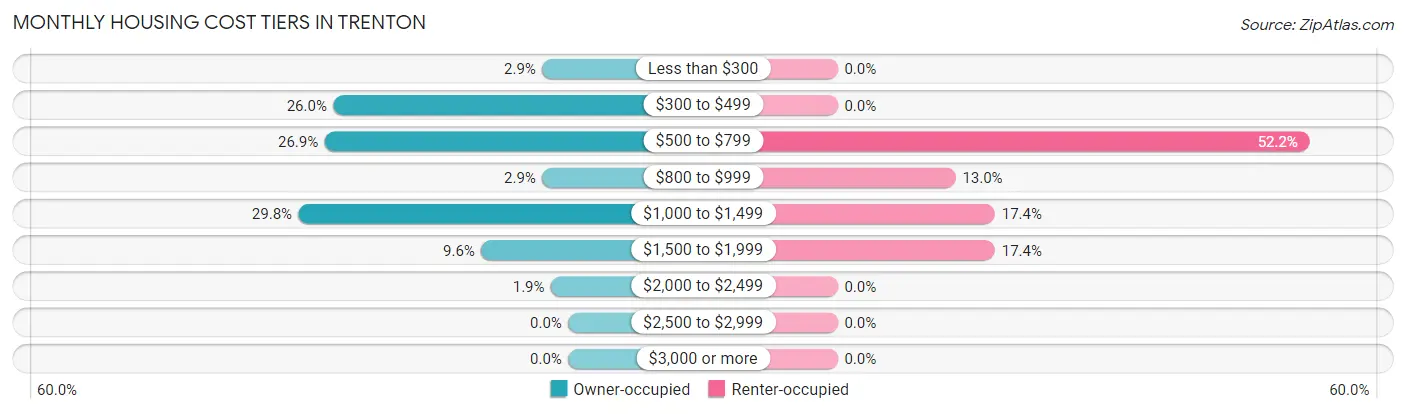
| Monthly Cost | Owner-occupied | Renter-occupied |
| Less than $300 | 3 (2.9%) | 0 (0.0%) |
| $300 to $499 | 27 (26.0%) | 0 (0.0%) |
| $500 to $799 | 28 (26.9%) | 12 (52.2%) |
| $800 to $999 | 3 (2.9%) | 3 (13.0%) |
| $1,000 to $1,499 | 31 (29.8%) | 4 (17.4%) |
| $1,500 to $1,999 | 10 (9.6%) | 4 (17.4%) |
| $2,000 to $2,499 | 2 (1.9%) | 0 (0.0%) |
| $2,500 to $2,999 | 0 (0.0%) | 0 (0.0%) |
| $3,000 or more | 0 (0.0%) | 0 (0.0%) |
| Total | 104 (100.0%) | 23 (100.0%) |
Physical Housing Characteristics in Trenton
Housing Structures in Trenton
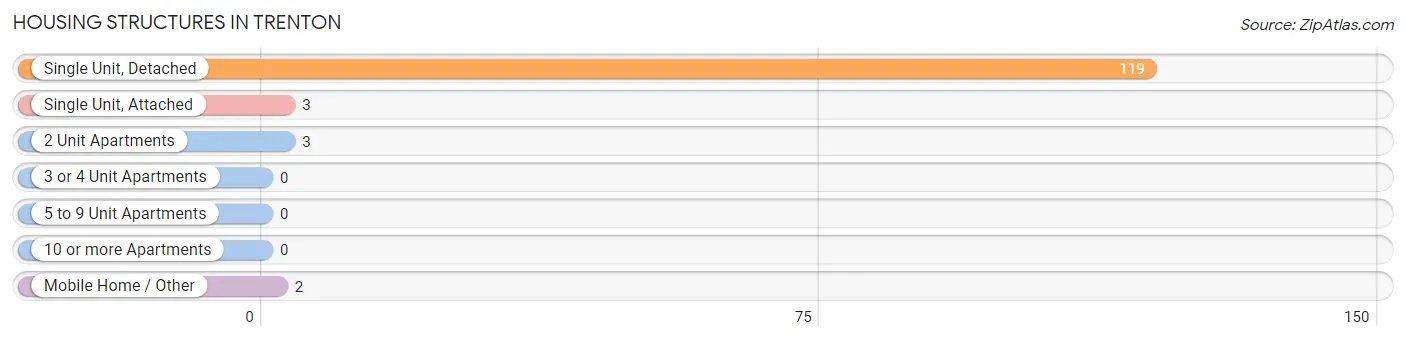
| Structure Type | # Housing Units | % Housing Units |
| Single Unit, Detached | 119 | 93.7% |
| Single Unit, Attached | 3 | 2.4% |
| 2 Unit Apartments | 3 | 2.4% |
| 3 or 4 Unit Apartments | 0 | 0.0% |
| 5 to 9 Unit Apartments | 0 | 0.0% |
| 10 or more Apartments | 0 | 0.0% |
| Mobile Home / Other | 2 | 1.6% |
| Total | 127 | 100.0% |
Housing Structures by Occupancy in Trenton
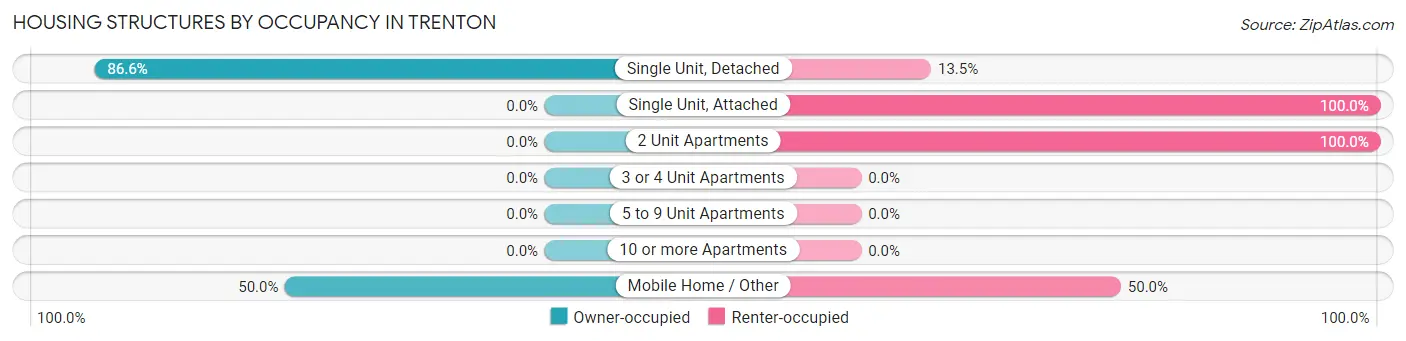
| Structure Type | Owner-occupied | Renter-occupied |
| Single Unit, Detached | 103 (86.6%) | 16 (13.5%) |
| Single Unit, Attached | 0 (0.0%) | 3 (100.0%) |
| 2 Unit Apartments | 0 (0.0%) | 3 (100.0%) |
| 3 or 4 Unit Apartments | 0 (0.0%) | 0 (0.0%) |
| 5 to 9 Unit Apartments | 0 (0.0%) | 0 (0.0%) |
| 10 or more Apartments | 0 (0.0%) | 0 (0.0%) |
| Mobile Home / Other | 1 (50.0%) | 1 (50.0%) |
| Total | 104 (81.9%) | 23 (18.1%) |
Housing Structures by Number of Rooms in Trenton
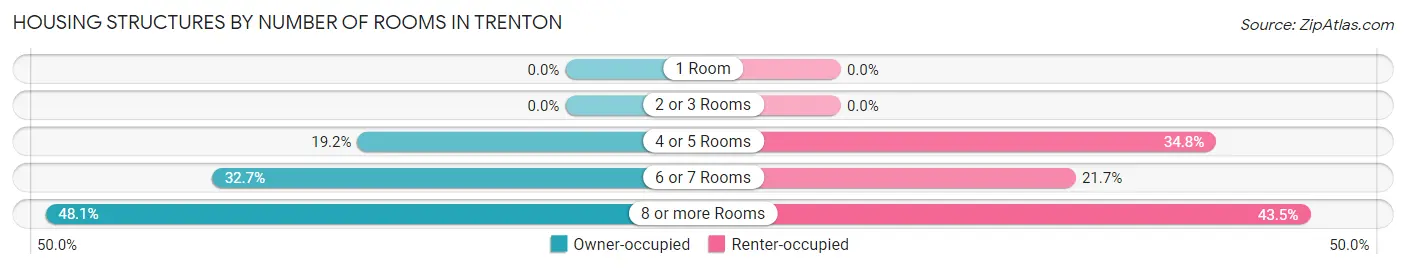
| Number of Rooms | Owner-occupied | Renter-occupied |
| 1 Room | 0 (0.0%) | 0 (0.0%) |
| 2 or 3 Rooms | 0 (0.0%) | 0 (0.0%) |
| 4 or 5 Rooms | 20 (19.2%) | 8 (34.8%) |
| 6 or 7 Rooms | 34 (32.7%) | 5 (21.7%) |
| 8 or more Rooms | 50 (48.1%) | 10 (43.5%) |
| Total | 104 (100.0%) | 23 (100.0%) |
Housing Structure by Heating Type in Trenton
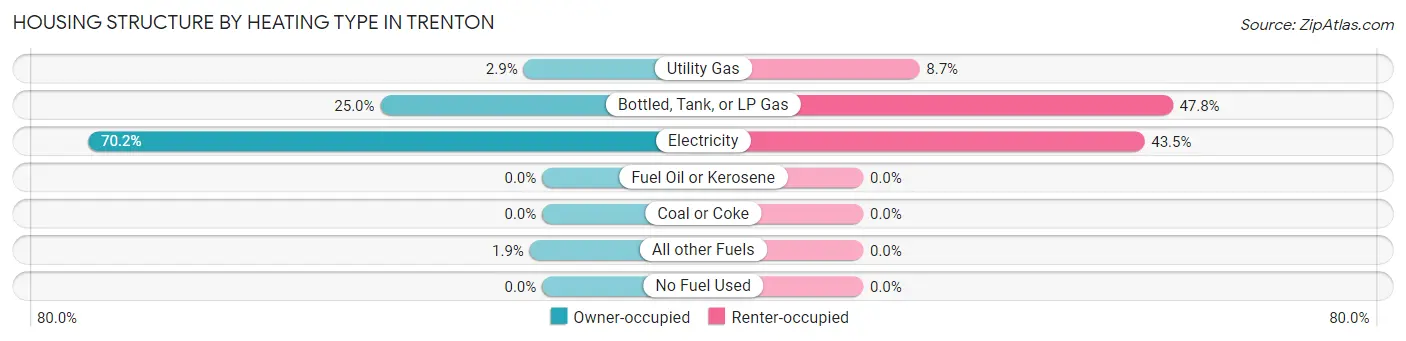
| Heating Type | Owner-occupied | Renter-occupied |
| Utility Gas | 3 (2.9%) | 2 (8.7%) |
| Bottled, Tank, or LP Gas | 26 (25.0%) | 11 (47.8%) |
| Electricity | 73 (70.2%) | 10 (43.5%) |
| Fuel Oil or Kerosene | 0 (0.0%) | 0 (0.0%) |
| Coal or Coke | 0 (0.0%) | 0 (0.0%) |
| All other Fuels | 2 (1.9%) | 0 (0.0%) |
| No Fuel Used | 0 (0.0%) | 0 (0.0%) |
| Total | 104 (100.0%) | 23 (100.0%) |
Household Vehicle Usage in Trenton
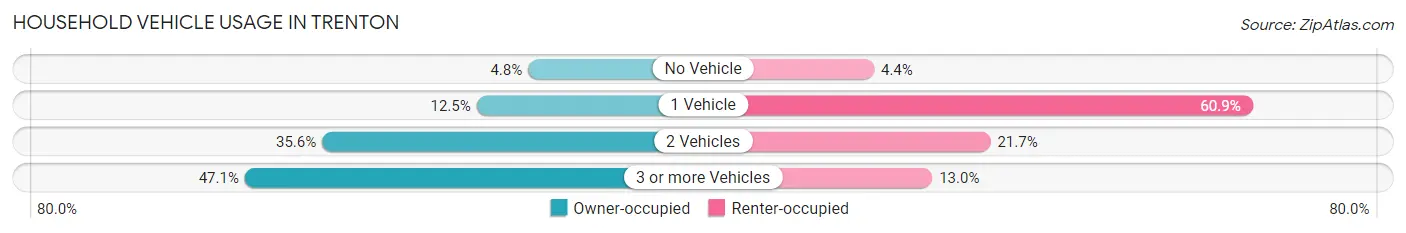
| Vehicles per Household | Owner-occupied | Renter-occupied |
| No Vehicle | 5 (4.8%) | 1 (4.3%) |
| 1 Vehicle | 13 (12.5%) | 14 (60.9%) |
| 2 Vehicles | 37 (35.6%) | 5 (21.7%) |
| 3 or more Vehicles | 49 (47.1%) | 3 (13.0%) |
| Total | 104 (100.0%) | 23 (100.0%) |
Real Estate & Mortgages in Trenton
Real Estate and Mortgage Overview in Trenton
| Characteristic | Without Mortgage | With Mortgage |
| Housing Units | 50 | 54 |
| Median Property Value | $172,900 | $170,800 |
| Median Household Income | $53,750 | $3 |
| Monthly Housing Costs | $474 | $0 |
| Real Estate Taxes | $725 | $0 |
Property Value by Mortgage Status in Trenton
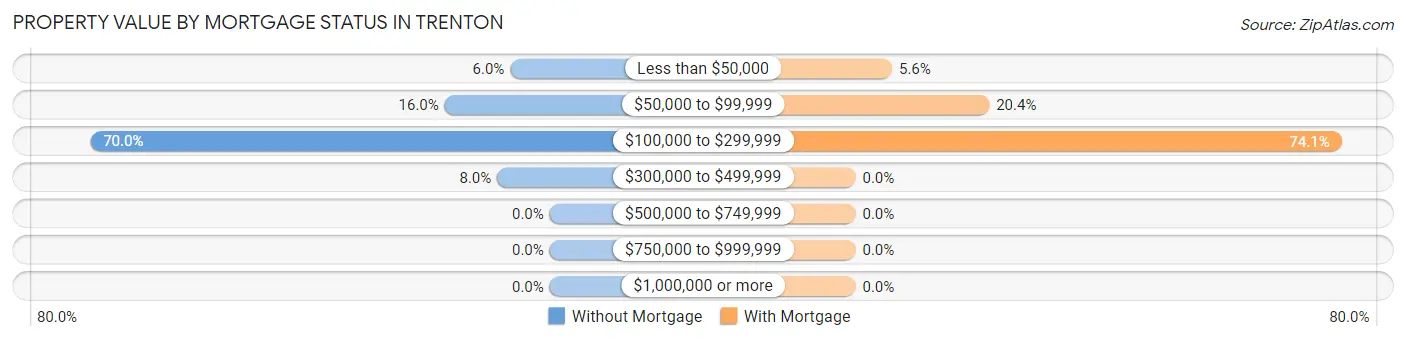
| Property Value | Without Mortgage | With Mortgage |
| Less than $50,000 | 3 (6.0%) | 3 (5.6%) |
| $50,000 to $99,999 | 8 (16.0%) | 11 (20.4%) |
| $100,000 to $299,999 | 35 (70.0%) | 40 (74.1%) |
| $300,000 to $499,999 | 4 (8.0%) | 0 (0.0%) |
| $500,000 to $749,999 | 0 (0.0%) | 0 (0.0%) |
| $750,000 to $999,999 | 0 (0.0%) | 0 (0.0%) |
| $1,000,000 or more | 0 (0.0%) | 0 (0.0%) |
| Total | 50 (100.0%) | 54 (100.0%) |
Household Income by Mortgage Status in Trenton
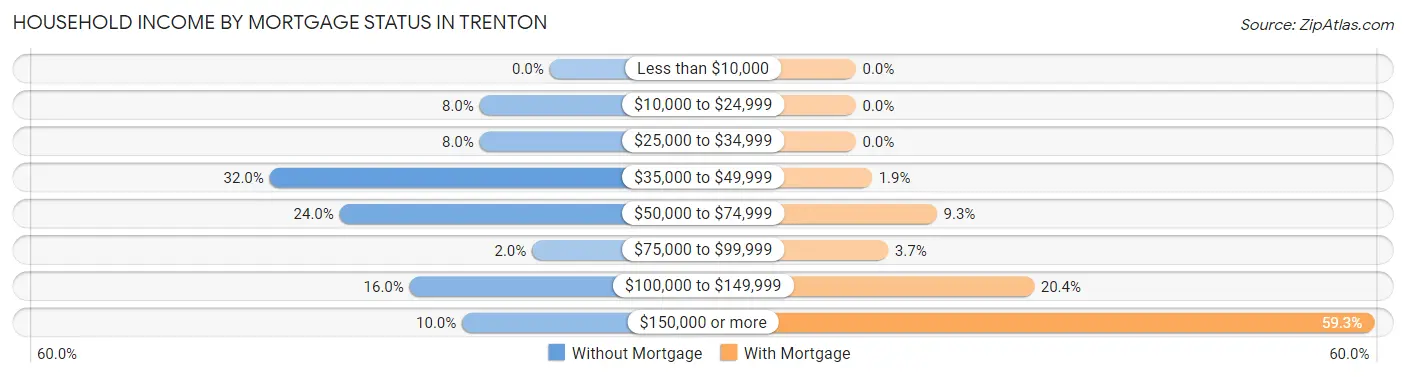
| Household Income | Without Mortgage | With Mortgage |
| Less than $10,000 | 0 (0.0%) | 0 (0.0%) |
| $10,000 to $24,999 | 4 (8.0%) | 0 (0.0%) |
| $25,000 to $34,999 | 4 (8.0%) | 0 (0.0%) |
| $35,000 to $49,999 | 16 (32.0%) | 1 (1.8%) |
| $50,000 to $74,999 | 12 (24.0%) | 5 (9.3%) |
| $75,000 to $99,999 | 1 (2.0%) | 2 (3.7%) |
| $100,000 to $149,999 | 8 (16.0%) | 11 (20.4%) |
| $150,000 or more | 5 (10.0%) | 32 (59.3%) |
| Total | 50 (100.0%) | 54 (100.0%) |
Property Value to Household Income Ratio in Trenton
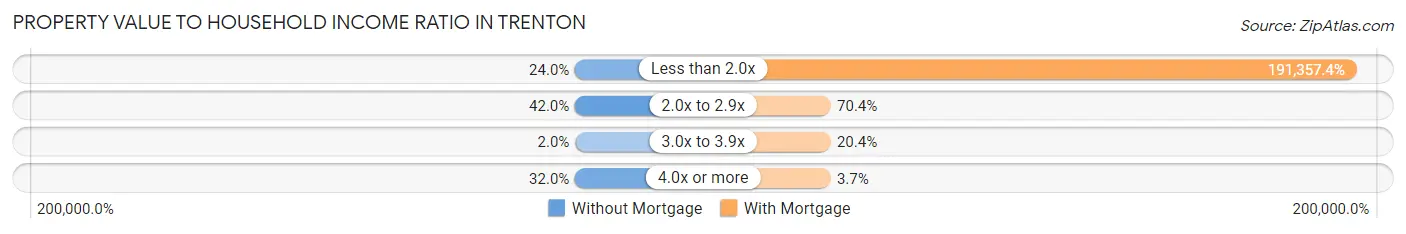
| Value-to-Income Ratio | Without Mortgage | With Mortgage |
| Less than 2.0x | 12 (24.0%) | 103,333 (191,357.4%) |
| 2.0x to 2.9x | 21 (42.0%) | 38 (70.4%) |
| 3.0x to 3.9x | 1 (2.0%) | 11 (20.4%) |
| 4.0x or more | 16 (32.0%) | 2 (3.7%) |
| Total | 50 (100.0%) | 54 (100.0%) |
Real Estate Taxes by Mortgage Status in Trenton
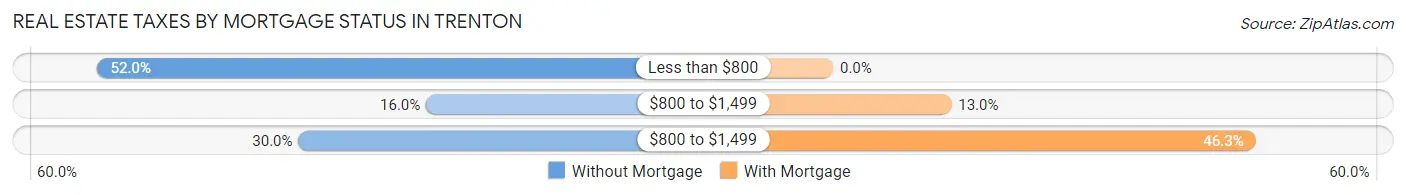
| Property Taxes | Without Mortgage | With Mortgage |
| Less than $800 | 26 (52.0%) | 0 (0.0%) |
| $800 to $1,499 | 8 (16.0%) | 7 (13.0%) |
| $800 to $1,499 | 15 (30.0%) | 25 (46.3%) |
| Total | 50 (100.0%) | 54 (100.0%) |
Health & Disability in Trenton
Health Insurance Coverage by Age in Trenton
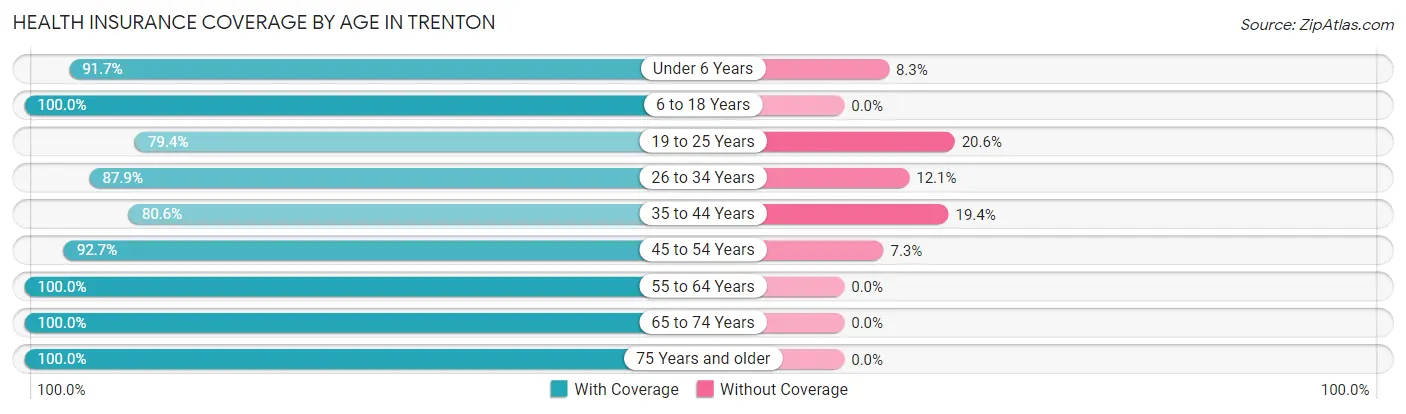
| Age Bracket | With Coverage | Without Coverage |
| Under 6 Years | 22 (91.7%) | 2 (8.3%) |
| 6 to 18 Years | 21 (100.0%) | 0 (0.0%) |
| 19 to 25 Years | 27 (79.4%) | 7 (20.6%) |
| 26 to 34 Years | 29 (87.9%) | 4 (12.1%) |
| 35 to 44 Years | 29 (80.6%) | 7 (19.4%) |
| 45 to 54 Years | 38 (92.7%) | 3 (7.3%) |
| 55 to 64 Years | 54 (100.0%) | 0 (0.0%) |
| 65 to 74 Years | 16 (100.0%) | 0 (0.0%) |
| 75 Years and older | 27 (100.0%) | 0 (0.0%) |
| Total | 263 (92.0%) | 23 (8.0%) |
Health Insurance Coverage by Citizenship Status in Trenton
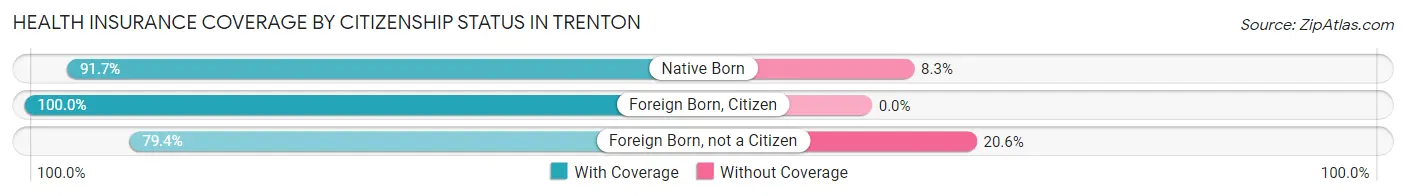
| Citizenship Status | With Coverage | Without Coverage |
| Native Born | 22 (91.7%) | 2 (8.3%) |
| Foreign Born, Citizen | 21 (100.0%) | 0 (0.0%) |
| Foreign Born, not a Citizen | 27 (79.4%) | 7 (20.6%) |
Health Insurance Coverage by Household Income in Trenton
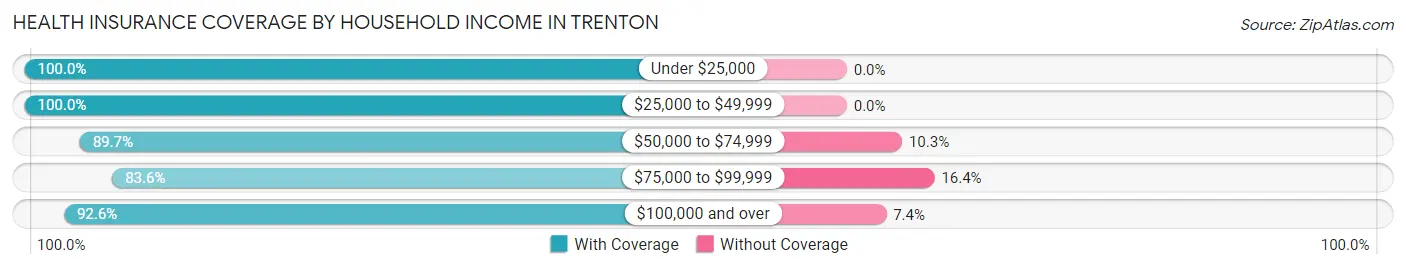
| Household Income | With Coverage | Without Coverage |
| Under $25,000 | 15 (100.0%) | 0 (0.0%) |
| $25,000 to $49,999 | 53 (100.0%) | 0 (0.0%) |
| $50,000 to $74,999 | 26 (89.7%) | 3 (10.3%) |
| $75,000 to $99,999 | 56 (83.6%) | 11 (16.4%) |
| $100,000 and over | 113 (92.6%) | 9 (7.4%) |
Public vs Private Health Insurance Coverage by Age in Trenton
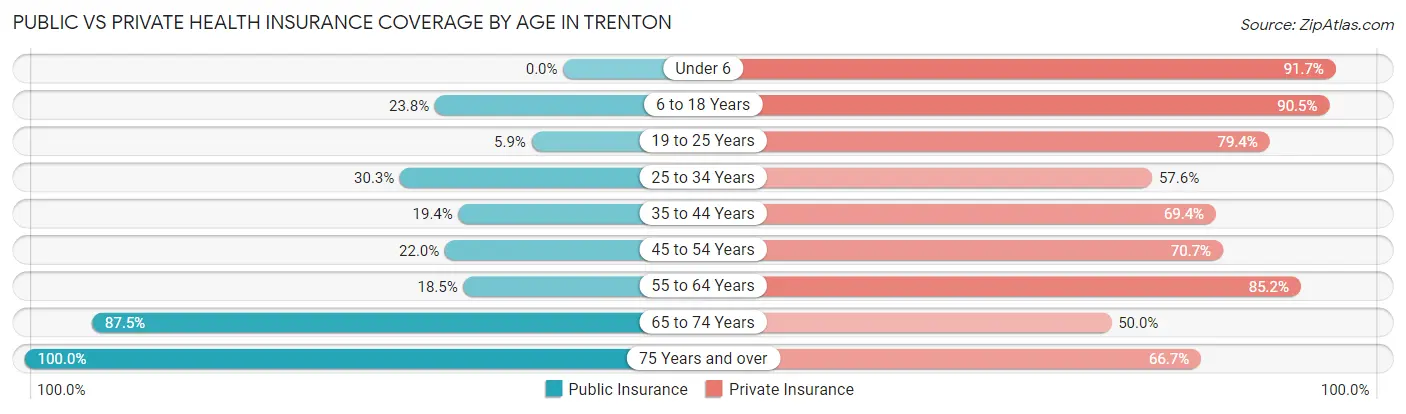
| Age Bracket | Public Insurance | Private Insurance |
| Under 6 | 0 (0.0%) | 22 (91.7%) |
| 6 to 18 Years | 5 (23.8%) | 19 (90.5%) |
| 19 to 25 Years | 2 (5.9%) | 27 (79.4%) |
| 25 to 34 Years | 10 (30.3%) | 19 (57.6%) |
| 35 to 44 Years | 7 (19.4%) | 25 (69.4%) |
| 45 to 54 Years | 9 (22.0%) | 29 (70.7%) |
| 55 to 64 Years | 10 (18.5%) | 46 (85.2%) |
| 65 to 74 Years | 14 (87.5%) | 8 (50.0%) |
| 75 Years and over | 27 (100.0%) | 18 (66.7%) |
| Total | 84 (29.4%) | 213 (74.5%) |
Disability Status by Sex by Age in Trenton
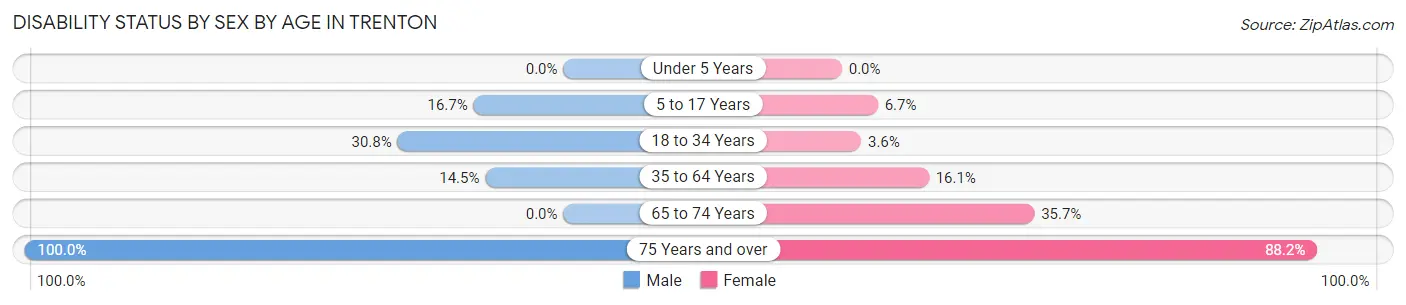
| Age Bracket | Male | Female |
| Under 5 Years | 0 (0.0%) | 0 (0.0%) |
| 5 to 17 Years | 1 (16.7%) | 1 (6.7%) |
| 18 to 34 Years | 12 (30.8%) | 1 (3.6%) |
| 35 to 64 Years | 10 (14.5%) | 10 (16.1%) |
| 65 to 74 Years | 0 (0.0%) | 5 (35.7%) |
| 75 Years and over | 10 (100.0%) | 15 (88.2%) |
Disability Class by Sex by Age in Trenton
Disability Class: Hearing Difficulty
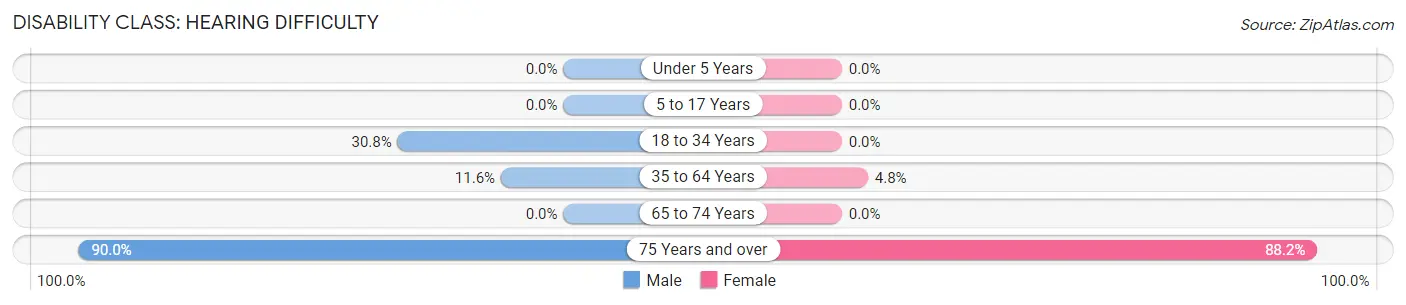
| Age Bracket | Male | Female |
| Under 5 Years | 0 (0.0%) | 0 (0.0%) |
| 5 to 17 Years | 0 (0.0%) | 0 (0.0%) |
| 18 to 34 Years | 12 (30.8%) | 0 (0.0%) |
| 35 to 64 Years | 8 (11.6%) | 3 (4.8%) |
| 65 to 74 Years | 0 (0.0%) | 0 (0.0%) |
| 75 Years and over | 9 (90.0%) | 15 (88.2%) |
Disability Class: Vision Difficulty
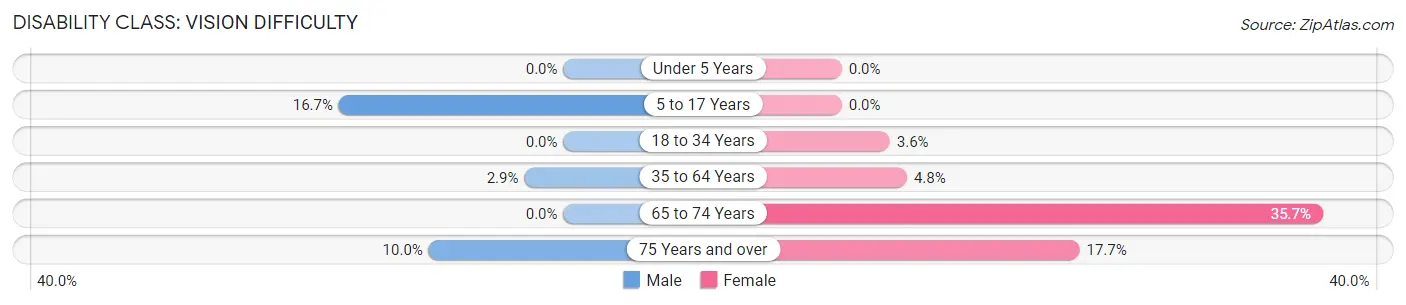
| Age Bracket | Male | Female |
| Under 5 Years | 0 (0.0%) | 0 (0.0%) |
| 5 to 17 Years | 1 (16.7%) | 0 (0.0%) |
| 18 to 34 Years | 0 (0.0%) | 1 (3.6%) |
| 35 to 64 Years | 2 (2.9%) | 3 (4.8%) |
| 65 to 74 Years | 0 (0.0%) | 5 (35.7%) |
| 75 Years and over | 1 (10.0%) | 3 (17.6%) |
Disability Class: Cognitive Difficulty
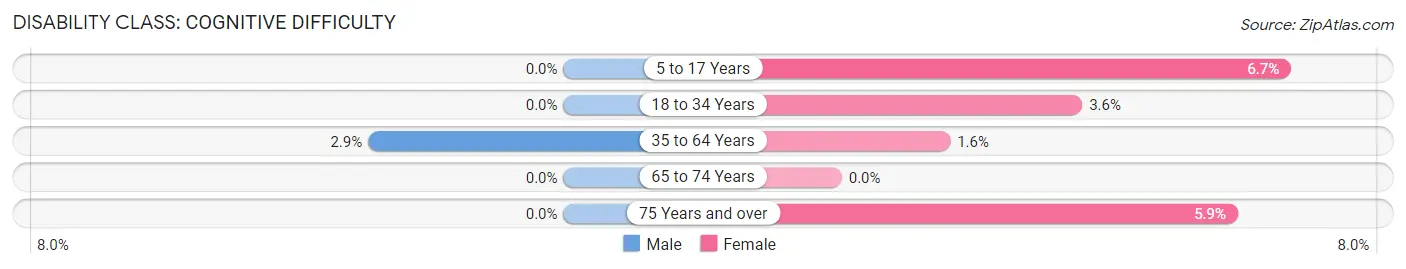
| Age Bracket | Male | Female |
| 5 to 17 Years | 0 (0.0%) | 1 (6.7%) |
| 18 to 34 Years | 0 (0.0%) | 1 (3.6%) |
| 35 to 64 Years | 2 (2.9%) | 1 (1.6%) |
| 65 to 74 Years | 0 (0.0%) | 0 (0.0%) |
| 75 Years and over | 0 (0.0%) | 1 (5.9%) |
Disability Class: Ambulatory Difficulty
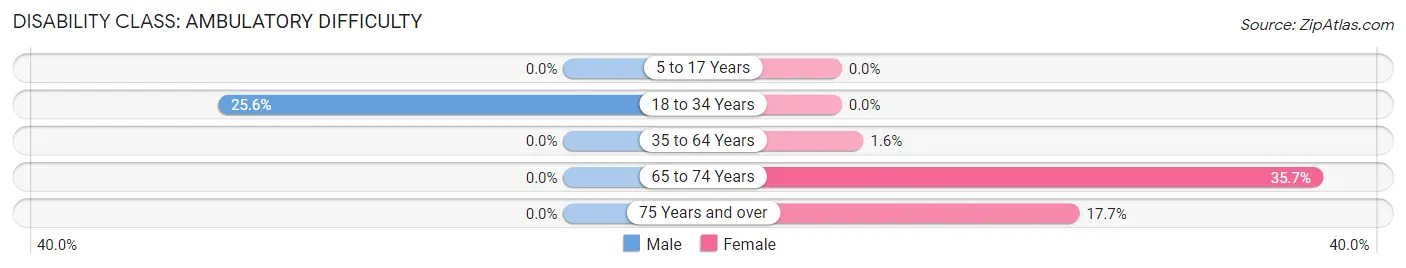
| Age Bracket | Male | Female |
| 5 to 17 Years | 0 (0.0%) | 0 (0.0%) |
| 18 to 34 Years | 10 (25.6%) | 0 (0.0%) |
| 35 to 64 Years | 0 (0.0%) | 1 (1.6%) |
| 65 to 74 Years | 0 (0.0%) | 5 (35.7%) |
| 75 Years and over | 0 (0.0%) | 3 (17.6%) |
Disability Class: Self-Care Difficulty
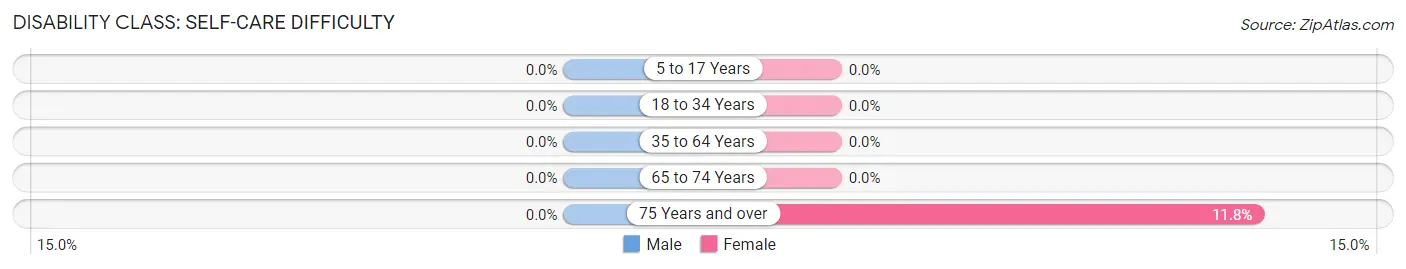
| Age Bracket | Male | Female |
| 5 to 17 Years | 0 (0.0%) | 0 (0.0%) |
| 18 to 34 Years | 0 (0.0%) | 0 (0.0%) |
| 35 to 64 Years | 0 (0.0%) | 0 (0.0%) |
| 65 to 74 Years | 0 (0.0%) | 0 (0.0%) |
| 75 Years and over | 0 (0.0%) | 2 (11.8%) |
Technology Access in Trenton
Computing Device Access in Trenton
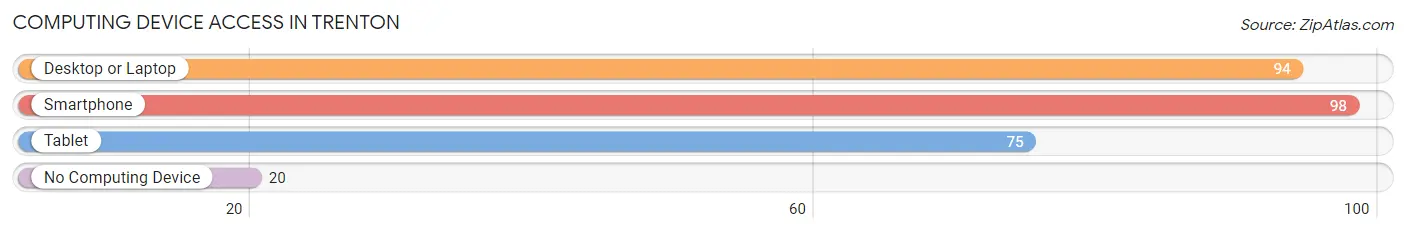
| Device Type | # Households | % Households |
| Desktop or Laptop | 94 | 74.0% |
| Smartphone | 98 | 77.2% |
| Tablet | 75 | 59.1% |
| No Computing Device | 20 | 15.8% |
| Total | 127 | 100.0% |
Internet Access in Trenton
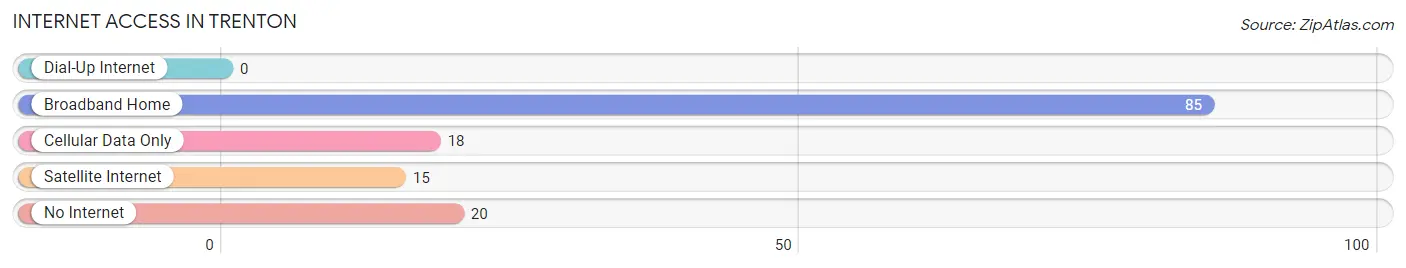
| Internet Type | # Households | % Households |
| Dial-Up Internet | 0 | 0.0% |
| Broadband Home | 85 | 66.9% |
| Cellular Data Only | 18 | 14.2% |
| Satellite Internet | 15 | 11.8% |
| No Internet | 20 | 15.8% |
| Total | 127 | 100.0% |
Trenton Summary
Trenton is a small city located in the western part of Kentucky, in the United States. It is the county seat of Todd County, and is situated on the banks of the Green River. The city has a population of approximately 1,500 people, and is part of the Bowling Green metropolitan area.
History
Trenton was founded in 1820 by William Trent, a Revolutionary War veteran. The city was originally known as Trent’s Landing, and was the first settlement in Todd County. The city was incorporated in 1837, and was named after William Trent.
Trenton was an important stop on the Louisville and Nashville Railroad, which was completed in 1859. The railroad brought economic growth to the city, and it became a major shipping center for the region.
During the Civil War, Trenton was a major supply center for the Confederate Army. The city was occupied by Union forces in 1862, and was the site of a major battle in 1863. After the war, the city experienced a period of economic decline, but was able to recover in the late 19th century.
Geography
Trenton is located in western Kentucky, in the United States. It is situated on the banks of the Green River, and is part of the Bowling Green metropolitan area. The city has a total area of 2.2 square miles, all of which is land.
The climate in Trenton is humid subtropical, with hot, humid summers and mild winters. The average annual temperature is around 60 degrees Fahrenheit, and the average annual precipitation is around 45 inches.
Economy
Trenton’s economy is largely based on agriculture and manufacturing. The city is home to several large manufacturing plants, including a paper mill and a furniture factory. Agriculture is also an important part of the local economy, with corn, soybeans, and wheat being the main crops.
The city is also home to several small businesses, including restaurants, retail stores, and service providers. Tourism is also an important part of the local economy, with several attractions in the area, including the Green River Lake State Park and the Trenton Historic District.
Demographics
As of the 2010 census, Trenton had a population of 1,500 people. The racial makeup of the city was 95.3% White, 2.7% African American, 0.2% Native American, 0.2% Asian, and 1.6% from other races. The median household income was $30,000, and the median family income was $35,000.
The city has a large number of residents who are of German, Irish, and English descent. The city also has a small Hispanic population, with around 4% of the population being of Hispanic or Latino origin.
Conclusion
Trenton is a small city located in western Kentucky, in the United States. It is the county seat of Todd County, and is situated on the banks of the Green River. The city has a population of approximately 1,500 people, and is part of the Bowling Green metropolitan area. The city’s economy is largely based on agriculture and manufacturing, and it is also home to several small businesses and tourist attractions. The city has a diverse population, with a large number of residents who are of German, Irish, and English descent, as well as a small Hispanic population.
Common Questions
What is Per Capita Income in Trenton?
Per Capita income in Trenton is $35,354.
What is the Median Family Income in Trenton?
Median Family Income in Trenton is $93,125.
What is the Median Household income in Trenton?
Median Household Income in Trenton is $76,250.
What is Income or Wage Gap in Trenton?
Income or Wage Gap in Trenton is 29.4%.
Women in Trenton earn 70.6 cents for every dollar earned by a man.
What is Inequality or Gini Index in Trenton?
Inequality or Gini Index in Trenton is 0.34.
What is the Total Population of Trenton?
Total Population of Trenton is 286.
What is the Total Male Population of Trenton?
Total Male Population of Trenton is 142.
What is the Total Female Population of Trenton?
Total Female Population of Trenton is 144.
What is the Ratio of Males per 100 Females in Trenton?
There are 98.61 Males per 100 Females in Trenton.
What is the Ratio of Females per 100 Males in Trenton?
There are 101.41 Females per 100 Males in Trenton.
What is the Median Population Age in Trenton?
Median Population Age in Trenton is 44.3 Years.
What is the Average Family Size in Trenton
Average Family Size in Trenton is 2.5 People.
What is the Average Household Size in Trenton
Average Household Size in Trenton is 2.2 People.
How Large is the Labor Force in Trenton?
There are 159 People in the Labor Forcein in Trenton.
What is the Percentage of People in the Labor Force in Trenton?
64.4% of People are in the Labor Force in Trenton.