Whitesville, KY Map & Demographics
Whitesville Map
Whitesville Overview
$27,065
PER CAPITA INCOME
$80,694
AVG FAMILY INCOME
$70,000
AVG HOUSEHOLD INCOME
13.2%
WAGE / INCOME GAP [ % ]
86.8¢/ $1
WAGE / INCOME GAP [ $ ]
0.33
INEQUALITY / GINI INDEX
570
TOTAL POPULATION
200
MALE POPULATION
370
FEMALE POPULATION
54.05
MALES / 100 FEMALES
185.00
FEMALES / 100 MALES
32.5
MEDIAN AGE
3.5
AVG FAMILY SIZE
2.8
AVG HOUSEHOLD SIZE
225
LABOR FORCE [ PEOPLE ]
54.5%
PERCENT IN LABOR FORCE
0.9%
UNEMPLOYMENT RATE
Whitesville Zip Codes
Whitesville Area Codes
Income in Whitesville
Income Overview in Whitesville
Per Capita Income in Whitesville is $27,065, while median incomes of families and households are $80,694 and $70,000 respectively.
| Characteristic | Number | Measure |
| Per Capita Income | 570 | $27,065 |
| Median Family Income | 131 | $80,694 |
| Mean Family Income | 131 | $80,111 |
| Median Household Income | 204 | $70,000 |
| Mean Household Income | 204 | $72,550 |
| Income Deficit | 131 | $0 |
| Wage / Income Gap (%) | 570 | 13.17% |
| Wage / Income Gap ($) | 570 | 86.83¢ per $1 |
| Gini / Inequality Index | 570 | 0.33 |
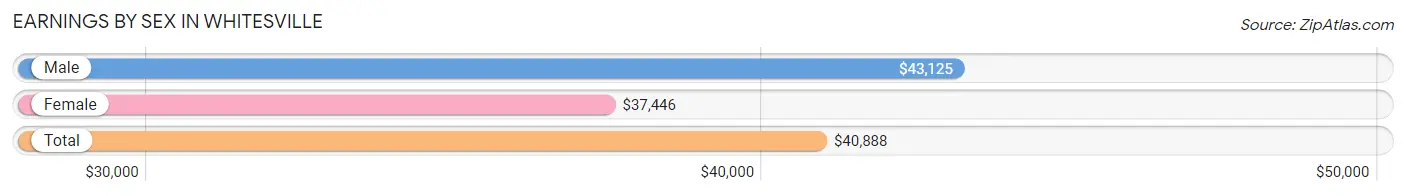
Earnings by Sex in Whitesville
Average Earnings in Whitesville are $40,888, $43,125 for men and $37,446 for women, a difference of 13.2%.
| Sex | Number | Average Earnings |
| Male | 114 (48.1%) | $43,125 |
| Female | 123 (51.9%) | $37,446 |
| Total | 237 (100.0%) | $40,888 |
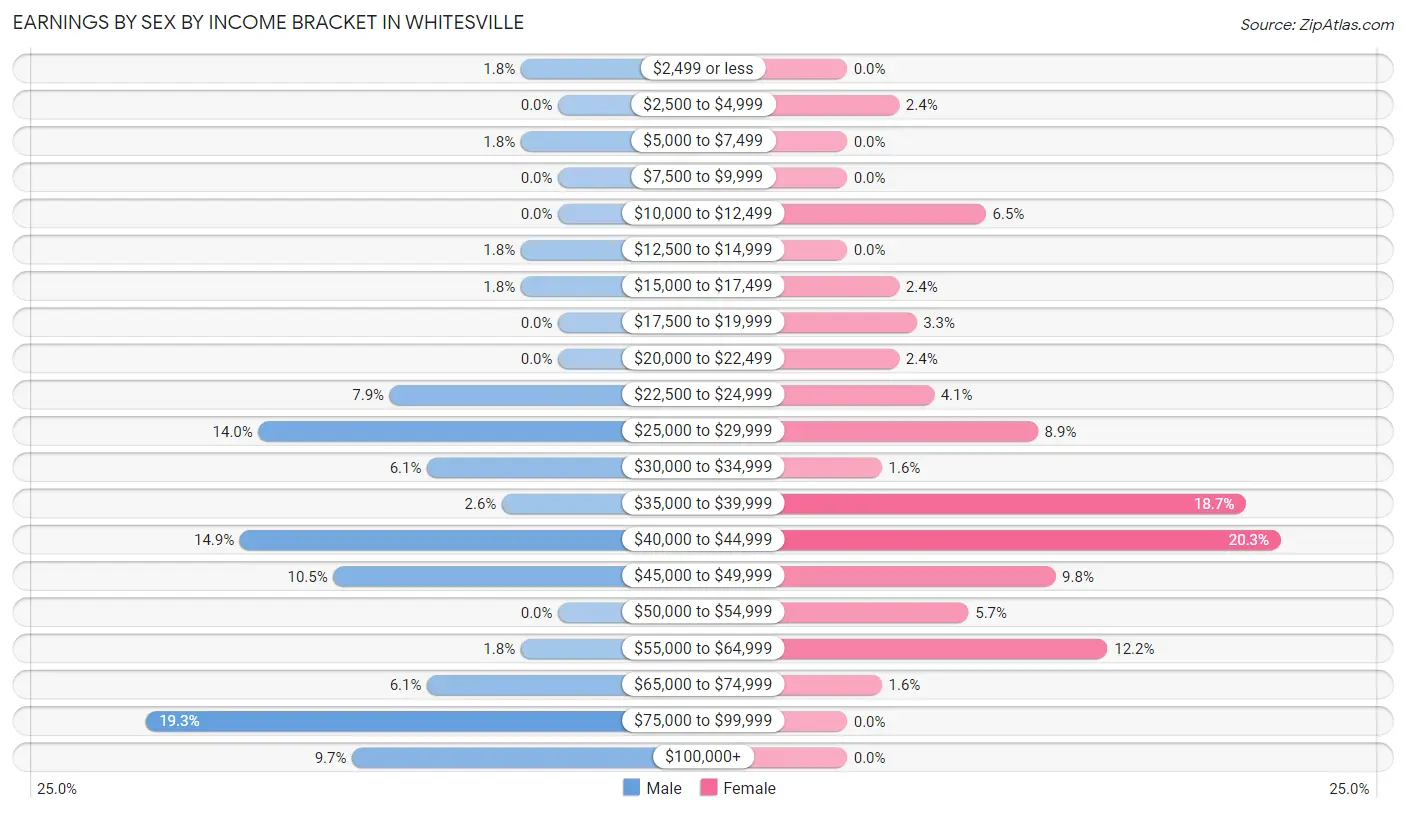
Earnings by Sex by Income Bracket in Whitesville
The most common earnings brackets in Whitesville are $75,000 to $99,999 for men (22 | 19.3%) and $40,000 to $44,999 for women (25 | 20.3%).
| Income | Male | Female |
| $2,499 or less | 2 (1.8%) | 0 (0.0%) |
| $2,500 to $4,999 | 0 (0.0%) | 3 (2.4%) |
| $5,000 to $7,499 | 2 (1.8%) | 0 (0.0%) |
| $7,500 to $9,999 | 0 (0.0%) | 0 (0.0%) |
| $10,000 to $12,499 | 0 (0.0%) | 8 (6.5%) |
| $12,500 to $14,999 | 2 (1.8%) | 0 (0.0%) |
| $15,000 to $17,499 | 2 (1.8%) | 3 (2.4%) |
| $17,500 to $19,999 | 0 (0.0%) | 4 (3.3%) |
| $20,000 to $22,499 | 0 (0.0%) | 3 (2.4%) |
| $22,500 to $24,999 | 9 (7.9%) | 5 (4.1%) |
| $25,000 to $29,999 | 16 (14.0%) | 11 (8.9%) |
| $30,000 to $34,999 | 7 (6.1%) | 2 (1.6%) |
| $35,000 to $39,999 | 3 (2.6%) | 23 (18.7%) |
| $40,000 to $44,999 | 17 (14.9%) | 25 (20.3%) |
| $45,000 to $49,999 | 12 (10.5%) | 12 (9.8%) |
| $50,000 to $54,999 | 0 (0.0%) | 7 (5.7%) |
| $55,000 to $64,999 | 2 (1.8%) | 15 (12.2%) |
| $65,000 to $74,999 | 7 (6.1%) | 2 (1.6%) |
| $75,000 to $99,999 | 22 (19.3%) | 0 (0.0%) |
| $100,000+ | 11 (9.7%) | 0 (0.0%) |
| Total | 114 (100.0%) | 123 (100.0%) |
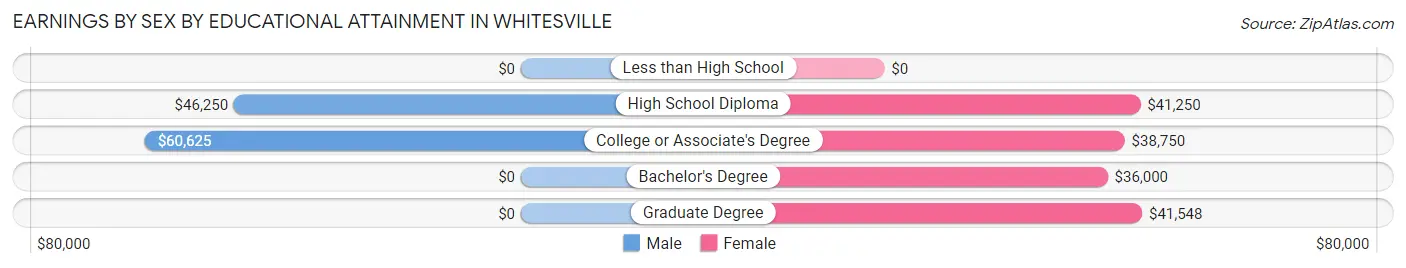
Earnings by Sex by Educational Attainment in Whitesville
Average earnings in Whitesville are $42,500 for men and $40,100 for women, a difference of 5.7%. Men with an educational attainment of college or associate's degree enjoy the highest average annual earnings of $60,625, while those with high school diploma education earn the least with $46,250. Women with an educational attainment of graduate degree earn the most with the average annual earnings of $41,548, while those with bachelor's degree education have the smallest earnings of $36,000.
| Educational Attainment | Male Income | Female Income |
| Less than High School | - | - |
| High School Diploma | $46,250 | $41,250 |
| College or Associate's Degree | $60,625 | $38,750 |
| Bachelor's Degree | - | - |
| Graduate Degree | - | - |
| Total | $42,500 | $40,100 |
Family Income in Whitesville
Family Income Brackets in Whitesville
According to the Whitesville family income data, there are 44 families falling into the $75,000 to $99,999 income range, which is the most common income bracket and makes up 33.6% of all families.
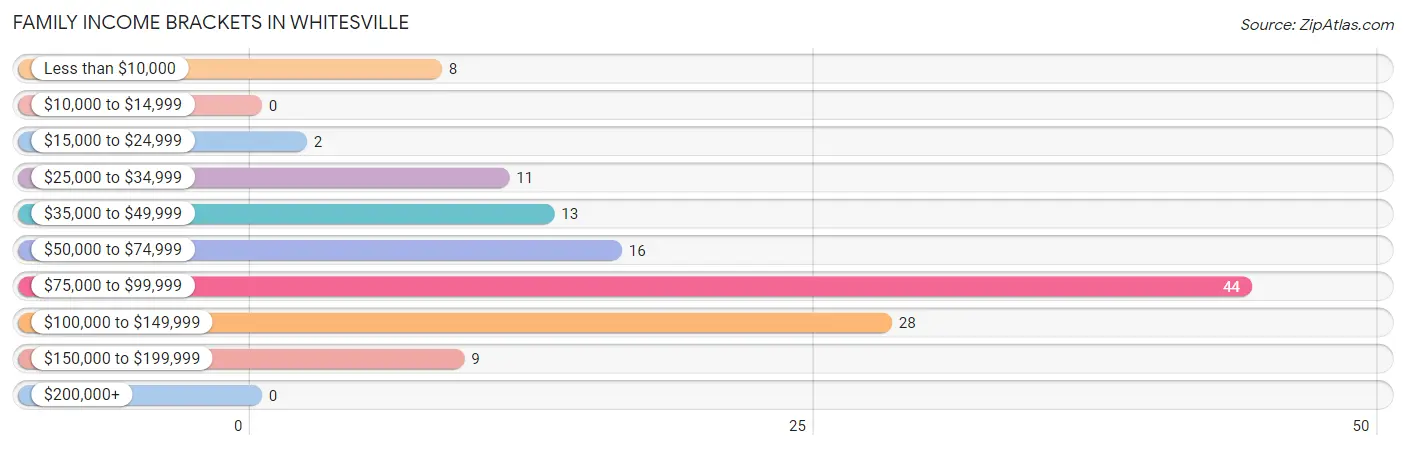
| Income Bracket | # Families | % Families |
| Less than $10,000 | 8 | 6.1% |
| $10,000 to $14,999 | 0 | 0.0% |
| $15,000 to $24,999 | 2 | 1.5% |
| $25,000 to $34,999 | 11 | 8.4% |
| $35,000 to $49,999 | 13 | 9.9% |
| $50,000 to $74,999 | 16 | 12.2% |
| $75,000 to $99,999 | 44 | 33.6% |
| $100,000 to $149,999 | 28 | 21.4% |
| $150,000 to $199,999 | 9 | 6.9% |
| $200,000+ | 0 | 0.0% |
Family Income by Famaliy Size in Whitesville
4-person families (30 | 22.9%) account for the highest median family income in Whitesville with $111,667 per family, while 4-person families (30 | 22.9%) have the highest median income of $27,917 per family member.
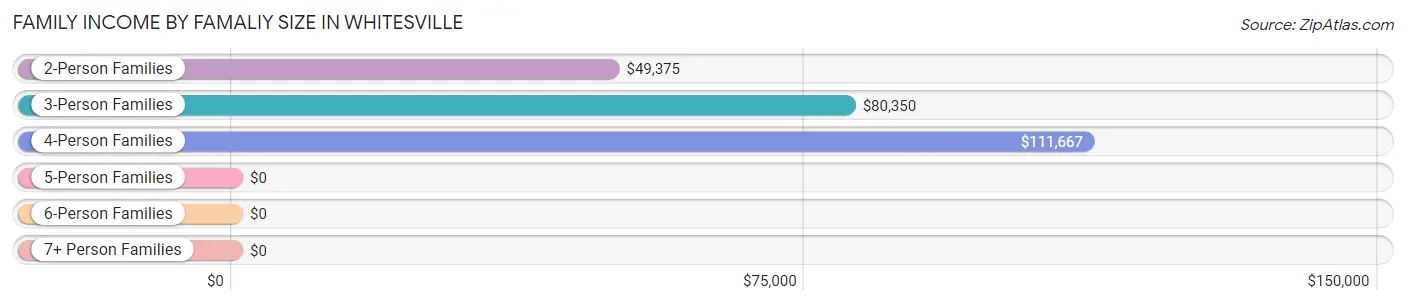
| Income Bracket | # Families | Median Income |
| 2-Person Families | 42 (32.1%) | $49,375 |
| 3-Person Families | 43 (32.8%) | $80,350 |
| 4-Person Families | 30 (22.9%) | $111,667 |
| 5-Person Families | 7 (5.3%) | $0 |
| 6-Person Families | 2 (1.5%) | $0 |
| 7+ Person Families | 7 (5.3%) | $0 |
| Total | 131 (100.0%) | $80,694 |
Family Income by Number of Earners in Whitesville
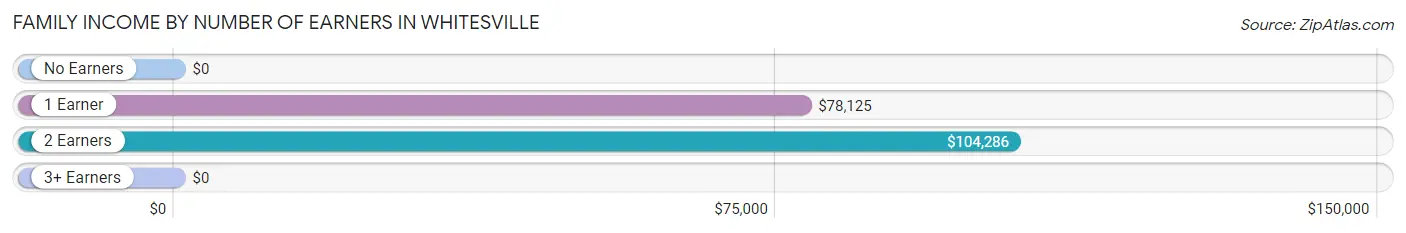
| Number of Earners | # Families | Median Income |
| No Earners | 20 (15.3%) | $0 |
| 1 Earner | 60 (45.8%) | $78,125 |
| 2 Earners | 42 (32.1%) | $104,286 |
| 3+ Earners | 9 (6.9%) | $0 |
| Total | 131 (100.0%) | $80,694 |
Household Income in Whitesville
Household Income Brackets in Whitesville
With 56 households falling in the category, the $75,000 to $99,999 income range is the most frequent in Whitesville, accounting for 27.5% of all households.
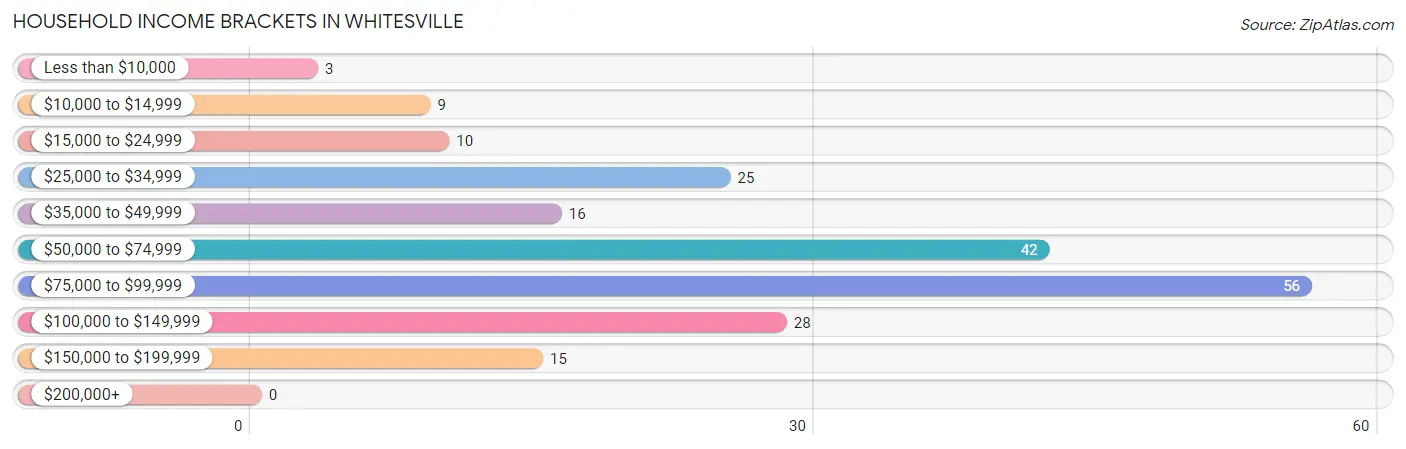
| Income Bracket | # Households | % Households |
| Less than $10,000 | 3 | 1.5% |
| $10,000 to $14,999 | 9 | 4.4% |
| $15,000 to $24,999 | 10 | 4.9% |
| $25,000 to $34,999 | 25 | 12.3% |
| $35,000 to $49,999 | 16 | 7.8% |
| $50,000 to $74,999 | 42 | 20.6% |
| $75,000 to $99,999 | 56 | 27.5% |
| $100,000 to $149,999 | 28 | 13.7% |
| $150,000 to $199,999 | 15 | 7.4% |
| $200,000+ | 0 | 0.0% |
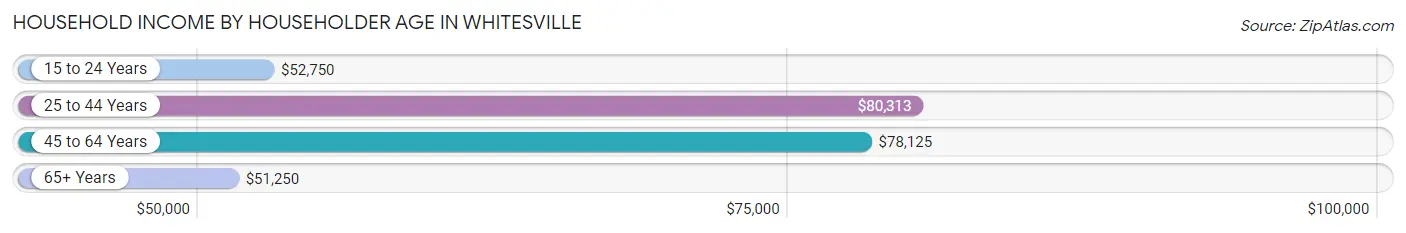
Household Income by Householder Age in Whitesville
The median household income in Whitesville is $70,000, with the highest median household income of $80,313 found in the 25 to 44 years age bracket for the primary householder. A total of 53 households (26.0%) fall into this category. Meanwhile, the 65+ years age bracket for the primary householder has the lowest median household income of $51,250, with 55 households (27.0%) in this group.
| Income Bracket | # Households | Median Income |
| 15 to 24 Years | 9 (4.4%) | $52,750 |
| 25 to 44 Years | 53 (26.0%) | $80,313 |
| 45 to 64 Years | 87 (42.6%) | $78,125 |
| 65+ Years | 55 (27.0%) | $51,250 |
| Total | 204 (100.0%) | $70,000 |
Poverty in Whitesville
Income Below Poverty by Sex and Age in Whitesville
With 8.5% poverty level for males and 8.1% for females among the residents of Whitesville, 5 year old males and 18 to 24 year old females are the most vulnerable to poverty, with 3 males (100.0%) and 5 females (33.3%) in their respective age groups living below the poverty level.
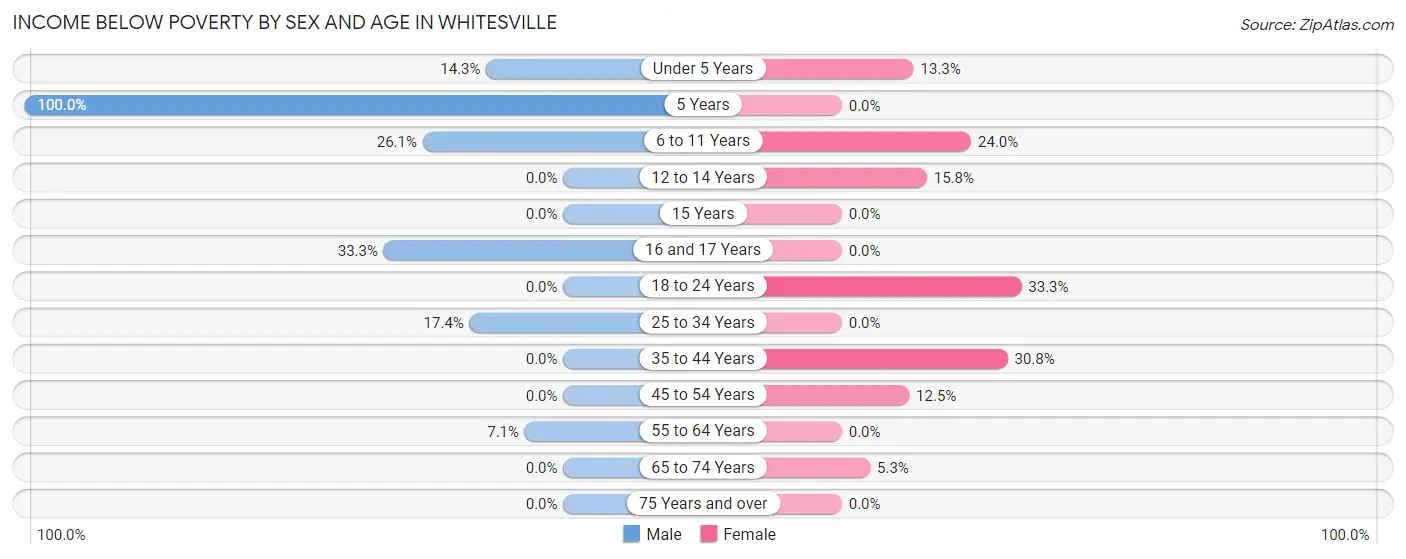
| Age Bracket | Male | Female |
| Under 5 Years | 1 (14.3%) | 2 (13.3%) |
| 5 Years | 3 (100.0%) | 0 (0.0%) |
| 6 to 11 Years | 6 (26.1%) | 6 (24.0%) |
| 12 to 14 Years | 0 (0.0%) | 3 (15.8%) |
| 15 Years | 0 (0.0%) | 0 (0.0%) |
| 16 and 17 Years | 2 (33.3%) | 0 (0.0%) |
| 18 to 24 Years | 0 (0.0%) | 5 (33.3%) |
| 25 to 34 Years | 4 (17.4%) | 0 (0.0%) |
| 35 to 44 Years | 0 (0.0%) | 4 (30.8%) |
| 45 to 54 Years | 0 (0.0%) | 8 (12.5%) |
| 55 to 64 Years | 1 (7.1%) | 0 (0.0%) |
| 65 to 74 Years | 0 (0.0%) | 1 (5.3%) |
| 75 Years and over | 0 (0.0%) | 0 (0.0%) |
| Total | 17 (8.5%) | 29 (8.1%) |
Income Above Poverty by Sex and Age in Whitesville
According to the poverty statistics in Whitesville, males aged 12 to 14 years and females aged 5 years are the age groups that are most secure financially, with 100.0% of males and 100.0% of females in these age groups living above the poverty line.
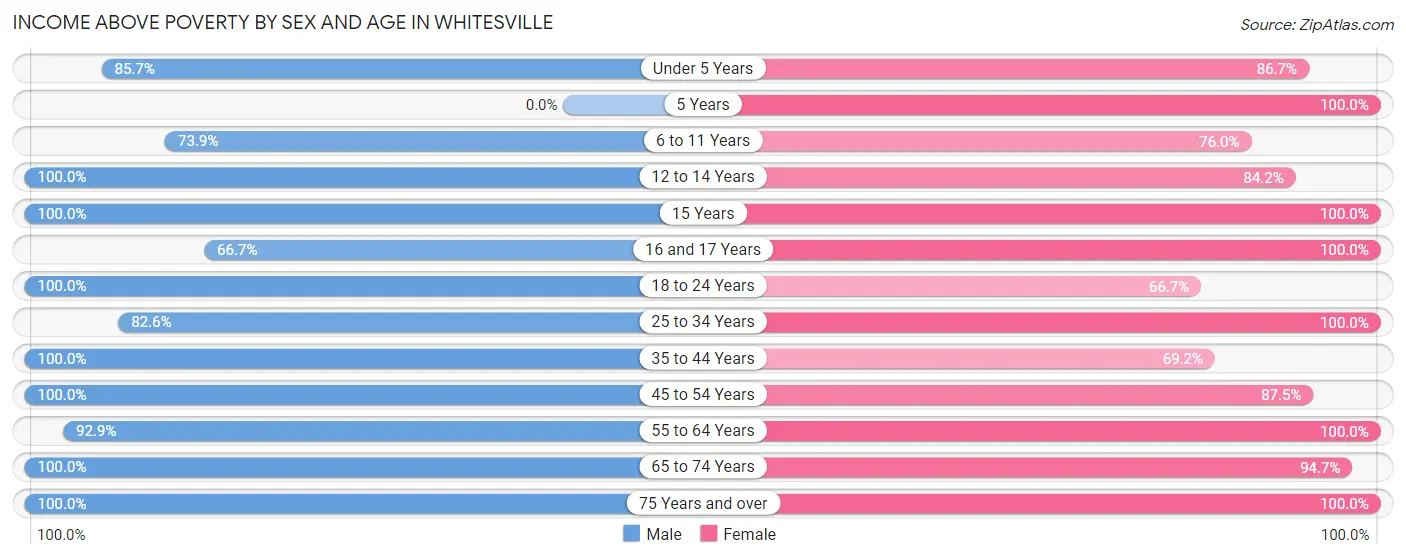
| Age Bracket | Male | Female |
| Under 5 Years | 6 (85.7%) | 13 (86.7%) |
| 5 Years | 0 (0.0%) | 2 (100.0%) |
| 6 to 11 Years | 17 (73.9%) | 19 (76.0%) |
| 12 to 14 Years | 2 (100.0%) | 16 (84.2%) |
| 15 Years | 1 (100.0%) | 47 (100.0%) |
| 16 and 17 Years | 4 (66.7%) | 39 (100.0%) |
| 18 to 24 Years | 19 (100.0%) | 10 (66.7%) |
| 25 to 34 Years | 19 (82.6%) | 55 (100.0%) |
| 35 to 44 Years | 45 (100.0%) | 9 (69.2%) |
| 45 to 54 Years | 14 (100.0%) | 56 (87.5%) |
| 55 to 64 Years | 13 (92.9%) | 31 (100.0%) |
| 65 to 74 Years | 22 (100.0%) | 18 (94.7%) |
| 75 Years and over | 21 (100.0%) | 13 (100.0%) |
| Total | 183 (91.5%) | 328 (91.9%) |
Income Below Poverty Among Married-Couple Families in Whitesville
The poverty statistics for married-couple families in Whitesville show that 5.6% or 5 of the total 89 families live below the poverty line. Families with 3 or 4 children have the highest poverty rate of 66.7%, comprising of 4 families. On the other hand, families with no children have the lowest poverty rate of 0.0%, which includes 0 families.
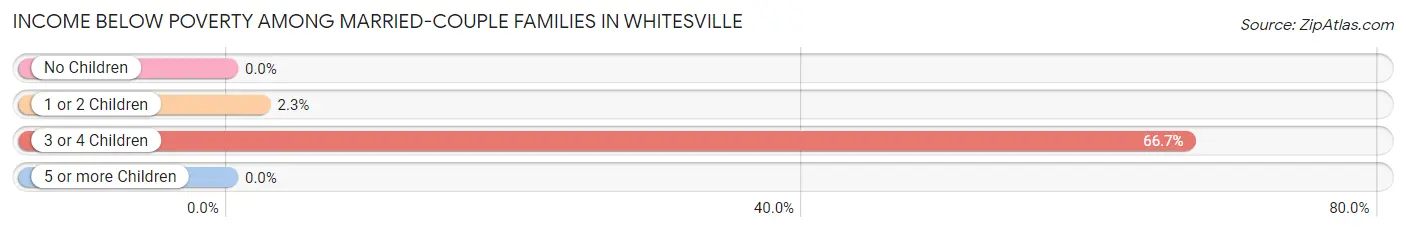
| Children | Above Poverty | Below Poverty |
| No Children | 39 (100.0%) | 0 (0.0%) |
| 1 or 2 Children | 43 (97.7%) | 1 (2.3%) |
| 3 or 4 Children | 2 (33.3%) | 4 (66.7%) |
| 5 or more Children | 0 (0.0%) | 0 (0.0%) |
| Total | 84 (94.4%) | 5 (5.6%) |
Income Below Poverty Among Single-Parent Households in Whitesville
According to the poverty data in Whitesville, 50.0% or 2 single-father households and 13.2% or 5 single-mother households are living below the poverty line. Among single-father households, those with 1 or 2 children have the highest poverty rate, with 2 households (50.0%) experiencing poverty. Likewise, among single-mother households, those with 1 or 2 children have the highest poverty rate, with 5 households (14.7%) falling below the poverty line.
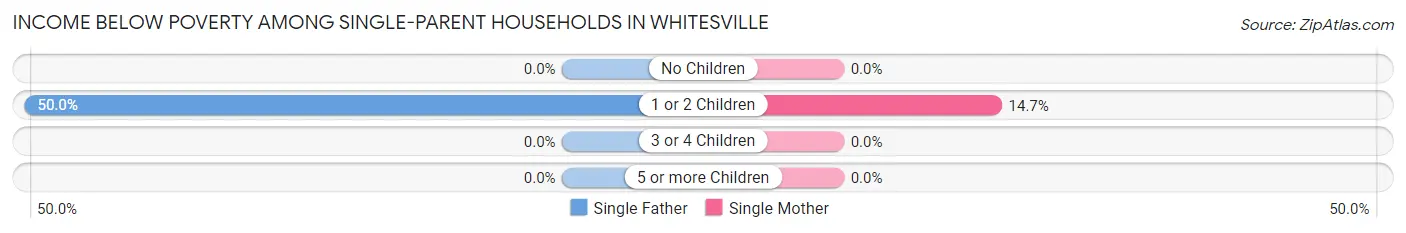
| Children | Single Father | Single Mother |
| No Children | 0 (0.0%) | 0 (0.0%) |
| 1 or 2 Children | 2 (50.0%) | 5 (14.7%) |
| 3 or 4 Children | 0 (0.0%) | 0 (0.0%) |
| 5 or more Children | 0 (0.0%) | 0 (0.0%) |
| Total | 2 (50.0%) | 5 (13.2%) |
Income Below Poverty Among Married-Couple vs Single-Parent Households in Whitesville
The poverty data for Whitesville shows that 5 of the married-couple family households (5.6%) and 7 of the single-parent households (16.7%) are living below the poverty level. Within the married-couple family households, those with 3 or 4 children have the highest poverty rate, with 4 households (66.7%) falling below the poverty line. Among the single-parent households, those with 1 or 2 children have the highest poverty rate, with 7 household (18.4%) living below poverty.
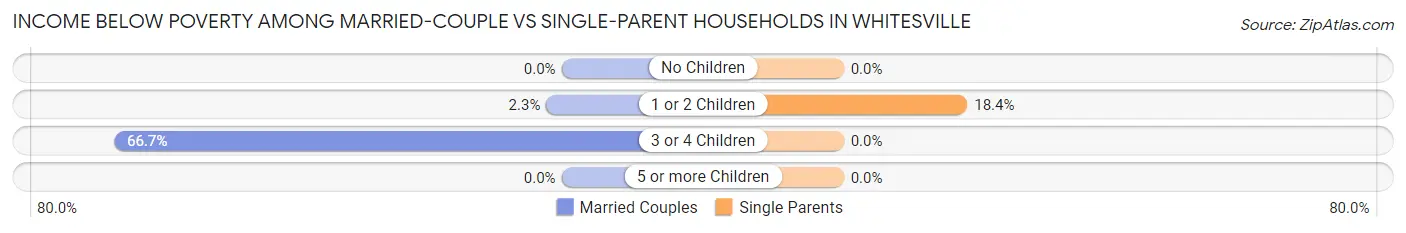
| Children | Married-Couple Families | Single-Parent Households |
| No Children | 0 (0.0%) | 0 (0.0%) |
| 1 or 2 Children | 1 (2.3%) | 7 (18.4%) |
| 3 or 4 Children | 4 (66.7%) | 0 (0.0%) |
| 5 or more Children | 0 (0.0%) | 0 (0.0%) |
| Total | 5 (5.6%) | 7 (16.7%) |
Race in Whitesville
The most populous races in Whitesville are White / Caucasian (558 | 97.9%), Hispanic or Latino (19 | 3.3%), and Two or more Races (7 | 1.2%).
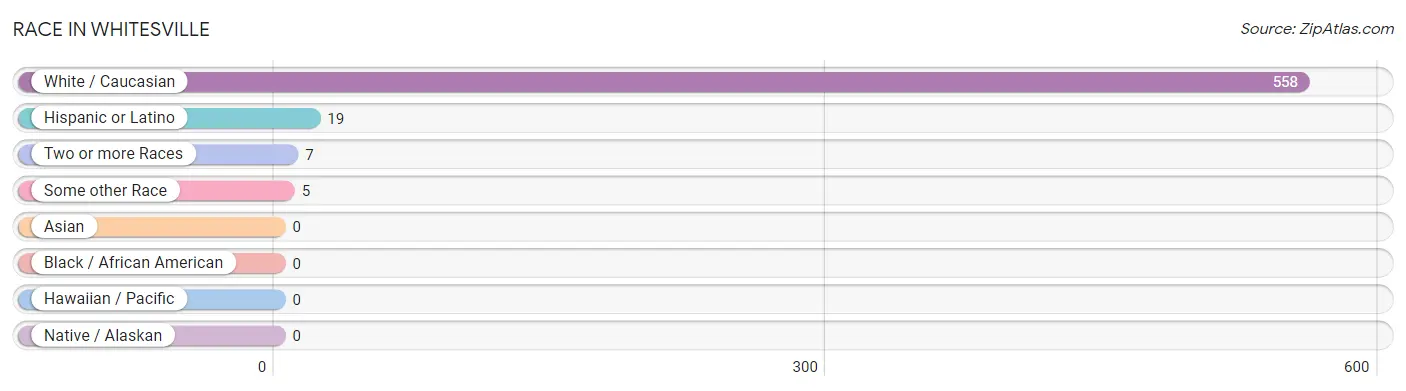
| Race | # Population | % Population |
| Asian | 0 | 0.0% |
| Black / African American | 0 | 0.0% |
| Hawaiian / Pacific | 0 | 0.0% |
| Hispanic or Latino | 19 | 3.3% |
| Native / Alaskan | 0 | 0.0% |
| White / Caucasian | 558 | 97.9% |
| Two or more Races | 7 | 1.2% |
| Some other Race | 5 | 0.9% |
| Total | 570 | 100.0% |
Ancestry in Whitesville
The most populous ancestries reported in Whitesville are English (199 | 34.9%), Irish (85 | 14.9%), American (45 | 7.9%), German (32 | 5.6%), and Mexican (15 | 2.6%), together accounting for 66.0% of all Whitesville residents.
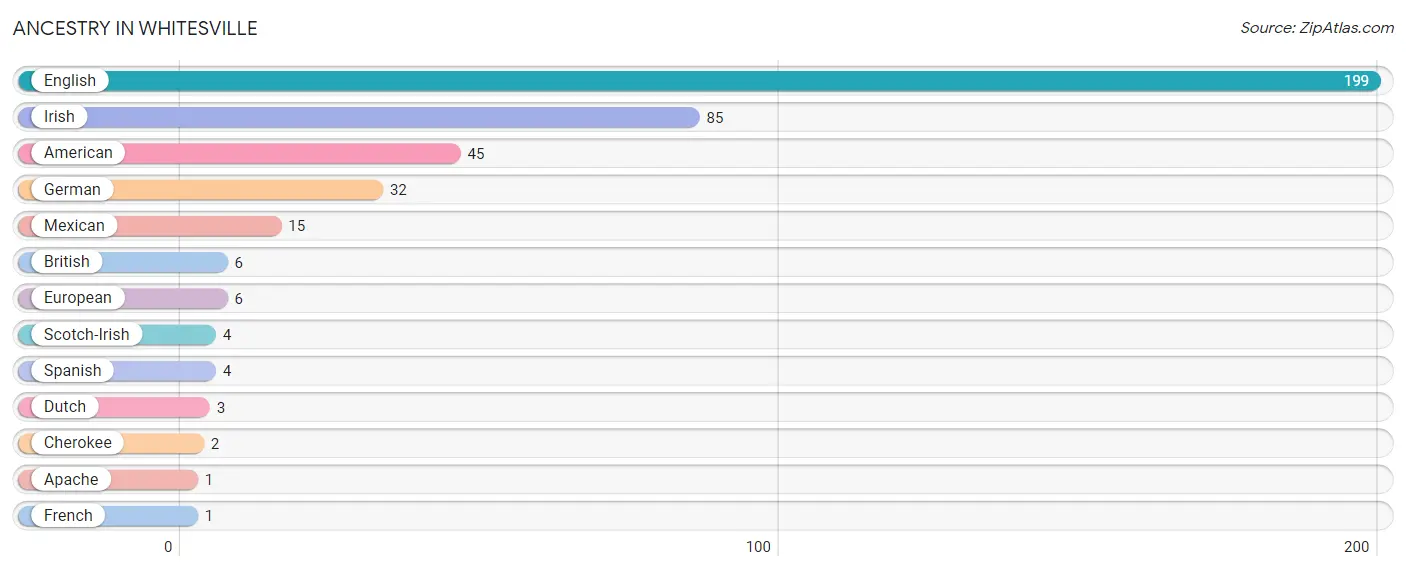
| Ancestry | # Population | % Population |
| American | 45 | 7.9% |
| Apache | 1 | 0.2% |
| British | 6 | 1.1% |
| Cherokee | 2 | 0.4% |
| Dutch | 3 | 0.5% |
| English | 199 | 34.9% |
| European | 6 | 1.1% |
| French | 1 | 0.2% |
| German | 32 | 5.6% |
| Irish | 85 | 14.9% |
| Mexican | 15 | 2.6% |
| Scotch-Irish | 4 | 0.7% |
| Spanish | 4 | 0.7% | View All 13 Rows |
Immigrants in Whitesville

| Immigration Origin | # Population | % Population | View All 0 Rows |
Sex and Age in Whitesville
Sex and Age in Whitesville
The most populous age groups in Whitesville are 35 to 39 Years (27 | 13.5%) for men and 15 to 19 Years (87 | 23.5%) for women.
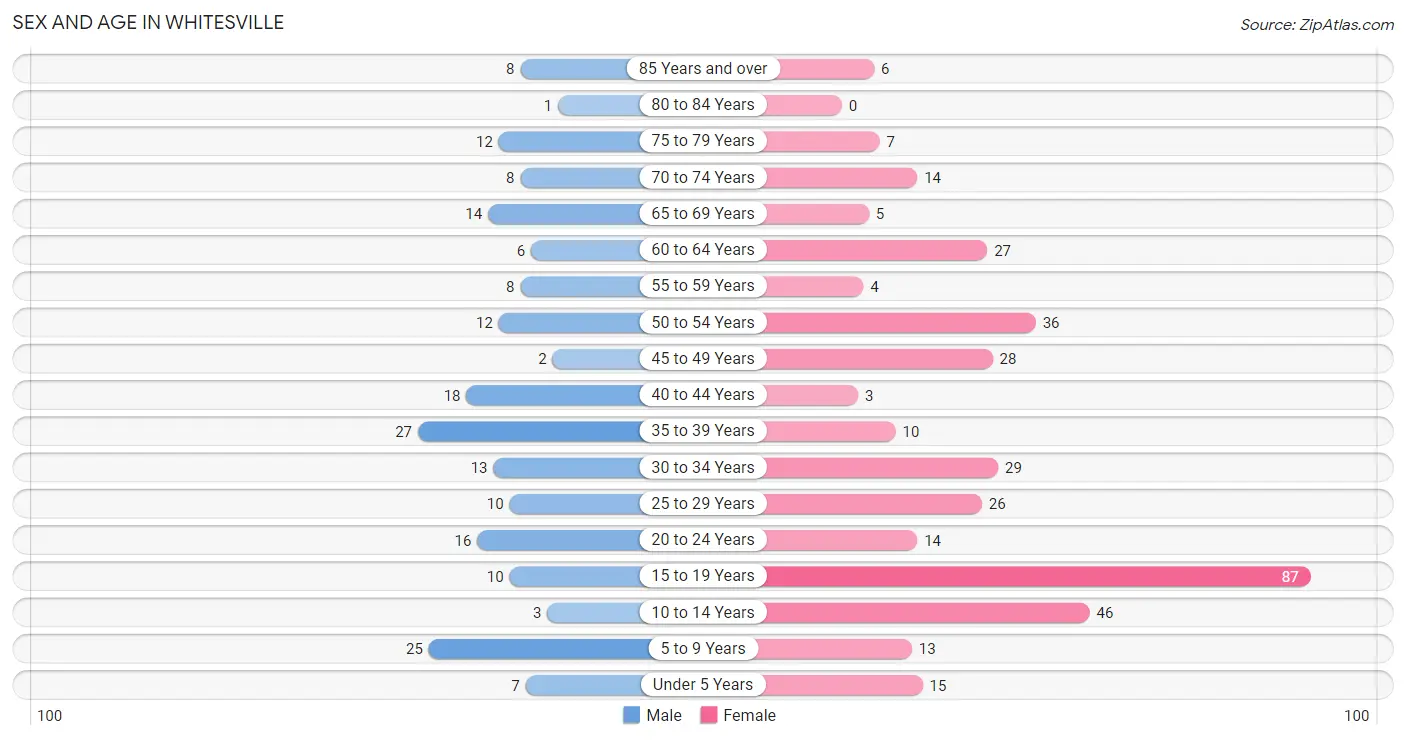
| Age Bracket | Male | Female |
| Under 5 Years | 7 (3.5%) | 15 (4.1%) |
| 5 to 9 Years | 25 (12.5%) | 13 (3.5%) |
| 10 to 14 Years | 3 (1.5%) | 46 (12.4%) |
| 15 to 19 Years | 10 (5.0%) | 87 (23.5%) |
| 20 to 24 Years | 16 (8.0%) | 14 (3.8%) |
| 25 to 29 Years | 10 (5.0%) | 26 (7.0%) |
| 30 to 34 Years | 13 (6.5%) | 29 (7.8%) |
| 35 to 39 Years | 27 (13.5%) | 10 (2.7%) |
| 40 to 44 Years | 18 (9.0%) | 3 (0.8%) |
| 45 to 49 Years | 2 (1.0%) | 28 (7.6%) |
| 50 to 54 Years | 12 (6.0%) | 36 (9.7%) |
| 55 to 59 Years | 8 (4.0%) | 4 (1.1%) |
| 60 to 64 Years | 6 (3.0%) | 27 (7.3%) |
| 65 to 69 Years | 14 (7.0%) | 5 (1.3%) |
| 70 to 74 Years | 8 (4.0%) | 14 (3.8%) |
| 75 to 79 Years | 12 (6.0%) | 7 (1.9%) |
| 80 to 84 Years | 1 (0.5%) | 0 (0.0%) |
| 85 Years and over | 8 (4.0%) | 6 (1.6%) |
| Total | 200 (100.0%) | 370 (100.0%) |
Families and Households in Whitesville
Median Family Size in Whitesville
The median family size in Whitesville is 3.46 persons per family, with single female/mother families (38 | 29.0%) accounting for the largest median family size of 3.84 persons per family. On the other hand, single male/father families (4 | 3.0%) represent the smallest median family size with 2.00 persons per family.
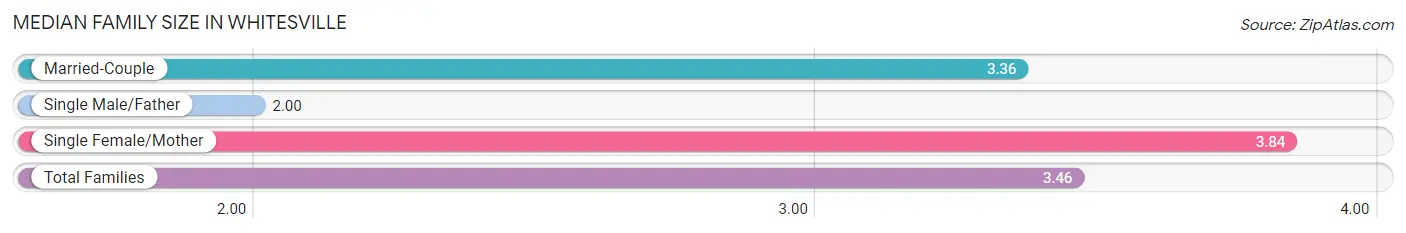
| Family Type | # Families | Family Size |
| Married-Couple | 89 (67.9%) | 3.36 |
| Single Male/Father | 4 (3.0%) | 2.00 |
| Single Female/Mother | 38 (29.0%) | 3.84 |
| Total Families | 131 (100.0%) | 3.46 |
Median Household Size in Whitesville
The median household size in Whitesville is 2.79 persons per household, with single female/mother households (38 | 18.6%) accounting for the largest median household size of 4.08 persons per household. non-family households (73 | 35.8%) represent the smallest median household size with 1.48 persons per household.
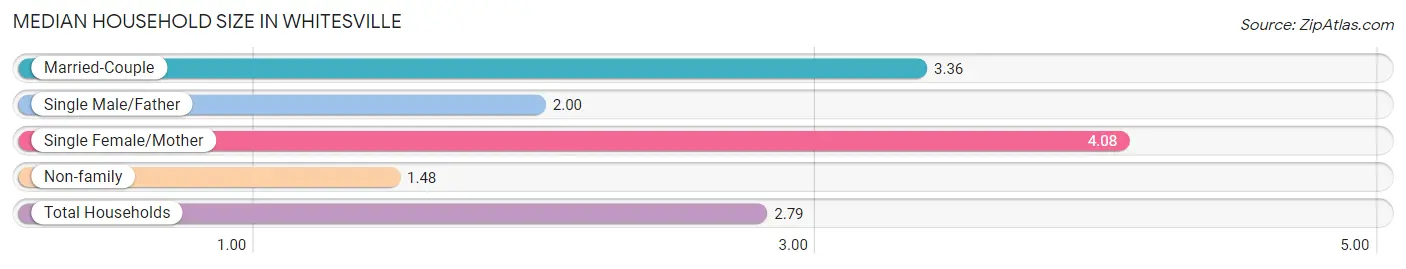
| Household Type | # Households | Household Size |
| Married-Couple | 89 (43.6%) | 3.36 |
| Single Male/Father | 4 (2.0%) | 2.00 |
| Single Female/Mother | 38 (18.6%) | 4.08 |
| Non-family | 73 (35.8%) | 1.48 |
| Total Households | 204 (100.0%) | 2.79 |
Household Size by Marriage Status in Whitesville
Out of a total of 204 households in Whitesville, 131 (64.2%) are family households, while 73 (35.8%) are nonfamily households. The most numerous type of family households are 2-person households, comprising 42, and the most common type of nonfamily households are 1-person households, comprising 59.
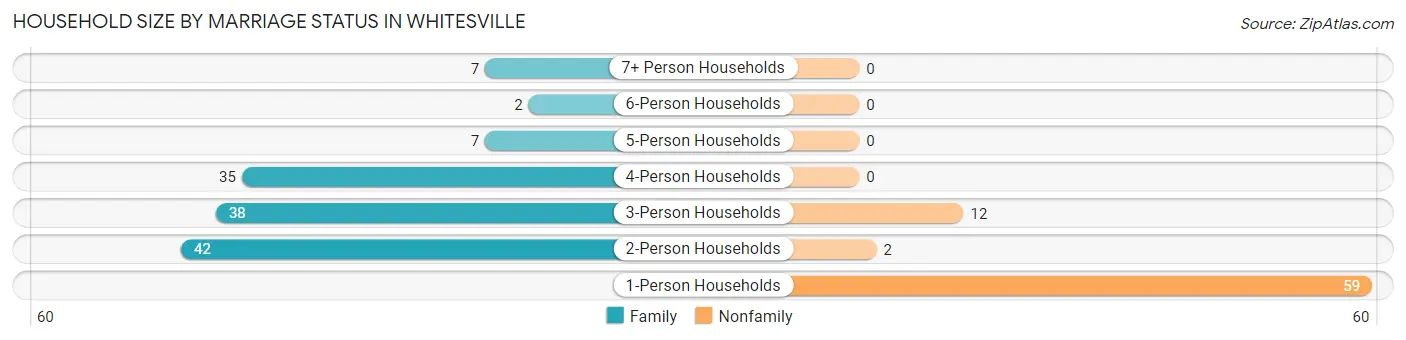
| Household Size | Family Households | Nonfamily Households |
| 1-Person Households | - | 59 (28.9%) |
| 2-Person Households | 42 (20.6%) | 2 (1.0%) |
| 3-Person Households | 38 (18.6%) | 12 (5.9%) |
| 4-Person Households | 35 (17.2%) | 0 (0.0%) |
| 5-Person Households | 7 (3.4%) | 0 (0.0%) |
| 6-Person Households | 2 (1.0%) | 0 (0.0%) |
| 7+ Person Households | 7 (3.4%) | 0 (0.0%) |
| Total | 131 (64.2%) | 73 (35.8%) |
Female Fertility in Whitesville
Fertility by Age in Whitesville
Average fertility rate in Whitesville is 36.0 births per 1,000 women. Women in the age bracket of 20 to 34 years have the highest fertility rate with 101.0 births per 1,000 women. Women in the age bracket of 20 to 34 years acount for 100.0% of all women with births.
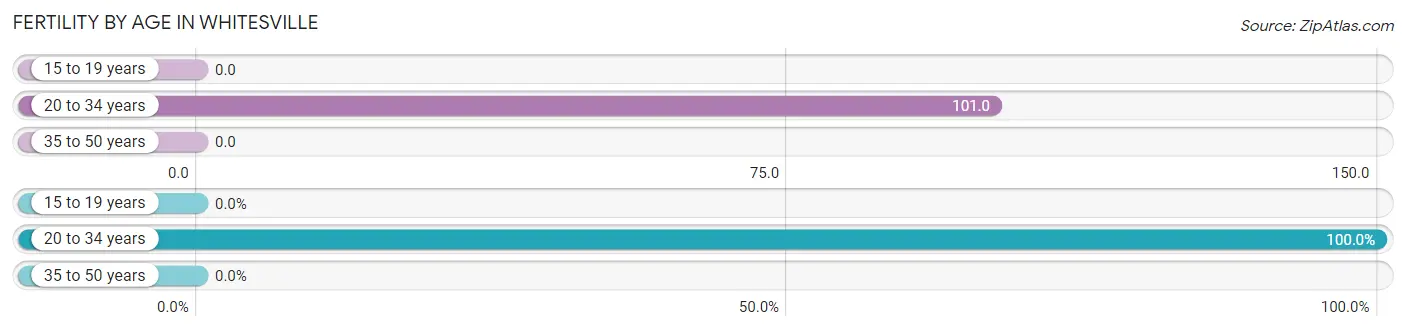
| Age Bracket | Women with Births | Births / 1,000 Women |
| 15 to 19 years | 0 (0.0%) | 0.0 |
| 20 to 34 years | 7 (100.0%) | 101.0 |
| 35 to 50 years | 0 (0.0%) | 0.0 |
| Total | 7 (100.0%) | 36.0 |
Fertility by Age by Marriage Status in Whitesville
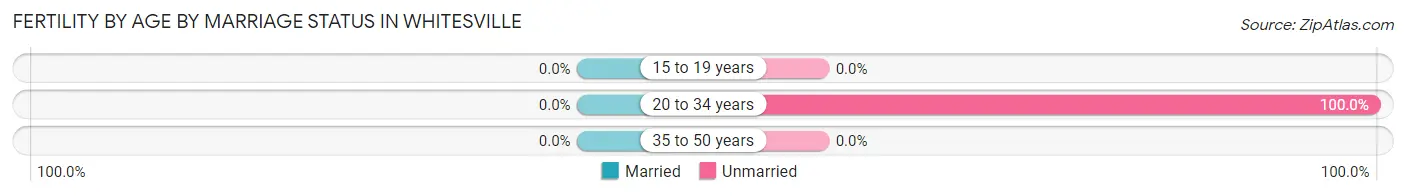
| Age Bracket | Married | Unmarried |
| 15 to 19 years | 0 (0.0%) | 0 (0.0%) |
| 20 to 34 years | 0 (0.0%) | 7 (100.0%) |
| 35 to 50 years | 0 (0.0%) | 0 (0.0%) |
| Total | 0 (0.0%) | 7 (100.0%) |
Fertility by Education in Whitesville
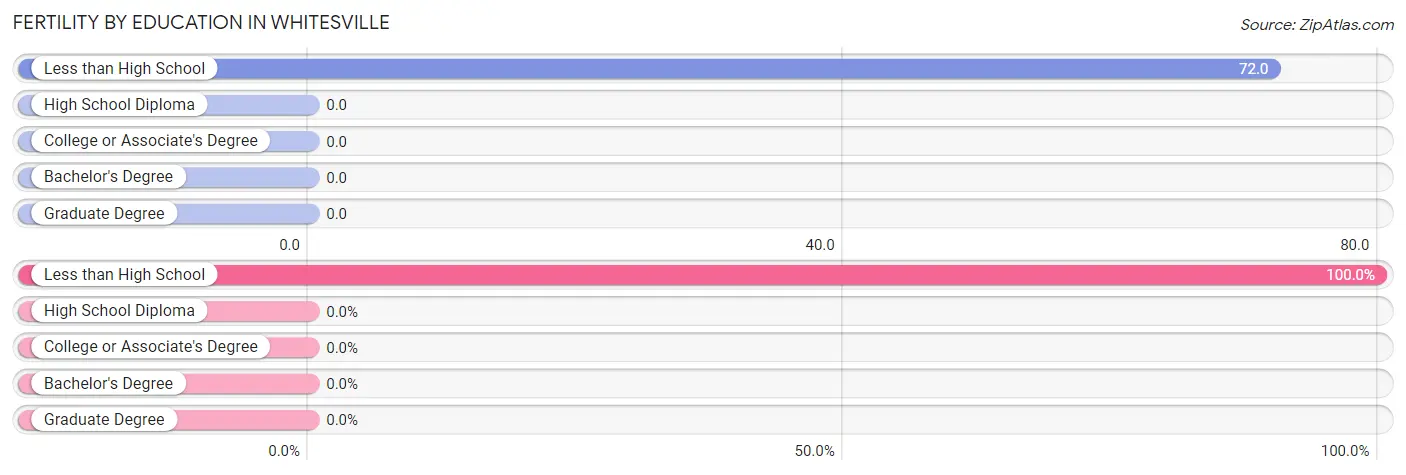
| Educational Attainment | Women with Births | Births / 1,000 Women |
| Less than High School | 7 (100.0%) | 72.0 |
| High School Diploma | 0 (0.0%) | 0.0 |
| College or Associate's Degree | 0 (0.0%) | 0.0 |
| Bachelor's Degree | 0 (0.0%) | 0.0 |
| Graduate Degree | 0 (0.0%) | 0.0 |
| Total | 7 (100.0%) | 36.0 |
Fertility by Education by Marriage Status in Whitesville
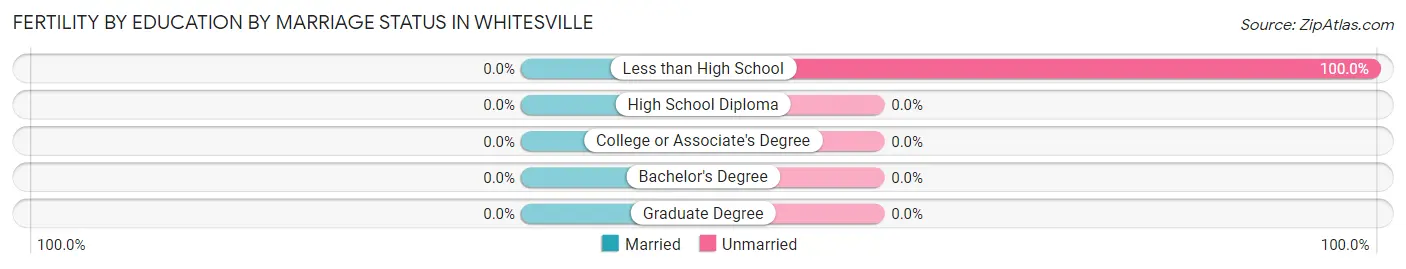
| Educational Attainment | Married | Unmarried |
| Less than High School | 0 (0.0%) | 7 (100.0%) |
| High School Diploma | 0 (0.0%) | 0 (0.0%) |
| College or Associate's Degree | 0 (0.0%) | 0 (0.0%) |
| Bachelor's Degree | 0 (0.0%) | 0 (0.0%) |
| Graduate Degree | 0 (0.0%) | 0 (0.0%) |
| Total | 0 (0.0%) | 7 (100.0%) |
Employment Characteristics in Whitesville
Employment by Class of Employer in Whitesville
Among the 202 employed individuals in Whitesville, private company employees (150 | 74.3%), state government employees (20 | 9.9%), and local government employees (12 | 5.9%) make up the most common classes of employment.
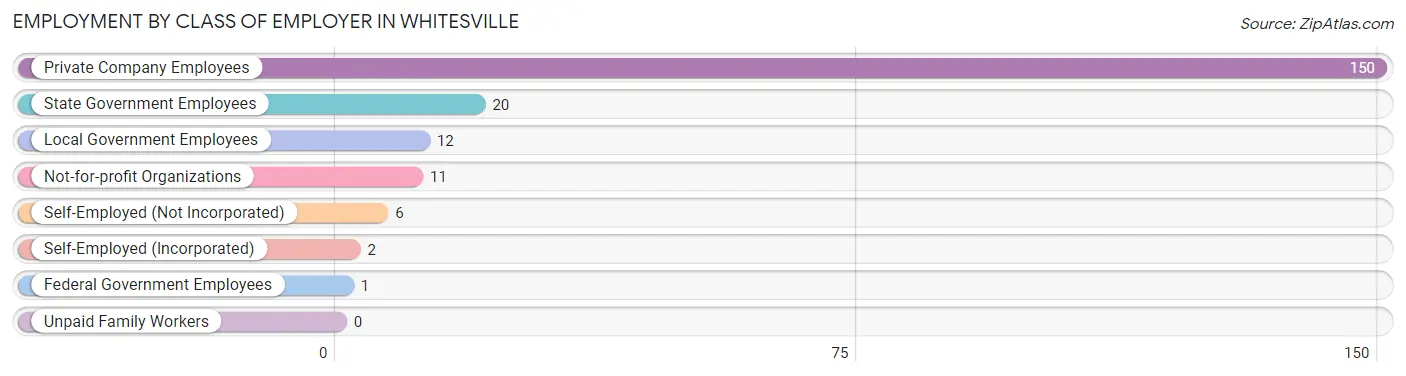
| Employer Class | # Employees | % Employees |
| Private Company Employees | 150 | 74.3% |
| Self-Employed (Incorporated) | 2 | 1.0% |
| Self-Employed (Not Incorporated) | 6 | 3.0% |
| Not-for-profit Organizations | 11 | 5.4% |
| Local Government Employees | 12 | 5.9% |
| State Government Employees | 20 | 9.9% |
| Federal Government Employees | 1 | 0.5% |
| Unpaid Family Workers | 0 | 0.0% |
| Total | 202 | 100.0% |
Employment Status by Age in Whitesville
According to the labor force statistics for Whitesville, out of the total population over 16 years of age (413), 54.5% or 225 individuals are in the labor force, with 0.9% or 2 of them unemployed. The age group with the highest labor force participation rate is 30 to 34 years, with 95.2% or 40 individuals in the labor force. Within the labor force, the 35 to 44 years age range has the highest percentage of unemployed individuals, with 2.9% or 1 of them being unemployed.
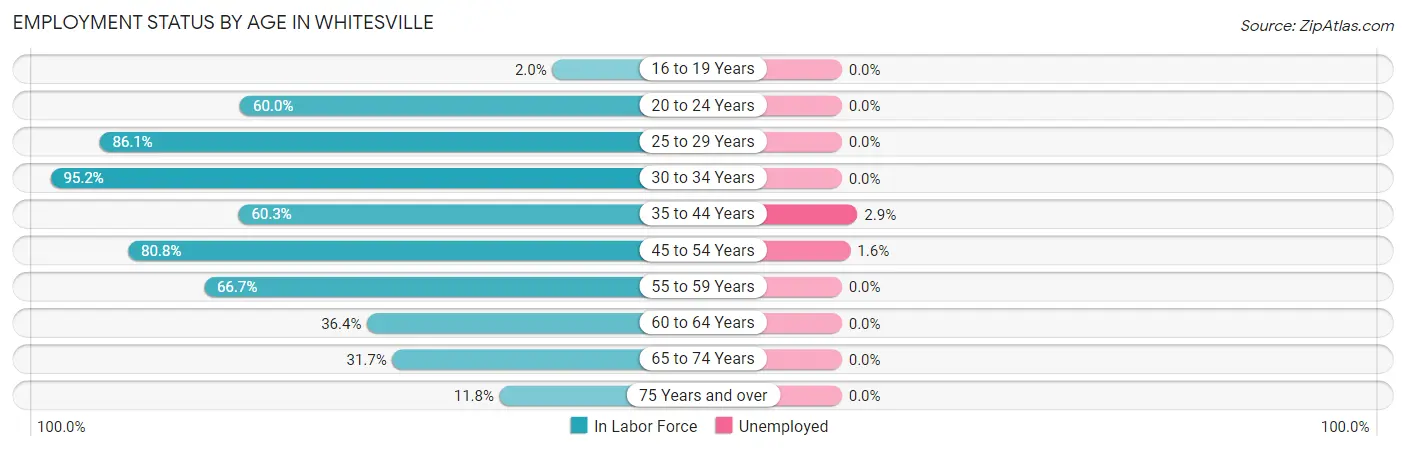
| Age Bracket | In Labor Force | Unemployed |
| 16 to 19 Years | 1 (2.0%) | 0 (0.0%) |
| 20 to 24 Years | 18 (60.0%) | 0 (0.0%) |
| 25 to 29 Years | 31 (86.1%) | 0 (0.0%) |
| 30 to 34 Years | 40 (95.2%) | 0 (0.0%) |
| 35 to 44 Years | 35 (60.3%) | 1 (2.9%) |
| 45 to 54 Years | 63 (80.8%) | 1 (1.6%) |
| 55 to 59 Years | 8 (66.7%) | 0 (0.0%) |
| 60 to 64 Years | 12 (36.4%) | 0 (0.0%) |
| 65 to 74 Years | 13 (31.7%) | 0 (0.0%) |
| 75 Years and over | 4 (11.8%) | 0 (0.0%) |
| Total | 225 (54.5%) | 2 (0.9%) |
Employment Status by Educational Attainment in Whitesville
According to labor force statistics for Whitesville, 73.0% of individuals (189) out of the total population between 25 and 64 years of age (259) are in the labor force, with 1.1% or 2 of them being unemployed. The group with the highest labor force participation rate are those with the educational attainment of bachelor's degree or higher, with 81.3% or 61 individuals in the labor force. Within the labor force, individuals with bachelor's degree or higher education have the highest percentage of unemployment, with 1.6% or 1 of them being unemployed.
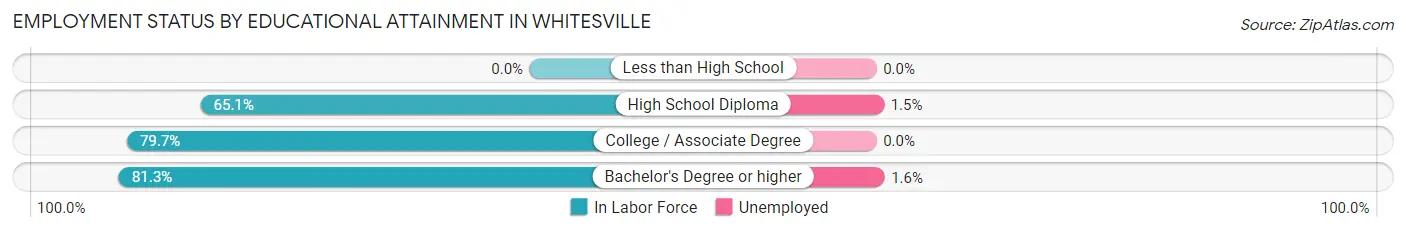
| Educational Attainment | In Labor Force | Unemployed |
| Less than High School | 0 (0.0%) | 0 (0.0%) |
| High School Diploma | 69 (65.1%) | 2 (1.5%) |
| College / Associate Degree | 59 (79.7%) | 0 (0.0%) |
| Bachelor's Degree or higher | 61 (81.3%) | 1 (1.6%) |
| Total | 189 (73.0%) | 3 (1.1%) |
Employment Occupations by Sex in Whitesville
Management, Business, Science and Arts Occupations
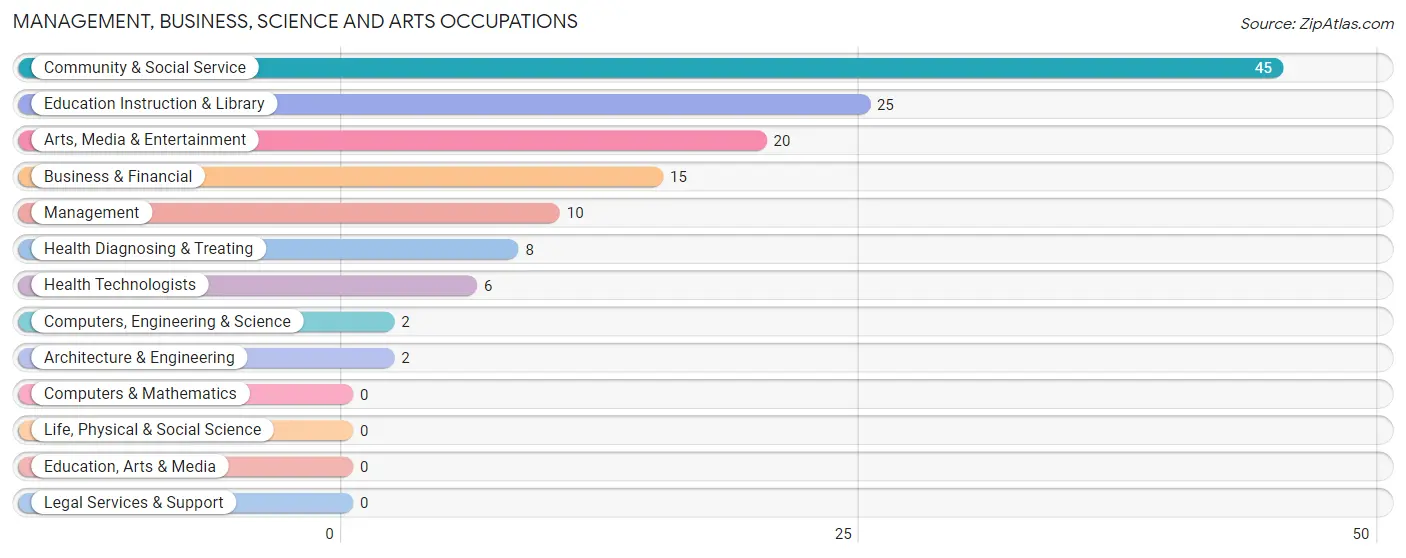
The most common Management, Business, Science and Arts occupations in Whitesville are Community & Social Service (45 | 20.3%), Education Instruction & Library (25 | 11.3%), Arts, Media & Entertainment (20 | 9.0%), Business & Financial (15 | 6.8%), and Management (10 | 4.5%).
Management, Business, Science and Arts Occupations by Sex
Within the Management, Business, Science and Arts occupations in Whitesville, the most male-oriented occupations are Computers, Engineering & Science (100.0%), Architecture & Engineering (100.0%), and Management (80.0%), while the most female-oriented occupations are Business & Financial (100.0%), Community & Social Service (100.0%), and Education Instruction & Library (100.0%).
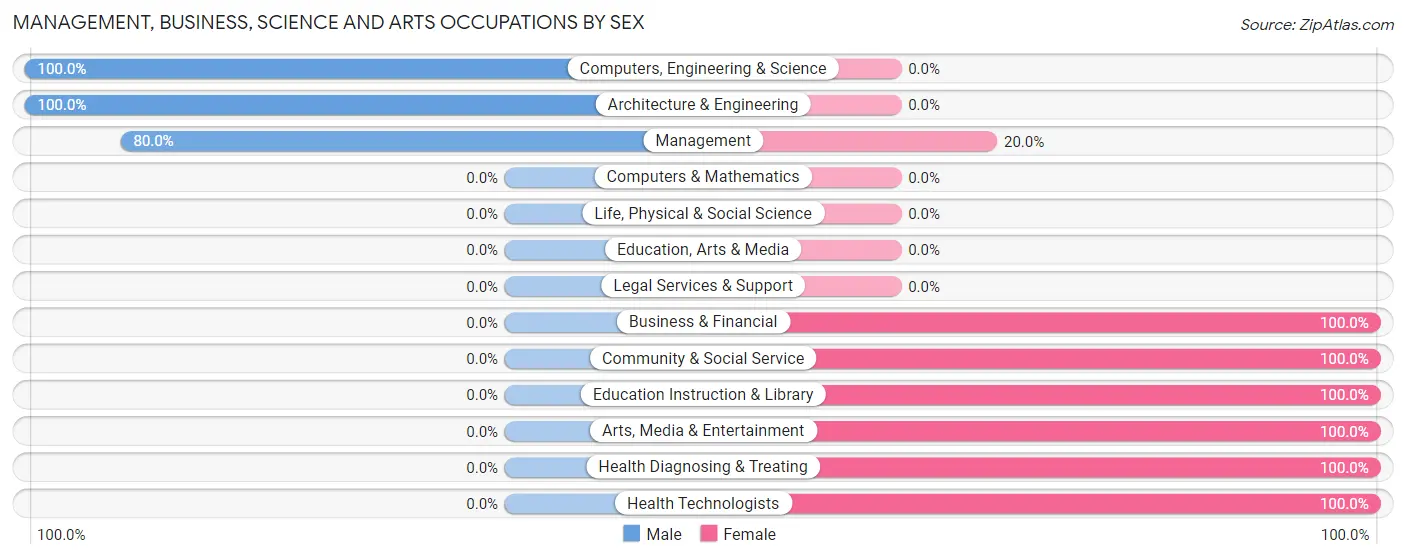
| Occupation | Male | Female |
| Management | 8 (80.0%) | 2 (20.0%) |
| Business & Financial | 0 (0.0%) | 15 (100.0%) |
| Computers, Engineering & Science | 2 (100.0%) | 0 (0.0%) |
| Computers & Mathematics | 0 (0.0%) | 0 (0.0%) |
| Architecture & Engineering | 2 (100.0%) | 0 (0.0%) |
| Life, Physical & Social Science | 0 (0.0%) | 0 (0.0%) |
| Community & Social Service | 0 (0.0%) | 45 (100.0%) |
| Education, Arts & Media | 0 (0.0%) | 0 (0.0%) |
| Legal Services & Support | 0 (0.0%) | 0 (0.0%) |
| Education Instruction & Library | 0 (0.0%) | 25 (100.0%) |
| Arts, Media & Entertainment | 0 (0.0%) | 20 (100.0%) |
| Health Diagnosing & Treating | 0 (0.0%) | 8 (100.0%) |
| Health Technologists | 0 (0.0%) | 6 (100.0%) |
| Total (Category) | 10 (12.5%) | 70 (87.5%) |
| Total (Overall) | 99 (44.6%) | 123 (55.4%) |
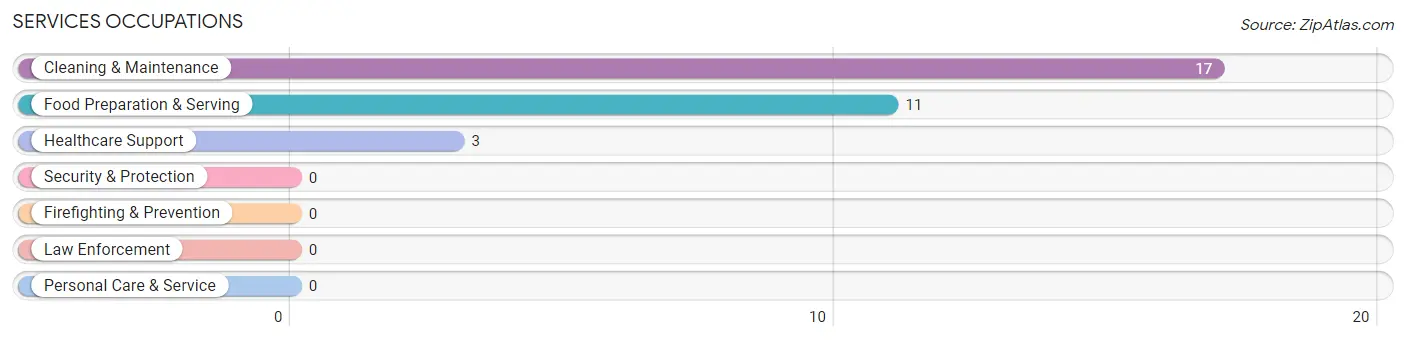
Services Occupations
The most common Services occupations in Whitesville are Cleaning & Maintenance (17 | 7.7%), Food Preparation & Serving (11 | 5.0%), and Healthcare Support (3 | 1.3%).
Services Occupations by Sex
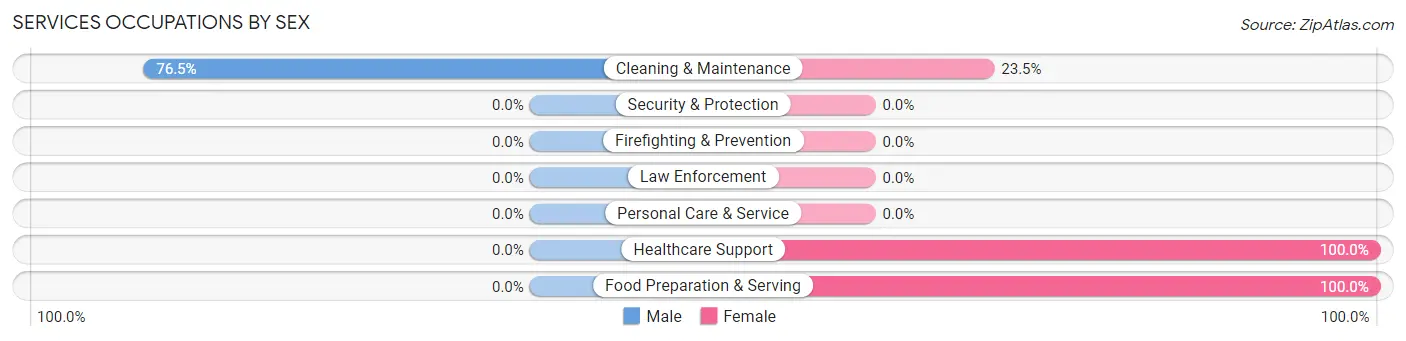
| Occupation | Male | Female |
| Healthcare Support | 0 (0.0%) | 3 (100.0%) |
| Security & Protection | 0 (0.0%) | 0 (0.0%) |
| Firefighting & Prevention | 0 (0.0%) | 0 (0.0%) |
| Law Enforcement | 0 (0.0%) | 0 (0.0%) |
| Food Preparation & Serving | 0 (0.0%) | 11 (100.0%) |
| Cleaning & Maintenance | 13 (76.5%) | 4 (23.5%) |
| Personal Care & Service | 0 (0.0%) | 0 (0.0%) |
| Total (Category) | 13 (41.9%) | 18 (58.1%) |
| Total (Overall) | 99 (44.6%) | 123 (55.4%) |
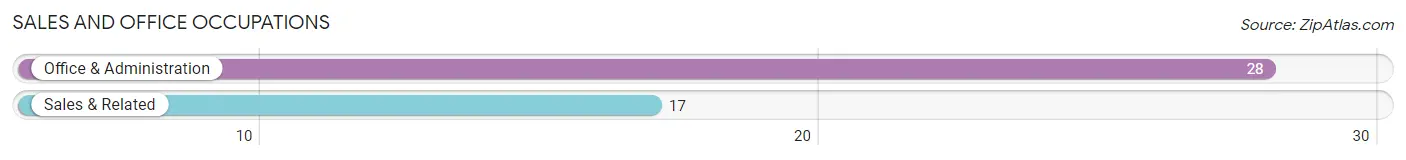
Sales and Office Occupations
The most common Sales and Office occupations in Whitesville are Office & Administration (28 | 12.6%), and Sales & Related (17 | 7.7%).
Sales and Office Occupations by Sex
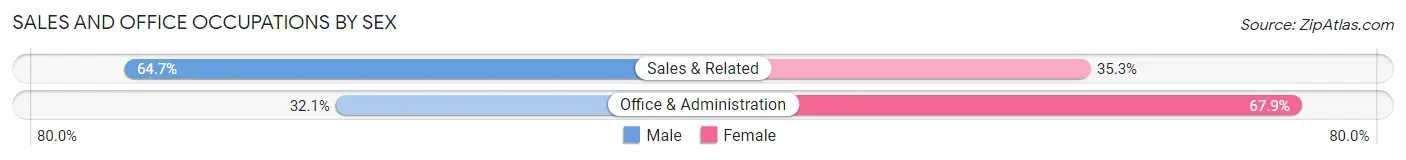
| Occupation | Male | Female |
| Sales & Related | 11 (64.7%) | 6 (35.3%) |
| Office & Administration | 9 (32.1%) | 19 (67.9%) |
| Total (Category) | 20 (44.4%) | 25 (55.6%) |
| Total (Overall) | 99 (44.6%) | 123 (55.4%) |
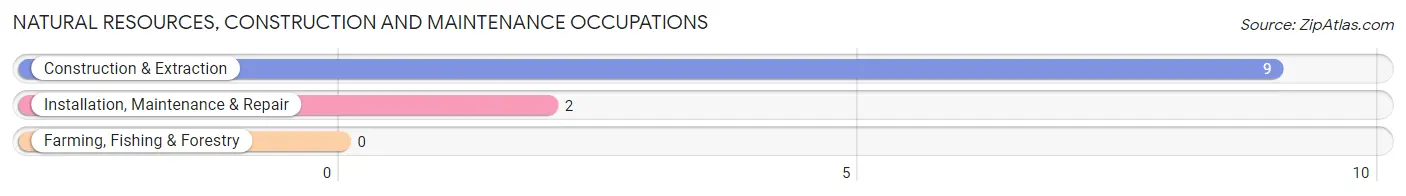
Natural Resources, Construction and Maintenance Occupations
The most common Natural Resources, Construction and Maintenance occupations in Whitesville are Construction & Extraction (9 | 4.1%), and Installation, Maintenance & Repair (2 | 0.9%).
Natural Resources, Construction and Maintenance Occupations by Sex
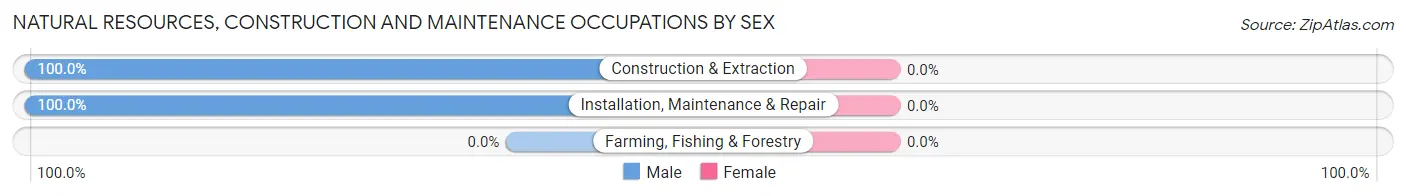
| Occupation | Male | Female |
| Farming, Fishing & Forestry | 0 (0.0%) | 0 (0.0%) |
| Construction & Extraction | 9 (100.0%) | 0 (0.0%) |
| Installation, Maintenance & Repair | 2 (100.0%) | 0 (0.0%) |
| Total (Category) | 11 (100.0%) | 0 (0.0%) |
| Total (Overall) | 99 (44.6%) | 123 (55.4%) |
Production, Transportation and Moving Occupations
The most common Production, Transportation and Moving occupations in Whitesville are Production (34 | 15.3%), Transportation (11 | 5.0%), and Material Moving (10 | 4.5%).
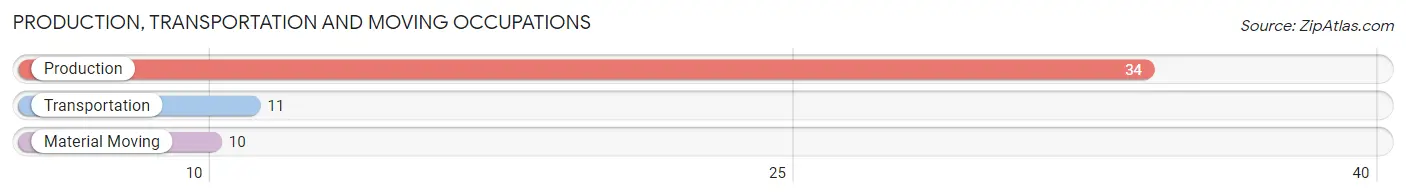
Production, Transportation and Moving Occupations by Sex
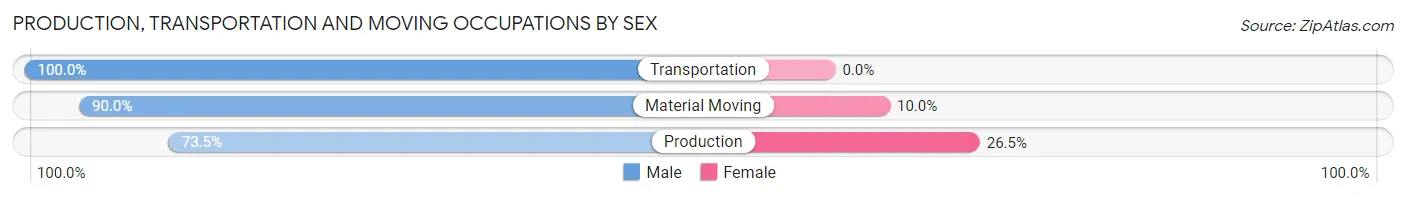
| Occupation | Male | Female |
| Production | 25 (73.5%) | 9 (26.5%) |
| Transportation | 11 (100.0%) | 0 (0.0%) |
| Material Moving | 9 (90.0%) | 1 (10.0%) |
| Total (Category) | 45 (81.8%) | 10 (18.2%) |
| Total (Overall) | 99 (44.6%) | 123 (55.4%) |
Employment Industries by Sex in Whitesville
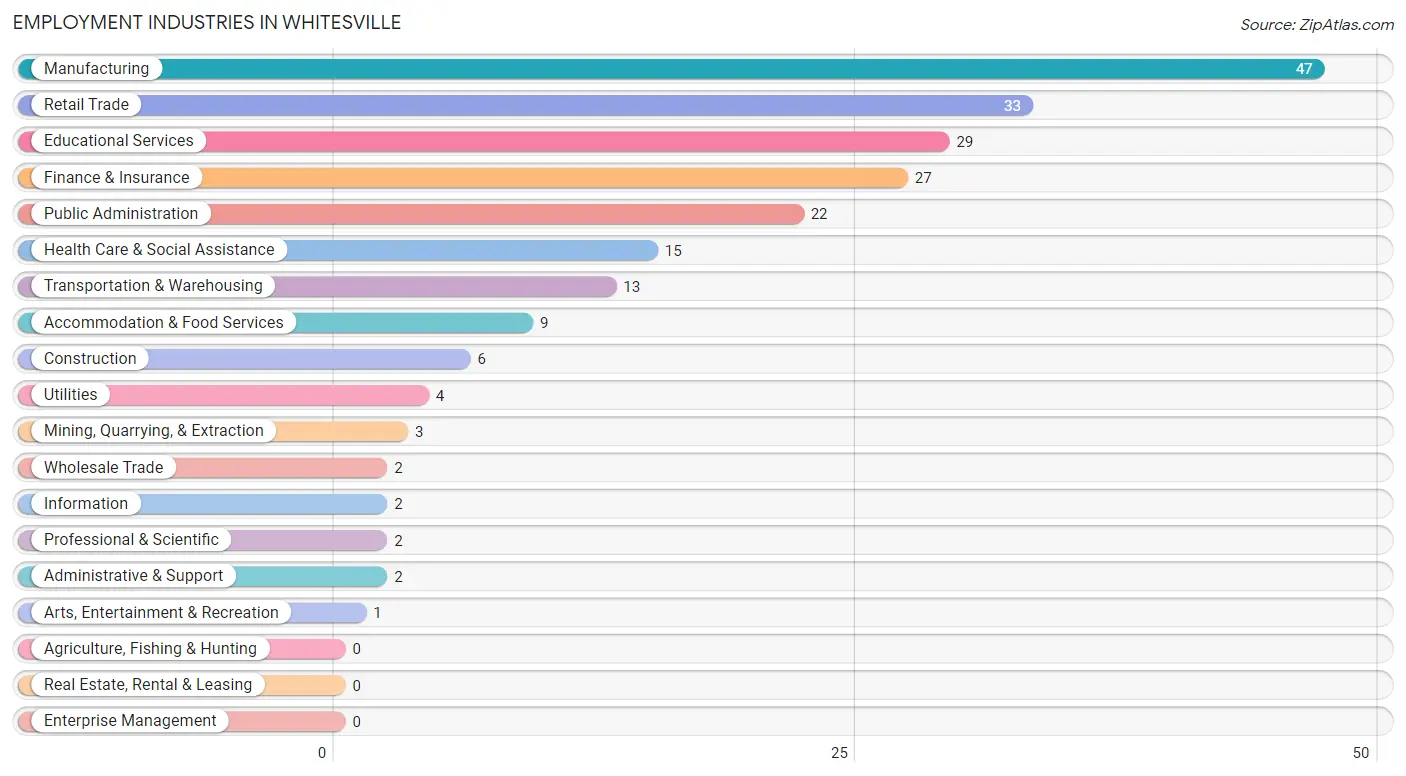
Employment Industries in Whitesville
The major employment industries in Whitesville include Manufacturing (47 | 21.2%), Retail Trade (33 | 14.9%), Educational Services (29 | 13.1%), Finance & Insurance (27 | 12.2%), and Public Administration (22 | 9.9%).
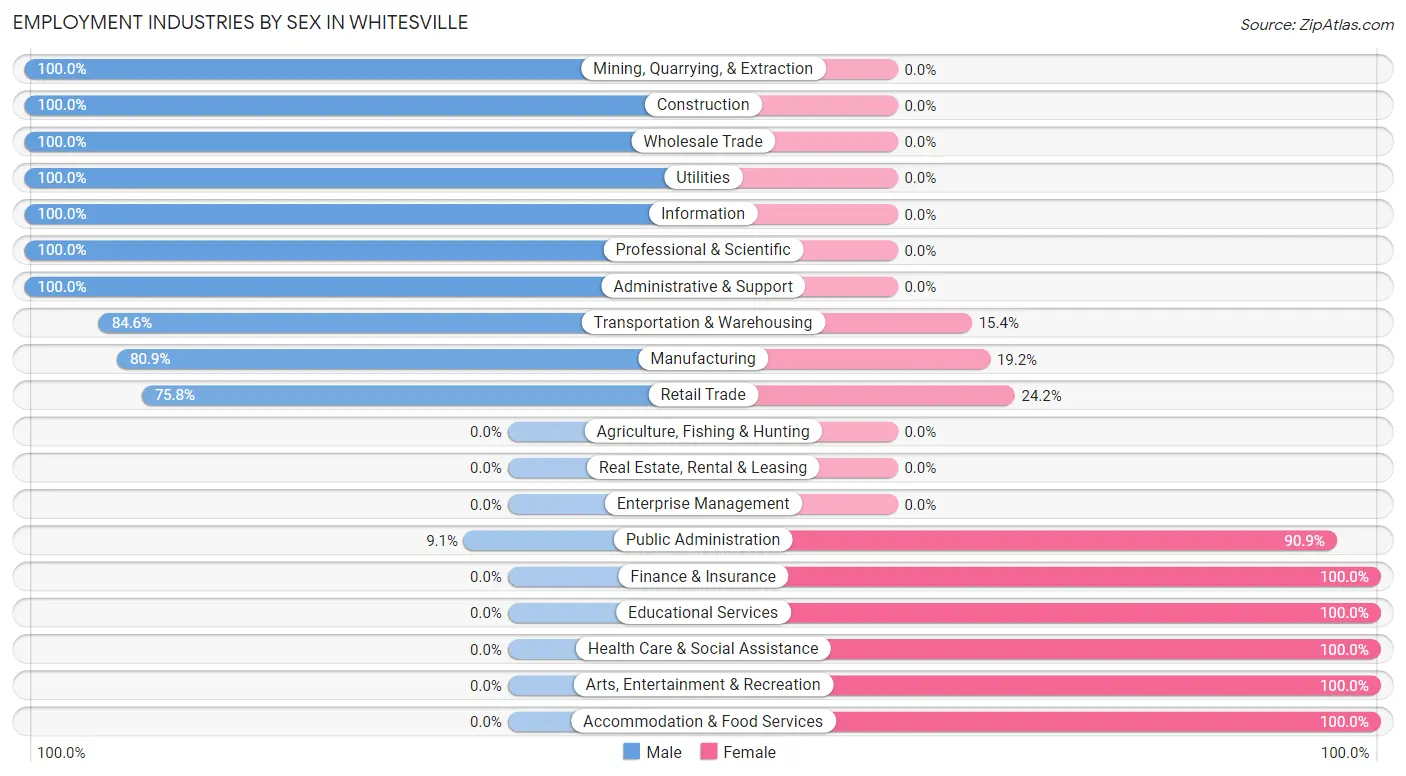
Employment Industries by Sex in Whitesville
The Whitesville industries that see more men than women are Mining, Quarrying, & Extraction (100.0%), Construction (100.0%), and Wholesale Trade (100.0%), whereas the industries that tend to have a higher number of women are Finance & Insurance (100.0%), Educational Services (100.0%), and Health Care & Social Assistance (100.0%).
| Industry | Male | Female |
| Agriculture, Fishing & Hunting | 0 (0.0%) | 0 (0.0%) |
| Mining, Quarrying, & Extraction | 3 (100.0%) | 0 (0.0%) |
| Construction | 6 (100.0%) | 0 (0.0%) |
| Manufacturing | 38 (80.8%) | 9 (19.2%) |
| Wholesale Trade | 2 (100.0%) | 0 (0.0%) |
| Retail Trade | 25 (75.8%) | 8 (24.2%) |
| Transportation & Warehousing | 11 (84.6%) | 2 (15.4%) |
| Utilities | 4 (100.0%) | 0 (0.0%) |
| Information | 2 (100.0%) | 0 (0.0%) |
| Finance & Insurance | 0 (0.0%) | 27 (100.0%) |
| Real Estate, Rental & Leasing | 0 (0.0%) | 0 (0.0%) |
| Professional & Scientific | 2 (100.0%) | 0 (0.0%) |
| Enterprise Management | 0 (0.0%) | 0 (0.0%) |
| Administrative & Support | 2 (100.0%) | 0 (0.0%) |
| Educational Services | 0 (0.0%) | 29 (100.0%) |
| Health Care & Social Assistance | 0 (0.0%) | 15 (100.0%) |
| Arts, Entertainment & Recreation | 0 (0.0%) | 1 (100.0%) |
| Accommodation & Food Services | 0 (0.0%) | 9 (100.0%) |
| Public Administration | 2 (9.1%) | 20 (90.9%) |
| Total | 99 (44.6%) | 123 (55.4%) |
Education in Whitesville
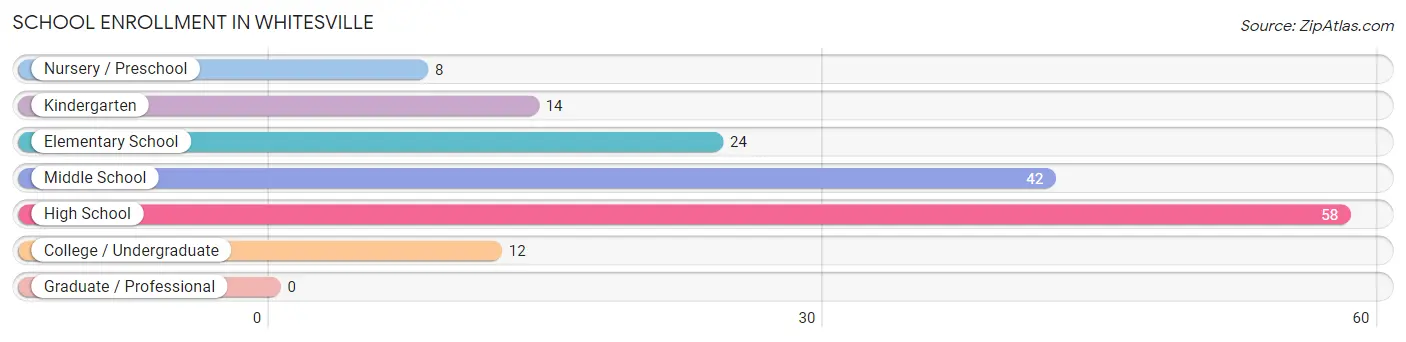
School Enrollment in Whitesville
The most common levels of schooling among the 158 students in Whitesville are high school (58 | 36.7%), middle school (42 | 26.6%), and elementary school (24 | 15.2%).
| School Level | # Students | % Students |
| Nursery / Preschool | 8 | 5.1% |
| Kindergarten | 14 | 8.9% |
| Elementary School | 24 | 15.2% |
| Middle School | 42 | 26.6% |
| High School | 58 | 36.7% |
| College / Undergraduate | 12 | 7.6% |
| Graduate / Professional | 0 | 0.0% |
| Total | 158 | 100.0% |
School Enrollment by Age by Funding Source in Whitesville
Out of a total of 158 students who are enrolled in schools in Whitesville, 45 (28.5%) attend a private institution, while the remaining 113 (71.5%) are enrolled in public schools. The age group of 3 to 4 year olds has the highest likelihood of being enrolled in private schools, with 3 (100.0% in the age bracket) enrolled. Conversely, the age group of 18 to 19 year olds has the lowest likelihood of being enrolled in a private school, with 3 (100.0% in the age bracket) attending a public institution.
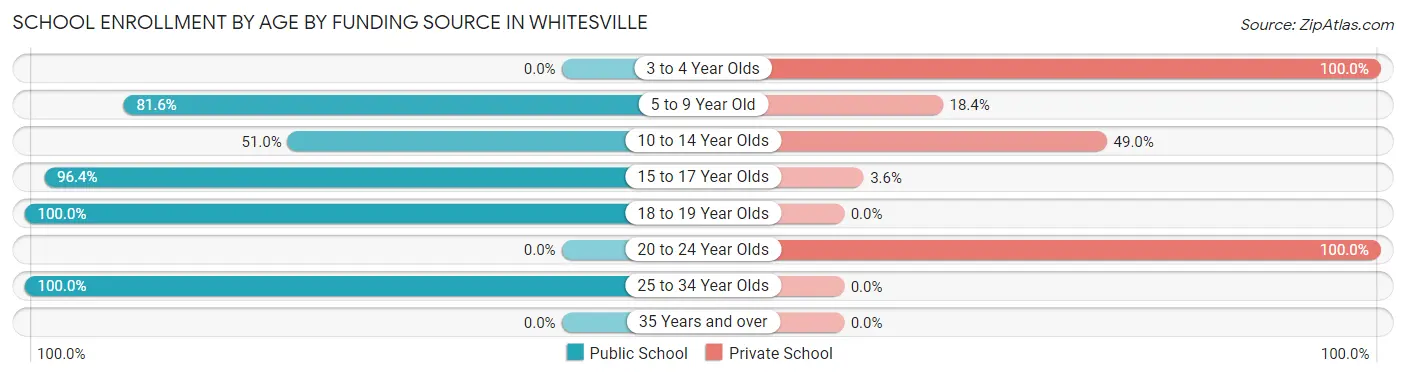
| Age Bracket | Public School | Private School |
| 3 to 4 Year Olds | 0 (0.0%) | 3 (100.0%) |
| 5 to 9 Year Old | 31 (81.6%) | 7 (18.4%) |
| 10 to 14 Year Olds | 25 (51.0%) | 24 (49.0%) |
| 15 to 17 Year Olds | 53 (96.4%) | 2 (3.6%) |
| 18 to 19 Year Olds | 3 (100.0%) | 0 (0.0%) |
| 20 to 24 Year Olds | 0 (0.0%) | 9 (100.0%) |
| 25 to 34 Year Olds | 1 (100.0%) | 0 (0.0%) |
| 35 Years and over | 0 (0.0%) | 0 (0.0%) |
| Total | 113 (71.5%) | 45 (28.5%) |
Educational Attainment by Field of Study in Whitesville
Arts & humanities (24 | 27.9%), education (22 | 25.6%), communications (12 | 14.0%), engineering (11 | 12.8%), and business (7 | 8.1%) are the most common fields of study among 86 individuals in Whitesville who have obtained a bachelor's degree or higher.
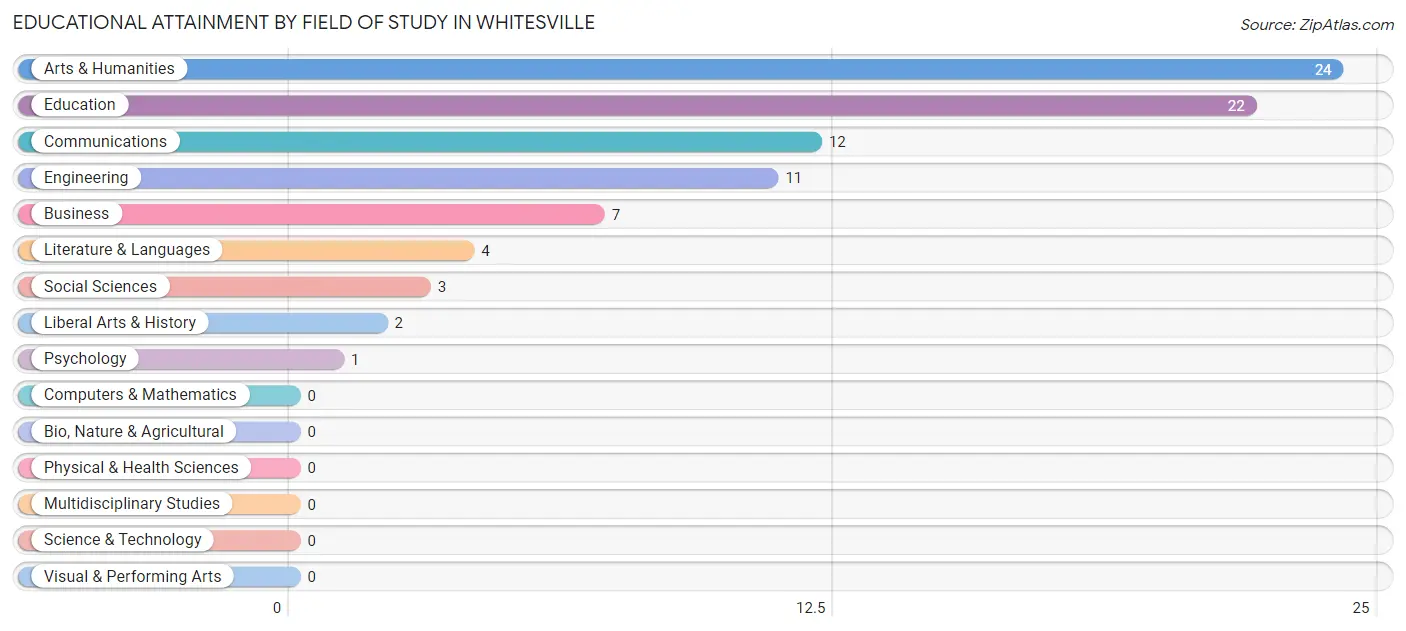
| Field of Study | # Graduates | % Graduates |
| Computers & Mathematics | 0 | 0.0% |
| Bio, Nature & Agricultural | 0 | 0.0% |
| Physical & Health Sciences | 0 | 0.0% |
| Psychology | 1 | 1.2% |
| Social Sciences | 3 | 3.5% |
| Engineering | 11 | 12.8% |
| Multidisciplinary Studies | 0 | 0.0% |
| Science & Technology | 0 | 0.0% |
| Business | 7 | 8.1% |
| Education | 22 | 25.6% |
| Literature & Languages | 4 | 4.6% |
| Liberal Arts & History | 2 | 2.3% |
| Visual & Performing Arts | 0 | 0.0% |
| Communications | 12 | 14.0% |
| Arts & Humanities | 24 | 27.9% |
| Total | 86 | 100.0% |
Transportation & Commute in Whitesville
Vehicle Availability by Sex in Whitesville
The most prevalent vehicle ownership categories in Whitesville are males with 2 vehicles (43, accounting for 43.0%) and females with 2 vehicles (54, making up 42.2%).
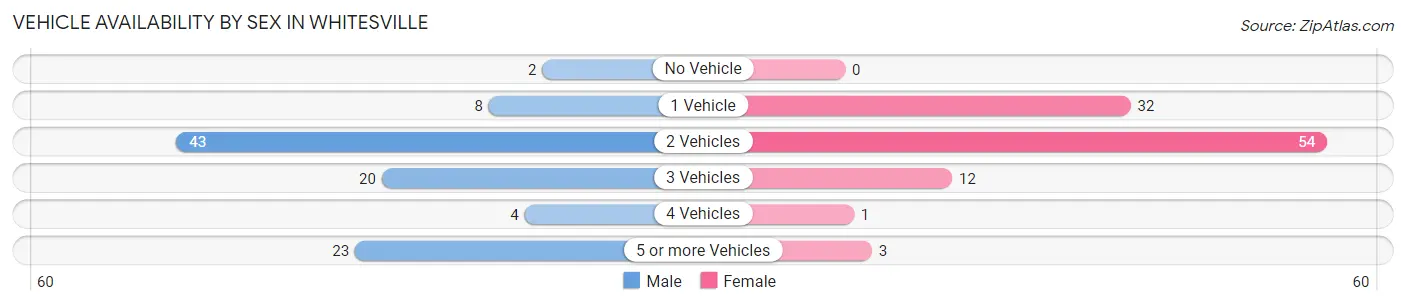
| Vehicles Available | Male | Female |
| No Vehicle | 2 (2.0%) | 0 (0.0%) |
| 1 Vehicle | 8 (8.0%) | 32 (31.4%) |
| 2 Vehicles | 43 (43.0%) | 54 (52.9%) |
| 3 Vehicles | 20 (20.0%) | 12 (11.8%) |
| 4 Vehicles | 4 (4.0%) | 1 (1.0%) |
| 5 or more Vehicles | 23 (23.0%) | 3 (2.9%) |
| Total | 100 (100.0%) | 102 (100.0%) |
Commute Time in Whitesville
The most frequently occuring commute durations in Whitesville are 30 to 34 minutes (57 commuters, 31.7%), 5 to 9 minutes (32 commuters, 17.8%), and 20 to 24 minutes (29 commuters, 16.1%).
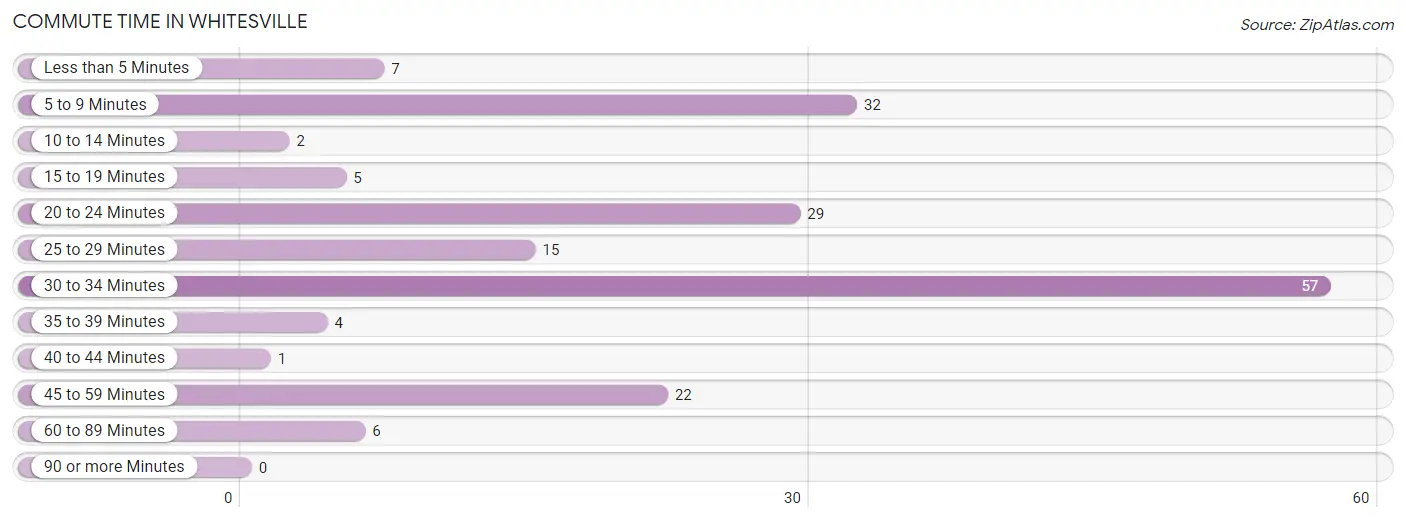
| Commute Time | # Commuters | % Commuters |
| Less than 5 Minutes | 7 | 3.9% |
| 5 to 9 Minutes | 32 | 17.8% |
| 10 to 14 Minutes | 2 | 1.1% |
| 15 to 19 Minutes | 5 | 2.8% |
| 20 to 24 Minutes | 29 | 16.1% |
| 25 to 29 Minutes | 15 | 8.3% |
| 30 to 34 Minutes | 57 | 31.7% |
| 35 to 39 Minutes | 4 | 2.2% |
| 40 to 44 Minutes | 1 | 0.6% |
| 45 to 59 Minutes | 22 | 12.2% |
| 60 to 89 Minutes | 6 | 3.3% |
| 90 or more Minutes | 0 | 0.0% |
Commute Time by Sex in Whitesville
The most common commute times in Whitesville are 30 to 34 minutes (37 commuters, 37.8%) for males and 5 to 9 minutes (29 commuters, 35.4%) for females.
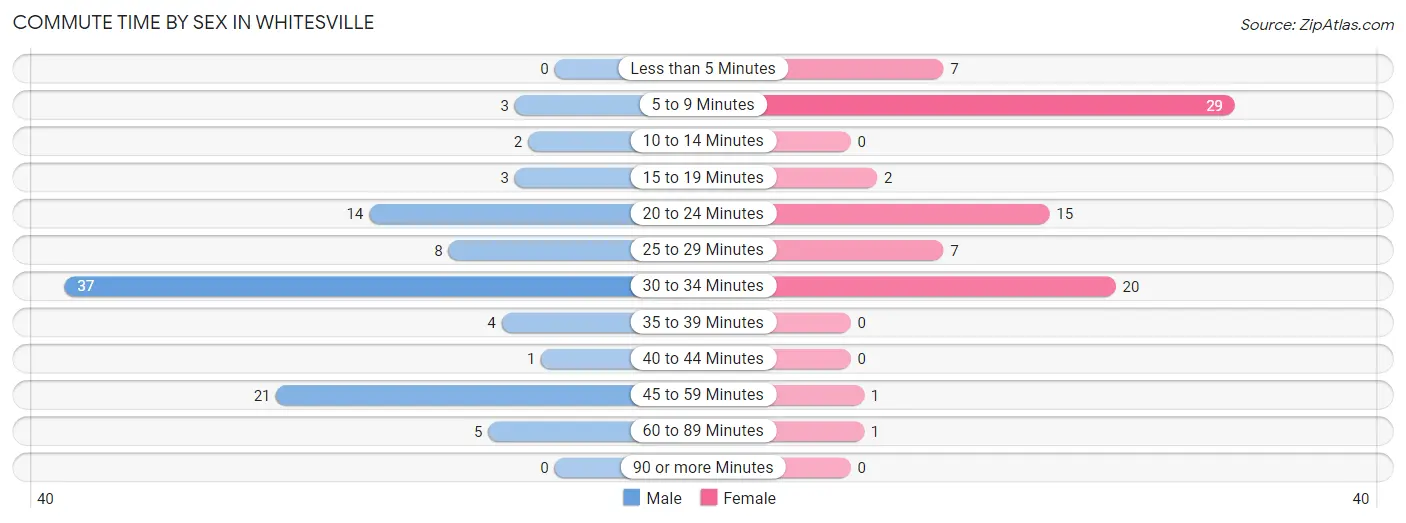
| Commute Time | Male | Female |
| Less than 5 Minutes | 0 (0.0%) | 7 (8.5%) |
| 5 to 9 Minutes | 3 (3.1%) | 29 (35.4%) |
| 10 to 14 Minutes | 2 (2.0%) | 0 (0.0%) |
| 15 to 19 Minutes | 3 (3.1%) | 2 (2.4%) |
| 20 to 24 Minutes | 14 (14.3%) | 15 (18.3%) |
| 25 to 29 Minutes | 8 (8.2%) | 7 (8.5%) |
| 30 to 34 Minutes | 37 (37.8%) | 20 (24.4%) |
| 35 to 39 Minutes | 4 (4.1%) | 0 (0.0%) |
| 40 to 44 Minutes | 1 (1.0%) | 0 (0.0%) |
| 45 to 59 Minutes | 21 (21.4%) | 1 (1.2%) |
| 60 to 89 Minutes | 5 (5.1%) | 1 (1.2%) |
| 90 or more Minutes | 0 (0.0%) | 0 (0.0%) |
Time of Departure to Work by Sex in Whitesville
The most frequent times of departure to work in Whitesville are 6:00 AM to 6:29 AM (22, 22.5%) for males and 9:00 AM to 9:59 AM (29, 35.4%) for females.
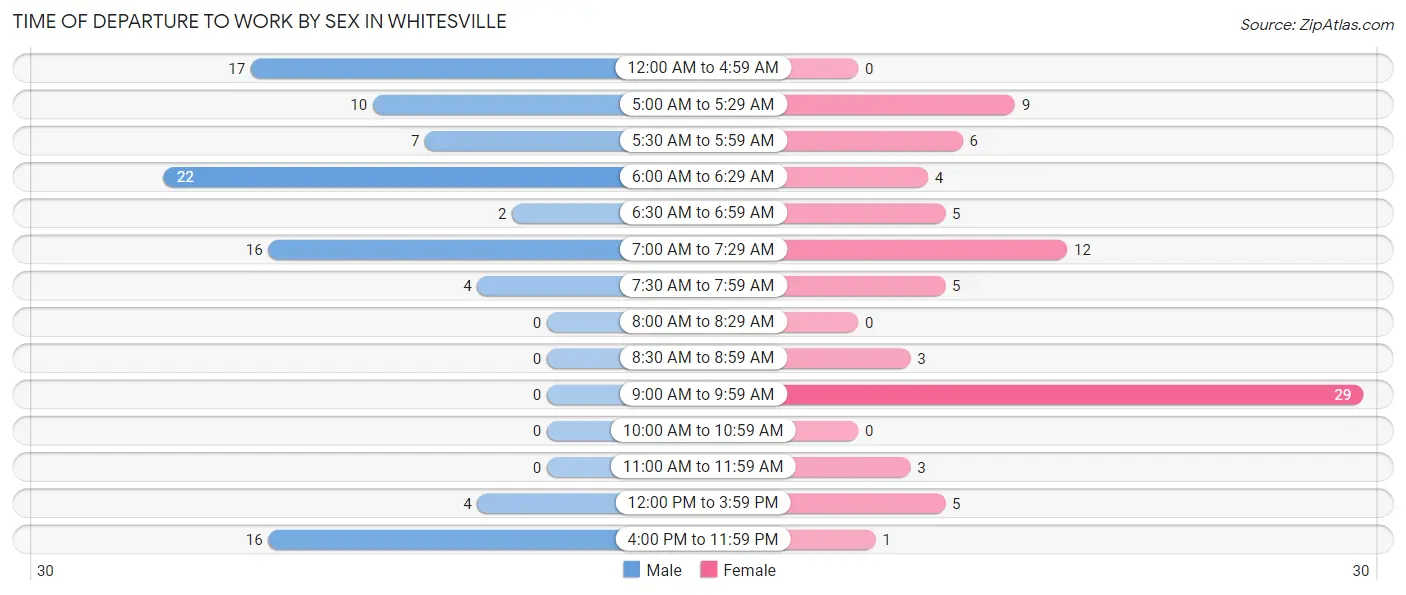
| Time of Departure | Male | Female |
| 12:00 AM to 4:59 AM | 17 (17.3%) | 0 (0.0%) |
| 5:00 AM to 5:29 AM | 10 (10.2%) | 9 (11.0%) |
| 5:30 AM to 5:59 AM | 7 (7.1%) | 6 (7.3%) |
| 6:00 AM to 6:29 AM | 22 (22.5%) | 4 (4.9%) |
| 6:30 AM to 6:59 AM | 2 (2.0%) | 5 (6.1%) |
| 7:00 AM to 7:29 AM | 16 (16.3%) | 12 (14.6%) |
| 7:30 AM to 7:59 AM | 4 (4.1%) | 5 (6.1%) |
| 8:00 AM to 8:29 AM | 0 (0.0%) | 0 (0.0%) |
| 8:30 AM to 8:59 AM | 0 (0.0%) | 3 (3.7%) |
| 9:00 AM to 9:59 AM | 0 (0.0%) | 29 (35.4%) |
| 10:00 AM to 10:59 AM | 0 (0.0%) | 0 (0.0%) |
| 11:00 AM to 11:59 AM | 0 (0.0%) | 3 (3.7%) |
| 12:00 PM to 3:59 PM | 4 (4.1%) | 5 (6.1%) |
| 4:00 PM to 11:59 PM | 16 (16.3%) | 1 (1.2%) |
| Total | 98 (100.0%) | 82 (100.0%) |
Housing Occupancy in Whitesville
Occupancy by Ownership in Whitesville
Of the total 204 dwellings in Whitesville, owner-occupied units account for 162 (79.4%), while renter-occupied units make up 42 (20.6%).
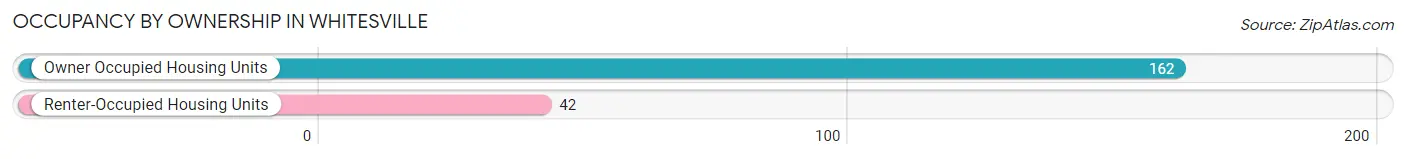
| Occupancy | # Housing Units | % Housing Units |
| Owner Occupied Housing Units | 162 | 79.4% |
| Renter-Occupied Housing Units | 42 | 20.6% |
| Total Occupied Housing Units | 204 | 100.0% |
Occupancy by Household Size in Whitesville
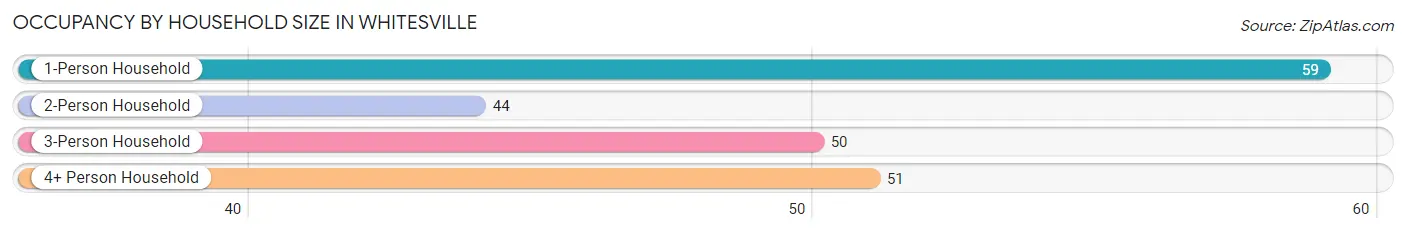
| Household Size | # Housing Units | % Housing Units |
| 1-Person Household | 59 | 28.9% |
| 2-Person Household | 44 | 21.6% |
| 3-Person Household | 50 | 24.5% |
| 4+ Person Household | 51 | 25.0% |
| Total Housing Units | 204 | 100.0% |
Occupancy by Ownership by Household Size in Whitesville
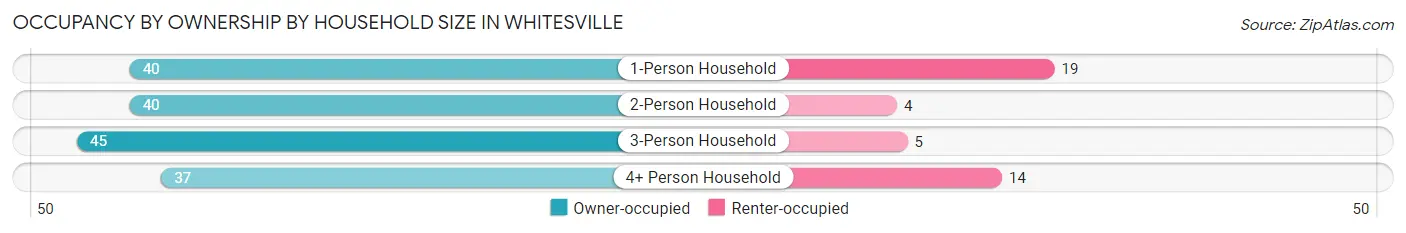
| Household Size | Owner-occupied | Renter-occupied |
| 1-Person Household | 40 (67.8%) | 19 (32.2%) |
| 2-Person Household | 40 (90.9%) | 4 (9.1%) |
| 3-Person Household | 45 (90.0%) | 5 (10.0%) |
| 4+ Person Household | 37 (72.6%) | 14 (27.5%) |
| Total Housing Units | 162 (79.4%) | 42 (20.6%) |
Occupancy by Educational Attainment in Whitesville
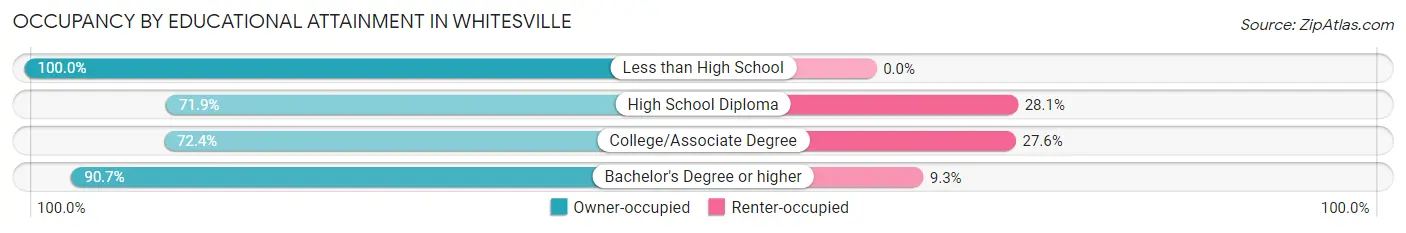
| Household Size | Owner-occupied | Renter-occupied |
| Less than High School | 17 (100.0%) | 0 (0.0%) |
| High School Diploma | 41 (71.9%) | 16 (28.1%) |
| College/Associate Degree | 55 (72.4%) | 21 (27.6%) |
| Bachelor's Degree or higher | 49 (90.7%) | 5 (9.3%) |
Occupancy by Age of Householder in Whitesville
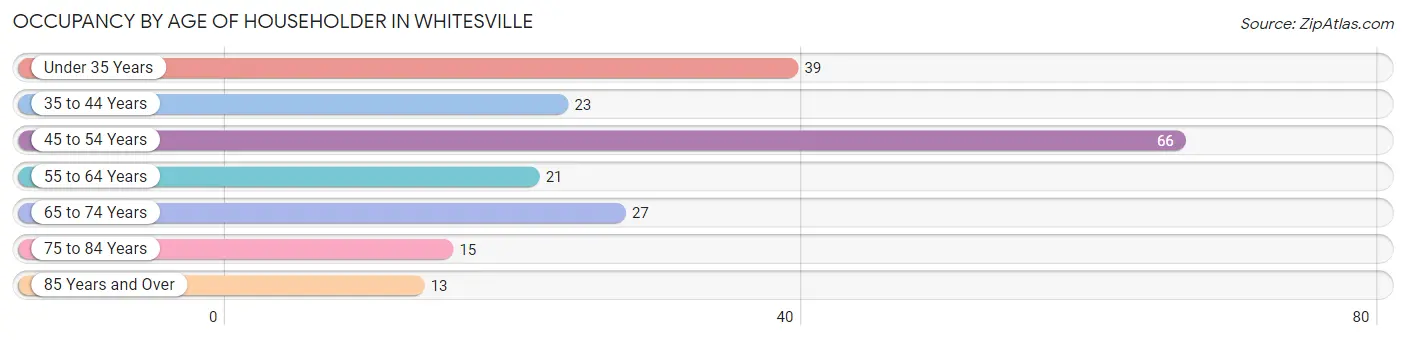
| Age Bracket | # Households | % Households |
| Under 35 Years | 39 | 19.1% |
| 35 to 44 Years | 23 | 11.3% |
| 45 to 54 Years | 66 | 32.4% |
| 55 to 64 Years | 21 | 10.3% |
| 65 to 74 Years | 27 | 13.2% |
| 75 to 84 Years | 15 | 7.3% |
| 85 Years and Over | 13 | 6.4% |
| Total | 204 | 100.0% |
Housing Finances in Whitesville
Median Income by Occupancy in Whitesville
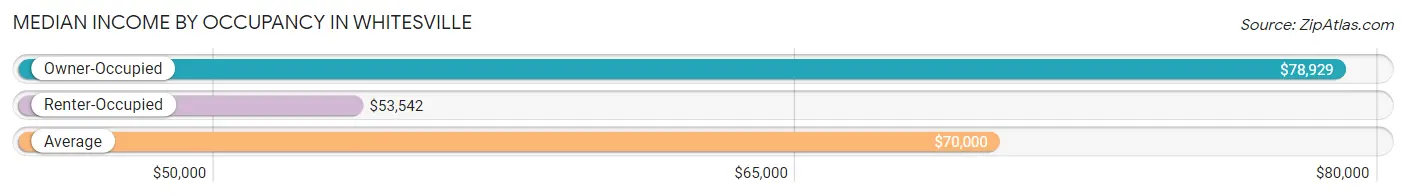
| Occupancy Type | # Households | Median Income |
| Owner-Occupied | 162 (79.4%) | $78,929 |
| Renter-Occupied | 42 (20.6%) | $53,542 |
| Average | 204 (100.0%) | $70,000 |
Occupancy by Householder Income Bracket in Whitesville
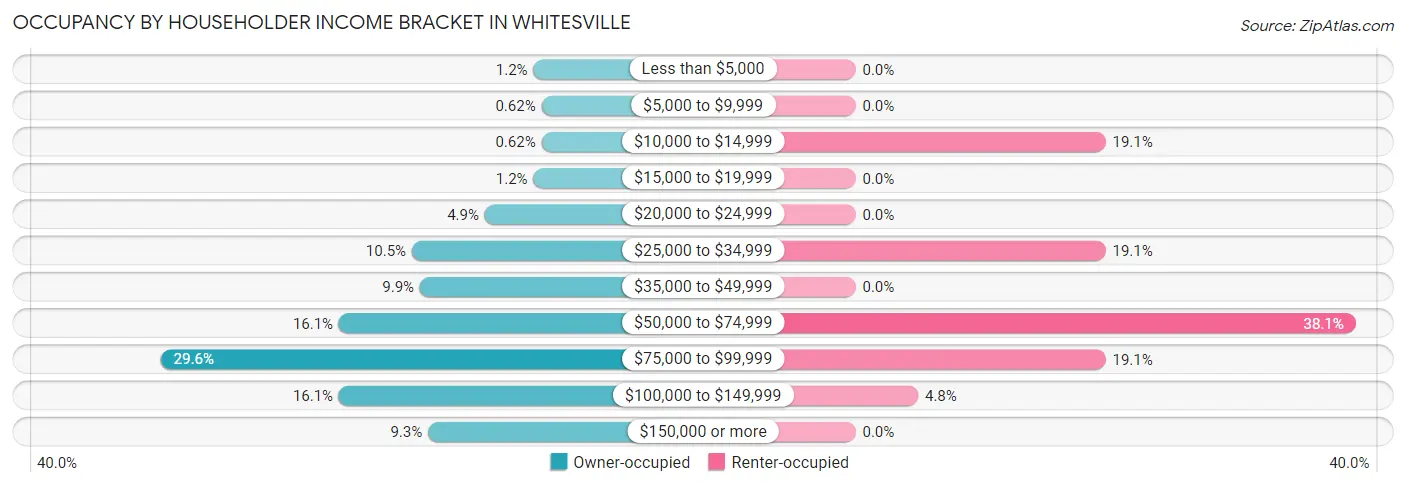
| Income Bracket | Owner-occupied | Renter-occupied |
| Less than $5,000 | 2 (1.2%) | 0 (0.0%) |
| $5,000 to $9,999 | 1 (0.6%) | 0 (0.0%) |
| $10,000 to $14,999 | 1 (0.6%) | 8 (19.1%) |
| $15,000 to $19,999 | 2 (1.2%) | 0 (0.0%) |
| $20,000 to $24,999 | 8 (4.9%) | 0 (0.0%) |
| $25,000 to $34,999 | 17 (10.5%) | 8 (19.1%) |
| $35,000 to $49,999 | 16 (9.9%) | 0 (0.0%) |
| $50,000 to $74,999 | 26 (16.1%) | 16 (38.1%) |
| $75,000 to $99,999 | 48 (29.6%) | 8 (19.1%) |
| $100,000 to $149,999 | 26 (16.1%) | 2 (4.8%) |
| $150,000 or more | 15 (9.3%) | 0 (0.0%) |
| Total | 162 (100.0%) | 42 (100.0%) |
Monthly Housing Cost Tiers in Whitesville
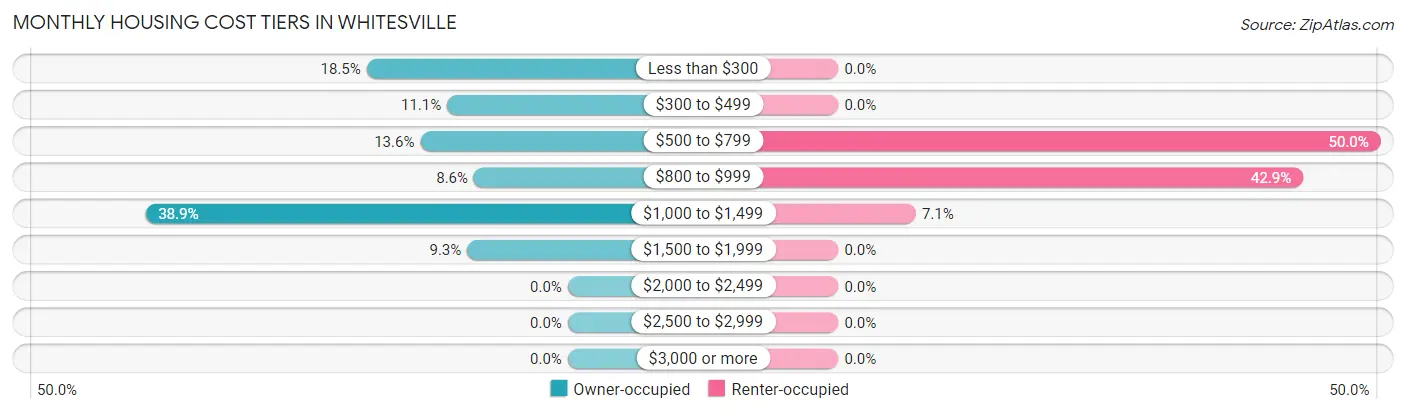
| Monthly Cost | Owner-occupied | Renter-occupied |
| Less than $300 | 30 (18.5%) | 0 (0.0%) |
| $300 to $499 | 18 (11.1%) | 0 (0.0%) |
| $500 to $799 | 22 (13.6%) | 21 (50.0%) |
| $800 to $999 | 14 (8.6%) | 18 (42.9%) |
| $1,000 to $1,499 | 63 (38.9%) | 3 (7.1%) |
| $1,500 to $1,999 | 15 (9.3%) | 0 (0.0%) |
| $2,000 to $2,499 | 0 (0.0%) | 0 (0.0%) |
| $2,500 to $2,999 | 0 (0.0%) | 0 (0.0%) |
| $3,000 or more | 0 (0.0%) | 0 (0.0%) |
| Total | 162 (100.0%) | 42 (100.0%) |
Physical Housing Characteristics in Whitesville
Housing Structures in Whitesville
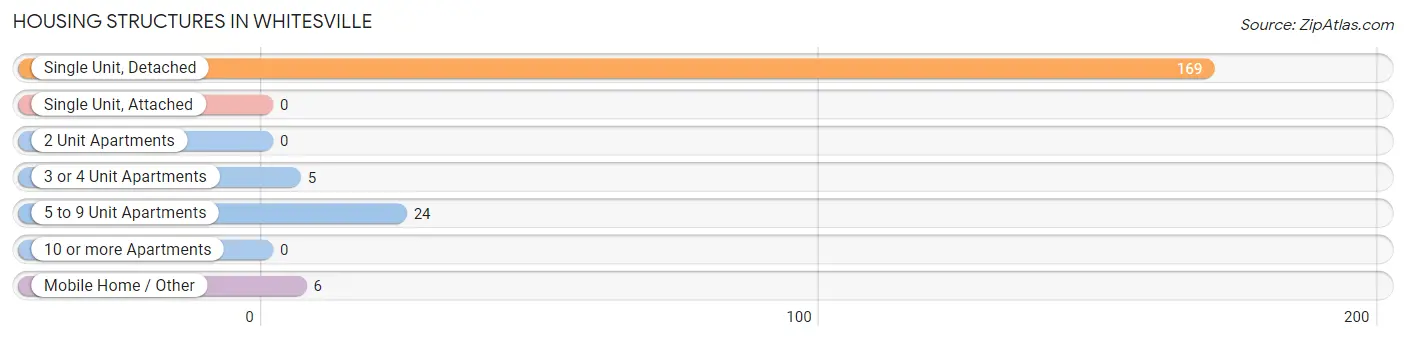
| Structure Type | # Housing Units | % Housing Units |
| Single Unit, Detached | 169 | 82.8% |
| Single Unit, Attached | 0 | 0.0% |
| 2 Unit Apartments | 0 | 0.0% |
| 3 or 4 Unit Apartments | 5 | 2.5% |
| 5 to 9 Unit Apartments | 24 | 11.8% |
| 10 or more Apartments | 0 | 0.0% |
| Mobile Home / Other | 6 | 2.9% |
| Total | 204 | 100.0% |
Housing Structures by Occupancy in Whitesville
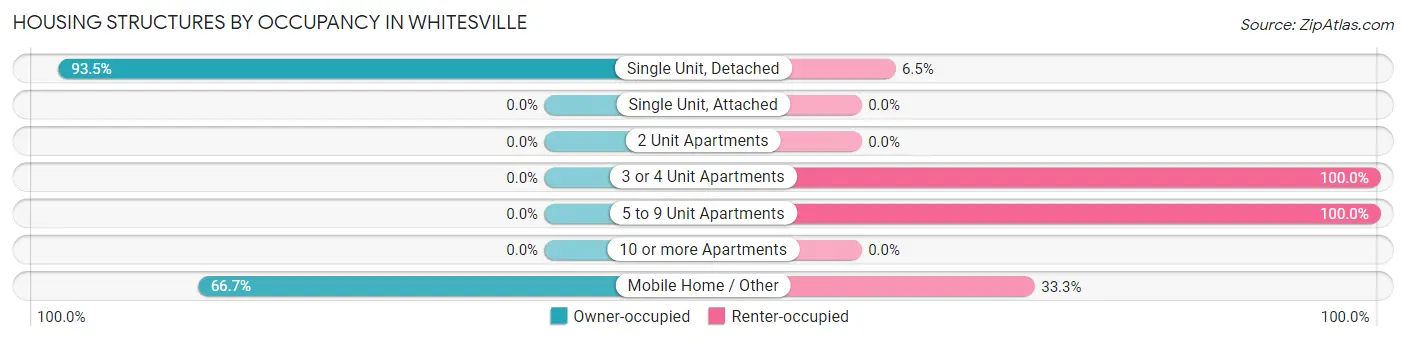
| Structure Type | Owner-occupied | Renter-occupied |
| Single Unit, Detached | 158 (93.5%) | 11 (6.5%) |
| Single Unit, Attached | 0 (0.0%) | 0 (0.0%) |
| 2 Unit Apartments | 0 (0.0%) | 0 (0.0%) |
| 3 or 4 Unit Apartments | 0 (0.0%) | 5 (100.0%) |
| 5 to 9 Unit Apartments | 0 (0.0%) | 24 (100.0%) |
| 10 or more Apartments | 0 (0.0%) | 0 (0.0%) |
| Mobile Home / Other | 4 (66.7%) | 2 (33.3%) |
| Total | 162 (79.4%) | 42 (20.6%) |
Housing Structures by Number of Rooms in Whitesville
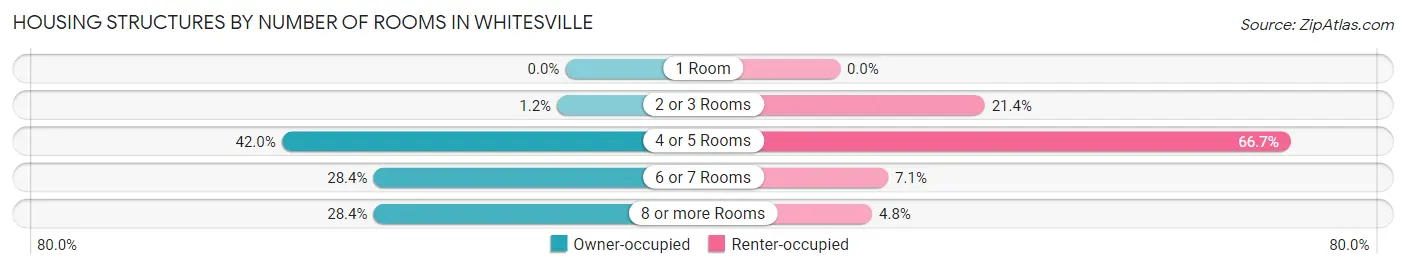
| Number of Rooms | Owner-occupied | Renter-occupied |
| 1 Room | 0 (0.0%) | 0 (0.0%) |
| 2 or 3 Rooms | 2 (1.2%) | 9 (21.4%) |
| 4 or 5 Rooms | 68 (42.0%) | 28 (66.7%) |
| 6 or 7 Rooms | 46 (28.4%) | 3 (7.1%) |
| 8 or more Rooms | 46 (28.4%) | 2 (4.8%) |
| Total | 162 (100.0%) | 42 (100.0%) |
Housing Structure by Heating Type in Whitesville
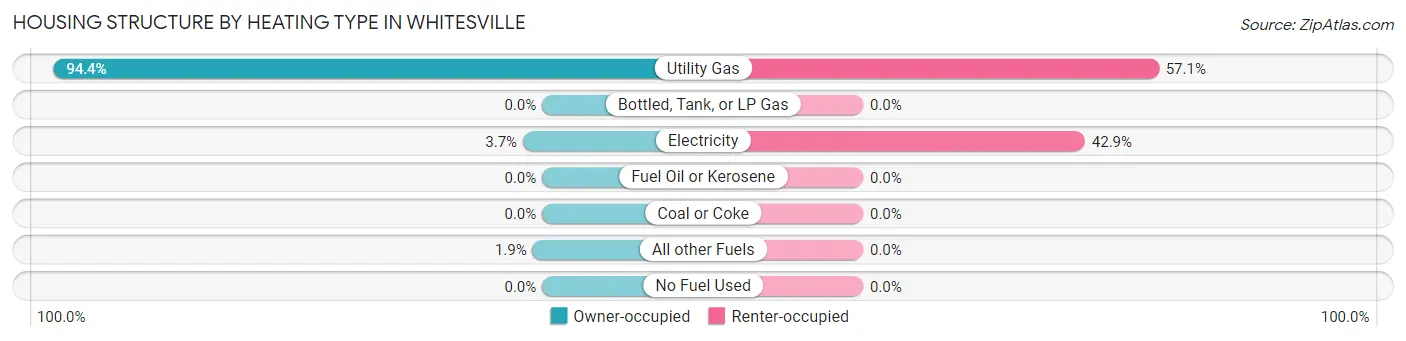
| Heating Type | Owner-occupied | Renter-occupied |
| Utility Gas | 153 (94.4%) | 24 (57.1%) |
| Bottled, Tank, or LP Gas | 0 (0.0%) | 0 (0.0%) |
| Electricity | 6 (3.7%) | 18 (42.9%) |
| Fuel Oil or Kerosene | 0 (0.0%) | 0 (0.0%) |
| Coal or Coke | 0 (0.0%) | 0 (0.0%) |
| All other Fuels | 3 (1.8%) | 0 (0.0%) |
| No Fuel Used | 0 (0.0%) | 0 (0.0%) |
| Total | 162 (100.0%) | 42 (100.0%) |
Household Vehicle Usage in Whitesville
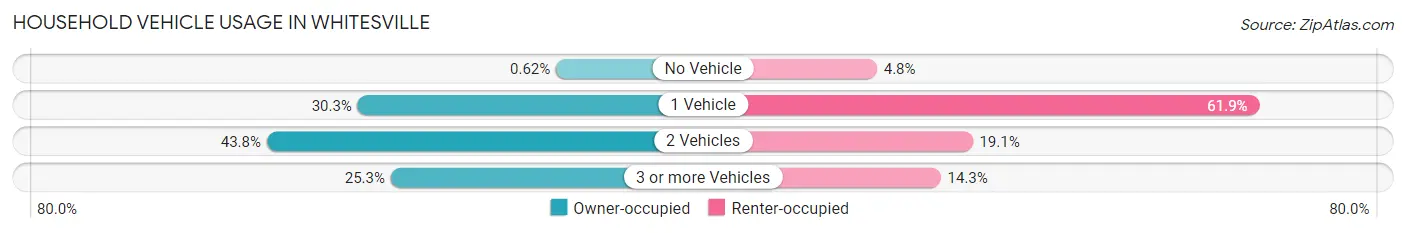
| Vehicles per Household | Owner-occupied | Renter-occupied |
| No Vehicle | 1 (0.6%) | 2 (4.8%) |
| 1 Vehicle | 49 (30.2%) | 26 (61.9%) |
| 2 Vehicles | 71 (43.8%) | 8 (19.1%) |
| 3 or more Vehicles | 41 (25.3%) | 6 (14.3%) |
| Total | 162 (100.0%) | 42 (100.0%) |
Real Estate & Mortgages in Whitesville
Real Estate and Mortgage Overview in Whitesville
| Characteristic | Without Mortgage | With Mortgage |
| Housing Units | 54 | 108 |
| Median Property Value | $90,000 | $143,500 |
| Median Household Income | $51,667 | $0 |
| Monthly Housing Costs | $285 | $0 |
| Real Estate Taxes | $643 | $0 |
Property Value by Mortgage Status in Whitesville
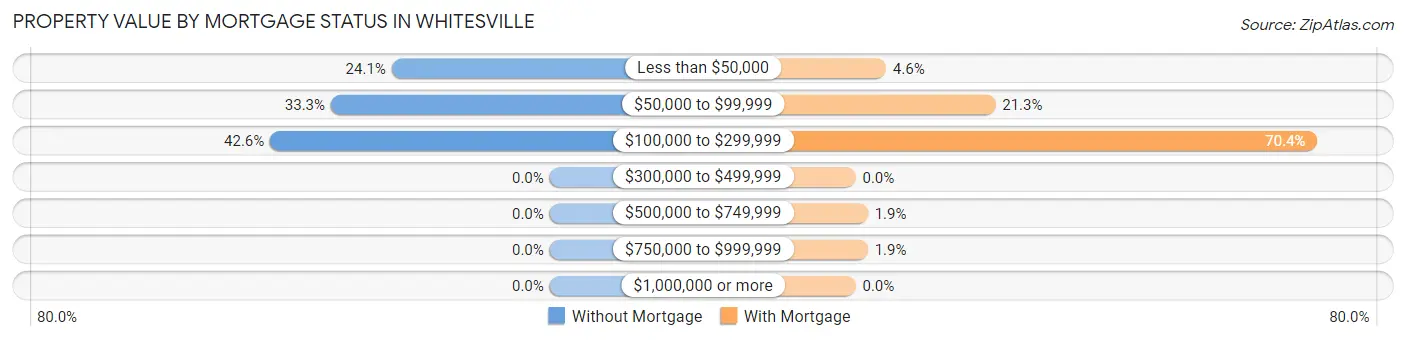
| Property Value | Without Mortgage | With Mortgage |
| Less than $50,000 | 13 (24.1%) | 5 (4.6%) |
| $50,000 to $99,999 | 18 (33.3%) | 23 (21.3%) |
| $100,000 to $299,999 | 23 (42.6%) | 76 (70.4%) |
| $300,000 to $499,999 | 0 (0.0%) | 0 (0.0%) |
| $500,000 to $749,999 | 0 (0.0%) | 2 (1.8%) |
| $750,000 to $999,999 | 0 (0.0%) | 2 (1.8%) |
| $1,000,000 or more | 0 (0.0%) | 0 (0.0%) |
| Total | 54 (100.0%) | 108 (100.0%) |
Household Income by Mortgage Status in Whitesville
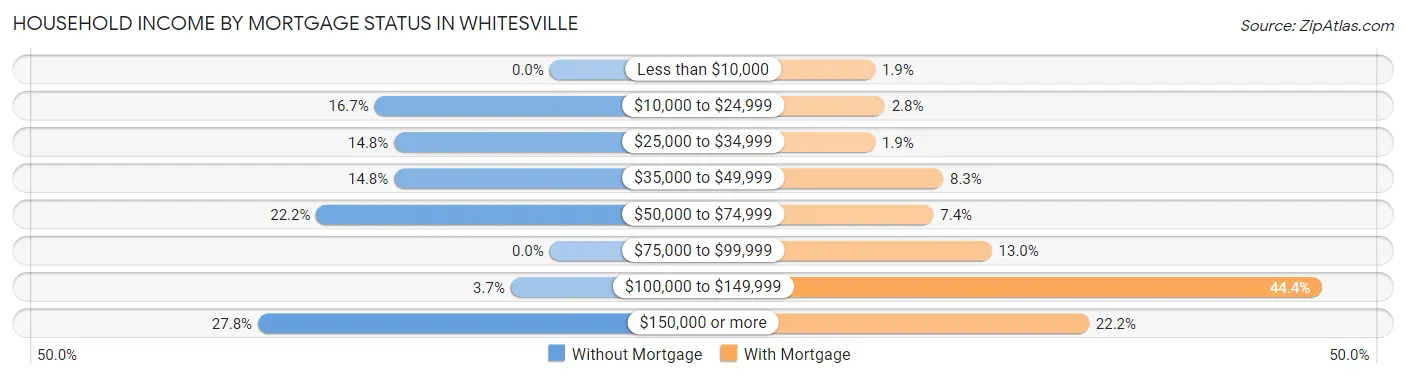
| Household Income | Without Mortgage | With Mortgage |
| Less than $10,000 | 0 (0.0%) | 2 (1.8%) |
| $10,000 to $24,999 | 9 (16.7%) | 3 (2.8%) |
| $25,000 to $34,999 | 8 (14.8%) | 2 (1.8%) |
| $35,000 to $49,999 | 8 (14.8%) | 9 (8.3%) |
| $50,000 to $74,999 | 12 (22.2%) | 8 (7.4%) |
| $75,000 to $99,999 | 0 (0.0%) | 14 (13.0%) |
| $100,000 to $149,999 | 2 (3.7%) | 48 (44.4%) |
| $150,000 or more | 15 (27.8%) | 24 (22.2%) |
| Total | 54 (100.0%) | 108 (100.0%) |
Property Value to Household Income Ratio in Whitesville
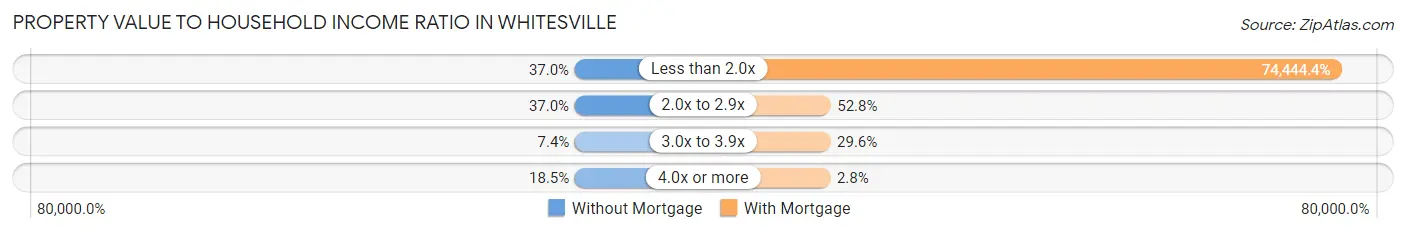
| Value-to-Income Ratio | Without Mortgage | With Mortgage |
| Less than 2.0x | 20 (37.0%) | 80,400 (74,444.4%) |
| 2.0x to 2.9x | 20 (37.0%) | 57 (52.8%) |
| 3.0x to 3.9x | 4 (7.4%) | 32 (29.6%) |
| 4.0x or more | 10 (18.5%) | 3 (2.8%) |
| Total | 54 (100.0%) | 108 (100.0%) |
Real Estate Taxes by Mortgage Status in Whitesville
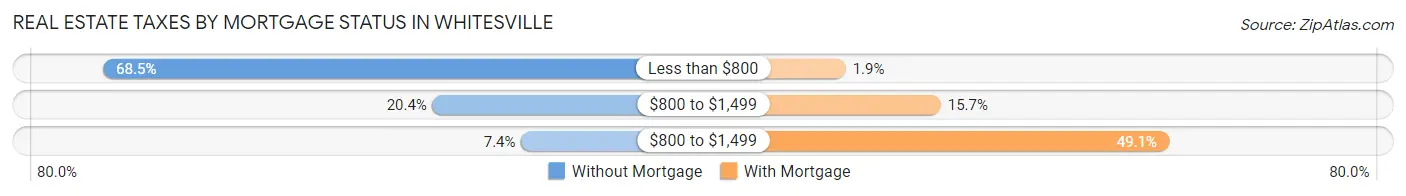
| Property Taxes | Without Mortgage | With Mortgage |
| Less than $800 | 37 (68.5%) | 2 (1.8%) |
| $800 to $1,499 | 11 (20.4%) | 17 (15.7%) |
| $800 to $1,499 | 4 (7.4%) | 53 (49.1%) |
| Total | 54 (100.0%) | 108 (100.0%) |
Health & Disability in Whitesville
Health Insurance Coverage by Age in Whitesville
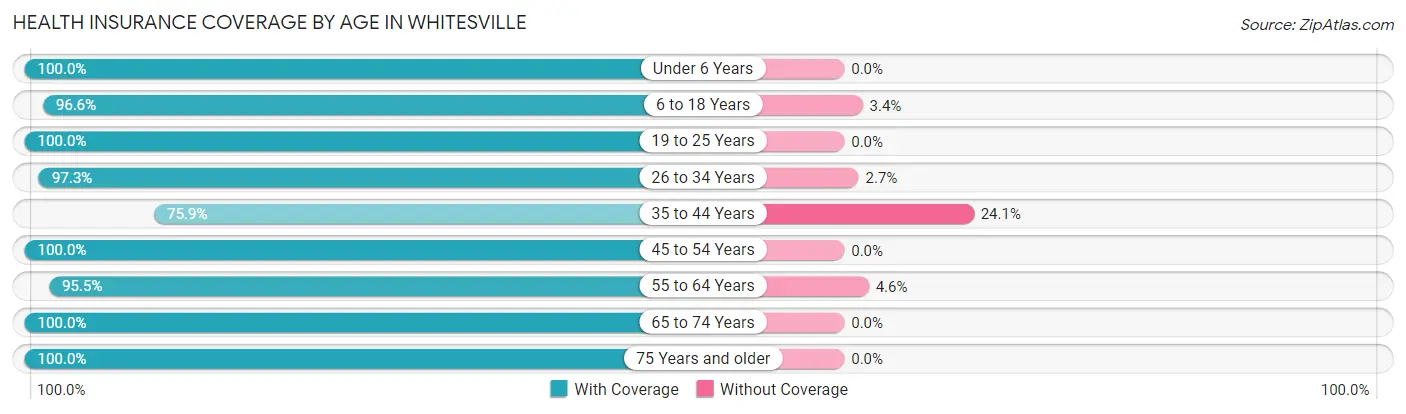
| Age Bracket | With Coverage | Without Coverage |
| Under 6 Years | 27 (100.0%) | 0 (0.0%) |
| 6 to 18 Years | 170 (96.6%) | 6 (3.4%) |
| 19 to 25 Years | 36 (100.0%) | 0 (0.0%) |
| 26 to 34 Years | 73 (97.3%) | 2 (2.7%) |
| 35 to 44 Years | 44 (75.9%) | 14 (24.1%) |
| 45 to 54 Years | 78 (100.0%) | 0 (0.0%) |
| 55 to 64 Years | 42 (95.5%) | 2 (4.5%) |
| 65 to 74 Years | 41 (100.0%) | 0 (0.0%) |
| 75 Years and older | 34 (100.0%) | 0 (0.0%) |
| Total | 545 (95.8%) | 24 (4.2%) |
Health Insurance Coverage by Citizenship Status in Whitesville
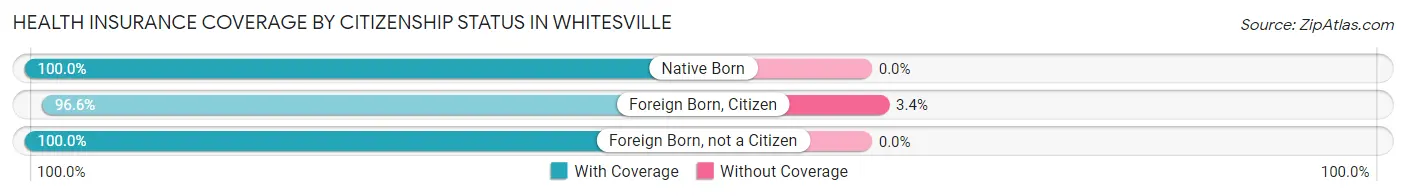
| Citizenship Status | With Coverage | Without Coverage |
| Native Born | 27 (100.0%) | 0 (0.0%) |
| Foreign Born, Citizen | 170 (96.6%) | 6 (3.4%) |
| Foreign Born, not a Citizen | 36 (100.0%) | 0 (0.0%) |
Health Insurance Coverage by Household Income in Whitesville
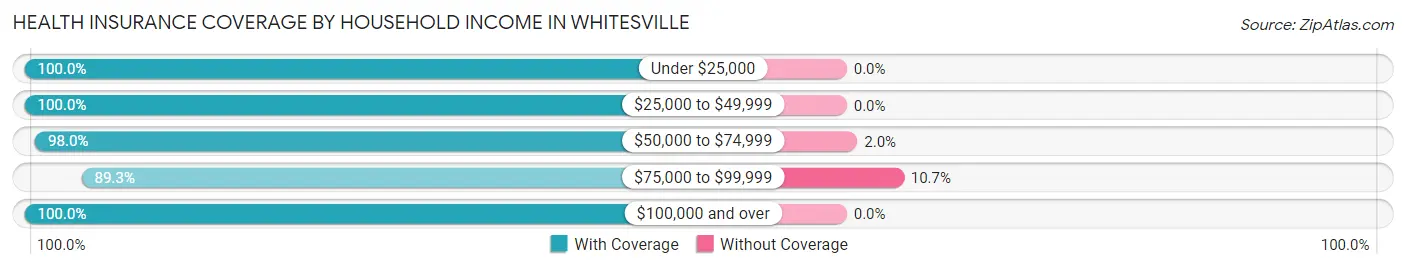
| Household Income | With Coverage | Without Coverage |
| Under $25,000 | 30 (100.0%) | 0 (0.0%) |
| $25,000 to $49,999 | 77 (100.0%) | 0 (0.0%) |
| $50,000 to $74,999 | 99 (98.0%) | 2 (2.0%) |
| $75,000 to $99,999 | 184 (89.3%) | 22 (10.7%) |
| $100,000 and over | 155 (100.0%) | 0 (0.0%) |
Public vs Private Health Insurance Coverage by Age in Whitesville
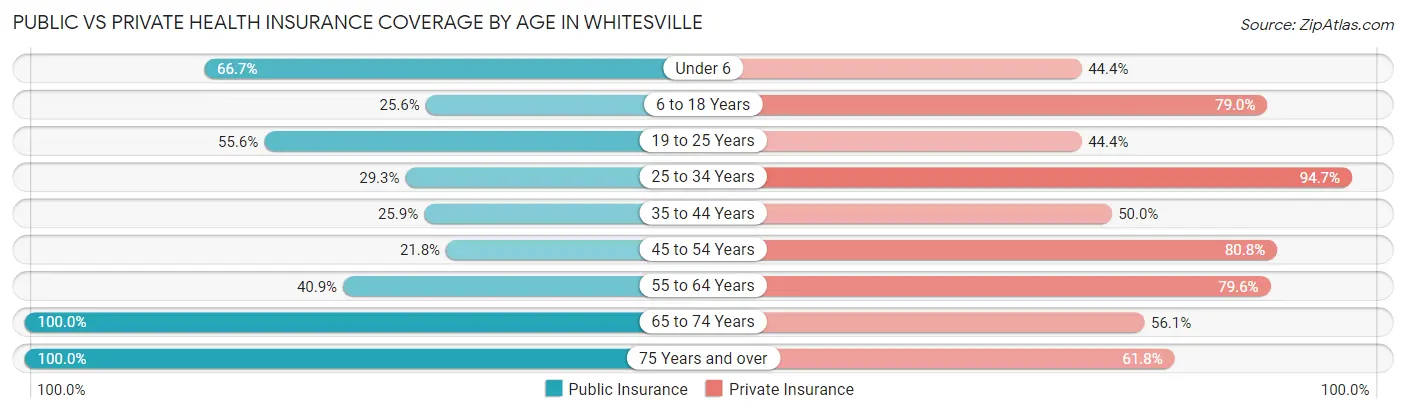
| Age Bracket | Public Insurance | Private Insurance |
| Under 6 | 18 (66.7%) | 12 (44.4%) |
| 6 to 18 Years | 45 (25.6%) | 139 (79.0%) |
| 19 to 25 Years | 20 (55.6%) | 16 (44.4%) |
| 25 to 34 Years | 22 (29.3%) | 71 (94.7%) |
| 35 to 44 Years | 15 (25.9%) | 29 (50.0%) |
| 45 to 54 Years | 17 (21.8%) | 63 (80.8%) |
| 55 to 64 Years | 18 (40.9%) | 35 (79.5%) |
| 65 to 74 Years | 41 (100.0%) | 23 (56.1%) |
| 75 Years and over | 34 (100.0%) | 21 (61.8%) |
| Total | 230 (40.4%) | 409 (71.9%) |
Disability Status by Sex by Age in Whitesville
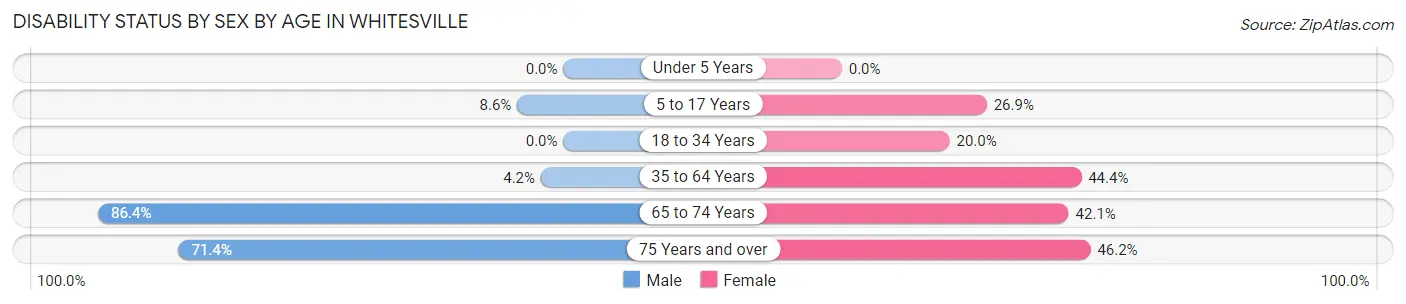
| Age Bracket | Male | Female |
| Under 5 Years | 0 (0.0%) | 0 (0.0%) |
| 5 to 17 Years | 3 (8.6%) | 39 (26.9%) |
| 18 to 34 Years | 0 (0.0%) | 14 (20.0%) |
| 35 to 64 Years | 3 (4.2%) | 48 (44.4%) |
| 65 to 74 Years | 19 (86.4%) | 8 (42.1%) |
| 75 Years and over | 15 (71.4%) | 6 (46.2%) |
Disability Class by Sex by Age in Whitesville
Disability Class: Hearing Difficulty
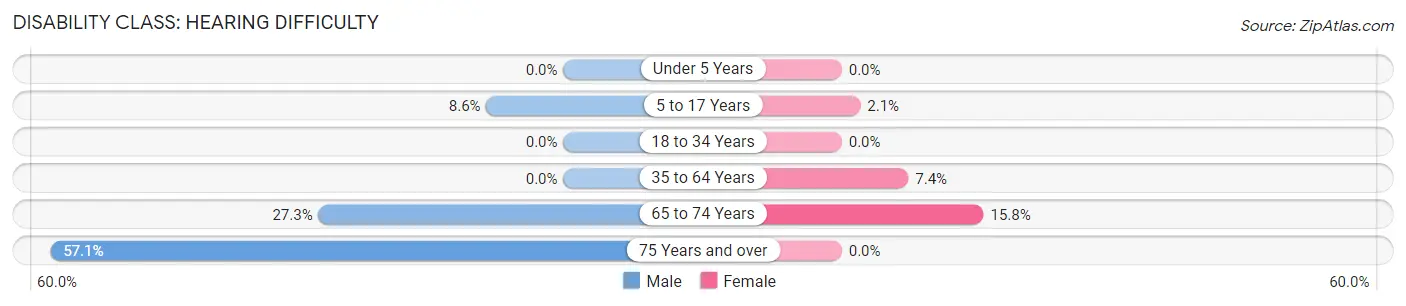
| Age Bracket | Male | Female |
| Under 5 Years | 0 (0.0%) | 0 (0.0%) |
| 5 to 17 Years | 3 (8.6%) | 3 (2.1%) |
| 18 to 34 Years | 0 (0.0%) | 0 (0.0%) |
| 35 to 64 Years | 0 (0.0%) | 8 (7.4%) |
| 65 to 74 Years | 6 (27.3%) | 3 (15.8%) |
| 75 Years and over | 12 (57.1%) | 0 (0.0%) |
Disability Class: Vision Difficulty
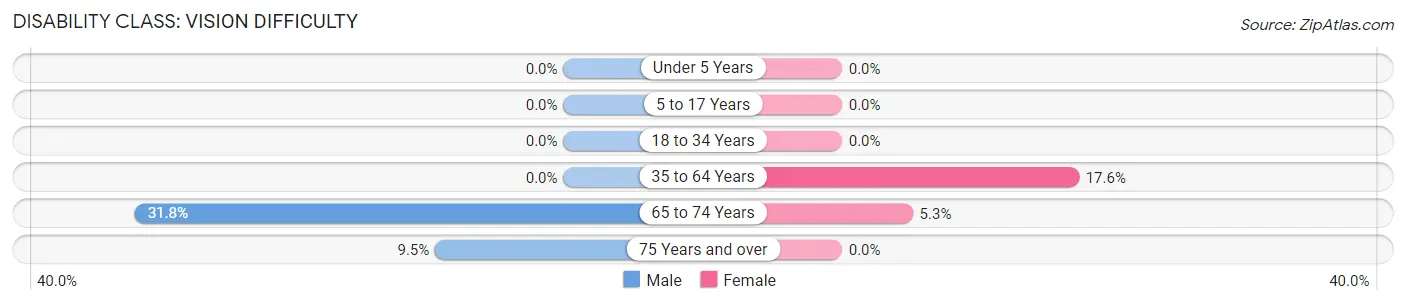
| Age Bracket | Male | Female |
| Under 5 Years | 0 (0.0%) | 0 (0.0%) |
| 5 to 17 Years | 0 (0.0%) | 0 (0.0%) |
| 18 to 34 Years | 0 (0.0%) | 0 (0.0%) |
| 35 to 64 Years | 0 (0.0%) | 19 (17.6%) |
| 65 to 74 Years | 7 (31.8%) | 1 (5.3%) |
| 75 Years and over | 2 (9.5%) | 0 (0.0%) |
Disability Class: Cognitive Difficulty
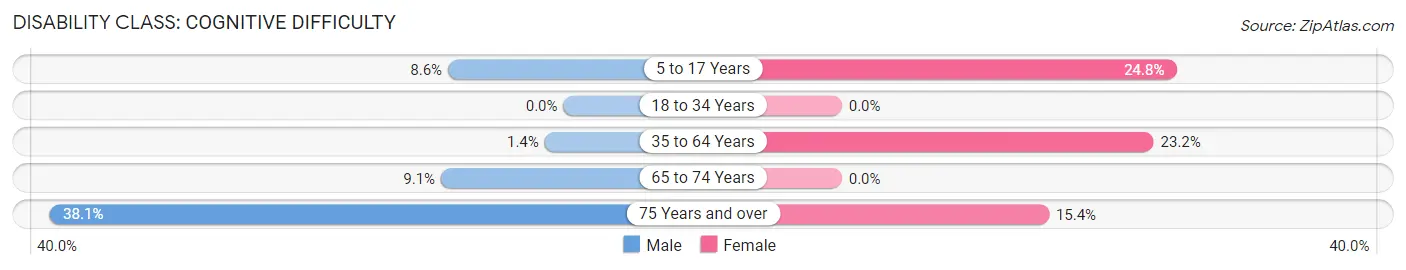
| Age Bracket | Male | Female |
| 5 to 17 Years | 3 (8.6%) | 36 (24.8%) |
| 18 to 34 Years | 0 (0.0%) | 0 (0.0%) |
| 35 to 64 Years | 1 (1.4%) | 25 (23.2%) |
| 65 to 74 Years | 2 (9.1%) | 0 (0.0%) |
| 75 Years and over | 8 (38.1%) | 2 (15.4%) |
Disability Class: Ambulatory Difficulty
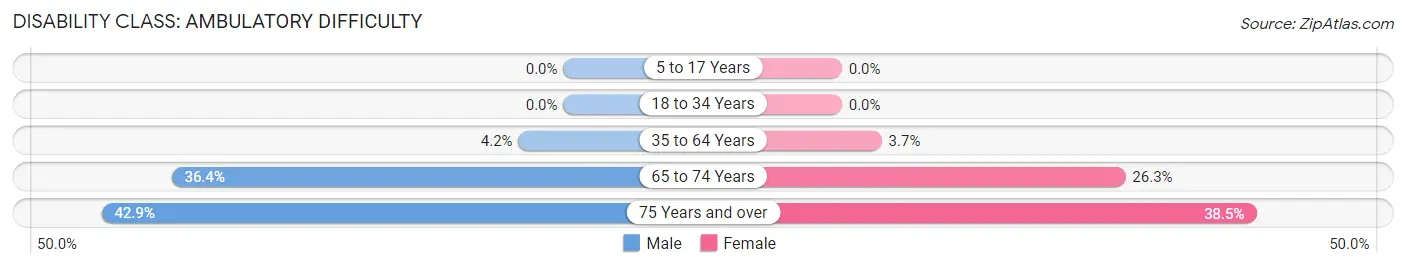
| Age Bracket | Male | Female |
| 5 to 17 Years | 0 (0.0%) | 0 (0.0%) |
| 18 to 34 Years | 0 (0.0%) | 0 (0.0%) |
| 35 to 64 Years | 3 (4.2%) | 4 (3.7%) |
| 65 to 74 Years | 8 (36.4%) | 5 (26.3%) |
| 75 Years and over | 9 (42.9%) | 5 (38.5%) |
Disability Class: Self-Care Difficulty
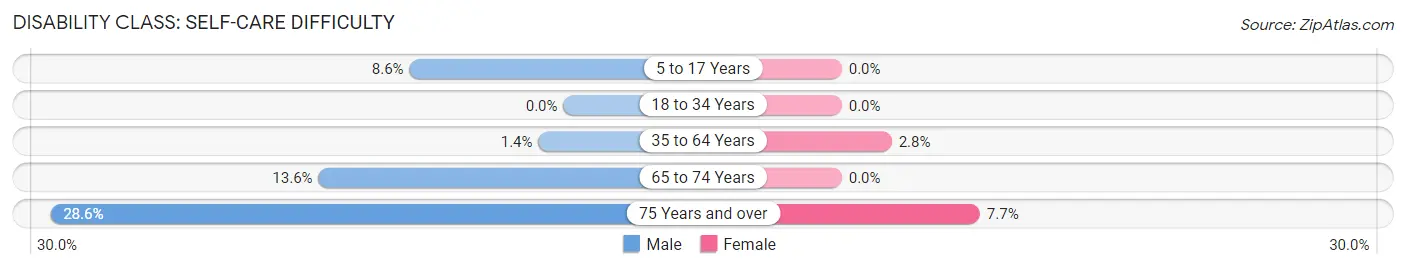
| Age Bracket | Male | Female |
| 5 to 17 Years | 3 (8.6%) | 0 (0.0%) |
| 18 to 34 Years | 0 (0.0%) | 0 (0.0%) |
| 35 to 64 Years | 1 (1.4%) | 3 (2.8%) |
| 65 to 74 Years | 3 (13.6%) | 0 (0.0%) |
| 75 Years and over | 6 (28.6%) | 1 (7.7%) |
Technology Access in Whitesville
Computing Device Access in Whitesville
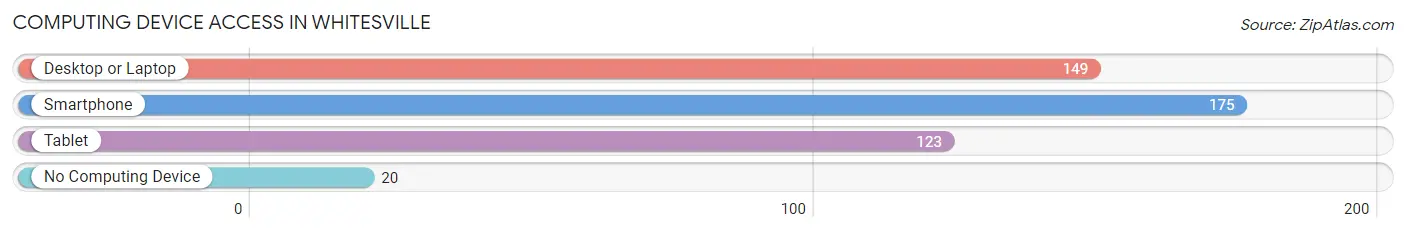
| Device Type | # Households | % Households |
| Desktop or Laptop | 149 | 73.0% |
| Smartphone | 175 | 85.8% |
| Tablet | 123 | 60.3% |
| No Computing Device | 20 | 9.8% |
| Total | 204 | 100.0% |
Internet Access in Whitesville
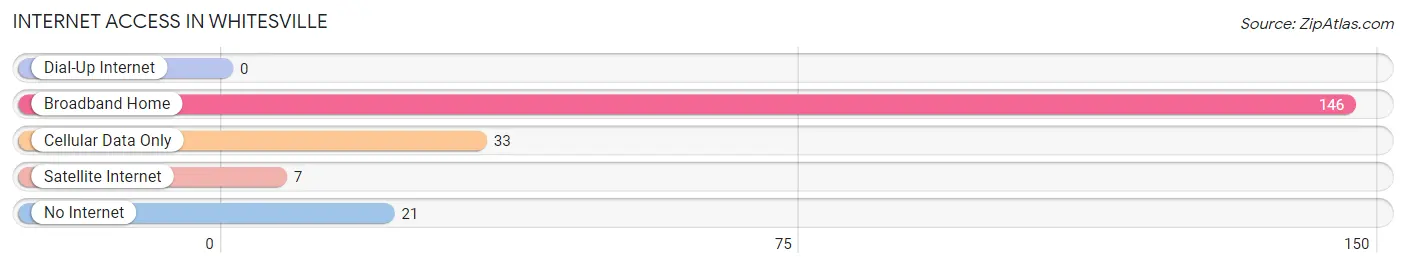
| Internet Type | # Households | % Households |
| Dial-Up Internet | 0 | 0.0% |
| Broadband Home | 146 | 71.6% |
| Cellular Data Only | 33 | 16.2% |
| Satellite Internet | 7 | 3.4% |
| No Internet | 21 | 10.3% |
| Total | 204 | 100.0% |
Whitesville Summary
Whitesville is a small unincorporated community located in Daviess County, Kentucky. It is situated on the banks of the Ohio River, approximately 10 miles south of Owensboro. The population of Whitesville was estimated to be around 1,000 in 2020.
History
Whitesville was founded in 1818 by William White, a Revolutionary War veteran. White was a farmer and a blacksmith who had moved to the area from Virginia. He purchased a large tract of land and built a log cabin on the banks of the Ohio River. The town was named after him and was originally known as White’s Landing.
The town grew slowly but steadily over the years, and by the mid-1800s, it had become a thriving river port. The town was home to several businesses, including a sawmill, a gristmill, a blacksmith shop, and a general store. The town also had a post office, a school, and a church.
In the late 1800s, the railroad came to Whitesville, connecting it to the larger cities of Owensboro and Henderson. This allowed the town to grow even more, and by the early 1900s, it had become a bustling community.
Geography
Whitesville is located in the western part of Daviess County, Kentucky. It is situated on the banks of the Ohio River, approximately 10 miles south of Owensboro. The town is surrounded by rolling hills and farmland, and the climate is generally mild and humid.
The town is served by two major highways, US Route 231 and Kentucky Route 54. The nearest airport is Owensboro-Daviess County Regional Airport, located about 15 miles away.
Economy
Whitesville’s economy is largely based on agriculture and tourism. The town is home to several farms, which produce a variety of crops, including corn, soybeans, and wheat. The town is also home to several tourist attractions, including the Whitesville Historical Museum and the Whitesville Riverfront Park.
The town is also home to several small businesses, including restaurants, convenience stores, and gas stations. The town is served by several banks, including the Bank of Whitesville and the First National Bank of Whitesville.
Demographics
As of the 2020 census, the population of Whitesville was estimated to be around 1,000. The racial makeup of the town was 97.2% White, 0.7% African American, 0.3% Native American, 0.2% Asian, and 1.6% from other races. The median household income was $37,500, and the median home value was $90,000.
Conclusion
Whitesville is a small unincorporated community located in Daviess County, Kentucky. It is situated on the banks of the Ohio River, approximately 10 miles south of Owensboro. The town has a rich history and is home to several tourist attractions, farms, and small businesses. The population of Whitesville was estimated to be around 1,000 in 2020, and the town’s economy is largely based on agriculture and tourism.
Common Questions
What is Per Capita Income in Whitesville?
Per Capita income in Whitesville is $27,065.
What is the Median Family Income in Whitesville?
Median Family Income in Whitesville is $80,694.
What is the Median Household income in Whitesville?
Median Household Income in Whitesville is $70,000.
What is Income or Wage Gap in Whitesville?
Income or Wage Gap in Whitesville is 13.2%.
Women in Whitesville earn 86.8 cents for every dollar earned by a man.
What is Inequality or Gini Index in Whitesville?
Inequality or Gini Index in Whitesville is 0.33.
What is the Total Population of Whitesville?
Total Population of Whitesville is 570.
What is the Total Male Population of Whitesville?
Total Male Population of Whitesville is 200.
What is the Total Female Population of Whitesville?
Total Female Population of Whitesville is 370.
What is the Ratio of Males per 100 Females in Whitesville?
There are 54.05 Males per 100 Females in Whitesville.
What is the Ratio of Females per 100 Males in Whitesville?
There are 185.00 Females per 100 Males in Whitesville.
What is the Median Population Age in Whitesville?
Median Population Age in Whitesville is 32.5 Years.
What is the Average Family Size in Whitesville
Average Family Size in Whitesville is 3.5 People.
What is the Average Household Size in Whitesville
Average Household Size in Whitesville is 2.8 People.
How Large is the Labor Force in Whitesville?
There are 225 People in the Labor Forcein in Whitesville.
What is the Percentage of People in the Labor Force in Whitesville?
54.5% of People are in the Labor Force in Whitesville.
What is the Unemployment Rate in Whitesville?
Unemployment Rate in Whitesville is 0.9%.