Hebron Estates, KY Map & Demographics
Hebron Estates Map
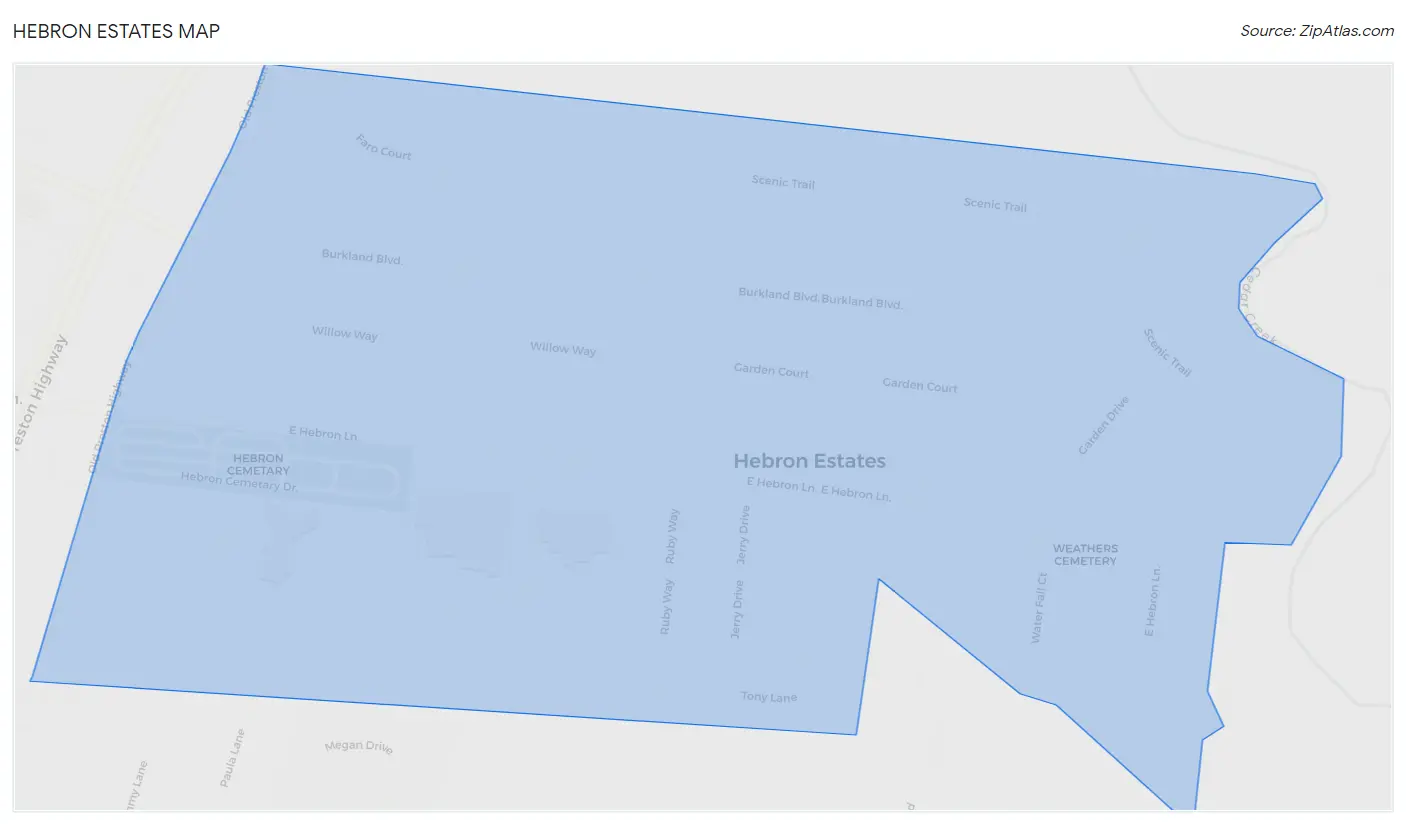
Hebron Estates Overview
$38,127
PER CAPITA INCOME
$73,618
AVG FAMILY INCOME
$53,929
AVG HOUSEHOLD INCOME
45.5%
WAGE / INCOME GAP [ % ]
54.5¢/ $1
WAGE / INCOME GAP [ $ ]
0.47
INEQUALITY / GINI INDEX
1,308
TOTAL POPULATION
667
MALE POPULATION
641
FEMALE POPULATION
104.06
MALES / 100 FEMALES
96.10
FEMALES / 100 MALES
52.2
MEDIAN AGE
2.7
AVG FAMILY SIZE
2.3
AVG HOUSEHOLD SIZE
716
LABOR FORCE [ PEOPLE ]
64.1%
PERCENT IN LABOR FORCE
13.1%
UNEMPLOYMENT RATE
Hebron Estates Area Codes
Income in Hebron Estates
Income Overview in Hebron Estates
Per Capita Income in Hebron Estates is $38,127, while median incomes of families and households are $73,618 and $53,929 respectively.
| Characteristic | Number | Measure |
| Per Capita Income | 1,308 | $38,127 |
| Median Family Income | 409 | $73,618 |
| Mean Family Income | 409 | $100,663 |
| Median Household Income | 576 | $53,929 |
| Mean Household Income | 576 | $84,862 |
| Income Deficit | 409 | $0 |
| Wage / Income Gap (%) | 1,308 | 45.47% |
| Wage / Income Gap ($) | 1,308 | 54.53¢ per $1 |
| Gini / Inequality Index | 1,308 | 0.47 |
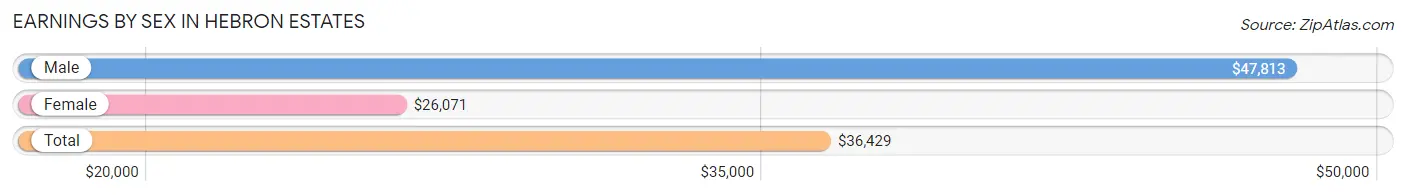
Earnings by Sex in Hebron Estates
Average Earnings in Hebron Estates are $36,429, $47,813 for men and $26,071 for women, a difference of 45.5%.
| Sex | Number | Average Earnings |
| Male | 404 (56.7%) | $47,813 |
| Female | 308 (43.3%) | $26,071 |
| Total | 712 (100.0%) | $36,429 |
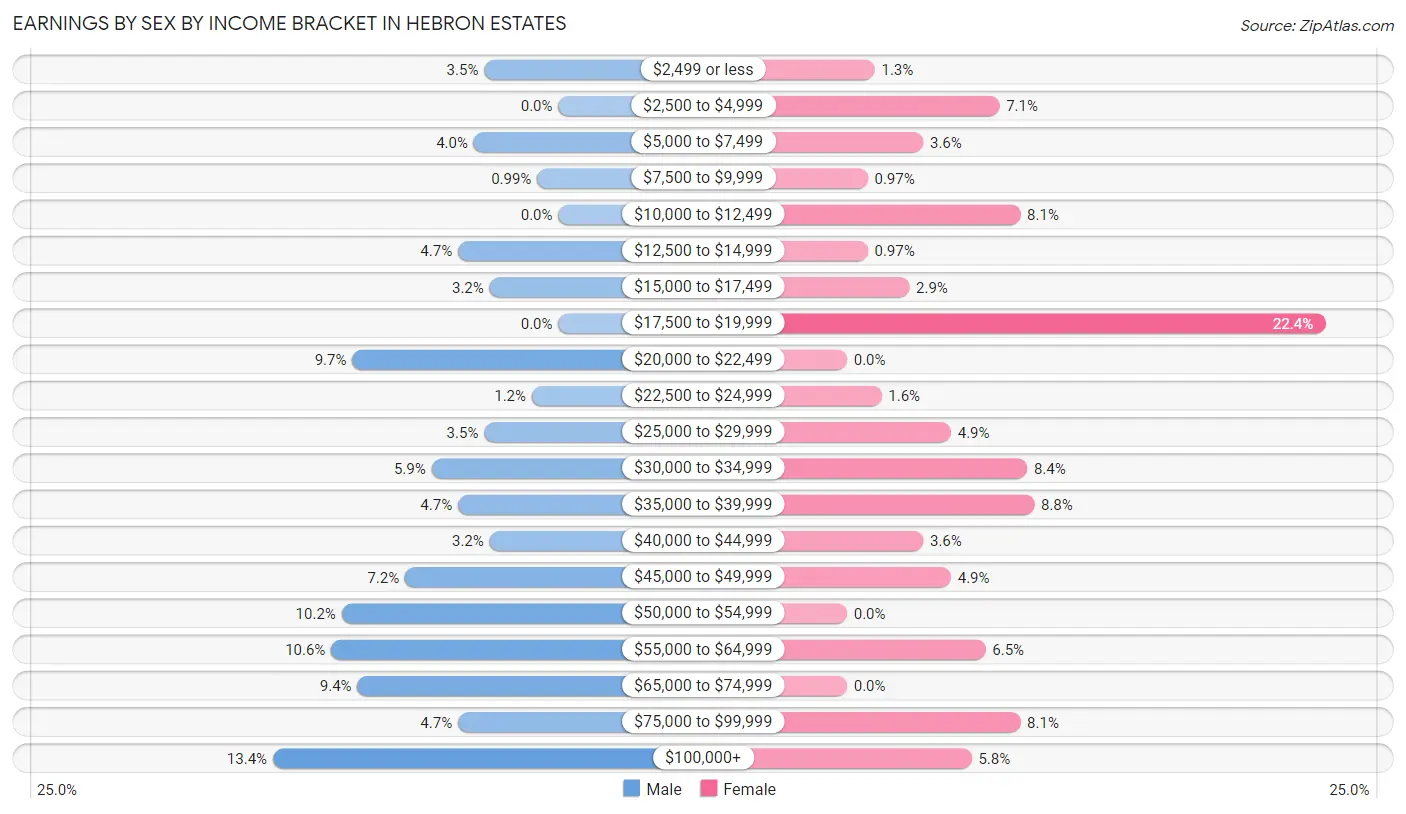
Earnings by Sex by Income Bracket in Hebron Estates
The most common earnings brackets in Hebron Estates are $100,000+ for men (54 | 13.4%) and $17,500 to $19,999 for women (69 | 22.4%).
| Income | Male | Female |
| $2,499 or less | 14 (3.5%) | 4 (1.3%) |
| $2,500 to $4,999 | 0 (0.0%) | 22 (7.1%) |
| $5,000 to $7,499 | 16 (4.0%) | 11 (3.6%) |
| $7,500 to $9,999 | 4 (1.0%) | 3 (1.0%) |
| $10,000 to $12,499 | 0 (0.0%) | 25 (8.1%) |
| $12,500 to $14,999 | 19 (4.7%) | 3 (1.0%) |
| $15,000 to $17,499 | 13 (3.2%) | 9 (2.9%) |
| $17,500 to $19,999 | 0 (0.0%) | 69 (22.4%) |
| $20,000 to $22,499 | 39 (9.7%) | 0 (0.0%) |
| $22,500 to $24,999 | 5 (1.2%) | 5 (1.6%) |
| $25,000 to $29,999 | 14 (3.5%) | 15 (4.9%) |
| $30,000 to $34,999 | 24 (5.9%) | 26 (8.4%) |
| $35,000 to $39,999 | 19 (4.7%) | 27 (8.8%) |
| $40,000 to $44,999 | 13 (3.2%) | 11 (3.6%) |
| $45,000 to $49,999 | 29 (7.2%) | 15 (4.9%) |
| $50,000 to $54,999 | 41 (10.2%) | 0 (0.0%) |
| $55,000 to $64,999 | 43 (10.6%) | 20 (6.5%) |
| $65,000 to $74,999 | 38 (9.4%) | 0 (0.0%) |
| $75,000 to $99,999 | 19 (4.7%) | 25 (8.1%) |
| $100,000+ | 54 (13.4%) | 18 (5.8%) |
| Total | 404 (100.0%) | 308 (100.0%) |
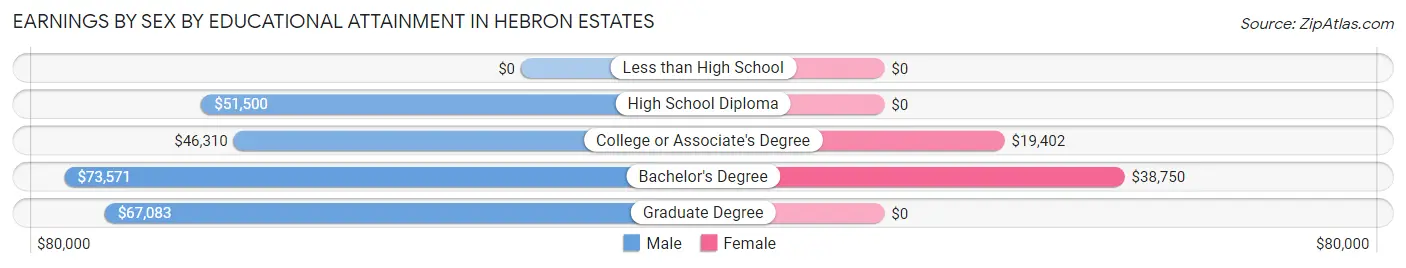
Earnings by Sex by Educational Attainment in Hebron Estates
Average earnings in Hebron Estates are $50,735 for men and $24,000 for women, a difference of 52.7%. Men with an educational attainment of bachelor's degree enjoy the highest average annual earnings of $73,571, while those with college or associate's degree education earn the least with $46,310. Women with an educational attainment of bachelor's degree earn the most with the average annual earnings of $38,750, while those with college or associate's degree education have the smallest earnings of $19,402.
| Educational Attainment | Male Income | Female Income |
| Less than High School | - | - |
| High School Diploma | $51,500 | $0 |
| College or Associate's Degree | $46,310 | $19,402 |
| Bachelor's Degree | $73,571 | $38,750 |
| Graduate Degree | $67,083 | $0 |
| Total | $50,735 | $24,000 |
Family Income in Hebron Estates
Family Income Brackets in Hebron Estates
According to the Hebron Estates family income data, there are 99 families falling into the $35,000 to $49,999 income range, which is the most common income bracket and makes up 24.2% of all families. Conversely, the $15,000 to $24,999 income bracket is the least frequent group with only 3 families (0.7%) belonging to this category.
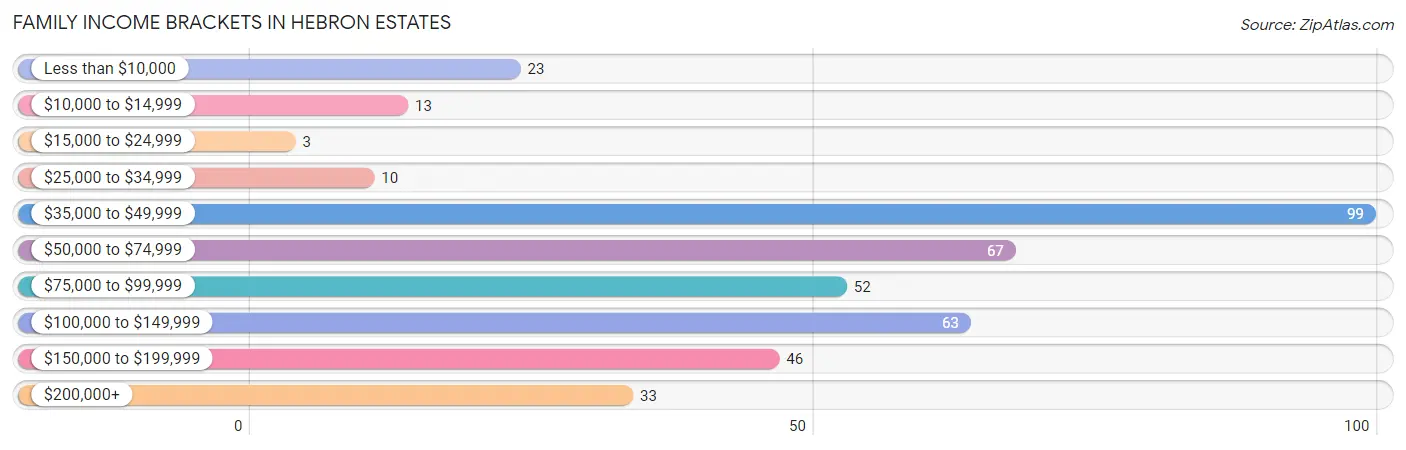
| Income Bracket | # Families | % Families |
| Less than $10,000 | 23 | 5.6% |
| $10,000 to $14,999 | 13 | 3.2% |
| $15,000 to $24,999 | 3 | 0.7% |
| $25,000 to $34,999 | 10 | 2.4% |
| $35,000 to $49,999 | 99 | 24.2% |
| $50,000 to $74,999 | 67 | 16.4% |
| $75,000 to $99,999 | 52 | 12.7% |
| $100,000 to $149,999 | 63 | 15.4% |
| $150,000 to $199,999 | 46 | 11.2% |
| $200,000+ | 33 | 8.1% |
Family Income by Famaliy Size in Hebron Estates
4-person families (40 | 9.8%) account for the highest median family income in Hebron Estates with $170,357 per family, while 4-person families (40 | 9.8%) have the highest median income of $42,589 per family member.
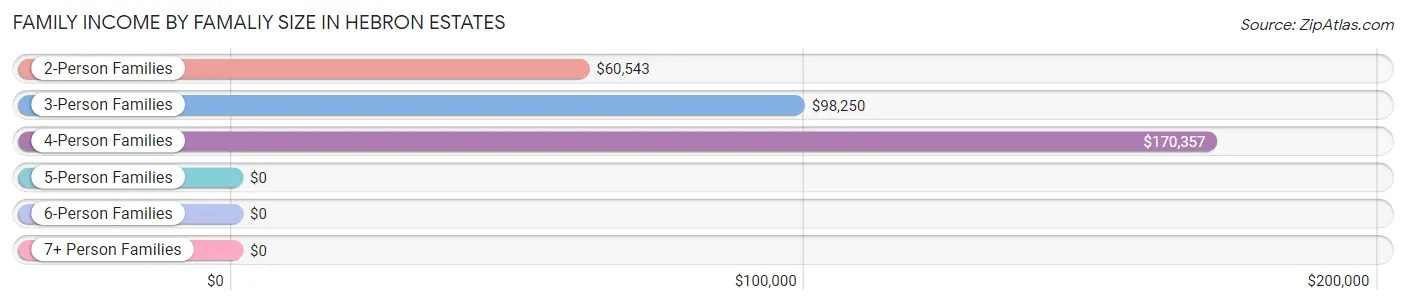
| Income Bracket | # Families | Median Income |
| 2-Person Families | 278 (68.0%) | $60,543 |
| 3-Person Families | 61 (14.9%) | $98,250 |
| 4-Person Families | 40 (9.8%) | $170,357 |
| 5-Person Families | 14 (3.4%) | $0 |
| 6-Person Families | 10 (2.4%) | $0 |
| 7+ Person Families | 6 (1.5%) | $0 |
| Total | 409 (100.0%) | $73,618 |
Family Income by Number of Earners in Hebron Estates
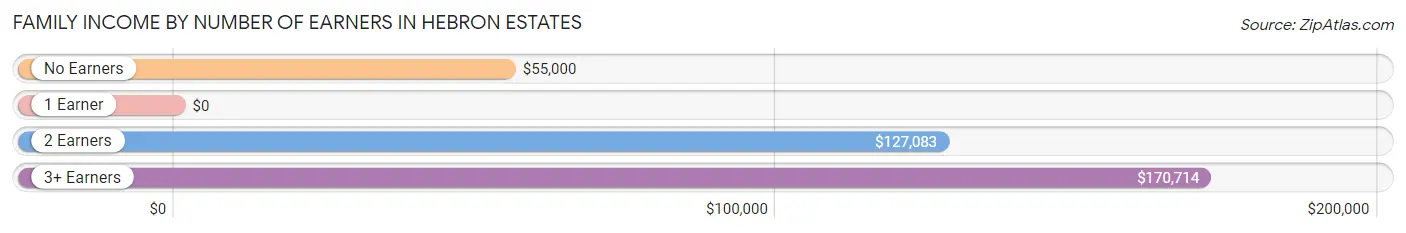
| Number of Earners | # Families | Median Income |
| No Earners | 50 (12.2%) | $55,000 |
| 1 Earner | 230 (56.2%) | $0 |
| 2 Earners | 91 (22.3%) | $127,083 |
| 3+ Earners | 38 (9.3%) | $170,714 |
| Total | 409 (100.0%) | $73,618 |
Household Income in Hebron Estates
Household Income Brackets in Hebron Estates
With 133 households falling in the category, the $35,000 to $49,999 income range is the most frequent in Hebron Estates, accounting for 23.1% of all households. In contrast, only 25 households (4.3%) fall into the $15,000 to $24,999 income bracket, making it the least populous group.
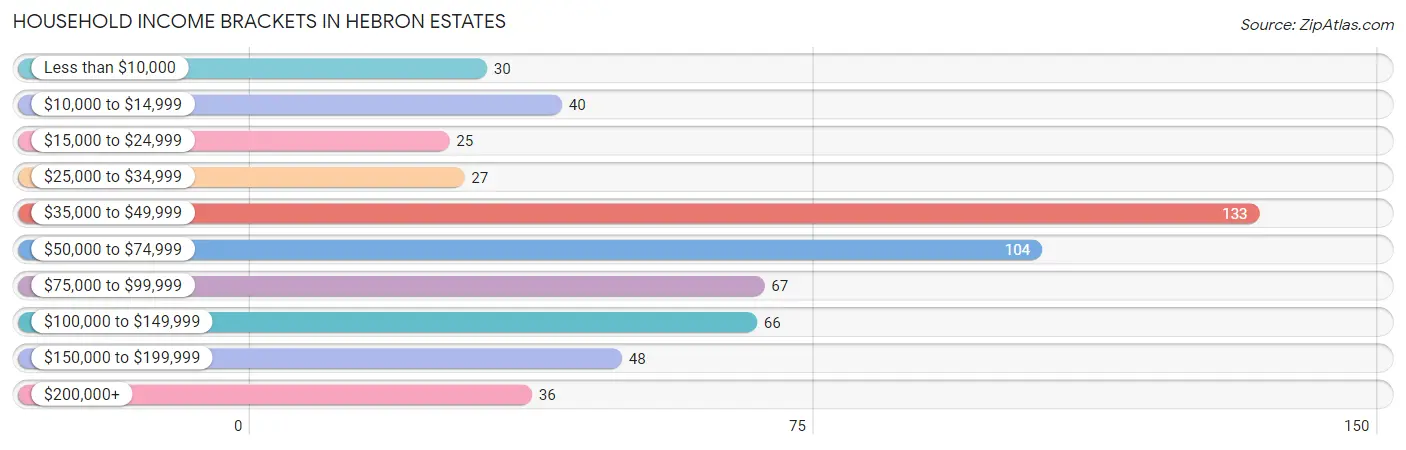
| Income Bracket | # Households | % Households |
| Less than $10,000 | 30 | 5.2% |
| $10,000 to $14,999 | 40 | 6.9% |
| $15,000 to $24,999 | 25 | 4.3% |
| $25,000 to $34,999 | 27 | 4.7% |
| $35,000 to $49,999 | 133 | 23.1% |
| $50,000 to $74,999 | 104 | 18.1% |
| $75,000 to $99,999 | 67 | 11.6% |
| $100,000 to $149,999 | 66 | 11.5% |
| $150,000 to $199,999 | 48 | 8.3% |
| $200,000+ | 36 | 6.3% |
Household Income by Householder Age in Hebron Estates
The median household income in Hebron Estates is $53,929, with the highest median household income of $80,000 found in the 25 to 44 years age bracket for the primary householder. A total of 82 households (14.2%) fall into this category. Meanwhile, the 15 to 24 years age bracket for the primary householder has the lowest median household income of $0, with 13 households (2.3%) in this group.
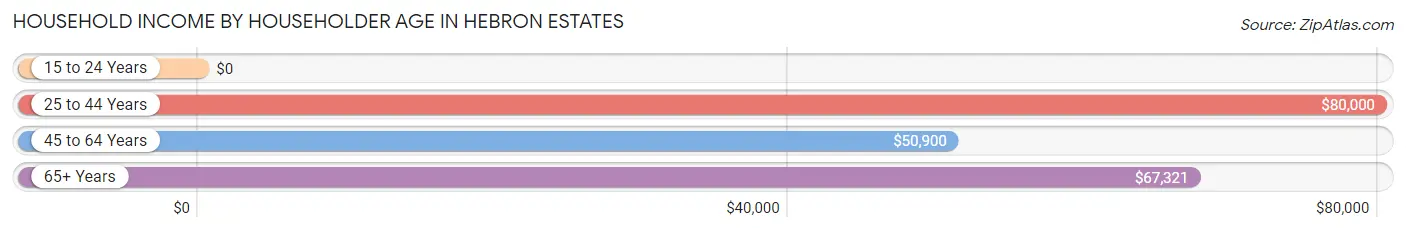
| Income Bracket | # Households | Median Income |
| 15 to 24 Years | 13 (2.3%) | $0 |
| 25 to 44 Years | 82 (14.2%) | $80,000 |
| 45 to 64 Years | 328 (56.9%) | $50,900 |
| 65+ Years | 153 (26.6%) | $67,321 |
| Total | 576 (100.0%) | $53,929 |
Poverty in Hebron Estates
Income Below Poverty by Sex and Age in Hebron Estates
With 14.9% poverty level for males and 17.0% for females among the residents of Hebron Estates, under 5 year old males and 15 year old females are the most vulnerable to poverty, with 49 males (65.3%) and 10 females (100.0%) in their respective age groups living below the poverty level.
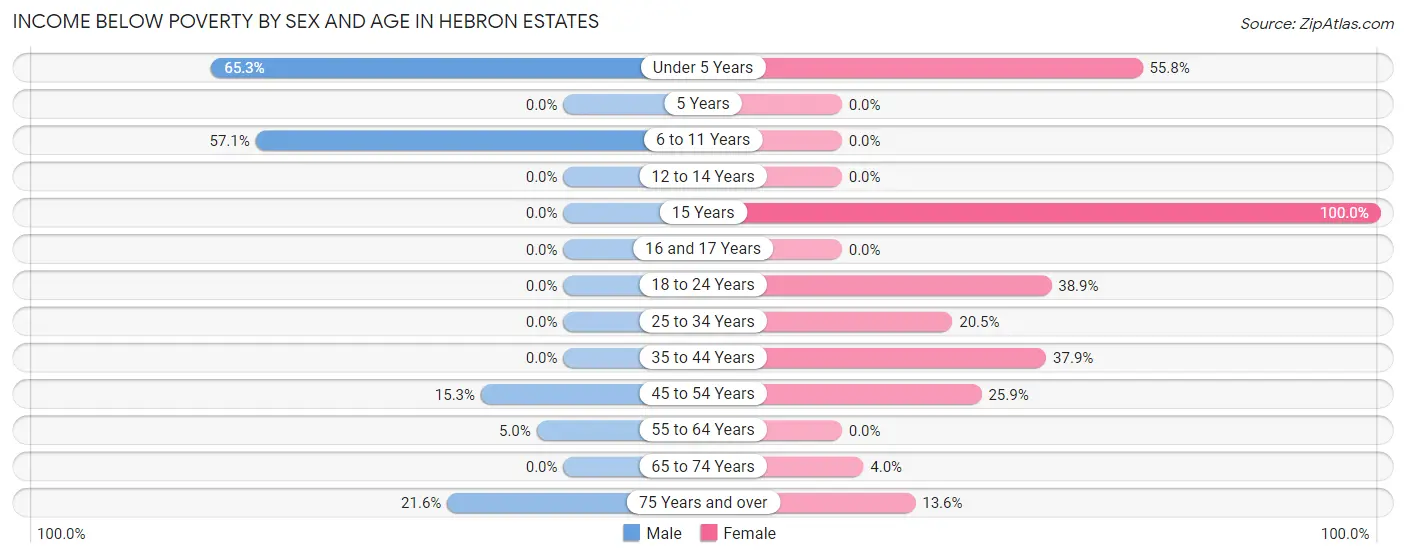
| Age Bracket | Male | Female |
| Under 5 Years | 49 (65.3%) | 24 (55.8%) |
| 5 Years | 0 (0.0%) | 0 (0.0%) |
| 6 to 11 Years | 16 (57.1%) | 0 (0.0%) |
| 12 to 14 Years | 0 (0.0%) | 0 (0.0%) |
| 15 Years | 0 (0.0%) | 10 (100.0%) |
| 16 and 17 Years | 0 (0.0%) | 0 (0.0%) |
| 18 to 24 Years | 0 (0.0%) | 14 (38.9%) |
| 25 to 34 Years | 0 (0.0%) | 8 (20.5%) |
| 35 to 44 Years | 0 (0.0%) | 22 (37.9%) |
| 45 to 54 Years | 15 (15.3%) | 21 (25.9%) |
| 55 to 64 Years | 7 (5.0%) | 0 (0.0%) |
| 65 to 74 Years | 0 (0.0%) | 3 (4.0%) |
| 75 Years and over | 11 (21.6%) | 6 (13.6%) |
| Total | 98 (14.9%) | 108 (17.0%) |
Income Above Poverty by Sex and Age in Hebron Estates
According to the poverty statistics in Hebron Estates, males aged 5 years and females aged 6 to 11 years are the age groups that are most secure financially, with 100.0% of males and 100.0% of females in these age groups living above the poverty line.
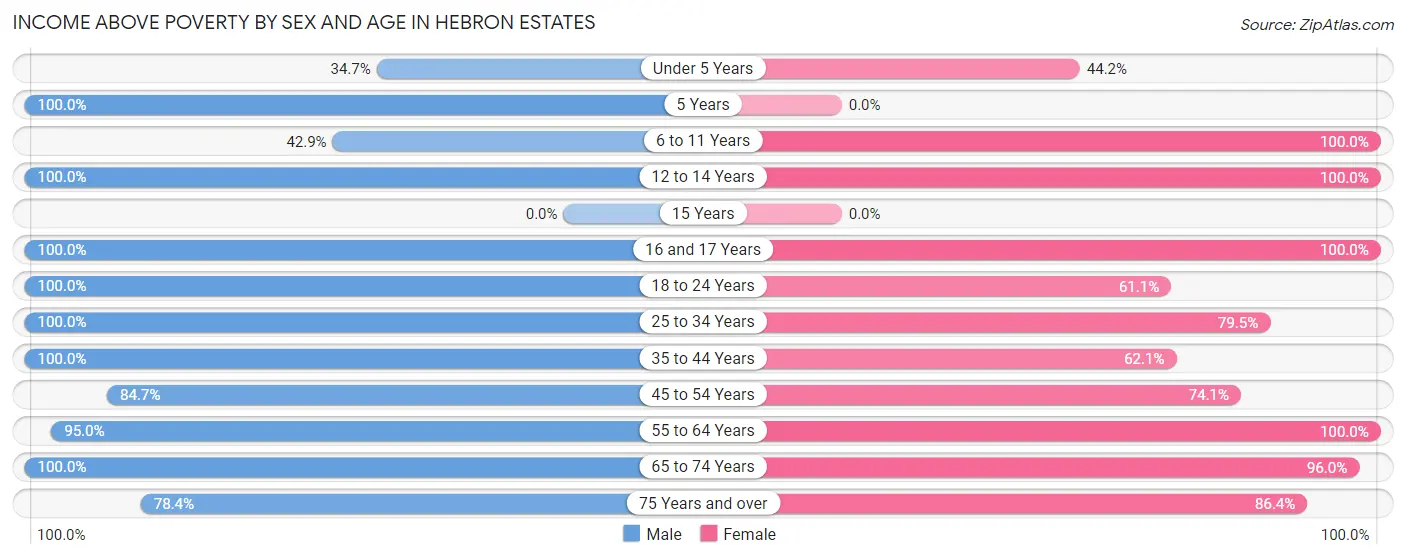
| Age Bracket | Male | Female |
| Under 5 Years | 26 (34.7%) | 19 (44.2%) |
| 5 Years | 4 (100.0%) | 0 (0.0%) |
| 6 to 11 Years | 12 (42.9%) | 5 (100.0%) |
| 12 to 14 Years | 4 (100.0%) | 9 (100.0%) |
| 15 Years | 0 (0.0%) | 0 (0.0%) |
| 16 and 17 Years | 14 (100.0%) | 57 (100.0%) |
| 18 to 24 Years | 43 (100.0%) | 22 (61.1%) |
| 25 to 34 Years | 55 (100.0%) | 31 (79.5%) |
| 35 to 44 Years | 43 (100.0%) | 36 (62.1%) |
| 45 to 54 Years | 83 (84.7%) | 60 (74.1%) |
| 55 to 64 Years | 134 (95.0%) | 180 (100.0%) |
| 65 to 74 Years | 102 (100.0%) | 72 (96.0%) |
| 75 Years and over | 40 (78.4%) | 38 (86.4%) |
| Total | 560 (85.1%) | 529 (83.1%) |
Income Below Poverty Among Married-Couple Families in Hebron Estates
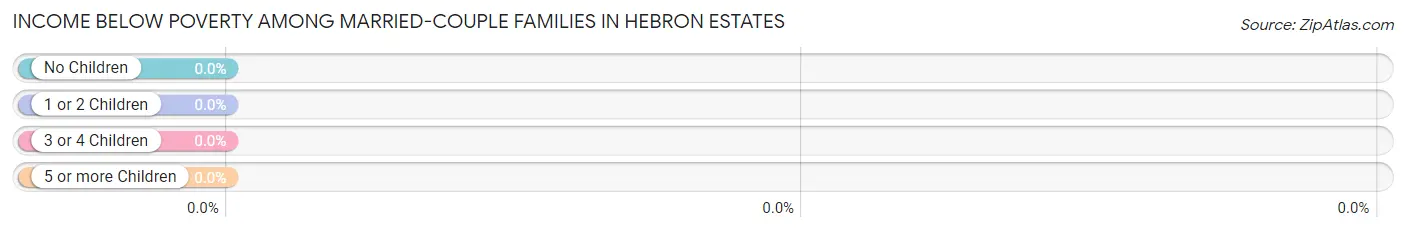
| Children | Above Poverty | Below Poverty |
| No Children | 191 (100.0%) | 0 (0.0%) |
| 1 or 2 Children | 45 (100.0%) | 0 (0.0%) |
| 3 or 4 Children | 14 (100.0%) | 0 (0.0%) |
| 5 or more Children | 0 (0.0%) | 0 (0.0%) |
| Total | 250 (100.0%) | 0 (0.0%) |
Income Below Poverty Among Single-Parent Households in Hebron Estates
According to the poverty data in Hebron Estates, 19.4% or 7 single-father households and 23.6% or 29 single-mother households are living below the poverty line. Among single-father households, those with 1 or 2 children have the highest poverty rate, with 7 households (29.2%) experiencing poverty. Likewise, among single-mother households, those with 3 or 4 children have the highest poverty rate, with 11 households (100.0%) falling below the poverty line.
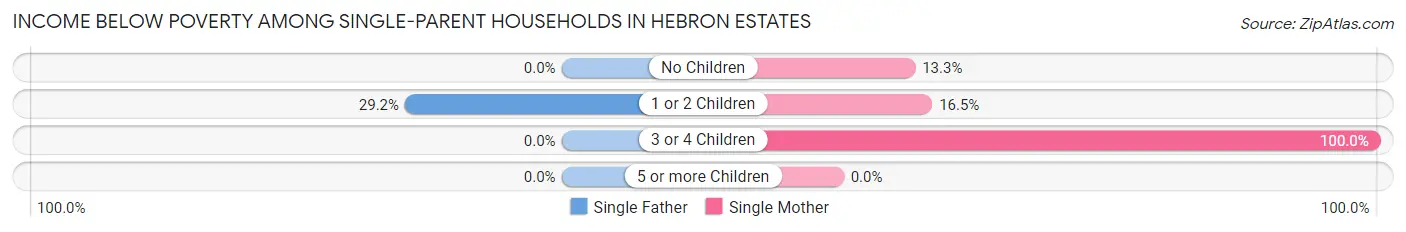
| Children | Single Father | Single Mother |
| No Children | 0 (0.0%) | 2 (13.3%) |
| 1 or 2 Children | 7 (29.2%) | 16 (16.5%) |
| 3 or 4 Children | 0 (0.0%) | 11 (100.0%) |
| 5 or more Children | 0 (0.0%) | 0 (0.0%) |
| Total | 7 (19.4%) | 29 (23.6%) |
Income Below Poverty Among Married-Couple vs Single-Parent Households in Hebron Estates
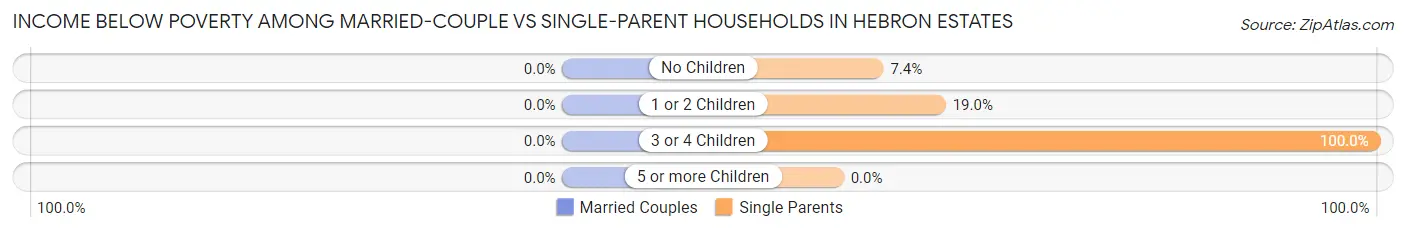
| Children | Married-Couple Families | Single-Parent Households |
| No Children | 0 (0.0%) | 2 (7.4%) |
| 1 or 2 Children | 0 (0.0%) | 23 (19.0%) |
| 3 or 4 Children | 0 (0.0%) | 11 (100.0%) |
| 5 or more Children | 0 (0.0%) | 0 (0.0%) |
| Total | 0 (0.0%) | 36 (22.6%) |
Race in Hebron Estates
The most populous races in Hebron Estates are White / Caucasian (1,072 | 82.0%), Two or more Races (141 | 10.8%), and Black / African American (87 | 6.7%).
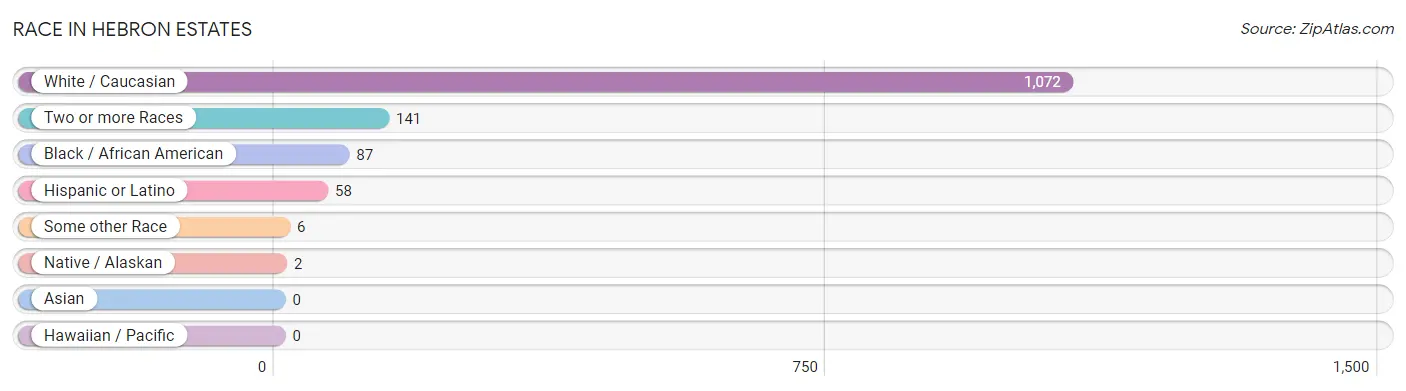
| Race | # Population | % Population |
| Asian | 0 | 0.0% |
| Black / African American | 87 | 6.7% |
| Hawaiian / Pacific | 0 | 0.0% |
| Hispanic or Latino | 58 | 4.4% |
| Native / Alaskan | 2 | 0.2% |
| White / Caucasian | 1,072 | 82.0% |
| Two or more Races | 141 | 10.8% |
| Some other Race | 6 | 0.5% |
| Total | 1,308 | 100.0% |
Ancestry in Hebron Estates
The most populous ancestries reported in Hebron Estates are German (204 | 15.6%), American (190 | 14.5%), English (139 | 10.6%), Irish (122 | 9.3%), and Italian (72 | 5.5%), together accounting for 55.6% of all Hebron Estates residents.
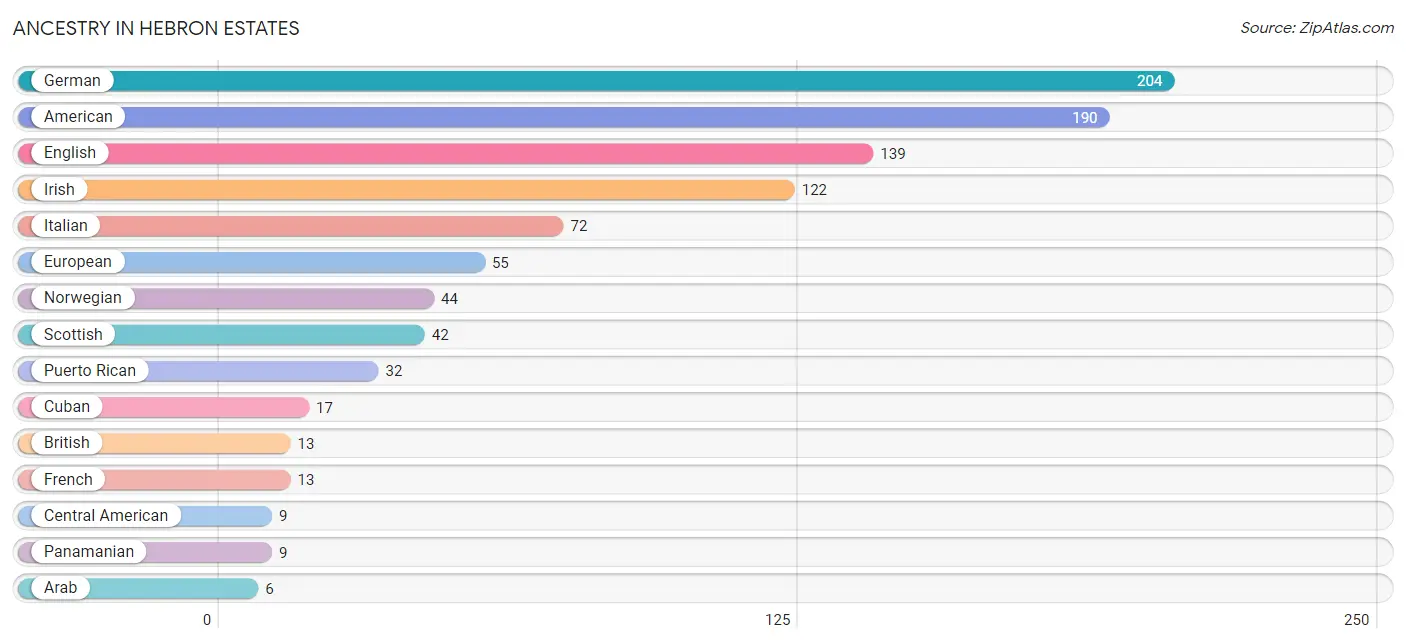
| Ancestry | # Population | % Population |
| American | 190 | 14.5% |
| Apache | 2 | 0.2% |
| Arab | 6 | 0.5% |
| British | 13 | 1.0% |
| Central American | 9 | 0.7% |
| Cuban | 17 | 1.3% |
| English | 139 | 10.6% |
| European | 55 | 4.2% |
| French | 13 | 1.0% |
| German | 204 | 15.6% |
| Irish | 122 | 9.3% |
| Italian | 72 | 5.5% |
| Lebanese | 6 | 0.5% |
| Norwegian | 44 | 3.4% |
| Panamanian | 9 | 0.7% |
| Polish | 3 | 0.2% |
| Puerto Rican | 32 | 2.5% |
| Scotch-Irish | 2 | 0.2% |
| Scottish | 42 | 3.2% |
| Swiss | 3 | 0.2% | View All 20 Rows |
Immigrants in Hebron Estates
The most numerous immigrant groups reported in Hebron Estates came from Europe (8 | 0.6%), Germany (8 | 0.6%), and Western Europe (8 | 0.6%), together accounting for 1.8% of all Hebron Estates residents.
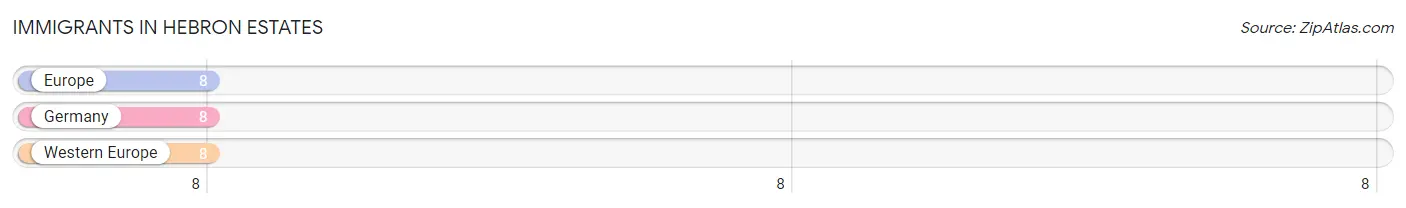
| Immigration Origin | # Population | % Population |
| Europe | 8 | 0.6% |
| Germany | 8 | 0.6% |
| Western Europe | 8 | 0.6% | View All 3 Rows |
Sex and Age in Hebron Estates
Sex and Age in Hebron Estates
The most populous age groups in Hebron Estates are Under 5 Years (75 | 11.2%) for men and 60 to 64 Years (128 | 20.0%) for women.
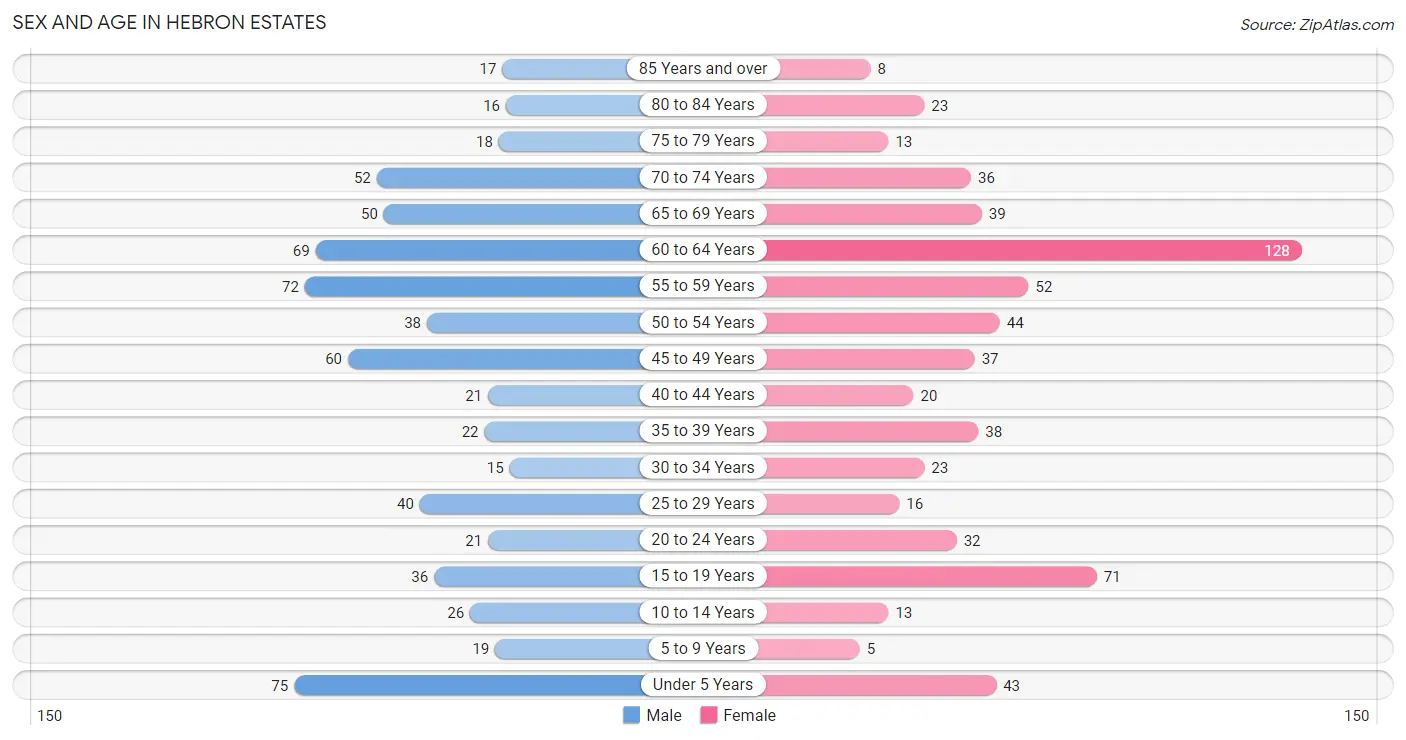
| Age Bracket | Male | Female |
| Under 5 Years | 75 (11.2%) | 43 (6.7%) |
| 5 to 9 Years | 19 (2.9%) | 5 (0.8%) |
| 10 to 14 Years | 26 (3.9%) | 13 (2.0%) |
| 15 to 19 Years | 36 (5.4%) | 71 (11.1%) |
| 20 to 24 Years | 21 (3.2%) | 32 (5.0%) |
| 25 to 29 Years | 40 (6.0%) | 16 (2.5%) |
| 30 to 34 Years | 15 (2.2%) | 23 (3.6%) |
| 35 to 39 Years | 22 (3.3%) | 38 (5.9%) |
| 40 to 44 Years | 21 (3.2%) | 20 (3.1%) |
| 45 to 49 Years | 60 (9.0%) | 37 (5.8%) |
| 50 to 54 Years | 38 (5.7%) | 44 (6.9%) |
| 55 to 59 Years | 72 (10.8%) | 52 (8.1%) |
| 60 to 64 Years | 69 (10.3%) | 128 (20.0%) |
| 65 to 69 Years | 50 (7.5%) | 39 (6.1%) |
| 70 to 74 Years | 52 (7.8%) | 36 (5.6%) |
| 75 to 79 Years | 18 (2.7%) | 13 (2.0%) |
| 80 to 84 Years | 16 (2.4%) | 23 (3.6%) |
| 85 Years and over | 17 (2.5%) | 8 (1.3%) |
| Total | 667 (100.0%) | 641 (100.0%) |
Families and Households in Hebron Estates
Median Family Size in Hebron Estates
The median family size in Hebron Estates is 2.68 persons per family, with married-couple families (250 | 61.1%) accounting for the largest median family size of 2.93 persons per family. On the other hand, single female/mother families (123 | 30.1%) represent the smallest median family size with 2.18 persons per family.
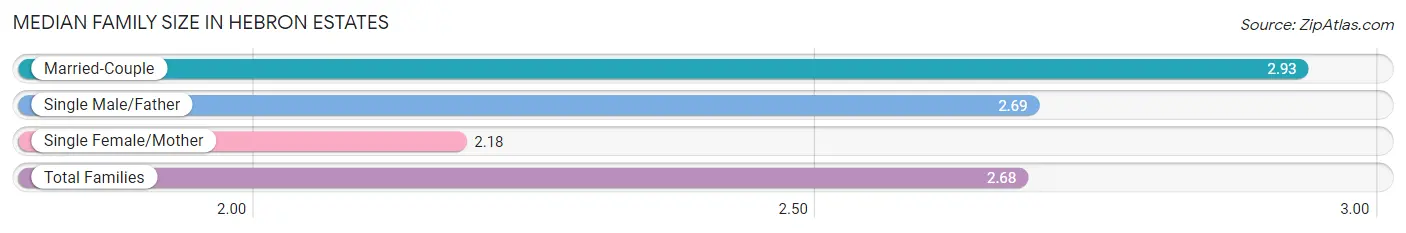
| Family Type | # Families | Family Size |
| Married-Couple | 250 (61.1%) | 2.93 |
| Single Male/Father | 36 (8.8%) | 2.69 |
| Single Female/Mother | 123 (30.1%) | 2.18 |
| Total Families | 409 (100.0%) | 2.68 |
Median Household Size in Hebron Estates
The median household size in Hebron Estates is 2.27 persons per household, with married-couple households (250 | 43.4%) accounting for the largest median household size of 2.93 persons per household. non-family households (167 | 29.0%) represent the smallest median household size with 1.18 persons per household.
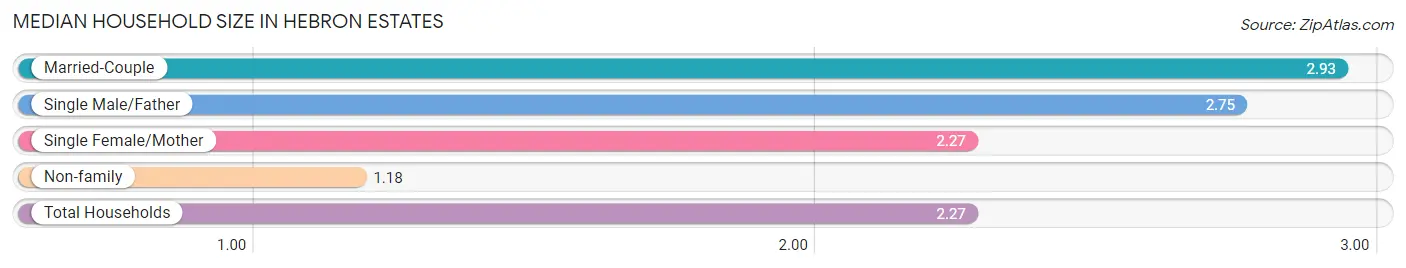
| Household Type | # Households | Household Size |
| Married-Couple | 250 (43.4%) | 2.93 |
| Single Male/Father | 36 (6.2%) | 2.75 |
| Single Female/Mother | 123 (21.3%) | 2.27 |
| Non-family | 167 (29.0%) | 1.18 |
| Total Households | 576 (100.0%) | 2.27 |
Household Size by Marriage Status in Hebron Estates
Out of a total of 576 households in Hebron Estates, 409 (71.0%) are family households, while 167 (29.0%) are nonfamily households. The most numerous type of family households are 2-person households, comprising 270, and the most common type of nonfamily households are 1-person households, comprising 148.
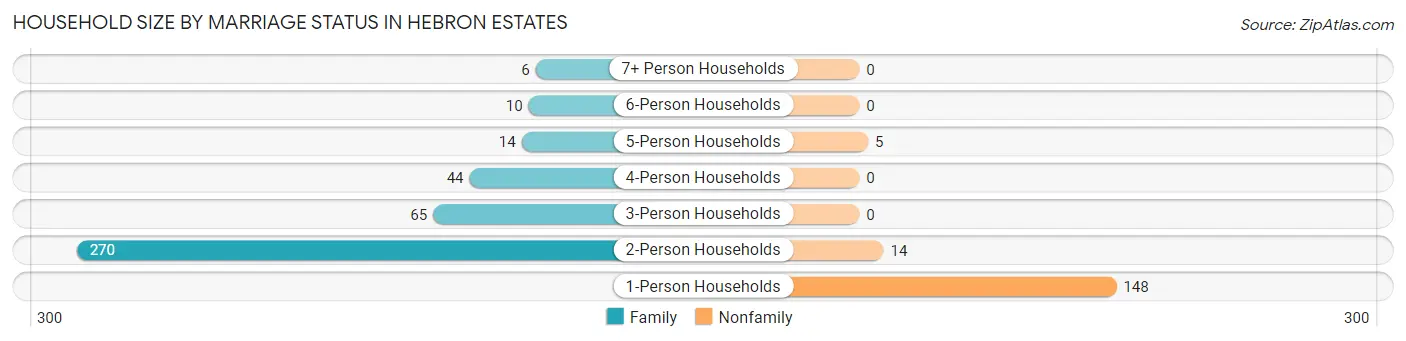
| Household Size | Family Households | Nonfamily Households |
| 1-Person Households | - | 148 (25.7%) |
| 2-Person Households | 270 (46.9%) | 14 (2.4%) |
| 3-Person Households | 65 (11.3%) | 0 (0.0%) |
| 4-Person Households | 44 (7.6%) | 0 (0.0%) |
| 5-Person Households | 14 (2.4%) | 5 (0.9%) |
| 6-Person Households | 10 (1.7%) | 0 (0.0%) |
| 7+ Person Households | 6 (1.0%) | 0 (0.0%) |
| Total | 409 (71.0%) | 167 (29.0%) |
Female Fertility in Hebron Estates
Fertility by Age in Hebron Estates
Average fertility rate in Hebron Estates is 74.0 births per 1,000 women. Women in the age bracket of 20 to 34 years have the highest fertility rate with 254.0 births per 1,000 women. Women in the age bracket of 20 to 34 years acount for 100.0% of all women with births.
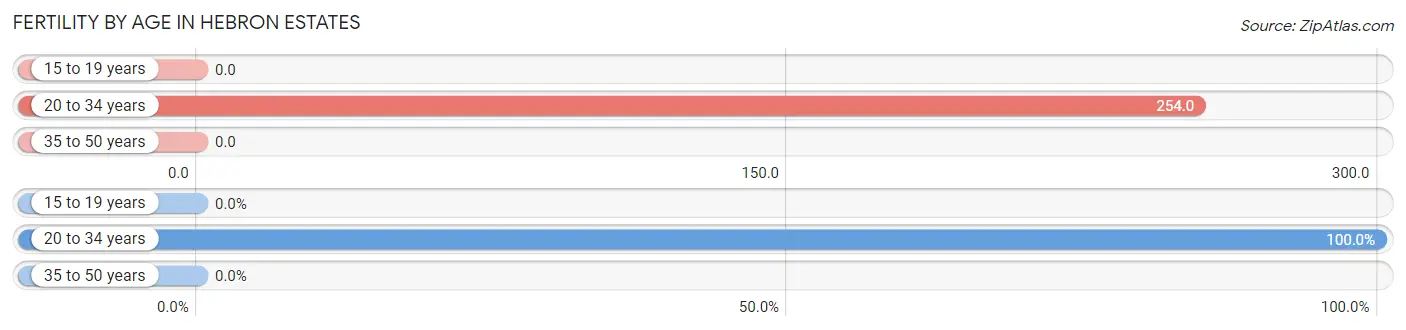
| Age Bracket | Women with Births | Births / 1,000 Women |
| 15 to 19 years | 0 (0.0%) | 0.0 |
| 20 to 34 years | 18 (100.0%) | 254.0 |
| 35 to 50 years | 0 (0.0%) | 0.0 |
| Total | 18 (100.0%) | 74.0 |
Fertility by Age by Marriage Status in Hebron Estates
22.2% of women with births (18) in Hebron Estates are married. The highest percentage of unmarried women with births falls into 20 to 34 years age bracket with 77.8% of them unmarried at the time of birth, while the lowest percentage of unmarried women with births belong to 20 to 34 years age bracket with 77.8% of them unmarried.
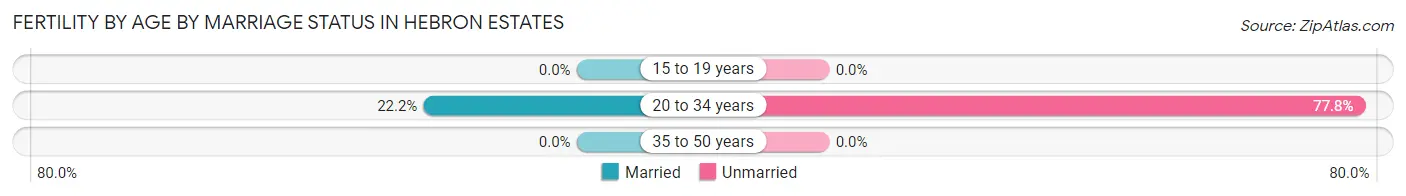
| Age Bracket | Married | Unmarried |
| 15 to 19 years | 0 (0.0%) | 0 (0.0%) |
| 20 to 34 years | 4 (22.2%) | 14 (77.8%) |
| 35 to 50 years | 0 (0.0%) | 0 (0.0%) |
| Total | 4 (22.2%) | 14 (77.8%) |
Fertility by Education in Hebron Estates
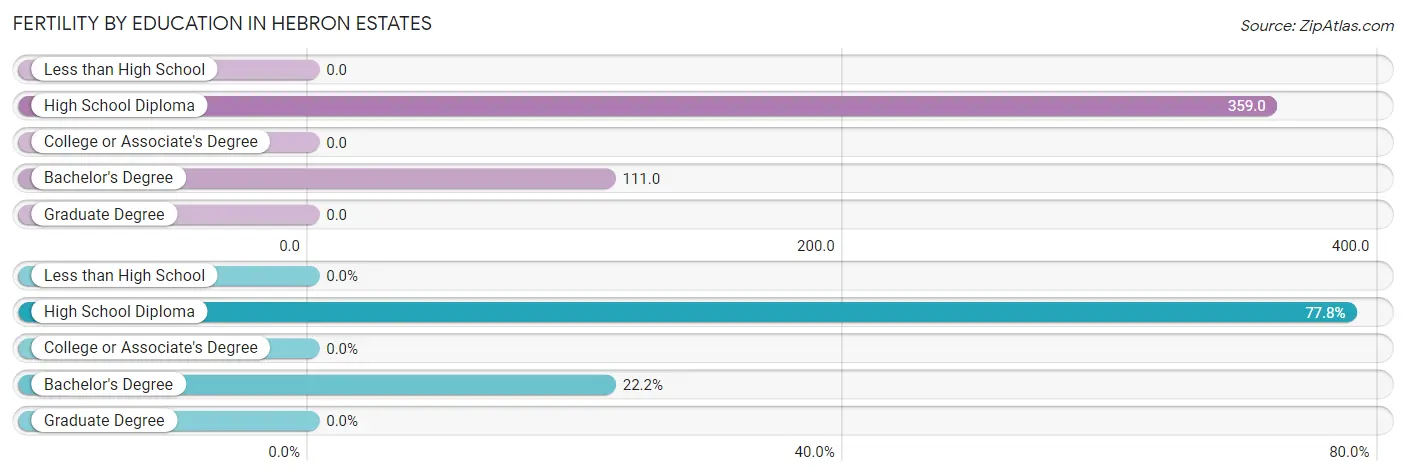
| Educational Attainment | Women with Births | Births / 1,000 Women |
| Less than High School | 0 (0.0%) | 0.0 |
| High School Diploma | 14 (77.8%) | 359.0 |
| College or Associate's Degree | 0 (0.0%) | 0.0 |
| Bachelor's Degree | 4 (22.2%) | 111.0 |
| Graduate Degree | 0 (0.0%) | 0.0 |
| Total | 18 (100.0%) | 74.0 |
Fertility by Education by Marriage Status in Hebron Estates
77.8% of women with births in Hebron Estates are unmarried. Women with the educational attainment of bachelor's degree are most likely to be married with 100.0% of them married at childbirth, while women with the educational attainment of high school diploma are least likely to be married with 100.0% of them unmarried at childbirth.
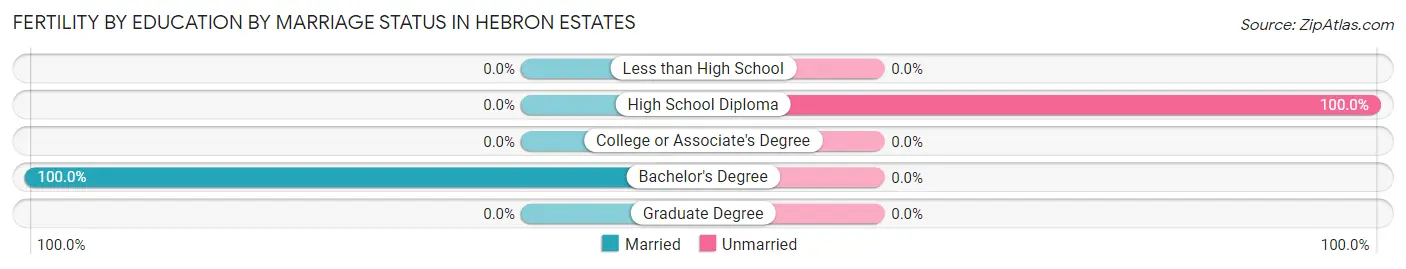
| Educational Attainment | Married | Unmarried |
| Less than High School | 0 (0.0%) | 0 (0.0%) |
| High School Diploma | 0 (0.0%) | 14 (100.0%) |
| College or Associate's Degree | 0 (0.0%) | 0 (0.0%) |
| Bachelor's Degree | 4 (100.0%) | 0 (0.0%) |
| Graduate Degree | 0 (0.0%) | 0 (0.0%) |
| Total | 4 (22.2%) | 14 (77.8%) |
Employment Characteristics in Hebron Estates
Employment by Class of Employer in Hebron Estates
Among the 599 employed individuals in Hebron Estates, private company employees (482 | 80.5%), local government employees (46 | 7.7%), and self-employed (incorporated) (32 | 5.3%) make up the most common classes of employment.
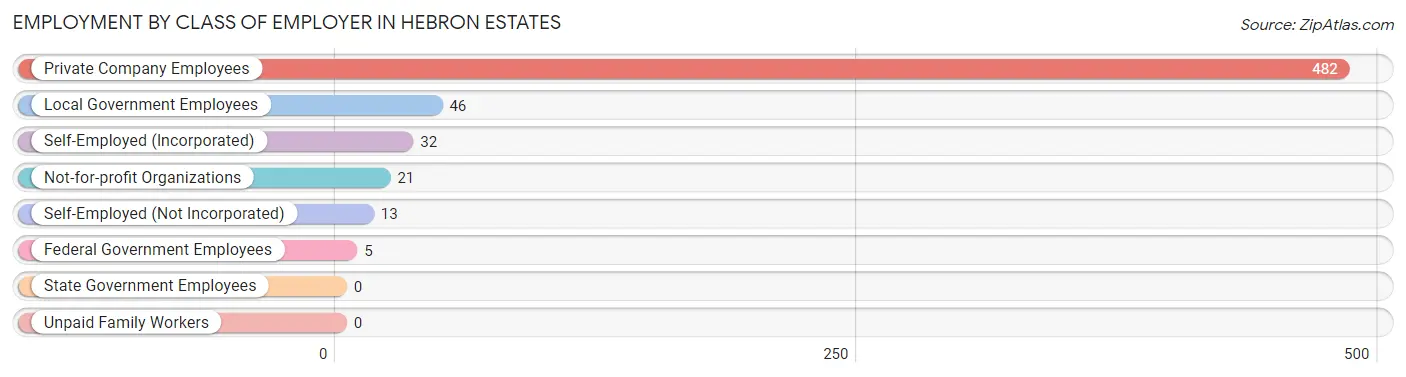
| Employer Class | # Employees | % Employees |
| Private Company Employees | 482 | 80.5% |
| Self-Employed (Incorporated) | 32 | 5.3% |
| Self-Employed (Not Incorporated) | 13 | 2.2% |
| Not-for-profit Organizations | 21 | 3.5% |
| Local Government Employees | 46 | 7.7% |
| State Government Employees | 0 | 0.0% |
| Federal Government Employees | 5 | 0.8% |
| Unpaid Family Workers | 0 | 0.0% |
| Total | 599 | 100.0% |
Employment Status by Age in Hebron Estates
According to the labor force statistics for Hebron Estates, out of the total population over 16 years of age (1,117), 64.1% or 716 individuals are in the labor force, with 13.1% or 94 of them unemployed. The age group with the highest labor force participation rate is 45 to 54 years, with 92.7% or 166 individuals in the labor force. Within the labor force, the 60 to 64 years age range has the highest percentage of unemployed individuals, with 61.7% or 82 of them being unemployed.
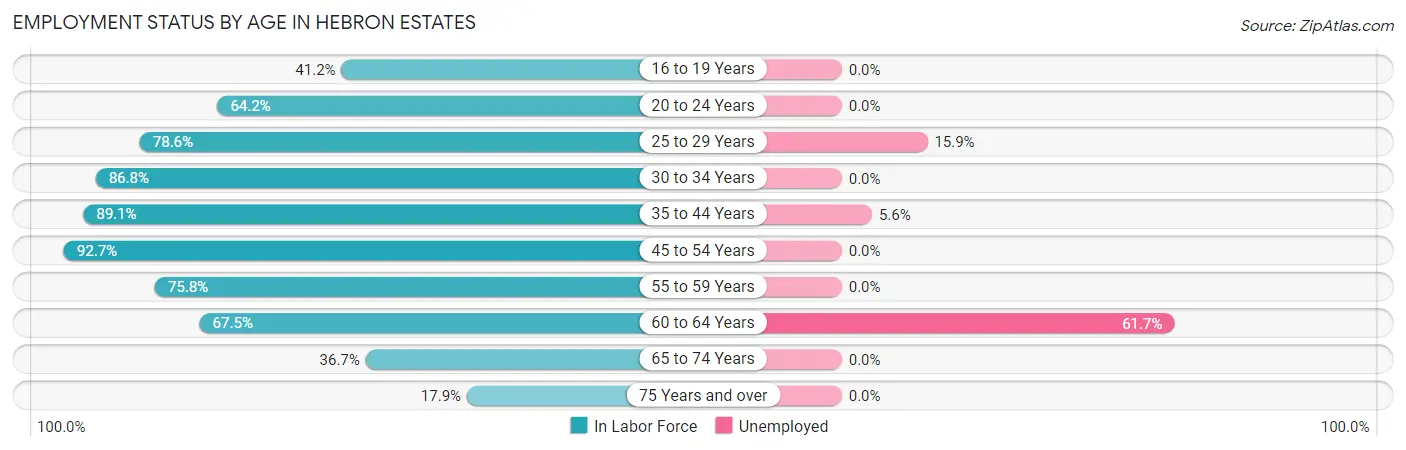
| Age Bracket | In Labor Force | Unemployed |
| 16 to 19 Years | 40 (41.2%) | 0 (0.0%) |
| 20 to 24 Years | 34 (64.2%) | 0 (0.0%) |
| 25 to 29 Years | 44 (78.6%) | 7 (15.9%) |
| 30 to 34 Years | 33 (86.8%) | 0 (0.0%) |
| 35 to 44 Years | 90 (89.1%) | 5 (5.6%) |
| 45 to 54 Years | 166 (92.7%) | 0 (0.0%) |
| 55 to 59 Years | 94 (75.8%) | 0 (0.0%) |
| 60 to 64 Years | 133 (67.5%) | 82 (61.7%) |
| 65 to 74 Years | 65 (36.7%) | 0 (0.0%) |
| 75 Years and over | 17 (17.9%) | 0 (0.0%) |
| Total | 716 (64.1%) | 94 (13.1%) |
Employment Status by Educational Attainment in Hebron Estates
According to labor force statistics for Hebron Estates, 80.6% of individuals (560) out of the total population between 25 and 64 years of age (695) are in the labor force, with 16.8% or 94 of them being unemployed. The group with the highest labor force participation rate are those with the educational attainment of college / associate degree, with 91.7% or 275 individuals in the labor force. Within the labor force, individuals with college / associate degree education have the highest percentage of unemployment, with 26.5% or 73 of them being unemployed.
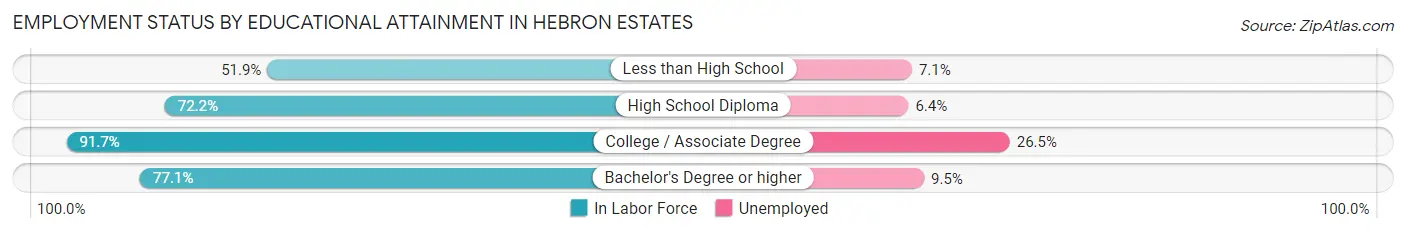
| Educational Attainment | In Labor Force | Unemployed |
| Less than High School | 14 (51.9%) | 2 (7.1%) |
| High School Diploma | 187 (72.2%) | 17 (6.4%) |
| College / Associate Degree | 275 (91.7%) | 80 (26.5%) |
| Bachelor's Degree or higher | 84 (77.1%) | 10 (9.5%) |
| Total | 560 (80.6%) | 117 (16.8%) |
Employment Occupations by Sex in Hebron Estates
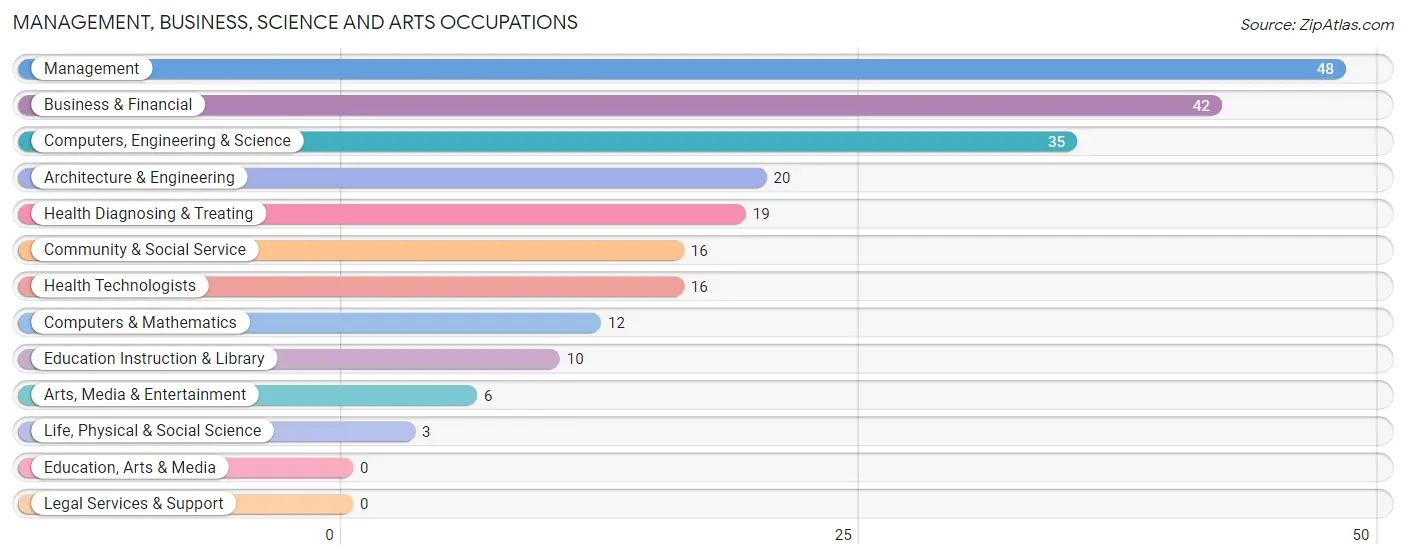
Management, Business, Science and Arts Occupations
The most common Management, Business, Science and Arts occupations in Hebron Estates are Management (48 | 7.7%), Business & Financial (42 | 6.8%), Computers, Engineering & Science (35 | 5.6%), Architecture & Engineering (20 | 3.2%), and Health Diagnosing & Treating (19 | 3.0%).
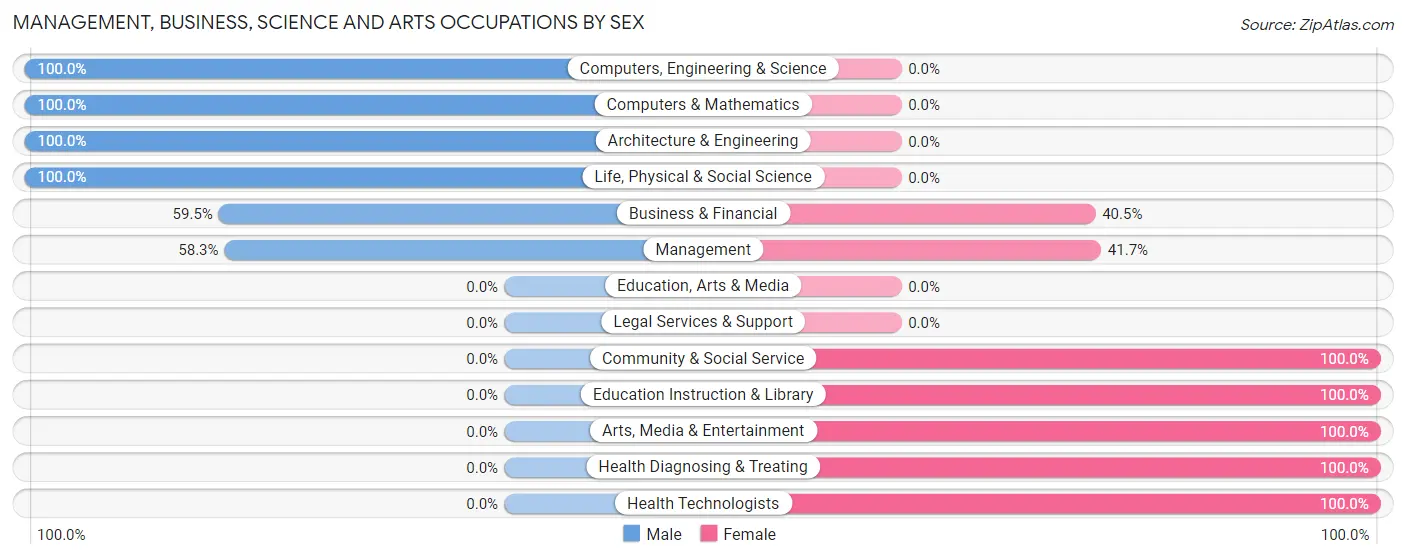
Management, Business, Science and Arts Occupations by Sex
Within the Management, Business, Science and Arts occupations in Hebron Estates, the most male-oriented occupations are Computers, Engineering & Science (100.0%), Computers & Mathematics (100.0%), and Architecture & Engineering (100.0%), while the most female-oriented occupations are Community & Social Service (100.0%), Education Instruction & Library (100.0%), and Arts, Media & Entertainment (100.0%).
| Occupation | Male | Female |
| Management | 28 (58.3%) | 20 (41.7%) |
| Business & Financial | 25 (59.5%) | 17 (40.5%) |
| Computers, Engineering & Science | 35 (100.0%) | 0 (0.0%) |
| Computers & Mathematics | 12 (100.0%) | 0 (0.0%) |
| Architecture & Engineering | 20 (100.0%) | 0 (0.0%) |
| Life, Physical & Social Science | 3 (100.0%) | 0 (0.0%) |
| Community & Social Service | 0 (0.0%) | 16 (100.0%) |
| Education, Arts & Media | 0 (0.0%) | 0 (0.0%) |
| Legal Services & Support | 0 (0.0%) | 0 (0.0%) |
| Education Instruction & Library | 0 (0.0%) | 10 (100.0%) |
| Arts, Media & Entertainment | 0 (0.0%) | 6 (100.0%) |
| Health Diagnosing & Treating | 0 (0.0%) | 19 (100.0%) |
| Health Technologists | 0 (0.0%) | 16 (100.0%) |
| Total (Category) | 88 (55.0%) | 72 (45.0%) |
| Total (Overall) | 398 (64.0%) | 224 (36.0%) |
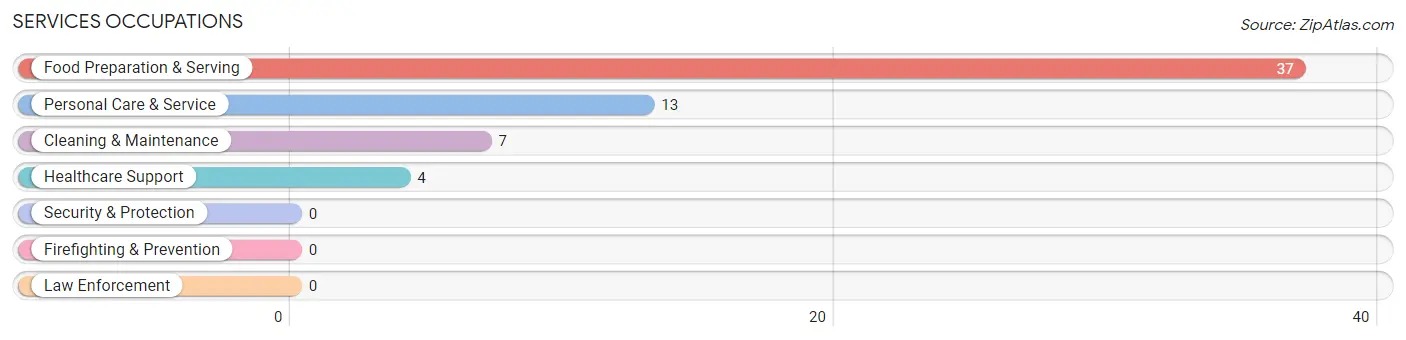
Services Occupations
The most common Services occupations in Hebron Estates are Food Preparation & Serving (37 | 5.9%), Personal Care & Service (13 | 2.1%), Cleaning & Maintenance (7 | 1.1%), and Healthcare Support (4 | 0.6%).
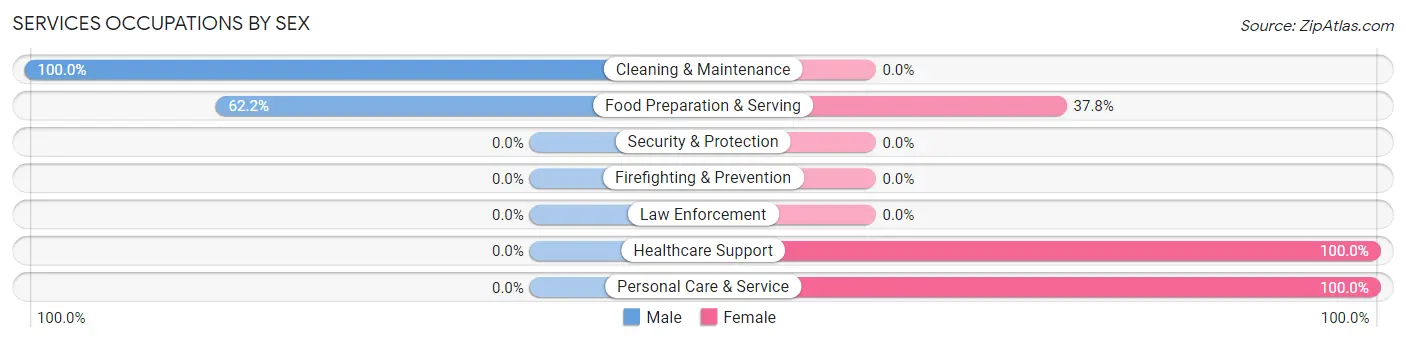
Services Occupations by Sex
Within the Services occupations in Hebron Estates, the most male-oriented occupations are Cleaning & Maintenance (100.0%), and Food Preparation & Serving (62.2%), while the most female-oriented occupations are Healthcare Support (100.0%), Personal Care & Service (100.0%), and Food Preparation & Serving (37.8%).
| Occupation | Male | Female |
| Healthcare Support | 0 (0.0%) | 4 (100.0%) |
| Security & Protection | 0 (0.0%) | 0 (0.0%) |
| Firefighting & Prevention | 0 (0.0%) | 0 (0.0%) |
| Law Enforcement | 0 (0.0%) | 0 (0.0%) |
| Food Preparation & Serving | 23 (62.2%) | 14 (37.8%) |
| Cleaning & Maintenance | 7 (100.0%) | 0 (0.0%) |
| Personal Care & Service | 0 (0.0%) | 13 (100.0%) |
| Total (Category) | 30 (49.2%) | 31 (50.8%) |
| Total (Overall) | 398 (64.0%) | 224 (36.0%) |
Sales and Office Occupations
The most common Sales and Office occupations in Hebron Estates are Office & Administration (113 | 18.2%), and Sales & Related (20 | 3.2%).
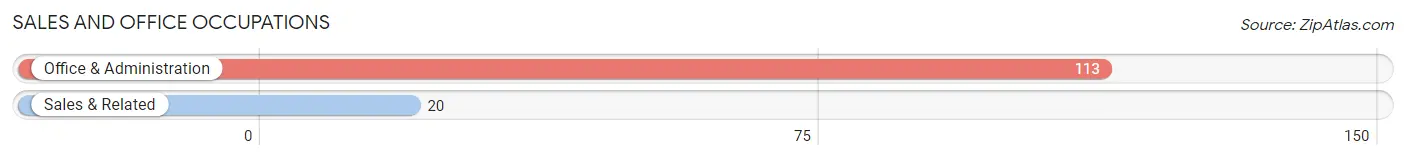
Sales and Office Occupations by Sex
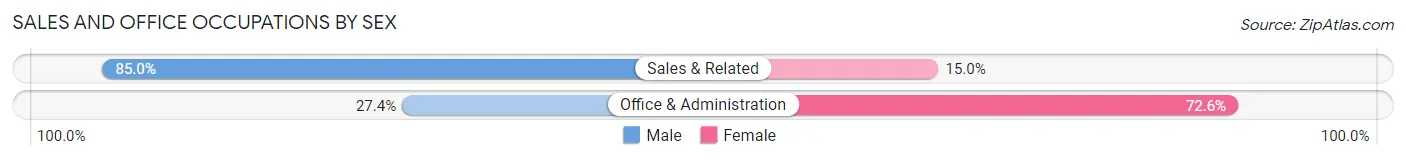
| Occupation | Male | Female |
| Sales & Related | 17 (85.0%) | 3 (15.0%) |
| Office & Administration | 31 (27.4%) | 82 (72.6%) |
| Total (Category) | 48 (36.1%) | 85 (63.9%) |
| Total (Overall) | 398 (64.0%) | 224 (36.0%) |
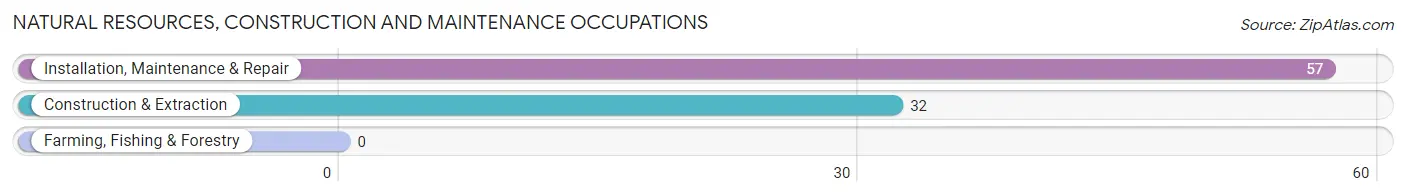
Natural Resources, Construction and Maintenance Occupations
The most common Natural Resources, Construction and Maintenance occupations in Hebron Estates are Installation, Maintenance & Repair (57 | 9.2%), and Construction & Extraction (32 | 5.1%).
Natural Resources, Construction and Maintenance Occupations by Sex
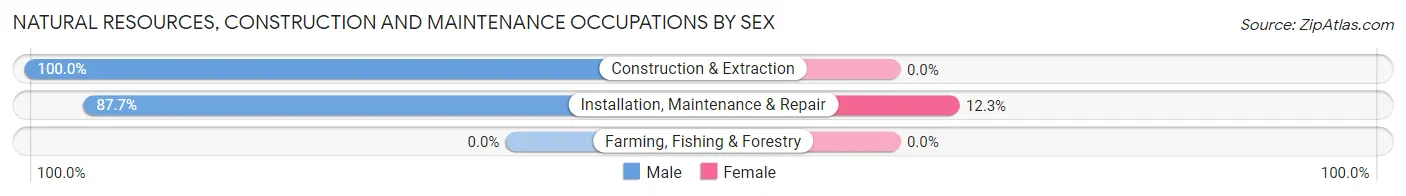
| Occupation | Male | Female |
| Farming, Fishing & Forestry | 0 (0.0%) | 0 (0.0%) |
| Construction & Extraction | 32 (100.0%) | 0 (0.0%) |
| Installation, Maintenance & Repair | 50 (87.7%) | 7 (12.3%) |
| Total (Category) | 82 (92.1%) | 7 (7.9%) |
| Total (Overall) | 398 (64.0%) | 224 (36.0%) |
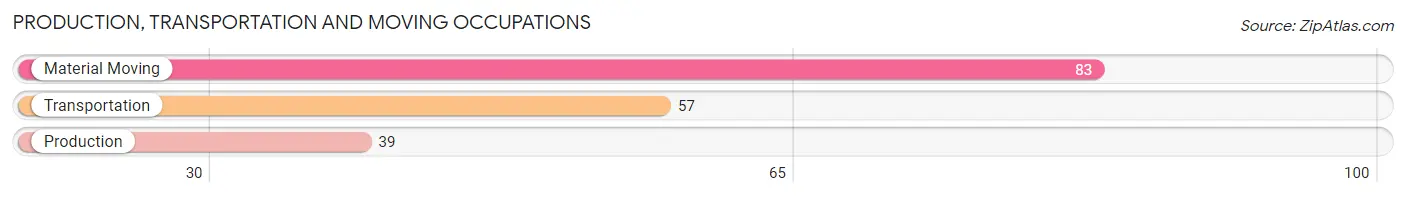
Production, Transportation and Moving Occupations
The most common Production, Transportation and Moving occupations in Hebron Estates are Material Moving (83 | 13.3%), Transportation (57 | 9.2%), and Production (39 | 6.3%).
Production, Transportation and Moving Occupations by Sex
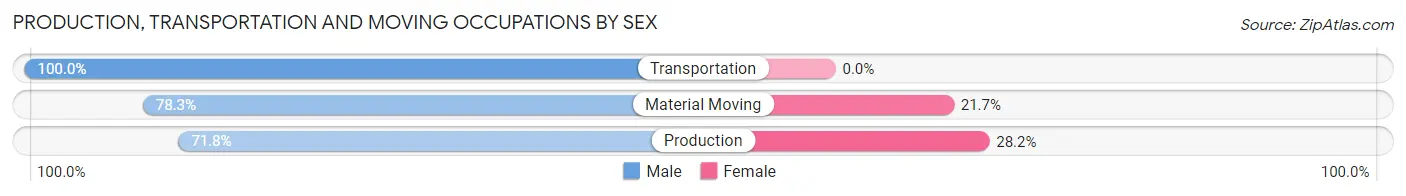
| Occupation | Male | Female |
| Production | 28 (71.8%) | 11 (28.2%) |
| Transportation | 57 (100.0%) | 0 (0.0%) |
| Material Moving | 65 (78.3%) | 18 (21.7%) |
| Total (Category) | 150 (83.8%) | 29 (16.2%) |
| Total (Overall) | 398 (64.0%) | 224 (36.0%) |
Employment Industries by Sex in Hebron Estates
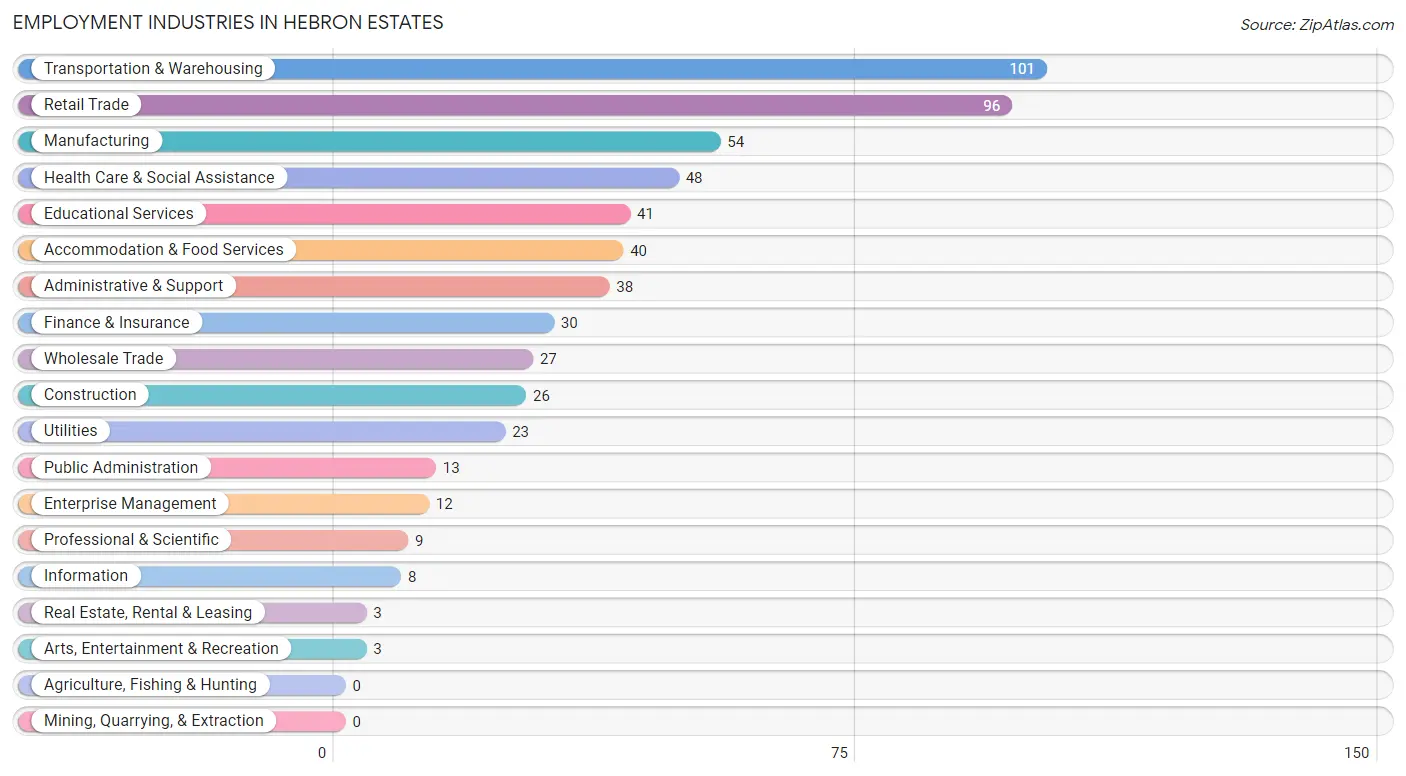
Employment Industries in Hebron Estates
The major employment industries in Hebron Estates include Transportation & Warehousing (101 | 16.2%), Retail Trade (96 | 15.4%), Manufacturing (54 | 8.7%), Health Care & Social Assistance (48 | 7.7%), and Educational Services (41 | 6.6%).
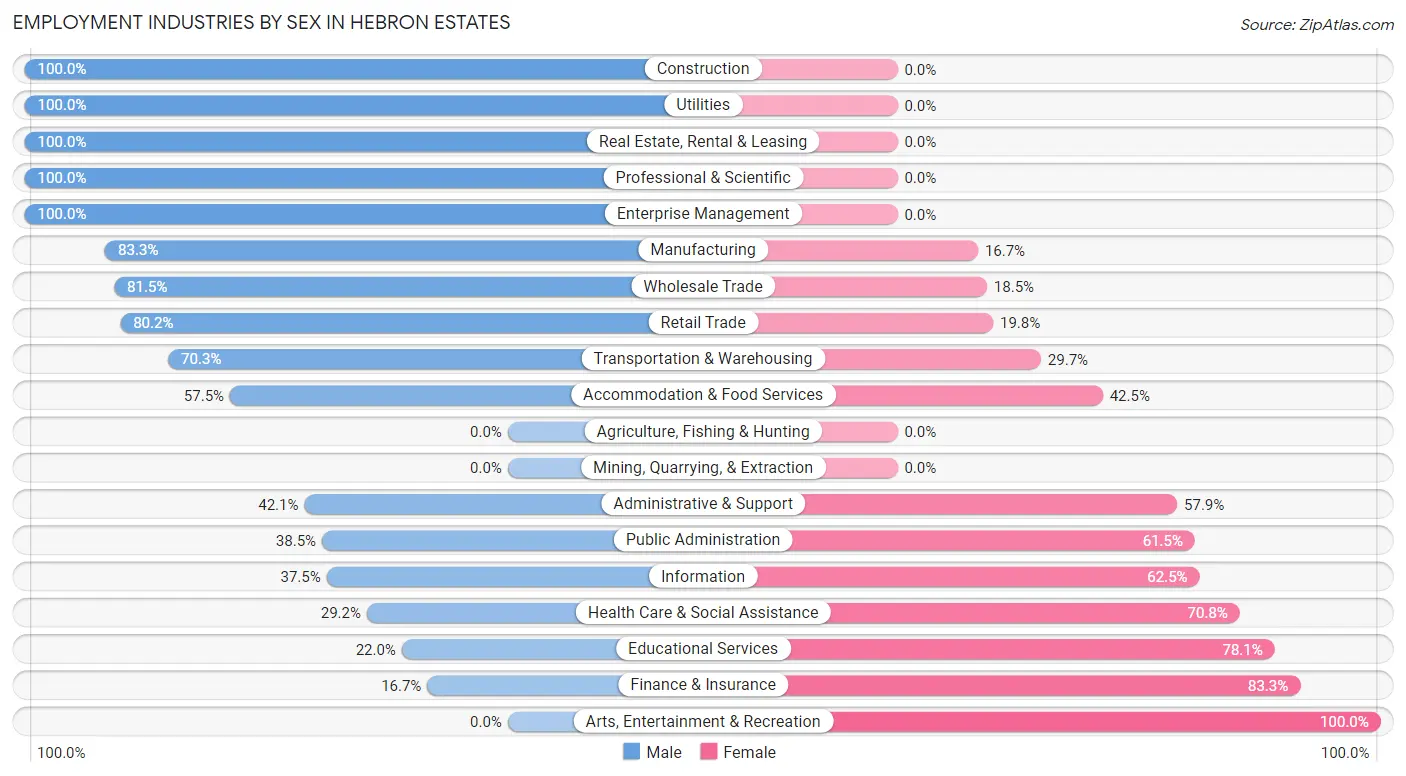
Employment Industries by Sex in Hebron Estates
The Hebron Estates industries that see more men than women are Construction (100.0%), Utilities (100.0%), and Real Estate, Rental & Leasing (100.0%), whereas the industries that tend to have a higher number of women are Arts, Entertainment & Recreation (100.0%), Finance & Insurance (83.3%), and Educational Services (78.0%).
| Industry | Male | Female |
| Agriculture, Fishing & Hunting | 0 (0.0%) | 0 (0.0%) |
| Mining, Quarrying, & Extraction | 0 (0.0%) | 0 (0.0%) |
| Construction | 26 (100.0%) | 0 (0.0%) |
| Manufacturing | 45 (83.3%) | 9 (16.7%) |
| Wholesale Trade | 22 (81.5%) | 5 (18.5%) |
| Retail Trade | 77 (80.2%) | 19 (19.8%) |
| Transportation & Warehousing | 71 (70.3%) | 30 (29.7%) |
| Utilities | 23 (100.0%) | 0 (0.0%) |
| Information | 3 (37.5%) | 5 (62.5%) |
| Finance & Insurance | 5 (16.7%) | 25 (83.3%) |
| Real Estate, Rental & Leasing | 3 (100.0%) | 0 (0.0%) |
| Professional & Scientific | 9 (100.0%) | 0 (0.0%) |
| Enterprise Management | 12 (100.0%) | 0 (0.0%) |
| Administrative & Support | 16 (42.1%) | 22 (57.9%) |
| Educational Services | 9 (22.0%) | 32 (78.0%) |
| Health Care & Social Assistance | 14 (29.2%) | 34 (70.8%) |
| Arts, Entertainment & Recreation | 0 (0.0%) | 3 (100.0%) |
| Accommodation & Food Services | 23 (57.5%) | 17 (42.5%) |
| Public Administration | 5 (38.5%) | 8 (61.5%) |
| Total | 398 (64.0%) | 224 (36.0%) |
Education in Hebron Estates
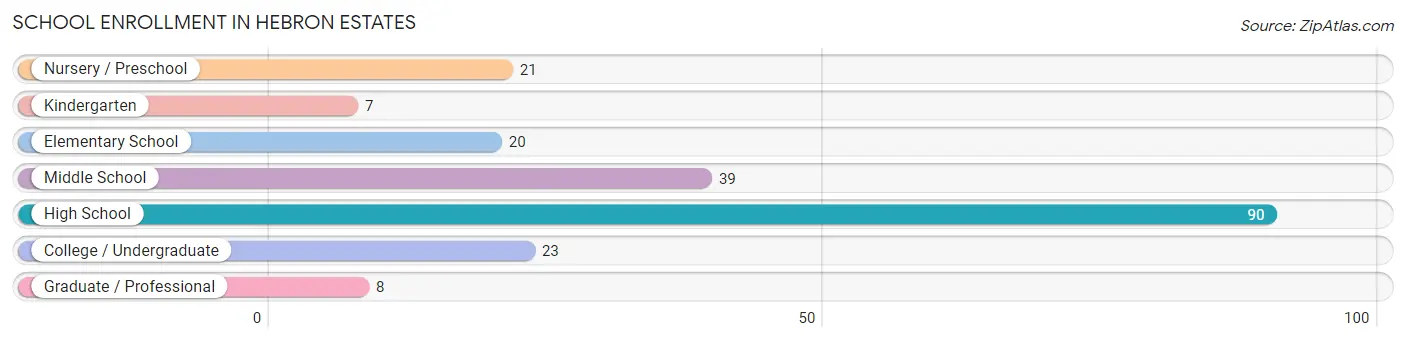
School Enrollment in Hebron Estates
The most common levels of schooling among the 208 students in Hebron Estates are high school (90 | 43.3%), middle school (39 | 18.8%), and college / undergraduate (23 | 11.1%).
| School Level | # Students | % Students |
| Nursery / Preschool | 21 | 10.1% |
| Kindergarten | 7 | 3.4% |
| Elementary School | 20 | 9.6% |
| Middle School | 39 | 18.8% |
| High School | 90 | 43.3% |
| College / Undergraduate | 23 | 11.1% |
| Graduate / Professional | 8 | 3.8% |
| Total | 208 | 100.0% |
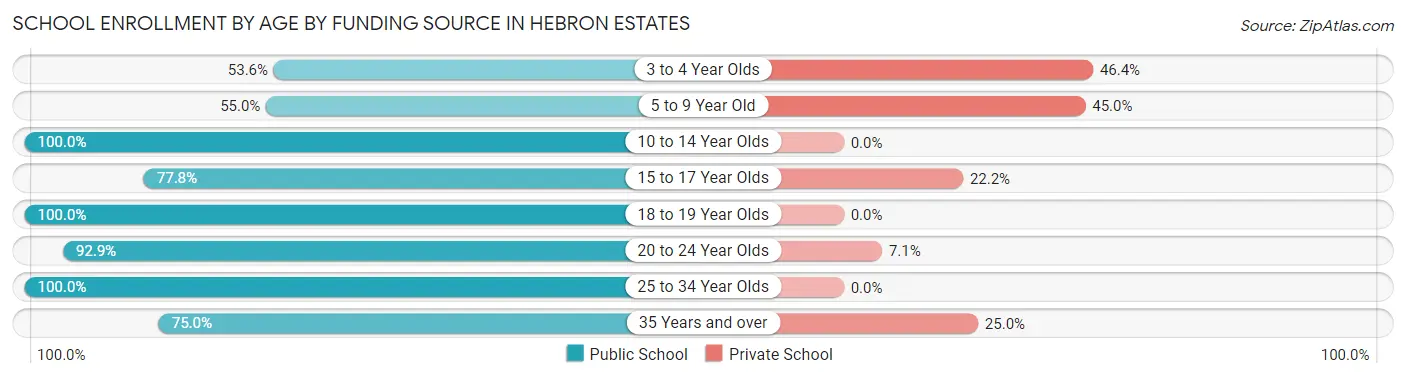
School Enrollment by Age by Funding Source in Hebron Estates
Out of a total of 208 students who are enrolled in schools in Hebron Estates, 42 (20.2%) attend a private institution, while the remaining 166 (79.8%) are enrolled in public schools. The age group of 3 to 4 year olds has the highest likelihood of being enrolled in private schools, with 13 (46.4% in the age bracket) enrolled. Conversely, the age group of 10 to 14 year olds has the lowest likelihood of being enrolled in a private school, with 39 (100.0% in the age bracket) attending a public institution.
| Age Bracket | Public School | Private School |
| 3 to 4 Year Olds | 15 (53.6%) | 13 (46.4%) |
| 5 to 9 Year Old | 11 (55.0%) | 9 (45.0%) |
| 10 to 14 Year Olds | 39 (100.0%) | 0 (0.0%) |
| 15 to 17 Year Olds | 63 (77.8%) | 18 (22.2%) |
| 18 to 19 Year Olds | 13 (100.0%) | 0 (0.0%) |
| 20 to 24 Year Olds | 13 (92.9%) | 1 (7.1%) |
| 25 to 34 Year Olds | 9 (100.0%) | 0 (0.0%) |
| 35 Years and over | 3 (75.0%) | 1 (25.0%) |
| Total | 166 (79.8%) | 42 (20.2%) |
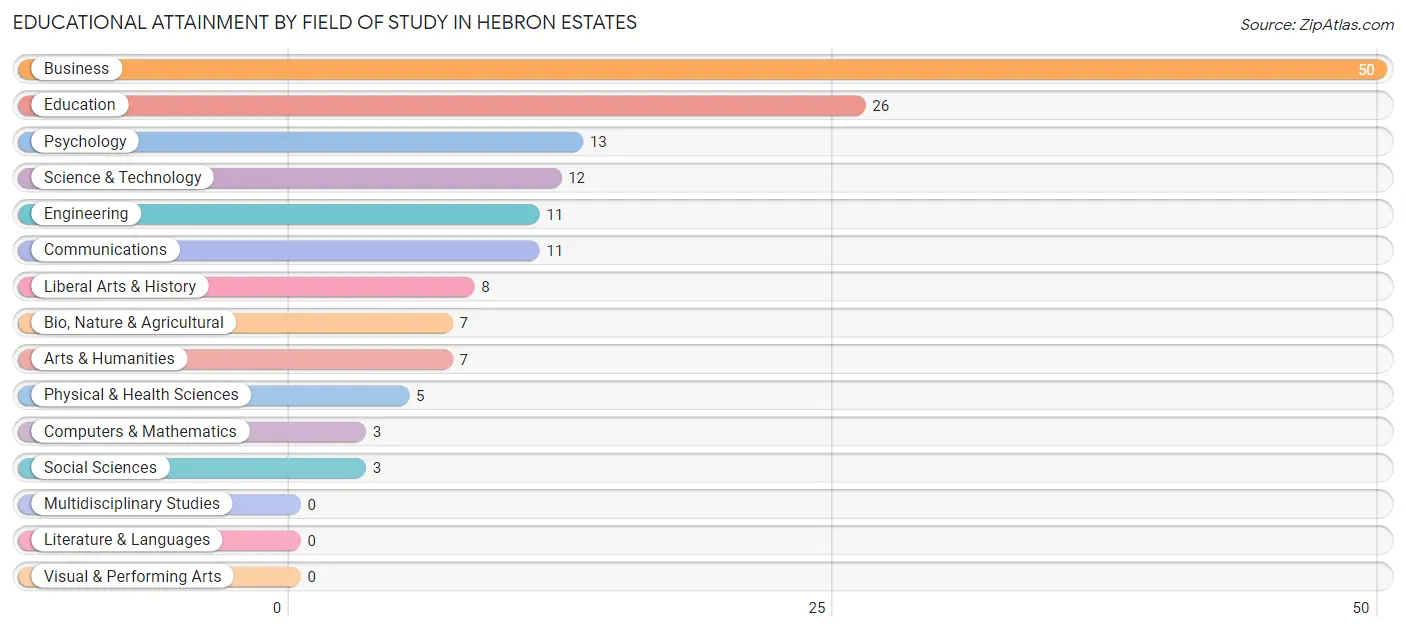
Educational Attainment by Field of Study in Hebron Estates
Business (50 | 32.1%), education (26 | 16.7%), psychology (13 | 8.3%), science & technology (12 | 7.7%), and engineering (11 | 7.0%) are the most common fields of study among 156 individuals in Hebron Estates who have obtained a bachelor's degree or higher.
| Field of Study | # Graduates | % Graduates |
| Computers & Mathematics | 3 | 1.9% |
| Bio, Nature & Agricultural | 7 | 4.5% |
| Physical & Health Sciences | 5 | 3.2% |
| Psychology | 13 | 8.3% |
| Social Sciences | 3 | 1.9% |
| Engineering | 11 | 7.0% |
| Multidisciplinary Studies | 0 | 0.0% |
| Science & Technology | 12 | 7.7% |
| Business | 50 | 32.1% |
| Education | 26 | 16.7% |
| Literature & Languages | 0 | 0.0% |
| Liberal Arts & History | 8 | 5.1% |
| Visual & Performing Arts | 0 | 0.0% |
| Communications | 11 | 7.0% |
| Arts & Humanities | 7 | 4.5% |
| Total | 156 | 100.0% |
Transportation & Commute in Hebron Estates
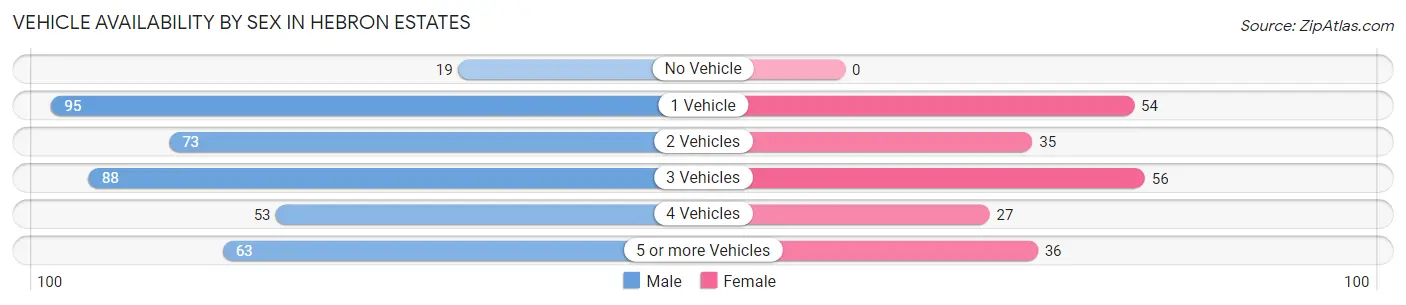
Vehicle Availability by Sex in Hebron Estates
The most prevalent vehicle ownership categories in Hebron Estates are males with 1 vehicle (95, accounting for 24.3%) and females with 1 vehicle (54, making up 45.7%).
| Vehicles Available | Male | Female |
| No Vehicle | 19 (4.9%) | 0 (0.0%) |
| 1 Vehicle | 95 (24.3%) | 54 (26.0%) |
| 2 Vehicles | 73 (18.7%) | 35 (16.8%) |
| 3 Vehicles | 88 (22.5%) | 56 (26.9%) |
| 4 Vehicles | 53 (13.6%) | 27 (13.0%) |
| 5 or more Vehicles | 63 (16.1%) | 36 (17.3%) |
| Total | 391 (100.0%) | 208 (100.0%) |
Commute Time in Hebron Estates
The most frequently occuring commute durations in Hebron Estates are 25 to 29 minutes (112 commuters, 21.6%), 20 to 24 minutes (106 commuters, 20.4%), and 30 to 34 minutes (75 commuters, 14.4%).
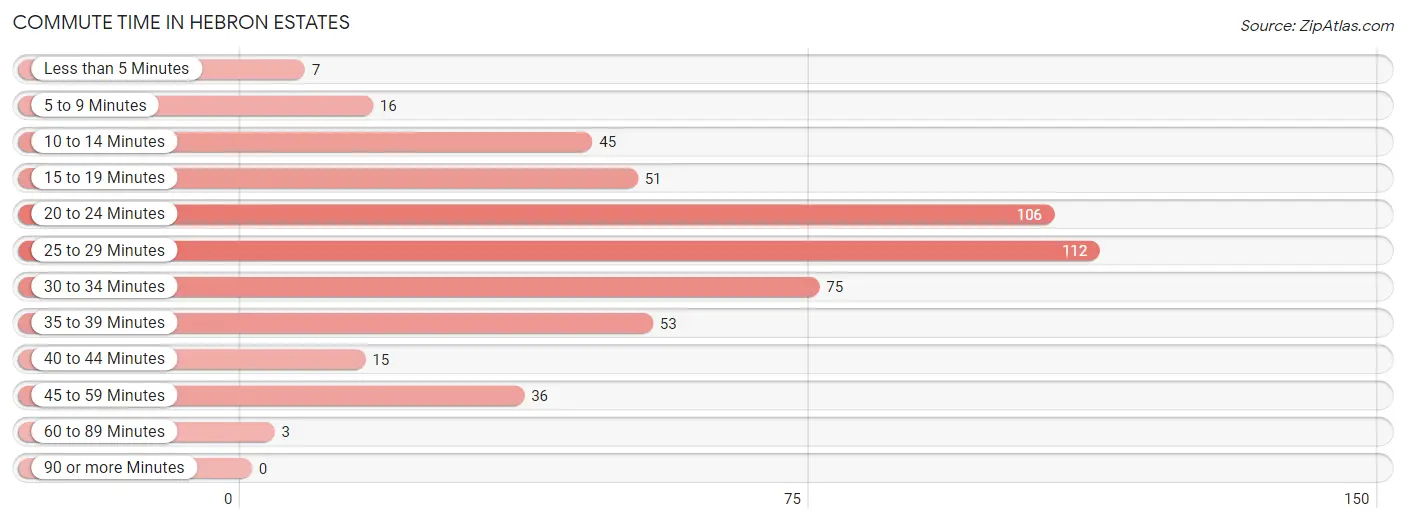
| Commute Time | # Commuters | % Commuters |
| Less than 5 Minutes | 7 | 1.3% |
| 5 to 9 Minutes | 16 | 3.1% |
| 10 to 14 Minutes | 45 | 8.7% |
| 15 to 19 Minutes | 51 | 9.8% |
| 20 to 24 Minutes | 106 | 20.4% |
| 25 to 29 Minutes | 112 | 21.6% |
| 30 to 34 Minutes | 75 | 14.4% |
| 35 to 39 Minutes | 53 | 10.2% |
| 40 to 44 Minutes | 15 | 2.9% |
| 45 to 59 Minutes | 36 | 6.9% |
| 60 to 89 Minutes | 3 | 0.6% |
| 90 or more Minutes | 0 | 0.0% |
Commute Time by Sex in Hebron Estates
The most common commute times in Hebron Estates are 25 to 29 minutes (97 commuters, 26.7%) for males and 30 to 34 minutes (39 commuters, 25.0%) for females.
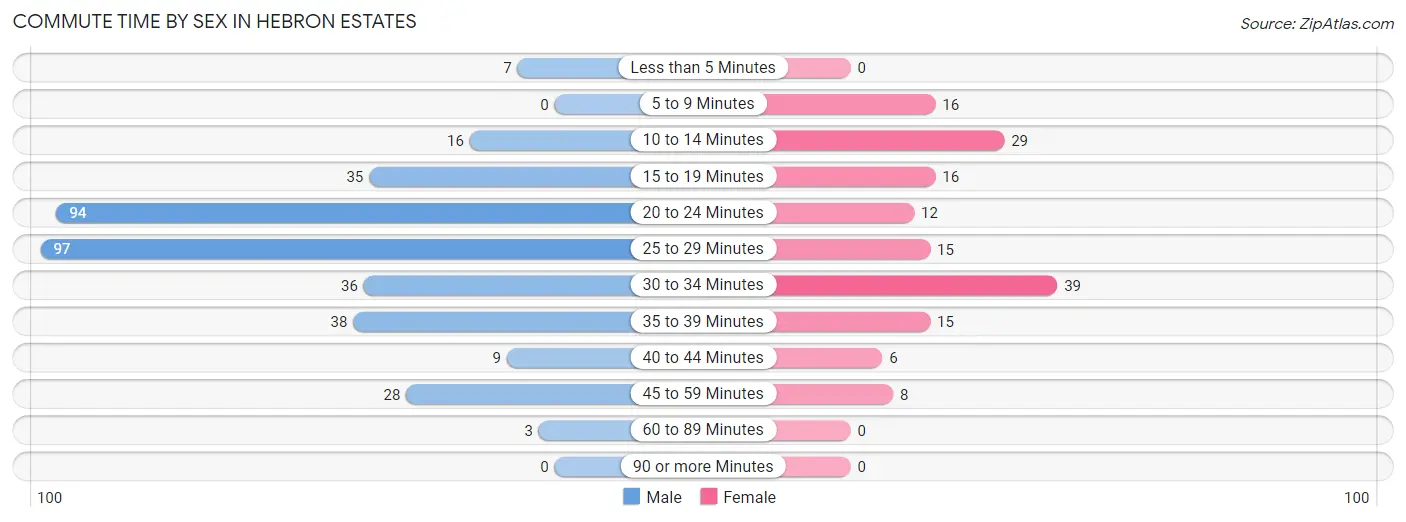
| Commute Time | Male | Female |
| Less than 5 Minutes | 7 (1.9%) | 0 (0.0%) |
| 5 to 9 Minutes | 0 (0.0%) | 16 (10.3%) |
| 10 to 14 Minutes | 16 (4.4%) | 29 (18.6%) |
| 15 to 19 Minutes | 35 (9.6%) | 16 (10.3%) |
| 20 to 24 Minutes | 94 (25.9%) | 12 (7.7%) |
| 25 to 29 Minutes | 97 (26.7%) | 15 (9.6%) |
| 30 to 34 Minutes | 36 (9.9%) | 39 (25.0%) |
| 35 to 39 Minutes | 38 (10.5%) | 15 (9.6%) |
| 40 to 44 Minutes | 9 (2.5%) | 6 (3.8%) |
| 45 to 59 Minutes | 28 (7.7%) | 8 (5.1%) |
| 60 to 89 Minutes | 3 (0.8%) | 0 (0.0%) |
| 90 or more Minutes | 0 (0.0%) | 0 (0.0%) |
Time of Departure to Work by Sex in Hebron Estates
The most frequent times of departure to work in Hebron Estates are 6:00 AM to 6:29 AM (62, 17.1%) for males and 7:00 AM to 7:29 AM (37, 23.7%) for females.
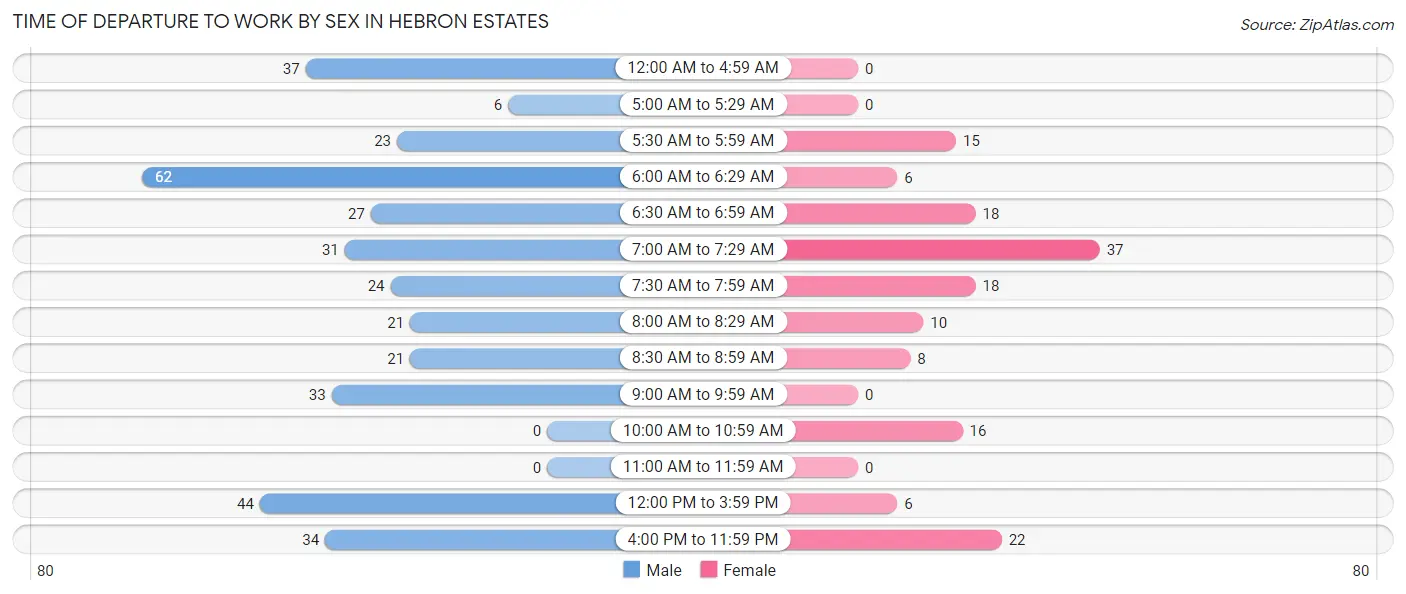
| Time of Departure | Male | Female |
| 12:00 AM to 4:59 AM | 37 (10.2%) | 0 (0.0%) |
| 5:00 AM to 5:29 AM | 6 (1.7%) | 0 (0.0%) |
| 5:30 AM to 5:59 AM | 23 (6.3%) | 15 (9.6%) |
| 6:00 AM to 6:29 AM | 62 (17.1%) | 6 (3.8%) |
| 6:30 AM to 6:59 AM | 27 (7.4%) | 18 (11.5%) |
| 7:00 AM to 7:29 AM | 31 (8.5%) | 37 (23.7%) |
| 7:30 AM to 7:59 AM | 24 (6.6%) | 18 (11.5%) |
| 8:00 AM to 8:29 AM | 21 (5.8%) | 10 (6.4%) |
| 8:30 AM to 8:59 AM | 21 (5.8%) | 8 (5.1%) |
| 9:00 AM to 9:59 AM | 33 (9.1%) | 0 (0.0%) |
| 10:00 AM to 10:59 AM | 0 (0.0%) | 16 (10.3%) |
| 11:00 AM to 11:59 AM | 0 (0.0%) | 0 (0.0%) |
| 12:00 PM to 3:59 PM | 44 (12.1%) | 6 (3.8%) |
| 4:00 PM to 11:59 PM | 34 (9.4%) | 22 (14.1%) |
| Total | 363 (100.0%) | 156 (100.0%) |
Housing Occupancy in Hebron Estates
Occupancy by Ownership in Hebron Estates
Of the total 576 dwellings in Hebron Estates, owner-occupied units account for 347 (60.2%), while renter-occupied units make up 229 (39.8%).
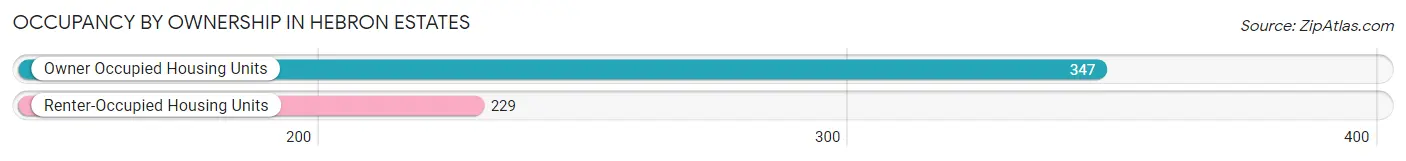
| Occupancy | # Housing Units | % Housing Units |
| Owner Occupied Housing Units | 347 | 60.2% |
| Renter-Occupied Housing Units | 229 | 39.8% |
| Total Occupied Housing Units | 576 | 100.0% |
Occupancy by Household Size in Hebron Estates
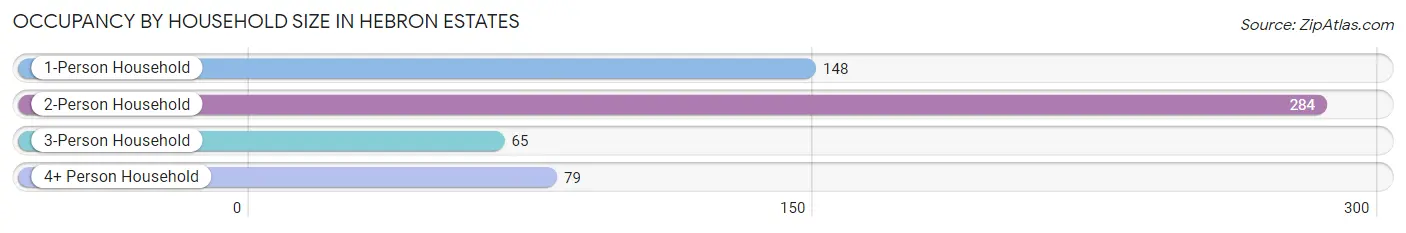
| Household Size | # Housing Units | % Housing Units |
| 1-Person Household | 148 | 25.7% |
| 2-Person Household | 284 | 49.3% |
| 3-Person Household | 65 | 11.3% |
| 4+ Person Household | 79 | 13.7% |
| Total Housing Units | 576 | 100.0% |
Occupancy by Ownership by Household Size in Hebron Estates
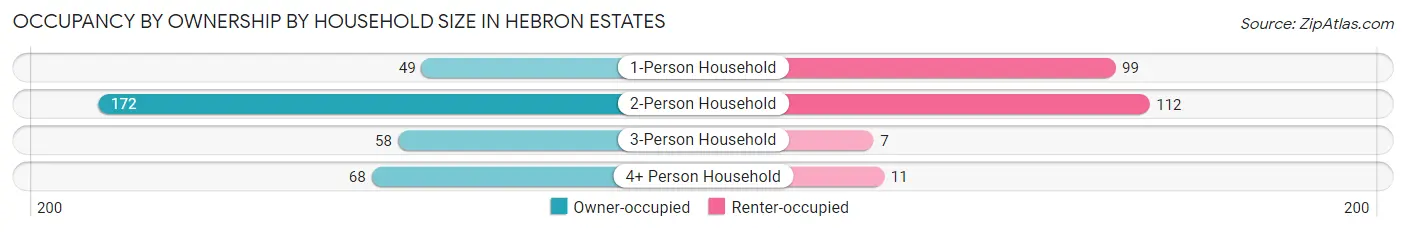
| Household Size | Owner-occupied | Renter-occupied |
| 1-Person Household | 49 (33.1%) | 99 (66.9%) |
| 2-Person Household | 172 (60.6%) | 112 (39.4%) |
| 3-Person Household | 58 (89.2%) | 7 (10.8%) |
| 4+ Person Household | 68 (86.1%) | 11 (13.9%) |
| Total Housing Units | 347 (60.2%) | 229 (39.8%) |
Occupancy by Educational Attainment in Hebron Estates
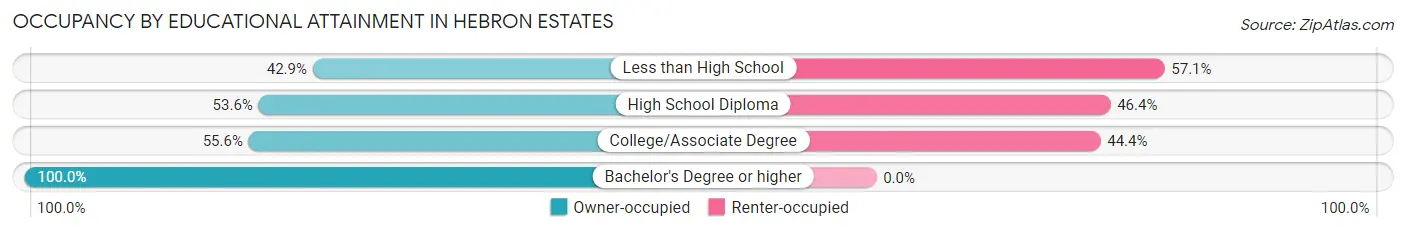
| Household Size | Owner-occupied | Renter-occupied |
| Less than High School | 9 (42.9%) | 12 (57.1%) |
| High School Diploma | 112 (53.6%) | 97 (46.4%) |
| College/Associate Degree | 150 (55.6%) | 120 (44.4%) |
| Bachelor's Degree or higher | 76 (100.0%) | 0 (0.0%) |
Occupancy by Age of Householder in Hebron Estates
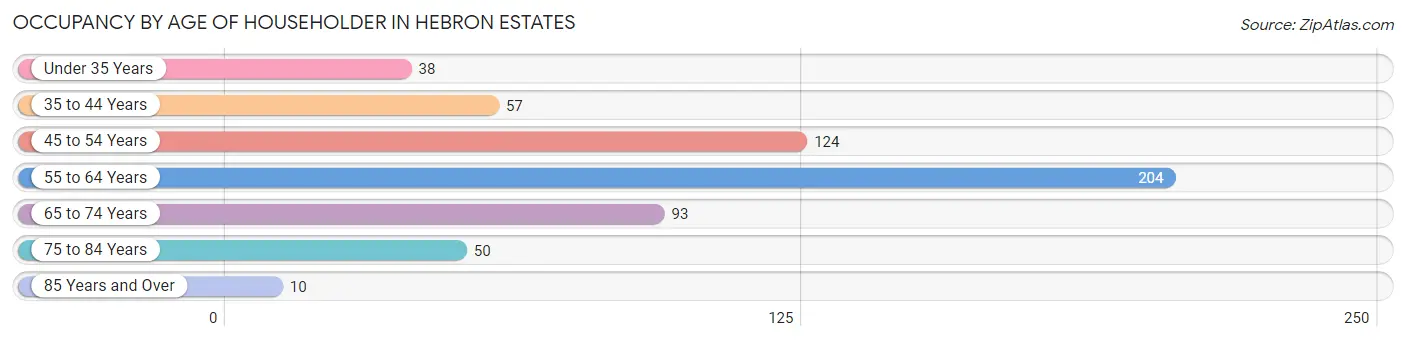
| Age Bracket | # Households | % Households |
| Under 35 Years | 38 | 6.6% |
| 35 to 44 Years | 57 | 9.9% |
| 45 to 54 Years | 124 | 21.5% |
| 55 to 64 Years | 204 | 35.4% |
| 65 to 74 Years | 93 | 16.2% |
| 75 to 84 Years | 50 | 8.7% |
| 85 Years and Over | 10 | 1.7% |
| Total | 576 | 100.0% |
Housing Finances in Hebron Estates
Median Income by Occupancy in Hebron Estates
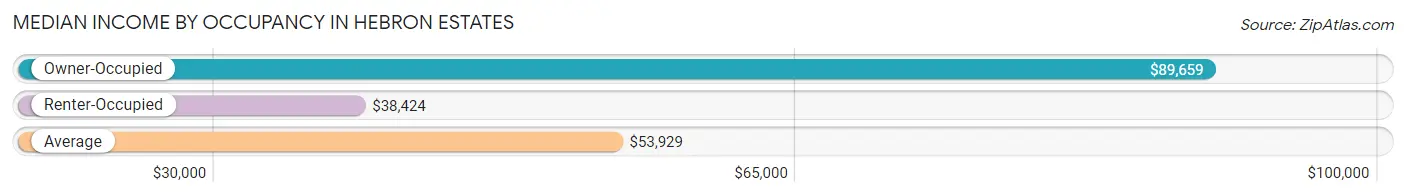
| Occupancy Type | # Households | Median Income |
| Owner-Occupied | 347 (60.2%) | $89,659 |
| Renter-Occupied | 229 (39.8%) | $38,424 |
| Average | 576 (100.0%) | $53,929 |
Occupancy by Householder Income Bracket in Hebron Estates
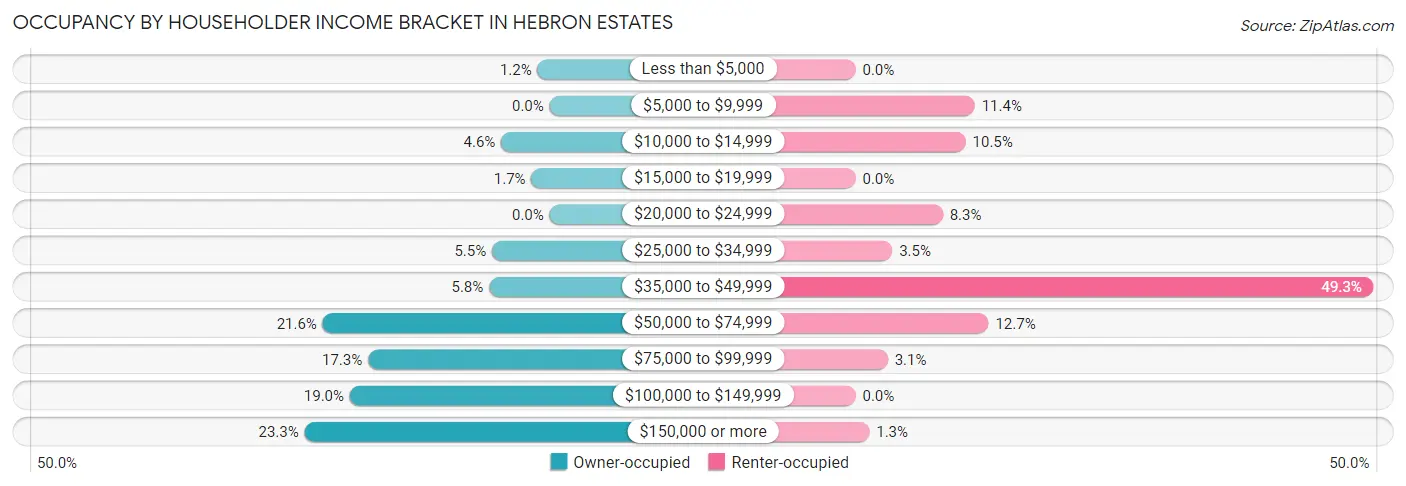
| Income Bracket | Owner-occupied | Renter-occupied |
| Less than $5,000 | 4 (1.1%) | 0 (0.0%) |
| $5,000 to $9,999 | 0 (0.0%) | 26 (11.4%) |
| $10,000 to $14,999 | 16 (4.6%) | 24 (10.5%) |
| $15,000 to $19,999 | 6 (1.7%) | 0 (0.0%) |
| $20,000 to $24,999 | 0 (0.0%) | 19 (8.3%) |
| $25,000 to $34,999 | 19 (5.5%) | 8 (3.5%) |
| $35,000 to $49,999 | 20 (5.8%) | 113 (49.3%) |
| $50,000 to $74,999 | 75 (21.6%) | 29 (12.7%) |
| $75,000 to $99,999 | 60 (17.3%) | 7 (3.1%) |
| $100,000 to $149,999 | 66 (19.0%) | 0 (0.0%) |
| $150,000 or more | 81 (23.3%) | 3 (1.3%) |
| Total | 347 (100.0%) | 229 (100.0%) |
Monthly Housing Cost Tiers in Hebron Estates
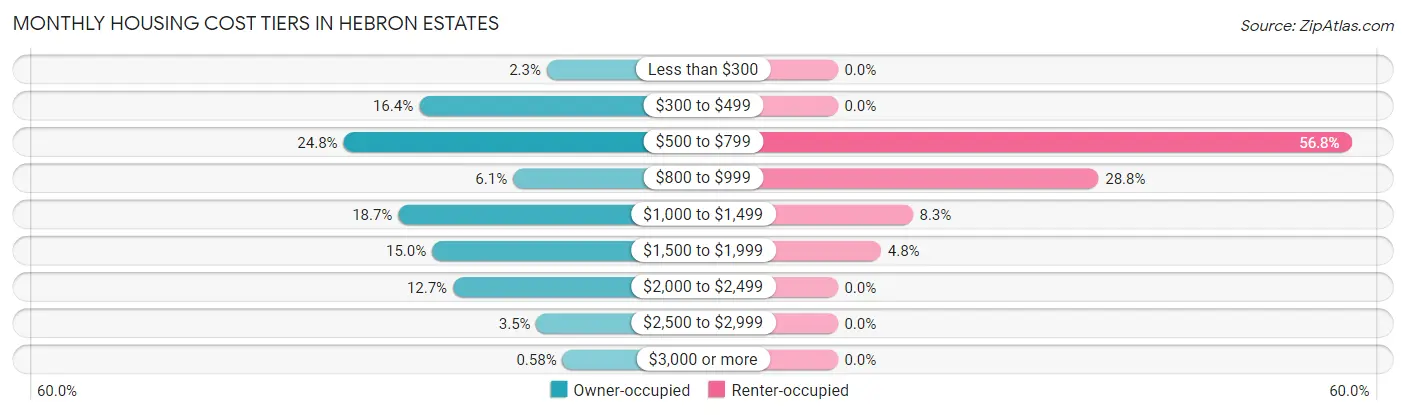
| Monthly Cost | Owner-occupied | Renter-occupied |
| Less than $300 | 8 (2.3%) | 0 (0.0%) |
| $300 to $499 | 57 (16.4%) | 0 (0.0%) |
| $500 to $799 | 86 (24.8%) | 130 (56.8%) |
| $800 to $999 | 21 (6.0%) | 66 (28.8%) |
| $1,000 to $1,499 | 65 (18.7%) | 19 (8.3%) |
| $1,500 to $1,999 | 52 (15.0%) | 11 (4.8%) |
| $2,000 to $2,499 | 44 (12.7%) | 0 (0.0%) |
| $2,500 to $2,999 | 12 (3.5%) | 0 (0.0%) |
| $3,000 or more | 2 (0.6%) | 0 (0.0%) |
| Total | 347 (100.0%) | 229 (100.0%) |
Physical Housing Characteristics in Hebron Estates
Housing Structures in Hebron Estates
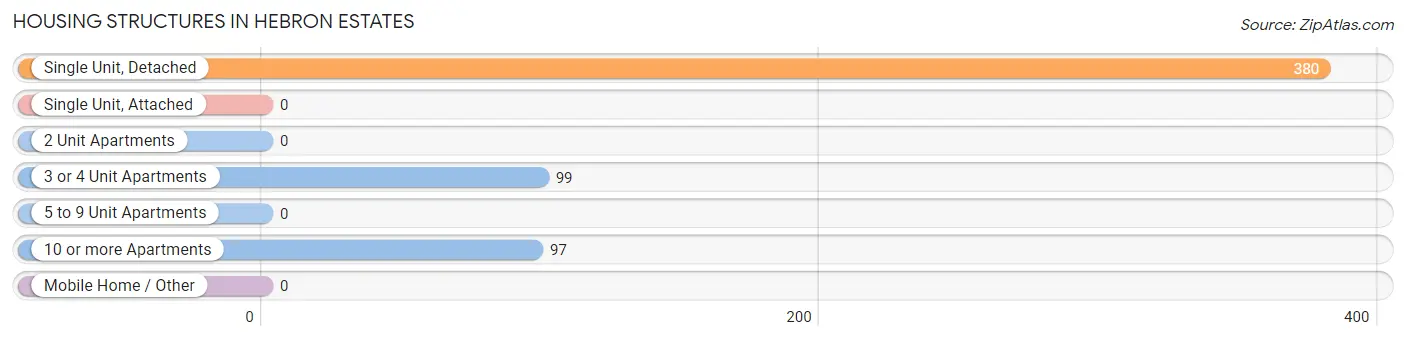
| Structure Type | # Housing Units | % Housing Units |
| Single Unit, Detached | 380 | 66.0% |
| Single Unit, Attached | 0 | 0.0% |
| 2 Unit Apartments | 0 | 0.0% |
| 3 or 4 Unit Apartments | 99 | 17.2% |
| 5 to 9 Unit Apartments | 0 | 0.0% |
| 10 or more Apartments | 97 | 16.8% |
| Mobile Home / Other | 0 | 0.0% |
| Total | 576 | 100.0% |
Housing Structures by Occupancy in Hebron Estates
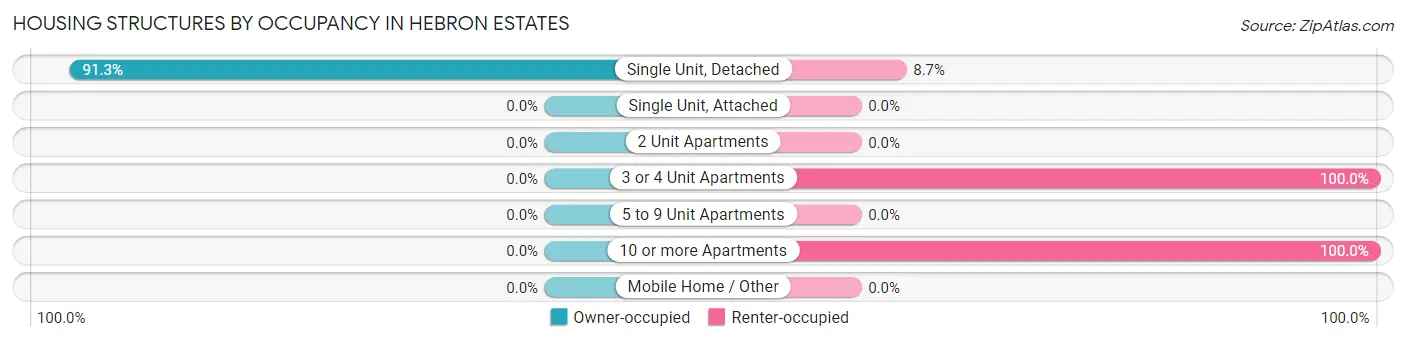
| Structure Type | Owner-occupied | Renter-occupied |
| Single Unit, Detached | 347 (91.3%) | 33 (8.7%) |
| Single Unit, Attached | 0 (0.0%) | 0 (0.0%) |
| 2 Unit Apartments | 0 (0.0%) | 0 (0.0%) |
| 3 or 4 Unit Apartments | 0 (0.0%) | 99 (100.0%) |
| 5 to 9 Unit Apartments | 0 (0.0%) | 0 (0.0%) |
| 10 or more Apartments | 0 (0.0%) | 97 (100.0%) |
| Mobile Home / Other | 0 (0.0%) | 0 (0.0%) |
| Total | 347 (60.2%) | 229 (39.8%) |
Housing Structures by Number of Rooms in Hebron Estates
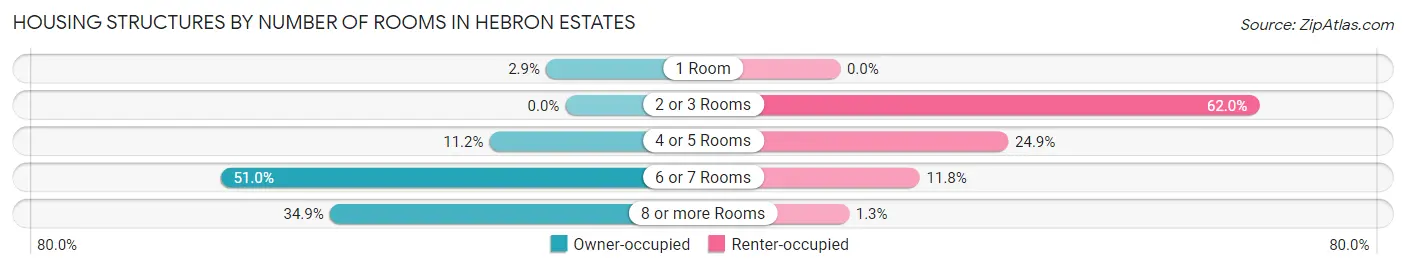
| Number of Rooms | Owner-occupied | Renter-occupied |
| 1 Room | 10 (2.9%) | 0 (0.0%) |
| 2 or 3 Rooms | 0 (0.0%) | 142 (62.0%) |
| 4 or 5 Rooms | 39 (11.2%) | 57 (24.9%) |
| 6 or 7 Rooms | 177 (51.0%) | 27 (11.8%) |
| 8 or more Rooms | 121 (34.9%) | 3 (1.3%) |
| Total | 347 (100.0%) | 229 (100.0%) |
Housing Structure by Heating Type in Hebron Estates
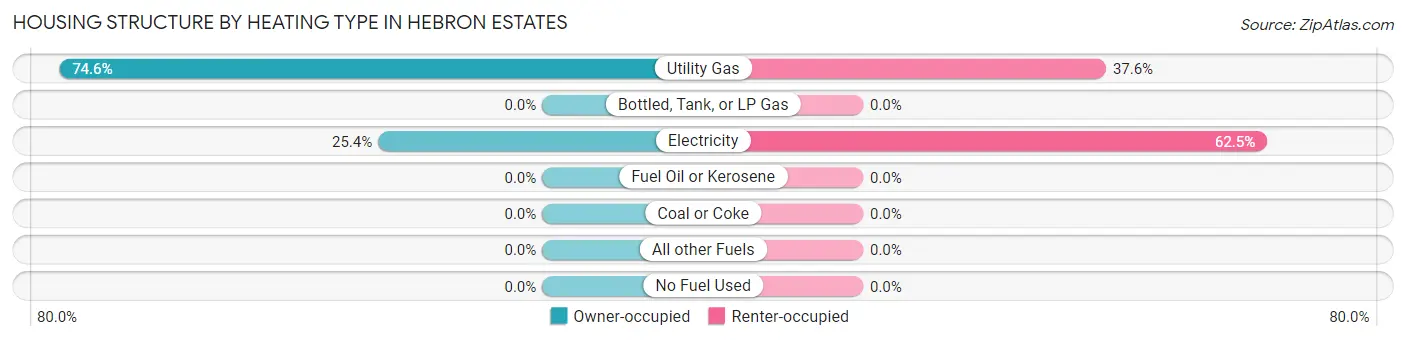
| Heating Type | Owner-occupied | Renter-occupied |
| Utility Gas | 259 (74.6%) | 86 (37.6%) |
| Bottled, Tank, or LP Gas | 0 (0.0%) | 0 (0.0%) |
| Electricity | 88 (25.4%) | 143 (62.5%) |
| Fuel Oil or Kerosene | 0 (0.0%) | 0 (0.0%) |
| Coal or Coke | 0 (0.0%) | 0 (0.0%) |
| All other Fuels | 0 (0.0%) | 0 (0.0%) |
| No Fuel Used | 0 (0.0%) | 0 (0.0%) |
| Total | 347 (100.0%) | 229 (100.0%) |
Household Vehicle Usage in Hebron Estates
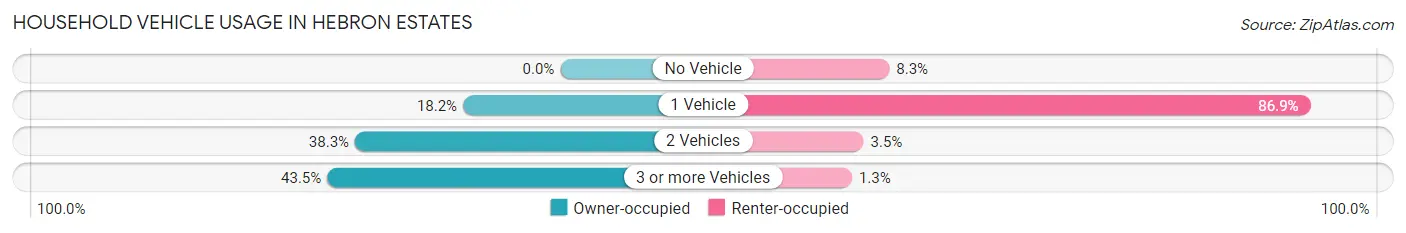
| Vehicles per Household | Owner-occupied | Renter-occupied |
| No Vehicle | 0 (0.0%) | 19 (8.3%) |
| 1 Vehicle | 63 (18.2%) | 199 (86.9%) |
| 2 Vehicles | 133 (38.3%) | 8 (3.5%) |
| 3 or more Vehicles | 151 (43.5%) | 3 (1.3%) |
| Total | 347 (100.0%) | 229 (100.0%) |
Real Estate & Mortgages in Hebron Estates
Real Estate and Mortgage Overview in Hebron Estates
| Characteristic | Without Mortgage | With Mortgage |
| Housing Units | 149 | 198 |
| Median Property Value | $240,300 | $278,000 |
| Median Household Income | $73,672 | $58 |
| Monthly Housing Costs | $543 | $2 |
| Real Estate Taxes | $2,009 | $0 |
Property Value by Mortgage Status in Hebron Estates
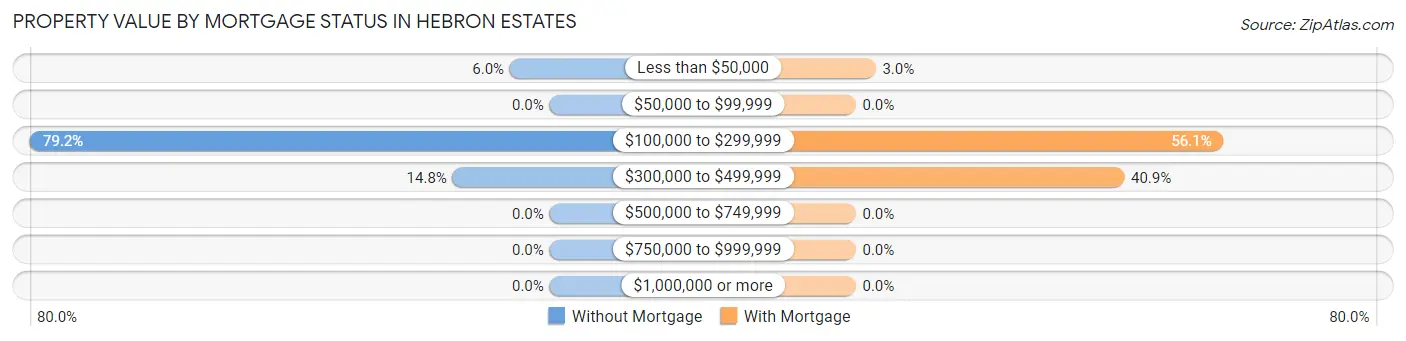
| Property Value | Without Mortgage | With Mortgage |
| Less than $50,000 | 9 (6.0%) | 6 (3.0%) |
| $50,000 to $99,999 | 0 (0.0%) | 0 (0.0%) |
| $100,000 to $299,999 | 118 (79.2%) | 111 (56.1%) |
| $300,000 to $499,999 | 22 (14.8%) | 81 (40.9%) |
| $500,000 to $749,999 | 0 (0.0%) | 0 (0.0%) |
| $750,000 to $999,999 | 0 (0.0%) | 0 (0.0%) |
| $1,000,000 or more | 0 (0.0%) | 0 (0.0%) |
| Total | 149 (100.0%) | 198 (100.0%) |
Household Income by Mortgage Status in Hebron Estates
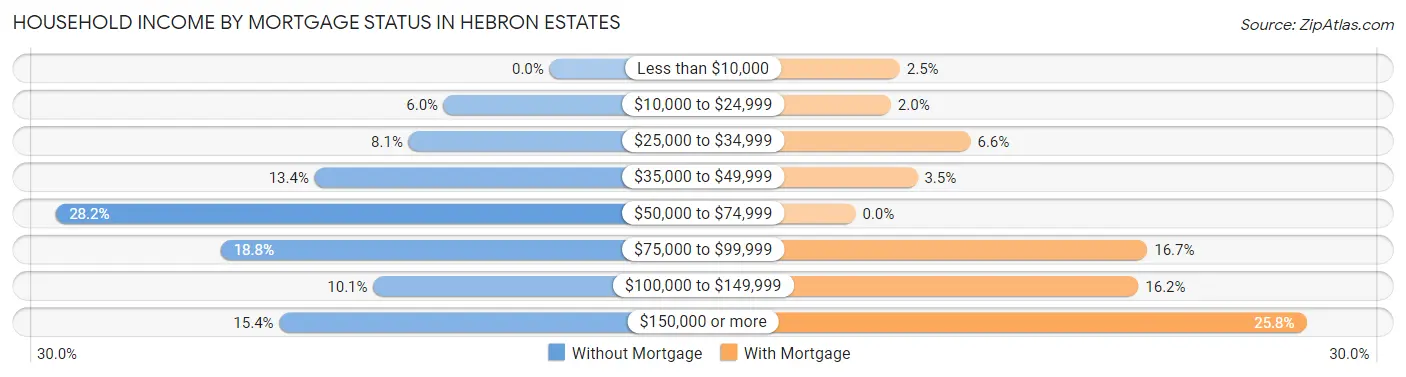
| Household Income | Without Mortgage | With Mortgage |
| Less than $10,000 | 0 (0.0%) | 5 (2.5%) |
| $10,000 to $24,999 | 9 (6.0%) | 4 (2.0%) |
| $25,000 to $34,999 | 12 (8.1%) | 13 (6.6%) |
| $35,000 to $49,999 | 20 (13.4%) | 7 (3.5%) |
| $50,000 to $74,999 | 42 (28.2%) | 0 (0.0%) |
| $75,000 to $99,999 | 28 (18.8%) | 33 (16.7%) |
| $100,000 to $149,999 | 15 (10.1%) | 32 (16.2%) |
| $150,000 or more | 23 (15.4%) | 51 (25.8%) |
| Total | 149 (100.0%) | 198 (100.0%) |
Property Value to Household Income Ratio in Hebron Estates
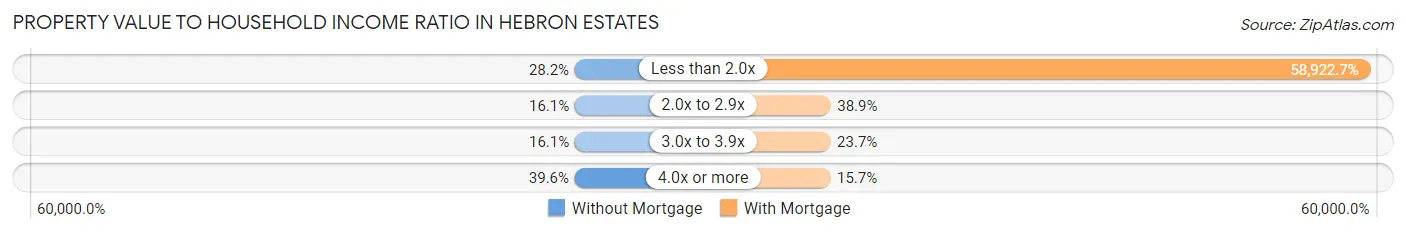
| Value-to-Income Ratio | Without Mortgage | With Mortgage |
| Less than 2.0x | 42 (28.2%) | 116,667 (58,922.7%) |
| 2.0x to 2.9x | 24 (16.1%) | 77 (38.9%) |
| 3.0x to 3.9x | 24 (16.1%) | 47 (23.7%) |
| 4.0x or more | 59 (39.6%) | 31 (15.7%) |
| Total | 149 (100.0%) | 198 (100.0%) |
Real Estate Taxes by Mortgage Status in Hebron Estates
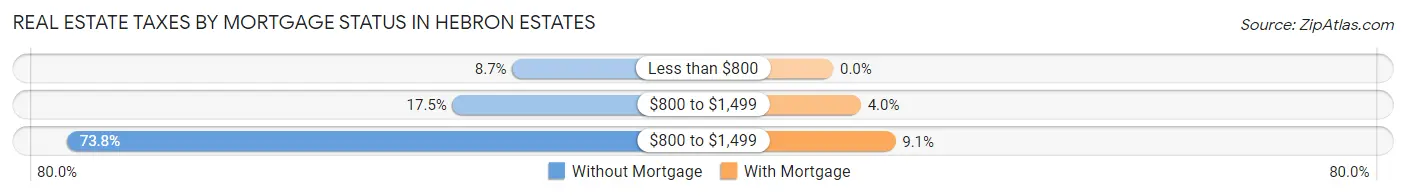
| Property Taxes | Without Mortgage | With Mortgage |
| Less than $800 | 13 (8.7%) | 0 (0.0%) |
| $800 to $1,499 | 26 (17.4%) | 8 (4.0%) |
| $800 to $1,499 | 110 (73.8%) | 18 (9.1%) |
| Total | 149 (100.0%) | 198 (100.0%) |
Health & Disability in Hebron Estates
Health Insurance Coverage by Age in Hebron Estates
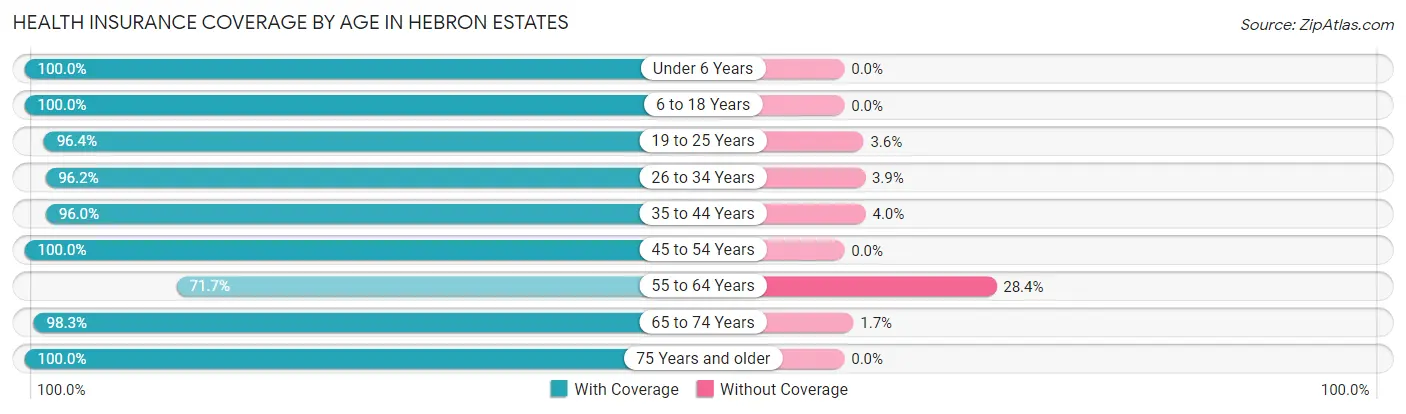
| Age Bracket | With Coverage | Without Coverage |
| Under 6 Years | 122 (100.0%) | 0 (0.0%) |
| 6 to 18 Years | 151 (100.0%) | 0 (0.0%) |
| 19 to 25 Years | 81 (96.4%) | 3 (3.6%) |
| 26 to 34 Years | 75 (96.2%) | 3 (3.8%) |
| 35 to 44 Years | 97 (96.0%) | 4 (4.0%) |
| 45 to 54 Years | 179 (100.0%) | 0 (0.0%) |
| 55 to 64 Years | 230 (71.7%) | 91 (28.3%) |
| 65 to 74 Years | 174 (98.3%) | 3 (1.7%) |
| 75 Years and older | 95 (100.0%) | 0 (0.0%) |
| Total | 1,204 (92.0%) | 104 (8.0%) |
Health Insurance Coverage by Citizenship Status in Hebron Estates
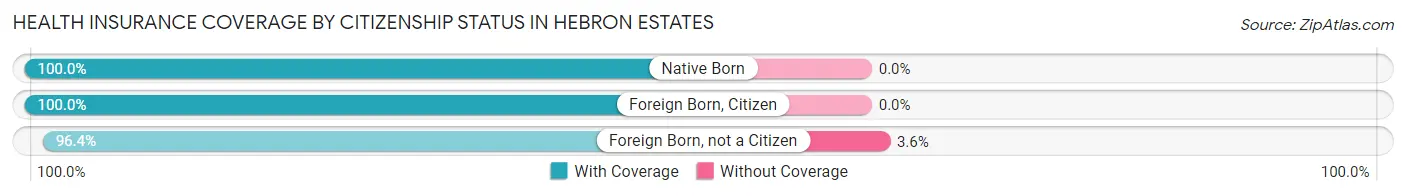
| Citizenship Status | With Coverage | Without Coverage |
| Native Born | 122 (100.0%) | 0 (0.0%) |
| Foreign Born, Citizen | 151 (100.0%) | 0 (0.0%) |
| Foreign Born, not a Citizen | 81 (96.4%) | 3 (3.6%) |
Health Insurance Coverage by Household Income in Hebron Estates
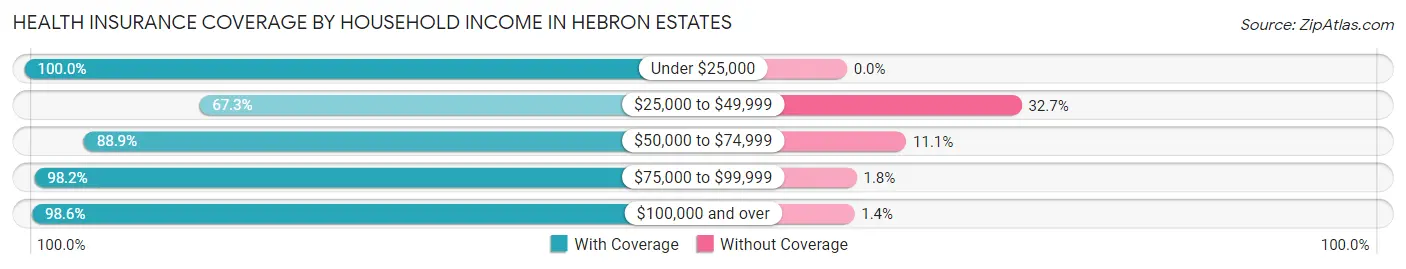
| Household Income | With Coverage | Without Coverage |
| Under $25,000 | 224 (100.0%) | 0 (0.0%) |
| $25,000 to $49,999 | 148 (67.3%) | 72 (32.7%) |
| $50,000 to $74,999 | 176 (88.9%) | 22 (11.1%) |
| $75,000 to $99,999 | 162 (98.2%) | 3 (1.8%) |
| $100,000 and over | 494 (98.6%) | 7 (1.4%) |
Public vs Private Health Insurance Coverage by Age in Hebron Estates
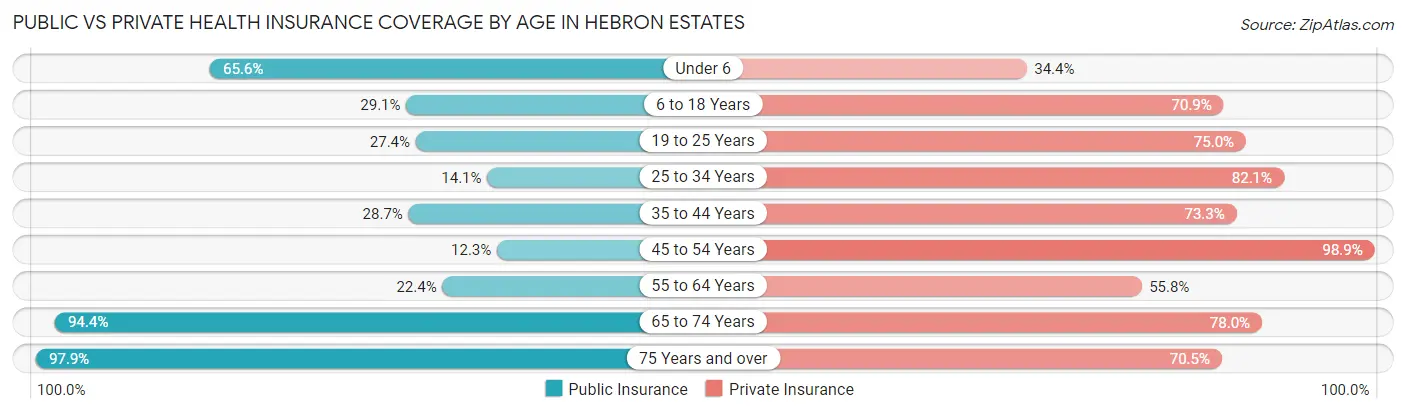
| Age Bracket | Public Insurance | Private Insurance |
| Under 6 | 80 (65.6%) | 42 (34.4%) |
| 6 to 18 Years | 44 (29.1%) | 107 (70.9%) |
| 19 to 25 Years | 23 (27.4%) | 63 (75.0%) |
| 25 to 34 Years | 11 (14.1%) | 64 (82.1%) |
| 35 to 44 Years | 29 (28.7%) | 74 (73.3%) |
| 45 to 54 Years | 22 (12.3%) | 177 (98.9%) |
| 55 to 64 Years | 72 (22.4%) | 179 (55.8%) |
| 65 to 74 Years | 167 (94.4%) | 138 (78.0%) |
| 75 Years and over | 93 (97.9%) | 67 (70.5%) |
| Total | 541 (41.4%) | 911 (69.7%) |
Disability Status by Sex by Age in Hebron Estates
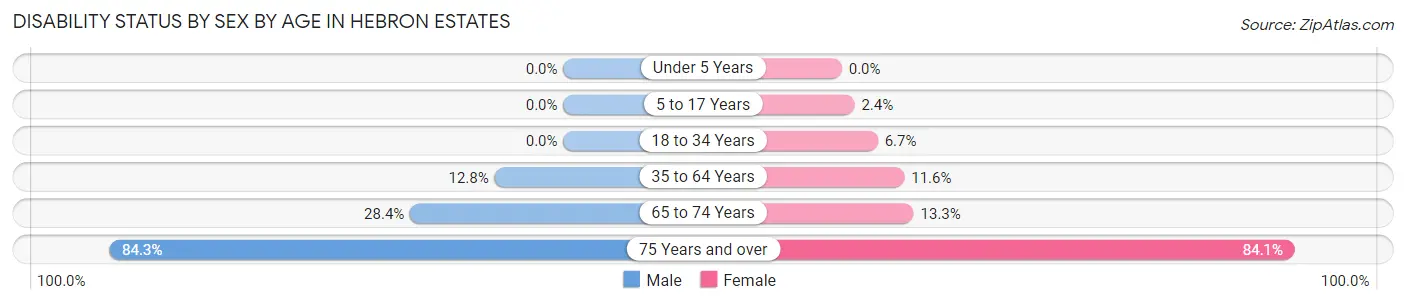
| Age Bracket | Male | Female |
| Under 5 Years | 0 (0.0%) | 0 (0.0%) |
| 5 to 17 Years | 0 (0.0%) | 2 (2.4%) |
| 18 to 34 Years | 0 (0.0%) | 5 (6.7%) |
| 35 to 64 Years | 36 (12.8%) | 37 (11.6%) |
| 65 to 74 Years | 29 (28.4%) | 10 (13.3%) |
| 75 Years and over | 43 (84.3%) | 37 (84.1%) |
Disability Class by Sex by Age in Hebron Estates
Disability Class: Hearing Difficulty
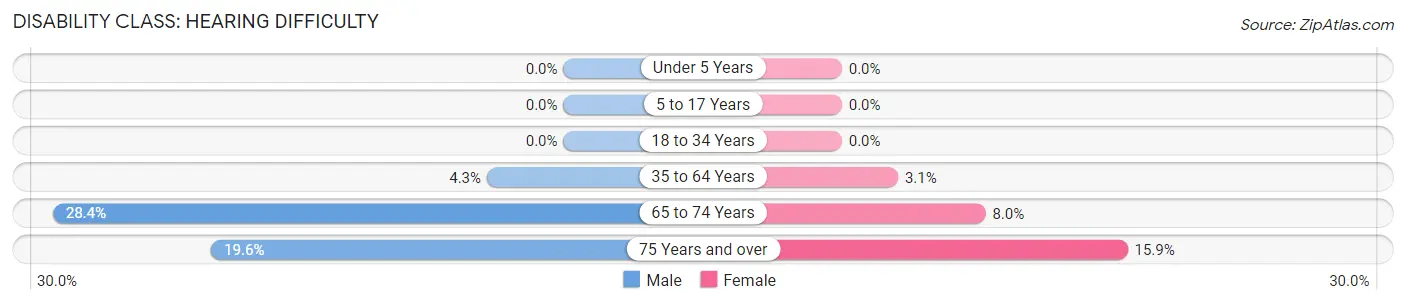
| Age Bracket | Male | Female |
| Under 5 Years | 0 (0.0%) | 0 (0.0%) |
| 5 to 17 Years | 0 (0.0%) | 0 (0.0%) |
| 18 to 34 Years | 0 (0.0%) | 0 (0.0%) |
| 35 to 64 Years | 12 (4.3%) | 10 (3.1%) |
| 65 to 74 Years | 29 (28.4%) | 6 (8.0%) |
| 75 Years and over | 10 (19.6%) | 7 (15.9%) |
Disability Class: Vision Difficulty
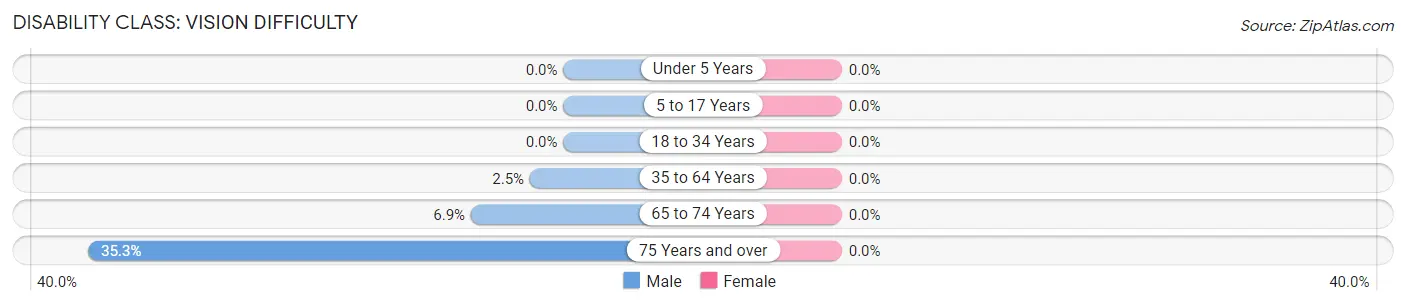
| Age Bracket | Male | Female |
| Under 5 Years | 0 (0.0%) | 0 (0.0%) |
| 5 to 17 Years | 0 (0.0%) | 0 (0.0%) |
| 18 to 34 Years | 0 (0.0%) | 0 (0.0%) |
| 35 to 64 Years | 7 (2.5%) | 0 (0.0%) |
| 65 to 74 Years | 7 (6.9%) | 0 (0.0%) |
| 75 Years and over | 18 (35.3%) | 0 (0.0%) |
Disability Class: Cognitive Difficulty
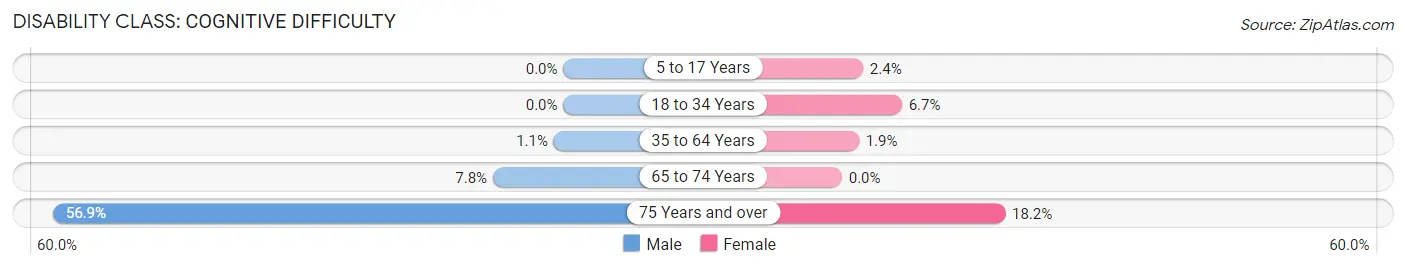
| Age Bracket | Male | Female |
| 5 to 17 Years | 0 (0.0%) | 2 (2.4%) |
| 18 to 34 Years | 0 (0.0%) | 5 (6.7%) |
| 35 to 64 Years | 3 (1.1%) | 6 (1.9%) |
| 65 to 74 Years | 8 (7.8%) | 0 (0.0%) |
| 75 Years and over | 29 (56.9%) | 8 (18.2%) |
Disability Class: Ambulatory Difficulty
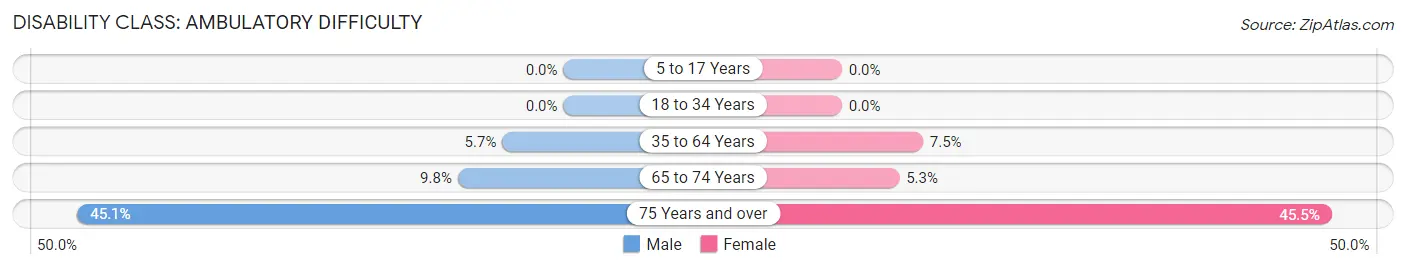
| Age Bracket | Male | Female |
| 5 to 17 Years | 0 (0.0%) | 0 (0.0%) |
| 18 to 34 Years | 0 (0.0%) | 0 (0.0%) |
| 35 to 64 Years | 16 (5.7%) | 24 (7.5%) |
| 65 to 74 Years | 10 (9.8%) | 4 (5.3%) |
| 75 Years and over | 23 (45.1%) | 20 (45.5%) |
Disability Class: Self-Care Difficulty
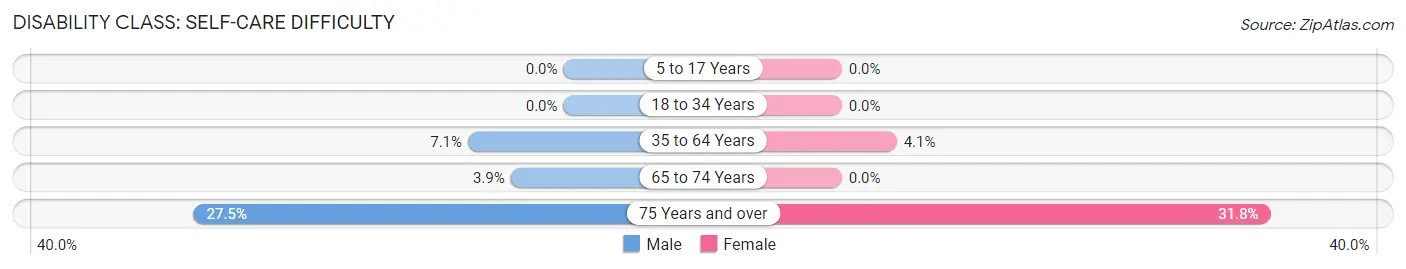
| Age Bracket | Male | Female |
| 5 to 17 Years | 0 (0.0%) | 0 (0.0%) |
| 18 to 34 Years | 0 (0.0%) | 0 (0.0%) |
| 35 to 64 Years | 20 (7.1%) | 13 (4.1%) |
| 65 to 74 Years | 4 (3.9%) | 0 (0.0%) |
| 75 Years and over | 14 (27.5%) | 14 (31.8%) |
Technology Access in Hebron Estates
Computing Device Access in Hebron Estates
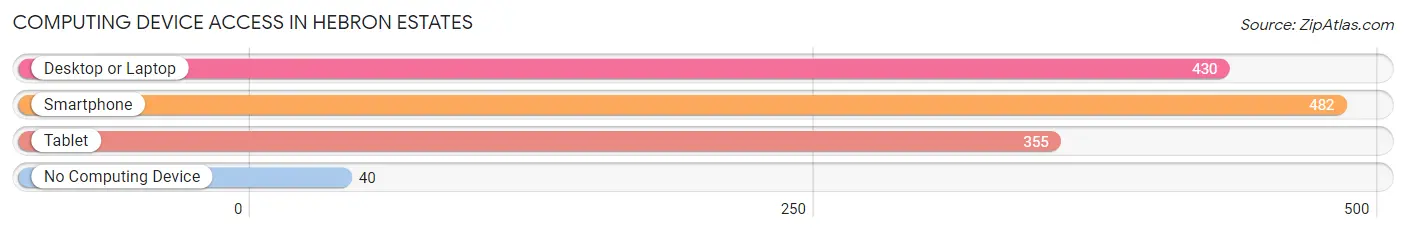
| Device Type | # Households | % Households |
| Desktop or Laptop | 430 | 74.7% |
| Smartphone | 482 | 83.7% |
| Tablet | 355 | 61.6% |
| No Computing Device | 40 | 6.9% |
| Total | 576 | 100.0% |
Internet Access in Hebron Estates
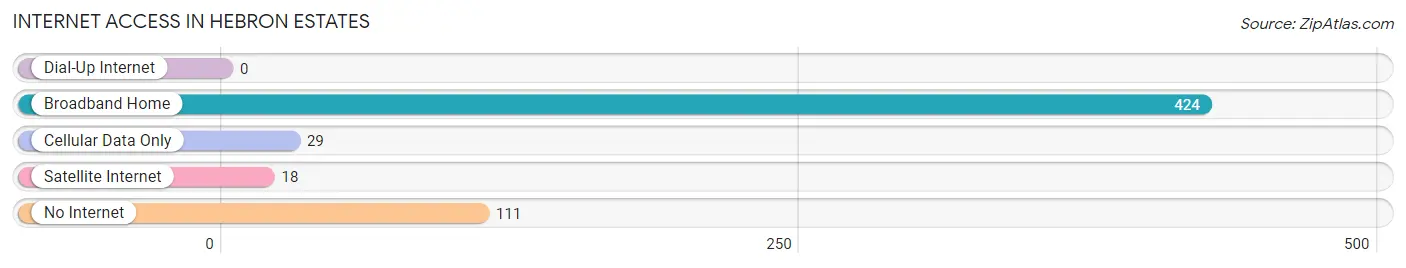
| Internet Type | # Households | % Households |
| Dial-Up Internet | 0 | 0.0% |
| Broadband Home | 424 | 73.6% |
| Cellular Data Only | 29 | 5.0% |
| Satellite Internet | 18 | 3.1% |
| No Internet | 111 | 19.3% |
| Total | 576 | 100.0% |
Hebron Estates Summary
Hebron Estates is a small unincorporated community located in Bullitt County, Kentucky. It is situated along the Salt River, approximately 20 miles south of Louisville. The population of Hebron Estates was estimated to be around 1,000 in 2020.
History
Hebron Estates was founded in the late 1800s by a group of German immigrants who had settled in the area. The community was originally known as “Hebron” and was named after the biblical city of Hebron. The name was changed to “Hebron Estates” in the early 1900s when the community began to develop into a residential area.
The community was largely agricultural in nature until the 1950s when the area began to experience rapid growth due to the development of the nearby Louisville International Airport. This growth led to the construction of several new homes and businesses in the area.
Geography
Hebron Estates is located in the rolling hills of Bullitt County, Kentucky. The area is characterized by its lush green landscape and rolling hills. The Salt River runs through the community and provides a scenic backdrop for the area.
The climate in Hebron Estates is generally mild, with temperatures ranging from the mid-50s in the winter to the mid-80s in the summer. The area receives an average of 45 inches of rain per year.
Economy
Hebron Estates is primarily a residential community, with most of its residents employed in the nearby Louisville metropolitan area. The area is home to several small businesses, including a grocery store, a gas station, and a few restaurants.
The community is also home to a number of industrial and manufacturing businesses, including a plastics factory and a metal fabrication plant. These businesses provide employment opportunities for many of the residents of Hebron Estates.
Demographics
The population of Hebron Estates is estimated to be around 1,000. The majority of the population is white (90%), with the remaining 10% being African American, Hispanic, and Asian. The median household income in the area is $50,000, and the median home value is $150,000.
The majority of the residents of Hebron Estates are employed in the nearby Louisville metropolitan area. The area is home to a number of small businesses, including a grocery store, a gas station, and a few restaurants.
Conclusion
Hebron Estates is a small unincorporated community located in Bullitt County, Kentucky. It is situated along the Salt River, approximately 20 miles south of Louisville. The population of Hebron Estates was estimated to be around 1,000 in 2020. The area is characterized by its lush green landscape and rolling hills, and the climate is generally mild. The majority of the population is white, and the median household income is $50,000. The area is home to several small businesses, including a grocery store, a gas station, and a few restaurants. It is also home to a number of industrial and manufacturing businesses, providing employment opportunities for many of the residents of Hebron Estates.
Common Questions
What is Per Capita Income in Hebron Estates?
Per Capita income in Hebron Estates is $38,127.
What is the Median Family Income in Hebron Estates?
Median Family Income in Hebron Estates is $73,618.
What is the Median Household income in Hebron Estates?
Median Household Income in Hebron Estates is $53,929.
What is Income or Wage Gap in Hebron Estates?
Income or Wage Gap in Hebron Estates is 45.5%.
Women in Hebron Estates earn 54.5 cents for every dollar earned by a man.
What is Inequality or Gini Index in Hebron Estates?
Inequality or Gini Index in Hebron Estates is 0.47.
What is the Total Population of Hebron Estates?
Total Population of Hebron Estates is 1,308.
What is the Total Male Population of Hebron Estates?
Total Male Population of Hebron Estates is 667.
What is the Total Female Population of Hebron Estates?
Total Female Population of Hebron Estates is 641.
What is the Ratio of Males per 100 Females in Hebron Estates?
There are 104.06 Males per 100 Females in Hebron Estates.
What is the Ratio of Females per 100 Males in Hebron Estates?
There are 96.10 Females per 100 Males in Hebron Estates.
What is the Median Population Age in Hebron Estates?
Median Population Age in Hebron Estates is 52.2 Years.
What is the Average Family Size in Hebron Estates
Average Family Size in Hebron Estates is 2.7 People.
What is the Average Household Size in Hebron Estates
Average Household Size in Hebron Estates is 2.3 People.
How Large is the Labor Force in Hebron Estates?
There are 716 People in the Labor Forcein in Hebron Estates.
What is the Percentage of People in the Labor Force in Hebron Estates?
64.1% of People are in the Labor Force in Hebron Estates.
What is the Unemployment Rate in Hebron Estates?
Unemployment Rate in Hebron Estates is 13.1%.